UNITED STATES
SECURITIES AND EXCHANGE COMMISSION
Washington, D.C. 20549
FORM N-CSR
CERTIFIED SHAREHOLDER REPORT OF REGISTERED MANAGEMENT INVESTMENT COMPANIES
| | |
| Investment Company Act file number: | | 811-09805 |
| |
| Exact name of registrant as specified in charter: | | Prudential Investment Portfolios 3 |
|
| (This Form N-CSR relates solely to the Registrant’s PGIM Real Assets Fund, PGIM Global Dynamic Bond Fund and PGIM Wadhwani Systematic Absolute Return Fund (each a “Fund” and collectively the “Funds”)) |
| |
| Address of principal executive offices: | | 655 Broad Street, 17th Floor |
| | Newark, New Jersey 07102 |
| |
| Name and address of agent for service: | | Andrew R. French |
| | 655 Broad Street, 17th Floor |
| | Newark, New Jersey 07102 |
| |
| Registrant’s telephone number, including area code: | | 800-225-1852 |
| |
| Date of fiscal year end: | | 10/31/2021 |
| |
| Date of reporting period: | | 10/31/2021 |
Item 1 – Reports to Stockholders

PGIM REAL ASSETS FUND
ANNUAL REPORT
OCTOBER 31, 2021

|
To enroll in e-delivery, go to pgim.com/investments/resource/edelivery |
Table of Contents
This report presents the consolidated results of the PGIM Real Assets Fund and the PGIM Real Assets Subsidiary, Ltd.
This report is not authorized for distribution to prospective investors unless preceded or accompanied by a current prospectus.
The views expressed in this report and information about the Fund’s portfolio holdings are for the period covered by this report and are subject to change thereafter.
Mutual funds are distributed by Prudential Investment Management Services LLC, a Prudential Financial company, member SIPC. Jennison Associates LLC and PGIM, Inc. (PGIM) are registered investment advisers and Prudential Financial companies. PGIM Quantitative Solutions is the primary business name of PGIM Quantitative Solutions LLC (formerly known as QMA LLC), a wholly owned subsidiary of PGIM. PGIM Fixed Income and PGIM Real Estate are units of PGIM. © 2021 Prudential Financial, Inc. and its related entities. Jennison Associates, Jennison, PGIM Real Estate, PGIM, and the PGIM logo are service marks of Prudential Financial, Inc. and its related entities, registered in many jurisdictions worldwide.
| | |
| 2 | | Visit our website at pgim.com/investments |
Letter from the President
| | |
 | | Dear Shareholder: We hope you find the annual report for the PGIM Real Assets Fund informative and useful. The report covers performance for the 12-month period that ended October 31, 2021. The global economy and markets continued to recover throughout the period from the ongoing impact of the COVID-19 pandemic. The Federal Reserve slashed interest rates and kept them near zero to encourage borrowing. Congress passed stimulus bills worth several trillion dollars to help consumers and businesses. And several effective COVID-19 vaccines received regulatory approval. Those measures were enough to offset the fear of rising inflation and supply |
chain challenges that threatened to disrupt growth.
At the start of the period, stocks had recovered most of the steep losses they had suffered at the onset of the pandemic. Equities rallied as states reopened their economies but became more volatile as investors worried that a surge in COVID-19 infections would stall the recovery. However, rising corporate profits and economic growth, the resolution of the US presidential election, and the global rollout of approved vaccines lifted equity markets to record levels, helping stocks around the globe post gains for the full period.
Throughout this volatile period, investors sought safety in fixed income.
Investment-grade bonds in the US and the overall global bond market declined slightly during the period as the economy recovered, but emerging market debt rose. While the 10-year US Treasury yield hovered near record lows early in the period after a significant rally in interest rates, rates moved higher later on as investors began to focus on stronger economic growth and the prospects of higher inflation. The Fed also took several aggressive actions to keep the bond markets running smoothly, implementing many of the relief programs that proved to be successful in helping end the global financial crisis in 2008-09.
Regarding your investments with PGIM, we believe it is important to maintain a diversified portfolio of funds consistent with your tolerance for risk, time horizon, and financial goals. Your financial advisor can help you create a diversified investment plan that may include funds covering all the basic asset classes and that reflects your personal investor profile and risk tolerance. However, diversification and asset allocation strategies do not assure a profit or protect against loss in declining markets.
At PGIM Investments, we consider it a great privilege and responsibility to help investors participate in opportunities across global markets while meeting their toughest investment challenges. PGIM is a top-10 global investment manager with more than $1.5 trillion in assets under management. This scale and investment expertise allow us to deliver actively managed funds and strategies to meet the needs of investors around the globe.
Thank you for choosing our family of funds.
Sincerely,

Stuart S. Parker, President
PGIM Real Assets Fund
December 15, 2021
Your Fund’s Performance (unaudited)
Performance data quoted represent past performance. Past performance does not guarantee future results. The investment return and principal value of an investment will fluctuate so that an investor’s shares, when redeemed, may be worth more or less than their original cost. Current performance may be lower or higher than the past performance data quoted. An investor may obtain performance data as of the most recent month-end by visiting our website at pgim.com/investments or by calling (800) 225-1852.
| | | | | | | | | | | | | | | | | | | | |
| |
| | | Average Annual Total Returns as of 10/31/21 |
| | | One Year (%) | | Five Years (%) | | Ten Years (%) | | Since Inception (%) |
| | | | |
| Class A | | | | | | | | |
| | | | |
| (with sales charges) | | 20.18 | | 5.35 | | 2.98 | | — |
| | | | |
| (without sales charges) | | 27.18 | | 6.55 | | 3.57 | | — |
| | | | |
| Class C | | | | | | | | |
| | | | |
| (with sales charges) | | 25.32 | | 5.78 | | 2.82 | | — |
| | | | |
| (without sales charges) | | 26.32 | | 5.78 | | 2.82 | | — |
| | | | |
| Class Z | | | | | | | | |
| | | | |
| (without sales charges) | | 27.70 | | 6.91 | | 3.88 | | — |
| | | | |
| Class R6 | | | | | | | | |
| | | | |
| (without sales charges) | | 27.78 | | 7.00 | | N/A | | 4.29 (01/23/2015) |
| | | | |
| Customized Blend Index | | | | | | | | |
| | | | |
| | 28.98 | | 6.49 | | 3.07 | | — |
| | | | |
| Bloomberg US TIPS Index | | | | | | | | |
| | | | |
| | | 7.08 | | 4.66 | | 3.05 | | — |
| | |
|
| Average Annual Total Returns as of 10/31/21 Since Inception (%) |
| | | Class R6
(01/23/2015) |
| |
| Customized Blend Index | | 4.09 |
| |
| Bloomberg US TIPS Index | | 3.75 |
Since Inception returns are provided for any share class with less than 10 fiscal years of returns. Since Inception returns for the Indexes are measured from the closest month-end to the class’ inception date.
| | |
| 4 | | Visit our website at pgim.com/investments |
Growth of a $10,000 Investment (unaudited)
The graph compares a $10,000 investment in the Fund’s Class Z shares with a similar investment in the Customized Blend Index and Bloomberg US TIPS Index, by portraying the initial account values at the beginning of the 10-year period for Class Z shares (October 31, 2011) and the account values at the end of the current fiscal year (October 31, 2021), as measured on a quarterly basis. For purposes of the graph, and unless otherwise indicated, it has been assumed that (a) all recurring fees (including management fees) were deducted and (b) all dividends and distributions were reinvested. The line graph provides information for Class Z shares only. As indicated in the tables provided earlier, performance for other share classes will vary due to the differing fees and expenses applicable to each share class (as indicated in the following paragraphs). Without waiver of fees and/or expense reimbursements, if any, the returns would have been lower.
Past performance does not predict future performance. Total returns and the ending account values in the graph include changes in share price and reinvestment of dividends and capital gains distributions in a hypothetical investment for the periods shown. The Fund’s total returns do not reflect the deduction of income taxes on an individual’s investment. Taxes may reduce your actual investment returns on income or gains paid by the Fund or any gains you may realize if you sell your shares.
Your Fund’s Performance (continued)
The returns in the tables do not reflect the deduction of taxes that a shareholder would pay on Fund distributions or following the redemption of Fund shares. The average annual total returns take into account applicable sales charges, which are described for each share class in the table below.
| | | | | | | | |
| | | | | |
| | | Class A | | Class C | | Class Z | | Class R6 |
| | | | | |
| Maximum initial sales charge | | 5.50% of the public offering price | | None | | None | | None |
| Contingent deferred sales charge (CDSC) (as a percentage of the lower of the original purchase price or the net asset value at redemption) | | 1.00% on sales of $1 million or more made within 12 months of purchase | | 1.00% on sales made within 12 months of purchase | | None | | None |
| Annual distribution and service (12b-1) fees (shown as a percentage of average daily net assets) | | 0.30% (0.25% currently) | | 1.00% | | None | | None |
Benchmark Definitions
Customized Blend Index—The Customized Blend Index (Customized Blend) is a model portfolio consisting of the Bloomberg Commodity Index (33.3%), Morgan Stanley Capital International World Real Estate Net Dividend Index (33.3%), and Bloomberg US TIPS Index (33.3%). Each component of the Customized Blend is an unmanaged index generally considered as representing the performance of the Fund’s asset classes. The Customized Blend is intended to provide a theoretical comparison of the Fund’s performance, based on the amounts allocated to each asset class rather than on amounts allocated to various Fund segments. The Bloomberg Commodity Index is an unmanaged, broadly diversified futures index currently composed of futures contracts on 23 physical commodities. The Index is weighted among commodity sectors using dollar-adjusted liquidity and production data. An investment cannot be made directly in an index. The MSCI World Real Estate Net Dividend Index is a sub-index of the MSCI World Index and represents only securities in the GICS Real Estate Industry Group. The Net Dividend version of the MSCI World Real Estate Index reflects the impact of the maximum withholding taxes on reinvested dividends.
Bloomberg US TIPS Index—The Bloomberg US Treasury Inflation-Protected Securities Index (TIPS Index) is an unmanaged index that consists of inflation-protected securities issued by the US Treasury.
Investors cannot invest directly in an index. The returns for the Indexes would be lower if they included the effects of sales charges, operating expenses of a mutual fund, or taxes that may be paid by an investor.
| | |
| 6 | | Visit our website at pgim.com/investments |
Presentation of Fund Holdings as of 10/31/21
| | | | |
| | |
| Ten Largest Holdings | | Asset Class | | % of Net Assets |
| | |
| PGIM QMA Commodity Strategies Fund (Class R6) | | Commodity | | 24.7% |
| | |
| PGIM TIPS Fund (Class R6) | | TIPS | | 15.0% |
| | |
| PGIM Global Real Estate Fund (Class R6) | | Real Estate | | 12.0% |
| | |
| PGIM Select Real Estate Fund (Class R6) | | Real Estate | | 12.0% |
| | |
| PGIM Jennison Global Infrastructure Fund (Class R6) | | Utilities/Infrastructure | | 10.6% |
| | |
| PGIM Jennison MLP Fund (Class R6) | | Master Limited Partnerships (MLPs) | | 10.2% |
| | |
| PGIM Jennison Natural Resources Fund (Class R6) | | Natural Resources | | 8.5% |
| | |
| PGIM Short Duration High Yield Income Fund (Class R6) | | Short Duration High Yield | | 2.9% |
| | |
| PGIM Floating Rate Income Fund (Class R6) | | Floating Rate Income | | 2.9% |
| | |
| iShares Gold Trust | | Exchange-Traded Funds | | 0.1% |
Holdings reflect only long-term investments and are subject to change.
Strategy and Performance Overview (unaudited)
How did the Fund perform?
The PGIM Real Assets Fund’s Class Z shares returned 27.70% in the 12-month reporting period that ended October 31, 2021, outperforming the 7.08% return of the Bloomberg US TIPS Index (the Index) but underperforming the 28.98% return of the Customized Blend Index. The Customized Blend Index is a model portfolio consisting of the Bloomberg Commodity Index (33.3%), the Morgan Stanley Capital International World Real Estate Net Dividend Index (33.3%), and the Bloomberg US TIPS Index (33.3%)
What were the market conditions?
| ● | After a period of robust recovery, global growth hit a speed bump in the middle of 2021 as supply-chain disruptions and the spread of the COVID-19 Delta variant slowed economic activity in major economies, including the US and China. |
| ● | The US gross domestic product (i.e., the monetary value of all finished goods and services made in a country within a specific period) slowed sharply to a 2.0% annual growth rate in the third quarter of 2021, down sharply from 6.7% annual growth in the previous quarter, as both consumption and spending eased. |
| ● | Inflation rose throughout 2021 and remained elevated at the end of the reporting period, as energy and commodity prices rose. Energy demand surged after COVID-19 lockdowns were eased, which led to supply bottlenecks and higher prices worldwide. |
| ● | Rising inflation forced central banks to begin communicating their next stages of monetary policy during the period. The Federal Reserve described inflation as “transitory” early in the period but subsequently modified its position and signaled it could begin tapering monthly bond purchases that have been part of its quantitative easing strategy during the pandemic. |
| ● | US Treasury interest rates rose throughout 2021, ending the period near the peak set in the spring. However, the improved economic picture compressed credit spreads, lowering the market’s expectation for their returns. |
What worked?
| ● | Relative to the Index, the Fund was overweight risk assets while significantly underweight treasury inflation-protected securities, which was the worst-performing Index component during the reporting period. Both strategies contributed to performance. |
| ● | An off-Index allocation to short-duration high yield bonds and floating rate income bonds, at the expense of TIPS, also contributed to returns. |
| ● | Tactically, an overweight allocation to commodity-sensitive exposures, notably master limited partnerships (MLPs) and global natural resource stocks, benefited the Fund, as the broad commodity markets posted large returns during the period. |
| ● | Among underlying Fund managers, the PGIM Jennison Global Natural Resources Fund, PGIM Jennison MLP Fund, and PREI Global REIT funds all outperformed their respective indexes by sizable margins during the period, a tailwind for performance. |
| | |
| 8 | | Visit our website at pgim.com/investments |
What didn’t work?
| ● | Tactically, an off-Index allocation, albeit limited, to gold detracted from the Fund’s performance as gold experienced negative absolute returns during the reporting period. |
| ● | Relative to the Index, an underweight allocation to global real estate investment trusts (REITs), with offsetting exposure to global infrastructure stocks, detracted from Fund performance, as global infrastructure stocks trailed global REITs for the period. |
| ● | Among underlying managers, the PGIM QMA Commodity Fund lagged its index during the period, a slight headwind to performance. |
Did the Fund use derivatives?
| ● | The Fund did not utilize any derivative instruments at the aggregate level during the reporting period, although the sub-advisors of the underlying funds may utilize them, as is permitted in managing their respective strategies. More specifically, both the QMA Gold Sleeve and the QMA Commodity Sleeve utilize futures in obtaining exposure to various commodity markets. |
| ● | The QMA Commodity Sleeve closely tracks the Bloomberg Commodity Index, a diversified benchmark for the commodity futures markets composed of futures contracts on 22 physical commodities. This sleeve exhibits a performance profile similar to this index and is composed entirely of near-dated futures contracts. Derivatives are core holdings of this sleeve and are not an off-index position. There is no additional impact of holding derivatives beyond the core investment mandate. |
| ● | The QMA Gold Sleeve closely tracks the price of gold and may opportunistically invest in other precious metals. Similar to the broader commodity investment complex, this is achieved by purchasing futures contracts for primarily one physical commodity—gold. Historically, this sleeve has also purchased silver futures contracts. There is no additional impact of holding derivatives beyond tracking the gold and other precious metal near-dated futures prices. |
Current outlook
| ● | In the near term, inflation is likely to remain under upward pressure by factors related to the COVID-19 pandemic shock, in PGIM Quantitative Solutions’ view, and any change is likely to be gradual in an environment of strong demand growth, lean inventory positions, and a normalization of service sector prices. |
| ● | Going forward, PGIM Quantitative Solutions believes the biggest potential risk to investors would occur if policymakers maintain loose fiscal and monetary policies, allowing inflation to rise above what investors consider to be benign. |
| ● | PGIM Quantitative Solutions remains bullish on the outlook for real assets such as natural resources stocks, midstream energy/MLPs, and commodities given strong economic growth prospects, supply-side constraints, and rising inflation risks. |
Strategy and Performance Overview (continued)
| ● | PGIM Quantitative Solutions anticipates bond yields rising toward the levels seen earlier in 2021 as Delta variant risks rise and fall. However, rates likely will stay historically low, anchored by structural trends and central bank policy. |
| | |
| 10 | | Visit our website at pgim.com/investments |
Fees and Expenses (unaudited)
As a shareholder of the Fund, you incur two types of costs: (1) transaction costs, including sales charges (loads) on purchase payments and redemptions, as applicable, and (2) ongoing costs, including management fees, distribution and/or service (12b-1) fees, and other Fund expenses, as applicable. This example is intended to help you understand your ongoing costs (in dollars) of investing in the Fund and to compare these costs with the ongoing costs of investing in other mutual funds.
The example is based on an investment of $1,000 held through the six-month period ended October 31, 2021. The example is for illustrative purposes only; you should consult the Prospectus for information on initial and subsequent minimum investment requirements.
Actual Expenses
The first line for each share class in the table on the following page provides information about actual account values and actual expenses. You may use the information on this line, together with the amount you invested, to estimate the expenses that you paid over the period. Simply divide your account value by $1,000 (for example, an $8,600 account value ÷ $1,000 = 8.6), then multiply the result by the number on the first line under the heading “Expenses Paid During the Six-Month Period” to estimate the expenses you paid on your account during this period.
Hypothetical Example for Comparison Purposes
The second line for each share class in the table on the following page provides information about hypothetical account values and hypothetical expenses based on the Fund’s actual expense ratio and an assumed rate of return of 5% per year before expenses, which is not the Fund’s actual return. The hypothetical account values and expenses may not be used to estimate the actual ending account balance or expenses you paid for the period. You may use this information to compare the ongoing costs of investing in the Fund and other funds. To do so, compare this 5% hypothetical example with the 5% hypothetical examples that appear in the shareholder reports of the other funds.
The Fund’s transfer agent may charge additional fees to holders of certain accounts that are not included in the expenses shown in the table on the following page. These fees apply to individual retirement accounts (IRAs) and Section 403(b) accounts. As of the close of the six-month period covered by the table, IRA fees included an annual maintenance fee of $15 per account (subject to a maximum annual maintenance fee of $25 for all accounts held by the same shareholder). Section 403(b) accounts are charged an annual $25 fiduciary maintenance fee. Some of the fees may vary in amount, or may be waived, based on your total account balance or the number of PGIM funds, including the Fund, that you own. You should consider the additional fees that were charged to your Fund account over the six-month period when you estimate the total ongoing expenses paid over the period and the impact of these fees on your ending account value, as these additional expenses are not reflected in the information
Fees and Expenses (continued)
provided in the expense table. Additional fees have the effect of reducing investment returns.
Please note that the expenses shown in the table are meant to highlight your ongoing costs only and do not reflect any transactional costs such as sales charges (loads). Therefore, the second line for each share class in the table is useful in comparing ongoing costs only and will not help you determine the relative total costs of owning different funds. In addition, if these transactional costs were included, your costs would have been higher.
| | | | | | | | | | |
| | | | |
| PGIM Real Assets Fund | | Beginning
Account Value
May 1, 2021 | | Ending
Account Value
October 31, 2021 | | Annualized
Expense
Ratio Based on
the Six-Month Period | | Expenses Paid
During the
Six-Month Period* |
| Class A | | Actual | | $1,000.00 | | $1,100.20 | | 1.27% | | $ 6.72 |
| | Hypothetical | | $1,000.00 | | $1,018.80 | | 1.27% | | $ 6.46 |
| Class C | | Actual | | $1,000.00 | | $1,097.50 | | 1.92% | | $10.15 |
| | Hypothetical | | $1,000.00 | | $1,015.53 | | 1.92% | | $ 9.75 |
| Class Z | | Actual | | $1,000.00 | | $1,102.70 | | 0.95% | | $ 5.03 |
| | Hypothetical | | $1,000.00 | | $1,020.42 | | 0.95% | | $ 4.84 |
| Class R6 | | Actual | | $1,000.00 | | $1,103.30 | | 0.85% | | $ 4.51 |
| | | Hypothetical | | $1,000.00 | | $1,020.92 | | 0.85% | | $ 4.33 |
*Fund expenses (net of fee waivers or subsidies, if any) for each share class are equal to the annualized expense ratio for each share class (provided in the table), multiplied by the average account value over the period, multiplied by the 184 days in the six-month period ended October 31, 2021, and divided by the 365 days in the Fund’s fiscal year ended October 31, 2021 (to reflect the six-month period). Expenses presented in the table include the expenses of any underlying portfolios in which the Fund may invest.
| | |
| 12 | | Visit our website at pgim.com/investments |
Consolidated Schedule of Investments
as of October 31, 2021
| | | | | | | | | | |
| Description | | Shares | | | Value | |
| | |
LONG-TERM INVESTMENTS 98.9% | | | | | | | | |
| | |
AFFILIATED MUTUAL FUNDS 98.8% | | | | | | | | |
PGIM Floating Rate Income Fund (Class R6) | | | 349,190 | | | $ | 3,387,141 | |
PGIM Global Real Estate Fund (Class R6) | | | 503,986 | | | | 13,904,978 | |
PGIM Jennison Global Infrastructure Fund (Class R6) | | | 718,792 | | | | 12,327,281 | |
PGIM Jennison MLP Fund (Class R6) | | | 1,850,345 | | | | 11,897,716 | |
PGIM Jennison Natural Resources Fund (Class R6) | | | 205,789 | | | | 9,923,127 | |
PGIM QMA Commodity Strategies Fund (Class R6)* | | | 2,237,718 | | | | 28,687,546 | |
PGIM Select Real Estate Fund (Class R6) | | | 907,698 | | | | 13,896,855 | |
PGIM Short Duration High Yield Income Fund (Class R6) | | | 374,701 | | | | 3,387,293 | |
PGIM TIPS Fund (Class R6) | | | 1,635,596 | | | | 17,468,162 | |
| | | | | | | | | | |
| | |
TOTAL AFFILIATED MUTUAL FUNDS
(cost $90,040,423)(wd) | | | | | | | 114,880,099 | |
| | | | | | | | | | |
| | |
EXCHANGE-TRADED FUND 0.1% | | | | | | | | |
iShares Gold Trust*
(cost $123,611) | | | 3,650 | | | | 123,844 | |
| | | | | | | | | | |
| | |
TOTAL LONG-TERM INVESTMENTS
(cost $90,164,034) | | | | | | | 115,003,943 | |
| | | | | | | | | | |
| | |
SHORT-TERM INVESTMENTS 1.1% | | | | | | | | |
| | |
AFFILIATED MUTUAL FUND 0.9% | | | | | | | | |
PGIM Core Ultra Short Bond Fund
(cost $1,035,371)(bb)(wd) | | | 1,035,371 | | | | 1,035,371 | |
| | | | | | | | | | |
| | | | | | | | | | | | | | | | |
| | | Interest
Rate | | | Maturity
Date | | | Principal
Amount
(000)# | | | | |
|
U.S. TREASURY OBLIGATION(bb)(k)(n) 0.2% | |
U.S. Treasury Bills
(cost $299,989) | | | 0.035 | % | | | 12/09/21 | | | | 300 | | | | 299,979 | |
| | | | | | | | | | | | | | | | |
| | | | |
TOTAL SHORT-TERM INVESTMENTS
(cost $1,335,360) | | | | | | | | | | | | | | | 1,335,350 | |
| | | | | | | | | | | | | | | | |
| | | | |
TOTAL INVESTMENTS 100.0%
(cost $91,499,394) | | | | | | | | | | | | | | | 116,339,293 | |
Liabilities in excess of other assets(z) (0.0)% | | | | | | | | | | | | | | | (55,001 | ) |
| | | | | | | | | | | | | | | | |
| | | | |
NET ASSETS 100.0% | | | | | | | | | | | | | | $ | 116,284,292 | |
| | | | | | | | | | | | | | | | |
See Notes to Consolidated Financial Statements.
Consolidated Schedule of Investments (continued)
as of October 31, 2021
Below is a list of the abbreviation(s) used in the annual report:
USD—US Dollar
LIBOR—London Interbank Offered Rate
MLP—Master Limited Partnership
OTC—Over-the-counter
TIPS—Treasury Inflation-Protected Securities
| * | Non-income producing security. |
| # | Principal amount is shown in U.S. dollars unless otherwise stated. |
| (bb) | Represents security, or a portion thereof, held in the Cayman Subsidiary. |
| (k) | Represents security, or a portion thereof, segregated as collateral for centrally cleared/exchange-traded derivatives. |
| (n) | Rate shown is the effective yield at purchase date. |
| (wd) | PGIM Investments LLC, the manager of the Fund, also serves as the manager of the underlying funds in which the Fund invests. |
| (z) | Includes net unrealized appreciation/(depreciation) and/or market value of the below holdings which are excluded from the Consolidated Schedule of Investments: |
Commodity Futures contracts outstanding at October 31, 2021(1):
| | | | | | | | | | | | | | | | | |
Number
of
Contracts | | Type | | Expiration
Date | | Current
Notional
Amount | | Value/
Unrealized
Appreciation
(Depreciation) |
| | | |
| Long Positions: | | | | | | | | | | | | | | | |
5 | | Gold 100 OZ | | | | Dec. 2021 | | | | $ | 891,950 | | | | $ | (10,312 | ) |
1 | | Silver | | | | Dec. 2021 | | | | | 119,745 | | | | | 908 | |
| | | | | | | | | | | | | | | | | |
| | | | | | | | | | | | | | | $ | (9,404 | ) |
| | | | | | | | | | | | | | | | | |
| (1) | Represents positions held in the Cayman Subsidiary. |
Summary of Collateral for Centrally Cleared/Exchange-traded Derivatives:
Cash and securities segregated as collateral, including pending settlement for closed positions, to cover requirements for centrally cleared/exchange-traded derivatives are listed by broker as follows:
| | | | | | | | | | |
Broker | | Cash and/or Foreign Currency | | Securities Market Value |
Morgan Stanley & Co. LLC | | | $ | — | | | | $ | 299,979 | |
| | | | | | | | | | |
Fair Value Measurements:
Various inputs are used in determining the value of the Fund’s investments. These inputs are summarized in the three broad levels listed below.
Level 1—unadjusted quoted prices generally in active markets for identical securities.
Level 2—quoted prices for similar securities, interest rates and yield curves, prepayment speeds, foreign currency exchange rates and other observable inputs.
Level 3—unobservable inputs for securities valued in accordance with Board approved fair valuation procedures.
See Notes to Consolidated Financial Statements.
The following is a summary of the inputs used as of October 31, 2021 in valuing such portfolio securities:
| | | | | | | | | | | | |
| | | Level 1 | | | Level 2 | | | Level 3 | |
Investments in Securities | | | | | | | | | | | | |
Assets | | | | | | | | | | | | |
Long-Term Investments | | | | | | | | | | | | |
Affiliated Mutual Funds | | $ | 114,880,099 | | | $ | — | | | | $— | |
Exchange-Traded Fund | | | 123,844 | | | | — | | | | — | |
Short-Term Investments | | | | | | | | | | | | |
Affiliated Mutual Fund | | | 1,035,371 | | | | — | | | | — | |
U.S. Treasury Obligation | | | — | | | | 299,979 | | | | — | |
| | | | | | | | | | | | |
Total | | $ | 116,039,314 | | | $ | 299,979 | | | | $— | |
| | | | | | | | | | | | |
| | | |
| Other Financial Instruments* | | | | | | | | | |
Assets | | | | | | | | | | | | |
Commodity Future Contract | | $ | 908 | | | $ | — | | | | $— | |
| | | | | | | | | | | | |
Liabilities | | | | | | | | | | | | |
Commodity Future Contract | | $ | (10,312 | ) | | $ | — | | | | $— | |
| | | | | | | | | | | | |
| * | Other financial instruments are derivative instruments not reflected in the Consolidated Schedule of Investments, such as futures, forwards and centrally cleared swap contracts, which are recorded at the unrealized appreciation (depreciation) on the instrument, and OTC swap contracts which are recorded at fair value. |
Fund Composition:
The fund composition of investments (excluding derivatives) and liabilities in excess of other assets shown as a percentage of net assets as of October 31, 2021 were as follows (unaudited):
| | | | |
Commodity | | | 24.7 | % |
Real Estate | | | 24.0 | |
TIPS | | | 15.0 | |
Utilities/Infrastructure | | | 10.6 | |
Master Limited Partnerships (MLPs) | | | 10.2 | |
Natural Resources | | | 8.5 | |
Short Duration High Yield | | | 2.9 | |
Floating Rate Income | | | 2.9 | |
Core Ultra Short Bond | | | 0.9 | |
U.S. Treasury Obligation | | | 0.2 | |
Exchange-Traded Fund | | | 0.1 | |
| | | | |
| | | 100.0 | |
Liabilities in excess of other assets | | | (0.0 | )* |
| | | | |
| | | 100.0 | % |
| | | | |
See Notes to Consolidated Financial Statements.
Consolidated Schedule of Investments (continued)
as of October 31, 2021
Effects of Derivative Instruments on the Financial Statements and Primary Underlying Risk Exposure:
The Fund invested in derivative instruments during the reporting period. The primary type of risk associated with these derivative instruments is commodity contracts risk. See the Notes to Consolidated Financial Statements for additional detail regarding these derivative instruments and their risks. The effect of such derivative instruments on the Fund’s financial position and financial performance as reflected in the Consolidated Statement of Assets and Liabilities and Consolidated Statement of Operations is presented in the summary below.
Fair values of derivative instruments as of October 31, 2021 as presented in the Consolidated Statement of Assets and Liabilities:
| | | | | | | | |
| | | Asset Derivatives | | Liability Derivatives |
Derivatives not accounted for as hedging instruments, carried at fair value | | Consolidated
Statement of
Assets and
Liabilities Location | | Fair
Value | | Consolidated
Statement of
Assets and
Liabilities Location | | Fair
Value |
| Commodity contracts | | Due from/to
broker-variation
margin futures | | $908* | | Due from/to
broker-variation
margin futures | | $10,312* |
| | | | | | | | |
| * | Includes cumulative appreciation (depreciation) as reported in the schedule of open futures and centrally cleared swap contracts. Only unsettled variation margin receivable (payable) is reported within the Consolidated Statement of Assets and Liabilities. |
The effects of derivative instruments on the Consolidated Statement of Operations for the year ended October 31, 2021 are as follows:
| | |
Amount of Realized Gain (Loss) on Derivatives Recognized in Income |
Derivatives not accounted for as hedging instruments, carried at fair value | | Futures |
Commodity contracts | | $(1,102,123) |
| | |
|
Change in Unrealized Appreciation (Depreciation) on Derivatives Recognized in Income |
Derivatives not accounted for as hedging instruments, carried at fair value | | Futures |
Commodity contracts | | $389,663 |
| | |
See Notes to Consolidated Financial Statements.
For the year ended October 31, 2021, the Fund’s average volume of derivative activities is as follows:
|
Futures Contracts— Long Positions(1) |
$6,420,142 |
| (1) | Notional Amount in USD. |
Average volume is based on average quarter end balances as noted for the year ended October 31, 2021.
See Notes to Consolidated Financial Statements.
Consolidated Statement of Assets and Liabilities
as of October 31, 2021
| | | | |
Assets | | | | |
Investments at value: | | | | |
Unaffiliated investments (cost $423,600) | | $ | 423,823 | |
Affiliated investments (cost $91,075,794) | | | 115,915,470 | |
Receivable for Fund shares sold | | | 225,933 | |
Due from Manager | | | 1,088 | |
Prepaid expenses | | | 1,202 | |
| | | | |
Total Assets | | | 116,567,516 | |
| | | | |
| |
| Liabilities | | | |
Payable for Fund shares purchased | | | 172,756 | |
Audit fee payable | | | 52,000 | |
Custodian and accounting fees payable | | | 23,962 | |
Accrued expenses and other liabilities | | | 14,375 | |
Due to broker—variation margin futures | | | 10,205 | |
Affiliated transfer agent fee payable | | | 6,952 | |
Distribution fee payable | | | 2,055 | |
Trustees’ fees payable | | | 883 | |
Dividends payable | | | 36 | |
| | | | |
Total Liabilities | | | 283,224 | |
| | | | |
| |
Net Assets | | $ | 116,284,292 | |
| | | | |
| |
| | | | | |
Net assets were comprised of: | | | | |
Shares of beneficial interest, at par | | $ | 10,261 | |
Paid-in capital in excess of par | | | 105,971,236 | |
Total distributable earnings (loss) | | | 10,302,795 | |
| | | | |
Net assets, October 31, 2021 | | $ | 116,284,292 | |
| | | | |
See Notes to Consolidated Financial Statements.
| | | | |
Class A | |
Net asset value and redemption price per share,
($7,447,882 ÷ 658,260 shares of beneficial interest issued and outstanding) | | $ | 11.31 | |
Maximum sales charge (5.50% of offering price) | | | 0.66 | |
| | | | |
Maximum offering price to public | | $ | 11.97 | |
| | | | |
|
Class C | |
Net asset value, offering price and redemption price per share,
($612,757 ÷ 54,616 shares of beneficial interest issued and outstanding) | | $ | 11.22 | |
| | | | |
|
Class Z | |
Net asset value, offering price and redemption price per share,
($58,290,488 ÷ 5,141,733 shares of beneficial interest issued and outstanding) | | $ | 11.34 | |
| | | | |
|
Class R6 | |
Net asset value, offering price and redemption price per share,
($49,933,165 ÷ 4,406,564 shares of beneficial interest issued and outstanding) | | $ | 11.33 | |
| | | | |
See Notes to Consolidated Financial Statements.
Consolidated Statement of Operations
Year Ended October 31, 2021
| | | | |
Net Investment Income (Loss) | | | | |
Income | | | | |
Affiliated dividend income | | $ | 1,495,215 | |
Unaffiliated dividend income | | | 6,001 | |
Interest income | | | 380 | |
| | | | |
Total income | | | 1,501,596 | |
| | | | |
| |
Expenses | | | | |
Management fee | | | 666,914 | |
Distribution fee(a) | | | 26,071 | |
Custodian and accounting fees | | | 94,477 | |
Transfer agent’s fees and expenses (including affiliated expense of $38,629)(a) | | | 58,073 | |
Audit fee | | | 55,002 | |
Legal fees and expenses | | | 39,069 | |
Registration fees(a) | | | 24,624 | |
Shareholders’ reports | | | 15,769 | |
Trustees’ fees | | | 11,149 | |
Miscellaneous | | | 18,795 | |
| | | | |
Total expenses | | | 1,009,943 | |
Less: Fee waiver and/or expense reimbursement(a) | | | (808,657 | ) |
Distribution fee waiver(a) | | | (3,030 | ) |
| | | | |
Net expenses | | | 198,256 | |
| | | | |
| |
Net investment income (loss) | | | 1,303,340 | |
| | | | |
| |
| Realized And Unrealized Gain (Loss) On Investment And Foreign Currency Transactions | | | |
Net realized gain (loss) on: | | | | |
Investment transactions (including affiliated of $1,039,495) | | | 842,914 | |
Affiliated net capital gain distributions received | | | 233,636 | |
Futures transactions | | | (1,102,123 | ) |
| | | | |
| | | (25,573 | ) |
| | | | |
Net change in unrealized appreciation (depreciation) on: | | | | |
Investments (including affiliated of $23,700,283) | | | 23,719,544 | |
Futures | | | 389,663 | |
Foreign currencies | | | 244 | |
| | | | |
| | | 24,109,451 | |
| | | | |
Net gain (loss) on investment and foreign currency transactions | | | 24,083,878 | |
| | | | |
Net Increase (Decrease) In Net Assets Resulting From Operations | | $ | 25,387,218 | |
| | | | |
| (a) | Class specific expenses and waivers were as follows: |
| | | | | | | | | | | | | | | | |
| | | Class A | | | Class C | | | Class Z | | | Class R6 | |
Distribution fee | | | 18,178 | | | | 7,893 | | | | — | | | | — | |
Transfer agent’s fees and expenses | | | 10,748 | | | | 1,230 | | | | 45,790 | | | | 305 | |
Registration fees | | | 6,857 | | | | 4,837 | | | | 7,793 | | | | 5,137 | |
Fee waiver and/or expense reimbursement | | | (51,969 | ) | | | (10,643 | ) | | | (438,006 | ) | | | (308,039 | ) |
Distribution fee waiver | | | (3,030 | ) | | | — | | | | — | | | | — | |
See Notes to Consolidated Financial Statements.
Consolidated Statements of Changes in Net Assets
| | | | | | | | |
| |
| | | Year Ended
October 31, | |
| | |
| | | 2021 | | | 2020 | |
| | |
Increase (Decrease) in Net Assets | | | | | | | | |
| | |
Operations | | | | | | | | |
Net investment income (loss) | | $ | 1,303,340 | | | $ | 1,390,869 | |
Net realized gain (loss) on investment transactions | | | (259,209 | ) | | | 2,805,945 | |
Affiliated net capital gain distributions received | | | 233,636 | | | | 1,087,111 | |
Net change in unrealized appreciation (depreciation) on investments and foreign currencies | | | 24,109,451 | | | | (6,609,380 | ) |
| | | | | | | | |
Net increase (decrease) in net assets resulting from operations | | | 25,387,218 | | | | (1,325,455 | ) |
| | | | | | | | |
| | |
Dividends and Distributions | | | | | | | | |
Distributions from distributable earnings | | | | | | | | |
Class A | | | (284,273 | ) | | | (102,388 | ) |
Class B | | | — | | | | (2,494 | ) |
Class C | | | (50,905 | ) | | | (24,363 | ) |
Class Z | | | (3,222,924 | ) | | | (1,555,078 | ) |
Class R6 | | | (2,024,274 | ) | | | (783,021 | ) |
| | | | | | | | |
| | | (5,582,376 | ) | | | (2,467,344 | ) |
| | | | | | | | |
| | |
Fund share transactions (Net of share conversions) | | | | | | | | |
Net proceeds from shares sold | | | 29,735,415 | | | | 22,820,985 | |
Net asset value of shares issued in reinvestment of dividends and distributions | | | 5,582,026 | | | | 2,467,076 | |
Cost of shares purchased | | | (31,372,465 | ) | | | (27,352,239 | ) |
| | | | | | | | |
| | |
Net increase (decrease) in net assets from Fund share transactions | | | 3,944,976 | | | | (2,064,178 | ) |
| | | | | | | | |
| | |
Total increase (decrease) | | | 23,749,818 | | | | (5,856,977 | ) |
| | |
| Net Assets: | | | | | | |
Beginning of year | | | 92,534,474 | | | | 98,391,451 | |
| | | | | | | | |
End of year | | $ | 116,284,292 | | | $ | 92,534,474 | |
| | | | | | | | |
See Notes to Consolidated Financial Statements.
Consolidated Financial Highlights
| | | | | | | | | | | | | | | | | | | | |
| Class A Shares | |
| | | Year Ended October 31, | |
| | | 2021 | | | 2020 | | | 2019 | | | 2018 | | | 2017 | |
| Per Share Operating Performance(a): | | | | | | | | | | | | | | | | | | | | |
| Net Asset Value, Beginning of Year | | | $9.37 | | | | $9.74 | | | | $8.98 | | | | $9.44 | | | | $9.36 | |
| Income (loss) from investment operations: | | | | | | | | | | | | | | | | | | | | |
| Net investment income (loss) | | | 0.10 | | | | 0.11 | | | | 0.13 | | | | 0.14 | | | | 0.12 | |
| Net realized and unrealized gain (loss) on investment transactions | | | 2.37 | | | | (0.26 | ) | | | 0.81 | | | | (0.44 | ) | | | 0.12 | |
| Total from investment operations | | | 2.47 | | | | (0.15 | ) | | | 0.94 | | | | (0.30 | ) | | | 0.24 | |
| Less Dividends and Distributions: | | | | | | | | | | | | | | | | | | | | |
| Dividends from net investment income | | | (0.28 | ) | | | (0.16 | ) | | | (0.18 | ) | | | (0.16 | ) | | | (0.12 | ) |
| Tax return of capital distributions | | | - | | | | - | | | | - | | | | - | (b) | | | (0.04 | ) |
| Distributions from net realized gains | | | (0.25 | ) | | | (0.06 | ) | | | - | | | | - | | | | - | (b) |
| Total dividends and distributions | | | (0.53 | ) | | | (0.22 | ) | | | (0.18 | ) | | | (0.16 | ) | | | (0.16 | ) |
| Net asset value, end of year | | | $11.31 | | | | $9.37 | | | | $9.74 | | | | $8.98 | | | | $9.44 | |
| Total Return(c): | | | 27.18 | % | | | (1.61) | % | | | 10.55 | % | | | (3.25) | % | | | 2.60 | % |
| | | | | | | | | | | | | | | | | | | | | |
| Ratios/Supplemental Data: | |
| Net assets, end of year (000) | | | $7,448 | | | | $4,694 | | | | $4,719 | | | | $5,487 | | | | $6,702 | |
| Average net assets (000) | | | $6,059 | | | | $4,479 | | | | $5,438 | | | | $6,032 | | | | $7,589 | |
| Ratios to average net assets(d)(e): | | | | | | | | | | | | | | | | | | | | |
| Expenses after waivers and/or expense reimbursement | | | 0.53 | % | | | 0.86 | % | | | 0.85 | % | | | 0.77 | % | | | 0.66 | % |
| Expenses before waivers and/or expense reimbursement | | | 1.44 | % | | | 2.12 | % | | | 1.57 | % | | | 1.77 | % | | | 1.28 | % |
| Net investment income (loss) | | | 0.92 | % | | | 1.14 | % | | | 1.43 | % | | | 1.50 | % | | | 1.33 | % |
| Portfolio turnover rate(f)(g) | | | 30 | % | | | 96 | % | | | 60 | % | | | 77 | % | | | 96 | % |
| (a) | Calculated based on average shares outstanding during the year. |
| (b) | Amount rounds to zero. |
| (c) | Total return does not consider the effects of sales loads. Total return is calculated assuming a purchase of a share on the first day and a sale on the last day of each year reported and includes reinvestment of dividends and distributions, if any. Total returns may reflect adjustments to conform to GAAP. |
| (d) | Effective November 1, 2017, class specific expenses include transfer agent fees and expenses and registration fees, which are charged to their respective share class. |
| (e) | Does not include expenses of the underlying funds in which the Fund invests. |
| (f) | The Fund’s portfolio turnover rate is calculated in accordance with regulatory requirements, without regard to transactions involving short-term investments and certain derivatives. If such transactions were included, the Fund’s portfolio turnover rate may be higher. |
| (g) | Portfolio turnover excludes the value of portfolio securities received or delivered as a result of in-kind fund share transactions (if any). |
See Notes to Consolidated Financial Statements.
| | | | | | | | | | | | | | | | | | | | |
| Class C Shares | |
| | | Year Ended October 31, | |
| | | 2021 | | | 2020 | | | 2019 | | | 2018 | | | 2017 | |
| Per Share Operating Performance(a): | | | | | | | | | | | | | | | | | | | | |
| Net Asset Value, Beginning of Year | | | $9.30 | | | | $9.68 | | | | $8.93 | | | | $9.39 | | | | $9.32 | |
| Income (loss) from investment operations: | | | | | | | | | | | | | | | | | | | | |
| Net investment income (loss) | | | 0.01 | | | | 0.04 | | | | 0.07 | | | | 0.07 | | | | 0.05 | |
| Net realized and unrealized gain (loss) on investment transactions | | | 2.37 | | | | (0.25 | ) | | | 0.79 | | | | (0.43 | ) | | | 0.11 | |
| Total from investment operations | | | 2.38 | | | | (0.21 | ) | | | 0.86 | | | | (0.36 | ) | | | 0.16 | |
| Less Dividends and Distributions: | | | | | | | | | | | | | | | | | | | | |
| Dividends from net investment income | | | (0.21 | ) | | | (0.11 | ) | | | (0.11 | ) | | | (0.10 | ) | | | (0.07 | ) |
| Tax return of capital distributions | | | - | | | | - | | | | - | | | | - | (b) | | | (0.02 | ) |
| Distributions from net realized gains | | | (0.25 | ) | | | (0.06 | ) | | | - | | | | - | | | | - | (b) |
| Total dividends and distributions | | | (0.46 | ) | | | (0.17 | ) | | | (0.11 | ) | | | (0.10 | ) | | | (0.09 | ) |
| Net asset value, end of year | | | $11.22 | | | | $9.30 | | | | $9.68 | | | | $8.93 | | | | $9.39 | |
| Total Return(c): | | | 26.32 | % | | | (2.26) | % | | | 9.75 | % | | | (3.93) | % | | | 1.74 | % |
| | | | | | | | | | | | | | | | | | | | | |
| Ratios/Supplemental Data: | |
| Net assets, end of year (000) | | | $613 | | | | $1,163 | | | | $1,486 | | | | $1,783 | | | | $2,607 | |
| Average net assets (000) | | | $789 | | | | $1,340 | | | | $1,620 | | | | $2,178 | | | | $2,932 | |
| Ratios to average net assets(d)(e): | | | | | | | | | | | | | | | | | | | | |
| Expenses after waivers and/or expense reimbursement | | | 1.29 | % | | | 1.58 | % | | | 1.56 | % | | | 1.49 | % | | | 1.41 | % |
| Expenses before waivers and/or expense reimbursement | | | 2.64 | % | | | 3.40 | % | | | 2.45 | % | | | 2.70 | % | | | 1.98 | % |
| Net investment income (loss) | | | 0.11 | % | | | 0.41 | % | | | 0.72 | % | | | 0.78 | % | | | 0.56 | % |
| Portfolio turnover rate(f)(g) | | | 30 | % | | | 96 | % | | | 60 | % | | | 77 | % | | | 96 | % |
| (a) | Calculated based on average shares outstanding during the year. |
| (b) | Amount rounds to zero. |
| (c) | Total return does not consider the effects of sales loads. Total return is calculated assuming a purchase of a share on the first day and a sale on the last day of each year reported and includes reinvestment of dividends and distributions, if any. Total returns may reflect adjustments to conform to GAAP. |
| (d) | Effective November 1, 2017, class specific expenses include transfer agent fees and expenses and registration fees, which are charged to their respective share class. |
| (e) | Does not include expenses of the underlying funds in which the Fund invests. |
| (f) | The Fund’s portfolio turnover rate is calculated in accordance with regulatory requirements, without regard to transactions involving short-term investments and certain derivatives. If such transactions were included, the Fund’s portfolio turnover rate may be higher. |
| (g) | Portfolio turnover excludes the value of portfolio securities received or delivered as a result of in-kind fund share transactions (if any). |
See Notes to Consolidated Financial Statements.
Consolidated Financial Highlights (continued)
| | | | | | | | | | | | | | | | | | | | |
| Class Z Shares | | | | | | | | | | | | | | | |
| | | Year Ended October 31, | |
| | | 2021 | | | 2020 | | | 2019 | | | 2018 | | | 2017 | |
| Per Share Operating Performance(a): | | | | | | | | | | | | | | | | | | | | |
| Net Asset Value, Beginning of Year | | | $9.39 | | | | $9.75 | | | | $8.99 | | | | $9.45 | | | | $9.38 | |
| Income (loss) from investment operations: | | | | | | | | | | | | | | | | | | | | |
| Net investment income (loss) | | | 0.13 | | | | 0.15 | | | | 0.16 | | | | 0.17 | | | | 0.15 | |
| Net realized and unrealized gain (loss) on investment transactions | | | 2.38 | | | | (0.26 | ) | | | 0.81 | | | | (0.44 | ) | | | 0.10 | |
| Total from investment operations | | | 2.51 | | | | (0.11 | ) | | | 0.97 | | | | (0.27 | ) | | | 0.25 | |
| Less Dividends and Distributions: | | | | | | | | | | | | | | | | | | | | |
| Dividends from net investment income | | | (0.31 | ) | | | (0.19 | ) | | | (0.21 | ) | | | (0.19 | ) | | | (0.14 | ) |
| Tax return of capital distributions | | | - | | | | - | | | | - | | | | - | (b) | | | (0.04 | ) |
| Distributions from net realized gains | | | (0.25 | ) | | | (0.06 | ) | | | - | | | | - | | | | - | (b) |
| Total dividends and distributions | | | (0.56 | ) | | | (0.25 | ) | | | (0.21 | ) | | | (0.19 | ) | | | (0.18 | ) |
| Net asset value, end of year | | | $11.34 | | | | $9.39 | | | | $9.75 | | | | $8.99 | | | | $9.45 | |
| Total Return(c): | | | 27.70 | % | | | (1.18 | )% | | | 10.94 | % | | | (2.91 | )% | | | 2.74 | % |
| | | | | | | | | | | | | | | | | | | | | |
| Ratios/Supplemental Data: | | | | | | | | | | | | | | | |
| Net assets, end of year (000) | | | $58,290 | | | | $56,307 | | | | $64,495 | | | | $79,349 | | | | $84,752 | |
| Average net assets (000) | | | $57,988 | | | | $58,559 | | | | $67,444 | | | | $85,493 | | | | $94,426 | |
| Ratios to average net assets(d)(e): | | | | | | | | | | | | | | | | | | | | |
| Expenses after waivers and/or expense reimbursement | | | 0.19 | % | | | 0.50 | % | | | 0.49 | % | | | 0.42 | % | | | 0.41 | % |
| Expenses before waivers and/or expense reimbursement | | | 0.95 | % | | | 1.11 | % | | | 1.07 | % | | | 0.99 | % | | | 0.98 | % |
| Net investment income (loss) | | | 1.23 | % | | | 1.58 | % | | | 1.76 | % | | | 1.83 | % | | | 1.57 | % |
| Portfolio turnover rate(f)(g) | | | 30 | % | | | 96 | % | | | 60 | % | | | 77 | % | | | 96 | % |
| (a) | Calculated based on average shares outstanding during the year. |
| (b) | Amount rounds to zero. |
| (c) | Total return is calculated assuming a purchase of a share on the first day and a sale on the last day of each year reported and includes reinvestment of dividends and distributions, if any. Total returns may reflect adjustments to conform to GAAP. |
| (d) | Effective November 1, 2017, class specific expenses include transfer agent fees and expenses and registration fees, which are charged to their respective share class. |
| (e) | Does not include expenses of the underlying funds in which the Fund invests. |
| (f) | The Fund’s portfolio turnover rate is calculated in accordance with regulatory requirements, without regard to transactions involving short-term investments and certain derivatives. If such transactions were included, the Fund’s portfolio turnover rate may be higher. |
| (g) | Portfolio turnover excludes the value of portfolio securities received or delivered as a result of in-kind fund share transactions (if any). |
See Notes to Consolidated Financial Statements.
| | | | | | | | | | | | | | | | | | | | |
| Class R6 Shares | | | | | | | | | | | | | | | |
| | | Year Ended October 31, | |
| | | 2021 | | | 2020 | | | 2019 | | | 2018 | | | 2017 | |
| Per Share Operating Performance(a): | | | | | | | | | | | | | | | | | | | | |
| Net Asset Value, Beginning of Year | | | $9.38 | | | | $9.75 | | | | $8.98 | | | | $9.44 | | | | $9.37 | |
| Income (loss) from investment operations: | | | | | | | | | | | | | | | | | | | | |
| Net investment income (loss) | | | 0.14 | | | | 0.13 | | | | 0.17 | | | | 0.18 | | | | 0.15 | |
| Net realized and unrealized gain (loss) on investment transactions | | | 2.38 | | | | (0.24 | ) | | | 0.82 | | | | (0.44 | ) | | | 0.11 | |
| Total from investment operations | | | 2.52 | | | | (0.11 | ) | | | 0.99 | | | | (0.26 | ) | | | 0.26 | |
| Less Dividends and Distributions: | | | | | | | | | | | | | | | | | | | | |
| Dividends from net investment income | | | (0.32 | ) | | | (0.20 | ) | | | (0.22 | ) | | | (0.20 | ) | | | (0.15 | ) |
| Tax return of capital distributions | | | - | | | | - | | | | - | | | | - | (b) | | | (0.04 | ) |
| Distributions from net realized gains | | | (0.25 | ) | | | (0.06 | ) | | | - | | | | - | | | | - | (b) |
| Total dividends and distributions | | | (0.57 | ) | | | (0.26 | ) | | | (0.22 | ) | | | (0.20 | ) | | | (0.19 | ) |
| Net asset value, end of year | | | $11.33 | | | | $9.38 | | | | $9.75 | | | | $8.98 | | | | $9.44 | |
| Total Return(c): | | | 27.78 | % | | | (1.18 | )% | | | 11.15 | % | | | (2.85 | )% | | | 2.83 | % |
| | | | | | | | | | | | | | | | | | | | | |
| Ratios/Supplemental Data: | | | | | | | | | | | | | | | |
| Net assets, end of year (000) | | | $49,933 | | | | $30,370 | | | | $27,530 | | | | $44,822 | | | | $69,957 | |
| Average net assets (000) | | | $40,677 | | | | $28,578 | | | | $42,776 | | | | $64,112 | | | | $71,614 | |
| Ratios to average net assets(d)(e): | | | | | | | | | | | | | | | | | | | | |
| Expenses after waivers and/or expense reimbursement | | | 0.11 | % | | | 0.41 | % | | | 0.40 | % | | | 0.36 | % | | | 0.32 | % |
| Expenses before waivers and/or expense reimbursement | | | 0.87 | % | | | 1.04 | % | | | 0.98 | % | | | 0.92 | % | | | 0.89 | % |
| Net investment income (loss) | | | 1.31 | % | | | 1.42 | % | | | 1.88 | % | | | 1.93 | % | | | 1.58 | % |
| Portfolio turnover rate(f)(g) | | | 30 | % | | | 96 | % | | | 60 | % | | | 77 | % | | | 96 | % |
| (a) | Calculated based on average shares outstanding during the year. |
| (b) | Amount rounds to zero. |
| (c) | Total return is calculated assuming a purchase of a share on the first day and a sale on the last day of each year reported and includes reinvestment of dividends and distributions, if any. Total returns may reflect adjustments to conform to GAAP. |
| (d) | Effective November 1, 2017, class specific expenses include transfer agent fees and expenses and registration fees, which are charged to their respective share class. |
| (e) | Does not include expenses of the underlying funds in which the Fund invests. |
| (f) | The Fund’s portfolio turnover rate is calculated in accordance with regulatory requirements, without regard to transactions involving short-term investments and certain derivatives. If such transactions were included, the Fund’s portfolio turnover rate may be higher. |
| (g) | Portfolio turnover excludes the value of portfolio securities received or delivered as a result of in-kind fund share transactions (if any). |
See Notes to Consolidated Financial Statements.
Notes to Consolidated Financial Statements
Prudential Investment Portfolios 3 (the “Registered Investment Company” or “RIC”) is registered under the Investment Company Act of 1940, as amended (“1940 Act”), as an open-end management investment company. The RIC is organized as a Delaware Statutory Trust and currently consists of six separate funds: PGIM Global Dynamic Bond Fund, PGIM Jennison Focused Growth Fund, PGIM QMA Large-Cap Value Fund, PGIM Real Assets Fund, PGIM Strategic Bond Fund and PGIM Wadhwani Systematic Absolute Return Fund. These consolidated financial statements relate only to the PGIM Real Assets Fund (the “Fund”). The Fund is classified as a diversified fund for purposes of the 1940 Act.
The investment objective of the Fund is to seek long-term real return.
The Fund wholly owns and controls the PGIM Real Assets Subsidiary, Ltd. (the “Cayman Subsidiary”), a company organized under the laws of the Cayman Islands. The Cayman Subsidiary is not registered as an investment company under the 1940 Act. The consolidated financial statements of the Fund include the financial results of the Cayman Subsidiary.
In accordance with the accounting rules relating to reporting of a wholly-owned subsidiary, the Consolidated Schedule of Investments includes positions of the Fund and the Cayman Subsidiary. These consolidated financial statements include the accounts of the Fund and the Cayman Subsidiary. All significant inter-company balances and transactions between the Fund and the Cayman Subsidiary have been eliminated in consolidation. The Fund will seek to gain exposure to commodities, commodities-related instruments, derivatives and other investments by directly investing in those instruments or through investments in the Cayman Subsidiary. The Cayman Subsidiary participates in the same investment objective as the Fund. The Cayman Subsidiary pursues its investment objective by investing in commodities, commodities-related instruments, derivatives and other investments. The Cayman Subsidiary (unlike the Fund) may invest without limitation in these instruments. However, the Cayman Subsidiary is otherwise subject to the same investment restrictions and limitations, and follows the same compliance policies and procedures as the Fund.
As of October 31, 2021, the Cayman Subsidiary had net assets of $1,015,135 representing 0.87% of the Fund’s net assets.
The Fund’s disclosures and operations are subject to compliance with applicable regulations governing commodity pools including Commodity Futures Trading Commission rules.
The Fund and the Cayman Subsidiary (collectively hereafter, the “Fund”) follow the investment company accounting and reporting guidance of the Financial Accounting Standards Board (“FASB”) Accounting Standard Codification (“ASC”) Topic 946 Financial Services — Investment Companies. The following is a summary of significant accounting policies followed by the Fund in the preparation of its financial statements. The policies conform to U.S. generally accepted accounting principles (“GAAP”). The Fund consistently follows such policies in the preparation of its consolidated financial statements.
Securities Valuation: The Fund holds securities and other assets and liabilities that are fair valued as of the close of each day (generally, 4:00 PM Eastern time) the New York Stock Exchange (“NYSE”) is open for trading. As described in further detail below, the Fund’s investments are valued daily based on a number of factors, including the type of investment and whether market quotations are readily available. The Board of Trustees (the “Board”) has adopted valuation procedures for security valuation under which fair valuation responsibilities have been delegated to PGIM Investments LLC (“PGIM Investments” or the “Manager”). Pursuant to the Board’s delegation, the Manager has established a Valuation Committee responsible for supervising the fair valuation of portfolio securities and other assets and liabilities. The valuation procedures permit the Fund to utilize independent pricing vendor services, quotations from market makers, and alternative valuation methods when market quotations are either not readily available or not deemed representative of fair value. Fair value is the price that would be received to sell an asset or paid to transfer a liability in an orderly transaction between market participants on the measurement date. A record of the Valuation Committee’s actions is subject to the Board’s review at its first quarterly meeting following the quarter in which such actions take place.
For the fiscal reporting year-end, securities and other assets and liabilities were fair valued at the close of the last U.S. business day. Trading in certain foreign securities may occur when the NYSE is closed (including weekends and holidays). Because such foreign securities trade in markets that are open on weekends and U.S. holidays, the values of some of the Fund’s foreign investments may change on days when investors cannot purchase or redeem Fund shares.
Various inputs determine how the Fund’s investments are valued, all of which are categorized according to the three broad levels (Level 1, 2, or 3) detailed in the Consolidated Schedule of Investments and referred to herein as the “fair value hierarchy” in accordance with FASB ASC Topic 820 - Fair Value Measurements and Disclosures.
Common or preferred stocks, exchange-traded funds and derivative instruments, if applicable, that are traded on a national securities exchange are valued at the last sale price as of the close of trading on the applicable exchange where the security principally trades. Securities traded via NASDAQ are valued at the NASDAQ official closing price. To the extent these securities are valued at the last sale price or NASDAQ official closing price, they are classified as Level 1 in the fair value hierarchy. In the event that no sale or official closing price on valuation date exists, these securities are generally valued at the mean between the
Notes to Consolidated Financial Statements (continued)
last reported bid and ask prices, or at the last bid price in the absence of an ask price. These securities are classified as Level 2 in the fair value hierarchy.
Investments in open-end funds (other than exchange-traded funds) are valued at their net asset values as of the close of the NYSE on the date of valuation. These securities are classified as Level 1 in the fair value hierarchy since they may be purchased or sold at their net asset values on the date of valuation.
Fixed income securities traded in the OTC market are generally classified as Level 2 in the fair value hierarchy. Such fixed income securities are typically valued using the market approach which generally involves obtaining data from an approved independent third-party vendor source. The Fund utilizes the market approach as the primary method to value securities when market prices of identical or comparable instruments are available. The third-party vendors’ valuation techniques used to derive the evaluated bid price are based on evaluating observable inputs, including but not limited to, yield curves, yield spreads, credit ratings, deal terms, tranche level attributes, default rates, cash flows, prepayment speeds, broker/dealer quotations and reported trades. Certain Level 3 securities are also valued using the market approach when obtaining a single broker quote or when utilizing transaction prices for identical securities that have been used in excess of five business days. During the reporting period, there were no changes to report with respect to the valuation approach and/or valuation techniques discussed above.
Securities and other assets that cannot be priced according to the methods described above are valued based on pricing methodologies approved by the Board. In the event that unobservable inputs are used when determining such valuations, the securities will be classified as Level 3 in the fair value hierarchy. Altering one or more unobservable inputs may result in a significant change to a Level 3 security’s fair value measurement.
When determining the fair value of securities, some of the factors influencing the valuation include: the nature of any restrictions on disposition of the securities; assessment of the general liquidity of the securities; the issuer’s financial condition and the markets in which it does business; the cost of the investment; the size of the holding and the capitalization of the issuer; the prices of any recent transactions or bids/offers for such securities or any comparable securities; any available analyst media or other reports or information deemed reliable by the Manager regarding the issuer or the markets or industry in which it operates. Using fair value to price securities may result in a value that is different from a security’s most recent closing price and from the price used by other unaffiliated mutual funds to calculate their net asset values.
Foreign Currency Translation: The books and records of the Fund are maintained in U.S. dollars. Foreign currency amounts are translated into U.S. dollars on the following basis:
(i) market value of investment securities, other assets and liabilities — at the exchange rate as of the valuation date;
(ii) purchases and sales of investment securities, income and expenses — at the rates of exchange prevailing on the respective dates of such transactions.
Although the net assets of the Fund are presented at the foreign exchange rates and market values at the close of the period, the Fund does not generally isolate that portion of the results of operations arising as a result of changes in the foreign exchange rates from the fluctuations arising from changes in the market prices of long-term portfolio securities held at the end of the period. Similarly, the Fund does not isolate the effect of changes in foreign exchange rates from the fluctuations arising from changes in the market prices of long-term portfolio securities sold during the period. Accordingly, holding period unrealized and realized foreign currency gains (losses) are included in the reported Net change in unrealized appreciation (depreciation) on investments and Net realized gains (losses) on investment transactions on the Statements of Operations.
Net realized gains (losses) on foreign currency transactions represent net foreign exchange gains (losses) from the disposition of holdings of foreign currencies, currency gains (losses) realized between the trade and settlement dates on investment transactions, and the difference between the amounts of interest, dividends and foreign withholding taxes recorded on the Fund’s books and the U.S. dollar equivalent amounts actually received or paid. Net unrealized currency gains (losses) arise from valuing foreign currency denominated assets and liabilities (other than investments) at period end exchange rates.
Commodities: The Fund gains exposure to commodity markets through direct investment of the Fund’s assets or through the Cayman Subsidiary. The Fund gains exposure to the commodity markets primarily through exchange-traded futures on commodities held by the Cayman Subsidiary. The Fund may invest up to 25% of its total assets in the Cayman Subsidiary. The Cayman Subsidiary may invest in commodity investments without limit. The Fund invests in the Cayman Subsidiary in order to gain exposure to commodities within the limitations of the federal tax law requirements applicable to regulated investment companies such as the Fund. The Fund may invest directly in commodity-linked structured notes (CLNs). The Fund may also gain direct exposure to commodities through direct investment in certain exchange-traded funds (ETFs) whose returns are linked to commodities or commodity indices within the limit of applicable tax law. Commodities are assets that have tangible properties, such as oil, agriculture products and precious metals. The value of commodities may be affected by, among other things, changes in overall market movements, commodity index volatility, changes in interest rates, or factors affecting a particular industry or commodity, such as drought, floods, weather, livestock disease, embargos, tariffs and international economic, political and regulatory developments. These factors may have a larger impact on commodity prices and commodity linked instruments than on traditional securities. Certain commodities are also subject to limited pricing flexibility because of supply and demand factors. Others are subject to broad price fluctuations as a result of the volatility of the prices for certain raw materials and the
Notes to Consolidated Financial Statements (continued)
instability of supplies of other materials. These additional variables may create additional risks which subject the Fund’s investments to greater volatility than investments in traditional securities.
Financial/Commodity Futures Contracts: A futures contract is an agreement to purchase (long) or sell (short) an agreed amount of securities at a set price for delivery on a future date. Upon entering into a futures contract, the Fund is required to pledge to the broker an amount of cash and/or other assets equal to a certain percentage of the contract amount. This amount is known as the “initial margin.” Subsequent payments, known as “variation margin,” are made or received by the Fund each day, depending on the daily fluctuations in the value of the underlying security. Such variation margin is recorded for financial statement purposes on a daily basis as unrealized gain (loss). When the contract expires or is closed, the gain (loss) is realized and is presented in the Consolidated Statement of Operations as net realized gain (loss) on futures transactions.
The Fund invested in futures contracts in order to hedge its existing portfolio securities, or securities the Fund intends to purchase, against fluctuations in value caused by changes in prevailing interest rates. Should interest rates move unexpectedly, the Fund may not achieve the anticipated benefits of the futures contracts and may realize a loss. The Fund invested in commodity futures contracts in order to hedge or gain exposure to commodity markets. The use of futures transactions involves the risk of imperfect correlation in movements in the price of futures contracts, interest rates and the underlying hedged assets. Since futures contracts are exchange-traded, there is minimal counterparty credit risk to the Fund since the exchanges’ clearinghouse acts as counterparty to all exchange-traded futures and guarantees the futures contracts against default.
Securities Transactions and Net Investment Income: Securities transactions are recorded on the trade date. Realized gains (losses) from investment and currency transactions are calculated on the specific identification method. Dividend income is recorded on the ex-date, or for certain foreign securities, when the Fund becomes aware of such dividends. Interest income, including amortization of premium and accretion of discount on debt securities, as required, is recorded on the accrual basis. Expenses are recorded on an accrual basis, which may require the use of certain estimates by management that may differ from actual. Net investment income or loss (other than class specific expenses and waivers, which are allocated as noted below) and unrealized and realized gains (losses) are allocated daily to each class of shares based upon the relative proportion of adjusted net assets of each class at the beginning of the day. Class specific expenses and waivers, where applicable, are charged to the respective share classes. Such class specific expenses and waivers include distribution fees and distribution fee waivers, shareholder servicing fees, transfer agent’s fees and expenses, registration fees and fee waivers and/or expense reimbursements, as applicable.
Taxes: It is the Fund’s policy to continue to meet the requirements of the Internal Revenue Code applicable to regulated investment companies and to distribute all of its taxable net investment income and capital gains, if any, to its shareholders. Therefore, no federal income tax provision is required. Withholding taxes on foreign dividends, interest and capital gains, if any, are recorded, net of reclaimable amounts, at the time the related income is earned.
Dividends and Distributions: The Fund expects to pay dividends from net investment income quarterly. Distributions from net realized capital and currency gains, if any, are declared and paid annually. Dividends and distributions to shareholders, which are determined in accordance with federal income tax regulations and which may differ from GAAP, are recorded on the ex-date. Permanent book/tax differences relating to income and gain (loss) are reclassified between total distributable earnings (loss) and paid-in capital in excess of par, as appropriate.
Estimates: The preparation of consolidated financial statements requires management to make estimates and assumptions that affect the reported amounts and disclosures in the consolidated financial statements. Actual results could differ from those estimates.
The RIC, on behalf of the Fund, has a management agreement with the Manager. Pursuant to this agreement, the Manager has responsibility for all investment advisory services and supervises the subadviser’s performance of such services.
The Manager has entered into a subadvisory agreement with PGIM Quantitative Solutions LLC (formerly known as QMA LLC) (“PGIM Quantitative Solutions” or the “subadviser”). The Manager pays for the services of the subadviser.
The management fee paid to the Manager is accrued daily and payable monthly at an annual rate of 0.60% of the Fund’s average daily net assets up to and including $3 billion, 0.58% on the next $2 billion of average daily net assets, 0.57% on the next $5 billion of average daily net assets and 0.56% of the average daily net assets in excess of $10 billion (including the Cayman Subsidiary). The effective consolidated management fee rate before any waivers and/or expense reimbursements was 0.63% for the year ended October 31, 2021.
The Manager has contractually agreed, through February 28, 2023, to limit net annual operating expenses and acquired fund fees and expenses (exclusive of distribution and service (12b-1) fees, interest, dividend and interest expense on short sales (including acquired fund dividend and interest expense on short sales), brokerage, taxes (such as income and foreign withholding taxes, stamp duty and deferred tax expenses (including acquired fund taxes), transfer agency expenses (including sub-transfer agency and networking fees), and extraordinary expenses) of each class of shares to 0.85% of the Fund’s average daily net assets.
Notes to Consolidated Financial Statements (continued)
Where applicable, the Manager agrees to waive management fees or shared operating expenses on any share class to the same extent that it waives such expenses on any other share class and, in addition, total annual operating expenses for Class R6 shares will not exceed total annual operating expenses for Class Z shares. Fees and/or expenses waived and/or reimbursed by the Manager may be recouped by the Manager within the same fiscal year during which such waiver and/or reimbursement is made if such recoupment can be realized without exceeding the expense limit in effect at the time of the recoupment for that fiscal year.
The Cayman Subsidiary has entered into a separate management agreement with the Manager whereby the Manager provides advisory and other services to the Cayman Subsidiary substantially similar to the services provided by the Manager to the Fund as discussed above. In consideration for these services, the Cayman Subsidiary pays the Manager a monthly fee at the annual rate of 0.60% of the Cayman Subsidiary’s average daily net assets up to and including $3 billion, 0.58% on the next $2 billion of average daily net assets, 0.57% on the next $5 billion of average daily net assets and 0.56% of the average daily net assets in excess of $10 billion. The Manager has contractually agreed to waive any management fee it receives from the Fund in an amount equal to the management fees paid by the Cayman Subsidiary. This waiver may not be terminated without prior approval of the Fund’s Board as long as the Fund remains invested or intends to invest in the Cayman Subsidiary. The Manager also has entered into a Subadvisory Agreement with PGIM Quantitative Solutions, relating to the Cayman Subsidiary.
The RIC, on behalf of the Fund, has a distribution agreement with Prudential Investment Management Services LLC (“PIMS”), which acts as the distributor of the Class A, Class C, Class Z and Class R6 shares of the Fund. The Fund compensates PIMS for distributing and servicing the Fund’s Class A and Class C shares, pursuant to the plans of distribution (the “Distribution Plans”), regardless of expenses actually incurred by PIMS.
Pursuant to the Distribution Plans, the Fund compensates PIMS for distribution related activities at an annual rate of up to 0.30%, and 1% of the average daily net assets of the Class A and Class C shares, respectively. PIMS has contractually agreed through February 28, 2023 to limit such fees to 0.25% of the average daily net assets of Class A shares. The distribution fees are accrued daily and payable monthly. No distribution or service fees are paid to PIMS as distributor for Class Z and Class R6 shares of the Fund.
For the year ended October 31, 2021, PIMS received $36,257 in front-end sales charges resulting from sales of Class A shares. Additionally, for the year ended October 31, 2021, PIMS did not receive any contingent deferred sales charges imposed upon redemptions by certain Class A and Class C shareholders, respectively. From these fees, PIMS paid such
sales charges to broker-dealers, who in turn paid commissions to salespersons and incurred other distribution costs.
PGIM Investments, PIMS and PGIM Quantitative Solutions are indirect, wholly-owned subsidiaries of Prudential Financial, Inc. (“Prudential”).
| 4. | Other Transactions with Affiliates |
Prudential Mutual Fund Services LLC (“PMFS”), an affiliate of PGIM Investments and an indirect, wholly-owned subsidiary of Prudential, serves as the Fund’s transfer agent. Transfer agent’s fees and expenses in the Consolidated Statement of Operations include certain out-of-pocket expenses paid to non-affiliates, where applicable.
The Fund may invest its overnight sweep cash in the PGIM Core Ultra Short Bond Fund (the “Core Fund”), a fund of Prudential Investment Portfolios 2, registered under the 1940 Act and managed by PGIM Investments. PGIM Investments and/or its affiliates are paid fees or reimbursed for providing their services to the Core Fund. In addition to the realized and unrealized gains on investments in the Core Fund and other affiliated mutual funds, earnings from such investments are disclosed on the Consolidated Statement of Operations as “Affiliated dividend income”.
The Fund may enter into certain securities purchase or sale transactions under Board approved Rule 17a-7 procedures. Rule 17a-7 is an exemptive rule under the 1940 Act, that subject to certain conditions, permits purchase and sale transactions among affiliated investment companies, or between an investment company and a person that is affiliated solely by reason of having a common (or affiliated) investment adviser, common directors/trustees, and/or common officers. For the year ended October 31, 2021, no 17a-7 transactions were entered into by the Fund.
The aggregate cost of purchases and proceeds from sales of portfolio securities (excluding short-term investments and U.S. Government securities) for the year ended October 31, 2021, were $43,107,433 and $29,798,284, respectively.
A summary of the cost of purchases and proceeds from sales of shares of affiliated mutual funds for the year ended October 31, 2021, is presented as follows:
| | | | | | | | | | | | | | | | | | | | | | | | | | | | | | | | |
Value,
Beginning
of Year | | Cost of
Purchases | | | Proceeds
from
Sales | | | Change in
Unrealized
Gain
(Loss) | | | Realized
Gain
(Loss) | | | Value,
End
of Year | | | Shares,
End
of Year | | | Dividend
Income | | | Capital
Gain
Distributions | |
| | |
Long-Term Investments - Affiliated Mutual Funds(wd): | | | | | | | | | |
| | |
PGIM Floating Rate Income Fund (Class R6)(1) | | | | | | | | | |
$ — | | $ | 3,918,656 | | | $ | 543,100 | | | $ | 11,049 | | | $ | 536 | | | $ | 3,387,141 | | | | 349,190 | | | $ | 58,956 | | | $ | — | |
Notes to Consolidated Financial Statements (continued)
| | | | | | | | | | | | | | | | | | | | | | | | | | | | | | | | |
Value,
Beginning
of Year | | Cost of
Purchases | | | Proceeds
from
Sales | | | Change in
Unrealized
Gain
(Loss) | | | Realized
Gain
(Loss) | | | Value,
End
of Year | | | Shares,
End
of Year | | | Dividend
Income | | | Capital
Gain
Distributions | |
| | |
PGIM Global Real Estate Fund (Class R6)(1) | | | | | | | | | |
$ 5,801,188 | | $ | 6,729,202 | | | $ | 1,317,116 | ** | | $ | 2,702,147 | | | $ | (10,443 | ) | | $ | 13,904,978 | | | | 503,986 | | | $ | 64,485 | ** | | $ | — | |
| | |
PGIM Jennison Global Infrastructure Fund (Class R6)(1) | | | | | | | | | |
5,596,039 | | | 6,527,104 | | | | 1,676,484 | ** | | | 1,825,092 | | | | 55,530 | | | | 12,327,281 | | | | 718,792 | | | | 83,120 | ** | | | — | |
| | |
PGIM Jennison MLP Fund (Class R6)(1) | | | | | | | | | |
2,247,908 | | | 7,757,414 | | | | 1,818,865 | ** | | | 3,705,501 | | | | 5,758 | | | | 11,897,716 | | | | 1,850,345 | | | | (154,551 | )** | | | — | |
| | |
PGIM Jennison Natural Resources Fund (Class R6)(1) | | | | | | | | | |
5,509,849 | | | 4,412,813 | | | | 4,234,800 | | | | 3,616,532 | | | | 618,733 | | | | 9,923,127 | | | | 205,789 | | | | 137,912 | | | | — | |
| | |
PGIM QMA Commodity Strategies Fund (Class R6)*(1) | | | | | | | | | |
19,752,807 | | | 2,916,300 | | | | 3,288,400 | | | | 9,065,488 | | | | 241,351 | | | | 28,687,546 | | | | 2,237,718 | | | | — | | | | — | |
| | |
PGIM Select Real Estate Fund (Class R6)(1) | | | | | | | | | |
5,813,586 | | | 6,771,580 | | | | 1,288,700 | | | | 2,624,531 | | | | (24,142 | ) | | | 13,896,855 | | | | 907,698 | | | | 163,680 | | | | — | |
| | |
PGIM Short Duration High Yield Income Fund (Class R6)(1) | | | | | | | | | |
2,819,737 | | | 2,745,271 | | | | 2,319,700 | | | | 124,342 | | | | 17,643 | | | | 3,387,293 | | | | 374,701 | | | | 210,739 | | | | — | |
| | |
PGIM Short-Term Corporate Bond Fund (Class R6)(1) | | | | | | | | | |
2,741,503 | | | 5,207 | | | | 2,763,618 | | | | (163,870 | ) | | | 180,778 | | | | — | | | | — | | | | 5,563 | | | | — | |
| | |
PGIM TIPS Fund (Class R6) | | | | | | | | | |
26,331,965 | | | 1,200,275 | | | | 10,207,300 | | | | 189,471 | | | | (46,249 | ) | | | 17,468,162 | | | | 1,635,596 | | | | 915,740 | | | | 233,636 | |
| | | | | | | | | | | | | | | | | | | | | | | | | | | | | | | | |
$76,614,582 | | $ | 42,983,822 | | | $ | 29,458,083 | | | $ | 23,700,283 | | | $ | 1,039,495 | | | $ | 114,880,099 | | | | | | | $ | 1,485,644 | | | $ | 233,636 | |
| | | | | | | | | | | | | | | | | | | | | | | | | | | | | | | | |
| | |
Short-Term Investments - Affiliated Mutual Fund(wd): | | | | | | | | | |
PGIM Core Ultra Short Bond Fund (1)(bb) | | | | | | | | | |
$13,666,782 | | $ | 33,153,753 | | | $ | 45,785,164 | | | $ | — | | | $ | — | | | $ | 1,035,371 | | | | 1,035,371 | | | $ | 9,571 | | | $ | — | |
| | | | | | | | | | | | | | | | | | | | | | | | | | | | | | | | |
$90,281,364 | | $ | 76,137,575 | | | $ | 75,243,247 | | | $ | 23,700,283 | | | $ | 1,039,495 | | | $ | 115,915,470 | | | | | | | $ | 1,495,215 | | | $ | 233,636 | |
| | | | | | | | | | | | | | | | | | | | | | | | | | | | | | | | |
| * | Non-income producing security. |
| ** | Amount includes return of capital distribution. |
| (1) | The Fund did not have any capital gain distributions during the reporting period. |
| (bb) | Represents security, or a portion thereof, held in the Cayman Subsidiary. |
| (wd) | PGIM Investments LLC, the manager of the Fund, also serves as the manager of the underlying funds in which the Fund invests. |
| 6. | Distributions and Tax Information |
Distributions to shareholders, which are determined in accordance with federal income tax regulations and which may differ from GAAP, are recorded on the ex-date.
For the year ended October 31, 2021, the tax character of dividends paid by the Fund were $3,102,799 of ordinary income and $2,479,577 of long-term capital gains. For the year
ended October 31, 2020, the tax character of dividends paid by the Fund were $1,909,966 of ordinary income and $557,378 of long-term capital gains.
As of October 31, 2021, the accumulated undistributed earnings on a tax basis was $461,160 of ordinary income.
The United States federal income tax basis of the Fund’s investments and the net unrealized appreciation as of October 31, 2021 were as follows:
| | | | | | |
| Tax Basis | | Gross Unrealized
Appreciation | | Gross Unrealized
Depreciation | | Net Unrealized
Appreciation |
| $106,488,218 | | $24,830,495 | | $(14,988,824) | | $9,841,671 |
The difference between book basis and tax basis were primarily attributable to deferred losses on wash sales and the tax treatment of the investment in the Cayman Subsidiary.
The Manager has analyzed the Fund’s tax positions taken on federal, state and local income tax returns for all open tax years and has concluded that no provision for income tax is required in the Fund’s consolidated financial statements for the current reporting period. Since tax authorities can examine previously filed tax returns, the Fund’s U.S. federal and state tax returns for each of the four fiscal years up to the most recent fiscal year ended October 31, 2021 are subject to such review.
7. Capital and Ownership
The Fund offers Class A, Class C, Class Z and Class R6 shares. Class A shares are sold with a maximum front-end sales charge of 5.50%. Investors who purchase $1 million or more of Class A shares and sell these shares within 12 months of purchase are subject to a contingent deferred sales charge (“CDSC”) of 1%, although they are not subject to an initial sales charge. The Class A CDSC is waived for certain retirement and/or benefit plans. A special exchange privilege is also available for shareholders who qualified to purchase Class A shares at net asset value. Effective June 26, 2020, all of the issued and outstanding Class B shares of the Fund converted into Class A shares. Class C shares are sold with a CDSC of 1% on sales made within 12 months of purchase. Class C shares will automatically convert to Class A shares on a monthly basis approximately eight years (ten years prior to January 22, 2021) after purchase. Class Z and Class R6 shares are not subject to any sales or redemption charges and are available exclusively for sale to a limited group of investors.
Under certain circumstances, an exchange may be made from specified share classes of the Fund to one or more other share classes of the Fund as presented in the table of transactions in shares of beneficial interest, below.
The RIC has authorized an unlimited number of shares of beneficial interest of the Fund at $0.001 par value per share, currently divided into four classes, designated Class A, Class C, Class Z and Class R6.
Notes to Consolidated Financial Statements (continued)
As of October 31, 2021, Prudential, through its affiliated entities, including affiliated funds (if applicable), owned shares of the Fund as follows:
| | | | |
| | | Number of Shares | | Percentage of
Outstanding Shares |
Class Z | | 3,130,205 | | 60.9% |
Class R6 | | 3,287,650 | | 74.6% |
At the reporting period end, the number of shareholders holding greater than 5% of the Fund are as follows:
| | | | | | |
| Affiliated | | Unaffiliated |
Number of Shareholders | | Percentage of Outstanding Shares | | Number of Shareholders | | Percentage of Outstanding Shares |
3 | | 62.6% | | 1 | | 6.3% |
Transactions in shares of beneficial interest were as follows:
| | | | | | | | |
Class A | | Shares | | | Amount | |
Year ended October 31, 2021: | | | | | | | | |
Shares sold | | | 196,422 | | | $ | 2,081,898 | |
Shares issued in reinvestment of dividends and distributions | | | 28,548 | | | | 283,941 | |
Shares purchased | | | (120,738 | ) | | | (1,242,549 | ) |
| | | | | | | | |
Net increase (decrease) in shares outstanding before conversion | | | 104,232 | | | | 1,123,290 | |
Shares issued upon conversion from other share class(es) | | | 59,665 | | | | 597,162 | |
Shares purchased upon conversion into other share class(es) | | | (6,734 | ) | | | (65,808 | ) |
| | | | | | | | |
Net increase (decrease) in shares outstanding | | | 157,163 | | | $ | 1,654,644 | |
| | | | | | | | |
Year ended October 31, 2020: | | | | | | | | |
Shares sold | | | 124,506 | | | $ | 1,148,571 | |
Shares issued in reinvestment of dividends and distributions | | | 10,768 | | | | 102,388 | |
Shares purchased | | | (143,666 | ) | | | (1,303,751 | ) |
| | | | | | | | |
Net increase (decrease) in shares outstanding before conversion | | | (8,392 | ) | | | (52,792 | ) |
Shares issued upon conversion from other share class(es) | | | 26,026 | | | | 242,063 | |
Shares purchased upon conversion into other share class(es) | | | (1,269 | ) | | | (11,887 | ) |
| | | | | | | | |
Net increase (decrease) in shares outstanding | | | 16,365 | | | $ | 177,384 | |
| | | | | | | | |
| | |
Class B | | | | | | |
Period ended June 26, 2020*: | | | | | | | | |
Shares issued in reinvestment of dividends and distributions | | | 260 | | | $ | 2,494 | |
Shares purchased | | | (5,641 | ) | | | (54,552 | ) |
| | | | | | | | |
Net increase (decrease) in shares outstanding before conversion | | | (5,381 | ) | | | (52,058 | ) |
Shares purchased upon conversion into other share class(es) | | | (11,207 | ) | | | (101,549 | ) |
| | | | | | | | |
Net increase (decrease) in shares outstanding | | | (16,588 | ) | | $ | (153,607 | ) |
| | | | | | | | |
| | | | | | | | |
Class C | | Shares | | | Amount | |
Year ended October 31, 2021: | | | | | | | | |
Shares sold | | | 772 | | | $ | 8,154 | |
Shares issued in reinvestment of dividends and distributions | | | 5,285 | | | | 50,887 | |
Shares purchased | | | (17,151 | ) | | | (172,302 | ) |
| | | | | | | | |
Net increase (decrease) in shares outstanding before conversion | | | (11,094 | ) | | | (113,261 | ) |
Shares purchased upon conversion into other share class(es) | | | (59,411 | ) | | | (589,974 | ) |
| | | | | | | | |
Net increase (decrease) in shares outstanding | | | (70,505 | ) | | $ | (703,235 | ) |
| | | | | | | | |
Year ended October 31, 2020: | | | | | | | | |
Shares sold | | | 22,208 | | | $ | 199,739 | |
Shares issued in reinvestment of dividends and distributions | | | 2,558 | | | | 24,363 | |
Shares purchased | | | (38,155 | ) | | | (357,083 | ) |
| | | | | | | | |
Net increase (decrease) in shares outstanding before conversion | | | (13,389 | ) | | | (132,981 | ) |
Shares purchased upon conversion into other share class(es) | | | (15,007 | ) | | | (140,514 | ) |
| | | | | | | | |
Net increase (decrease) in shares outstanding | | | (28,396 | ) | | $ | (273,495 | ) |
| | | | | | | | |
| | |
Class Z | | | | | | |
Year ended October 31, 2021: | | | | | | | | |
Shares sold | | | 1,182,117 | | | $ | 12,049,210 | |
Shares issued in reinvestment of dividends and distributions | | | 324,884 | | | | 3,222,924 | |
Shares purchased | | | (2,354,972 | ) | | | (24,053,330 | ) |
| | | | | | | | |
Net increase (decrease) in shares outstanding before conversion | | | (847,971 | ) | | | (8,781,196 | ) |
Shares issued upon conversion from other share class(es) | | | 8,426 | | | | 83,059 | |
Shares purchased upon conversion into other share class(es) | | | (17,402 | ) | | | (183,970 | ) |
| | | | | | | | |
Net increase (decrease) in shares outstanding | | | (856,947 | ) | | $ | (8,882,107 | ) |
| | | | | | | | |
Year ended October 31, 2020: | | | | | | | | |
Shares sold | | | 1,035,195 | | | $ | 9,401,584 | |
Shares issued in reinvestment of dividends and distributions | | | 163,849 | | | | 1,554,810 | |
Shares purchased | | | (1,815,811 | ) | | | (16,843,715 | ) |
| | | | | | | | |
Net increase (decrease) in shares outstanding before conversion | | | (616,767 | ) | | | (5,887,321 | ) |
Shares issued upon conversion from other share class(es) | | | 1,266 | | | | 11,887 | |
| | | | | | | | |
Net increase (decrease) in shares outstanding | | | (615,501 | ) | | $ | (5,875,434 | ) |
| | | | | | | | |
| | |
Class R6 | | | | | | |
Year ended October 31, 2021: | | | | | | | | |
Shares sold | | | 1,516,234 | | | $ | 15,596,153 | |
Shares issued in reinvestment of dividends and distributions | | | 202,087 | | | | 2,024,274 | |
Shares purchased | | | (564,580 | ) | | | (5,904,284 | ) |
| | | | | | | | |
Net increase (decrease) in shares outstanding before conversion | | | 1,153,741 | | | | 11,716,143 | |
Shares issued upon conversion from other share class(es) | | | 14,979 | | | | 159,531 | |
| | | | | | | | |
Net increase (decrease) in shares outstanding | | | 1,168,720 | | | $ | 11,875,674 | |
| | | | | | | | |
Year ended October 31, 2020: | | | | | | | | |
Shares sold | | | 1,268,192 | | | $ | 12,071,091 | |
Shares issued in reinvestment of dividends and distributions | | | 82,635 | | | | 783,021 | |
Shares purchased | | | (937,799 | ) | | | (8,793,138 | ) |
| | | | | | | | |
Net increase (decrease) in shares outstanding | | | 413,028 | | | $ | 4,060,974 | |
| | | | | | | | |
| * | Effective June 26, 2020, all of the issued and outstanding Class B shares of the Fund converted into Class A shares. |
Notes to Consolidated Financial Statements (continued)
8. Borrowings
The RIC, on behalf of the Fund, along with other affiliated registered investment companies (the “Participating Funds”), is a party to a Syndicated Credit Agreement (“SCA”) with a group of banks. The purpose of the SCA is to provide an alternative source of temporary funding for capital share redemptions. The table below provides details of the SCA.
| | | | |
| | | Current SCA | | Prior SCA |
Term of Commitment | | 10/1/2021 – 9/29/2022 | | 10/2/2020 – 9/30/2021 |
| | | |
Total Commitment | | $ 1,200,000,000 | | $ 1,200,000,000 |
Annualized Commitment Fee on the Unused Portion of the SCA | | 0.15% | | 0.15% |
| | | |
| Annualized Interest Rate on Borrowings | | 1.20% plus the higher of (1) the effective federal funds rate, (2) the one-month LIBOR rate or (3) zero percent | | 1.30% plus the higher of (1) the effective federal funds rate, (2) the one-month LIBOR rate or (3) zero percent |
Certain affiliated registered investment companies that are parties to the SCA include portfolios that are subject to a predetermined mathematical formula used to manage certain benefit guarantees offered under variable annuity contracts. The formula may result in large scale asset flows into and out of these portfolios. Consequently, these portfolios may be more likely to utilize the SCA for purposes of funding redemptions. It may be possible for those portfolios to fully exhaust the committed amount of the SCA, thereby requiring the Manager to allocate available funding per a Board-approved methodology designed to treat the Participating Funds in the SCA equitably.
The Fund utilized the SCA during the year ended October 31, 2021. The average daily balance for the 1 day that the Fund had loans outstanding during the period was approximately $595,000, borrowed at a weighted average interest rate of 1.42%. The maximum loan outstanding amount during the period was $595,000. At October 31, 2021, the Fund did not have an outstanding loan amount.
9. Risks of Investing in the Fund
The Fund’s risks include, but are not limited to, some or all of the risks discussed below. For further information on the Fund’s risks, please refer to the Fund’s Prospectus and Statement of Additional Information.
Affiliated Funds Risk: The Fund’s manager serves as the manager of the Underlying Funds. It is possible that a conflict of interest among the Fund and the Underlying Funds could impact the manager and subadvisers. Because the amount of the investment management fees to be retained by the manager and the subadvisers may differ depending upon the Underlying Funds in which the Fund invests, there is a conflict of interest for the manager
and the subadvisers in selecting the Underlying Funds. In addition, the manager and the subadvisers may have an incentive to take into account the effect on an Underlying Fund in which the Fund may invest in determining whether, and under what circumstances, to purchase or sell shares in that Underlying Fund. Although the manager and the subadvisers take steps to address the conflicts of interest, it is possible that the conflicts could impact the Fund. In addition, the subadvisers may invest in Underlying Funds that have a limited or no performance history.
Asset Allocation Risk: Asset allocation risk is the risk that the Fund’s assets may be allocated to an asset class that underperforms other asset classes. For example, the Fund may be overweight in equities when the stock market is falling and the fixed income market is rising. Likewise, the Fund may be overweight in fixed income securities when fixed income markets are falling and the equity markets are rising. Allocations to underperforming or volatile asset classes or other changes in asset allocations could lead to increased volatility in the Fund’s portfolio.
Asset Class Variation Risk: The Underlying Funds invest principally in the securities constituting their asset class (i.e., domestic or international real estate, utilities, infrastructure, natural resources, MLPs and various types of fixed income investments). However, under normal market conditions, an Underlying Fund may vary the percentage of its assets in these securities (subject to any applicable regulatory requirements). Depending upon the percentage of securities in a particular asset class held by the Underlying Funds at any given time and the percentage of the Fund’s assets invested in the Underlying Funds, the Fund’s actual exposure to the securities in a particular asset class may vary substantially from its allocation to that asset class.
Cayman Subsidiary Risk: By investing in the Cayman Subsidiary, the Fund is indirectly exposed to the risks associated with the Cayman Subsidiary’s investments. The Cayman Subsidiary is not registered as an investment company under the 1940 Act, and, unless otherwise noted in this Prospectus, is not subject to all the investor protections of the 1940 Act. The Fund has received a private letter ruling from the Internal Revenue Service (the IRS) stating that income derived from the Fund’s investment in the Cayman Subsidiary will be considered qualifying regulated investment company (RIC) income for tax purposes. Final tax regulations, on which taxpayers may rely for taxable years beginning after September 28, 2016, also support this result. Changes in the laws of the Cayman Islands, under which the Cayman Subsidiary is incorporated, could result in the inability of the Fund to effect its desired gold/defensive investment strategy.
Commodity Risk: The values of commodities and commodity-linked investments are affected by events that might have less impact on the value of stocks and bonds. Such investments may be speculative. Prices of commodities and related contracts may fluctuate significantly over short periods for a variety of reasons, including weather, crop or livestock disease, investment speculation, resource availability, fluctuations in industrial and commercial supply and demand, US agricultural, fiscal, monetary and exchange control programs, embargoes, tariffs, and international political, economic, military and regulatory
Notes to Consolidated Financial Statements (continued)
developments. These risks may subject the Fund to greater volatility than investments in traditional instruments or securities. In addition, the commodities markets are subject to temporary distortions or other disruptions due to a variety of factors, including participation of speculators, government intervention and regulation, and certain lack of liquidity in the markets.
Commodity-Linked Notes Risk: The Fund may invest in leveraged or unleveraged commodity-linked notes (CLNs) to gain exposure to the commodities markets. CLNs are subject to counterparty risk. The value of the CLNs may fluctuate significantly because the values of the investments to which they are linked are volatile. In addition, the terms of a CLN may create economic leverage by requiring payment by the issuer of an amount that is a multiple of the price increase or decrease of the underlying commodity, commodity index or other economic variable. Economic leverage increases the volatility of CLNs and their value may increase or decrease more quickly than the value of the underlying commodity, commodity index or other economic variable.
Commodity Regulatory Risk: The Fund is deemed a “commodity pool” and the manager is considered a “commodity pool operator” with respect to the Fund under the Commodity Exchange Act. The manager, directly or through its affiliates, is therefore subject to dual regulation by the Securities and Exchange Commission (the “SEC”) and the Commodity Futures Trading Commission (the “CFTC”). The regulatory requirements governing the use of commodity futures (which include futures on broad-based securities indexes, interest rate futures and currency futures), options on commodity futures, certain swaps or certain other investments could change at any time.
Credit Risk/Counterparty Risk: The ability, or perceived ability, of the issuer or guarantor of a debt security, or the counterparty (the party on the other side of the transaction) to a derivatives contract or other financial contract to meet its financial obligations will affect the value of the security or derivative. Counterparty and credit risk are especially important in the context of privately negotiated instruments. The Fund expects to enter into certain privately negotiated agreements where the counterparty assumes the physical settlement obligations of the Fund under such transactions. Under this type of arrangement, there is a risk that the relevant counterparty or intermediary would, due to insolvency or other reasons, be unable to or fail to assume the physical settlement obligations of the Fund, in which case the Fund could be required to sell portfolio instruments at unfavorable times or prices or could have insufficient assets to satisfy its physical settlement obligations.
Credit ratings are intended to provide a measure of credit risk. However, credit ratings are only the opinions of the credit rating agency issuing the ratings and are not guarantees as to quality. The lower the rating of a debt security held by the Fund, the greater the degree of credit risk that is perceived to exist by the credit rating agency with respect to that security.
Increasing the amount of Fund assets allocated to lower-rated securities generally will increase the credit risk to which the Fund is subject. Not all securities in which the Fund invests are rated. The longer the maturity and the lower the credit quality of a bond, the more sensitive it is to credit risk.
Currency Risk: The Fund’s and the Underlying Funds’ NAVs could decline as a result of changes in exchange rates, which could adversely affect the Fund’s investments in currencies, or in securities that trade in, and receive revenues related to currencies, or in derivatives that provide exposure to currencies. Certain foreign countries may impose restrictions on the ability of issuers of foreign securities to make payment of principal and interest or dividends to investors located outside the country, due to blockage of foreign currency exchanges or otherwise.
Debt Obligations Risk: Debt obligations are subject to credit risk, market risk and interest rate risk. The Fund’s holdings, share price, yield and total return may also fluctuate in response to bond market movements. The value of bonds may decline for issuer-related reasons, including management performance, financial leverage and reduced demand for the issuer’s goods and services. Certain types of fixed income obligations also may be subject to “call and redemption risk,” which is the risk that the issuer may call a bond held by the Fund for redemption before it matures and the Fund may lose income.
Deflation Risk: During periods of deflation, prices throughout the economy may decline over time, which may have an adverse effect on the creditworthiness of issuers in whose securities the Fund invests. Additionally, since the Fund makes investments that may perform well in periods of rising inflation, during periods of no inflation or deflation an investment in the Fund may underperform broad market measures and may lose value.
Derivatives Risk: Derivatives involve special risks and costs and may result in losses to the Fund and the Underlying Funds. The successful use of derivatives requires sophisticated management, and, to the extent that derivatives are used, the Fund and the Underlying Funds will depend on the subadvisers’ ability to analyze and manage derivatives transactions. The prices of derivatives may move in unexpected ways, especially in abnormal market conditions. Some derivatives are “leveraged” and therefore may magnify or otherwise increase investment losses to the Fund. The Fund’s use of derivatives may also increase the amount of taxes payable by shareholders.
Other risks arise from the potential inability to terminate or sell derivatives positions. A liquid secondary market may not always exist for the Fund’s or an Underlying Fund’s derivatives positions. In fact, many over-the-counter derivative instruments lack liquidity beyond the counterparty to the instrument. Over-the-counter derivative instruments also involve the risk that the other party will not meet its obligations to the Fund.
The US Government and foreign governments have adopted (and may adopt further) regulations governing derivatives markets, including mandatory clearing of certain derivatives, margin and reporting requirements and risk exposure limitations. The ultimate
Notes to Consolidated Financial Statements (continued)
impact of the regulations remains unclear. Additional regulation of derivatives may make derivatives more costly, limit their availability or utility, or otherwise adversely affect their performance or disrupt markets.
Distribution Risk: The Fund’s distributions may consist of net investment income, if any, and net realized gains, if any, from the sale of investments and/or return of capital. The Fund will provide to shareholders early in each calendar year the final tax character of the Fund’s distributions for the previous year. Also, at such time that the Fund distribution is expected to be from sources other than current or accumulated net income, a notice to shareholders may be required.
Economic and Market Events Risk: Events in the U.S. and global financial markets, including actions taken by the U.S. Federal Reserve or foreign central banks to stimulate or stabilize economic growth or the functioning of the securities markets, may at times result in unusually high market volatility, which could negatively impact performance. Relatively reduced liquidity in credit and fixed income markets could adversely affect issuers worldwide.
Emerging Markets Risk: The risks of foreign investments are greater for investments in or exposed to emerging markets. Emerging market countries typically have economic and political systems that are less fully developed, and can be expected to be less stable, than those of more developed countries. For example, the economies of such countries can be subject to rapid and unpredictable rates of inflation or deflation. Low trading volumes may result in a lack of liquidity and price volatility. Emerging market countries may have policies that restrict investment by non-U.S. investors, or that prevent non-U.S. investors from withdrawing their money at will.
The Fund may invest in some emerging markets that subject it to risks such as those associated with illiquidity, custody of assets, different settlement and clearance procedures and asserting legal title under a developing legal and regulatory regime to a greater degree than in developed markets or even in other emerging markets.
Energy Sector Risk: The Fund’s investments in certain Underlying Funds will expose the Fund to the risks of adverse economic, environmental, business, regulatory or other occurrences affecting the energy sector. The energy sector has historically experienced substantial price volatility. MLPs and other companies operating in the energy sector are subject to specific risks, including, among others, fluctuations in commodity prices; reduced consumer demand for commodities such as oil, natural gas or petroleum products; reduced availability of natural gas or other commodities for transporting, processing, storing or delivering; slowdowns in new construction; extreme weather or other natural disasters; and threats of attack by terrorists on energy assets. Additionally, changes in the regulatory
environment for energy companies may adversely impact their profitability. Over time, depletion of natural gas reserves and other energy reserves may also affect the profitability of energy companies.
Fund of Funds Risk: The value of an investment in the Fund will be related, to a degree, to the investment performance of the Underlying Funds in which it invests. Therefore, the principal risks of investing in the Fund are closely related to the principal risks associated with these Underlying Funds and their investments. Because the Fund’s allocation among different Underlying Funds and direct investments in securities and derivatives will vary, an investment in the Fund may be subject to any and all of these risks at different times and to different degrees. Investing in an Underlying Fund will also expose the Fund to a pro rata portion of the Underlying Fund’s fees and expenses. In addition, one Underlying Fund may buy the same securities that another Underlying Fund sells. Therefore, the Fund would indirectly bear the costs of these trades without accomplishing the investment purpose.
Hedging Risk: The decision as to whether and to what extent the Fund or an Underlying Fund will engage in hedging transactions to hedge against certain risks, such as market risk and issuer risk, will depend on a number of factors, including prevailing market conditions, the composition of the portfolio of the Fund or the Underlying Fund, and the availability of suitable transactions. Hedging transactions involve costs and may result in losses. There is no guarantee that any of these hedging instruments would work as anticipated, and in certain cases the Fund or an Underlying Fund might be better off had it not used a hedging instrument. There can be no assurance that the Fund or the Underlying Fund will engage in hedging transactions at any given time or from time to time, even under volatile market environments, or that any such strategies, if used, will be successful.
Increase in Expenses Risk: Your actual cost of investing in the Fund may be higher than the expenses shown in the expense table in the Fund’s prospectus for a variety of reasons. For example, expense ratios may be higher than those shown if average net assets decrease. Net assets are more likely to decrease and Fund expense ratios are more likely to increase when markets are volatile. Active and frequent trading of Fund securities can increase expenses.
Interest Rate Risk: The value of your investment may go down when interest rates rise. A rise in rates tends to have a greater impact on the prices of longer term or duration debt securities. For example, a fixed income security with a duration of three years is expected to decrease in value by approximately 3% if interest rates increase by 1%. This is referred to as “duration risk.” When interest rates fall, the issuers of debt obligations may prepay principal more quickly than expected, and the Fund may be required to reinvest the proceeds at a lower interest rate. This is referred to as “prepayment risk.” When interest rates rise, debt obligations may be repaid more slowly than expected, and the value of the Fund’s holdings may fall sharply. This is referred to as “extension risk.” The Fund may lose money if short-term or long-term interest rates rise sharply or in a manner not anticipated by the subadviser.
Notes to Consolidated Financial Statements (continued)
Inflation-indexed bonds, such as TIPS, generally decline in value when real interest rates rise. In certain interest rate environments, such as when real interest rates are rising faster than nominal interest rates, TIPS may experience greater losses than other fixed income securities with similar durations. In addition, any increase in principal value of an inflation-indexed bond caused by an increase in the price index is taxable in the year the increase occurs, even though the Fund generally will not receive cash representing the increase at that time. As a result, the Fund could be required at times to liquidate other investments, including when it is not advantageous to do so, in order to satisfy its distribution requirements as a regulated investment company under the Code. Also, to the extent that the Fund invests in inflation-indexed bonds, income distributions are more likely to fluctuate.
Junk Bonds Risk: High-yield, high-risk bonds have predominantly speculative characteristics, including particularly high credit risk. Junk bonds tend to have lower market liquidity than higher-rated securities. The liquidity of particular issuers or industries within a particular investment category may shrink or disappear suddenly and without warning. The non-investment grade bond market can experience sudden and sharp price swings and become illiquid due to a variety of factors, including changes in economic forecasts, stock market activity, large sustained sales by major investors, a high profile default or a change in the market’s psychology.
Large Shareholder and Large Scale Redemption Risk: Certain individuals, accounts, funds (including funds affiliated with the Manager) or institutions, including the Manager and its affiliates, may from time to time own or control a substantial amount of the Fund’s shares. There is no requirement that these entities maintain their investment in the Fund. There is a risk that such large shareholders or that the Fund’s shareholders generally may redeem all or a substantial portion of their investments in the Fund in a short period of time, which could have a significant negative impact on the Fund’s NAV, liquidity, and brokerage costs. Large redemptions could also result in tax consequences to shareholders and impact the Fund’s ability to implement its investment strategy. The Fund’s ability to pursue its investment objective after one or more large scale redemptions may be impaired and, as a result, the Fund may invest a larger portion of its assets in cash or cash equivalents.
Leverage Risk: Certain transactions in which the Fund or an Underlying Fund may engage may give rise to leverage. The use of leverage exaggerates the effect of any increase or decrease in the value of the Fund’s holdings, and makes any change in the Fund’s net asset value (NAV) greater than it would be without the use of leverage. This could result in increased volatility of investment returns.
Liquidity Risk: Liquidity risk is the risk that the Fund could not meet requests to redeem shares issued by the Fund without significant dilution of remaining investors’ interests in the
Fund. The Fund may invest in instruments that trade in lower volumes and are more illiquid than other investments. If the Fund is forced to sell these investments to pay redemption proceeds or for other reasons, the Fund may lose money. In addition, when there is no willing buyer and investments cannot be readily sold at the desired time or price, the Fund may have to accept a lower price or may not be able to sell the instrument at all. An inability to sell a portfolio position can adversely affect the Fund’s value or prevent the Fund from being able to take advantage of other investment opportunities.
Management Risk: Actively managed mutual funds are subject to management risk. The subadvisers will apply investment techniques and risk analyses in making investment decisions for the Fund, but there can be no guarantee that these techniques will produce the desired results. Additionally, the securities or Underlying Funds selected by the manager and/or subadvisers may underperform the markets in general, the Fund’s benchmarks and other mutual funds with similar investment objectives.
Market Disruption and Geopolitical Risks: International wars or conflicts and geopolitical developments in foreign countries, along with instability in regions such as Asia, Eastern Europe, and the Middle East, possible terrorist attacks in the United States or around the world, public health epidemics such as the outbreak of infectious diseases like the outbreak of COVID-19 globally in 2020 or the 2014–2016 outbreak in West Africa of the Ebola virus, and other similar events could adversely affect the U.S. and foreign financial markets, including increases in market volatility, reduced liquidity in the securities markets and government intervention, and may cause further long-term economic uncertainties in the United States and worldwide generally. The coronavirus pandemic and the related governmental and public responses have had and may continue to have an impact on the Fund’s investments and net asset value and have led and may continue to lead to increased market volatility and the potential for illiquidity in certain classes of securities and sectors of the market. Preventative or protective actions that governments may take in respect of pandemic or epidemic diseases may result in periods of business disruption, business closures, inability to obtain raw materials, supplies and component parts, and reduced or disrupted operations for the issuers in which the Fund invests. Government intervention in markets may impact interest rates, market volatility and security pricing. The occurrence, reoccurrence and pendency of such diseases could adversely affect the economies (including through changes in business activity and increased unemployment) and financial markets either in specific countries or worldwide.
Market Risk: Securities markets may be volatile and the market prices of the Fund’s securities may decline. Securities fluctuate in price based on changes in an issuer’s financial condition and overall market and economic conditions. If the market prices of the securities owned by the Fund fall, the value of your investment in the Fund will decline.
Master Limited Partnerships Risk: The Fund’s investments in certain Underlying Funds will expose the Fund to the risks of MLPs. An MLP is an investment that combines the tax benefits of a limited partnership with the liquidity of publicly-traded securities. The risks of investing in an MLP are generally those involved in investing in a partnership as opposed to
Notes to Consolidated Financial Statements (continued)
a corporation. For example, state law governing partnerships is often less restrictive than state law governing corporations. Accordingly, there may be fewer protections afforded investors in an MLP than investors in a corporation. Investments held by MLPs may be relatively illiquid, limiting the MLPs’ ability to vary their portfolios promptly in response to changes in economic or other conditions. MLPs may have limited financial resources, their securities may trade infrequently and in limited volume, and they may be subject to more abrupt or erratic price movements than securities of larger or more broadly-based companies. Investments by the Fund in certain Underlying Funds that invest in MLPs may also subject the Fund to the risks associated with the specific industry or industries in which the MLPs invest, risks related to limited control and limited rights to vote on matters affecting the MLP, risks related to potential conflicts of interest between the MLP and the MLP’s general partner, cash flow risks, dilution risks and risks related to the general partner’s right to require unit-holders to sell their common units at an undesirable time or price. MLPs are generally considered interest-rate sensitive investments. During periods of interest rate volatility, these investments may not provide attractive returns. Since MLPs generally conduct business in multiple states, through its investment in certain Underlying Funds, the Fund may be subject to income or franchise tax in each of the states in which the partnership does business. The additional cost of preparing and filing the tax returns and paying the related taxes may adversely impact the Fund’s return on its investment in certain Underlying Funds.
Mortgage-Backed and Asset-Backed Securities Risk: Mortgage-backed and asset-backed securities tend to increase in value less than other debt securities when interest rates decline, but are subject to similar risk of decline in market value during periods of rising interest rates. The values of mortgage-backed and asset-backed securities become more volatile as interest rates rise. In a period of declining interest rates, the Fund may be required to reinvest more frequent prepayments on mortgage-backed and asset-backed securities in lower-yielding investments.
Multi-Manager Risk: While the manager monitors the investments of each subadviser and monitors the overall management of the Fund, each subadviser makes investment decisions for the asset classes it manages independently from one another. It is possible that the investment styles used by a subadviser in an asset class will not always be complementary to those used by others, which could adversely affect the performance of the Fund.
Natural Resources Investment Risk: The Fund’s investments in certain Underlying Funds will expose the Fund to the risk of investment in natural resource companies. The market value of securities of natural resource companies may be affected by numerous factors, including events occurring in nature, inflationary pressures and international politics. For example, events occurring in nature (such as earthquakes or fires in prime natural resource areas) and political events (such as coups, military confrontations or acts of terrorism) can
affect the overall supply of a natural resource and the value of companies involved in such natural resource. Political risks and the other risks to which non-US securities are subject may affect domestic companies if they have significant operations or investments in non-US countries. In addition, rising interest rates and general economic conditions may affect the demand for natural resources.
Non-US Securities Risk: The Fund’s investments in securities of non-US issuers or issuers with significant exposure to non-US markets and its investments in Underlying Funds that have exposure to non-US markets involve additional risk. Non-US countries in which the Fund may invest may have markets that are less liquid, less regulated and more volatile than U.S. markets. The value of the Fund’s investments may decline because of factors affecting the particular issuer as well as non-US markets and issuers generally, such as unfavorable government actions, and political or financial instability. Lack of information may also affect the value of these securities.
Real Estate Investment Trust (REIT) Risk: The Fund’s investment in certain Underlying Funds will expose the Fund to the risk of REITs. An investment in a REIT may be subject to risks similar to those associated with direct ownership of real estate, including losses from casualty or condemnation, and changes in local and general economic conditions, supply and demand, interest rates, zoning laws, regulatory limitations on rents, property taxes and operating expenses. In addition, an investment in a REIT is subject to additional risks, such as poor performance by the manager of the REIT, adverse changes to the tax laws or failure by the REIT to qualify for tax-free pass-through of income under the Code, and to the effect of general declines in stock prices. In addition, some REITs have limited diversification because they invest in a limited number of properties, a narrow geographic area, or a single type of property. Also, the organizational documents of a REIT may contain provisions that make changes in control of the REIT difficult and time-consuming. As a shareholder in a REIT, the Fund and its shareholders could bear its ratable share of the REIT’s expenses and would at the same time continue to pay its own fees and expenses. In addition, REITs may incur significant amounts of leverage.
Real Estate Related Securities Risk: Because the Fund invests in real estate securities, including REITs, the Fund is subject to the risks of investing in the real estate industry, such as changes in general and local economic conditions, the supply and demand for real estate and changes in zoning and tax laws. Since the Fund concentrates in the real estate industry, its holdings can vary significantly from broad market indices. As a result, the Fund’s performance can deviate from the performance of such indices. Because the Fund invests in stocks, there is the risk that the price of a particular stock owned by the Fund could go down or pay lower-than-expected or no dividends. In addition to an individual stock losing value, the value of the equity markets or of companies comprising the real estate industry could go down. An investment in the Fund will be closely linked to the performance of the real estate markets. Real estate securities are subject to the same risks as direct investments in real estate and mortgages, and their value will depend on the value of the underlying properties or the underlying loans or interests. The underlying loans may be subject to the risks of default or of prepayments that occur earlier or later than expected,
Notes to Consolidated Financial Statements (continued)
and such loans may also include so-called “subprime” mortgages. The value of these securities will rise and fall in response to many factors, including economic conditions, the demand for rental property and interest rates. In particular, the value of these securities may decline when interest rates rise and will also be affected by the real estate market and by the management of the underlying properties.
Small and Medium Sized Companies Risk: Small and medium sized companies usually offer a smaller range of products and services than larger companies. Smaller companies may also have limited financial resources and may lack management depth. As a result, their prices may fluctuate more than the stocks of larger, more established companies.
Historically, small and medium sized companies have sometimes gone through extended periods when they did not perform as well as larger companies. Small and medium sized companies generally are more illiquid than larger companies, which may make such investments more difficult to sell at the time and price that the Fund would like.
Tax Risk: In order to qualify as a RIC under the Code, the Fund must meet certain requirements regarding the source of its income, the diversification of its assets and the distribution of its income. If the Fund were to fail to qualify as a RIC, the Fund could be subject to federal income tax on its net income at regular corporate rates (without reduction for distributions to shareholders). When distributed, that income would also be taxable to shareholders as an ordinary dividend to the extent attributable to the Fund’s earnings and profits. If the Fund were to fail to qualify as a RIC and become subject to federal income tax, shareholders of the Fund would be subject to diminished returns.
The Fund has received a private letter ruling from the Internal Revenue Service (the IRS) stating that income derived from the Fund’s investment in the Cayman Subsidiary will constitute qualifying income to the Fund. Final tax regulations, on which taxpayers may rely for taxable years beginning after September 28, 2016, also support this result. However, in the future, if the IRS issues regulations or other guidance, or Congress enacts legislation, limiting the circumstances in which the Fund may treat such income as “qualifying income,” the Fund may need to change its investment strategies, which could adversely affect the Fund. The Cayman Subsidiary will not be subject to US federal income tax. The Cayman Subsidiary will, however, be considered a controlled foreign corporation, and the Fund will be required to include as income annually amounts earned by the Cayman Subsidiary during that year. Furthermore, the Fund will be subject to the distribution requirement applicable to open-end investment companies on such Cayman Subsidiary income, whether or not the Cayman Subsidiary makes a distribution to the Fund during the taxable year.
One of the Underlying Funds, the PGIM Jennison MLP Fund, is taxed as a regular corporation, or “C” corporation, for federal income tax purposes. This means that the PGIM
Jennison MLP Fund is generally subject to US federal income tax on its taxable income at the rates applicable to corporations and also subject to state and local income taxes. This is a relatively new strategy for mutual funds and may have unexpected and potentially significant consequences for shareholders, including the Fund.
Treasury Inflation Protected Securities (TIPS) Risk: The value of TIPS generally fluctuates in response to inflationary concerns. As inflationary expectations increase, TIPS will become more attractive, because they protect future interest payments against inflation. Conversely, as inflationary concerns decrease, TIPS will become less attractive and less valuable. Although the principal value of TIPS declines in periods of deflation, holders at maturity receive no less than the par value of the bond. However, if an Underlying Fund purchases TIPS in the secondary market, where principal values have been adjusted upward due to inflation since issuance, it may experience a loss if there is a subsequent period of deflation. If inflation is lower than expected during the period an Underlying Fund holds TIPS, the Underlying Fund may earn less on the security than on a conventional bond.
US Government and Agency Securities Risk: US Government and agency securities are subject to market risk, interest rate risk and credit risk. Not all US Government securities are insured or guaranteed by the full faith and credit of the US Government; some are only insured or guaranteed by the issuing agency, which must rely on its own resources to repay the debt. In addition, Connecticut Avenue Securities issued by Fannie Mae and Structured Agency Credit Risk issued by Freddie Mac carry no guarantee whatsoever and the risk of default associated with these securities would be borne by the Fund or an Underlying Fund. The maximum potential liability of the issuers of some US Government securities held by the Fund may greatly exceed their current resources, including their legal right to support from the US Treasury. It is possible that these issuers will not have the funds to meet their payment obligations in the future. In addition, the value of US Government securities may be affected by changes in the credit rating of the US Government.
Utilities/Infrastructure Investment Risk: The Fund’s investments in certain Underlying Funds will expose the Fund to potential adverse economic, regulatory, political and other changes affecting infrastructure investments, particularly investments in the utilities sector. In most countries and localities, the utilities industry is regulated by governmental entities, which can increase costs and delays for new projects and make it difficult to pass increased costs on to consumers. In certain areas, deregulation of utilities has resulted in increased competition and reduced profitability for certain companies, and increased the risk that a particular company will become bankrupt or fail completely. Reduced profitability, as well as new uses for or additional need of funds (such as for expansion, operations or stock buybacks), could result in reduced dividend payout rates for utilities companies. In addition, utilities companies face the risk of increases in the cost and reduced availability of fuel (such as oil, coal, natural gas or nuclear energy) and potentially high interest costs for borrowing to finance new projects. Issuers in other types of infrastructure-related businesses also are subject to a variety of factors that may adversely affect their business or operations, including high interest costs in connection with capital construction programs, costs associated with environmental and other regulations, the effects of economic slowdown and
Notes to Consolidated Financial Statements (continued)
surplus capacity, increased competition from other providers of services, uncertainties concerning the availability of fuel at reasonable prices, the effects of energy conservation policies, and other factors.
| 10. | Recent Accounting Pronouncement and Regulatory Developments |
In March 2020, the FASB issued Accounting Standard Update (“ASU”) No. 2020-04, which provides optional guidance for applying GAAP to contract modifications, hedging relationships and other transactions affected by the reference rate reform if certain criteria are met. ASU 2020-04 is elective and is effective on March 12, 2020 through December 31, 2022. At this time, management is evaluating the implications of certain provisions of the ASU and any impact on the financial statement disclosures has not yet been determined.
On December 3, 2020, the SEC announced that it voted to adopt a new rule that establishes an updated regulatory framework for fund valuation practices (the “Rule”). The Rule, in part, provides (i) a framework for determining fair value in good faith and (ii) provides for a fund Board’s assignment of its responsibility for the execution of valuation-related activities to a fund’s investment adviser. Further, the SEC is rescinding previously issued guidance on related issues. The Rule took effect on March 8, 2021, with a compliance date of September 8, 2022. Management is currently evaluating the Rule and its impact to the Fund.
Report of Independent Registered Public Accounting Firm
To the Board of Trustees of Prudential Investment Portfolios 3 and Shareholders of PGIM Real Assets Fund
Opinion on the Consolidated Financial Statements
We have audited the accompanying consolidated statement of assets and liabilities, including the consolidated schedule of investments, of PGIM Real Assets Fund (one of the funds constituting Prudential Investment Portfolios 3, referred to hereafter as the “Fund”) as of October 31, 2021, the related consolidated statement of operations for the year ended October 31, 2021, the consolidated statement of changes in net assets for each of the two years in the period ended October 31, 2021, including the related notes, and consolidated financial highlights for each of the two years in the period ended October 31, 2021 (collectively referred to as the “financial statements”). In our opinion, the financial statements present fairly, in all material respects, the financial position of the Fund as of October 31, 2021, the results of its operations for the year then ended, and the changes in its net assets and the financial highlights for each of the two years in the period ended October 31, 2021 in conformity with accounting principles generally accepted in the United States of America.
The consolidated financial statements of the Fund as of and for the year ended October 31, 2019 and the consolidated financial highlights for each of the periods ended on or prior to October 31, 2019 (not presented herein, other than the consolidated financial highlights) were audited by other auditors whose report dated December 19, 2019 expressed an unqualified opinion on those consolidated financial statements and consolidated financial highlights.
Basis for Opinion
These financial statements are the responsibility of the Fund’s management. Our responsibility is to express an opinion on the Fund’s financial statements based on our audits. We are a public accounting firm registered with the Public Company Accounting Oversight Board (United States) (PCAOB) and are required to be independent with respect to the Fund in accordance with the U.S. federal securities laws and the applicable rules and regulations of the Securities and Exchange Commission and the PCAOB.
We conducted our audits of these financial statements in accordance with the standards of the PCAOB. Those standards require that we plan and perform the audit to obtain reasonable assurance about whether the financial statements are free of material misstatement, whether due to error or fraud.
Our audits included performing procedures to assess the risks of material misstatement of the financial statements, whether due to error or fraud, and performing procedures that respond to those risks. Such procedures included examining, on a test basis, evidence regarding the amounts and disclosures in the financial statements. Our audits also included evaluating the accounting principles used and significant estimates made by management, as well as evaluating the overall presentation of the financial statements. Our procedures included confirmation of securities owned as of October 31, 2021 by correspondence with the custodian, transfer agent and brokers. We believe that our audits provide a reasonable basis for our opinion.
/s/PricewaterhouseCoopers LLP
New York, New York
December 16, 2021
We have served as the auditor of one or more investment companies in the PGIM Retail Funds complex since 2020.
Tax Information (unaudited)
We are advising you that during the fiscal year ended October 31, 2021, the Fund reports the maximum amount allowed per share but not less than $.25 for Class A, C, Z and R6 shares as a capital gain distribution in accordance with Section 852(b)(3)(C) of the Internal Revenue Code.
For the year ended October 31, 2021, the Fund reports the maximum amount allowable under Section 854 of the Internal Revenue Code, but not less than, the following percentages of the ordinary income dividends paid as 1) qualified dividend income (QDI); and 2) eligible for corporate dividends received deduction (DRD):
| | | | | | | | |
| | | QDI | | | DRD | |
PGIM Real Assets Fund | | | 13.89 | % | | | 4.97 | % |
In January 2022, you will be advised on IRS Form 1099-DIV or substitute 1099-DIV, as to the federal tax status of dividends and distributions received by you in calendar year 2021.
INFORMATION ABOUT BOARD MEMBERS AND OFFICERS (unaudited)
Information about Board Members and Officers of the Fund is set forth below. Board Members who are not deemed to be “interested persons” of the Fund, as defined in the 1940 Act, are referred to as “Independent Board Members.” Board Members who are deemed to be “interested persons” of the Fund are referred to as “Interested Board Members.” The Board Members are responsible for the overall supervision of the operations of the Fund and perform the various duties imposed on the directors of investment companies by the 1940 Act. The Board in turn elects the Officers, who are responsible for administering the day-to-day operations of the Fund.
| | | | | | |
| Independent Board Members | | | | |
| | | | |
Name Year of Birth Position(s) Portfolios Overseen | | Principal Occupation(s) During Past Five Years | | Other Directorships Held During Past Five Years | | Length of
Board Service |
| | | | |
Ellen S. Alberding 1958 Board Member Portfolios Overseen: 95 | | President and Board Member, The Joyce Foundation (charitable foundation) (since 2002); formerly Vice Chair, City Colleges of Chicago (community college system) (2011-2015); Trustee, National Park Foundation (charitable foundation for national park system) (2009-2018); Trustee, Economic Club of Chicago (2009-2016); Trustee, Loyola University (since 2018). | | None. | | Since September 2013 |
| | | | |
Kevin J. Bannon 1952 Board Member Portfolios Overseen: 95 | | Retired; formerly Managing Director (April 2008-May 2015) and Chief Investment Officer (October 2008-November 2013) of Highmount Capital LLC (registered investment adviser); formerly Executive Vice President and Chief Investment Officer (April 1993-August 2007) of Bank of New York Company; President (May 2003-May 2007) of BNY Hamilton Family of Mutual Funds. | | Director of Urstadt Biddle Properties (equity real estate investment trust) (since September 2008). | | Since July 2008 |
PGIM Real Assets Fund
| | | | | | |
Independent Board Members | | | | |
| | | | |
Name Year of Birth Position(s) Portfolios Overseen | | Principal Occupation(s) During Past Five Years | | Other Directorships Held During Past Five Years | | Length of Board Service |
| | | | |
Linda W. Bynoe 1952 Board Member Portfolios Overseen: 92 | | President and Chief Executive Officer (since March 1995) and formerly Chief Operating Officer (December 1989-February 1995) of Telemat Limited LLC (formerly Telemat Ltd) (management consulting); formerly Vice President (January 1985-June 1989) at Morgan Stanley & Co. (broker-dealer). | | Trustee of Equity Residential (residential real estate) (since December 2009); Director of Northern Trust Corporation (financial services) (since April 2006); formerly Director of Anixter International, Inc. (communication products distributor) (January 2006-June 2020). | | Since March 2005 |
| | | | |
Barry H. Evans 1960 Board Member Portfolios Overseen: 94 | | Retired; formerly President (2005-2016), Global Chief Operating Officer (2014-2016), Chief Investment Officer - Global Head of Fixed Income (1998-2014), and various portfolio manager roles (1986-2006), Manulife Asset Management (asset management). | | Formerly Director, Manulife Trust Company (2011-2018); formerly Director, Manulife Asset Management Limited (2015-2017); formerly Chairman of the Board of Directors of Manulife Asset Management U.S. (2005-2016); formerly Chairman of the Board, Declaration Investment Management and Research (2008-2016). | | Since September 2017 |
| | | | |
Keith F. Hartstein 1956 Board Member & Independent Chair Portfolios Overseen: 95 | | Retired; Executive Committee of the Independent Directors Council (IDC) Board of Governors (since October 2019); Member (since November 2014) of the Governing Council of the IDC (organization of independent mutual fund directors); formerly President and Chief Executive Officer (2005-2012), Senior Vice President (2004-2005), Senior Vice President of Sales and Marketing (1997-2004), and various executive management positions (1990-1997), John Hancock Funds, LLC (asset management); Chairman, Investment Company Institute’s Sales Force Marketing Committee (2003-2008). | | None. | | Since September 2013 |
Visit our website at pgim.com/investments
| | | | | | |
| Independent Board Members | | | | |
| | | | |
Name Year of Birth Position(s) Portfolios Overseen | | Principal Occupation(s) During Past Five Years | | Other Directorships Held During Past Five Years | | Length of Board Service |
| | | | |
Laurie Simon Hodrick 1962 Board Member Portfolios Overseen: 91 | | A. Barton Hepburn Professor Emerita of Economics in the Faculty of Business, Columbia Business School (since 2018); Visiting Fellow at the Hoover Institution, Stanford University (since 2015); Sole Member, ReidCourt LLC (since 2008) (a consulting firm); formerly Visiting Professor of Law, Stanford Law School (2015-2021); formerly A. Barton Hepburn Professor of Economics in the Faculty of Business, Columbia Business School (1996-2017); formerly Managing Director, Global Head of Alternative Investment Strategies, Deutsche Bank (2006-2008). | | Independent Director, Roku (since December 2020) (communication services); formerly Independent Director, Synnex Corporation (2019-2021) (information technology); formerly Independent Director, Kabbage, Inc. (2018-2020) (financial services); formerly Independent Director, Corporate Capital Trust (2017-2018) (a business development company). | | Since September 2017 |
| | | | |
Brian K. Reid 1961 Board Member Portfolios Overseen: 94 | | Retired; formerly Chief Economist for the Investment Company Institute (ICI) (2005-2017); formerly Senior Economist and Director of Industry and Financial Analysis at the ICI (1998-2004); formerly Senior Economist, Industry and Financial Analysis at the ICI (1996-1998); formerly Staff Economist at the Federal Reserve Board (1989-1996); Director, ICI Mutual Insurance Company (2012-2017). | | None. | | Since March 2018 |
PGIM Real Assets Fund
| | | | | | |
| Independent Board Members | | | | |
| | | | |
Name Year of Birth Position(s) Portfolios Overseen | | Principal Occupation(s) During Past Five Years | | Other Directorships Held During Past Five Years | | Length of Board Service |
| | | | |
Grace C. Torres 1959 Board Member Portfolios Overseen: 94 | | Retired; formerly Treasurer and Principal Financial and Accounting Officer of the PGIM Funds, Target Funds, Advanced Series Trust, Prudential Variable Contract Accounts and The Prudential Series Fund (1998-June 2014); Assistant Treasurer (March 1999-June 2014) and Senior Vice President (September 1999-June 2014) of PGIM Investments LLC; Assistant Treasurer (May 2003-June 2014) and Vice President (June 2005-June 2014) of AST Investment Services, Inc.; Senior Vice President and Assistant Treasurer (May 2003-June 2014) of Prudential Annuities Advisory Services, Inc. | | Director (since January 2018) of OceanFirst Financial Corp. and OceanFirst Bank; formerly Director (July 2015-January 2018) of Sun Bancorp, Inc. N.A. and Sun National Bank. | | Since November 2014 |
| | | | | | |
| Interested Board Members | | | | |
| | | | |
Name Year of Birth Position(s) Portfolios Overseen | | Principal Occupation(s) During Past Five Years | | Other Directorships Held During Past Five Years | | Length of Board Service |
| | | | |
Stuart S. Parker 1962 Board Member & President Portfolios Overseen: 94 | | President, Chief Executive Officer, Chief Operating Officer and Officer in Charge of PGIM Investments LLC (formerly known as Prudential Investments LLC) (since January 2012); formerly Executive Vice President of Jennison Associates LLC and Head of Retail Distribution of PGIM Investments LLC (June 2005-December 2011); Investment Company Institute - Board of Governors (since May 2012). | | None. | | Since January 2012 |
Visit our website at pgim.com/investments
| | | | | | |
| Interested Board Members | | | | |
| | | | |
Name Year of Birth Position(s) Portfolios Overseen | | Principal Occupation(s) During Past Five Years | | Other Directorships Held During Past Five Years | | Length of
Board Service |
| | | | |
Scott E. Benjamin 1973 Board Member & Vice President Portfolios Overseen: 95 | | Executive Vice President (since May 2009) of PGIM Investments LLC; Vice President (since June 2012) of Prudential Investment Management Services LLC; Executive Vice President (since September 2009) of AST Investment Services, Inc.; Senior Vice President of Product Development and Marketing, PGIM Investments (since February 2006); formerly Vice President of Product Development and Product Management, PGIM Investments LLC (2003-2006). | | None. | | Since March 2010 |
(1) The year that each Board Member joined the Board is as follows:
Ellen S. Alberding, 2013; Kevin J. Bannon, 2008; Linda W. Bynoe, 2005; Barry H. Evans, 2017; Keith F. Hartstein, 2013; Laurie Simon Hodrick, 2017; Michael S. Hyland, 2008; Richard A. Redeker, 1993; Stephen G. Stoneburn, 2003; Stuart S. Parker, Board Member since 2012 and President since 2012; Scott E. Benjamin, Board Member since 2010 and Vice President since 2009; Grace C. Torres, 2014.
| | | | |
| Fund Officers(a) | | | | |
| | | |
Name Year of Birth Fund Position | | Principal Occupation(s) During Past Five Years | | Length of Service as Fund Officer |
| | | |
Claudia DiGiacomo 1974 Chief Legal Officer | | Chief Legal Officer, Executive Vice President and Secretary of PGIM Investments LLC (since August 2020); Chief Legal Officer of Prudential Mutual Fund Services LLC (since August 2020); Chief Legal Officer of PIFM Holdco, LLC (since August 2020); Vice President and Corporate Counsel (since January 2005) of Prudential; and Corporate Counsel of AST Investment Services, Inc. (since August 2020); formerly Vice President and Assistant Secretary of PGIM Investments LLC (2005-2020); formerly Associate at Sidley Austin Brown & Wood LLP (1999-2004). | | Since December 2005 |
PGIM Real Assets Fund
| | | | |
| Fund Officers(a) | | | | |
| | | |
Name Year of Birth Fund Position | | Principal Occupation(s) During Past Five Years | | Length of
Service as Fund
Officer |
| | | |
Dino Capasso 1974 Chief Compliance Officer | | Chief Compliance Officer (since July 2019) of PGIM Investments LLC; Chief Compliance Officer (since July 2019) of the PGIM Funds, Target Funds, Advanced Series Trust, The Prudential Series Fund, Prudential’s Gibraltar Fund, Inc., PGIM Global High Yield Fund, Inc., PGIM High Yield Bond Fund, Inc., and PGIM Short Duration High Yield Opportunities Fund; Vice President and Deputy Chief Compliance Officer (June 2017-2019) of PGIM Investments LLC; formerly Senior Vice President and Senior Counsel (January 2016-June 2017), and Vice President and Counsel (February 2012-December 2015) of Pacific Investment Management Company LLC. | | Since July 2019 |
| | | |
Andrew R. French 1962 Secretary | | Vice President (since December 2018) of PGIM Investments LLC; formerly Vice President and Corporate Counsel (2010-2018) of Prudential; formerly Director and Corporate Counsel (2006-2010) of Prudential; Vice President and Assistant Secretary (since January 2007) of PGIM Investments LLC; Vice President and Assistant Secretary (since January 2007) of Prudential Mutual Fund Services LLC. | | Since October 2006 |
| | | |
Diana N. Huffman 1982 Assistant Secretary | | Vice President and Corporate Counsel (since September 2015) of Prudential; Vice President and Assistant Secretary (since August 2020) of PGIM Investments LLC; formerly Associate at Willkie Farr & Gallagher LLP (2009-2015). | | Since March 2019 |
| | | |
Melissa Gonzalez 1980 Assistant Secretary | | Vice President and Corporate Counsel (since September 2018) of Prudential; Vice President and Assistant Secretary (since August 2020) of PGIM Investments LLC; formerly Director and Corporate Counsel (March 2014-September 2018) of Prudential. | | Since March 2020 |
| | | |
Patrick E. McGuinness 1986 Assistant Secretary | | Vice President and Assistant Secretary (since August 2020) of PGIM Investments LLC; Director and Corporate Counsel (since February 2017) of Prudential; and Corporate Counsel (2012-2017) of IIL, Inc. | | Since June 2020 |
| | | |
Debra Rubano 1975 Assistant Secretary | | Vice President and Corporate Counsel (since November 2020) of Prudential; formerly Director and Senior Counsel of Allianz Global Investors U.S. Holdings LLC (2010-2020) and Assistant Secretary of numerous funds in the Allianz fund complex (2015-2020). | | Since December 2020 |
| | | |
Kelly A. Coyne 1968 Assistant Secretary | | Director, Investment Operations of Prudential Mutual Fund Services LLC (since 2010). | | Since March 2015 |
Visit our website at pgim.com/investments
| | | | |
| Fund Officers(a) | | | | |
| | | |
Name Year of Birth Fund Position | | Principal Occupation(s) During Past Five Years | | Length of
Service as Fund
Officer |
| | | |
Christian J. Kelly 1975 Treasurer and Principal Financial and Accounting Officer | | Vice President, Head of Fund Administration of PGIM Investments LLC (since November 2018); formerly Director of Fund Administration of Lord Abbett & Co. LLC (2009-2018), Treasurer and Principal Accounting Officer of the Lord Abbett Family of Funds (2017-2018); Director of Accounting, Avenue Capital Group (2008-2009); Senior Manager, Investment Management Practice of Deloitte & Touche LLP (1998-2007). | | Since January 2019 |
| | | |
Lana Lomuti 1967 Assistant Treasurer | | Vice President (since 2007) and Director (2005-2007), within PGIM Investments Fund Administration; formerly Assistant Treasurer (December 2007-February 2014) of The Greater China Fund, Inc. | | Since April 2014 |
| | | |
Russ Shupak 1973 Assistant Treasurer | | Vice President (since 2017) and Director (2013-2017), within PGIM Investments Fund Administration. | | Since September 2019 |
| | | |
Deborah Conway 1969 Assistant Treasurer | | Vice President (since 2017) and Director (2007-2017), within PGIM Investments Fund Administration. | | Since September 2019 |
| | | |
Elyse M. McLaughlin 1974 Assistant Treasurer | | Vice President (since 2017) and Director (2011-2017), within PGIM Investments Fund Administration. | | Since September 2019 |
| | | |
Jonathan Corbett 1983 Anti-Money Laundering Compliance Officer | | Vice President, Corporate Compliance, Global Compliance Programs and Compliance Risk Management (since August 2019) of Prudential; formerly Vice President and Head of Key Risk Areas Compliance (March 2016 to July 2019), Chief Privacy Officer (March 2016 to July 2019) and Head of Global Financial Crimes Unit (April 2014 to March 2016) at MetLife. | | Since October 2021 |
(a) Excludes Mr. Parker and Mr. Benjamin, interested Board Members who also serve as President and Vice President, respectively.
Explanatory Notes to Tables:
| ∎ | | Board Members are deemed to be “Interested,” as defined in the 1940 Act, by reason of their affiliation with PGIM Investments LLC and/or an affiliate of PGIM Investments LLC. |
| ∎ | | Unless otherwise noted, the address of all Board Members and Officers is c/o PGIM Investments LLC, 655 Broad Street, Newark, New Jersey 07102-4410. |
| ∎ | | There is no set term of office for Board Members or Officers. The Board Members have adopted a retirement policy, which calls for the retirement of Board Members on December 31 of the year in which they reach the age of 75. |
| ∎ | | “Other Directorships Held” includes all directorships of companies required to register or file reports with the SEC under the 1934 Act (that is, “public companies”) or other investment companies registered under the 1940 Act. |
| ∎ | | “Portfolios Overseen” includes all investment companies managed by PGIM Investments LLC. The investment companies for which PGIM Investments LLC serves as manager include the PGIM Funds, Target Funds, The Prudential Variable Contract Accounts, PGIM ETF Trust, PGIM High Yield Bond Fund, Inc., PGIM Global High Yield Fund, Inc., PGIM Short Duration High Yield Opportunities Fund, The Prudential Series Fund, Prudential’s Gibraltar Fund, Inc. and the Advanced Series Trust. |
| ∎ | | As used in the Fund Officers table “Prudential” means The Prudential Insurance Company of America. |
PGIM Real Assets Fund
Approval of Advisory Agreements (unaudited)
The Fund’s Board of Trustees
The Board of Trustees (the “Board”) of PGIM Real Assets Fund (the “Fund”)1 consists of ten individuals, eight of whom are not “interested persons” of the Fund, as defined in the Investment Company Act of 1940, as amended (the “1940 Act”) (the “Independent Trustees”). The Board is responsible for the oversight of the Fund and its operations, and performs the various duties imposed on the directors of investment companies by the 1940 Act. The Independent Trustees have retained independent legal counsel to assist them in connection with their duties. The Chair of the Board is an Independent Trustee. The Board has established four standing committees: the Audit Committee, the Nominating and Governance Committee, and two Investment Committees. Each committee is chaired by, and composed of, Independent Trustees.
Annual Approval of the Fund’s Advisory Agreements
As required under the 1940 Act, the Board determines annually whether to renew the Fund’s management agreement with PGIM Investments LLC (“PGIM Investments”) and the Fund’s subadvisory agreement with QMA LLC (“QMA”).2 In considering the renewal of the agreements, the Board, including all of the Independent Trustees, met on June 7-10, 2021. The Board approved the renewal of the agreements through July 31, 2022, after concluding that the renewal of the agreements was in the best interests of the Fund and its shareholders.
In advance of the meetings, the Board requested and received materials relating to the agreements, and had the opportunity to ask questions and request further information in connection with its consideration. Among other things, the Board considered comparative fee information from PGIM Investments and QMA. Also, the Board considered comparisons with other mutual funds in relevant Peer Universes and Peer Groups, as is further discussed below.
In approving the agreements, the Board, including the Independent Trustees advised by independent legal counsel, considered the factors it deemed relevant, including the nature, quality and extent of services provided by PGIM Investments and the subadviser, the performance of the Fund, the profitability of PGIM Investments and its affiliates, expenses and fees, and the potential for economies of scale that may be shared with the Fund and its shareholders as the Fund’s assets grow. In their deliberations, the Trustees did not identify any single factor which alone was responsible for the Board’s decision to approve the agreements with respect to the Fund. In connection with its deliberations, the Board considered information provided by PGIM Investments throughout the year at regular Board meetings, presentations from portfolio managers and other information, as well as information furnished at or in advance of the meetings on June 7-10, 2021.
| 1 | PGIM Real Assets Fund is a series of Prudential Investment Portfolios 3. |
| 2 | The Board noted that, effective as of October 26, 2020, no assets were allocated to PGIM Fixed Income with respect to the fixed income asset class and PGIM Fixed Income did not manage any assets of the Fund. Accordingly, PGIM Investments is terminating the subadvisory agreement with PGIM with due notice effective as of July 1, 2021. |
PGIM Real Assets Fund
Approval of Advisory Agreements (continued)
The Trustees determined that the overall arrangements between the Fund and PGIM Investments, which serves as the Fund’s investment manager pursuant to a management agreement, and between PGIM Investments and QMA, which serves as the Fund’s subadviser pursuant to the terms of a subadvisory agreement with PGIM Investments, are in the best interests of the Fund and its shareholders in light of the services performed, fees charged and such other matters as the Trustees considered relevant in the exercise of their business judgment.
The material factors and conclusions that formed the basis for the Trustees’ reaching their determinations to approve the continuance of the agreements are separately discussed below.
Nature, Quality and Extent of Services
The Board received and considered information regarding the nature, quality and extent of services provided to the Fund by PGIM Investments and QMA. The Board noted that QMA is affiliated with PGIM Investments. The Board considered the services provided by PGIM Investments, including but not limited to the oversight of the subadviser for the Fund, as well as the provision of fund recordkeeping, compliance and other services to the Fund, and PGIM Investments’ role as administrator for the Fund’s liquidity risk management program. With respect to PGIM Investments’ oversight of the subadviser, the Board noted that PGIM Investments’ Strategic Investment Research Group (“SIRG”), which is a business unit of PGIM Investments, is responsible for monitoring and reporting to PGIM Investments’ senior management on the performance and operations of the subadviser. The Board also considered that PGIM Investments pays the salaries of all of the officers and interested Trustees of the Fund who are part of Fund management. The Board also considered the investment subadvisory services provided by QMA, including investment research and security selection, as well as adherence to the Fund’s investment restrictions and compliance with applicable Fund policies and procedures. The Board considered PGIM Investments’ evaluation of the subadviser as well as PGIM Investments’ recommendation, based on its review of each subadviser, to renew the subadvisory agreement.
The Board considered the qualifications, backgrounds and responsibilities of PGIM Investments’ senior management responsible for the oversight of the Fund and QMA and also considered the qualifications, backgrounds and responsibilities of the QMA portfolio managers who are responsible for the day-to-day management of the Fund’s portfolio. The Board was provided with information pertaining to PGIM Investments’ and QMA’s organizational structures, senior management, investment operations, and other relevant information pertaining to PGIM Investments and QMA. The Board also noted that it received favorable compliance reports from the Fund’s Chief Compliance Officer (“CCO”) as to each of PGIM Investments and QMA.
The Board concluded that it was satisfied with the nature, extent and quality of the investment management services provided by PGIM Investments and the subadvisory services provided to the Fund by QMA and that there was a reasonable basis on which
Visit our website at pgim.com/investments
to conclude that the Fund benefits from the services provided by PGIM Investments and QMA under the management and subadvisory agreements.
Costs of Services and Profits Realized by PGIM Investments
The Board was provided with information on the profitability of PGIM Investments and its affiliates in serving as the Fund’s investment manager. The Board discussed with PGIM Investments the methodology utilized in assembling the information regarding profitability and considered its reasonableness. The Board recognized that it is difficult to make comparisons of profitability from fund management contracts because comparative information is not generally publicly available and is affected by numerous factors, including the structure of the particular adviser, the types of funds it manages, its business mix, numerous assumptions regarding allocations and the adviser’s capital structure and cost of capital. However, the Board considered that the cost of services provided by PGIM Investments to the Fund during the year ended December 31, 2020 exceeded the management fees paid by the Fund, resulting in an operating loss to PGIM Investments. Taking these factors into account, the Board concluded that the profitability of PGIM Investments and its affiliates in relation to the services rendered was not unreasonable.
Economies of Scale
The Board received and discussed information concerning economies of scale that PGIM Investments may realize as the Fund’s assets grow beyond current levels. The Board noted that management fee schedule for the Fund includes breakpoints, which have the effect of decreasing the fee rate as assets increase. During the course of time, the Board has considered information regarding the launch date of the Fund, the management fees of the Fund compared to those of similarly managed funds and PGIM Investments’ investment in the Fund over time. The Board noted that economies of scale may be shared with the Fund in several ways, including low management fees from inception, additional technological and personnel investments to enhance shareholder services, and maintaining existing expense structures in the face of a rising cost environment. The Board considered PGIM Investments’ assertion that it continually evaluates the management fee schedule of the Fund and the potential to share economies of scale through breakpoints or fee waivers as asset levels increase.
The Board recognized the inherent limitations of any analysis of economies of scale, stemming largely from the Board’s understanding that most of PGIM Investments’ costs are not specific to individual funds, but rather are incurred across a variety of products and services.
Other Benefits to PGIM Investments and QMA
The Board considered potential ancillary benefits that might be received by PGIM Investments and QMA and their affiliates as a result of their relationship with the Fund. The Board concluded that potential benefits to be derived by PGIM Investments included transfer agency fees received by the Fund’s transfer agent (which is affiliated with PGIM Investments), as well as benefits to its reputation or other intangible benefits
PGIM Real Assets Fund
Approval of Advisory Agreements (continued)
resulting from PGIM Investments’ association with the Fund. The Board concluded that the potential benefits to be derived by QMA included its ability to use soft dollar credits, as well as the potential benefits consistent with those generally resulting from an increase in assets under management, specifically, potential access to additional research resources and benefits to their reputations. The Board concluded that the benefits derived by PGIM Investments and QMA were consistent with the types of benefits generally derived by investment managers and subadvisers to mutual funds.
Performance of the Fund / Fees and Expenses
The Board considered certain additional factors and made related conclusions relating to the historical performance of the Fund for the one-, three-, and five-year periods ended December 31, 2020.
The Board also considered the Fund’s actual management fee, as well as the Fund’s net total expense ratio, for the fiscal year ended October 31, 2020. The Board considered the management fee for the Fund as compared to the management fee charged by PGIM Investments to other funds and the fee charged by other advisers to comparable mutual funds in a Peer Group. The actual management fee represents the fee rate actually paid by Fund shareholders and includes any fee waivers or reimbursements. The net total expense ratio for the Fund represents the actual expense ratio incurred by Fund shareholders.
The mutual funds included in the Peer Universe, which was used to consider performance, and the mutual funds included in the Peer Group, which was used to consider expenses and fees, were selected by PGIM Investments. In certain circumstances, PGIM Investments also provided supplemental Peer Universe or Peer Group information for reasons addressed with the Board. The comparisons placed the Fund in various quartiles over various periods, with the first quartile being the best 25% of the mutual funds (for performance, the best performing mutual funds and, for expenses, the lowest cost mutual funds).
The section below summarizes key factors considered by the Board and the Board’s conclusions regarding the Fund’s performance, fees and overall expenses. The table sets forth net performance comparisons (which reflect the impact on performance of fund expenses, or any subsidies, expense caps or waivers that may be applicable) with the Peer Universe, actual management fees with the Peer Group (which reflect the impact of any subsidies or fee waivers), and net total expenses with the Peer Group, each of which were key factors considered by the Board.
| | | | | | | | |
| | | | | |
Net Performance | | 1 Year | | 3 Years | | 5 Years | | 10 Years |
| | 1st Quartile | | 2nd Quartile | | 4th Quartile | | 2nd Quartile |
| |
| Actual Management Fees: 1st Quartile |
| |
| Net Total Expenses: 1st Quartile |
Visit our website at pgim.com/investments
| | ● | The Board noted that the Fund outperformed one of its benchmark indices (a custom blended index) over all periods. The Board also noted that the Fund underperformed its other benchmark index (the Bloomberg Barclays US TIPS Index) over all periods. |
| | ● | The Board also considered that the Fund outperformed the Bloomberg Barclays US TIPS Index in the fourth quarter of 2020. |
| | ● | The Board and PGIM Investments agreed to continue the Fund’s existing contractual expense cap, which (exclusive of certain fees and expenses) caps the annual operating expenses of each class of the Fund’s shares at 0.85% through February 28, 2022. |
| | ● | In addition, PGIM Investments will waive management fees or shared operating expenses on any share class to the same extent that it waives such expenses on any other share class, and has agreed that total annual fund operating expenses for Class R6 shares will not exceed total annual fund operating expenses for Class Z shares. |
| | ● | The Board concluded that, in light of the above, it would be in the best interests of the Fund and its shareholders to renew the agreements. |
| | ● | The Board concluded that the management fees (including subadvisory fees) and total expenses were reasonable in light of the services provided. |
* * *
After full consideration of these factors, the Board concluded that approval of the agreements was in the best interests of the Fund and its shareholders.
PGIM Real Assets Fund
| | | | |
| | | |
| ∎ MAIL | | ∎ TELEPHONE | | ∎ WEBSITE |
655 Broad Street Newark, NJ 07102 | | (800) 225-1852 | | pgim.com/investments |
|
| PROXY VOTING |
| The Board of Trustees of the Fund has delegated to the Fund’s subadviser the responsibility for voting any proxies and maintaining proxy recordkeeping with respect to the Fund. A description of these proxy voting policies and procedures is available without charge, upon request, by calling (800) 225-1852 or by visiting the Securities and Exchange Commission’s website at sec.gov. Information regarding how the Fund voted proxies relating to portfolio securities during the most recent 12-month period ended June 30 is available on the Fund’s website and on the Securities and Exchange Commission’s website. |
|
| TRUSTEES |
| Ellen S. Alberding • Kevin J. Bannon • Scott E. Benjamin • Linda W. Bynoe • Barry H. Evans • Keith F. Hartstein • Laurie Simon Hodrick • Stuart S. Parker • Brian K. Reid • Grace C. Torres |
|
| OFFICERS |
| Stuart S. Parker, President • Scott E. Benjamin, Vice President • Christian J. Kelly, Treasurer and Principal Financial and Accounting Officer • Claudia DiGiacomo, Chief Legal Officer • Dino Capasso, Chief Compliance Officer • Jonathan Corbett, Anti-Money Laundering Compliance Officer • Andrew R. French, Secretary • Melissa Gonzalez, Assistant Secretary • Diana N. Huffman, Assistant Secretary • Kelly A. Coyne, Assistant Secretary • Patrick E. McGuinness, Assistant Secretary • Debra Rubano, Assistant Secretary • Lana Lomuti, Assistant Treasurer • Russ Shupak, Assistant Treasurer • Elyse M. McLaughlin, Assistant Treasurer • Deborah Conway, Assistant Treasurer |
| | | | |
| MANAGER | | PGIM Investments LLC | | 655 Broad Street
Newark, NJ 07102 |
|
| SUBADVISER | | PGIM Quantitative Solutions LLC | | Gateway Center Two
100 Mulberry Street
Newark, NJ 07102 |
|
| DISTRIBUTOR | | Prudential Investment Management Services LLC | | 655 Broad Street
Newark, NJ 07102 |
|
| CUSTODIAN | | The Bank of New York Mellon | | 240 Greenwich Street
New York, NY 10286 |
|
| TRANSFER AGENT | | Prudential Mutual Fund Services LLC | | PO Box 9658
Providence, RI 02940 |
|
| INDEPENDENT REGISTERED PUBLIC ACCOUNTING FIRM | | PricewaterhouseCoopers LLP | | 300 Madison Avenue
New York, NY 10017 |
|
| FUND COUNSEL | | Willkie Farr & Gallagher LLP | | 787 Seventh Avenue
New York, NY 10019 |
|
|
| An investor should consider the investment objectives, risks, charges, and expenses of the Fund carefully before investing. The prospectus and summary prospectus contain this and other information about the Fund. An investor may obtain the prospectus and summary prospectus by visiting our website at pgim.com/investments or by calling (800) 225-1852. The prospectus and summary prospectus should be read carefully before investing. |
|
| E-DELIVERY |
| To receive your mutual fund documents online, go to pgim.com/investments/resource/edelivery and enroll. Instead of receiving printed documents by mail, you will receive notification via email when new materials are available. You can cancel your enrollment or change your email address at any time by visiting the website address above. |
|
| SHAREHOLDER COMMUNICATIONS WITH TRUSTEES |
| Shareholders can communicate directly with the Board of Trustees by writing to the Chair of the Board, PGIM Real Assets Fund, PGIM Investments, Attn: Board of Trustees, 655 Broad Street, Newark, NJ 07102. Shareholders can communicate directly with an individual Trustee by writing to that Trustee at the same address. Communications are not screened before being delivered to the addressee. |
|
| AVAILABILITY OF PORTFOLIO HOLDINGS |
| The Fund files its complete schedule of portfolio holdings with the Securities and Exchange Commission for the first and third quarters of each fiscal year as an exhibit to its reports on Form N-PORT. The Fund’s Form N-PORT filings are available on the Commission’s website at sec.gov. |
|
| The Fund’s Statement of Additional Information contains additional information about the Fund’s Trustees and is available without charge, upon request, by calling (800) 225-1852. |
Mutual Funds:
| | | | |
| ARE NOT INSURED BY THE FDIC OR ANY FEDERAL GOVERNMENT AGENCY | | MAY LOSE VALUE | | ARE NOT A DEPOSIT OF OR GUARANTEED BY ANY BANK OR ANY BANK AFFILIATE |

PGIM REAL ASSETS FUND
| | | | | | | | |
| SHARE CLASS | | A | | C | | Z | | R6 |
| | | | |
| NASDAQ | | PUDAX | | PUDCX | | PUDZX | | PUDQX |
| | | | |
| CUSIP | | 74440K819 | | 74440K785 | | 74440K777 | | 74440K744 |
MF207E

PGIM GLOBAL DYNAMIC BOND FUND
ANNUAL REPORT
OCTOBER 31, 2021

|
|
To enroll in e-delivery, go to pgim.com/investments/resource/edelivery |
Table of Contents
This report is not authorized for distribution to prospective investors unless preceded or accompanied by a current prospectus.
The views expressed in this report and information about the Fund’s portfolio holdings are for the period covered by this report and are subject to change thereafter.
Mutual funds are distributed by Prudential Investment Management Services LLC (PIMS), member SIPC. PGIM Fixed Income is a unit of PGIM, Inc. (PGIM), a registered investment adviser. PIMS and PGIM are Prudential Financial companies. © 2021 Prudential Financial, Inc. and its related entities. PGIM and the PGIM logo are service marks of Prudential Financial, Inc. and its related entities, registered in many jurisdictions worldwide.
| | |
| 2 | | Visit our website at pgim.com/investments |
Letter from the President
| | |
 | | Dear Shareholder: We hope you find the annual report for the PGIM Global Dynamic Bond Fund informative and useful. The report covers performance for the 12-month period that ended October 31, 2021. The global economy and markets continued to recover throughout the period from the ongoing impact of the COVID-19 pandemic. The Federal Reserve slashed interest rates and kept them near zero to encourage borrowing. |
| | |
| Congress passed stimulus bills worth several trillion dollars to help consumers and businesses. And several effective COVID-19 vaccines received regulatory approval. Those measures were enough to offset the fear of rising inflation and supply chain challenges that threatened to disrupt growth. |
At the start of the period, stocks had recovered most of the steep losses they had suffered at the onset of the pandemic. Equities rallied as states reopened their economies but became more volatile as investors worried that a surge in COVID-19 infections would stall the recovery. However, rising corporate profits and economic growth, the resolution of the US presidential election, and the global rollout of approved vaccines lifted equity markets to record levels, helping stocks around the globe post gains for the full period.
Throughout this volatile period, investors sought safety in fixed income. Investment-grade bonds in the US and the overall global bond market declined slightly during the period as the economy recovered, but emerging market debt rose. While the 10-year US Treasury yield hovered near record lows early in the period after a significant rally in interest rates, rates moved higher later on as investors began to focus on stronger economic growth and the prospects of higher inflation. The Fed also took several aggressive actions to keep the bond markets running smoothly, implementing many of the relief programs that proved to be successful in helping end the global financial crisis in 2008-09.
Regarding your investments with PGIM, we believe it is important to maintain a diversified portfolio of funds consistent with your tolerance for risk, time horizon, and financial goals. Your financial advisor can help you create a diversified investment plan that may include funds covering all the basic asset classes and that reflects your personal investor profile and risk tolerance. However, diversification and asset allocation strategies do not assure a profit or protect against loss in declining markets.
At PGIM Investments, we consider it a great privilege and responsibility to help investors participate in opportunities across global markets while meeting their toughest investment challenges. PGIM is a top-10 global investment manager with more than $1.5 trillion in assets under management. This scale and investment expertise allow us to deliver actively managed funds and strategies to meet the needs of investors around the globe.
Thank you for choosing our family of funds.
Sincerely,

Stuart S. Parker, President
PGIM Global Dynamic Bond Fund
December 15, 2021
| | | | |
PGIM Global Dynamic Bond Fund | | | 3 | |
Your Fund’s Performance (unaudited)
Performance data quoted represent past performance. Past performance does not guarantee future results. The investment return and principal value of an investment will fluctuate so that an investor’s shares, when redeemed, may be worth more or less than their original cost. Current performance may be lower or higher than the past performance data quoted. An investor may obtain performance data as of the most recent month-end by visiting our website at pgim.com/investments or by calling (800) 225-1852.
| | | | | | |
| | |
| | | Average Annual Total Returns as of 10/31/21 |
| | | | |
| | | One Year (%) | | Five Years (%) | | Since Inception (%) |
| | | | |
| Class A | | | | | | |
| | | | |
| (with sales charges) | | 1.83 | | 4.90 | | 4.73 (11/03/2015) |
| | | | |
| (without sales charges) | | 5.25 | | 5.59 | | 5.31 (11/03/2015) |
| | | | |
| Class C | | | | | | |
| | | | |
| (with sales charges) | | 3.36 | | 4.77 | | 4.49 (11/03/2015) |
| | | | |
| (without sales charges) | | 4.36 | | 4.77 | | 4.49 (11/03/2015) |
| | | | |
| Class Z | | | | | | |
| | | | |
| (without sales charges) | | 5.62 | | 5.92 | | 5.64 (11/03/2015) |
| | | | |
| Class R6 | | | | | | |
| | | | |
| (without sales charges) | | 5.56 | | 5.96 | | 5.65 (11/03/2015) |
| | |
| ICE BofA USD 3-Month Deposit Offered Rate Constant Maturity Index | | |
| | | | |
| | | 0.19 | | 1.43 | | 1.28 |
| | | | |
| Bloomberg Global Aggregate Index | | | | | | |
| | | -1.24 | | 2.52 | | 3.02 |
Since Inception returns are provided since the Fund has less than 10 fiscal years of returns. Since Inception returns for the Indexes are measured from the closest month-end to the Fund’s inception date.
| | |
| 4 | | Visit our website at pgim.com/investments |
Growth of a $10,000 Investment (unaudited)
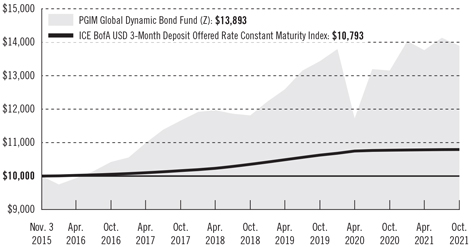
The graph compares a $10,000 investment in the Fund’s Class Z shares with a similar investment in the ICE BofA USD LIBOR 3-Month Deposit Offered Rate Constant Maturity Index by portraying the initial account values at the commencement of operations for Class Z shares (November 3, 2015) and the account values at the end of the current fiscal year (October 31, 2021), as measured on a quarterly basis. For purposes of the graph, and unless otherwise indicated, it has been assumed that (a) all recurring fees (including management fees) were deducted and (b) all dividends and distributions were reinvested. The line graph provides information for Class Z shares only. As indicated in the tables provided earlier, performance for other share classes will vary due to the differing fees and expenses applicable to each share class (as indicated in the following paragraphs). Without waiver of fees and/or expense reimbursements, if any, the returns would have been lower.
Past performance does not predict future performance. Total returns and the ending account values in the graph include changes in share price and reinvestment of dividends and capital gains distributions in a hypothetical investment for the periods shown. The Fund’s total returns do not reflect the deduction of income taxes on an individual’s investment. Taxes may reduce your actual investment returns on income or gains paid by the Fund or any gains you may realize if you sell your shares.
| | | | |
PGIM Global Dynamic Bond Fund | | | 5 | |
Your Fund’s Performance (continued)
The returns in the tables do not reflect the deduction of taxes that a shareholder would pay on Fund distributions or following the redemption of Fund shares. The average annual total returns take into account applicable sales charges, which are described for each share class in the table below.
| | | | | | | | |
| | | | | |
| | | Class A | | Class C | | Class Z | | Class R6 |
| | | | | |
| Maximum initial sales charge | | 3.25% of the public offering price | | None | | None | | None |
| Contingent deferred sales charge (CDSC) (as a percentage of the lower of the original purchase price or the net asset value at redemption) | | 1.00% on sales of $500,000 or more made within 12 months of purchase | | 1.00% on sales made within 12 months of purchase | | None | | None |
| Annual distribution and service (12b-1) fees (shown as a percentage of average daily net assets) | | 0.25% | | 1.00% | | None | | None |
Benchmark Definitions
ICE BofA USD 3-Month Deposit Offered Rate Constant Maturity Index—The ICE BofA USD 3-Month Deposit Offered Rate Constant Maturity Index is an unmanaged index that tracks the performance of a synthetic asset paying LIBOR to a stated maturity. The Index is based on the assumed purchase at par of a synthetic instrument having exactly its stated maturity and with a coupon equal to that day’s fixing rate. That issue is assumed to be sold the following business day (priced at a yield equal to the current day fixing rate) and rolled into a new instrument.
Bloomberg Global Aggregate Index—The Bloomberg Global Aggregate Index is an unmanaged index of global investment-grade fixed income markets. The three major components of this index are the U.S. Aggregate, the Pan-European Aggregate, and the Asian-Pacific Aggregate Indices. The Index also includes Eurodollar and Euro-Yen corporate bonds, and Canadian government, agency, and corporate securities.
Investors cannot invest directly in an index. The returns for the Indexes would be lower if they included the effects of sales charges, operating expenses of a mutual fund, or taxes that may be paid by an investor.
| | |
| 6 | | Visit our website at pgim.com/investments |
| | | | | | |
|
| Distributions and Yields as of 10/31/21 |
| | | |
| | Total Distributions
Paid for
12 Months ($) | | SEC 30-Day
Subsidized
Yield* (%) | | SEC 30-Day
Unsubsidized
Yield** (%) |
| | | |
| Class A | | 0.81 | | 2.27 | | 5.71 |
| | | |
| Class C | | 0.73 | | 1.60 | | 11.51 |
| | | |
| Class Z | | 0.85 | | 2.69 | | 2.62 |
| | | |
| Class R6 | | 0.85 | | 2.75 | | 2.64 |
*SEC 30-Day Subsidized Yield (%)—A standardized yield calculation created by the Securities and Exchange Commission, it reflects the income earned during a 30-day period, after the deduction of the Fund’s net expenses (net of any expense waivers or reimbursements). The investor experience is represented by the SEC 30-Day Subsidized Yield.
**SEC 30-Day Unsubsidized Yield (%)—A standardized yield calculation created by the Securities and Exchange Commission, it reflects the income earned during a 30-day period, after the deduction of the Fund’s gross expenses. The investor experience is represented by the SEC 30-Day Subsidized Yield.
| | |
| |
| Credit Quality expressed as a percentage of total investments as of 10/31/21 (%) | | |
| | |
| AAA | | 0.9 |
| | |
| AA | | 0.9 |
| | |
| A | | 7.5 |
| | |
| BBB | | 20.2 |
| | |
| BB | | 38.4 |
| | |
| B | | 20.9 |
| | |
| CCC | | 3.8 |
| | |
| CC | | 0.4 |
| | |
| Not Rated | | 3.4 |
| | |
| Cash/Cash Equivalents | | 3.6 |
| | |
| Total | | 100.0 |
Credit ratings reflect the highest rating assigned by a nationally recognized statistical rating organization (NRSRO) such as Moody’s Investors Service, Inc. (Moody’s), S&P Global Ratings (S&P), or Fitch, Inc. (Fitch). Credit ratings reflect the common nomenclature used by both S&P and Fitch. Where applicable, ratings are converted to the comparable S&P/Fitch rating tier nomenclature. These rating agencies are independent and are widely used. The Not Rated category consists of securities that have not been rated by an NRSRO. Credit ratings are subject to change.
| | | | |
PGIM Global Dynamic Bond Fund | | | 7 | |
Strategy and Performance Overview (unaudited)
How did the Fund perform?
The PGIM Global Dynamic Bond Fund’s Class Z shares returned 5.62% in the 12-month reporting period that ended October 31, 2021, outperforming the 0.19% return of the ICE BofA USD 3-Month Deposit Offered Rate Constant Maturity Index (the Index).
What were the market conditions?
| • | | The strong global rebound from the depths of the COVID-19 pandemic continued throughout the reporting period, as economies continued to respond to the unprecedented monetary and fiscal stimulus programs. The effective rollout of COVID-19 vaccines, along with clear messaging from both President Biden and the Federal Reserve (the Fed) on the potential for further stimulus, shifted the prospects for growth and inflation, kicking off a robust “reflation trade” in bond markets, which caused the US Treasury yield curve to steepen over the period. (A yield curve is a line graph that illustrates the relationship between the yields and maturities of fixed income securities. It is created by plotting the yields of different maturities for the same type of bonds.) |
| • | | Although yields for short-term Treasuries remained well anchored during the first quarter of 2021 by the Fed’s commitment to maintain its low-rate policy, longer-term Treasuries sold off sharply, with the yield on the benchmark US 10-year Treasury note rising from 0.92% on December 31, 2020 to 1.74% by March 31, 2021. Similarly, the yield on the 30-year Treasury bond rose from 1.65% to 2.41% over the same period. |
| • | | Market volatility for rates then eased in the second and third quarters of 2021, with long-term US Treasury yields declining gradually before rising again in late September after the Fed signaled it could begin tapering its monthly bond purchases shortly after its November meeting. The US 10-year and 30-year Treasury yields ended the period at 1.55% and 1.93%, respectively. Meanwhile, the yield on the 2-year Treasury note rose sharply the last month of the period as markets began pricing in two rate hikes in 2022, ending October 31, 2021 at 0.45%—a rise of 28 basis points (bps) over the period. (One basis point equals 0.01%.) Despite flattening over the last six months of the period as the market pulled forward its expectation for rate hikes, the US Treasury yield curve steepened during the period, with the 10-year and 2-year Treasury spread rising from 0.74% to 1.07% as of October 31, 2021. |
| • | | In Europe, German 10-year bond yields rose to end the period at -0.10%, as rate hike expectations were brought forward amid concerns about prolonged inflation even as the European Central Bank continued to signal rate hikes in 2022 were unlikely. Similarly, United Kingdom (UK) 10-year bond yields rose over the period to end October 31, 2021 at 1.03% amid inflation concerns driven by demand and supply-chain bottlenecks. |
| • | | Spread markets continued to tighten, supported by the Fed’s monetary responses, fiscal stimulus, the rollout of COVID-19 vaccines, better-than-expected corporate earnings, and surging growth in the US, Europe, and some emerging market economies. (Spread markets are non-government-related sectors of the fixed income market, such as investment grade corporate bonds, high yield bonds, or asset-backed |
| | |
| 8 | | Visit our website at pgim.com/investments |
| | securities.) Strengthening economic fundamentals coupled with aggressive central bank measures (e.g., zero interest rate policies and asset purchases) drove corporate and securitized asset spreads tighter, with many sectors rallying to, or through, their pre-COVID-19 levels. |
| • | | The US investment grade corporate market performed well, with spreads tightening to near-historic levels by the end of the period, supported by better-than-expected corporate earnings, positive vaccination progress, and a favorable technical backdrop. Strengthening fundamentals generally kept securitized credit on a tightening trajectory as well, with commercial mortgage-backed securities (CMBS) spreads trading well below their pre-pandemic tights by the end of the period. US high yield bond spreads tightened as fundamentals remained supportive. Meanwhile, emerging market spreads tightened, boosting returns as investor appetite remained strong amid a global search for yield. |
What worked?
| • | | Security selection was the largest contributor to the Fund’s performance during the reporting period, with selection in developed high yield, emerging sovereigns, developed sovereigns, emerging agencies, developed CMBS, developed equity, and developed investment grade corporates the largest contributors. |
| • | | Within credit, positions in foreign non-corporates, upstream and midstream energy, gaming, lodging & leisure, aerospace & defense, and telecom were the largest contributors. |
| • | | In individual security selection, the Fund benefited from overweights to Ukraine and Greece sovereign bonds relative to the Index, along with positioning in Chesapeake Energy Corp. (upstream energy), Bombardier Inc. (aerospace & defense), and AMC Entertainment Holdings Inc. (gaming, lodging & leisure). |
What didn’t work?
| • | | During the reporting period, the Fund’s long duration bias detracted from returns. (Duration measures the sensitivity of the price—the value of principal—of a bond to a change in interest rates.) The Fund’s yield curve flattener positioning in US rates also detracted as the curve steepened over the period. (A yield curve flattener is an interest rate environment in which long-term rates are decreasing more quickly than short-term rates.) |
| • | | Developed LIBOR derivatives (London Interbank Offered Rate) and emerging LIBOR derivatives detracted from performance. |
| • | | In individual security selection, positioning in Intelsat SA (cable), Bellis Holdco Ltd. (food), and Sinclair Broadcasting Group Inc. (media & entertainment) detracted from performance. |
Did the Fund use derivatives?
The Fund uses derivatives when they facilitate implementation of the overall investment approach. During the reporting period, the Fund used interest rate futures, options, and
| | | | |
PGIM Global Dynamic Bond Fund | | | 9 | |
Strategy and Performance Overview (continued)
swaps to help manage duration positioning and yield curve exposure. Over the period, futures, options, and swaps contributed to performance. Credit default swaps and credit default swap index (CDX) positions were used to either add risk exposure to certain issuers or to hedge credit risk imposed by certain issuers. Overall, credit derivative exposure contributed during the period. In addition, the Fund traded foreign-exchange derivatives, which had a negative impact on performance over the period.
Current outlook
| • | | As the Fed’s tapering approached, PGIM Fixed Income believed the Fed would likely draw a clear distinction between the removal of accommodation via reduction in asset purchases and tightening of policy through rate hikes in the federal funds rate target. |
| • | | Looking beyond the next year or two, PGIM Fixed Income believes the secular fundamental drivers—such as aging demographics and high debt levels—that pushed rates lower for decades are likely to reassert themselves with even more downward force on rates in a post-COVID world of older populations and markedly higher debt levels. As a result, many central bankers may end up leaving administered rates near, or at, their effective lower bounds, and rate hike cycles will likely continue cresting at progressively lower levels. From that perspective, the third quarter 2021 increase in longer-term rates—which lifted them back up to levels that reflect a substantial and permanent rise in administered rates over the coming years—has probably already overshot fundamentals, in PGIM Fixed Income’s view. |
| • | | As for spread sectors, PGIM Fixed Income continues to expect the ongoing economic expansion to support credit fundamentals and, in turn, to allow credit products to continue outperforming. Given the relatively narrow level of spreads, however, excess returns are likely to be more modest, deriving primarily from incremental yield and rolling down the spread curve, rather than from the kinds of wholesale spread compression seen since March 2020. (Roll-down return is a strategy for selling a bond as it approaches its maturity date. In general, as a bond’s maturity date grows closer, its interest rate moves closer to zero. Since there is an inverse relationship between bond yields and prices, bond prices increase as their interest rates decrease.) |
| • | | PGIM Fixed Income maintains its positive view of the spread sectors over the medium to long term, and the Fund holds allocations to an array of credit sectors, including both investment-grade and high yield corporates, high-quality structured products, and emerging markets. While valuations are now a bit full, with spreads in many sectors tighter than historical norms, PGIM Fixed Income generally expects ongoing spread sector outperformance. However, this outlook is not without caveats. First, the relatively narrow level of spreads diminishes the pace and magnitude of further outperformance. Additionally, narrower spreads leave little room for error, and the uncertain course of the long-term economic recovery warrants a discerning approach to credit selection. |
| • | | Within structured products, PGIM Fixed Income is biased to own the top of the capital structure, as near-zero policy rates and ongoing Fed purchases support a spread |
| | |
| 10 | | Visit our website at pgim.com/investments |
| | tightening environment. In investment grade corporates, PGIM Fixed Income is looking to take advantage of spread compression in select higher-yielding BBB-rated bonds, solid credits in stressed industries, and cyclicals. PGIM Fixed Income remains constructive on high yield over the medium term as improving fundamentals and a decline in defaults is expected to drive spread compression going forward, and it believes the prospects for emerging market debt performance are encouraging given the supportive backdrop, attractive valuations, and global search for yield. |
| | | | |
PGIM Global Dynamic Bond Fund | | | 11 | |
Fees and Expenses (unaudited)
As a shareholder of the Fund, you incur two types of costs: (1) transaction costs, including sales charges (loads) on purchase payments and redemptions, as applicable, and (2) ongoing costs, including management fees, distribution and/or service (12b-1) fees, and other Fund expenses, as applicable. This example is intended to help you understand your ongoing costs (in dollars) of investing in the Fund and to compare these costs with the ongoing costs of investing in other mutual funds.
The example is based on an investment of $1,000 held through the six-month period ended October 31, 2021. The example is for illustrative purposes only; you should consult the Prospectus for information on initial and subsequent minimum investment requirements.
Actual Expenses
The first line for each share class in the table on the following page provides information about actual account values and actual expenses. You may use the information on this line, together with the amount you invested, to estimate the expenses that you paid over the period. Simply divide your account value by $1,000 (for example, an $8,600 account value ÷ $1,000 = 8.6), then multiply the result by the number on the first line under the heading “Expenses Paid During the Six-Month Period” to estimate the expenses you paid on your account during this period.
Hypothetical Example for Comparison Purposes
The second line for each share class in the table on the following page provides information about hypothetical account values and hypothetical expenses based on the Fund’s actual expense ratio and an assumed rate of return of 5% per year before expenses, which is not the Fund’s actual return. The hypothetical account values and expenses may not be used to estimate the actual ending account balance or expenses you paid for the period. You may use this information to compare the ongoing costs of investing in the Fund and other funds. To do so, compare this 5% hypothetical example with the 5% hypothetical examples that appear in the shareholder reports of the other funds.
The Fund’s transfer agent may charge additional fees to holders of certain accounts that are not included in the expenses shown in the table on the following page. These fees apply to individual retirement accounts (IRAs) and Section 403(b) accounts. As of the close of the six-month period covered by the table, IRA fees included an annual maintenance fee of $15 per account (subject to a maximum annual maintenance fee of $25 for all accounts held by the same shareholder). Section 403(b) accounts are charged an annual $25 fiduciary maintenance fee. Some of the fees may vary in amount, or may be waived, based on your total account balance or the number of PGIM funds, including the Fund, that you own. You should consider the additional fees that were charged to your Fund account over the six-month period when you estimate the total ongoing expenses paid over the period and the impact of these fees on your ending account value, as these additional expenses are not reflected in the information
| | |
| 12 | | Visit our website at pgim.com/investments |
provided in the expense table. Additional fees have the effect of reducing investment returns.
Please note that the expenses shown in the table are meant to highlight your ongoing costs only and do not reflect any transactional costs such as sales charges (loads). Therefore, the second line for each share class in the table is useful in comparing ongoing costs only and will not help you determine the relative total costs of owning different funds. In addition, if these transactional costs were included, your costs would have been higher.
| | | | | | | | | | |
| | | | |
PGIM Global Dynamic Bond Fund | | Beginning
Account Value
May 1, 2021 | | Ending
Account Value
October 31, 2021 | | Annualized
Expense
Ratio Based on
the Six-Month Period | | Expenses Paid
During the
Six-Month Period* |
| | | | | |
| Class A | | Actual | | $ 1,000.00 | | $ 1,006.70 | | 1.20% | | $ 6.07 |
| | Hypothetical | | $ 1,000.00 | | $ 1,019.16 | | 1.20% | | $ 6.11 |
| Class C | | Actual | | $ 1,000.00 | | $ 1,002.90 | | 1.95% | | $ 9.84 |
| | Hypothetical | | $ 1,000.00 | | $ 1,015.38 | | 1.95% | | $ 9.91 |
| Class Z | | Actual | | $ 1,000.00 | | $ 1,009.50 | | 0.85% | | $ 4.31 |
| | Hypothetical | | $ 1,000.00 | | $ 1,020.92 | | 0.85% | | $ 4.33 |
| Class R6 | | Actual | | $ 1,000.00 | | $ 1,008.70 | | 0.80% | | $ 4.05 |
| | | Hypothetical | | $ 1,000.00 | | $ 1,021.17 | | 0.80% | | $ 4.08 |
*Fund expenses (net of fee waivers or subsidies, if any) for each share class are equal to the annualized expense ratio for each share class (provided in the table), multiplied by the average account value over the period, multiplied by the 184 days in the six-month period ended October 31, 2021, and divided by the 365 days in the Fund’s fiscal year ended October 31, 2021 (to reflect the six-month period). Expenses presented in the table include the expenses of any underlying portfolios in which the Fund may invest.
| | | | |
PGIM Global Dynamic Bond Fund | | | 13 | |
Schedule of Investments
as of October 31, 2021
| | | | | | | | | | | | | | | | |
| | | | |
| Description | | Interest
Rate | | | Maturity
Date | | | Principal
Amount
(000)# | | | Value | |
| | | | |
LONG-TERM INVESTMENTS 96.3% | | | | | | | | | | | | | | | | |
| | | | |
ASSET-BACKED SECURITIES 3.2% | | | | | | | | | | | | | | | | |
| | | | |
Cayman Islands 0.4% | | | | | | | | | | | | | | | | |
Trinitas CLO Ltd., | | | | | | | | | | | | | | | | |
Series 2020-14A, Class C, 144A, 3 Month LIBOR + 3.000% (Cap N/A, Floor 3.000%) | | | 3.124%(c) | | | | 01/25/34 | | | | 250 | | | $ | 251,127 | |
| | | | |
Spain 0.7% | | | | | | | | | | | | | | | | |
TFS, | | | | | | | | | | | | | | | | |
Series 2018-03, Class A1, 1 Month EURIBOR + 3.000% | | | 3.000(c) | | | | 04/16/23 | | | EUR | 449 | | | | 454,216 | |
| | | | |
United States 2.1% | | | | | | | | | | | | | | | | |
Laurel Road Prime Student Loan Trust, | | | | | | | | | | | | | | | | |
Series 2019-A, Class R, 144A | | | 0.000 | | | | 10/25/48 | | | | 1,016 | | | | 172,016 | |
Legacy Mortgage Asset Trust, | | | | | | | | | | | | | | | | |
Series 2019-GS02, Class A1, 144A | | | 3.750 | | | | 01/25/59 | | | | 111 | | | | 111,073 | |
Oportun Funding XIII LLC, | | | | | | | | | | | | | | | | |
Series 2019-A, Class B, 144A | | | 3.870 | | | | 08/08/25 | | | | 100 | | | | 101,495 | |
PNMAC GMSR Issuer Trust, | | | | | | | | | | | | | | | | |
Series 2018-GT01, Class A, 144A, 1 Month LIBOR + 2.850% (Cap N/A, Floor 2.850%) | | | 2.939(c) | | | | 02/25/23 | | | | 100 | | | | 100,233 | |
Series 2018-GT02, Class A, 144A, 1 Month LIBOR + 2.650% (Cap N/A, Floor 0.000%) | | | 2.739(c) | | | | 08/25/25 | | | | 100 | | | | 99,970 | |
TH MSR Issuer Trust, | | | | | | | | | | | | | | | | |
Series 2019-FT01, Class A, 144A, 1 Month LIBOR + 2.800% (Cap N/A, Floor 2.800%) | | | 2.889(c) | | | | 06/25/24 | | | | 820 | | | | 817,996 | |
| | | | | | | | | | | | | | | | |
| | | | |
| | | | | | | | | | | | | | | 1,402,783 | |
| | | | | | | | | | | | | | | | |
| | | | |
TOTAL ASSET-BACKED SECURITIES
(cost $2,063,569) | | | | | | | | | | | | | | | 2,108,126 | |
| | | | | | | | | | | | | | | | |
| | | | |
BANK LOANS 0.4% | | | | | | | | | | | | | | | | |
| | | | |
Luxembourg 0.1% | | | | | | | | | | | | | | | | |
Intelsat Jackson Holdings SA, | | | | | | | | | | | | | | | | |
DIP Term Loan, 3 Month LIBOR + 4.750% | | | 5.750(c) | | | | 07/13/22 | | | | 62 | | | | 62,938 | |
See Notes to Financial Statements.
| | | | |
| PGIM Global Dynamic Bond Fund | | | 15 | |
Schedule of Investments (continued)
as of October 31, 2021
| | | | | | | | | | | | | | | | |
| | | | |
| Description | | Interest
Rate | | | Maturity
Date | | | Principal
Amount
(000)# | | | Value | |
| | | | |
BANK LOANS (Continued) | | | | | | | | | | | | | | | | |
| | | | |
United States 0.3% | | | | | | | | | | | | | | | | |
Ascent Resources Utica Holdings LLC, | | | | | | | | | | | | | | | | |
Second Lien Term Loan, 3 Month LIBOR + 9.000% | | | 10.000%(c) | | | | 11/01/25 | | | | 178 | | | $ | 194,732 | |
Diamond Sports Group LLC, | | | | | | | | | | | | | | | | |
Term Loan, 1 Month LIBOR + 3.250% | | | 3.340(c) | | | | 08/24/26 | | | | 40 | | | | 20,714 | |
| | | | | | | | | | | | | | | | |
| | | | |
| | | | | | | | | | | | | | | 215,446 | |
| | | | | | | | | | | | | | | | |
| | |
TOTAL BANK LOANS
(cost $268,241) | | | | | | | | 278,384 | |
| | | | | | | | | | | | | | | | |
| |
COMMERCIAL MORTGAGE-BACKED SECURITIES 12.6% | | | | | |
| | | | |
Canada 0.1% | | | | | | | | | | | | | | | | |
Real Estate Asset Liquidity Trust, | | | | | | | | | | | | | | | | |
Series 2020-01A, Class A1, 144A | | | 2.381(cc) | | | | 02/12/55 | | | CAD | 70 | | | | 56,643 | |
| | | | | | | | | | | | | | | | |
| | | | |
Ireland 3.5% | | | | | | | | | | | | | | | | |
Deco DAC, | | | | | | | | | | | | | | | | |
Series 2019-RAM, Class A3 Month GBP LIBOR + 1.900% (Cap N/A, Floor 1.900%) | | | 1.973(c) | | | | 08/07/30 | | | GBP | 1,721 | | | | 2,299,993 | |
| | | | | | | | | | | | | | | | |
| | | | |
United States 9.0% | | | | | | | | | | | | | | | | |
Barclays Commercial Mortgage Securities Trust, | | | | | | | | | | | | | | | | |
Series 2018-CHRS, Class D, 144A | | | 4.267(cc) | | | | 08/05/38 | | | | 300 | | | | 295,861 | |
BX Commercial Mortgage Trust, | | | | | | | | | | | | | | | | |
Series 2019-XL, Class J, 144A, 1 Month LIBOR + 2.650% (Cap N/A, Floor 2.650%) | | | 2.740(c) | | | | 10/15/36 | | | | 544 | | | | 542,646 | |
Series 2020-BXLP, Class G, 144A, 1 Month LIBOR + 2.500% (Cap N/A, Floor 2.500%) | | | 2.590(c) | | | | 12/15/36 | | | | 640 | | | | 636,986 | |
Cold Storage Trust, | | | | | | | | | | | | | | | | |
Series 2020-ICE05, Class E, 144A, 1 Month LIBOR + 2.766% (Cap N/A, Floor 2.833%) | | | 2.856(c) | | | | 11/15/37 | | | | 98 | | | | 98,240 | |
Credit Suisse Mortgage Capital Certificates, | | | | | | | | | | | | | | | | |
Series 2019-ICE04, Class E, 144A, 1 Month LIBOR + 2.150% (Cap N/A, Floor 2.150%) | | | 2.240(c) | | | | 05/15/36 | | | | 275 | | | | 275,171 | |
Series 2019-ICE04, Class F, 144A, 1 Month LIBOR + 2.650% (Cap N/A, Floor 2.650%) | | | 2.740(c) | | | | 05/15/36 | | | | 1,250 | | | | 1,249,250 | |
DBWF Mortgage Trust, | | | | | | | | | | | | | | | | |
Series 2016-85T, Class E, 144A | | | 3.808(cc) | | | | 12/10/36 | | | | 250 | | | | 241,283 | |
See Notes to Financial Statements.
| | | | | | | | | | | | | | | | |
| | | | |
| Description | | Interest
Rate | | | Maturity
Date | | | Principal
Amount
(000)# | | | Value | |
|
COMMERCIAL MORTGAGE-BACKED SECURITIES (Continued) | |
|
United States (cont’d.) | |
FHLMC Multifamily Structured Pass-Through Certificates, | | | | | | | | | | | | | | | | |
Series K111, Class X1, IO | | | 1.572%(cc) | | | | 05/25/30 | | | | 479 | | | $ | 55,711 | |
Series K113, Class X1, IO | | | 1.387(cc) | | | | 06/25/30 | | | | 1,610 | | | | 166,994 | |
GS Mortgage Securities Corp. Trust, | | | | | | | | | | | | | | | | |
Series 2021-IP, Class F, 144A, 1 Month LIBOR + 4.550% (Cap N/A, Floor 4.550%) | | | 4.650(c) | | | | 10/15/36 | | | | 140 | | | | 140,128 | |
JPMorgan Chase Commercial Mortgage Securities Corp., | | | | | | | | | | | | | | | | |
Series 2018-AON, Class E, 144A | | | 4.613(cc) | | | | 07/05/31 | | | | 400 | | | | 409,491 | |
MKT Mortgage Trust, | | | | | | | | | | | | | | | | |
Series 2020-525M, Class F, 144A | | | 2.941(cc) | | | | 02/12/40 | | | | 550 | | | | 509,712 | |
Morgan Stanley Capital I Trust, | | | | | | | | | | | | | | | | |
Series 2019-MEAD, Class E, 144A | | | 3.177(cc) | | | | 11/10/36 | | | | 650 | | | | 621,928 | |
One New York Plaza Trust, | | | | | | | | | | | | | | | | |
Series 2020-01NYP, Class D, 144A, 1 Month LIBOR + 2.750% (Cap N/A, Floor 2.750%) | | | 2.840(c) | | | | 01/15/26 | | | | 125 | | | | 125,626 | |
Wells Fargo Commercial Mortgage Trust, | | | | | | | | | | | | | | | | |
Series 2021-FCMT, Class E, 144A, 1 Month LIBOR + 4.500% (Cap N/A, Floor 4.500%) | | | 4.590(c) | | | | 05/15/31 | | | | 500 | | | | 500,312 | |
| | | | | | | | | | | | | | | | |
| | | | |
| | | | | | | | | | | | | | | 5,869,339 | |
| | | | | | | | | | | | | | | | |
| | |
TOTAL COMMERCIAL MORTGAGE-BACKED SECURITIES
(cost $8,139,795) | | | | | | | | 8,225,975 | |
| | | | | | | | | | | | | | | | |
|
CORPORATE BONDS 55.0% | |
|
Brazil 1.4% | |
Petrobras Global Finance BV, | | | | | | | | | | | | | | | | |
Gtd. Notes | | | 5.375 | | | | 10/01/29 | | | | GBP 300 | | | | 439,014 | |
Gtd. Notes | | | 6.625 | | | | 01/16/34 | | | | GBP 100 | | | | 153,753 | |
Gtd. Notes, EMTN | | | 6.250 | | | | 12/14/26 | | | | GBP 200 | | | | 303,829 | |
| | | | | | | | | | | | | | | | |
| | | | |
| | | | | | | | | | | | | | | 896,596 | |
| |
Bulgaria 0.3% | | | | | |
Bulgarian Energy Holding EAD, | | | | | | | | | | | | | | | | |
Sr. Unsec’d. Notes | | | 2.450 | | | | 07/22/28 | | | | EUR 200 | | | | 229,739 | |
| |
Canada 1.9% | | | | | |
Bombardier, Inc., | | | | | | | | | | | | | | | | |
Sr. Unsec’d. Notes, 144A | | | 7.125 | | | | 06/15/26 | | | | 25 | | | | 26,243 | |
See Notes to Financial Statements.
| | | | |
| PGIM Global Dynamic Bond Fund | | | 17 | |
Schedule of Investments (continued)
as of October 31, 2021
| | | | | | | | | | | | |
| | | | |
| Description | | Interest
Rate | | Maturity
Date | | Principal
Amount
(000)# | | | Value | |
|
CORPORATE BONDS (Continued) | |
|
Canada (cont’d.) | |
Bombardier, Inc., (cont’d.) | | | | | | | | | | | | |
Sr. Unsec’d. Notes, 144A | | 7.500% | | 12/01/24 | | | 180 | | | $ | 187,374 | |
Sr. Unsec’d. Notes, 144A | | 7.875 | | 04/15/27 | | | 395 | | | | 410,788 | |
Brookfield Residential Properties, Inc./Brookfield Residential US LLC, | | | | | | | | | | | | |
Gtd. Notes, 144A | | 4.875 | | 02/15/30 | | | 85 | | | | 85,252 | |
Cenovus Energy, Inc., | | | | | | | | | | | | |
Sr. Unsec’d. Notes | | 2.650 | | 01/15/32 | | | 5 | | | | 4,881 | |
Sr. Unsec’d. Notes | | 3.750 | | 02/15/52 | | | 10 | | | | 10,092 | |
Sr. Unsec’d. Notes | | 5.250 | | 06/15/37 | | | 110 | | | | 132,242 | |
MEG Energy Corp., | | | | | | | | | | | | |
Gtd. Notes, 144A | | 7.125 | | 02/01/27 | | | 45 | | | | 47,281 | |
Sec’d. Notes, 144A | | 6.500 | | 01/15/25 | | | 120 | | | | 122,886 | |
Teck Resources Ltd., | | | | | | | | | | | | |
Sr. Unsec’d. Notes | | 6.250 | | 07/15/41 | | | 150 | | | | 200,776 | |
| | | | | | | | | | | | |
| | | | |
| | | | | | | | | | | 1,227,815 | |
|
France 4.1% | |
Adevinta ASA, | | | | | | | | | | | | |
Sr. Sec’d. Notes | | 3.000 | | 11/15/27 | | | EUR 250 | | | | 294,057 | |
Sr. Sec’d. Notes, 144A | | 3.000 | | 11/15/27 | | | EUR 100 | | | | 117,623 | |
Altice France SA, | | | | | | | | | | | | |
Sr. Sec’d. Notes | | 3.375 | | 01/15/28 | | | EUR 400 | | | | 443,561 | |
CAB SELAS, | | | | | | | | | | | | |
Sr. Sec’d. Notes, 144A | | 3.375 | | 02/01/28 | | | EUR 125 | | | | 143,697 | |
Credit Agricole Assurances SA, | | | | | | | | | | | | |
Sub. Notes | | 4.250(ff) | | 01/13/25(oo) | | | EUR 100 | | | | 127,015 | |
Faurecia SE, | | | | | | | | | | | | |
Sr. Unsec’d. Notes | | 3.750 | | 06/15/28 | | | EUR 250 | | | | 299,837 | |
Iliad Holding SAS, | | | | | | | | | | | | |
Sr. Sec’d. Notes, 144A | | 5.625 | | 10/15/28 | | | EUR 200 | | | | 238,714 | |
Loxam SAS, | | | | | | | | | | | | |
Sr. Sub. Notes | | 4.500 | | 04/15/27 | | | EUR 100 | | | | 114,589 | |
Sr. Sub. Notes | | 5.750 | | 07/15/27 | | | EUR 180 | | | | 214,322 | |
SPCM SA, | | | | | | | | | | | | |
Sr. Unsec’d. Notes, 144A | | 2.000 | | 02/01/26 | | | EUR 100 | | | | 115,889 | |
Sr. Unsec’d. Notes, 144A | | 2.625 | | 02/01/29 | | | EUR 100 | | | | 116,901 | |
Verallia SA, | | | | | | | | | | | | |
Gtd. Notes | | 1.625 | | 05/14/28 | | | EUR 400 | | | | 472,804 | |
| | | | | | | | | | | | |
| | | | |
| | | | | | | | | | | 2,699,009 | |
See Notes to Financial Statements.
| | | | | | | | | | | | |
| | | | |
| Description | | Interest
Rate | | Maturity
Date | | Principal
Amount
(000)# | | | Value | |
|
CORPORATE BONDS (Continued) | |
|
Germany 2.0% | |
Nidda BondCo GmbH, | | | | | | | | | | | | |
Gtd. Notes, 144A | | 5.000% | | 09/30/25 | | EUR | 100 | | | $ | 114,155 | |
Nidda Healthcare Holding GmbH, | | | | | | | | | | | | |
Sr. Sec’d. Notes | | 3.500 | | 09/30/24 | | EUR | 200 | | | | 227,732 | |
TK Elevator Holdco GmbH, | | | | | | | | | | | | |
Sr. Unsec’d. Notes | | 6.625 | | 07/15/28 | | EUR | 270 | | | | 326,744 | |
TK Elevator Midco GmbH, | | | | | | | | | | | | |
Sr. Sec’d. Notes | | 4.375 | | 07/15/27 | | EUR | 100 | | | | 118,977 | |
Sr. Sec’d. Notes, 144A | | 4.375 | | 07/15/27 | | EUR | 100 | | | | 118,977 | |
Volkswagen International Finance NV, | | | | | | | | | | | | |
Gtd. Notes | | 2.700(ff) | | 12/14/22(oo) | | EUR | 100 | | | | 118,399 | |
Gtd. Notes | | 4.625(ff) | | 03/24/26(oo) | | EUR | 200 | | | | 258,926 | |
| | | | | | | | | | | | |
| | | | |
| | | | | | | | | | | 1,283,910 | |
|
India 0.6% | |
NTPC Ltd., | | | | | | | | | | | | |
Sr. Unsec’d. Notes, EMTN | | 2.750 | | 02/01/27 | | EUR | 300 | | | | 367,950 | |
|
Indonesia 0.5% | |
Perusahaan Listrik Negara PT, | | | | | | | | | | | | |
Sr. Unsec’d. Notes | | 2.875 | | 10/25/25 | | EUR | 200 | | | | 246,538 | |
Sr. Unsec’d. Notes, 144A | | 1.875 | | 11/05/31 | | EUR | 100 | | | | 112,396 | |
| | | | | | | | | | | | |
| | | | |
| | | | | | | | | | | 358,934 | |
|
Israel 0.1% | |
Energean Israel Finance Ltd., | | | | | | | | | | | | |
Sr. Sec’d. Notes, 144A | | 4.500 | | 03/30/24 | | | 100 | | | | 101,987 | |
|
Italy 1.2% | |
Assicurazioni Generali SpA, | | | | | | | | | | | | |
Sub. Notes, EMTN | | 5.500(ff) | | 10/27/47 | | EUR | 100 | | | | 139,876 | |
Nexi SpA, | | | | | | | | | | | | |
Sr. Unsec’d. Notes | | 2.125 | | 04/30/29 | | EUR | 400 | | | | 457,236 | |
Shiba Bidco SpA, | | | | | | | | | | | | |
Sr. Sec’d. Notes, 144A | | 4.500 | | 10/31/28 | | EUR | 150 | | | | 173,422 | |
| | | | | | | | | | | | |
| | | | |
| | | | | | | | | | | 770,534 | |
See Notes to Financial Statements.
| | | | |
| PGIM Global Dynamic Bond Fund | | | 19 | |
Schedule of Investments (continued)
as of October 31, 2021
| | | | | | | | | | | | | | | | |
| | | | |
| Description | | Interest
Rate | | | Maturity
Date | | | Principal
Amount
(000)# | | | Value | |
| | | | |
CORPORATE BONDS (Continued) | | | | | | | | | | | | | | | | |
| | | | |
Jamaica 1.2% | | | | | | | | | | | | | | | | |
Digicel Group Holdings Ltd., | | | | | | | | | | | | | | | | |
Sr. Sec’d. Notes, Cash coupon 8.000% and PIK 2.000% | | | 10.000% | | | | 04/01/24 | | | | 111 | | | $ | 112,369 | |
Digicel International Finance Ltd./Digicel International Holdings Ltd., | | | | | | | | | | | | | | | | |
Gtd. Notes, 144A, Cash coupon 6.000% and PIK 7.000% | | | 13.000 | | | | 12/31/25 | | | | 259 | | | | 265,327 | |
Sr. Sec’d. Notes, 144A | | | 8.750 | | | | 05/25/24 | | | | 200 | | | | 208,000 | |
Digicel Ltd., | | | | | | | | | | | | | | | | |
Gtd. Notes, 144A | | | 6.750 | | | | 03/01/23 | | | | 200 | | | | 193,419 | |
| | | | | | | | | | | | | | | | |
| | | | |
| | | | | | | | | | | | | | | 779,115 | |
| | | | |
Luxembourg 2.3% | | | | | | | | | | | | | | | | |
ARD Finance SA, | | | | | | | | | | | | | | | | |
Sr. Sec’d. Notes, Cash coupon 5.000% or PIK 5.750% | | | 5.000 | | | | 06/30/27 | | | EUR | 400 | | | | 475,420 | |
Sr. Sec’d. Notes, 144A, Cash coupon 5.000% or PIK 5.750% | | | 5.000 | | | | 06/30/27 | | | EUR | 300 | | | | 356,565 | |
Intelsat Jackson Holdings SA, | | | | | | | | | | | | | | | | |
Gtd. Notes | | | 5.500 | | | | 08/01/23(d) | | | | 440 | | | | 222,110 | |
Gtd. Notes, 144A | | | 8.500 | | | | 10/15/24(d) | | | | 25 | | | | 12,964 | |
Gtd. Notes, 144A | | | 9.750 | | | | 07/15/25(d) | | | | 25 | | | | 12,892 | |
Matterhorn Telecom SA, | | | | | | | | | | | | | | | | |
Sr. Sec’d. Notes | | | 3.125 | | | | 09/15/26 | | | EUR | 400 | | | | 457,752 | |
| | | | | | | | | | | | | | | | |
| | | | |
| | | | | | | | | | | | | | | 1,537,703 | |
| | | | |
Mexico 1.7% | | | | | | | | | | | | | | | | |
Comision Federal de Electricidad, | | | | | | | | | | | | | | | | |
Sr. Unsec’d. Notes | | | 5.000 | | | | 09/29/36 | | | | 158 | | | | 165,733 | |
Petroleos Mexicanos, | | | | | | | | | | | | | | | | |
Gtd. Notes | | | 3.625 | | | | 11/24/25 | | | EUR | 200 | | | | 233,497 | |
Gtd. Notes | | | 6.500 | | | | 01/23/29 | | | | 40 | | | | 41,649 | |
Gtd. Notes, EMTN | | | 4.875 | | | | 02/21/28 | | | EUR | 600 | | | | 698,008 | |
| | | | | | | | | | | | | | | | |
| | | | |
| | | | | | | | | | | | | | | 1,138,887 | |
| | | | |
Netherlands 2.4% | | | | | | | | | | | | | | | | |
OCI NV, | | | | | | | | | | | | | | | | |
Sr. Sec’d. Notes | | | 3.125 | | | | 11/01/24 | | | EUR | 500 | | | | 585,948 | |
Titan Holdings II BV, | | | | | | | | | | | | | | | | |
Sr. Unsec’d. Notes, 144A | | | 5.125 | | | | 07/15/29 | | | EUR | 150 | | | | 171,546 | |
See Notes to Financial Statements.
| | | | | | | | | | | | | | | | |
| | | | |
| Description | | Interest
Rate | | | Maturity
Date | | | Principal
Amount
(000)# | | | Value | |
| | | | |
CORPORATE BONDS (Continued) | | | | | | | | | | | | | | | | |
| | | | |
Netherlands (cont’d.) | | | | | | | | | | | | | | | | |
United Group BV, | | | | | | | | | | | | | | | | |
Sr. Sec’d. Notes, 144A | | | 3.125% | | | | 02/15/26 | | | EUR | 400 | | | $ | 445,060 | |
Ziggo Bond Co. BV, | | | | | | | | | | | | | | | | |
Gtd. Notes, 144A | | | 3.375 | | | | 02/28/30 | | | EUR | 300 | | | | 341,598 | |
| | | | | | | | | | | | | | | | |
| | | | |
| | | | | | | | | | | | | | | 1,544,152 | |
| | | | |
Peru 0.2% | | | | | | | | | | | | | | | | |
Peru Enhanced Pass-Through Finance Ltd., | | | | | | | | | | | | | | | | |
Pass-Through Certificates | | | 1.962(s) | | | | 06/02/25 | | | | 119 | | | | 112,963 | |
| | | | |
Russia 1.0% | | | | | | | | | | | | | | | | |
Gazprom PJSC Via Gaz Capital SA, | | | | | | | | | | | | | | | | |
Sr. Unsec’d. Notes | | | 2.500 | | | | 03/21/26 | | | EUR | 100 | | | | 120,713 | |
Sr. Unsec’d. Notes | | | 4.250 | | | | 04/06/24 | | | GBP | 100 | | | | 144,330 | |
Russian Railways Via RZD Capital PLC, | | | | | | | | | | | | | | | | |
Sr. Unsec’d. Notes | | | 7.487 | | | | 03/25/31 | | | GBP | 200 | | | | 363,246 | |
| | | | | | | | | | | | | | | | |
| | | | |
| | | | | | | | | | | | | | | 628,289 | |
| | | | |
South Africa 0.7% | | | | | | | | | | | | | | | | |
Eskom Holdings SOC Ltd., | | | | | | | | | | | | | | | | |
Gov’t. Gtd. Notes, MTN | | | 6.350 | | | | 08/10/28 | | | | 400 | | | | 431,177 | |
| | | | |
Spain 1.6% | | | | | | | | | | | | | | | | |
Cellnex Telecom SA, | | | | | | | | | | | | | | | | |
Sr. Unsec’d. Notes, EMTN | | | 1.750 | | | | 10/23/30 | | | EUR | 400 | | | | 446,412 | |
Codere Finance 2 Luxembourg SA, | | | | | | | | | | | | | | | | |
Sr. Sec’d. Notes, Cash coupon 4.500% and PIK 6.250% | | | 10.750 | | | | 11/01/23(d) | | | EUR | 158 | | | | 113,884 | |
Sr. Sec’d. Notes, 144A | | | 10.750 | | | | 09/30/23(d) | | | EUR | 114 | | | | 143,280 | |
Sr. Sec’d. Notes, 144A | | | 10.750 | | | | 09/30/23(d) | | | EUR | 28 | | | | 34,763 | |
ContourGlobal Power Holdings SA, | | | | | | | | | | | | | | | | |
Sr. Sec’d. Notes | | | 4.125 | | | | 08/01/25 | | | EUR | 100 | | | | 117,382 | |
Kaixo Bondco Telecom SA, | | | | | | | | | | | | | | | | |
Sr. Unsec’d. Notes, 144A | | | 5.125 | | | | 09/30/29 | | | EUR | 175 | | | | 200,651 | |
| | | | | | | | | | | | | | | | |
| | | | |
| | | | | | | | | | | | | | | 1,056,372 | |
| | | | |
Ukraine 0.2% | | | | | | | | | | | | | | | | |
NAK Naftogaz Ukraine via Kondor Finance PLC, | | | | | | | | | | | | | | | | |
Sr. Unsec’d. Notes | | | 7.125 | | | | 07/19/24 | | | EUR | 100 | | | | 115,695 | |
See Notes to Financial Statements.
| | | | |
| PGIM Global Dynamic Bond Fund | | | 21 | |
Schedule of Investments (continued)
as of October 31, 2021
| | | | | | | | | | | | | | | | |
| | | | |
| Description | | Interest
Rate | | | Maturity
Date | | | Principal
Amount
(000)# | | | Value | |
| | | | |
CORPORATE BONDS (Continued) | | | | | | | | | | | | | | | | |
| | | | |
United Arab Emirates 0.4% | | | | | | | | | | | | | | | | |
DP World PLC, | | | | | | | | | | | | | | | | |
Sr. Unsec’d. Notes | | | 2.375% | | | | 09/25/26 | | | EUR | 100 | | | $ | 123,150 | |
Sr. Unsec’d. Notes | | | 4.250 | | | | 09/25/30 | | | GBP | 100 | | | | 152,481 | |
| | | | | | | | | | | | | | | | |
| | | | |
| | | | | | | | | | | | | | | 275,631 | |
| | | | |
United Kingdom 5.9% | | | | | | | | | | | | | | | | |
Bellis Acquisition Co. PLC, | | | | | | | | | | | | | | | | |
Sr. Sec’d. Notes, 144A | | | 3.250 | | | | 02/16/26 | | | GBP | 500 | | | | 655,408 | |
Bellis Finco PLC, | | | | | | | | | | | | | | | | |
Sr. Unsec’d. Notes, 144A | | | 4.000 | | | | 02/16/27 | | | GBP | 200 | | | | 258,078 | |
BP Capital Markets PLC, | | | | | | | | | | | | | | | | |
Gtd. Notes | | | 4.375(ff) | | | | 06/22/25(oo) | | | | 250 | | | | 265,359 | |
Co-operative Group Holdings 2011 Ltd., | | | | | | | | | | | | | | | | |
Gtd. Notes | | | 7.500(cc) | | | | 07/08/26 | | | GBP | 150 | | | | 240,485 | |
Co-operative Group Ltd., | | | | | | | | | | | | | | | | |
Sr. Unsec’d. Notes | | | 5.125 | | | | 05/17/24 | | | GBP | 150 | | | | 215,395 | |
eG Global Finance PLC, | | | | | | | | | | | | | | | | |
Sr. Sec’d. Notes | | | 4.375 | | | | 02/07/25 | | | EUR | 350 | | | | 399,204 | |
Sr. Sec’d. Notes | | | 6.250 | | | | 10/30/25 | | | EUR | 100 | | | | 117,307 | |
Sr. Sec’d. Notes, 144A | | | 4.375 | | | | 02/07/25 | | | EUR | 100 | | | | 114,058 | |
INEOS Quattro Finance 1 PLC, | | | | | | | | | | | | | | | | |
Sr. Unsec’d. Notes | | | 3.750 | | | | 07/15/26 | | | EUR | 150 | | | | 175,134 | |
INEOS Quattro Finance 2 PLC, | | | | | | | | | | | | | | | | |
Sr. Sec’d. Notes, 144A | | | 2.500 | | | | 01/15/26 | | | EUR | 100 | | | | 115,311 | |
Saga PLC, | | | | | | | | | | | | | | | | |
Gtd. Notes | | | 5.500 | | | | 07/15/26 | | | GBP | 200 | | | | 266,251 | |
Sherwood Financing PLC, | | | | | | | | | | | | | | | | |
Sr. Sec’d. Notes, 144A | | | 6.000 | | | | 11/15/26 | | | GBP | 175 | | | | 239,197 | |
Very Group Funding PLC (The), | | | | | | | | | | | | | | | | |
Sr. Sec’d. Notes, 144A | | | 6.500 | | | | 08/01/26 | | | GBP | 225 | | | | 306,551 | |
Virgin Media Finance PLC, | | | | | | | | | | | | | | | | |
Gtd. Notes | | | 3.750 | | | | 07/15/30 | | | EUR | 300 | | | | 344,199 | |
Virgin Media Vendor Financing Notes III DAC, | | | | | | | | | | | | | | | | |
Gtd. Notes | | | 4.875 | | | | 07/15/28 | | | GBP | 100 | | | | 137,375 | |
| | | | | | | | | | | | | | | | |
| | | | |
| | | | | | | | | | | | | | | 3,849,312 | |
| | | | |
United States 25.3% | | | | | | | | | | | | | | | | |
Adtalem Global Education, Inc., | | | | | | | | | | | | | | | | |
Sr. Sec’d. Notes, 144A | | | 5.500 | | | | 03/01/28 | | | | 125 | | | | 126,432 | |
Aethon United BR LP/Aethon United Finance Corp., | | | | | | | | | | | | | | | | |
Sr. Unsec’d. Notes, 144A | | | 8.250 | | | | 02/15/26 | | | | 75 | | | | 80,541 | |
See Notes to Financial Statements.
| | | | | | | | | | | | | | | | |
| | | | |
| Description | | Interest
Rate | | | Maturity
Date | | | Principal
Amount
(000)# | | | Value | |
| | | | |
CORPORATE BONDS (Continued) | | | | | | | | | | | | | | | | |
| | | | |
United States (cont’d.) | | | | | | | | | | | | | | | | |
Alta Mesa Holdings LP/Alta Mesa Finance Services Corp., | | | | | | | | | | | | | | | | |
Sr. Unsec’d. Notes^ | | | 7.875% | | | | 12/15/24(d) | | | | 400 | | | $ | 2,720 | |
AMC Entertainment Holdings, Inc., | | | | | | | | | | | | | | | | |
Sec’d. Notes, 144A, Cash coupon 10.000% or PIK 12.000% or Cash coupon 5.000% and PIK 6.000% | | | 12.000 | | | | 06/15/26 | | | | 131 | | | | 130,513 | |
American Axle & Manufacturing, Inc., | | | | | | | | | | | | | | | | |
Gtd. Notes | | | 6.250 | | | | 03/15/26 | | | | 125 | | | | 128,441 | |
AmeriGas Partners LP/AmeriGas Finance Corp., | | | | | | | | | | | | | | | | |
Sr. Unsec’d. Notes | | | 5.875 | | | | 08/20/26 | | | | 500 | | | | 558,365 | |
Antero Midstream Partners LP/Antero Midstream Finance Corp., | | | | | | | | | | | | | | | | |
Gtd. Notes, 144A | | | 5.750 | | | | 01/15/28 | | | | 75 | | | | 78,485 | |
Antero Resources Corp., | | | | | | | | | | | | | | | | |
Gtd. Notes | | | 5.000 | | | | 03/01/25 | | | | 100 | | | | 101,793 | |
Gtd. Notes, 144A | | | 8.375 | | | | 07/15/26 | | | | 32 | | | | 36,013 | |
Ascent Resources Utica Holdings LLC/ARU Finance Corp., | | | | | | | | | | | | | | | | |
Gtd. Notes, 144A | | | 7.000 | | | | 11/01/26 | | | | 50 | | | | 51,622 | |
Gtd. Notes, 144A | | | 9.000 | | | | 11/01/27 | | | | 93 | | | | 127,176 | |
Sr. Unsec’d. Notes, 144A | | | 8.250 | | | | 12/31/28 | | | | 50 | | | | 54,478 | |
Ashton Woods USA LLC/Ashton Woods Finance Co., | | | | | | | | | | | | | | | | |
Sr. Unsec’d. Notes, 144A | | | 4.625 | | | | 04/01/30 | | | | 25 | | | | 24,677 | |
Avantor Funding, Inc., | | | | | | | | | | | | | | | | |
Gtd. Notes | | | 3.875 | | | | 07/15/28 | | | | EUR 300 | | | | 359,461 | |
Sr. Sec’d. Notes, 144A | | | 2.625 | | | | 11/01/25 | | | | EUR 100 | | | | 118,201 | |
Bank of America Corp., | | | | | | | | | | | | | | | | |
Jr. Sub. Notes, Series MM | | | 4.300(ff) | | | | 01/28/25(oo) | | | | 405 | | | | 411,730 | |
Sr. Unsec’d. Notes | | | 2.572(ff) | | | | 10/20/32 | | | | 150 | | | | 150,329 | |
Bausch Health Americas, Inc., | | | | | | | | | | | | | | | | |
Gtd. Notes, 144A | | | 8.500 | | | | 01/31/27 | | | | 315 | | | | 335,200 | |
Bausch Health Cos., Inc., | | | | | | | | | | | | | | | | |
Gtd. Notes, 144A | | | 5.250 | | | | 01/30/30 | | | | 50 | | | | 45,181 | |
Gtd. Notes, 144A | | | 5.250 | | | | 02/15/31 | | | | 25 | | | | 22,509 | |
Beazer Homes USA, Inc., | | | | | | | | | | | | | | | | |
Gtd. Notes | | | 5.875 | | | | 10/15/27 | | | | 100 | | | | 104,484 | |
Gtd. Notes | | | 6.750 | | | | 03/15/25 | | | | 125 | | | | 129,063 | |
Gtd. Notes | | | 7.250 | | | | 10/15/29 | | | | 75 | | | | 81,950 | |
Brinker International, Inc., | | | | | | | | | | | | | | | | |
Gtd. Notes, 144A | | | 5.000 | | | | 10/01/24 | | | | 100 | | | | 105,926 | |
See Notes to Financial Statements.
| | | | |
| PGIM Global Dynamic Bond Fund | | | 23 | |
Schedule of Investments (continued)
as of October 31, 2021
| | | | | | | | | | | | | | | | |
| | | | |
| Description | | Interest
Rate | | | Maturity
Date | | | Principal
Amount
(000)# | | | Value | |
| | | | |
CORPORATE BONDS (Continued) | | | | | | | | | | | | | | | | |
| | | | |
United States (cont’d.) | | | | | | | | | | | | | | | | |
Brixmor Operating Partnership LP, | | | | | | | | | | | | | | | | |
Sr. Unsec’d. Notes | | | 2.500% | | | | 08/16/31 | | | | 20 | | | $ | 19,554 | |
C&S Group Enterprises LLC, | | | | | | | | | | | | | | | | |
Gtd. Notes, 144A | | | 5.000 | | | | 12/15/28 | | | | 100 | | | | 93,054 | |
Caesars Entertainment, Inc., | | | | | | | | | | | | | | | | |
Sr. Unsec’d. Notes, 144A | | | 4.625 | | | | 10/15/29 | | | | 25 | | | | 25,149 | |
Calpine Corp., | | | | | | | | | | | | | | | | |
Sr. Unsec’d. Notes, 144A | | | 4.625 | | | | 02/01/29 | | | | 50 | | | | 48,615 | |
Sr. Unsec’d. Notes, 144A | | | 5.000 | | | | 02/01/31 | | | | 185 | | | | 181,251 | |
Sr. Unsec’d. Notes, 144A | | | 5.125 | | | | 03/15/28 | | | | 75 | | | | 74,813 | |
CCO Holdings LLC/CCO Holdings Capital Corp., | | | | | | | | | | | | | | | | |
Sr. Unsec’d. Notes, 144A | | | 4.250 | | | | 02/01/31 | | | | 300 | | | | 298,530 | |
Sr. Unsec’d. Notes, 144A | | | 4.750 | | | | 03/01/30 | | | | 119 | | | | 123,002 | |
Sr. Unsec’d. Notes, 144A | | | 5.375 | | | | 06/01/29 | | | | 50 | | | | 53,738 | |
CF Industries, Inc., | | | | | | | | | | | | | | | | |
Gtd. Notes | | | 4.950 | | | | 06/01/43 | | | | 40 | | | | 48,794 | |
Gtd. Notes | | | 5.375 | | | | 03/15/44 | | | | 40 | | | | 51,260 | |
Chemours Co. (The), | | | | | | | | | | | | | | | | |
Gtd. Notes | | | 5.375 | | | | 05/15/27 | | | | 125 | | | | 132,657 | |
Chesapeake Energy Corp., | | | | | | | | | | | | | | | | |
Gtd. Notes, 144A | | | 5.500 | | | | 02/01/26 | | | | 50 | | | | 52,331 | |
Gtd. Notes, 144A | | | 5.875 | | | | 02/01/29 | | | | 25 | | | | 26,620 | |
Citgo Holding, Inc., | | | | | | | | | | | | | | | | |
Sr. Sec’d. Notes, 144A | | | 9.250 | | | | 08/01/24 | | | | 25 | | | | 25,531 | |
Citigroup, Inc., | | | | | | | | | | | | | | | | |
Jr. Sub. Notes | | | 3.875(ff) | | | | 02/18/26(oo) | | | | 380 | | | | 384,502 | |
Sr. Unsec’d. Notes | | | 2.520(ff) | | | | 11/03/32 | | | | 35 | | | | 34,871 | |
Diamond Sports Group LLC/Diamond Sports Finance Co., | | | | | | | | | | | | | | | | |
Gtd. Notes, 144A | | | 6.625 | | | | 08/15/27 | | | | 510 | | | | 152,531 | |
DISH DBS Corp., | | | | | | | | | | | | | | | | |
Gtd. Notes | | | 7.750 | | | | 07/01/26 | | | | 425 | | | | 473,057 | |
Diversified Healthcare Trust, | | | | | | | | | | | | | | | | |
Sr. Unsec’d. Notes | | | 4.750 | | | | 02/15/28 | | | | 225 | | | | 224,331 | |
Dominion Energy, Inc., | | | | | | | | | | | | | | | | |
Jr. Sub. Notes, Series B | | | 4.650(ff) | | | | 12/15/24(oo) | | | | 400 | | | | 426,336 | |
Energy Transfer LP, | | | | | | | | | | | | | | | | |
Jr. Sub. Notes, Series G | | | 7.125(ff) | | | | 05/15/30(oo) | | | | 200 | | | | 209,048 | |
Ford Motor Co., | | | | | | | | | | | | | | | | |
Sr. Unsec’d. Notes | | | 4.750 | | | | 01/15/43 | | | | 550 | | | | 600,962 | |
Golden Entertainment, Inc., | | | | | | | | | | | | | | | | |
Sr. Unsec’d. Notes, 144A | | | 7.625 | | | | 04/15/26 | | | | 200 | | | | 210,096 | |
See Notes to Financial Statements.
| | | | | | | | | | | | | | | | |
| | | | |
| Description | | Interest
Rate | | | Maturity
Date | | | Principal
Amount
(000)# | | | Value | |
| | | | |
CORPORATE BONDS (Continued) | | | | | | | | | | | | | | | | |
| | | | |
United States (cont’d.) | | | | | | | | | | | | | | | | |
Goldman Sachs Group, Inc. (The), | | | | | | | | | | | | | | | | |
Jr. Sub. Notes, Series U | | | 3.650%(ff) | | | | 08/10/26(oo) | | | | 115 | | | $ | 114,402 | |
Sr. Unsec’d. Notes | | | 2.650(ff) | | | | 10/21/32 | | | | 235 | | | | 236,226 | |
Griffon Corp., | | | | | | | | | | | | | | | | |
Gtd. Notes | | | 5.750 | | | | 03/01/28 | | | | 100 | | | | 104,567 | |
Hilcorp Energy I LP/Hilcorp Finance Co., | | | | | | | | | | | | | | | | |
Sr. Unsec’d. Notes, 144A | | | 5.750 | | | | 02/01/29 | | | | 25 | | | | 25,474 | |
Sr. Unsec’d. Notes, 144A | | | 6.000 | | | | 02/01/31 | | | | 25 | | | | 25,674 | |
Sr. Unsec’d. Notes, 144A | | | 6.250 | | | | 11/01/28 | | | | 150 | | | | 153,895 | |
Hilton Domestic Operating Co., Inc., | | | | | | | | | | | | | | | | |
Gtd. Notes, 144A | | | 3.625 | | | | 02/15/32 | | | | 300 | | | | 292,928 | |
Howard Hughes Corp. (The), | | | | | | | | | | | | | | | | |
Gtd. Notes, 144A | | | 4.125 | | | | 02/01/29 | | | | 275 | | | | 275,481 | |
Hunt Cos., Inc., | | | | | | | | | | | | | | | | |
Sr. Sec’d. Notes, 144A | | | 5.250 | | | | 04/15/29 | | | | 200 | | | | 197,006 | |
International Game Technology PLC, | | | | | | | | | | | | | | | | |
Sr. Sec’d. Notes, 144A | | | 4.125 | | | | 04/15/26 | | | | 200 | | | | 206,633 | |
IQVIA, Inc., | | | | | | | | | | | | | | | | |
Gtd. Notes | | | 2.250 | | | | 03/15/29 | | | | EUR 250 | | | | 286,236 | |
Gtd. Notes, 144A | | | 1.750 | | | | 03/15/26 | | | | EUR 150 | | | | 173,931 | |
JBS USA LUX SA/JBS USA Finance, Inc., | | | | | | | | | | | | | | | | |
Gtd. Notes, 144A | | | 6.750 | | | | 02/15/28 | | | | 400 | | | | 431,692 | |
JBS USA LUX SA/JBS USA Food Co./JBS USA Finance, Inc., | | | | | | | | | | | | | | | | |
Gtd. Notes, 144A | | | 6.500 | | | | 04/15/29 | | | | 80 | | | | 88,832 | |
Jefferies Group LLC/Jefferies Group Capital Finance, Inc., | | | | | | | | | | | | | | | | |
Sr. Unsec’d. Notes | | | 2.625 | | | | 10/15/31 | | | | 150 | | | | 147,219 | |
JPMorgan Chase & Co., | | | | | | | | | | | | | | | | |
Jr. Sub. Notes, Series HH | | | 4.600(ff) | | | | 02/01/25(oo) | | | | 420 | | | | 429,055 | |
KB Home, | | | | | | | | | | | | | | | | |
Gtd. Notes | | | 4.800 | | | | 11/15/29 | | | | 75 | | | | 80,919 | |
Kraft Heinz Foods Co., | | | | | | | | | | | | | | | | |
Gtd. Notes | | | 3.000 | | | | 06/01/26 | | | | 139 | | | | 144,996 | |
Gtd. Notes | | | 3.750 | | | | 04/01/30 | | | | 75 | | | | 81,295 | |
Lamb Weston Holdings, Inc., | | | | | | | | | | | | | | | | |
Gtd. Notes, 144A | | | 4.125 | | | | 01/31/30 | | | | 25 | | | | 25,029 | |
Gtd. Notes, 144A | | | 4.375 | | | | 01/31/32 | | | | 25 | | | | 25,034 | |
Lumen Technologies, Inc., | | | | | | | | | | | | | | | | |
Sr. Unsec’d. Notes, Series P | | | 7.600 | | | | 09/15/39 | | | | 80 | | | | 88,343 | |
Sr. Unsec’d. Notes, Series U | | | 7.650 | | | | 03/15/42 | | | | 100 | | | | 110,440 | |
See Notes to Financial Statements.
| | | | |
| PGIM Global Dynamic Bond Fund | | | 25 | |
Schedule of Investments (continued)
as of October 31, 2021
| | | | | | | | | | | | | | | | |
| | | | |
| Description | | Interest
Rate | | | Maturity
Date | | | Principal
Amount
(000)# | | | Value | |
| | | | |
CORPORATE BONDS (Continued) | | | | | | | | | | | | | | | | |
| | | | |
United States (cont’d.) | | | | | | | | | | | | | | | | |
MGM Resorts International, | | | | | | | | | | | | | | | | |
Gtd. Notes | | | 4.750% | | | | 10/15/28 | | | | 150 | | | $ | 156,018 | |
Gtd. Notes | | | 5.500 | | | | 04/15/27 | | | | 150 | | | | 161,583 | |
Morgan Stanley, | | | | | | | | | | | | | | | | |
Sr. Unsec’d. Notes | | | 1.102(ff) | | | | 04/29/33 | | | | EUR 200 | | | | 230,488 | |
Sr. Unsec’d. Notes, MTN | | | 2.511(ff) | | | | 10/20/32 | | | | 65 | | | | 64,872 | |
Mozart Debt Merger Sub, Inc., | | | | | | | | | | | | | | | | |
Sr. Sec’d. Notes, 144A | | | 3.875 | | | | 04/01/29 | | | | 25 | | | | 24,880 | |
Sr. Unsec’d. Notes, 144A | | | 5.250 | | | | 10/01/29 | | | | 25 | | | | 25,410 | |
MPT Operating Partnership LP/MPT Finance Corp., | | | | | | | | | | | | | | | | |
Gtd. Notes | | | 2.500 | | | | 03/24/26 | | | | GBP 100 | | | | 137,948 | |
Gtd. Notes | | | 3.325 | | | | 03/24/25 | | | | EUR 100 | | | | 124,592 | |
Gtd. Notes | | | 3.692 | | | | 06/05/28 | | | | GBP 155 | | | | 224,562 | |
Nabors Industries, Inc., | | | | | | | | | | | | | | | | |
Gtd. Notes | | | 5.750 | | | | 02/01/25 | | | | 75 | | | | 71,297 | |
Nationstar Mortgage Holdings, Inc., | | | | | | | | | | | | | | | | |
Gtd. Notes, 144A | | | 5.500 | | | | 08/15/28 | | | | 120 | | | | 122,930 | |
NRG Energy, Inc., | | | | | | | | | | | | | | | | |
Gtd. Notes, 144A | | | 3.625 | | | | 02/15/31 | | | | 150 | | | | 146,095 | |
Gtd. Notes, 144A | | | 5.250 | | | | 06/15/29 | | | | 150 | | | | 159,533 | |
OneMain Finance Corp., | | | | | | | | | | | | | | | | |
Gtd. Notes | | | 6.875 | | | | 03/15/25 | | | | 25 | | | | 27,952 | |
Gtd. Notes | | | 7.125 | | | | 03/15/26 | | | | 125 | | | | 141,960 | |
Park Intermediate Holdings LLC/PK Domestic Property LLC/PK Finance Co-Issuer, | | | | | | | | | | | | | | | | |
Sr. Sec’d. Notes, 144A | | | 5.875 | | | | 10/01/28 | | | | 100 | | | | 104,992 | |
PennyMac Financial Services, Inc., | | | | | | | | | | | | | | | | |
Gtd. Notes, 144A | | | 4.250 | | | | 02/15/29 | | | | 100 | | | | 94,673 | |
Pilgrim’s Pride Corp., | | | | | | | | | | | | | | | | |
Gtd. Notes, 144A | | | 4.250 | | | | 04/15/31 | | | | 175 | | | | 184,670 | |
Premier Entertainment Sub LLC/Premier Entertainment Finance Corp., | | | | | | | | | | | | | | | | |
Gtd. Notes, 144A | | | 5.625 | | | | 09/01/29 | | | | 25 | | | | 25,469 | |
Gtd. Notes, 144A | | | 5.875 | | | | 09/01/31 | | | | 50 | | | | 51,002 | |
Range Resources Corp., | | | | | | | | | | | | | | | | |
Gtd. Notes | | | 9.250 | | | | 02/01/26 | | | | 50 | | | | 54,140 | |
RegionalCare Hospital Partners Holdings, Inc./LifePoint Health, Inc., | | | | | | | | | | | | | | | | |
Gtd. Notes, 144A | | | 9.750 | | | | 12/01/26 | | | | 125 | | | | 131,898 | |
Rockies Express Pipeline LLC, | | | | | | | | | | | | | | | | |
Sr. Unsec’d. Notes, 144A | | | 6.875 | | | | 04/15/40 | | | | 75 | | | | 85,039 | |
See Notes to Financial Statements.
| | | | | | | | | | | | | | | | |
| | | | |
| Description | | Interest
Rate | | | Maturity
Date | | | Principal
Amount
(000)# | | | Value | |
| | | | |
CORPORATE BONDS (Continued) | | | | | | | | | | | | | | | | |
| | | | |
United States (cont’d.) | | | | | | | | | | | | | | | | |
Sally Holdings LLC/Sally Capital, Inc., | | | | | | | | | | | | | | | | |
Gtd. Notes | | | 5.625% | | | | 12/01/25 | | | | 100 | | | $ | 102,168 | |
Scientific Games International, Inc., | | | | | | | | | | | | | | | | |
Gtd. Notes, 144A | | | 8.625 | | | | 07/01/25 | | | | 300 | | | | 324,268 | |
Service Properties Trust, | | | | | | | | | | | | | | | | |
Sr. Unsec’d. Notes | | | 4.350 | | | | 10/01/24 | | | | 150 | | | | 151,160 | |
Suburban Propane Partners LP/Suburban Energy Finance Corp., | | | | | | | | | | | | | | | | |
Sr. Unsec’d. Notes | | | 5.875 | | | | 03/01/27 | | | | 200 | | | | 207,917 | |
Tallgrass Energy Partners LP/Tallgrass Energy Finance Corp., | | | | | | | | | | | | | | | | |
Gtd. Notes, 144A | | | 6.000 | | | | 12/31/30 | | | | 75 | | | | 75,040 | |
Gtd. Notes, 144A | | | 7.500 | | | | 10/01/25 | | | | 150 | | | | 162,207 | |
Taylor Morrison Communities, Inc., | | | | | | | | | | | | | | | | |
Gtd. Notes, 144A | | | 5.750 | | | | 01/15/28 | | | | 150 | | | | 165,069 | |
Gtd. Notes, 144A | | | 6.625 | | | | 07/15/27 | | | | 320 | | | | 337,617 | |
Tenet Healthcare Corp., | | | | | | | | | | | | | | | | |
Gtd. Notes, 144A | | | 6.125 | | | | 10/01/28 | | | | 100 | | | | 105,020 | |
T-Mobile USA, Inc., | | | | | | | | | | | | | | | | |
Gtd. Notes | | | 2.625 | | | | 02/15/29 | | | | 125 | | | | 123,861 | |
TPC Group, Inc., | | | | | | | | | | | | | | | | |
Sr. Sec’d. Notes, 144A | | | 10.500 | | | | 08/01/24 | | | | 50 | | | | 45,305 | |
Sr. Sec’d. Notes, 144A | | | 10.875 | | | | 08/01/24 | | | | 12 | | | | 13,146 | |
Transocean, Inc., | | | | | | | | | | | | | | | | |
Gtd. Notes, 144A | | | 7.250 | | | | 11/01/25 | | | | 75 | | | | 61,842 | |
U.S. Bancorp, | | | | | | | | | | | | | | | | |
Jr. Sub. Notes | | | 3.700(ff) | | | | 01/15/27(oo) | | | | 200 | | | | 199,188 | |
United Airlines 2019-2 Class AA Pass-Through Trust, | | | | | | | | | | | | | | | | |
Pass-Through Certificates | | | 2.700 | | | | 11/01/33 | | | | 67 | | | | 67,724 | |
United Airlines, Inc., | | | | | | | | | | | | | | | | |
Sr. Sec’d. Notes, 144A | | | 4.375 | | | | 04/15/26 | | | | 65 | | | | 67,303 | |
Sr. Sec’d. Notes, 144A | | | 4.625 | | | | 04/15/29 | | | | 15 | | | | 15,469 | |
United Rentals North America, Inc., | | | | | | | | | | | | | | | | |
Gtd. Notes | | | 3.750 | | | | 01/15/32 | | | | 25 | | | | 24,951 | |
Gtd. Notes | | | 4.875 | | | | 01/15/28 | | | | 120 | | | | 126,720 | |
Vector Group Ltd., | | | | | | | | | | | | | | | | |
Sr. Sec’d. Notes, 144A | | | 5.750 | | | | 02/01/29 | | | | 125 | | | | 124,697 | |
Venture Global Calcasieu Pass LLC, | | | | | | | | | | | | | | | | |
Sr. Sec’d. Notes, 144A | | | 3.875 | | | | 08/15/29 | | | | 5 | | | | 5,093 | |
Sr. Sec’d. Notes, 144A | | | 4.125 | | | | 08/15/31 | | | | 5 | | | | 5,179 | |
See Notes to Financial Statements.
| | | | |
| PGIM Global Dynamic Bond Fund | | | 27 | |
Schedule of Investments (continued)
as of October 31, 2021
| | | | | | | | | | | | | | |
| | | | |
| Description | | Interest
Rate | | Maturity
Date | | | Principal
Amount
(000)# | | | Value | |
| | | | |
CORPORATE BONDS (Continued) | | | | | | | | | | | | | | |
| | | | |
United States (cont’d.) | | | | | | | | | | | | | | |
VICI Properties LP/VICI Note Co., Inc., | | | | | | | | | | | | | | |
Gtd. Notes, 144A | | 4.250% | | | 12/01/26 | | | | 75 | | | $ | 77,726 | |
Vistra Corp., | | | | | | | | | | | | | | |
Jr. Sub. Notes, 144A | | 8.000(ff) | | | 10/15/26 | (oo) | | | 100 | | | | 104,969 | |
Vistra Operations Co. LLC, | | | | | | | | | | | | | | |
Gtd. Notes, 144A | | 5.000 | | | 07/31/27 | | | | 180 | | | | 184,303 | |
| | | | | | | | | | | | | | |
| | | | |
| | | | | | | | | | | | | 16,511,175 | |
| | | | | | | | | | | | | | |
| |
TOTAL CORPORATE BONDS
(cost $36,269,341) | | | | 35,916,945 | |
| | | | | | | | | | | | | | |
| | | | |
RESIDENTIAL MORTGAGE-BACKED SECURITIES 6.4% | | | | | | | | | | | | | | |
| | | | |
Bermuda 3.6% | | | | | | | | | | | | | | |
Bellemeade Re Ltd., | | | | | | | | | | | | | | |
Series 2019-03A, Class M1B, 144A, 1 Month LIBOR + 1.600% (Cap N/A, Floor 1.600%) | | 1.689(c) | | | 07/25/29 | | | | 450 | | | | 451,132 | |
Series 2019-04A, Class M1B, 144A, 1 Month LIBOR + 2.000% (Cap N/A, Floor 2.000%) | | 2.089(c) | | | 10/25/29 | | | | 500 | | | | 500,311 | |
Home Re Ltd., | | | | | | | | | | | | | | |
Series 2021-01, Class M1C, 144A, 1 Month LIBOR + 2.300% (Cap N/A, Floor 0.000%) | | 2.389(c) | | | 07/25/33 | | | | 185 | | | | 183,927 | |
Series 2021-02, Class M1B, 144A, 30 Day Average SOFR + 1.600% (Cap N/A, Floor 0.000%) | | 1.649(c) | | | 01/25/34 | | | | 150 | | | | 149,626 | |
Series 2021-02, Class M1C, 144A, 30 Day Average SOFR + 2.800% (Cap N/A, Floor 0.000%) | | 2.849(c) | | | 01/25/34 | | | | 175 | | | | 175,226 | |
Oaktown Re VII Ltd., | | | | | | | | | | | | | | |
Series 2021-02, Class M1A, 144A, 30 Day Average SOFR + 1.600% (Cap N/A, Floor 1.600%) | | 1.650(c) | | | 04/25/34 | | | | 700 | | | | 700,001 | |
Series 2021-02, Class M1B, 144A, 30 Day Average SOFR + 2.900% (Cap N/A, Floor 2.900%) | | 2.950(c) | | | 04/25/34 | | | | 200 | | | | 200,000 | |
| | | | | | | | | | | | | | |
| | | | |
| | | | | | | | | | | | | 2,360,223 | |
| | | | |
Ireland 0.3% | | | | | | | | | | | | | | |
Retiro Mortgage Securities DAC, | | | | | | | | | | | | | | |
Series 01A, Class A1, 144A, 3 Month EURIBOR + 2.000% (Cap 5.000%, Floor 0.000%) | | 1.453(c) | | | 07/30/75 | | | | EUR 160 | | | | 183,401 | |
See Notes to Financial Statements.
| | | | | | | | | | | | | | |
| | | | |
| Description | | Interest
Rate | | Maturity
Date | | | Principal
Amount
(000)# | | | Value | |
| | | | |
RESIDENTIAL MORTGAGE-BACKED SECURITIES (Continued) | | | | | | | | | | | | | | |
| | | | |
United States 2.5% | | | | | | | | | | | | | | |
BVRT Financing Trust, | | | | | | | | | | | | | | |
Series 2021-04, Class F, 144A, SOFR + 2.000%^ | | 2.050%(c) | | | 09/12/26 | | | | 83 | | | $ | 83,200 | |
FHLMC Structured Agency Credit Risk REMIC Trust, | | | | | | | | | | | | | | |
Series 2020-DNA03, Class M2, 144A, 1 Month LIBOR + 3.000% (Cap N/A, Floor 0.000%) | | 3.089(c) | | | 06/25/50 | | | | 37 | | | | 37,182 | |
Series 2021-DNA05, Class B1, 144A, 30 Day Average SOFR + 3.050% (Cap N/A, Floor 0.000%) | | 3.099(c) | | | 01/25/34 | | | | 110 | | | | 111,237 | |
Series 2021-DNA05, Class M2, 144A, 30 Day Average SOFR + 1.650% (Cap N/A, Floor 0.000%) | | 1.699(c) | | | 01/25/34 | | | | 40 | | | | 40,227 | |
Series 2021-HQA01, Class B1, 144A, 30 Day Average SOFR + 3.000% (Cap N/A, Floor 0.000%) | | 3.049(c) | | | 08/25/33 | | | | 200 | | | | 201,250 | |
Series 2021-HQA01, Class M2, 144A, 30 Day Average SOFR + 2.250% (Cap N/A, Floor 0.000%) | | 2.299(c) | | | 08/25/33 | | | | 400 | | | | 404,512 | |
Series 2021-HQA02, Class B1, 144A, 30 Day Average SOFR + 3.150% (Cap N/A, Floor 0.000%) | | 3.199(c) | | | 12/25/33 | | | | 100 | | | | 101,064 | |
Series 2021-HQA03, Class B1, 144A, 30 Day Average SOFR + 3.350% (Cap N/A, Floor 0.000%) | | 3.399(c) | | | 09/25/41 | | | | 60 | | | | 59,426 | |
Series 2021-HQA03, Class M2, 144A, 30 Day Average SOFR + 2.100% (Cap N/A, Floor 0.000%) | | 2.149(c) | | | 09/25/41 | | | | 130 | | | | 130,000 | |
GCAT LLC, | | | | | | | | | | | | | | |
Series 2019-04, Class A1, 144A | | 3.228 | | | 11/26/49 | | | | 368 | | | | 369,476 | |
PMT Credit Risk Transfer Trust, | | | | | | | | | | | | | | |
Series 2020-02R, Class A, 144A, 1 Month LIBOR + 3.815% (Cap N/A, Floor 3.815%) | | 3.903(c) | | | 12/25/22 | | | | 88 | | | | 87,864 | |
| | | | | | | | | | | | | | |
| | | | |
| | | | | | | | | | | | | 1,625,438 | |
| | | | | | | | | | | | | | |
| | | | |
TOTAL RESIDENTIAL MORTGAGE-BACKED SECURITIES
(cost $4,164,352) | | | | | | | | | | | | | 4,169,062 | |
| | | | | | | | | | | | | | |
See Notes to Financial Statements.
| | | | |
| PGIM Global Dynamic Bond Fund | | | 29 | |
Schedule of Investments (continued)
as of October 31, 2021
| | | | | | | | | | | | | | |
| | | | |
| Description | | Interest
Rate | | Maturity
Date | | | Principal
Amount
(000)# | | | Value | |
| | | | |
SOVEREIGN BONDS 16.3% | | | | | | | | | | | | | | |
| | | | |
Brazil 4.5% | | | | | | | | | | | | | | |
Brazil Loan Trust 1, | | | | | | | | | | | | | | |
Gov’t. Gtd. Notes | | 5.477% | | | 07/24/23 | | | | 277 | | | $ | 285,953 | |
Brazil Minas SPE via State of Minas Gerais, | | | | | | | | | | | | | | |
Gov’t. Gtd. Notes | | 5.333 | | | 02/15/28 | | | | 2,485 | | | | 2,635,997 | |
| | | | | | | | | | | | | | |
| | | | |
| | | | | | | | | | | | | 2,921,950 | |
| | | | |
Greece 0.8% | | | | | | | | | | | | | | |
Hellenic Republic Government International Bond, | | | | | | | | | | | | | | |
Sr. Unsec’d. Notes | | 5.200 | | | 07/17/34 | | | EUR | 120 | | | | 196,359 | |
Sr. Unsec’d. Notes | | 6.140 | | | 04/14/28 | | | EUR | 200 | | | | 302,384 | |
| | | | | | | | | | | | | | |
| | | | |
| | | | | | | | | | | | | 498,743 | |
| | | | |
Hungary 0.3% | | | | | | | | | | | | | | |
Hungary Government International Bond, | | | | | | | | | | | | | | |
Sr. Unsec’d. Notes, 144A | | 2.125 | | | 09/22/31 | | | | 200 | | | | 195,269 | |
| | | | |
Italy 0.5% | | | | | | | | | | | | | | |
Region of Lazio, | | | | | | | | | | | | | | |
Sr. Unsec’d. Notes | | 3.088 | | | 03/31/43 | | | EUR | 268 | | | | 352,925 | |
| | | | |
Romania 0.8% | | | | | | | | | | | | | | |
Romanian Government International Bond, | | | | | | | | | | | | | | |
Sr. Unsec’d. Notes, EMTN | | 3.500 | | | 04/03/34 | | | EUR | 100 | | | | 123,587 | |
Sr. Unsec’d. Notes, EMTN | | 4.125 | | | 03/11/39 | | | EUR | 300 | | | | 379,741 | |
| | | | | | | | | | | | | | |
| | | | |
| | | | | | | | | | | | | 503,328 | |
| | | | |
Russia 1.4% | | | | | | | | | | | | | | |
Russian Foreign Bond - Eurobond, | | | | | | | | | | | | | | |
Sr. Unsec’d. Notes | | 1.125 | | | 11/20/27 | | | EUR | 100 | | | | 115,450 | |
Sr. Unsec’d. Notes | | 1.850 | | | 11/20/32 | | | EUR | 500 | | | | 575,944 | |
Sr. Unsec’d. Notes | | 2.650 | | | 05/27/36 | | | EUR | 200 | | | | 235,419 | |
| | | | | | | | | | | | | | |
| | | | |
| | | | | | | | | | | | | 926,813 | |
| | | | |
Saudi Arabia 0.2% | | | | | | | | | | | | | | |
Saudi Government International Bond, | | | | | | | | | | | | | | |
Sr. Unsec’d. Notes | | 2.000 | | | 07/09/39 | | | EUR | 100 | | | | 120,921 | |
See Notes to Financial Statements.
| | | | | | | | | | | | | | |
| | | | |
| Description | | Interest
Rate | | Maturity
Date | | | Principal Amount (000)# | | | Value | |
| | | | |
SOVEREIGN BONDS (Continued) | | | | | | | | | | | | | | |
| | | | |
Serbia 1.3% | | | | | | | | | | | | | | |
Serbia International Bond, | | | | | | | | | | | | | | |
Sr. Unsec’d. Notes | | 1.500% | | | 06/26/29 | | | EUR | 300 | | | $ | 340,000 | |
Sr. Unsec’d. Notes | | 1.650 | | | 03/03/33 | | | EUR | 500 | | | | 542,647 | |
| | | | | | | | | | | | | | |
| | | | |
| | | | | | | | | | | | | 882,647 | |
| | | | |
Spain 2.1% | | | | | | | | | | | | | | |
Autonomous Community of Catalonia, | | | | | | | | | | | | | | |
Sr. Unsec’d. Notes, EMTN | | 6.350 | | | 11/30/41 | | | EUR | 50 | | | | 98,531 | |
Spain Government Bond, | | | | | | | | | | | | | | |
Sr. Unsec’d. Notes, 144A | | 1.450 | | | 10/31/27(k) | | | EUR | 600 | | | | 749,702 | |
Sr. Unsec’d. Notes, 144A | | 1.450 | | | 04/30/29(k) | | | EUR | 405 | | | | 508,499 | |
| | | | | | | | | | | | | | |
| | | | |
| | | | | | | | | | | | | 1,356,732 | |
| | | | |
Turkey 0.9% | | | | | | | | | | | | | | |
Turkey Government International Bond, | | | | | | | | | | | | | | |
Sr. Unsec’d. Notes | | 4.625 | | | 03/31/25 | | | EUR | 500 | | | | 591,759 | |
| | | | |
Ukraine 3.5% | | | | | | | | | | | | | | |
Ukraine Government International Bond, | | | | | | | | | | | | | | |
Sr. Unsec’d. Notes | | 6.750 | | | 06/20/26 | | | EUR | 1,300 | | | | 1,617,314 | |
Sr. Unsec’d. Notes, 144A | | 4.375 | | | 01/27/30 | | | EUR | 600 | | | | 645,904 | |
| | | | | | | | | | | | | | |
| | | | |
| | | | | | | | | | | | | 2,263,218 | |
| | | | | | | | | | | | | | |
| | | | |
TOTAL SOVEREIGN BONDS
(cost $10,615,048) | | | | | | | | | | | | | 10,614,305 | |
| | | | | | | | | | | | | | |
| | | | |
U.S. TREASURY OBLIGATION(k) 0.4% | | | | | | | | | | | | | | |
U.S. Treasury Notes | | | | | | | | | | | | | | |
(cost $275,198) | | 1.375 | | | 01/31/25 | | | | 275 | | | | 279,791 | |
| | | | | | | | | | | | | | |
| | | | |
| | | | | | | | Shares | | | | |
| | | | |
COMMON STOCKS 1.5% | | | | | | | | | | | | | | |
| | | | |
United States | | | | | | | | | | | | | | |
Chesapeake Energy Corp. | | | | | | | | | 10,317 | | | | 657,606 | |
Chesapeake Energy Corp. Backstop Commitment | | | | | | | | | 59 | | | | 3,761 | |
Extraction Oil & Gas, Inc.* | | | | | | | | | 734 | | | | 48,906 | |
Ferrellgas Partners LP (Class B Stock) | | | | | | | | | 628 | | | | 161,710 | |
See Notes to Financial Statements.
| | | | |
| PGIM Global Dynamic Bond Fund | | | 31 | |
Schedule of Investments (continued)
as of October 31, 2021
| | | | | | | | | | | | | | |
| | | | |
| Description | | | | | | | Shares | | | Value | |
| | | | |
COMMON STOCKS (Continued) | | | | | | | | | | | | | | |
| | | | |
United States (cont’d.) | | | | | | | | | | | | | | |
GenOn Energy Holdings, Inc. (Class A Stock) | | | | | | | | | | | | | | |
(original cost $65,599; purchased 02/28/19)*^(f) | | | | | | | | | 610 | | | $ | 85,400 | |
Hexion Holdings Corp. (Class B Stock)* | | | | | | | | | 1,179 | | | | 27,117 | |
| | | | | | | | | | | | | | |
| | | | |
TOTAL COMMON STOCKS | | | | | | | | | | | | | | |
(cost $367,989) | | | | | | | | | | | | | 984,500 | |
| | | | | | | | | | | | | | |
| | | | |
PREFERRED STOCK 0.5% | | | | | | | | | | | | | | |
| | | | |
United States | | | | | | | | | | | | | | |
Ferrellgas Escrow LLC, 8.956%, Maturing 03/30/31^ | | | | | | | | | | | | | | |
(cost $291,000) | | | | | | | | | 300,000 | | | | 300,000 | |
| | | | | | | | | | | | | | |
| | | | |
WARRANTS* 0.0% | | | | | | | | | | | | | | |
| | | | |
United States | | | | | | | | | | | | | | |
TPC Group, Inc., expiring 08/01/24^ | | | | | | | | | | | | | | |
(cost $0) | | | | | | | | | 35,028 | | | | 164 | |
| | | | | | | | | | | | | | |
| | | | |
TOTAL LONG-TERM INVESTMENTS
(cost $62,454,533) | | | | | | | | | | | | | 62,877,252 | |
| | | | | | | | | | | | | | |
| | | | |
SHORT-TERM INVESTMENTS 2.5% | | | | | | | | | | | | | | |
| | | | |
AFFILIATED MUTUAL FUND 1.4% | | | | | | | | | | | | | | |
PGIM Core Ultra Short Bond Fund
(cost $916,981)(wa) | | | | | | | | | 916,981 | | | | 916,981 | |
| | | | | | | | | | | | | | |
| | | | |
OPTIONS PURCHASED*~ 1.1% | | | | | | | | | | | | | | |
(cost $1,958,479) | | | | | | | | | | | | | 700,869 | |
| | | | | | | | | | | | | | |
| | | | |
TOTAL SHORT-TERM INVESTMENTS | | | | | | | | | | | | | | |
(cost $2,875,460) | | | | | | | | | | | | | 1,617,850 | |
| | | | | | | | | | | | | | |
| | | | |
TOTAL INVESTMENTS, BEFORE OPTIONS WRITTEN 98.8% | | | | | | | | | | | | | | |
(cost $65,329,993) | | | | | | | | | | | | | 64,495,102 | |
| | | | | | | | | | | | | | |
| | | | |
OPTIONS WRITTEN*~ (0.9)% | | | | | | | | | | | | | | |
(premiums received $2,089,580) | | | | | | | | | | | | | (564,307 | ) |
| | | | | | | | | | | | | | |
| | | | |
TOTAL INVESTMENTS, NET OF OPTIONS WRITTEN 97.9% | | | | | | | | | | | | | | |
(cost $63,240,413) | | | | | | | | | | | | | 63,930,795 | |
Other assets in excess of liabilities(z) 2.1% | | | | | | | | | | | | | 1,348,101 | |
| | | | | | | | | | | | | | |
| | | | |
NET ASSETS 100.0% | | | | | | | | | | | | $ | 65,278,896 | |
| | | | | | | | | | | | | | |
See Notes to Financial Statements.
Below is a list of the abbreviation(s) used in the annual report:
AUD—Australian Dollar
BRL—Brazilian Real
CAD—Canadian Dollar
CHF—Swiss Franc
CLP—Chilean Peso
CNH—Chinese Renminbi
COP—Colombian Peso
DKK—Danish Krone
EUR—Euro
GBP—British Pound
HUF—Hungarian Forint
ILS—Israeli Shekel
INR—Indian Rupee
JPY—Japanese Yen
KRW—South Korean Won
MXN—Mexican Peso
NOK—Norwegian Krone
NZD—New Zealand Dollar
PLN—Polish Zloty
RUB—Russian Ruble
SAR—Saudi Arabian Riyal
SEK—Swedish Krona
SGD—Singapore Dollar
THB—Thai Baht
TWD—New Taiwanese Dollar
USD—US Dollar
ZAR—South African Rand
144A—Security was purchased pursuant to Rule 144A under the Securities Act of 1933 and, pursuant to the requirements of Rule 144A, may not be resold except to qualified institutional buyers.
A—Annual payment frequency for swaps
BBR—New Zealand Bank Bill Rate
BBSW—Australian Bank Bill Swap Reference Rate
BROIS—Brazil Overnight Index Swap
BUBOR—Budapest Interbank Offered Rate
CBOT—Chicago Board of Trade
CDOR—Canadian Dollar Offered Rate
CDX—Credit Derivative Index
CIBOR—Copenhagen Interbank Offered Rate
CLO—Collateralized Loan Obligation
CLOIS—Sinacofi Chile Interbank Rate Average
CME—Chicago Mercantile Exchange
COOIS—Colombia Overnight Interbank Reference Rate
CPI—Consumer Price Index
DIP—Debtor-In-Possession
DJIA—Dow Jones Industrial Average
EMTN—Euro Medium Term Note
ESTR—Euro Short-Term Rate
EURIBOR—Euro Interbank Offered Rate
FHLMC—Federal Home Loan Mortgage Corporation
IO—Interest Only (Principal amount represents notional)
See Notes to Financial Statements.
| | | | |
| PGIM Global Dynamic Bond Fund | | | 33 | |
Schedule of Investments (continued)
as of October 31, 2021
JIBAR—Johannesburg Interbank Agreed Rate
KWCDC—Korean Won Certificate of Deposit
LIBOR—London Interbank Offered Rate
LP—Limited Partnership
M—Monthly payment frequency for swaps
MosPRIME—Moscow Prime Offered Rate
MTN—Medium Term Note
NASDAQ—National Association of Securities Dealers Automated Quotations
NIBOR—Norwegian Interbank Offered Rate
NSA—Non-Seasonally Adjusted
OAT—Obligations Assimilables du Tresor
OTC—Over-the-counter
PIK—Payment-in-Kind
PJSC—Public Joint-Stock Company
Q—Quarterly payment frequency for swaps
S—Semiannual payment frequency for swaps
S&P—Standard & Poor’s
SAIBOR—Saudi Arabian Interbank Offered Rate
SOFR—Secured Overnight Financing Rate
STIBOR—Stockholm Interbank Offered Rate
STOXX—Stock Index of the Eurozone
T—Swap payment upon termination
TELBOR—Tel Aviv Interbank Offered Rate
THBFIX—Thai Baht Interest Rate Fixing
TOPIX—Tokyo Stock Price Index
USOIS—United States Overnight Index Swap
WIBOR—Warsaw Interbank Offered Rate
| * | Non-income producing security. |
| # | Principal or notional amount is shown in U.S. dollars unless otherwise stated. |
| ~ | See tables subsequent to the Schedule of Investments for options detail. |
| ^ | Indicates a Level 3 instrument. The aggregate value of Level 3 instruments is $471,484 and 0.7% of net assets. |
| (c) | Variable rate instrument. The interest rate shown reflects the rate in effect at October 31, 2021. |
| (cc) | Variable rate instrument. The rate shown is based on the latest available information as of October 31, 2021. Certain variable rate securities are not based on a published reference rate and spread but are determined by the issuer or agent and are based on current market conditions. These securities do not indicate a reference rate and spread in their description. |
| (d) | Represents issuer in default on interest payments and/or principal repayment. Non-income producing security. Such securities may be post-maturity. |
| (f) | Indicates a restricted security that is acquired in unregistered, private sales from the issuing company or from an affiliate of the issuer and is considered restricted as to disposition under federal securities law; the aggregate original cost of such securities is $65,599. The aggregate value of $85,400 is 0.1% of net assets. |
| (ff) | Variable rate security. Security may be issued at a fixed coupon rate, which converts to a variable rate at a specified date. Rate shown is the rate in effect as of period end. |
| (k) | Represents security, or a portion thereof, segregated as collateral for centrally cleared/exchange-traded derivatives. |
| (oo) | Perpetual security. Maturity date represents next call date. |
| (r) | Principal or notional amount is less than $500 par. |
| (s) | Represents zero coupon bond or principal only security. Rate represents yield to maturity at purchase date. |
| (wa) | PGIM Investments LLC, the manager of the Fund, also serves as manager of the PGIM Core Ultra Short Bond Fund and PGIM Institutional Money Market Fund, if applicable. |
| (z) | Includes net unrealized appreciation/(depreciation) and/or market value of the below holdings which are excluded from the Schedule of Investments: |
See Notes to Financial Statements.
Unfunded loan commitment outstanding at October 31, 2021:
| | | | | | | | | | |
Borrower | | Principal
Amount
(000)# | | Current
Value | | | Unrealized
Appreciation | | Unrealized
Depreciation |
Intelsat Jackson Holdings SA, DIP Term Loan, 3 Month LIBOR + 3.600%, 3.600%(c), Maturity Date 07/13/22 (cost $12,359) | | 13 | | $ | 12,588 | | | $228 | | $— |
| | | | | | | | | | |
Options Purchased:
Exchange Traded
| | | | | | | | | | | | | | | | | | |
Description | | Call/
Put | | Expiration
Date | | | Strike | | Contracts | | Notional
Amount
(000)# | | | Value | |
| NASDAQ 100 E-Mini Index | | Call | | | 12/17/21 | | | $15,100.00 | | 13 | | | — | (r) | | $ | 241,670 | |
| NASDAQ 100 E-Mini Index | | Call | | | 12/17/21 | | | $15,900.00 | | 13 | | | — | (r) | | | 93,990 | |
| NASDAQ 100 E-Mini Index | | Call | | | 12/17/21 | | | $16,800.00 | | 6 | | | — | (r) | | | 6,600 | |
| NASDAQ 100 E-Mini Index | | Call | | | 03/18/22 | | | $15,500.00 | | 6 | | | — | (r) | | | 119,490 | |
| NASDAQ 100 E-Mini Index | | Call | | | 03/18/22 | | | $15,700.00 | | 5 | | | — | (r) | | | 86,750 | |
| | | | | | | | | | | | | | | | | | |
| Total Exchange Traded (cost $354,427) | | | | | | | | | | | | | | | | $ | 548,500 | |
| | | | | | | | | | | | | | | | | | |
OTC Traded
| | | | | | | | | | | | | | | | | | | | | | |
Description | | Call/
Put | | Counterparty | | Expiration
Date | | | Strike | | | Contracts | | Notional
Amount
(000)# | | | Value | |
Currency Option EUR vs USD | | Call | | Deutsche Bank AG | | | 11/18/21 | | | | 1.21 | | | — | | EUR | 1,275 | | | $ | 12 | |
Currency Option EUR vs USD | | Call | | Bank of America, N.A. | | | 11/18/21 | | | | 1.31 | | | — | | EUR | 5,100 | | | | — | |
Currency Option USD vs BRL | | Call | | JPMorgan Chase Bank, N.A. | | | 11/29/21 | | | | 7.30 | | | — | | | 5,550 | | | | 173 | |
Currency Option USD vs INR | | Call | | Morgan Stanley & Co. International PLC | | | 11/18/21 | | | | 84.00 | | | — | | | 2,405 | | | | 8 | |
Currency Option USD vs MXN | | Call | | Goldman Sachs International | | | 02/23/22 | | | | 26.00 | | | — | | | 5,250 | | | | 4,347 | |
Currency Option USD vs MXN | | Call | | Barclays Bank PLC | | | 02/23/22 | | | | 31.50 | | | — | | | 10,500 | | | | 1,220 | |
Currency Option USD vs MXN | | Call | | Goldman Sachs International | | | 02/23/22 | | | | 36.00 | | | — | | | 3,800 | | | | 151 | |
Currency Option USD vs RUB | | Call | | JPMorgan Chase Bank, N.A. | | | 11/23/21 | | | | 98.00 | | | — | | | 5,700 | | | | 9 | |
Currency Option USD vs RUB | | Call | | Morgan Stanley & Co. International PLC | | | 04/27/22 | | | | 80.00 | | | — | | | 5,700 | | | | 59,870 | |
Currency Option AUD vs JPY | | Put | | Deutsche Bank AG | | | 11/05/21 | | | | 70.00 | | | — | | AUD | 7,800 | | | | — | |
Currency Option AUD vs JPY | | Put | | BNP Paribas S.A. | | | 01/26/22 | | | | 55.00 | | | — | | AUD | 21,600 | | | | 101 | |
Currency Option AUD vs JPY | | Put | | Deutsche Bank AG | | | 01/26/22 | | | | 63.00 | | | — | | AUD | 10,800 | | | | 326 | |
Currency Option AUD vs JPY | | Put | | BNP Paribas S.A. | | | 05/25/22 | | | | 80.00 | | | — | | AUD | 3,900 | | | | 35,470 | |
See Notes to Financial Statements.
| | | | |
| PGIM Global Dynamic Bond Fund | | | 35 | |
Schedule of Investments (continued)
as of October 31, 2021
Options Purchased (continued):
OTC Traded
| | | | | | | | | | | | | | | | | | | | | | |
Description | | Call/
Put | | Counterparty | | Expiration
Date | | Strike | | | Contracts | | | Notional
Amount
(000)# | | | Value | |
Currency Option AUD vs JPY | | Put | | Morgan Stanley & Co. International PLC | | 04/26/23 | | | 75.00 | | | | — | | | AUD | 2,600 | | | $ | 37,478 | |
Currency Option USD vs JPY | | Put | | JPMorgan Chase Bank, N.A. | | 11/10/21 | | | 95.00 | | | | — | | | | 4,000 | | | | — | |
Currency Option USD vs TWD | | Put | | Deutsche Bank AG | | 12/21/21 | | | 24.30 | | | | — | | | | 12,300 | | | | 82 | |
Currency Option USD vs TWD | | Put | | JPMorgan Chase Bank, N.A. | | 12/21/21 | | | 25.80 | | | | — | | | | 4,100 | | | | 230 | |
| | | | | | | | | | | | | | | | | | | | | | |
| Total OTC Traded (cost $1,591,452) | | | | | | | | | | | | | | | | $ | 139,477 | |
| | | | | | | | | | | | | | | | | | | | | | |
OTC Swaptions
| | | | | | | | | | | | | | | | | | | | | | | | | | |
Description | | Call/
Put | | Counterparty | | Expiration
Date | | Strike | | | Receive | | | Pay | | | Notional
Amount
(000)# | | | Value | |
2- Year Interest Rate Swap, 05/21/25 | | Call | | Deutsche Bank AG | | 05/17/23 | | | 2.05 | % | | | 2.05%(A) | | |
| 3 Month
SAIBOR(Q) |
| | SAR | 3,750 | | | $ | 2,967 | |
2- Year Interest Rate Swap, 05/21/25 | | Put | | Deutsche Bank AG | | 05/17/23 | | | 2.05 | % | |
| 3 Month
SAIBOR(Q) |
| | | 2.05%(A) | | | SAR | 3,750 | | | | 9,925 | |
| | | | | | | | | | | | | | | | | | | | | | | | | | |
| Total OTC Swaptions (cost $12,600) | | | | | | | | | | | | | | | | | | $ | 12,892 | |
| | | | | | | | | | | | | | | | | | | | | | | | | | |
| Total Options Purchased (cost $1,958,479) | | | | | | | | | | | | | | | | | | $ | 700,869 | |
| | | | | | | | | | | | | | | | | | | | | | | | | | |
Options Written:
Exchange Traded
| | | | | | | | | | | | | | | | | | | | |
Description | | Call/
Put | | Expiration
Date | | Strike | | | Contracts | | | Notional
Amount
(000)# | | | Value | |
NASDAQ 100 E-Mini Index | | Call | | 12/17/21 | | $ | 15,500.00 | | | | 20 | | | | — | (r) | | $ | (248,500 | ) |
NASDAQ 100 E-Mini Index | | Call | | 12/17/21 | | $ | 16,300.00 | | | | 12 | | | | — | (r) | | | (41,340 | ) |
NASDAQ 100 E-Mini Index | | Call | | 03/18/22 | | $ | 16,000.00 | | | | 6 | | | | — | (r) | | | (82,890 | ) |
NASDAQ 100 E-Mini Index | | Call | | 03/18/22 | | $ | 16,700.00 | | | | 5 | | | | — | (r) | | | (36,275 | ) |
NASDAQ 100 E-Mini Index | | Put | | 03/18/22 | | $ | 13,000.00 | | | | 11 | | | | — | (r) | | | (40,315 | ) |
NASDAQ 100 E-Mini Index | | Put | | 03/18/22 | | $ | 13,300.00 | | | | 6 | | | | — | (r) | | | (25,620 | ) |
| | | | | | | | | | | | | | | | | | | | |
Total Exchange Traded (premiums received $396,349) | | | | | | | | | | | $ | (474,940 | ) |
| | | | | | | | | | | | | | | | | | | | |
See Notes to Financial Statements.
Options Written (continued):
OTC Traded
| | | | | | | | | | | | | | | | | | | | | | | | |
Description | | Call/
Put | | Counterparty | | Expiration
Date | | | Strike | | | Contracts | | | Notional
Amount
(000)# | | | Value | |
|
| Currency Option EUR vs USD | | Call | | Bank of America, N.A. | | | 11/18/21 | | | | 1.21 | | | | — | | | EUR | 1,275 | | | $ | (12 | ) |
| Currency Option EUR vs USD | | Call | | Deutsche Bank AG | | | 11/18/21 | | | | 1.31 | | | | — | | | EUR | 5,100 | | | | — | |
| Currency Option USD vs INR | | Call | | JPMorgan Chase Bank, N.A. | | | 06/28/22 | | | | 83.00 | | | | — | | | | 2,405 | | | | (9,922 | ) |
| Currency Option USD vs MXN | | Call | | Barclays Bank PLC | | | 02/23/22 | | | | 26.00 | | | | — | | | | 5,250 | | | | (4,347 | ) |
| Currency Option USD vs MXN | | Call | | Goldman Sachs International | | | 02/23/22 | | | | 31.50 | | | | — | | | | 10,500 | | | | (1,220 | ) |
| Currency Option USD vs MXN | | Call | | Citibank, N.A. | | | 02/23/22 | | | | 36.00 | | | | — | | | | 3,800 | | | | (151 | ) |
| Currency Option USD vs RUB | | Call | | Morgan Stanley & Co. International PLC | | | 04/27/22 | | | | 89.00 | | | | — | | | | 11,400 | | | | (35,224 | ) |
| Currency Option AUD vs JPY | | Put | | Deutsche Bank AG | | | 01/26/22 | | | | 55.00 | | | | — | | | AUD | 21,600 | | | | (101 | ) |
| Currency Option AUD vs JPY | | Put | | BNP Paribas S.A. | | | 01/26/22 | | | | 63.00 | | | | — | | | AUD | 10,800 | | | | (326 | ) |
| Currency Option AUD vs JPY | | Put | | Morgan Stanley & Co. International PLC | | | 01/26/22 | | | | 74.00 | | | | — | | | AUD | 2,600 | | | | (1,317 | ) |
| Currency Option AUD vs JPY | | Put | | BNP Paribas S.A. | | | 05/25/22 | | | | 70.00 | | | | — | | | AUD | 11,700 | | | | (20,148 | ) |
| Currency Option USD vs TWD | | Put | | JPMorgan Chase Bank, N.A. | | | 12/21/21 | | | | 24.30 | | | | — | | | | 12,300 | | | | (82 | ) |
| Currency Option USD vs TWD | | Put | | Deutsche Bank AG | | | 12/21/21 | | | | 25.80 | | | | — | | | | 4,100 | | | | (230 | ) |
| | | | | | | | | | | | | | | | | | | | | | | | |
| Total OTC Traded (premiums received $1,678,231) | | | | | | | | | | | | | | | | | | $ | (73,080 | ) |
| | | | | | | | | | | | | | | | | | | | | | | | |
OTC Swaptions
| | | | | | | | | | | | | | | | | | | | | | | | |
Description | | Call/
Put | | Counterparty | | Expiration
Date | | Strike | | Receive | | | Pay | | | Notional
Amount
(000)# | | | Value | |
2- Year Interest
Rate Swap,
05/19/25 | | Call | | Deutsche Bank AG | | 05/17/23 | | 1.13% | | | 3 Month LIBOR(Q) | | | | 1.13%(S) | | | | 1,000 | | | $ | (4,679 | ) |
2- Year Interest
Rate Swap,
05/19/25 | | Put | | Deutsche Bank AG | | 05/17/23 | | 1.13% | | | 1.13%(S) | | | | 3 Month LIBOR(Q) | | | | 1,000 | | | | (11,608 | ) |
| | | | | | | | | | | | | | | | | | | | | | | | |
| Total OTC Swaptions (premiums received $15,000) | | | | | | | | | | | | | | | | $ | (16,287 | ) |
| | | | | | | | | | | | | | | | | | | | | | | | |
| Total Options Written (premiums received $2,089,580) | | | | | | | | | | | | | | | | $ | (564,307 | ) |
| | | | | | | | | | | | | | | | | | | | | | | | |
See Notes to Financial Statements.
| | | | |
| PGIM Global Dynamic Bond Fund | | | 37 | |
Schedule of Investments (continued)
as of October 31, 2021
Futures contracts outstanding at October 31, 2021:
| | | | | | | | | | | | | | | | | |
Number
of
Contracts | | Type | | Expiration
Date | | Current
Notional
Amount | | Value /
Unrealized
Appreciation
(Depreciation) |
Long Positions: | | | | | | | | | | | | | | | |
| 2 | | 10 Year Australian Treasury Bonds | | | | Dec. 2021 | | | | $ | 202,884 | | | | $ | (13,745 | ) |
| 2 | | 10 Year Canadian Government Bonds | | | | Dec. 2021 | | | | | 227,780 | | | | | (9,489 | ) |
| 9 | | 10 Year U.S. Ultra Treasury Notes | | | | Dec. 2021 | | | | | 1,305,281 | | | | | (13,378 | ) |
| 39 | | 20 Year U.S. Treasury Bonds | | | | Dec. 2021 | | | | | 6,272,906 | | | | | (39,711 | ) |
| 15 | | 30 Year U.S. Ultra Treasury Bonds | | | | Dec. 2021 | | | | | 2,946,094 | | | | | (4,895 | ) |
| 3 | | Euro STOXX 50 Index | | | | Dec. 2021 | | | | | 146,939 | | | | | 916 | |
| 2 | | Euro-OAT | | | | Dec. 2021 | | | | | 379,168 | | | | | (11,319 | ) |
| 4 | | Russell 2000 E-Mini Index | | | | Dec. 2021 | | | | | 459,060 | | | | | 7,192 | |
| 5 | | S&P 500 E-Mini Index | | | | Dec. 2021 | | | | | 1,149,250 | | | | | 46,591 | |
| | | | | | | | | | | | | | | | | |
| | | | | | | | | | | | | | | | (37,838 | ) |
| | | | | | | | | | | | | | | | | |
Short Positions: | | | | | | | | | | | | | | | |
| 15 | | 30 Day Federal Funds | | | | Jan. 2022 | | | | | 6,245,500 | | | | | (23 | ) |
| 5 | | 30 Day Federal Funds | | | | Nov. 2021 | | | | | 2,081,937 | | | | | (216 | ) |
| 4 | | 30 Day Federal Funds | | | | Jul. 2022 | | | | | 1,662,216 | | | | | 5,578 | |
| 20 | | 3 Month CME SOFR | | | | Jun. 2022 | | | | | 4,994,000 | | | | | 6,463 | |
| 1 | | 3 Month CME SOFR | | | | Sep. 2022 | | | | | 249,300 | | | | | 723 | |
| 212 | | 2 Year U.S. Treasury Notes | | | | Dec. 2021 | | | | | 46,481,000 | | | | | 192,514 | |
| 83 | | 5 Year Euro-Bobl | | | | Dec. 2021 | | | | | 12,834,004 | | | | | 176,344 | |
| 40 | | 5 Year U.S. Treasury Notes | | | | Dec. 2021 | | | | | 4,870,000 | | | | | 22,908 | |
| 5 | | 10 Year Euro-Bund | | | | Dec. 2021 | | | | | 971,734 | | | | | 12,110 | |
| 18 | | 10 Year U.S. Treasury Notes | | | | Dec. 2021 | | | | | 2,352,656 | | | | | 14,617 | |
| 5 | | 10 Year U.K. Gilt | | | | Dec. 2021 | | | | | 854,796 | | | | | 16,240 | |
| 4 | | DJIA MINI E-CBOT DEC21 | | | | Dec. 2021 | | | | | 714,080 | | | | | (12,680 | ) |
| 163 | | Euro Schatz Index | | | | Dec. 2021 | | | | | 21,096,399 | | | | | 63,038 | |
| 2 | | TOPIX Index | | | | Dec. 2021 | | | | | 349,638 | | | | | 1,486 | |
| | | | | | | | | | | | | | | | | |
| | | | | | | | | | | | | | | | 499,102 | |
| | | | | | | | | | | | | | | | | |
| | | | | | | | | | | | | | | $ | 461,264 | |
| | | | | | | | | | | | | | | | | |
Forward foreign currency exchange contracts outstanding at October 31, 2021:
| | | | | | | | | | | | | | | | | | | | | | |
Purchase
Contracts | | Counterparty | | Notional
Amount
(000) | | | Value at
Settlement
Date | | | Current
Value | | | Unrealized
Appreciation | | | Unrealized
Depreciation | |
OTC Forward Foreign Currency Exchange Contracts: | | | | | | | | | | | | | |
Australian Dollar, | | | | | | | | | | | | | | | | | | | | | | |
Expiring 01/19/22 | | Bank of America, N.A. | | AUD | 78 | | | $ | 58,388 | | | $ | 58,464 | | | $ | 76 | | | $ | — | |
Expiring 01/28/22 | | Citibank, N.A. | | AUD | 212 | | | | 139,227 | | | | 159,516 | | | | 20,289 | | | | — | |
Expiring 01/28/22 | | Morgan Stanley & Co. | | | | | | | | | | | | | | | | | | | | |
| | International PLC | | AUD | 895 | | | | 675,584 | | | | 673,276 | | | | — | | | | (2,308 | ) |
Expiring 01/28/22 | | Morgan Stanley & Co. | | | | | | | | | | | | | | | | | | | | |
| | International PLC | | AUD | 683 | | | | 498,284 | | | | 514,069 | | | | 15,785 | | | | — | |
See Notes to Financial Statements.
Forward foreign currency exchange contracts outstanding at October 31, 2021 (continued):
| | | | | | | | | | | | | | | | | | | | | | | | | | |
Purchase
Contracts | | Counterparty | | Notional
Amount
(000) | | | Value at
Settlement
Date | | | Current
Value | | | Unrealized
Appreciation | | | Unrealized
Depreciation | |
OTC Forward Foreign Currency Exchange Contracts (cont’d.): | |
Australian Dollar (cont’d.), | | | | | | | | | | | | | | | | | | | | | | | | |
Expiring 10/31/23 | | JPMorgan Chase Bank, N.A. | | | AUD | | | | 197 | | | $ | 136,791 | | | $ | 146,502 | | | $ | 9,711 | | | $ | — | |
Brazilian Real, | | | | | | | | | | | | | | | | | | | | | | | | | | |
Expiring 12/02/21 | | Citibank, N.A. | | | BRL | | | | 2,555 | | | | 454,983 | | | | 449,617 | | | | — | | | | (5,366 | ) |
Expiring 01/28/22 | | BNP Paribas S.A. | | | BRL | | | | 1,833 | | | | 323,146 | | | | 318,140 | | | | — | | | | (5,006 | ) |
Expiring 01/28/22 | | BNP Paribas S.A. | | | BRL | | | | 394 | | | | 71,000 | | | | 68,383 | | | | — | | | | (2,617 | ) |
Expiring 01/28/22 | | Citibank, N.A. | | | BRL | | | | 1,303 | | | | 246,000 | | | | 226,193 | | | | — | | | | (19,807 | ) |
Expiring 01/28/22 | | Deutsche Bank AG | | | BRL | | | | 3,289 | | | | 562,000 | | | | 570,892 | | | | 8,892 | | | | — | |
Expiring 01/28/22 | | JPMorgan Chase Bank, N.A. | | | BRL | | | | 2,025 | | | | 362,368 | | | | 351,558 | | | | — | | | | (10,810 | ) |
Expiring 01/28/22 | | Morgan Stanley & Co. International PLC | | | BRL | | | | 3,199 | | | | 587,605 | | | | 555,236 | | | | — | | | | (32,369 | ) |
Expiring 04/28/23 | | Morgan Stanley & Co. International PLC | | | BRL | | | | 1,833 | | | | 278,449 | | | | 276,611 | | | | — | | | | (1,838 | ) |
British Pound, | | | | | | | | | | | | | | | | | | | | | | | | | | |
Expiring 01/28/22 | | Morgan Stanley & Co. International PLC | | | GBP | | | | 109 | | | | 150,476 | | | | 149,207 | | | | — | | | | (1,269 | ) |
Canadian Dollar, | | | | | | | | | | | | | | | | | | | | | | | | | | |
Expiring 05/31/22 | | Morgan Stanley & Co. International PLC | | | CAD | | | | 465 | | | | 363,763 | | | | 375,020 | | | | 11,257 | | | | — | |
Chilean Peso, | | | | | | | | | | | | | | | | | | | | | | | | | | |
Expiring 12/15/21 | | HSBC Bank PLC | | | CLP | | | | 57,812 | | | | 73,934 | | | | 70,690 | | | | — | | | | (3,244 | ) |
Expiring 06/30/22 | | Barclays Bank PLC | | | CLP | | | | 405,392 | | | | 477,915 | | | | 483,548 | | | | 5,633 | | | | — | |
Chinese Renminbi, | | | | | | | | | | | | | | | | | | | | | | | | | | |
Expiring 11/18/21 | | Goldman Sachs International | | | CNH | | | | 372 | | | | 58,088 | | | | 58,026 | | | | — | | | | (62 | ) |
Expiring 01/28/22 | | JPMorgan Chase Bank, N.A. | | | CNH | | | | 626 | | | | 94,686 | | | | 97,008 | | | | 2,322 | | | | — | |
Expiring 01/28/22 | | The Toronto-Dominion Bank | | | CNH | | | | 1,424 | | | | 218,421 | | | | 220,566 | | | | 2,145 | | | | — | |
Colombian Peso, | | | | | | | | | | | | | | | | | | | | | | | | | | |
Expiring 12/15/21 | | JPMorgan Chase Bank, N.A. | | | COP | | | | 221,071 | | | | 58,513 | | | | 58,518 | | | | 5 | | | | — | |
Euro, | | | | | | | | | | | | | | | | | | | | | | | | | | |
Expiring 11/22/21 | | Bank of America, N.A. | | | EUR | | | | 185 | | | | 218,097 | | | | 213,957 | | | | — | | | | (4,140 | ) |
Expiring 11/22/21 | | Deutsche Bank AG | | | EUR | | | | 81 | | | | 96,500 | | | | 93,678 | | | | — | | | | (2,822 | ) |
Expiring 03/31/22 | | Bank of America, N.A. | | | EUR | | | | 538 | | | | 636,486 | | | | 624,191 | | | | — | | | | (12,295 | ) |
Expiring 03/31/22 | | Bank of America, N.A. | | | EUR | | | | 177 | | | | 215,152 | | | | 205,356 | | | | — | | | | (9,796 | ) |
Expiring 10/31/23 | | HSBC Bank PLC | | | EUR | | | | 62 | | | | 75,000 | | | | 73,429 | | | | — | | | | (1,571 | ) |
Hungarian Forint, | | | | | | | | | | | | | | | | | | | | | | | | | | |
Expiring 01/19/22 | | Barclays Bank PLC | | | HUF | | | | 15,028 | | | | 48,042 | | | | 48,116 | | | | 74 | | | | — | |
See Notes to Financial Statements.
| | | | |
| PGIM Global Dynamic Bond Fund | | | 39 | |
Schedule of Investments (continued)
as of October 31, 2021
Forward foreign currency exchange contracts outstanding at October 31, 2021 (continued):
| | | | | | | | | | | | | | | | | | | | | | | | | | |
Purchase
Contracts | | Counterparty | | Notional
Amount
(000) | | | Value at
Settlement
Date | | | Current
Value | | | Unrealized
Appreciation | | | Unrealized
Depreciation | |
OTC Forward Foreign Currency Exchange Contracts (cont’d.): | |
Hungarian Forint (cont’d.), | | | | | | | | | | | | | | | | | | | | | | | | |
Expiring 01/19/22 | | Goldman Sachs International | | | HUF | | | | 20,761 | | | $ | 65,759 | | | $ | 66,470 | | | $ | 711 | | | $ | — | |
Indian Rupee, | | | | | | | | | | | | | | | | | | | | | | | | | | |
Expiring 02/25/22 | | JPMorgan Chase Bank, N.A. | | | INR | | | | 40,745 | | | | 533,000 | | | | 535,337 | | | | 2,337 | | | | — | |
Expiring 02/25/22 | | Morgan Stanley & Co. International PLC | | | INR | | | | 5,159 | | | | 68,000 | | | | 67,781 | | | | — | | | | (219 | ) |
Expiring 02/25/22 | | Standard Chartered Bank | | | INR | | | | 66,596 | | | | 890,118 | | | | 874,979 | | | | — | | | | (15,139 | ) |
Israeli Shekel, | | | | | | | | | | | | | | | | | | | | | | | | | | |
Expiring 12/15/21 | | Bank of America, N.A. | | | ILS | | | | 104 | | | | 32,895 | | | | 32,817 | | | | — | | | | (78 | ) |
Japanese Yen, | | | | | | | | | | | | | | | | | | | | | | | | | | |
Expiring 01/19/22 | | Bank of America, N.A. | | | JPY | | | | 4,585 | | | | 40,250 | | | | 40,266 | | | | 16 | | | | — | |
Expiring 01/28/22 | | BNP Paribas S.A. | | | JPY | | | | 6,832 | | | | 61,000 | | | | 60,007 | | | | — | | | | (993 | ) |
Expiring 01/28/22 | | Citibank, N.A. | | | JPY | | | | 89,317 | | | | 872,064 | | | | 784,536 | | | | — | | | | (87,528 | ) |
Expiring 01/28/22 | | Deutsche Bank AG | | | JPY | | | | 70,780 | | | | 672,000 | | | | 621,717 | | | | — | | | | (50,283 | ) |
Expiring 01/28/22 | | Deutsche Bank AG | | | JPY | | | | 26,689 | | | | 256,000 | | | | 234,429 | | | | — | | | | (21,571 | ) |
Expiring 01/28/22 | | Deutsche Bank AG | | | JPY | | | | 23,951 | | | | 211,000 | | | | 210,379 | | | | — | | | | (621 | ) |
Expiring 01/28/22 | | Deutsche Bank AG | | | JPY | | | | 13,543 | | | | 125,000 | | | | 118,954 | | | | — | | | | (6,046 | ) |
Expiring 01/28/22 | | Morgan Stanley & Co. International PLC | | | JPY | | | | 13,465 | | | | 119,000 | | | | 118,269 | | | | — | | | | (731 | ) |
Expiring 01/28/22 | | Morgan Stanley & Co. International PLC | | | JPY | | | | 8,236 | | | | 74,000 | | | | 72,345 | | | | — | | | | (1,655 | ) |
Expiring 05/31/22 | | Citibank, N.A. | | | JPY | | | | 15,780 | | | | 144,787 | | | | 138,826 | | | | — | | | | (5,961 | ) |
Expiring 05/31/22 | | Deutsche Bank AG | | | JPY | | | | 112,665 | | | | 1,043,000 | | | | 991,169 | | | | — | | | | (51,831 | ) |
Expiring 10/31/23 | | Bank of America, N.A. | | | JPY | | | | 105,610 | | | | 1,058,000 | | | | 945,769 | | | | — | | | | (112,231 | ) |
Expiring 10/31/23 | | Barclays Bank PLC | | | JPY | | | | 21,923 | | | | 230,000 | | | | 196,329 | | | | — | | | | (33,671 | ) |
Expiring 10/31/23 | | Barclays Bank PLC | | | JPY | | | | 13,554 | | | | 140,000 | | | | 121,381 | | | | — | | | | (18,619 | ) |
Expiring 10/31/23 | | Deutsche Bank AG | | | JPY | | | | 22,335 | | | | 234,000 | | | | 200,020 | | | | — | | | | (33,980 | ) |
Expiring 10/31/23 | | Goldman Sachs International | | | JPY | | | | 50,469 | | | | 518,000 | | | | 451,964 | | | | — | | | | (66,036 | ) |
Expiring 10/31/23 | | Morgan Stanley & Co. International PLC | | | JPY | | | | 78,211 | | | | 755,589 | | | | 700,403 | | | | — | | | | (55,186 | ) |
Mexican Peso, | | | | | | | | | | | | | | | | | | | | | | | | | | |
Expiring 12/15/21 | | HSBC Bank PLC | | | MXN | | | | 796 | | | | 38,324 | | | | 38,369 | | | | 45 | | | | — | |
Expiring 02/25/22 | | Bank of America, N.A. | | | MXN | | | | 12,262 | | | | 594,514 | | | | 584,306 | | | | — | | | | (10,208 | ) |
Expiring 02/25/22 | | Bank of America, N.A. | | | MXN | | | | 6,969 | | | | 295,361 | | | | 332,057 | | | | 36,696 | | | | — | |
Expiring 02/25/22 | | Goldman Sachs International | | | MXN | | | | 1,521 | | | | 72,000 | | | | 72,469 | | | | 469 | | | | — | |
Expiring 02/25/22 | | Goldman Sachs International | | | MXN | | | | 1,442 | | | | 70,000 | | | | 68,694 | | | | — | | | | (1,306 | ) |
Expiring 04/28/23 | | JPMorgan Chase Bank, N.A. | | | MXN | | | | 4,649 | | | | 192,329 | | | | 204,860 | | | | 12,531 | | | | — | |
See Notes to Financial Statements.
Forward foreign currency exchange contracts outstanding at October 31, 2021 (continued):
| | | | | | | | | | | | | | | | | | | | | | | | | | |
Purchase
Contracts | | Counterparty | | Notional
Amount (000) | | | Value at
Settlement
Date | | | Current
Value | | | Unrealized
Appreciation | | | Unrealized
Depreciation | |
|
| OTC Forward Foreign Currency Exchange Contracts (cont’d.): | |
Mexican Peso (cont’d.), | | | | | | | | | | | | | | | | | | | | | | | | |
Expiring 04/28/23 | | Morgan Stanley & Co. International PLC | | | MXN | | | | 14,804 | | | $ | 624,000 | | | $ | 652,351 | | | $ | 28,351 | | | $ | — | |
New Taiwanese Dollar, | | | | | | | | | | | | | | | | | | | | | | | | |
Expiring 12/23/21 | | Deutsche Bank AG | | | TWD | | | | 11,337 | | | | 407,000 | | | | 408,546 | | | | 1,546 | | | | — | |
New Zealand Dollar, | | | | | | | | | | | | | | | | | | | | | | | | | | |
Expiring 01/19/22 | | Bank of America, N.A. | | | NZD | | | | 89 | | | | 63,463 | | | | 63,537 | | | | 74 | | | | — | |
Norwegian Krone, | | | | | | | | | | | | | | | | | | | | | | | | | | |
Expiring 01/19/22 | | Citibank, N.A. | | | NOK | | | | 750 | | | | 87,299 | | | | 88,690 | | | | 1,391 | | | | — | |
Russian Ruble, | | | | | | | | | | | | | | | | | | | | | | | | | | |
Expiring 11/22/21 | | Barclays Bank PLC | | | RUB | | | | 6,290 | | | | 83,000 | | | | 88,280 | | | | 5,280 | | | | — | |
Expiring 11/22/21 | | Barclays Bank PLC | | | RUB | | | | 5,563 | | | | 74,000 | | | | 78,069 | | | | 4,069 | | | | — | |
Expiring 11/22/21 | | Barclays Bank PLC | | | RUB | | | | 5,562 | | | | 74,000 | | | | 78,055 | | | | 4,055 | | | | — | |
Expiring 11/22/21 | | Barclays Bank PLC | | | RUB | | | | 4,810 | | | | 65,000 | | | | 67,502 | | | | 2,502 | | | | — | |
Expiring 11/22/21 | | Barclays Bank PLC | | | RUB | | | | 4,654 | | | | 62,000 | | | | 65,318 | | | | 3,318 | | | | — | |
Expiring 11/22/21 | | Deutsche Bank AG | | | RUB | | | | 29,985 | | | | 387,000 | | | | 420,826 | | | | 33,826 | | | | — | |
Expiring 11/22/21 | | Deutsche Bank AG | | | RUB | | | | 13,388 | | | | 170,000 | | | | 187,889 | | | | 17,889 | | | | — | |
Expiring 11/22/21 | | Morgan Stanley & Co. International PLC | | | RUB | | | | 34,486 | | | | 431,000 | | | | 484,006 | | | | 53,006 | | | | — | |
Expiring 11/22/21 | | Morgan Stanley & Co. International PLC | | | RUB | | | | 5,348 | | | | 72,000 | | | | 75,060 | | | | 3,060 | | | | — | |
Expiring 11/22/21 | | Morgan Stanley & Co. International PLC | | | RUB | | | | 4,088 | | | | 55,000 | | | | 57,377 | | | | 2,377 | | | | — | |
Expiring 12/15/21 | | Barclays Bank PLC | | | RUB | | | | 830 | | | | 11,145 | | | | 11,580 | | | | 435 | | | | — | |
Expiring 12/15/21 | | Citibank, N.A. | | | RUB | | | | 3,202 | | | | 44,785 | | | | 44,672 | | | | — | | | | (113 | ) |
Expiring 12/15/21 | | Morgan Stanley & Co. International PLC | | | RUB | | | | 830 | | | | 11,197 | | | | 11,581 | | | | 384 | | | | — | |
South African Rand, | | | | | | | | | | | | | | | | | | | | | | | | | | |
Expiring 12/15/21 | | Barclays Bank PLC | | | ZAR | | | | 821 | | | | 54,053 | | | | 53,446 | | | | — | | | | (607 | ) |
Expiring 12/15/21 | | Citibank, N.A. | | | ZAR | | | | 828 | | | | 54,192 | | | | 53,887 | | | | — | | | | (305 | ) |
Expiring 12/23/21 | | Goldman Sachs International | | | ZAR | | | | 10,613 | | | | 562,000 | | | | 689,990 | | | | 127,990 | | | | — | |
Expiring 05/31/22 | | Morgan Stanley & Co. International PLC | | | ZAR | | | | 2,260 | | | | 147,377 | | | | 143,898 | | | | — | | | | (3,479 | ) |
Expiring 05/31/22 | | Morgan Stanley & Co. International PLC | | | ZAR | | | | 2,088 | | | | 134,319 | | | | 132,905 | | | | — | | | | (1,414 | ) |
South Korean Won, | | | | | | | | | | | | | | | | | | | | | | | | | | |
Expiring 12/15/21 | | Morgan Stanley & Co. International PLC | | | KRW | | | | 34,560 | | | | 29,510 | | | | 29,390 | | | | — | | | | (120 | ) |
Expiring 06/30/22 | | JPMorgan Chase Bank, N.A. | | | KRW | | | | 1,001,042 | | | | 841,000 | | | | 847,933 | | | | 6,933 | | | | — | |
See Notes to Financial Statements.
| | | | |
| PGIM Global Dynamic Bond Fund | | | 41 | |
Schedule of Investments (continued)
as of October 31, 2021
Forward foreign currency exchange contracts outstanding at October 31, 2021 (continued):
| | | | | | | | | | | | | | | | | | | | | | | | | | |
Purchase Contracts | | Counterparty | | Notional
Amount
(000) | | | Value at
Settlement
Date | | | Current
Value | | | Unrealized
Appreciation | | | Unrealized
Depreciation | |
|
| OTC Forward Foreign Currency Exchange Contracts (cont’d.): | |
Swiss Franc, | | | | | | | | | | | | | | | | | | | | | | | | |
Expiring 01/19/22 | | Bank of America, N.A. | | | CHF | | | | 55 | | | $ | 59,865 | | | $ | 60,506 | | | $ | 641 | | | $ | — | |
| | | | | | | | | | | | | | | | | | | | | | | | | | |
| | | | | | | | | | | | $ | 21,189,093 | | | $ | 20,919,963 | | | | 426,121 | | | | (695,251 | ) |
| | | | | | | | | | | | | | | | | | | | | | | | | | |
| | | | | | |
Sale Contracts | | Counterparty | | Notional
Amount
(000) | | | Value at
Settlement
Date | | | Current
Value | | | Unrealized
Appreciation | | | Unrealized
Depreciation | |
|
| OTC Forward Foreign Currency Exchange Contracts: | |
Australian Dollar, | | | | | | | | | | | | | | | | | | | | | | | | |
Expiring 01/19/22 | | Morgan Stanley & Co. | | | | | | | | | | | | | | | | | | | | | | | | |
| | International PLC | | | AUD | | | | 243 | | | $ | 179,446 | | | $ | 183,216 | | | $ | — | | | $ | (3,770 | ) |
Expiring 01/28/22 | | Morgan Stanley & Co. | | | | | | | | | | | | | | | | | | | | | | | | |
| | International PLC | | | AUD | | | | 142 | | | | 105,000 | | | | 107,181 | | | | — | | | | (2,181 | ) |
Expiring 01/28/22 | | Morgan Stanley & Co. | | | | | | | | | | | | | | | | | | | | | | | | |
| | International PLC | | | AUD | | | | 105 | | | | 79,000 | | | | 79,104 | | | | — | | | | (104 | ) |
Expiring 05/31/22 | | Morgan Stanley & Co. | | | | | | | | | | | | | | | | | | | | | | | | |
| | International PLC | | | AUD | | | | 212 | | | | 160,068 | | | | 159,391 | | | | 677 | | | | — | |
Brazilian Real, | | | | | | | | | | | | | | | | | | | | | | | | |
Expiring 01/28/22 | | Barclays Bank PLC | | | BRL | | | | 399 | | | | 72,000 | | | | 69,340 | | | | 2,660 | | | | — | |
Expiring 01/28/22 | | Citibank, N.A. | | | BRL | | | | 3,063 | | | | 546,000 | | | | 531,677 | | | | 14,323 | | | | — | |
Expiring 01/28/22 | | Citibank, N.A. | | | BRL | | | | 452 | | | | 78,667 | | | | 78,457 | | | | 210 | | | | — | |
Expiring 01/28/22 | | Citibank, N.A. | | | BRL | | | | 361 | | | | 68,657 | | | | 62,665 | | | | 5,992 | | | | — | |
Expiring 01/28/22 | | Citibank, N.A. | | | BRL | | | | 335 | | | | 60,000 | | | | 58,183 | | | | 1,817 | | | | — | |
Expiring 01/28/22 | | Deutsche Bank AG | | | BRL | | | | 6,392 | | | | 1,390,141 | | | | 1,109,536 | | | | 280,605 | | | | — | |
Expiring 01/28/22 | | Morgan Stanley & Co. | | | | | | | | | | | | | | | | | | | | | | | | |
| | International PLC | | | BRL | | | | 598 | | | | 106,000 | | | | 103,760 | | | | 2,240 | | | | — | |
Expiring 01/28/22 | | Morgan Stanley & Co. | | | | | | | | | | | | | | | | | | | | | | | | |
| | International PLC | | | BRL | | | | 442 | | | | 81,289 | | | | 76,783 | | | | 4,506 | | | | — | |
Expiring 04/28/23 | | BNP Paribas S.A. | | | BRL | | | | 1,833 | | | | 284,342 | | | | 276,612 | | | | 7,730 | | | | — | |
British Pound, | | | | | | | | | | | | | | | | | | | | | | | | |
Expiring 01/19/22 | | Bank of America, N.A. | | | GBP | | | | 59 | | | | 79,500 | | | | 80,100 | | | | — | | | | (600 | ) |
Expiring 01/19/22 | | Barclays Bank PLC | | | GBP | | | | 4,548 | | | | 6,183,363 | | | | 6,225,851 | | | | — | | | | (42,488 | ) |
Expiring 01/19/22 | | Morgan Stanley & Co. | | | | | | | | | | | | | | | | | | | | | | | | |
| | International PLC | | | GBP | | | | 100 | | | | 137,381 | | | | 136,256 | | | | 1,125 | | | | — | |
Expiring 01/19/22 | | Standard Chartered Bank | | | GBP | | | | 134 | | | | 182,970 | | | | 183,489 | | | | — | | | | (519 | ) |
Expiring 01/28/22 | | JPMorgan Chase Bank, N.A. | | | GBP | | | | 109 | | | | 142,502 | | | | 149,206 | | | | — | | | | (6,704 | ) |
Canadian Dollar, | | | | | | | | | | | | | | | | | | | | | | | | |
Expiring 05/31/22 | | Morgan Stanley & Co. | | | | | | | | | | | | | | | | | | | | | | | | |
| | International PLC | | | CAD | | | | 465 | | | | 384,000 | | | | 375,020 | | | | 8,980 | | | | — | |
Chilean Peso, | | | | | | | | | | | | | | | | | | | | | | | | |
Expiring 06/30/22 | | Barclays Bank PLC | | | CLP | | | | 405,392 | | | | 530,000 | | | | 483,549 | | | | 46,451 | | | | — | |
See Notes to Financial Statements.
Forward foreign currency exchange contracts outstanding at October 31, 2021 (continued):
| | | | | | | | | | | | | | | | | | | | | | | | | | |
Sale
Contracts | | Counterparty | | Notional
Amount
(000) | | | Value at
Settlement
Date | | | Current
Value | | | Unrealized
Appreciation | | | Unrealized
Depreciation | |
| OTC Forward Foreign Currency Exchange Contracts (cont’d.): | | | | | |
Chinese Renminbi, | | | | | | | | | | | | | | | | | | | | | | | | |
Expiring 11/18/21 | | Barclays Bank PLC | | | CNH | | | | 240 | | | $ | 36,899 | | | $ | 37,332 | | | $ | — | | | $ | (433 | ) |
Expiring 11/18/21 | | HSBC Bank PLC | | | CNH | | | | 461 | | | | 70,550 | | | | 71,783 | | | | — | | | | (1,233 | ) |
Expiring 01/28/22 | | Deutsche Bank AG | | | CNH | | | | 1,424 | | | | 218,866 | | | | 220,467 | | | | — | | | | (1,601 | ) |
Expiring 01/28/22 | | Deutsche Bank AG | | | CNH | | | | 626 | | | | 91,000 | | | | 97,008 | | | | — | | | | (6,008 | ) |
Danish Krone, | | | | | | | | | | | | | | | | | | | | | | | | |
Expiring 01/19/22 | | JPMorgan Chase Bank, N.A. DKK | | | | | | | 438 | | | | 68,340 | | | | 68,283 | | | | 57 | | | | — | |
Euro, | | | | | | | | | | | | | | | | | | | | | | | | |
Expiring 11/22/21 | | Citibank, N.A. | | | EUR | | | | 104 | | | | 123,440 | | | | 119,860 | | | | 3,580 | | | | — | |
Expiring 11/22/21 | | Morgan Stanley & Co. | | | | | | | | | | | | | | | | | | | | | | | | |
| | International PLC | | | EUR | | | | 162 | | | | 193,684 | | | | 187,776 | | | | 5,908 | | | | — | |
Expiring 01/19/22 | | Barclays Bank PLC | | | EUR | | | | 197 | | | | 229,223 | | | | 228,292 | | | | 931 | | | | — | |
Expiring 01/19/22 | | BNP Paribas S.A. | | | EUR | | | | 38 | | | | 43,937 | | | | 43,897 | | | | 40 | | | | — | |
Expiring 01/19/22 | | Goldman Sachs | | | | | | | | | | | | | | | | | | | | | | | | |
| | International | | | EUR | | | | 4,319 | | | | 5,000,784 | | | | 5,003,559 | | | | — | | | | (2,775 | ) |
Expiring 01/19/22 | | HSBC Bank PLC | | | EUR | | | | 4,832 | | | | 5,595,027 | | | | 5,597,315 | | | | — | | | | (2,288 | ) |
Expiring 01/19/22 | | Morgan Stanley & Co. | | | | | | | | | | | | | | | | | | | | | | | | |
| | International PLC | | | EUR | | | | 187 | | | | 217,865 | | | | 216,918 | | | | 947 | | | | — | |
Expiring 01/19/22 | | The Toronto-Dominion Bank | | | EUR | | | | 256 | | | | 297,903 | | | | 296,011 | | | | 1,892 | | | | — | |
Expiring 01/19/22 | | UBS AG | | | EUR | | | | 4,780 | | | | 5,538,602 | | | | 5,537,190 | | | | 1,412 | | | | — | |
Expiring 01/19/22 | | UBS AG | | | EUR | | | | 2,892 | | | | 3,350,498 | | | | 3,349,840 | | | | 658 | | | | — | |
Expiring 03/31/22 | | Bank of America, N.A. | | | EUR | | | | 731 | | | | 875,789 | | | | 848,111 | | | | 27,678 | | | | — | |
Indian Rupee, | | | | | | | | | | | | | | | | | | | | | | | | |
Expiring 02/25/22 | | Citibank, N.A. | | | INR | | | | 4,168 | | | | 55,000 | | | | 54,763 | | | | 237 | | | | — | |
Expiring 02/25/22 | | JPMorgan Chase Bank, N.A. | | | INR | | | | 36,373 | | | | 470,000 | | | | 477,896 | | | | — | | | | (7,896 | ) |
Expiring 02/25/22 | | JPMorgan Chase Bank, N.A. | | | INR | | | | 23,037 | | | | 300,000 | | | | 302,675 | | | | — | | | | (2,675 | ) |
Expiring 02/25/22 | | Morgan Stanley & Co. | | | | | | | | | | | | | | | | | | | | | | | | |
| | International PLC | | | INR | | | | 29,859 | | | | 381,000 | | | | 392,304 | | | | — | | | | (11,304 | ) |
Expiring 02/25/22 | | Morgan Stanley & Co. | | | | | | | | | | | | | | | | | | | | | | | | |
| | International PLC | | | INR | | | | 4,351 | | | | 57,000 | | | | 57,163 | | | | — | | | | (163 | ) |
Expiring 06/30/22 | | JPMorgan Chase Bank, N.A. | | | INR | | | | 37,840 | | | | 487,000 | | | | 488,847 | | | | — | | | | (1,847 | ) |
Israeli Shekel, | | | | | | | | | | | | | | | | | | | | | | | | |
Expiring 12/15/21 | | BNP Paribas S.A. | | | ILS | | | | 210 | | | | 65,225 | | | | 66,331 | | | | — | | | | (1,106 | ) |
Japanese Yen, | | | | | | | | | | | | | | | | | | | | | | | | |
Expiring 01/19/22 | | HSBC Bank PLC | | | JPY | | | | 3,183 | | | | 28,035 | | | | 27,958 | | | | 77 | | | | — | |
Expiring 01/28/22 | | Citibank, N.A. | | | JPY | | | | 103,688 | | | | 975,339 | | | | 910,772 | | | | 64,567 | | | | — | |
Expiring 01/28/22 | | Citibank, N.A. | | | JPY | | | | 95,532 | | | | 914,576 | | | | 839,129 | | | | 75,447 | | | | — | |
Expiring 01/28/22 | | Citibank, N.A. | | | JPY | | | | 70,199 | | | | 678,691 | | | | 616,611 | | | | 62,080 | | | | — | |
Expiring 01/28/22 | | Citibank, N.A. | | | JPY | | | | 15,857 | | | | 145,235 | | | | 139,282 | | | | 5,953 | | | | — | |
Expiring 01/28/22 | | Deutsche Bank AG | | | JPY | | | | 101,907 | | | | 932,506 | | | | 895,123 | | | | 37,383 | | | | — | |
Expiring 05/31/22 | | Citibank, N.A. | | | JPY | | | | 50,233 | | | | 486,589 | | | | 441,925 | | | | 44,664 | | | | — | |
Expiring 05/31/22 | | Deutsche Bank AG | | | JPY | | | | 59,511 | | | | 566,000 | | | | 523,551 | | | | 42,449 | | | | — | |
Expiring 10/31/23 | | Bank of America, N.A. | | | JPY | | | | 165,745 | | | | 1,624,000 | | | | 1,484,305 | | | | 139,695 | | | | — | |
See Notes to Financial Statements.
| | | | |
| PGIM Global Dynamic Bond Fund | | | 43 | |
Schedule of Investments (continued)
as of October 31, 2021
Forward foreign currency exchange contracts outstanding at October 31, 2021 (continued):
| | | | | | | | | | | | | | | | | | | | | | | | | | |
Sale
Contracts | | Counterparty | | Notional
Amount
(000) | | | Value at
Settlement
Date | | | Current
Value | | | Unrealized
Appreciation | | | Unrealized
Depreciation | |
| OTC Forward Foreign Currency Exchange Contracts (cont’d.): | | | | | |
Japanese Yen (cont’d.), | | | | | | | | | | | | | | | | | | | | | | | | |
Expiring 10/31/23 | | Bank of America, N.A. | | | JPY | | | | 107,140 | | | $ | 1,062,000 | | | $ | 959,473 | | | $ | 102,527 | | | $ | — | |
Expiring 10/31/23 | | Citibank, N.A. | | | JPY | | | | 27,641 | | | | 286,831 | | | | 247,530 | | | | 39,301 | | | | — | |
Expiring 10/31/23 | | Citibank, N.A. | | | JPY | | | | 5,701 | | | | 54,601 | | | | 51,053 | | | | 3,548 | | | | — | |
Mexican Peso, | | | | | | | | | | | | | | | | | | | | | | | | | | |
Expiring 02/25/22 | | Barclays Bank PLC | | | MXN | | | | 6,929 | | | | 293,000 | | | | 330,194 | | | | — | | | | (37,194 | ) |
Expiring 02/25/22 | | Deutsche Bank AG | | | MXN | | | | 2,984 | | | | 139,000 | | | | 142,189 | | | | — | | | | (3,189 | ) |
Expiring 02/25/22 | | Goldman Sachs | | | | | | | | | | | | | | | | | | | | | | | | |
| | International | | | MXN | | | | 1,984 | | | | 80,000 | | | | 94,516 | | | | — | | | | (14,516 | ) |
Expiring 02/25/22 | | Morgan Stanley & Co. | | | | | | | | | | | | | | | | | | | | | | | | |
| | International PLC | | | MXN | | | | 10,296 | | | | 499,553 | | | | 490,627 | | | | 8,926 | | | | — | |
Expiring 04/28/23 | | Morgan Stanley & Co. | | | | | | | | | | | | | | | | | | | | | | | | |
| | International PLC | | | MXN | | | | 19,453 | | | | 844,701 | | | | 857,210 | | | | — | | | | (12,509 | ) |
New Taiwanese Dollar, | | | | | | | | | | | | | | | | | | | | | | | | | | |
Expiring 12/23/21 | | Citibank, N.A. | | | TWD | | | | 3,198 | | | | 116,804 | | | | 115,253 | | | | 1,551 | | | | — | |
Expiring 12/23/21 | | JPMorgan Chase Bank, N.A. | | | TWD | | | | 8,139 | | | | 309,000 | | | | 293,293 | | | | 15,707 | | | | — | |
New Zealand Dollar, | | | | | | | | | | | | | | | | | | | | | | | | | | |
Expiring 01/19/22 | | HSBC Bank PLC | | | NZD | | | | 90 | | | | 62,118 | | | | 64,071 | | | | — | | | | (1,953 | ) |
Russian Ruble, | | | | | | | | | | | | | | | | | | | | | | | | | | |
Expiring 11/22/21 | | Barclays Bank PLC | | | RUB | | | | 4,431 | | | | 63,000 | | | | 62,186 | | | | 814 | | | | — | |
Expiring 11/22/21 | | Deutsche Bank AG | | | RUB | | | | 53,363 | | | | 704,000 | | | | 748,935 | | | | — | | | | (44,935 | ) |
Expiring 11/22/21 | | Deutsche Bank AG | | | RUB | | | | 17,241 | | | | 220,000 | | | | 241,977 | | | | — | | | | (21,977 | ) |
Expiring 11/22/21 | | Deutsche Bank AG | | | RUB | | | | 2,801 | | | | 37,000 | | | | 39,310 | | | | — | | | | (2,310 | ) |
Expiring 11/22/21 | | Morgan Stanley & Co. | | | | | | | | | | | | | | | | | | | | | | | | |
| | International PLC | | | RUB | | | | 6,429 | | | | 89,000 | | | | 90,230 | | | | — | | | | (1,230 | ) |
Singapore Dollar, | | | | | | | | | | | | | | | | | | | | | | | | | | |
Expiring 12/15/21 | | Goldman Sachs | | | | | | | | | | | | | | | | | | | | | | | | |
| | International | | | SGD | | | | 58 | | | | 42,856 | | | | 42,711 | | | | 145 | | | | — | |
South African Rand, | | | | | | | | | | | | | | | | | | | | | | | | | | |
Expiring 12/15/21 | | Barclays Bank PLC | | | ZAR | | | | 1,323 | | | | 90,602 | | | | 86,102 | | | | 4,500 | | | | — | |
Expiring 12/15/21 | | Citibank, N.A. | | | ZAR | | | | 804 | | | | 55,625 | | | | 52,339 | | | | 3,286 | | | | — | |
Expiring 12/15/21 | | HSBC Bank PLC | | | ZAR | | | | 1,448 | | | | 100,400 | | | | 94,268 | | | | 6,132 | | | | — | |
Expiring 12/23/21 | | Barclays Bank PLC | | | ZAR | | | | 6,463 | | | | 348,622 | | | | 420,148 | | | | — | | | | (71,526 | ) |
Expiring 12/23/21 | | Goldman Sachs | | | | | | | | | | | | | | | | | | | | | | | | |
| | International | | | ZAR | | | | 1,126 | | | | 71,000 | | | | 73,170 | | | | — | | | | (2,170 | ) |
Expiring 12/23/21 | | Morgan Stanley & Co. | | | | | | | | | | | | | | | | | | | | | | | | |
| | International PLC | | | ZAR | | | | 3,025 | | | | 197,778 | | | | 196,671 | | | | 1,107 | | | | — | |
Expiring 05/31/22 | | JPMorgan Chase Bank, N.A. | | | ZAR | | | | 2,260 | | | | 145,000 | | | | 143,898 | | | | 1,102 | | | | — | |
Expiring 05/31/22 | | JPMorgan Chase Bank, N.A. | | | ZAR | | | | 2,088 | | | | 124,000 | | | | 132,905 | | | | — | | | | (8,905 | ) |
South Korean Won, | | | | | | | | | | | | | | | | | | | | | | | | | | |
Expiring 06/30/22 | | Deutsche Bank AG | | | KRW | | | | 449,028 | | | | 380,745 | | | | 380,349 | | | | 396 | | | | — | |
Expiring 06/30/22 | | JPMorgan Chase Bank, N.A. | | | KRW | | | | 552,015 | | | | 487,000 | | | | 467,584 | | | | 19,416 | | | | — | |
See Notes to Financial Statements.
Forward foreign currency exchange contracts outstanding at October 31, 2021 (continued):
| | | | | | | | | | | | | | | | | | | | | | |
Sale
Contracts | | Counterparty | | Notional
Amount
(000) | | | Value at
Settlement
Date | | | Current
Value | | | Unrealized
Appreciation | | | Unrealized
Depreciation | |
OTC Forward Foreign Currency Exchange Contracts (cont’d.): | |
Swedish Krona, | | | | | | | | | | | | | | | | | | | | |
Expiring 01/19/22 | | Morgan Stanley & Co. | | | | | | | | | | | | | | | | | | | | |
| | International PLC | | SEK | 578 | | | $ | 65,941 | | | $ | 67,372 | | | $ | — | | | $ | (1,431 | ) |
Swiss Franc, | | | | | | | | | | | | | | | | | | | | | | |
Expiring 01/19/22 | | Barclays Bank PLC | | CHF | 132 | | | | 143,316 | | | | 144,931 | | | | — | | | | (1,615 | ) |
| | | | | | | | | | | | | | | | | | | | | | |
| | | | | | | | $ | 48,082,422 | | | $ | 47,302,148 | | | | 1,101,429 | | | | (321,155 | ) |
| | | | | | | | | | | | | | | | | | | | | | |
| | | | | | | | | | | | | | | | $ | 1,527,550 | | | $ | (1,016,406 | ) |
| | | | | | | | | | | | | | | | | | | | | | |
Cross currency exchange contracts outstanding at October 31, 2021:
| | | | | | | | | | | | | | | | | | | | |
Settlement | | Type | | Notional
Amount
(000) | | | In Exchange
For (000) | | | Unrealized
Appreciation | | | Unrealized
Depreciation | | | Counterparty |
OTC Cross Currency Exchange Contracts: |
01/28/22 | | Buy | | JPY | 14,371 | | | AUD | 212 | | | $ | — | | | $ | (33,280 | ) | | Deutsche Bank AG |
01/28/22 | | Buy | | JPY | 24,302 | | | AUD | 325 | | | | — | | | | (31,080 | ) | | Deutsche Bank AG |
| | | | | | | | | | | | | | | | | | | | Morgan Stanley & Co. |
01/28/22 | | Buy | | JPY | 32,286 | | | AUD | 400 | | | | — | | | | (17,376 | ) | | International PLC |
01/28/22 | | Buy | | JPY | 45,977 | | | AUD | 587 | | | | — | | | | (37,828 | ) | | BNP Paribas S.A. |
05/31/22 | | Buy | | AUD | 823 | | | JPY | 62,754 | | | | 66,692 | | | | — | | | Deutsche Bank AG |
| | | | | | | | | | | | | | | | | | | | Goldman Sachs |
05/31/22 | | Buy | | JPY | 44,053 | | | AUD | 611 | | | | — | | | | (71,820 | ) | | International |
| | | | | | | | | | | | | | | | | | | | Morgan Stanley & Co. |
04/28/23 | | Buy | | AUD | 853 | | | JPY | 68,288 | | | | 30,068 | | | | — | | | International PLC |
10/31/23 | | Buy | | AUD | 367 | | | JPY | 24,589 | | | | 52,721 | | | | — | | | Deutsche Bank AG |
| | | | | | | | | | | | | | | | | | | | Goldman Sachs |
10/31/23 | | Buy | | JPY | 9,277 | | | AUD | 133 | | | | — | | | | (15,831 | ) | | International |
| | | | | | | | | | | | | | | | | | | | Morgan Stanley & Co. |
10/31/23 | | Buy | | JPY | 29,437 | | | AUD | 431 | | | | — | | | | (56,897 | ) | | International PLC |
| | | | | | | | | | | | | | | | | | | | |
| | | | | | | | | | | | $ | 149,481 | | | $ | (264,112 | ) | | |
| | | | | | | | | | | | | | | | | | | | |
Credit default swap agreements outstanding at October 31, 2021:
| | | | | | | | | | | | | | | | | | | | |
Reference
Entity/
Obligation | | Termination
Date | | Fixed
Rate | | Notional
Amount
(000)#(3) | | | | | Fair
Value | | | Upfront
Premiums
Paid
(Received) | | Unrealized
Appreciation
(Depreciation) | | Counterparty |
OTC Credit Default Swap Agreement on corporate and/or sovereign issues - Buy Protection(1): |
Republic of France | | 12/20/26 | | 0.250%(Q) | | | 115 | | | | | | $(229) | | | $(233) | | $4 | | Barclays Bank PLC |
| | | | | | | | | | | | | | | | | | | | |
See Notes to Financial Statements.
| | | | |
| PGIM Global Dynamic Bond Fund | | | 45 | |
Schedule of Investments (continued)
as of October 31, 2021
Credit default swap agreements outstanding at October 31, 2021 (continued):
| | | | | | | | | | | | | | | | | | | | | | | | |
Reference
Entity/
Obligation | | Termination
Date | | Fixed
Rate | | Notional
Amount
(000)#(3) | | | Implied
Credit
Spread at
October 31,
2021(4) | | Fair
Value | | | Upfront
Premiums
Paid
(Received) | | | Unrealized
Appreciation
(Depreciation) | | | Counterparty |
OTC Credit Default Swap Agreements on corporate and/or sovereign issues - Sell Protection(2): |
Boeing Co. | | 12/20/21 | | 1.000%(Q) | | | 85 | | | 0.331% | | $ | 181 | | | $ | 52 | | | $ | 129 | | | Goldman Sachs
International |
Devon Energy Corp. | | 12/20/21 | | 1.000%(Q) | | | 200 | | | 0.333% | | | 426 | | | | 207 | | | | 219 | | | Goldman Sachs
International |
EQT Corp. | | 06/20/22 | | 5.000%(Q) | | | 110 | | | 1.068% | | | 3,437 | | | | 2,528 | | | | 909 | | | Credit Suisse
International |
Generalitat de Cataluna | | 12/20/22 | | 1.000%(Q) | | | 230 | | | * | | | 1,681 | | | | (7,494 | ) | | | 9,175 | | | Citibank, N.A. |
Goldman Sachs Group, Inc. | | 12/20/21 | | 1.000%(Q) | | | 310 | | | 0.243% | | | 701 | | | | 342 | | | | 359 | | | Barclays Bank
PLC |
Hellenic Republic | | 12/20/24 | | 1.000%(Q) | | | 1,650 | | | 0.558% | | | 24,720 | | | | (54,704 | ) | | | 79,424 | | | Citibank, N.A.
Barclays Bank |
Hellenic Republic | | 12/20/27 | | 1.000%(Q) | | | 290 | | | 1.027% | | | (116 | ) | | | 1,171 | | | | (1,287 | ) | | PLC |
Hellenic Republic | | 06/20/29 | | 1.000%(Q) | | | 250 | | | 1.189% | | | (3,041 | ) | | | (26,953 | ) | | | 23,912 | | | Citibank, N.A. |
JPMorgan Chase & Co. | | 12/20/21 | | 1.000%(Q) | | | 210 | | | 0.206% | | | 486 | | | | 246 | | | | 240 | | | Barclays Bank
PLC |
Kingdom of Spain | | 06/20/30 | | 1.000%(Q) | | | 800 | | | 0.535% | | | 31,249 | | | | (2,590 | ) | | | 33,839 | | | Credit Suisse
International |
Kingdom of Spain | | 12/20/30 | | 1.000%(Q) | | | 1,000 | | | 0.555% | | | 39,317 | | | | 24,909 | | | | 14,408 | | | JPMorgan Chase
Bank, N.A. |
Republic of Chile | | 12/20/21 | | 1.000%(Q) | | | 70 | | | 0.236% | | | 159 | | | | 82 | | | | 77 | | | Citibank, N.A. |
Republic of France | | 12/20/26 | | 0.250%(Q) | | | 115 | | | 0.217% | | | 228 | | | | 906 | | | | (678 | ) | | Barclays Bank
PLC |
Republic of Indonesia | | 06/20/25 | | 1.000%(Q) | | | 600 | | | 0.563% | | | 10,159 | | | | (20,137 | ) | | | 30,296 | | | Morgan Stanley &
Co.
International
PLC |
Republic of Italy | | 12/20/25 | | 1.000%(Q) | | | 750 | | | 0.652% | | | 11,507 | | | | (11,816 | ) | | | 23,323 | | | JPMorgan Chase
Bank, N.A. |
Republic of Italy | | 12/20/29 | | 1.000%(Q) | | | 1,000 | | | 1.143% | | | (9,562 | ) | | | (32,121 | ) | | | 22,559 | | | JPMorgan Chase
Bank, N.A. |
Republic of Kazakhstan | | 06/20/23 | | 1.000%(Q) | | | 230 | | | 0.241% | | | 3,162 | | | | — | | | | 3,162 | | | Citibank, N.A. |
Republic of Panama | | 12/20/26 | | 1.000%(Q) | | | 350 | | | 0.933% | | | 1,581 | | | | 1,035 | | | | 546 | | | Citibank, N.A. |
Republic of | | | | | | | | | | | | | | | | | | | | | | | | JPMorgan Chase |
Portugal | | 12/20/30 | | 1.000%(Q) | | | 1,000 | | | 0.536% | | | 41,007 | | | | 31,431 | | | | 9,576 | | | Bank, N.A. |
Republic of | | | | | | | | | | | | | | | | | | | | | | | | |
Serbia | | 12/20/21 | | 1.000%(Q) | | | 90 | | | 0.110% | | | 220 | | | | 105 | | | | 115 | | | BNP Paribas S.A. |
Republic of South Africa | | 12/20/23 | | 1.000%(Q) | | | 250 | | | 1.048% | | | 33 | | | | (5,746 | ) | | | 5,779 | | | Bank of America,
N.A. |
See Notes to Financial Statements.
Credit default swap agreements outstanding at October 31, 2021 (continued):
| | | | | | | | | | | | | | | | | | | | | | | | | | | | | | |
Reference
Entity/
Obligation | | Termination
Date | | | Fixed Rate | | | Notional
Amount
(000)#(3) | | | Implied
Credit
Spread at
October 31,
2021(4) | | | Fair Value | | | Upfront
Premiums
Paid
(Received) | | | Unrealized
Appreciation
(Depreciation) | | | Counterparty |
OTC Credit Default Swap Agreements on corporate and/or sovereign issues - Sell Protection(2)(cont’d.): |
Republic of Ukraine | | | 12/20/23 | | | | 5.000%(Q) | | | | 200 | | | | 3.212 | % | | $ | 8,578 | | | $ | 6,112 | | | $ | 2,466 | | | Deutsche Bank AG |
Republic of Ukraine | | | 12/20/24 | | | | 5.000%(Q) | | | | 400 | | | | 3.622 | % | | | 18,599 | | | | 19,899 | | | | (1,300 | ) | | HSBC Bank PLC |
Republic of Ukraine | | | 12/20/25 | | | | 5.000%(Q) | | | | 220 | | | | 3.952 | % | | | 9,955 | | | | (3,798 | ) | | | 13,753 | | | Barclays Bank PLC |
Russian Federation | | | 06/20/23 | | | | 1.000%(Q) | | | | 350 | | | | 0.330 | % | | | 4,288 | | | | (1,843 | ) | | | 6,131 | | | Morgan Stanley & Co. International PLC |
Russian Federation | | | 06/20/23 | | | | 1.000%(Q) | | | | 50 | | | | 0.330 | % | | | 613 | | | | (314 | ) | | | 927 | | | Morgan Stanley & Co. International PLC |
Russian Federation | | | 12/20/26 | | | | 1.000%(Q) | | | | 350 | | | | 0.830 | % | | | 3,393 | | | | (17,674 | ) | | | 21,067 | | | Citibank, N.A. |
State of Illinois | | | 12/20/22 | | | | 1.000%(Q) | | | | 210 | | | | 0.403 | % | | | 1,683 | | | | (1,893 | ) | | | 3,576 | | | Citibank, N.A. |
State of Illinois | | | 12/20/24 | | | | 1.000%(Q) | | | | 200 | | | | 0.700 | % | | | 2,071 | | | | (6,229 | ) | | | 8,300 | | | Goldman Sachs International |
United Mexican States | | | 06/20/31 | | | | 1.000%(Q) | | | | 320 | | | | 1.660 | % | | | (17,748 | ) | | | (15,164 | ) | | | (2,584 | ) | | Citibank, N.A. |
Verizon Communications, Inc. | | | 06/20/26 | | | | 1.000%(Q) | | | | 170 | | | | 0.488 | % | | | 4,169 | | | | 3,306 | | | | 863 | | | Goldman Sachs International |
| | | | | | | | | | | | | | | | | | | | | | | | | | | | | | |
| | | | | | | | | | | | | | | | | | $ | 193,136 | | | $ | (116,145 | ) | | $ | 309,281 | | | |
| | | | | | | | | | | | | | | | | | | | | | | | | | | | | | |
| | | | | | | | | | | | | | | | | | | | | | | | | | | | |
Reference
Entity/
Obligation | | Termination
Date | | | Fixed Rate | | | Notional
Amount
(000)#(3) | | | Implied Credit
Spread at
October 31,
2021(4) | | | Value at
Trade Date | | | Value at
October 31,
2021 | | | Unrealized
Appreciation
(Depreciation) | |
Centrally Cleared Credit Default Swap Agreements on credit indices - Sell Protection(2): | | | | | |
CDX.NA.HY.37.V1 | | | 12/20/26 | | | | 5.000%(Q) | | | | 2,500 | | | | 3.047% | | | $ | 225,819 | | | $ | 238,013 | | | $ | 12,194 | |
iTraxx.XO.36.V1 | | | 12/20/26 | | | | 5.000%(Q) | | | | EUR 2,000 | | | | 2.616% | | | | 264,123 | | | | 272,378 | | | | 8,255 | |
| | | | | | | | | | | | | | | | | | | | | | | | | | | | |
| | | | | | | | | | | | | | | | | | $ | 489,942 | | | $ | 510,391 | | | $ | 20,449 | |
| | | | | | | | | | | | | | | | | | | | | | | | | | | | |
See Notes to Financial Statements.
| | | | |
| PGIM Global Dynamic Bond Fund | | | 47 | |
Schedule of Investments (continued)
as of October 31, 2021
Credit default swap agreements outstanding at October 31, 2021 (continued):
| | | | | | | | | | | | | | | | | | | | | | | | | | | | | | | | | | | | | | | | |
Reference
Entity/
Obligation | | Termination
Date | | Fixed
Rate | | Notional
Amount
(000)#(3) | | Implied
Credit
Spread at
October 31,
2021(4) | | Fair
Value | | Upfront
Premiums
Paid
(Received)
(Depreciation) | | Unrealized
Appreciation | | Counterparty |
OTC Credit Default Swap Agreement on credit indices - Sell Protection(2): | |
CDX.NA.HY.BB.36.V1 | | | | 06/20/26 | | | | | 5.000%(Q) | | | | | 100 | | | | | 1.775 | % | | | $ | 14,648 | | | | $ | 14,270 | | | | $ | 378 | | | | | Citibank, N.A. | |
| | | | | | | | | | | | | | | | | | | | | | | | | | | | | | | | | | | | | | | | |
The Fund entered into credit default swaps (“CDS”) to provide a measure of protection against defaults or to take an active long or short position with respect to the likelihood of a particular issuer’s default or the reference entity’s credit soundness. CDS contracts generally trade based on a spread which represents the cost a protection buyer has to pay the protection seller. The protection buyer is said to be short the credit as the value of the contract rises the more the credit deteriorates. The value of the CDS contract increases for the protection buyer if the spread increases.
| (1) | If the Fund is a buyer of protection, it pays the fixed rate. When a credit event occurs, as defined under the terms of that particular swap agreement, the Fund will either (i) receive from the seller of protection an amount equal to the notional amount of the swap and make delivery of the referenced obligation or underlying securities comprising the referenced index or (ii) receive a net settlement amount in the form of cash or securities equal to the notional amount of the swap less the recovery value of the referenced obligation or underlying securities comprising the referenced index. |
| (2) | If the Fund is a seller of protection, it receives the fixed rate. When a credit event occurs, as defined under the terms of that particular swap agreement, the Fund will either (i) pay to the buyer of protection an amount equal to the notional amount of the swap and take delivery of the referenced obligation or underlying securities comprising the referenced index or (ii) pay a net settlement amount in the form of cash or securities equal to the notional amount of the swap less the recovery value of the referenced obligation or underlying securities comprising the referenced index. |
| (3) | Notional amount represents the maximum potential amount the Fund could be required to pay as a seller of credit protection or receive as a buyer of credit protection if a credit event occurs as defined under the terms of that particular swap agreement. |
| (4) | Implied credit spreads, represented in absolute terms, utilized in determining the fair value of credit default swap agreements where the Fund is the seller of protection as of the reporting date serve as an indicator of the current status of the payment/ performance risk and represent the likelihood of risk of default for the credit derivative. The implied credit spread of a particular referenced entity reflects the cost of buying/selling protection and may include up-front payments required to be made to enter into the agreement. Wider credit spreads represent a deterioration of the referenced entity’s credit soundness and a greater likelihood of risk of default or other credit event occurring as defined under the terms of the agreement. |
| * | When an implied credit spread is not available, reference the fair value of credit default swap agreements on credit indices and asset-backed securities. Where the Fund is the seller of protection, it serves as an indicator of the current status of the payment/performance risk and represents the likelihood of an expected liability (or profit) for the credit |
See Notes to Financial Statements.
| | derivative should the notional amount of the swap agreement be closed/sold as of the reporting date. Increasing fair value in absolute terms, when compared to the notional amount of the swap, represents a deterioration of the referenced entity’s credit soundness and a greater likelihood of risk of default or other credit event occurring as defined under the terms of the agreement. |
Inflation swap agreements outstanding at October 31, 2021:
| | | | | | | | | | | | | | | | | | | | | | | | |
Notional
Amount
(000)# | | | Termination
Date | | | Fixed
Rate | | | Floating
Rate | | Value at
Trade Date | | | Value at
October 31,
2021 | | | Unrealized
Appreciation
(Depreciation) | |
| Centrally Cleared Inflation Swap Agreements: | |
| | 200 | | | | 01/12/26 | | | | 2.185%(T) | | | U.S. CPI Urban Consumers NSA Index(2)(T) | | $ | — | | | $ | (15,089 | ) | | $ | (15,089 | ) |
| | 650 | | | | 04/07/31 | | | | 2.469%(T) | | | U.S. CPI Urban Consumers NSA Index(2)(T) | | | — | | | | (39,774 | ) | | | (39,774 | ) |
| | 90 | | | | 04/09/31 | | | | 2.435%(T) | | | U.S. CPI Urban Consumers NSA Index(2)(T) | | | — | | | | (5,829 | ) | | | (5,829 | ) |
| | 180 | | | | 04/09/31 | | | | 2.448%(T) | | | U.S. CPI Urban Consumers NSA Index(2)(T) | | | — | | | | (11,410 | ) | | | (11,410 | ) |
| | 175 | | | | 04/13/31 | | | | 2.445%(T) | | | U.S. CPI Urban Consumers NSA Index(2)(T) | | | — | | | | (11,106 | ) | | | (11,106 | ) |
| | 100 | | | | 04/13/31 | | | | 2.450%(T) | | | U.S. CPI Urban Consumers NSA Index(2)(T) | | | — | | | | (6,291 | ) | | | (6,291 | ) |
| | 100 | | | | 04/14/31 | | | | 2.450%(T) | | | U.S. CPI Urban Consumers NSA Index(2)(T) | | | — | | | | (6,277 | ) | | | (6,277 | ) |
| | 220 | | | | 04/15/31 | | | | 2.465%(T) | | | U.S. CPI Urban Consumers NSA Index(2)(T) | | | — | | | | (13,432 | ) | | | (13,432 | ) |
| | | | | | | | | | | | | | | | | | | | | | | | |
| | | | | | | | | | | | | | $ | — | | | $ | (109,208 | ) | | $ | (109,208 | ) |
| | | | | | | | | | | | | | | | | | | | | | | | |
| (1) | The Fund pays the fixed rate and receives the floating rate. |
| (2) | The Fund pays the floating rate and receives the fixed rate. |
Interest rate swap agreements outstanding at October 31, 2021:
| | | | | | | | | | | | | | | | | | | | | | | | |
Notional
Amount
(000)# | | | Termination
Date | | | Fixed
Rate | | | Floating
Rate | | Value at
Trade Date | | | Value at
October 31,
2021 | | | Unrealized
Appreciation
(Depreciation) | |
| Centrally Cleared Interest Rate Swap Agreements: | |
| AUD | 970 | | | | 12/03/30 | | | | 2.750%(S) | | | 6 Month BBSW(2)(S) | | $ | 111,823 | | | $ | 48,419 | | | $ | (63,404 | ) |
| AUD | 200 | | | | 10/08/31 | | | | 1.665%(S) | | | 6 Month BBSW(2)(S) | | | — | | | | (6,261 | ) | | | (6,261 | ) |
See Notes to Financial Statements.
| | | | |
| PGIM Global Dynamic Bond Fund | | | 49 | |
Schedule of Investments (continued)
as of October 31, 2021
Interest rate swap agreements outstanding at October 31, 2021 (continued):
| | | | | | | | | | | | | | | | | | | | | | | | |
Notional
Amount
(000)# | | | Termination
Date | | | Fixed
Rate | | | Floating
Rate | | Value at
Trade Date | | | Value at
October 31,
2021 | | | Unrealized
Appreciation
(Depreciation) | |
| Centrally Cleared Interest Rate Swap Agreements (cont’d.): | | | | | | | | | |
| AUD | 470 | | | | 07/19/32 | | | | 3.130%(S) | | | 6 Month BBSW(2)(S) | | $ | 157 | | | $ | 36,002 | | | $ | 35,845 | |
| BRL | 28,422 | | | | 01/02/25 | | | | 6.220%(T) | | | 1 Day BROIS(2)(T) | | | — | | | | (736,847 | ) | | | (736,847 | ) |
| BRL | 4,844 | | | | 01/02/25 | | | | 6.670%(T) | | | 1 Day BROIS(2)(T) | | | — | | | | (79,861 | ) | | | (79,861 | ) |
| BRL | 1,587 | | | | 01/02/25 | | | | 9.475%(T) | | | 1 Day BROIS(2)(T) | | | — | | | | 31,043 | | | | 31,043 | |
| BRL | 3,103 | | | | 01/02/25 | | | | 9.943%(T) | | | 1 Day BROIS(2)(T) | | | — | | | | 89,791 | | | | 89,791 | |
| BRL | 244 | | | | 01/02/25 | | | | 12.090%(T) | | | 1 Day BROIS(2)(T) | | | — | | | | 12,799 | | | | 12,799 | |
| CAD | 1,535 | | | | 04/03/25 | | | | 0.970%(S) | | | 3 Month CDOR(2)(S) | | | (841 | ) | | | (36,023 | ) | | | (35,182 | ) |
| CLP | 250,000 | | | | 04/05/29 | | | | 3.885%(S) | | | 1 Day CLOIS(2)(S) | | | 19,118 | | | | (30,693 | ) | | | (49,811 | ) |
| CLP | 410,000 | | | | 10/24/29 | | | | 2.790%(S) | | | 1 Day CLOIS(2)(S) | | | — | | | | (90,865 | ) | | | (90,865 | ) |
| CLP | 270,000 | | | | 02/28/30 | | | | 3.110%(S) | | | 1 Day CLOIS(2)(S) | | | — | | | | (54,199 | ) | | | (54,199 | ) |
| CNH | 2,000 | | | | 08/15/23 | | | | 3.115%(Q) | | | 7 Day China Fixing Repo Rates(2)(Q) | | | (13 | ) | | | 4,433 | | | | 4,446 | |
| CNH | 2,030 | | | | 03/13/24 | | | | 2.945%(Q) | | | 7 Day China Fixing Repo Rates(2)(Q) | | | — | | | | 3,852 | | | | 3,852 | |
| CNH | 2,900 | | | | 04/01/24 | | | | 2.923%(Q) | | | 7 Day China Fixing Repo Rates(2)(Q) | | | — | | | | 5,226 | | | | 5,226 | |
| CNH | 1,250 | | | | 06/03/24 | | | | 2.975%(Q) | | | 7 Day China Fixing Repo Rates(2)(Q) | | | — | | | | 2,687 | | | | 2,687 | |
| CNH | 8,180 | | | | 06/20/24 | | | | 2.900%(Q) | | | 7 Day China Fixing Repo Rates(2)(Q) | | | 4 | | | | 14,371 | | | | 14,367 | |
| CNH | 1,700 | | | | 09/03/24 | | | | 2.860%(Q) | | | 7 Day China Fixing Repo Rates(2)(Q) | | | (2 | ) | | | 2,924 | | | | 2,926 | |
| CNH | 1,700 | | | | 09/19/24 | | | | 2.940%(Q) | | | 7 Day China Fixing Repo Rates(2)(Q) | | | (1 | ) | | | 3,391 | | | | 3,392 | |
| CNH | 2,000 | | | | 10/10/24 | | | | 2.860%(Q) | | | 7 Day China Fixing Repo Rates(2)(Q) | | | (1 | ) | | | 3,232 | | | | 3,233 | |
| CNH | 2,910 | | | | 11/01/24 | | | | 3.120%(Q) | | | 7 Day China Fixing Repo Rates(2)(Q) | | | (5 | ) | | | 8,968 | | | | 8,973 | |
| CNH | 1,200 | | | | 02/04/25 | | | | 2.600%(Q) | | | 7 Day China Fixing Repo Rates(2)(Q) | | | — | | | | 594 | | | | 594 | |
| COP | 7,500,000 | | | | 02/08/26 | | | | 3.135%(Q) | | | 1 Day COOIS(2)(Q) | | | — | | | | (212,946 | ) | | | (212,946 | ) |
| COP | 3,204,860 | | | | 07/27/28 | | | | 6.200%(Q) | | | 1 Day COOIS(2)(Q) | | | 41,731 | | | | (4,664 | ) | | | (46,395 | ) |
| COP | 860,000 | | | | 12/16/29 | | | | 5.480%(Q) | | | 1 Day COOIS(2)(Q) | | | — | | | | (12,736 | ) | | | (12,736 | ) |
| DKK | 2,300 | | | | 03/15/27 | | | | 1.123%(A) | | | 6 Month CIBOR(2)(S) | | | — | | | | 17,684 | | | | 17,684 | |
| EUR | 490 | | | | 05/11/31 | | | | 0.750%(A) | | | 1 Day ESTR(1)(A) | | | 3,347 | | | | (41,603 | ) | | | (44,950 | ) |
| HUF | 257,045 | | | | 06/12/28 | | | | 3.750%(A) | | | 6 Month BUBOR(2)(S) | | | — | | | | (5,569 | ) | | | (5,569 | ) |
| HUF | 101,100 | | | | 07/15/29 | | | | 1.650%(A) | | | 6 Month BUBOR(2)(S) | | | — | | | | (44,967 | ) | | | (44,967 | ) |
See Notes to Financial Statements.
Interest rate swap agreements outstanding at October 31, 2021 (continued):
| | | | | | | | | | | | | | | | | | | | | | | | |
Notional Amount (000)# | | | Termination
Date | | | Fixed
Rate | | Floating Rate | | Value at
Trade Date | | | Value at
October 31,
2021 | | | Unrealized
Appreciation
(Depreciation) | |
Centrally Cleared Interest Rate Swap Agreements (cont’d.): | | | | | | | | | | | | |
| HUF | | | 70,365 | | | | 12/09/29 | | | 1.245%(A) | | 6 Month BUBOR(2)(S) | | $ | — | | | $ | (38,296 | ) | | $ | (38,296 | ) |
| HUF | | | 190,140 | | | | 01/23/30 | | | 1.740%(A) | | 6 Month BUBOR(2)(S) | | | 2,361 | | | | (80,863 | ) | | | (83,224 | ) |
| KRW | | | 50,000 | | | | 09/10/28 | | | 2.043%(Q) | | 3 Month KWCDC(2)(Q) | | | 1,837 | | | | (401 | ) | | | (2,238 | ) |
| MXN | | | 13,380 | | | | 02/27/29 | | | 8.260%(M) | | 28 Day Mexican Interbank Rate(2)(M) | | | 3,202 | | | | 25,996 | | | | 22,794 | |
| MXN | | | 5,400 | | | | 07/10/30 | | | 5.680%(M) | | 28 Day Mexican Interbank Rate(2)(M) | | | (3 | ) | | | (33,151 | ) | | | (33,148 | ) |
| MXN | | | 7,220 | | | | 01/16/31 | | | 5.450%(M) | | 28 Day Mexican Interbank Rate(2)(M) | | | (10 | ) | | | (51,916 | ) | | | (51,906 | ) |
| NOK | | | 2,690 | | | | 02/07/29 | | | 2.083%(A) | | 6 Month NIBOR(2)(S) | | | 2,674 | | | | 8,115 | | | | 5,441 | |
| NOK | | | 8,405 | | | | 01/08/31 | | | 1.250%(A) | | 6 Month NIBOR(2)(S) | | | (5,897 | ) | | | (49,177 | ) | | | (43,280 | ) |
| NOK | | | 1,540 | | | | 01/19/31 | | | 1.346%(A) | | 6 Month NIBOR(2)(S) | | | — | | | | (7,476 | ) | | | (7,476 | ) |
| NZD | | | 400 | | | | 11/28/28 | | | 2.950%(S) | | 3 Month BBR(2)(Q) | | | 21,840 | | | | 8,493 | | | | (13,347 | ) |
| NZD | | | 1,825 | | | | 10/07/29 | | | 1.130%(S) | | 3 Month BBR(2)(Q) | | | 4,601 | | | | (146,790 | ) | | | (151,391 | ) |
| PLN | | | 2,000 | | | | 05/24/23 | | | 2.520%(A) | | 6 Month WIBOR(2)(S) | | | — | | | | 7,497 | | | | 7,497 | |
| PLN | | | 2,890 | | | | 08/24/23 | | | 2.390%(A) | | 6 Month WIBOR(2)(S) | | | — | | | | 4,946 | | | | 4,946 | |
| PLN | | | 550 | | | | 01/21/26 | | | 2.500%(A) | | 6 Month WIBOR(2)(S) | | | 1,191 | | | | 1,880 | | | | 689 | |
| PLN | | | 5,135 | | | | 07/11/28 | | | 2.935%(A) | | 6 Month WIBOR(2)(S) | | | 160,444 | | | | 30,289 | | | | (130,155 | ) |
| SEK | | | 3,000 | | | | 06/20/29 | | | 0.550%(A) | | 3 Month STIBOR(2)(Q) | | | — | | | | (9,499 | ) | | | (9,499 | ) |
| SEK | | | 4,000 | | | | 10/07/29 | | | 0.180%(A) | | 3 Month STIBOR(2)(Q) | | | — | | | | (27,930 | ) | | | (27,930 | ) |
| SEK | | | 3,800 | | | | 01/24/30 | | | 0.605%(A) | | 3 Month STIBOR(2)(Q) | | | — | | | | (10,787 | ) | | | (10,787 | ) |
| SEK | | | 2,635 | | | | 07/13/30 | | | 0.308%(A) | | 3 Month STIBOR(2)(Q) | | | (1,767 | ) | | | (17,329 | ) | | | (15,562 | ) |
| THB | | | 8,400 | | | | 07/03/30 | | | 1.028%(S) | | 6 Month THBFIX(2)(S) | | | — | | | | (13,589 | ) | | | (13,589 | ) |
| | | 4,665 | | | | 03/10/22 | | | 0.330%(A) | | 1 Day USOIS(1)(A) | | | — | | | | (11,912 | ) | | | (11,912 | ) |
| | | 9,800 | | | | 05/29/22 | | | 0.014%(A) | | 1 Day USOIS(1)(A) | | | 8,093 | | | | 8,240 | | | | 147 | |
See Notes to Financial Statements.
| | | | |
| PGIM Global Dynamic Bond Fund | | | 51 | |
Schedule of Investments (continued)
as of October 31, 2021
Interest rate swap agreements outstanding at October 31, 2021 (continued):
| | | | | | | | | | | | | | | | | | | | | | | | |
Notional
Amount
(000)# | | | Termination
Date | | | Fixed
Rate | | | Floating
Rate | | Value at
Trade Date | | | Value at
October 31,
2021 | | | Unrealized
Appreciation
(Depreciation) | |
| Centrally Cleared Interest Rate Swap Agreements (cont’d.): | |
| | 7,635 | | | | 11/09/22 | | | | 0.061%(A) | | | 1 Day SOFR(1)(A) | | $ | — | | | $ | 7,945 | | | $ | 7,945 | |
| | 4,670 | | | | 10/30/23 | | | | 0.072%(A) | | | 1 Day USOIS(1)(A) | | | — | | | | 43,654 | | | | 43,654 | |
| | 5,739 | | | | 11/06/23 | | | | 0.063%(A) | | | 1 Day USOIS(1)(A) | | | — | | | | 56,396 | | | | 56,396 | |
| | 2,956 | | | | 05/31/24 | | | | 1.350%(A) | | | 1 Day USOIS(1)(A) | | | — | | | | (66,898 | ) | | | (66,898 | ) |
| | 734 | | | | 02/28/26 | | | | 0.953%(A) | | | 1 Day SOFR(1)(A) | | | — | | | | 405 | | | | 405 | |
| | 493 | | | | 08/15/28 | | | | 1.220%(A) | | | 1 Day SOFR(1)(A) | | | — | | | | (1,478 | ) | | | (1,478 | ) |
| ZAR | 7,500 | | | | 03/13/29 | | | | 8.055%(Q) | | | 3 Month JIBAR(2)(Q) | | | — | | | | 20,385 | | | | 20,385 | |
| ZAR | 5,700 | | | | 06/21/29 | | | | 7.685%(Q) | | | 3 Month JIBAR(2)(Q) | | | (21 | ) | | | 6,047 | | | | 6,068 | |
| ZAR | 8,000 | | | | 10/03/29 | | | | 7.580%(Q) | | | 3 Month JIBAR(2)(Q) | | | — | | | | 2,846 | | | | 2,846 | |
| ZAR | 5,000 | | | | 11/01/29 | | | | 7.820%(Q) | | | 3 Month JIBAR(2)(Q) | | | (30 | ) | | | 8,662 | | | | 8,692 | |
| ZAR | 16,450 | | | | 12/01/30 | | | | 6.888%(Q) | | | 3 Month JIBAR(2)(Q) | | | 17,265 | | | | (55,597 | ) | | | (72,862 | ) |
| ZAR | 3,990 | | | | 10/07/31 | | | | 7.670%(Q) | | | 3 Month JIBAR(2)(Q) | | | (29 | ) | | | (3,244 | ) | | | (3,215 | ) |
| | | | | | | | | | | | | | | | | | | | | | | | |
| | | | | | | | | | | | | | $ | 391,068 | | | $ | (1,456,355 | ) | | $ | (1,847,423 | ) |
| | | | | | | | | | | | | | | | | | | | | | | | |
| | | | | | | | | | | | | | | | | | | | | | | | | | |
Notional
Amount
(000)# | | | Termination
Date | | | Fixed
Rate | | | Floating
Rate | | Fair
Value | | | Upfront
Premiums
Paid(Received) | | | Unrealized
Appreciation
(Depreciation) | | | Counterparty |
| OTC Interest Rate Swap Agreements: | | | | | | | | | |
| CLP | 220,000 | | | | 02/09/27 | | | | 4.120%(S) | | | 1 Day CLOIS(2)(S) | | $ | (14,656 | ) | | $ | — | | | $ | (14,656 | ) | | Morgan Stanley & Co. International PLC |
| CLP | 140,000 | | | | 12/20/27 | | | | 4.260%(S) | | | 1 Day CLOIS(2)(S) | | | (9,567 | ) | | | — | | | | (9,567 | ) | | Morgan Stanley & Co. International PLC |
| CLP | 62,800 | | | | 01/23/28 | | | | 4.245%(S) | | | 1 Day CLOIS(2)(S) | | | (4,369 | ) | | | — | | | | (4,369 | ) | | Morgan Stanley & Co. International PLC |
| CLP | 101,000 | | | | 01/26/28 | | | | 4.210%(S) | | | 1 Day CLOIS(2)(S) | | | (7,422 | ) | | | — | | | | (7,422 | ) | | Morgan Stanley & Co. International PLC |
| CLP | 56,000 | | | | 05/17/28 | | | | 4.270%(S) | | | 1 Day CLOIS(2)(S) | | | (3,590 | ) | | | — | | | | (3,590 | ) | | Citibank, N.A. |
| COP | 1,600,000 | | | | 06/02/27 | | | | 5.910%(Q) | | | 1 Day COOIS(2)(Q) | | | (2,163 | ) | | | — | | | | (2,163 | ) | | Morgan Stanley & Co. International PLC |
See Notes to Financial Statements.
Interest rate swap agreements outstanding at October 31, 2021 (continued):
| | | | | | | | | | | | | | | | | | | | | | | | | | | | |
Notional
Amount
(000)# | | | Termination
Date | | | Fixed
Rate | | | Floating
Rate | | Fair
Value | | | Upfront
Premiums
Paid(Received) | | | Unrealized
Appreciation
(Depreciation) | | | Counterparty | |
| OTC Interest Rate Swap Agreements (cont’d.): | | | | | | | | | | |
| COP | 405,000 | | | | 01/23/28 | | | | 6.035%(Q) | | | 1 Day COOIS(2)(Q) | | $ | (1,109 | ) | | $ | — | | | $ | (1,109 | ) | |
| Morgan Stanley &
Co. International
PLC |
|
| COP | 509,000 | | | | 01/26/28 | | | | 6.000%(Q) | | | 1 Day COOIS(2)(Q) | | | (1,636 | ) | | | — | | | | (1,636 | ) | |
| Morgan Stanley &
Co. International
PLC |
|
| COP | 768,900 | | | | 07/12/29 | | | | 5.165%(Q) | | | 1 Day COOIS(2)(Q) | | | (15,153 | ) | | | — | | | | (15,153 | ) | |
| Morgan Stanley &
Co. International
PLC |
|
| ILS | 1,340 | | | | 03/15/27 | | | | 2.130%(A) | | | 3 Month TELBOR(2)(Q) | | | 28,539 | | | | — | | | | 28,539 | | | | Citibank, N.A. | |
| ILS | 1,090 | | | | 07/13/27 | | | | 0.395%(A) | | | 3 Month TELBOR(2)(Q) | | | (13,651 | ) | | | — | | | | (13,651 | ) | |
| Goldman Sachs
International |
|
| ILS | 950 | | | | 07/16/28 | | | | 2.045%(A) | | | 3 Month TELBOR(2)(Q) | | | 17,655 | | | | — | | | | 17,655 | | |
| JPMorgan Chase
Bank, N.A. |
|
| ILS | 960 | | | | 07/12/29 | | | | 1.411%(A) | | | 3 Month TELBOR(2)(Q) | | | 3,639 | | | | (208 | ) | | | 3,847 | | | | Citibank, N.A. | |
| ILS | 1,000 | | | | 10/07/29 | | | | 0.885%(A) | | | 3 Month TELBOR(2)(Q) | | | (10,310 | ) | | | — | | | | (10,310 | ) | |
| Goldman Sachs
International |
|
| ILS | 490 | | | | 04/24/30 | | | | 0.710%(A) | | | 3 Month TELBOR(2)(Q) | | | (7,527 | ) | | | (5 | ) | | | (7,522 | ) | |
| Goldman Sachs
International |
|
| RUB | 50,000 | | | | 01/12/26 | | | | 6.360%(A) | | | 3 Month MosPRIME(2)(Q) | | | (38,717 | ) | | | — | | | | (38,717 | ) | |
| Morgan Stanley &
Co. International
PLC |
|
| RUB | 53,000 | | | | 02/27/26 | | | | 6.680%(A) | | | 3 Month MosPRIME(2)(Q) | | | (33,829 | ) | | | — | | | | (33,829 | ) | |
| Morgan Stanley &
Co. International
PLC |
|
| ZAR | 1,060 | | | | 03/22/42 | | | | 7.800%(Q) | | | 3 Month JIBAR(2)(Q) | | | (5,361 | ) | | | (25 | ) | | | (5,336 | ) | | | Citibank, N.A. | |
| ZAR | 7,000 | | | | 09/22/42 | | | | 8.020%(Q) | | | 3 Month JIBAR(2)(Q) | | | (26,017 | ) | | | (47 | ) | | | (25,970 | ) | | | Citibank, N.A. | |
| ZAR | 1,000 | | | | 03/22/47 | | | | 7.650%(Q) | | | 3 Month JIBAR(1)(Q) | | | 7,034 | | | | 24 | | | | 7,010 | | | | Citibank, N.A. | |
| ZAR | 6,575 | | | | 09/22/47 | | | | 7.890%(Q) | | | 3 Month JIBAR(1)(Q) | | | 35,543 | | | | 42 | | | | 35,501 | | | | Citibank, N.A. | |
| | | | | | | | | | | | | | | | | | | | | | | | | | | | |
| | | | | | | | | | | | | | $ | (102,667 | ) | | $ | (219 | ) | | $ | (102,448 | ) | | | | |
| | | | | | | | | | | | | | | | | | | | | | | | | | | | |
| (1) | The Fund pays the fixed rate and receives the floating rate. |
| (2) | The Fund pays the floating rate and receives the fixed rate. |
See Notes to Financial Statements.
| | | | |
| PGIM Global Dynamic Bond Fund | | | 53 | |
Schedule of Investments (continued)
as of October 31, 2021
Balances Reported in the Statement of Assets and Liabilities for OTC Swap Agreements:
| | | | | | | | | | | | | | | | | | | | |
| | | Premiums Paid | | Premiums Received | | Unrealized
Appreciation | | Unrealized
Depreciation |
OTC Swap Agreements | | | $ | 106,667 | | | | $ | (208,994 | ) | | | $ | 408,064 | | | | $ | (200,849 | ) |
Summary of Collateral for Centrally Cleared/Exchange-traded Derivatives:
Cash and securities segregated as collateral, including pending settlement for closed positions, to cover requirements for centrally cleared/exchange-traded derivatives are listed by broker as follows:
| | | | | | | | | | |
Broker | | Cash and/or Foreign Currency | | Securities Market Value |
Citigroup Global Markets, Inc. | | | $ | 156,000 | | | | $ | 1,334,508 | |
J.P. Morgan Securities LLC | | | | 459,000 | | | | | 203,484 | |
| | | | | | | | | | |
Total | | | $ | 615,000 | | | | $ | 1,537,992 | |
| | | | | | | | | | |
Fair Value Measurements:
Various inputs are used in determining the value of the Fund’s investments. These inputs are summarized in the three broad levels listed below.
Level 1—unadjusted quoted prices generally in active markets for identical securities.
Level 2—quoted prices for similar securities, interest rates and yield curves, prepayment speeds, foreign currency exchange rates and other observable inputs.
Level 3—unobservable inputs for securities valued in accordance with Board approved fair valuation procedures.
The following is a summary of the inputs used as of October 31, 2021 in valuing such portfolio securities:
| | | | | | | | | | | | |
| | | Level 1 | | | Level 2 | | | Level 3 | |
Investments in Securities | | | | | | | | | | | | |
Assets | | | | | | | | | | | | |
Long-Term Investments | | | | | | | | | | | | |
Asset-Backed Securities | | | | | | | | | | | | |
Cayman Islands | | $ | — | | | $ | 251,127 | | | $ | — | |
Spain | | | — | | | | 454,216 | | | | — | |
United States | | | — | | | | 1,402,783 | | | | — | |
Bank Loans | | | | | | | | | | | | |
Luxembourg | | | — | | | | 62,938 | | | | — | |
United States | | | — | | | | 215,446 | | | | — | |
Commercial Mortgage-Backed Securities | | | | | | | | | | | | |
Canada | | | — | | | | 56,643 | | | | — | |
Ireland | | | — | | | | 2,299,993 | | | | — | |
United States | | | — | | | | 5,869,339 | | | | — | |
Corporate Bonds | | | | | | | | | | | | |
Brazil | | | — | | | | 896,596 | | | | — | |
Bulgaria | | | — | | | | 229,739 | | | | — | |
Canada | | | — | | | | 1,227,815 | | | | — | |
See Notes to Financial Statements.
| | | | | | | | | | | | |
| | | Level 1 | | | Level 2 | | | Level 3 | |
Investments in Securities (continued) | | | | | | | | | | | | |
Assets (continued) | | | | | | | | | | | | |
Long-Term Investments (continued) | | | | | | | | | | | | |
Corporate Bonds (continued) | | | | | | | | | | | | |
France | | $ | — | | | $ | 2,699,009 | | | $ | — | |
Germany | | | — | | | | 1,283,910 | | | | — | |
India | | | — | | | | 367,950 | | | | — | |
Indonesia | | | — | | | | 358,934 | | | | — | |
Israel | | | — | | | | 101,987 | | | | — | |
Italy | | | — | | | | 770,534 | | | | — | |
Jamaica | | | — | | | | 779,115 | | | | — | |
Luxembourg | | | — | | | | 1,537,703 | | | | — | |
Mexico | | | — | | | | 1,138,887 | | | | — | |
Netherlands | | | — | | | | 1,544,152 | | | | — | |
Peru | | | — | | | | 112,963 | | | | — | |
Russia | | | — | | | | 628,289 | | | | — | |
South Africa | | | — | | | | 431,177 | | | | — | |
Spain | | | — | | | | 1,056,372 | | | | — | |
Ukraine | | | — | | | | 115,695 | | | | — | |
United Arab Emirates | | | — | | | | 275,631 | | | | — | |
United Kingdom | | | — | | | | 3,849,312 | | | | — | |
United States | | | — | | | | 16,508,455 | | | | 2,720 | |
Residential Mortgage-Backed Securities | | | | | | | | | | | | |
Bermuda | | | — | | | | 2,360,223 | | | | — | |
Ireland | | | — | | | | 183,401 | | | | — | |
United States | | | — | | | | 1,542,238 | | | | 83,200 | |
Sovereign Bonds | | | | | | | | | | | | |
Brazil | | | — | | | | 2,921,950 | | | | — | |
Greece | | | — | | | | 498,743 | | | | — | |
Hungary | | | — | | | | 195,269 | | | | — | |
Italy | | | — | | | | 352,925 | | | | — | |
Romania | | | — | | | | 503,328 | | | | — | |
Russia | | | — | | | | 926,813 | | | | — | |
Saudi Arabia | | | — | | | | 120,921 | | | | — | |
Serbia | | | — | | | | 882,647 | | | | — | |
Spain | | | — | | | | 1,356,732 | | | | — | |
Turkey | | | — | | | | 591,759 | | | | — | |
Ukraine | | | — | | | | 2,263,218 | | | | — | |
U.S. Treasury Obligation | | | — | | | | 279,791 | | | | — | |
Common Stocks | | | | | | | | | | | | |
United States | | | 733,629 | | | | 165,471 | | | | 85,400 | |
Preferred Stock | | | | | | | | | | | | |
United States | | | — | | | | — | | | | 300,000 | |
Warrants | | | | | | | | | | | | |
United States | | | — | | | | — | | | | 164 | |
See Notes to Financial Statements.
| | | | |
| PGIM Global Dynamic Bond Fund | | | 55 | |
Schedule of Investments (continued)
as of October 31, 2021
| | | | | | | | | | | | |
| | | Level 1 | | | Level 2 | | | Level 3 | |
Investments in Securities (continued) | | | | | | | | | | | | |
Assets (continued) | | | | | | | | | | | | |
Short-Term Investments | | | | | | | | | | | | |
Affiliated Mutual Fund | | $ | 916,981 | | | $ | — | | | $ | — | |
Options Purchased | | | 548,500 | | | | 152,369 | | | | — | |
| | | | | | | | | | | | |
Total | | $ | 2,199,110 | | | $ | 61,824,508 | | | $ | 471,484 | |
| | | | | | | | | | | | |
| | | |
Liabilities | | | | | | | | | | | | |
Options Written | | $ | (474,940 | ) | | $ | (89,367 | ) | | $ | — | |
| | | | | | | | | | | | |
| | | |
Other Financial Instruments* | | | | | | | | | | | | |
Assets | | | | | | | | | | | | |
Unfunded Loan Commitment | | $ | — | | | $ | 228 | | | $ | — | |
Futures Contracts | | | 566,720 | | | | — | | | | — | |
OTC Forward Foreign Currency Exchange Contracts | | | — | | | | 1,527,550 | | | | — | |
OTC Cross Currency Exchange Contracts | | | — | | | | 149,481 | | | | — | |
Centrally Cleared Credit Default Swap Agreements | | | — | | | | 20,449 | | | | — | |
OTC Credit Default Swap Agreements | | | — | | | | 238,251 | | | | — | |
Centrally Cleared Interest Rate Swap Agreements | | | — | | | | 424,763 | | | | — | |
OTC Interest Rate Swap Agreements | | | — | | | | 92,410 | | | | — | |
| | | | | | | | | | | | |
Total | | $ | 566,720 | | | $ | 2,453,132 | | | $ | — | |
| | | | | | | | | | | | |
| | | |
Liabilities | | | | | | | | | | | | |
Futures Contracts | | $ | (105,456 | ) | | $ | — | | | $ | — | |
OTC Forward Foreign Currency Exchange Contracts | | | — | | | | (1,016,406 | ) | | | — | |
OTC Cross Currency Exchange Contracts | | | — | | | | (264,112 | ) | | | — | |
OTC Credit Default Swap Agreements | | | — | | | | (30,696 | ) | | | — | |
Centrally Cleared Inflation Swap Agreements | | | — | | | | (109,208 | ) | | | — | |
Centrally Cleared Interest Rate Swap Agreements | | | — | | | | (2,272,186 | ) | | | — | |
OTC Interest Rate Swap Agreements | | | — | | | | (195,077 | ) | | | — | |
| | | | | | | | | | | | |
Total | | $ | (105,456 | ) | | $ | (3,887,685 | ) | | $ | — | |
| | | | | | | | | | | | |
| * | Other financial instruments are derivative instruments, with the exception of unfunded loan commitments, and are not reflected in the Schedule of Investments. Futures, forwards, centrally cleared swap contracts and unfunded loan commitments are recorded at net unrealized appreciation (depreciation) and OTC swap contracts are recorded at fair value. |
Industry Classification:
The industry classification of investments and other assets in excess of liabilities shown as a percentage of net assets as of October 31, 2021 were as follows (unaudited):
| | | | |
Sovereign Bonds | | | 16.3 | % |
Commercial Mortgage-Backed Securities | | | 12.6 | |
Residential Mortgage-Backed Securities | | | 7.3 | |
| | | | |
Oil & Gas | | | 6.2 | % |
Electric | | | 4.6 | |
Telecommunications | | | 4.2 | |
See Notes to Financial Statements.
Industry Classification (continued):
| | | | |
Foods | | | 3.7 | % |
Banks | | | 3.5 | |
Media | | | 3.0 | |
Retail | | | 2.3 | |
Packaging & Containers | | | 2.3 | |
Chemicals | | | 2.1 | |
Commercial Services | | | 2.1 | |
Entertainment | | | 1.9 | |
Real Estate Investment Trusts (REITs) | | | 1.6 | |
Home Builders | | | 1.5 | |
Auto Manufacturers | | | 1.5 | |
Affiliated Mutual Funds | | | 1.4 | |
Diversified Financial Services | | | 1.4 | |
Internet | | | 1.3 | |
Healthcare-Services | | | 1.3 | |
Other | | | 1.2 | |
Pharmaceuticals | | | 1.1 | |
Oil, Gas & Consumable Fuels | | | 1.1 | |
Options Purchased | | | 1.1 | |
Aerospace & Defense | | | 1.0 | |
Pipelines | | | 0.9 | |
Lodging | | | 0.9 | |
Machinery-Diversified | | | 0.9 | |
Gas | | | 0.9 | |
| | | | |
Healthcare-Products | | | 0.8 | % |
Gas Utilities | | | 0.8 | |
Real Estate | | | 0.7 | |
Engineering & Construction | | | 0.7 | |
Auto Parts & Equipment | | | 0.7 | |
Transportation | | | 0.6 | |
Consumer Loans | | | 0.4 | |
U.S. Treasury Obligation | | | 0.4 | |
Insurance | | | 0.4 | |
Leisure Time | | | 0.4 | |
Collateralized Loan Obligation | | | 0.4 | |
Mining | | | 0.3 | |
Student Loan | | | 0.3 | |
Airlines | | | 0.2 | |
Agriculture | | | 0.2 | |
Building Materials | | | 0.2 | |
Electric Utilities | | | 0.1 | |
| | | | |
| | | 98.8 | |
Options Written | | | (0.9 | ) |
Other assets in excess of liabilities | | | 2.1 | |
| | | | |
| |
| | | 100.0 | % |
| | | | |
Effects of Derivative Instruments on the Financial Statements and Primary Underlying Risk Exposure:
The Fund invested in derivative instruments during the reporting period. The primary types of risk associated with these derivative instruments are credit contracts risk, equity contracts risk, foreign exchange contracts risk and interest rate contracts risk. See the Notes to Financial Statements for additional detail regarding these derivative instruments and their risks. The effect of such derivative instruments on the Fund’s financial position and financial performance as reflected in the Statement of Assets and Liabilities and Statement of Operations is presented in the summary below.
Fair values of derivative instruments as of October 31, 2021 as presented in the Statement of Assets and Liabilities:
| | | | | | | | | | | | |
Derivatives not accounted
for as hedging instruments,
carried at fair value | | Asset Derivatives | | | Liability Derivatives | |
| | Statement of
Assets and
Liabilities Location | | Fair
Value | | | Statement of
Assets and
Liabilities Location | | Fair
Value | |
| Credit contracts | | Due from/to broker-variation margin swaps | | $ | 20,449 | * | | — | | $ | — | |
| Credit contracts | | Premiums paid for OTC swap agreements | | | 106,601 | | | Premiums received for OTC swap agreements | | | 208,709 | |
See Notes to Financial Statements.
| | | | |
| PGIM Global Dynamic Bond Fund | | | 57 | |
Schedule of Investments (continued)
as of October 31, 2021
| | | | | | | | | | | | |
Derivatives not accounted for
as hedging instruments,
carried at fair value | | Asset Derivatives | | | Liability Derivatives | |
| | Statement of
Assets and
Liabilities Location | | Fair
Value | | | Statement of
Assets and
Liabilities Location | | Fair
Value | |
| Credit contracts | | Unrealized appreciation on OTC swap agreements | | $ | 315,512 | | | Unrealized depreciation on OTC swap agreements | | $ | 5,849 | |
| Equity contracts | | Due from/to broker-variation margin futures | | | 56,185 | * | | Due from/to broker-variation margin futures | | | 12,680 | * |
| Equity contracts | | Unaffiliated investments | | | 548,500 | | | Options written outstanding, at value | | | 474,940 | |
| Foreign exchange contracts | | Unaffiliated investments | | | 139,477 | | | Options written outstanding, at value | | | 73,080 | |
| Foreign exchange contracts | | Unrealized appreciation on OTC cross currency exchange contracts | | | 149,481 | | | Unrealized depreciation on OTC cross currency exchange contracts | | | 264,112 | |
| Foreign exchange contracts | | Unrealized appreciation on OTC forward foreign currency exchange contracts | | | 1,527,550 | | | Unrealized depreciation on OTC forward foreign currency exchange contracts | | | 1,016,406 | |
| Interest rate contracts | | Due from/to broker-variation margin futures | | | 510,535 | * | | Due from/to broker-variation margin futures | | | 92,776 | * |
| Interest rate contracts | | Due from/to broker-variation margin swaps | | | 424,763 | * | | Due from/to broker-variation margin swaps | | | 2,381,394 | * |
| Interest rate contracts | | Premiums paid for OTC swap agreements | | | 66 | | | Premiums received for OTC swap agreements | | | 285 | |
| Interest rate contracts | | Unaffiliated investments | | | 12,892 | | | Options written outstanding, at value | | | 16,287 | |
| Interest rate contracts | | Unrealized appreciation on OTC swap agreements | | | 92,552 | | | Unrealized depreciation on OTC swap agreements | | | 195,000 | |
| | | | | | | | | | | | |
| | | | $ | 3,904,563 | | | | | $ | 4,741,518 | |
| | | | | | | | | | | | |
| * | Includes cumulative appreciation (depreciation) as reported in the schedule of open futures and centrally cleared swap contracts. Only unsettled variation margin receivable (payable) is reported within the Statement of Assets and Liabilities. |
See Notes to Financial Statements.
The effects of derivative instruments on the Statement of Operations for the year ended October 31, 2021 are as follows:
| | | | | | | | | | | | | | | | | | | | |
Amount of Realized Gain (Loss) on Derivatives Recognized in Income | |
Derivatives not accounted for as
hedging
instruments, carried at fair value | | Options
Purchased(1) | | | Options
Written | | | Futures | | | Forward
&Cross
Currency
Exchange
Contracts | | | Swaps | |
Credit contracts | | $ | (7,973 | ) | | $ | 9,170 | | | $ | — | | | $ | — | | | $ | 671,940 | |
Equity contracts | | | (234,513 | ) | | | 387,270 | | | | (222,484 | ) | | | — | | | | — | |
Foreign exchange contracts | | | (14,096,910 | ) | | | 13,685,783 | | | | 10,996 | | | | 362,466 | | | | — | |
Interest rate contracts | | | — | | | | — | | | | (1,646,813 | ) | | | — | | | | 605,940 | |
| | | | | | | | | | | | | | | | | | | | |
Total | | $ | (14,339,396 | ) | | $ | 14,082,223 | | | $ | (1,858,301 | ) | | $ | 362,466 | | | $ | 1,277,880 | |
| | | | | | | | | | | | | | | | | | | | |
| (1) | Included in net realized gain (loss) on investment transactions in the Statement of Operations. |
| | | | | | | | | | | | | | | | | | | | |
Change in Unrealized Appreciation (Depreciation) on Derivatives Recognized in Income | |
Derivatives not accounted for as hedging instruments, carried at fair value | | Options
Purchased(2) | | | Options
Written | | | Futures | | | Forward
& Cross
Currency
Exchange
Contracts | | | Swaps | |
Credit contracts | | $ | — | | | $ | — | | | $ | — | | | $ | — | | | $ | 235,046 | |
Equity contracts | | | 194,073 | | | | (78,591 | ) | | | 10,532 | | | | — | | | | — | |
Foreign exchange contracts | | | (1,465,575 | ) | | | 1,958,422 | | | | (84,549 | ) | | | (59,472 | ) | | | — | |
Interest rate contracts | | | 292 | | | | (1,287 | ) | | | 1,034,362 | | | | — | | | | (3,748,649 | ) |
| | | | | | | | | | | | | | | | | | | | |
Total | | $ | (1,271,210 | ) | | $ | 1,878,544 | | | $ | 960,345 | | | $ | (59,472 | ) | | $ | (3,513,603 | ) |
| | | | | | | | | | | | | | | | | | | | |
| (2) | Included in net change in unrealized appreciation (depreciation) on investments in the Statement of Operations. |
See Notes to Financial Statements.
| | | | |
| PGIM Global Dynamic Bond Fund | | | 59 | |
Schedule of Investments (continued)
as of October 31, 2021
For the year ended October 31, 2021, the Fund’s average volume of derivative activities is as follows:
| | | | | | | | | | | | | | | | | | | | | | | |
Options
Purchased(1) | | Options
Written(2) | | Futures
Contracts—
Long
Positions(2) | | Futures
Contracts—
Short
Positions(2) | | Forward Foreign
Currency Exchange
Contracts—Purchased(3) |
| | $ | 6,478,921 | | | | $ | 266,103,523 | | | | $ | 19,209,987 | | | | $ | 123,644,332 | | | | $ | 40,227,542 | |
| | | | | | | | | | | | | | | | | | |
Forward Foreign
Currency Exchange
Contracts—Sold(3) | | Cross
Currency
Exchange
Contracts(4) | | Interest Rate
Swap
Agreements(2) | | Credit Default
Swap Agreements—
Buy Protection(2) |
| $65,102,078 | | | $ | 7,860,686 | | | | $ | 88,791,563 | | | | $ | 4,657,768 | |
| | | | | | | | | | | | | |
Credit Default
Swap Agreements—
Sell Protection(2) | | Currency
Swap
Agreements(2) | | Inflation Swap
Agreements(2) |
| $20,729,580 | | $2,188,040 | | $1,968,308 |
| (2) | Notional Amount in USD. |
| (3) | Value at Settlement Date. |
Average volume is based on average quarter end balances as noted for the year ended October 31, 2021.
See Notes to Financial Statements.
Financial Instruments/Transactions—Summary of Offsetting and Netting Arrangements:
The Fund invested in OTC derivatives during the reporting period that are either offset in accordance with current requirements or are subject to enforceable master netting arrangements or similar agreements that permit offsetting. The information about offsetting and related netting arrangements for OTC derivatives where the legal right to set-off exists is presented in the summary below.
Offsetting of OTC derivative assets and liabilities:
| | | | | | | | | | | | | | | | | | | | |
Counterparty | | Gross Amounts of
Recognized
Assets(1) | | | Gross Amounts of
Recognized
Liabilities(1) | | | Net Amounts of
Recognized
Assets/(Liabilities) | | | Collateral
Pledged/(Received)(2) | | | Net Amount | |
Bank of America, N.A. | | $ | 313,182 | | | $ | (155,106 | ) | | $ | 158,076 | | | $ | — | | | $ | 158,076 | |
Barclays Bank PLC | | | 98,963 | | | | (216,496 | ) | | | (117,533 | ) | | | — | | | | (117,533 | ) |
BNP Paribas S.A. | | | 43,561 | | | | (68,024 | ) | | | (24,463 | ) | | | — | | | | (24,463 | ) |
Citibank, N.A. | | | 579,903 | | | | (280,873 | ) | | | 299,030 | | | | (260,000 | ) | | | 39,030 | |
Credit Suisse International | | | 37,276 | | | | (2,590 | ) | | | 34,686 | | | | — | | | | 34,686 | |
Deutsche Bank AG | | | 564,289 | | | | (328,152 | ) | | | 236,137 | | | | (195,397 | ) | | | 40,740 | |
Goldman Sachs International | | | 146,889 | | | | (213,453 | ) | | | (66,564 | ) | | | — | | | | (66,564 | ) |
HSBC Bank PLC | | | 26,153 | | | | (11,589 | ) | | | 14,564 | | | | — | | | | 14,564 | |
JPMorgan Chase Bank, N.A. | | | 214,394 | | | | (92,778 | ) | | | 121,616 | | | | (121,616 | ) | | | — | |
Morgan Stanley & Co. International PLC | | | 313,414 | | | | (395,009 | ) | | | (81,595 | ) | | | — | | | | (81,595 | ) |
Standard Chartered Bank | | | — | | | | (15,658 | ) | | | (15,658 | ) | | | — | | | | (15,658 | ) |
The Toronto-Dominion Bank | | | 4,037 | | | | — | | | | 4,037 | | | | — | | | | 4,037 | |
UBS AG | | | 2,070 | | | | — | | | | 2,070 | | | | — | | | | 2,070 | |
| | | | | | | | | | | | | | | | | | | | |
| | $ | 2,344,131 | | | $ | (1,779,728 | ) | | $ | 564,403 | | | $ | (577,013 | ) | | $ | (12,610 | ) |
| | | | | | | | | | | | | | | | | | | | |
| (1) | Includes unrealized appreciation/(depreciation) on swaps and forwards, premiums paid/(received) on swap agreements and market value of purchased and written options, as represented on the Statement of Assets and Liabilities. |
| (2) | Collateral amount disclosed by the Fund is limited to the market value of financial instruments/transactions and the Fund’s OTC derivative exposure by counterparty. |
See Notes to Financial Statements.
| | | | |
| PGIM Global Dynamic Bond Fund | | | 61 | |
Statement of Assets and Liabilities
as of October 31, 2021
| | | | | |
Assets | | | | | |
Investments at value: | | | | | |
Unaffiliated investments (cost $64,413,012) | | | $ | 63,578,121 | |
Affiliated investments (cost $916,981) | | | | 916,981 | |
Cash | | | | 107 | |
Foreign currency, at value (cost $76,659) | | | | 76,600 | |
Unrealized appreciation on OTC forward foreign currency exchange contracts | | | | 1,527,550 | |
Dividends and interest receivable | | | | 663,271 | |
Deposit with broker for centrally cleared/exchange-traded derivatives | | | | 615,000 | |
Unrealized appreciation on OTC swap agreements | | | | 408,064 | |
Unrealized appreciation on OTC cross currency exchange contracts | | | | 149,481 | |
Due from broker—variation margin futures | | | | 107,939 | |
Premiums paid for OTC swap agreements | | | | 106,667 | |
Due from broker—variation margin swaps | | | | 35,448 | |
Receivable for Fund shares sold | | | | 5,655 | |
Unrealized appreciation on unfunded loan commitment | | | | 228 | |
Prepaid expenses | | | | 3,417 | |
| | | | | |
Total Assets | | | | 68,194,529 | |
| | | | | |
| |
Liabilities | | | | | |
Unrealized depreciation on OTC forward foreign currency exchange contracts | | | | 1,016,406 | |
Options written outstanding, at value (premiums received $2,089,580) | | | | 564,307 | |
Payable for investments purchased | | | | 427,267 | |
Unrealized depreciation on OTC cross currency exchange contracts | | | | 264,112 | |
Premiums received for OTC swap agreements | | | | 208,994 | |
Unrealized depreciation on OTC swap agreements | | | | 200,849 | |
Accrued expenses and other liabilities | | | | 130,371 | |
Payable for Fund shares purchased | | | | 53,257 | |
Management fee payable | | | | 46,994 | |
Distribution fee payable | | | | 1,230 | |
Trustees’ fees payable | | | | 994 | |
Affiliated transfer agent fee payable | | | | 714 | |
Dividends payable | | | | 138 | |
| | | | | |
Total Liabilities | | | | 2,915,633 | |
| | | | | |
| |
Net Assets | | | $ | 65,278,896 | |
| | | | | |
| |
| | | | | | |
Net assets were comprised of: | | | | | |
Shares of beneficial interest, at par | | | $ | 6,853 | |
Paid-in capital in excess of par | | | | 73,184,870 | |
Total distributable earnings (loss) | | | | (7,912,827 | ) |
| | | | | |
Net assets, October 31, 2021 | | | $ | 65,278,896 | |
| | | | | |
See Notes to Financial Statements.
| | | | |
Class A | | | | |
Net asset value and redemption price per share,
($2,017,709 ÷ 211,719 shares of beneficial interest issued and outstanding) | | $ | 9.53 | |
Maximum sales charge (3.25% of offering price) | | | 0.32 | |
| | | | |
Maximum offering price to public | | $ | 9.85 | |
| | | | |
| |
Class C | | | | |
Net asset value, offering price and redemption price per share,
($932,123 ÷ 97,976 shares of beneficial interest issued and outstanding) | | $ | 9.51 | |
| | | | |
| |
Class Z | | | | |
Net asset value, offering price and redemption price per share,
($27,633,160 ÷ 2,900,376 shares of beneficial interest issued and outstanding) | | $ | 9.53 | |
| | | | |
| |
Class R6 | | | | |
Net asset value, offering price and redemption price per share,
($34,695,904 ÷ 3,643,317 shares of beneficial interest issued and outstanding) | | $ | 9.52 | |
| | | | |
See Notes to Financial Statements.
| | | | |
| PGIM Global Dynamic Bond Fund | | | 63 | |
Statement of Operations
Year Ended October 31, 2021
| | | | |
Net Investment Income (Loss) | | | | |
Income | | | | |
Interest income | | $ | 2,597,690 | |
Affiliated dividend income | | | 3,149 | |
Income from securities lending, net (including affiliated income of $292) | | | 1,676 | |
| | | | |
Total income | | | 2,602,515 | |
| | | | |
| |
Expenses | | | | |
Management fee | | | 497,908 | |
Distribution fee(a) | | | 16,815 | |
Custodian and accounting fees | | | 118,727 | |
Audit fee | | | 65,402 | |
Transfer agent’s fees and expenses (including affiliated expense of $2,386)(a) | | | 48,096 | |
Registration fees(a) | | | 39,492 | |
Legal fees and expenses | | | 20,314 | |
Shareholders’ reports | | | 18,548 | |
Trustees’ fees | | | 10,427 | |
Miscellaneous | | | 56,642 | |
| | | | |
Total expenses | | | 892,371 | |
Less: Fee waiver and/or expense reimbursement(a) | | | (279,622 | ) |
| | | | |
Net expenses | | | 612,749 | |
| | | | |
Net investment income (loss) | | | 1,989,766 | |
| | | | |
| |
Realized And Unrealized Gain (Loss) On Investment And Foreign Currency Transactions | | | | |
Net realized gain (loss) on: | | | | |
Investment transactions (including affiliated of $100) | | | (13,427,416 | ) |
Futures transactions | | | (1,858,301 | ) |
Forward currency contract transactions | | | 362,466 | |
Options written transactions | | | 14,082,223 | |
Swap agreement transactions | | | 1,277,880 | |
Foreign currency transactions | | | 558,730 | |
| | | | |
| | | 995,582 | |
| | | | |
Net change in unrealized appreciation (depreciation) on: | | | | |
Investments (including affiliated of $(365)) | | | (340,685 | ) |
Futures | | | 960,345 | |
Forward and cross currency contracts | | | (59,472 | ) |
Options written | | | 1,878,544 | |
Swap agreements | | | (3,513,603 | ) |
Foreign currencies | | | 125,860 | |
Unfunded loan commitments | | | 228 | |
| | | | |
| | | (948,783 | ) |
| | | | |
Net gain (loss) on investment and foreign currency transactions | | | 46,799 | |
| | | | |
Net Increase (Decrease) In Net Assets Resulting From Operations | | $ | 2,036,565 | |
| | | | |
See Notes to Financial Statements.
| (a) | Class specific expenses and waivers were as follows: |
| | | | | | | | | | | | | | | | |
| | | Class A | | | Class C | | | Class Z | | | Class R6 | |
Distribution fee | | | 5,306 | | | | 11,509 | | | | — | | | | — | |
Transfer agent’s fees and expenses | | | 2,834 | | | | 1,426 | | | | 43,671 | | | | 165 | |
Registration fees | | | 8,591 | | | | 7,816 | | | | 16,432 | | | | 6,653 | |
Fee waiver and/or expense reimbursement | | | (14,846 | ) | | | (11,116 | ) | | | (139,023 | ) | | | (114,637 | ) |
See Notes to Financial Statements.
| | | | |
| PGIM Global Dynamic Bond Fund | | | 65 | |
Statements of Changes in Net Assets
| | | | | | | | |
| |
| | | Year Ended
October 31, | |
| | |
| | | 2021 | | | 2020 | |
| | |
Increase (Decrease) in Net Assets | | | | | | | | |
Operations | | | | | | | | |
Net investment income (loss) | | $ | 1,989,766 | | | $ | 2,181,733 | |
Net realized gain (loss) on investment and foreign currency transactions | | | 995,582 | | | | (6,381,691 | ) |
Net change in unrealized appreciation (depreciation) on investments and foreign currencies | | | (948,783 | ) | | | (656,214 | ) |
| | | | | | | | |
Net increase (decrease) in net assets resulting from operations | | | 2,036,565 | | | | (4,856,172 | ) |
| | | | | | | | |
| | |
Dividends and Distributions | | | | | | | | |
Distributions from distributable earnings | | | | | | | | |
Class A | | | (84,135 | ) | | | (250,810 | ) |
Class C | | | (37,342 | ) | | | (90,510 | ) |
Class Z | | | (1,413,038 | ) | | | (2,213,760 | ) |
Class R6 | | | (1,513,561 | ) | | | (2,196,249 | ) |
| | | | | | | | |
| | | (3,048,076 | ) | | | (4,751,329 | ) |
| | | | | | | | |
Tax return of capital distributions | | | | | | | | |
Class A | | | — | | | | (74,416 | ) |
Class C | | | — | | | | (26,854 | ) |
Class Z | | | — | | | | (656,831 | ) |
Class R6 | | | — | | | | (651,635 | ) |
| | | | | | | | |
| | | — | | | | (1,409,736 | ) |
| | | | | | | | |
| | |
Fund share transactions (Net of share conversions) | | | | | | | | |
Net proceeds from shares sold | | | 46,855,470 | | | | 49,138,454 | |
Net asset value of shares issued in reinvestment of dividends and distributions | | | 3,041,495 | | | | 5,969,148 | |
Cost of shares purchased | | | (47,698,901 | ) | | | (55,183,534 | ) |
| | | | | | | | |
Net increase (decrease) in net assets from Fund share transactions | | | 2,198,064 | | | | (75,932 | ) |
| | | | | | | | |
Total increase (decrease) | | | 1,186,553 | | | | (11,093,169 | ) |
| | |
Net Assets: | | | | | | | | |
Beginning of year | | | 64,092,343 | | | | 75,185,512 | |
| | | | | | | | |
End of year | | $ | 65,278,896 | | | $ | 64,092,343 | |
| | | | | | | | |
See Notes to Financial Statements.
Financial Highlights
| | | | | | | | | | | | | | | | | | | | |
| Class A Shares | | | | | | | | | | | | | | | |
| | | Year Ended October 31, | |
| | | 2021 | | | 2020 | | | 2019 | | | 2018 | | | 2017 | |
| Per Share Operating Performance(a): | | | | | | | | | | | | | | | | | | | | |
| Net Asset Value, Beginning of Year | | | $9.43 | | | | $10.49 | | | | $10.03 | | | | $10.56 | | | | $9.93 | |
| Income (loss) from investment operations: | | | | | | | | | | | | | | | | | | | | |
| Net investment income (loss) | | | 0.24 | | | | 0.27 | | | | 0.24 | | | | 0.25 | | | | 0.27 | |
| Net realized and unrealized gain (loss) on investment and foreign currency transactions | | | 0.25 | | | | (0.51 | ) | | | 1.03 | | | | (0.14 | ) | | | 0.86 | |
| Total from investment operations | | | 0.49 | | | | (0.24 | ) | | | 1.27 | | | | 0.11 | | | | 1.13 | |
| Less Dividends and Distributions: | | | | | | | | | | | | | | | | | | | | |
| Dividends from net investment income | | | (0.39 | ) | | | (0.31 | ) | | | (0.81 | ) | | | (0.57 | ) | | | (0.50 | ) |
| Tax return of capital distributions | | | - | | | | (0.20 | ) | | | - | | | | - | | | | - | |
| Distributions from net realized gains | | | - | | | | (0.31 | ) | | | - | | | | (0.07 | ) | | | - | |
| Total dividends and distributions | | | (0.39 | ) | | | (0.82 | ) | | | (0.81 | ) | | | (0.64 | ) | | | (0.50 | ) |
| Net asset value, end of year | | | $9.53 | | | | $9.43 | | | | $10.49 | | | | $10.03 | | | | $10.56 | |
| Total Return(b): | | | 5.25 | % | | | (2.43 | )% | | | 13.32 | % | | | 1.00 | % | | | 11.69 | % |
| | |
| Ratios/Supplemental Data: | | | | | | | | | | |
| Net assets, end of year (000) | | | $2,018 | | | | $2,249 | | | | $8,693 | | | | $585 | | | | $397 | |
| Average net assets (000) | | | $2,122 | | | | $3,690 | | | | $2,311 | | | | $1,984 | | | | $122 | |
| Ratios to average net assets(c)(d): | | | | | | | | | | | | | | | | | | | | |
| Expenses after waivers and/or expense reimbursement | | | 1.21 | % | | | 1.21 | % | | | 1.20 | % | | | 1.20 | % | | | 1.20 | % |
| Expenses before waivers and/or expense reimbursement | | | 1.91 | % | | | 2.09 | % | | | 2.52 | % | | | 2.77 | % | | | 5.51 | % |
| Net investment income (loss) | | | 2.48 | % | | | 2.80 | % | | | 2.26 | % | | | 2.43 | % | | | 2.60 | % |
| Portfolio turnover rate(e) | | | 105 | % | | | 68 | % | | | 33 | % | | | 106 | % | | | 63 | % |
| (a) | Calculated based on average shares outstanding during the year. |
| (b) | Total return does not consider the effects of sales loads. Total return is calculated assuming a purchase of a share on the first day and a sale on the last day of each year reported and includes reinvestment of dividends and distributions, if any. Total returns may reflect adjustments to conform to GAAP. |
| (c) | Does not include expenses of the underlying funds in which the Fund invests. |
| (d) | Effective August 1, 2017, class specific expenses include transfer agent fees and expenses and registration fees, which are charged to their respective share class. |
| (e) | The Fund’s portfolio turnover rate is calculated in accordance with regulatory requirements, without regard to transactions involving short-term investments and certain derivatives. If such transactions were included, the Fund’s portfolio turnover rate may be higher. |
See Notes to Financial Statements.
| | | | |
| PGIM Global Dynamic Bond Fund | | | 67 | |
Financial Highlights (continued)
| | | | | | | | | | | | | | | | | | | | |
| Class C Shares | | | | | | | | | | | | | | | |
| | | Year Ended October 31, | |
| | | 2021 | | | 2020 | | | 2019 | | | 2018 | | | 2017 | |
| Per Share Operating Performance(a): | | | | | | | | | | �� | | | | | | | | | | |
| Net Asset Value, Beginning of Year | | | $9.41 | | | | $10.47 | | | | $10.01 | | | | $10.54 | | | | $9.93 | |
| Income (loss) from investment operations: | | | | | | | | | | | | | | | | | | | | |
| Net investment income (loss) | | | 0.17 | | | | 0.20 | | | | 0.17 | | | | 0.19 | | | | 0.21 | |
| Net realized and unrealized gain (loss) on investment and foreign currency transactions | | | 0.24 | | | | (0.51 | ) | | | 1.02 | | | | (0.16 | ) | | | 0.82 | |
| Total from investment operations | | | 0.41 | | | | (0.31 | ) | | | 1.19 | | | | 0.03 | | | | 1.03 | |
| Less Dividends and Distributions: | | | | | | | | | | | | | | | | | | | | |
| Dividends from net investment income | | | (0.31 | ) | | | (0.24 | ) | | | (0.73 | ) | | | (0.49 | ) | | | (0.42 | ) |
| Tax return of capital distributions | | | - | | | | (0.20 | ) | | | - | | | | - | | | | - | |
| Distributions from net realized gains | | | - | | | | (0.31 | ) | | | - | | | | (0.07 | ) | | | - | |
| Total dividends and distributions | | | (0.31 | ) | | | (0.75 | ) | | | (0.73 | ) | | | (0.56 | ) | | | (0.42 | ) |
| Net asset value, end of year | | | $9.51 | | | | $9.41 | | | | $10.47 | | | | $10.01 | | | | $10.54 | |
| Total Return(b): | | | 4.36 | % | | | (3.08 | )% | | | 12.48 | % | | | 0.26 | % | | | 10.65 | % |
| | |
| Ratios/Supplemental Data: | | | | | | | | | | |
| Net assets, end of year (000) | | | $932 | | | | $1,510 | | | | $1,335 | | | | $227 | | | | $71 | |
| Average net assets (000) | | | $1,151 | | | | $1,563 | | | | $465 | | | | $162 | | | | $60 | |
| Ratios to average net assets(c)(d): | | | | | | | | | | | | | | | | | | | | |
| Expenses after waivers and/or expense reimbursement | | | 1.96 | % | | | 1.96 | % | | | 1.95 | % | | | 1.95 | % | | | 1.95 | % |
| Expenses before waivers and/or expense reimbursement | | | 2.93 | % | | | 3.34 | % | | | 5.71 | % | | | 12.20 | % | | | 9.28 | % |
| Net investment income (loss) | | | 1.75 | % | | | 2.09 | % | | | 1.67 | % | | | 1.81 | % | | | 2.05 | % |
| Portfolio turnover rate(e) | | | 105 | % | | | 68 | % | | | 33 | % | | | 106 | % | | | 63 | % |
| (a) | Calculated based on average shares outstanding during the year. |
| (b) | Total return does not consider the effects of sales loads. Total return is calculated assuming a purchase of a share on the first day and a sale on the last day of each year reported and includes reinvestment of dividends and distributions, if any. Total returns may reflect adjustments to conform to GAAP. |
| (c) | Does not include expenses of the underlying funds in which the Fund invests. |
| (d) | Effective August 1, 2017, class specific expenses include transfer agent fees and expenses and registration fees, which are charged to their respective share class. |
| (e) | The Fund’s portfolio turnover rate is calculated in accordance with regulatory requirements, without regard to transactions involving short-term investments and certain derivatives. If such transactions were included, the Fund’s portfolio turnover rate may be higher. |
See Notes to Financial Statements.
| | | | | | | | | | | | | | | | | | | | |
| Class Z Shares | | | | | | | | | | | | | | | |
| | | Year Ended October 31, | |
| | | 2021 | | | 2020 | | | 2019 | | | 2018 | | | 2017 | |
| Per Share Operating Performance(a): | | | | | | | | | | | | | | | | | | | | |
| Net Asset Value, Beginning of Year | | | $9.43 | | | | $10.49 | | | | $10.03 | | | | $10.56 | | | | $9.94 | |
| Income (loss) from investment operations: | | | | | | | | | | | | | | | | | | | | |
| Net investment income (loss) | | | 0.27 | | | | 0.30 | | | | 0.22 | | | | 0.29 | | | | 0.29 | |
| Net realized and unrealized gain (loss) on investment and foreign currency transactions | | | 0.25 | | | | (0.51 | ) | | | 1.09 | | | | (0.15 | ) | | | 0.86 | |
| Total from investment operations | | | 0.52 | | | | (0.21 | ) | | | 1.31 | | | | 0.14 | | | | 1.15 | |
| Less Dividends and Distributions: | | | | | | | | | | | | | | | | | | | | |
| Dividends from net investment income | | | (0.42 | ) | | | (0.34 | ) | | | (0.85 | ) | | | (0.60 | ) | | | (0.53 | ) |
| Tax return of capital distributions | | | - | | | | (0.20 | ) | | | - | | | | - | | | | - | |
| Distributions from net realized gains | | | - | | | | (0.31 | ) | | | - | | | | (0.07 | ) | | | - | |
| Total dividends and distributions | | | (0.42 | ) | | | (0.85 | ) | | | (0.85 | ) | | | (0.67 | ) | | | (0.53 | ) |
| Net asset value, end of year | | | $9.53 | | | | $9.43 | | | | $10.49 | | | | $10.03 | | | | $10.56 | |
| Total Return(b): | | | 5.62 | % | | | (2.09 | )% | | | 13.73 | % | | | 1.33 | % | | | 11.85 | % |
| | |
| Ratios/Supplemental Data: | | | | | | | | | | |
| Net assets, end of year (000) | | | $27,633 | | | | $27,403 | | | | $31,323 | | | | $3,186 | | | | $2,578 | |
| Average net assets (000) | | | $33,100 | | | | $31,816 | | | | $11,946 | | | | $4,160 | | | | $784 | |
| Ratios to average net assets(c)(d): | | | | | | | | | | | | | | | | | | | | |
| Expenses after waivers and/or expense reimbursement | | | 0.86 | % | | | 0.86 | % | | | 0.85 | % | | | 0.87 | % | | | 0.95 | % |
| Expenses before waivers and/or expense reimbursement | | | 1.28 | % | | | 1.41 | % | | | 1.79 | % | | | 2.14 | % | | | 2.75 | % |
| Net investment income (loss) | | | 2.76 | % | | | 3.14 | % | | | 2.16 | % | | | 2.84 | % | | | 2.78 | % |
| Portfolio turnover rate(e) | | | 105 | % | | | 68 | % | | | 33 | % | | | 106 | % | | | 63 | % |
| (a) | Calculated based on average shares outstanding during the year. |
| (b) | Total return is calculated assuming a purchase of a share on the first day and a sale on the last day of each year reported and includes reinvestment of dividends and distributions, if any. Total returns may reflect adjustments to conform to GAAP. |
| (c) | Does not include expenses of the underlying funds in which the Fund invests. |
| (d) | Effective August 1, 2017, class specific expenses include transfer agent fees and expenses and registration fees, which are charged to their respective share class. |
| (e) | The Fund’s portfolio turnover rate is calculated in accordance with regulatory requirements, without regard to transactions involving short-term investments and certain derivatives. If such transactions were included, the Fund’s portfolio turnover rate may be higher. |
See Notes to Financial Statements.
| | | | |
| PGIM Global Dynamic Bond Fund | | | 69 | |
Financial Highlights (continued)
| | | | | | | | | | | | | | | | | | | | |
| Class R6 Shares | | | | | | | | | | | | | | | |
| | | Year Ended October 31, | |
| | | 2021 | | | 2020 | | | 2019 | | | 2018 | | | 2017 | |
| Per Share Operating Performance(a): | | | | | | | | | | | | | | | | | | | | |
| Net Asset Value, Beginning of Year | | | $9.42 | | | | $10.49 | | | | $10.02 | | | | $10.55 | | | | $9.93 | |
| Income (loss) from investment operations: | | | | | | | | | | | | | | | | | | | | |
| Net investment income (loss) | | | 0.28 | | | | 0.31 | | | | 0.34 | | | | 0.30 | | | | 0.32 | |
| Net realized and unrealized gain (loss) on investment and foreign currency transactions | | | 0.24 | | | | (0.52 | ) | | | 0.98 | | | | (0.16 | ) | | | 0.82 | |
| Total from investment operations | | | 0.52 | | | | (0.21 | ) | | | 1.32 | | | | 0.14 | | | | 1.14 | |
| Less Dividends and Distributions: | | | | | | | | | | | | | | | | | | | | |
| Dividends from net investment income | | | (0.42 | ) | | | (0.35 | ) | | | (0.85 | ) | | | (0.60 | ) | | | (0.52 | ) |
| Tax return of capital distributions | | | - | | | | (0.20 | ) | | | - | | | | - | | | | - | |
| Distributions from net realized gains | | | - | | | | (0.31 | ) | | | - | | | | (0.07 | ) | | | - | |
| Total dividends and distributions | | | (0.42 | ) | | | (0.86 | ) | | | (0.85 | ) | | | (0.67 | ) | | | (0.52 | ) |
| Net asset value, end of year | | | $9.52 | | | | $9.42 | | | | $10.49 | | | | $10.02 | | | | $10.55 | |
| Total Return(b): | | | 5.56 | % | | | (1.94 | )% | | | 13.79 | % | | | 1.37 | % | | | 11.86 | % |
| | |
| Ratios/Supplemental Data: | | | | | | | | | | |
| Net assets, end of year (000) | | | $34,696 | | | | $32,930 | | | | $33,833 | | | | $29,530 | | | | $29,120 | |
| Average net assets (000) | | | $34,756 | | | | $32,443 | | | | $31,497 | | | | $29,353 | | | | $27,313 | |
| Ratios to average net assets(c)(d): | | | | | | | | | | | | | | | | | | | | |
| Expenses after waivers and/or expense reimbursement | | | 0.81 | % | | | 0.81 | % | | | 0.80 | % | | | 0.83 | % | | | 0.95 | % |
| Expenses before waivers and/or expense reimbursement | | | 1.14 | % | | | 1.24 | % | | | 1.66 | % | | | 1.76 | % | | | 2.33 | % |
| Net investment income (loss) | | | 2.89 | % | | | 3.22 | % | | | 3.39 | % | | | 2.89 | % | | | 3.15 | % |
| Portfolio turnover rate(e) | | | 105 | % | | | 68 | % | | | 33 | % | | | 106 | % | | | 63 | % |
| (a) | Calculated based on average shares outstanding during the year. |
| (b) | Total return is calculated assuming a purchase of a share on the first day and a sale on the last day of each year reported and includes reinvestment of dividends and distributions, if any. Total returns may reflect adjustments to conform to GAAP. |
| (c) | Does not include expenses of the underlying funds in which the Fund invests. |
| (d) | Effective August 1, 2017, class specific expenses include transfer agent fees and expenses and registration fees, which are charged to their respective share class. |
| (e) | The Fund’s portfolio turnover rate is calculated in accordance with regulatory requirements, without regard to transactions involving short-term investments and certain derivatives. If such transactions were included, the Fund’s portfolio turnover rate may be higher. |
See Notes to Financial Statements.
Notes to Financial Statements
1. Organization
Prudential Investment Portfolios 3 (the “Registered Investment Company” or “RIC”) is registered under the Investment Company Act of 1940, as amended (“1940 Act”), as an open-end management investment company. The RIC is organized as a Delaware Statutory Trust and currently consists of six separate funds: PGIM Global Dynamic Bond Fund, PGIM Jennison Focused Growth Fund, PGIM QMA Large-Cap Value Fund, PGIM Real Assets Fund, PGIM Strategic Bond Fund and PGIM Wadhwani Systematic Absolute Return Fund. These financial statements relate only to the PGIM Global Dynamic Bond Fund (the “Fund”). The Fund is classified as a diversified fund for purposes of the 1940 Act.
The investment objective of the Fund is to seek positive returns over the long term, regardless of market conditions.
The Fund is subject to compliance with applicable regulations governing commodity pools including Commodity Futures Trading Commission (“CFTC”) rules.
2. Accounting Policies
The Fund follows the investment company accounting and reporting guidance of the Financial Accounting Standards Board (“FASB”) Accounting Standard Codification (“ASC”) Topic 946 Financial Services — Investment Companies. The following is a summary of significant accounting policies followed by the Fund in the preparation of its financial statements. The policies conform to U.S. generally accepted accounting principles (“GAAP”). The Fund consistently follows such policies in the preparation of its financial statements.
Securities Valuation: The Fund holds securities and other assets and liabilities that are fair valued as of the close of each day (generally, 4:00 PM Eastern time) the New York Stock Exchange (“NYSE”) is open for trading. As described in further detail below, the Fund’s investments are valued daily based on a number of factors, including the type of investment and whether market quotations are readily available. The RIC’s Board of Trustees (the “Board”) has adopted valuation procedures for security valuation under which fair valuation responsibilities have been delegated to PGIM Investments LLC (“PGIM Investments” or the “Manager”). Pursuant to the Board’s delegation, the Manager has established a Valuation Committee responsible for supervising the fair valuation of portfolio securities and other assets and liabilities. The valuation procedures permit the Fund to utilize independent pricing vendor services, quotations from market makers, and alternative valuation methods when market quotations are either not readily available or not deemed representative of fair value. Fair value is the price that would be received to sell an asset or paid to transfer a liability in an orderly transaction between market participants on the measurement date. A
| | | | |
| PGIM Global Dynamic Bond Fund | | | 71 | |
Notes to Financial Statements (continued)
record of the Valuation Committee’s actions is subject to the Board’s review at its first quarterly meeting following the quarter in which such actions take place.
For the fiscal reporting year-end, securities and other assets and liabilities were fair valued at the close of the last U.S. business day. Trading in certain foreign securities may occur when the NYSE is closed (including weekends and holidays). Because such foreign securities trade in markets that are open on weekends and U.S. holidays, the values of some of the Fund’s foreign investments may change on days when investors cannot purchase or redeem Fund shares.
Various inputs determine how the Fund’s investments are valued, all of which are categorized according to the three broad levels (Level 1, 2, or 3) detailed in the Schedule of Investments and referred to herein as the “fair value hierarchy” in accordance with FASB ASC Topic 820 - Fair Value Measurements and Disclosures.
Common or preferred stocks, exchange-traded funds and derivative instruments, if applicable, that are traded on a national securities exchange are valued at the last sale price as of the close of trading on the applicable exchange where the security principally trades. Securities traded via NASDAQ are valued at the NASDAQ official closing price. To the extent these securities are valued at the last sale price or NASDAQ official closing price, they are classified as Level 1 in the fair value hierarchy. In the event that no sale or official closing price on valuation date exists, these securities are generally valued at the mean between the last reported bid and ask prices, or at the last bid price in the absence of an ask price. These securities are classified as Level 2 in the fair value hierarchy.
Investments in open-end funds (other than exchange-traded funds) are valued at their net asset values as of the close of the NYSE on the date of valuation. These securities are classified as Level 1 in the fair value hierarchy since they may be purchased or sold at their net asset values on the date of valuation.
Fixed income securities traded in the OTC market are generally classified as Level 2 in the fair value hierarchy. Such fixed income securities are typically valued using the market approach which generally involves obtaining data from an approved independent third-party vendor source. The Fund utilizes the market approach as the primary method to value securities when market prices of identical or comparable instruments are available. The third-party vendors’ valuation techniques used to derive the evaluated bid price are based on evaluating observable inputs, including but not limited to, yield curves, yield spreads, credit ratings, deal terms, tranche level attributes, default rates, cash flows, prepayment speeds, broker/dealer quotations and reported trades. Certain Level 3 securities are also valued using the market approach when obtaining a single broker quote or when utilizing transaction prices for identical securities that have been used in excess of five business
days. During the reporting period, there were no changes to report with respect to the valuation approach and/or valuation techniques discussed above.
Bank loans are generally valued at prices provided by approved independent pricing vendors. The pricing vendors utilize broker/dealer quotations and provide prices based on the average of such quotations. Bank loans valued using such vendor prices are generally classified as Level 2 in the fair value hierarchy. Bank loans valued based on a single broker quote or at the original transaction price in excess of five business days are classified as Level 3 in the fair value hierarchy.
OTC and centrally cleared derivative instruments are generally classified as Level 2 in the fair value hierarchy. Such derivative instruments are typically valued using the market approach and/or income approach which generally involves obtaining data from an approved independent third-party vendor source. The Fund utilizes the market approach when quoted prices in broker-dealer markets are available but also includes consideration of alternative valuation approaches, including the income approach. In the absence of reliable market quotations, the income approach is typically utilized for purposes of valuing derivatives such as interest rate swaps based on a discounted cash flow analysis whereby the value of the instrument is equal to the present value of its future cash inflows or outflows. Such analysis includes projecting future cash flows and determining the discount rate (including the present value factors that affect the discount rate) used to discount the future cash flows. In addition, the third-party vendors’ valuation techniques used to derive the evaluated derivative price is based on evaluating observable inputs, including but not limited to, underlying asset prices, indices, spreads, interest rates and exchange rates. Certain derivatives may be classified as Level 3 when valued using the market approach by obtaining a single broker quote or when utilizing unobservable inputs in the income approach. During the reporting period, there were no changes to report with respect to the valuation approach and/or valuation techniques discussed above.
Securities and other assets that cannot be priced according to the methods described above are valued based on pricing methodologies approved by the Board. In the event that unobservable inputs are used when determining such valuations, the securities will be classified as Level 3 in the fair value hierarchy. Altering one or more unobservable inputs may result in a significant change to a Level 3 security’s fair value measurement.
When determining the fair value of securities, some of the factors influencing the valuation include: the nature of any restrictions on disposition of the securities; assessment of the general liquidity of the securities; the issuer’s financial condition and the markets in which it does business; the cost of the investment; the size of the holding and the capitalization of the issuer; the prices of any recent transactions or bids/offers for such securities or any comparable securities; any available analyst media or other reports or information deemed reliable by the Manager regarding the issuer or the markets or industry in which it operates. Using fair value to price securities may result in a value that is different from a security’s most recent closing price and from the price used by other unaffiliated mutual funds to calculate their net asset values.
| | | | |
| PGIM Global Dynamic Bond Fund | | | 73 | |
Notes to Financial Statements (continued)
Foreign Currency Translation: The books and records of the Fund are maintained in U.S. dollars. Foreign currency amounts are translated into U.S. dollars on the following basis:
(i) market value of investment securities, other assets and liabilities — at the exchange rate as of the valuation date;
(ii) purchases and sales of investment securities, income and expenses — at the rates of exchange prevailing on the respective dates of such transactions.
Although the net assets of the Fund are presented at the foreign exchange rates and market values at the close of the period, the Fund does not generally isolate that portion of the results of operations arising as a result of changes in the foreign exchange rates from the fluctuations arising from changes in the market prices of long-term portfolio securities held at the end of the period. Similarly, the Fund does not isolate the effect of changes in foreign exchange rates from the fluctuations arising from changes in the market prices of long-term portfolio securities sold during the period. Accordingly, holding period unrealized and realized foreign currency gains (losses) are included in the reported Net change in unrealized appreciation (depreciation) on investments and Net realized gains (losses) on investment transactions on the Statements of Operations. Notwithstanding the above, the Fund does isolate the effect of fluctuations in foreign currency exchange rates when determining the gain (loss) upon the sale or maturity of foreign currency denominated debt obligations; such amounts are included in net realized gains (losses) on foreign currency transactions.
Additionally, net realized gains (losses) on foreign currency transactions represent net foreign exchange gains (losses) from the disposition of holdings of foreign currencies, currency gains (losses) realized between the trade and settlement dates on investment transactions, and the difference between the amounts of interest, dividends and foreign withholding taxes recorded on the Fund’s books and the U.S. dollar equivalent amounts actually received or paid. Net unrealized currency gains (losses) arise from valuing foreign currency denominated assets and liabilities (other than investments) at period end exchange rates.
Forward and Cross Currency Contracts: A forward currency contract is a commitment to purchase or sell a foreign currency at a future date at a negotiated forward rate. The Fund enters into forward currency contracts, as defined in the prospectus, in order to hedge its exposure to changes in foreign currency exchange rates on its foreign portfolio holdings or on specific receivables and payables denominated in a foreign currency and to gain exposure to certain currencies. The contracts are valued daily at current forward exchange rates and any unrealized gain (loss) is included in net unrealized appreciation or depreciation on forward and cross currency contracts. Gain (loss) is realized on the
settlement date of the contract equal to the difference between the settlement value of the original and negotiated forward contracts. This gain (loss), if any, is included in net realized gain (loss) on forward and cross currency contract transactions. Risks may arise upon entering into these contracts from the potential inability of the counterparties to meet the terms of their contracts. Forward currency contracts involve risks from currency exchange rate and credit risk in excess of the amounts reflected on the Statement of Assets and Liabilities. The Fund’s maximum risk of loss from counterparty credit risk is the net value of the cash flows to be received from the counterparty at the end of the contract’s life. A cross currency contract is a forward contract where a specified amount of one foreign currency will be exchanged for a specified amount of another foreign currency.
Options: The Fund purchased and/or wrote options in order to hedge against adverse market movements or fluctuations in value caused by changes in prevailing interest rates, value of equities or foreign currency exchange rates with respect to securities or financial instruments which the Fund currently owns or intends to purchase. The Fund may also use options to gain additional market exposure. The Fund’s principal reason for writing options is to realize, through receipt of premiums, a greater current return than would be realized on the underlying security alone. When the Fund purchases an option, it pays a premium and an amount equal to that premium is recorded as an asset. When the Fund writes an option, it receives a premium and an amount equal to that premium is recorded as a liability. The asset or liability is adjusted daily to reflect the current market value of the option. If an option expires unexercised, the Fund realizes a gain (loss) to the extent of the premium received or paid. If an option is exercised, the premium received or paid is recorded as an adjustment to the proceeds from the sale or the cost of the purchase in determining whether the Fund has realized a gain (loss). The difference between the premium and the amount received or paid at the closing of a purchase or sale transaction is also treated as a realized gain (loss). Gain (loss) on purchased options is included in net realized gain (loss) on investment transactions. Gain (loss) on written options is presented separately as net realized gain (loss) on options written transactions.
The Fund, as writer of an option, may have no control over whether the underlying securities or financial instruments may be sold (called) or purchased (put). As a result, the Fund bears the market risk of an unfavorable change in the price of the security or financial instrument underlying the written option. The Fund, as purchaser of an OTC option, bears the risk of the potential inability of the counterparties to meet the terms of their contracts. With exchange-traded options contracts, there is minimal counterparty credit risk to the Fund since the exchanges’ clearinghouse acts as counterparty to all exchange-traded options and guarantees the options contracts against default.
When the Fund writes an option on a swap, an amount equal to any premium received by the Fund is recorded as a liability and is subsequently adjusted to the current market value of the written option on the swap. If a call option on a swap is exercised, the Fund becomes obligated to pay a fixed interest rate (noted as the strike price) and receive a variable interest rate on a notional amount. If a put option on a swap is exercised, the Fund becomes obligated to pay a variable interest rate and receive a fixed interest rate (noted as the strike
| | | | |
| PGIM Global Dynamic Bond Fund | | | 75 | |
Notes to Financial Statements (continued)
price) on a notional amount. Premiums received from writing options on swaps that expire or are exercised are treated as realized gains upon the expiration or exercise of such options on swaps. The risk associated with writing put and call options on swaps is that the Fund will be obligated to be party to a swap agreement if an option on a swap is exercised.
Financial Futures Contracts: A financial futures contract is an agreement to purchase (long) or sell (short) an agreed amount of securities at a set price for delivery on a future date. Upon entering into a financial futures contract, the Fund is required to pledge to the broker an amount of cash and/or other assets equal to a certain percentage of the contract amount. This amount is known as the “initial margin.” Subsequent payments, known as “variation margin,” are made or received by the Fund each day, depending on the daily fluctuations in the value of the underlying security. Such variation margin is recorded for financial statement purposes on a daily basis as unrealized gain (loss). When the contract expires or is closed, the gain (loss) is realized and is presented in the Statement of Operations as net realized gain (loss) on futures transactions.
The Fund invested in financial futures contracts in order to hedge its existing portfolio securities, or securities the Fund intends to purchase, against fluctuations in value caused by changes in prevailing interest rates. Should interest rates move unexpectedly, the Fund may not achieve the anticipated benefits of the financial futures contracts and may realize a loss. The use of futures transactions involves the risk of imperfect correlation in movements in the price of futures contracts, interest rates and the underlying hedged assets. Since futures contracts are exchange-traded, there is minimal counterparty credit risk to the Fund since the exchanges’ clearinghouse acts as counterparty to all exchange-traded futures and guarantees the futures contracts against default.
Swap Agreements: The Fund entered into certain types of swap agreements detailed in the disclosures below. A swap agreement is an agreement to exchange the return generated by one instrument for the return generated by another instrument. Swap agreements are negotiated in the OTC market and may be executed either directly with a counterparty (“OTC-traded”) or through a central clearing facility, such as a registered exchange. Swap agreements are valued daily at current market value and any change in value is included in the net unrealized appreciation or depreciation on swap agreements. Centrally cleared swaps pay or receive an amount known as “variation margin”, based on daily changes in the valuation of the swap contract. For OTC-traded, upfront premiums paid and received are shown as swap premiums paid and swap premiums received in the Statement of Assets and Liabilities. Risk of loss may exceed amounts recognized on the Statement of Assets and Liabilities. Swap agreements outstanding at period end, if any, are listed on the Schedule of Investments.
Interest Rate Swaps: Interest rate swaps represent an agreement between counterparties to exchange cash flows based on the difference between two interest rates, applied to a notional principal amount for a specified period. The Fund is subject to interest rate risk exposure in the normal course of pursuing its investment objective. The Fund used interest rate swaps to maintain its ability to generate steady cash flow by receiving a stream of fixed rate payments or to increase exposure to prevailing market rates by receiving floating rate payments. The Fund’s maximum risk of loss from counterparty credit risk is the discounted net present value of the cash flows to be received from the counterparty over the contract’s remaining life.
Inflation Swaps: The Fund entered into inflation swap agreements to protect against fluctuations in inflation rates. Inflation swaps are characterized by one party paying a fixed rate in exchange for a floating rate that is derived from an inflation index, such as the Consumer Price Index or UK Retail Price Index. Inflation swaps subject the Fund to interest rate risk.
Credit Default Swaps (“CDS”): CDS involve one party (the protection buyer) making a stream of payments to another party (the protection seller) in exchange for the right to receive a specified payment in the event of a default or as a result of a default (collectively a “credit event”) for the referenced entity (typically corporate issues or sovereign issues of an emerging country) on its obligation; or in the event of a write-down, principal shortfall, interest shortfall or default of all or part of the referenced entities comprising a credit index.
The Fund is subject to credit risk in the normal course of pursuing its investment objectives, and as such, has entered into CDS contracts to provide a measure of protection against defaults or to take an active long or short position with respect to the likelihood of a particular issuer’s default or the reference entity’s credit soundness. CDS contracts generally trade based on a spread which represents the cost a protection buyer has to pay the protection seller. The protection buyer is said to be short the credit as the value of the contract rises the more the credit deteriorates. The value of the CDS contract increases for the protection buyer if the spread increases. The Fund’s maximum risk of loss from counterparty credit risk for purchased CDS is the inability of the counterparty to honor the contract up to the notional value due to a credit event.
As a seller of protection on credit default swap agreements, the Fund generally receives an agreed upon payment from the buyer of protection throughout the term of the swap, provided no credit event occurs. As the seller, the Fund effectively increases its investment risk because, in addition to its total net assets, the Fund may be subject to investment exposure on the notional amount of the swap.
The maximum amount of the payment that the Fund, as a seller of protection, could be required to make under a credit default swap agreement would be equal to the notional amount of the underlying security or index contract as a result of a credit event. This potential amount will be partially offset by any recovery values of the respective referenced obligations, or net amounts received from the settlement of buy protection credit default
| | | | |
| PGIM Global Dynamic Bond Fund | | | 77 | |
Notes to Financial Statements (continued)
swap agreements which the Fund entered into for the same referenced entity or index. As a buyer of protection, the Fund generally receives an amount up to the notional value of the swap if a credit event occurs.
Implied credit spreads, represented in absolute terms, utilized in determining the market value of credit default swap agreements where the Fund is the seller of protection as of period end are disclosed in the footnotes to the Schedule of Investments, if applicable. These spreads serve as indicators of the current status of the payment/performance risk and represent the likelihood of default risk for the credit derivative. The implied credit spread of a particular referenced entity reflects the cost of buying/selling protection and may include upfront payments required to enter into the agreement. Wider credit spreads and increased market value in absolute terms, when compared to the notional amount of the swap, represent a deterioration of the referenced entity’s credit soundness and a greater likelihood of risk of default or other credit event occurring as defined under the terms of the agreement.
Currency Swaps: The Fund entered into currency swap agreements primarily to gain yield exposure on foreign bonds. Currency swap agreements involve two parties exchanging two different currencies with an agreement to reverse the exchange at a later date at specified exchange rates.
Bank Loans: The Fund invested in bank loans. Bank loans include fixed and floating rate loans that are privately negotiated between a corporate borrower and one or more financial institutions, including, but not limited to, term loans, revolvers, and other instruments issued in the bank loan market. The Fund acquires interests in loans directly (by way of assignment from the selling institution) and/or indirectly (by way of the purchase of a participation interest from the selling institution). Under a bank loan assignment, the Fund generally will succeed to all the rights and obligations of an assigning lending institution and becomes a lender under the loan agreement with the relevant borrower in connection with that loan. Under a bank loan participation, the Fund generally will have a contractual relationship only with the lender, not with the relevant borrower. As a result, the Fund generally will have the right to receive payments of principal, interest, and any fees to which it is entitled only from the lender selling the participation and only upon receipt by the lender of the payments from the relevant borrower. The Fund may not directly benefit from the collateral supporting the debt obligation in which it has purchased the participation. As a result, the Fund will assume the credit risk of both the borrower and the institution selling the participation to the Fund.
Mortgage-Backed and Asset-Backed Securities: Mortgage-backed securities are pass-through securities, meaning that principal and interest payments made by the borrower on the underlying mortgages are passed through to the Fund. Asset-backed securities directly or indirectly represent a participation interest in, or are secured by and
payable from, a stream of payments generated by particular assets such as motor vehicle or credit card receivables. Asset-backed securities may be classified as pass-through certificates or collateralized obligations, such as collateralized bond obligations, collateralized loan obligations and other similarly structured securities. The value of mortgage-backed and asset-backed securities varies with changes in interest rates and may be affected by changes in credit quality or value of the mortgage loans or other assets that support the securities.
Stripped mortgage-backed securities are usually structured with two classes that receive different proportions of the interest (“IO”) and principal (“PO”) distributions on a pool of mortgage assets. Payments received for IOs are included in interest income on the Statements of Operations. Because no principal will be received at the maturity of an IO, adjustments are made to the cost of the security on a monthly basis until maturity. These adjustments are included in interest income on the Statements of Operations. Payments received for POs are treated as reductions to the cost and par value of the securities.
Master Netting Arrangements: The RIC, on behalf of the Fund, is subject to various Master Agreements, or netting arrangements, with select counterparties. These are agreements which a subadviser may have negotiated and entered into on behalf of all or a portion of the Fund. A master netting arrangement between the Fund and the counterparty permits the Fund to offset amounts payable by the Fund to the same counterparty against amounts to be received; and by the receipt of collateral from the counterparty by the Fund to cover the Fund’s exposure to the counterparty. However, there is no assurance that such mitigating factors are easily enforceable. In addition to master netting arrangements, the right to set-off exists when all the conditions are met such that each of the parties owes the other determinable amounts, the reporting party has the right to set-off the amount owed with the amount owed by the other party, the reporting party intends to set-off and the right of set-off is enforceable by law.
The Trust, on behalf of the Fund, is a party to International Swaps and Derivatives Association, Inc. (“ISDA”) Master Agreements with certain counterparties that govern OTC derivative and foreign exchange contracts entered into from time to time. The Master Agreements may contain provisions regarding, among other things, the parties’ general obligations, representations, agreements, collateral requirements, events of default and early termination. With respect to certain counterparties, in accordance with the terms of the Master Agreements, collateral posted to the Fund is held in a segregated account by the Fund’s custodian and with respect to those amounts which can be sold or re-pledged, is presented in the Schedule of Investments. Collateral pledged by the Fund is segregated by the Fund’s custodian and identified in the Schedule of Investments. Collateral can be in the form of cash or debt securities issued by the U.S. Government or related agencies or other securities as agreed to by the Fund and the applicable counterparty. Collateral requirements are determined based on the Fund’s net position with each counterparty. Termination events applicable to the Fund may occur upon a decline in the Fund’s net assets below a specified threshold over a certain period of time. Termination events applicable to counterparties may occur upon a decline in the counterparty’s long-term and short-term credit ratings below a
| | | | |
| PGIM Global Dynamic Bond Fund | | | 79 | |
Notes to Financial Statements (continued)
specified level. In each case, upon occurrence, the other party may elect to terminate early and cause settlement of all derivative and foreign exchange contracts outstanding, including the payment of any losses and costs resulting from such early termination, as reasonably determined by the terminating party. Any decision by one or more of the Fund’s counterparties to elect early termination could impact the Fund’s future derivative activity.
In addition to each instrument’s primary underlying risk exposure (e.g. interest rate, credit, equity or foreign exchange, etc.), swap agreements involve, to varying degrees, elements of credit, market and documentation risk. Such risks involve the possibility that no liquid market for these agreements will exist, the counterparty to the agreement may default on its obligation to perform or disagree on the contractual terms of the agreement, and changes in net interest rates will be unfavorable. In connection with these agreements, securities in the portfolio may be identified or received as collateral from the counterparty in accordance with the terms of the respective swap agreements to provide or receive assets of value and to serve as recourse in the event of default or bankruptcy/insolvency of either party. Such OTC derivative agreements include conditions which, when materialized, give the counterparty the right to cause an early termination of the transactions under those agreements. Any election by the counterparty for early termination of the contract(s) may impact the amounts reported on financial statements.
Short sales and OTC contracts, including forward foreign currency exchange contracts, swaps, forward rate agreements and written options involve elements of both market and credit risk in excess of the amounts reflected on the Statement of Assets and Liabilities, if applicable. Such risks may be mitigated by engaging in master netting arrangements.
Warrants: The Fund held warrants acquired either through a direct purchase or pursuant to corporate actions. Warrants entitle the holder to buy a proportionate amount of common stock, or such other security that the issuer may specify, at a specific price and time through the expiration dates. Such warrants are held as long positions by the Fund until exercised, sold or expired. Warrants are valued at fair value in accordance with the Board approved fair valuation procedures.
Payment-In-Kind: The Fund invested in the open market or received pursuant to debt restructuring, securities that pay-in-kind (PIK) the interest due on such debt instruments. The PIK interest, computed at the contractual rate specified, is added to the existing principal balance of the debt when issued bonds have same terms as the bond or recorded as a separate bond when terms are different from the existing debt, and is recorded as interest income.
Securities Lending: The Fund lends its portfolio securities to banks and broker-dealers. The loans are secured by collateral at least equal to the market value of the securities loaned.
Collateral pledged by each borrower is invested in an affiliated money market fund and is marked to market daily, based on the previous day’s market value, such that the value of the collateral exceeds the value of the loaned securities. In the event of significant appreciation in value of securities on loan on the last business day of the reporting period, the financial statements may reflect a collateral value that is less than the market value of the loaned securities. Such shortfall is remedied as described above. Loans are subject to termination at the option of the borrower or the Fund. Upon termination of the loan, the borrower will return to the Fund securities identical to the loaned securities. The remaining maturities of the securities lending transactions are considered overnight and continuous. Should the borrower of the securities fail financially, the Fund has the right to repurchase the securities in the open market using the collateral.
The Fund recognizes income, net of any rebate and securities lending agent fees, for lending its securities in the form of fees or interest on the investment of any cash received as collateral. The borrower receives all interest and dividends from the securities loaned and such payments are passed back to the lender in amounts equivalent thereto, which are reflected in interest income or unaffiliated dividend income based on the nature of the payment on the Statement of Operations. The Fund also continues to recognize any unrealized gain (loss) in the market price of the securities loaned and on the change in the value of the collateral invested that may occur during the term of the loan. In addition, realized gain (loss) is recognized on changes in the value of the collateral invested upon liquidation of the collateral. Net earnings from securities lending are disclosed in the Statement of Operations.
Securities Transactions and Net Investment Income: Securities transactions are recorded on the trade date. Realized gains (losses) from investment and currency transactions are calculated on the specific identification method. Dividend income is recorded on the ex-date, or for certain foreign securities, when the Fund becomes aware of such dividends. Interest income, including amortization of premium and accretion of discount on debt securities, as required, is recorded on the accrual basis. Expenses are recorded on an accrual basis, which may require the use of certain estimates by management that may differ from actual. Net investment income or loss (other than class specific expenses and waivers, which are allocated as noted below) and unrealized and realized gains (losses) are allocated daily to each class of shares based upon the relative proportion of adjusted net assets of each class at the beginning of the day. Class specific expenses and waivers, where applicable, are charged to the respective share classes. Such class specific expenses and waivers include distribution fees and distribution fee waivers, shareholder servicing fees, transfer agent’s fees and expenses, registration fees and fee waivers and/or expense reimbursements, as applicable.
Taxes: It is the Fund’s policy to continue to meet the requirements of the Internal Revenue Code applicable to regulated investment companies and to distribute all of its taxable net investment income and capital gains, if any, to its shareholders. Therefore, no federal
| | | | |
| PGIM Global Dynamic Bond Fund | | | 81 | |
Notes to Financial Statements (continued)
income tax provision is required. Withholding taxes on foreign dividends, interest and capital gains, if any, are recorded, net of reclaimable amounts, at the time the related income is earned.
Dividends and Distributions: The Fund expects to declare dividends of its net investment income daily and pay such dividends monthly. Distributions of net realized capital and currency gains, if any, are declared and paid at least annually. Dividends and distributions to shareholders, which are determined in accordance with federal income tax regulations and which may differ from GAAP, are recorded on the ex-date. Permanent book/tax differences relating to income and gain (loss) are reclassified between total distributable earnings (loss) and paid-in capital in excess of par, as appropriate.
Estimates: The preparation of financial statements requires management to make estimates and assumptions that affect the reported amounts and disclosures in the financial statements. Actual results could differ from those estimates.
3. Agreements
The RIC, on behalf of the Fund, has a management agreement with the Manager. Pursuant to this agreement, the Manager has responsibility for all investment advisory services and supervises the subadvisers’ performance of such services.
The Manager has entered into a subadvisory agreement with PGIM, Inc., which provides subadvisory services to the Fund through its PGIM Fixed Income unit, and PGIM, Inc. has entered into a sub-subadvisory agreement with PGIM Limited (each a “subadviser” and collectively the “subadvisers”). The Manager pays for the services of the subadvisers.
The management fee paid to the Manager is accrued daily and payable monthly at an annual rate of 0.70% of the Fund’s average daily net assets up to and including $2.5 billion, 0.675% of the next $2.5 billion and 0.65% of the average daily net assets in excess of $5 billion. The effective management fee rate before any waivers and/or expense reimbursements was 0.70% for the year ended October 31, 2021.
The Manager has contractually agreed, through February 28, 2023, to limit total annual operating expenses after fee waivers and/or expense reimbursements to 1.20% of average daily net assets for Class A shares, 1.95% of average daily net assets for Class C shares, 0.85% of average daily net assets for Class Z shares and 0.80% of average daily net assets for Class R6 shares. This contractual waiver excludes interest, brokerage, taxes (such as income and foreign withholding taxes, stamp duty and deferred tax expenses), acquired fund fees and expenses, extraordinary expenses, and certain other Fund expenses such as dividend and interest expense and broker charges on short sales.
Where applicable, the Manager agrees to waive management fees or shared operating expenses on any share class to the same extent that it waives similar expenses on any other share class. In addition, total annual operating expenses for Class R6 shares will not exceed total annual operating expenses for Class Z shares. Fees and/or expenses waived and/or reimbursed by the Manager may be recouped by the Manager within the same fiscal year during which such waiver and/or reimbursement is made if such recoupment can be realized without exceeding the expense limit in effect at the time of the recoupment for that fiscal year.
The Trust, on behalf of the Fund, has a distribution agreement with Prudential Investment Management Services LLC (“PIMS”), which acts as the distributor of the Class A, Class C, Class Z and Class R6 shares of the Fund. The Fund compensates PIMS for distributing and servicing the Fund’s Class A and Class C shares, pursuant to the plans of distribution (the “Distribution Plans”), regardless of expenses actually incurred by PIMS.
Pursuant to the Distribution Plans, the Fund compensates PIMS for distribution related activities at an annual rate of up to 0.25% and 1% of the average daily net assets of the Class A and Class C shares, respectively. The distribution fees are accrued daily and payable monthly. No distribution or service fees are paid to PIMS as distributor of the Class Z or Class R6 shares of the Fund.
For the year ended October 31, 2021, PIMS received $5,243 in front-end sales charges resulting from sales of Class A shares. Additionally, for the year ended October 31, 2021, PIMS received $201 in contingent deferred sales charges imposed upon redemptions by certain Class C shareholders. From these fees, PIMS paid such sales charges to broker-dealers, who in turn paid commissions to salespersons and incurred other distribution costs.
PGIM Investments, PGIM, Inc., PGIM Limited and PIMS are indirect, wholly-owned subsidiaries of Prudential Financial, Inc. (“Prudential”).
4. Other Transactions with Affiliates
Prudential Mutual Fund Services LLC (“PMFS”), an affiliate of PGIM Investments and an indirect, wholly-owned subsidiary of Prudential, serves as the Fund’s transfer agent. Transfer agent’s fees and expenses in the Statement of Operations include certain out-of-pocket expenses paid to non-affiliates, where applicable.
The Fund may invest its overnight sweep cash in the PGIM Core Ultra Short Bond Fund (the “Core Fund”), and its securities lending cash collateral in the PGIM Institutional Money Market Fund (the “Money Market Fund”), each a fund of Prudential Investment Portfolios 2, registered under the 1940 Act and managed by PGIM Investments. PGIM Investments and/or its affiliates are paid fees or reimbursed for providing their services to the Core Fund. In addition to the realized and unrealized gains on investments in the Core Fund and Money
| | | | |
| PGIM Global Dynamic Bond Fund | | | 83 | |
Notes to Financial Statements (continued)
Market Fund, earnings from such investments are disclosed on the Statement of Operations as “Affiliated dividend income” and “Income from securities lending, net”, respectively.
The Fund may enter into certain securities purchase or sale transactions under Board approved Rule 17a-7 procedures. Rule 17a-7 is an exemptive rule under the 1940 Act, that subject to certain conditions, permits purchase and sale transactions among affiliated investment companies, or between an investment company and a person that is affiliated solely by reason of having a common (or affiliated) investment adviser, common directors/trustees, and/or common officers. For the year ended October 31, 2021, no 17a-7 transactions were entered into by the Fund.
5. Portfolio Securities
The aggregate cost of purchases and proceeds from sales of portfolio securities (excluding short-term investments and U.S. Government securities) for the year ended October 31, 2021, were $75,632,743 and $72,754,551, respectively.
A summary of the cost of purchases and proceeds from sales of shares of affiliated mutual funds for the year ended October 31, 2021, is presented as follows:
| | | | | | | | | | | | | | | | | | | | | | | | | | | | | | |
Value,
Beginning
of Year | | | Cost of
Purchases | | | Proceeds
from Sales | | | Change in
Unrealized
Gain
(Loss) | | | Realized
Gain
(Loss) | | | Value,
End of Year | | | Shares,
End
of Year | | | Income | |
| | | |
| | Short-Term Investments - Affiliated Mutual Funds: | | | | | | | | | | | | | |
|
| | PGIM Core Ultra Short Bond Fund (1)(wa) | |
| $ | 905,638 | | | $ | 64,284,201 | | | $ | 64,272,858 | | | $ | — | | | $ | — | | | $ | 916,981 | | | | 916,981 | | | $ | 3,149 | |
| | | |
| | PGIM Institutional Money Market Fund (1)(b)(wa) | | | | | | | | | | | | | |
| | 262,826 | | | | 4,088,269 | | | | 4,350,830 | | | | (365 | ) | | | 100 | | | | — | | | | — | | | | 292 | (2) |
| | | | | | | | | | | | | | | | | | | | | | | | | | | | | | |
| $ | 1,168,464 | | | $ | 68,372,470 | | | $ | 68,623,688 | | | $ | (365 | ) | | $ | 100 | | | $ | 916,981 | | | | | | | $ | 3,441 | |
| | | | | | | | | | | | | | | | | | | | | | | | | | | | | | |
| (1) | The Fund did not have any capital gain distributions during the reporting period. |
| (2) | The amount, or a portion thereof, represents the affiliated securities lending income shown on the Statement of Operations. |
| (b) | Represents security, or portion thereof, purchased with cash collateral received for securities on loan and includes dividend reinvestment. |
| (wa) | PGIM Investments LLC, the manager of the Fund, also serves as manager of the PGIM Core Ultra Short Bond Fund and PGIM Institutional Money Market Fund, if applicable. |
6. Distributions and Tax Information
Distributions to shareholders, which are determined in accordance with federal income tax regulations and which may differ from GAAP, are recorded on the ex-date.
For the year ended October 31, 2021, the tax character of dividends paid by the Fund was $3,048,076 of ordinary income. For the year ended October 31, 2020, the tax character of dividends paid by the Fund were $4,751,329 of ordinary income and $1,409,736 of tax return of capital.
As of October 31, 2021, the accumulated undistributed earnings on a tax basis was $491,851 of ordinary income.
The United States federal income tax basis of the Fund’s investments and the net unrealized depreciation as of October 31, 2021 were as follows:
| | | | | | |
| Tax Basis | | Gross
Unrealized
Appreciation | | Gross
Unrealized
Depreciation | | Net
Unrealized
Depreciation |
| $64,607,998 | | $7,123,349 | | $(8,773,840) | | $(1,650,491) |
The differences between book basis and tax basis were primarily attributable to deferred losses on wash sales, straddles, mark-to-market of futures and forwards, amortization of bond premium and swaps.
For federal income tax purposes, the Fund had a capital loss carryforward as of October 31, 2021 of approximately $6,753,000 which can be carried forward for an unlimited period. The Fund utilized approximately $95,000 of its capital loss carryforward to offset net taxable gains realized in the fiscal year ended October 31, 2021. No capital gains distributions are expected to be paid to shareholders until net gains have been realized in excess of such losses.
The Manager has analyzed the Fund’s tax positions taken on federal, state and local income tax returns for all open tax years and has concluded that no provision for income tax is required in the Fund’s financial statements for the current reporting period. Since tax authorities can examine previously filed tax returns, the Fund’s U.S. federal and state tax returns for each of the four fiscal years up to the most recent fiscal year ended October 31, 2021 are subject to such review.
7. Capital and Ownership
The Fund offers Class A, Class C, Class Z and Class R6 shares. Class A shares are sold with a maximum front-end sales charge of 3.25%. Investors who purchase $500,000 or more of Class A shares and sell those shares within 12 months of purchase are subject to a contingent deferred sales charge (“CDSC”) of 1.00% on sales although these purchases are not subject to a front-end sales charge. The Class A CDSC is waived for certain retirement and/or benefit plans. A special exchange privilege is also available for shareholders who qualified to purchase Class A shares at net asset value. Class C shares are sold with a CDSC of 1% on sales made within 12 months of purchase. Class C shares will automatically convert to Class A shares on a monthly basis approximately eight years (ten years prior to
| | | | |
| PGIM Global Dynamic Bond Fund | | | 85 | |
Notes to Financial Statements (continued)
January 22, 2021) after purchase. Class Z and Class R6 shares are not subject to any sales or redemption charges and are available exclusively for sale to a limited group of investors.
Under certain circumstances, an exchange may be made from specified share classes of the Fund to one or more other share classes of the Fund as presented in the table of transactions in shares of beneficial interest, below.
The Trust has authorized an unlimited number of shares of beneficial interest of the Fund at $0.001 par value per share, currently divided into four classes, designated Class A, Class C, Class Z and Class R6.
As of October 31, 2021, Prudential, through its affiliated entities, including affiliated funds (if applicable), owned shares of the Fund as follows:
| | | | |
| | | Number of Shares | | Percentage of Outstanding Shares |
Class R6 | | 3,639,558 | | 99.9% |
At the reporting period end, the number of shareholders holding greater than 5% of the Fund are as follows:
| | | | | | |
| | |
| Affiliated | | Unaffiliated |
| | | | |
Number of Shareholders | | Percentage of Outstanding Shares | | Number of Shareholders | | Percentage of Outstanding Shares |
1 | | 53.1% | | 4 | | 42.2% |
Transactions in shares of beneficial interest were as follows:
| | | | | | | | |
Class A | | Shares | | | Amount | |
| | |
Year ended October 31, 2021: | | | | | | | | |
Shares sold | | | 76,666 | | | $ | 749,059 | |
Shares issued in reinvestment of dividends and distributions | | | 8,327 | | | | 81,124 | |
Shares purchased | | | (84,830 | ) | | | (830,537 | ) |
| | | | | | | | |
Net increase (decrease) in shares outstanding before conversion | | | 163 | | | | (354 | ) |
Shares issued upon conversion from other share class(es) | | | 4,054 | | | | 39,214 | |
Shares purchased upon conversion into other share class(es) | | | (31,031 | ) | | | (307,521 | ) |
| | | | | | | | |
Net increase (decrease) in shares outstanding | | | (26,814 | ) | | $ | (268,661 | ) |
| | | | | | | | |
| | |
Year ended October 31, 2020: | | | | | | | | |
Shares sold | | | 489,479 | | | $ | 4,873,797 | |
Shares issued in reinvestment of dividends and distributions | | | 24,873 | | | | 243,925 | |
Shares purchased | | | (1,105,338 | ) | | | (11,062,465 | ) |
| | | | | | | | |
Net increase (decrease) in shares outstanding before conversion | | | (590,986 | ) | | | (5,944,743 | ) |
Shares issued upon conversion from other share class(es) | | | 819 | | | | 7,056 | |
Shares purchased upon conversion into other share class(es) | | | (355 | ) | | | (3,644 | ) |
| | | | | | | | |
Net increase (decrease) in shares outstanding | | | (590,522 | ) | | $ | (5,941,331 | ) |
| | | | | | | | |
| | | | | | | | |
Class C | | Shares | | | Amount | |
| | |
Year ended October 31, 2021: | | | | | | | | |
Shares sold | | | 23,652 | | | $ | 230,769 | |
Shares issued in reinvestment of dividends and distributions | | | 3,830 | | | | 37,260 | |
Shares purchased | | | (85,666 | ) | | | (835,258 | ) |
| | | | | | | | |
Net increase (decrease) in shares outstanding before conversion | | | (58,184 | ) | | | (567,229 | ) |
Shares purchased upon conversion into other share class(es) | | | (4,353 | ) | | | (42,078 | ) |
| | | | | | | | |
Net increase (decrease) in shares outstanding | | | (62,537 | ) | | $ | (609,307 | ) |
| | | | | | | | |
| | |
Year ended October 31, 2020: | | | | | | | | |
Shares sold | | | 62,954 | | | $ | 622,312 | |
Shares issued in reinvestment of dividends and distributions | | | 12,010 | | | | 117,353 | |
Shares purchased | | | (41,588 | ) | | | (377,696 | ) |
| | | | | | | | |
Net increase (decrease) in shares outstanding before conversion | | | 33,376 | | | | 361,969 | |
Shares purchased upon conversion into other share class(es) | | | (434 | ) | | | (4,078 | ) |
| | | | | | | | |
Net increase (decrease) in shares outstanding | | | 32,942 | | | $ | 357,891 | |
| | | | | | | | |
Class Z | | | | | | |
Year ended October 31, 2021: | | | | | | | | |
Shares sold | | | 4,575,380 | | | $ | 45,396,536 | |
Shares issued in reinvestment of dividends and distributions | | | 145,192 | | | | 1,409,573 | |
Shares purchased | | | (4,758,776 | ) | | | (45,469,931 | ) |
| | | | | | | | |
Net increase (decrease) in shares outstanding before conversion | | | (38,204 | ) | | | 1,336,178 | |
Shares issued upon conversion from other share class(es) | | | 31,321 | | | | 310,385 | |
| | | | | | | | |
Net increase (decrease) in shares outstanding | | | (6,883 | ) | | $ | 1,646,563 | |
| | | | | | | | |
Year ended October 31, 2020: | | | | | | | | |
Shares sold | | | 4,310,985 | | | $ | 42,875,773 | |
Shares issued in reinvestment of dividends and distributions | | | 291,485 | | | | 2,863,039 | |
Shares purchased | | | (4,681,601 | ) | | | (42,932,466 | ) |
| | | | | | | | |
Net increase (decrease) in shares outstanding before conversion | | | (79,131 | ) | | | 2,806,346 | |
Shares issued upon conversion from other share class(es) | | | 789 | | | | 7,722 | |
Shares purchased upon conversion into other share class(es) | | | (819 | ) | | | (7,056 | ) |
| | | | | | | | |
Net increase (decrease) in shares outstanding | | | (79,161 | ) | | $ | 2,807,012 | |
| | | | | | | | |
Class R6 | | | | | | |
Year ended October 31, 2021: | | | | | | | | |
Shares sold | | | 49,794 | | | $ | 479,106 | |
Shares issued in reinvestment of dividends and distributions | | | 155,595 | | | | 1,513,538 | |
Shares purchased | | | (57,998 | ) | | | (563,175 | ) |
| | | | | | | | |
Net increase (decrease) in shares outstanding | | | 147,391 | | | $ | 1,429,469 | |
| | | | | | | | |
Year ended October 31, 2020: | | | | | | | | |
Shares sold | | | 78,210 | | | $ | 766,572 | |
Shares issued in reinvestment of dividends and distributions | | | 281,169 | | | | 2,744,831 | |
Shares purchased | | | (89,091 | ) | | | (810,907 | ) |
| | | | | | | | |
Net increase (decrease) in shares outstanding | | | 270,288 | | | $ | 2,700,496 | |
| | | | | | | | |
8. Borrowings
The Trust, on behalf of the Fund, along with other affiliated registered investment companies (the “Participating Funds”), is a party to a Syndicated Credit Agreement (“SCA”) with a group of banks. The purpose of the SCA is to provide an alternative source of temporary
| | | | |
| PGIM Global Dynamic Bond Fund | | | 87 | |
Notes to Financial Statements (continued)
funding for capital share redemptions. The table below provides details of the current SCA in effect at the reporting period-end as well as the prior SCA.
| | | | |
| | | Current SCA | | Prior SCA |
| Term of Commitment | | 10/1/2021 – 9/29/2022 | | 10/2/2020 – 9/30/2021 |
| Total Commitment | | $ 1,200,000,000 | | $ 1,200,000,000 |
| Annualized Commitment Fee on the Unused Portion of the SCA | | 0.15% | | 0.15% |
| Annualized Interest Rate on Borrowings | | 1.20% plus the higher of (1) the effective federal funds rate, (2) the one-month LIBOR rate or (3) zero percent | | 1.30% plus the higher of (1) the effective federal funds rate, (2) the one-month LIBOR rate or (3) zero percent |
Certain affiliated registered investment companies that are parties to the SCA include portfolios that are subject to a predetermined mathematical formula used to manage certain benefit guarantees offered under variable annuity contracts. The formula may result in large scale asset flows into and out of these portfolios. Consequently, these portfolios may be more likely to utilize the SCA for purposes of funding redemptions. It may be possible for those portfolios to fully exhaust the committed amount of the SCA, thereby requiring the Manager to allocate available funding per a Board-approved methodology designed to treat the Participating Funds in the SCA equitably.
The Fund utilized the SCA during the year ended October 31, 2021. The average daily balance for the 13 days that the Fund had loans outstanding during the period was approximately $10,687,000, borrowed at a weighted average interest rate of 1.41%. The maximum loan outstanding amount during the period was $19,420,000. At October 31, 2021, the Fund did not have an outstanding loan amount.
9. Risks of Investing in the Fund
The Fund’s risks include, but are not limited to, some or all of the risks discussed below. For further information on the Fund’s risks, please refer to the Fund’s Prospectus and Statement of Additional Information.
Bank Loan Investments Risk: The Fund’s ability to receive payments of principal and interest and other amounts in connection with loans (whether through participations, assignments or otherwise) will depend primarily on the financial condition of the borrower. The failure by the Fund to receive scheduled interest or principal payments on a loan because of a default, bankruptcy or any other reason would adversely affect the income of the Fund and would likely reduce the value of its assets. Even with loans secured by collateral, there is the risk that the value of the collateral may decline, may be insufficient to meet the obligations of the borrower, or be difficult to liquidate. In the event of a default, the Fund may have difficulty collecting on any collateral and would not have the ability to collect
on any collateral for an uncollateralized loan. Further, the Fund’s access to collateral, if any, may be limited by bankruptcy laws. Due to the nature of the private syndication of senior loans, including, for example, lack of publicly-available information, some senior loans are not as easily purchased or sold as publicly-traded securities. In addition, loan participations generally are subject to restrictions on transfer, and only limited opportunities may exist to sell loan participations in secondary markets. As a result, it may be difficult for the Fund to value loans or sell loans at an acceptable price when it wants to sell them. Loans trade in an over-the-counter market, and confirmation and settlement, which are effected through standardized procedures and documentation, may take significantly longer than seven days to complete. Extended trade settlement periods may, in unusual market conditions with a high volume of shareholder redemptions, present a risk to shareholders regarding the Fund’s ability to pay redemption proceeds in a timely manner. In some instances, loans and loan participations are not rated by independent credit rating agencies; in such instances, a decision by the Fund to invest in a particular loan or loan participation could depend exclusively on the subadviser’s credit analysis of the borrower, or in the case of a loan participation, of the intermediary holding the portion of the loan that the Fund has purchased. To the extent the Fund invests in loans of non-U.S. issuers, the risks of investing in non-U.S. issuers are applicable. Loans may not be considered to be “securities” and as a result may not benefit from the protections of the federal securities laws, including anti-fraud protections and those with respect to the use of material non-public information, so that purchasers, such as the Fund, may not have the benefit of these protections. If the Fund is in possession of material non-public information about a borrower as a result of its investment in such borrower’s loan, the Fund may not be able to enter into a transaction with respect to a publicly-traded security of the borrower when it would otherwise be advantageous to do so.
Commodity Regulatory Risk: The Fund is deemed a “commodity pool” and the manager is considered a “commodity pool operator” with respect to the Fund under the Commodity Exchange Act. The manager, directly or through its affiliates, is therefore subject to dual regulation by the Securities and Exchange Commission (the “SEC”) and the CFTC. The regulatory requirements governing the use of commodity futures (which include futures on broad-based securities indexes, interest rate futures and currency futures), options on commodity futures, certain swaps or certain other investments could change at any time.
Credit Risk/Counterparty Risk: The ability, or perceived ability, of the issuer or guarantor of a debt security, or the counterparty (the party on the other side of the transaction) to a derivatives contract or other financial contract to meet its financial obligations will affect the value of the security or derivative. Counterparty and credit risk are especially important in the context of privately negotiated instruments. The Fund expects to enter into certain privately negotiated agreements where the counterparty assumes the physical settlement obligations of the Fund under such transactions. Under this type of arrangement, there is a risk that the relevant counterparty or intermediary would, due to insolvency or other reasons, be unable to or fail to assume the physical settlement obligations of the Fund, in which case the Fund could be required to sell portfolio instruments at unfavorable times or prices or could have insufficient assets to satisfy its physical settlement obligations.
| | | | |
| PGIM Global Dynamic Bond Fund | | | 89 | |
Notes to Financial Statements (continued)
Credit ratings are intended to provide a measure of credit risk. However, credit ratings are only the opinions of the credit rating agency issuing the ratings and are not guarantees as to quality. The lower the rating of a debt security held by the Fund, the greater the degree of credit risk that is perceived to exist by the credit rating agency with respect to that security. Increasing the amount of Fund assets allocated to lower-rated securities generally will increase the credit risk to which the Fund is subject. Not all securities in which the Fund invests are rated. The longer the maturity and the lower the credit quality of a bond, the more sensitive it is to credit risk.
Currency Risk: The Fund’s net asset value could decline as a result of changes in exchange rates, which could adversely affect the Fund’s investments in currencies, or in securities that trade in, and receive revenues related to, currencies, or in derivatives that provide exposure to currencies. Certain foreign countries may impose restrictions on the ability of issuers of foreign securities to make payment of principal and interest or dividends to investors located outside the country, due to blockage of foreign currency exchanges or otherwise.
Debt Obligations Risk: Debt obligations are subject to credit risk, market risk and interest rate risk. The Fund’s holdings, share price, yield and total return may also fluctuate in response to bond market movements. The value of bonds may decline for issuer-related reasons, including management performance, financial leverage and reduced demand for the issuer’s goods and services. Certain types of fixed income obligations also may be subject to “call and redemption risk,” which is the risk that the issuer may call a bond held by the Fund for redemption before it matures and the Fund may lose income.
Derivatives Risk: Derivatives involve special risks and costs and may result in losses to the Fund. The successful use of derivatives requires sophisticated management, and, to the extent that derivatives are used, the Fund will depend on the subadviser’s ability to analyze and manage derivatives transactions. The prices of derivatives may move in unexpected ways, especially in abnormal market conditions. Some derivatives are “leveraged” and therefore may magnify or otherwise increase investment losses to the Fund. The Fund’s use of derivatives may also increase the amount of taxes payable by shareholders. Other risks arise from the potential inability to terminate or sell derivatives positions. A liquid secondary market may not always exist for the Fund’s derivatives positions. In fact, many over-the-counter derivative instruments will not have liquidity beyond the counterparty to the instrument. Over-the-counter derivative instruments also involve the risk that the other party will not meet its obligations to the Fund.
The U.S. Government and foreign governments have adopted (and may adopt further) regulations governing derivatives markets, including mandatory clearing of certain derivatives, margin and reporting requirements and risk exposure limitations. The ultimate impact of the regulations remains unclear. Additional regulation of derivatives may make
derivatives more costly, limit their availability or utility, or otherwise adversely affect their performance or disrupt markets.
Economic and Market Events Risk: Events in the U.S. and global financial markets, including actions taken by the U.S. Federal Reserve or foreign central banks to stimulate or stabilize economic growth or the functioning of the securities markets, may at times result in unusually high market volatility, which could negatively impact performance. Relatively reduced liquidity in credit and fixed income markets could adversely affect issuers worldwide.
Emerging Markets Risk: The risks of foreign investments are greater for investments in or exposed to emerging markets. Emerging market countries typically have economic and political systems that are less fully developed, and can be expected to be less stable, than those of more developed countries. For example, the economies of such countries can be subject to rapid and unpredictable rates of inflation or deflation. Low trading volumes may result in a lack of liquidity and price volatility. Emerging market countries may have policies that restrict investment by non-U.S. investors, or that prevent non-U.S. investors from withdrawing their money at will.
The Fund may invest in some emerging markets that subject it to risks such as those associated with illiquidity, custody of assets, different settlement and clearance procedures and asserting legal title under a developing legal and regulatory regime to a greater degree than in developed markets or even in other emerging markets.
Foreign Securities Risk: Investments in securities of non-U.S. issuers (including those denominated in U.S. dollars) may involve more risk than investing in securities of U.S. issuers. Foreign political, economic and legal systems, especially those in developing and emerging market countries, may be less stable and more volatile than in the United States. Foreign legal systems generally have fewer regulatory requirements than the U.S. legal system, particularly those of emerging markets. In general, less information is publicly available with respect to non-U.S. companies than U.S. companies. Non-U.S. companies generally are not subject to the same accounting, auditing, and financial reporting standards as are U.S. companies. Additionally, the changing value of foreign currencies and changes in exchange rates could also affect the value of the assets the Fund holds and the Fund’s performance. Certain foreign countries may impose restrictions on the ability of issuers of foreign securities to make payment of principal and interest or dividends to investors located outside the country, due to blockage of foreign currency exchanges or otherwise. Investments in emerging markets are subject to greater volatility and price declines.
In addition, the Fund’s investments in non-U.S. securities may be subject to the risks of nationalization or expropriation of assets, imposition of currency exchange controls or restrictions on the repatriation of non-U.S. currency, confiscatory taxation and adverse diplomatic developments. Special U.S. tax considerations may apply.
| | | | |
| PGIM Global Dynamic Bond Fund | | | 91 | |
Notes to Financial Statements (continued)
Increase in Expenses Risk: Your actual cost of investing in the Fund may be higher than the expenses shown in the expense table in the Fund’s prospectus for a variety of reasons. For example, expense ratios may be higher than those shown if average net assets decrease. Net assets are more likely to decrease and Fund expense ratios are more likely to increase when markets are volatile. Active and frequent trading of Fund securities can increase expenses.
Interest Rate Risk: The value of your investment may go down when interest rates rise. A rise in rates tends to have a greater impact on the prices of longer term or duration debt securities. For example, a fixed income security with a duration of three years is expected to decrease in value by approximately 3% if interest rates increase by 1%. This is referred to as “duration risk.” When interest rates fall, the issuers of debt obligations may prepay principal more quickly than expected, and the Fund may be required to reinvest the proceeds at a lower interest rate. This is referred to as “prepayment risk.” When interest rates rise, debt obligations may be repaid more slowly than expected, and the value of the Fund’s holdings may fall sharply. This is referred to as “extension risk.” The Fund may lose money if short-term or long-term interest rates rise sharply or in a manner not anticipated by the subadviser.
Junk Bonds Risk: High-yield, high-risk bonds have predominantly speculative characteristics, including particularly high credit risk. Junk bonds tend to have lower market liquidity than higher-rated securities. The liquidity of particular issuers or industries within a particular investment category may shrink or disappear suddenly and without warning. The non-investment grade bond market can experience sudden and sharp price swings and become illiquid due to a variety of factors, including changes in economic forecasts, stock market activity, large sustained sales by major investors, a high profile default or a change in the market’s psychology.
Large Shareholder and Large Scale Redemption Risk: Certain individuals, accounts, funds (including funds affiliated with the Manager) or institutions, including the Manager and its affiliates, may from time to time own or control a substantial amount of the Fund’s shares. There is no requirement that these entities maintain their investment in the Fund. There is a risk that such large shareholders or that the Fund’s shareholders generally may redeem all or a substantial portion of their investments in the Fund in a short period of time, which could have a significant negative impact on the Fund’s NAV, liquidity, and brokerage costs. Large redemptions could also result in tax consequences to shareholders and impact the Fund’s ability to implement its investment strategy. The Fund’s ability to pursue its investment objective after one or more large scale redemptions may be impaired and, as a result, the Fund may invest a larger portion of its assets in cash or cash equivalents.
Leverage Risk: Certain transactions in which the Fund may engage may give rise to leverage. The use of leverage exaggerates the effect of any increase or decrease in the value of the Fund’s holdings, and makes any change in the Fund’s net asset value (“NAV”) greater than it would be without the use of leverage. This could result in increased volatility of investment return.
LIBOR Risk: Many financial instruments use or may use a floating rate based on the London Interbank Offered Rate, or “LIBOR,” which is the offered rate for short-term Eurodollar deposits between major international banks. Over the course of the last several years, global regulators have indicated an intent to phase out the use of LIBOR and similar interbank offering rates (IBOR). There still remains uncertainty regarding the nature of any replacement rates for LIBOR and the other IBORs as well as around fallback approaches for instruments extending beyond the any phase-out of these reference rates. The lack of consensus around replacement rates and the uncertainty of the phase out of LIBOR and other IBORs may result in increased volatility in corporate or governmental debt, bank loans, derivatives and other instruments invested in by the Fund as well as loan facilities used by the Fund.
The potential effect of a transition away from LIBOR on the Fund or the financial instruments in which the Fund invests cannot yet be determined. The elimination of LIBOR or changes to other reference rates or any other changes or reforms to the determination or supervision of reference rates could have an adverse impact on the market for, or value of, any securities or payments linked to those reference rates, which may adversely affect the Fund’s performance and/or net asset value. Certain proposed replacement rates to LIBOR, such as the Secured Overnight Financing Rate (“SOFR”), are materially different from LIBOR, and changes in the applicable spread for instruments previously linked to LIBOR will need to be made in order for instruments to pay similar rates. Uncertainty and risk also remain regarding the willingness and ability of issuers and lenders to include revised provisions in new and existing contracts or instruments. Consequently, the transition away from LIBOR to other reference rates may lead to reduced coupons on debt held by the Fund, higher rates required to be paid by the Fund on bank lines of credit due to increases in spreads, increased volatility and illiquidity in markets that are tied to LIBOR, fluctuations in values of LIBOR-related investments or investments in issuers that utilize LIBOR, increased difficulty in borrowing or refinancing and diminished effectiveness of hedging strategies, adversely affecting the Fund’s performance. Furthermore, the risks associated with the expected discontinuation of LIBOR and transition may be exacerbated if the work necessary to effect an orderly transition to an alternative reference rate is not completed in a timely manner. Because the usefulness of LIBOR and the other IBORs as benchmarks could deteriorate during the transition period, these effects could begin to be experienced by the end of 2021 and beyond until the anticipated discontinuance date in 2023 for the majority of the LIBOR rates.
Liquidity Risk: Liquidity risk is the risk that the Fund could not meet requests to redeem shares issued by the Fund without significant dilution of remaining investors’ interests in the Fund. The Fund may invest in instruments that trade in lower volumes and are more illiquid
| | | | |
| PGIM Global Dynamic Bond Fund | | | 93 | |
Notes to Financial Statements (continued)
than other investments. If the Fund is forced to sell these investments to pay redemption proceeds or for other reasons, the Fund may lose money. In addition, when there is no willing buyer and investments cannot be readily sold at the desired time or price, the Fund may have to accept a lower price or may not be able to sell the instrument at all. An inability to sell a portfolio position can adversely affect the Fund’s value or prevent the Fund from being able to take advantage of other investment opportunities.
Management Risk: The value of your investment may decrease if judgments by the subadviser about the attractiveness, value or market trends affecting a particular security, industry or sector or about market movements are incorrect.
Market Disruption and Geopolitical Risks: International wars or conflicts and geopolitical developments in foreign countries, along with instability in regions such as Asia, Eastern Europe, and the Middle East, possible terrorist attacks in the United States or around the world, public health epidemics such as the outbreak of infectious diseases like the outbreak of COVID-19 globally in 2020 or the 2014–2016 outbreak in West Africa of the Ebola virus, and other similar events could adversely affect the U.S. and foreign financial markets, including increases in market volatility, reduced liquidity in the securities markets and government intervention, and may cause further long-term economic uncertainties in the United States and worldwide generally. The coronavirus pandemic and the related governmental and public responses have had and may continue to have an impact on the Fund’s investments and net asset value and have led and may continue to lead to increased market volatility and the potential for illiquidity in certain classes of securities and sectors of the market. Preventative or protective actions that governments may take in respect of pandemic or epidemic diseases may result in periods of business disruption, business closures, inability to obtain raw materials, supplies and component parts, and reduced or disrupted operations for the issuers in which the Fund invests. Government intervention in markets may impact interest rates, market volatility and security pricing. The occurrence, reoccurrence and pendency of such diseases could adversely affect the economies (including through changes in business activity and increased unemployment) and financial markets either in specific countries or worldwide.
Market Risk: Securities markets may be volatile and the market prices of the Fund’s securities may decline. Securities fluctuate in price based on changes in an issuer’s financial condition and overall market and economic conditions. If the market prices of the securities owned by the Fund fall, the value of your investment in the Fund will decline.
Mortgage-Backed and Asset-Backed Securities Risk: Mortgage-backed and asset-backed securities tend to increase in value less than other debt securities when interest rates decline, but are subject to similar risk of decline in market value during periods of rising interest rates. The values of mortgage-backed and asset-backed securities become more
volatile as interest rates rise. In a period of declining interest rates, the Fund may be required to reinvest more frequent prepayments on mortgage-backed and asset-backed securities in lower-yielding investments.
Short Position Risk: The Fund may take short positions in derivative instruments that present various risks, including credit/counterparty risk and leverage risk. A short position on a derivative instrument involves the risk of a theoretically unlimited increase in the value of the underlying security or instrument and, thus, the risk of a theoretically unlimited loss for the Fund. Short positions/sales also involve transaction and other costs that will reduce potential Fund gains and increase potential Fund losses.
U.S. Government and Agency Securities Risk: U.S. Government and agency securities are subject to market risk, interest rate risk and credit risk. Not all U.S. Government securities are insured or guaranteed by the full faith and credit of the U.S. Government; some are only insured or guaranteed by the issuing agency, which must rely on its own resources to repay the debt. The maximum potential liability of the issuers of some U.S. Government securities held by the Fund may greatly exceed their current resources, including their legal right to support from the U.S. Treasury. No assurance can be given that the U.S. government would provide financial support to any such issuers if it is not obligated to do so by law. It is possible that these issuers will not have the funds to meet their payment obligations in the future. In addition, the value of U.S. Government securities may be affected by changes in the credit rating of the U.S. Government.
10. Recent Accounting Pronouncement and Regulatory Developments
In March 2020, the FASB issued Accounting Standard Update (“ASU”) No. 2020-04, which provides optional guidance for applying GAAP to contract modifications, hedging relationships and other transactions affected by the reference rate reform if certain criteria are met. ASU 2020-04 is elective and is effective on March 12, 2020 through December 31, 2022. At this time, management is evaluating the implications of certain provisions of the ASU and any impact on the financial statement disclosures has not yet been determined.
On December 3, 2020, the SEC announced that it voted to adopt a new rule that establishes an updated regulatory framework for fund valuation practices (the “Rule”). The Rule, in part, provides (i) a framework for determining fair value in good faith and (ii) provides for a fund Board’s assignment of its responsibility for the execution of valuation-related activities to a fund’s investment adviser. Further, the SEC is rescinding previously issued guidance on related issues. The Rule took effect on March 8, 2021, with a compliance date of September 8, 2022. Management is currently evaluating the Rule and its impact to the Fund.
| | | | |
| PGIM Global Dynamic Bond Fund | | | 95 | |
Report of Independent Registered Public Accounting Firm
To the Board of Trustees of Prudential Investment Portfolios 3 and Shareholders of PGIM Global Dynamic Bond Fund
Opinion on the Financial Statements
We have audited the accompanying statement of assets and liabilities, including the schedule of investments, of PGIM Global Dynamic Bond Fund (one of the funds constituting Prudential Investment Portfolios 3, referred to hereafter as the “Fund”) as of October 31, 2021, the related statement of operations for the year ended October 31, 2021, the statement of changes in net assets for each of the two years in the period ended October 31, 2021, including the related notes, and financial highlights for each of the two years in the period ended October 31, 2021 (collectively referred to as the “financial statements”). In our opinion, the financial statements present fairly, in all material respects, the financial position of the Fund as of October 31, 2021, the results of its operations for the year then ended, and the changes in its net assets and the financial highlights for each of the two years in the period ended October 31, 2021 in conformity with accounting principles generally accepted in the United States of America.
The financial statements of the Fund as of and for the year ended October 31, 2019 and the financial highlights for each of the periods ended on or prior to October 31, 2019 (not presented herein, other than the financial highlights) were audited by other auditors whose report dated December 19, 2019 expressed an unqualified opinion on those financial statements and financial highlights.
Basis for Opinion
These financial statements are the responsibility of the Fund’s management. Our responsibility is to express an opinion on the Fund’s financial statements based on our audits. We are a public accounting firm registered with the Public Company Accounting Oversight Board (United States) (PCAOB) and are required to be independent with respect to the Fund in accordance with the U.S. federal securities laws and the applicable rules and regulations of the Securities and Exchange Commission and the PCAOB.
We conducted our audits of these financial statements in accordance with the standards of the PCAOB. Those standards require that we plan and perform the audit to obtain reasonable assurance about whether the financial statements are free of material misstatement, whether due to error or fraud.
Our audits included performing procedures to assess the risks of material misstatement of the financial statements, whether due to error or fraud, and performing procedures that respond to those risks. Such procedures included examining, on a test basis, evidence regarding the amounts and disclosures in the financial statements. Our audits also included evaluating the accounting principles used and significant estimates made by management, as well as evaluating the overall presentation of the financial statements. Our procedures included confirmation of securities owned as of October 31, 2021 by correspondence with the custodian, transfer agent and brokers; when replies were not received from brokers, we performed other auditing procedures. We believe that our audits provide a reasonable basis for our opinion.
/s/PricewaterhouseCoopers LLP
New York, New York
December 17, 2021
We have served as the auditor of one or more investment companies in the PGIM Retail Funds complex since 2020.
Federal Income Tax Information (unaudited)
For the year ended October 31, 2021, the Fund reports the maximum amount allowable but not less than 30.62% as interest related dividends in accordance with Sections 871(k)(1) and 881(e)(1) of the Internal Revenue Code.
In January 2022, you will be advised on IRS Form 1099-DIV or substitute 1099-DIV as to the federal tax status of dividends received by you in calendar year 2021.
| | | | |
PGIM Global Dynamic Bond Fund | | | 97 | |
INFORMATION ABOUT BOARD MEMBERS AND OFFICERS (unaudited)
Information about Board Members and Officers of the Fund is set forth below. Board Members who are not deemed to be “interested persons” of the Fund, as defined in the 1940 Act, are referred to as “Independent Board Members.” Board Members who are deemed to be “interested persons” of the Fund are referred to as “Interested Board Members.” The Board Members are responsible for the overall supervision of the operations of the Fund and perform the various duties imposed on the directors of investment companies by the 1940 Act. The Board in turn elects the Officers, who are responsible for administering the day-to-day operations of the Fund.
| | | | | | |
| Independent Board Members |
| | | | |
Name Year of Birth Position(s) Portfolios Overseen | | Principal Occupation(s) During Past Five Years | | Other Directorships Held During Past Five Years | | Length of
Board Service |
| | | | |
Ellen S. Alberding 1958 Board Member Portfolios Overseen: 95 | | President and Board Member, The Joyce Foundation (charitable foundation) (since 2002); formerly Vice Chair, City Colleges of Chicago (community college system) (2011-2015); Trustee, National Park Foundation (charitable foundation for national park system) (2009-2018); Trustee, Economic Club of Chicago (2009-2016); Trustee, Loyola University (since 2018). | | None. | | Since September 2013 |
| | | | |
Kevin J. Bannon 1952 Board Member Portfolios Overseen: 95 | | Retired; formerly Managing Director (April 2008-May 2015) and Chief Investment Officer (October 2008-November 2013) of Highmount Capital LLC (registered investment adviser); formerly Executive Vice President and Chief Investment Officer (April 1993-August 2007) of Bank of New York Company; President (May 2003-May 2007) of BNY Hamilton Family of Mutual Funds. | | Director of Urstadt Biddle Properties (equity real estate investment trust) (since September 2008). | | Since July 2008 |
PGIM Global Dynamic Bond Fund
| | | | | | |
| Independent Board Members |
| | | | |
Name Year of Birth Position(s) Portfolios Overseen | | Principal Occupation(s) During Past Five Years | | Other Directorships Held During Past Five Years | | Length of
Board Service |
| | | | |
Linda W. Bynoe 1952 Board Member Portfolios Overseen: 92 | | President and Chief Executive Officer (since March 1995) and formerly Chief Operating Officer (December 1989-February 1995) of Telemat Limited LLC (formerly Telemat Ltd) (management consulting); formerly Vice President (January 1985-June 1989) at Morgan Stanley & Co. (broker-dealer). | | Trustee of Equity Residential (residential real estate) (since December 2009); Director of Northern Trust Corporation (financial services) (since April 2006); formerly Director of Anixter International, Inc. (communication products distributor) (January 2006-June 2020). | | Since March 2005 |
| | | | |
Barry H. Evans 1960 Board Member Portfolios Overseen: 94 | | Retired; formerly President (2005-2016), Global Chief Operating Officer (2014-2016), Chief Investment Officer - Global Head of Fixed Income (1998-2014), and various portfolio manager roles (1986-2006), Manulife Asset Management (asset management). | | Formerly Director, Manulife Trust Company (2011-2018); formerly Director, Manulife Asset Management Limited (2015-2017); formerly Chairman of the Board of Directors of Manulife Asset Management U.S. (2005-2016); formerly Chairman of the Board, Declaration Investment Management and Research (2008-2016). | | Since September 2017 |
| | | | |
Keith F. Hartstein 1956 Board Member & Independent Chair Portfolios Overseen: 95 | | Retired; Executive Committee of the Independent Directors Council (IDC) Board of Governors (since October 2019); Member (since November 2014) of the Governing Council of the IDC (organization of independent mutual fund directors); formerly President and Chief Executive Officer (2005-2012), Senior Vice President (2004-2005), Senior Vice President of Sales and Marketing (1997-2004), and various executive management positions (1990-1997), John Hancock Funds, LLC (asset management); Chairman, Investment Company Institute’s Sales Force Marketing Committee (2003-2008). | | None. | | Since September 2013 |
Visit our website at pgim.com/investments
| | | | | | |
| Independent Board Members |
| | | | |
Name Year of Birth Position(s) Portfolios Overseen | | Principal Occupation(s) During Past Five Years | | Other Directorships Held During Past Five Years | | Length of
Board Service |
| | | | |
Laurie Simon Hodrick 1962 Board Member Portfolios Overseen: 91 | | A. Barton Hepburn Professor Emerita of Economics in the Faculty of Business, Columbia Business School (since 2018); Visiting Fellow at the Hoover Institution, Stanford University (since 2015); Sole Member, ReidCourt LLC (since 2008) (a consulting firm); formerly Visiting Professor of Law, Stanford Law School (2015-2021); formerly A. Barton Hepburn Professor of Economics in the Faculty of Business, Columbia Business School (1996-2017); formerly Managing Director, Global Head of Alternative Investment Strategies, Deutsche Bank (2006-2008). | | Independent Director, Roku (since December 2020) (communication services); formerly Independent Director, Synnex Corporation (2019-2021) (information technology); formerly Independent Director, Kabbage, Inc. (2018-2020) (financial services); formerly Independent Director, Corporate Capital Trust (2017-2018) (a business development company). | | Since September 2017 |
| | | | |
Brian K. Reid 1961 Board Member Portfolios Overseen: 94 | | Retired; formerly Chief Economist for the Investment Company Institute (ICI) (2005-2017); formerly Senior Economist and Director of Industry and Financial Analysis at the ICI (1998-2004); formerly Senior Economist, Industry and Financial Analysis at the ICI (1996-1998); formerly Staff Economist at the Federal Reserve Board (1989-1996); Director, ICI Mutual Insurance Company (2012-2017). | | None. | | Since March 2018 |
PGIM Global Dynamic Bond Fund
| | | | | | |
| Independent Board Members |
| | | | |
Name Year of Birth Position(s) Portfolios Overseen | | Principal Occupation(s) During Past Five Years | | Other Directorships Held During Past Five Years | | Length of
Board Service |
| | | | |
Grace C. Torres 1959 Board Member Portfolios Overseen: 94 | | Retired; formerly Treasurer and Principal Financial and Accounting Officer of the PGIM Funds, Target Funds, Advanced Series Trust, Prudential Variable Contract Accounts and The Prudential Series Fund (1998-June 2014); Assistant Treasurer (March 1999-June 2014) and Senior Vice President (September 1999-June 2014) of PGIM Investments LLC; Assistant Treasurer (May 2003-June 2014) and Vice President (June 2005-June 2014) of AST Investment Services, Inc.; Senior Vice President and Assistant Treasurer (May 2003-June 2014) of Prudential Annuities Advisory Services, Inc. | | Director (since January 2018) of OceanFirst Financial Corp. and OceanFirst Bank; formerly Director (July 2015-January 2018) of Sun Bancorp, Inc. N.A. and Sun National Bank. | | Since November 2014 |
| | | | | | |
| Interested Board Members |
| | | | |
Name Year of Birth Position(s) Portfolios Overseen | | Principal Occupation(s) During Past Five Years | | Other Directorships Held During Past Five Years | | Length of
Board Service |
| | | | |
Stuart S. Parker 1962 Board Member & President Portfolios Overseen: 94 | | President, Chief Executive Officer, Chief Operating Officer and Officer in Charge of PGIM Investments LLC (formerly known as Prudential Investments LLC) (since January 2012); formerly Executive Vice President of Jennison Associates LLC and Head of Retail Distribution of PGIM Investments LLC (June 2005-December 2011); Investment Company Institute - Board of Governors (since May 2012). | | None. | | Since January 2012 |
Visit our website at pgim.com/investments
| | | | | | |
| Interested Board Members |
| | | | |
Name Year of Birth Position(s) Portfolios Overseen | | Principal Occupation(s) During Past Five Years | | Other Directorships Held During Past Five Years | | Length of
Board Service |
| | | | |
Scott E. Benjamin 1973 Board Member & Vice President Portfolios Overseen: 95 | | Executive Vice President (since May 2009) of PGIM Investments LLC; Vice President (since June 2012) of Prudential Investment Management Services LLC; Executive Vice President (since September 2009) of AST Investment Services, Inc.; Senior Vice President of Product Development and Marketing, PGIM Investments (since February 2006); formerly Vice President of Product Development and Product Management, PGIM Investments LLC (2003-2006). | | None. | | Since March 2010 |
(1) The year that each Board Member joined the Board is as follows:
Ellen S. Alberding, 2013; Kevin J. Bannon, 2008; Linda W. Bynoe, 2005; Barry H. Evans, 2017; Keith F. Hartstein, 2013; Laurie Simon Hodrick, 2017; Michael S. Hyland, 2008; Richard A. Redeker, 1993; Stephen G. Stoneburn, 2003; Stuart S. Parker, Board Member since 2012 and President since 2012; Scott E. Benjamin, Board Member since 2010 and Vice President since 2009; Grace C. Torres, 2014.
| | | | |
| Fund Officers(a) | | | | |
| | | |
Name Year of Birth Fund Position | | Principal Occupation(s) During Past Five Years | | Length of
Service as Fund
Officer |
| | | |
Claudia DiGiacomo 1974 Chief Legal Officer | | Chief Legal Officer, Executive Vice President and Secretary of PGIM Investments LLC (since August 2020); Chief Legal Officer of Prudential Mutual Fund Services LLC (since August 2020); Chief Legal Officer of PIFM Holdco, LLC (since August 2020); Vice President and Corporate Counsel (since January 2005) of Prudential; and Corporate Counsel of AST Investment Services, Inc. (since August 2020); formerly Vice President and Assistant Secretary of PGIM Investments LLC (2005-2020); formerly Associate at Sidley Austin Brown & Wood LLP (1999-2004). | | Since December 2005 |
PGIM Global Dynamic Bond Fund
| | | | |
| Fund Officers(a) | | | | |
| | | |
Name Year of Birth Fund Position | | Principal Occupation(s) During Past Five Years | | Length of Service as Fund Officer |
| | | |
Dino Capasso 1974 Chief Compliance Officer | | Chief Compliance Officer (since July 2019) of PGIM Investments LLC; Chief Compliance Officer (since July 2019) of the PGIM Funds, Target Funds, Advanced Series Trust, The Prudential Series Fund, Prudential’s Gibraltar Fund, Inc., PGIM Global High Yield Fund, Inc., PGIM High Yield Bond Fund, Inc., and PGIM Short Duration High Yield Opportunities Fund; Vice President and Deputy Chief Compliance Officer (June 2017-2019) of PGIM Investments LLC; formerly Senior Vice President and Senior Counsel (January 2016-June 2017), and Vice President and Counsel (February 2012-December 2015) of Pacific Investment Management Company LLC. | | Since July 2019 |
| | | |
Andrew R. French 1962 Secretary | | Vice President (since December 2018) of PGIM Investments LLC; formerly Vice President and Corporate Counsel (2010-2018) of Prudential; formerly Director and Corporate Counsel (2006-2010) of Prudential; Vice President and Assistant Secretary (since January 2007) of PGIM Investments LLC; Vice President and Assistant Secretary (since January 2007) of Prudential Mutual Fund Services LLC. | | Since October 2006 |
| | | |
Diana N. Huffman 1982 Assistant Secretary | | Vice President and Corporate Counsel (since September 2015) of Prudential; Vice President and Assistant Secretary (since August 2020) of PGIM Investments LLC; formerly Associate at Willkie Farr & Gallagher LLP (2009-2015). | | Since March 2019 |
| | | |
Melissa Gonzalez 1980 Assistant Secretary | | Vice President and Corporate Counsel (since September 2018) of Prudential; Vice President and Assistant Secretary (since August 2020) of PGIM Investments LLC; formerly Director and Corporate Counsel (March 2014-September 2018) of Prudential. | | Since March 2020 |
| | | |
Patrick E. McGuinness 1986 Assistant Secretary | | Vice President and Assistant Secretary (since August 2020) of PGIM Investments LLC; Director and Corporate Counsel (since February 2017) of Prudential; and Corporate Counsel (2012-2017) of IIL, Inc. | | Since June 2020 |
| | | |
Debra Rubano 1975 Assistant Secretary | | Vice President and Corporate Counsel (since November 2020) of Prudential; formerly Director and Senior Counsel of Allianz Global Investors U.S. Holdings LLC (2010-2020) and Assistant Secretary of numerous funds in the Allianz fund complex (2015-2020). | | Since December 2020 |
| | | |
Kelly A. Coyne 1968 Assistant Secretary | | Director, Investment Operations of Prudential Mutual Fund Services LLC (since 2010). | | Since March 2015 |
Visit our website at pgim.com/investments
| | | | |
| Fund Officers(a) | | | | |
| | | |
Name Year of Birth Fund Position | | Principal Occupation(s) During Past Five Years | | Length of Service as Fund Officer |
| | | |
Christian J. Kelly 1975 Treasurer and Principal Financial and Accounting Officer | | Vice President, Head of Fund Administration of PGIM Investments LLC (since November 2018); formerly Director of Fund Administration of Lord Abbett & Co. LLC (2009-2018), Treasurer and Principal Accounting Officer of the Lord Abbett Family of Funds (2017-2018); Director of Accounting, Avenue Capital Group (2008-2009); Senior Manager, Investment Management Practice of Deloitte & Touche LLP (1998-2007). | | Since January 2019 |
| | | |
Lana Lomuti 1967 Assistant Treasurer | | Vice President (since 2007) and Director (2005-2007), within PGIM Investments Fund Administration; formerly Assistant Treasurer (December 2007-February 2014) of The Greater China Fund, Inc. | | Since April 2014 |
| | | |
Russ Shupak 1973 Assistant Treasurer | | Vice President (since 2017) and Director (2013-2017), within PGIM Investments Fund Administration. | | Since September 2019 |
| | | |
Deborah Conway 1969 Assistant Treasurer | | Vice President (since 2017) and Director (2007-2017), within PGIM Investments Fund Administration. | | Since September 2019 |
| | | |
Elyse M. McLaughlin 1974 Assistant Treasurer | | Vice President (since 2017) and Director (2011-2017), within PGIM Investments Fund Administration. | | Since September 2019 |
| | | |
Jonathan Corbett 1983 Anti-Money Laundering Compliance Officer | | Vice President, Corporate Compliance, Global Compliance Programs and Compliance Risk Management (since August 2019) of Prudential; formerly Vice President and Head of Key Risk Areas Compliance (March 2016 to July 2019), Chief Privacy Officer (March 2016 to July 2019) and Head of Global Financial Crimes Unit (April 2014 to March 2016) at MetLife. | | Since October 2021 |
(a) Excludes Mr. Parker and Mr. Benjamin, interested Board Members who also serve as President and Vice President, respectively.
Explanatory Notes to Tables:
| ∎ | | Board Members are deemed to be “Interested,” as defined in the 1940 Act, by reason of their affiliation with PGIM Investments LLC and/or an affiliate of PGIM Investments LLC. |
| ∎ | | Unless otherwise noted, the address of all Board Members and Officers is c/o PGIM Investments LLC, 655 Broad Street, Newark, New Jersey 07102-4410. |
| ∎ | | There is no set term of office for Board Members or Officers. The Board Members have adopted a retirement policy, which calls for the retirement of Board Members on December 31 of the year in which they reach the age of 75. |
| ∎ | | “Other Directorships Held” includes all directorships of companies required to register or file reports with the SEC under the 1934 Act (that is, “public companies”) or other investment companies registered under the 1940 Act. |
| ∎ | | “Portfolios Overseen” includes all investment companies managed by PGIM Investments LLC. The investment companies for which PGIM Investments LLC serves as manager include the PGIM Funds, Target Funds, The Prudential Variable Contract Accounts, PGIM ETF Trust, PGIM High Yield Bond Fund, Inc., PGIM Global High Yield Fund, Inc., PGIM Short Duration High Yield Opportunities Fund, The Prudential Series Fund, Prudential’s Gibraltar Fund, Inc. and the Advanced Series Trust. |
| ∎ | | As used in the Fund Officers table “Prudential” means The Prudential Insurance Company of America. |
PGIM Global Dynamic Bond Fund
Approval of Advisory Agreements (unaudited)
The Fund’s Board of Trustees
The Board of Trustees (the “Board”) of PGIM Global Dynamic Bond Fund (the “Fund”)1 consists of ten individuals, eight of whom are not “interested persons” of the Fund, as defined in the Investment Company Act of 1940, as amended (the “1940 Act”) (the “Independent Trustees”). The Board is responsible for the oversight of the Fund and its operations, and performs the various duties imposed on the directors of investment companies by the 1940 Act. The Independent Trustees have retained independent legal counsel to assist them in connection with their duties. The Chair of the Board is an Independent Trustee. The Board has established four standing committees: the Audit Committee, the Nominating and Governance Committee, and two Investment Committees. Each committee is chaired by, and composed of, Independent Trustees.
Annual Approval of the Fund’s Advisory Agreements
As required under the 1940 Act, the Board determines annually whether to renew the Fund’s management agreement with PGIM Investments LLC (“PGIM Investments”), the Fund’s subadvisory agreement with PGIM, Inc. (“PGIM”), on behalf of its PGIM Fixed Income unit (“PGIM Fixed Income”), and the Fund’s sub-subadvisory agreement with PGIM Limited (“PGIML”). In considering the renewal of the agreements, the Board, including all of the Independent Trustees, met on June 7-10, 2021 and approved the renewal of the agreements through July 31, 2022, after concluding that the renewal of the agreements was in the best interests of the Fund and its shareholders.
In advance of the meetings, the Board requested and received materials relating to the agreements, and had the opportunity to ask questions and request further information in connection with its consideration. Among other things, the Board considered comparative fee information from PGIM Investments, PGIM, and where appropriate, affiliates of PGIM. Also, the Board considered comparisons with other mutual funds in relevant Peer Universes and Peer Groups, as is further discussed below.
In approving the agreements, the Board, including the Independent Trustees advised by independent legal counsel, considered the factors it deemed relevant, including the nature, quality and extent of services provided by PGIM Investments, the subadviser and, as relevant, its affiliates, the performance of the Fund, the profitability of PGIM Investments and its affiliates, expenses and fees, and the potential for economies of scale that may be shared with the Fund and its shareholders as the Fund’s assets grow. In their deliberations, the Trustees did not identify any single factor which alone was responsible for the Board’s decision to approve the agreements with respect to the Fund. In connection with its deliberations, the Board considered information provided by PGIM Investments throughout the year at regular Board meetings, presentations from portfolio managers and other information, as well as information furnished at or in advance of the meetings on June 7-10, 2021.
| 1 | PGIM Global Dynamic Bond Fund is a series of Prudential Investment Portfolios 3. |
PGIM Global Dynamic Bond Fund
Approval of Advisory Agreements (continued)
The Trustees determined that the overall arrangements between the Fund and PGIM Investments, which serves as the Fund’s investment manager pursuant to a management agreement, between PGIM Investments and PGIM, which, through its PGIM Fixed Income unit, serves as the Fund’s subadviser pursuant to the terms of a subadvisory agreement with PGIM Investments, and between PGIM and PGIML, which serves as the Fund’s sub-subadviser pursuant to the terms of a sub-subadvisory agreement with PGIM, are in the best interests of the Fund and its shareholders in light of the services performed, fees charged and such other matters as the Trustees considered relevant in the exercise of their business judgment.
The material factors and conclusions that formed the basis for the Trustees’ reaching their determinations to approve the continuance of the agreements are separately discussed below.
Nature, Quality and Extent of Services
The Board received and considered information regarding the nature, quality and extent of services provided to the Fund by PGIM Investments, PGIM Fixed Income, and PGIML. The Board noted that PGIM Fixed Income and PGIML are affiliated with PGIM Investments. The Board considered the services provided by PGIM Investments, including but not limited to the oversight of the subadviser and sub-subadviser for the Fund, as well as the provision of fund recordkeeping, compliance and other services to the Fund, and PGIM Investments’ role as administrator for the Fund’s liquidity risk management program. With respect to PGIM Investments’ oversight of the subadviser and sub-subadviser, the Board noted that PGIM Investments’ Strategic Investment Research Group (“SIRG”), which is a business unit of PGIM Investments, is responsible for monitoring and reporting to PGIM Investments senior management on the performance and operations of the subadviser and sub-subadviser. The Board also considered that PGIM Investments pays the salaries of all of the officers and interested Trustees of the Fund who are part of Fund management. The Board also considered the investment subadvisory services provided by PGIM Fixed Income and PGIML, including investment research and security selection, as well as adherence to the Fund’s investment restrictions and compliance with applicable Fund policies and procedures. The Board considered PGIM Investments’ evaluation of the subadviser and sub-subadviser, as well as PGIM Investments’ recommendation, based on its review of the subadviser and sub-subadviser, to renew the subadvisory and sub-subadvisory agreements.
The Board considered the qualifications, backgrounds and responsibilities of PGIM Investments’ senior management responsible for the oversight of the Fund, PGIM Fixed Income, and PGIML, and also considered the qualifications, backgrounds and responsibilities of PGIM Fixed Income’s portfolio managers who are responsible for the day-to-day management of the Fund’s portfolio. The Board was provided with information pertaining to PGIM Investments’, PGIM Fixed Income’s, and PGIML’s organizational structure, senior management, investment operations, and other relevant
Visit our website at pgim.com/investments
information pertaining to PGIM Investments, PGIM Fixed Income, and PGIML. The Board also noted that it received favorable compliance reports from the Fund’s Chief Compliance Officer (“CCO”) as to PGIM Investments, PGIM Fixed Income, and PGIML.
The Board concluded that it was satisfied with the nature, extent and quality of the investment management services provided by PGIM Investments, the subadvisory services provided to the Fund by PGIM Fixed Income, and the sub-subadvisory services provided by PGIML, and that there was a reasonable basis on which to conclude that the Fund benefits from the services provided by PGIM Investments, PGIM Fixed Income, and PGIML under the management, subadvisory and sub-subadvisory agreements.
Costs of Services and Profits Realized by PGIM Investments
The Board was provided with information on the profitability of PGIM Investments and its affiliates in serving as the Fund’s investment manager. The Board discussed with PGIM Investments the methodology utilized in assembling the information regarding profitability and considered its reasonableness. The Board recognized that it is difficult to make comparisons of profitability from fund management contracts because comparative information is not generally publicly available and is affected by numerous factors, including the structure of the particular adviser, the types of funds it manages, its business mix, numerous assumptions regarding allocations and the adviser’s capital structure and cost of capital. However, the Board considered that the cost of services provided by PGIM Investments to the Fund during the year ended December 31, 2020 exceeded the management fees paid by the Fund, resulting in an operating loss to PGIM Investments. Taking these factors into account, the Board concluded that the profitability of PGIM Investments and its affiliates in relation to the services rendered was not unreasonable.
Economies of Scale
The Board received and discussed information concerning economies of scale that PGIM Investments may realize as the Fund’s assets grow beyond current levels. The Board noted that the management fee schedule for the Fund includes breakpoints, which have the effect of decreasing the fee rate as assets increase. During the course of time, the Board has considered information regarding the launch date of the Fund, the management fees of the Fund compared to those of similarly managed funds and PGIM Investments’ investment in the Fund over time. The Board noted that economies of scale can be shared with the Fund in other ways, including low management fees from inception, additional technological and personnel investments to enhance shareholder services, and maintaining existing expense structures in the face of a rising cost environment. The Board also considered PGIM Investments’ assertion that it continually evaluates the management fee schedule of the Fund and the potential to share economies of scale through breakpoints or fee waivers as asset levels increase.
PGIM Global Dynamic Bond Fund
Approval of Advisory Agreements (continued)
The Board recognized the inherent limitations of any analysis of economies of scale, stemming largely from the Board’s understanding that most of PGIM Investments’ costs are not specific to individual funds, but rather are incurred across a variety of products and services.
Other Benefits to PGIM Investments, PGIM Fixed Income and PGIML
The Board considered potential ancillary benefits that might be received by PGIM Investments, PGIM Fixed Income, PGIML and their affiliates as a result of their relationship with the Fund. The Board concluded that potential benefits to be derived by PGIM Investments included transfer agency fees received by the Fund’s transfer agent (which is affiliated with PGIM Investments), as well as benefits to its reputation or other intangible benefits resulting from PGIM Investments’ association with the Fund. The Board concluded that the potential benefits to be derived by PGIM Fixed Income and PGIML included the ability to use soft dollar credits, as well as the potential benefits consistent with those generally resulting from an increase in assets under management, specifically, potential access to additional research resources and benefits to their reputations. The Board concluded that the benefits derived by PGIM Investments, PGIM Fixed Income, and PGIML were consistent with the types of benefits generally derived by investment managers and subadvisers to mutual funds.
Performance of the Fund / Fees and Expenses
The Board considered certain additional factors and made related conclusions relating to the historical performance of the Fund for the one-, three- and five-year periods ended December 31, 2020. The Board considered that the Fund commenced operations on November 3, 2015 and that longer-term performance was not yet available.
The Board also considered the Fund’s actual management fee, as well as the Fund’s net total expense ratio, for the fiscal year ended October 31, 2020. The Board considered the management fee for the Fund as compared to the management fee charged by PGIM Investments to other funds and the fee charged by other advisers to comparable mutual funds in a Peer Group. The actual management fee represents the fee rate actually paid by Fund shareholders and includes any fee waivers or reimbursements. The net total expense ratio for the Fund represents the actual expense ratio incurred by Fund shareholders.
The mutual funds included in the Peer Universe, which was used to consider performance, and the Peer Group, which was used to consider expenses and fees, were objectively determined by Broadridge, an independent provider of mutual fund data. In certain circumstances, PGIM Investments also provided supplemental Peer Universe or Peer Group information, for reasons addressed with the Board. The comparisons placed the Fund in various quartiles over various periods, with the first quartile being the best 25% of the mutual funds (for performance, the best performing mutual funds and, for expenses, the lowest cost mutual funds).
Visit our website at pgim.com/investments
The section below summarizes key factors considered by the Board and the Board’s conclusions regarding the Fund’s performance, fees and overall expenses. The table sets forth net performance comparisons (which reflect the impact on performance of fund expenses, or any subsidies, expense caps or waivers that may be applicable) with the Peer Universe, actual management fees with the Peer Group (which reflect the impact of any subsidies or fee waivers), and net total expenses with the Peer Group, each of which were key factors considered by the Board.
| | | | | | | | |
| Net Performance | | 1 Year | | 3 Years | | 5 Years | | 10 Years |
| | 4th Quartile | | 1st Quartile | | 1st Quartile | | N/A |
| Actual Management Fees: 2nd Quartile | | | | |
| Net Total Expenses: 4th Quartile |
| | • | | The Board noted that the Fund outperformed its benchmark index over all periods. |
| | • | | The Board and PGIM Investments agreed to retain the existing contractual expense cap, which (exclusive of certain fees and expenses) caps total annual operating expenses at 1.20% for Class A shares, 1.95% for Class C shares, 0.80% for Class R6 shares, and 0.85% for Class Z shares through February 28, 2022. |
| | • | | In addition, PGIM Investments will waive management fees or shared operating expenses on any share class to the same extent that it waives such expenses on any other share class, and has agreed that total annual fund operating expenses for Class R6 shares will not exceed total annual fund operating expenses for Class Z shares. |
| | • | | The Board concluded that, in light of the above, it would be in the best interests of the Fund and its shareholders to renew the agreements. |
| | • | | The Board concluded that the management fees (including subadvisory fees) and total expenses were reasonable in light of the services provided. |
* * *
After full consideration of these factors, the Board concluded that the approval of the agreements was in the best interests of the Fund and its shareholders.
PGIM Global Dynamic Bond Fund
| | | | |
| | | |
∎ MAIL | | ∎ TELEPHONE | | ∎ WEBSITE |
655 Broad Street
Newark, NJ 07102 | | (800) 225-1852 | | pgim.com/investments |
|
| |
| PROXY VOTING |
| The Board of Trustees of the Fund has delegated to the Fund’s subadviser the responsibility for voting any proxies and maintaining proxy recordkeeping with respect to the Fund. A description of these proxy voting policies and procedures is available without charge, upon request, by calling (800) 225-1852 or by visiting the Securities and Exchange Commission’s website at sec.gov. Information regarding how the Fund voted proxies relating to portfolio securities during the most recent 12-month period ended June 30 is available on the Fund’s website and on the Securities and Exchange Commission’s website. |
|
| |
| TRUSTEES |
| Ellen S. Alberding • Kevin J. Bannon • Scott E. Benjamin • Linda W. Bynoe • Barry H. Evans • Keith F. Hartstein • Laurie Simon Hodrick • Stuart S. Parker • Brian K. Reid • Grace C. Torres |
|
| |
| OFFICERS |
| Stuart S. Parker, President • Scott E. Benjamin, Vice President • Christian J. Kelly, Treasurer and Principal Financial and Accounting Officer • Claudia DiGiacomo, Chief Legal Officer • Dino Capasso, Chief Compliance Officer • Jonathan Corbett, Anti-Money Laundering Compliance Officer • Andrew R. French, Secretary • Melissa Gonzalez, Assistant Secretary • Diana N. Huffman, Assistant Secretary • Kelly A. Coyne, Assistant Secretary • Patrick E. McGuinness, Assistant Secretary • Debra Rubano, Assistant Secretary • Lana Lomuti, Assistant Treasurer • Russ Shupak, Assistant Treasurer • Elyse M. McLaughlin, Assistant Treasurer • Deborah Conway, Assistant Treasurer |
| | | | |
| MANAGER | | PGIM Investments LLC | | 655 Broad Street Newark, NJ 07102 |
|
| SUBADVISER | | PGIM Fixed Income | | 655 Broad Street Newark, NJ 07102 |
| | |
| | PGIM Limited | | Grand Buildings, 1-3 Strand Trafalgar Square London, WC2N 5HR United Kingdom |
|
| DISTRIBUTOR | | Prudential Investment Management Services LLC | | 655 Broad Street Newark, NJ 07102 |
|
| CUSTODIAN | | The Bank of New York Mellon | | 240 Greenwich Street New York, NY 10286 |
|
| TRANSFER AGENT | | Prudential Mutual Fund Services LLC | | PO Box 9658 Providence, RI 02940 |
|
| INDEPENDENT REGISTERED PUBLIC ACCOUNTING FIRM | | PricewaterhouseCoopers LLP | | 300 Madison Avenue New York, NY 10017 |
|
| FUND COUNSEL | | Willkie Farr & Gallagher LLP | | 787 Seventh Avenue New York, NY 10019 |
|
| | |
| An investor should consider the investment objectives, risks, charges, and expenses of the Fund carefully before investing. The prospectus and summary prospectus contain this and other information about the Fund. An investor may obtain the prospectus and summary prospectus by visiting our website at pgim.com/investments or by calling (800) 225-1852. The prospectus and summary prospectus should be read carefully before investing. |
| | |
| E-DELIVERY |
| To receive your mutual fund documents online, go to pgim.com/investments/resource/edelivery and enroll. Instead of receiving printed documents by mail, you will receive notification via email when new materials are available. You can cancel your enrollment or change your email address at any time by visiting the website address above. |
| | |
| SHAREHOLDER COMMUNICATIONS WITH TRUSTEES |
| Shareholders can communicate directly with the Board of Trustees by writing to the Chair of the Board, PGIM Global Dynamic Bond Fund, PGIM Investments, Attn: Board of Trustees, 655 Broad Street, Newark, NJ 07102. Shareholders can communicate directly with an individual Trustee by writing to that Trustee at the same address. Communications are not screened before being delivered to the addressee. |
| | |
| AVAILABILITY OF PORTFOLIO HOLDINGS |
| The Fund files its complete schedule of portfolio holdings with the Securities and Exchange Commission for the first and third quarters of each fiscal year as an exhibit to its reports on Form N-PORT. The Fund’s Form N-PORT filings are available on the Commission’s website at sec.gov. |
| | |
| The Fund’s Statement of Additional Information contains additional information about the Fund’s Trustees and is available without charge, upon request, by calling (800) 225-1852. |
Mutual Funds:
| | | | |
| | | |
| ARE NOT INSURED BY THE FDIC OR ANY FEDERAL GOVERNMENT AGENCY | | MAY LOSE VALUE | | ARE NOT A DEPOSIT OF OR GUARANTEED BY ANY BANK OR ANY BANK AFFILIATE |
PGIM GLOBAL DYNAMIC BOND FUND
| | | | | | | | | | |
| | | | | |
| SHARE CLASS | | | | A | | C | | Z | | R6 |
| | | | | |
| NASDAQ | | | | PAJAX | | PAJCX | | PAJZX | | PAJQX |
| | | | | |
| CUSIP | | | | 74440K645 | | 74440K637 | | 74440K611 | | 74440K629 |
MF233E

PGIM WADHWANI SYSTEMATIC ABSOLUTE
RETURN FUND
ANNUAL REPORT
OCTOBER 31, 2021

|
|
To enroll in e-delivery, go to pgim.com/investments/resource/edelivery |
Table of Contents
This report is not authorized for distribution to prospective investors unless preceded or accompanied by a current prospectus.
The views expressed in this report and information about the Fund’s portfolio holdings are for the period covered by this report and are subject to change thereafter.
Mutual funds are distributed by Prudential Investment Management Services LLC, a Prudential Financial company,member SIPC. PGIM Wadhwani is the primary business name of PGIM Wadhwani LLP, a wholly owned subsidiary of PGIM, Inc. (PGIM), a Prudential Financial company. © 2021 Prudential Financial, Inc. and its related entities. PGIM and the PGIM logo are service marks of Prudential Financial, Inc. and its related entities, registered in many jurisdictions worldwide.
| | |
| 2 | | Visit our website at pgim.com/investments |
Letter from the President
| | |
 | | Dear Shareholder: We hope you find the annual report for the PGIM Wadhwani Systematic Absolute Return Fund informative and useful. The report covers performance for the period from the Fund’s inception on September 28, 2021 through October 31, 2021. The global economy and markets continued to recover throughout the period from the ongoing impact of the COVID-19 pandemic. The Federal Reserve slashed interest rates and kept them near zero to encourage borrowing. |
| | |
Congress passed stimulus bills worth several trillion dollars to help consumers and businesses. And several effective COVID-19 vaccines received regulatory approval. Those measures were enough to offset the fear of rising inflation and supply chain challenges that threatened to disrupt growth. |
At the start of the period, stocks had recovered most of the steep losses they had suffered at the onset of the pandemic. Equities rallied as states reopened their economies but became more volatile as investors worried that a surge in COVID-19 infections would stall the recovery. However, rising corporate profits and economic growth, the resolution of the US presidential election, and the global rollout of approved vaccines lifted equity markets to record levels, helping stocks around the globe post gains for the full period.
Throughout this volatile period, investors sought safety in fixed income. Investment-grade bonds in the US and the overall global bond market declined slightly during the period as the economy recovered, but emerging market debt rose. While the 10-year US Treasury yield hovered near record lows early in the period after a significant rally in interest rates, rates moved higher later on as investors began to focus on stronger economic growth and the prospects of higher inflation. The Fed also took several aggressive actions to keep the bond markets running smoothly, implementing many of the relief programs that proved to be successful in helping end the global financial crisis in 2008-09.
Regarding your investments with PGIM, we believe it is important to maintain a diversified portfolio of funds consistent with your tolerance for risk, time horizon, and financial goals. Your financial advisor can help you create a diversified investment plan that may include funds covering all the basic asset classes and that reflects your personal investor profile and risk tolerance. However, diversification and asset allocation strategies do not assure a profit or protect against loss in declining markets.
At PGIM Investments, we consider it a great privilege and responsibility to help investors participate in opportunities across global markets while meeting their toughest investment challenges. PGIM is a top-10 global investment manager with more than $1.5 trillion in assets under management. This scale and investment expertise allow us to deliver actively managed funds and strategies to meet the needs of investors around the globe.
Thank you for choosing our family of funds.
Sincerely,

Stuart S. Parker, President
PGIM Wadhwani Systematic Absolute Return Fund
December 15, 2021
| | | | |
PGIM Wadhwani Systematic Absolute Return Fund | | | 3 | |
Your Fund’s Performance (unaudited)
Performance data quoted represent past performance. Past performance does not guarantee future results. The investment return and principal value of an investment will fluctuate so that an investor’s shares, when redeemed, may be worth more or less than their original cost. Current performance may be lower or higher than the past performance data quoted. An investor may obtain performance data as of the most recent month-end by visiting our website at pgim.com/investments or by calling (800) 225-1852.
| | |
| | | Total Returns as of 10/31/21
Since Inception (%) |
| |
| Class A | | |
| |
| (without sales charges) | | 2.20 (09/28/2021) |
| |
| Class C | | |
| |
| (without sales charges) | | 2.10 (09/28/2021) |
| |
| Class Z | | |
| |
| (without sales charges) | | 2.20 (09/28/2021) |
| |
| Class R6 | | |
| |
| (without sales charges) | | 2.20 (09/28/2021) |
| |
| ICE BofA 3-Month T-Bill Index | | |
| |
| | | 0.00 |
Since Inception returns are provided since the Fund has less than 10 fiscal years of returns. Since Inception returns for the Index are measured from the closest month-end to the Fund’s inception date.
| | |
| 4 | | Visit our website at pgim.com/investments |
Growth of a $10,000 Investment (unaudited)
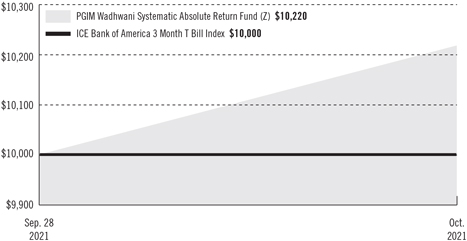
The graph compares a $10,000 investment in the Fund’s Class Z shares with a similar investment in the ICE BofA 3-Month T Bill Index by portraying the initial account values at the commencement of operations for Class Z shares (September 28, 2021) and the account values at the end of the current fiscal year (October 31, 2021), as measured on a quarterly basis. For purposes of the graph, and unless otherwise indicated, it has been assumed that (a) all recurring fees (including management fees) were deducted and (b) all dividends and distributions were reinvested. The line graph provides information for Class Z shares only. As indicated in the tables provided earlier, performance for other share classes will vary due to the differing fees and expenses applicable to each share class (as indicated in the following paragraphs). Without waiver of fees and/or expense reimbursements, if any, the returns would have been lower.
Past performance does not predict future performance. Total returns and the ending account values in the graph include changes in share price and reinvestment of dividends and capital gains distributions in a hypothetical investment for the periods shown. The Fund’s total returns do not reflect the deduction of income taxes on an individual’s investment. Taxes may reduce your actual investment returns on income or gains paid by the Fund or any gains you may realize if you sell your shares.
| | | | |
PGIM Wadhwani Systematic Absolute Return Fund | | | 5 | |
Your Fund’s Performance (continued)
The returns in the tables do not reflect the deduction of taxes that a shareholder would pay on Fund distributions or following the redemption of Fund shares. The average annual total returns take into account applicable sales charges, which are described for each share class in the table below.
| | | | | | | | |
| | | | | |
| | | Class A | | Class C | | Class Z | | Class R6 |
Maximum initial sales
charge | | 5.50% of the public offering price | | None | | None | | None |
Contingent deferred
sales charge (CDSC)
(as a percentage of
the lower of the
original purchase
price or the net asset
value at redemption) | | 1.00% on sales of $1
million or more made
within 12 months of
purchase | | 1.00% on
sales made
within 12
months of
purchase | | None | | None |
Annual distribution
and service (12b-1)
fees (shown as a
percentage of average
daily net assets) | | 0.25% | | 1.00% | | None | | None |
Benchmark Definitions
ICE BofA 3-Month T Bill Index—The ICE BofA 3-Month US Treasury Bill Index tracks the performance of US dollar-denominated US Treasury bills publicly issued in the US domestic market with a remaining term to final maturity of 3 months.
Investors cannot invest directly in an index. The returns for the Index would be lower if they included the effects of sales charges, operating expenses of a mutual fund, or taxes that may be paid by an investor.
| | |
| 6 | | Visit our website at pgim.com/investments |
Strategy and Performance Overview (unaudited)
How did the Fund perform?
The PGIM Wadhwani Systematic Absolute Return Fund’s Class Z shares returned 2.20% (net of fees) since the Fund’s inception on September 28, 2021 through October 31, 2021 (the reporting period), outperforming the 0.00% return of the ICE BofA 3-Month T-Bill Index (the Index).
What were the market conditions?
| | • | | The main theme driving markets during the reporting period was a growing recognition that, despite signs the global economic recovery had less luster than anticipated, higher-than-expected inflation meant that some major central banks might act more forcefully in normalizing policy interest rates than had previously seemed likely. |
| | • | | Supporting this view was the change in Canadian and United Kingdom (UK) central bank rhetoric, and that the Australian central bank did not appear to defend its interest rate target, during the period. Yields implied by December 2022 short-term interest rate futures rose by 120 basis points (bps) in Australia, 70 bps in Canada, and 60 bps in the UK. (One basis point equals 0.01%.) In the US, markets seemed to expect the Federal Reserve’s (the Fed’s) policy interest rates to be about 50 bps higher by year-end 2022, which would put them above the Fed’s own median forecast from September 22, 2021. PGIM Wadhwani has warned of upside inflation risks for some time, but the magnitude and rapidity of these market moves during the period were consistent with the forced liquidation that is often seen after a value-at-risk (VAR) shock (i.e., a jump in the maximum loss that a market in aggregate can be reasonably expected to sustain over a short period of time.) After all, underlying inflation pressures in Australia are probably more contained than in many other developed countries, in PGIM Wadhwani’s view, and it may not have been obvious that the country’s central bank would need to do as much work as implied by interest rate futures at the end of the period. |
| | • | | Shifts of this order might have been expected to hurt investor confidence, resulting in a sharp drop in equity prices. However, stocks made significant gains instead during the period. For example, the MSCI World Index rose more than 5% during October 2021 due to a positive corporate earnings season, reduced concern about contagion from a debt crisis at Chinese property developer Evergrande, and relief associated with the postponement of a potential crisis related to the US debt ceiling. Longer-term US Treasury yields edged higher during the period and rose about 5 bps in October. Low real long-term interest rates continued to underpin equity valuations. In contrast, Australian 10-year government bond yields rose dramatically—from nearly 1.5% to about 2.1% over the course of October. |
| | • | | Like equities, commodities generally took the expected shift in central banks’ reaction functions in stride. (A reaction function refers to how central banks adjust monetary |
| | | | |
PGIM Wadhwani Systematic Absolute Return Fund | | | 7 | |
Strategy and Performance Overview (continued)
| | policy based on evolving conditions and expectations.) Meanwhile, commodity-sensitive currencies appreciated markedly, with the New Zealand dollar, Australian dollar, and Norwegian krone each rising by more than 3.5% versus the US dollar. |
What worked?
| | • | | In terms of investment styles, the directional and relative value models both contributed positively overall to the Fund’s performance during the reporting period. |
| | • | | All three of the asset classes (equities, fixed income, and currencies) on which the Fund focuses added to its performance, with the bulk of gains coming from equities. Currencies, though accounting for a low share of total risk, were particularly profitable. |
| | • | | Within equities, the Fund had long exposure to most developed markets (largely due to signals from directional models), which bolstered performance. Country-based equity strategies driven by relative value models added slightly to results. |
| | • | | In fixed income, the Fund benefited from directional models, which helped generate positive returns. Yield curve strategies, which sought to take advantage of the flattening of the yield curve, performed well. |
| | • | | Regarding currencies, the Fund was helped by long exposure to several that are commodity sensitive, led by the Norwegian krone, Canadian dollar, and New Zealand dollar. In addition, the Fund took advantage of weakness in the Japanese yen, as well as the appreciation of the UK pound sterling as markets reassessed the near-term possibility that the Bank of England would start to normalize monetary policy. |
What didn’t work?
| | • | | During the reporting period, the Fund was hurt by its exposure to Japanese stocks amid declines in the Japanese equity market. |
| | • | | Within fixed income, the Fund was hampered by relative value strategies, especially country-based models. |
Did the Fund use derivatives?
The Fund invests in exchange-traded equity and bond index futures and in forward foreign currency exchange contracts within both developed and emerging markets. During the reporting period, these derivative exposures were responsible for all the Fund’s positive performance, excluding interest on cash holdings.
Current outlook
| | • | | Looking ahead, PGIM Wadhwani sees two possible scenarios, both of which have significant probability. |
| | • | | The first is a “soft landing” scenario, wherein transitory drivers pushing up inflation diminish during 2022, vindicating the Fed’s view as set out in its economic projections earlier in 2021, and inflation data turns out to be lower than consensus expectations. This would allow the Fed to go slowly on policy normalization. |
| | |
| 8 | | Visit our website at pgim.com/investments |
| | Meanwhile longer-term interest rates, which are determined by market pricing, may not rise very much and real rates would then remain low. In this scenario, the relative valuation of equities versus bonds would stay largely unaffected, in PGIM Wadhwani’s view. |
| | • | | The second is a “hard landing” scenario, wherein central banks initially tighten monetary policy by less than the markets have priced in. Investors might then question the credibility of central banks, causing inflation expectations to dislodge. Higher short-term inflation expectations could be replaced with longer-term inflation expectations, which PGIM Wadhwani believes could affect wage and price growth expectations and lead to a self-reinforcing inflation spiral. In this scenario, central banks might be forced to tighten monetary policy more aggressively than the market had previously anticipated, resulting in tighter financial conditions and potentially precipitating a recession. Real interest rateswould likely rise in response, which could cause both equity and bond markets to suffer. |
| | • | | At the end of the reporting period, PGIM Wadhwani had positioned the Fund for a flatter yield curve. |
| | • | | The Fund’s VAR was lower at the end of the period than it had been at the beginning. PGIM Wadhwani believes this lower VAR is consistent with elevated levels of uncertainty. |
| | | | |
PGIM Wadhwani Systematic Absolute Return Fund | | | 9 | |
Fees and Expenses (unaudited)
As a shareholder of the Fund, you incur two types of costs: (1) transaction costs, including sales charges (loads) on purchase payments and redemptions, as applicable, and (2) ongoing costs, including management fees, distribution and/or service (12b-1) fees, and other Fund expenses, as applicable. This example is intended to help you understand your ongoing costs (in dollars) of investing in the Fund and to compare these costs with the ongoing costs of investing in other mutual funds.
The example is based on an investment of $1,000 held through the six-month period ended October 31, 2021. The example is for illustrative purposes only; you should consult the Prospectus for information on initial and subsequent minimum investment requirements.
Actual Expenses
The first line for each share class in the table on the following page provides information about actual account values and actual expenses. You may use the information on this line, together with the amount you invested, to estimate the expenses that you paid over the period. Simply divide your account value by $1,000 (for example, an $8,600 account value ÷ $1,000 = 8.6), then multiply the result by the number on the first line under the heading “Expenses Paid During the Six-Month Period” to estimate the expenses you paid on your account during this period.
Hypothetical Example for Comparison Purposes
The second line for each share class in the table on the following page provides information about hypothetical account values and hypothetical expenses based on the Fund’s actual expense ratio and an assumed rate of return of 5% per year before expenses, which is not the Fund’s actual return. The hypothetical account values and expenses may not be used to estimate the actual ending account balance or expenses you paid for the period. You may use this information to compare the ongoing costs of investing in the Fund and other funds. To do so, compare this 5% hypothetical example with the 5% hypothetical examples that appear in the shareholder reports of the other funds.
The Fund’s transfer agent may charge additional fees to holders of certain accounts that are not included in the expenses shown in the table on the following page. These fees apply to individual retirement accounts (IRAs) and Section 403(b) accounts. As of the close of the six-month period covered by the table, IRA fees included an annual maintenance fee of $15 per account (subject to a maximum annual maintenance fee of $25 for all accounts held by the same shareholder). Section 403(b) accounts are charged an annual $25 fiduciary maintenance fee. Some of the fees may vary in amount, or may be waived, based on your total account balance or the number of PGIM funds, including the Fund, that you own. You should consider the additional fees that were charged to your Fund account over the six-month period when you estimate the total ongoing expenses paid over the period and the impact of these fees on your ending account value, as these additional expenses are not reflected in the information
| | |
| 10 | | Visit our website at pgim.com/investments |
provided in the expense table. Additional fees have the effect of reducing investment returns.
Please note that the expenses shown in the table are meant to highlight your ongoing costs only and do not reflect any transactional costs such as sales charges (loads). Therefore, the second line for each share class in the table is useful in comparing ongoing costs only and will not help you determine the relative total costs of owning different funds. In addition, if these transactional costs were included, your costs would have been higher.
| | | | | | | | | | |
| | | | |
PGIM Wadhwani Systematic
Absolute Return Fund | | Beginning
Account Value May 1, 2021 | | Ending
Account Value October 31, 2021 | | Annualized
Expense
Ratio Based on
the
Six-Month Period | | Expenses Paid
During the
Six-Month Period* |
| Class A | | Actual** | | $1,000.00 | | $1,022.00 | | 1.40% | | $ 1.32 |
| | Hypothetical | | $1,000.00 | | $1,018.15 | | 1.40% | | $ 7.12 |
| Class C | | Actual** | | $1,000.00 | | $1,021.00 | | 2.15% | | $ 2.02 |
| | Hypothetical | | $1,000.00 | | $1,014.37 | | 2.15% | | $10.92 |
| Class Z | | Actual** | | $1,000.00 | | $1,022.00 | | 1.15% | | $ 1.08 |
| | Hypothetical | | $1,000.00 | | $1,019.41 | | 1.15% | | $ 5.85 |
| Class R6 | | Actual** | | $1,000.00 | | $1,022.00 | | 1.10% | | $ 1.04 |
| | | Hypothetical | | $1,000.00 | | $1,019.66 | | 1.10% | | $ 5.60 |
*Fund expenses (net of fee waivers or subsidies, if any) for each share class are equal to the annualized expense ratio for each share class (provided in the table), multiplied by the average account value over the period, multiplied by the 184 days in the six-month period ended October 31, 2021, and divided by the 365 days in the Fund’s fiscal year ended October 31, 2021 (to reflect the six-month period). Expenses presented in the table include the expenses of any underlying portfolios in which the Fund may invest.
**“Actual” expenses are calculated using 34-day period ended October 31, 2021 due to the Fund’s inception date of September 28, 2021.
| | | | |
PGIM Jennison Natural Resources Fund | | | 11 | |
Schedule of Investments
as of October 31, 2021
| | | | | | | | |
| | |
| Description | | Shares | | | Value | |
| | |
SHORT-TERM INVESTMENT 79.6% | | | | | | | | |
| | |
AFFILIATED MUTUAL FUND | | | | | | | | |
PGIM Core Ultra Short Bond Fund
(cost $24,447,267)(wb) | | | 24,447,267 | | | $ | 24,447,267 | |
| | | | | | | | |
| | |
TOTAL INVESTMENTS 79.6%
(cost $24,447,267) | | | | | | | 24,447,267 | |
Other assets in excess of liabilities(z) 20.4% | | | | | | | 6,259,705 | |
| | | | | | | | |
| | |
NET ASSETS 100.0% | | | | | | $ | 30,706,972 | |
| | | | | | | | |
Below is a list of the abbreviation(s) used in the annual report:
AUD—Australian Dollar
BRL—Brazilian Real
CAD—Canadian Dollar
CHF—Swiss Franc
CLP—Chilean Peso
CNH—Chinese Renminbi
COP—Colombian Peso
CZK—Czech Koruna
EUR—Euro
GBP—British Pound
HUF—Hungarian Forint
IDR—Indonesian Rupiah
ILS—Israeli Shekel
INR—Indian Rupee
JPY—Japanese Yen
KRW—South Korean Won
MXN—Mexican Peso
NOK—Norwegian Krone
NZD—New Zealand Dollar
PLN—Polish Zloty
SEK—Swedish Krona
SGD—Singapore Dollar
THB—Thai Baht
TRY—Turkish Lira
TWD—New Taiwanese Dollar
ZAR—South African Rand
ASX—Australian Securities Exchange
CAC40—French Stock Market Index
DAX—German Stock Index
FTSE—Financial Times Stock Exchange
JSE—Johannesburg Stock Exchange
KLCI—Kuala Lumpur Composite Index
KOSPI—Korean Composite Stock Price Index
LIBOR—London Interbank Offered Rate
MIB—Borsa Italiana Stock Exchange
MSCI—Morgan Stanley Capital International
See Notes to Financial Statements.
| | | | |
PGIM Wadhwani Systematic Absolute Return Fund | | | 13 | |
Schedule of Investments (continued)
as of October 31, 2021
NASDAQ—National Association of Securities Dealers Automated Quotations
OBX—Oslo Stock Exchange
S&P—Standard & Poor’s
SET—Stock Exchange of Thailand
SGX—Singapore Exchange
SPI—Share Price Index
STOXX—Stock Index of the Eurozone
TOPIX—Tokyo Stock Price Index
TSX—Toronto Stock Exchange
| (wb) | PGIM Investments LLC, the manager of the Fund, also serves as manager of the PGIM Core Ultra Short Bond Fund. |
| (z) | Includes net unrealized appreciation/(depreciation) and/or market value of the below holdings which are excluded from the Schedule of Investments: |
Futures contracts outstanding at October 31, 2021:
| | | | | | | | | | | | | | | | | |
Number
of
Contracts | | Type | | Expiration Date | | Current
Notional
Amount | | Value /
Unrealized
Appreciation
(Depreciation) |
| Long Positions: | | | | | | |
| 23 | | 10 Year Australian Treasury Bonds | | | | Dec. 2021 | | | | | $2,333,165 | | | | | $(51,103 | ) |
| 14 | | 10 Year Canadian Government Bonds | | | | Dec. 2021 | | | | | 1,594,457 | | | | | (6,639 | ) |
| 2 | | 10 Year Japanese Bonds | | | | Dec. 2021 | | | | | 2,655,319 | | | | | (184 | ) |
| 30 | | 10 Year U.S. Treasury Notes | | | | Dec. 2021 | | | | | 3,921,094 | | | | | (3,757 | ) |
| 12 | | 20 Year U.S. Treasury Bonds | | | | Dec. 2021 | | | | | 1,930,125 | | | | | 5,297 | |
| 6 | | 30 Year Euro Buxl | | | | Dec. 2021 | | | | | 1,449,485 | | | | | 14,699 | |
| 4 | | 30 Year U.S. Ultra Treasury Bonds | | | | Dec. 2021 | | | | | 785,625 | | | | | 18,588 | |
| 16 | | ASX SPI 200 Index | | | | Dec. 2021 | | | | | 2,190,552 | | | | | (27,892 | ) |
| 7 | | CAC40 10 Euro | | | | Nov. 2021 | | | | | 552,400 | | | | | 8,731 | |
| 2 | | DAX Index | | | | Dec. 2021 | | | | | 905,379 | | | | | 2,309 | |
| 26 | | Euro Schatz Index | | | | Dec. 2021 | | | | | 3,365,070 | | | | | (5,269 | ) |
| 38 | | Euro STOXX 50 Index | | | | Dec. 2021 | | | | | 1,861,229 | | | | | 24,905 | |
| 15 | | FTSE 100 Index | | | | Dec. 2021 | | | | | 1,482,961 | | | | | 4,688 | |
| 1 | | FTSE MIB Index | | | | Dec. 2021 | | | | | 154,598 | | | | | 6,774 | |
| 6 | | Mexican Bolsa Index | | | | Dec. 2021 | | | | | 149,178 | | | | | (1,619 | ) |
| 1 | | MSCI Singapore Index | | | | Nov. 2021 | | | | | 27,290 | | | | | (121 | ) |
| 9 | | NASDAQ 100 E-Mini Index | | | | Dec. 2021 | | | | | 2,850,930 | | | | | 64,974 | |
| 10 | | Nikkei 225 (SGX) | | | | Dec. 2021 | | | | | 1,262,777 | | | | | (5,719 | ) |
| 3 | | OBX Index | | | | Nov. 2021 | | | | | 37,512 | | | | | (293 | ) |
| 14 | | Russell 2000 E-Mini Index | | | | Dec. 2021 | | | | | 1,606,710 | | | | | 12,050 | |
| 20 | | S&P 500 E-Mini Index | | | | Dec. 2021 | | | | | 4,597,000 | | | | | 72,565 | |
| 19 | | S&P TSX 60 Index | | | | Dec. 2021 | | | | | 3,870,314 | | | | | 23,757 | |
| 8 | | TOPIX Index | | | | Dec. 2021 | | | | | 1,398,552 | | | | | (12,832 | ) |
| | | | | | | | | | | | | | | | | |
| | | | | | | | | | | | | | | | 143,909 | |
| | | | | | | | | | | | | | | | | |
| Short Positions: | | | | | | |
| 20 | | 90 Day Sterling | | | | Dec. 2022 | | | | | 3,373,305 | | | | | 4,641 | |
| 9 | | 2 Year U.S. Treasury Notes | | | | Dec. 2021 | | | | | 1,973,250 | | | | | (135 | ) |
| 7 | | 5 Year Euro-Bobl | | | | Dec. 2021 | | | | | 1,082,386 | | | | | 2,642 | |
| 19 | | 5 Year U.S. Treasury Notes | | | | Dec. 2021 | | | | | 2,313,250 | | | | | (873 | ) |
| 4 | | 10 Year Euro-Bund | | | | Dec. 2021 | | | | | 777,387 | | | | | 2,968 | |
See Notes to Financial Statements.
Futures contracts outstanding at October 31, 2021 (continued):
| | | | | | | | | | | | | | | | | |
Number
of
Contracts | | Type | | Expiration Date | | Current
Notional
Amount | | Value /
Unrealized
Appreciation
(Depreciation) |
| Short Positions (cont’d): | | | | | | |
| 20 | | 10 Year U.K. Gilt | | | | Dec. 2021 | | | | | $3,419,185 | | | | | $(11,745 | ) |
| 3 | | FTSE Bursa Malaysia KLCI Index | | | | Nov. 2021 | | | | | 56,599 | | | | | 750 | |
| 2 | | FTSE JSE Top 40 Index | | | | Dec. 2021 | | | | | 80,022 | | | | | (1,995 | ) |
| 1 | | Hang Seng China Enterprises Index | | | | Nov. 2021 | | | | | 57,522 | | | | | 2,132 | |
| 1 | | Hang Seng Index | | | | Nov. 2021 | | | | | 162,612 | | | | | 1,187 | |
| 1 | | KOSPI 200 Index | | | | Dec. 2021 | | | | | 83,041 | | | | | 1,079 | |
| 27 | | SET 50 Index | | | | Dec. 2021 | | | | | 158,619 | | | | | (592 | ) |
| | | | | | | | | | | | | | | | 59 | |
| | | | | | | | | | | | | | | | | |
| | | | | | | | | | | | | | | | $143,968 | |
| | | | | | | | | | | | | | | | | |
Forward foreign currency exchange contracts outstanding at October 31, 2021:
| | | | | | | | | | | | | | | | | | | | | | | | | | | | | | |
Purchase
Contracts | | Counterparty | | Notional
Amount
(000) | | Value at
Settlement
Date | | Current
Value | | Unrealized
Appreciation | | Unrealized
Depreciation |
| OTC Forward Foreign Currency Exchange Contracts: | | | | | | | | | | | |
Australian Dollar, | | | | | | | | | | | | | | | | | | | | | | | | | | | |
Expiring 11/17/21 | | Morgan Stanley & Co. LLC | | | AUD | 610 | | | | | $ 460,520 | | | | | $ 458,907 | | | | | $ — | | | | | $ (1,613 | ) |
Expiring 11/17/21 | | Morgan Stanley & Co. LLC | | | AUD | 550 | | | | | 413,596 | | | | | 413,768 | | | | | 172 | | | | | — | |
Expiring 11/17/21 | | Morgan Stanley & Co. LLC | | | AUD | 320 | | | | | 240,936 | | | | | 240,738 | | | | | — | | | | | (198 | ) |
Expiring 11/17/21 | | Morgan Stanley & Co. LLC | | | AUD | 260 | | | | | 194,469 | | | | | 195,600 | | | | | 1,131 | | | | | — | |
Expiring 11/17/21 | | Morgan Stanley & Co. LLC | | | AUD | 260 | | | | | 191,241 | | | | | 195,600 | | | | | 4,359 | | | | �� | — | |
Expiring 11/17/21 | | Morgan Stanley & Co. LLC | | | AUD | 220 | | | | | 165,299 | | | | | 165,507 | | | | | 208 | | | | | — | |
Expiring 11/17/21 | | Morgan Stanley & Co. LLC | | | AUD | 210 | | | | | 155,679 | | | | | 157,984 | | | | | 2,305 | | | | | — | |
Expiring 11/17/21 | | Morgan Stanley & Co. LLC | | | AUD | 200 | | | | | 150,122 | | | | | 150,461 | | | | | 339 | | | | | — | |
Expiring 11/17/21 | | Morgan Stanley & Co. LLC | | | AUD | 180 | | | | | 133,439 | | | | | 135,415 | | | | | 1,976 | | | | | — | |
Expiring 11/17/21 | | Morgan Stanley & Co. LLC | | | AUD | 160 | | | | | 119,434 | | | | | 120,369 | | | | | 935 | | | | | — | |
Expiring 11/17/21 | | Morgan Stanley & Co. LLC | | | AUD | 150 | | | | | 111,297 | | | | | 112,846 | | | | | 1,549 | | | | | — | |
Expiring 11/17/21 | | Morgan Stanley & Co. LLC | | | AUD | 80 | | | | | 59,344 | | | | | 60,184 | | | | | 840 | | | | | — | |
Expiring 11/17/21 | | Morgan Stanley & Co. LLC | | | AUD | 60 | | | | | 45,093 | | | | | 45,138 | | | | | 45 | | | | | — | |
Expiring 11/17/21 | | Morgan Stanley & Co. LLC | | | AUD | 60 | | | | | 44,877 | | | | | 45,138 | | | | | 261 | | | | | — | |
Expiring 11/17/21 | | Morgan Stanley & Co. LLC | | | AUD | 40 | | | | | 29,672 | | | | | 30,092 | | | | | 420 | | | | | — | |
Expiring 11/17/21 | | Morgan Stanley & Co. LLC | | | AUD | 40 | | | | | 29,653 | | | | | 30,092 | | | | | 439 | | | | | — | |
Expiring 11/17/21 | | Morgan Stanley & Co. LLC | | | AUD | 30 | | | | | 22,394 | | | | | 22,569 | | | | | 175 | | | | | — | |
Expiring 11/17/21 | | Morgan Stanley & Co. LLC | | | AUD | 30 | | | | | 22,649 | | | | | 22,570 | | | | | — | | | | | (79 | ) |
Expiring 11/17/21 | | Morgan Stanley & Co. LLC | | | AUD | 20 | | | | | 15,031 | | | | | 15,046 | | | | | 15 | | | | | — | |
Expiring 11/17/21 | | Morgan Stanley & Co. LLC | | | AUD | 20 | | | | | 15,059 | | | | | 15,047 | | | | | — | | | | | (12 | ) |
Expiring 11/17/21 | | Morgan Stanley & Co. LLC | | | AUD | 20 | | | | | 14,959 | | | | | 15,046 | | | | | 87 | | | | | — | |
Expiring 11/17/21 | | Morgan Stanley & Co. LLC | | | AUD | 20 | | | | | 15,027 | | | | | 15,046 | | | | | 19 | | | | | — | |
Expiring 11/17/21 | | Morgan Stanley & Co. LLC | | | AUD | 20 | | | | | 14,840 | | | | | 15,047 | | | | | 207 | | | | | — | |
Expiring 11/17/21 | | Morgan Stanley & Co. LLC | | | AUD | 10 | | | | | 7,550 | | | | | 7,524 | | | | | — | | | | | (26 | ) |
See Notes to Financial Statements.
| | | | |
PGIM Wadhwani Systematic Absolute Return Fund | | | 15 | |
Schedule of Investments (continued)
as of October 31, 2021
Forward foreign currency exchange contracts outstanding at October 31, 2021 (continued):
| | | | | | | | | | | | | | | | | | | | | | | | | | | | | | |
Purchase
Contracts | | Counterparty | | Notional
Amount
(000) | | Value at
Settlement
Date | | Current
Value | | Unrealized
Appreciation | | Unrealized
Depreciation |
| OTC Forward Foreign Currency Exchange Contracts (cont’d.): | |
| Australian Dollar (cont’d.), | | | | | | | | | | |
Expiring 11/17/21 | | Morgan Stanley & Co. LLC | | | AUD | 10 | | | | | $ 7,465 | | | | | $ 7,523 | | | | | $ 58 | | | | | $ — | |
Expiring 11/17/21 | | Morgan Stanley & Co. LLC | | | AUD | 10 | | | | | 7,480 | | | | | 7,523 | | | | | 43 | | | | | — | |
Expiring 11/17/21 | | Morgan Stanley & Co. LLC | | | AUD | 10 | | | | | 7,413 | | | | | 7,523 | | | | | 110 | | | | | — | |
Expiring 11/17/21 | | Morgan Stanley & Co. LLC | | | AUD | 10 | | | | | 7,529 | | | | | 7,523 | | | | | — | | | | | (6 | ) |
| Brazilian Real, | | | | | | | | | | | | |
Expiring 11/03/21 | | Morgan Stanley & Co. LLC | | | BRL | 1,199 | | | | | 220,000 | | | | | 212,207 | | | | | — | | | | | (7,793 | ) |
Expiring 11/03/21 | | Morgan Stanley & Co. LLC | | | BRL | 614 | | | | | 110,000 | | | | | 108,609 | | | | | — | | | | | (1,391 | ) |
Expiring 11/03/21 | | Morgan Stanley & Co. LLC | | | BRL | 218 | | | | | 40,000 | | | | | 38,602 | | | | | — | | | | | (1,398 | ) |
Expiring 11/03/21 | | Morgan Stanley & Co. LLC | | | BRL | 55 | | | | | 10,000 | | | | | 9,767 | | | | | — | | | | | (233 | ) |
Expiring 11/03/21 | | Morgan Stanley & Co. LLC | | | BRL | 55 | | | | | 10,000 | | | | | 9,736 | | | | | — | | | | | (264 | ) |
Expiring 11/03/21 | | Morgan Stanley & Co. LLC | | | BRL | 55 | | | | | 10,000 | | | | | 9,775 | | | | | — | | | | | (225 | ) |
Expiring 11/03/21 | | Morgan Stanley & Co. LLC | | | BRL | 54 | | | | | 10,000 | | | | | 9,624 | | | | | — | | | | | (376 | ) |
Expiring 11/03/21 | | Morgan Stanley & Co. LLC | | | BRL | 54 | | | | | 10,000 | | | | | 9,599 | | | | | — | | | | | (401 | ) |
Expiring 11/03/21 | | Morgan Stanley & Co. LLC | | | BRL | 54 | | | | | 10,000 | | | | | 9,638 | | | | | — | | | | | (362 | ) |
Expiring 11/03/21 | | Morgan Stanley & Co. LLC | | | BRL | 37 | | | | | 6,697 | | | | | 6,592 | | | | | — | | | | | (105 | ) |
Expiring 12/02/21 | | Morgan Stanley & Co. LLC | | | BRL | 898 | | | | | 160,000 | | | | | 158,030 | | | | | — | | | | | (1,970 | ) |
Expiring 12/02/21 | | Morgan Stanley & Co. LLC | | | BRL | 57 | | | | | 10,000 | | | | | 9,961 | | | | | — | | | | | (39 | ) |
Expiring 12/02/21 | | Morgan Stanley & Co. LLC | | | BRL | 56 | | | | | 10,000 | | | | | 9,848 | | | | | — | | | | | (152 | ) |
| British Pound, | | | | | | | | | | | | |
Expiring 11/17/21 | | Morgan Stanley & Co. LLC | | | GBP | 730 | | | | | 994,860 | | | | | 999,054 | | | | | 4,194 | | | | | — | |
Expiring 11/17/21 | | Morgan Stanley & Co. LLC | | | GBP | 310 | | | | | 422,428 | | | | | 424,256 | | | | | 1,828 | | | | | — | |
Expiring 11/17/21 | | Morgan Stanley & Co. LLC | | | GBP | 220 | | | | | 299,748 | | | | | 301,085 | | | | | 1,337 | | | | | — | |
Expiring 11/17/21 | | Morgan Stanley & Co. LLC | | | GBP | 200 | | | | | 272,501 | | | | | 273,714 | | | | | 1,213 | | | | | — | |
Expiring 11/17/21 | | Morgan Stanley & Co. LLC | | | GBP | 150 | | | | | 206,051 | | | | | 205,285 | | | | | — | | | | | (766 | ) |
Expiring 11/17/21 | | Morgan Stanley & Co. LLC | | | GBP | 80 | | | | | 110,381 | | | | | 109,485 | | | | | — | | | | | (896 | ) |
Expiring 11/17/21 | | Morgan Stanley & Co. LLC | | | GBP | 30 | | | | | 41,269 | | | | | 41,057 | | | | | — | | | | | (212 | ) |
Expiring 11/17/21 | | Morgan Stanley & Co. LLC | | | GBP | 10 | | | | | 13,737 | | | | | 13,686 | | | | | — | | | | | (51 | ) |
| Canadian Dollar, | | | | | | | | | | | | |
Expiring 11/17/21 | | Morgan Stanley & Co. LLC | | | CAD | 3,745 | | | | | 3,010,000 | | | | | 3,025,848 | | | | | 15,848 | | | | | — | |
Expiring 11/17/21 | | Morgan Stanley & Co. LLC | | | CAD | 383 | | | | | 309,329 | | | | | 309,398 | | | | | 69 | | | | | — | |
Expiring 11/17/21 | | Morgan Stanley & Co. LLC | | | CAD | 321 | | | | | 259,461 | | | | | 259,204 | | | | | — | | | | | (257 | ) |
Expiring 11/17/21 | | Morgan Stanley & Co. LLC | | | CAD | 247 | | | | | 199,846 | | | | | 199,939 | | | | | 93 | | | | | — | |
Expiring 11/17/21 | | Morgan Stanley & Co. LLC | | | CAD | 124 | | | | | 100,086 | | | | | 100,019 | | | | | — | | | | | (67 | ) |
Expiring 11/17/21 | | Morgan Stanley & Co. LLC | | | CAD | 87 | | | | | 70,000 | | | | | 70,394 | | | | | 394 | | | | | — | |
Expiring 11/17/21 | | Morgan Stanley & Co. LLC | | | CAD | 62 | | | | | 49,871 | | | | | 49,820 | | | | | — | | | | | (51 | ) |
Expiring 11/17/21 | | Morgan Stanley & Co. LLC | | | CAD | 62 | | | | | 50,256 | | | | | 50,125 | | | | | — | | | | | (131 | ) |
Expiring 11/17/21 | | Morgan Stanley & Co. LLC | | | CAD | 50 | | | | | 40,071 | | | | | 40,044 | | | | | — | | | | | (27 | ) |
Expiring 11/17/21 | | Morgan Stanley & Co. LLC | | | CAD | 50 | | | | | 40,000 | | | | | 40,215 | | | | | 215 | | | | | — | |
Expiring 11/17/21 | | Morgan Stanley & Co. LLC | | | CAD | 37 | | | | | 29,942 | | | | | 29,912 | | | | | — | | | | | (30 | ) |
Expiring 11/17/21 | | Morgan Stanley & Co. LLC | | | CAD | 37 | | | | | 29,967 | | | | | 29,937 | | | | | — | | | | | (30 | ) |
Expiring 11/17/21 | | Morgan Stanley & Co. LLC | | | CAD | 25 | | | | | 19,943 | | | | | 19,923 | | | | | — | | | | | (20 | ) |
Expiring 11/17/21 | | Morgan Stanley & Co. LLC | | | CAD | 25 | | | | | 20,015 | | | | | 20,002 | | | | | — | | | | | (13 | ) |
See Notes to Financial Statements.
Forward foreign currency exchange contracts outstanding at October 31, 2021 (continued):
| | | | | | | | | | | | | | | | | | | | | | | | | | | | | | |
Purchase
Contracts | | Counterparty | | Notional
Amount
(000) | | Value at
Settlement
Date | | Current
Value | | Unrealized
Appreciation | | Unrealized
Depreciation |
| OTC Forward Foreign Currency Exchange Contracts (cont’d.): | |
| Canadian Dollar (cont’d.), | | | | | | | | | | |
Expiring 11/17/21 | | Morgan Stanley & Co. LLC | | | CAD | 25 | | | | | $ 19,923 | | | | | $ 19,927 | | | | | $ 4 | | | | | $ — | |
Expiring 11/17/21 | | Morgan Stanley & Co. LLC | | | CAD | 12 | | | | | 9,980 | | | | | 9,970 | | | | | — | | | | | (10 | ) |
Expiring 11/17/21 | | Morgan Stanley & Co. LLC | | | CAD | 12 | | | | | 10,019 | | | | | 9,993 | | | | | — | | | | | (26 | ) |
Expiring 11/17/21 | | Morgan Stanley & Co. LLC | | | CAD | 12 | | | | | 9,497 | | | | | 9,466 | | | | | — | | | | | (31 | ) |
| Chilean Peso, | | | | | | | | | | | | |
Expiring 11/17/21 | | Morgan Stanley & Co. LLC | | | CLP | 24,083 | | | | | 30,000 | | | | | 29,540 | | | | | — | | | | | (460 | ) |
Expiring 11/17/21 | | Morgan Stanley & Co. LLC | | | CLP | 8,201 | | | | | 10,000 | | | | | 10,060 | | | | | 60 | | | | | — | |
Expiring 11/17/21 | | Morgan Stanley & Co. LLC | | | CLP | 8,186 | | | | | 10,000 | | | | | 10,041 | | | | | 41 | | | | | — | |
| Chinese Renminbi, | | | | | | | | | | |
Expiring 11/17/21 | | Morgan Stanley & Co. LLC | | | CNH | 4,395 | | | | | 680,000 | | | | | 684,981 | | | | | 4,981 | | | | | — | |
Expiring 11/17/21 | | Morgan Stanley & Co. LLC | | | CNH | 255 | | | | | 39,942 | | | | | 39,768 | | | | | — | | | | | (174 | ) |
Expiring 11/17/21 | | Morgan Stanley & Co. LLC | | | CNH | 64 | | | | | 9,977 | | | | | 10,017 | | | | | 40 | | | | | — | |
Expiring 11/17/21 | | Morgan Stanley & Co. LLC | | | CNH | 64 | | | | | 9,972 | | | | | 10,023 | | | | | 51 | | | | | — | |
Expiring 11/17/21 | | Morgan Stanley & Co. LLC | | | CNH | 64 | | | | | 9,987 | | | | | 9,953 | | | | | — | | | | | (34 | ) |
| Colombian Peso, | | | | | | | | | | | | |
Expiring 11/18/21 | | Morgan Stanley & Co. LLC | | | COP | 111,814 | | | | | 30,000 | | | | | 29,650 | | | | | — | | | | | (350 | ) |
Expiring 11/18/21 | | Morgan Stanley & Co. LLC | | | COP | 37,576 | | | | | 10,000 | | | | | 9,964 | | | | | — | | | | | (36 | ) |
| Czech Koruna, | | | | | | | | | | | | |
Expiring 11/18/21 | | Morgan Stanley & Co. LLC | | | CZK | 257 | | | | | 11,602 | | | | | 11,582 | | | | | — | | | | | (20 | ) |
Expiring 11/18/21 | | Morgan Stanley & Co. LLC | | | CZK | 254 | | | | | 11,591 | | | | | 11,425 | | | | | — | | | | | (166 | ) |
| Euro, | | | | | | | | | | | | |
Expiring 11/17/21 | | Morgan Stanley & Co. LLC | | | EUR | 150 | | | | | 175,317 | | | | | 173,462 | | | | | — | | | | | (1,855 | ) |
Expiring 11/17/21 | | Morgan Stanley & Co. LLC | | | EUR | 130 | | | | | 150,742 | | | | | 150,334 | | | | | — | | | | | (408 | ) |
Expiring 11/17/21 | | Morgan Stanley & Co. LLC | | | EUR | 130 | | | | | 150,776 | | | | | 150,334 | | | | | — | | | | | (442 | ) |
Expiring 11/17/21 | | Morgan Stanley & Co. LLC | | | EUR | 110 | | | | | 127,801 | | | | | 127,206 | | | | | — | | | | | (595 | ) |
Expiring 11/17/21 | | Morgan Stanley & Co. LLC | | | EUR | 90 | | | | | 104,031 | | | | | 104,077 | | | | | 46 | | | | | — | |
Expiring 11/17/21 | | Morgan Stanley & Co. LLC | | | EUR | 70 | | | | | 80,913 | | | | | 80,949 | | | | | 36 | | | | | — | |
Expiring 11/17/21 | | Morgan Stanley & Co. LLC | | | EUR | 20 | | | | | 23,376 | | | | | 23,129 | | | | | — | | | | | (247 | ) |
Expiring 11/17/21 | | Morgan Stanley & Co. LLC | | | EUR | 20 | | | | | 23,291 | | | | | 23,129 | | | | | — | | | | | (162 | ) |
Expiring 11/17/21 | | Morgan Stanley & Co. LLC | | | EUR | 20 | | | | | 23,237 | | | | | 23,129 | | | | | — | | | | | (108 | ) |
Expiring 11/17/21 | | Morgan Stanley & Co. LLC | | | EUR | 10 | | | | | 11,559 | | | | | 11,564 | | | | | 5 | | | | | — | |
Expiring 11/17/21 | | Morgan Stanley & Co. LLC | | | EUR | 10 | | | | | 11,659 | | | | | 11,564 | | | | | — | | | | | (95 | ) |
Expiring 11/18/21 | | Morgan Stanley & Co. LLC | | | EUR | 40 | | | | | 46,477 | | | | | 46,258 | | | | | — | | | | | (219 | ) |
Expiring 11/18/21 | | Morgan Stanley & Co. LLC | | | EUR | 10 | | | | | 11,619 | | | | | 11,564 | | | | | — | | | | | (55 | ) |
| Hungarian Forint, | | | | | | | | | | | | |
Expiring 11/17/21 | | Morgan Stanley & Co. LLC | | | HUF | 20 | | | | | 65 | | | | | 65 | | | | | — | | | | | — | |
| Indian Rupee, | | | | | | | | | | | | |
Expiring 11/17/21 | | Morgan Stanley & Co. LLC | | | INR | 29,497 | | | | | 390,000 | | | | | 392,578 | | | | | 2,578 | | | | | — | |
Expiring 11/17/21 | | Morgan Stanley & Co. LLC | | | INR | 6,051 | | | | | 80,000 | | | | | 80,531 | | | | | 531 | | | | | — | |
Expiring 11/17/21 | | Morgan Stanley & Co. LLC | | | INR | 2,256 | | | | | 30,000 | | | | | 30,028 | | | | | 28 | | | | | — | |
Expiring 11/17/21 | | Morgan Stanley & Co. LLC | | | INR | 2,252 | | | | | 30,000 | | | | | 29,972 | | | | | — | | | | | (28 | ) |
Expiring 11/17/21 | | Morgan Stanley & Co. LLC | | | INR | 1,513 | | | | | 20,000 | | | | | 20,132 | | | | | 132 | | | | | — | |
See Notes to Financial Statements.
| | | | |
PGIM Wadhwani Systematic Absolute Return Fund | | | 17 | |
Schedule of Investments (continued)
as of October 31, 2021
Forward foreign currency exchange contracts outstanding at October 31, 2021 (continued):
| | | | | | | | | | | | | | | | | | | | | | | | | | | | | | |
Purchase
Contracts | | Counterparty | | Notional
Amount
(000) | | Value at
Settlement
Date | | Current
Value | | Unrealized
Appreciation | | Unrealized
Depreciation |
| OTC Forward Foreign Currency Exchange Contracts (cont’d.): | |
| Indian Rupee (cont’d.), | | | | | | | | | | |
Expiring 11/17/21 | | Morgan Stanley & Co. LLC | | | INR | 1,510 | | | | | $ 20,000 | | | | | $ 20,095 | | | | | $ 95 | | | | $ | — | |
Expiring 11/17/21 | | Morgan Stanley & Co. LLC | | | INR | 755 | | | | | 10,000 | | | | | 10,053 | | | | | 53 | | | | | — | |
Expiring 11/17/21 | | Morgan Stanley & Co. LLC | | | INR | 753 | | | | | 10,000 | | | | | 10,024 | | | | | 24 | | | | | — | |
Expiring 11/17/21 | | Morgan Stanley & Co. LLC | | | INR | 751 | | | | | 10,000 | | | | | 10,001 | | | | | 1 | | | | | — | |
Expiring 11/17/21 | | Morgan Stanley & Co. LLC | | | INR | 750 | | | | | 10,000 | | | | | 9,982 | | | | | — | | | | | (18 | ) |
Expiring 11/17/21 | | Morgan Stanley & Co. LLC | | | INR | 750 | | | | | 10,000 | | | | | 9,977 | | | | | — | | | | | (23 | ) |
Expiring 11/17/21 | | Morgan Stanley & Co. LLC | | | INR | 749 | | | | | 10,000 | | | | | 9,968 | | | | | — | | | | | (32 | ) |
| Indonesian Rupiah, | | | | | | | | | | | | |
Expiring 11/17/21 | | Morgan Stanley & Co. LLC | | | IDR | 3,845,016 | | | | | 270,000 | | | | | 269,797 | | | | | — | | | | | (203 | ) |
Expiring 11/17/21 | | Morgan Stanley & Co. LLC | | | IDR | 283,752 | | | | | 20,000 | | | | | 19,910 | | | | | — | | | | | (90 | ) |
Expiring 11/17/21 | | Morgan Stanley & Co. LLC | | | IDR | 141,722 | | | | | 10,000 | | | | | 9,944 | | | | | — | | | | | (56 | ) |
Expiring 11/17/21 | | Morgan Stanley & Co. LLC | | | IDR | 141,705 | | | | | 10,000 | | | | | 9,943 | | | | | — | | | | | (57 | ) |
Expiring 11/17/21 | | Morgan Stanley & Co. LLC | | | IDR | 140,870 | | | | | 10,000 | | | | | 9,885 | | | | | — | | | | | (115 | ) |
| Israeli Shekel, | | | | | | | | | | | | |
Expiring 11/17/21 | | Morgan Stanley & Co. LLC | | | ILS | 920 | | | | | 290,712 | | | | | 290,901 | | | | | 189 | | | | | — | |
Expiring 11/17/21 | | Morgan Stanley & Co. LLC | | | ILS | 258 | | | | | 80,000 | | | | | 81,686 | | | | | 1,686 | | | | | — | |
Expiring 11/17/21 | | Morgan Stanley & Co. LLC | | | ILS | 158 | | | | | 50,005 | | | | | 49,996 | | | | | — | | | | | (9 | ) |
Expiring 11/17/21 | | Morgan Stanley & Co. LLC | | | ILS | 128 | | | | | 40,017 | | | | | 40,458 | | | | | 441 | | | | | — | |
Expiring 11/17/21 | | Morgan Stanley & Co. LLC | | | ILS | 96 | | | | | 30,003 | | | | | 30,411 | | | | | 408 | | | | | — | |
Expiring 11/17/21 | | Morgan Stanley & Co. LLC | | | ILS | 96 | | | | | 29,991 | | | | | 30,298 | | | | | 307 | | | | | — | |
Expiring 11/17/21 | | Morgan Stanley & Co. LLC | | | ILS | 64 | | | | | 20,000 | | | | | 20,357 | | | | | 357 | | | | | — | |
Expiring 11/17/21 | | Morgan Stanley & Co. LLC | | | ILS | 32 | | | | | 10,015 | | | | | 10,155 | | | | | 140 | | | | | — | |
| Japanese Yen, | | | | | | | | | | | | |
Expiring 11/17/21 | | Morgan Stanley & Co. LLC | | | JPY | 68,219 | | | | | 600,284 | | | | | 598,615 | | | | | — | | | | | (1,669 | ) |
Expiring 11/17/21 | | Morgan Stanley & Co. LLC | | | JPY | 19,371 | | | | | 169,491 | | | | | 169,981 | | | | | 490 | | | | | — | |
Expiring 11/17/21 | | Morgan Stanley & Co. LLC | | | JPY | 9,137 | | | | | 79,993 | | | | | 80,177 | | | | | 184 | | | | | — | |
Expiring 11/17/21 | | Morgan Stanley & Co. LLC | | | JPY | 1,144 | | | | | 10,016 | | | | | 10,039 | | | | | 23 | | | | | — | |
Expiring 11/17/21 | | Morgan Stanley & Co. LLC | | | JPY | 1,138 | | | | | 10,016 | | | | | 9,988 | | | | | — | | | | | (28 | ) |
| Mexican Peso, | | | | | | | | | | | | |
Expiring 11/17/21 | | Morgan Stanley & Co. LLC | | | MXN | 7,307 | | | | | 350,000 | | | | | 353,878 | | | | | 3,878 | | | | | — | |
Expiring 11/17/21 | | Morgan Stanley & Co. LLC | | | MXN | 1,044 | | | | | 50,000 | | | | | 50,567 | | | | | 567 | | | | | — | |
Expiring 11/17/21 | | Morgan Stanley & Co. LLC | | | MXN | 808 | | | | | 39,832 | | | | | 39,119 | | | | | — | | | | | (713 | ) |
Expiring 11/17/21 | | Morgan Stanley & Co. LLC | | | MXN | 616 | | | | | 30,151 | | | | | 29,839 | | | | | — | | | | | (312 | ) |
Expiring 11/17/21 | | Morgan Stanley & Co. LLC | | | MXN | 606 | | | | | 29,869 | | | | | 29,335 | | | | | — | | | | | (534 | ) |
Expiring 11/17/21 | | Morgan Stanley & Co. LLC | | | MXN | 404 | | | | | 19,881 | | | | | 19,557 | | | | | — | | | | | (324 | ) |
Expiring 11/17/21 | | Morgan Stanley & Co. LLC | | | MXN | 404 | | | | | 19,937 | | | | | 19,552 | | | | | — | | | | | (385 | ) |
Expiring 11/17/21 | | Morgan Stanley & Co. LLC | | | MXN | 404 | | | | | 19,938 | | | | | 19,575 | | | | | — | | | | | (363 | ) |
Expiring 11/17/21 | | Morgan Stanley & Co. LLC | | | MXN | 205 | | | | | 10,052 | | | | | 9,948 | | | | | — | | | | | (104 | ) |
Expiring 11/17/21 | | Morgan Stanley & Co. LLC | | | MXN | 204 | | | | | 9,898 | | | | | 9,895 | | | | | — | | | | | (3 | ) |
Expiring 11/17/21 | | Morgan Stanley & Co. LLC | | | MXN | 203 | | | | | 9,951 | | | | | 9,837 | | | | | — | | | | | (114 | ) |
Expiring 11/17/21 | | Morgan Stanley & Co. LLC | | | MXN | 203 | | | | | 9,939 | | | | | 9,818 | | | | | — | | | | | (121 | ) |
Expiring 11/17/21 | | Morgan Stanley & Co. LLC | | | MXN | 203 | | | | | 9,944 | | | | | 9,823 | | | | | — | | | | | (121 | ) |
See Notes to Financial Statements.
Forward foreign currency exchange contracts outstanding at October 31, 2021 (continued):
| | | | | | | | | | | | | | | | | | | | | | | | | | | | | | |
Purchase
Contracts | | Counterparty | | Notional
Amount
(000) | | Value at
Settlement
Date | | Current
Value | | Unrealized
Appreciation | | Unrealized
Depreciation |
| OTC Forward Foreign Currency Exchange Contracts (cont’d.): | |
| Mexican Peso (cont’d.), | | | | | | | | | | |
Expiring 11/17/21 | | Morgan Stanley & Co. LLC | | | MXN | 203 | | | | | $ 9,953 | | | | | $ 9,850 | | | | | $ — | | | | | $ (103 | ) |
Expiring 11/17/21 | | Morgan Stanley & Co. LLC | | | MXN | 202 | | | | | 9,973 | | | | | 9,791 | | | | | — | | | | | (182 | ) |
Expiring 11/17/21 | | Morgan Stanley & Co. LLC | | | MXN | 202 | | | | | 9,950 | | | | | 9,803 | | | | | — | | | | | (147 | ) |
Expiring 11/17/21 | | Morgan Stanley & Co. LLC | | | MXN | 202 | | | | | 9,972 | | | | | 9,790 | | | | | — | | | | | (182 | ) |
Expiring 11/17/21 | | Morgan Stanley & Co. LLC | | | MXN | 202 | | | | | 9,950 | | | | | 9,803 | | | | | — | | | | | (147 | ) |
Expiring 11/17/21 | | Morgan Stanley & Co. LLC | | | MXN | 202 | | | | | 9,964 | | | | | 9,772 | | | | | — | | | | | (192 | ) |
Expiring 11/17/21 | | Morgan Stanley & Co. LLC | | | MXN | 202 | | | | | 9,957 | | | | | 9,779 | | | | | — | | | | | (178 | ) |
Expiring 11/17/21 | | Morgan Stanley & Co. LLC | | | MXN | 202 | | | | | 9,967 | | | | | 9,775 | | | | | — | | | | | (192 | ) |
| New Taiwanese Dollar, | | | | | | | | | | |
Expiring 11/17/21 | | Morgan Stanley & Co. LLC | | | TWD | 7,804 | | | | | 280,000 | | | | | 280,632 | | | | | 632 | | | | | — | |
Expiring 11/17/21 | | Morgan Stanley & Co. LLC | | | TWD | 3,886 | | | | | 140,000 | | | | | 139,749 | | | | | — | | | | | (251 | ) |
Expiring 11/17/21 | | Morgan Stanley & Co. LLC | | | TWD | 2,222 | | | | | 80,000 | | | | | 79,881 | | | | | — | | | | | (119 | ) |
Expiring 11/17/21 | | Morgan Stanley & Co. LLC | | | TWD | 1,388 | | | | | 50,000 | | | | | 49,920 | | | | | — | | | | | (80 | ) |
Expiring 11/17/21 | | Morgan Stanley & Co. LLC | | | TWD | 561 | | | | | 20,000 | | | | | 20,177 | | | | | 177 | | | | | — | |
Expiring 11/17/21 | | Morgan Stanley & Co. LLC | | | TWD | 558 | | | | | 20,000 | | | | | 20,049 | | | | | 49 | | | | | — | |
Expiring 11/17/21 | | Morgan Stanley & Co. LLC | | | TWD | 281 | | | | | 10,000 | | | | | 10,088 | | | | | 88 | | | | | — | |
Expiring 11/17/21 | | Morgan Stanley & Co. LLC | | | TWD | 279 | | | | | 10,000 | | | | | 10,024 | | | | | 24 | | | | | — | |
Expiring 11/17/21 | | Morgan Stanley & Co. LLC | | | TWD | 278 | | | | | 10,000 | | | | | 10,005 | | | | | 5 | | | | | — | |
| New Zealand Dollar, | | | | | | | | | | | | |
Expiring 11/17/21 | | Morgan Stanley & Co. LLC | | | NZD | 430 | | | | | 298,657 | | | | | 308,062 | | | | | 9,405 | | | | | — | |
Expiring 11/17/21 | | Morgan Stanley & Co. LLC | | | NZD | 380 | | | | | 263,884 | | | | | 272,241 | | | | | 8,357 | | | | | — | |
Expiring 11/17/21 | | Morgan Stanley & Co. LLC | | | NZD | 280 | | | | | 194,429 | | | | | 200,599 | | | | | 6,170 | | | | | — | |
Expiring 11/17/21 | | Morgan Stanley & Co. LLC | | | NZD | 160 | | | | | 112,369 | | | | | 114,628 | | | | | 2,259 | | | | | — | |
Expiring 11/17/21 | | Morgan Stanley & Co. LLC | | | NZD | 140 | | | | | 98,997 | | | | | 100,299 | | | | | 1,302 | | | | | — | |
Expiring 11/17/21 | | Morgan Stanley & Co. LLC | | | NZD | 100 | | | | | 70,683 | | | | | 71,643 | | | | | 960 | | | | | — | |
Expiring 11/17/21 | | Morgan Stanley & Co. LLC | | | NZD | 90 | | | | | 64,365 | | | | | 64,478 | | | | | 113 | | | | | — | |
Expiring 11/17/21 | | Morgan Stanley & Co. LLC | | | NZD | 90 | | | | | 63,190 | | | | | 64,478 | | | | | 1,288 | | | | | — | |
Expiring 11/17/21 | | Morgan Stanley & Co. LLC | | | NZD | 80 | | | | | 57,462 | | | | | 57,314 | | | | | — | | | | | (148 | ) |
Expiring 11/17/21 | | Morgan Stanley & Co. LLC | | | NZD | 80 | | | | | 57,633 | | | | | 57,314 | | | | | — | | | | | (319 | ) |
Expiring 11/17/21 | | Morgan Stanley & Co. LLC | | | NZD | 70 | | | | | 49,549 | | | | | 50,150 | | | | | 601 | | | | | — | |
Expiring 11/17/21 | | Morgan Stanley & Co. LLC | | | NZD | 60 | | | | | 42,859 | | | | | 42,985 | | | | | 126 | | | | | — | |
Expiring 11/17/21 | | Morgan Stanley & Co. LLC | | | NZD | 60 | | | | | 42,517 | | | | | 42,986 | | | | | 469 | | | | | — | |
Expiring 11/17/21 | | Morgan Stanley & Co. LLC | | | NZD | 50 | | | | | 35,896 | | | | | 35,821 | | | | | — | | | | | (75 | ) |
Expiring 11/17/21 | | Morgan Stanley & Co. LLC | | | NZD | 50 | | | | | 35,682 | | | | | 35,821 | | | | | 139 | | | | | — | |
Expiring 11/17/21 | | Morgan Stanley & Co. LLC | | | NZD | 50 | | | | | 35,691 | | | | | 35,822 | | | | | 131 | | | | | — | |
Expiring 11/17/21 | | Morgan Stanley & Co. LLC | | | NZD | 50 | | | | | 35,801 | | | | | 35,821 | | | | | 20 | | | | | — | |
Expiring 11/17/21 | | Morgan Stanley & Co. LLC | | | NZD | 30 | | | | | 21,507 | | | | | 21,493 | | | | | — | | | | | (14 | ) |
Expiring 11/17/21 | | Morgan Stanley & Co. LLC | | | NZD | 30 | | | | | 20,878 | | | | | 21,493 | | | | | 615 | | | | | — | |
Expiring 11/17/21 | | Morgan Stanley & Co. LLC | | | NZD | 30 | | | | | 21,526 | | | | | 21,493 | | | | | — | | | | | (33 | ) |
Expiring 11/17/21 | | Morgan Stanley & Co. LLC | | | NZD | 30 | | | | | 21,464 | | | | | 21,493 | | | | | 29 | | | | | — | |
Expiring 11/17/21 | | Morgan Stanley & Co. LLC | | | NZD | 20 | | | | | 13,886 | | | | | 14,328 | | | | | 442 | | | | | — | |
Expiring 11/17/21 | | Morgan Stanley & Co. LLC | | | NZD | 20 | | | | | 14,415 | | | | | 14,328 | | | | | — | | | | | (87 | ) |
See Notes to Financial Statements.
| | | | |
PGIM Wadhwani Systematic Absolute Return Fund | | | 19 | |
Schedule of Investments (continued)
as of October 31, 2021
Forward foreign currency exchange contracts outstanding at October 31, 2021 (continued):
| | | | | | | | | | | | | | | | | | | | | | | | | | | | | | |
Purchase
Contracts | | Counterparty | | Notional
Amount
(000) | | Value at
Settlement
Date | | Current
Value | | Unrealized
Appreciation | | Unrealized
Depreciation |
| OTC Forward Foreign Currency Exchange Contracts (cont’d.): | |
| New Zealand Dollar (cont’d.), | | | | | | | | | | |
Expiring 11/17/21 | | Morgan Stanley & Co. LLC | | | NZD | 20 | | | | | $ 14,157 | | | | | $ 14,329 | | | | | $ 172 | | | | | $ — | |
Expiring 11/17/21 | | Morgan Stanley & Co. LLC | | | NZD | 20 | | | | | 14,303 | | | | | 14,328 | | | | | 25 | | | | | — | |
Expiring 11/17/21 | | Morgan Stanley & Co. LLC | | | NZD | 20 | | | | | 14,341 | | | | | 14,328 | | | | | — | | | | | (13 | ) |
Expiring 11/17/21 | | Morgan Stanley & Co. LLC | | | NZD | 20 | | | | | 14,043 | | | | | 14,328 | | | | | 285 | | | | | — | |
Expiring 11/17/21 | | Morgan Stanley & Co. LLC | | | NZD | 10 | | | | | 7,155 | | | | | 7,165 | | | | | 10 | | | | | — | |
Expiring 11/17/21 | | Morgan Stanley & Co. LLC | | | NZD | 10 | | | | | 7,138 | | | | | 7,164 | | | | | 26 | | | | | — | |
Expiring 11/17/21 | | Morgan Stanley & Co. LLC | | | NZD | 10 | | | | | 7,068 | | | | | 7,164 | | | | | 96 | | | | | — | |
Expiring 11/17/21 | | Morgan Stanley & Co. LLC | | | NZD | 10 | | | | | 7,068 | | | | | 7,164 | | | | | 96 | | | | | — | |
Expiring 11/17/21 | | Morgan Stanley & Co. LLC | | | NZD | 10 | | | | | 7,078 | | | | | 7,164 | | | | | 86 | | | | | — | |
Expiring 11/17/21 | | Morgan Stanley & Co. LLC | | | NZD | 10 | | | | | 7,159 | | | | | 7,164 | | | | | 5 | | | | | — | |
Expiring 11/17/21 | | Morgan Stanley & Co. LLC | | | NZD | 10 | | | | | 7,152 | | | | | 7,165 | | | | | 13 | | | | | — | |
Expiring 11/17/21 | | Morgan Stanley & Co. LLC | | | NZD | 10 | | | | | 7,084 | | | | | 7,164 | | | | | 80 | | | | | — | |
| Norwegian Krone, | | | | | | | | | | | | |
Expiring 11/17/21 | | Morgan Stanley & Co. LLC | | | NOK | 582 | | | | | 69,562 | | | | | 68,864 | | | | | — | | | | | (698 | ) |
Expiring 11/17/21 | | Morgan Stanley & Co. LLC | | | NOK | 391 | | | | | 46,416 | | | | | 46,280 | | | | | — | | | | | (136 | ) |
Expiring 11/17/21 | | Morgan Stanley & Co. LLC | | | NOK | 391 | | | | | 46,431 | | | | | 46,295 | | | | | — | | | | | (136 | ) |
Expiring 11/17/21 | | Morgan Stanley & Co. LLC | | | NOK | 293 | | | | | 35,026 | | | | | 34,637 | | | | | — | | | | | (389 | ) |
Expiring 11/17/21 | | Morgan Stanley & Co. LLC | | | NOK | 194 | | | | | 23,213 | | | | | 23,013 | | | | | — | | | | | (200 | ) |
Expiring 11/17/21 | | Morgan Stanley & Co. LLC | | | NOK | 97 | | | | | 11,590 | | | | | 11,465 | | | | | — | | | | | (125 | ) |
Expiring 11/17/21 | | Morgan Stanley & Co. LLC | | | NOK | 97 | | | | | 11,606 | | | | | 11,506 | | | | | — | | | | | (100 | ) |
Expiring 11/17/21 | | Morgan Stanley & Co. LLC | | | NOK | 97 | | | | | 11,570 | | | | | 11,454 | | | | | — | | | | | (116 | ) |
Expiring 11/17/21 | | Morgan Stanley & Co. LLC | | | NOK | 97 | | | | | 11,612 | | | | | 11,486 | | | | | — | | | | | (126 | ) |
| Polish Zloty, | | | | | | | | | | | | |
Expiring 11/17/21 | | Morgan Stanley & Co. LLC | | | PLN | —* | | | | | 41 | | | | | 41 | | | | | — | | | | | — | |
| Singapore Dollar, | | | | | | | | | | | | |
Expiring 11/17/21 | | Morgan Stanley & Co. LLC | | | SGD | 379 | | | | | 280,000 | | | | | 280,900 | | | | | 900 | | | | | — | |
Expiring 11/17/21 | | Morgan Stanley & Co. LLC | | | SGD | 148 | | | | | 110,011 | | | | | 109,720 | | | | | — | | | | | (291 | ) |
Expiring 11/17/21 | | Morgan Stanley & Co. LLC | | | SGD | 67 | | | | | 49,960 | | | | | 49,977 | | | | | 17 | | | | | — | |
Expiring 11/17/21 | | Morgan Stanley & Co. LLC | | | SGD | 41 | | | | | 30,031 | | | | | 30,045 | | | | | 14 | | | | | — | |
Expiring 11/17/21 | | Morgan Stanley & Co. LLC | | | SGD | 40 | | | | | 29,994 | | | | | 29,993 | | | | | — | | | | | (1 | ) |
Expiring 11/17/21 | | Morgan Stanley & Co. LLC | | | SGD | 27 | | | | | 19,996 | | | | | 19,995 | | | | | — | | | | | (1 | ) |
Expiring 11/17/21 | | Morgan Stanley & Co. LLC | | | SGD | 27 | | | | | 19,990 | | | | | 19,974 | | | | | — | | | | | (16 | ) |
Expiring 11/17/21 | | Morgan Stanley & Co. LLC | | | SGD | 27 | | | | | 19,997 | | | | | 19,944 | | | | | — | | | | | (53 | ) |
Expiring 11/17/21 | | Morgan Stanley & Co. LLC | | | SGD | 27 | | | | | 20,009 | | | | | 19,996 | | | | | — | | | | | (13 | ) |
Expiring 11/17/21 | | Morgan Stanley & Co. LLC | | | SGD | 27 | | | | | 19,997 | | | | | 19,996 | | | | | — | | | | | (1 | ) |
Expiring 11/17/21 | | Morgan Stanley & Co. LLC | | | SGD | 14 | | | | | 10,002 | | | | | 10,030 | | | | | 28 | | | | | — | |
Expiring 11/17/21 | | Morgan Stanley & Co. LLC | | | SGD | 13 | | | | | 9,981 | | | | | 9,984 | | | | | 3 | | | | | — | |
Expiring 11/17/21 | | Morgan Stanley & Co. LLC | | | SGD | 13 | | | | | 10,000 | | | | | 10,003 | | | | | 3 | | | | | — | |
Expiring 11/17/21 | | Morgan Stanley & Co. LLC | | | SGD | 13 | | | | | 9,997 | | | | | 9,996 | | | | | — | | | | | (1 | ) |
Expiring 11/17/21 | | Morgan Stanley & Co. LLC | | | SGD | 13 | | | | | 9,975 | | | | | 9,978 | | | | | 3 | | | | | — | |
Expiring 11/17/21 | | Morgan Stanley & Co. LLC | | | SGD | 13 | | | | | 9,997 | | | | | 9,971 | | | | | — | | | | | (26 | ) |
Expiring 11/17/21 | | Morgan Stanley & Co. LLC | | | SGD | 13 | | | | | 9,996 | | | | | 9,957 | | | | | — | | | | | (39 | ) |
See Notes to Financial Statements.
Forward foreign currency exchange contracts outstanding at October 31, 2021 (continued):
| | | | | | | | | | | | | | | | | | | | | | | | | | | | | | |
Purchase
Contracts | | Counterparty | | Notional
Amount
(000) | | Value at
Settlement
Date | | Current
Value | | Unrealized
Appreciation | | Unrealized
Depreciation |
| OTC Forward Foreign Currency Exchange Contracts (cont’d.): | |
| Singapore Dollar (cont’d.), | | | | | | | | | | |
Expiring 11/17/21 | | Morgan Stanley & Co. LLC | | | SGD | 13 | | | | | $ 10,000 | | | | | $ 10,003 | | | | | $ 3 | | | | | $ — | |
Expiring 11/17/21 | | Morgan Stanley & Co. LLC | | | SGD | 13 | | | | | 10,000 | | | | | 9,961 | | | | | — | | | | | (39 | ) |
Expiring 11/17/21 | | Morgan Stanley & Co. LLC | | | SGD | 13 | | | | | 9,998 | | | | | 10,003 | | | | | 5 | | | | | — | |
Expiring 11/17/21 | | Morgan Stanley & Co. LLC | | | SGD | 13 | | | | | 10,000 | | | | | 9,992 | | | | | — | | | | | (8 | ) |
| South African Rand, | | | | | | | | | | |
Expiring 11/17/21 | | Morgan Stanley & Co. LLC | | | ZAR | 2,687 | | | | | 180,000 | | | | | 175,551 | | | | | — | | | | | (4,449 | ) |
Expiring 11/17/21 | | Morgan Stanley & Co. LLC | | | ZAR | 295 | | | | | 19,997 | | | | | 19,244 | | | | | — | | | | | (753 | ) |
Expiring 11/17/21 | | Morgan Stanley & Co. LLC | | | ZAR | 292 | | | | | 19,920 | | | | | 19,095 | | | | | — | | | | | (825 | ) |
Expiring 11/17/21 | | Morgan Stanley & Co. LLC | | | ZAR | 148 | | | | | 9,976 | | | | | 9,700 | | | | | — | | | | | (276 | ) |
Expiring 11/17/21 | | Morgan Stanley & Co. LLC | | | ZAR | 148 | | | | | 9,958 | | | | | 9,666 | | | | | — | | | | | (292 | ) |
Expiring 11/17/21 | | Morgan Stanley & Co. LLC | | | ZAR | 146 | | | | | 9,977 | | | | | 9,564 | | | | | — | | | | | (413 | ) |
Expiring 11/17/21 | | Morgan Stanley & Co. LLC | | | ZAR | 145 | | | | | 10,051 | | | | | 9,495 | | | | | — | | | | | (556 | ) |
| South Korean Won, | | | | | | | | | | |
Expiring 11/17/21 | | Morgan Stanley & Co. LLC | | | KRW | 152,656 | | | | | 130,000 | | | | | 129,893 | | | | | — | | | | | (107 | ) |
Expiring 11/17/21 | | Morgan Stanley & Co. LLC | | | KRW | 46,797 | | | | | 40,000 | | | | | 39,819 | | | | | — | | | | | (181 | ) |
Expiring 11/17/21 | | Morgan Stanley & Co. LLC | | | KRW | 34,982 | | | | | 30,000 | | | | | 29,766 | | | | | — | | | | | (234 | ) |
Expiring 11/17/21 | | Morgan Stanley & Co. LLC | | | KRW | 23,622 | | | | | 20,000 | | | | | 20,099 | | | | | 99 | | | | | — | |
Expiring 11/17/21 | | Morgan Stanley & Co. LLC | | | KRW | 23,377 | | | | | 20,000 | | | | | 19,891 | | | | | — | | | | | (109 | ) |
Expiring 11/17/21 | | Morgan Stanley & Co. LLC | | | KRW | 11,888 | | | | | 10,000 | | | | | 10,115 | | | | | 115 | | | | | — | |
Expiring 11/17/21 | | Morgan Stanley & Co. LLC | | | KRW | 11,887 | | | | | 10,000 | | | | | 10,115 | | | | | 115 | | | | | — | |
Expiring 11/17/21 | | Morgan Stanley & Co. LLC | | | KRW | 11,832 | | | | | 10,000 | | | | | 10,067 | | | | | 67 | | | | | — | |
Expiring 11/17/21 | | Morgan Stanley & Co. LLC | | | KRW | 11,784 | | | | | 10,000 | | | | | 10,027 | | | | | 27 | | | | | — | |
Expiring 11/17/21 | | Morgan Stanley & Co. LLC | | | KRW | 11,743 | | | | | 10,000 | | | | | 9,992 | | | | | — | | | | | (8 | ) |
Expiring 11/17/21 | | Morgan Stanley & Co. LLC | | | KRW | 11,741 | | | | | 10,000 | | | | | 9,990 | | | | | — | | | | | (10 | ) |
Expiring 11/17/21 | | Morgan Stanley & Co. LLC | | | KRW | 11,707 | | | | | 10,000 | | | | | 9,961 | | | | | — | | | | | (39 | ) |
Swedish
Krona, | | | | | | | | | | | | |
Expiring 11/17/21 | | Morgan Stanley & Co. LLC | | | SEK | 1,803 | | | | | 208,666 | | | | | 209,985 | | | | | 1,319 | | | | | — | |
Expiring 11/17/21 | | Morgan Stanley & Co. LLC | | | SEK | 1,301 | | | | | 151,559 | | | | | 151,464 | | | | | — | | | | | (95 | ) |
Expiring 11/17/21 | | Morgan Stanley & Co. LLC | | | SEK | 1,093 | | | | | 127,790 | | | | | 127,310 | | | | | — | | | | | (480 | ) |
Expiring 11/17/21 | | Morgan Stanley & Co. LLC | | | SEK | 1,008 | | | | | 115,894 | | | | | 117,349 | | | | | 1,455 | | | | | — | |
Expiring 11/17/21 | | Morgan Stanley & Co. LLC | | | SEK | 995 | | | | | 116,834 | | | | | 115,904 | | | | | — | | | | | (930 | ) |
Expiring 11/17/21 | | Morgan Stanley & Co. LLC | | | SEK | 800 | | | | | 92,935 | | | | | 93,144 | | | | | 209 | | | | | — | |
Expiring 11/17/21 | | Morgan Stanley & Co. LLC | | | SEK | 601 | | | | | 69,806 | | | | | 69,942 | | | | | 136 | | | | | — | |
Expiring 11/17/21 | | Morgan Stanley & Co. LLC | | | SEK | 503 | | | | | 58,082 | | | | | 58,559 | | | | | 477 | | | | | — | |
Expiring 11/17/21 | | Morgan Stanley & Co. LLC | | | SEK | 499 | | | | | 58,216 | | | | | 58,135 | | | | | — | | | | | (81 | ) |
Expiring 11/17/21 | | Morgan Stanley & Co. LLC | | | SEK | 498 | | | | | 58,422 | | | | | 57,957 | | | | | — | | | | | (465 | ) |
Expiring 11/17/21 | | Morgan Stanley & Co. LLC | | | SEK | 497 | | | | | 57,798 | | | | | 57,848 | | | | | 50 | | | | | — | |
Expiring 11/17/21 | | Morgan Stanley & Co. LLC | | | SEK | 401 | | | | | 46,371 | | | | | 46,664 | | | | | 293 | | | | | — | |
Expiring 11/17/21 | | Morgan Stanley & Co. LLC | | | SEK | 302 | | | | | 34,849 | | | | | 35,135 | | | | | 286 | | | | | — | |
Expiring 11/17/21 | | Morgan Stanley & Co. LLC | | | SEK | 301 | | | | | 34,778 | | | | | 34,998 | | | | | 220 | | | | | — | |
Expiring 11/17/21 | | Morgan Stanley & Co. LLC | | | SEK | 298 | | | | | 34,681 | | | | | 34,711 | | | | | 30 | | | | | — | |
Expiring 11/17/21 | | Morgan Stanley & Co. LLC | | | SEK | 200 | | | | | 23,268 | | | | | 23,313 | | | | | 45 | | | | | — | |
See Notes to Financial Statements.
| | | | |
PGIM Wadhwani Systematic Absolute Return Fund | | | 21 | |
Schedule of Investments (continued)
as of October 31, 2021
Forward foreign currency exchange contracts outstanding at October 31, 2021 (continued):
| | | | | | | | | | | | | | | | | | | | | | | | | | | | | | |
Purchase
Contracts | | Counterparty | | Notional
Amount
(000) | | Value at
Settlement
Date | | Current
Value | | Unrealized
Appreciation | | Unrealized
Depreciation |
| OTC Forward Foreign Currency Exchange Contracts (cont’d.): | |
| Swedish Krona (cont’d.), | | | | | | | | | | |
Expiring 11/17/21 | | Morgan Stanley & Co. LLC | | | SEK | 200 | | | | | $ 23,335 | | | | | $ 23,320 | | | | | $ — | | | | | $ (15 | ) |
Expiring 11/17/21 | | Morgan Stanley & Co. LLC | | | SEK | 101 | | | | | 11,587 | | | | | 11,732 | | | | | 145 | | | | | — | |
Expiring 11/17/21 | | Morgan Stanley & Co. LLC | | | SEK | 100 | | | | | 11,601 | | | | | 11,628 | | | | | 27 | | | | | — | |
Expiring 11/17/21 | | Morgan Stanley & Co. LLC | | | SEK | 100 | | | | | 11,601 | | | | | 11,628 | | | | | 27 | | | | | — | |
Expiring 11/17/21 | | Morgan Stanley & Co. LLC | | | SEK | 100 | | | | | 11,601 | | | | | 11,628 | | | | | 27 | | | | | — | |
Expiring 11/17/21 | | Morgan Stanley & Co. LLC | | | SEK | 100 | | | | | 11,658 | | | | | 11,651 | | | | | — | | | | | (7 | ) |
| Swiss Franc, | | | | | | | | | | | | |
Expiring 11/17/21 | | Morgan Stanley & Co. LLC | | | CHF | 312 | | | | | 339,878 | | | | | 341,216 | | | | | 1,338 | | | | | — | |
Expiring 11/17/21 | | Morgan Stanley & Co. LLC | | | CHF | 274 | | | | | 299,062 | | | | | 299,255 | | | | | 193 | | | | | — | |
Expiring 11/17/21 | | Morgan Stanley & Co. LLC | | | CHF | 194 | | | | | 210,689 | | | | | 211,442 | | | | | 753 | | | | | — | |
Expiring 11/17/21 | | Morgan Stanley & Co. LLC | | | CHF | 139 | | | | | 150,603 | | | | | 151,968 | | | | | 1,365 | | | | | — | |
Expiring 11/17/21 | | Morgan Stanley & Co. LLC | | | CHF | 129 | | | | | 140,007 | | | | | 141,211 | | | | | 1,204 | | | | | — | |
Expiring 11/17/21 | | Morgan Stanley & Co. LLC | | | CHF | 129 | | | | | 139,849 | | | | | 141,048 | | | | | 1,199 | | | | | — | |
Expiring 11/17/21 | | Morgan Stanley & Co. LLC | | | CHF | 101 | | | | | 109,824 | | | | | 110,765 | | | | | 941 | | | | | — | |
Expiring 11/17/21 | | Morgan Stanley & Co. LLC | | | CHF | 73 | | | | | 80,037 | | | | | 80,111 | | | | | 74 | | | | | — | |
Expiring 11/17/21 | | Morgan Stanley & Co. LLC | | | CHF | 45 | | | | | 49,777 | | | | | 49,569 | | | | | — | | | | | (208 | ) |
Expiring 11/17/21 | | Morgan Stanley & Co. LLC | | | CHF | 37 | | | | | 39,867 | | | | | 39,893 | | | | | 26 | | | | | — | |
Expiring 11/17/21 | | Morgan Stanley & Co. LLC | | | CHF | 37 | | | | | 40,030 | | | | | 40,188 | | | | | 158 | | | | | — | |
Expiring 11/17/21 | | Morgan Stanley & Co. LLC | | | CHF | 28 | | | | | 30,032 | | | | | 30,124 | | | | | 92 | | | | | — | |
Expiring 11/17/21 | | Morgan Stanley & Co. LLC | | | CHF | 27 | | | | | 29,990 | | | | | 30,018 | | | | | 28 | | | | | — | |
Expiring 11/17/21 | | Morgan Stanley & Co. LLC | | | CHF | 18 | | | | | 19,953 | | | | | 20,032 | | | | | 79 | | | | | — | |
Expiring 11/17/21 | | Morgan Stanley & Co. LLC | | | CHF | 18 | | | | | 20,040 | | | | | 20,112 | | | | | 72 | | | | | — | |
Expiring 11/17/21 | | Morgan Stanley & Co. LLC | | | CHF | 18 | | | | | 19,899 | | | | | 19,912 | | | | | 13 | | | | | — | |
Expiring 11/17/21 | | Morgan Stanley & Co. LLC | | | CHF | 18 | | | | | 20,011 | | | | | 19,928 | | | | | — | | | | | (83 | ) |
Expiring 11/17/21 | | Morgan Stanley & Co. LLC | | | CHF | 18 | | | | | 20,048 | | | | | 19,964 | | | | | — | | | | | (84 | ) |
Expiring 11/17/21 | | Morgan Stanley & Co. LLC | | | CHF | 18 | | | | | 20,021 | | | | | 20,039 | | | | | 18 | | | | | — | |
Expiring 11/17/21 | | Morgan Stanley & Co. LLC | | | CHF | 9 | | | | | 10,071 | | | | | 10,102 | | | | | 31 | | | | | — | |
Expiring 11/17/21 | | Morgan Stanley & Co. LLC | | | CHF | 9 | | | | | 10,006 | | | | | 10,042 | | | | | 36 | | | | | — | |
Expiring 11/17/21 | | Morgan Stanley & Co. LLC | | | CHF | 9 | | | | | 10,005 | | | | | 10,036 | | | | | 31 | | | | | — | |
Expiring 11/17/21 | | Morgan Stanley & Co. LLC | | | CHF | 9 | | | | | 9,980 | | | | | 10,054 | | | | | 74 | | | | | — | |
Expiring 11/17/21 | | Morgan Stanley & Co. LLC | | | CHF | 9 | | | | | 9,950 | | | | | 9,956 | | | | | 6 | | | | | — | |
Expiring 11/17/21 | | Morgan Stanley & Co. LLC | | | CHF | —* | | | | | 20 | | | | | 20 | | | | | — | | | | | — | |
| Thai Baht, | | | | | | | | | | | | |
Expiring 11/17/21 | | Morgan Stanley & Co. LLC | | | THB | 2,655 | | | | | 80,022 | | | | | 80,009 | | | | | — | | | | | (13 | ) |
Expiring 11/17/21 | | Morgan Stanley & Co. LLC | | | THB | 1,322 | | | | | 39,989 | | | | | 39,838 | | | | | — | | | | | (151 | ) |
Expiring 11/17/21 | | Morgan Stanley & Co. LLC | | | THB | 334 | | | | | 9,989 | | | | | 10,049 | | | | | 60 | | | | | — | |
Expiring 11/17/21 | | Morgan Stanley & Co. LLC | | | THB | 334 | | | | | 9,990 | | | | | 10,051 | | | | | 61 | | | | | — | |
Expiring 11/17/21 | | Morgan Stanley & Co. LLC | | | THB | 334 | | | | | 10,001 | | | | | 10,070 | | | | | 69 | | | | | — | |
Expiring 11/17/21 | | Morgan Stanley & Co. LLC | | | THB | 333 | | | | | 10,037 | | | | | 10,028 | | | | | — | | | | | (9 | ) |
| Turkish Lira, | | | | | | | | | | | | |
Expiring 11/17/21 | | Morgan Stanley & Co. LLC | | | TRY | 1,289 | | | | | 140,000 | | | | | 132,928 | | | | | — | | | | | (7,072 | ) |
See Notes to Financial Statements.
Forward foreign currency exchange contracts outstanding at October 31, 2021 (continued):
| | | | | | | | | | | | | | | | | | | | | | | | | | | | | | |
Purchase
Contracts | | Counterparty | | Notional
Amount
(000) | | Value at
Settlement
Date | | Current
Value | | Unrealized
Appreciation | | Unrealized
Depreciation |
| OTC Forward Foreign Currency Exchange Contracts (cont’d.): | |
| Turkish Lira (cont’d.), | | | | | | | | | | | | |
Expiring 11/17/21 | | Morgan Stanley & Co. LLC | | | TRY | 276 | | | | $ | 30,000 | | | | $ | 28,480 | | | | $ | — | | | | $ | (1,520 | ) |
Expiring 11/17/21 | | Morgan Stanley & Co. LLC | | | TRY | 93 | | | | | 9,856 | | | | | 9,607 | | | | | — | | | | | (249 | ) |
| | | | | | | | | | | | | | | | | | | | | | | | | | | |
| | | | | | | | | | $ | 22,316,328 | | | | $ | 22,368,149 | | | | | 106,621 | | | | | (54,800 | ) |
| | | | | | | | | | | | | | | | | | | | | | | | | | | |
| | | | | | |
Sale
Contracts | | Counterparty | | Notional
Amount
(000) | | Value at
Settlement
Date | | Current
Value | | Unrealized
Appreciation | | Unrealized
Depreciation |
| OTC Forward Foreign Currency Exchange Contracts: | |
| Australian Dollar, | | | | | | | | | | | | |
Expiring 11/17/21 | | Morgan Stanley & Co. LLC | | | AUD | 470 | | | | $ | 352,292 | | | | $ | 353,584 | | | | $ | — | | | | | $ (1,292 | ) |
Expiring 11/17/21 | | Morgan Stanley & Co. LLC | | | AUD | 90 | | | | | 67,202 | | | | | 67,708 | | | | | — | | | | | (506 | ) |
Expiring 11/17/21 | | Morgan Stanley & Co. LLC | | | AUD | 30 | | | | | 22,115 | | | | | 22,569 | | | | | — | | | | | (454 | ) |
Expiring 11/17/21 | | Morgan Stanley & Co. LLC | | | AUD | 20 | | | | | 14,934 | | | | | 15,046 | | | | | — | | | | | (112 | ) |
| Brazilian Real, | | | | | | | | | | | | |
Expiring 11/03/21 | | Morgan Stanley & Co. LLC | | | BRL | 837 | | | | | 150,000 | | | | | 148,136 | | | | | 1,864 | | | | | — | |
Expiring 11/03/21 | | Morgan Stanley & Co. LLC | | | BRL | 556 | | | | | 100,000 | | | | | 98,434 | | | | | 1,566 | | | | | — | |
Expiring 11/03/21 | | Morgan Stanley & Co. LLC | | | BRL | 167 | | | | | 30,000 | | | | | 29,605 | | | | | 395 | | | | | — | |
Expiring 11/03/21 | | Morgan Stanley & Co. LLC | | | BRL | 114 | | | | | 20,000 | | | | | 20,261 | | | | | — | | | | | (261 | ) |
Expiring 11/03/21 | | Morgan Stanley & Co. LLC | | | BRL | 110 | | | | | 20,000 | | | | | 19,400 | | | | | 600 | | | | | — | |
Expiring 11/03/21 | | Morgan Stanley & Co. LLC | | | BRL | 57 | | | | | 10,000 | | | | | 10,020 | | | | | — | | | | | (20 | ) |
Expiring 11/03/21 | | Morgan Stanley & Co. LLC | | | BRL | 57 | | | | | 10,000 | | | | | 10,020 | | | | | — | | | | | (20 | ) |
Expiring 11/03/21 | | Morgan Stanley & Co. LLC | | | BRL | 57 | | | | | 10,000 | | | | | 10,125 | | | | | — | | | | | (125 | ) |
Expiring 11/03/21 | | Morgan Stanley & Co. LLC | | | BRL | 56 | | | | | 10,000 | | | | | 9,880 | | | | | 120 | | | | | — | |
Expiring 11/03/21 | | Morgan Stanley & Co. LLC | | | BRL | 56 | | | | | 10,000 | | | | | 9,834 | | | | | 166 | | | | | — | |
Expiring 11/03/21 | | Morgan Stanley & Co. LLC | | | BRL | 56 | | | | | 10,000 | | | | | 9,864 | | | | | 136 | | | | | — | |
Expiring 11/03/21 | | Morgan Stanley & Co. LLC | | | BRL | 56 | | | | | 10,000 | | | | | 9,833 | | | | | 167 | | | | | — | |
Expiring 11/03/21 | | Morgan Stanley & Co. LLC | | | BRL | 55 | | | | | 10,000 | | | | | 9,764 | | | | | 236 | | | | | — | |
Expiring 11/03/21 | | Morgan Stanley & Co. LLC | | | BRL | 55 | | | | | 10,000 | | | | | 9,767 | | | | | 233 | | | | | — | |
Expiring 11/03/21 | | Morgan Stanley & Co. LLC | | | BRL | 54 | | | | | 10,000 | | | | | 9,621 | | | | | 379 | | | | | — | |
Expiring 11/03/21 | | Morgan Stanley & Co. LLC | | | BRL | 54 | | | | | 10,000 | | | | | 9,584 | | | | | 416 | | | | | — | |
Expiring 12/02/21 | | Morgan Stanley & Co. LLC | | | BRL | 617 | | | | | 110,000 | | | | | 108,617 | | | | | 1,383 | | | | | — | |
Expiring 12/02/21 | | Morgan Stanley & Co. LLC | | | BRL | 113 | | | | | 20,000 | | | | | 19,877 | | | | | 123 | | | | | — | |
| British Pound, | | | | | | | | | | | | |
Expiring 11/17/21 | | Morgan Stanley & Co. LLC | | | GBP | 700 | | | | | 964,082 | | | | | 957,998 | | | | | 6,084 | | | | | — | |
Expiring 11/17/21 | | Morgan Stanley & Co. LLC | | | GBP | 240 | | | | | 330,032 | | | | | 328,456 | | | | | 1,576 | | | | | — | |
Expiring 11/17/21 | | Morgan Stanley & Co. LLC | | | GBP | 190 | | | | | 260,138 | | | | | 260,028 | | | | | 110 | | | | | — | |
Expiring 11/17/21 | | Morgan Stanley & Co. LLC | | | GBP | 120 | | | | | 164,173 | | | | | 164,228 | | | | | — | | | | | (55 | ) |
Expiring 11/17/21 | | Morgan Stanley & Co. LLC | | | GBP | 120 | | | | | 163,704 | | | | | 164,228 | | | | | — | | | | | (524 | ) |
Expiring 11/17/21 | | Morgan Stanley & Co. LLC | | | GBP | 100 | | | | | 137,615 | | | | | 136,857 | | | | | 758 | | | | | — | |
Expiring 11/17/21 | | Morgan Stanley & Co. LLC | | | GBP | 50 | | | | | 69,139 | | | | | 68,429 | | | | | 710 | | | | | — | |
See Notes to Financial Statements.
| | | | |
PGIM Wadhwani Systematic Absolute Return Fund | | | 23 | |
Schedule of Investments (continued)
as of October 31, 2021
Forward foreign currency exchange contracts outstanding at October 31, 2021 (continued):
| | | | | | | | | | | | | | | | | | | | | | | | | | | | | | |
Sale
Contracts | | Counterparty | | Notional
Amount
(000) | | Value at
Settlement
Date | | Current
Value | | Unrealized
Appreciation | | Unrealized
Depreciation |
| OTC Forward Foreign Currency Exchange Contracts (cont’d.): | |
| British Pound (cont’d.), | | | | | | | | | | |
Expiring 11/17/21 | | Morgan Stanley & Co. LLC | | | GBP | 40 | | | | $ | 54,988 | | | | $ | 54,743 | | | | $ | 245 | | | | $ | — | |
Expiring 11/17/21 | | Morgan Stanley & Co. LLC | | | GBP | 40 | | | | | 54,724 | | | | | 54,742 | | | | | — | | | | | (18 | ) |
Expiring 11/17/21 | | Morgan Stanley & Co. LLC | | | GBP | 30 | | | | | 41,483 | | | | | 41,057 | | | | | 426 | | | | | — | |
Expiring 11/17/21 | | Morgan Stanley & Co. LLC | | | GBP | 30 | | | | | 41,306 | | | | | 41,057 | | | | | 249 | | | | | — | |
Expiring 11/17/21 | | Morgan Stanley & Co. LLC | | | GBP | 30 | | | | | 41,254 | | | | | 41,057 | | | | | 197 | | | | | — | |
Expiring 11/17/21 | | Morgan Stanley & Co. LLC | | | GBP | 30 | | | | | 41,074 | | | | | 41,057 | | | | | 17 | | | | | — | |
Expiring 11/17/21 | | Morgan Stanley & Co. LLC | | | GBP | 20 | | | | | 27,523 | | | | | 27,371 | | | | | 152 | | | | | — | |
Expiring 11/17/21 | | Morgan Stanley & Co. LLC | | | GBP | 20 | | | | | 27,655 | | | | | 27,371 | | | | | 284 | | | | | — | |
Expiring 11/17/21 | | Morgan Stanley & Co. LLC | | | GBP | 20 | | | | | 27,567 | | | | | 27,371 | | | | | 196 | | | | | — | |
Expiring 11/17/21 | | Morgan Stanley & Co. LLC | | | GBP | 20 | | | | | 27,523 | | | | | 27,371 | | | | | 152 | | | | | — | |
Expiring 11/17/21 | | Morgan Stanley & Co. LLC | | | GBP | 20 | | | | | 27,655 | | | | | 27,371 | | | | | 284 | | | | | — | |
Expiring 11/17/21 | | Morgan Stanley & Co. LLC | | | GBP | 20 | | | | | 27,503 | | | | | 27,372 | | | | | 131 | | | | | — | |
Expiring 11/17/21 | | Morgan Stanley & Co. LLC | | | GBP | 10 | | | | | 13,773 | | | | | 13,686 | | | | | 87 | | | | | — | |
Expiring 11/17/21 | | Morgan Stanley & Co. LLC | | | GBP | 10 | | | | | 13,751 | | | | | 13,685 | | | | | 66 | | | | | — | |
Expiring 11/17/21 | | Morgan Stanley & Co. LLC | | | GBP | 10 | | | | | 13,681 | | | | | 13,686 | | | | | — | | | | | (5 | ) |
Expiring 11/17/21 | | Morgan Stanley & Co. LLC | | | GBP | 10 | | | | | 13,783 | | | | | 13,685 | | | | | 98 | | | | | — | |
Expiring 11/17/21 | | Morgan Stanley & Co. LLC | | | GBP | 10 | | | | | 13,747 | | | | | 13,686 | | | | | 61 | | | | | — | |
Expiring 11/17/21 | | Morgan Stanley & Co. LLC | | | GBP | 10 | | | | | 13,761 | | | | | 13,685 | | | | | 76 | | | | | — | |
Expiring 11/17/21 | | Morgan Stanley & Co. LLC | | | GBP | 10 | | | | | 13,773 | | | | | 13,686 | | | | | 87 | | | | | — | |
Expiring 11/17/21 | | Morgan Stanley & Co. LLC | | | GBP | 10 | | | | | 13,795 | | | | | 13,686 | | | | | 109 | | | | | — | |
Expiring 11/17/21 | | Morgan Stanley & Co. LLC | | | GBP | 10 | | | | | 13,795 | | | | | 13,685 | | | | | 110 | | | | | — | |
Expiring 11/17/21 | | Morgan Stanley & Co. LLC | | | GBP | 10 | | | | | 13,769 | | | | | 13,686 | | | | | 83 | | | | | — | |
Expiring 11/17/21 | | Morgan Stanley & Co. LLC | | | GBP | 10 | | | | | 13,795 | | | | | 13,686 | | | | | 109 | | | | | — | |
Expiring 11/17/21 | | Morgan Stanley & Co. LLC | | | GBP | 10 | | | | | 13,761 | | | | | 13,686 | | | | | 75 | | | | | — | |
Expiring 11/17/21 | | Morgan Stanley & Co. LLC | | | GBP | 10 | | | | | 13,681 | | | | | 13,686 | | | | | — | | | | | (5 | ) |
| Canadian Dollar, | | | | | | | | | | |
Expiring 11/17/21 | | Morgan Stanley & Co. LLC | | | CAD | 358 | | | | | 289,065 | | | | | 289,289 | | | | | — | | | | | (224 | ) |
Expiring 11/17/21 | | Morgan Stanley & Co. LLC | | | CAD | 321 | | | | | 260,667 | | | | | 259,318 | | | | | 1,349 | | | | | — | |
Expiring 11/17/21 | | Morgan Stanley & Co. LLC | | | CAD | 210 | | | | | 169,933 | | | | | 169,954 | | | | | — | | | | | (21 | ) |
Expiring 11/17/21 | | Morgan Stanley & Co. LLC | | | CAD | 162 | | | | | 130,201 | | | | | 130,885 | | | | | — | | | | | (684 | ) |
Expiring 11/17/21 | | Morgan Stanley & Co. LLC | | | CAD | 111 | | | | | 90,039 | | | | | 90,015 | | | | | 24 | | | | | — | |
Expiring 11/17/21 | | Morgan Stanley & Co. LLC | | | CAD | 37 | | | | | 29,762 | | | | | 29,788 | | | | | — | | | | | (26 | ) |
Expiring 11/17/21 | | Morgan Stanley & Co. LLC | | | CAD | 25 | | | | | 20,018 | | | | | 20,020 | | | | | — | | | | | (2 | ) |
Expiring 11/17/21 | | Morgan Stanley & Co. LLC | | | CAD | 25 | | | | | 20,028 | | | | | 20,133 | | | | | — | | | | | (105 | ) |
Expiring 11/17/21 | | Morgan Stanley & Co. LLC | | | CAD | 12 | | | | | 9,998 | | | | | 10,018 | | | | | — | | | | | (20 | ) |
Expiring 11/17/21 | | Morgan Stanley & Co. LLC | | | CAD | —* | | | | | 4 | | | | | 4 | | | | | — | | | | | — | |
| Chilean Peso, | | | | | | | | | | | | |
Expiring 11/17/21 | | Morgan Stanley & Co. LLC | | | CLP | 74,225 | | | | | 90,000 | | | | | 91,044 | | | | | — | | | | | (1,044 | ) |
Expiring 11/17/21 | | Morgan Stanley & Co. LLC | | | CLP | 16,712 | | | | | 20,000 | | | | | 20,498 | | | | | — | | | | | (498 | ) |
Expiring 11/17/21 | | Morgan Stanley & Co. LLC | | | CLP | 8,213 | | | | | 10,000 | | | | | 10,075 | | | | | — | | | | | (75 | ) |
| Chinese Renminbi, | | | | | | | | | | |
Expiring 11/17/21 | | Morgan Stanley & Co. LLC | | | CNH | 382 | | | | | 59,845 | | | | | 59,586 | | | | | 259 | | | | | — | |
See Notes to Financial Statements.
Forward foreign currency exchange contracts outstanding at October 31, 2021 (continued):
| | | | | | | | | | | | | | | | | | | | | | | | | | | | | | |
Sale
Contracts | | Counterparty | | Notional
Amount
(000) | | Value at
Settlement
Date | | Current
Value | | Unrealized
Appreciation | | Unrealized
Depreciation |
| OTC Forward Foreign Currency Exchange Contracts (cont’d.): | |
| Chinese Renminbi (cont’d.), | | | | | | | | | | |
Expiring 11/17/21 | | Morgan Stanley & Co. LLC | | | CNH | 64 | | | | $ | 9,971 | | | | $ | 10,019 | | | | $ | — | | | | | $ (48 | ) |
Expiring 11/17/21 | | Morgan Stanley & Co. LLC | | | CNH | 64 | | | | | 9,973 | | | | | 9,939 | | | | | 34 | | | | | — | |
Expiring 11/17/21 | | Morgan Stanley & Co. LLC | | | CNH | 64 | | | | | 9,979 | | | | | 9,967 | | | | | 12 | | | | | — | |
Expiring 11/17/21 | | Morgan Stanley & Co. LLC | | | CNH | 64 | | | | | 9,989 | | | | | 9,989 | | | | | — | | | | | — | |
Expiring 11/17/21 | | Morgan Stanley & Co. LLC | | | CNH | 64 | | | | | 9,974 | | | | | 9,958 | | | | | 16 | | | | | — | |
| Czech Koruna, | | | | | | | | | | | | |
Expiring 11/18/21 | | Morgan Stanley & Co. LLC | | | CZK | 1,029 | | | | | 46,428 | | | | | 46,308 | | | | | 120 | | | | | — | |
Expiring 11/18/21 | | Morgan Stanley & Co. LLC | | | CZK | 511 | | | | | 23,297 | | | | | 22,984 | | | | | 313 | | | | | — | |
Expiring 11/18/21 | | Morgan Stanley & Co. LLC | | | CZK | 257 | | | | | 11,628 | | | | | 11,551 | | | | | 77 | | | | | — | |
Expiring 11/18/21 | | Morgan Stanley & Co. LLC | | | CZK | 257 | | | | | 11,588 | | | | | 11,558 | | | | | 30 | | | | | — | |
Expiring 11/18/21 | | Morgan Stanley & Co. LLC | | | CZK | 256 | | | | | 11,577 | | | | | 11,515 | | | | | 62 | | | | | — | |
Expiring 11/18/21 | | Morgan Stanley & Co. LLC | | | CZK | 254 | | | | | 11,585 | | | | | 11,430 | | | | | 155 | | | | | — | |
Expiring 11/18/21 | | Morgan Stanley & Co. LLC | | | CZK | —* | | | | | 13 | | | | | 13 | | | | | — | | | | | — | |
| Euro, | | | | | | | | | | | | |
Expiring 11/17/21 | | Morgan Stanley & Co. LLC | | | EUR | 830 | | | | | 960,226 | | | | | 959,825 | | | | | 401 | | | | | — | |
Expiring 11/17/21 | | Morgan Stanley & Co. LLC | | | EUR | 710 | | | | | 821,327 | | | | | 821,055 | | | | | 272 | | | | | — | |
Expiring 11/17/21 | | Morgan Stanley & Co. LLC | | | EUR | 580 | | | | | 670,978 | | | | | 670,721 | | | | | 257 | | | | | — | |
Expiring 11/17/21 | | Morgan Stanley & Co. LLC | | | EUR | 250 | | | | | 289,165 | | | | | 289,104 | | | | | 61 | | | | | — | |
Expiring 11/17/21 | | Morgan Stanley & Co. LLC | | | EUR | 230 | | | | | 266,036 | | | | | 265,976 | | | | | 60 | | | | | — | |
Expiring 11/17/21 | | Morgan Stanley & Co. LLC | | | EUR | 180 | | | | | 209,173 | | | | | 208,155 | | | | | 1,018 | | | | | — | |
Expiring 11/17/21 | | Morgan Stanley & Co. LLC | | | EUR | 170 | | | | | 197,892 | | | | | 196,590 | | | | | 1,302 | | | | | — | |
Expiring 11/17/21 | | Morgan Stanley & Co. LLC | | | EUR | 100 | | | | | 115,979 | | | | | 115,642 | | | | | 337 | | | | | — | |
Expiring 11/17/21 | | Morgan Stanley & Co. LLC | | | EUR | 70 | | | | | 81,337 | | | | | 80,949 | | | | | 388 | | | | | — | |
Expiring 11/17/21 | | Morgan Stanley & Co. LLC | | | EUR | 70 | | | | | 81,214 | | | | | 80,949 | | | | | 265 | | | | | — | |
Expiring 11/17/21 | | Morgan Stanley & Co. LLC | | | EUR | 70 | | | | | 81,396 | | | | | 80,949 | | | | | 447 | | | | | — | |
Expiring 11/17/21 | | Morgan Stanley & Co. LLC | | | EUR | 70 | | | | | 81,345 | | | | | 80,949 | | | | | 396 | | | | | — | |
Expiring 11/17/21 | | Morgan Stanley & Co. LLC | | | EUR | 40 | | | | | 46,417 | | | | | 46,257 | | | | | 160 | | | | | — | |
Expiring 11/17/21 | | Morgan Stanley & Co. LLC | | | EUR | 40 | | | | | 46,408 | | | | | 46,257 | | | | | 151 | | | | | — | |
Expiring 11/17/21 | | Morgan Stanley & Co. LLC | | | EUR | 40 | | | | | 46,563 | | | | | 46,257 | | | | | 306 | | | | | — | |
Expiring 11/17/21 | | Morgan Stanley & Co. LLC | | | EUR | 30 | | | | | 34,813 | | | | | 34,693 | | | | | 120 | | | | | — | |
Expiring 11/17/21 | | Morgan Stanley & Co. LLC | | | EUR | 30 | | | | | 34,827 | | | | | 34,692 | | | | | 135 | | | | | — | |
Expiring 11/17/21 | | Morgan Stanley & Co. LLC | | | EUR | 30 | | | | | 34,862 | | | | | 34,692 | | | | | 170 | | | | | — | |
Expiring 11/17/21 | | Morgan Stanley & Co. LLC | | | EUR | 20 | | | | | 23,204 | | | | | 23,128 | | | | | 76 | | | | | — | |
Expiring 11/17/21 | | Morgan Stanley & Co. LLC | | | EUR | 20 | | | | | 23,209 | | | | | 23,129 | | | | | 80 | | | | | — | |
Expiring 11/17/21 | | Morgan Stanley & Co. LLC | | | EUR | 20 | | | | | 23,218 | | | | | 23,128 | | | | | 90 | | | | | — | |
Expiring 11/17/21 | | Morgan Stanley & Co. LLC | | | EUR | 20 | | | | | 23,256 | | | | | 23,128 | | | | | 128 | | | | | — | |
Expiring 11/17/21 | | Morgan Stanley & Co. LLC | | | EUR | 10 | | | | | 11,602 | | | | | 11,564 | | | | | 38 | | | | | — | |
Expiring 11/17/21 | | Morgan Stanley & Co. LLC | | | EUR | 10 | | | | | 11,598 | | | | | 11,564 | | | | | 34 | | | | | — | |
Expiring 11/17/21 | | Morgan Stanley & Co. LLC | | | EUR | 10 | | | | | 11,621 | | | | | 11,564 | | | | | 57 | | | | | — | |
Expiring 11/17/21 | | Morgan Stanley & Co. LLC | | | EUR | 10 | | | | | 11,604 | | | | | 11,564 | | | | | 40 | | | | | — | |
Expiring 11/17/21 | | Morgan Stanley & Co. LLC | | | EUR | 10 | | | | | 11,602 | | | | | 11,564 | | | | | 38 | | | | | — | |
Expiring 11/17/21 | | Morgan Stanley & Co. LLC | | | EUR | 10 | | | | | 11,641 | | | | | 11,564 | | | | | 77 | | | | | — | |
See Notes to Financial Statements.
| | | | |
PGIM Wadhwani Systematic Absolute Return Fund | | | 25 | |
Schedule of Investments (continued)
as of October 31, 2021
Forward foreign currency exchange contracts outstanding at October 31, 2021 (continued):
| | | | | | | | | | | | | | | | | | | | | | | | | | | | | | |
Sale
Contracts | | Counterparty | | Notional
Amount
(000) | | Value at
Settlement
Date | | Current
Value | | Unrealized
Appreciation | | Unrealized
Depreciation |
| OTC Forward Foreign Currency Exchange Contracts (cont’d.): | |
| Euro (cont’d.), | | | | | | | | | | | | |
Expiring 11/17/21 | | Morgan Stanley & Co. LLC | | | EUR | 10 | | | | $ | 11,602 | | | | $ | 11,564 | | | | $ | 38 | | | | $ | — | |
Expiring 11/17/21 | | Morgan Stanley & Co. LLC | | | EUR | 10 | | | | | 11,641 | | | | | 11,564 | | | | | 77 | | | | | — | |
Expiring 11/17/21 | | Morgan Stanley & Co. LLC | | | EUR | 10 | | | | | 11,628 | | | | | 11,564 | | | | | 64 | | | | | — | |
Expiring 11/17/21 | | Morgan Stanley & Co. LLC | | | EUR | 10 | | | | | 11,621 | | | | | 11,564 | | | | | 57 | | | | | — | |
Expiring 11/17/21 | | Morgan Stanley & Co. LLC | | | EUR | 10 | | | | | 11,641 | | | | | 11,564 | | | | | 77 | | | | | — | |
Expiring 11/17/21 | | Morgan Stanley & Co. LLC | | | EUR | 10 | | | | | 11,604 | | | | | 11,564 | | | | | 40 | | | | | — | |
Expiring 11/17/21 | | Morgan Stanley & Co. LLC | | | EUR | 10 | | | | | 11,609 | | | | | 11,564 | | | | | 45 | | | | | — | |
Expiring 11/17/21 | | Morgan Stanley & Co. LLC | | | EUR | 10 | | | | | 11,641 | | | | | 11,564 | | | | | 77 | | | | | — | |
Expiring 11/18/21 | | Morgan Stanley & Co. LLC | | | EUR | 10 | | | | | 11,605 | | | | | 11,565 | | | | | 40 | | | | | — | |
Expiring 11/18/21 | | Morgan Stanley & Co. LLC | | | EUR | 10 | | | | | 11,603 | | | | | 11,565 | | | | | 38 | | | | | — | |
Expiring 11/18/21 | | Morgan Stanley & Co. LLC | | | EUR | 10 | | | | | 11,641 | | | | | 11,564 | | | | | 77 | | | | | — | |
| Hungarian Forint, | | | | | | | | | | | | |
Expiring 11/17/21 | | Morgan Stanley & Co. LLC | | | HUF | 7,317 | | | | | 23,218 | | | | | 23,489 | | | | | — | | | | | (271 | ) |
Expiring 11/17/21 | | Morgan Stanley & Co. LLC | | | HUF | 3,647 | | | | | 11,594 | | | | | 11,708 | | | | | — | | | | | (114 | ) |
Expiring 11/17/21 | | Morgan Stanley & Co. LLC | | | HUF | 3,647 | | | | | 11,594 | | | | | 11,708 | | | | | — | | | | | (114 | ) |
Expiring 11/17/21 | | Morgan Stanley & Co. LLC | | | HUF | 3,647 | | | | | 11,592 | | | | | 11,706 | | | | | — | | | | | (114 | ) |
Expiring 11/17/21 | | Morgan Stanley & Co. LLC | | | HUF | 3,645 | | | | | 11,618 | | | | | 11,701 | | | | | — | | | | | (83 | ) |
Expiring 11/17/21 | | Morgan Stanley & Co. LLC | | | HUF | 3,634 | | | | | 11,583 | | | | | 11,666 | | | | | — | | | | | (83 | ) |
Expiring 11/17/21 | | Morgan Stanley & Co. LLC | | | HUF | 3,624 | | | | | 11,649 | | | | | 11,634 | | | | | 15 | | | | | — | |
| Indian Rupee, | | | | | | | | | | | | |
Expiring 11/17/21 | | Morgan Stanley & Co. LLC | | | INR | 755 | | | | | 10,000 | | | | | 10,050 | | | | | — | | | | | (50 | ) |
| Indonesian Rupiah, | | | | | | | | | | | | |
Expiring 11/17/21 | | Morgan Stanley & Co. LLC | | | IDR | 569,764 | | | | | 40,000 | | | | | 39,979 | | | | | 21 | | | | | — | |
Expiring 11/17/21 | | Morgan Stanley & Co. LLC | | | IDR | 566,680 | | | | | 40,000 | | | | | 39,763 | | | | | 237 | | | | | — | |
Expiring 11/17/21 | | Morgan Stanley & Co. LLC | | | IDR | 426,616 | | | | | 30,000 | | | | | 29,935 | | | | | 65 | | | | | — | |
Expiring 11/17/21 | | Morgan Stanley & Co. LLC | | | IDR | 142,125 | | | | | 10,000 | | | | | 9,973 | | | | | 27 | | | | | — | |
Expiring 11/17/21 | | Morgan Stanley & Co. LLC | | | IDR | 141,159 | | | | | 10,000 | | | | | 9,905 | | | | | 95 | | | | | — | |
| Japanese Yen, | | | | | | | | | | | | |
Expiring 11/17/21 | | Morgan Stanley & Co. LLC | | | JPY | 188,439 | | | | | 1,660,000 | | | | | 1,653,543 | | | | | 6,457 | | | | | — | |
Expiring 11/17/21 | | Morgan Stanley & Co. LLC | | | JPY | 40,874 | | | | | 360,000 | | | | | 358,666 | | | | | 1,334 | | | | | — | |
Expiring 11/17/21 | | Morgan Stanley & Co. LLC | | | JPY | 39,855 | | | | | 349,992 | | | | | 349,728 | | | | | 264 | | | | | — | |
Expiring 11/17/21 | | Morgan Stanley & Co. LLC | | | JPY | 39,735 | | | | | 350,000 | | | | | 348,669 | | | | | 1,331 | | | | | — | |
Expiring 11/17/21 | | Morgan Stanley & Co. LLC | | | JPY | 38,603 | | | | | 340,000 | | | | | 338,743 | | | | | 1,257 | | | | | — | |
Expiring 11/17/21 | | Morgan Stanley & Co. LLC | | | JPY | 32,913 | | | | | 290,043 | | | | | 288,809 | | | | | 1,234 | | | | | — | |
Expiring 11/17/21 | | Morgan Stanley & Co. LLC | | | JPY | 18,201 | | | | | 159,975 | | | | | 159,709 | | | | | 266 | | | | | — | |
Expiring 11/17/21 | | Morgan Stanley & Co. LLC | | | JPY | 17,131 | | | | | 150,095 | | | | | 150,321 | | | | | — | | | | | (226 | ) |
Expiring 11/17/21 | | Morgan Stanley & Co. LLC | | | JPY | 13,712 | | | | | 120,073 | | | | | 120,318 | | | | | — | | | | | (245 | ) |
Expiring 11/17/21 | | Morgan Stanley & Co. LLC | | | JPY | 12,520 | | | | | 109,838 | | | | | 109,860 | | | | | — | | | | | (22 | ) |
Expiring 11/17/21 | | Morgan Stanley & Co. LLC | | | JPY | 10,237 | | | | | 90,013 | | | | | 89,829 | | | | | 184 | | | | | — | |
Expiring 11/17/21 | | Morgan Stanley & Co. LLC | | | JPY | 9,084 | | | | | 80,000 | | | | | 79,709 | | | | | 291 | | | | | — | |
Expiring 11/17/21 | | Morgan Stanley & Co. LLC | | | JPY | 6,852 | | | | | 59,961 | | | | | 60,127 | | | | | — | | | | | (166 | ) |
Expiring 11/17/21 | | Morgan Stanley & Co. LLC | | | JPY | 4,529 | | | | | 39,982 | | | | | 39,742 | | | | | 240 | | | | | — | |
See Notes to Financial Statements.
Forward foreign currency exchange contracts outstanding at October 31, 2021 (continued):
| | | | | | | | | | | | | | | | | | | | | | | | | | | | | | |
Sale
Contracts | | Counterparty | | Notional
Amount
(000) | | Value at
Settlement
Date | | Current
Value | | Unrealized
Appreciation | | Unrealized
Depreciation |
| OTC Forward Foreign Currency Exchange Contracts (cont’d.): | |
| Japanese Yen (cont’d.), | | | | | | | | | | |
Expiring 11/17/21 | | Morgan Stanley & Co. LLC | | | JPY | 3,427 | | | | $ | 30,022 | | | | $ | 30,067 | | | | $ | — | | | | | $ (45 | ) |
Expiring 11/17/21 | | Morgan Stanley & Co. LLC | | | JPY | 3,424 | | | | | 29,961 | | | | | 30,044 | | | | | — | | | | | (83 | ) |
Expiring 11/17/21 | | Morgan Stanley & Co. LLC | | | JPY | 3,417 | | | | | 29,978 | | | | | 29,984 | | | | | — | | | | | (6 | ) |
Expiring 11/17/21 | | Morgan Stanley & Co. LLC | | | JPY | 3,413 | | | | | 29,995 | | | | | 29,946 | | | | | 49 | | | | | — | |
Expiring 11/17/21 | | Morgan Stanley & Co. LLC | | | JPY | 3,406 | | | | | 29,966 | | | | | 29,886 | | | | | 80 | | | | | — | |
Expiring 11/17/21 | | Morgan Stanley & Co. LLC | | | JPY | 3,405 | | | | | 29,962 | | | | | 29,883 | | | | | 79 | | | | | — | |
Expiring 11/17/21 | | Morgan Stanley & Co. LLC | | | JPY | 1,196 | | | | | 10,539 | | | | | 10,492 | | | | | 47 | | | | | — | |
Expiring 11/17/21 | | Morgan Stanley & Co. LLC | | | JPY | 1,143 | | | | | 10,011 | | | | | 10,031 | | | | | — | | | | | (20 | ) |
Expiring 11/17/21 | | Morgan Stanley & Co. LLC | | | JPY | 1,141 | | | | | 9,997 | | | | | 10,012 | | | | | — | | | | | (15 | ) |
Expiring 11/17/21 | | Morgan Stanley & Co. LLC | | | JPY | 1,140 | | | | | 10,047 | | | | | 10,002 | | | | | 45 | | | | | — | |
Expiring 11/17/21 | | Morgan Stanley & Co. LLC | | | JPY | 1,140 | | | | | 10,046 | | | | | 10,001 | | | | | 45 | | | | | — | |
Expiring 11/17/21 | | Morgan Stanley & Co. LLC | | | JPY | 1,140 | | | | | 10,050 | | | | | 10,005 | | | | | 45 | | | | | — | |
Expiring 11/17/21 | | Morgan Stanley & Co. LLC | | | JPY | 1,140 | | | | | 10,045 | | | | | 10,000 | | | | | 45 | | | | | — | |
Expiring 11/17/21 | | Morgan Stanley & Co. LLC | | | JPY | 1,139 | | | | | 9,996 | | | | | 9,998 | | | | | — | | | | | (2 | ) |
Expiring 11/17/21 | | Morgan Stanley & Co. LLC | | | JPY | 1,139 | | | | | 10,002 | | | | | 9,995 | | | | | 7 | | | | | — | |
Expiring 11/17/21 | | Morgan Stanley & Co. LLC | | | JPY | 1,138 | | | | | 9,985 | | | | | 9,987 | | | | | — | | | | | (2 | ) |
Expiring 11/17/21 | | Morgan Stanley & Co. LLC | | | JPY | 1,137 | | | | | 10,002 | | | | | 9,981 | | | | | 21 | | | | | — | |
Expiring 11/17/21 | | Morgan Stanley & Co. LLC | | | JPY | 1,137 | | | | | 10,002 | | | | | 9,981 | | | | | 21 | | | | | — | |
| Mexican Peso, | | | | | | | | | | | | |
Expiring 11/17/21 | | Morgan Stanley & Co. LLC | | | MXN | 204 | | | | | 9,961 | | | | | 9,858 | | | | | 103 | | | | | — | |
| New Taiwanese Dollar, | | | | | | | | | | |
Expiring 11/17/21 | | Morgan Stanley & Co. LLC | | | TWD | 15,417 | | | | | 550,000 | | | | | 554,366 | | | | | — | | | | | (4,366 | ) |
Expiring 11/17/21 | | Morgan Stanley & Co. LLC | | | TWD | 7,568 | | | | | 270,000 | | | | | 272,144 | | | | | — | | | | | (2,144 | ) |
Expiring 11/17/21 | | Morgan Stanley & Co. LLC | | | TWD | 6,167 | | | | | 220,000 | | | | | 221,747 | | | | | — | | | | | (1,747 | ) |
Expiring 11/17/21 | | Morgan Stanley & Co. LLC | | | TWD | 835 | | | | | 30,000 | | | | | 30,036 | | | | | — | | | | | (36 | ) |
Expiring 11/17/21 | | Morgan Stanley & Co. LLC | | | TWD | 560 | | | | | 20,000 | | | | | 20,138 | | | | | — | | | | | (138 | ) |
Expiring 11/17/21 | | Morgan Stanley & Co. LLC | | | TWD | 557 | | | | | 20,000 | | | | | 20,034 | | | | | — | | | | | (34 | ) |
Expiring 11/17/21 | | Morgan Stanley & Co. LLC | | | TWD | 557 | | | | | 20,000 | | | | | 20,035 | | | | | — | | | | | (35 | ) |
Expiring 11/17/21 | | Morgan Stanley & Co. LLC | | | TWD | 556 | | | | | 20,000 | | | | | 19,991 | | | | | 9 | | | | | — | |
Expiring 11/17/21 | | Morgan Stanley & Co. LLC | | | TWD | 556 | | | | | 20,000 | | | | | 19,979 | | | | | 21 | | | | | — | |
Expiring 11/17/21 | | Morgan Stanley & Co. LLC | | | TWD | 555 | | | | | 20,000 | | | | | 19,974 | | | | | 26 | | | | | — | |
Expiring 11/17/21 | | Morgan Stanley & Co. LLC | | | TWD | 280 | | | | | 10,000 | | | | | 10,062 | | | | | — | | | | | (62 | ) |
Expiring 11/17/21 | | Morgan Stanley & Co. LLC | | | TWD | 280 | | | | | 10,000 | | | | | 10,067 | | | | | — | | | | | (67 | ) |
Expiring 11/17/21 | | Morgan Stanley & Co. LLC | | | TWD | 279 | | | | | 10,000 | | | | | 10,017 | | | | | — | | | | | (17 | ) |
Expiring 11/17/21 | | Morgan Stanley & Co. LLC | | | TWD | 278 | | | | | 10,000 | | | | | 10,000 | | | | | — | | | | | — | |
Expiring 11/17/21 | | Morgan Stanley & Co. LLC | | | TWD | 278 | | | | | 10,000 | | | | | 9,993 | | | | | 7 | | | | | — | |
Expiring 11/17/21 | | Morgan Stanley & Co. LLC | | | TWD | 278 | | | | | 10,000 | | | | | 10,007 | | | | | — | | | | | (7 | ) |
| New Zealand Dollar, | | | | | | | | | | | | |
Expiring 11/17/21 | | Morgan Stanley & Co. LLC | | | NZD | 160 | | | | | 114,600 | | | | | 114,628 | | | | | — | | | | | (28 | ) |
Expiring 11/17/21 | | Morgan Stanley & Co. LLC | | | NZD | 110 | | | | | 78,712 | | | | | 78,807 | | | | | — | | | | | (95 | ) |
Expiring 11/17/21 | | Morgan Stanley & Co. LLC | | | NZD | 110 | | | | | 78,775 | | | | | 78,807 | | | | | — | | | | | (32 | ) |
Expiring 11/17/21 | | Morgan Stanley & Co. LLC | | | NZD | 90 | | | | | 64,524 | | | | | 64,479 | | | | | 45 | | | | | — | |
See Notes to Financial Statements.
| | | | |
PGIM Wadhwani Systematic Absolute Return Fund | | | 27 | |
Schedule of Investments (continued)
as of October 31, 2021
Forward foreign currency exchange contracts outstanding at October 31, 2021 (continued):
| | | | | | | | | | | | | | | | | | | | | | | | | | | |
Sale
Contracts | | Counterparty | | Notional
Amount
(000) | | Value at
Settlement
Date | | Current
Value | | Unrealized
Appreciation | | Unrealized
Depreciation |
| OTC Forward Foreign Currency Exchange Contracts (cont’d.): | |
| New Zealand Dollar (cont’d.), | | | | | | | | | | |
Expiring 11/17/21 | | Morgan Stanley & Co. LLC | | | NZD | 30 | | | | $ | 21,091 | | | | $ | 21,493 | | | | $ | — | | | | | $ (402 | ) |
Expiring 11/17/21 | | Morgan Stanley & Co. LLC | | | NZD | 30 | | | | | 20,866 | | | | | 21,493 | | | | | — | | | | | (627 | ) |
Expiring 11/17/21 | | Morgan Stanley & Co. LLC | | | NZD | 20 | | | | | 14,401 | | | | | 14,329 | | | | | 72 | | | | | — | |
Expiring 11/17/21 | | Morgan Stanley & Co. LLC | | | NZD | 20 | | | | | 14,402 | | | | | 14,328 | | | | | 74 | | | | | — | |
Expiring 11/17/21 | | Morgan Stanley & Co. LLC | | | NZD | 20 | | | | | 14,329 | | | | | 14,329 | | | | | — | | | | | — | |
Expiring 11/17/21 | | Morgan Stanley & Co. LLC | | | NZD | 20 | | | | | 14,402 | | | | | 14,328 | | | | | 74 | | | | | — | |
Expiring 11/17/21 | | Morgan Stanley & Co. LLC | | | NZD | 10 | | | | | 7,156 | | | | | 7,164 | | | | | — | | | | | (8 | ) |
Expiring 11/17/21 | | Morgan Stanley & Co. LLC | | | NZD | 10 | | | | | 6,941 | | | | | 7,165 | | | | | — | | | | | (224 | ) |
Expiring 11/17/21 | | Morgan Stanley & Co. LLC | | | NZD | 10 | | | | | 7,184 | | | | | 7,165 | | | | | 19 | | | | | — | |
Expiring 11/17/21 | | Morgan Stanley & Co. LLC | | | NZD | 10 | | | | | 7,201 | | | | | 7,164 | | | | | 37 | | | | | — | |
Expiring 11/17/21 | | Morgan Stanley & Co. LLC | | | NZD | 10 | | | | | 7,201 | | | | | 7,164 | | | | | 37 | | | | | — | |
Expiring 11/17/21 | | Morgan Stanley & Co. LLC | | | NZD | 10 | | | | | 7,061 | | | | | 7,164 | | | | | — | | | | | (103 | ) |
Expiring 11/17/21 | | Morgan Stanley & Co. LLC | | | NZD | 10 | | | | | 7,163 | | | | | 7,164 | | | | | — | | | | | (1 | ) |
Expiring 11/17/21 | | Morgan Stanley & Co. LLC | | | NZD | 10 | | | | | 7,167 | | | | | 7,165 | | | | | 2 | | | | | — | |
| Norwegian Krone, | | | | | | | | | | | | |
Expiring 11/17/21 | | Morgan Stanley & Co. LLC | | | NOK | 1,461 | | | | | 175,407 | | | | | 172,910 | | | | | 2,497 | | | | | — | |
Expiring 11/17/21 | | Morgan Stanley & Co. LLC | | | NOK | 1,280 | | | | | 150,521 | | | | | 151,504 | | | | | — | | | | | (983 | ) |
Expiring 11/17/21 | | Morgan Stanley & Co. LLC | | | NOK | 781 | | | | | 92,651 | | | | | 92,383 | | | | | 268 | | | | | — | |
Expiring 11/17/21 | | Morgan Stanley & Co. LLC | | | NOK | 679 | | | | | 81,286 | | | | | 80,348 | | | | | 938 | | | | | — | |
Expiring 11/17/21 | | Morgan Stanley & Co. LLC | | | NOK | 582 | | | | | 69,672 | | | | | 68,937 | | | | | 735 | | | | | — | |
Expiring 11/17/21 | | Morgan Stanley & Co. LLC | | | NOK | 294 | | | | | 34,780 | | | | | 34,835 | | | | | — | | | | | (55 | ) |
Expiring 11/17/21 | | Morgan Stanley & Co. LLC | | | NOK | 194 | | | | | 23,347 | | | | | 22,975 | | | | | 372 | | | | | — | |
Expiring 11/17/21 | | Morgan Stanley & Co. LLC | | | NOK | 98 | | | | | 11,736 | | | | | 11,569 | | | | | 167 | | | | | — | |
Expiring 11/17/21 | | Morgan Stanley & Co. LLC | | | NOK | 98 | | | | | 11,553 | | | | | 11,557 | | | | | — | | | | | (4 | ) |
| Polish Zloty, | | | | | | | | | | | | |
Expiring 11/17/21 | | Morgan Stanley & Co. LLC | | | PLN | 46 | | | | | 11,600 | | | | | 11,437 | | | | | 163 | | | | | — | |
Expiring 11/17/21 | | Morgan Stanley & Co. LLC | | | PLN | 46 | | | | | 11,605 | | | | | 11,442 | | | | | 163 | | | | | — | |
Expiring 11/17/21 | | Morgan Stanley & Co. LLC | | | PLN | 46 | | | | | 11,597 | | | | | 11,536 | | | | | 61 | | | | | — | |
Expiring 11/17/21 | | Morgan Stanley & Co. LLC | | | PLN | 46 | | | | | 11,646 | | | | | 11,540 | | | | | 106 | | | | | — | |
Expiring 11/17/21 | | Morgan Stanley & Co. LLC | | | PLN | 46 | | | | | 11,597 | | | | | 11,536 | | | | | 61 | | | | | — | |
Expiring 11/17/21 | | Morgan Stanley & Co. LLC | | | PLN | 46 | | | | | 11,603 | | | | | 11,459 | | | | | 144 | | | | | — | |
Expiring 11/17/21 | | Morgan Stanley & Co. LLC | | | PLN | 46 | | | | | 11,646 | | | | | 11,540 | | | | | 106 | | | | | — | |
| Singapore Dollar, | | | | | | | | | | | | |
Expiring 11/17/21 | | Morgan Stanley & Co. LLC | | | SGD | 13 | | | | | 10,027 | | | | | 9,994 | | | | | 33 | | | | | — | |
Expiring 11/17/21 | | Morgan Stanley & Co. LLC | | | SGD | 13 | | | | | 10,027 | | | | | 9,994 | | | | | 33 | | | | | — | |
| South African Rand, | | | | | | | | | | | | |
Expiring 11/17/21 | | Morgan Stanley & Co. LLC | | | ZAR | 304 | | | | | 19,873 | | | | | 19,866 | | | | | 7 | | | | | — | |
Expiring 11/17/21 | | Morgan Stanley & Co. LLC | | | ZAR | 303 | | | | | 19,974 | | | | | 19,792 | | | | | 182 | | | | | — | |
Expiring 11/17/21 | | Morgan Stanley & Co. LLC | | | ZAR | 152 | | | | | 9,942 | | | | | 9,939 | | | | | 3 | | | | | — | |
Expiring 11/17/21 | | Morgan Stanley & Co. LLC | | | ZAR | 150 | | | | | 9,972 | | | | | 9,810 | | | | | 162 | | | | | — | |
Expiring 11/17/21 | | Morgan Stanley & Co. LLC | | | ZAR | 147 | | | | | 9,985 | | | | | 9,619 | | | | | 366 | | | | | — | |
Expiring 11/17/21 | | Morgan Stanley & Co. LLC | | | ZAR | 145 | | | | | 9,858 | | | | | 9,479 | | | | | 379 | | | | | — | |
See Notes to Financial Statements.
Forward foreign currency exchange contracts outstanding at October 31, 2021 (continued):
| | | | | | | | | | | | | | | | | | | | | | | | | | | |
Sale
Contracts | | Counterparty | | Notional
Amount
(000) | | Value at
Settlement
Date | | Current
Value | | Unrealized
Appreciation | | Unrealized
Depreciation |
| OTC Forward Foreign Currency Exchange Contracts (cont’d.): | |
| South African Rand (cont’d.), | | | | | | | | | | |
Expiring 11/17/21 | | Morgan Stanley & Co. LLC | | | ZAR | 1 | | | | $ | 55 | | | | $ | 52 | | | | $ | 3 | | | | $ | — | |
Expiring 11/17/21 | | Morgan Stanley & Co. LLC | | | ZAR | —* | | | | | 13 | | | | | 13 | | | | | — | | | | | — | |
| South Korean Won, | | | | | | | | | | | | |
Expiring 11/17/21 | | Morgan Stanley & Co. LLC | | | KRW | 214,616 | | | | | 180,000 | | | | | 182,614 | | | | | — | | | | | (2,614 | ) |
Expiring 11/17/21 | | Morgan Stanley & Co. LLC | | | KRW | 143,102 | | | | | 120,000 | | | | | 121,764 | | | | | — | | | | | (1,764 | ) |
Expiring 11/17/21 | | Morgan Stanley & Co. LLC | | | KRW | 95,392 | | | | | 80,000 | | | | | 81,167 | | | | | — | | | | | (1,167 | ) |
Expiring 11/17/21 | | Morgan Stanley & Co. LLC | | | KRW | 11,832 | | | | | 10,000 | | | | | 10,068 | | | | | — | | | | | (68 | ) |
Expiring 11/17/21 | | Morgan Stanley & Co. LLC | | | KRW | 11,831 | | | | | 10,000 | | | | | 10,067 | | | | | — | | | | | (67 | ) |
Expiring 11/17/21 | | Morgan Stanley & Co. LLC | | | KRW | 11,788 | | | | | 10,000 | | | | | 10,030 | | | | | — | | | | | (30 | ) |
Expiring 11/17/21 | | Morgan Stanley & Co. LLC | | | KRW | 11,765 | | | | | 10,000 | | | | | 10,010 | | | | | — | | | | | (10 | ) |
Expiring 11/17/21 | | Morgan Stanley & Co. LLC | | | KRW | 11,713 | | | | | 10,000 | | | | | 9,966 | | | | | 34 | | | | | — | |
| Swedish Krona, | | | | | | | | | | | | |
Expiring 11/17/21 | | Morgan Stanley & Co. LLC | | | SEK | 200 | | | | | 23,200 | | | | | 23,277 | | | | | — | | | | | (77 | ) |
Expiring 11/17/21 | | Morgan Stanley & Co. LLC | | | SEK | 200 | | | | | 23,213 | | | | | 23,290 | | | | | — | | | | | (77 | ) |
Expiring 11/17/21 | | Morgan Stanley & Co. LLC | | | SEK | 100 | | | | | 11,630 | | | | | 11,675 | | | | | — | | | | | (45 | ) |
Expiring 11/17/21 | | Morgan Stanley & Co. LLC | | | SEK | —* | | | | | 3 | | | | | 3 | | | | | — | | | | | — | |
| Swiss Franc, | | | | | | | | | | | | |
Expiring 11/17/21 | | Morgan Stanley & Co. LLC | | | CHF | 1,149 | | | | | 1,240,000 | | | | | 1,255,584 | | | | | — | | | | | (15,584 | ) |
Expiring 11/17/21 | | Morgan Stanley & Co. LLC | | | CHF | 547 | | | | | 590,000 | | | | | 597,376 | | | | | — | | | | | (7,376 | ) |
Expiring 11/17/21 | | Morgan Stanley & Co. LLC | | | CHF | 166 | | | | | 180,188 | | | | | 181,581 | | | | | — | | | | | (1,393 | ) |
Expiring 11/17/21 | | Morgan Stanley & Co. LLC | | | CHF | 120 | | | | | 130,000 | | | | | 131,668 | | | | | — | | | | | (1,668 | ) |
Expiring 11/17/21 | | Morgan Stanley & Co. LLC | | | CHF | 83 | | | | | 90,069 | | | | | 90,472 | | | | | — | | | | | (403 | ) |
Expiring 11/17/21 | | Morgan Stanley & Co. LLC | | | CHF | 64 | | | | | 70,048 | | | | | 70,154 | | | | | — | | | | | (106 | ) |
Expiring 11/17/21 | | Morgan Stanley & Co. LLC | | | CHF | 46 | | | | | 50,188 | | | | | 50,576 | | | | | — | | | | | (388 | ) |
Expiring 11/17/21 | | Morgan Stanley & Co. LLC | | | CHF | 9 | | | | | 10,021 | | | | | 10,098 | | | | | — | | | | | (77 | ) |
Expiring 11/17/21 | | Morgan Stanley & Co. LLC | | | CHF | 9 | | | | | 10,038 | | | | | 10,116 | | | | | — | | | | | (78 | ) |
Expiring 11/17/21 | | Morgan Stanley & Co. LLC | | | CHF | —* | | | | | 9 | | | | | 9 | | | | | — | | | | | — | |
| Thai Baht, | | | | | | | | | | | | |
Expiring 11/17/21 | | Morgan Stanley & Co. LLC | | | THB | 6,985 | | | | | 210,000 | | | | | 210,456 | | | | | — | | | | | (456 | ) |
Expiring 11/17/21 | | Morgan Stanley & Co. LLC | | | THB | 3,992 | | | | | 120,000 | | | | | 120,271 | | | | | — | | | | | (271 | ) |
Expiring 11/17/21 | | Morgan Stanley & Co. LLC | | | THB | 998 | | | | | 30,000 | | | | | 30,067 | | | | | — | | | | | (67 | ) |
Expiring 11/17/21 | | Morgan Stanley & Co. LLC | | | THB | 334 | | | | | 9,982 | | | | | 10,067 | | | | | — | | | | | (85 | ) |
Expiring 11/17/21 | | Morgan Stanley & Co. LLC | | | THB | 334 | | | | | 10,003 | | | | | 10,050 | | | | | — | | | | | (47 | ) |
Expiring 11/17/21 | | Morgan Stanley & Co. LLC | | | THB | 333 | | | | | 10,001 | | | | | 10,026 | | | | | — | | | | | (25 | ) |
| Turkish Lira, | | | | | | | | | | | | |
Expiring 11/17/21 | | Morgan Stanley & Co. LLC | | | TRY | 93 | | | | | 9,845 | | | | | 9,611 | | | | | 234 | | | | | — | |
See Notes to Financial Statements.
| | | | |
PGIM Wadhwani Systematic Absolute Return Fund | | | 29 | |
Schedule of Investments (continued)
as of October 31, 2021
Forward foreign currency exchange contracts outstanding at October 31, 2021 (continued):
| | | | | | | | | | | | | | | | | | | | | | | | | | | |
Sale
Contracts | | Counterparty | | Notional
Amount
(000) | | Value at
Settlement
Date | | Current
Value | | Unrealized
Appreciation | | Unrealized
Depreciation |
| OTC Forward Foreign Currency Exchange Contracts (cont’d.): | | | | | | | | | | | |
Turkish Lira (cont’d.), | | | | | | | | | | | | | | | | | | | | | | | | | | | |
Expiring 11/17/21 | | Morgan Stanley & Co. LLC | | | | TRY 92 | | | | $ | 9,852 | | | | $ | 9,534 | | | | $ | 318 | | | | $ | — | |
Expiring 11/17/21 | | Morgan Stanley & Co. LLC | | | | TRY 1 | | | | | 86 | | | | | 83 | | | | | 3 | | | | | — | |
| | | | | | | | | | | | | | | | | | | | | | | | | | | |
| | | | | | | | | | $ | 20,027,369 | | | | $ | 20,028,165 | | | | | 52,167 | | | | | (52,963 | ) |
| | | | | | | | | | | | | | | | | | | | | | | | | | | |
| | | | | | | | | | | | | | | | | | | | $ | 158,788 | | | | $ | (107,763 | ) |
| | | | | | | | | | | | | | | | | | | | | | | | | | | |
Cross currency exchange contracts outstanding at October 31, 2021:
| | | | | | | | | | | | | | | | | | | | | | | | | | | |
| | | | | | |
Settlement | | Type | | Notional
Amount
(000) | | In Exchange
For (000) | | Unrealized Appreciation | | Unrealized
Depreciation | | Counterparty |
| OTC Cross Currency Exchange Contracts: | | | | |
| 11/17/21 | | Buy | | | EUR | 10 | | | | PLN | 46 | | | | $ | — | | | | $ | (28 | ) | | Morgan Stanley & Co. LLC |
11/17/21 | | Buy | | | EUR | 10 | | | | PLN | 46 | | | | | — | | | | | (19 | ) | | Morgan Stanley & Co. LLC |
| 11/17/21 | | Buy | | | EUR | 10 | | | | PLN | 46 | | | | | — | | | | | (25 | ) | | Morgan Stanley & Co. LLC |
| 11/17/21 | | Buy | | | EUR | 20 | | | | PLN | 92 | | | | | — | | | | | (41 | ) | | Morgan Stanley & Co. LLC |
| 11/17/21 | | Buy | | | EUR | 30 | | | | SEK | 304 | | | | | — | | | | | (681 | ) | | Morgan Stanley & Co. LLC |
| 11/17/21 | | Buy | | | EUR | 80 | | | | PLN | 367 | | | | | 660 | | | | | — | | | Morgan Stanley & Co. LLC |
| 11/17/21 | | Buy | | | EUR | 160 | | | | PLN | 733 | | | | | 1,317 | | | | | — | | | Morgan Stanley & Co. LLC |
| 11/17/21 | | Buy | | | EUR | 160 | | | | SEK | 1,620 | | | | | — | | | | | (3,646 | ) | | Morgan Stanley & Co. LLC |
| 11/17/21 | | Buy | | | EUR | 170 | | | | SEK | 1,721 | | | | | — | | | | | (3,846 | ) | | Morgan Stanley & Co. LLC |
| 11/17/21 | | Buy | | | EUR | 180 | | | | PLN | 825 | | | | | 1,473 | | | | | — | | | Morgan Stanley & Co. LLC |
| 11/17/21 | | Buy | | | HUF | 3,602 | | | | EUR | 10 | | | | | — | | | | | (1 | ) | | Morgan Stanley & Co. LLC |
| 11/17/21 | | Buy | | | HUF | 3,607 | | | | EUR | 10 | | | | | 15 | | | | | — | | | Morgan Stanley & Co. LLC |
| 11/17/21 | | Buy | | | HUF | 36,100 | | | | EUR | 100 | | | | | 235 | | | | | — | | | Morgan Stanley & Co. LLC |
| 11/17/21 | | Buy | | | NOK | 592 | | | | EUR | 60 | | | | | 693 | | | | | — | | | Morgan Stanley & Co. LLC |
See Notes to Financial Statements.
Cross currency exchange contracts outstanding at October 31, 2021 (continued):
| | | | | | | | | | | | | | | | | | | | | | | | | | | | | | |
| | | | | | |
Settlement | | Type | | Notional
Amount
(000) | | In Exchange
For (000) | | Unrealized
Appreciation | | Unrealized
Depreciation | | Counterparty |
| OTC Cross Currency Exchange Contracts (cont’d.): | | | | | | | | | | | |
| 11/17/21 | | Buy | | | NOK | 3,452 | | | | EUR | 350 | | | | $ | 3,841 | | | | $ | — | | | |
| Morgan Stanley & Co.
LLC |
|
| 11/17/21 | | Buy | | | NOK | 14,498 | | | | EUR | 1,470 | | | | | 16,097 | | | | | — | | | |
| Morgan Stanley & Co.
LLC |
|
| 11/18/21 | | Buy | | | CZK | 254 | | | | EUR | 10 | | | | | — | | | | | (122 | ) | | |
| Morgan Stanley & Co.
LLC |
|
11/18/21 | | Buy | | | CZK | 7,121 | | | | EUR | 280 | | | | | — | | | | | (3,407 | ) | | |
| Morgan Stanley & Co.
LLC |
|
| 11/18/21 | | Buy | | | EUR | 10 | | | | CZK | 258 | | | | | — | | | | | (41 | ) | | |
| Morgan Stanley & Co.
LLC |
|
| | | | | | | | | | | | | | | | | | | | | | | | | | | |
| | | | | | | | | | | | | | | $ | 24,331 | | | | $ | (11,857 | ) | | | | | |
| | | | | | | | | | | | | | | | | | | | | | | | | | | |
Summary of Collateral for Centrally Cleared/Exchange-traded Derivatives:
Cash and securities segregated as collateral, including pending settlement for closed positions, to cover requirements for centrally cleared/exchange-traded derivatives are listed by broker as follows:
| | | | |
Broker | | Cash and/or Foreign Currency | | Securities Market Value |
| Credit Suisse Securities (USA) LLC | | $ 807,679 | | $— |
| Morgan Stanley & Co. LLC | | 964,826 | | — |
| | | | |
| Total | | $1,772,505 | | $— |
| | | | |
Fair Value Measurements:
Various inputs are used in determining the value of the Fund’s investments. These inputs are summarized in the three broad levels listed below.
Level 1—unadjusted quoted prices generally in active markets for identical securities.
Level 2—quoted prices for similar securities, interest rates and yield curves, prepayment speeds, foreign currency exchange rates and other observable inputs.
Level 3—unobservable inputs for securities valued in accordance with Board approved fair valuation procedures.
The following is a summary of the inputs used as of October 31, 2021 in valuing such portfolio securities:
| | | | | | | | | | |
| | | Level 1 | | | Level 2 | | | Level 3 |
| Short-Term Investment | | | | | | | | |
Affiliated Mutual Fund | | $ | 24,447,267 | | | $ | — | | | $— |
| | | | | | | | | | |
| | | |
| Other Financial Instruments* | | | | | | | | |
| Assets | | | | | | | | |
Futures Contracts | | $ | 274,736 | | | $ | — | | | $— |
See Notes to Financial Statements.
| | | | |
PGIM Wadhwani Systematic Absolute Return Fund | | | 31 | |
Schedule of Investments (continued)
as of October 31, 2021
| | | | | | | | | | |
| | | Level 1 | | | Level 2 | | | Level 3 |
| Other Financial Instruments* (continued) | | | | | | | | |
| Assets (continued) | | | | | | | | |
OTC Forward Foreign Currency Exchange Contracts | | $ | — | | | $ | 158,788 | | | $— |
OTC Cross Currency Exchange Contracts | | | — | | | | 24,331 | | | — |
| | | | | | | | | | |
Total | | $ | 274,736 | | | $ | 183,119 | | | $— |
| | | | | | | | | | |
| | | |
| Liabilities | | | | | | | | |
Futures Contracts | | $ | (130,768 | ) | | $ | — | | | $— |
OTC Forward Foreign Currency Exchange Contracts | | | — | | | | (107,763 | ) | | — |
OTC Cross Currency Exchange Contracts | | | — | | | | (11,857 | ) | | — |
| | | | | | | | | | |
Total | | $ | (130,768 | ) | | $ | (119,620 | ) | | $— |
| | | | | | | | | | |
| * | Other financial instruments are derivative instruments not reflected in the Schedule of Investments, such as futures, forwards and centrally cleared swap contracts, which are recorded at the unrealized appreciation (depreciation) on the instrument, and OTC swap contracts which are recorded at fair value. |
Industry Classification:
The industry classification of investments and other assets in excess of liabilities shown as a percentage of net assets as of October 31, 2021 were as follows (unaudited):
| | | | |
Affiliated Mutual Fund | | | 79.6 | % |
| | | | |
| | | 79.6 | |
Other assets in excess of liabilities | | | 20.4 | |
| | | | |
| |
| | | 100.0 | % |
| | | | |
Effects of Derivative Instruments on the Financial Statements and Primary Underlying Risk Exposure:
The Fund invested in derivative instruments during the reporting period. The primary types of risk associated with these derivative instruments are equity contracts risk, foreign exchange contracts risk and interest rate contracts risk. See the Notes to Financial Statements for additional detail regarding these derivative instruments and their risks. The effect of such derivative instruments on the Fund’s financial position and financial performance as reflected in the Statement of Assets and Liabilities and Statement of Operations is presented in the summary below.
Fair values of derivative instruments as of October 31, 2021 as presented in the Statement of Assets and Liabilities:
| | | | | | | | | | | | |
Derivatives not accounted for as
hedging instruments, carried at
fair value | | Asset Derivatives | | | Liability Derivatives | |
| | Statement of
Assets and
Liabilities Location | | Fair
Value | | | Statement of
Assets and
Liabilities Location | | Fair
Value | |
| | Due from/to | | | | | | Due from/to | | | | |
| | broker-variation margin | | | | | | broker-variation margin | | | | |
| Equity contracts | | futures | | $ | 225,901 | * | | futures | | $ | 51,063 | * |
See Notes to Financial Statements.
| | | | | | | | | | | | |
Derivatives not accounted for as
hedging instruments, carried at
fair value | | Asset Derivatives | | | Liability Derivatives | |
| | Statement of
Assets and
Liabilities Location | | Fair
Value | | | Statement of
Assets and
Liabilities Location | | Fair
Value | |
| Foreign exchange contracts | | Unrealized appreciation on OTC cross currency exchange contracts | | $ | 24,331 | | | Unrealized depreciation on OTC cross currency exchange contracts | | $ | 11,857 | |
| Foreign exchange contracts | | Unrealized appreciation on OTC forward foreign currency exchange
contracts | | | 158,788 | | | Unrealized depreciation on OTC forward foreign currency exchange
contracts | | | 107,763 | |
| Interest rate contracts | | Due from/to
broker-variation margin futures | | | 48,835 | * | | Due from/to
broker-variation margin
futures | | | 79,705 | * |
| | | | | | | | | | | | |
| | | | $ | 457,855 | | | | | $ | 250,388 | |
| | | | | | | | | | | | |
| * | Includes cumulative appreciation (depreciation) as reported in the schedule of open futures and centrally cleared swap contracts. Only unsettled variation margin receivable (payable) is reported within the Statement of Assets and Liabilities. |
The effects of derivative instruments on the Statement of Operations for the period ended October 31, 2021 are as follows:
| | | | | | | | |
Amount of Realized Gain (Loss) on Derivatives Recognized in Income | |
Derivatives not accounted for as hedging instruments, carried at fair value | | Futures | | | Forward
& Cross
Currency
Exchange
Contracts | |
Equity contracts | | $ | 332,814 | | | $ | — | |
Foreign exchange contracts | | | — | | | | 127,881 | |
Interest rate contracts | | | 36,251 | | | | — | |
| | | | | | | | |
Total | | $ | 369,065 | | | $ | 127,881 | |
| | | | | | | | |
|
Change in Unrealized Appreciation (Depreciation) on Derivatives Recognized in Income | |
Derivatives not accounted for
as hedging instruments, carried at fair value | | Futures | | | Forward
& Cross
Currency
Exchange
Contracts | |
Equity contracts | | $ | 174,838 | | | $ | — | |
Foreign exchange contracts | | | — | | | | 63,499 | |
Interest rate contracts | | | (30,870 | ) | | | — | |
| | | | | | | | |
Total | | $ | 143,968 | | | $ | 63,499 | |
| | | | | | | | |
The derivative instruments outstanding as of period-end serve as indicators of the volume of derivative activities for the Fund.
See Notes to Financial Statements.
| | | | |
PGIM Wadhwani Systematic Absolute Return Fund | | | 33 | |
Schedule of Investments (continued)
as of October 31, 2021
Financial Instruments/Transactions—Summary of Offsetting and Netting Arrangements:
The Fund invested in OTC derivatives during the reporting period that are either offset in accordance with current requirements or are subject to enforceable master netting arrangements or similar agreements that permit offsetting. The information about offsetting and related netting arrangements for OTC derivatives where the legal right to set-off exists is presented in the summary below.
Offsetting of OTC derivative assets and liabilities:
| | | | | | | | | | |
Counterparty | | Gross Amounts of
Recognized
Assets(1) | | Gross Amounts of
Recognized
Liabilities(1) | | Net Amounts of
Recognized
Assets/(Liabilities) | | Collateral
Pledged/(Received)(2) | | Net
Amount |
Morgan Stanley & Co. LLC | | $183,119 | | $(119,620) | | $63,499 | | $— | | $63,499 |
| | | | | | | | | | |
| (1) | Includes unrealized appreciation/(depreciation) on swaps and forwards, premiums paid/(received) on swap agreements and market value of purchased and written options, as represented on the Statement of Assets and Liabilities. |
| (2) | Collateral amount disclosed by the Fund is limited to the market value of financial instruments/transactions and the Fund’s OTC derivative exposure by counterparty. |
See Notes to Financial Statements.
Statement of Assets and Liabilities
as of October 31, 2021
| | | | |
Assets | | | | |
Affiliated investments (cost $24,447,267) | | $ | 24,447,267 | |
Deposit with prime broker for futures and OTC forward foreign currency exchange contracts | | | 4,620,206 | |
Deposit with broker for centrally cleared/exchange-traded derivatives | | | 1,772,505 | |
Unrealized appreciation on OTC forward foreign currency exchange contracts | | | 158,788 | |
Due from Manager | | | 69,941 | |
Unrealized appreciation on OTC cross currency exchange contracts | | | 24,331 | |
Receivable for Fund shares sold | | | 1,000 | |
Prepaid expenses and other assets | | | 102,680 | |
| | | | |
Total Assets | | | 31,196,718 | |
| | | | |
| |
| Liabilities | | | |
Due to broker—variation margin futures | | | 221,316 | |
Unrealized depreciation on OTC forward foreign currency exchange contracts | | | 107,763 | |
Legal fees and expenses payable | | | 54,699 | |
Audit fee payable | | | 35,000 | |
Offering fees payable | | | 32,933 | |
Accrued expenses and other liabilities | | | 24,091 | |
Unrealized depreciation on OTC cross currency exchange contracts | | | 11,857 | |
Payable for Fund shares purchased | | | 1,000 | |
Trustees’ fees payable | | | 1,000 | |
Affiliated transfer agent fee payable | | | 76 | |
Distribution fee payable | | | 11 | |
| | | | |
Total Liabilities | | | 489,746 | |
| | | | |
| |
Net Assets | | $ | 30,706,972 | |
| | | | |
| | | | | |
Net assets were comprised of: | | | | |
Shares of beneficial interest, at par | | $ | 3,004 | |
Paid-in capital in excess of par | | | 30,020,137 | |
Total distributable earnings (loss) | | | 683,831 | |
| | | | |
Net assets, October 31, 2021 | | $ | 30,706,972 | |
| | | | |
See Notes to Financial Statements.
| | | | |
PGIM Wadhwani Systematic Absolute Return Fund | | | 35 | |
Statement of Assets and Liabilities
as of October 31, 2021
| | | | | |
Class A | | | | | |
Net asset value and redemption price per share,
($11,218 ÷ 1,098 shares of beneficial interest issued and outstanding) | | | | $10.22 | |
Maximum sales charge (5.50% of offering price) | | | | 0.59 | |
| | | | | |
Maximum offering price to public | | | | $10.81 | |
| | | | | |
| |
| Class C | | |
Net asset value, offering price and redemption price per share,
($10,211 ÷ 1,000 shares of beneficial interest issued and outstanding) | | | | $10.21 | |
| | | | | |
| |
| Class Z | | |
Net asset value, offering price and redemption price per share,
($10,221 ÷ 1,000 shares of beneficial interest issued and outstanding) | | | | $10.22 | |
| | | | | |
| |
| Class R6 | | |
Net asset value, offering price and redemption price per share,
($30,675,322 ÷ 3,001,000 shares of beneficial interest issued and outstanding) | | | | $10.22 | |
| | | | | |
See Notes to Financial Statements.
Statement of Operations
For the Period September 28, 2021* through October 31, 2021
| | | | |
Net Investment Income (Loss) | | | | |
Affiliated dividend income | | $ | 2,402 | |
| | | | |
| |
Expenses | | | | |
Management fee | | | 29,642 | |
Distribution fee(a) | | | 12 | |
Legal fees and expenses | | | 54,843 | |
Audit fee | | | 35,000 | |
Registration fees(a) | | | 5,834 | |
Custodian and accounting fees | | | 4,749 | |
Shareholders’ reports | | | 4,000 | |
Offering fees | | | 3,068 | |
Trustees’ fees | | | 1,000 | |
Transfer agent’s fees and expenses (including affiliated expense of $76)(a) | | | 400 | |
Miscellaneous | | | 1,710 | |
| | | | |
Total expenses | | | 140,258 | |
Less: Fee waiver and/or expense reimbursement(a) | | | (109,127 | ) |
| | | | |
Net expenses | | | 31,131 | |
| | | | |
Net investment income (loss) | | | (28,729 | ) |
| | | | |
|
| Realized And Unrealized Gain (Loss) On Investment And Foreign Currency Transactions | |
Net realized gain (loss) on: | | | | |
Futures transactions | | | 369,065 | |
Forward and cross currency contract transactions | | | 127,881 | |
Foreign currency transactions | | | (7,074 | ) |
| | | | |
| | | 489,872 | |
| | | | |
Net change in unrealized appreciation (depreciation) on: | | | | |
Futures | | | 143,968 | |
Forward and cross currency contracts | | | 63,499 | |
Foreign currencies | | | (2,638 | ) |
| | | | |
| | | 204,829 | |
| | | | |
Net gain (loss) on investment and foreign currency transactions | | | 694,701 | |
| | | | |
Net Increase (Decrease) In Net Assets Resulting From Operations | | $ | 665,972 | |
| | | | |
| | | | |
| * | Commencement of operations. |
| (a) | Class specific expenses and waivers were as follows: |
| | | | | | | | | | | | | | | | |
| | | Class A | | | Class C | | | Class Z | | | Class R6 | |
Distribution fee | | | 3 | | | | 9 | | | | — | | | | — | |
Registration fees | | | 1,779 | | | | 1,779 | | | | 1,779 | | | | 497 | |
Transfer agent’s fees and expenses | | | 100 | | | | 50 | | | | 200 | | | | 50 | |
Fee waiver and/or expense reimbursement | | | (1,913 | ) | | | (1,863 | ) | | | (2,013 | ) | | | (103,338 | ) |
See Notes to Financial Statements.
| | | | |
PGIM Wadhwani Systematic Absolute Return Fund | | | 37 | |
Statements of Changes in Net Assets
| | | | | |
| |
| | | September 28, 2021*
through
October 31, 2021 |
| |
Increase (Decrease) in Net Assets | | | | | |
Operations | | | | | |
Net investment income (loss) | | | $ | (28,729 | ) |
Net realized gain (loss) on investment and foreign currency transactions | | | | 489,872 | |
Net change in unrealized appreciation (depreciation) on investments and foreign currencies | | | | 204,829 | |
| | | | | |
Net increase (decrease) in net assets resulting from operations | | | | 665,972 | |
| | | | | |
| |
Fund share transactions | | | | | |
Net proceeds from shares sold | | | | 30,041,000 | |
| | | | | |
Total increase (decrease) | | | | 30,706,972 | |
| |
| Net Assets: | | |
Beginning of period | | | | — | |
| | | | | |
End of period | | | $ | 30,706,972 | |
| | | | | |
| * | Commencement of operations. |
See Notes to Financial Statements.
Financial Highlights
| | | | | |
| Class A Shares |
| | | September 28, 2021(a)
through October 31,
2021 |
| Per Share Operating Performance(b): | | | | | |
| Net Asset Value, Beginning of Period | | | | $10.00 | |
| Income (loss) from investment operations: | | | | | |
| Net investment income (loss) | | | | (0.01 | ) |
| Net realized and unrealized gain (loss) on investment and foreign currency transactions | | | | 0.23 | |
| Total from investment operations | | | | 0.22 | |
| Net asset value, end of period | | | | $10.22 | |
| Total Return(c): | | | | 2.20 | % |
| | | | | | |
| Ratios/Supplemental Data: |
| Net assets, end of period (000) | | | | $11 | |
| Average net assets (000) | | | | $10 | |
| Ratios to average net assets(d): | | | | | |
| Expenses after waivers and/or expense reimbursement | | | | 1.40 | %(e) |
| Expenses before waivers and/or expense reimbursement | | | | 200.29 | %(e) |
| Net investment income (loss) | | | | (1.32 | )%(e) |
| Portfolio turnover rate(f) | | | | 0 | % |
| (a) | Commencement of operations. |
| (b) | Calculated based on average shares outstanding during the period. |
| (c) | Total return does not consider the effects of sales loads. Total return is calculated assuming a purchase of a share on the first day and a sale on the last day of each period reported and includes reinvestment of dividends and distributions, if any. Total returns may reflect adjustments to conform to GAAP. Total returns for periods less than one full year are not annualized. |
| (d) | Does not include expenses of the underlying funds in which the Fund invests. |
| (e) | Annualized, with the exception of certain non-recurring expenses. |
| (f) | The Fund’s portfolio turnover rate is calculated in accordance with regulatory requirements, without regard to transactions involving short-term investments and certain derivatives. If such transactions were included, the Fund’s portfolio turnover rate may be higher. |
See Notes to Financial Statements.
| | | | |
PGIM Wadhwani Systematic Absolute Return Fund | | | 39 | |
Financial Highlights (continued)
| | | | | |
| Class C Shares | | |
| | | September 28, 2021(a)
through October 31,
2021 |
| Per Share Operating Performance(b): | | | | | |
| Net Asset Value, Beginning of Period | | | | $10.00 | |
| Income (loss) from investment operations: | | | | | |
| Net investment income (loss) | | | | (0.02 | ) |
| Net realized and unrealized gain (loss) on investment and foreign currency transactions | | | | 0.23 | |
| Total from investment operations | | | | 0.21 | |
| Net asset value, end of period | | | | $10.21 | |
| Total Return(c): | | | | 2.10 | % |
| | | | | | |
| Ratios/Supplemental Data: | | |
| Net assets, end of period (000) | | | | $10 | |
| Average net assets (000) | | | | $10 | |
| Ratios to average net assets(d): | | | | | |
| Expenses after waivers and/or expense reimbursement | | | | 2.15 | %(e) |
| Expenses before waivers and/or expense reimbursement | | | | 197.54 | %(e) |
| Net investment income (loss) | | | | (2.07 | )%(e) |
| Portfolio turnover rate(f) | | | | 0 | % |
| (a) | Commencement of operations. |
| (b) | Calculated based on average shares outstanding during the period. |
| (c) | Total return does not consider the effects of sales loads. Total return is calculated assuming a purchase of a share on the first day and a sale on the last day of each period reported and includes reinvestment of dividends and distributions, if any. Total returns may reflect adjustments to conform to GAAP. Total returns for periods less than one full year are not annualized. |
| (d) | Does not include expenses of the underlying funds in which the Fund invests. |
| (e) | Annualized, with the exception of certain non-recurring expenses. |
| (f) | The Fund’s portfolio turnover rate is calculated in accordance with regulatory requirements, without regard to transactions involving short-term investments and certain derivatives. If such transactions were included, the Fund’s portfolio turnover rate may be higher. |
See Notes to Financial Statements.
| | | | | |
| Class Z Shares | | |
| | | September 28, 2021(a)
through October 31,
2021 |
| Per Share Operating Performance(b): | | | | | |
| Net Asset Value, Beginning of Period | | | | $10.00 | |
| Income (loss) from investment operations: | | | | | |
| Net investment income (loss) | | | | (0.01 | ) |
| Net realized and unrealized gain (loss) on investment and foreign currency transactions | | | | 0.23 | |
| Total from investment operations | | | | 0.22 | |
| Net asset value, end of period | | | | $10.22 | |
| Total Return(c): | | | | 2.20 | % |
| | | | | | |
| Ratios/Supplemental Data: | | |
| Net assets, end of period (000) | | | | $10 | |
| Average net assets (000) | | | | $10 | |
| Ratios to average net assets(d): | | | | | |
| Expenses after waivers and/or expense reimbursement | | | | 1.15 | %(e) |
| Expenses before waivers and/or expense reimbursement | | | | 212.41 | %(e) |
| Net investment income (loss) | | | | (1.07 | )%(e) |
| Portfolio turnover rate(f) | | | | 0 | % |
| (a) | Commencement of operations. |
| (b) | Calculated based on average shares outstanding during the period. |
| (c) | Total return is calculated assuming a purchase of a share on the first day and a sale on the last day of each period reported and includes reinvestment of dividends and distributions, if any. Total returns may reflect adjustments to conform to GAAP. Total returns for periods less than one full year are not annualized. |
| (d) | Does not include expenses of the underlying funds in which the Fund invests. |
| (e) | Annualized, with the exception of certain non-recurring expenses. |
| (f) | The Fund’s portfolio turnover rate is calculated in accordance with regulatory requirements, without regard to transactions involving short-term investments and certain derivatives. If such transactions were included, the Fund’s portfolio turnover rate may be higher. |
See Notes to Financial Statements.
| | | | |
PGIM Wadhwani Systematic Absolute Return Fund | | | 41 | |
Financial Highlights (continued)
| | | | | |
| Class R6 Shares |
| | | September 28, 2021(a)
through October 31,
2021 |
| Per Share Operating Performance(b): | | | | | |
| Net Asset Value, Beginning of Period | | | | $10.00 | |
| Income (loss) from investment operations: | | | | | |
| Net investment income (loss) | | | | (0.01 | ) |
| Net realized and unrealized gain (loss) on investment and foreign currency transactions | | | | 0.23 | |
| Total from investment operations | | | | 0.22 | |
| Net asset value, end of period | | | | $10.22 | |
| Total Return(c): | | | | 2.20 | % |
| | | | | | |
| Ratios/Supplemental Data: |
| Net assets, end of period (000) | | | | $30,675 | |
| Average net assets (000) | | | | $30,276 | |
| Ratios to average net assets(d): | | | | | |
| Expenses after waivers and/or expense reimbursement | | | | 1.10 | %(e) |
| Expenses before waivers and/or expense reimbursement | | | | 1.84 | %(e) |
| Net investment income (loss) | | | | (1.02 | )%(e) |
| Portfolio turnover rate(f) | | | | 0 | % |
| (a) | Commencement of operations. |
| (b) | Calculated based on average shares outstanding during the period. |
| (c) | Total return is calculated assuming a purchase of a share on the first day and a sale on the last day of each period reported and includes reinvestment of dividends and distributions, if any. Total returns may reflect adjustments to conform to GAAP. Total returns for periods less than one full year are not annualized. |
| (d) | Does not include expenses of the underlying funds in which the Fund invests. |
| (e) | Annualized, with the exception of certain non-recurring expenses. |
| (f) | The Fund’s portfolio turnover rate is calculated in accordance with regulatory requirements, without regard to transactions involving short-term investments and certain derivatives. If such transactions were included, the Fund’s portfolio turnover rate may be higher. |
See Notes to Financial Statements.
Notes to Financial Statements
1. Organization
Prudential Investment Portfolios 3 (the “Registered Investment Company” or “RIC”) is registered under the Investment Company Act of 1940, as amended (“1940 Act”), as an open-end management investment company. The RIC is organized as a Delaware Statutory Trust and currently consists of six separate funds: PGIM Global Dynamic Bond Fund, PGIM Jennison Focused Growth Fund, PGIM QMA Large-Cap Value Fund, PGIM Real Assets Fund, PGIM Strategic Bond Fund and PGIM Wadhwani Systematic Absolute Return Fund. These financial statements relate only to the PGIM Wadhwani Systematic Absolute Return Fund (the “Fund”). The Fund is classified as a non-diversified fund for purposes of the 1940 Act.
The investment objective of the Fund is to seek long-term risk adjusted total return.
The Fund is subject to compliance with applicable regulations governing commodity pools including Commodity Futures Trading Commission (“CFTC”) rules.
2. Accounting Policies
The Fund follows the investment company accounting and reporting guidance of the Financial Accounting Standards Board (“FASB”) Accounting Standard Codification (“ASC”) Topic 946 Financial Services — Investment Companies. The following is a summary of significant accounting policies followed by the Fund in the preparation of its financial statements. The policies conform to U.S. generally accepted accounting principles (“GAAP”). The Fund consistently follows such policies in the preparation of its financial statements.
Securities Valuation: The Fund holds securities and other assets and liabilities that are fair valued as of the close of each day (generally, 4:00 PM Eastern time) the New York Stock Exchange (“NYSE”) is open for trading. As described in further detail below, the Fund’s investments are valued daily based on a number of factors, including the type of investment and whether market quotations are readily available. The RIC’s Board of Trustees (the “Board”) has adopted valuation procedures for security valuation under which fair valuation responsibilities have been delegated to PGIM Investments LLC (“PGIM Investments” or the “Manager”). Pursuant to the Board’s delegation, the Manager has established a Valuation Committee responsible for supervising the fair valuation of portfolio securities and other assets and liabilities. The valuation procedures permit the Fund to utilize independent pricing vendor services, quotations from market makers, and alternative valuation methods when market quotations are either not readily available or not deemed representative of fair value. Fair value is the price that would be received to sell an asset or paid to transfer a liability in an orderly transaction between market participants on the measurement date. A
| | | | |
PGIM Wadhwani Systematic Absolute Return Fund | | | 43 | |
Notes to Financial Statements (continued)
record of the Valuation Committee’s actions is subject to the Board’s review at its first quarterly meeting following the quarter in which such actions take place.
For the fiscal reporting period-end, securities and other assets and liabilities were fair valued at the close of the last U.S. business day. Trading in certain foreign securities may occur when the NYSE is closed (including weekends and holidays). Because such foreign securities trade in markets that are open on weekends and U.S. holidays, the values of some of the Fund’s foreign investments may change on days when investors cannot purchase or redeem Fund shares.
Various inputs determine how the Fund’s investments are valued, all of which are categorized according to the three broad levels (Level 1, 2, or 3) detailed in the Schedule of Investments and referred to herein as the “fair value hierarchy” in accordance with FASB ASC Topic 820 - Fair Value Measurements and Disclosures.
Common or preferred stocks, exchange-traded funds and derivative instruments, if applicable, that are traded on a national securities exchange are valued at the last sale price as of the close of trading on the applicable exchange where the security principally trades. Securities traded via NASDAQ are valued at the NASDAQ official closing price. To the extent these securities are valued at the last sale price or NASDAQ official closing price, they are classified as Level 1 in the fair value hierarchy. In the event that no sale or official closing price on valuation date exists, these securities are generally valued at the mean between the last reported bid and ask prices, or at the last bid price in the absence of an ask price. These securities are classified as Level 2 in the fair value hierarchy.
Investments in open-end funds (other than exchange-traded funds) are valued at their net asset values as of the close of the NYSE on the date of valuation. These securities are classified as Level 1 in the fair value hierarchy since they may be purchased or sold at their net asset values on the date of valuation.
Fixed income securities traded in the OTC market are generally classified as Level 2 in the fair value hierarchy. Such fixed income securities are typically valued using the market approach which generally involves obtaining data from an approved independent third-party vendor source. The Fund utilizes the market approach as the primary method to value securities when market prices of identical or comparable instruments are available. The third-party vendors’ valuation techniques used to derive the evaluated bid price are based on evaluating observable inputs, including but not limited to, yield curves, yield spreads, credit ratings, deal terms, tranche level attributes, default rates, cash flows, prepayment speeds, broker/dealer quotations and reported trades. Certain Level 3 securities are also valued using the market approach when obtaining a single broker quote or when utilizing transaction prices for identical securities that have been used in excess of five business
days. During the reporting period, there were no changes to report with respect to the valuation approach and/or valuation techniques discussed above.
OTC and centrally cleared derivative instruments are generally classified as Level 2 in the fair value hierarchy. Such derivative instruments are typically valued using the market approach and/or income approach which generally involves obtaining data from an approved independent third-party vendor source. The Fund utilizes the market approach when quoted prices in broker-dealer markets are available but also includes consideration of alternative valuation approaches, including the income approach. In the absence of reliable market quotations, the income approach is typically utilized for purposes of valuing derivatives such as interest rate swaps based on a discounted cash flow analysis whereby the value of the instrument is equal to the present value of its future cash inflows or outflows. Such analysis includes projecting future cash flows and determining the discount rate (including the present value factors that affect the discount rate) used to discount the future cash flows. In addition, the third-party vendors’ valuation techniques used to derive the evaluated derivative price is based on evaluating observable inputs, including but not limited to, underlying asset prices, indices, spreads, interest rates and exchange rates. Certain derivatives may be classified as Level 3 when valued using the market approach by obtaining a single broker quote or when utilizing unobservable inputs in the income approach. During the reporting period, there were no changes to report with respect to the valuation approach and/or valuation techniques discussed above.
Securities and other assets that cannot be priced according to the methods described above are valued based on pricing methodologies approved by the Board. In the event that unobservable inputs are used when determining such valuations, the securities will be classified as Level 3 in the fair value hierarchy. Altering one or more unobservable inputs may result in a significant change to a Level 3 security’s fair value measurement.
When determining the fair value of securities, some of the factors influencing the valuation include: the nature of any restrictions on disposition of the securities; assessment of the general liquidity of the securities; the issuer’s financial condition and the markets in which it does business; the cost of the investment; the size of the holding and the capitalization of the issuer; the prices of any recent transactions or bids/offers for such securities or any comparable securities; any available analyst media or other reports or information deemed reliable by the Manager regarding the issuer or the markets or industry in which it operates. Using fair value to price securities may result in a value that is different from a security’s most recent closing price and from the price used by other unaffiliated mutual funds to calculate their net asset values.
Foreign Currency Translation: The books and records of the Fund are maintained in U.S. dollars. Foreign currency amounts are translated into U.S. dollars on the following basis:
(i) market value of investment securities, other assets and liabilities — at the exchange rate as of the valuation date;
| | | | |
PGIM Wadhwani Systematic Absolute Return Fund | | | 45 | |
Notes to Financial Statements (continued)
(ii) purchases and sales of investment securities, income and expenses — at the rates of exchange prevailing on the respective dates of such transactions.
Although the net assets of the Fund are presented at the foreign exchange rates and market values at the close of the period, the Fund does not generally isolate that portion of the results of operations arising as a result of changes in the foreign exchange rates from the fluctuations arising from changes in the market prices of long-term portfolio securities held at the end of the period. Similarly, the Fund does not isolate the effect of changes in foreign exchange rates from the fluctuations arising from changes in the market prices of long-term portfolio securities sold during the period. Accordingly, holding period unrealized and realized foreign currency gains (losses) are included in the reported Net change in unrealized appreciation (depreciation) on investments and Net realized gains (losses) on investment transactions on the Statements of Operations.
Net realized gains (losses) on foreign currency transactions represent net foreign exchange gains (losses) from the disposition of holdings of foreign currencies, currency gains (losses) realized between the trade and settlement dates on investment transactions, and the difference between the amounts of interest, dividends and foreign withholding taxes recorded on the Fund’s books and the U.S. dollar equivalent amounts actually received or paid. Net unrealized currency gains (losses) arise from valuing foreign currency denominated assets and liabilities (other than investments) at period end exchange rates.
Forward and Cross Currency Contracts: A forward currency contract is a commitment to purchase or sell a foreign currency at a future date at a negotiated forward rate. The Fund enters into forward currency contracts, as defined in the prospectus, in order to hedge its exposure to changes in foreign currency exchange rates on its foreign portfolio holdings or on specific receivables and payables denominated in a foreign currency and to gain exposure to certain currencies. The contracts are valued daily at current forward exchange rates and any unrealized gain (loss) is included in net unrealized appreciation or depreciation on forward and cross currency contracts. Gain (loss) is realized on the settlement date of the contract equal to the difference between the settlement value of the original and negotiated forward contracts. This gain (loss), if any, is included in net realized gain (loss) on forward and cross currency contract transactions. Risks may arise upon entering into these contracts from the potential inability of the counterparties to meet the terms of their contracts. Forward currency contracts involve risks from currency exchange rate and credit risk in excess of the amounts reflected on the Statement of Assets and Liabilities. The Fund’s maximum risk of loss from counterparty credit risk is the net value of the cash flows to be received from the counterparty at the end of the contract’s life. A cross currency contract is a forward contract where a specified amount of one foreign currency will be exchanged for a specified amount of another foreign currency.
Financial Futures Contracts: A financial futures contract is an agreement to purchase (long) or sell (short) an agreed amount of securities at a set price for delivery on a future date. Upon entering into a financial futures contract, the Fund is required to pledge to the broker an amount of cash and/or other assets equal to a certain percentage of the contract amount. This amount is known as the “initial margin.” Subsequent payments, known as “variation margin,” are made or received by the Fund each day, depending on the daily fluctuations in the value of the underlying security. Such variation margin is recorded for financial statement purposes on a daily basis as unrealized gain (loss). When the contract expires or is closed, the gain (loss) is realized and is presented in the Statement of Operations as net realized gain (loss) on futures transactions.
The Fund invested in financial futures contracts in order to hedge its existing portfolio securities, or securities the Fund intends to purchase, against fluctuations in value caused by changes in prevailing interest rates. Should interest rates move unexpectedly, the Fund may not achieve the anticipated benefits of the financial futures contracts and may realize a loss. The use of futures transactions involves the risk of imperfect correlation in movements in the price of futures contracts, interest rates and the underlying hedged assets. Since futures contracts are exchange-traded, there is minimal counterparty credit risk to the Fund since the exchanges’ clearinghouse acts as counterparty to all exchange-traded futures and guarantees the futures contracts against default.
Master Netting Arrangements: The RIC, on behalf of the Fund, is subject to various Master Agreements, or netting arrangements, with select counterparties. These are agreements which a subadviser may have negotiated and entered into on behalf of all or a portion of the Fund. A master netting arrangement between the Fund and the counterparty permits the Fund to offset amounts payable by the Fund to the same counterparty against amounts to be received; and by the receipt of collateral from the counterparty by the Fund to cover the Fund’s exposure to the counterparty. However, there is no assurance that such mitigating factors are easily enforceable. In addition to master netting arrangements, the right to set-off exists when all the conditions are met such that each of the parties owes the other determinable amounts, the reporting party has the right to set-off the amount owed with the amount owed by the other party, the reporting party intends to set-off and the right of set-off is enforceable by law.
The RIC, on behalf of the Fund, is a party to International Swaps and Derivatives Association, Inc. (“ISDA”) Master Agreements with certain counterparties that govern OTC derivative and foreign exchange contracts entered into from time to time. The Master Agreements may contain provisions regarding, among other things, the parties’ general obligations, representations, agreements, collateral requirements, events of default and early termination. With respect to certain counterparties, in accordance with the terms of the Master Agreements, collateral posted to the Fund is held in a segregated account by the Fund’s custodian and with respect to those amounts which can be sold or re-pledged, is presented in the Schedule of Investments. Collateral pledged by the Fund is segregated by the Fund’s custodian and identified in the Schedule of Investments. Collateral can be in the form of cash or debt securities issued by the U.S. Government or related agencies or other
| | | | |
PGIM Wadhwani Systematic Absolute Return Fund | | | 47 | |
Notes to Financial Statements (continued)
securities as agreed to by the Fund and the applicable counterparty. Collateral requirements are determined based on the Fund’s net position with each counterparty. Termination events applicable to the Fund may occur upon a decline in the Fund’s net assets below a specified threshold over a certain period of time. Termination events applicable to counterparties may occur upon a decline in the counterparty’s long-term and short-term credit ratings below a specified level. In each case, upon occurrence, the other party may elect to terminate early and cause settlement of all derivative and foreign exchange contracts outstanding, including the payment of any losses and costs resulting from such early termination, as reasonably determined by the terminating party. Any decision by one or more of the Fund’s counterparties to elect early termination could impact the Fund’s future derivative activity.
In addition to each instrument’s primary underlying risk exposure (e.g. interest rate, credit, equity or foreign exchange, etc.), swap agreements involve, to varying degrees, elements of credit, market and documentation risk. Such risks involve the possibility that no liquid market for these agreements will exist, the counterparty to the agreement may default on its obligation to perform or disagree on the contractual terms of the agreement, and changes in net interest rates will be unfavorable. In connection with these agreements, securities in the portfolio may be identified or received as collateral from the counterparty in accordance with the terms of the respective swap agreements to provide or receive assets of value and to serve as recourse in the event of default or bankruptcy/insolvency of either party. Such OTC derivative agreements include conditions which, when materialized, give the counterparty the right to cause an early termination of the transactions under those agreements. Any election by the counterparty for early termination of the contract(s) may impact the amounts reported on financial statements.
Short sales and OTC contracts, including forward foreign currency exchange contracts, swaps, forward rate agreements and written options involve elements of both market and credit risk in excess of the amounts reflected on the Statement of Assets and Liabilities, if applicable. Such risks may be mitigated by engaging in master netting arrangements.
Securities Transactions and Net Investment Income: Securities transactions are recorded on the trade date. Realized gains (losses) from investment and currency transactions are calculated on the specific identification method. Dividend income is recorded on the ex-date, or for certain foreign securities, when the Fund becomes aware of such dividends. Expenses are recorded on an accrual basis, which may require the use of certain estimates by management that may differ from actual. Net investment income or loss (other than class specific expenses and waivers, which are allocated as noted below) and unrealized and realized gains (losses) are allocated daily to each class of shares based upon the relative proportion of adjusted net assets of each class at the beginning of the day. Class specific expenses and waivers, where applicable, are charged to the respective share classes. Such class specific expenses and waivers include distribution fees and distribution fee waivers,
shareholder servicing fees, transfer agent’s fees and expenses, registration fees and fee waivers and/or expense reimbursements, as applicable.
Offering and Organization Costs: Offering costs paid in connection with the initial offering of shares of the Fund are being amortized on a straight-line basis over twelve months from the date of commencement of operations. Organization costs paid in connection with the organization of the Fund were expensed as incurred.
Taxes: It is the Fund’s policy to meet the requirements of the Internal Revenue Code applicable to regulated investment companies and to distribute all of its taxable net investment income and capital gains, if any, to its shareholders. Therefore, no federal income tax provision is required. Withholding taxes on foreign dividends, interest and capital gains, if any, are recorded, net of reclaimable amounts, at the time the related income is earned.
Dividends and Distributions: The Fund expects to pay dividends from net investment income and distributions from net realized capital gains, if any, annually. Dividends and distributions to shareholders, which are determined in accordance with federal income tax regulations and which may differ from GAAP, are recorded on the ex-date. Permanent book/tax differences relating to income and gain (loss) are reclassified between total distributable earnings (loss) and paid-in capital in excess of par, as appropriate.
Estimates: The preparation of financial statements requires management to make estimates and assumptions that affect the reported amounts and disclosures in the financial statements. Actual results could differ from those estimates.
3. Agreements
The RIC, on behalf of the Fund, has a management agreement with the Manager. Pursuant to this agreement, the Manager has responsibility for all investment advisory services and supervises the subadviser’s performance of such services.
The Manager has entered into a subadvisory agreement with PGIM Wadhwani LLP (“PGIM Wadhwani” or the “subadviser”). The Manager pays for the services of the subadviser.
The management fee paid to the Manager is accrued daily and payable monthly at an annual rate of 1.05% of the Fund’s average daily net assets up to and including $1 billion, 1.03% on the next $2 billion of average daily net assets, 1.01% on the next $2 billion of average daily net assets, 1.00% on the next $5 billion and 0.99% on average daily net assets in excess of $10 billion. The effective management fee rate before any waivers and/or expense reimbursements was 1.05% for the period ended October 31, 2021.
The Manager has contractually agreed, through February 28, 2023, to limit total annual operating expenses after fee waivers and/or expense reimbursements to 1.40% of average daily net assets for Class A shares, 2.15% of average daily net assets for Class C
| | | | |
PGIM Wadhwani Systematic Absolute Return Fund | | | 49 | |
Notes to Financial Statements (continued)
shares, 1.15% of average daily net assets for Class Z shares and 1.10% of average daily net assets for Class R6 shares. This contractual waiver excludes interest, brokerage, taxes (such as income and foreign withholding taxes, stamp duty and deferred tax expenses), acquired fund fees and expenses, extraordinary expenses, and certain other Fund expenses such as dividend and interest expense and broker charges on short sales.
Where applicable, the Manager agrees to waive management fees or shared operating expenses on any share class to the same extent that it waives such expenses on any other share class. In addition, total annual operating expenses for Class R6 shares will not exceed total annual operating expenses for Class Z shares. Fees and/or expenses waived and/or reimbursed by the Manager may be recouped by the Manager within the same fiscal year during which such waiver and/or reimbursement is made if such recoupment can be realized without exceeding the expense limit in effect at the time of the recoupment for that fiscal year.
The RIC, on behalf of the Fund, has a distribution agreement with Prudential Investment Management Services LLC (“PIMS”), which acts as the distributor of the Class A, Class C, Class Z and Class R6 shares of the Fund. The Fund compensates PIMS for distributing and servicing the Fund’s Class A and Class C shares, pursuant to the plans of distribution (the “Distribution Plans”), regardless of expenses actually incurred by PIMS.
Pursuant to the Distribution Plans, the Fund compensates PIMS for distribution related activities at an annual rate of up to 0.25% and 1% of the average daily net assets of the Class A and Class C shares, respectively. The distribution fees are accrued daily and payable monthly. No distribution or service fees are paid to PIMS as distributor of the Class Z and Class R6 shares of the Fund.
For the period ended October 31, 2021, PIMS did not receive any front-end sales charges resulting from sales of Class A shares. Additionally, for the period ended October 31, 2021, PIMS did not receive any contingent deferred sales charges imposed upon redemptions by certain Class A and Class C shareholders, respectively.
PGIM Investments, PGIM Wadhwani and PIMS are indirect, wholly-owned subsidiaries of Prudential Financial, Inc. (“Prudential”).
4. Other Transactions with Affiliates
Prudential Mutual Fund Services LLC (“PMFS”), an affiliate of PGIM Investments and an indirect, wholly-owned subsidiary of Prudential, serves as the Fund’s transfer agent. Transfer agent’s fees and expenses in the Statement of Operations include certain out-of-pocket expenses paid to non-affiliates, where applicable.
The Fund may invest its overnight sweep cash in the PGIM Core Ultra Short Bond Fund (the “Core Fund”), a fund of Prudential Investment Portfolios 2, registered under the 1940 Act and managed by PGIM Investments. PGIM Investments and/or its affiliates are paid fees or reimbursed for providing their services to the Core Fund. In addition to the realized and unrealized gains on investments in the Core Fund, earnings from such investments are disclosed on the Statement of Operations as “Affiliated dividend income”.
The Fund may enter into certain securities purchase or sale transactions under Board approved Rule 17a-7 procedures. Rule 17a-7 is an exemptive rule under the 1940 Act, that subject to certain conditions, permits purchase and sale transactions among affiliated investment companies, or between an investment company and a person that is affiliated solely by reason of having a common (or affiliated) investment adviser, common directors/trustees, and/or common officers. For the reporting period ended October 31, 2021, no 17a-7 transactions were entered into by the Fund.
5. Portfolio Securities
There were no purchases or sales of portfolio securities, other than short-term investments, for the period ended October 31, 2021.
A summary of the cost of purchases and proceeds from sales of shares of affiliated mutual funds for the period ended October 31, 2021, is presented as follows:
| | | | | | | | | | | | | | | | | | | | | | | | | | | | | | | | | | | |
Value,
Beginning
of
Period | | Cost of
Purchases | | Proceeds
from Sales | | Change in
Unrealized
Gain
(Loss) | | Realized
Gain
(Loss) | | Value,
End of
Period | | Shares,
End
of
Period | | Income |
|
Short-Term Investments - Affiliated Mutual Fund: | |
|
PGIM Core Ultra Short Bond Fund (1)(wb) | |
$— | | | | $25,929,984 | | | | | $1,482,717 | | | | | $— | | | | | $— | | | | | $24,447,267 | | | | | 24,447,267 | | | | | $2,402 | |
| | | | | | | | | | | | | | | | | | | | | | | | | | | | | | | | | | | |
| (1) | The Fund did not have any capital gain distributions during the reporting period. |
| (wb) | PGIM Investments LLC, the manager of the Fund, also serves as manager of the PGIM Core Ultra Short Bond Fund. |
6. Distributions and Tax Information
Distributions to shareholders, which are determined in accordance with federal income tax regulations and which may differ from GAAP, are recorded on the ex-date. In order to present total distributable earnings (loss) and paid-in capital in excess of par on the Statement of Assets and Liabilities that more closely represent their tax character, certain adjustments have been made to total distributable earnings (loss) and paid-in capital in excess of par. For the tax period ended October 31, 2021, the adjustments were to increase total distributable earnings and decrease paid-in capital in excess of par by $17,859 due to non-deductible offering costs. Net investment income (loss), net realized gain (loss) on investments and foreign currency transactions and net assets were not affected by this change.
| | | | |
PGIM Wadhwani Systematic Absolute Return Fund | | | 51 | |
Notes to Financial Statements (continued)
For the period ended October 31, 2021, there were no distributions paid by the Fund.
As of October 31, 2021, the accumulated undistributed earnings on a tax basis were $423,972 of ordinary income and $337,911 of long-term capital gains.
The United States federal income tax basis of the Fund’s investments and the net unrealized depreciation as of October 31, 2021 were as follows:
| | | | | | |
| Tax Basis | | Gross
Unrealized
Appreciation | | Gross
Unrealized
Depreciation | | Net
Unrealized
Depreciation |
|
| $24,724,633 | | $336,491 | | $(406,390) | | $(69,899) |
The differences between GAAP and tax basis were primarily attributable to future and forward contracts and other cost basis differences between financial and tax accounting.
The Manager has analyzed the Fund’s tax positions and has concluded that no provision for income tax is required in the Fund’s financial statements for the current reporting period.
7. Capital and Ownership
The Fund offers Class A, Class C, Class Z and Class R6 shares. Class A shares are sold with a maximum front-end sales charge of 5.50%. Investors who purchase $1 million or more of Class A shares and sell these shares within 12 months of purchase are subject to a contingent deferred sales charge (“CDSC”) of 1%, although they are not subject to an initial sales charge. The Class A CDSC is waived for certain retirement and/or benefit plans. A special exchange privilege is also available for shareholders who qualified to purchase Class A shares at net asset value. Class C shares are sold with a CDSC of 1% on sales made within 12 months of purchase. Class C shares will automatically convert to Class A shares on a monthly basis approximately eight years after purchase. Class Z and Class R6 shares are not subject to any sales or redemption charges and are available exclusively for sale to a limited group of investors.
Under certain circumstances, an exchange may be made from specified share classes of the Fund to one or more other share classes of the Fund as presented in the table of transactions in shares of beneficial interest, below.
The RIC has authorized an unlimited number of shares of beneficial interest at $0.001 par value per share, currently divided into four classes, designated Class A, Class C, Class Z and Class R6.
As of October 31, 2021, Prudential, through its affiliated entities, including affiliated funds (if applicable), owned shares of the Fund as follows:
| | | | | | | | | | |
| | | Number of Shares | | Percentage of
Outstanding Shares |
Class A | | | | 1,000 | | | | | 91.1 | % |
Class C | | | | 1,000 | | | | | 100.0 | % |
Class Z | | | | 1,000 | | | | | 100.0 | % |
Class R6 | | | | 3,001,000 | | | | | 100.0 | % |
At the reporting period end, the number of shareholders holding greater than 5% of the Fund are as follows:
| | | | | | |
| Affiliated | | Unaffiliated |
Number of
Shareholders | | Percentage of
Outstanding Shares | | Number of
Shareholders | | Percentage of
Outstanding Shares |
| 1 | | 99.9% | | — | | —% |
Transactions in shares of beneficial interest were as follows:
| | | | | | | | |
Class A | | Shares | | | Amount | |
Period ended October 31, 2021*: | | | | | | | | |
Shares sold | | | 1,098 | | | $ | 11,000 | |
| | | | | | | | |
Net increase (decrease) in shares outstanding | | | 1,098 | | | $ | 11,000 | |
| | | | | | | | |
Class C | | | | | | |
Period ended October 31, 2021*: | | | | | | | | |
Shares sold | | | 1,000 | | | $ | 10,000 | |
| | | | | | | | |
Net increase (decrease) in shares outstanding | | | 1,000 | | | $ | 10,000 | |
| | | | | | | | |
Class Z | | | | | | |
Period ended October 31, 2021*: | | | | | | | | |
Shares sold | | | 1,000 | | | $ | 10,000 | |
| | | | | | | | |
Net increase (decrease) in shares outstanding | | | 1,000 | | | $ | 10,000 | |
| | | | | | | | |
Class R6 | | | | | | |
Period ended October 31, 2021*: | | | | | | | | |
Shares sold | | | 3,001,000 | | | $ | 30,010,000 | |
| | | | | | | | |
Net increase (decrease) in shares outstanding | | | 3,001,000 | | | $ | 30,010,000 | |
| | | | | | | | |
| * | Commencement of operations was September 28, 2021. |
8. Borrowings
The RIC, on behalf of the Fund, along with other affiliated registered investment companies (the “Participating Funds”), is a party to a Syndicated Credit Agreement (“SCA”) with a group of banks. The purpose of the SCA is to provide an alternative source of temporary funding for capital share redemptions. The table below provides details of the SCA.
| | |
| | | SCA |
Term of Commitment | | 10/1/2021 – 9/29/2022 |
| | |
Total Commitment | | $ 1,200,000,000 |
| | | | |
PGIM Wadhwani Systematic Absolute Return Fund | | | 53 | |
Notes to Financial Statements (continued)
| | |
| | | SCA |
| | |
| Annualized Commitment Fee on the Unused Portion of the SCA | | 0.15% |
| | |
Annualized Interest Rate on Borrowings | | 1.20% plus the higher of (1)
the effective federal funds
rate, (2) the one-month
LIBOR rate or (3) zero
percent |
Certain affiliated registered investment companies that are parties to the SCA include portfolios that are subject to a predetermined mathematical formula used to manage certain benefit guarantees offered under variable annuity contracts. The formula may result in large scale asset flows into and out of these portfolios. Consequently, these portfolios may be more likely to utilize the SCA for purposes of funding redemptions. It may be possible for those portfolios to fully exhaust the committed amount of the SCA, thereby requiring the Manager to allocate available funding per a Board-approved methodology designed to treat the Participating Funds in the SCA equitably.
The Fund did not utilize the SCA during the reporting period ended October 31, 2021.
9. Risks of Investing in the Fund
The Fund’s risks include, but are not limited to, some or all of the risks discussed below. For further information on the Fund’s risks, please refer to the Fund’s Prospectus and Statement of Additional Information.
Cash Management and Defensive Investing Risk: The value of the investments held by the Fund for cash management or defensive investing purposes can fluctuate. Like other fixed income securities, they are subject to risk, including market, interest rate and credit risk. If the Fund holds cash uninvested, it will be subject to the credit risk of the depository institution holding the cash. If the Fund holds cash uninvested, the Fund will not earn income on the cash. If a significant amount of the Fund’s assets are used for cash management or defensive investing purposes, it may not achieve its investment objective.
Commodity Regulatory Risk: The Fund is deemed a “commodity pool” and the manager is considered a “commodity pool operator” with respect to the Fund under the Commodity Exchange Act. The manager, directly or through its affiliates, is therefore subject to dual regulation by the Securities and Exchange Commission and the CFTC. The regulatory requirements governing the use of commodity futures (which include futures on broad-based securities indexes, interest rate futures and currency futures), options on commodity futures, certain swaps or certain other investments could change at any time.
Credit Risk/Counterparty Risk: The ability, or perceived ability, of the issuer or guarantor of a debt security, or the counterparty (the party on the other side of the transaction) to a derivatives contract or other financial contract to meet its financial obligations will affect the value of the security or derivative. Counterparty and credit risk are especially important in the context of privately negotiated instruments. The Fund expects to enter into certain privately negotiated agreements where the counterparty assumes the physical settlement obligations of the Fund under such transactions. Under this type of arrangement, there is a risk that the relevant counterparty or intermediary would, due to insolvency or other reasons, be unable to or fail to assume the physical settlement obligations of the Fund, in which case the Fund could be required to sell portfolio instruments at unfavorable times or prices or could have insufficient assets to satisfy its physical settlement obligations.
Credit ratings are intended to provide a measure of credit risk. However, credit ratings are only the opinions of the credit rating agency issuing the ratings and are not guarantees as to quality. The lower the rating of a debt security held by the Fund, the greater the degree of credit risk that is perceived to exist by the credit rating agency with respect to that security. Increasing the amount of Fund assets allocated to lower-rated securities generally will increase the credit risk to which the Fund is subject. Not all securities in which the Fund invests are rated. The longer the maturity and the lower the credit quality of a bond, the more sensitive it is to credit risk.
Currency Risk: A substantial portion of assets of the Fund may be invested in non-US currencies or in securities that trade in, and receive revenues in, non-US currencies or in derivatives that provide exposure to non-US currencies. Such investments are subject to the risk that the value of a particular currency will change in relation to the US dollar or other currencies in a manner that is not anticipated or does not correspond accurately to changes in the value of the Fund’s holdings and may result in Fund losses. Among the factors that may affect currency values are trade balances, levels of short term interest rates, differences in relative values of similar assets in different currencies, long term opportunities for investment and capital appreciation, central bank policy, and political developments. Currency conversion costs and currency fluctuations could erase investment gains or add to investment losses. Currency exchange rates may be volatile. Certain currency transactions are also subject to counterparty risk.
Debt Obligations Risk: Debt obligations are subject to credit risk, market risk and interest rate risk. The Fund’s holdings, share price, yield and total return may also fluctuate in response to bond market movements. The value of bonds may decline for issuer-related reasons, including management performance, financial leverage and reduced demand for the issuer’s goods and services. Certain types of fixed income obligations also may be subject to “call and redemption risk,” which is the risk that the issuer may call a bond held by the Fund for redemption before it matures and the Fund may lose income.
Derivatives Risk: Using derivatives can increase Fund losses and reduce opportunities for gains when market prices, interest rates, currency rates or the derivatives themselves behave in a way not anticipated by the Fund. Using derivatives also can have a leveraging
| | | | |
PGIM Wadhwani Systematic Absolute Return Fund | | | 55 | |
Notes to Financial Statements (continued)
effect and increase Fund volatility. The Fund can lose more than the amount it invests in a derivative. Certain derivatives have the potential for unlimited loss, regardless of the size of the initial investment. Derivatives may be difficult to sell, unwind or value, and the counterparty may default on its obligations to the Fund. Use of derivatives may have different tax consequences for the Fund than an investment in the underlying instrument, and such differences may affect the amount, timing and character of income distributed to shareholders.
Economic and Market Events Risk: Events in the U.S. and global financial markets, including actions taken by the U.S. Federal Reserve or foreign central banks to stimulate or stabilize economic growth or the functioning of the securities markets, may at times result in unusually high market volatility, which could negatively impact performance. Relatively reduced liquidity in credit and fixed income markets could adversely affect issuers worldwide.
Emerging Markets Risk: The risks of foreign investments are greater for investments in or exposed to emerging markets. Emerging market countries typically have economic and political systems that are less fully developed, and can be expected to be less stable, than those of more developed countries. For example, the economies of such countries can be subject to rapid and unpredictable rates of inflation or deflation. Low trading volumes may result in a lack of liquidity and price volatility. Emerging market countries may have policies that restrict investment by non-U.S. investors, or that prevent non-U.S. investors from withdrawing their money at will.
The Fund may invest in some emerging markets that subject it to risks such as those associated with illiquidity, custody of assets, different settlement and clearance procedures and asserting legal title under a developing legal and regulatory regime to a greater degree than in developed markets or even in other emerging markets.
Equity and Equity-Related Securities Risk: Equity and equity-related securities may be subject to changes in value, and their values may be more volatile than those of other asset classes. In addition to an individual security losing value, the value of the equity markets or a sector in which the Fund invests could go down. Different parts of a market can react differently to adverse issuer, market, regulatory, political and economic developments.
ETF Risk: The price movement of an ETF may not track the underlying index or basket of securities and may result in a loss. Investments in ETFs entail duplicate management fees, and the Fund will bear its proportionate share of the other expenses of the ETFs in which it invests. In addition, ETFs that invest in commodities may be, or may become subject to CFTC trading regulations that limit the amount of commodity contracts an ETF may hold. Such regulations could hurt the market value of an ETF’s shares. In addition, some
commodity ETFs invest in commodity futures that can lose money even when commodity prices are rising.
Europe Recent Events Risk: A number of countries in Europe have experienced severe economic and financial difficulties. Many non-governmental issuers, and even certain governments, have defaulted on, or been forced to restructure, their debts; many other issuers have faced difficulties obtaining credit or refinancing existing obligations; financial institutions have in many cases required government or central bank support, have needed to raise capital, and/or have been impaired in their ability to extend credit; and financial markets in Europe and elsewhere have experienced extreme volatility and declines in asset values and liquidity. These difficulties may continue, worsen or spread within and beyond Europe. Responses to the financial problems by European governments, central banks and others, including austerity measures and reforms, may not work, may result in social unrest and may limit future growth and economic recovery or have other unintended consequences. Further defaults or restructurings by governments and others of their debt could have additional adverse effects on economies, financial markets and asset valuations around the world. In addition, the United Kingdom (UK) has formally withdrawn from the European Union (EU) and one or more other countries may withdraw from the EU and/or abandon the Euro, the common currency of the EU. The UK and EU reached an agreement effective January 1, 2021 on the terms of their future trading relationship relating to the trading of goods, however, this does not cover financial services. The Fund may face risks associated with the potential uncertainty and consequences of the new relationship between the UK and EU, including volatility in exchange and interest rates and politically divergent national laws and regulations. Ukraine has experienced ongoing military conflict; this conflict may expand and military attacks could occur elsewhere in Europe. Europe has also been struggling with mass migration from the Middle East and Africa. The impact of these actions, especially if they occur in a disorderly fashion, is not clear but could be significant and far-reaching.
Whether or not the Fund invests in securities of issuers located in Europe or with significant exposure to European issuers or countries, these events could negatively affect the value and relative liquidity of the Fund’s investments. The occurrence of terrorist incidents throughout Europe could also impact financial markets.
Foreign Securities Risk: Investments in securities of non-U.S. issuers (including those denominated in U.S. dollars) may involve more risk than investing in securities of U.S. issuers. Foreign political, economic and legal systems, especially those in developing and emerging market countries, may be less stable and more volatile than in the United States. Foreign legal systems generally have fewer regulatory requirements than the U.S. legal system, particularly those of emerging markets. In general, less information is publicly available with respect to non-U.S. companies than U.S. companies. Non-U.S. companies generally are not subject to the same accounting, auditing, and financial reporting standards as are U.S. companies. Additionally, the changing value of foreign currencies and changes in exchange rates could also affect the value of the assets the Fund holds and the Fund’s performance. Certain foreign countries may impose restrictions on the ability of issuers of
| | | | |
PGIM Wadhwani Systematic Absolute Return Fund | | | 57 | |
Notes to Financial Statements (continued)
foreign securities to make payment of principal and interest or dividends to investors located outside the country, due to blockage of foreign currency exchanges or otherwise. Investments in emerging markets are subject to greater volatility and price declines.
In addition, the Fund’s investments in non-U.S. securities may be subject to the risks of nationalization or expropriation of assets, imposition of currency exchange controls or restrictions on the repatriation of non-U.S. currency, confiscatory taxation and adverse diplomatic developments. Special U.S. tax considerations may apply.
Futures and Forward Contracts Risk: The primary risks associated with the use of futures or forward contracts are (a) the imperfect correlation between the change in market value of the instruments held by the Fund and the price of the futures or forward contract; (b) possible lack of a liquid secondary market for a futures or forward contract and the resulting inability to close a futures or forward contract when desired; (c) losses caused by unanticipated market movements, which are potentially unlimited; (d) the failure to predict correctly the direction of securities or commodities prices, interest rates, currency exchange rates and other economic factors; and (e) the possibility that the counterparty to the futures or forward contract will default in the performance of its obligations. Additionally, not all forward contracts require a counterparty to post collateral, which may expose the Fund to greater losses in the event of a default by a counterparty.
Increase in Expenses Risk: Your actual cost of investing in the Fund may be higher than the expenses shown in the expense table in the Fund’s prospectus for a variety of reasons. For example, expense ratios may be higher than those shown if average net assets decrease.
Net assets are more likely to decrease and Fund expense ratios are more likely to increase when markets are volatile. Active and frequent trading of Fund securities can increase expenses.
Interest Rate Risk: The value of your investment may go down when interest rates rise. A rise in rates tends to have a greater impact on the prices of longer term or duration debt securities. For example, a fixed income security with a duration of three years is expected to decrease in value by approximately 3% if interest rates increase by 1%. This is referred to as “duration risk. ”When interest rates fall, the issuers of debt obligations may prepay principal more quickly than expected, and the Fund may be required to reinvest the proceeds at a lower interest rate. This is referred to as “prepayment risk.” When interest rates rise, debt obligations may be repaid more slowly than expected, and the value of the Fund’s holdings may fall sharply. This is referred to as “extension risk.” The Fund may lose money if short-term or long-term interest rates rise sharply or in a manner not anticipated by the subadviser.
Large Shareholder and Large Scale Redemption Risk: Certain individuals, accounts, funds (including funds affiliated with the Manager) or institutions, including the Manager and its affiliates, may from time to time own or control a substantial amount of the Fund’s shares. There is no requirement that these entities maintain their investment in the Fund. There is a risk that such large shareholders or that the Fund’s shareholders generally may redeem all or a substantial portion of their investments in the Fund in a short period of time, which could have a significant negative impact on the Fund’s NAV, liquidity, and brokerage costs. Large redemptions could also result in tax consequences to shareholders and impact the Fund’s ability to implement its investment strategy. The Fund’s ability to pursue its investment objective after one or more large scale redemptions may be impaired and, as a result, the Fund may invest a larger portion of its assets in cash or cash equivalents.
Leverage Risk: Certain transactions in which the Fund may engage may give rise to leverage. The use of leverage exaggerates the effect of any increase or decrease in the value of the Fund’s holdings, and makes any change in the Fund’s net asset value (“NAV”) greater than it would be without the use of leverage. This could result in increased volatility of investment return. There is a possibility that segregation involving a large percentage of the assets of the Fund could impede portfolio management or the Fund’s ability to meet redemption requests or other current obligations or that the Fund may be required to dispose of some of its investments at unfavorable prices or times.
LIBOR Risk: Many financial instruments use or may use a floating rate based on the London Interbank Offered Rate, or “LIBOR,” which is the offered rate for short-term Eurodollar deposits between major international banks. Over the course of the last several years, global regulators have indicated an intent to phase out the use of LIBOR and similar interbank offering rates (IBOR). There still remains uncertainty regarding the nature of any replacement rates for LIBOR and the other IBORs as well as around fallback approaches for instruments extending beyond the any phase-out of these reference rates. The lack of consensus around replacement rates and the uncertainty of the phase out of LIBOR and other IBORs may result in increased volatility in corporate or governmental debt, bank loans, derivatives and other instruments invested in by the Fund as well as loan facilities used by the Fund.
The potential effect of a transition away from LIBOR on the Fund or the financial instruments in which the Fund invests cannot yet be determined. The elimination of LIBOR or changes to other reference rates or any other changes or reforms to the determination or supervision of reference rates could have an adverse impact on the market for, or value of, any securities or payments linked to those reference rates, which may adversely affect the Fund’s performance and/or net asset value. Certain proposed replacement rates to LIBOR, such as the Secured Overnight Financing Rate (“SOFR”), are materially different from LIBOR, and changes in the applicable spread for instruments previously linked to LIBOR will need to be made in order for instruments to pay similar rates. Uncertainty and risk also remain regarding the willingness and ability of issuers and lenders to include revised provisions in new and existing contracts or instruments. Consequently, the transition away from LIBOR to other reference rates may lead to reduced coupons on debt held by the Fund, higher rates
| | | | |
PGIM Wadhwani Systematic Absolute Return Fund | | | 59 | |
Notes to Financial Statements (continued)
required to be paid by the Fund on bank lines of credit due to increases in spreads, increased volatility and illiquidity in markets that are tied to LIBOR, fluctuations in values of LIBOR-related investments or investments in issuers that utilize LIBOR, increased difficulty in borrowing or refinancing and diminished effectiveness of hedging strategies, adversely affecting the Fund’s performance. Furthermore, the risks associated with the expected discontinuation of LIBOR and transition may be exacerbated if the work necessary to effect an orderly transition to an alternative reference rate is not completed in a timely manner. Because the usefulness of LIBOR and the other IBORs as benchmarks could deteriorate during the transition period, these effects could begin to be experienced by the end of 2021 and beyond until the anticipated discontinuance date in 2023 for the majority of the LIBOR rates.
Management Risk: Actively managed mutual funds are subject to management risk. The subadviser will apply investment techniques and risk analyses in making investment decisions for the Fund, but there can be no guarantee that these techniques will produce the desired results. Additionally, the investments selected by the subadviser may underperform the markets in general, the Fund’s benchmark and other mutual funds with similar investment objectives.
Market Disruption and Geopolitical Risks: International wars or conflicts and geopolitical developments in foreign countries, along with instability in regions such as Asia, Eastern Europe, and the Middle East, possible terrorist attacks in the United States or around the world, public health epidemics such as the outbreak of infectious diseases like the outbreak of COVID-19 globally in 2020 or the 2014–2016 outbreak in West Africa of the Ebola virus, and other similar events could adversely affect the U.S. and foreign financial markets, including increases in market volatility, reduced liquidity in the securities markets and government intervention, and may cause further long-term economic uncertainties in the United States and worldwide generally. The coronavirus pandemic and the related governmental and public responses have had and may continue to have an impact on the Fund’s investments and net asset value and have led and may continue to lead to increased market volatility and the potential for illiquidity in certain classes of securities and sectors of the market. Preventative or protective actions that governments may take in respect of pandemic or epidemic diseases may result in periods of business disruption, business closures, inability to obtain raw materials, supplies and component parts, and reduced or disrupted operations for the issuers in which the Fund invests. Government intervention in markets may impact interest rates, market volatility and security pricing. The occurrence, reoccurrence and pendency of such diseases could adversely affect the economies (including through changes in business activity and increased unemployment) and financial markets either in specific countries or worldwide.
Market Risk: Markets are volatile and the prices of the Fund’s investments may decline generally. Instruments held by the Fund may fluctuate in price based on changes in an issuer’s financial condition and overall market and economic conditions. If the market prices of the instruments owned by the Fund fall, the value of your investment in the Fund will decline.
Model Design Risk: The subadviser uses certain quantitative models or algorithms to help guide its investment decisions. The design of the underlying models or algorithms may be flawed or incomplete. Additionally, the quantitative techniques that underlie the subadviser’s portfolio construction processes may fail to fully anticipate important risks. When a model or algorithms used in managing the Fund contains an error, or is incorrect or incomplete, any decision made in reliance on the model or algorithm may not produce the desired results and the Fund may realize losses. There is no guarantee that a quantitative model or algorithm used by the subadviser, and the investments selected based on the model or algorithm, will perform as expected or produce the desired results.
Model Implementation Risk: While the subadviser strives to mitigate the likelihood of material implementation errors, it is impossible to completely eliminate the risk of error in the implementation of the computer models that guide the subadviser’s quantitative investment processes. Additionally, it may be difficult to implement model recommendations in volatile and rapidly changing market conditions.
Money Market Instruments Risk: The value of money market instruments may be affected by changing interest rates and by changes in the credit ratings of those instruments. If a significant amount of the Fund’s assets are invested in money market instruments, it will be more difficult for the Fund to achieve its investment objective.
New Fund Risk: The Fund recently commenced operations. As a new and relatively small fund, the Fund’s performance may not represent how the Fund is expected to or may perform in the long term if it becomes larger and after it has fully implemented its investment strategies. Investment positions may have a disproportionate impact (negative or positive) on performance in new and smaller funds. New and smaller funds may also require a period of time before they are invested in securities that meet their investment objectives and policies and achieve a representative portfolio composition. Accordingly, investors in the Fund bear the risk that the Fund may not be successful in implementing its investment strategy, and may not employ a successful investment strategy, either of which could result in the Fund being liquidated at any time without shareholder approval and/or at a time that may not be favorable for all shareholders. Such a liquidation could result in transaction costs and have negative tax consequences for shareholders.
Non-Diversified Investment Company Risk: The Fund is non-diversified for purposes of the 1940 Act. This means that the Fund may invest a greater percentage of its assets in the securities of a single company or other issuer than a diversified fund. Investing in a non-diversified fund involves greater risk than investing in a diversified fund because a loss
| | | | |
PGIM Wadhwani Systematic Absolute Return Fund | | | 61 | |
Notes to Financial Statements (continued)
resulting from the decline in value of any one security may represent a greater portion of the total assets of a non-diversified fund.
Short Position Risk: The Fund’s short sales of a security or short positions in derivative instruments are subject to special risks. If the price of the security or derivative increases, then the Fund will incur a loss equal to the increase in price from the time that the short sale was entered into plus any transaction costs (i.e., premiums and interest) paid to the broker-dealer to borrow securities. Therefore, short sales involve the risk that losses may be exaggerated, potentially losing more money than the actual cost of the investment. By contrast, a loss on a long position arises from decreases in the value of the security and is limited by the fact that a security’s value cannot decrease below zero. By investing the proceeds received from selling securities short, the Fund could be deemed to be employing a form of leverage, which creates special risks. In times of unusual or adverse market, economic, regulatory or political conditions, the Fund may not be able, fully or partially, to implement its short selling strategy. Also, there is the risk that the third party to the short sale will not fulfill its contractual obligations, causing a loss to the Fund.
Sovereign Debt Risk: The Fund may invest in sovereign debt issued by governments, their agencies or instrumentalities, or other government-related entities. Holders of sovereign debt may be requested to participate in the rescheduling of such debt and to extend further loans to governmental entities. In addition, there is no bankruptcy proceeding by which defaulted sovereign debt may be collected.
Swaps Risk: Swap agreements involve the risk that the party with which the Fund has entered into the swap will default on its obligation to pay the Fund and the risk that the Fund will not be able to meet its obligations to pay the other party to the agreement.
U.S. Government and Agency Securities Risk: U.S. Government and agency securities are subject to market risk, interest rate risk and credit risk. Not all U.S. Government securities are insured or guaranteed by the full faith and credit of the U.S. Government; some are only insured or guaranteed by the issuing agency, which must rely on its own resources to repay the debt. The maximum potential liability of the issuers of some U.S. Government securities held by the Fund may greatly exceed their current resources, including their legal right to support from the U.S. Treasury. No assurance can be given that the U.S. government would provide financial support to any such issuers if it is not obligated to do so by law. It is possible that these issuers will not have the funds to meet their payment obligations in the future. In addition, the value of U.S. Government securities may be affected by changes in the credit rating of the U.S. Government.
10. Recent Accounting Pronouncement and Regulatory Developments
In March 2020, the FASB issued Accounting Standard Update (“ASU”) No. 2020-04, which provides optional guidance for applying GAAP to contract modifications, hedging relationships and other transactions affected by the reference rate reform if certain criteria are met. ASU 2020-04 is elective and is effective on March 12, 2020 through December 31, 2022. At this time, management is evaluating the implications of certain provisions of the ASU and any impact on the financial statement disclosures has not yet been determined.
On December 3, 2020, the SEC announced that it voted to adopt a new rule that establishes an updated regulatory framework for fund valuation practices (the “Rule”). The Rule, in part, provides (i) a framework for determining fair value in good faith and (ii) provides for a fund Board’s assignment of its responsibility for the execution of valuation-related activities to a fund’s investment adviser. Further, the SEC is rescinding previously issued guidance on related issues. The Rule took effect on March 8, 2021, with a compliance date of September 8, 2022. Management is currently evaluating the Rule and its impact to the Fund.
| | | | |
PGIM Wadhwani Systematic Absolute Return Fund | | | 63 | |
Report of Independent Registered Public Accounting Firm
To the Board of Trustees of Prudential Investment Portfolios 3 and Shareholders of PGIM Wadhwani Systematic Absolute Return Fund
Opinion on the Financial Statements
We have audited the accompanying statement of assets and liabilities, including the schedule of investments, of PGIM Wadhwani Systematic Absolute Return Fund (one of the funds constituting Prudential Investment Portfolios 3, referred to hereafter as the “Fund”) as of October 31, 2021, and the related statements of operations and changes in net assets, including the related notes, and the financial highlights for the period September 28, 2021 (commencement of operations) through October 31, 2021 (collectively referred to as the “financial statements”). In our opinion, the financial statements present fairly, in all material respects, the financial position of the Fund as of October 31, 2021, and the results of its operations, changes in its net assets, and the financial highlights for the period September 28, 2021 (commencement of operations) through October 31, 2021 in conformity with accounting principles generally accepted in the United States of America.
Basis for Opinion
These financial statements are the responsibility of the Fund’s management. Our responsibility is to express an opinion on the Fund’s financial statements based on our audit. We are a public accounting firm registered with the Public Company Accounting Oversight Board (United States) (PCAOB) and are required to be independent with respect to the Fund in accordance with the U.S. federal securities laws and the applicable rules and regulations of the Securities and Exchange Commission and the PCAOB.
We conducted our audit of these financial statements in accordance with the standards of the PCAOB. Those standards require that we plan and perform the audit to obtain reasonable assurance about whether the financial statements are free of material misstatement, whether due to error or fraud.
Our audit included performing procedures to assess the risks of material misstatement of the financial statements, whether due to error or fraud, and performing procedures that respond to those risks. Such procedures included examining, on a test basis, evidence regarding the amounts and disclosures in the financial statements. Our audit also included evaluating the accounting principles used and significant estimates made by management, as well as evaluating the overall presentation of the financial statements. Our procedures included confirmation of securities owned as of October 31, 2021 by correspondence with the transfer agent and brokers; when replies were not received from brokers, we performed other auditing procedures. We believe that our audit provides a reasonable basis for our opinion.
/s/PricewaterhouseCoopers LLP
New York, New York
December 16, 2021
We have served as the auditor of one or more investment companies in the PGIM Retail Funds complex since 2020.
INFORMATION ABOUT BOARD MEMBERS AND OFFICERS (unaudited)
Information about Board Members and Officers of the Fund is set forth below. Board Members who are not deemed to be “interested persons” of the Fund, as defined in the 1940 Act, are referred to as “Independent Board Members.” Board Members who are deemed to be “interested persons” of the Fund are referred to as “Interested Board Members.” The Board Members are responsible for the overall supervision of the operations of the Fund and perform the various duties imposed on the directors of investment companies by the 1940 Act. The Board in turn elects the Officers, who are responsible for administering the day-to-day operations of the Fund.
| | | | | | |
| Independent Board Members |
| | | | |
Name Year of Birth Position(s) Portfolios Overseen | | Principal Occupation(s) During Past Five Years | | Other Directorships Held During Past Five Years | | Length of
Board Service |
| | | | |
Ellen S. Alberding 1958 Board Member Portfolios Overseen: 95 | | President and Board Member, The Joyce Foundation (charitable foundation) (since 2002); formerly Vice Chair, City Colleges of Chicago (community college system) (2011-2015); Trustee, National Park Foundation (charitable foundation for national park system) (2009-2018); Trustee, Economic Club of Chicago (2009-2016); Trustee, Loyola University (since 2018). | | None. | | Since September 2013 |
| | | | |
Kevin J. Bannon 1952 Board Member Portfolios Overseen: 95 | | Retired; formerly Managing Director (April 2008-May 2015) and Chief Investment Officer (October 2008-November 2013) of Highmount Capital LLC (registered investment adviser); formerly Executive Vice President and Chief Investment Officer (April 1993-August 2007) of Bank of New York Company; President (May 2003-May 2007) of BNY Hamilton Family of Mutual Funds. | | Director of Urstadt Biddle Properties (equity real estate investment trust) (since September 2008). | | Since July 2008 |
PGIM Wadhwani Systematic Absolute Return Fund
| | | | | | |
| Independent Board Members |
| | | | |
Name Year of Birth Position(s) Portfolios Overseen | | Principal Occupation(s) During Past Five Years | | Other Directorships Held During Past Five Years | | Length of
Board Service |
| | | | |
Linda W. Bynoe 1952 Board Member Portfolios Overseen: 92 | | President and Chief Executive Officer (since March 1995) and formerly Chief Operating Officer (December 1989-February 1995) of Telemat Limited LLC (formerly Telemat Ltd) (management consulting); formerly Vice President (January 1985-June 1989) at Morgan Stanley & Co. (broker-dealer). | | Trustee of Equity Residential (residential real estate) (since December 2009); Director of Northern Trust Corporation (financial services) (since April 2006); formerly Director of Anixter International, Inc. (communication products distributor) (January 2006-June 2020). | | Since March 2005 |
| | | | |
Barry H. Evans 1960 Board Member Portfolios Overseen: 94 | | Retired; formerly President (2005-2016), Global Chief Operating Officer (2014-2016), Chief Investment Officer - Global Head of Fixed Income (1998-2014), and various portfolio manager roles (1986-2006), Manulife Asset Management (asset management). | | Formerly Director, Manulife Trust Company (2011-2018); formerly Director, Manulife Asset Management Limited (2015-2017); formerly Chairman of the Board of Directors of Manulife Asset Management U.S. (2005-2016); formerly Chairman of the Board, Declaration Investment Management and Research (2008-2016). | | Since September 2017 |
| | | | |
Keith F. Hartstein 1956 Board Member & Independent Chair Portfolios Overseen: 95 | | Retired; Executive Committee of the Independent Directors Council (IDC) Board of Governors (since October 2019); Member (since November 2014) of the Governing Council of the IDC (organization of independent mutual fund directors); formerly President and Chief Executive Officer (2005-2012), Senior Vice President (2004-2005), Senior Vice President of Sales and Marketing (1997-2004), and various executive management positions (1990-1997), John Hancock Funds, LLC (asset management); Chairman, Investment Company Institute’s Sales Force Marketing Committee (2003-2008). | | None. | | Since September 2013 |
Visit our website at pgim.com/investments
| | | | | | |
| Independent Board Members |
| | | | |
Name Year of Birth Position(s) Portfolios Overseen | | Principal Occupation(s) During Past Five Years | | Other Directorships Held During Past Five Years | | Length of
Board Service |
| | | | |
Laurie Simon Hodrick 1962 Board Member Portfolios Overseen: 91 | | A. Barton Hepburn Professor Emerita of Economics in the Faculty of Business, Columbia Business School (since 2018); Visiting Fellow at the Hoover Institution, Stanford University (since 2015); Sole Member, ReidCourt LLC (since 2008) (a consulting firm); formerly Visiting Professor of Law, Stanford Law School (2015-2021); formerly A. Barton Hepburn Professor of Economics in the Faculty of Business, Columbia Business School (1996-2017); formerly Managing Director, Global Head of Alternative Investment Strategies, Deutsche Bank (2006-2008). | | Independent Director, Roku (since December 2020) (communication services); formerly Independent Director, Synnex Corporation (2019-2021) (information technology); formerly Independent Director, Kabbage, Inc. (2018-2020) (financial services); formerly Independent Director, Corporate Capital Trust (2017-2018) (a business development company). | | Since September 2017 |
| | | | |
Brian K. Reid 1961 Board Member Portfolios Overseen: 94 | | Retired; formerly Chief Economist for the Investment Company Institute (ICI) (2005-2017); formerly Senior Economist and Director of Industry and Financial Analysis at the ICI (1998-2004); formerly Senior Economist, Industry and Financial Analysis at the ICI (1996-1998); formerly Staff Economist at the Federal Reserve Board (1989-1996); Director, ICI Mutual Insurance Company (2012-2017). | | None. | | Since March 2018 |
PGIM Wadhwani Systematic Absolute Return Fund
| | | | | | |
| Independent Board Members |
| | | | |
Name Year of Birth Position(s) Portfolios Overseen | | Principal Occupation(s) During Past Five Years | | Other Directorships Held During Past Five Years | | Length of
Board Service |
| | | | |
Grace C. Torres 1959 Board Member Portfolios Overseen: 94 | | Retired; formerly Treasurer and Principal Financial and Accounting Officer of the PGIM Funds, Target Funds, Advanced Series Trust, Prudential Variable Contract Accounts and The Prudential Series Fund (1998-June 2014); Assistant Treasurer (March 1999-June 2014) and Senior Vice President (September 1999-June 2014) of PGIM Investments LLC; Assistant Treasurer (May 2003-June 2014) and Vice President (June 2005-June 2014) of AST Investment Services, Inc.; Senior Vice President and Assistant Treasurer (May 2003-June 2014) of Prudential Annuities Advisory Services, Inc. | | Director (since January 2018) of OceanFirst Financial Corp. and OceanFirst Bank; formerly Director (July 2015-January 2018) of Sun Bancorp, Inc. N.A. and Sun National Bank. | | Since November 2014 |
| | | | | | |
| Interested Board Members |
| | | | |
Name Year of Birth Position(s) Portfolios Overseen | | Principal Occupation(s) During Past Five Years | | Other Directorships Held During Past Five Years | | Length of
Board Service |
| | | | |
Stuart S. Parker 1962 Board Member & President Portfolios Overseen: 94 | | President, Chief Executive Officer, Chief Operating Officer and Officer in Charge of PGIM Investments LLC (formerly known as Prudential Investments LLC) (since January 2012); formerly Executive Vice President of Jennison Associates LLC and Head of Retail Distribution of PGIM Investments LLC (June 2005-December 2011); Investment Company Institute - Board of Governors (since May 2012). | | None. | | Since January 2012 |
Visit our website at pgim.com/investments
| | | | | | |
| Interested Board Members |
| | | | |
Name Year of Birth Position(s) Portfolios Overseen | | Principal Occupation(s) During Past Five Years | | Other Directorships Held During Past Five Years | | Length of
Board Service |
| | | | |
Scott E. Benjamin 1973 Board Member & Vice President Portfolios Overseen: 95 | | Executive Vice President (since May 2009) of PGIM Investments LLC; Vice President (since June 2012) of Prudential Investment Management Services LLC; Executive Vice President (since September 2009) of AST Investment Services, Inc.; Senior Vice President of Product Development and Marketing, PGIM Investments (since February 2006); formerly Vice President of Product Development and Product Management, PGIM Investments LLC (2003-2006). | | None. | | Since March 2010 |
(1) The year that each Board Member joined the Board is as follows:
Ellen S. Alberding, 2013; Kevin J. Bannon, 2008; Linda W. Bynoe, 2005; Barry H. Evans, 2017; Keith F. Hartstein, 2013; Laurie Simon Hodrick, 2017; Michael S. Hyland, 2008; Richard A. Redeker, 1993; Stephen G. Stoneburn, 2003; Stuart S. Parker, Board Member since 2012 and President since 2012; Scott E. Benjamin, Board Member since 2010 and Vice President since 2009; Grace C. Torres, 2014.
| | | | |
| Fund Officers(a) | | | | |
| | | |
Name Year of Birth Fund Position | | Principal Occupation(s) During Past Five Years | | Length of
Service as Fund
Officer |
| | | |
Claudia DiGiacomo 1974 Chief Legal Officer | | Chief Legal Officer, Executive Vice President and Secretary of PGIM Investments LLC (since August 2020); Chief Legal Officer of Prudential Mutual Fund Services LLC (since August 2020); Chief Legal Officer of PIFM Holdco, LLC (since August 2020); Vice President and Corporate Counsel (since January 2005) of Prudential; and Corporate Counsel of AST Investment Services, Inc. (since August 2020); formerly Vice President and Assistant Secretary of PGIM Investments LLC (2005-2020); formerly Associate at Sidley Austin Brown & Wood LLP (1999-2004). | | Since December 2005 |
PGIM Wadhwani Systematic Absolute Return Fund
| | | | |
| Fund Officers(a) | | | | |
| | | |
Name Year of Birth Fund Position | | Principal Occupation(s) During Past Five Years | | Length of Service as Fund Officer |
| | | |
Dino Capasso 1974 Chief Compliance Officer | | Chief Compliance Officer (since July 2019) of PGIM Investments LLC; Chief Compliance Officer (since July 2019) of the PGIM Funds, Target Funds, Advanced Series Trust, The Prudential Series Fund, Prudential’s Gibraltar Fund, Inc., PGIM Global High Yield Fund, Inc., PGIM High Yield Bond Fund, Inc., and PGIM Short Duration High Yield Opportunities Fund; Vice President and Deputy Chief Compliance Officer (June 2017-2019) of PGIM Investments LLC; formerly Senior Vice President and Senior Counsel (January 2016-June 2017), and Vice President and Counsel (February 2012-December 2015) of Pacific Investment Management Company LLC. | | Since July 2019 |
| | | |
Andrew R. French 1962 Secretary | | Vice President (since December 2018) of PGIM Investments LLC; formerly Vice President and Corporate Counsel (2010-2018) of Prudential; formerly Director and Corporate Counsel (2006-2010) of Prudential; Vice President and Assistant Secretary (since January 2007) of PGIM Investments LLC; Vice President and Assistant Secretary (since January 2007) of Prudential Mutual Fund Services LLC. | | Since October 2006 |
| | | |
Diana N. Huffman 1982 Assistant Secretary | | Vice President and Corporate Counsel (since September 2015) of Prudential; Vice President and Assistant Secretary (since August 2020) of PGIM Investments LLC; formerly Associate at Willkie Farr & Gallagher LLP (2009-2015). | | Since March 2019 |
| | | |
Melissa Gonzalez 1980 Assistant Secretary | | Vice President and Corporate Counsel (since September 2018) of Prudential; Vice President and Assistant Secretary (since August 2020) of PGIM Investments LLC; formerly Director and Corporate Counsel (March 2014-September 2018) of Prudential. | | Since March 2020 |
| | | |
Patrick E. McGuinness 1986 Assistant Secretary | | Vice President and Assistant Secretary (since August 2020) of PGIM Investments LLC; Director and Corporate Counsel (since February 2017) of Prudential; and Corporate Counsel (2012-2017) of IIL, Inc. | | Since June 2020 |
| | | |
Debra Rubano 1975 Assistant Secretary | | Vice President and Corporate Counsel (since November 2020) of Prudential; formerly Director and Senior Counsel of Allianz Global Investors U.S. Holdings LLC (2010-2020) and Assistant Secretary of numerous funds in the Allianz fund complex (2015-2020). | | Since December 2020 |
| | | |
Kelly A. Coyne 1968 Assistant Secretary | | Director, Investment Operations of Prudential Mutual Fund Services LLC (since 2010). | | Since March 2015 |
Visit our website at pgim.com/investments
| | | | |
| Fund Officers(a) | | | | |
| | | |
Name Year of Birth Fund Position | | Principal Occupation(s) During Past Five Years | | Length of Service as Fund Officer |
| | | |
Christian J. Kelly 1975 Treasurer and Principal Financial and Accounting Officer | | Vice President, Head of Fund Administration of PGIM Investments LLC (since November 2018); formerly Director of Fund Administration of Lord Abbett & Co. LLC (2009-2018), Treasurer and Principal Accounting Officer of the Lord Abbett Family of Funds (2017-2018); Director of Accounting, Avenue Capital Group (2008-2009); Senior Manager, Investment Management Practice of Deloitte & Touche LLP (1998-2007). | | Since January 2019 |
| | | |
Lana Lomuti 1967 Assistant Treasurer | | Vice President (since 2007) and Director (2005-2007), within PGIM Investments Fund Administration; formerly Assistant Treasurer (December 2007-February 2014) of The Greater China Fund, Inc. | | Since April 2014 |
| | | |
Russ Shupak 1973 Assistant Treasurer | | Vice President (since 2017) and Director (2013-2017), within PGIM Investments Fund Administration. | | Since September 2019 |
| | | |
Deborah Conway 1969 Assistant Treasurer | | Vice President (since 2017) and Director (2007-2017), within PGIM Investments Fund Administration. | | Since September 2019 |
| | | |
Elyse M. McLaughlin 1974 Assistant Treasurer | | Vice President (since 2017) and Director (2011-2017), within PGIM Investments Fund Administration. | | Since September 2019 |
| | | |
Jonathan Corbett 1983 Anti-Money Laundering Compliance Officer | | Vice President, Corporate Compliance, Global Compliance Programs and Compliance Risk Management (since August 2019) of Prudential; formerly Vice President and Head of Key Risk Areas Compliance (March 2016 to July 2019), Chief Privacy Officer (March 2016 to July 2019) and Head of Global Financial Crimes Unit (April 2014 to March 2016) at MetLife. | | Since October 2021 |
(a) Excludes Mr. Parker and Mr. Benjamin, interested Board Members who also serve as President and Vice President, respectively.
Explanatory Notes to Tables:
| ∎ | | Board Members are deemed to be “Interested,” as defined in the 1940 Act, by reason of their affiliation with PGIM Investments LLC and/or an affiliate of PGIM Investments LLC. |
| ∎ | | Unless otherwise noted, the address of all Board Members and Officers is c/o PGIM Investments LLC, 655 Broad Street, Newark, New Jersey 07102-4410. |
| ∎ | | There is no set term of office for Board Members or Officers. The Board Members have adopted a retirement policy, which calls for the retirement of Board Members on December 31 of the year in which they reach the age of 75. |
| ∎ | | “Other Directorships Held” includes all directorships of companies required to register or file reports with the SEC under the 1934 Act (that is, “public companies”) or other investment companies registered under the 1940 Act. |
| ∎ | | “Portfolios Overseen” includes all investment companies managed by PGIM Investments LLC. The investment companies for which PGIM Investments LLC serves as manager include the PGIM Funds, Target Funds, The Prudential Variable Contract Accounts, PGIM ETF Trust, PGIM High Yield Bond Fund, Inc., PGIM Global High Yield Fund, Inc., PGIM Short Duration High Yield Opportunities Fund, The Prudential Series Fund, Prudential’s Gibraltar Fund, Inc. and the Advanced Series Trust. |
| ∎ | | As used in the Fund Officers table “Prudential” means The Prudential Insurance Company of America. |
PGIM Wadhwani Systematic Absolute Return Fund
Approval of Advisory Agreements (unaudited)
Initial Approval of the Fund’s Management and Subadvisory Agreements
As required by the Investment Company Act of 1940 (the 1940 Act), the Board of Prudential Investment Portfolios 3 considered the proposed management agreement with PGIM Investments LLC (the Manager) and the proposed subadvisory agreement between the Manager and QMA Wadhwani LLP (QMAW or the Subadviser) with respect to the Fund prior to the Fund’s commencement of operations. The Board, including a majority of the Independent Trustees, met on September 15, 2020 (the Meeting), and approved the agreements for an initial two year period, after concluding that approval of the agreements was in the best interests of the Fund.
In advance of the Meeting, the Board requested and received materials relating to the agreements, and had the opportunity to ask questions and request further information in connection with its considerations.
In approving the agreements, the Board, including the Independent Trustees advised by independent legal counsel, considered the factors it deemed relevant, including the nature, quality and extent of services to be provided to the Fund by the Manager and the Subadviser; any relevant comparable performance and the Subadviser’s qualifications and track record in serving other funds; and the fees proposed to be paid by the Fund to the Manager and by the Manager to the Subadviser under the agreements. In connection with its deliberations, the Board considered information provided by the Manager and the Subadviser at or in advance of the Meeting. The Board also considered information provided by the Manager with respect to other funds managed by the Manager, which information had been provided throughout the year at regular Board meetings. In their deliberations, the Trustees did not identify any single factor which alone was responsible for the Board’s decision to approve the agreements with respect to the Fund.
The Trustees determined that the overall arrangements between the Fund and the Manager, which will serve as the Fund’s investment manager pursuant to a management agreement, and between the Manager and the Subadviser, which will serve as the Fund’s subadviser pursuant to the terms of a subadvisory agreement, were in the best interests of the Fund in light of the services to be performed and the fees to be charged under the agreements and such other matters as the Trustees considered relevant in the exercise of their business judgment.
Certain factors and conclusions that formed the basis for the Trustees’ reaching their determinations to approve the agreements are separately discussed below.
Nature, Quality and Extent of Services
With respect to the Manager, the Board noted that it had received and considered information about the Manager at the June 9-11, 2020 meetings in connection with the renewal of the management agreements between the Manager and the other PGIM Retail Funds, and that the Manager provided a representation that there were no material changes to such information. The Board also noted that it received and
PGIM Wadhwani Systematic Absolute Return Fund
Approval of Advisory Agreements (continued)
considered information at other regular meetings throughout the year regarding the nature, quality and extent of services provided by the Manager to the other PGIM Retail Funds. The Board considered the services to be provided by the Manager, including but not limited to the oversight of the Subadviser, as well as the provision of fund recordkeeping, compliance and other services to the Fund. With respect to the Manager’s oversight of the Subadviser, the Board noted that the Manager’s Strategic Investment Research Group, which is a business unit of the Manager, is responsible for monitoring and reporting to the Manager’s senior management on the performance and operations of the Subadviser. The Board also noted that the Manager pays the salaries of all the officers and interested Trustees of the Fund who are part of Fund management. The Board reviewed the qualifications, backgrounds and responsibilities of the Manager’s senior management responsible for the oversight of the Fund and the Subadviser, and was also provided with information pertaining to the Manager’s organizational structure, senior management, investment operations and other relevant information pertaining to the Manager. The Board noted that it received favorable compliance reports from the Fund’s Chief Compliance Officer with respect to the Manager. The Board noted that it had concluded that it was satisfied with the nature, quality and extent of the services provided by the Manager to the other PGIM Retail Funds and determined that it was reasonable to conclude that the nature, quality and extent of services to be provided by the Manager under the management agreement for the Fund would be similar in nature to those provided under the other management agreements.
With respect to the Subadviser, the Board noted that it had received and considered information about the Subadviser regarding the nature, quality and extent of services to be provided by the Subadviser. The Board considered, among other things, the qualifications, background and experience of the Subadviser’s portfolio managers who will be responsible for the day-to-day management of the Fund’s portfolio, as well as information on the Subadviser’s organizational structure, senior management, investment operations and other relevant information pertaining to the Subadviser. The Board further noted that it received favorable compliance reports from the Fund’s Chief Compliance Officer with respect to the Subadviser. The Board noted that the Subadviser is affiliated with the Manager. The Board determined that it was reasonable to conclude that the nature, quality and extent of services to be provided by the Subadviser under the subadvisory agreement for the Fund would be appropriate for the Fund.
Performance
Because the Fund had not yet commenced operations, no investment performance for the Fund existed for Board review. The Board did consider the Subadviser’s track record in managing a non-U.S. fund that follows investment strategies similar to the Fund. The Board considered the background and professional experience of the proposed portfolio management team for the Fund. The Board noted that the Manager will provide
Visit our website at pgim.com/investments
Approval of Advisory Agreements (unaudited)
information relating to performance to the Board in connection with future annual reviews of the management agreement and subadvisory agreement.
Fee Rates
The Board considered the proposal that the Fund will pay PGIM Investments at the rate of 1.05% of the average daily net assets of the Fund up to and including $1 billion; 1.03% of the average daily net assets of the Fund from $1 billion up to and including $3 billion; 1.01% of the average daily net assets of the Fund from $3 billion up to and including $5 billion; 1.00% of the average daily net assets of the Fund from $5 billion up to and including $10 billion; and 0.99% of the average daily net assets of the Fund over $10 billion. The Board also took note of the Fund’s other expenses, which will include fees for custodian services, Independent Trustees’ fees, and fees for legal, accounting, valuation, and transfer agency services.
The Board considered the management fee for the Fund as compared to the management fee charged by the Manager. The Board considered information comparing the Fund’s proposed management fee rate and net expense ratio relative to its Lipper Peer Group. The Board noted that the Manager has contractually agreed, through February 28, 2022, to limit Total Annual Fund Operating Expenses after fee waivers and/or expense reimbursements to 1.40% of average daily net assets for Class A shares, 2.15% of average daily net assets for Class C shares, 1.15% of average daily net assets for Class Z shares and 1.10% of average daily net assets for Class R6 shares, subject to certain exclusions.
The Board also considered information about the proposed subadvisory fees and that the subadvisory fees will be paid to the Subadviser by the Manager and not by the Fund. Under the proposed Subadvisory Agreement, the Manager will be responsible for paying QMAW a monthly fee at the annual rate of 0.625% of the Fund’s average daily net assets.
Profitability
Because the Fund had not yet commenced operations and the actual asset base of the Fund has not yet been determined, the Board noted that there was no historical profitability information with respect to the Fund to be reviewed. The Board noted that the Subadviser was affiliated with the Manager and, as a result, its profitability will be reflected in the Manager’s profitability report. The Board noted that it would review profitability information in connection with the annual renewal of the management and subadvisory agreements.
Economies of Scale
The Board noted that the proposed fee payable by the Fund to the Manager contained breakpoints that would reduce the fee rates on assets above specified levels. The Board noted that the proposed subadvisory fee payable by the Manager to the Subadviser with respect to the Fund did not include breakpoints. The Board considered the potential for the Manager and the Subadviser to experience economies of scale as the amount of
PGIM Wadhwani Systematic Absolute Return Fund
Approval of Advisory Agreements (continued)
assets managed by the Manager and the Subadviser, respectively, increased in size. Because the Fund had not yet commenced operations and the actual asset base of the Fund has not yet been determined, the Board noted that there was no historical information regarding economies of scale with respect to the Fund to be reviewed. The Board noted that it would review such information in connection with the annual renewals of the management and subadvisory agreements.
Other Benefits to the Manager and the Subadviser
The Board considered potential “fall-out” or ancillary benefits that might be received by the Manager, the Subadviser and their affiliates as a result of their relationships with the Fund. The Board concluded that any potential benefits to be derived by the Manager were similar to benefits derived by the Manager in connection with its management of the other PGIM Retail Funds (e.g., including transfer agency fees to be received by the Fund’s transfer agent (which is affiliated with PGIM Investments), and benefits to its reputation as well as other intangible benefits resulting from PGIM Investments’ association with the Fund), which are reviewed on an annual basis. The Board also concluded that any potential benefits to be derived by the Subadviser (e.g., the potential benefits consistent with those generally resulting from an increase in assets under management and benefits to its reputation) were consistent with those generally derived by subadvisers to the PGIM Retail Funds, and that those benefits are reviewed on an annual basis. The Board concluded that any potential benefits that may be derived by the Manager and the Subadviser were consistent with the types of benefits generally derived by investment managers and subadvisers to mutual funds.
***
After consideration of these factors, the Board concluded that the approval of the agreements was in the best interests of the Fund.
Visit our website at pgim.com/investments
| | | | |
| | | |
| ∎ MAIL | | ∎ TELEPHONE | | ∎ WEBSITE |
| | | |
655 Broad Street
Newark, NJ 07102 | | (800) 225-1852 | | pgim.com/investments |
|
| PROXY VOTING |
| The Board of Trustees of the Fund has delegated to the Fund’s subadviser the responsibility for voting any proxies and maintaining proxy recordkeeping with respect to the Fund. A description of these proxy voting policies and procedures is available without charge, upon request, by calling (800) 225-1852 or by visiting the Securities and Exchange Commission’s website at sec.gov. Information regarding how the Fund voted proxies relating to portfolio securities during the most recent 12-month period ended June 30 is available on the Fund’s website and on the Securities and Exchange Commission’s website. |
|
| TRUSTEES |
| Ellen S. Alberding • Kevin J. Bannon • Scott E. Benjamin • Linda W. Bynoe • Barry H. Evans • Keith F. Hartstein • Laurie Simon Hodrick • Stuart S. Parker • Brian K. Reid • Grace C. Torres |
|
| OFFICERS |
| Stuart S. Parker, President • Scott E. Benjamin, Vice President • Christian J. Kelly, Treasurer and Principal Financial and Accounting Officer • Claudia DiGiacomo, Chief Legal Officer • Dino Capasso, Chief Compliance Officer • Jonathan Corbett, Anti-Money Laundering Compliance Officer • Andrew R. French, Secretary • Melissa Gonzalez, Assistant Secretary • Diana N. Huffman, Assistant Secretary • Kelly A. Coyne, Assistant Secretary • Patrick E. McGuinness, Assistant Secretary • Debra Rubano, Assistant Secretary • Lana Lomuti, Assistant Treasurer • Russ Shupak, Assistant Treasurer • Elyse M. McLaughlin, Assistant Treasurer • Deborah Conway, Assistant Treasurer |
| | | | |
| MANAGER | | PGIM Investments LLC | | 655 Broad Street Newark, NJ 07102 |
|
| SUBADVISER | | PGIM Wadhwani LLP | | 5 Upper St. Martin’s Lane Orion House, 9th Floor London WC2H 9EA |
|
| DISTRIBUTOR | | Prudential Investment Management Services LLC | | 655 Broad Street Newark, NJ 07102 |
|
| CUSTODIAN | | The Bank of New York Mellon | | 240 Greenwich Street New York, NY 10286 |
|
| TRANSFER AGENT | | Prudential Mutual Fund Services LLC | | PO Box 9658 Providence, RI 02940 |
|
| INDEPENDENT REGISTERED PUBLIC ACCOUNTING FIRM | | PricewaterhouseCoopers LLP | | 300 Madison Avenue New York, NY 10017 |
|
| FUND COUNSEL | | Willkie Farr & Gallagher LLP | | 787 Seventh Avenue New York, NY 10019 |
|
| | |
| An investor should consider the investment objectives, risks, charges, and expenses of the Fund carefully before investing. The prospectus and summary prospectus contain this and other information about the Fund. An investor may obtain the prospectus and summary prospectus by visiting our website at pgim.com/investments or by calling (800) 225-1852. The prospectus and summary prospectus should be read carefully before investing. |
| | |
| E-DELIVERY |
| To receive your mutual fund documents online, go to pgim.com/investments/resource/edelivery and enroll. Instead of receiving printed documents by mail, you will receive notification via email when new materials are available. You can cancel your enrollment or change your email address at any time by visiting the website address above. |
| | |
| SHAREHOLDER COMMUNICATIONS WITH TRUSTEES |
| Shareholders can communicate directly with the Board of Trustees by writing to the Chair of the Board, PGIM Wadhwani Systematic Absolute Return Fund, PGIM Investments, Attn: Board of Trustees, 655 Broad Street, Newark, NJ 07102. Shareholders can communicate directly with an individual Trustee by writing to that Trustee at the same address. Communications are not screened before being delivered to the addressee. |
| | |
| AVAILABILITY OF PORTFOLIO HOLDINGS |
| The Fund files its complete schedule of portfolio holdings with the Securities and Exchange Commission for the first and third quarters of each fiscal year as an exhibit to its reports on Form N-PORT. The Fund’s Form N-PORT filings are available on the Commission’s website at sec.gov. |
| | |
| The Fund’s Statement of Additional Information contains additional information about the Fund’s Trustees and is available without charge, upon request, by calling (800) 225-1852. |
Mutual Funds:
| | | | |
| ARE NOT INSURED BY THE FDIC OR ANY FEDERAL GOVERNMENT AGENCY | | MAY LOSE VALUE | | ARE NOT A DEPOSIT OF OR GUARANTEED BY ANY BANK OR ANY BANK AFFILIATE |

PGIM WADHWANI SYSTEMATIC ABSOLUTE RETURN FUND
| | | | | | | | | | | | |
| | | | | | |
| SHARE CLASS | | | | A | | | | C | | Z | | R6 |
| | | | | | |
| NASDAQ | | | | PGAEX | | | | PGAFX | | PGAGX | | PGAHX |
| | | | | | |
| CUSIP | | | | 74440K512 | | | | 74440K496 | | 74440K488 | | 74440K470 |
MF245E
Item 2 – Code of Ethics — See Exhibit (a)
As of the end of the period covered by this report, the registrant has adopted a code of ethics (the “Section 406 Standards for Investment Companies – Ethical Standards for Principal Executive and Financial Officers”) that applies to the registrant’s Principal Executive Officer and Principal Financial Officer; the registrant’s Principal Financial Officer also serves as the Principal Accounting Officer.
The registrant hereby undertakes to provide any person, without charge, upon request, a copy of the code of ethics. To request a copy of the code of ethics, contact the registrant 800-225-1852, and ask for a copy of the Section 406 Standards for Investment Companies - Ethical Standards for Principal Executive and Financial Officers.
Item 3 – Audit Committee Financial Expert –
The registrant’s Board has determined that Ms. Grace C. Torres, member of the Board’s Audit Committee is an “audit committee financial expert,” and that she is “independent,” for purposes of this item.
Item 4 – Principal Accountant Fees and Services –
(a) Audit Fees
For the fiscal year ended October 31, 2021 and October 31, 2020, PricewaterhouseCoopers LLP (“PwC”), the Registrant’s principal accountant, billed the Registrant $167,400 and $114,400 respectively, for professional services rendered for the audit of the Registrant’s annual financial statements or services that are normally provided in connection with statutory and regulatory filings.
(b) Audit-Related Fees
For the fiscal years ended October 31, 2021 and October 31, 2020, PwC did not bill the Registrant for audit-related services.
For the fiscal year ended October 31, 2020, fees of $5,103 were billed to the Registrant for services rendered by KPMG LLP (the Registrant’s prior principal accountant) in connection with the auditor transition.
(c) Tax Fees
For the fiscal years ended October 31, 2021 and October 31, 2020: none.
(d) All Other Fees
For the fiscal years ended October 31, 2021 and October 31, 2020: none.
(e) (1) Audit Committee Pre-Approval Policies and Procedures
THE PGIM MUTUAL FUNDS
AUDIT COMMITTEE POLICY
on
Pre-Approval of Services Provided by the Independent
Accountants
The Audit Committee of each PGIM Mutual Fund is charged with the responsibility to monitor the independence of the Fund’s independent accountants. As part of this responsibility, the Audit Committee must pre-approve the independent accounting firm’s engagement to render audit and/or permissible non-audit services, as required by law. In evaluating a proposed engagement of the independent accountants, the Audit Committee will assess the effect that the engagement might reasonably be expected to have on the accountant’s independence. The Committee’s evaluation will be based on:
| | • | | a review of the nature of the professional services expected to be provided, |
| | • | | a review of the safeguards put into place by the accounting firm to safeguard independence, and |
| | • | | periodic meetings with the accounting firm. |
Policy for Audit and Non-Audit Services Provided to the Funds
On an annual basis, the scope of audits for each Fund, audit fees and expenses, and audit-related and non-audit services (and fees proposed in respect thereof) proposed to be performed by the Fund’s independent accountants will be presented by the Treasurer and the independent accountants to the Audit Committee for review and, as appropriate, approval prior to the initiation of such services.
Such presentation shall be accompanied by confirmation by both the Treasurer and the independent accountants that the proposed
non-audit services will not adversely affect the independence of the independent accountants. Such proposed non-audit services shall be described in sufficient detail to enable the Audit Committee to assess the appropriateness of such services and fees, and the compatibility of the provision of such services with the auditor’s independence. The Committee shall receive periodic reports on the progress of the audit and other services which are approved by the Committee or by the Committee Chair pursuant to authority delegated in this Policy.
The categories of services enumerated under “Audit Services”, “Audit-related Services”, and “Tax Services” are intended to provide guidance to the Treasurer and the independent accountants as to those categories of services which the Committee believes are generally consistent with the independence of the independent accountants and which the Committee (or the Committee Chair) would expect upon the presentation of specific proposals to pre-approve. The enumerated categories are not intended as an exclusive list of audit, audit-related or tax services, which the Committee (or the Committee Chair) would consider for pre-approval.
Audit Services
The following categories of audit services are considered to be consistent with the role of the Fund’s independent accountants:
| | • | | Annual Fund financial statement audits |
| | • | | Seed audits (related to new product filings, as required) |
| | • | | SEC and regulatory filings and consents |
Audit-related Services
The following categories of audit-related services are considered to be consistent with the role of the Fund’s independent accountants:
| | • | | Accounting consultations |
| | • | | Fund merger support services |
| | • | | Agreed Upon Procedure Reports |
| | • | | Other Internal Control Reports |
Individual audit-related services that fall within one of these categories (except for fund merger support services) and are not presented to the Audit Committee as part of the annual pre-approval process are subject to an authorized pre-approval by the Audit Committee so long as the estimated fee for those services does not exceed $30,000. Any services provided under such pre-approval will be reported to the Audit Committee at its next regular meeting. Should the amount of such services exceed $30,000 any additional fees will be subject to pre-approval by the Committee Chair (or any other Committee member on whom this responsibility has been delegated). Fees related to fund merger support services are subject to a separate authorized pre-approval by the Audit Committee with fees determined on a per occurrence and merger complexity basis.
Tax Services
The following categories of tax services are considered to be consistent with the role of the Fund’s independent accountants:
| | • | | Tax compliance services related to the filing or amendment of the following: |
| | • | | Federal, state and local income tax compliance; and, |
| | • | | Sales and use tax compliance |
| | • | | Timely RIC qualification reviews |
| | • | | Tax distribution analysis and planning |
| | • | | Tax authority examination services |
| | • | | Tax appeals support services |
| | • | | Accounting methods studies |
| | • | | Fund merger support services |
| | • | | Tax consulting services and related projects |
Individual tax services that fall within one of these categories and are not presented to the Audit Committee as part of the annual pre-approval process are subject to an authorized pre-approval by the Audit Committee so long as the estimated fee for those services does not exceed $30,000. Any services provided under such pre-approval will be reported to the Audit Committee at its next regular meeting. Should the amount of such services exceed $30,000 any additional fees will be subject to pre-approval by the Committee Chair (or any other Committee member on whom this responsibility has been delegated).
Other Non-Audit Services
Certain non-audit services that the independent accountants are legally permitted to render will be subject to pre-approval by the Committee or by one or more Committee members to whom the Committee has delegated this authority and who will report to the full Committee any pre-approval decisions made pursuant to this Policy. Non-audit services presented for pre-approval pursuant to this paragraph will be accompanied by a confirmation from both the Treasurer and the independent accountants that the proposed services will not adversely affect the independence of the independent accountants.
Proscribed Services
The Fund’s independent accountants will not render services in the following categories of non-audit services:
| | • | | Bookkeeping or other services related to the accounting records or financial statements of the Fund |
| | • | | Financial information systems design and implementation |
| | • | | Appraisal or valuation services, fairness opinions, or contribution-in-kind reports |
| | • | | Internal audit outsourcing services |
| | • | | Management functions or human resources |
| | • | | Broker or dealer, investment adviser, or investment banking services |
| | • | | Legal services and expert services unrelated to the audit |
| | • | | Any other service that the Public Company Accounting Oversight Board determines, by regulation, is impermissible. |
Pre-approval of Non-Audit Services Provided to Other Entities Within the PGIM Fund Complex
Certain non-audit services provided to PGIM Investments LLC or any of its affiliates that also provide ongoing services to the PGIM Mutual Funds will be subject to pre-approval by the Audit Committee. The only non-audit services provided to these entities that will require pre-approval are those related directly to the operations and financial reporting of the Funds. Individual projects that are not presented to the Audit Committee as part of the annual pre-approval process will be subject to pre-approval by the Committee Chair (or any other Committee member on whom this responsibility has been delegated) so long as the estimated fee for those services does not exceed $30,000. Services presented for pre-approval pursuant to this
paragraph will be accompanied by a confirmation from both the Treasurer and the independent accountants that the proposed services will not adversely affect the independence of the independent accountants.
Although the Audit Committee will not pre-approve all services provided to PGIM Investments LLC and its affiliates, the Committee will receive an annual report from the Fund’s independent accounting firm showing the aggregate fees for all services provided to PGIM Investments and its affiliates.
(e) (2) Percentage of services referred to in 4(b) – 4(d) that were approved by the audit committee –
For the fiscal years ended October 31, 2021 and October 31, 2020, 100% of the services referred to in Item 4(b) was approved by the audit committee.
(f) Percentage of hours expended attributable to work performed by other than full time employees of principal accountant if greater than 50%.
The percentage of hours expended on the principal accountant’s engagement to audit the registrant’s financial statements for the most recent fiscal year that were attributed to work performed by persons other than the principal accountant’s full-time, permanent employees was 0%.
(g) Non-Audit Fees
The aggregate non-audit fees billed by the Registrant’s principal accountant for services rendered to the registrant’s investment adviser and any entity controlling, controlled by, or under common control with the investment adviser that provides ongoing services to the registrant for the fiscal years ended October 31, 2021 and October 31, 2020 was $0 and $0, respectively.
(h) Principal Accountant’s Independence
Not applicable as the Registrant’s principal accountant has not provided non-audit services to the registrant’s investment adviser and any entity controlling, controlled by, or under common control with the investment adviser that provides ongoing services to the registrant that were not pre-approved pursuant to Rule 2-01(c)(7)(ii) of Regulation S-X.
Item 5 – Audit Committee of Listed Registrants – Not applicable.
| | |
Item 6 – | | Schedule of Investments – The schedule is included as part of the report to shareholders filed under Item 1 of this Form. |
| | |
| Item 7 – | | Disclosure of Proxy Voting Policies and Procedures for Closed-End Management Investment Companies – Not applicable. |
Item 8 – Portfolio Managers of Closed-End Management Investment Companies – Not applicable.
| | |
| Item 9 – | | Purchases of Equity Securities by Closed-End Management Investment Company and Affiliated Purchasers – Not applicable. |
Item 10 – Submission of Matters to a Vote of Security Holders – There have been no material changes to these procedures.
Item 11 – Controls and Procedures
| | (a) | It is the conclusion of the registrant’s principal executive officer and principal financial officer that the effectiveness of the registrant’s current disclosure controls and procedures (such disclosure controls and procedures having been evaluated within 90 days of the date of this filing) provide reasonable assurance that the information required to be disclosed by the registrant has been recorded, processed, summarized and reported within the time period specified in the Commission’s rules and forms and that the information required to be disclosed by the registrant has been accumulated and communicated to the registrant’s principal executive officer and principal financial officer in order to allow timely decisions regarding required |
| | (b) | There has been no significant change in the registrant’s internal control over financial reporting that occurred during the registrant’s most recent fiscal quarter of the period covered by this report that has materially affected, or is likely to materially affect, the registrant’s internal control over financial reporting. |
Item 12 – Controls and Procedures - Disclosure of Securities Lending Activities for Closed-End Management Investment Companies – Not applicable.
Item 13 – Exhibits
(2) Certifications pursuant to Section 302 of the Sarbanes-Oxley Act – Attached hereto as Exhibit EX-99.CERT.
(3) Any written solicitation to purchase securities under Rule 23c-1 – Not applicable.
SIGNATURES
Pursuant to the requirements of the Securities Exchange Act of 1934 and the Investment Company Act of 1940, the registrant has duly caused this report to be signed on its behalf by the undersigned, thereunto duly authorized.
| | |
Registrant: | | Prudential Investment Portfolios 3 |
| |
By: | | /s/ Andrew R. French |
| | Andrew R. French |
| | Secretary |
| |
Date: | | December 17, 2021 |
Pursuant to the requirements of the Securities Exchange Act of 1934 and the Investment Company Act of 1940, this report has been signed below by the following persons on behalf of the registrant and in the capacities and on the dates indicated.
| | |
By: | | /s/ Stuart S. Parker |
| | Stuart S. Parker |
| | President and Principal Executive Officer |
| |
Date: | | December 17, 2021 |
| |
By: | | /s/ Christian J. Kelly |
| | Christian J. Kelly |
| | Treasurer and Principal Financial and Accounting Officer |
| |
Date: | | December 17, 2021 |