UNITED STATES
SECURITIES AND EXCHANGE COMMISSION
Washington, D.C. 20549
FORM N-CSR
CERTIFIED SHAREHOLDER REPORT OF REGISTERED MANAGEMENT INVESTMENT
COMPANIES
| | |
| Investment Company Act file number: | | 811-09805 |
| |
| Exact name of registrant as specified in charter: | | Prudential Investment Portfolios 3 |
|
| (This Form N-CSR relates solely to the Registrant’s PGIM Jennison Focused Growth Fund, PGIM Quant Solutions Large-Cap Value Fund and PGIM Strategic Bond Fund) |
| |
| Address of principal executive offices: | | 655 Broad Street, 17th Floor |
| | Newark, New Jersey 07102 |
| |
| Name and address of agent for service: | | Andrew R. French |
| | 655 Broad Street, 17th Floor |
| | Newark, New Jersey 07102 |
| |
| Registrant’s telephone number, including area code: | | 800-225-1852 |
| |
| Date of fiscal year end: | | 2/28/2022 |
| |
| Date of reporting period: | | 2/28/2022 |
Item 1 – Reports to Stockholders

PGIM JENNISON FOCUSED GROWTH FUND
ANNUAL REPORT
FEBRUARY 28, 2022

|
|
To enroll in e-delivery, go to pgim.com/investments/resource/edelivery |
Table of Contents
This report is not authorized for distribution to prospective investors unless preceded or accompanied by a current prospectus.
The views expressed in this report and information about the Fund’s portfolio holdings are for the period covered by this report and are subject to change thereafter.
Mutual funds are distributed by Prudential Investment Management Services LLC, member SIPC. Jennison Associates LLC is a registered investment adviser. Both are Prudential Financial companies. © 2022 Prudential Financial, Inc. and its related entities. Jennison Associates, Jennison, PGIM, and the PGIM logo are service marks of Prudential Financial, Inc. and its related entities, registered in many jurisdictions worldwide.
| | |
| 2 | | Visit our website at pgim.com/investments |
Letter from the President
| | |
 | | Dear Shareholder: We hope you find the annual report for the PGIM Jennison Focused Growth Fund informative and useful. The report covers performance for the 12-month period that ended February 28, 2022. The global economy and markets continued to recover throughout the period from the ongoing impact of the COVID-19 pandemic. The Federal Reserve (the Fed) kept interest rates near zero to promote borrowing, while the approval of effective vaccines encouraged states to reopen their economies. Yet inflation surged to a 40-year high near the end of the period, prompting the Fed to signal it would begin raising rates to combat rising consumer prices. |
Stocks rallied for much of the period, with ongoing stimulus programs helping boost the job market and corporate profits. Equity markets rose to record levels but became much more volatile later on as investors worried that supply-chain challenges, the emergence of more contagious variants, and geopolitical uncertainty in Europe relating to Russia’s invasion of Ukraine might stall the recovery. For the period, large-cap US equities and stocks in developed foreign markets rose. Emerging market and small-cap US stocks fell.
Fixed income investors turned cautious during the period. Investment-grade bonds in the US and the overall global bond market, along with emerging market debt, posted negative returns for the period. US high yield corporate bonds posted a small gain.
Regarding your investments with PGIM, we believe it is important to maintain a diversified portfolio of funds consistent with your tolerance for risk, time horizon, and financial goals. Your financial advisor can help you create a diversified investment plan that may include funds covering all the basic asset classes and that reflects your personal investor profile and risk tolerance. However, diversification and asset allocation strategies do not assure a profit or protect against loss in declining markets.
At PGIM Investments, we provide access to active investment strategies across the global markets in the pursuit of consistent outperformance for investors. PGIM is a top-10 investment manager globally with more than $1.5 trillion in assets under management. Our scale and investment expertise allow us to deliver a diversified suite of actively managed solutions across a broad spectrum of asset classes and investment styles.
Thank you for choosing our family of funds.
Sincerely,

Stuart S. Parker, President
PGIM Jennison Focused Growth Fund
April 15, 2022
PGIM Jennison Focused Growth Fund 3
Your Fund’s Performance (unaudited)
Performance data quoted represent past performance. Past performance does not guarantee future results. The investment return and principal value of an investment will fluctuate so that an investor’s shares, when redeemed, may be worth more or less than their original cost. Current performance may be lower or higher than the past performance data quoted. An investor may obtain performance data as of the most recent month-end by visiting our website at pgim.com/investments or by calling (800) 225-1852.
| | | | | | | | | | | | | | |
| |
| | | Average Annual Total Returns as of 2/28/22 | |
| | | One Year (%) | | Five Years (%) | | | Ten Years (%) | | | Since Inception (%) | |
| Class A | | | | | | | | | | | | | | |
| (with sales charges) | | -17.32 | | | 18.44 | | | | 14.99 | | | | — | |
| (without sales charges) | | -12.51 | | | 19.79 | | | | 15.64 | | | | — | |
| Class C | | | | | | | | | | | | | | |
| (with sales charges) | | -13.98 | | | 18.89 | | | | 14.77 | | | | — | |
| (without sales charges) | | -13.27 | | | 18.89 | | | | 14.77 | | | | — | |
| Class Z | | | | | | | | | | | | | | |
| (without sales charges) | | -12.27 | | | 20.16 | | | | 15.96 | | | | — | |
| Class R6 | | | | | | | | | | | | | | |
| (without sales charges) | | -12.19 | | | 20.23 | | | | N/A | | | | 15.89 (05/03/2012) | |
| Russell 1000® Growth Index | | | | | | | | | | | | | | |
| | 12.55 | | | 20.24 | | | | 16.97 | | | | — | |
| S&P 500 Index | |
| | | 16.38 | | | 15.17 | | | | 14.58 | | | | — | |
| | | | | | | | | | | | | | |
|
| Average Annual Total Returns as of 2/28/22 Since Inception (%) | |
| | | | | | | | | | | Class R6
(05/03/2012) | |
| Russell 1000® Growth Index | | | | | | | | 16.92 | |
| S&P 500 Index | | | | | | | | 14.54 | |
Since Inception returns are provided for any share class with less than 10 fiscal years of returns. Since Inception returns for the Indexes are measured from the closest month-end to the class’ inception date.
| | |
| 4 | | Visit our website at pgim.com/investments |
Growth of a $10,000 Investment (unaudited)
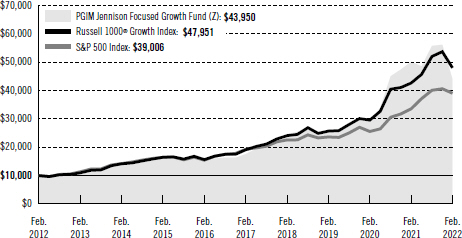
The graph compares a $10,000 investment in the Fund’s Class Z shares with a similar investment in the Russell 1000 Growth Index and the S&P 500 Index by portraying the initial account values at the beginning of the 10-year period for Class Z shares (February 29, 2012) and the account values at the end of the current fiscal year (February 28, 2022), as measured on a quarterly basis. For purposes of the graph, and unless otherwise indicated, it has been assumed that (a) all recurring fees (including management fees) were deducted and (b) all dividends and distributions were reinvested. The line graph provides information for Class Z shares only. As indicated in the tables provided earlier, performance for other share classes will vary due to the differing charges and expenses applicable to each share class (as indicated in the following paragraphs). Without waiver of fees and/or expense reimbursements, if any, the returns would have been lower.
Past performance does not predict future performance. Total returns and the ending account values in the graph include changes in share price and reinvestment of dividends and capital gains distributions in a hypothetical investment for the periods shown. The Fund’s total returns do not reflect the deduction of income taxes on an individual’s investment. Taxes may reduce your actual investment returns on income or gains paid by the Fund or any gains you may realize if you sell your shares.
| | | | |
PGIM Jennison Focused Growth Fund | | | 5 | |
Your Fund’s Performance (continued)
The returns in the tables do not reflect the deduction of taxes that a shareholder would pay on Fund distributions or following the redemption of Fund shares. The average annual total returns take into account applicable sales charges, which are described for each share class in the table below.
| | | | | | | | |
| | | | | |
| | | Class A | | Class C | | Class Z | | Class R6 |
| Maximum initial sales charge | | 5.50% of the public offering price | | None | | None | | None |
| Contingent deferred sales charge (CDSC) (as a percentage of the lower of the original purchase price or the net asset value at redemption) | | 1.00% on sales of $1 million or more made within 12 months of purchase | | 1.00% on sales made within 12 months of purchase | | None | | None |
| Annual distribution and service (12b-1) fees (shown as a percentage of average daily net assets) | | 0.30% (0.25% currently) | | 1.00% | | None | | None |
Benchmark Definitions
Russell 1000 Growth Index—The Russell 1000 Growth Index is an unmanaged index which contains those securities in the Russell 1000 Index with an above-average growth orientation. Companies in this Index tend to exhibit higher price-to-book ratios and price-to-earnings ratios, lower dividend yields, and higher forecasted growth rates.
S&P 500 Index*—The S&P 500 Index is an unmanaged index of over 500 stocks of large US public companies. It gives a broad look at how stock prices in the United States have performed.
*The S&P 500 Index (“Index”) is a product of S&P Dow Jones Indices LLC and/or its affiliates and has been licensed for use by PGIM, Inc. and/or its affiliates. Copyright © 2022 S&P Dow Jones Indices LLC, a division of S&P Global, Inc., and/or its affiliates. All rights reserved. Redistribution or reproduction in whole or in part are prohibited without written permission of S&P Dow Jones Indices LLC. For more information on any of S&P Dow Jones Indices LLC’s indices please visit www.spdji.com. S&P® is a registered trademark of S&P Global and Dow Jones® is a registered trademark of Dow Jones Trademark Holdings LLC.
Investors cannot invest directly in an index. The returns for the Indexes would be lower if they included the effects of sales charges, operating expenses of a mutual fund, or taxes that may be paid by an investor.
| | |
| 6 | | Visit our website at pgim.com/investments |
Presentation of Fund Holdings as of 2/28/22
| | | | |
| | |
| Ten Largest Holdings | | Line of Business | | % of Net Assets |
| Amazon.com, Inc. | | Internet & Direct Marketing Retail | | 9.3% |
| Microsoft Corp. | | Software | | 9.0% |
| Tesla, Inc. | | Automobiles | | 7.3% |
| Apple, Inc. | | Technology Hardware, Storage & Peripherals | | 6.2% |
| NVIDIA Corp. | | Semiconductors & Semiconductor Equipment | | 5.3% |
| LVMH Moet Hennessy Louis Vuitton SE (France) | | Textiles, Apparel & Luxury Goods | | 5.0% |
| Alphabet, Inc. (Class A Stock) | | Interactive Media & Services | | 4.0% |
| Alphabet, Inc. (Class C Stock) | | Interactive Media & Services | | 4.0% |
| Costco Wholesale Corp. | | Food & Staples Retailing | | 3.9% |
| MercadoLibre, Inc. (Brazil) | | Internet & Direct Marketing Retail | | 3.5% |
Holdings reflect only long-term investments and are subject to change.
| | | | |
PGIM Jennison Focused Growth Fund | | | 7 | |
Strategy and Performance Overview* (unaudited)
How did the Fund perform?
The PGIM Jennison Focused Growth Fund’s Class Z shares returned -12.27% in the 12-month reporting period that ended February 28, 2022, underperforming the 12.55% return of the Russell 1000 Growth Index (the Index).
What were the market conditions?
| • | | The US economy exhibited robust growth in 2021, as policymakers continued to support growth through monetary and fiscal stimulus to combat the effects of the COVID-19 pandemic. Corporate earnings remained strong, continuing their recovery from pandemic lows in 2020. |
| • | | Against this backdrop, US equity markets closed out 2021 at all-time highs. However, persistently high inflation spurred the Federal Reserve to pivot to a tightening stance late in the year, leading to a spike in Treasury yields and a general repricing of risk. These developments weighed heavily on high-valuation, high-growth stocks. |
| • | | The weakness in growth stocks spilled into the overall market in the first two months of 2022, accelerating toward the end of February, as Russia’s invasion of Ukraine led to a spike in energy and other commodity prices and introduced new risks for the global economy. |
What worked?
| • | | A number of the Fund’s top holdings in the information technology and communications services sectors provided significant positive contributions to the Fund’s returns over the reporting period. Digitization of the economy accelerated, with consumers continuing to shift toward e-commerce and streaming entertainment. Enterprises also migrated a growing share of their business functions to the cloud. Leading beneficiaries of these trends were well represented in Jennison’s portfolios, and Jennison expects them to continue to be a source of strong performance in the future. Strong performers during the period included: |
| • | | Nvidia Corp., the industry leader in advanced graphics chips, was the top contributor to the Fund’s returns. The company benefited from strong secular growth across a number of its business lines, including datacenter, automotive, and gaming. The company’s results repeatedly exceeded consensus estimates during the period. |
| • | | Microsoft Corp. and Alphabet Inc. were the strongest performers among the Fund’s mega-cap technology holdings, gaining ground on impressive growth and profitability from their diversified portfolios of consumer and enterprise businesses. |
| • | | In the consumer space, luxury goods giant LVMH Moet Hennessy Louis Vuitton and wholesale retailer Costco Wholesale Corp. were also among the top contributors to performance as the strength of their respective franchises and loyal customer bases supported revenue and margin growth during a challenging period. |
| | |
| 8 | | Visit our website at pgim.com/investments |
What didn’t work?
| • | | A meaningful correction in the stock prices of many of the Fund’s high-growth holdings that had less-visible, short-term profitability drove most of the underperformance during the reporting period. Many of these companies made the strategic decision to reinvest cash flows into building their franchises rather than report current profits. While Jennison believes these companies will prove profitable over the long term, the uncertainty associated with those future profits led to significant valuation compression late in 2021 and early 2022 as interest rate expectations rose. |
| • | | The Fund’s performance also lagged due to holdings that reported results below expectations or struggled with executing their business plans in the difficult operating environment created by the pandemic. For some technology and e-commerce companies, this disappointment resulted partly from the complexity of comparing recent financial results to the elevated growth rates that they reported earlier in the pandemic. Jennison believes this comparison issue will become less material in the second half of 2022. |
| • | | It is worth noting that the Fund’s underperformance over the period was the largest in the strategy’s history. To put this period in context, the previous period provided the largest outperformance in the strategy’s history. These significant swings reflect, in large part, the effects of the pandemic. Jennison remains confident that strong secular growth patterns of the Fund’s holdings will drive share prices higher over time and lead to strong returns for long-term investors. |
Current outlook
The current economic and geopolitical backdrop is creating significant uncertainty with respect to the path of inflation and interest rates. Moreover, the ongoing crisis in Ukraine is contributing to elevated risk aversion and may have a dampening effect on global growth, raising the risk of recession in certain regions. Jennison would not be surprised to see continued pressure on high-valuation, high-growth stocks in the near term, as investors reprice risk and seek clarity regarding the post-pandemic growth rates of companies that have benefited disproportionately from recent consumer and technological trends. That said, Jennison believes the challenging comparisons in financial results that many growth stocks currently face will ease over the course of 2022, and that the market will once again assign an appropriate valuation premium to the durable, secular growth opportunities represented in the Fund.
* This strategy and performance overview, which discusses what strategies or holdings (including derivatives, if applicable) affected the Fund’s performance, is compiled based on how the Fund performed relative to the Fund’s assigned index and is viewed for performance attribution purposes at the aggregate Fund level, which in most instances will not directly correlate to the amounts disclosed in the Statement of Operations which conform to U.S. generally accepted accounting principles.
| | | | |
PGIM Jennison Focused Growth Fund | | | 9 | |
Fees and Expenses (unaudited)
As a shareholder of the Fund, you incur two types of costs: (1) transaction costs, including sales charges (loads) on purchase payments and redemptions, as applicable, and (2) ongoing costs, including management fees, distribution and/or service (12b-1) fees, and other Fund expenses, as applicable. This example is intended to help you understand your ongoing costs (in dollars) of investing in the Fund and to compare these costs with the ongoing costs of investing in other mutual funds.
The example is based on an investment of $1,000 held through the six-month period ended February 28, 2022. The example is for illustrative purposes only; you should consult the Prospectus for information on initial and subsequent minimum investment requirements.
Actual Expenses
The first line for each share class in the table on the following page provides information about actual account values and actual expenses. You may use the information on this line, together with the amount you invested, to estimate the expenses that you paid over the period. Simply divide your account value by $1,000 (for example, an $8,600 account value ÷ $1,000 = 8.6), then multiply the result by the number on the first line under the heading “Expenses Paid During the Six-Month Period” to estimate the expenses you paid on your account during this period.
Hypothetical Example for Comparison Purposes
The second line for each share class in the table on the following page provides information about hypothetical account values and hypothetical expenses based on the Fund’s actual expense ratio and an assumed rate of return of 5% per year before expenses, which is not the Fund’s actual return. The hypothetical account values and expenses may not be used to estimate the actual ending account balance or expenses you paid for the period. You may use this information to compare the ongoing costs of investing in the Fund and other funds. To do so, compare this 5% hypothetical example with the 5% hypothetical examples that appear in the shareholder reports of the other funds.
The Fund’s transfer agent may charge additional fees to holders of certain accounts that are not included in the expenses shown in the table on the following page. These fees apply to individual retirement accounts (IRAs) and Section 403(b) accounts. As of the close of the six-month period covered by the table, IRA fees included an annual maintenance fee of $15 per account (subject to a maximum annual maintenance fee of $25 for all accounts held by the same shareholder). Section 403(b) accounts are charged an annual $25 fiduciary maintenance fee. Some of the fees may vary in amount, or may be waived, based on your total account balance or the number of PGIM funds, including the Fund, that you own. You should consider the additional fees that were charged to your Fund account over the six-month period when you estimate the total ongoing expenses paid over the period and the impact of these fees on your ending account value, as these additional expenses are not reflected in the information
| | |
| 10 | | Visit our website at pgim.com/investments |
provided in the expense table. Additional fees have the effect of reducing investment returns.
Please note that the expenses shown in the table are meant to highlight your ongoing costs only and do not reflect any transactional costs such as sales charges (loads). Therefore, the second line for each share class in the table is useful in comparing ongoing costs only and will not help you determine the relative total costs of owning different funds. In addition, if these transactional costs were included, your costs would have been higher.
| | | | | | | | | | |
| | | | |
PGIM Jennison Focused Growth Fund | | Beginning
Account Value
September 1, 2021 | | Ending
Account Value
February 28, 2022 | | Annualized
Expense
Ratio Based on
the
Six-Month Period | | Expenses Paid
During the
Six-Month
Period* |
| Class A | | Actual | | $1,000.00 | | $ 788.20 | | 1.06% | | $4.70 |
| | Hypothetical | | $1,000.00 | | $1,019.54 | | 1.06% | | $5.31 |
| Class C | | Actual | | $1,000.00 | | $ 784.40 | | 1.80% | | $7.96 |
| | Hypothetical | | $1,000.00 | | $1,015.87 | | 1.80% | | $9.00 |
| Class Z | | Actual | | $1,000.00 | | $ 789.10 | | 0.75% | | $3.33 |
| | Hypothetical | | $1,000.00 | | $1,021.08 | | 0.75% | | $3.76 |
| Class R6 | | Actual | | $1,000.00 | | $ 789.60 | | 0.67% | | $2.97 |
| | | Hypothetical | | $1,000.00 | | $1,021.47 | | 0.67% | | $3.36 |
*Fund expenses (net of fee waivers or subsidies, if any) for each share class are equal to the annualized expense ratio for each share class (provided in the table), multiplied by the average account value over the period, multiplied by the 181 days in the six-month period ended February 28, 2022, and divided by the 365 days in the Fund’s fiscal year ended February 28, 2022 (to reflect the six-month period). Expenses presented in the table include the expenses of any underlying portfolios in which the Fund may invest.
| | | | |
PGIM Jennison Focused Growth Fund | | | 11 | |
Schedule of Investments
as of February 28, 2022
| | | | | | | | |
| | |
| Description | | Shares | | | Value | |
| | |
LONG-TERM INVESTMENTS 97.9% | | | | | | | | |
| | |
COMMON STOCKS | | | | | | | | |
| | |
Automobiles 7.3% | | | | | | | | |
Tesla, Inc.* | | | 153,655 | | | $ | 133,745,922 | |
| | |
Entertainment 2.5% | | | | | | | | |
Netflix, Inc.* | | | 71,322 | | | | 28,137,955 | |
ROBLOX Corp. (Class A Stock)*(a) | | | 190,220 | | | | 9,809,645 | |
Sea Ltd. (Taiwan), ADR* | | | 53,511 | | | | 7,791,202 | |
| | | | | | | | |
| | |
| | | | | | | 45,738,802 | |
| | |
Food & Staples Retailing 3.9% | | | | | | | | |
Costco Wholesale Corp. | | | 136,846 | | | | 71,057,285 | |
| | |
Health Care Equipment & Supplies 2.1% | | | | | | | | |
Align Technology, Inc.* | | | 76,922 | | | | 39,342,526 | |
| | |
Health Care Providers & Services 2.0% | | | | | | | | |
UnitedHealth Group, Inc. | | | 77,877 | | | | 37,059,328 | |
| | |
Hotels, Restaurants & Leisure 2.8% | | | | | | | | |
Airbnb, Inc. (Class A Stock)* | | | 341,525 | | | | 51,737,622 | |
| | |
Interactive Media & Services 13.1% | | | | | | | | |
Alphabet, Inc. (Class A Stock)* | | | 27,217 | | | | 73,516,928 | |
Alphabet, Inc. (Class C Stock)* | | | 27,248 | | | | 73,510,199 | |
Match Group, Inc.*(a) | | | 325,106 | | | | 36,246,068 | |
Snap, Inc. (Class A Stock)*(a) | | | 715,717 | | | | 28,585,737 | |
ZoomInfo Technologies, Inc.* | | | 523,910 | | | | 28,652,638 | |
| | | | | | | | |
| | |
| | | | | | | 240,511,570 | |
| | |
Internet & Direct Marketing Retail 12.8% | | | | | | | | |
Amazon.com, Inc.* | | | 55,259 | | | | 169,714,756 | |
MercadoLibre, Inc. (Brazil)* | | | 57,384 | | | | 64,651,684 | |
| | | | | | | | |
| | |
| | | | | | | 234,366,440 | |
| | |
IT Services 8.8% | | | | | | | | |
Adyen NV (Netherlands), 144A* | | | 27,773 | | | | 57,016,948 | |
Mastercard, Inc. (Class A Stock) | | | 143,179 | | | | 51,661,847 | |
Shopify, Inc. (Canada) (Class A Stock)* | | | 47,176 | | | | 32,752,410 | |
Snowflake, Inc. (Class A Stock)* | | | 77,989 | | | | 20,718,558 | |
| | | | | | | | |
| | |
| | | | | | | 162,149,763 | |
See Notes to Financial Statements.
PGIM Jennison Focused Growth Fund 13
Schedule of Investments (continued)
as of February 28, 2022
| | | | | | | | |
| | |
Description | | Shares | | | Value | |
| | |
COMMON STOCKS (Continued) | | | | | | | | |
| | |
Personal Products 3.0% | | | | | | | | |
Estee Lauder Cos., Inc. (The) (Class A Stock) | | | 185,876 | | | $ | 55,080,635 | |
| | |
Pharmaceuticals 2.1% | | | | | | | | |
Eli Lilly & Co. | | | 157,211 | | | | 39,294,889 | |
| | |
Semiconductors & Semiconductor Equipment 5.3% | | | | | | | | |
NVIDIA Corp. | | | 401,739 | | | | 97,964,055 | |
| | |
Software 15.0% | | | | | | | | |
Atlassian Corp. PLC (Class A Stock)* | | | 110,822 | | | | 33,880,502 | |
HubSpot, Inc.* | | | 53,648 | | | | 28,165,200 | |
Microsoft Corp. | | | 554,409 | | | | 165,651,865 | |
salesforce.com, Inc.* | | | 223,054 | | | | 46,959,559 | |
| | | | | | | | |
| | |
| | | | | | | 274,657,126 | |
| | |
Technology Hardware, Storage & Peripherals 6.2% | | | | | | | | |
Apple, Inc. | | | 689,109 | | | | 113,785,678 | |
| | |
Textiles, Apparel & Luxury Goods 11.0% | | | | | | | | |
Lululemon Athletica, Inc.* | | | 173,736 | | | | 55,585,096 | |
LVMH Moet Hennessy Louis Vuitton SE (France) | | | 123,847 | | | | 91,107,011 | |
NIKE, Inc. (Class B Stock) | | | 402,249 | | | | 54,927,101 | |
| | | | | | | | |
| | |
| | | | | | | 201,619,208 | |
| | | | | | | | |
| | |
TOTAL LONG-TERM INVESTMENTS
(cost $1,348,921,392) | | | | | | | 1,798,110,849 | |
| | | | | | | | |
| | |
SHORT-TERM INVESTMENTS 2.4% | | | | | | | | |
| | |
AFFILIATED MUTUAL FUND 0.7% | | | | | | | | |
PGIM Institutional Money Market Fund
(cost $13,334,208; includes $13,333,598 of cash collateral for securities on loan)(b)(wa) | | | 13,344,100 | | | | 13,333,425 | |
| | | | | | | | |
See Notes to Financial Statements.
14
| | | | | | | | |
| | |
| Description | | Shares | | | Value | |
| | |
UNAFFILIATED FUND 1.7% | | | | | | | | |
Dreyfus Government Cash Management (Institutional Shares)
(cost $30,066,674) | | | 30,066,674 | | | $ | 30,066,674 | |
| | | | | | | | |
| | |
TOTAL SHORT-TERM INVESTMENTS
(cost $43,400,882) | | | | | | | 43,400,099 | |
| | | | | | | | |
| | |
TOTAL INVESTMENTS 100.3%
(cost $1,392,322,274) | | | | | | | 1,841,510,948 | |
Liabilities in excess of other assets (0.3)% | | | | | | | (5,723,696 | ) |
| | | | | | | | |
| | |
NET ASSETS 100.0% | | | | | | $ | 1,835,787,252 | |
| | | | | | | | |
Below is a list of the abbreviation(s) used in the annual report:
| | 144A—Security was purchased pursuant to Rule 144A under the Securities Act of 1933 and, pursuant to the requirements of Rule 144A, may not be resold except to qualified institutional buyers. |
ADR—American Depositary Receipt
LIBOR—London Interbank Offered Rate
| * | Non-income producing security. |
| (a) | All or a portion of security is on loan. The aggregate market value of such securities, including those sold and pending settlement, is $13,335,118; cash collateral of $13,333,598 (included in liabilities) was received with which the Fund purchased highly liquid short-term investments. In the event of significant appreciation in value of securities on loan on the last business day of the reporting period, the Fund may reflect a collateral value that is less than the market value of the loaned securities and such shortfall is remedied the following business day. |
| (b) | Represents security, or portion thereof, purchased with cash collateral received for securities on loan and includes dividend reinvestment. |
| (wa) | PGIM Investments LLC, the manager of the Fund, also serves as manager of the PGIM Core Ultra Short Bond Fund and PGIM Institutional Money Market Fund, if applicable. |
Fair Value Measurements:
Various inputs are used in determining the value of the Fund’s investments. These inputs are summarized in the three broad levels listed below.
Level 1—unadjusted quoted prices generally in active markets for identical securities.
Level 2—quoted prices for similar securities, interest rates and yield curves, prepayment speeds, foreign currency exchange rates and other observable inputs.
Level 3—unobservable inputs for securities valued in accordance with Board approved fair valuation procedures.
The following is a summary of the inputs used as of February 28, 2022 in valuing such portfolio securities:
See Notes to Financial Statements.
PGIM Jennison Focused Growth Fund 15
Schedule of Investments (continued)
as of February 28, 2022
| | | | | | | | | | | | |
| | | Level 1 | | | Level 2 | | | Level 3 | |
Investments in Securities | | | | | | | | | | | | |
Assets | | | | | | | | | | | | |
Long-Term Investments | | | | | | | | | | | | |
Common Stocks | | | | | | | | | | | | |
Automobiles | | $ | 133,745,922 | | | $ | — | | | $ | — | |
Entertainment | | | 45,738,802 | | | | — | | | | — | |
Food & Staples Retailing | | | 71,057,285 | | | | — | | | | — | |
Health Care Equipment & Supplies | | | 39,342,526 | | | | — | | | | — | |
Health Care Providers & Services | | | 37,059,328 | | | | — | | | | — | |
Hotels, Restaurants & Leisure | | | 51,737,622 | | | | — | | | | — | |
Interactive Media & Services | | | 240,511,570 | | | | — | | | | — | |
Internet & Direct Marketing Retail | | | 234,366,440 | | | | — | | | | — | |
IT Services | | | 105,132,815 | | | | 57,016,948 | | | | — | |
Personal Products | | | 55,080,635 | | | | — | | | | — | |
Pharmaceuticals | | | 39,294,889 | | | | — | | | | — | |
Semiconductors & Semiconductor Equipment | | | 97,964,055 | | | | — | | | | — | |
Software | | | 274,657,126 | | | | — | | | | — | |
Technology Hardware, Storage & Peripherals | | | 113,785,678 | | | | — | | | | — | |
Textiles, Apparel & Luxury Goods | | | 110,512,197 | | | | 91,107,011 | | | | — | |
Short-Term Investments | | | | | | | | | | | | |
Affiliated Mutual Fund | | | 13,333,425 | | | | — | | | | — | |
Unaffiliated Fund | | | 30,066,674 | | | | — | | | | — | |
| | | | | | | | | | | | |
| | | |
Total | | $ | 1,693,386,989 | | | $ | 148,123,959 | | | $ | — | |
| | | | | | | | | | | | |
Industry Classification:
The industry classification of investments and liabilities in excess of other assets shown as a percentage of net assets as of February 28, 2022 were as follows (unaudited):
| | | | |
Software | | | 15.0 | % |
Interactive Media & Services | | | 13.1 | |
Internet & Direct Marketing Retail | | | 12.8 | |
Textiles, Apparel & Luxury Goods | | | 11.0 | |
IT Services | | | 8.8 | |
Automobiles | | | 7.3 | |
Technology Hardware, Storage & Peripherals | | | 6.2 | |
Semiconductors & Semiconductor Equipment | | | 5.3 | |
Food & Staples Retailing | | | 3.9 | |
Personal Products | | | 3.0 | |
Hotels, Restaurants & Leisure | | | 2.8 | |
Entertainment | | | 2.5 | |
| | | | |
Health Care Equipment & Supplies | | | 2.1 | % |
Pharmaceuticals | | | 2.1 | |
Health Care Providers & Services | | | 2.0 | |
Unaffiliated Fund | | | 1.7 | |
Affiliated Mutual Fund (0.7% represents investments purchased with collateral from securities on loan) | | | 0.7 | |
| | | | |
| | | 100.3 | |
Liabilities in excess of other assets | | | (0.3 | ) |
| | | | |
| | | 100.0 | % |
| | | | |
Financial Instruments/Transactions—Summary of Offsetting and Netting Arrangements:
The Fund entered into financial instruments/transactions during the reporting period that are either offset in accordance with current requirements or are subject to enforceable master netting arrangements or similar agreements that permit
See Notes to Financial Statements.
16
offsetting. The information about offsetting and related netting arrangements for financial instruments/transactions where the legal right to set-off exists is presented in the summary below.
Offsetting of financial instrument/transaction assets and liabilities:
| | | | | | |
| Description | | Gross Market
Value of
Recognized
Assets/(Liabilities) | | Collateral Pledged/(Received)(1) | | Net
Amount |
Securities on Loan | | $13,335,118 | | $(13,333,598) | | $1,520 |
| (1) | Collateral amount disclosed by the Fund is limited to the market value of financial instruments/transactions. |
See Notes to Financial Statements.
PGIM Jennison Focused Growth Fund 17
Statement of Assets and Liabilities
as of February 28, 2022
| | | | |
| |
Assets | | | | |
| |
Investments at value, including securities on loan of $13,335,118: | | | | |
Unaffiliated investments (cost $1,378,988,066) | | $ | 1,828,177,523 | |
Affiliated investments (cost $13,334,208) | | | 13,333,425 | |
Receivable for investments sold | | | 10,625,052 | |
Receivable for Fund shares sold | | | 2,777,234 | |
Dividends receivable | | | 610,278 | |
Tax reclaim receivable | | | 173,213 | |
Prepaid expenses and other assets | | | 56,855 | |
| | | | |
| |
Total Assets | | | 1,855,753,580 | |
| | | | |
| |
Liabilities | | | | |
| |
Payable to broker for collateral for securities on loan | | | 13,333,598 | |
Payable for Fund shares purchased | | | 5,038,215 | |
Management fee payable | | | 638,639 | |
Accrued expenses and other liabilities | | | 596,805 | |
Distribution fee payable | | | 257,188 | |
Affiliated transfer agent fee payable | | | 93,679 | |
Trustees’ fees payable | | | 8,204 | |
| | | | |
| |
Total Liabilities | | | 19,966,328 | |
| | | | |
| |
Net Assets | | $ | 1,835,787,252 | |
| | | | |
| |
| | | | | |
| |
Net assets were comprised of: | | | | |
Shares of beneficial interest, at par | | $ | 96,838 | |
Paid-in capital in excess of par | | | 1,508,692,074 | |
Total distributable earnings (loss) | | | 326,998,340 | |
| | | | |
| |
Net assets, February 28, 2022 | | $ | 1,835,787,252 | |
| | | | |
See Notes to Financial Statements.
18
| | | | |
Class A | | | | |
| |
Net asset value and redemption price per share, ($1,078,255,962 ÷ 58,421,480 shares of beneficial interest issued and outstanding) | | | $18.46 | |
Maximum sales charge (5.50% of offering price) | | | 1.07 | |
| |
Maximum offering price to public | | | $19.53 | |
| |
Class C | | | | |
Net asset value, offering price and redemption price per share, | | | | |
($60,204,535 ÷ 4,632,419 shares of beneficial interest issued and outstanding) | | | $13.00 | |
| |
Class Z | | | | |
Net asset value, offering price and redemption price per share, ($538,779,898 ÷ 26,108,942 shares of beneficial interest issued and outstanding) | | | $20.64 | |
| |
Class R6 | | | | |
| |
Net asset value, offering price and redemption price per share, ($158,546,857 ÷ 7,674,906 shares of beneficial interest issued and outstanding) | | | $20.66 | |
See Notes to Financial Statements.
PGIM Jennison Focused Growth Fund 19
Statement of Operations
Year Ended February 28, 2022
| | | | |
Net Investment Income (Loss) | | | | |
Income | | | | |
Unaffiliated dividend income (net of $100,475 foreign withholding tax) | | $ | 2,731,041 | |
Income from securities lending, net (including affiliated income of $14,729) | | | 75,666 | |
Affiliated dividend income | | | 9,242 | |
| | | | |
| |
Total income | | | 2,815,949 | |
| | | | |
| |
Expenses | | | | |
Management fee | | | 9,836,659 | |
Distribution fee(a) | | | 2,567,385 | |
Transfer agent’s fees and expenses (including affiliated expense of $389,243)(a) | | | 1,624,906 | |
Shareholders’ reports | | | 168,077 | |
Custodian and accounting fees | | | 125,105 | |
Registration fees(a) | | | 97,590 | |
SEC registration fees | | | 76,873 | |
Legal fees and expenses | | | 34,252 | |
Audit fee | | | 28,907 | |
Trustees’ fees | | | 26,113 | |
Miscellaneous | | | 41,610 | |
| | | | |
Total expenses | | | 14,627,477 | |
Less: Fee waiver and/or expense reimbursement(a) | | | (707,440 | ) |
Distribution fee waiver(a) | | | (326,787 | ) |
| | | | |
| |
Net expenses | | | 13,593,250 | |
| | | | |
| |
Net investment income (loss) | | | (10,777,301 | ) |
| | | | |
| |
Realized And Unrealized Gain (Loss) On Investment And Foreign Currency Transactions | | | | |
Net realized gain (loss) on: | | | | |
Investment transactions (including affiliated of $18,000) | | | (23,234,279 | ) |
Foreign currency transactions | | | 2,197 | |
| | | | |
| |
| | | (23,232,082 | ) |
| | | | |
| |
Net change in unrealized appreciation (depreciation) on: | | | | |
Investments (including affiliated of $(20,311)) | | | (314,682,667 | ) |
Foreign currencies | | | (6,973 | ) |
| | | | |
| |
| | | (314,689,640 | ) |
| | | | |
| |
Net gain (loss) on investment and foreign currency transactions | | | (337,921,722 | ) |
| | | | |
| |
Net Increase (Decrease) In Net Assets Resulting From Operations | | $ | (348,699,023 | ) |
| | | | |
(a) Class specific expenses and waivers were as follows:
| | | | | | | | | | | | | | | | |
| | | Class A | | | Class C | | | Class Z | | | Class R6 | |
Distribution fee | | | 1,960,721 | | | | 606,664 | | | | — | | | | — | |
Transfer agent’s fees and expenses | | | 923,679 | | | | 62,175 | | | | 637,345 | | | | 1,707 | |
Registration fees | | | 31,630 | | | | 15,559 | | | | 26,983 | | | | 23,418 | |
Fee waiver and/or expense reimbursement | | | (273,658 | ) | | | (17,756 | ) | | | (343,974 | ) | | | (72,052 | ) |
Distribution fee waiver | | | (326,787 | ) | | | — | | | | — | | | | — | |
See Notes to Financial Statements.
20
Statements of Changes in Net Assets
| | | | | | | | | | |
| | | Year Ended
February 28, | | | |
| | | |
| | | 2022 | | | 2021 | | | |
| | | |
Increase (Decrease) in Net Assets | | | | | | | | | | |
| | | |
Operations | | | | | | | | | | |
Net investment income (loss) | | $ | (10,777,301 | ) | | $ | (6,768,666 | ) | | |
Net realized gain (loss) on investment and foreign currency transactions | | | (23,232,082 | ) | | | 156,829,165 | | | |
Net change in unrealized appreciation (depreciation) on investments and foreign currencies | | | (314,689,640 | ) | | | 314,825,601 | | | |
| | | | | | | | | | |
| | | |
Net increase (decrease) in net assets resulting from operations | | | (348,699,023 | ) | | | 464,886,100 | | | |
| | | | | | | | | | |
| | | |
Dividends and Distributions | | | | | | | | | | |
Distributions from distributable earnings | | | | | | | | | | |
Class A | | | (69,905,533 | ) | | | (39,594,520 | ) | | |
Class C | | | (10,492,498 | ) | | | (6,725,448 | ) | | |
Class Z | | | (69,936,125 | ) | | | (44,456,131 | ) | | |
Class R6 | | | (24,598,404 | ) | | | (6,765,090 | ) | | |
| | | | | | | | | | |
| | | |
| | | (174,932,560 | ) | | | (97,541,189 | ) | | |
| | | | | | | | | | |
Fund share transactions (Net of share conversions) | | | | | | | | | | |
Net proceeds from shares sold | | | 315,674,446 | | | | 434,815,164 | | | |
Net asset value of shares issued in reinvestment of dividends and distributions | | | 165,611,664 | | | | 91,578,722 | | | |
Net asset value of shares issued in merger | | | 1,090,237,618 | | | | — | | | |
Cost of shares purchased | | | (488,250,524 | ) | | | (291,946,361 | ) | | |
| | | | | | | | | | |
| | | |
Net increase (decrease) in net assets from Fund share transactions | | | 1,083,273,204 | | | | 234,447,525 | | | |
| | | | | | | | | | |
Total increase (decrease) | | | 559,641,621 | | | | 601,792,436 | | | |
| | | |
Net Assets: | | | | | | | | | | |
| | | |
Beginning of year | | | 1,276,145,631 | | | | 674,353,195 | | | |
| | | | | | | | | | |
| | | |
End of year | | $ | 1,835,787,252 | | | $ | 1,276,145,631 | | | |
| | | | | | | | | | |
See Notes to Financial Statements.
PGIM Jennison Focused Growth Fund 21
Financial Highlights
| | | | | | | | | | | | | | | | | | | | |
| | | | | | |
| Class A Shares | | | | | | | | | | | | | | | |
| | | | | | Year Ended February 28/29, | | | | |
| | | 2022 | | | 2021 | | | 2020 | | | 2019 | | | 2018 | |
Per Share Operating Performance(a): | | | | | | | | | | | | | | | | | | | | |
Net Asset Value, Beginning of Year | | | $24.34 | | | | $15.84 | | | | $14.91 | | | | $15.46 | | | | $12.42 | |
Income (loss) from investment operations: | | | | | | | | | | | | | | | | | | | | |
Net investment income (loss) | | | (0.20 | ) | | | (0.18 | ) | | | (0.11 | ) | | | (0.08 | ) | | | (0.09 | ) |
| Net realized and unrealized gain (loss) on investment and foreign currency transactions | | | (2.10 | ) | | | 10.85 | | | | 1.97 | | | | 1.01 | | | | 4.75 | |
Total from investment operations | | | (2.30 | ) | | | 10.67 | | | | 1.86 | | | | 0.93 | | | | 4.66 | |
Less Dividends and Distributions: | | | | | | | | | | | | | | | | | | | | |
Distributions from net realized gains | | | (3.58 | ) | | | (2.17 | ) | | | (0.93 | ) | | | (1.48 | ) | | | (1.62 | ) |
Net asset value, end of year | | | $18.46 | | | | $24.34 | | | | $15.84 | | | | $14.91 | | | | $15.46 | |
Total Return(b): | | | (12.51 | )% | | | 67.82 | % | | | 12.47 | % | | | 6.66 | % | | | 40.04 | % |
| | | | | | | | | | | | | | | | | | | | | |
| | | | | | |
| Ratios/Supplemental Data: | | | | | | | | | | | | | | | |
Net assets, end of year (000) | | $ | 1,078,256 | | | $ | 485,590 | | | $ | 292,554 | | | $ | 245,528 | | | $ | 226,316 | |
Average net assets (000) | | | $653,573 | | | $ | 393,844 | | | $ | 283,060 | | | $ | 234,841 | | | $ | 195,791 | |
Ratios to average net assets(c)(d): | | | | | | | | | | | | | | | | | | | | |
Expenses after waivers and/or expense reimbursement | | | 1.05 | % | | | 1.07 | % | | | 1.10 | % | | | 1.15 | % | | | 1.24 | % |
Expenses before waivers and/or expense reimbursement | | | 1.14 | % | | | 1.15 | % | | | 1.19 | % | | | 1.27 | % | | | 1.43 | % |
Net investment income (loss) | | | (0.86 | )% | | | (0.84 | )% | | | (0.66 | )% | | | (0.52 | )% | | | (0.62 | )% |
Portfolio turnover rate(e) | | | 67 | % | | | 74 | % | | | 72 | % | | | 52 | % | | | 87 | % |
| (a) | Calculated based on average shares outstanding during the year. |
| (b) | Total return does not consider the effects of sales loads. Total return is calculated assuming a purchase of a share on the first day and a sale on the last day of each year reported and includes reinvestment of dividends and distributions, if any. Total returns may reflect adjustments to conform to GAAP. |
| (c) | Effective October 1, 2017, class specific expenses include transfer agent fees and expenses and registration fees, which are charged to their respective share class. |
| (d) | Does not include expenses of the underlying funds in which the Fund invests. |
| (e) | The Fund’s portfolio turnover rate is calculated in accordance with regulatory requirements, without regard to transactions involving short-term investments, certain derivatives and in-kind transactions (if any). If such transactions were included, the Fund’s portfolio turnover rate may be higher. |
See Notes to Financial Statements.
22
| | | | | | | | | | | | | | | | | | | | |
| | | | | | |
| Class C Shares | | | | | | | | | | | | | | | |
| | | | | | Year Ended February 28/29, | | | | |
| | | 2022 | | | 2021 | | | 2020 | | | 2019 | | | 2018 | |
Per Share Operating Performance(a): | | | | | | | | | | | | | | | | | | | | |
Net Asset Value, Beginning of Year | | | $18.25 | | | | $12.29 | | | | $11.84 | | | | $12.67 | | | | $10.50 | |
Income (loss) from investment operations: | | | | | | | | | | | | | | | | | | | | |
Net investment income (loss) | | | (0.28 | ) | | | (0.25 | ) | | | (0.17 | ) | | | (0.15 | ) | | | (0.16 | ) |
| Net realized and unrealized gain (loss) on investment and foreign currency transactions | | | (1.39 | ) | | | 8.38 | | | | 1.55 | | | | 0.80 | | | | 3.95 | |
Total from investment operations | | | (1.67 | ) | | | 8.13 | | | | 1.38 | | | | 0.65 | | | | 3.79 | |
Less Dividends and Distributions: | | | | | | | | | | | | | | | | | | | | |
Distributions from net realized gains | | | (3.58 | ) | | | (2.17 | ) | | | (0.93 | ) | | | (1.48 | ) | | | (1.62 | ) |
Net asset value, end of year | | | $13.00 | | | | $18.25 | | | | $12.29 | | | | $11.84 | | | | $12.67 | |
Total Return(b): | | | (13.27 | )% | | | 66.59 | % | | | 11.73 | % | | | 5.86 | % | | | 39.02 | % |
| | | | | | | | | | | | | | | | | | | | | |
| | | | | | |
| Ratios/Supplemental Data: | | | | | | | | | | | | | | | |
Net assets, end of year (000) | | $ | 60,205 | | | $ | 59,185 | | | $ | 39,542 | | | $ | 66,687 | | | $ | 56,630 | |
Average net assets (000) | | $ | 60,666 | | | $ | 51,793 | | | $ | 44,576 | | | $ | 60,750 | | | $ | 49,905 | |
Ratios to average net assets(c)(d): | | | | | | | | | | | | | | | | | | | | |
Expenses after waivers and/or expense reimbursement | | | 1.79 | % | | | 1.79 | % | | | 1.82 | % | | | 1.89 | % | | | 1.99 | % |
Expenses before waivers and/or expense reimbursement | | | 1.82 | % | | | 1.82 | % | | | 1.86 | % | | | 1.95 | % | | | 2.14 | % |
Net investment income (loss) | | | (1.61 | )% | | | (1.56 | )% | | | (1.39 | )% | | | (1.26 | )% | | | (1.37 | )% |
Portfolio turnover rate(e) | | | 67 | % | | | 74 | % | | | 72 | % | | | 52 | % | | | 87 | % |
| (a) | Calculated based on average shares outstanding during the year. |
| (b) | Total return does not consider the effects of sales loads. Total return is calculated assuming a purchase of a share on the first day and a sale on the last day of each year reported and includes reinvestment of dividends and distributions, if any. Total returns may reflect adjustments to conform to GAAP. |
| (c) | Effective October 1, 2017, class specific expenses include transfer agent fees and expenses and registration fees, which are charged to their respective share class. |
| (d) | Does not include expenses of the underlying funds in which the Fund invests. |
| (e) | The Fund’s portfolio turnover rate is calculated in accordance with regulatory requirements, without regard to transactions involving short-term investments, certain derivatives and in-kind transactions (if any). If such transactions were included, the Fund’s portfolio turnover rate may be higher. |
See Notes to Financial Statements.
PGIM Jennison Focused Growth Fund 23
Financial Highlights (continued)
| | | | | | | | | | | | | | | | | | | | |
| | | | | | |
| Class Z Shares | | | | | | | | | | | | | | | |
| | | | | | Year Ended February 28/29, | | | | |
| | | 2022 | | | 2021 | | | 2020 | | | 2019 | | | 2018 | |
Per Share Operating Performance(a): | | | | | | | | | | | | | | | | | | | | |
Net Asset Value, Beginning of Year | | | $26.76 | | | | $17.23 | | | | $16.09 | | | | $16.52 | | | | $13.14 | |
Income (loss) from investment operations: | | | | | | | | | | | | | | | | | | | | |
Net investment income (loss) | | | (0.15 | ) | | | (0.12 | ) | | | (0.05 | ) | | | (0.03 | ) | | | (0.05 | ) |
| Net realized and unrealized gain (loss) on investment and foreign currency transactions | | | (2.39 | ) | | | 11.82 | | | | 2.12 | | | | 1.08 | | | | 5.05 | |
Total from investment operations | | | (2.54 | ) | | | 11.70 | | | | 2.07 | | | | 1.05 | | | | 5.00 | |
Less Dividends and Distributions: | | | | | | | | | | | | | | | | | | | | |
Distributions from net realized gains | | | (3.58 | ) | | | (2.17 | ) | | | (0.93 | ) | | | (1.48 | ) | | | (1.62 | ) |
Net asset value, end of year | | | $20.64 | | | | $26.76 | | | | $17.23 | | | | $16.09 | | | | $16.52 | |
Total Return(b): | | | (12.27 | )% | | | 68.34 | % | | | 12.87 | % | | | 6.98 | % | | | 40.46 | % |
| | | | | | | | | | | | | | | | | | | | | |
| | | | | | |
| Ratios/Supplemental Data: | | | | | | | | | | | | | | | |
Net assets, end of year (000) | | $ | 538,780 | | | $ | 593,796 | | | $ | 316,686 | | | $ | 278,810 | | | $ | 162,297 | |
Average net assets (000) | | $ | 587,500 | | | $ | 453,422 | | | $ | 311,632 | | | $ | 227,690 | | | $ | 116,296 | |
Ratios to average net assets(c)(d): | | | | | | | | | | | | | | | | | | | | |
Expenses after waivers and/or expense reimbursement | | | 0.75 | % | | | 0.75 | % | | | 0.75 | % | | | 0.82 | % | | | 0.99 | % |
Expenses before waivers and/or expense reimbursement | | | 0.81 | % | | | 0.81 | % | | | 0.83 | % | | | 0.90 | % | | | 1.12 | % |
Net investment income (loss) | | | (0.56 | )% | | | (0.52 | )% | | | (0.31 | )% | | | (0.21 | )% | | | (0.37 | )% |
Portfolio turnover rate(e) | | | 67 | % | | | 74 | % | | | 72 | % | | | 52 | % | | | 87 | % |
| (a) | Calculated based on average shares outstanding during the year. |
| (b) | Total return is calculated assuming a purchase of a share on the first day and a sale on the last day of each year reported and includes reinvestment of dividends and distributions, if any. Total returns may reflect adjustments to conform to GAAP. |
| (c) | Effective October 1, 2017, class specific expenses include transfer agent fees and expenses and registration fees, which are charged to their respective share class. |
| (d) | Does not include expenses of the underlying funds in which the Fund invests. |
| (e) | The Fund’s portfolio turnover rate is calculated in accordance with regulatory requirements, without regard to transactions involving short-term investments, certain derivatives and in-kind transactions (if any). If such transactions were included, the Fund’s portfolio turnover rate may be higher. |
See Notes to Financial Statements.
24
| | | | | | | | | | | | | | | | | | | | |
| | | | | | |
| Class R6 Shares | | | | | | | | | | | | | | | |
| | | | | | Year Ended February 28/29, | | | | |
| | | 2022 | | | 2021 | | | 2020 | | | 2019 | | | 2018 | |
Per Share Operating Performance(a): | | | | | | | | | | | | | | | | | | | | |
Net Asset Value, Beginning of Year | | | $26.76 | | | | $17.21 | | | | $16.07 | | | | $16.49 | | | | $13.12 | |
Income (loss) from investment operations: | | | | | | | | | | | | | | | | | | | | |
Net investment income (loss) | | | (0.13 | ) | | | (0.11 | ) | | | (0.04 | ) | | | (0.02 | ) | | | (0.06 | ) |
| Net realized and unrealized gain (loss) on investment and foreign currency transactions | | | (2.39 | ) | | | 11.83 | | | | 2.11 | | | | 1.08 | | | | 5.05 | |
Total from investment operations | | | (2.52 | ) | | | 11.72 | | | | 2.07 | | | | 1.06 | | | | 4.99 | |
Less Dividends and Distributions: | | | | | | | | | | | | | | | | | | | | |
Distributions from net realized gains | | | (3.58 | ) | | | (2.17 | ) | | | (0.93 | ) | | | (1.48 | ) | | | (1.62 | ) |
Net asset value, end of year | | | $20.66 | | | | $26.76 | | | | $17.21 | | | | $16.07 | | | | $16.49 | |
Total Return(b): | | | (12.19 | )% | | | 68.44 | % | | | 13.01 | % | | | 7.06 | % | | | 40.45 | % |
| | | | | | | | | | | | | | | | | | | | | |
| | | | | | |
| Ratios/Supplemental Data: | | | | | | | | | | | | | | | |
Net assets, end of year (000) | | | $158,547 | | | | $137,574 | | | | $22,843 | | | | $18,222 | | | | $4,688 | |
Average net assets (000) | | | $180,823 | | | | $58,252 | | | | $21,320 | | | | $11,478 | | | | $2,037 | |
Ratios to average net assets(c)(d): | | | | | | | | | | | | | | | | | | | | |
Expenses after waivers and/or expense reimbursement | | | 0.67 | % | | | 0.67 | % | | | 0.67 | % | | | 0.73 | % | | | 0.99 | % |
Expenses before waivers and/or expense reimbursement | | | 0.71 | % | | | 0.75 | % | | | 0.78 | % | | | 0.86 | % | | | 1.53 | % |
Net investment income (loss) | | | (0.48 | )% | | | (0.46 | )% | | | (0.23 | )% | | | (0.13 | )% | | | (0.37 | )% |
Portfolio turnover rate(e) | | | 67 | % | | | 74 | % | | | 72 | % | | | 52 | % | | | 87 | % |
| (a) | Calculated based on average shares outstanding during the year. |
| (b) | Total return is calculated assuming a purchase of a share on the first day and a sale on the last day of each year reported and includes reinvestment of dividends and distributions, if any. Total returns may reflect adjustments to conform to GAAP. |
| (c) | Effective October 1, 2017, class specific expenses include transfer agent fees and expenses and registration fees, which are charged to their respective share class. |
| (d) | Does not include expenses of the underlying funds in which the Fund invests. |
| (e) | The Fund’s portfolio turnover rate is calculated in accordance with regulatory requirements, without regard to transactions involving short-term investments, certain derivatives and in-kind transactions (if any). If such transactions were included, the Fund’s portfolio turnover rate may be higher. |
See Notes to Financial Statements.
PGIM Jennison Focused Growth Fund 25
Notes to Financial Statements
1. Organization
Prudential Investment Portfolios 3 (the “Registered Investment Company” or “RIC”) is registered under the Investment Company Act of 1940, as amended (“1940 Act”), as an open-end management investment company. The RIC is organized as a Delaware Statutory Trust. These financial statements relate only to the PGIM Jennison Focused Growth Fund (the “Fund”), a series of the RIC. The Fund is classified as a non-diversified fund for purposes of the 1940 Act.
The investment objective of the Fund is to seek long-term growth of capital.
2. Accounting Policies
The Fund follows the investment company accounting and reporting guidance of the Financial Accounting Standards Board (“FASB”) Accounting Standard Codification (“ASC”) Topic 946 Financial Services — Investment Companies. The following is a summary of significant accounting policies followed by the Fund in the preparation of its financial statements. The policies conform to U.S. generally accepted accounting principles (“GAAP”). The Fund consistently follows such policies in the preparation of its financial statements.
Securities Valuation: The Fund holds securities and other assets and liabilities that are fair valued as of the close of each day (generally, 4:00 PM Eastern time) the New York Stock Exchange (“NYSE”) is open for trading. As described in further detail below, the Fund’s investments are valued daily based on a number of factors, including the type of investment and whether market quotations are readily available. The RIC’s Board of Trustees (the “Board”) has adopted valuation procedures for security valuation under which fair valuation responsibilities have been delegated to PGIM Investments LLC (“PGIM Investments” or the “Manager”). Pursuant to the Board’s delegation, the Manager has established a Valuation Committee responsible for supervising the fair valuation of portfolio securities and other assets and liabilities. The valuation procedures permit the Fund to utilize independent pricing vendor services, quotations from market makers, and alternative valuation methods when market quotations are either not readily available or not deemed representative of fair value. Fair value is the price that would be received to sell an asset or paid to transfer a liability in an orderly transaction between market participants on the measurement date. A record of the Valuation Committee’s actions is subject to the Board’s review at its first quarterly meeting following the quarter in which such actions take place.
For the fiscal reporting year-end, securities and other assets and liabilities were fair valued at the close of the last U.S. business day. Trading in certain foreign securities may occur when the NYSE is closed (including weekends and holidays). Because such foreign securities
26
trade in markets that are open on weekends and U.S. holidays, the values of some of the Fund’s foreign investments may change on days when investors cannot purchase or redeem Fund shares.
Various inputs determine how the Fund’s investments are valued, all of which are categorized according to the three broad levels (Level 1, 2, or 3) detailed in the Schedule of Investments and referred to herein as the “fair value hierarchy” in accordance with FASB ASC Topic 820—Fair Value Measurement.
Common or preferred stocks, exchange-traded funds and derivative instruments, if applicable, that are traded on a national securities exchange are valued at the last sale price as of the close of trading on the applicable exchange where the security principally trades. Securities traded via NASDAQ are valued at the NASDAQ official closing price. To the extent these securities are valued at the last sale price or NASDAQ official closing price, they are classified as Level 1 in the fair value hierarchy. In the event that no sale or official closing price on valuation date exists, these securities are generally valued at the mean between the last reported bid and ask prices, or at the last bid price in the absence of an ask price. These securities are classified as Level 2 in the fair value hierarchy.
Foreign equities traded on foreign securities exchanges are generally valued using pricing vendor services that provide model prices derived using adjustment factors based on information such as local closing price, relevant general and sector indices, currency fluctuations, depositary receipts, and futures, as applicable. Securities valued using such model prices are classified as Level 2 in the fair value hierarchy. The models generate an evaluated adjustment factor for each security, which is applied to the local closing price to adjust it for post closing market movements up to the time the Fund is valued. Utilizing that evaluated adjustment factor, the vendor provides an evaluated price for each security. If the vendor does not provide an evaluated price, securities are valued in accordance with exchange-traded common and preferred stock valuation policies discussed above.
Investments in open-end funds (other than exchange-traded funds) are valued at their net asset values as of the close of the NYSE on the date of valuation. These securities are classified as Level 1 in the fair value hierarchy since they may be purchased or sold at their net asset values on the date of valuation.
Securities and other assets that cannot be priced according to the methods described above are valued based on pricing methodologies approved by the Board. In the event that unobservable inputs are used when determining such valuations, the securities will be classified as Level 3 in the fair value hierarchy. Altering one or more unobservable inputs may result in a significant change to a Level 3 security’s fair value measurement.
When determining the fair value of securities, some of the factors influencing the valuation include: the nature of any restrictions on disposition of the securities; assessment of the general liquidity of the securities; the issuer’s financial condition and the markets in which it does business; the cost of the investment; the size of the holding and the capitalization of
PGIM Jennison Focused Growth Fund 27
Notes to Financial Statements (continued)
the issuer; the prices of any recent transactions or bids/offers for such securities or any comparable securities; any available analyst media or other reports or information deemed reliable by the Manager regarding the issuer or the markets or industry in which it operates. Using fair value to price securities may result in a value that is different from a security’s most recent closing price and from the price used by other unaffiliated mutual funds to calculate their net asset values.
Foreign Currency Translation: The books and records of the Fund are maintained in U.S. dollars. Foreign currency amounts are translated into U.S. dollars on the following basis:
(i) market value of investment securities, other assets and liabilities — at the exchange rate as of the valuation date;
(ii) purchases and sales of investment securities, income and expenses — at the rates of exchange prevailing on the respective dates of such transactions.
Although the net assets of the Fund are presented at the foreign exchange rates and market values at the close of the period, the Fund does not generally isolate that portion of the results of operations arising as a result of changes in the foreign exchange rates from the fluctuations arising from changes in the market prices of long-term portfolio securities held at the end of the period. Similarly, the Fund does not isolate the effect of changes in foreign exchange rates from the fluctuations arising from changes in the market prices of long-term portfolio securities sold during the period. Accordingly, holding period unrealized and realized foreign currency gains (losses) are included in the reported net change in unrealized appreciation (depreciation) on investments and net realized gains (losses) on investment transactions on the Statements of Operations.
Net realized gains (losses) on foreign currency transactions represent net foreign exchange gains (losses) from the disposition of holdings of foreign currencies, currency gains (losses) realized between the trade and settlement dates on investment transactions, and the difference between the amounts of interest, dividends and foreign withholding taxes recorded on the Fund’s books and the U.S. dollar equivalent amounts actually received or paid. Net unrealized currency gains (losses) arise from valuing foreign currency denominated assets and liabilities (other than investments) at period end exchange rates.
Master Netting Arrangements: The RIC, on behalf of the Fund, is subject to various Master Agreements, or netting arrangements, with select counterparties. These are agreements which a subadviser may have negotiated and entered into on behalf of all or a portion of the Fund. A master netting arrangement between the Fund and the counterparty permits the Fund to offset amounts payable by the Fund to the same counterparty against amounts to be received; and by the receipt of collateral from the counterparty by the Fund to cover the
28
Fund’s exposure to the counterparty. However, there is no assurance that such mitigating factors are easily enforceable. In addition to master netting arrangements, the right to set-off exists when all the conditions are met such that each of the parties owes the other determinable amounts, the reporting party has the right to set-off the amount owed with the amount owed by the other party, the reporting party intends to set-off and the right of set-off is enforceable by law.
Securities Lending: The Fund lends its portfolio securities to banks and broker-dealers. The loans are secured by collateral at least equal to the market value of the securities loaned. Collateral pledged by each borrower is invested in an affiliated money market fund and is marked to market daily, based on the previous day’s market value, such that the value of the collateral exceeds the value of the loaned securities. In the event of significant appreciation in value of securities on loan on the last business day of the reporting period, the financial statements may reflect a collateral value that is less than the market value of the loaned securities. Such shortfall is remedied as described above. Loans are subject to termination at the option of the borrower or the Fund. Upon termination of the loan, the borrower will return to the Fund securities identical to the loaned securities. The remaining maturities of the securities lending transactions are considered overnight and continuous. Should the borrower of the securities fail financially, the Fund has the right to repurchase the securities in the open market using the collateral.
The Fund recognizes income, net of any rebate and securities lending agent fees, for lending its securities in the form of fees or interest on the investment of any cash received as collateral. The borrower receives all interest and dividends from the securities loaned and such payments are passed back to the lender in amounts equivalent thereto, which are reflected in interest income or unaffiliated dividend income based on the nature of the payment on the Statement of Operations. The Fund also continues to recognize any unrealized gain (loss) in the market price of the securities loaned and on the change in the value of the collateral invested that may occur during the term of the loan. In addition, realized gain (loss) is recognized on changes in the value of the collateral invested upon liquidation of the collateral. Net earnings from securities lending are disclosed in the Statement of Operations.
Securities Transactions and Net Investment Income: Securities transactions are recorded on the trade date. Realized gains (losses) from investment and currency transactions are calculated on the specific identification method. Dividend income is recorded on the ex-date, or for certain foreign securities, when the Fund becomes aware of such dividends. Expenses are recorded on an accrual basis, which may require the use of certain estimates by management that may differ from actual. Net investment income or loss (other than class specific expenses and waivers, which are allocated as noted below) and unrealized and realized gains (losses) are allocated daily to each class of shares based upon the relative proportion of adjusted net assets of each class at the beginning of the day. Class specific expenses and waivers, where applicable, are charged to the respective share classes. Such class specific expenses and waivers include distribution fees and distribution fee waivers,
PGIM Jennison Focused Growth Fund 29
Notes to Financial Statements (continued)
shareholder servicing fees, transfer agent’s fees and expenses, registration fees and fee waivers and/or expense reimbursements, as applicable.
Taxes: It is the Fund’s policy to continue to meet the requirements of the Internal Revenue Code applicable to regulated investment companies and to distribute all of its taxable net investment income and capital gains, if any, to its shareholders. Therefore, no federal income tax provision is required. Withholding taxes on foreign dividends, interest and capital gains, if any, are recorded, net of reclaimable amounts, at the time the related income is earned.
Dividends and Distributions: Dividends and distributions to shareholders, which are determined in accordance with federal income tax regulations and which may differ from GAAP, are recorded on the ex-date. Permanent book/tax differences relating to income and gain (loss) are reclassified between total distributable earnings (loss) and paid-in capital in excess of par, as appropriate. The chart below sets forth the expected frequency of dividend and capital gains distributions to shareholders. Various factors may impact the frequency of dividend distributions to shareholders, including but not limited to adverse market conditions or portfolio holding-specific events.
| | |
| | |
| Expected Distribution Schedule to Shareholders* | | Frequency |
| Net Investment Income | | Annually |
| Short-Term Capital Gains | | Annually |
| Long-Term Capital Gains | | Annually |
| * | Under certain circumstances, the Fund may make more than one distribution of short-term capital gains during a fiscal year. |
Estimates: The preparation of financial statements requires management to make estimates and assumptions that affect the reported amounts and disclosures in the financial statements. Actual results could differ from those estimates.
3. Agreements
The RIC, on behalf of the Fund, has a management agreement with the Manager. Pursuant to this agreement, the Manager has responsibility for all investment advisory services and supervises the subadviser’s performance of such services.
The Manager has entered into a subadvisory agreement with Jennison Associates LLC (“Jennison” or the “subadviser”). The Manager pays for the services of Jennison.
30
Fees payable under the management agreement are computed daily and paid monthly. For the reporting period ended February 28, 2022, the contractual and effective management fee rates were as follows:
| | |
| | |
| Contractual Management Rate | | Effective Management Fee, before any waivers
and/or expense reimbursements |
0.67% up to $1 billion of average daily net assets; | | 0.66% |
0.65% from $1 billion to $3 billion of average daily net assets; | | |
0.63% from $3 billion to $5 billion of average daily net assets; | | |
0.62% from $5 billion to $10 billion of average daily assets; | | |
0.61% over $10 billion of average daily net assets | | |
The Manager has contractually agreed, through June 30, 2023, to limit total annual operating expenses after fee waivers and/or expense reimbursements.
This contractual waiver excludes interest, brokerage, taxes (such as income and foreign withholding taxes, stamp duty and deferred tax expenses), acquired fund fees and expenses, extraordinary expenses, and certain other Fund expenses such as dividend and interest expense and broker charges on short sales.
Where applicable, the Manager agrees to waive management fees or shared operating expenses on any share class to the same extent that it waives such expenses on any other share class. In addition, total annual operating expenses for Class R6 shares will not exceed total annual operating expenses for Class Z shares. Fees and/or expenses waived and/or reimbursed by the Manager may be recouped by the Manager within the same fiscal year during which such waiver and/or reimbursement is made if such recoupment can be realized without exceeding the expense limit in effect at the time of the recoupment for that fiscal year. Effective December 11, 2021, the expense limitations attributable to each class are as follows:
| | | | | | | | | | |
| | | |
| Class | | Expense
Limitations | | Prior Expense
Limitations* |
A | | | | 1.05 | % | | | | — | % |
C | | | | 1.78 | | | | | — | |
Z | | | | 0.75 | | | | | 0.75 | |
R6 | | | | 0.67 | | | | | 0.67 | |
*The expense limitations attributable to each share class prior to December 11, 2021.
The RIC, on behalf of the Fund, has a distribution agreement with Prudential Investment Management Services LLC (“PIMS”), which acts as the distributor of the Class A, Class C, Class Z and Class R6 shares of the Fund. The Fund compensates PIMS for distributing and servicing the Fund’s Class A and Class C shares, pursuant to the plans of distribution (the “Distribution Plans”), regardless of expenses actually incurred by PIMS.
PGIM Jennison Focused Growth Fund 31
Notes to Financial Statements (continued)
Pursuant to the Distribution Plans, the Fund compensates PIMS for distribution related activities at an annual rate based on average daily net assets per class. PIMS has contractually agreed through June 30, 2023 to limit such fees on certain classes based on the average daily net assets.The distribution fees are accrued daily and payable monthly. The Fund’s annual distribution contractual rate and limit where applicable are as follows:
| | | | | | | | | | |
| Class | | Contractual Rate | | Limit |
A | | | | 0.30 | % | | 0.25% | |
C | | | | 1.00 | | | — | |
Z | | | | N/A | | | N/A | |
R6 | | | | N/A | | | N/A | |
For the reporting period ended February 28, 2022, PIMS received front-end sales charges (“FESL”) resulting from sales of certain class shares and contingent deferred sales charges (“CDSC”) imposed upon redemptions by certain shareholders. From these fees, PIMS paid such sales charges to broker-dealers, who in turn paid commissions to salespersons and incurred other distribution costs. The sales charges are as follows where applicable:
| | | | |
| FESL by Class | | Amount | |
A | | | $507,967 | |
C | | | — | |
| | | | |
| CDSC by Class | | Amount | |
A | | | $2,438 | |
C | | | 7,269 | |
PGIM Investments, PIMS and Jennison are indirect, wholly-owned subsidiaries of Prudential Financial, Inc. (“Prudential”).
4. Other Transactions with Affiliates
Prudential Mutual Fund Services LLC (“PMFS”), an affiliate of PGIM Investments and an indirect, wholly-owned subsidiary of Prudential, serves as the Fund’s transfer agent. Transfer agent’s fees and expenses in the Statement of Operations include certain out-of-pocket expenses paid to non-affiliates, where applicable.
The Fund may invest its overnight sweep cash in the PGIM Core Ultra Short Bond Fund (the “Core Fund”), and its securities lending cash collateral in the PGIM Institutional Money Market Fund (the “Money Market Fund”), each a fund of Prudential Investment Portfolios 2, registered under the 1940 Act and managed by PGIM Investments. PGIM Investments and/or its affiliates are paid fees or reimbursed for providing their services to the Core Fund and the Money Market Fund. In addition to the realized and unrealized gains on investments in the Core Fund and Money Market Fund, earnings from such investments are disclosed on
32
the Statement of Operations as “Affiliated dividend income” and “Income from securities lending, net”, respectively. Effective January 2022, the Fund changed its overnight cash sweep vehicle from the Core Fund to an unaffiliated money market fund.
The Fund may enter into certain securities purchase or sale transactions under Board approved Rule 17a-7 procedures. Rule 17a-7 is an exemptive rule under the 1940 Act, that subject to certain conditions, permits purchase and sale transactions among affiliated investment companies, or between an investment company and a person that is affiliated solely by reason of having a common (or affiliated) investment adviser, common directors/trustees, and/or common officers. For the year ended February 28, 2022, no 17a-7 transactions were entered into by the Fund.
5. Portfolio Securities
The aggregate cost of purchases and proceeds from sales of portfolio securities (excluding short-term investments and U.S. Government securities) for the reporting period ended February 28, 2022, were as follows:
| | | | | | |
| Cost of Purchases | | | | | | Proceeds from Sales |
| $930,600,732 | | | | | | $1,138,310,692 |
A summary of the cost of purchases and proceeds from sales of shares of affiliated mutual funds for the year ended February 28, 2022, is presented as follows:
| | | | | | | | | | | | | | | | | | | | | | | | | | | | | | |
Value,
Beginning
of Year | | | Cost of
Purchases | | | Proceeds
from Sales | | | Change in
Unrealized
Gain
(Loss) | | | Realized
Gain
(Loss) | | | Value,
End of Year | | | Shares,
End of
Year | | | Income | |
|
| | Short-Term Investments - Affiliated Mutual Funds: | |
|
| | PGIM Core Ultra Short Bond Fund(1)(wa) | |
| | $ 8,104,965 | | | | $313,514,605 | | | | $321,619,570 | | | | $ — | | | | $ — | | | | $ — | | | | — | | | | $ 9,242 | |
| | |
| | PGIM Institutional Money Market Fund(1)(b)(wa) | | | | | | | | | |
| | 39,067,234 | | | | 473,752,717 | | | | 499,484,215 | | | | (20,311) | | | | 18,000 | | | | 13,333,425 | | | | 13,344,100 | | | | 14,729 | (2) |
| | $47,172,199 | | | | $787,267,322 | | | | $821,103,785 | | | | $(20,311) | | | | $18,000 | | | | $13,333,425 | | | | | | | | $23,971 | |
| (1) | The Fund did not have any capital gain distributions during the reporting period. |
| (2) | The amount, or a portion thereof, represents the affiliated securities lending income shown on the Statement of Operations. |
| (b) | Represents security, or portion thereof, purchased with cash collateral received for securities on loan and includes dividend reinvestment. |
| (wa) | PGIM Investments LLC, the manager of the Fund, also serves as manager of the PGIM Core Ultra Short Bond Fund and PGIM Institutional Money Market Fund, if applicable. |
6. Distributions and Tax Information
Distributions to shareholders, which are determined in accordance with federal income tax regulations and which may differ from GAAP, are recorded on the ex-date. In order to present total distributable earnings (loss) and paid-in capital in excess of par on the
PGIM Jennison Focused Growth Fund 33
Notes to Financial Statements (continued)
Statement of Assets and Liabilities that more closely represent their tax character, certain adjustments have been made to total distributable earnings (loss) and paid-in capital in excess of par. For the year ended February 28, 2022, the adjustments were to increase total distributable earnings and decrease paid-in capital in excess of par by $3,135,159 due to a net operating loss and adjustment due to merger. Net investment income (loss), net realized gain (loss) on investments and foreign currency transactions and net assets were not affected by this change.
For the year ended February 28, 2022, the tax character of dividends paid by the Fund were $44,254,007 of ordinary income and $130,678,553 of long-term capital gains. For the year ended February 28, 2021, the tax character of dividends paid by the Fund were $36,121,851 of ordinary income and $61,419,338 of long-term capital gains.
As of February 28, 2022, there were no accumulated undistributed earnings on a tax basis.
The United States federal income tax basis of the Fund’s investments and the net unrealized appreciation as of February 28, 2022 were as follows:
| | | | | | |
| Tax Basis | | Gross
Unrealized
Appreciation | | Gross
Unrealized
Depreciation | | Net
Unrealized
Appreciation |
| $1,403,589,122 | | $530,412,391 | | $(92,490,565) | | $437,921,826 |
The difference between GAAP basis and tax basis was primarily attributable to deferred losses on wash sales.
The Fund elected to treat post-October capital losses of approximately $108,643,000 and certain late-year ordinary income losses of approximately $2,281,000 as having been incurred in the following fiscal year (February 28, 2023).
The Manager has analyzed the Fund’s tax positions taken on federal, state and local income tax returns for all open tax years and has concluded that no provision for income tax is required in the Fund’s financial statements for the current reporting period. Since tax authorities can examine previously filed tax returns, the Fund’s U.S. federal and state tax returns for each of the four fiscal years up to the most recent fiscal year ended February 28, 2022 are subject to such review.
7. Capital and Ownership
The Fund offers Class A, Class C, Class Z and Class R6 shares. Class A shares are sold with a maximum front-end sales charge of 5.50%. Investors who purchase $1 million or more of Class A shares and sell these shares within 12 months of purchase are subject to a
34
contingent deferred sales charge (“CDSC”) of 1%, although they are not subject to an initial sales charge. The Class A CDSC is waived for certain retirement and/or benefit plans. A special exchange privilege is also available for shareholders who qualified to purchase Class A shares at net asset value. Class C shares are sold with a CDSC of 1% on sales made within 12 months of purchase. Class C shares will automatically convert to Class A shares on a monthly basis approximately eight years (ten years prior to January 22, 2021) after purchase. Class Z and Class R6 shares are not subject to any sales or redemption charges and are available exclusively for sale to a limited group of investors.
Under certain circumstances, an exchange may be made from specified share classes of the Fund to one or more other share classes of the Fund as presented in the table of transactions in shares of beneficial interest, below.
The RIC has authorized an unlimited number of shares of beneficial interest of the Fund at $0.001 par value per share.
As of February 28, 2022, Prudential, through its affiliated entities, including affiliated funds (if applicable), owned shares of the Fund as follows:
| | | | | | | | | | |
| Class | | Number of Shares | | Percentage of Outstanding Shares |
A | | | | 1,306,839 | | | | | 2.2 | % |
C | | | | 41 | | | | | 0.1 | % |
At the reporting period end, the number of shareholders holding greater than 5% of the Fund are as follows:
| | | | | | | | | | |
| | | Number of Shareholders | | Percentage of Outstanding Shares |
Affiliated | | | | — | | | | | — | % |
Unaffiliated | | | | 4 | | | | | 41.2 | % |
PGIM Jennison Focused Growth Fund 35
Notes to Financial Statements (continued)
Transactions in shares of beneficial interest were as follows:
| | | | | | | | |
| | | |
| Share Class | | Shares | | | Amount | |
| | |
Class A | | | | | | | | |
Year ended February 28, 2022: | | | | | | | | |
Shares sold | | | 2,259,097 | | | $ | 53,439,793 | |
Shares issued in reinvestment of dividends and distributions | | | 2,901,455 | | | | 67,603,891 | |
Shares issued in merger | | | 38,251,389 | | | | 875,956,816 | |
Shares purchased | | | (4,953,296 | ) | | | (110,464,194 | ) |
Net increase (decrease) in shares outstanding before conversion | | | 38,458,645 | | | | 886,536,306 | |
Shares issued upon conversion from other share class(es) | | | 300,796 | | | | 6,999,328 | |
Shares purchased upon conversion into other share class(es) | | | (288,368 | ) | | | (6,692,279 | ) |
Net increase (decrease) in shares outstanding | | | 38,471,073 | | | $ | 886,843,355 | |
| | |
Year ended February 28, 2021: | | | | | | | | |
Shares sold | | | 2,586,281 | | | $ | 54,485,912 | |
Shares issued in reinvestment of dividends and distributions | | | 1,612,208 | | | | 38,209,325 | |
Shares purchased | | | (3,168,864 | ) | | | (65,997,374 | ) |
Net increase (decrease) in shares outstanding before conversion | | | 1,029,625 | | | | 26,697,863 | |
Shares issued upon conversion from other share class(es) | | | 654,165 | | | | 14,442,968 | |
Shares purchased upon conversion into other share class(es) | | | (208,175 | ) | | | (4,192,777 | ) |
Net increase (decrease) in shares outstanding | | | 1,475,615 | | | $ | 36,948,054 | |
| | |
Class B | | | | | | | | |
| | |
Period ended June 26, 2020*: | | | | | | | | |
Shares sold | | | 983 | | | $ | 10,917 | |
Shares purchased | | | (13,734 | ) | | | (179,224 | ) |
Net increase (decrease) in shares outstanding before conversion | | | (12,751 | ) | | | (168,307 | ) |
Shares purchased upon conversion into other share class(es) | | | (209,570 | ) | | | (2,987,948 | ) |
Net increase (decrease) in shares outstanding | | | (222,321 | ) | | $ | (3,156,255 | ) |
36
| | | | | | | | |
| | | |
| Share Class | | Shares | | | Amount | |
| | |
Class C | | | | | | | | |
Year ended February 28, 2022: | | | | | | | | |
Shares sold | | | 467,689 | | | $ | 8,185,945 | |
Shares issued in reinvestment of dividends and distributions | | | 559,568 | | | | 9,204,899 | |
Shares issued in merger | | | 1,616,680 | | | | 26,141,722 | |
Shares purchased | | | (840,456 | ) | | | (13,807,263 | ) |
Net increase (decrease) in shares outstanding before conversion | | | 1,803,481 | | | | 29,725,303 | |
Shares purchased upon conversion into other share class(es) | | | (414,889 | ) | | | (7,006,484 | ) |
Net increase (decrease) in shares outstanding | | | 1,388,592 | | | $ | 22,718,819 | |
| | |
Year ended February 28, 2021: | | | | | | | | |
Shares sold | | | 988,352 | | | $ | 15,534,411 | |
Shares issued in reinvestment of dividends and distributions | | | 333,299 | | | | 5,929,389 | |
Shares purchased | | | (559,536 | ) | | | (8,520,540 | ) |
Net increase (decrease) in shares outstanding before conversion | | | 762,115 | | | | 12,943,260 | |
Shares purchased upon conversion into other share class(es) | | | (735,959 | ) | | | (12,690,474 | ) |
Net increase (decrease) in shares outstanding | | | 26,156 | | | $ | 252,786 | |
| | |
Class Z | | | | | | | | |
Year ended February 28, 2022: | | | | | | | | |
Shares sold | | | 6,318,221 | | | $ | 162,343,871 | |
Shares issued in reinvestment of dividends and distributions | | | 2,465,866 | | | | 64,211,153 | |
Shares issued in merger | | | 6,914,600 | | | | 176,944,604 | |
Shares purchased | | | (11,488,770 | ) | | | (291,740,583 | ) |
Net increase (decrease) in shares outstanding before conversion | | | 4,209,917 | | | | 111,759,045 | |
Shares issued upon conversion from other share class(es) | | | 291,746 | | | | 7,567,460 | |
Shares purchased upon conversion into other share class(es) | | | (579,223 | ) | | | (15,009,866 | ) |
Net increase (decrease) in shares outstanding | | | 3,922,440 | | | $ | 104,316,639 | |
| | |
Year ended February 28, 2021: | | | | | | | | |
Shares sold | | | 11,073,465 | | | $ | 257,631,633 | |
Shares issued in reinvestment of dividends and distributions | | | 1,562,077 | | | | 40,676,479 | |
Shares purchased | | | (9,069,879 | ) | | | (202,214,275 | ) |
Net increase (decrease) in shares outstanding before conversion | | | 3,565,663 | | | | 96,093,837 | |
Shares issued upon conversion from other share class(es) | | | 284,408 | | | | 6,066,958 | |
Shares purchased upon conversion into other share class(es) | | | (47,907 | ) | | | (1,083,182 | ) |
Net increase (decrease) in shares outstanding | | | 3,802,164 | | | $ | 101,077,613 | |
PGIM Jennison Focused Growth Fund 37
Notes to Financial Statements (continued)
| | | | | | | | |
| | | |
| Share Class | | Shares | | | Amount | |
| | |
Class R6 | | | | | | | | |
Year ended February 28, 2022: | | | | | | | | |
Shares sold | | | 3,458,606 | | | $ | 91,704,837 | |
Shares issued in reinvestment of dividends and distributions | | | 943,658 | | | | 24,591,721 | |
Shares issued in merger | | | 437,163 | | | | 11,194,476 | |
Shares purchased | | | (2,853,476 | ) | | | (72,238,484 | ) |
Net increase (decrease) in shares outstanding before conversion | | | 1,985,951 | | | | 55,252,550 | |
Shares issued upon conversion from other share class(es) | | | 548,912 | | | | 14,144,366 | |
Shares purchased upon conversion into other share class(es) | | | (101 | ) | | | (2,525 | ) |
Net increase (decrease) in shares outstanding | | | 2,534,762 | | | $ | 69,394,391 | |
| | |
Year ended February 28, 2021: | | | | | | | | |
Shares sold | | | 4,169,644 | | | $ | 107,152,291 | |
Shares issued in reinvestment of dividends and distributions | | | 259,736 | | | | 6,763,529 | |
Shares purchased | | | (634,545 | ) | | | (15,034,948 | ) |
Net increase (decrease) in shares outstanding before conversion | | | 3,794,835 | | | | 98,880,872 | |
Shares issued upon conversion from other share class(es) | | | 18,225 | | | | 444,455 | |
Net increase (decrease) in shares outstanding | | | 3,813,060 | | | $ | 99,325,327 | |
| * | Effective June 26, 2020, all of the issued and outstanding Class B shares of the Fund converted into Class A shares. |
8. Borrowings
The RIC, on behalf of the Fund, along with other affiliated registered investment companies (the “Participating Funds”), is a party to a Syndicated Credit Agreement (“SCA”) with a group of banks. The purpose of the SCA is to provide an alternative source of temporary funding for capital share redemptions. The table below provides details of the current SCA in effect at the reporting period-end as well as the prior SCA.
| | | | |
| | | |
| | | Current SCA | | Prior SCA |
Term of Commitment | | 10/1/2021 – 9/29/2022 | | 10/2/2020 – 9/30/2021 |
Total Commitment | | $1,200,000,000 | | $1,200,000,000 |
| Annualized Commitment Fee on the Unused Portion of the SCA | | 0.15% | | 0.15% |
| Annualized Interest Rate on Borrowings | | 1.20% plus the higher of (1) the effective federal funds rate, (2) the one-month LIBOR rate or (3) zero percent | | 1.30% plus the higher of (1) the effective federal funds rate, (2) the one-month LIBOR rate or (3) zero percent |
Certain affiliated registered investment companies that are parties to the SCA include portfolios that are subject to a predetermined mathematical formula used to manage certain benefit guarantees offered under variable annuity contracts. The formula may result in large
38
scale asset flows into and out of these portfolios. Consequently, these portfolios may be more likely to utilize the SCA for purposes of funding redemptions. It may be possible for those portfolios to fully exhaust the committed amount of the SCA, thereby requiring the Manager to allocate available funding per a Board-approved methodology designed to treat the Participating Funds in the SCA equitably.
The Fund utilized the SCA during the year ended February 28, 2022. The average daily balance for the 21 days that the Fund had loans outstanding during the period was approximately $2,013,857, borrowed at a weighted average interest rate of 1.32%. The maximum loan outstanding amount during the period was $5,677,000. At February 28, 2022, the Fund did not have an outstanding loan amount.
9. Risks of Investing in the Fund
The Fund’s risks include, but are not limited to, some or all of the risks discussed below. For further information on the Fund’s risks, please refer to the Fund’s Prospectus and Statement of Additional Information.
Convertible Securities Risk: The market value of a convertible security performs like that of a regular debt security; that is, if market interest rates rise, the value of a convertible security usually falls. In addition, convertible securities are subject to the risk that the issuer will not be able to pay interest or dividends when due, and their market value may change based on changes in the issuer’s credit rating or the market’s perception of the issuer’s creditworthiness. Since it derives a portion of its value from the common stock into which it may be converted, a convertible security is also subject to the same types of market and issuer risks that apply to the underlying common stock.
Economic and Market Events Risk: Events in the U.S. and global financial markets, including actions taken by the U.S. Federal Reserve or foreign central banks to stimulate or stabilize economic growth or the functioning of the securities markets, may at times result in unusually high market volatility, which could negatively impact performance. Relatively reduced liquidity in credit and fixed income markets could adversely affect issuers worldwide.
Equity and Equity-Related Securities Risk: Equity and equity-related securities may be subject to changes in value, and their values may be more volatile than those of other asset classes. In addition to an individual security losing value, the value of the equity markets or a sector in which the Fund invests could go down. Different parts of a market can react differently to adverse issuer, market, regulatory, political and economic developments.
Foreign Securities Risk: Investments in securities of non-U.S. issuers (including those denominated in U.S. dollars) may involve more risk than investing in securities of U.S. issuers. Foreign political, economic and legal systems, especially those in developing and emerging market countries, may be less stable and more volatile than in the United States. Foreign legal systems generally have fewer regulatory requirements than the U.S. legal
PGIM Jennison Focused Growth Fund 39
Notes to Financial Statements (continued)
system, particularly those of emerging markets. In general, less information is publicly available with respect to non-U.S. companies than U.S. companies. Non-U.S. companies generally are not subject to the same accounting, auditing, and financial reporting standards as are U.S. companies. Additionally, the changing value of foreign currencies and changes in exchange rates could also affect the value of the assets the Fund holds and the Fund’s performance. Certain foreign countries may impose restrictions on the ability of issuers of foreign securities to make payment of principal and interest or dividends to investors located outside the country, due to blockage of foreign currency exchanges or otherwise. Investments in emerging markets are subject to greater volatility and price declines.
In addition, the Fund’s investments in non-U.S. securities may be subject to the risks of nationalization or expropriation of assets, imposition of currency exchange controls or restrictions on the repatriation of non-U.S. currency, confiscatory taxation and adverse diplomatic developments. Special U.S. tax considerations may apply.
Growth Style Risk: The Fund’s growth style may subject the Fund to above-average fluctuations as a result of seeking higher than average capital growth. Growth stocks are generally more sensitive to market movements than other types of stocks primarily because their stock prices are based heavily on future expectations. Historically, growth stocks have performed best during later stages of economic expansion and value stocks have performed best during periods of economic recovery. Growth company stocks also typically lack the dividend yield that can lessen price declines in market downturns. Since the Fund follows a growth investment style, there is the risk that the growth investment style may be out of favor for a period of time. At times when the style is out of favor, the Fund may underperform the market in general, its benchmark and other mutual funds.
Increase in Expenses Risk: Your actual cost of investing in the Fund may be higher than the expenses shown in the expense table in the Fund’s prospectus for a variety of reasons. For example, expense ratios may be higher than those shown if average net assets decrease. Net assets are more likely to decrease and Fund expense ratios are more likely to increase when markets are volatile. Active and frequent trading of Fund securities can increase expenses.
Initial Public Offerings (“IPOs”) Risk: The volume of IPOs and the levels at which the newly issued stocks trade in the secondary market are affected by the performance of the stock market overall. If IPOs are brought to the market, availability may be limited and if the Fund desires to acquire shares in such an offering, it may not be able to buy any shares at the offering price, or if it is able to buy shares, it may not be able to buy as many shares at the offering price as it would like. The prices of securities involved in IPOs are often subject to greater and more unpredictable price changes than more established stocks. Such unpredictability can have a dramatic impact on the Fund’s performance (higher or lower)
40
and any assumptions by investors based on the affected performance may be unwarranted. In addition, as Fund assets grow, the impact of IPO investments on performance will decline, which could reduce total returns.
Large Capitalization Company Risk: Companies with large market capitalizations go in and out of favor based on market and economic conditions. Larger companies tend to be less volatile than companies with smaller market capitalizations. In exchange for this potentially lower risk, the Fund’s value may not rise or fall as much as the value of funds that emphasize companies with smaller market capitalizations.
Large Shareholder and Large Scale Redemption Risk: Certain individuals, accounts, funds (including funds affiliated with the Manager) or institutions, including the Manager and its affiliates, may from time to time own or control a substantial amount of the Fund’s shares. There is no requirement that these entities maintain their investment in the Fund. There is a risk that such large shareholders or that the Fund’s shareholders generally may redeem all or a substantial portion of their investments in the Fund in a short period of time, which could have a significant negative impact on the Fund’s NAV, liquidity, and brokerage costs. Large redemptions could also result in tax consequences to shareholders and impact the Fund’s ability to implement its investment strategy. The Fund’s ability to pursue its investment objective after one or more large scale redemptions may be impaired and, as a result, the Fund may invest a larger portion of its assets in cash or cash equivalents.
Management Risk: The value of your investment may decrease if judgments by the subadviser about the attractiveness, value or market trends affecting a particular security, industry or sector or about market movements are incorrect.
Market Disruption and Geopolitical Risks: Market disruption can be caused by economic, financial or political events and factors, including but not limited to, international wars or conflicts (including Russia’s military invasion of Ukraine), geopolitical developments (including trading and tariff arrangements, sanctions and cybersecurity attacks), instability in regions such as Asia, Eastern Europe and the Middle East, terrorism, natural disasters and public health epidemics (including the outbreak of COVID-19 globally).
The extent and duration of such events and resulting market disruptions cannot be predicted, but could be substantial and could magnify the impact of other risks to the Fund. These and other similar events could adversely affect the U.S. and foreign financial markets and lead to increased market volatility, reduced liquidity in the securities markets, significant negative impacts on issuers and the markets for certain securities and commodities and/or government intervention. They may also cause short- or long-term economic uncertainties in the United States and worldwide. As a result, whether or not the Fund invests in securities of issuers located in or with significant exposure to the countries directly affected, the value and liquidity of the Fund’s investments may be negatively impacted. Further, due to closures of certain markets and restrictions on trading certain securities, the value of certain securities held by the Fund could be significantly impacted, which could lead to such securities being valued at zero.
PGIM Jennison Focused Growth Fund 41
Notes to Financial Statements (continued)
COVID-19 and the related governmental and public responses have had and may continue to have an impact on the Fund’s investments and net asset value and have led and may continue to lead to increased market volatility and the potential for illiquidity in certain classes of securities and sectors of the market. They have also had and may continue to result in periods of business disruption, business closures, inability to obtain raw materials, supplies and component parts, and reduced or disrupted operations for the issuers in which the Fund invests. The occurrence, reoccurrence and pendency of public health epidemics could adversely affect the economies and financial markets either in specific countries or worldwide.
Market Risk: Securities markets may be volatile and the market prices of the Fund’s securities may decline. Securities fluctuate in price based on changes in an issuer’s financial condition and overall market and economic conditions. If the market prices of the securities owned by the Fund fall, the value of your investment in the Fund will decline.
Medium Capitalization (Mid-Cap) Company Risk: The Fund’s investments in mid-cap companies carry more risk than investments in larger capitalized companies. Investments in mid-cap companies carry additional risks because earnings of these companies tend to be less predictable; they often have limited product lines, markets, distribution channels or financial resources; and the management of such companies may be dependent on one or a few key people. The market movements of these companies’ securities may be more abrupt or erratic than the market movements of securities of larger, more established companies or the stock market in general. Historically, mid-cap companies have sometimes gone through extended periods when they did not perform as well as larger companies.
Mid-cap companies generally are comparatively less liquid than larger companies, which may make such investments more difficult to sell at the time and price that the Fund would like. Also, the stocks of mid-cap companies may fall out of favor relative to those of small- or large-capitalization companies, causing the Fund to underperform other equity funds that focus on small or large-capitalization companies.
Non-Diversified Investment Company Risk: The Fund is non-diversified for purposes of the 1940 Act. This means that the Fund’s may invest a greater percentage of its assets in the securities of a single company or other issuer than a diversified fund. Investing in a non-diversified fund involves greater risk than investing in a diversified fund because a loss resulting from the decline in value of any one security may represent a greater portion of the total assets of a non-diversified fund.
Preferred Securities Risk: Preferred stock can experience sharp declines in value over short or extended periods of time, regardless of the success or failure of a company’s operations. A redemption by the issuer may negatively impact the return of the security held by the
42
Fund. Preferred stockholders’ liquidation rights are subordinate to the company’s debt holders and creditors. If interest rates rise, the fixed dividend on preferred stocks may be less attractive and the price of preferred stocks may decline. Preferred stock usually does not require the issuer to pay dividends and may permit the issuer to defer dividend payments. Deferred dividend payments could have adverse tax consequences for the Fund and may cause the preferred security to lose substantial value. Preferred securities also may have substantially lower trading volumes and less market depth than many other securities, such as common stock or U.S. Government securities.
10. Reorganization
On December 9, 2020, the Board approved an Agreement and Plan of Reorganization (the “Plan”) which provided for the transfer of all the assets of PGIM Jennison 20/20 Focus Fund (“Merged Fund”) for shares of PGIM Jennison Focused Growth Fund (the “Acquiring Fund”) and the assumption of the liabilities of the Merged Fund by the Acquiring Fund. Shareholders approved the Plan at a meeting on September 14, 2021 and the reorganization took place at the close of business on December 10, 2021.
On the reorganization date, the Merged Fund had the following total investment cost and value, representing the principal assets acquired by the Acquiring Fund:
| | | | | | | | |
| Merged Fund | | Total Investment
Value | | | Total Investment
Cost | |
PGIM Jennison 20/20 Focus Fund | | | $1,086,288,723 | | | | $847,993,281 | |
The purpose of the transaction was to combine two funds with substantially similar investment objectives, policies and strategies.
The acquisition was accomplished by a tax-free exchange of the following shares on December 10, 2021:
| | | | | | | | | | | | |
| Merged Fund | | | | | Class | | | Shares | |
PGIM Jennison 20/20 Focus Fund | | | | | | | A | | | | 64,068,249 | |
| | | | | | | | C | | | | 5,488,730 | |
| | | | | | | | R* | | | | 4,459,680 | |
| | | | | | | | Z | | | | 11,134,124 | |
| | | | | | | | R6 | | | | 692,500 | |
| | | | | | | | | | | | | |
| Acquiring Fund | | Class | | | Shares | | | Value | |
PGIM Jennison Focused Growth Fund | | | A | | | | 38,251,389 | | | $ | 875,956,816 | |
| | | | C | | | | 1,616,680 | | | | 26,141,722 | |
| | | | Z | | | | 6,914,600 | | | | 176,944,604 | |
| | | | R6 | | | | 437,113 | | | | 11,194,476 | |
| * | Class R shares were converted to Class A shares in the reorganization. |
PGIM Jennison Focused Growth Fund 43
Notes to Financial Statements (continued)
For financial reporting purposes, assets received and shares issued by the Acquiring Fund were recorded at fair value; however, the cost basis of the investments received from the Merged Fund was carried forward to reflect the tax-free status of the acquisition.
The net assets and net unrealized appreciation immediately before the acquisition were as follows:
| | | | | | | | | | | | | | | |
| Merged Fund | | Class | | Unrealized
Appreciation
(Depreciation)
on Investments | | Net Assets |
PGIM Jennison 20/20 Focus Fund | | | | A | | | | | $180,113,683 | | | | | $824,968,399 | |
| | | | | C | | | | | 5,702,782 | | | | | 26,141,722 | |
| | | | | R | | | | | 11,122,958 | | | | | 50,988,417 | |
| | | | | Z | | | | | 38,883,573 | | | | | 176,944,604 | |
| | | | | R6 | | | | | 2,472,446 | | | | | 11,194,476 | |
| | | | | | | | | | |
| | | |
| Acquiring Fund | | Class | | Net Assets |
PGIM Jennison Focused Growth Fund | | | | A | | | | | $512,695,115 | |
| | | | | C | | | | | 56,736,976 | |
| | | | | Z | | | | | 552,998,607 | |
| | | | | R6 | | | | | 200,023,881 | |
Assuming the acquisition had been completed on March 1, 2021, the Acquiring Fund’s unaudited pro forma results of operations for the year ended February 28, 2022 would have been as follows:
| | | | | | |
| Acquiring Fund | | Net
investment
income (loss) (a) | | Net realized and
unrealized gain (loss)
on investments (b) | | Net increase
(decrease) in
net assets resulting
from operations |
PGIM Jennison Focused Growth Fund | | $(11,151,324) | | $(370,576,329) | | $(381,727,653) |
| (a) | Net investment income as reported in the Statement of Operations (year ended February 28, 2022) of the Acquiring Fund, plus net investment loss from the Merged Fund pre-merger as follows: PGIM Jennison 20/20 Focus Fund $(374,023). |
| (b) | Net realized and unrealized gain (loss) on investments as reported in the Statement of Operations (year ended February 28, 2022) of the Acquiring Fund, plus net realized and unrealized loss on investments from the Merged Fund pre-merger as follows: PGIM Jennison 20/20 Focus Fund $(32,654,607). |
Since both the Merged Fund and the Acquiring Fund sold and redeemed shares throughout the period, it is not practicable to provide pro-forma information on a per-share basis.
Since the combined investment Funds had been managed as a single integrated fund since the acquisition was completed, it is also not practicable to separate the amounts of revenue and earnings of the Merged Fund that have been included in the Acquiring Fund’s Statement of Operations since December 10, 2021.
44
11. Recent Regulatory Developments
On December 3, 2020, the SEC announced that it voted to adopt a new rule that establishes an updated regulatory framework for fund valuation practices (the “Rule”). The Rule, in part, provides (i) a framework for determining fair value in good faith and (ii) provides for a fund Board’s assignment of its responsibility for the execution of valuation-related activities to a fund’s investment adviser. Further, the SEC is rescinding previously issued guidance on related issues. The Rule took effect on March 8, 2021, with a compliance date of September 8, 2022. Management is currently evaluating the Rule and its impact to the Fund.
PGIM Jennison Focused Growth Fund 45
Report of Independent Registered Public Accounting Firm
To the Board of Trustees of Prudential Investment Portfolios 3 and Shareholders of PGIM Jennison Focused Growth Fund
Opinion on the Financial Statements
We have audited the accompanying statement of assets and liabilities, including the schedule of investments, of PGIM Jennison Focused Growth Fund (one of the funds constituting Prudential Investment Portfolios 3, referred to hereafter as the “Fund”) as of February 28, 2022, the related statement of operations for the year ended February 28, 2022, the statement of changes in net assets for each of the two years in the period ended February 28, 2022, including the related notes, and the financial highlights for each of the two years in the period ended February 28, 2022 (collectively referred to as the “financial statements”). In our opinion, the financial statements present fairly, in all material respects, the financial position of the Fund as of February 28, 2022, the results of its operations for the year then ended, and the changes in its net assets and the financial highlights for each of the two years in the period ended February 28, 2022 in conformity with accounting principles generally accepted in the United States of America.
The financial statements of the Fund as of and for the year ended February 29, 2020 and the financial highlights for each of the periods ended on or prior to February 29, 2020 (not presented herein, other than the financial highlights) were audited by other auditors whose report dated April 17, 2020 expressed an unqualified opinion on those financial statements and financial highlights.
Basis for Opinion
These financial statements are the responsibility of the Fund’s management. Our responsibility is to express an opinion on the Fund’s financial statements based on our audits. We are a public accounting firm registered with the Public Company Accounting Oversight Board (United States) (PCAOB) and are required to be independent with respect to the Fund in accordance with the U.S. federal securities laws and the applicable rules and regulations of the Securities and Exchange Commission and the PCAOB.
We conducted our audits of these financial statements in accordance with the standards of the PCAOB. Those standards require that we plan and perform the audit to obtain reasonable assurance about whether the financial statements are free of material misstatement, whether due to error or fraud.
Our audits included performing procedures to assess the risks of material misstatement of the financial statements, whether due to error or fraud, and performing procedures that respond to those risks. Such procedures included examining, on a test basis, evidence regarding the amounts and disclosures in the financial statements. Our audits also included evaluating the accounting principles used and significant estimates made by management, as well as evaluating the overall presentation of the financial statements. Our procedures included confirmation of securities owned as of February 28, 2022 by correspondence with the custodian, transfer agent and brokers; when replies were not received from brokers, we performed other auditing procedures. We believe that our audits provide a reasonable basis for our opinion.
/s/PricewaterhouseCoopers LLP
New York, New York
April 20, 2022
We have served as the auditor of one or more investment companies in the PGIM Retail Funds complex since 2020.
46
Tax Information (unaudited)
We are advising you that during the year ended February 28, 2022, the Fund reports the maximum amount allowed per share but not less than $2.67 for Class A, C, Z and R6 shares as a capital gain distribution in accordance with Section 852(b)(3)(C) of the Internal Revenue Code.
For the year ended February 28, 2022, the Fund reports, in accordance with Section 854 of the Internal Revenue Code, the following percentages of the ordinary income dividends paid as 1) qualified dividend income (QDI); and 2) eligible for corporate dividends received deduction (DRD):
| | | | | | | | |
| | | QDI | | | DRD | |
PGIM Jennison Focused Growth Fund | | | 2.72 | % | | | 2.21 | % |
In January 2023, you will be advised on IRS Form 1099-DIV or substitute 1099-DIV as to the federal tax status of distributions received by you in calendar year 2022.
PGIM Jennison Focused Growth Fund 47
INFORMATION ABOUT BOARD MEMBERS AND OFFICERS (unaudited)
Information about Board Members and Officers of the Fund is set forth below. Board Members who are not deemed to be “interested persons” of the Fund, as defined in the 1940 Act, are referred to as “Independent Board Members.” Board Members who are deemed to be “interested persons” of the Fund are referred to as “Interested Board Members.” The Board Members are responsible for the overall supervision of the operations of the Fund and perform the various duties imposed on the directors of investment companies by the 1940 Act. The Board in turn elects the Officers, who are responsible for administering the day-to-day operations of the Fund.
| | | | | | |
| Independent Board Members | | | | |
| | | | |
Name Year of Birth Position(s) Portfolios Overseen | | Principal Occupation(s) During Past Five Years | | Other Directorships Held During Past Five Years | | Length of
Board Service |
| | | | |
Ellen S. Alberding 1958 Board Member Portfolios Overseen: 95 | | President and Board Member, The Joyce Foundation (charitable foundation) (since 2002); formerly Vice Chair, City Colleges of Chicago (community college system) (2011-2015); Trustee, National Park Foundation (charitable foundation for national park system) (2009-2018); Trustee, Economic Club of Chicago (2009-2016); Trustee, Loyola University (since 2018). | | None. | | Since September 2013 |
| | | | |
Kevin J. Bannon 1952 Board Member Portfolios Overseen: 95 | | Retired; formerly Managing Director (April 2008-May 2015) and Chief Investment Officer (October 2008-November 2013) of Highmount Capital LLC (registered investment adviser); formerly Executive Vice President and Chief Investment Officer (April 1993-August 2007) of Bank of New York Company; President (May 2003-May 2007) of BNY Hamilton Family of Mutual Funds. | | Director of Urstadt Biddle Properties (equity real estate investment trust) (since September 2008). | | Since July 2008 |
PGIM Jennison Focused Growth Fund
| | | | | | |
| Independent Board Members | | | | |
| | | | |
Name Year of Birth Position(s) Portfolios Overseen | | Principal Occupation(s) During Past Five Years | | Other Directorships Held During Past Five Years | | Length of
Board Service |
| | | | |
Linda W. Bynoe 1952 Board Member Portfolios Overseen: 92 | | President and Chief Executive Officer (since March 1995) and formerly Chief Operating Officer (December 1989-February 1995) of Telemat Limited LLC (formerly Telemat Ltd) (management consulting); formerly Vice President (January 1985-June 1989) at Morgan Stanley & Co. (broker-dealer). | | Trustee of Equity Residential (residential real estate) (since December 2009); Director of Northern Trust Corporation (financial services) (since April 2006); formerly Director of Anixter International, Inc. (communication products distributor) (January 2006-June 2020). | | Since March 2005 |
| | | | |
Barry H. Evans 1960 Board Member Portfolios Overseen: 94 | | Retired; formerly President (2005-2016), Global Chief Operating Officer (2014-2016), Chief Investment Officer - Global Head of Fixed Income (1998-2014), and various portfolio manager roles (1986-2006), Manulife Asset Management (asset management). | | Formerly Director, Manulife Trust Company (2011-2018); formerly Director, Manulife Asset Management Limited (2015-2017); formerly Chairman of the Board of Directors of Manulife Asset Management U.S. (2005-2016); formerly Chairman of the Board, Declaration Investment Management and Research (2008-2016). | | Since September 2017 |
| | | | |
Keith F. Hartstein 1956 Board Member & Independent Chair Portfolios Overseen: 95 | | Retired; Member (since November 2014) of the Governing Council of the Independent Directors Council (IDC) (organization of independent mutual fund directors); formerly Executive Committee of the IDC Board of Governors (October 2019-December 2021); formerly President and Chief Executive Officer (2005-2012), Senior Vice President (2004-2005), Senior Vice President of Sales and Marketing (1997-2004), and various executive management positions (1990-1997), John Hancock Funds, LLC (asset management); Chairman, Investment Company Institute’s Sales Force Marketing Committee (2003-2008). | | None. | | Since September 2013 |
Visit our website at pgim.com/investments
| | | | | | |
| Independent Board Members | | | | |
| | | | |
Name Year of Birth Position(s) Portfolios Overseen | | Principal Occupation(s) During Past Five Years | | Other Directorships Held During Past Five Years | | Length of
Board Service |
| | | | |
Laurie Simon Hodrick 1962 Board Member Portfolios Overseen: 91 | | A. Barton Hepburn Professor Emerita of Economics in the Faculty of Business, Columbia Business School (since 2018); Visiting Fellow at the Hoover Institution, Stanford University (since 2015); Sole Member, ReidCourt LLC (since 2008) (a consulting firm); formerly Visiting Professor of Law, Stanford Law School (2015-2021); formerly A. Barton Hepburn Professor of Economics in the Faculty of Business, Columbia Business School (1996-2017); formerly Managing Director, Global Head of Alternative Investment Strategies, Deutsche Bank (2006-2008). | | Independent Director, Andela (since January 2022) (global talent network); Independent Director, Roku (since December 2020) (communication services); formerly Independent Director, Synnex Corporation (2019-2021) (information technology); formerly Independent Director, Kabbage, Inc. (2018-2020) (financial services); formerly Independent Director, Corporate Capital Trust (2017-2018) (a business development company). | | Since September 2017 |
| | | | |
Brian K. Reid 1961 Board Member Portfolios Overseen: 94 | | Retired; formerly Chief Economist for the Investment Company Institute (ICI) (2005-2017); formerly Senior Economist and Director of Industry and Financial Analysis at the ICI (1998-2004); formerly Senior Economist, Industry and Financial Analysis at the ICI (1996-1998); formerly Staff Economist at the Federal Reserve Board (1989-1996); Director, ICI Mutual Insurance Company (2012-2017). | | None. | | Since March 2018 |
PGIM Jennison Focused Growth Fund
| | | | | | |
| Independent Board Members | | | | |
| | | | |
Name Year of Birth Position(s) Portfolios Overseen | | Principal Occupation(s) During Past Five Years | | Other Directorships Held During Past Five Years | | Length of Board Service |
| | | | |
Grace C. Torres 1959 Board Member Portfolios Overseen: 94 | | Retired; formerly Treasurer and Principal Financial and Accounting Officer of the PGIM Funds, Target Funds, Advanced Series Trust, Prudential Variable Contract Accounts and The Prudential Series Fund (1998-June 2014); Assistant Treasurer (March 1999-June 2014) and Senior Vice President (September 1999-June 2014) of PGIM Investments LLC; Assistant Treasurer (May 2003-June 2014) and Vice President (June 2005-June 2014) of AST Investment Services, Inc.; Senior Vice President and Assistant Treasurer (May 2003-June 2014) of Prudential Annuities Advisory Services, Inc. | | Director (since January 2018) of OceanFirst Financial Corp. and OceanFirst Bank; formerly Director (July 2015-January 2018) of Sun Bancorp, Inc. N.A. and Sun National Bank. | | Since November 2014 |
| | | | | | |
| Interested Board Members | | | | |
| | | | |
Name Year of Birth Position(s) Portfolios Overseen | | Principal Occupation(s) During Past Five Years | | Other Directorships Held During Past Five Years | | Length of Board Service |
| | | | |
Stuart S. Parker 1962 Board Member & President Portfolios Overseen: 94 | | President, Chief Executive Officer, Chief Operating Officer and Officer in Charge of PGIM Investments LLC (formerly known as Prudential Investments LLC) (since January 2012); formerly Executive Vice President of Jennison Associates LLC and Head of Retail Distribution of PGIM Investments LLC (June 2005-December 2011); Investment Company Institute - Board of Governors (since May 2012). | | None. | | Since January 2012 |
Visit our website at pgim.com/investments
| | | | | | |
| Interested Board Members | | | | |
| | | | |
Name Year of Birth Position(s) Portfolios Overseen | | Principal Occupation(s) During Past Five Years | | Other Directorships Held During Past Five Years | | Length of Board Service |
| | | | |
Scott E. Benjamin 1973 Board Member & Vice President Portfolios Overseen: 95 | | Executive Vice President (since May 2009) of PGIM Investments LLC; Vice President (since June 2012) of Prudential Investment Management Services LLC; Executive Vice President (since September 2009) of AST Investment Services, Inc.; Senior Vice President of Product Development and Marketing, PGIM Investments (since February 2006); formerly Vice President of Product Development and Product Management, PGIM Investments LLC (2003-2006). | | None. | | Since March 2010 |
| | | | |
| | | |
| Fund Officers(a) | | | | |
| | | |
Name Year of Birth Fund Position | | Principal Occupation(s) During Past Five Years | | Length of Service as
Fund Officer |
| | | |
Claudia DiGiacomo 1974 Chief Legal Officer | | Chief Legal Officer, Executive Vice President and Secretary of PGIM Investments LLC (since August 2020); Chief Legal Officer of Prudential Mutual Fund Services LLC (since August 2020); Chief Legal Officer of PIFM Holdco, LLC (since August 2020); Vice President and Corporate Counsel (since January 2005) of Prudential; and Corporate Counsel of AST Investment Services, Inc. (since August 2020); formerly Vice President and Assistant Secretary of PGIM Investments LLC (2005-2020); formerly Associate at Sidley Austin Brown & Wood LLP (1999-2004). | | Since December 2005 |
| | | |
Isabelle Sajous 1976 Chief Compliance Officer | | Chief Compliance Officer (since April 2022) of the PGIM Funds, Target Funds, PGIM Global High Yield Fund, Inc., PGIM High Yield Bond Fund, Inc., PGIM Short Duration High Yield Opportunities Fund, Advanced Series Trust, The Prudential Series Fund and Prudential’s Gibraltar Fund, Inc.; Chief Compliance Officer (since March 2022) of the PGIM Private Real Estate Fund; Vice President, Compliance of PGIM Investments LLC (since December 2020); formerly Director, Compliance (July 2018-December 2020) of Credit Suisse Asset Management LLC; and Vice President, Associate General Counsel & Deputy Chief Compliance Officer of Cramer Rosenthal McGlynn, LLC (August 2014-July 2018). | | Since April 2022 |
PGIM Jennison Focused Growth Fund
| | | | |
| | | |
| Fund Officers(a) | | | | |
| | | |
Name
Year of Birth
Fund Position | | Principal Occupation(s) During Past Five Years | | Length of
Service as Fund
Officer |
| | | |
Andrew R. French
1962
Secretary | | Vice President (since December 2018) of PGIM Investments LLC; formerly Vice President and Corporate Counsel (2010-2018) of Prudential; formerly Director and Corporate Counsel (2006-2010) of Prudential; Vice President and Assistant Secretary (since January 2007) of PGIM Investments LLC; Vice President and Assistant Secretary (since January 2007) of Prudential Mutual Fund Services LLC. | | Since October 2006 |
| | | |
Diana N. Huffman 1982
Assistant Secretary | | Vice President and Corporate Counsel (since September 2015) of Prudential; Vice President and Assistant Secretary (since August 2020) of PGIM Investments LLC; formerly Associate at Willkie Farr & Gallagher LLP (2009-2015). | | Since March 2019 |
| | | |
Melissa Gonzalez
1980
Assistant Secretary | | Vice President and Corporate Counsel (since September 2018) of Prudential; Vice President and Assistant Secretary (since August 2020) of PGIM Investments LLC; formerly Director and Corporate Counsel (March 2014-September 2018) of Prudential. | | Since March 2020 |
| | | |
Patrick E. McGuinness
1986
Assistant Secretary | | Vice President and Assistant Secretary (since August 2020) of PGIM Investments LLC; Director and Corporate Counsel (since February 2017) of Prudential; and Corporate Counsel (2012-2017) of IIL, Inc. | | Since June 2020 |
| | | |
Debra Rubano
1975
Assistant Secretary | | Vice President and Corporate Counsel (since November 2020) of Prudential; formerly Director and Senior Counsel of Allianz Global Investors U.S. Holdings LLC (2010-2020) and Assistant Secretary of numerous funds in the Allianz fund complex (2015-2020). | | Since December 2020 |
| | | |
Kelly A. Coyne
1968
Assistant Secretary | | Director, Investment Operations of Prudential Mutual Fund Services LLC (since 2010). | | Since March 2015 |
| | | |
Christian J. Kelly
1975
Treasurer and Principal Financial
and Accounting Officer | | Vice President, Head of Fund Administration of PGIM Investments LLC (since November 2018); formerly Director of Fund Administration of Lord Abbett & Co. LLC (2009-2018), Treasurer and Principal Accounting Officer of the Lord Abbett Family of Funds (2017-2018); Director of Accounting, Avenue Capital Group (2008-2009); Senior Manager, Investment Management Practice of Deloitte & Touche LLP (1998-2007). | | Since January 2019 |
| | | |
Lana Lomuti
1967
Assistant Treasurer | | Vice President (since 2007) and Director (2005-2007), within PGIM Investments Fund Administration; formerly Assistant Treasurer (December 2007-February 2014) of The Greater China Fund, Inc. | | Since April 2014 |
| | | |
Russ Shupak 1973
Assistant Treasurer | | Vice President (since 2017) and Director (2013-2017), within PGIM Investments Fund Administration. | | Since October 2019 |
Visit our website at pgim.com/investments
| | | | |
| | | |
| Fund Officers(a) | | | | |
| | | |
Name
Year of Birth
Fund Position | | Principal Occupation(s) During Past Five Years | | Length of
Service as
Fund Officer |
| | | |
Deborah Conway
1969
Assistant Treasurer | | Vice President (since 2017) and Director (2007-2017), within PGIM Investments Fund Administration. | | Since October 2019 |
| | | |
Elyse M. McLaughlin
1974
Assistant Treasurer | | Vice President (since 2017) and Director (2011-2017), within PGIM Investments Fund Administration. | | Since October 2019 |
| | | |
Jonathan Corbett
1983
Anti-Money Laundering Compliance Officer | | Vice President, Corporate Compliance, Global Compliance Programs and Compliance Risk Management (since August 2019) of Prudential; formerly Vice President and Head of Key Risk Areas Compliance (March 2016 to July 2019), Chief Privacy Officer (March 2016 to July 2019) and Head of Global Financial Crimes Unit (April 2014 to March 2016) at MetLife. | | Since October 2021 |
(a) Excludes Mr. Parker and Mr. Benjamin, interested Board Members who also serve as President and Vice President, respectively.
Explanatory Notes to Tables:
| ∎ | | Board Members are deemed to be “Interested,” as defined in the 1940 Act, by reason of their affiliation with PGIM Investments LLC and/or an affiliate of PGIM Investments LLC. |
| ∎ | | Unless otherwise noted, the address of all Board Members and Officers is c/o PGIM Investments LLC, 655 Broad Street, Newark, New Jersey 07102-4410. |
| ∎ | | There is no set term of office for Board Members or Officers. The Board Members have adopted a retirement policy, which calls for the retirement of Board Members on December 31 of the year in which they reach the age of 75. |
| ∎ | | “Other Directorships Held” includes all directorships of companies required to register or file reports with the SEC under the 1934 Act (that is, “public companies”) or other investment companies registered under the 1940 Act. |
| ∎ | | “Portfolios Overseen” includes all investment companies managed by PGIM Investments LLC. The investment companies for which PGIM Investments LLC serves as manager include the PGIM Funds, Target Funds, The Prudential Variable Contract Accounts, PGIM ETF Trust, PGIM High Yield Bond Fund, Inc., PGIM Global High Yield Fund, Inc., PGIM Short Duration High Yield Opportunities Fund, The Prudential Series Fund, Prudential’s Gibraltar Fund, Inc. and the Advanced Series Trust. |
| ∎ | | As used in the Fund Officers table “Prudential” means The Prudential Insurance Company of America. |
PGIM Jennison Focused Growth Fund
| | | | | | | | | | |
∎ | | MAIL 655 Broad Street Newark, NJ 07102 | | ∎ | | TELEPHONE (800) 225-1852 | | ∎ | | WEBSITE pgim.com/investments |
|
PROXY VOTING The Board of Trustees of the Fund has delegated to the Fund’s subadviser the responsibility for voting any proxies and maintaining proxy recordkeeping with respect to the Fund. A description of these proxy voting policies and procedures is available without charge, upon request, by calling (800) 225-1852 or by visiting the Securities and Exchange Commission’s website at sec.gov. Information regarding how the Fund voted proxies relating to portfolio securities during the most recent 12-month period ended June 30 is available on the Fund’s website and on the Securities and Exchange Commission’s website. |
|
TRUSTEES Ellen S. Alberding ● Kevin J. Bannon ● Scott E. Benjamin ● Linda W. Bynoe ● Barry H. Evans ● Keith F. Hartstein ● Laurie Simon Hodrick ● Stuart S. Parker ● Brian K. Reid ● Grace C. Torres |
|
OFFICERS Stuart S. Parker, President ● Scott E. Benjamin, Vice President ● Christian J. Kelly, Treasurer and Principal Financial and Accounting Officer ● Claudia DiGiacomo, Chief Legal Officer ● Isabelle Sajous, Chief Compliance Officer ● Jonathan Corbett, Anti-Money Laundering Compliance Officer ● Andrew R. French, Secretary ● Melissa Gonzalez, Assistant Secretary ● Diana N. Huffman, Assistant Secretary ● Kelly A. Coyne, Assistant Secretary ● Patrick E. McGuinness, Assistant Secretary ● Debra Rubano, Assistant Secretary ● Lana Lomuti, Assistant Treasurer ● Russ Shupak, Assistant Treasurer ● Elyse M. McLaughlin, Assistant Treasurer ● Deborah Conway, Assistant Treasurer |
| | | | |
| | |
MANAGER | | PGIM Investments LLC | | 655 Broad Street Newark, NJ 07102 |
| | |
SUBMANAGER | | PGIM, Inc. | | 655 Broad Street Newark, NJ 07102 |
| | |
SUBADVISER | | Jennison Associates LLC | | 466 Lexington Avenue New York, NY 10017 |
| | |
DISTRIBUTOR | | Prudential Investment Management Services LLC | | 655 Broad Street Newark, NJ 07102 |
| | |
CUSTODIAN | | The Bank of New York Mellon | | 240 Greenwich Street New York, NY 10286 |
| | |
TRANSFER AGENT | | Prudential Mutual Fund Services LLC | | PO Box 9658 Providence, RI 02940 |
| | |
INDEPENDENT REGISTERED PUBLIC ACCOUNTING FIRM | | PricewaterhouseCoopers LLP | | 300 Madison Avenue New York, NY 10017 |
| | |
FUND COUNSEL | | Willkie Farr & Gallagher LLP | | 787 Seventh Avenue New York, NY 10019 |
|
| An investor should consider the investment objectives, risks, charges, and expenses of the Fund carefully before investing. The prospectus and summary prospectus contain this and other information about the Fund. An investor may obtain the prospectus and summary prospectus by visiting our website at pgim.com/investments or by calling (800) 225-1852. The prospectus and summary prospectus should be read carefully before investing. |
|
E-DELIVERY To receive your mutual fund documents online, go to pgim.com/investments/resource/edelivery and enroll. Instead of receiving printed documents by mail, you will receive notification via email when new materials are available. You can cancel your enrollment or change your email address at any time by visiting the website address above. |
|
SHAREHOLDER COMMUNICATIONS WITH TRUSTEES Shareholders can communicate directly with the Board of Trustees by writing to the Chair of the Board, PGIM Jennison Focused Growth Fund PGIM Investments, Attn: Board of Trustees, 655 Broad Street, Newark, NJ 07102. Shareholders can communicate directly with an individual Trustee by writing to that Trustee at the same address. Communications are not screened before being delivered to the addressee. |
|
AVAILABILITY OF PORTFOLIO HOLDINGS The Fund files its complete schedule of portfolio holdings with the Securities and Exchange Commission on Form N-PORT. The Fund’s Form N-PORT filings are available on the Commission’s website at sec.gov. Form N-PORT is filed with the Commission quarterly, and each Fund’s full portfolio holdings as of the first and third fiscal quarter-ends will be made publicly available 60 days after the end of each quarter at sec.gov. |
|
| The Fund’s Statement of Additional Information contains additional information about the Fund’sTrustees and is available without charge, upon request, by calling (800) 225-1852. |
Mutual Funds:
| | | | |
| | | |
ARE NOT INSURED BY THE FDIC OR ANY FEDERAL GOVERNMENT AGENCY | | MAY LOSE VALUE | | ARE NOT A DEPOSIT OF OR GUARANTEED BY ANY BANK OR ANY BANK AFFILIATE |
PGIM JENNISON FOCUSED GROWTH FUND
| | | | | | | | |
| SHARE CLASS | | A | | C | | Z | | R6 |
| NASDAQ | | SPFAX | | SPFCX | | SPFZX | | PSGQX |
| CUSIP | | 74440K504 | | 74440K702 | | 74440K868 | | 7444OK751 |
MF500E

PGIM QUANT SOLUTIONS LARGE-CAP VALUE FUND
Formerly known as PGIM QMA Large-Cap Value Fund
ANNUAL REPORT
FEBRUARY 28, 2022

|
To enroll in e-delivery, go to pgim.com/investments/resource/edelivery |
Table of Contents
This report is not authorized for distribution to prospective investors unless preceded or accompanied by a current prospectus.
The information about the Fund’s portfolio holdings is for the period covered by this report and is subject to change thereafter.
The accompanying financial statements as of February 28, 2022 were not audited and, accordingly, no auditor’s opinion is expressed on them.
Mutual funds are distributed by Prudential Investment Management Services LLC, a Prudential Financial company and member SIPC. PGIM Quantitative Solutions is the primary business name of PGIM Quantitative Solutions LLC (formerly known as QMA LLC), a wholly owned subsidiary of PGIM, Inc. (PGIM), a registered investment adviser and Prudential Financial company. © 2022 Prudential Financial, Inc. and its related entities. PGIM and the PGIM logo are service marks of Prudential Financial, Inc. and its related entities, registered in many jurisdictions worldwide.
| | |
| 2 | | Visit our website at pgim.com/investments |
Letter from the President
| | |

| | Dear Shareholder: |
| | We hope you find the annual report for the PGIM Quant Solutions Large-Cap Value Fund informative and useful. The report covers performance for the 12-month period that ended February 28, 2022. |
| | The global economy and markets continued to recover throughout the period from the ongoing impact of the COVID-19 pandemic. The Federal Reserve (the Fed) kept interest rates near zero to promote borrowing, while the approval of effective vaccines encouraged states to reopen their economies. Yet inflation surged to a 40-year high near the end of the period, prompting the Fed to signal it would begin raising rates to combat rising consumer prices. |
Stocks rallied for much of the period, with ongoing stimulus programs helping boost the job market and corporate profits. Equity markets rose to record levels but became much more volatile later on as investors worried that supply-chain challenges, the emergence of more contagious variants, and geopolitical uncertainty in Europe relating to Russia’s invasion of Ukraine might stall the recovery. For the period, large-cap US equities and stocks in developed foreign markets rose. Emerging market and small-cap US stocks fell.
Fixed income investors turned cautious during the period. Investment-grade bonds in the US and the overall global bond market, along with emerging market debt, posted negative returns for the period. US high yield corporate bonds posted a small gain.
Regarding your investments with PGIM, we believe it is important to maintain a diversified portfolio of funds consistent with your tolerance for risk, time horizon, and financial goals. Your financial advisor can help you create a diversified investment plan that may include funds covering all the basic asset classes and that reflects your personal investor profile and risk tolerance. However, diversification and asset allocation strategies do not assure a profit or protect against loss in declining markets.
At PGIM Investments, we provide access to active investment strategies across the global markets in the pursuit of consistent outperformance for investors. PGIM is a top-10 investment manager globally with more than $1.5 trillion in assets under management. Our scale and investment expertise allow us to deliver a diversified suite of actively managed solutions across a broad spectrum of asset classes and investment styles.
Thank you for choosing our family of funds.
Sincerely,

Stuart S. Parker, President
PGIM Quant Solutions Large-Cap Value Fund
April 15, 2022
| | |
PGIM Quant Solutions Large-Cap Value Fund | | 3 |
Your Fund’s Performance (unaudited)
Performance data quoted represent past performance. Past performance does not guarantee future results. The investment return and principal value of an investment will fluctuate so that an investor’s shares, when redeemed, may be worth more or less than their original cost. Current performance may be lower or higher than the past performance data quoted. An investor may obtain performance data as of the most recent month-end by visiting our website at pgim.com/investments or by calling (800) 225-1852.
| | | | | | | | | | |
| |
| | | Average Annual Total Returns as of 2/28/22 | |
| | | | |
| | | One Year (%) | | Five Years (%) | | Ten Years (%) | | Since Inception (%) | |
| | | | |
Class A | | | | | | | | | | |
| | | | |
(with sales charges) | | 12.58 | | 5.75 | | 9.58 | | | — | |
| | | | |
(without sales charges) | | 19.13 | | 6.95 | | 10.20 | | | — | |
| | | | |
Class C | | | | | | | | | | |
| | | | |
(with sales charges) | | 16.97 | | 5.93 | | 9.27 | | | — | |
| | | | |
(without sales charges) | | 17.97 | | 5.93 | | 9.27 | | | — | |
| | | | |
Class R | | | | | | | | | | |
| | | | |
(without sales charges) | | 18.91 | | 6.74 | | N/A | | | 7.70 (06/19/2015) | |
| | | | |
Class Z | | | | | | | | | | |
| | | | |
(without sales charges) | | 19.58 | | 7.31 | | 10.53 | | | — | |
| | | | |
Class R6 | | | | | | | | | | |
| | | | |
(without sales charges) | | 19.52 | | N/A | | N/A | | | 7.84 (04/26/2017) | |
| | | | |
Russell 1000 Value Index | | | | | | | | | | |
| | | | |
| | 14.99 | | 9.45 | | 11.71 | | | — | |
| | | | |
S&P 500 Index | | | | | | | | | | |
| | | | |
| | | 16.38 | | 15.17 | | 14.58 | | | — | |
| | | | |
|
| Average Annual Total Returns as of 2/28/22 Since Inception (%) |
| | |
| | | Class R (06/19/2015) | | Class R6 (04/26/2017) |
| | |
Russell 1000 Value Index | | 9.76 | | 10.07 |
| | |
�� S&P 500 Index | | 14.08 | | 15.46 |
Since Inception returns are provided for any share class with less than 10 fiscal years of returns. Since Inception returns for the Indexes are measured from the closest month-end to the class’ inception date.
| | |
| 4 | | Visit our website at pgim.com/investments |
Growth of a $10,000 Investment (unaudited)
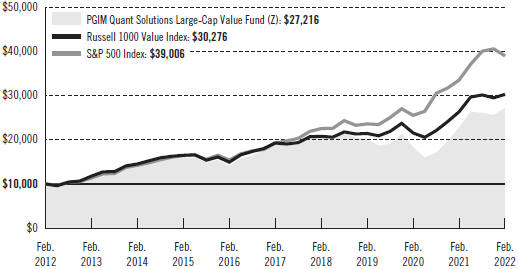
The graph compares a $10,000 investment in the Fund’s Class Z shares with a similar investment in the Russell 1000 Value Index and the S&P 500 Index by portraying the initial account values at the beginning of the 10-year period for Class Z shares (February 29, 2012) and the account values at the end of the current fiscal year (February 28, 2022), as measured on a quarterly basis. For purposes of the graph, and unless otherwise indicated, it has been assumed that (a) all recurring fees (including management fees) were deducted and (b) all dividends and distributions were reinvested. The line graph provides information for Class Z shares only. As indicated in the tables provided earlier, performance for other share classes will vary due to the differing charges and expenses applicable to each share class (as indicated in the following paragraphs). Without waiver of fees and/or expense reimbursements, if any, the returns would have been lower.
Past performance does not predict future performance. Total returns and the ending account values in the graph include changes in share price and reinvestment of dividends and capital gains distributions in a hypothetical investment for the periods shown. The Fund’s total returns do not reflect the deduction of income taxes on an individual’s investment. Taxes may reduce your actual investment returns on income or gains paid by the Fund or any gains you may realize if you sell your shares.
| | |
PGIM Quant Solutions Large-Cap Value Fund | | 5 |
Your Fund’s Performance (continued)
The returns in the tables do not reflect the deduction of taxes that a shareholder would pay on Fund distributions or following the redemption of Fund shares. The average annual total returns take into account applicable sales charges, which are described for each share class in the table below.
| | | | | | | | | | |
| | | | | | |
| | | Class A | | Class C | | Class R | | Class Z | | Class R6 |
| | | | | | |
Maximum initial sales charge | | 5.50% of the public offering price | | None | | None | | None | | None |
| | | | | | |
Contingent deferred sales charge (CDSC) (as a percentage of the lower of the original purchase price or the net asset value at redemption) | | 1.00% on sales of $1 million or more made within 12 months of purchase | | 1.00% on sales made within 12 months of purchase | | None | | None | | None |
| | | | | | |
Annual distribution and service (12b-1) fees (shown as a percentage of average daily net assets) | | 0.30%
(0.25% currently) | | 1.00% | | 0.75%
(0.50% currently) | | None | | None |
Benchmark Definitions
Russell 1000 Value Index—The Russell 1000 Value Index is an unmanaged index comprising those securities in the Russell 1000 Index with a below-average growth orientation. Companies in this index generally have low price-to-book and price-to-earnings ratios, higher dividend yields, and lower forecasted growth values.
S&P 500 Index*—The S&P 500 Index is an unmanaged index of over 500 stocks of large US public companies. It gives a broad look at how stock prices in the United States have performed.
*The S&P 500 Index (“Index”) is a product of S&P Dow Jones Indices LLC and/or its affiliates and has been licensed for use by PGIM, Inc. and/or its affiliates. Copyright © 2022 S&P Dow Jones Indices LLC, a division of S&P Global, Inc., and/or its affiliates. All rights reserved. Redistribution or reproduction in whole or in part are prohibited without written permission of S&P Dow Jones Indices LLC. For more information on any of S&P Dow Jones Indices LLC’s indices please visit www.spdji.com. S&P® is a registered trademark of S&P Global and Dow Jones® is a registered trademark of Dow Jones Trademark Holdings LLC.
Investors cannot invest directly in an index. The returns for the Indexes would be lower if they included the effects of sales charges, operating expenses of a mutual fund, or taxes that may be paid by an investor.
| | |
| 6 | | Visit our website at pgim.com/investments |
Presentation of Fund Holdings as of 2/28/22
| | | | |
| | |
| Ten Largest Holdings | | Line of Business | | % of Net Assets |
| | |
Berkshire Hathaway, Inc. (Class B Stock) | | Diversified Financial Services | | 3.0% |
| | |
JPMorgan Chase & Co. | | Banks | | 2.3% |
| | |
Bank of America Corp. | | Banks | | 2.1% |
| | |
Exxon Mobil Corp. | | Oil, Gas & Consumable Fuels | | 1.9% |
| | |
Chevron Corp. | | Oil, Gas & Consumable Fuels | | 1.7% |
| | |
Wells Fargo & Co. | | Banks | | 1.6% |
| | |
Johnson & Johnson | | Pharmaceuticals | | 1.5% |
| | |
UnitedHealth Group, Inc. | | Health Care Providers & Services | | 1.4% |
| | |
Intel Corp. | | Semiconductors & Semiconductor Equipment | | 1.4% |
| | |
Verizon Communications, Inc. | | Diversified Telecommunication Services | | 1.4% |
Holdings reflect only long-term investments and are subject to change.
| | |
| PGIM Quant Solutions Large-Cap Value Fund | | 7 |
Strategy and Performance Overview* (unaudited)
How did the Fund perform?
The PGIM Quant Solutions Large-Cap Value Fund’s Class Z shares returned 19.58% in the 12-month reporting period that ended February 28, 2022, outperforming the 14.99% return of the Russell 1000 Value Index (the Index).
What were the market conditions?
| · | | Although uncertainty about COVID-19 and its Delta and Omicron variants hovered over the markets during the reporting period, investors remained focused on COVID-19 vaccines and treatments that showed significant effectiveness in combating the virus. This boosted investors’ expectations for a recovery in many of the sectors that had been most negatively affected in the early stages of the pandemic and helped fuel the market rally. US equity markets were also buoyed by ongoing federal fiscal stimulus and accommodative monetary policy, improving employment and gross domestic product data, and stronger-than-expected corporate earnings. At the end of the period, however, markets cooled as investors grew increasingly concerned about persistent inflation, higher interest rates, and Russia’s invasion of Ukraine. |
| · | | US large-cap equities outperformed their mid-cap and small-cap counterparts during the period. Large-cap stocks (as measured by the Russell 1000 Index) gained 13.72%, mid-cap stocks (as measured by the Russell Midcap Index) rose 7.07%, and small-cap stocks (as measured by the Russell 2000 Index) declined 6.01%. |
| · | | Value stocks outperformed growth stocks within each of the market-cap indices. In the large-cap space, the Index gained 14.99% during the period, outperforming the 12.55% return of the Russell 1000 Growth Index. |
What worked?
| · | | PGIM Quantitative Solutions uses a systematic process to select large-cap stocks that trade at a discount to their fundamental value and show positive business prospects. The model focuses on deep-value stocks—those characterized by high earnings yields, cash flow yields, and book yields. |
| · | | During the period, the model’s emphasis on deep-value stocks drove the Fund’s strong relative performance, as undervalued stocks outperformed their more overvalued counterparts within the Index. Even when equity markets fell at the start of 2022, value stocks continued to fare better than growth stocks, with deep-value stocks outperforming their more expensive counterparts within the Index. |
| · | | The Fund outperformed the Index in 10 of the Index’s 11 sectors, with the strongest relative performance in materials, energy, and financials. |
| · | | In materials, the Fund’s relative gains were driven by its overweight positions relative to the Index in inexpensive steel producers, which returned nearly 86% for the period. During the period, steel prices surged to their highest levels in more than a decade, as supply struggled to keep up with strong demand. |
| · | | In energy, overweight positions relative to the Index in inexpensive exploration & production, refining, and integrated companies contributed the most to the Fund’s |
| | |
| 8 | | Visit our website at pgim.com/investments |
| | outperformance. Energy, which had been the worst-performing sector in the Index during each of the three preceding periods, was the best-performing sector during the current period, bolstered by a surge in crude oil prices to multi-year highs. Fueled by increased global demand, restrained supply from both OPEC+ and US producers, and escalation of the Russia-Ukraine conflict, the price of benchmark Brent crude oil topped $100 a barrel in February 2022, more than five times the recent low of $20 set in the spring of 2020. |
| · | | In financials, the Fund’s relative gains were driven by its overweight positions relative to the Index in inexpensive banks and insurers, which reported several quarters of stronger-than-expected profits during the period. Numerous financial companies rank among the most attractive stocks in PGIM Quant Solutions’ valuation model, making financials the most overweight sector in the Fund. |
| · | | The Fund also benefited considerably during the period from underweight positions in several expensive information technology services, entertainment, and industrial conglomerate stocks that underperformed the Index. |
| · | | In security selection, top relative contributors included Nucor Corp., Biogen Inc., Ford Motor Co., The Mosaic Co., and The Walt Disney Co. |
What didn’t work?
| · | | The Fund’s return slightly lagged the Index in the consumer discretionary sector. |
| · | | In security selection, top relative detractors included Qurate Retail Inc., Foot Locker Inc., Sage Therapeutics Inc., Mohawk Industries Inc., and Xerox Holdings Corp. |
Current outlook
| · | | Domestic equity markets moved meaningfully higher in 2021, as effective COVID-19 vaccines led to reopening of the US economy and improvement in the fortunes of the companies most negatively affected by shutdowns and quarantines. As PGIM Quant Solutions expected, the recovery was not linear, as outbreaks of COVID-19 variants caused disruptions along the way and drove a push-pull effect between the more growth-oriented “stay-at-home” stocks and the more cyclical “reopening” stocks that populate the Index. |
| · | | PGIM Quant Solutions believes the recovery in deep-value stocks will continue. The spread in earnings yields between the cheapest and most expensive stocks in the market remains meaningfully wide on an historical basis. Traditionally, when this spread in valuations reverts toward its narrower norm, the payoff to deep-value stocks can be significant. |
| · | | PGIM Quant Solutions’ model continues to identify many attractively valued stocks, and the Fund remains significantly more reasonably valued than the Index, based on various measures of value such as earnings yield, book yield, and cash flow yield. While valuations for the overall market appear somewhat stretched, PGIM Quant Solutions believes that the deeply discounted stocks held by the Fund, coupled with |
| | |
| PGIM Quant Solutions Large-Cap Value Fund | | 9 |
Strategy and Performance Overview* (continued)
| | even moderate earnings growth, offer the prospect of strong relative returns. PGIM Quant Solutions remains committed to investing in these attractively valued names to capture the value premium. |
* This strategy and performance overview, which discusses what strategies or holdings (including derivatives, if applicable) affected the Fund’s performance, is compiled based on how the Fund performed relative to the Fund’s assigned index and is viewed for performance attribution purposes at the aggregate Fund level, which in most instances will not directly correlate to the amounts disclosed in the Statement of Operations which conform to U.S. generally accepted accounting principles.
| | |
| 10 | | Visit our website at pgim.com/investments |
Fees and Expenses (unaudited)
As a shareholder of the Fund, you incur two types of costs: (1) transaction costs, including sales charges (loads) on purchase payments and redemptions, as applicable, and (2) ongoing costs, including management fees, distribution and/or service (12b-1) fees, and other Fund expenses, as applicable. This example is intended to help you understand your ongoing costs (in dollars) of investing in the Fund and to compare these costs with the ongoing costs of investing in other mutual funds.
The example is based on an investment of $1,000 held through the six-month period ended February 28, 2022. The example is for illustrative purposes only; you should consult the Prospectus for information on initial and subsequent minimum investment requirements.
Actual Expenses
The first line for each share class in the table on the following page provides information about actual account values and actual expenses. You may use the information on this line, together with the amount you invested, to estimate the expenses that you paid over the period. Simply divide your account value by $1,000 (for example, an $8,600 account value ÷ $1,000 = 8.6), then multiply the result by the number on the first line under the heading “Expenses Paid During the Six-Month Period” to estimate the expenses you paid on your account during this period.
Hypothetical Example for Comparison Purposes
The second line for each share class in the table on the following page provides information about hypothetical account values and hypothetical expenses based on the Fund’s actual expense ratio and an assumed rate of return of 5% per year before expenses, which is not the Fund’s actual return. The hypothetical account values and expenses may not be used to estimate the actual ending account balance or expenses you paid for the period. You may use this information to compare the ongoing costs of investing in the Fund and other funds. To do so, compare this 5% hypothetical example with the 5% hypothetical examples that appear in the shareholder reports of the other funds.
The Fund’s transfer agent may charge additional fees to holders of certain accounts that are not included in the expenses shown in the table on the following page. These fees apply to individual retirement accounts (IRAs) and Section 403(b) accounts. As of the close of the six-month period covered by the table, IRA fees included an annual maintenance fee of $15 per account (subject to a maximum annual maintenance fee of $25 for all accounts held by the same shareholder). Section 403(b) accounts are charged an annual $25 fiduciary maintenance fee. Some of the fees may vary in amount, or may be waived, based on your total account balance or the number of PGIM funds, including the Fund, that you own. You should consider the additional fees that were charged to your Fund account over the six-month period when you estimate the total ongoing expenses paid over the period and the impact of these fees on your ending account value, as these additional expenses are not reflected in the information
| | |
| PGIM Quant Solutions Large-Cap Value Fund | | 11 |
Fees and Expenses (continued)
provided in the expense table. Additional fees have the effect of reducing investment returns.
Please note that the expenses shown in the table are meant to highlight your ongoing costs only and do not reflect any transactional costs such as sales charges (loads). Therefore, the second line for each share class in the table is useful in comparing ongoing costs only and will not help you determine the relative total costs of owning different funds. In addition, if these transactional costs were included, your costs would have been higher.
| | | | | | | | | | |
| | | | |
PGIM Quant Solutions Large-Cap Value Fund | | Beginning Account Value September 1, 2021 | | Ending Account Value February 28, 2022 | | Annualized Expense Ratio Based on the Six-Month Period | | Expenses Paid During the Six-Month Period* |
| | | | | |
Class A | | Actual | | $1,000.00 | | $1,041.10 | | 1.16% | | $ 5.87 |
| | | | | |
| | Hypothetical | | $1,000.00 | | $1,019.04 | | 1.16% | | $ 5.81 |
Class C | | Actual | | $1,000.00 | | $1,035.90 | | 2.07% | | $10.45 |
| | | | | |
| | Hypothetical | | $1,000.00 | | $1,014.53 | | 2.07% | | $10.34 |
Class R | | Actual | | $1,000.00 | | $1,039.50 | | 1.35% | | $ 6.83 |
| | | | | |
| | Hypothetical | | $1,000.00 | | $1,018.10 | | 1.35% | | $ 6.76 |
Class Z | | Actual | | $1,000.00 | | $1,042.60 | | 0.80% | | $ 4.05 |
| | | | | |
| | Hypothetical | | $1,000.00 | | $1,020.83 | | 0.80% | | $ 4.01 |
Class R6 | | Actual | | $1,000.00 | | $1,042.10 | | 0.80% | | $ 4.05 |
| | | | | |
| | | Hypothetical | | $1,000.00 | | $1,020.83 | | 0.80% | | $ 4.01 |
*Fund expenses (net of fee waivers or subsidies, if any) for each share class are equal to the annualized expense ratio for each share class (provided in the table), multiplied by the average account value over the period, multiplied by the 181 days in the six-month period ended February 28, 2022, and divided by the 365 days in the Fund’s fiscal year ended February 28, 2022 (to reflect the six-month period). Expenses presented in the table include the expenses of any underlying portfolios in which the Fund may invest.
| | |
| 12 | | Visit our website at pgim.com/investments |
Schedule of Investments
as of February 28, 2022
| | | | | | | | |
| | |
| Description | | Shares | | | Value | |
| | |
LONG-TERM INVESTMENTS 99.5% | | | | | | | | |
| | |
COMMON STOCKS | | | | | | | | |
| | |
Aerospace & Defense 1.1% | | | | | | | | |
| | |
Boeing Co. (The)* | | | 2,800 | | | $ | 574,952 | |
General Dynamics Corp. | | | 1,900 | | | | 445,455 | |
L3Harris Technologies, Inc. | | | 800 | | | | 201,848 | |
Raytheon Technologies Corp. | | | 26,901 | | | | 2,762,733 | |
| | | | | | | | |
| | |
| | | | | | 3,984,988 | |
| | |
Air Freight & Logistics 0.4% | | | | | | | | |
| | |
FedEx Corp. | | | 7,500 | | | | 1,667,025 | |
| | |
Airlines 0.2% | | | | | | | | |
| | |
JetBlue Airways Corp.* | | | 45,100 | | | | 688,677 | |
| | |
Auto Components 0.5% | | | | | | | | |
BorgWarner, Inc. | | | 43,100 | | | | 1,767,531 | |
| | |
Automobiles 1.9% | | | | | | | | |
| | |
Ford Motor Co. | | | 185,710 | | | | 3,261,068 | |
General Motors Co.* | | | 66,896 | | | | 3,125,381 | |
Thor Industries, Inc. | | | 6,600 | | | | 597,300 | |
| | | | | | | | |
| | |
| | | | | | 6,983,749 | |
| | |
Banks 12.8% | | | | | | | | |
| | |
Bank of America Corp. | | | 174,511 | | | | 7,713,386 | |
Bank OZK | | | 6,900 | | | | 324,438 | |
BOK Financial Corp. | | | 4,100 | | | | 421,070 | |
Citigroup, Inc. | | | 67,604 | | | | 4,004,185 | |
Citizens Financial Group, Inc. | | | 44,504 | | | | 2,332,900 | |
Fifth Third Bancorp | | | 42,954 | | | | 2,054,919 | |
First Hawaiian, Inc. | | | 2,200 | | | | 63,954 | |
First Horizon Corp. | | | 36,900 | | | | 866,412 | |
FNB Corp. | | | 31,500 | | | | 423,045 | |
Huntington Bancshares, Inc. | | | 43,200 | | | | 670,464 | |
JPMorgan Chase & Co. | | | 59,364 | | | | 8,417,815 | |
KeyCorp | | | 53,690 | | | | 1,346,008 | |
M&T Bank Corp. | | | 8,946 | | | | 1,630,230 | |
PacWest Bancorp | | | 5,200 | | | | 256,984 | |
PNC Financial Services Group, Inc. (The) | | | 7,997 | | | | 1,593,402 | |
Popular, Inc. (Puerto Rico) | | | 7,400 | | | | 679,690 | |
Prosperity Bancshares, Inc. | | | 7,400 | | | | 551,004 | |
Regions Financial Corp. | | | 90,511 | | | | 2,189,461 | |
Truist Financial Corp. | | | 56,868 | | | | 3,538,327 | |
See Notes to Financial Statements.
PGIM Quant Solutions Large-Cap Value Fund 13
Schedule of Investments (continued)
as of February 28, 2022
| | | | | | | | |
| | |
| Description | | Shares | | | Value | |
| | |
COMMON STOCKS (Continued) | | | | | | | | |
| | |
Banks (cont’d.) | | | | | | | | |
| | |
U.S. Bancorp | | | 35,209 | | | $ | 1,990,717 | |
Wells Fargo & Co. | | | 108,832 | | | | 5,808,364 | |
Wintrust Financial Corp. | | | 3,500 | | | | 347,760 | |
| | | | | | | | |
| | |
| | | | | | | 47,224,535 | |
| | |
Beverages 0.6% | | | | | | | | |
| | |
Molson Coors Beverage Co. (Class B Stock) | | | 44,882 | | | | 2,341,943 | |
| | |
Biotechnology 1.6% | | | | | | | | |
| | |
Biogen, Inc.* | | | 6,600 | | | | 1,392,666 | |
Gilead Sciences, Inc. | | | 24,600 | | | | 1,485,840 | |
Regeneron Pharmaceuticals, Inc.* | | | 1,700 | | | | 1,051,212 | |
Sage Therapeutics, Inc.* | | | 59,100 | | | | 2,149,467 | |
| | | | | | | | |
| | |
| | | | | | | 6,079,185 | |
| | |
Capital Markets 4.3% | | | | | | | | |
| | |
Bank of New York Mellon Corp. (The) | | | 49,710 | | | | 2,642,087 | |
Charles Schwab Corp. (The) | | | 2,800 | | | | 236,488 | |
Franklin Resources, Inc. | | | 26,000 | | | | 772,980 | |
Goldman Sachs Group, Inc. (The) | | | 11,490 | | | | 3,921,422 | |
Invesco Ltd. | | | 52,660 | | | | 1,118,498 | |
Janus Henderson Group PLC | | | 20,800 | | | | 698,256 | |
Jefferies Financial Group, Inc. | | | 33,000 | | | | 1,172,820 | |
Morgan Stanley | | | 32,662 | | | | 2,963,750 | |
State Street Corp. | | | 28,518 | | | | 2,433,441 | |
| | | | | | | | |
| | |
| | | | | | | 15,959,742 | |
| | |
Chemicals 3.5% | | | | | | | | |
| | |
Corteva, Inc. | | | 53,100 | | | | 2,762,793 | |
Dow, Inc. | | | 33,800 | | | | 1,992,848 | |
DuPont de Nemours, Inc. | | | 34,336 | | | | 2,656,576 | |
International Flavors & Fragrances, Inc.(a) | | | 15,700 | | | | 2,088,100 | |
LyondellBasell Industries NV (Class A Stock) | | | 17,274 | | | | 1,679,551 | |
Mosaic Co. (The) | | | 33,176 | | | | 1,739,418 | |
| | | | | | | | |
| | |
| | | | | | | 12,919,286 | |
| | |
Communications Equipment 0.8% | | | | | | | | |
| | |
Cisco Systems, Inc. | | | 37,000 | | | | 2,063,490 | |
Viasat, Inc.*(a) | | | 19,000 | | | | 867,160 | |
| | | | | | | | |
| | |
| | | | | | | 2,930,650 | |
See Notes to Financial Statements.
14
| | | | | | | | |
| | |
| Description | | Shares | | | Value | |
| | |
COMMON STOCKS (Continued) | | | | | | | | |
| | |
Construction & Engineering 0.0% | | | | | | | | |
| | |
MDU Resources Group, Inc. | | | 3,200 | | | $ | 85,664 | |
| | |
Consumer Finance 1.3% | | | | | | | | |
| | |
Ally Financial, Inc. | | | 31,134 | | | | 1,553,587 | |
Capital One Financial Corp. | | | 20,741 | | | | 3,178,973 | |
| | | | | | | | |
| | |
| | | | | | | 4,732,560 | |
| | |
Containers & Packaging 0.6% | | | | | | | | |
| | |
Westrock Co. | | | 48,622 | | | | 2,201,118 | |
| | |
Diversified Financial Services 3.5% | | | | | | | | |
| | |
Berkshire Hathaway, Inc. (Class B Stock)* | | | 34,098 | | | | 10,960,802 | |
Equitable Holdings, Inc. | | | 28,680 | | | | 936,689 | |
Voya Financial, Inc. | | | 13,523 | | | | 910,774 | |
| | | | | | | | |
| | |
| | | | | | | 12,808,265 | |
| | |
Diversified Telecommunication Services 3.4% | | | | | | | | |
| | |
AT&T, Inc. | | | 215,503 | | | | 5,105,266 | |
Lumen Technologies, Inc.(a) | | | 226,541 | | | | 2,346,965 | |
Verizon Communications, Inc. | | | 95,616 | | | | 5,131,711 | |
| | | | | | | | |
| | |
| | | | | | | 12,583,942 | |
| | |
Electric Utilities 4.4% | | | | | | | | |
| | |
American Electric Power Co., Inc.(a) | | | 13,500 | | | | 1,223,775 | |
Avangrid, Inc.(a) | | | 35,100 | | | | 1,574,937 | |
Duke Energy Corp. | | | 34,569 | | | | 3,471,073 | |
Edison International | | | 38,100 | | | | 2,416,302 | |
Evergy, Inc. | | | 13,800 | | | | 861,258 | |
Exelon Corp. | | | 47,741 | | | | 2,031,857 | |
NextEra Energy, Inc. | | | 7,400 | | | | 579,198 | |
Pinnacle West Capital Corp. | | | 31,700 | | | | 2,245,311 | |
PPL Corp. | | | 45,478 | | | | 1,190,159 | |
Southern Co. (The) | | | 8,200 | | | | 531,114 | |
| | | | | | | | |
| | |
| | | | | | | 16,124,984 | |
Electronic Equipment, Instruments & Components 1.0% | | | | | | | | |
| | |
Arrow Electronics, Inc.* | | | 7,200 | | | | 877,536 | |
Avnet, Inc. | | | 17,200 | | | | 723,604 | |
TD SYNNEX Corp. | | | 20,200 | | | | 2,056,966 | |
| | | | | | | | |
| | |
| | | | | | | 3,658,106 | |
See Notes to Financial Statements.
PGIM Quant Solutions Large-Cap Value Fund 15
Schedule of Investments (continued)
as of February 28, 2022
| | | | | | | | |
| | |
| Description | | Shares | | | Value | |
| | |
COMMON STOCKS (Continued) | | | | | | | | |
| | |
Energy Equipment & Services 0.2% | | | | | | | | |
| | |
Baker Hughes Co.(a) | | | 30,700 | | | $ | 901,966 | |
| | |
Entertainment 0.7% | | | | | | | | |
| | |
Walt Disney Co. (The)* | | | 16,800 | | | | 2,494,128 | |
| | |
Equity Real Estate Investment Trusts (REITs) 3.5% | | | | | | | | |
| | |
Alexandria Real Estate Equities, Inc. | | | 5,200 | | | | 984,880 | |
Cousins Properties, Inc. | | | 41,900 | | | | 1,618,597 | |
EPR Properties | | | 11,100 | | | | 552,780 | |
Hudson Pacific Properties, Inc. | | | 75,700 | | | | 1,998,480 | |
JBG SMITH Properties | | | 23,900 | | | | 637,652 | |
Medical Properties Trust, Inc. | | | 72,400 | | | | 1,472,616 | |
Omega Healthcare Investors, Inc.(a) | | | 22,000 | | | | 619,740 | |
SL Green Realty Corp.(a) | | | 26,747 | | | | 2,126,921 | |
VICI Properties, Inc. | | | 36,100 | | | | 1,009,356 | |
Weyerhaeuser Co. | | | 44,100 | | | | 1,714,608 | |
| | | | | | | | |
| | |
| | | | | | | 12,735,630 | |
| | |
Food & Staples Retailing 1.4% | | | | | | | | |
| | |
Kroger Co. (The) | | | 27,064 | | | | 1,266,595 | |
Walgreens Boots Alliance, Inc. | | | 56,365 | | | | 2,597,863 | |
Walmart, Inc. | | | 10,052 | | | | 1,358,628 | |
| | | | | | | | |
| | |
| | | | | | | 5,223,086 | |
| | |
Food Products 2.3% | | | | | | | | |
| | |
Archer-Daniels-Midland Co. | | | 36,700 | | | | 2,879,115 | |
Kraft Heinz Co. (The) | | | 67,522 | | | | 2,648,213 | |
Mondelez International, Inc. (Class A Stock) | | | 6,800 | | | | 445,264 | |
Tyson Foods, Inc. (Class A Stock) | | | 27,000 | | | | 2,501,820 | |
| | | | | | | | |
| | |
| | | | | | | 8,474,412 | |
| | |
Gas Utilities 0.2% | | | | | | | | |
| | |
UGI Corp. | | | 15,400 | | | | 591,976 | |
| | |
Health Care Equipment & Supplies 0.4% | | | | | | | | |
| | |
Becton, Dickinson & Co. | | | 900 | | | | 244,152 | |
Medtronic PLC | | | 12,706 | | | | 1,334,003 | |
| | | | | | | | |
| | |
| | | | | | | 1,578,155 | |
| | |
Health Care Providers & Services 5.1% | | | | | | | | |
| | |
Anthem, Inc. | | | 4,300 | | | | 1,942,955 | |
See Notes to Financial Statements.
16
| | | | | | | | |
| | |
| Description | | Shares | | | Value | |
| | |
COMMON STOCKS (Continued) | | | | | | | | |
| | |
Health Care Providers & Services (cont’d.) | | | | | | | | |
| | |
Centene Corp.* | | | 34,900 | | | $ | 2,883,438 | |
Cigna Corp. | | | 14,749 | | | | 3,507,017 | |
CVS Health Corp. | | | 43,887 | | | | 4,548,888 | |
Laboratory Corp. of America Holdings* | | | 2,600 | | | | 705,276 | |
UnitedHealth Group, Inc. | | | 11,200 | | | | 5,329,744 | |
Universal Health Services, Inc. (Class B Stock) | | | 600 | | | | 86,358 | |
| | | | | | | | |
| | |
| | | | | | | 19,003,676 | |
| | |
Hotels, Restaurants & Leisure 0.2% | | | | | | | | |
| | |
McDonald’s Corp. | | | 2,327 | | | | 569,580 | |
| | |
Household Durables 2.4% | | | | | | | | |
| | |
D.R. Horton, Inc. | | | 12,000 | | | | 1,024,800 | |
Lennar Corp. (Class A Stock) | | | 27,581 | | | | 2,478,980 | |
Mohawk Industries, Inc.* | | | 14,700 | | | | 2,069,466 | |
PulteGroup, Inc. | | | 25,600 | | | | 1,271,296 | |
Toll Brothers, Inc. | | | 38,900 | | | | 2,110,714 | |
| | | | | | | | |
| | |
| | | | | | | 8,955,256 | |
| | |
Household Products 1.3% | | | | | | | | |
| | |
Procter & Gamble Co. (The) | | | 29,872 | | | | 4,656,746 | |
| | |
Industrial Conglomerates 0.2% | | | | | | | | |
| | |
General Electric Co. | | | 4,800 | | | | 458,448 | |
Honeywell International, Inc. | | | 1,900 | | | | 360,525 | |
| | | | | | | | |
| | |
| | | | | | | 818,973 | |
| | |
Insurance 7.4% | | | | | | | | |
| | |
Aflac, Inc. | | | 44,033 | | | | 2,689,976 | |
Allstate Corp. (The) | | | 21,597 | | | | 2,642,609 | |
American International Group, Inc. | | | 48,385 | | | | 2,963,097 | |
Arch Capital Group Ltd.* | | | 17,900 | | | | 843,269 | |
Brighthouse Financial, Inc.* | | | 5,500 | | | | 287,430 | |
Chubb Ltd. | | | 17,808 | | | | 3,626,421 | |
CNA Financial Corp. | | | 8,300 | | | | 379,310 | |
Everest Re Group Ltd. | | | 2,800 | | | | 835,016 | |
Fidelity National Financial, Inc. | | | 4,200 | | | | 200,088 | |
First American Financial Corp. | | | 12,400 | | | | 831,296 | |
Hartford Financial Services Group, Inc. (The) | | | 34,849 | | | | 2,421,309 | |
Lincoln National Corp.(a) | | | 14,000 | | | | 943,880 | |
Loews Corp. | | | 15,000 | | | | 920,100 | |
Mercury General Corp. | | | 6,800 | | | | 374,000 | |
See Notes to Financial Statements.
PGIM Quant Solutions Large-Cap Value Fund 17
Schedule of Investments (continued)
as of February 28, 2022
| | | | | | | | |
| | |
| Description | | Shares | | | Value | |
| | |
COMMON STOCKS (Continued) | | | | | | | | |
| | |
Insurance (cont’d.) | | | | | | | | |
| | |
MetLife, Inc. | | | 41,919 | | | $ | 2,831,628 | |
Old Republic International Corp. | | | 40,400 | | | | 1,064,540 | |
Principal Financial Group, Inc. | | | 7,000 | | | | 494,480 | |
Travelers Cos., Inc. (The) | | | 16,414 | | | | 2,820,418 | |
| | | | | | | | |
| | |
| | | | | | | 27,168,867 | |
| | |
Interactive Media & Services 0.4% | | | | | | | | |
| | |
Alphabet, Inc. (Class A Stock)* | | | 300 | | | | 810,342 | |
Alphabet, Inc. (Class C Stock)* | | | 300 | | | | 809,346 | |
| | | | | | | | |
| | |
| | | | | | | 1,619,688 | |
| | |
Internet & Direct Marketing Retail 0.5% | | | | | | | | |
| | |
Qurate Retail, Inc. (Class A Stock) | | | 314,343 | | | | 1,732,030 | |
| | |
IT Services 2.0% | | | | | | | | |
| | |
Alliance Data Systems Corp. | | | 14,900 | | | | 1,005,005 | |
Fidelity National Information Services, Inc. | | | 32,000 | | | | 3,047,360 | |
Fiserv, Inc.* | | | 2,700 | | | | 263,709 | |
Global Payments, Inc. | | | 20,000 | | | | 2,667,600 | |
StoneCo Ltd. (Brazil) (Class A Stock)* | | | 34,000 | | | | 382,160 | |
| | | | | | | | |
| | |
| | | | | | | 7,365,834 | |
| | |
Life Sciences Tools & Services 1.3% | | | | | | | | |
| | |
Bio-Rad Laboratories, Inc. (Class A Stock)* | | | 3,900 | | | | 2,441,244 | |
Danaher Corp. | | | 3,100 | | | | 850,671 | |
Thermo Fisher Scientific, Inc. | | | 2,500 | | | | 1,360,000 | |
| | | | | | | | |
| | |
| | | | | | | 4,651,915 | |
| | |
Machinery 0.4% | | | | | | | | |
| | |
Colfax Corp.* | | | 4,600 | | | | 184,966 | |
Gates Industrial Corp. PLC* | | | 85,000 | | | | 1,346,400 | |
| | | | | | | | |
| | |
| | | | | | | 1,531,366 | |
| | |
Marine 0.1% | | | | | | | | |
| | |
Kirby Corp.* | | | 5,500 | | | | 358,325 | |
| | |
Media 3.0% | | | | | | | | |
| | |
Comcast Corp. (Class A Stock) | | | 105,782 | | | | 4,946,366 | |
Discovery, Inc. (Class A Stock)*(a) | | | 33,500 | | | | 939,675 | |
Discovery, Inc. (Class C Stock)* | | | 36,400 | | | | 1,018,108 | |
See Notes to Financial Statements.
18
| | | | | | | | |
| | |
| Description | | Shares | | | Value | |
| | |
COMMON STOCKS (Continued) | | | | | | | | |
| | |
Media (cont’d.) | | | | | | | | |
| | |
DISH Network Corp. (Class A Stock)*(a) | | | 72,900 | | | $ | 2,329,884 | |
Liberty Media Corp.-Liberty SiriusXM (Class A Stock)* | | | 5,700 | | | | 287,052 | |
Liberty Media Corp.-Liberty SiriusXM (Class C Stock)* | | | 6,500 | | | | 327,080 | |
Paramount Global (Class B Stock) | | | 45,600 | | | | 1,395,816 | |
| | | | | | | | |
| | |
| | | | | | | 11,243,981 | |
| | |
Metals & Mining 1.8% | | | | | | | | |
| | |
Cleveland-Cliffs, Inc.* | | | 8,800 | | | | 196,768 | |
Newmont Corp. | | | 11,900 | | | | 787,780 | |
Nucor Corp. | | | 16,037 | | | | 2,110,790 | |
Reliance Steel & Aluminum Co. | | | 5,759 | | | | 1,099,220 | |
United States Steel Corp.(a) | | | 90,200 | | | | 2,454,342 | |
| | | | | | | | |
| | |
| | | | | | | 6,648,900 | |
| | |
Mortgage Real Estate Investment Trusts (REITs) 0.7% | | | | | | | | |
| | |
AGNC Investment Corp. | | | 72,120 | | | | 931,069 | |
Annaly Capital Management, Inc. | | | 147,200 | | | | 1,024,512 | |
New Residential Investment Corp. | | | 74,650 | | | | 774,867 | |
| | | | | | | | |
| | |
| | | | | | | 2,730,448 | |
| | |
Multiline Retail 0.3% | | | | | | | | |
| | |
Kohl’s Corp.(a) | | | 17,700 | | | | 984,474 | |
| | |
Multi-Utilities 1.5% | | | | | | | | |
| | |
Consolidated Edison, Inc. | | | 30,800 | | | | 2,641,716 | |
Public Service Enterprise Group, Inc. | | | 3,700 | | | | 239,871 | |
Sempra Energy | | | 17,300 | | | | 2,495,006 | |
| | | | | | | | |
| | |
| | | | | | | 5,376,593 | |
| | |
Oil, Gas & Consumable Fuels 8.4% | | | | | | | | |
| | |
Chevron Corp. | | | 43,538 | | | | 6,269,472 | |
ConocoPhillips | | | 36,415 | | | | 3,454,327 | |
Diamondback Energy, Inc. | | | 3,000 | | | | 414,300 | |
DT Midstream, Inc. | | | 13,700 | | | | 727,470 | |
EOG Resources, Inc. | | | 13,500 | | | | 1,551,420 | |
EQT Corp. | | | 54,300 | | | | 1,256,502 | |
Exxon Mobil Corp. | | | 91,371 | | | | 7,165,314 | |
HollyFrontier Corp. | | | 33,500 | | | | 1,020,075 | |
Kinder Morgan, Inc. | | | 101,900 | | | | 1,773,060 | |
Marathon Oil Corp. | | | 64,800 | | | | 1,461,888 | |
Marathon Petroleum Corp. | | | 25,640 | | | | 1,996,587 | |
See Notes to Financial Statements.
PGIM Quant Solutions Large-Cap Value Fund 19
Schedule of Investments (continued)
as of February 28, 2022
| | | | | | | | |
| | |
| Description | | Shares | | | Value | |
| | |
COMMON STOCKS (Continued) | | | | | | | | |
| | |
Oil, Gas & Consumable Fuels (cont’d.) | | | | | | | | |
Phillips 66 | | | 20,300 | | | $ | 1,710,072 | |
Pioneer Natural Resources Co. | | | 3,700 | | | | 886,520 | |
Valero Energy Corp. | | | 15,600 | | | | 1,302,756 | |
| | | | | | | | |
| | |
| | | | | | | 30,989,763 | |
| | |
Pharmaceuticals 4.2% | | | | | | | | |
| | |
Bristol-Myers Squibb Co. | | | 22,800 | | | | 1,565,676 | |
Johnson & Johnson | | | 34,420 | | | | 5,664,499 | |
Merck & Co., Inc. | | | 17,100 | | | | 1,309,518 | |
Perrigo Co. PLC(a) | | | 21,500 | | | | 763,680 | |
Pfizer, Inc. | | | 108,086 | | | | 5,073,557 | |
Viatris, Inc. | | | 90,300 | | | | 994,203 | |
| | | | | | | | |
| | |
| | | | | | | 15,371,133 | |
| | |
Road & Rail 1.0% | | | | | | | | |
| | |
Knight-Swift Transportation Holdings, Inc. | | | 40,400 | | | | 2,200,992 | |
Ryder System, Inc.(a) | | | 19,674 | | | | 1,551,098 | |
| | | | | | | | |
| | |
| | | | | | | 3,752,090 | |
| | |
Semiconductors & Semiconductor Equipment 2.4% | | | | | | | | |
| | |
First Solar, Inc.* | | | 12,800 | | | | 963,712 | |
Intel Corp. | | | 108,664 | | | | 5,183,273 | |
Micron Technology, Inc. | | | 30,703 | | | | 2,728,268 | |
| | | | | | | | |
| | |
| | | | | | | 8,875,253 | |
| | |
Software 0.2% | | | | | | | | |
| | |
salesforce.com, Inc.* | | | 3,500 | | | | 736,855 | |
| | |
Specialty Retail 0.4% | | | | | | | | |
| | |
Foot Locker, Inc.(a) | | | 49,100 | | | | 1,552,542 | |
| | |
Technology Hardware, Storage & Peripherals 1.7% | | | | | | | | |
| | |
Hewlett Packard Enterprise Co. | | | 141,863 | | | | 2,258,459 | |
Western Digital Corp.* | | | 42,000 | | | | 2,139,480 | |
Xerox Holdings Corp. | | | 95,800 | | | | 1,888,218 | |
| | | | | | | | |
| | |
| | | | | | | 6,286,157 | |
| | |
Textiles, Apparel & Luxury Goods 0.6% | | | | | | | | |
| | |
PVH Corp. | | | 21,500 | | | | 2,104,635 | |
See Notes to Financial Statements.
20
| | | | | | | | |
| | |
| Description | | Shares | | | Value | |
| | |
COMMON STOCKS (Continued) | | | | | | | | |
| | |
Thrifts & Mortgage Finance 0.5% | | | | | | | | |
| | |
MGIC Investment Corp. | | | 70,000 | | | $ | 1,062,600 | |
New York Community Bancorp, Inc.(a) | | | 72,200 | | | | 833,188 | |
| | | | | | | | |
| | |
| | | | | | | 1,895,788 | |
| | |
Tobacco 0.2% | | | | | | | | |
| | |
Philip Morris International, Inc. | | | 8,443 | | | | 853,334 | |
| | |
Trading Companies & Distributors 0.6% | | | | | | | | |
| | |
Air Lease Corp. | | | 49,926 | | | | 2,084,910 | |
| | |
Wireless Telecommunication Services 0.1% | | | | | | | | |
| | |
T-Mobile US, Inc.* | | | 2,400 | | | | 295,704 | |
| | | | | | | | |
| | |
TOTAL LONG-TERM INVESTMENTS
(cost $282,502,892) | | | | | | | 366,956,119 | |
| | | | | | | | |
| | |
SHORT-TERM INVESTMENTS 6.2% | | | | | | | | |
| | |
AFFILIATED MUTUAL FUND 6.2% | | | | | | | | |
PGIM Institutional Money Market Fund
(cost $22,666,988; includes $22,666,035 of cash collateral for securities on
loan)(b)(wa) | | | 22,685,351 | | | | 22,667,202 | |
| | | | | | | | |
| | |
UNAFFILIATED FUND 0.0% | | | | | | | | |
Dreyfus Government Cash Management (Institutional Shares)
(cost $929) | | | 929 | | | | 929 | |
| | | | | | | | |
| | |
TOTAL SHORT-TERM INVESTMENTS
(cost $22,667,917) | | | | | | | 22,668,131 | |
| | | | | | | | |
| | |
TOTAL INVESTMENTS 105.7%
(cost $305,170,809) | | | | | | | 389,624,250 | |
Liabilities in excess of other assets (5.7)% | | | | | | | (20,861,683 | ) |
| | | | | | | | |
| | |
NET ASSETS 100.0% | | | | | | $ | 368,762,567 | |
| | | | | | | | |
Below is a list of the abbreviation(s) used in the annual report:
LIBOR—London Interbank Offered Rate
REITs—Real Estate Investment Trust
| * | Non-income producing security. |
See Notes to Financial Statements.
PGIM Quant Solutions Large-Cap Value Fund 21
Schedule of Investments (continued)
as of February 28, 2022
| (a) | All or a portion of security is on loan. The aggregate market value of such securities, including those sold and pending settlement, is $21,768,080; cash collateral of $22,666,035 (included in liabilities) was received with which the Fund purchased highly liquid short-term investments. In the event of significant appreciation in value of securities on loan on the last business day of the reporting period, the Fund may reflect a collateral value that is less than the market value of the loaned securities and such shortfall is remedied the following business day. |
| (b) | Represents security, or portion thereof, purchased with cash collateral received for securities on loan and includes dividend reinvestment. |
| (wa) | PGIM Investments LLC, the manager of the Fund, also serves as manager of the PGIM Core Ultra Short Bond Fund and PGIM Institutional Money Market Fund, if applicable. |
Fair Value Measurements:
Various inputs are used in determining the value of the Fund’s investments. These inputs are summarized in the three broad levels listed below.
Level 1—unadjusted quoted prices generally in active markets for identical securities.
Level 2—quoted prices for similar securities, interest rates and yield curves, prepayment speeds, foreign currency exchange rates and other observable inputs.
Level 3—unobservable inputs for securities valued in accordance with Board approved fair valuation procedures.
The following is a summary of the inputs used as of February 28, 2022 in valuing such portfolio securities:
| | | | | | | | |
| | | Level 1 | | | Level 2 | | Level 3 |
Investments in Securities | | | | | | | | |
Assets | | | | | | | | |
Long-Term Investments | | | | | | | | |
Common Stocks | | | | | | | | |
Aerospace & Defense | | $ | 3,984,988 | | | $— | | $— |
Air Freight & Logistics | | | 1,667,025 | | | — | | — |
Airlines | | | 688,677 | | | — | | — |
Auto Components | | | 1,767,531 | | | — | | — |
Automobiles | | | 6,983,749 | | | — | | — |
Banks | | | 47,224,535 | | | — | | — |
Beverages | | | 2,341,943 | | | — | | — |
Biotechnology | | | 6,079,185 | | | — | | — |
Capital Markets | | | 15,959,742 | | | — | | — |
Chemicals | | | 12,919,286 | | | — | | — |
Communications Equipment | | | 2,930,650 | | | — | | — |
Construction & Engineering | | | 85,664 | | | — | | — |
Consumer Finance | | | 4,732,560 | | | — | | — |
Containers & Packaging | | | 2,201,118 | | | — | | — |
Diversified Financial Services | | | 12,808,265 | | | — | | — |
Diversified Telecommunication Services | | | 12,583,942 | | | — | | — |
Electric Utilities | | | 16,124,984 | | | — | | — |
Electronic Equipment, Instruments & Components | | | 3,658,106 | | | — | | — |
Energy Equipment & Services | | | 901,966 | | | — | | — |
Entertainment | | | 2,494,128 | | | — | | — |
Equity Real Estate Investment Trusts (REITs) | | | 12,735,630 | | | — | | — |
Food & Staples Retailing | | | 5,223,086 | | | — | | — |
Food Products | | | 8,474,412 | | | — | | — |
See Notes to Financial Statements.
22
| | | | | | | | |
| | | Level 1 | | | Level 2 | | Level 3 |
Investments in Securities (continued) | | | | | | | | |
Assets (continued) | | | | | | | | |
Long-Term Investments (continued) | | | | | | | | |
Common Stocks (continued) | | | | | | | | |
Gas Utilities | | $ | 591,976 | | | $— | | $— |
Health Care Equipment & Supplies | | | 1,578,155 | | | — | | — |
Health Care Providers & Services | | | 19,003,676 | | | — | | — |
Hotels, Restaurants & Leisure | | | 569,580 | | | — | | — |
Household Durables | | | 8,955,256 | | | — | | — |
Household Products | | | 4,656,746 | | | — | | — |
Industrial Conglomerates | | | 818,973 | | | — | | — |
Insurance | | | 27,168,867 | | | — | | — |
Interactive Media & Services | | | 1,619,688 | | | — | | — |
Internet & Direct Marketing Retail | | | 1,732,030 | | | — | | — |
IT Services | | | 7,365,834 | | | — | | — |
Life Sciences Tools & Services | | | 4,651,915 | | | — | | — |
Machinery | | | 1,531,366 | | | — | | — |
Marine | | | 358,325 | | | — | | — |
Media | | | 11,243,981 | | | — | | — |
Metals & Mining | | | 6,648,900 | | | — | | — |
Mortgage Real Estate Investment Trusts (REITs) | | | 2,730,448 | | | — | | — |
Multiline Retail | | | 984,474 | | | — | | — |
Multi-Utilities | | | 5,376,593 | | | — | | — |
Oil, Gas & Consumable Fuels | | | 30,989,763 | | | — | | — |
Pharmaceuticals | | | 15,371,133 | | | — | | — |
Road & Rail | | | 3,752,090 | | | — | | — |
Semiconductors & Semiconductor Equipment | | | 8,875,253 | | | — | | — |
Software | | | 736,855 | | | — | | — |
Specialty Retail | | | 1,552,542 | | | — | | — |
Technology Hardware, Storage & Peripherals | | | 6,286,157 | | | — | | — |
Textiles, Apparel & Luxury Goods | | | 2,104,635 | | | — | | — |
Thrifts & Mortgage Finance | | | 1,895,788 | | | — | | — |
Tobacco | | | 853,334 | | | — | | — |
Trading Companies & Distributors | | | 2,084,910 | | | — | | — |
Wireless Telecommunication Services | | | 295,704 | | | — | | — |
Short-Term Investments | | | | | | | | |
Affiliated Mutual Fund | | | 22,667,202 | | | — | | — |
Unaffiliated Fund | | | 929 | | | — | | — |
| | | | | | | | |
| | | |
Total | | $ | 389,624,250 | | | $— | | $— |
| | | | | | | | |
See Notes to Financial Statements.
PGIM Quant Solutions Large-Cap Value Fund 23
Schedule of Investments (continued)
as of February 28, 2022
Industry Classification:
The industry classification of investments and liabilities in excess of other assets shown as a percentage of net assets as of February 28, 2022 were as follows (unaudited):
| | | | |
Banks | | | 12.8 | % |
Oil, Gas & Consumable Fuels | | | 8.4 | |
Insurance | | | 7.4 | |
Affiliated Mutual Fund (6.1% represents investments purchased with collateral from securities on loan) | | | 6.2 | |
Health Care Providers & Services | | | 5.1 | |
Electric Utilities | | | 4.4 | |
Capital Markets | | | 4.3 | |
Pharmaceuticals | | | 4.2 | |
Chemicals | | | 3.5 | |
Diversified Financial Services | | | 3.5 | |
Equity Real Estate Investment Trusts (REITs) | | | 3.5 | |
Diversified Telecommunication Services | | | 3.4 | |
Media | | | 3.0 | |
Household Durables | | | 2.4 | |
Semiconductors & Semiconductor Equipment | | | 2.4 | |
Food Products | | | 2.3 | |
IT Services | | | 2.0 | |
Automobiles | | | 1.9 | |
Metals & Mining | | | 1.8 | |
Technology Hardware, Storage & Peripherals | | | 1.7 | |
Biotechnology | | | 1.6 | |
Multi-Utilities | | | 1.5 | |
Food & Staples Retailing | | | 1.4 | |
Consumer Finance | | | 1.3 | |
Household Products | | | 1.3 | |
Life Sciences Tools & Services | | | 1.3 | |
Aerospace & Defense | | | 1.1 | |
Road & Rail | | | 1.0 | |
Electronic Equipment, Instruments & Components | | | 1.0 | |
Communications Equipment | | | 0.8 | |
Mortgage Real Estate Investment Trusts (REITs) | | | 0.7 | |
| | | | |
Entertainment | | | 0.7 | % |
Beverages | | | 0.6 | |
Containers & Packaging | | | 0.6 | |
Textiles, Apparel & Luxury Goods | | | 0.6 | |
Trading Companies & Distributors | | | 0.6 | |
Thrifts & Mortgage Finance | | | 0.5 | |
Auto Components | | | 0.5 | |
Internet & Direct Marketing Retail | | | 0.5 | |
Air Freight & Logistics | | | 0.4 | |
Interactive Media & Services | | | 0.4 | |
Health Care Equipment & Supplies | | | 0.4 | |
Specialty Retail | | | 0.4 | |
Machinery | | | 0.4 | |
Multiline Retail | | | 0.3 | |
Energy Equipment & Services | | | 0.2 | |
Tobacco | | | 0.2 | |
Industrial Conglomerates | | | 0.2 | |
Software | | | 0.2 | |
Airlines | | | 0.2 | |
Gas Utilities | | | 0.2 | |
Hotels, Restaurants & Leisure | | | 0.2 | |
Marine | | | 0.1 | |
Wireless Telecommunication Services | | | 0.1 | |
Construction & Engineering | | | 0.0 | * |
Unaffiliated Fund | | | 0.0 | * |
| | | | |
| |
| | | 105.7 | |
Liabilities in excess of other assets | | | (5.7 | ) |
| | | | |
| |
| | | 100.0 | % |
| | | | |
Financial Instruments/Transactions—Summary of Offsetting and Netting Arrangements:
The Fund entered into financial instruments/transactions during the reporting period that are either offset in accordance with current requirements or are subject to enforceable master netting arrangements or similar agreements that permit offsetting. The information about offsetting and related netting arrangements for financial instruments/transactions where the legal right to set-off exists is presented in the summary below.
See Notes to Financial Statements.
24
Offsetting of financial instrument/transaction assets and liabilities:
| | | | | | |
| | | | |
| Description | | Gross Market Value of Recognized Assets/(Liabilities) | | Collateral Pledged/(Received)(1) | | Net Amount |
| | | | |
| Securities on Loan | | $21,768,080 | | $(21,768,080) | | $— |
| (1) | Collateral amount disclosed by the Fund is limited to the market value of financial instruments/transactions. |
See Notes to Financial Statements.
PGIM Quant Solutions Large-Cap Value Fund 25
Statement of Assets and Liabilities
as of February 28, 2022
| | | | |
Assets | | | | |
| |
Investments at value, including securities on loan of $21,768,080: | | | | |
Unaffiliated investments (cost $282,503,821) | | $ | 366,957,048 | |
Affiliated investments (cost $22,666,988) | | | 22,667,202 | |
Receivable for investments sold | | | 1,007,787 | |
Dividends receivable | | | 819,345 | |
Receivable for Fund shares sold | | | 703,489 | |
Prepaid expenses and other assets | | | 18,966 | |
| | | | |
| |
Total Assets | | | 392,173,837 | |
| | | | |
| |
Liabilities | | | | |
| |
Payable to broker for collateral for securities on loan | | | 22,666,035 | |
Payable for Fund shares purchased | | | 243,218 | |
Management fee payable | | | 169,313 | |
Loan payable | | | 128,000 | |
Distribution fee payable | | | 102,173 | |
Accrued expenses and other liabilities | | | 73,866 | |
Affiliated transfer agent fee payable | | | 26,611 | |
Trustees’ fees payable | | | 2,054 | |
| | | | |
| |
Total Liabilities | | | 23,411,270 | |
| | | | |
| |
Net Assets | | $ | 368,762,567 | |
| | | | |
| |
| | | | | |
| |
Net assets were comprised of: | | | | |
Shares of beneficial interest, at par | | $ | 25,877 | |
Paid-in capital in excess of par | | | 272,215,738 | |
Total distributable earnings (loss) | | | 96,520,952 | |
| | | | |
| |
Net assets, February 28, 2022 | | $ | 368,762,567 | |
| | | | |
See Notes to Financial Statements.
26
| | | | | | | | |
Class A | | | | | | | | |
| | |
Net asset value and redemption price per share,
($38,101,520 ÷ 2,749,051 shares of beneficial interest issued and outstanding) | | $ | 13.86 | | | | | |
Maximum sales charge (5.50% of offering price) | | | 0.81 | | | | | |
| | | | | | | | |
| | |
Maximum offering price to public | | $ | 14.67 | | | | | |
| | | | | | | | |
| | |
Class C | | | | | | | | |
| | |
Net asset value, offering price and redemption price per share,
($3,976,869 ÷ 318,622 shares of beneficial interest issued and outstanding) | | $ | 12.48 | | | | | |
| | | | | | | | |
| | |
Class R | | | | | | | | |
| | |
Net asset value, offering price and redemption price per share,
($234,736,708 ÷ 16,390,623 shares of beneficial interest issued and outstanding) | | $ | 14.32 | | | | | |
| | | | | | | | |
| | |
Class Z | | | | | | | | |
| | |
Net asset value, offering price and redemption price per share, ($55,747,436 ÷ 3,890,638 shares of beneficial interest issued and outstanding) | | $ | 14.33 | | | | | |
| | | | | | | | |
| | |
Class R6 | | | | | | | | |
| | |
Net asset value, offering price and redemption price per share,
($36,200,034 ÷ 2,528,146 shares of beneficial interest issued and outstanding) | | $ | 14.32 | | | | | |
| | | | | | | | |
See Notes to Financial Statements.
PGIM Quant Solutions Large-Cap Value Fund 27
Statement of Operations
Year Ended February 28, 2022
| | | | |
Net Investment Income (Loss) | | | | |
| |
Income | | | | |
Unaffiliated dividend income (net of $1,319 foreign withholding tax) | | $ | 9,131,318 | |
Income from securities lending, net (including affiliated income of $5,784) | | | 11,441 | |
Affiliated dividend income | | | 1,407 | |
| | | | |
| |
Total income | | | 9,144,166 | |
| | | | |
| |
Expenses | | | | |
Management fee | | | 2,927,113 | |
Distribution fee(a) | | | 1,955,098 | |
Transfer agent’s fees and expenses (including affiliated expense of $329,724)(a) | | | 416,574 | |
Custodian and accounting fees | | | 67,211 | |
Registration fees(a) | | | 62,864 | |
Shareholders’ reports | | | 36,630 | |
Legal fees and expenses | | | 34,814 | |
Audit fee | | | 24,207 | |
Trustees’ fees | | | 13,151 | |
Miscellaneous | | | 72,435 | |
| | | | |
Total expenses | | | 5,610,097 | |
Less: Fee waiver and/or expense reimbursement(a) | | | (615,606 | ) |
Distribution fee waiver(a) | | | (621,364 | ) |
| | | | |
| |
Net expenses | | | 4,373,127 | |
| | | | |
| |
Net investment income (loss) | | | 4,771,039 | |
| | | | |
| |
Realized And Unrealized Gain (Loss) On Investments | | | | |
| |
Net realized gain (loss) on investment transactions (including affiliated of $5,636) | | | 56,536,815 | |
Net change in unrealized appreciation (depreciation) on investments (including affiliated of $(9,510)) | | | 1,701,240 | |
| | | | |
| |
Net gain (loss) on investment transactions | | | 58,238,055 | |
| | | | |
| |
Net Increase (Decrease) In Net Assets Resulting From Operations | | $ | 63,009,094 | |
| | | | |
| (a) | Class specific expenses and waivers were as follows: |
| | | | | | | | | | | | | | | | | | | | |
| | | Class A | | | Class C | | | Class R | | | Class Z | | | Class R6 | |
Distribution fee | | | 108,797 | | | | 36,609 | | | | 1,809,692 | | | | — | | | | — | |
Transfer agent’s fees and expenses | | | 45,810 | | | | 5,261 | | | | 312,940 | | | | 52,380 | | | | 183 | |
Registration fees | | | 16,910 | | | | 8,922 | | | | 6,872 | | | | 16,208 | | | | 13,952 | |
Fee waiver and/or expense reimbursement | | | (61,651 | ) | | | (6,224 | ) | | | (410,197 | ) | | | (113,293 | ) | | | (24,241 | ) |
Distribution fee waiver | | | (18,133 | ) | | | — | | | | (603,231 | ) | | | — | | | | — | |
See Notes to Financial Statements.
28
Statements of Changes in Net Assets
| | | | | | | | |
| |
| | | Year Ended February 28, | |
| | |
| | | 2022 | | | 2021 | |
| | |
Increase (Decrease) in Net Assets | | | | | | | | |
| | |
Operations | | | | | | | | |
Net investment income (loss) | | $ | 4,771,039 | | | $ | 5,000,634 | |
Net realized gain (loss) on investment transactions | | | 56,536,815 | | | | (17,040,917 | ) |
Net change in unrealized appreciation (depreciation) on investments | | | 1,701,240 | | | | 95,352,530 | |
| | | | | | | | |
| | |
Net increase (decrease) in net assets resulting from operations | | | 63,009,094 | | | | 83,312,247 | |
| | | | | | | | |
| | |
Dividends and Distributions | | | | | | | | |
Distributions from distributable earnings | | | | | | | | |
Class A | | | (3,178,004 | ) | | | (512,087 | ) |
Class C | | | (323,265 | ) | | | (28,197 | ) |
Class R | | | (19,721,636 | ) | | | (3,832,749 | ) |
Class Z | | | (4,828,433 | ) | | | (1,377,175 | ) |
Class R6 | | | (485,164 | ) | | | (8,687 | ) |
| | | | | | | | |
| | |
| | | (28,536,502 | ) | | | (5,758,895 | ) |
| | | | | | | | |
| | |
Fund share transactions (Net of share conversions) | | | | | | | | |
Net proceeds from shares sold | | | 84,458,609 | | | | 89,075,510 | |
Net asset value of shares issued in reinvestment of dividends and distributions | | | 28,432,699 | | | | 5,739,371 | |
Cost of shares purchased | | | (134,228,320 | ) | | | (64,704,842 | ) |
| | | | | | | | |
| | |
Net increase (decrease) in net assets from Fund share transactions | | | (21,337,012 | ) | | | 30,110,039 | |
| | | | | | | | |
| | |
Total increase (decrease) | | | 13,135,580 | | | | 107,663,391 | |
| | |
Net Assets: | | | | | | | | |
| | |
Beginning of year | | | 355,626,987 | | | | 247,963,596 | |
| | | | | | | | |
| | |
End of year | | $ | 368,762,567 | | | $ | 355,626,987 | |
| | | | | | | | |
See Notes to Financial Statements.
PGIM Quant Solutions Large-Cap Value Fund 29
Financial Highlights
| | | | | | | | | | | | | | | | | | | | |
| | | | | | |
Class A Shares | | | | | | | | | | | | | | | | | | | | |
| | | Year Ended February 28/29, |
| | | | | | |
| | | 2022 | | | 2021 | | | 2020 | | | 2019 | | | 2018 | |
| | | | | | |
Per Share Operating Performance(a): | | | | | | | | | | | | | | | | | | | | |
Net Asset Value, Beginning of Year | | | $12.74 | | | | $10.47 | | | | $12.19 | | | | $14.38 | | | | $14.47 | |
Income (loss) from investment operations: | | | | | | | | | | | | | | | | | | | | |
Net investment income (loss) | | | 0.20 | | | | 0.19 | | | | 0.21 | | | | 0.22 | | | | 0.17 | |
Net realized and unrealized gain (loss) on investment transactions | | | 2.21 | | | | 2.29 | | | | (1.32 | ) | | | (0.85 | ) | | | 1.12 | |
Total from investment operations | | | 2.41 | | | | 2.48 | | | | (1.11 | ) | | | (0.63 | ) | | | 1.29 | |
Less Dividends and Distributions: | | | | | | | | | | | | | | | | | | | | |
Dividends from net investment income | | | (0.24 | ) | | | (0.17 | ) | | | (0.24 | ) | | | (0.25 | ) | | | (0.19 | ) |
Distributions from net realized gains | | | (1.05 | ) | | | (0.04 | ) | | | (0.37 | ) | | | (1.31 | ) | | | (1.19 | ) |
Total dividends and distributions | | | (1.29 | ) | | | (0.21 | ) | | | (0.61 | ) | | | (1.56 | ) | | | (1.38 | ) |
Net asset value, end of year | | | $13.86 | | | | $12.74 | | | | $10.47 | | | | $12.19 | | | | $14.38 | |
Total Return(b): | | | 19.13 | % | | | 24.05 | % | | | (9.86 | )% | | | (4.14 | )% | | | 9.57 | % |
| | | | | | | | | | | | | | | | | | | | | |
Ratios/Supplemental Data: | | | | | | | | | | | | | | | | | | | | |
Net assets, end of year (000) | | | $38,102 | | | | $30,685 | | | | $27,769 | | | | $28,482 | | | | $29,039 | |
Average net assets (000) | | | $36,266 | | | | $24,971 | | | | $32,667 | | | | $29,461 | | | | $27,204 | |
Ratios to average net assets(c)(d): | | | | | | | | | | | | | | | | | | | | |
Expenses after waivers and/or expense reimbursement | | | 1.12 | % | | | 1.15 | % | | | 1.13 | % | | | 1.13 | % | | | 1.10 | % |
Expenses before waivers and/or expense reimbursement | | | 1.34 | % | | | 1.37 | % | | | 1.35 | % | | | 1.35 | % | | | 1.32 | % |
Net investment income (loss) | | | 1.39 | % | | | 1.89 | % | | | 1.74 | % | | | 1.66 | % | | | 1.23 | % |
Portfolio turnover rate(e) | | | 73 | % | | | 53 | % | | | 56 | % | | | 76 | % | | | 72 | % |
| (a) | Calculated based on average shares outstanding during the year. |
| (b) | Total return does not consider the effects of sales loads. Total return is calculated assuming a purchase of a share on the first day and a sale on the last day of each year reported and includes reinvestment of dividends and distributions, if any. Total returns may reflect adjustments to conform to GAAP. |
| (c) | Effective August 1, 2017, class specific expenses include transfer agent fees and expenses and registration fees, which are charged to their respective share class. |
| (d) | Does not include expenses of the underlying funds in which the Fund invests. |
| (e) | The Fund’s portfolio turnover rate is calculated in accordance with regulatory requirements, without regard to transactions involving short-term investments, certain derivatives and in-kind transactions (if any). If such transactions were included, the Fund’s portfolio turnover rate may be higher. |
See Notes to Financial Statements.
30
| | | | | | | | | | | | | | | | | | | | |
| | | | | | |
Class C Shares | | | | | | | | | | | | | | | | | | | | |
| | | Year Ended February 28/29, |
| | | | | | |
| | | 2022 | | | 2021 | | | 2020 | | | 2019 | | | 2018 | |
| | | | | | |
Per Share Operating Performance(a): | | | | | | | | | | | | | | | | | | | | |
Net Asset Value, Beginning of Year | | | $11.59 | | | | $9.56 | | | | $11.20 | | | | $13.34 | | | | $13.53 | |
Income (loss) from investment operations: | | | | | | | | | | | | | | | | | | | | |
Net investment income (loss) | | | 0.06 | | | | 0.07 | | | | 0.08 | | | | 0.11 | | | | 0.06 | |
Net realized and unrealized gain (loss) on investment transactions | | | 2.00 | | | | 2.07 | | | | (1.21 | ) | | | (0.79 | ) | | | 1.04 | |
Total from investment operations | | | 2.06 | | | | 2.14 | | | | (1.13 | ) | | | (0.68 | ) | | | 1.10 | |
Less Dividends and Distributions: | | | | | | | | | | | | | | | | | | | | |
Dividends from net investment income | | | (0.12 | ) | | | (0.07 | ) | | | (0.14 | ) | | | (0.15 | ) | | | (0.10 | ) |
Distributions from net realized gains | | | (1.05 | ) | | | (0.04 | ) | | | (0.37 | ) | | | (1.31 | ) | | | (1.19 | ) |
Total dividends and distributions | | | (1.17 | ) | | | (0.11 | ) | | | (0.51 | ) | | | (1.46 | ) | | | (1.29 | ) |
Net asset value, end of year | | | $12.48 | | | | $11.59 | | | | $9.56 | | | | $11.20 | | | | $13.34 | |
Total Return(b): | | | 17.97 | % | | | 22.62 | % | | | (10.82 | )% | | | (4.88 | )% | | | 8.72 | % |
| | | | | | | | | | | | | | | | | | | | | |
Ratios/Supplemental Data: | | | | | | | | | | | | | | | | | | | | |
Net assets, end of year (000) | | | $3,977 | | | | $3,165 | | | | $3,007 | | | | $11,036 | | | | $14,054 | |
Average net assets (000) | | | $3,661 | | | | $2,561 | | | | $4,593 | | | | $12,883 | | | | $13,571 | |
Ratios to average net assets(c)(d): | | | | | | | | | | | | | | | | | | | | |
Expenses after waivers and/or expense reimbursement | | | 2.09 | % | | | 2.29 | % | | | 2.13 | % | | | 1.91 | % | | | 1.88 | % |
Expenses before waivers and/or expense reimbursement | | | 2.26 | % | | | 2.46 | % | | | 2.30 | % | | | 2.08 | % | | | 2.05 | % |
Net investment income (loss) | | | 0.44 | % | | | 0.76 | % | | | 0.70 | % | | | 0.88 | % | | | 0.46 | % |
Portfolio turnover rate(e) | | | 73 | % | | | 53 | % | | | 56 | % | | | 76 | % | | | 72 | % |
| (a) | Calculated based on average shares outstanding during the year. |
| (b) | Total return does not consider the effects of sales loads. Total return is calculated assuming a purchase of a share on the first day and a sale on the last day of each year reported and includes reinvestment of dividends and distributions, if any. Total returns may reflect adjustments to conform to GAAP. |
| (c) | Effective August 1, 2017, class specific expenses include transfer agent fees and expenses and registration fees, which are charged to their respective share class. |
| (d) | Does not include expenses of the underlying funds in which the Fund invests. |
| (e) | The Fund’s portfolio turnover rate is calculated in accordance with regulatory requirements, without regard to transactions involving short-term investments, certain derivatives and in-kind transactions (if any). If such transactions were included, the Fund’s portfolio turnover rate may be higher. |
See Notes to Financial Statements.
PGIM Quant Solutions Large-Cap Value Fund 31
Financial Highlights (continued)
| | | | | | | | | | | | | | | | | | | | |
| | | | | | |
Class R Shares | | | | | | | | | | | | | | | | | | | | |
| | | Year Ended February 28/29, |
| | | | | | |
| | | 2022 | | | 2021 | | | 2020 | | | 2019 | | | 2018 | |
| | | | | | |
Per Share Operating Performance(a): | | | | | | | | | | | | | | | | | | | | |
Net Asset Value, Beginning of Year | | | $13.13 | | | | $10.78 | | | | $12.54 | | | | $14.74 | | | | $14.79 | |
Income (loss) from investment operations: | | | | | | | | | | | | | | | | | | | | |
Net investment income (loss) | | | 0.17 | | | | 0.17 | | | | 0.19 | | | | 0.20 | | | | 0.15 | |
Net realized and unrealized gain (loss) on investment transactions | | | 2.27 | | | | 2.38 | | | | (1.36 | ) | | | (0.87 | ) | | | 1.15 | |
Total from investment operations | | | 2.44 | | | | 2.55 | | | | (1.17 | ) | | | (0.67 | ) | | | 1.30 | |
Less Dividends and Distributions: | | | | | | | | | | | | | | | | | | | | |
Dividends from net investment income | | | (0.20 | ) | | | (0.16 | ) | | | (0.22 | ) | | | (0.22 | ) | | | (0.16 | ) |
Distributions from net realized gains | | | (1.05 | ) | | | (0.04 | ) | | | (0.37 | ) | | | (1.31 | ) | | | (1.19 | ) |
Total dividends and distributions | | | (1.25 | ) | | | (0.20 | ) | | | (0.59 | ) | | | (1.53 | ) | | | (1.35 | ) |
Net asset value, end of year | | | $14.32 | | | | $13.13 | | | | $10.78 | | | | $12.54 | | | | $14.74 | |
Total Return(b): | | | 18.91 | % | | | 23.82 | % | | | (10.08 | )% | | | (4.34 | )% | | | 9.41 | % |
| | | | | | | | | | | | | | | | | | | | | |
Ratios/Supplemental Data: | | | | | | | | | | | | | | | | | | | | |
Net assets, end of year (000) | | | $234,737 | | | | $240,673 | | | | $170,352 | | | | $212,712 | | | | $237,199 | |
Average net assets (000) | | | $241,292 | | | | $197,850 | | | | $205,065 | | | | $226,245 | | | | $242,784 | |
Ratios to average net assets(c)(d): | | | | | | | | | | | | | | | | | | | | |
Expenses after waivers and/or expense reimbursement | | | 1.33 | % | | | 1.33 | % | | | 1.33 | % | | | 1.33 | % | | | 1.32 | % |
Expenses before waivers and/or expense reimbursement | | | 1.75 | % | | | 1.75 | % | | | 1.75 | % | | | 1.75 | % | | | 1.74 | % |
Net investment income (loss) | | | 1.19 | % | | | 1.69 | % | | | 1.53 | % | | | 1.47 | % | | | 1.02 | % |
Portfolio turnover rate(e) | | | 73 | % | | | 53 | % | | | 56 | % | | | 76 | % | | | 72 | % |
| (a) | Calculated based on average shares outstanding during the year. |
| (b) | Total return is calculated assuming a purchase of a share on the first day and a sale on the last day of each year reported and includes reinvestment of dividends and distributions, if any. Total returns may reflect adjustments to conform to GAAP. |
| (c) | Effective August 1, 2017, class specific expenses include transfer agent fees and expenses and registration fees, which are charged to their respective share class. |
| (d) | Does not include expenses of the underlying funds in which the Fund invests. |
| (e) | The Fund’s portfolio turnover rate is calculated in accordance with regulatory requirements, without regard to transactions involving short-term investments, certain derivatives and in-kind transactions (if any). If such transactions were included, the Fund’s portfolio turnover rate may be higher. |
See Notes to Financial Statements.
32
| | | | | | | | | | | | | | | | | | | | |
| | | | | | |
Class Z Shares | | | | | | | | | | | | | | | | | | | | |
| | | Year Ended February 28/29, |
| | | | | | |
| | | 2022 | | | 2021 | | | 2020 | | | 2019 | | | 2018 | |
| | | | | | |
Per Share Operating Performance(a): | | | | | | | | | | | | | | | | | | | | |
Net Asset Value, Beginning of Year | | | $13.13 | | | | $10.78 | | | | $12.53 | | | | $14.73 | | | | $14.78 | |
Income (loss) from investment operations: | | | | | | | | | | | | | | | | | | | | |
Net investment income (loss) | | | 0.25 | | | | 0.23 | | | | 0.26 | | | | 0.27 | | | | 0.22 | |
Net realized and unrealized gain (loss) on investment transactions | | | 2.28 | | | | 2.37 | | | | (1.35 | ) | | | (0.87 | ) | | | 1.16 | |
Total from investment operations | | | 2.53 | | | | 2.60 | | | | (1.09 | ) | | | (0.60 | ) | | | 1.38 | |
Less Dividends and Distributions: | | | | | | | | | | | | | | | | | | | | |
Dividends from net investment income | | | (0.28 | ) | | | (0.21 | ) | | | (0.29 | ) | | | (0.29 | ) | | | (0.24 | ) |
Distributions from net realized gains | | | (1.05 | ) | | | (0.04 | ) | | | (0.37 | ) | | | (1.31 | ) | | | (1.19 | ) |
Total dividends and distributions | | | (1.33 | ) | | | (0.25 | ) | | | (0.66 | ) | | | (1.60 | ) | | | (1.43 | ) |
Net asset value, end of year | | | $14.33 | | | | $13.13 | | | | $10.78 | | | | $12.53 | | | | $14.73 | |
Total Return(b): | | | 19.58 | % | | | 24.37 | % | | | (9.56 | )% | | | (3.77 | )% | | | 9.94 | % |
| | | | | | | | | | | | | | | | | | | | | |
Ratios/Supplemental Data: | | | | | | | | | | | | | | | | | | | | |
Net assets, end of year (000) | | | $55,747 | | | | $80,486 | | | | $46,231 | | | | $56,971 | | | | $70,569 | |
Average net assets (000) | | | $71,101 | | | | $53,264 | | | | $54,581 | | | | $64,057 | | | | $75,603 | |
Ratios to average net assets(c)(d): | | | | | | | | | | | | | | | | | | | | |
Expenses after waivers and/or expense reimbursement | | | 0.80 | % | | | 0.81 | % | | | 0.80 | % | | | 0.80 | % | | | 0.80 | % |
Expenses before waivers and/or expense reimbursement | | | 0.96 | % | | | 0.98 | % | | | 0.95 | % | | | 0.95 | % | | | 0.96 | % |
Net investment income (loss) | | | 1.69 | % | | | 2.17 | % | | | 2.07 | % | | | 2.00 | % | | | 1.53 | % |
Portfolio turnover rate(e) | | | 73 | % | | | 53 | % | | | 56 | % | | | 76 | % | | | 72 | % |
| (a) | Calculated based on average shares outstanding during the year. |
| (b) | Total return is calculated assuming a purchase of a share on the first day and a sale on the last day of each year reported and includes reinvestment of dividends and distributions, if any. Total returns may reflect adjustments to conform to GAAP. |
| (c) | Effective August 1, 2017, class specific expenses include transfer agent fees and expenses and registration fees, which are charged to their respective share class. |
| (d) | Does not include expenses of the underlying funds in which the Fund invests. |
| (e) | The Fund’s portfolio turnover rate is calculated in accordance with regulatory requirements, without regard to transactions involving short-term investments, certain derivatives and in-kind transactions (if any). If such transactions were included, the Fund’s portfolio turnover rate may be higher. |
See Notes to Financial Statements.
PGIM Quant Solutions Large-Cap Value Fund 33
Financial Highlights (continued)
| | | | | | | | | | | | | | | | | | | | | | | | |
Class R6 Shares | | | | | | | | |
| | | | | | | | | | | | | | April 26, 2017(a) | | | |
| | | Year Ended February 28/29, | | | through February 28, | | | |
| | | 2022 | | | 2021 | | | 2020 | | | 2019 | | 2018 | | | |
| | | | | | | | | | | | | |
| | | | | | | |
Per Share Operating Performance(b): | | | | | | | | | | | | | | | | | | | | | | | | |
Net Asset Value, Beginning of Period | | | $13.13 | | | | $10.78 | | | | $12.53 | | | | $14.74 | | | | $14.58 | | | | | |
Income (loss) from investment operations: | | | | | | | | | | | | | | | | | | | | | | | | |
Net investment income (loss) | | | 0.21 | | | | 0.23 | | | | 0.26 | | | | 0.28 | | | | 0.19 | | | | | |
Net realized and unrealized gain (loss) on investment transactions | | | 2.31 | | | | 2.37 | | | | (1.35 | ) | | | (0.89 | ) | | | 1.40 | | | | | |
Total from investment operations | | | 2.52 | | | | 2.60 | | | | (1.09 | ) | | | (0.61 | ) | | | 1.59 | | | | | |
Less Dividends and Distributions: | | | | | | | | | | | | | | | | | | | | | | | | |
Dividends from net investment income | | | (0.28 | ) | | | (0.21 | ) | | | (0.29 | ) | | | (0.29 | ) | | | (0.24 | ) | | | | |
Distributions from net realized gains | | | (1.05 | ) | | | (0.04 | ) | | | (0.37 | ) | | | (1.31 | ) | | | (1.19 | ) | | | | |
Total dividends and distributions | | | (1.33 | ) | | | (0.25 | ) | | | (0.66 | ) | | | (1.60 | ) | | | (1.43 | ) | | | | |
Net asset value, end of period | | | $14.32 | | | | $13.13 | | | | $10.78 | | | | $12.53 | | | | $14.74 | | | | | |
Total Return(c): | | | 19.52 | % | | | 24.37 | % | | | (9.56 | )% | | | (3.85 | )% | | | 11.52 | % | | | | |
| | | | | | | | | | | | | | | | | | | | | | | | | |
Ratios/Supplemental Data: | | | | | | | | | | | | | | | | | | | | | | | | |
Net assets, end of period (000) | | | $36,200 | | | | $618 | | | | $356 | | | | $26,223 | | | | $36,526 | | | | | |
Average net assets (000) | | | $13,569 | | | | $362 | | | | $7,619 | | | | $31,006 | | | | $33,613 | | | | | |
Ratios to average net assets(d)(e): | | | | | | | | | | | | | | | | | | | | | | | | |
Expenses after waivers and/or expense reimbursement | | | 0.80 | % | | | 0.81 | % | | | 0.80 | % | | | 0.80 | % | | | 0.80 | %(f) | | | | |
Expenses before waivers and/or expense reimbursement | | | 0.98 | % | | | 4.98 | % | | | 1.02 | % | | | 0.89 | % | | | 0.90 | %(f) | | | | |
Net investment income (loss) | | | 1.37 | % | | | 2.15 | % | | | 2.12 | % | | | 2.01 | % | | | 1.54 | %(f) | | | | |
Portfolio turnover rate(g) | | | 73 | % | | | 53 | % | | | 56 | % | | | 76 | % | | | 72 | % | | | | |
| (a) | Commencement of offering. |
| (b) | Calculated based on average shares outstanding during the period. |
| (c) | Total return is calculated assuming a purchase of a share on the first day and a sale on the last day of each period reported and includes reinvestment of dividends and distributions, if any. Total returns may reflect adjustments to conform to GAAP. Total returns for periods less than one full year are not annualized. |
| (d) | Effective August 1, 2017, class specific expenses include transfer agent fees and expenses and registration fees, which are charged to their respective share class. |
| (e) | Does not include expenses of the underlying funds in which the Fund invests. |
| (g) | The Fund’s portfolio turnover rate is calculated in accordance with regulatory requirements, without regard to transactions involving short-term investments, certain derivatives and in-kind transactions (if any). If such transactions were included, the Fund’s portfolio turnover rate may be higher. |
See Notes to Financial Statements.
34
Notes to Financial Statements
Prudential Investment Portfolios 3 (the “Registered Investment Company” or “RIC”) is registered under the Investment Company Act of 1940, as amended (“1940 Act”), as an open-end management investment company. The RIC is organized as a Delaware Statutory Trust. These financial statements relate only to the PGIM Quant Solutions Large-Cap Value Fund (formerly known as PGIM QMA Large-Cap Value Fund) (the “Fund”), a series of the RIC. The Fund is classified as a diversified fund for purposes of the 1940 Act.
The investment objective of the Fund is long-term growth of capital.
The Fund follows the investment company accounting and reporting guidance of the Financial Accounting Standards Board (“FASB”) Accounting Standard Codification (“ASC”) Topic 946 Financial Services — Investment Companies. The following is a summary of significant accounting policies followed by the Fund in the preparation of its financial statements. The policies conform to U.S. generally accepted accounting principles (“GAAP”). The Fund consistently follows such policies in the preparation of its financial statements.
Securities Valuation: The Fund holds securities and other assets and liabilities that are fair valued as of the close of each day (generally, 4:00 PM Eastern time) the New York Stock Exchange (“NYSE”) is open for trading. As described in further detail below, the Fund’s investments are valued daily based on a number of factors, including the type of investment and whether market quotations are readily available. The RIC’s Board of Trustees (the “Board”) has adopted valuation procedures for security valuation under which fair valuation responsibilities have been delegated to PGIM Investments LLC (“PGIM Investments” or the “Manager”). Pursuant to the Board’s delegation, the Manager has established a Valuation Committee responsible for supervising the fair valuation of portfolio securities and other assets and liabilities. The valuation procedures permit the Fund to utilize independent pricing vendor services, quotations from market makers, and alternative valuation methods when market quotations are either not readily available or not deemed representative of fair value. Fair value is the price that would be received to sell an asset or paid to transfer a liability in an orderly transaction between market participants on the measurement date. A record of the Valuation Committee’s actions is subject to the Board’s review at its first quarterly meeting following the quarter in which such actions take place.
For the fiscal reporting year-end, securities and other assets and liabilities were fair valued at the close of the last U.S. business day. Trading in certain foreign securities may occur when the NYSE is closed (including weekends and holidays). Because such foreign securities
PGIM Quant Solutions Large-Cap Value Fund 35
Notes to Financial Statements (continued)
trade in markets that are open on weekends and U.S. holidays, the values of some of the Fund’s foreign investments may change on days when investors cannot purchase or redeem Fund shares.
Various inputs determine how the Fund’s investments are valued, all of which are categorized according to the three broad levels (Level 1, 2, or 3) detailed in the Schedule of Investments and referred to herein as the “fair value hierarchy” in accordance with FASB ASC Topic 820 - Fair Value Measurement.
Common or preferred stocks, exchange-traded funds and derivative instruments, if applicable, that are traded on a national securities exchange are valued at the last sale price as of the close of trading on the applicable exchange where the security principally trades. Securities traded via NASDAQ are valued at the NASDAQ official closing price. To the extent these securities are valued at the last sale price or NASDAQ official closing price, they are classified as Level 1 in the fair value hierarchy. In the event that no sale or official closing price on valuation date exists, these securities are generally valued at the mean between the last reported bid and ask prices, or at the last bid price in the absence of an ask price. These securities are classified as Level 2 in the fair value hierarchy.
Investments in open-end funds (other than exchange-traded funds) are valued at their net asset values as of the close of the NYSE on the date of valuation. These securities are classified as Level 1 in the fair value hierarchy since they may be purchased or sold at their net asset values on the date of valuation.
Securities and other assets that cannot be priced according to the methods described above are valued based on pricing methodologies approved by the Board. In the event that unobservable inputs are used when determining such valuations, the securities will be classified as Level 3 in the fair value hierarchy. Altering one or more unobservable inputs may result in a significant change to a Level 3 security’s fair value measurement.
When determining the fair value of securities, some of the factors influencing the valuation include: the nature of any restrictions on disposition of the securities; assessment of the general liquidity of the securities; the issuer’s financial condition and the markets in which it does business; the cost of the investment; the size of the holding and the capitalization of the issuer; the prices of any recent transactions or bids/offers for such securities or any comparable securities; any available analyst media or other reports or information deemed reliable by the Manager regarding the issuer or the markets or industry in which it operates. Using fair value to price securities may result in a value that is different from a security’s most recent closing price and from the price used by other unaffiliated mutual funds to calculate their net asset values.
36
Master Netting Arrangements: The RIC, on behalf of the Fund, is subject to various Master Agreements, or netting arrangements, with select counterparties. These are agreements which a subadviser may have negotiated and entered into on behalf of all or a portion of the Fund. A master netting arrangement between the Fund and the counterparty permits the Fund to offset amounts payable by the Fund to the same counterparty against amounts to be received; and by the receipt of collateral from the counterparty by the Fund to cover the Fund’s exposure to the counterparty. However, there is no assurance that such mitigating factors are easily enforceable. In addition to master netting arrangements, the right to set-off exists when all the conditions are met such that each of the parties owes the other determinable amounts, the reporting party has the right to set-off the amount owed with the amount owed by the other party, the reporting party intends to set-off and the right of set-off is enforceable by law.
Securities Lending: The Fund lends its portfolio securities to banks and broker-dealers. The loans are secured by collateral at least equal to the market value of the securities loaned. Collateral pledged by each borrower is invested in an affiliated money market fund and is marked to market daily, based on the previous day’s market value, such that the value of the collateral exceeds the value of the loaned securities. In the event of significant appreciation in value of securities on loan on the last business day of the reporting period, the financial statements may reflect a collateral value that is less than the market value of the loaned securities. Such shortfall is remedied as described above. Loans are subject to termination at the option of the borrower or the Fund. Upon termination of the loan, the borrower will return to the Fund securities identical to the loaned securities. The remaining maturities of the securities lending transactions are considered overnight and continuous. Should the borrower of the securities fail financially, the Fund has the right to repurchase the securities in the open market using the collateral.
The Fund recognizes income, net of any rebate and securities lending agent fees, for lending its securities in the form of fees or interest on the investment of any cash received as collateral. The borrower receives all interest and dividends from the securities loaned and such payments are passed back to the lender in amounts equivalent thereto, which are reflected in interest income or unaffiliated dividend income based on the nature of the payment on the Statement of Operations. The Fund also continues to recognize any unrealized gain (loss) in the market price of the securities loaned and on the change in the value of the collateral invested that may occur during the term of the loan. In addition, realized gain (loss) is recognized on changes in the value of the collateral invested upon liquidation of the collateral. Net earnings from securities lending are disclosed in the Statement of Operations.
Equity and Mortgage Real Estate Investment Trusts (collectively REITs): The Fund invested in REITs, which report information on the source of their distributions annually. Based on current and historical information, a portion of distributions received from REITs during the period is estimated to be dividend income, capital gain or return of capital and recorded accordingly. When material, these estimates are adjusted periodically when the actual source of distributions is disclosed by the REITs.
PGIM Quant Solutions Large-Cap Value Fund 37
Notes to Financial Statements (continued)
Securities Transactions and Net Investment Income: Securities transactions are recorded on the trade date. Realized gains (losses) from investment and currency transactions are calculated on the specific identification method. Dividend income is recorded on the ex-date, or for certain foreign securities, when the Fund becomes aware of such dividends. Expenses are recorded on an accrual basis, which may require the use of certain estimates by management that may differ from actual. Net investment income or loss (other than class specific expenses and waivers, which are allocated as noted below) and unrealized and realized gains (losses) are allocated daily to each class of shares based upon the relative proportion of adjusted net assets of each class at the beginning of the day. Class specific expenses and waivers, where applicable, are charged to the respective share classes. Such class specific expenses and waivers include distribution fees and distribution fee waivers, shareholder servicing fees, transfer agent’s fees and expenses, registration fees and fee waivers and/or expense reimbursements, as applicable.
Taxes: It is the Fund’s policy to continue to meet the requirements of the Internal Revenue Code applicable to regulated investment companies and to distribute all of its taxable net investment income and capital gains, if any, to its shareholders. Therefore, no federal income tax provision is required. Withholding taxes on foreign dividends, interest and capital gains, if any, are recorded, net of reclaimable amounts, at the time the related income is earned.
Dividends and Distributions: Dividends and distributions to shareholders, which are determined in accordance with federal income tax regulations and which may differ from GAAP, are recorded on the ex-date. Permanent book/tax differences relating to income and gain (loss) are reclassified between total distributable earnings (loss) and paid-in capital in excess of par, as appropriate. The chart below sets forth the expected frequency of dividend and capital gains distributions to shareholders. Various factors may impact the frequency of dividend distributions to shareholders, including but not limited to adverse market conditions or portfolio holding-specific events.
| | |
Expected Distribution Schedule to Shareholders* | | Frequency |
Net Investment Income | | Annually |
Short-Term Capital Gains | | Annually |
Long-Term Capital Gains | | Annually |
| * | Under certain circumstances, the Fund may make more than one distribution of short-term and/or long-term capital gains during a fiscal year. |
Estimates: The preparation of financial statements requires management to make estimates and assumptions that affect the reported amounts and disclosures in the financial statements. Actual results could differ from those estimates.
38
The RIC, on behalf of the Fund, has a management agreement with the Manager. Pursuant to this agreement, the Manager has responsibility for all investment advisory services and supervises the subadviser’s performance of such services.
The Manager has entered into a subadvisory agreement with PGIM Quantitative Solutions LLC (formerly known as QMA LLC) (“PGIM Quantitative Solutions” or the “subadviser”). The Manager pays for the services of PGIM Quantitative Solutions.
Fees payable under the management agreement are computed daily and paid monthly. For the reporting period ended February 28, 2022, the contractual and effective management fee rates were as follows:
| | | | |
Contractual Management Rate | |
| Effective Management Fee, before any waivers
and/or expense reimbursements |
|
0.80% to $1 billion of average daily net assets; | | | 0.80% | |
0.75% over $1 billion of average daily net assets | | | | |
The Manager has contractually agreed, through June 30, 2023, to waive and/or reimburse up to 0.17% of fees and expenses from the Fund to the extent that the Fund’s net operating expenses (exclusive of taxes, interest, distribution (12b-1 fees) and certain extraordinary expenses) exceed 0.80% of the Fund’s average daily assets on an annualized basis. This contractual limitation excludes interest, brokerage, taxes (such as income and foreign withholding taxes, stamp duty and deferred tax expenses), acquired fund fees and expenses, extraordinary expenses, and certain other Fund expenses such as dividend and interest expense and broker charges on short sales.
Where applicable, the Manager agrees to waive management fees or shared operating expenses on any share class to the same extent that it waives such expenses on any other share class. In addition, total annual operating expenses for Class R6 shares will not exceed total annual operating expenses for Class Z shares. Fees and/or expenses waived and/or reimbursed by the Manager may be recouped by the Manager within the same fiscal year during which such waiver and/or reimbursement is made if such recoupment can be realized without exceeding the expense limit in effect at the time of the recoupment for that fiscal year.
The RIC, on behalf of the Fund, has a distribution agreement with Prudential Investment Management Services LLC (“PIMS”), which acts as the distributor of the Class A, Class C, Class R, Class Z and Class R6 shares of the Fund. The Fund compensates PIMS for distributing and servicing the Fund’s Class A, Class C and Class R shares, pursuant to the plans of distribution (the “Distribution Plans”), regardless of expenses actually incurred by PIMS.
Pursuant to the Distribution Plans, the Fund compensates PIMS for distribution related activities at an annual rate based on average daily net assets per class. PIMS has
PGIM Quant Solutions Large-Cap Value Fund 39
Notes to Financial Statements (continued)
contractually agreed through June 30, 2023 to limit such fees on certain classes based on the average daily net assets. The distribution fees are accrued daily and payable monthly. The Fund’s annual distribution contractual rate and limit where applicable are as follows:
| | | | | | |
Class | | Contractual Rate | | | Limit | |
A | | 0.30% | | | 0.25 | % |
C | | 1.00 | | | — | |
R | | 0.75 | | | 0.50 | |
Z | | N/A | | | N/A | |
R6 | | N/A | | | N/A | |
For the reporting period ended February 28, 2022, PIMS received front-end sales charges (“FESL”) resulting from sales of certain class shares and contingent deferred sales charges (“CDSC”) imposed upon redemptions by certain shareholders. From these fees, PIMS paid such sales charges to broker-dealers, who in turn paid commissions to salespersons and incurred other distribution costs. The sales charges are as follows where applicable:
| | |
FESL by Class | | Amount |
A | | $42,428 |
C | | — |
CDSC by Class | | Amount |
A | | $2,468 |
C | | 420 |
PGIM Investments, PIMS and PGIM Quantitative Solutions are indirect, wholly-owned subsidiaries of Prudential Financial, Inc. (“Prudential”).
| 4. | Other Transactions with Affiliates |
Prudential Mutual Fund Services LLC (“PMFS”), an affiliate of PGIM Investments and an indirect, wholly-owned subsidiary of Prudential, serves as the Fund’s transfer agent. Transfer agent’s fees and expenses in the Statement of Operations include certain out-of-pocket expenses paid to non-affiliates, where applicable.
The Fund may invest its overnight sweep cash in the PGIM Core Ultra Short Bond Fund (the “Core Fund”), and its securities lending cash collateral in the PGIM Institutional Money Market Fund (the “Money Market Fund”), each a fund of Prudential Investment Portfolios 2, registered under the 1940 Act and managed by PGIM Investments. PGIM Investments and/or its affiliates are paid fees or reimbursed for providing their services to the Core Fund and the Money Market Fund. In addition to the realized and unrealized gains on investments in the Core Fund and Money Market Fund, earnings from such investments are disclosed on the Statement of Operations as “Affiliated dividend income” and “Income from securities
40
lending, net”, respectively. Effective January 2022, the Fund changed its overnight cash sweep vehicle from the Core Fund to an unaffiliated money market fund.
The Fund may enter into certain securities purchase or sale transactions under Board approved Rule 17a-7 procedures. Rule 17a-7 is an exemptive rule under the 1940 Act, that subject to certain conditions, permits purchase and sale transactions among affiliated investment companies, or between an investment company and a person that is affiliated solely by reason of having a common (or affiliated) investment adviser, common directors/trustees, and/or common officers. For the year ended February 28, 2022, no 17a-7 transactions were entered into by the Fund.
The aggregate cost of purchases and proceeds from sales of portfolio securities (excluding short-term investments and U.S. Government securities) for the reporting period ended February 28, 2022, were as follows:
| | | | |
Cost of Purchases | | | Proceeds from Sales | |
$263,590,866 | | | $307,360,400 | |
A summary of the cost of purchases and proceeds from sales of shares of affiliated mutual funds for the year ended February 28, 2022, is presented as follows:
| | | | | | | | | | | | | | |
Value, Beginning of Year | | Cost of Purchases | | Proceeds from Sales | | Change in Unrealized Gain (Loss) | | Realized Gain (Loss) | | Value, End of Year | | Shares, End of Year | | Income |
|
Short-Term Investments - Affiliated Mutual Funds: |
|
PGIM Core Ultra Short Bond Fund(1)(wa) |
$2,574,803 | | $ 31,483,907 | | $ 34,058,710 | | $ — | | $ — | | $ — | | — | | $1,407 |
|
PGIM Institutional Money Market Fund(1)(b)(wa) |
5,554,240 | | 166,799,838 | | 149,683,002 | | (9,510) | | 5,636 | | 22,667,202 | | 22,685,351 | | 5,784(2) |
$8,129,043 | | $198,283,745 | | $183,741,712 | | $(9,510) | | $5,636 | | $22,667,202 | | | | $7,191 |
| (1) | The Fund did not have any capital gain distributions during the reporting period. |
| (2) | The amount, or a portion thereof, represents the affiliated securities lending income shown on the Statement of Operations. |
| (b) | Represents security, or portion thereof, purchased with cash collateral received for securities on loan and includes dividend reinvestment. |
| (wa) | PGIM Investments LLC, the manager of the Fund, also serves as manager of the PGIM Core Ultra Short Bond Fund and PGIM Institutional Money Market Fund, if applicable. |
| 6. | Distributions and Tax Information |
Distributions to shareholders, which are determined in accordance with federal income tax regulations and which may differ from GAAP, are recorded on the ex-date.
PGIM Quant Solutions Large-Cap Value Fund 41
Notes to Financial Statements (continued)
For the year ended February 28, 2022, the tax character of dividends paid by the Fund were $26,726,007 of ordinary income and $1,810,495 of long-term capital gains. For the year ended February 28, 2021, the tax character of dividends paid by the Fund were $5,421,600 of ordinary income $337,295 of long-term capital gains.
As of February 28, 2022, the accumulated undistributed earnings on a tax basis were $6,226,325 of ordinary income and $11,365,833 of long-term capital gains.
The United States federal income tax basis of the Fund’s investments and the net unrealized appreciation as of February 28, 2022 were as follows:
| | | | | | |
| Tax Basis | | Gross
Unrealized
Appreciation | | Gross
Unrealized
Depreciation | | Net
Unrealized
Appreciation |
| $310,695,456 | | $92,475,541 | | $(13,546,747) | | $78,928,794 |
The difference between GAAP and tax basis was primarily attributable to deferred losses on wash sales.
The Manager has analyzed the Fund’s tax positions taken on federal, state and local income tax returns for all open tax years and has concluded that no provision for income tax is required in the Fund’s financial statements for the current reporting period. Since tax authorities can examine previously filed tax returns, the Fund’s U.S. federal and state tax returns for each of the four fiscal years up to the most recent fiscal year ended February 28, 2022 are subject to such review.
The Fund offers Class A, Class C, Class R, Class Z and Class R6 shares. Class A shares are sold with a maximum front-end sales charge of 5.50%. Investors who purchase $1 million or more of Class A shares and sell these shares within 12 months of purchase are subject to a contingent deferred sales charge (“CDSC”) of 1%, although they are not subject to an initial sales charge. The Class A CDSC is waived for certain retirement and/or benefit plans. A special exchange privilege is also available for shareholders who qualified to purchase Class A shares at net asset value. Effective June 26, 2020, all of the issued and outstanding Class B shares of the Fund converted into Class A shares. Class C shares are sold with a CDSC of 1% on sales made within 12 months of purchase. Class C shares will automatically convert to Class A shares on a monthly basis approximately eight years (ten years prior to January 22, 2021) after purchase. Class R, Class Z and Class R6 shares are not subject to any sales or redemption charges and are available exclusively for sale to a limited group of investors.
42
Under certain circumstances, an exchange may be made from specified share classes of the Fund to one or more other share classes of the Fund as presented in the table of transactions in shares of beneficial interest, below.
The RIC has authorized an unlimited number of shares of beneficial interest of the Fund at $0.001 par value per share, currently divided into five classes, designated Class A, Class C, Class R, Class Z and Class R6.
As of February 28, 2022, Prudential, through its affiliated entities, including affiliated funds (if applicable), owned shares of the Fund as follows:
| | | | | | | | |
| | | |
| Class | | Number of Shares | | Percentage of Outstanding Shares |
A | | | 294 | | | | 0.1 | % |
R | | | 16,390,623 | | | | 100.0 | % |
At the reporting period end, the number of shareholders holding greater than 5% of the Fund are as follows:
| | | | | | | | |
| | | |
| | | Number of Shareholders | | Percentage of Outstanding Shares |
Affiliated | | | 1 | | | | 63.7 | % |
Unaffiliated | | | 2 | | | | 26.3 | % |
Transactions in shares of beneficial interest were as follows:
| | | | | | | | | | | | |
| | | |
| Share Class | | Shares | | | Amount | |
| | | |
Class A | | | | | | | | | | | | |
Year ended February 28, 2022: | | | | | | | | | | | | |
Shares sold | | | 504,706 | | | | | | | $ | 7,137,978 | |
Shares issued in reinvestment of dividends and distributions | | | 231,977 | | | | | | | | 3,113,129 | |
Shares purchased | | | (371,429 | ) | | | | | | | (5,260,895 | ) |
Net increase (decrease) in shares outstanding before conversion | | | 365,254 | | | | | | | | 4,990,212 | |
Shares issued upon conversion from other share class(es) | | | 13,988 | | | | | | | | 202,258 | |
Shares purchased upon conversion into other share class(es) | | | (37,953 | ) | | | | | | | (532,995 | ) |
Net increase (decrease) in shares outstanding | | | 341,289 | | | | | | | $ | 4,659,475 | |
| | | |
Year ended February 28, 2021: | | | | | | | | | | | | |
Shares sold | | | 206,058 | | | | | | | $ | 2,141,666 | |
Shares issued in reinvestment of dividends and distributions | | | 43,635 | | | | | | | | 500,490 | |
Shares purchased | | | (538,311 | ) | | | | | | | (5,331,771 | ) |
Net increase (decrease) in shares outstanding before conversion | | | (288,618 | ) | | | | | | | (2,689,615 | ) |
Shares issued upon conversion from other share class(es) | | | 50,568 | | | | | | | | 481,153 | |
Shares purchased upon conversion into other share class(es) | | | (5,969 | ) | | | | | | | (67,670 | ) |
Net increase (decrease) in shares outstanding | | | (244,019 | ) | | | | | | $ | (2,276,132 | ) |
PGIM Quant Solutions Large-Cap Value Fund 43
Notes to Financial Statements (continued)
| | | | | | | | | | | | |
| | | |
| Share Class | | Shares | | | Amount | |
| | | |
Class B | | | | | | | | | | | | |
| | | |
Period ended June 26, 2020*: | | | | | | | | | | | | |
Shares purchased | | | (7,783 | ) | | | | | | $ | (62,581 | ) |
Net increase (decrease) in shares outstanding before conversion | | | (7,783 | ) | | | | | | | (62,581 | ) |
Shares purchased upon conversion into other share class(es) | | | (18,196 | ) | | | | | | | (146,802 | ) |
Net increase (decrease) in shares outstanding | | | (25,979 | ) | | | | | | $ | (209,383 | ) |
| | | |
Class C | | | | | | | | | | | | |
Year ended February 28, 2022: | | | | | | | | | | | | |
Shares sold | | | 113,357 | | | | | | | $ | 1,458,597 | |
Shares issued in reinvestment of dividends and distributions | | | 26,183 | | | | | | | | 316,818 | |
Shares purchased | | | (70,122 | ) | | | | | | | (896,154 | ) |
Net increase (decrease) in shares outstanding before conversion | | | 69,418 | | | | | | | | 879,261 | |
Shares purchased upon conversion into other share class(es) | | | (23,790 | ) | | | | | | | (307,515 | ) |
Net increase (decrease) in shares outstanding | | | 45,628 | | | | | | | $ | 571,746 | |
| | | |
Year ended February 28, 2021: | | | | | | | | | | | | |
Shares sold | | | 111,687 | | | | | | | $ | 1,085,596 | |
Shares issued in reinvestment of dividends and distributions | | | 2,629 | | | | | | | | 27,477 | |
Shares purchased | | | (141,482 | ) | | | | | | | (1,275,822 | ) |
Net increase (decrease) in shares outstanding before conversion | | | (27,166 | ) | | | | | | | (162,749 | ) |
Shares purchased upon conversion into other share class(es) | | | (14,366 | ) | | | | | | | (149,959 | ) |
Net increase (decrease) in shares outstanding | | | (41,532 | ) | | | | | | $ | (312,708 | ) |
| | | |
Class R | | | | | | | | | | | | |
Year ended February 28, 2022: | | | | | | | | | | | | |
Shares sold | | | 641,739 | | | | | | | $ | 9,404,663 | |
Shares issued in reinvestment of dividends and distributions | | | 1,421,892 | | | | | | | | 19,721,636 | |
Shares purchased | | | (4,006,251 | ) | | | | | | | (57,208,039 | ) |
Net increase (decrease) in shares outstanding | | | (1,942,620 | ) | | | | | | $ | (28,081,740 | ) |
| | | |
Year ended February 28, 2021: | | | | | | | | | | | | |
Shares sold | | | 6,466,834 | | | | | | | $ | 54,105,385 | |
Shares issued in reinvestment of dividends and distributions | | | 324,260 | | | | | | | | 3,832,749 | |
Shares purchased | | | (4,257,045 | ) | | | | | | | (44,742,906 | ) |
Net increase (decrease) in shares outstanding | | | 2,534,049 | | | | | | | $ | 13,195,228 | |
44
| | | | | | | | | | | | |
| | | |
| Share Class | | Shares | | | Amount | |
| | | |
Class Z | | | | | | | | | | | | |
Year ended February 28, 2022: | | | | | | | | | | | | |
Shares sold | | | 1,646,528 | | | | | | | $ | 23,973,739 | |
Shares issued in reinvestment of dividends and distributions | | | 346,028 | | | | | | | | 4,795,953 | |
Shares purchased | | | (1,183,183 | ) | | | | | | | (17,499,998 | ) |
Net increase (decrease) in shares outstanding before conversion | | | 809,373 | | | | | | | | 11,269,694 | |
Shares issued upon conversion from other share class(es) | | | 45,070 | | | | | | | | 651,161 | |
Shares purchased upon conversion into other share class(es) | | | (3,094,001 | ) | | | | | | | (46,076,756 | ) |
Net increase (decrease) in shares outstanding | | | (2,239,558 | ) | | | | | | $ | (34,155,901 | ) |
| | | |
Year ended February 28, 2021: | | | | | | | | | | | | |
Shares sold | | | 3,056,448 | | | | | | | $ | 31,498,868 | |
Shares issued in reinvestment of dividends and distributions | | | 116,001 | | | | | | | | 1,369,969 | |
Shares purchased | | | (1,312,222 | ) | | | | | | | (13,155,910 | ) |
Net increase (decrease) in shares outstanding before conversion | | | 1,860,227 | | | | | | | | 19,712,927 | |
Shares issued upon conversion from other share class(es) | | | 7,701 | | | | | | | | 89,861 | |
Shares purchased upon conversion into other share class(es) | | | (27,800 | ) | | | | | | | (263,730 | ) |
Net increase (decrease) in shares outstanding | | | 1,840,128 | | | | | | | $ | 19,539,058 | |
| | | |
Class R6 | | | | | | | | | | | | |
Year ended February 28, 2022: | | | | | | | | | | | | |
Shares sold | | | 2,920,099 | | | | | | | $ | 42,483,632 | |
Shares issued in reinvestment of dividends and distributions | | | 35,030 | | | | | | | | 485,163 | |
Shares purchased | | | (3,567,105 | ) | | | | | | | (53,363,234 | ) |
Net increase (decrease) in shares outstanding before conversion | | | (611,976 | ) | | | | | | | (10,394,439 | ) |
Shares issued upon conversion from other share class(es) | | | 3,093,620 | | | | | | | | 46,072,372 | |
Shares purchased upon conversion into other share class(es) | | | (574 | ) | | | | | | | (8,525 | ) |
Net increase (decrease) in shares outstanding | | | 2,481,070 | | | | | | | $ | 35,669,408 | |
| | | |
Year ended February 28, 2021: | | | | | | | | | | | | |
Shares sold | | | 22,156 | | | | | | | $ | 243,995 | |
Shares issued in reinvestment of dividends and distributions | | | 736 | | | | | | | | 8,686 | |
Shares purchased | | | (14,405 | ) | | | | | | | (135,852 | ) |
Net increase (decrease) in shares outstanding before conversion | | | 8,487 | | | | | | | | 116,829 | |
Shares issued upon conversion from other share class(es) | | | 5,593 | | | | | | | | 57,147 | |
Net increase (decrease) in shares outstanding | | | 14,080 | | | | | | | $ | 173,976 | |
| * | Effective June 26, 2020, all of the issued and outstanding Class B shares of the Fund converted into Class A shares. |
The RIC, on behalf of the Fund, along with other affiliated registered investment companies (the “Participating Funds”), is a party to a Syndicated Credit Agreement (“SCA”) with a group of banks. The purpose of the SCA is to provide an alternative source of temporary
PGIM Quant Solutions Large-Cap Value Fund 45
Notes to Financial Statements (continued)
funding for capital share redemptions. The table below provides details of the current SCA in effect at the reporting period-end as well as the prior SCA.
| | | | | | |
| | | Current SCA | | | | Prior SCA |
Term of Commitment | | 10/1/2021 – 9/29/2022 | | | | 10/2/2020 – 9/30/2021 |
Total Commitment | | $1,200,000,000 | | | | $1,200,000,000 |
Annualized Commitment Fee on the Unused Portion of the SCA | | 0.15% | | | | 0.15% |
Annualized Interest Rate on Borrowings | | 1.20% plus the higher of (1) the effective federal funds rate, (2) the one-month LIBOR rate or (3) zero percent | | | | 1.30% plus the higher of (1) the effective federal funds rate, (2) the one-month LIBOR rate or (3) zero percent |
Certain affiliated registered investment companies that are parties to the SCA include portfolios that are subject to a predetermined mathematical formula used to manage certain benefit guarantees offered under variable annuity contracts. The formula may result in large scale asset flows into and out of these portfolios. Consequently, these portfolios may be more likely to utilize the SCA for purposes of funding redemptions. It may be possible for those portfolios to fully exhaust the committed amount of the SCA, thereby requiring the Manager to allocate available funding per a Board-approved methodology designed to treat the Participating Funds in the SCA equitably.
The Fund utilized the SCA during the year ended February 28, 2022. The average daily balance for the 21 days that the Fund had loans outstanding during the period was approximately $9,894,810, borrowed at a weighted average interest rate of 1.34%. The maximum loan outstanding amount during the period was $27,291,000. At February 28, 2022, the Fund had an outstanding loan balance of $128,000.
| 9. | Risks of Investing in the Fund |
The Fund’s risks include, but are not limited to, some or all of the risks discussed below. For further information on the Fund’s risks, please refer to the Fund’s Prospectus and Statement of Additional Information.
Economic and Market Events Risk: Events in the U.S. and global financial markets, including actions taken by the U.S. Federal Reserve or foreign central banks to stimulate or stabilize economic growth or the functioning of the securities markets, may at times result in unusually high market volatility, which could negatively impact performance. Relatively reduced liquidity in credit and fixed income markets could adversely affect issuers worldwide.
46
Equity and Equity-Related Securities Risk: Equity and equity-related securities may be subject to changes in value, and their values may be more volatile than those of other asset classes. In addition to an individual security losing value, the value of the equity markets or a sector in which the Fund invests could go down. Different parts of a market can react differently to adverse issuer, market, regulatory, political and economic developments.
Increase in Expenses Risk: Your actual cost of investing in the Fund may be higher than the expenses shown in the expense table of the Fund’s prospectus for a variety of reasons. For example, expense ratios may be higher than those shown if average net assets decrease. Net assets are more likely to decrease and Fund expense ratios are more likely to increase when markets are volatile. Active and frequent trading of Fund securities can increase expenses.
Large Capitalization Company Risk: Companies with large market capitalizations go in and out of favor based on market and economic conditions. Larger companies tend to be less volatile than companies with smaller market capitalizations. In exchange for this potentially lower risk, the Fund’s value may not rise or fall as much as the value of funds that emphasize companies with smaller market capitalizations.
Large Shareholder and Large Scale Redemption Risk: Certain individuals, accounts, funds (including funds affiliated with the Manager) or institutions, including the Manager and its affiliates, may from time to time own or control a substantial amount of the Fund’s shares. There is no requirement that these entities maintain their investment in the Fund. There is a risk that such large shareholders or that the Fund’s shareholders generally may redeem all or a substantial portion of their investments in the Fund in a short period of time, which could have a significant negative impact on the Fund’s NAV, liquidity, and brokerage costs. Large redemptions could also result in tax consequences to shareholders and impact the Fund’s ability to implement its investment strategy. The Fund’s ability to pursue its investment objective after one or more large scale redemptions may be impaired and, as a result, the Fund may invest a larger portion of its assets in cash or cash equivalents.
Management Risk: Actively managed mutual funds are subject to management risk. The subadviser will apply investment techniques and risk analyses in making investment decisions for the Fund, but there can be no guarantee that these techniques will produce the desired results. Additionally, the investments selected by the subadviser may underperform the markets in general, the Fund’s benchmark and other mutual funds with similar investment objectives.
Market Disruption and Geopolitical Risks: Market disruption can be caused by economic, financial or political events and factors, including but not limited to, international wars or conflicts (including Russia’s military invasion of Ukraine), geopolitical developments (including trading and tariff arrangements, sanctions and cybersecurity attacks), instability in regions such as Asia, Eastern Europe and the Middle East, terrorism, natural disasters and public health epidemics (including the outbreak of COVID-19 globally).
PGIM Quant Solutions Large-Cap Value Fund 47
Notes to Financial Statements (continued)
The extent and duration of such events and resulting market disruptions cannot be predicted, but could be substantial and could magnify the impact of other risks to the Fund. These and other similar events could adversely affect the U.S. and foreign financial markets and lead to increased market volatility, reduced liquidity in the securities markets, significant negative impacts on issuers and the markets for certain securities and commodities and/or government intervention. They may also cause short- or long- term economic uncertainties in the United States and worldwide. As a result, whether or not the Fund invests in securities of issuers located in or with significant exposure to the countries directly affected, the value and liquidity of the Fund’s investments may be negatively impacted. Further, due to closures of certain markets and restrictions on trading certain securities, the value of certain securities held by the Fund could be significantly impacted, which could lead to such securities being valued at zero.
COVID-19 and the related governmental and public responses have had and may continue to have an impact on the Fund’s investments and net asset value and have led and may continue to lead to increased market volatility and the potential for illiquidity in certain classes of securities and sectors of the market. They have also had and may continue to result in periods of business disruption, business closures, inability to obtain raw materials, supplies and component parts, and reduced or disrupted operations for the issuers in which the Fund invests. The occurrence, reoccurrence and pendency of public health epidemics could adversely affect the economies and financial markets either in specific countries or worldwide.
Market Risk: Securities markets may be volatile and the market prices of the Fund’s securities may decline. Securities fluctuate in price based on changes in an issuer’s financial condition and overall market and economic conditions. If the market prices of the securities owned by the Fund fall, the value of your investment in the Fund will decline.
Model Design Risk: The subadviser uses certain quantitative models to help guide its investment decisions. The design of the underlying models may be flawed or incomplete. The investment models the subadviser uses are based on historical and theoretical underpinnings that it believes are sound. There can be no guarantee, however, that these underpinnings will correlate with security price behavior in the manner assumed by the subadviser’s models. Additionally, the quantitative techniques that underlie the subadviser’s portfolio construction processes may fail to fully anticipate important risks.
Model Implementation Risk: While the subadviser strives to mitigate the likelihood of material implementation errors, it is impossible to completely eliminate the risk of error in the implementation of the computer models that guide the subadviser’s quantitative investment processes. Additionally, it may be difficult to implement model recommendations in volatile and rapidly changing market conditions.
48
Value Style Risk: Since the Fund follows a value investment style, there is the risk that the value style may be out of favor for long periods of time, that the market will not recognize a security’s intrinsic value for a long time or at all, or that a stock judged to be undervalued may actually be appropriately priced or overvalued. Issuers of value stocks may have experienced adverse business developments or may be subject to special risks that have caused the stock to be out of favor. In addition, the Fund’s value investment style may go out of favor with investors, negatively affecting the Fund’s performance. If the Fund’s assessment of market conditions or a company’s value is inaccurate, the Fund could suffer losses or produce poor performance relative to other funds.
| 10. | Recent Regulatory Developments |
On December 3, 2020, the SEC announced that it voted to adopt a new rule that establishes an updated regulatory framework for fund valuation practices (the “Rule”). The Rule, in part, provides (i) a framework for determining fair value in good faith and (ii) provides for a fund Board’s assignment of its responsibility for the execution of valuation-related activities to a fund’s investment adviser. Further, the SEC is rescinding previously issued guidance on related issues. The Rule took effect on March 8, 2021, with a compliance date of September 8, 2022. Management is currently evaluating the Rule and its impact to the Fund.
PGIM Quant Solutions Large-Cap Value Fund 49
Report of Independent Registered Public Accounting Firm
To the Board of Trustees of Prudential Investment Portfolios 3 and Shareholders of PGIM Quant Solutions Large-Cap Value Fund
Opinion on the Financial Statements
We have audited the accompanying statement of assets and liabilities, including the schedule of investments, of PGIM Quant Solutions Large-Cap Value Fund (one of the funds constituting Prudential Investment Portfolios 3, referred to hereafter as the “Fund”) as of February 28, 2022, the related statement of operations for the year ended February 28, 2022, the statement of changes in net assets for each of the two years in the period ended February 28, 2022, including the related notes, and the financial highlights for each of the two years in the period ended February 28, 2022 (collectively referred to as the “financial statements”). In our opinion, the financial statements present fairly, in all material respects, the financial position of the Fund as of February 28, 2022, the results of its operations for the year then ended, and the changes in its net assets and the financial highlights for each of the two years in the period ended February 28, 2022 in conformity with accounting principles generally accepted in the United States of America.
The financial statements of the Fund as of and for the year ended February 29, 2020 and the financial highlights for each of the periods ended on or prior to February 29, 2020 (not presented herein, other than the financial highlights) were audited by other auditors whose report dated April 17, 2020 expressed an unqualified opinion on those financial statements and financial highlights.
Basis for Opinion
These financial statements are the responsibility of the Fund’s management. Our responsibility is to express an opinion on the Fund’s financial statements based on our audits. We are a public accounting firm registered with the Public Company Accounting Oversight Board (United States) (PCAOB) and are required to be independent with respect to the Fund in accordance with the U.S. federal securities laws and the applicable rules and regulations of the Securities and Exchange Commission and the PCAOB.
We conducted our audits of these financial statements in accordance with the standards of the PCAOB. Those standards require that we plan and perform the audit to obtain reasonable assurance about whether the financial statements are free of material misstatement, whether due to error or fraud.
Our audits included performing procedures to assess the risks of material misstatement of the financial statements, whether due to error or fraud, and performing procedures that respond to those risks. Such procedures included examining, on a test basis, evidence regarding the amounts and disclosures in the financial statements. Our audits also included evaluating the accounting principles used and significant estimates made by management, as well as evaluating the overall presentation of the financial statements. Our procedures included confirmation of securities owned as of February 28, 2022 by correspondence with the custodian, transfer agent and broker. We believe that our audits provide a reasonable basis for our opinion.
/s/PricewaterhouseCoopers LLP
New York, New York
April 20, 2022
We have served as the auditor of one or more investment companies in the PGIM Retail Funds complex since 2020.
50
Tax Information (unaudited)
We are advising you that during the year ended February 28, 2022, the Fund reports the maximum amount allowed per share but not less than $0.08 for Class A, C, R, Z and R6 shares as a capital gain distribution in accordance with Section 852(b)(3)(C) of the Internal Revenue Code.
For the year ended February 28, 2022, the Fund reports the maximum amount allowable under Section 854 of the Internal Revenue Code, but not less than, the following percentages of the ordinary income dividends paid as 1) qualified dividend income (QDI); and 2) eligible for corporate dividends received deduction (DRD):
| | | | | | | | |
| | | QDI | | | DRD | |
| | |
PGIM Quant Solutions Large-Cap Value Fund | | | 27.99 | % | | | 28.16 | % |
In January 2023, you will be advised on IRS Form 1099-DIV or substitute 1099-DIV, as to the federal tax status of dividends and distributions received by you in calendar year 2022.
PGIM Quant Solutions Large-Cap Value Fund 51
INFORMATION ABOUT BOARD MEMBERS AND OFFICERS (unaudited)
Information about Board Members and Officers of the Fund is set forth below. Board Members who are not deemed to be “interested persons” of the Fund, as defined in the 1940 Act, are referred to as “Independent Board Members.” Board Members who are deemed to be “interested persons” of the Fund are referred to as “Interested Board Members.” The Board Members are responsible for the overall supervision of the operations of the Fund and perform the various duties imposed on the directors of investment companies by the 1940 Act. The Board in turn elects the Officers, who are responsible for administering the day-to-day operations of the Fund.
| | | | | | |
| |
Independent Board Members |
| | | | |
Name Year of Birth Position(s) Portfolios Overseen | | Principal Occupation(s) During Past Five Years | | Other Directorships Held During Past Five Years | | Length of Board Service |
| | | | |
Ellen S. Alberding 1958 Board Member Portfolios Overseen: 95 | | President and Board Member, The Joyce Foundation (charitable foundation) (since 2002); formerly Vice Chair, City Colleges of Chicago (community college system) (2011-2015); Trustee, National Park Foundation (charitable foundation for national park system) (2009-2018); Trustee, Economic Club of Chicago (2009-2016); Trustee, Loyola University (since 2018). | | None. | | Since September 2013 |
| | | | |
Kevin J. Bannon 1952 Board Member Portfolios Overseen: 95 | | Retired; formerly Managing Director (April 2008-May 2015) and Chief Investment Officer (October 2008-November 2013) of Highmount Capital LLC (registered investment adviser); formerly Executive Vice President and Chief Investment Officer (April 1993-August 2007) of Bank of New York Company; President (May 2003-May 2007) of BNY Hamilton Family of Mutual Funds. | | Director of Urstadt Biddle Properties (equity real estate investment trust) (since September 2008). | | Since July 2008 |
PGIM Quant Solutions Large-Cap Value Fund
| | | | | | |
| |
Independent Board Members |
| | | | |
Name Year of Birth Position(s) Portfolios Overseen | | Principal Occupation(s) During Past Five Years | | Other Directorships Held During Past Five Years | | Length of Board Service |
| | | | |
Linda W. Bynoe 1952 Board Member Portfolios Overseen: 92 | | President and Chief Executive Officer (since March 1995) and formerly Chief Operating Officer (December 1989-February 1995) of Telemat Limited LLC (formerly Telemat Ltd) (management consulting); formerly Vice President (January 1985-June 1989) at Morgan Stanley & Co. (broker-dealer). | | Trustee of Equity Residential (residential real estate) (since December 2009); Director of Northern Trust Corporation (financial services) (since April 2006); formerly Director of Anixter International, Inc. (communication products distributor) (January 2006-June 2020). | | Since March 2005 |
| | | | |
Barry H. Evans 1960 Board Member Portfolios Overseen: 94 | | Retired; formerly President (2005-2016), Global Chief Operating Officer (2014-2016), Chief Investment Officer - Global Head of Fixed Income (1998-2014), and various portfolio manager roles (1986-2006), Manulife Asset Management (asset management). | | Formerly Director, Manulife Trust Company (2011-2018); formerly Director, Manulife Asset Management Limited (2015-2017); formerly Chairman of the Board of Directors of Manulife Asset Management U.S. (2005-2016); formerly Chairman of the Board, Declaration Investment Management and Research (2008-2016). | | Since September 2017 |
| | | | |
Keith F. Hartstein 1956 Board Member & Independent Chair Portfolios Overseen: 95 | | Retired; Member (since November 2014) of the Governing Council of the Independent Directors Council (IDC) (organization of independent mutual fund directors); formerly Executive Committee of the IDC Board of Governors (October 2019-December 2021); formerly President and Chief Executive Officer (2005-2012), Senior Vice President (2004-2005), Senior Vice President of Sales and Marketing (1997-2004), and various executive management positions (1990-1997), John Hancock Funds, LLC (asset management); Chairman, Investment Company Institute’s Sales Force Marketing Committee (2003-2008). | | None. | | Since September 2013 |
Visit our website at pgim.com/investments
| | | | | | |
| |
Independent Board Members |
| | | | |
Name Year of Birth Position(s) Portfolios Overseen | | Principal Occupation(s) During Past Five Years | | Other Directorships Held During Past Five Years | | Length of Board Service |
| | | | |
Laurie Simon Hodrick 1962 Board Member Portfolios Overseen: 91 | | A. Barton Hepburn Professor Emerita of Economics in the Faculty of Business, Columbia Business School (since 2018); Visiting Fellow at the Hoover Institution, Stanford University (since 2015); Sole Member, ReidCourt LLC (since 2008) (a consulting firm); formerly Visiting Professor of Law, Stanford Law School (2015-2021); formerly A. Barton Hepburn Professor of Economics in the Faculty of Business, Columbia Business School (1996-2017); formerly Managing Director, Global Head of Alternative Investment Strategies, Deutsche Bank (2006-2008). | | Independent Director, Andela (since January 2022) (global talent network); Independent Director, Roku (since December 2020) (communication services); formerly Independent Director, Synnex Corporation (2019-2021) (information technology); formerly Independent Director, Kabbage, Inc. (2018-2020) (financial services); formerly Independent Director, Corporate Capital Trust (2017-2018) (a business development company). | | Since September 2017 |
| | | | |
Brian K. Reid 1961 Board Member Portfolios Overseen: 94 | | Retired; formerly Chief Economist for the Investment Company Institute (ICI) (2005-2017); formerly Senior Economist and Director of Industry and Financial Analysis at the ICI (1998-2004); formerly Senior Economist, Industry and Financial Analysis at the ICI (1996-1998); formerly Staff Economist at the Federal Reserve Board (1989-1996); Director, ICI Mutual Insurance Company (2012-2017). | | None. | | Since March 2018 |
PGIM Quant Solutions Large-Cap Value Fund
| | | | | | |
|
Independent Board Members |
| | | | |
Name Year of Birth Position(s) Portfolios Overseen | | Principal Occupation(s) During Past Five Years | | Other Directorships Held During Past Five Years | | Length of Board Service |
| | | | |
Grace C. Torres 1959 Board Member Portfolios Overseen: 94 | | Retired; formerly Treasurer and Principal Financial and Accounting Officer of the PGIM Funds, Target Funds, Advanced Series Trust, Prudential Variable Contract Accounts and The Prudential Series Fund (1998-June 2014); Assistant Treasurer (March 1999-June 2014) and Senior Vice President (September 1999-June 2014) of PGIM Investments LLC; Assistant Treasurer (May 2003-June 2014) and Vice President (June 2005-June 2014) of AST Investment Services, Inc.; Senior Vice President and Assistant Treasurer (May 2003-June 2014) of Prudential Annuities Advisory Services, Inc. | | Director (since January 2018) of OceanFirst Financial Corp. and OceanFirst Bank; formerly Director (July 2015-January 2018) of Sun Bancorp, Inc. N.A. and Sun National Bank. | | Since November 2014 |
| | | |
| | | | | | | |
|
Interested Board Members |
| | | | |
Name Year of Birth Position(s) Portfolios Overseen | | Principal Occupation(s) During Past Five Years | | Other Directorships Held During Past Five Years | | Length of Board Service |
| | | | |
Stuart S. Parker 1962 Board Member & President Portfolios Overseen: 94 | | President, Chief Executive Officer, Chief Operating Officer and Officer in Charge of PGIM Investments LLC (formerly known as Prudential Investments LLC) (since January 2012); formerly Executive Vice President of Jennison Associates LLC and Head of Retail Distribution of PGIM Investments LLC (June 2005-December 2011); Investment Company Institute - Board of Governors (since May 2012). | | None. | | Since January 2012 |
Visit our website at pgim.com/investments
| | | | | | |
| |
Interested Board Members |
| | | | |
Name Year of Birth Position(s) Portfolios Overseen | | Principal Occupation(s) During Past Five Years | | Other Directorships Held During Past Five Years | | Length of Board Service |
| | | | |
Scott E. Benjamin 1973 Board Member & Vice President Portfolios Overseen: 95 | | Executive Vice President (since May 2009) of PGIM Investments LLC; Vice President (since June 2012) of Prudential Investment Management Services LLC; Executive Vice President (since September 2009) of AST Investment Services, Inc.; Senior Vice President of Product Development and Marketing, PGIM Investments (since February 2006); formerly Vice President of Product Development and Product Management, PGIM Investments LLC (2003-2006). | | None. | | Since March 2010 |
| | | | |
| |
Fund Officers(a) |
| | | |
Name Year of Birth Fund Position | | Principal Occupation(s) During Past Five Years | | Length of Service as Fund Officer |
| | | |
Claudia DiGiacomo 1974 Chief Legal Officer | | Chief Legal Officer, Executive Vice President and Secretary of PGIM Investments LLC (since August 2020); Chief Legal Officer of Prudential Mutual Fund Services LLC (since August 2020); Chief Legal Officer of PIFM Holdco, LLC (since August 2020); Vice President and Corporate Counsel (since January 2005) of Prudential; and Corporate Counsel of AST Investment Services, Inc. (since August 2020); formerly Vice President and Assistant Secretary of PGIM Investments LLC (2005-2020); formerly Associate at Sidley Austin Brown & Wood LLP (1999-2004). | | Since December 2005 |
| | | |
Isabelle Sajous 1976 Chief Compliance Officer | | Chief Compliance Officer (since April 2022) of the PGIM Funds, Target Funds, PGIM Global High Yield Fund, Inc., PGIM High Yield Bond Fund, Inc., PGIM Short Duration High Yield Opportunities Fund, Advanced Series Trust, The Prudential Series Fund and Prudential’s Gibraltar Fund, Inc.; Chief Compliance Officer (since March 2022) of the PGIM Private Real Estate Fund; Vice President, Compliance of PGIM Investments LLC (since December 2020); formerly Director, Compliance (July 2018-December 2020) of Credit Suisse Asset Management LLC; and Vice President, Associate General Counsel & Deputy Chief Compliance Officer of Cramer Rosenthal McGlynn, LLC (August 2014-July 2018). | | Since April 2022 |
PGIM Quant Solutions Large-Cap Value Fund
| | | | |
| |
Fund Officers(a) |
| | | |
Name Year of Birth Fund Position | | Principal Occupation(s) During Past Five Years | | Length of Service as Fund Officer |
| | | |
Andrew R. French 1962 Secretary | | Vice President (since December 2018) of PGIM Investments LLC; formerly Vice President and Corporate Counsel (2010-2018) of Prudential; formerly Director and Corporate Counsel (2006-2010) of Prudential; Vice President and Assistant Secretary (since January 2007) of PGIM Investments LLC; Vice President and Assistant Secretary (since January 2007) of Prudential Mutual Fund Services LLC. | | Since October 2006 |
| | | |
Diana N. Huffman 1982 Assistant Secretary | | Vice President and Corporate Counsel (since September 2015) of Prudential; Vice President and Assistant Secretary (since August 2020) of PGIM Investments LLC; formerly Associate at Willkie Farr & Gallagher LLP (2009-2015). | | Since March 2019 |
| | | |
Melissa Gonzalez 1980 Assistant Secretary | | Vice President and Corporate Counsel (since September 2018) of Prudential; Vice President and Assistant Secretary (since August 2020) of PGIM Investments LLC; formerly Director and Corporate Counsel (March 2014-September 2018) of Prudential. | | Since March 2020 |
| | | |
Patrick E. McGuinness 1986 Assistant Secretary | | Vice President and Assistant Secretary (since August 2020) of PGIM Investments LLC; Director and Corporate Counsel (since February 2017) of Prudential; and Corporate Counsel (2012-2017) of IIL, Inc. | | Since June 2020 |
| | | |
Debra Rubano 1975 Assistant Secretary | | Vice President and Corporate Counsel (since November 2020) of Prudential; formerly Director and Senior Counsel of Allianz Global Investors U.S. Holdings LLC (2010-2020) and Assistant Secretary of numerous funds in the Allianz fund complex (2015-2020). | | Since December 2020 |
| | | |
Kelly A. Coyne 1968 Assistant Secretary | | Director, Investment Operations of Prudential Mutual Fund Services LLC (since 2010). | | Since March 2015 |
| | | |
Christian J. Kelly 1975 Treasurer and Principal Financial and Accounting Officer | | Vice President, Head of Fund Administration of PGIM Investments LLC (since November 2018); formerly Director of Fund Administration of Lord Abbett & Co. LLC (2009-2018), Treasurer and Principal Accounting Officer of the Lord Abbett Family of Funds (2017-2018); Director of Accounting, Avenue Capital Group (2008-2009); Senior Manager, Investment Management Practice of Deloitte & Touche LLP (1998-2007). | | Since January 2019 |
| | | |
Lana Lomuti 1967 Assistant Treasurer | | Vice President (since 2007) and Director (2005-2007), within PGIM Investments Fund Administration; formerly Assistant Treasurer (December 2007-February 2014) of The Greater China Fund, Inc. | | Since April 2014 |
| | | |
Russ Shupak 1973 Assistant Treasurer | | Vice President (since 2017) and Director (2013-2017), within PGIM Investments Fund Administration. | | Since October 2019 |
Visit our website at pgim.com/investments
| | | | |
| |
Fund Officers(a) |
| | | |
Name Year of Birth Fund Position | | Principal Occupation(s) During Past Five Years | | Length of Service as Fund Officer |
| | | |
Deborah Conway 1969 Assistant Treasurer | | Vice President (since 2017) and Director (2007-2017), within PGIM Investments Fund Administration. | | Since October 2019 |
| | | |
Elyse M. McLaughlin 1974 Assistant Treasurer | | Vice President (since 2017) and Director (2011-2017), within PGIM Investments Fund Administration. | | Since October 2019 |
| | | |
Jonathan Corbett 1983 Anti-Money Laundering Compliance Officer | | Vice President, Corporate Compliance, Global Compliance Programs and Compliance Risk Management (since August 2019) of Prudential; formerly Vice President and Head of Key Risk Areas Compliance (March 2016 to July 2019), Chief Privacy Officer (March 2016 to July 2019) and Head of Global Financial Crimes Unit (April 2014 to March 2016) at MetLife. | | Since October
2021 |
(a) Excludes Mr. Parker and Mr. Benjamin, interested Board Members who also serve as President and Vice President, respectively.
Explanatory Notes to Tables:
| ∎ | | Board Members are deemed to be “Interested,” as defined in the 1940 Act, by reason of their affiliation with PGIM Investments LLC and/or an affiliate of PGIM Investments LLC. |
| ∎ | | Unless otherwise noted, the address of all Board Members and Officers is c/o PGIM Investments LLC, 655 Broad Street, Newark, New Jersey 07102-4410. |
| ∎ | | There is no set term of office for Board Members or Officers. The Board Members have adopted a retirement policy, which calls for the retirement of Board Members on December 31 of the year in which they reach the age of 75. |
| ∎ | | “Other Directorships Held” includes all directorships of companies required to register or file reports with the SEC under the 1934 Act (that is, “public companies”) or other investment companies registered under the 1940 Act. |
| ∎ | | “Portfolios Overseen” includes all investment companies managed by PGIM Investments LLC. The investment companies for which PGIM Investments LLC serves as manager include the PGIM Funds, Target Funds, The Prudential Variable Contract Accounts, PGIM ETF Trust, PGIM High Yield Bond Fund, Inc., PGIM Global High Yield Fund, Inc., PGIM Short Duration High Yield Opportunities Fund, The Prudential Series Fund, Prudential’s Gibraltar Fund, Inc. and the Advanced Series Trust. |
| ∎ | | As used in the Fund Officers table “Prudential” means The Prudential Insurance Company of America. |
PGIM Quant Solutions Large-Cap Value Fund
| | | | |
∎ MAIL | | ∎ TELEPHONE | | ∎ WEBSITE |
655 Broad Street | | (800) 225-1852 | | pgim.com/investments |
Newark, NJ 07102 | | | | |
PROXY VOTING
The Board of Trustees of the Fund has delegated to the Fund’s subadviser the responsibility for voting any proxies and maintaining proxy recordkeeping with respect to the Fund. A description of these proxy voting policies and procedures is available without charge, upon request, by calling (800) 225-1852 or by visiting the Securities and Exchange Commission’s website at sec.gov. Information regarding how the Fund voted proxies relating to portfolio securities during the most recent 12-month period ended June 30 is available on the Fund’s website and on the Securities and Exchange Commission’s website.
Trustees
Ellen S. Alberding ● Kevin J. Bannon ● Scott E. Benjamin ● Linda W. Bynoe ● Barry H. Evans ● Keith F. Hartstein ● Laurie Simon Hodrick ● Stuart S. Parker ● Brian K. Reid ● Grace C. Torres
OFFICERS
Stuart S. Parker, President ● Scott E. Benjamin, Vice President ● Christian J. Kelly, Treasurer and Principal Financial and Accounting Officer ● Claudia DiGiacomo, Chief Legal Officer ● Isabelle Sajous, Chief Compliance Officer ● Jonathan Corbett, Anti-Money Laundering Compliance Officer ● Andrew R. French, Secretary ● Melissa Gonzalez, Assistant Secretary ● Diana N. Huffman, Assistant Secretary ● Kelly A. Coyne, Assistant Secretary ● Patrick E. McGuinness, Assistant Secretary ● Debra Rubano, Assistant Secretary ● Lana Lomuti, Assistant Treasurer ● Russ Shupak, Assistant Treasurer ● Elyse M. McLaughlin, Assistant Treasurer ● Deborah Conway, Assistant Treasurer
| | | | |
| MANAGER | | PGIM Investments LLC | | 655 Broad Street |
| | | | | Newark, NJ 07102 |
| | |
| SUBADVISER | | PGIM Quantitative Solutions LLC | | Gateway Center Two |
| | | | 100 Mulberry Street |
| | | | | Newark, NJ 07102 |
| | |
| DISTRIBUTOR | | Prudential Investment | | 655 Broad Street |
| | | Management Services LLC | | Newark, NJ 07102 |
| | |
| CUSTODIAN | | The Bank of New YorkMellon | | 240 Greenwich Street |
| | | | | New York, NY 10286 |
| | |
| TRANSFER AGENT | | Prudential Mutual Fund | | PO Box 9658 |
| | | Services LLC | | Providence, RI 02940 |
| | |
| INDEPENDENT REGISTERED | | PricewaterhouseCoopers LLP | | 300 Madison Avenue |
PUBLIC ACCOUNTING FIRM | | | | New York, NY 10017 |
| | |
| FUND COUNSEL | | Willkie Farr & Gallagher LLP | | 787 Seventh Avenue |
| | | | | New York, NY 10019 |
An investor should consider the investment objectives, risks, charges, and expenses of the Fund carefully before investing. The prospectus and summary prospectus contain this and other information about the Fund. An investor may obtain the prospectus and summary prospectus by visiting our website at pgim.com/investments or by calling (800) 225-1852. The prospectus and summary prospectus should be read carefully before investing.
E-DELIVERY
To receive your mutual fund documents online, go to pgim.com/investments/resource/edelivery and enroll. Instead of receiving printed documents by mail, you will receive notification via email when new materials are available. You can cancel your enrollment or change your email address at any time by visiting the website address above.
SHAREHOLDER COMMUNICATIONS WITH Trustees
Shareholders can communicate directly with the Board of Trustees by writing to the Chair of the Board, PGIM Quant Solutions Large-Cap Value Fund, PGIM Investments, Attn: Board of Trustees, 655 Broad Street, Newark, NJ 07102. Shareholders can communicate directly with an individual Trustee by writing to that Trustee at the same address. Communications are not screened before being delivered to the addressee.
AVAILABILITY OF PORTFOLIO HOLDINGS
The Fund files its complete schedule of portfolio holdings with the Securities and Exchange Commission for the first and third quarters of each fiscal year as an exhibit to its reports on Form N-PORT. The Fund’s Form N-PORT filings are available on the Commission’s website at sec.gov.
The Fund’s Statement of Additional Information contains additional information about the Fund’s Trustees and is available without charge, upon request, by calling (800) 225-1852.
Mutual Funds:
| | | | |
| | | |
ARE NOT INSURED BY THE FDIC OR ANY FEDERAL GOVERNMENT AGENCY | | MAY LOSE VALUE | | ARE NOT A DEPOSIT OF OR GUARANTEED BY ANY BANK OR ANY BANK AFFILIATE |

PGIM QUANT SOLUTIONS LARGE-CAP VALUE FUND
| | | | | | | | | | |
| | | | | |
| SHARE CLASS | | A | | C | | R | | Z | | R6 |
| | | | | |
NASDAQ | | SUVAX | | SUVCX | | PRVRX | | SUVZX | | SUVQX |
| | | | | |
CUSIP | | 74440K108 | | 74440K306 | | 74440K736 | | 74440K405 | | 74440K538 |
MF502E

PGIM STRATEGIC BOND FUND
ANNUAL REPORT
FEBRUARY 28, 2022

|
|
To enroll in e-delivery, go to pgim.com/investments/resource/edelivery |
Table of Contents
This report is not authorized for distribution to prospective investors unless preceded or accompanied by a current prospectus.
The views expressed in this report and information about the Fund’s portfolio holdings are for the period covered by this report and are subject to change thereafter.
Mutual funds are distributed by Prudential Investment Management Services LLC, (PIMS), member SIPC. PGIM Fixed Income is a unit of PGIM, Inc. (PGIM), a registered investment adviser.PIMS and PGIM are Prudential Financial companies. © 2022 Prudential Financial, Inc. and its related entities. PGIM and the PGIM logo are service marks of Prudential Financial, Inc. and its related entities, registered in many jurisdictions worldwide.
| | |
| 2 | | Visit our website at pgim.com/investments |
Letter from the President
| | |
 | | Dear Shareholder: We hope you find the annual report for the PGIM Strategic Bond Fund informative and useful. The report covers performance for the 12-month period that ended February 28, 2022. The global economy and markets continued to recover throughout the period from the ongoing impact of the COVID-19 pandemic. The Federal Reserve (the Fed) kept interest rates near zero to promote borrowing, while the approval of effective vaccines encouraged states to reopen their economies. Yet inflation surged to a 40-year high near the end of the period, prompting the Fed to signal it would begin raising rates to combat rising consumer prices. |
Stocks rallied for much of the period, with ongoing stimulus programs helping boost the job market and corporate profits. Equity markets rose to record levels but became much more volatile later on as investors worried that supply-chain challenges, the emergence of more contagious variants, and geopolitical uncertainty in Europe relating to Russia’s invasion of Ukraine might stall the recovery.For the period, large-cap US equities and stocks in developed foreign markets rose. Emerging market and small-cap US stocks fell.
Fixed income investors turned cautious during the period. Investment-grade bonds in the US and the overall global bond market, along with emerging market debt, posted negative returns for the period. US high yield corporate bonds posted a small gain.
Regarding your investments with PGIM, we believe it is important to maintain a diversified portfolio of funds consistent with your tolerance for risk, time horizon, and financial goals. Your financial advisor can help you create a diversified investment plan that may include funds covering all the basic asset classes and that reflects your personal investor profile and risk tolerance. However,diversification and asset allocation strategies do not assure a profit or protect against loss in declining markets.
At PGIM Investments, we provide access to active investment strategies across the global markets in the pursuit of consistent outperformance for investors. PGIM is a top-10 investment manager globally with more than $1.5 trillion in assets under management. Our scale and investment expertise allow us to deliver a diversified suite of actively managed solutions across a broad spectrum of asset classes and investment styles.
Thank you for choosing our family of funds.
Sincerely,

Stuart S. Parker, President
PGIM Strategic Bond Fund
April 15, 2022
| | | | |
PGIM Strategic Bond Fund | | | 3 | |
Your Fund’s Performance (unaudited)
Performance data quoted represent past performance. Past performance does not guarantee future results. The investment return and principal value of an investment will fluctuate so that an investor’s shares, when redeemed, may be worth more or less than their original cost. Current performance may be lower or higher than the past performance data quoted. An investor may obtain performance data as of the most recent month-end by visiting our website at pgim.com/investments or by calling (800) 225-1852.
| | | | | | |
| |
| | | Average Annual Total Returns as of 2/28/22 |
| | | One Year (%) | | Five Years (%) | | Since Inception (%) |
Class A | | | | | | |
(with sales charges) | | -5.76 | | 3.24 | | 4.01 (07/09/2015) |
(without sales charges) | | -2.59 | | 3.92 | | 4.53 (07/09/2015) |
Class C | | | | | | |
(with sales charges) | | -4.19 | | 3.14 | | 3.74 (07/09/2015) |
(without sales charges) | | -3.25 | | 3.14 | | 3.74 (07/09/2015) |
Class Z | | | | | | |
(without sales charges) | | -2.17 | | 4.28 | | 4.87 (07/09/2015) |
Class R6 | | | | | | |
(without sales charges) | | -2.24 | | N/A | | 4.26 (04/26/2017) |
Bloomberg Intermediate US Aggregate Bond Index | | | | | | |
| | | |
| | | -2.60 | | 2.20 | | — |
| | | | |
|
| Average Annual Total Returns as of 2/28/22 Since Inception (%) |
| | | Class A, Class C, Class Z
(07/09/2015) | | Class R6
(04/26/2017) |
| | |
Bloomberg Intermediate US Aggregate Bond Index | | 2.13 | | 2.13 |
Since Inception returns are provided for any share class with less than 10 fiscal years of returns. Since Inception returns for the Index are measured from the closest month-end to the class’ inception date.
| | |
| 4 | | Visit our website at pgim.com/investments |
Growth of a $10,000 Investment (unaudited)
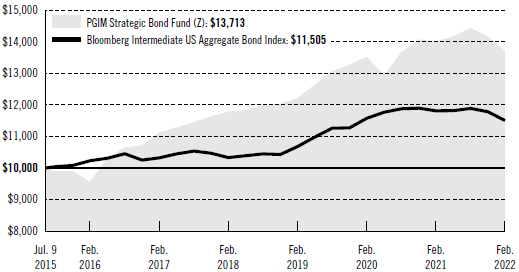
The graph compares a $10,000 investment in the Fund’s Class Z shares with a similar investment in the Bloomberg Intermediate US Aggregate Bond Index by portraying the initial account values at the beginning of the period for Class Z shares (July 9, 2015) and the account values at the end of the current fiscal year (February 28, 2022), as measured on a quarterly basis. For purposes of the graph, and unless otherwise indicated, it has been assumed that (a) all recurring fees (including management fees) were deducted and (b) all dividends and distributions were reinvested. The line graph provides information for Class Z shares only. As indicated in the tables provided earlier, performance for other share classes will vary due to the differing charges and expenses applicable to each share class (as indicated in the following paragraphs). Without waiver of fees and/or expense reimbursements, if any,the returns would have been lower.
Past performance does not predict future performance. Total returns and the ending account values in the graph include changes in share price and reinvestment of dividends and capital gains distributions in a hypothetical investment for the periods shown. The Fund’s total returns do not reflect the deduction of income taxes on an individual’s investment. Taxes may reduce your actual investment returns on income or gains paid by the Fund or any gains you may realize if you sell your shares.
| | | | |
PGIM Strategic Bond Fund | | | 5 | |
Your Fund’s Performance (continued)
The returns in the tables do not reflect the deduction of taxes that a shareholder would pay on Fund distributions or following the redemption of Fund shares. The average annual total returns take into account applicable sales charges, which are described for each share class in the table below.
| | | | | | | | |
| | | | | |
| | | Class A | | Class C | | Class Z | | Class R6 |
| | | | | |
Maximum initial sales charge | | 3.25% of public offering price | | None | | None | | None |
| | | | | |
Contingent deferred sales charge (CDSC) (as a percentage of the lower of the original purchase price or the net asset value at redemption) | | 1.00% on sales of $500,000 or more made within 12 months of purchase | | 1.00% on sales made within 12 months of purchase | | None | | None |
| | | | | |
Annual distribution and service (12b-1) fees (shown as a percentage of average daily net assets) | | 0.25% | | 1.00% | | None | | None |
Benchmark Definition
Bloomberg Intermediate US Aggregate Bond Index—The Bloomberg Intermediate US Aggregate Bond Index is the intermediate component of the Bloomberg US Aggregate Bond Index, which is unmanaged and represents securities that are taxable and dollar denominated. It covers the US investment-grade fixed rate bond market, with index components for government and corporate securities, mortgage pass-through securities, and asset-backed securities with maturities from 1 year up to, but not including 10 years for all sectors except for securitized, which does not have a maximum weighted average maturity or remaining average life constraint.
Investors cannot invest directly in an index. The returns for the Index would be lower if they included the effects of sales charges, operating expenses of a mutual fund, or taxes that may be paid by an investor.
6 Visit our website at pgim.com/investments
| | | | |
| |
| Credit Quality expressed as a percentage of total investments as of 2/28/22 (%) | | | |
| |
| AAA | | | 8.7 | |
| |
| AA | | | 9.6 | |
| |
| A | | | 6.0 | |
| |
| BBB | | | 20.9 | |
| |
| BB | | | 26.4 | |
| |
| B | | | 15.8 | |
| |
| CCC | | | 3.8 | |
| |
| CC | | | 0.1 | |
| |
| Not Rated | | | 9.4 | |
| |
| Cash/Cash Equivalents | | | -0.7 | |
| | |
| Total | | | 100.0 | |
Credit ratings reflect the highest rating assigned by a nationally recognized statistical rating organization (NRSRO) such as Moody’s Investors Service, Inc. (Moody’s), S&P Global Ratings (S&P), or Fitch, Inc. (Fitch). Credit ratings reflect the common nomenclature used by both S&P and Fitch. Where applicable, ratings are converted to the comparable S&P/Fitch rating tier nomenclature. These rating agencies are independent and are widely used. The Not Rated category consists of securities that have not been rated by an NRSRO. Credit ratings are subject to change.
| | | | | | |
| | | |
| Distributions and Yields as of 2/28/22 | | | | | | |
| | | |
| | Total Distributions
Paid for 12 Months ($) | | SEC 30-Day
Subsidized Yield* (%) | | SEC 30-Day
Unsubsidized Yield** (%) |
| | | |
| Class A | | 0.38 | | 3.48 | | 3.43 |
| | | |
| Class C | | 0.30 | | 2.69 | | 2.64 |
| | | |
| Class Z | | 0.41 | | 3.81 | | 3.65 |
| | | |
| Class R6 | | 0.41 | | 3.86 | | 3.61 |
*SEC 30-Day Subsidized Yield (%)—A standardized yield calculation created by the Securities and Exchange Commission, it reflects the income earned during a 30-day period, after the deduction of the Fund’s net expenses (net of any expense waivers or reimbursements). The investor experience is represented by the SEC 30-Day Subsidized Yield.
**SEC 30-Day Unsubsidized Yield (%)—A standardized yield calculation created by the Securities and Exchange Commission, it reflects the income earned during a 30-day period, after the deduction of the Fund’s gross expenses. The investor experience is represented by the SEC 30-Day Subsidized Yield.
PGIM Strategic Bond Fund 7
Strategy and Performance Overview*
(unaudited)
How did the Fund perform?
The PGIM Strategic Bond Fund’s Class Z shares returned –2.17% in the 12-month reporting period that ended February 28, 2022, outperforming the –2.60% return of the Bloomberg Intermediate US Aggregate Bond Index (the Index).
What were the market conditions?
| ● | The strong global rebound from the depths of the COVID-19 pandemic continued throughout much of the reporting period, as economies responded to monetary and fiscal stimulus. The rollout of COVID-19 vaccines, along with the potential for further stimulus, shifted the prospects for growth and inflation in the first half of 2021, kicking off a robust “reflation trade” in bond markets. This caused the US Treasury yield curve to steepen over the first month of the period before flattening sharply throughout the remainder of the period, as the market pulled forward its expectation for rate hikes. (A yield curve is a line graph that illustrates the relationship between the yields and maturities of fixed income securities. It is created by plotting the yields of different maturities for the same type of bonds.) |
| ● | While the yield on the 2-year Treasury note rose sharply beginning in the fourth quarter of 2021 as markets began pricing an increased number of rate hikes in 2022, long-end Treasury yields declined amid uncertainty around the Omicron variant of COVID-19, the economic impact of the Russian invasion of Ukraine, and the prospect of slower economic growth ahead. |
| ● | Despite steepening in the first quarter of 2021, the US Treasury yield curve flattened sharply over the full period, with the 10-year/2-year Treasury spread declining from 1.32% to 0.39% as of February 28, 2022. |
| ● | Spread market performance was mixed over the period. While the Federal Reserve’s (the Fed’s) monetary policy, fiscal stimulus, the rollout of the vaccines, and better-than-expected corporate earnings remained supportive, rising inflation expectations, a more hawkish Fed beginning in the fourth quarter of 2021, and an increasingly uncertain macroeconomic backdrop drove negative returns across many sectors during the first quarter of 2022. |
| ● | Mortgage-backed securities (MBS) posted negative returns over the period amid increased supply and concerns around the Fed’s tapering of its asset purchases. |
| ● | The US investment-grade corporate bond market underperformed, with spreads tightening to near-historic levels in the second quarter of 2021, supported by better-than-expected corporate earnings and favorable technicals, before widening through the remainder of the period amid concerns around inflation, Omicron, elevated new issuance, and, particularly during the last month of the period, geopolitical uncertainty. (Technicals are indicators derived from market data to help assess conditions in a given asset class.) |
8 Visit our website at pgim.com/investments
| ● | Strengthening fundamentals generally kept securitized credit on a tightening trajectory for most of the period before widening amid February’s broad market volatility. High-quality commercial mortgage-backed securities (CMBS) and collateralized loan obligation (CLO) spreads ended the period at or near 12-month wides. |
| ● | US high yield bond spreads generally tightened as fundamentals remained supportive; however, spreads widened sharply the last two months of the period as geopolitical and inflation concerns impacted the sector. |
| ● | Meanwhile, emerging-market spreads widened over the period amid an increasingly uncertain geopolitical backdrop, strong US dollar, and, finally, the Russian invasion of Ukraine. |
What worked?
| ● | Overall sector allocation was a primary driver of the Fund’s returns during the period, with an overweight to high yield relative to the Index the largest contributor. Overweights to investment-grade corporates, CLOs, and bank loans also contributed. An underweight to MBS was also a strong contributor to performance. |
| ● | Yield curve positioning, particularly along the US Treasury curve, was also a strong contributor as the curve flattened. |
| ● | While overall security selection detracted from performance, selection in non-agency MBS, CMBS, CLOs, asset-backed securities, and agency MBS contributed. |
| ● | Within corporates, positions in upstream and midstream energy, aerospace & defense, and gaming/lodging/leisure were the largest contributors. Looking at specific issuers, positions in Chesapeake Energy Corp. (upstream energy), Ferrellgas Partners LP (midstream energy), and Bombardier Inc. (aerospace &defense) were the largest contributors to performance. |
What didn’t work?
| ● | Duration positioning was the largest detractor from the Fund’s performance over the period, with positioning in emerging-market rates having the most significant negative impact. (Duration measures the sensitivity of the price—the value of principal—of a bond to a change in interest rates.) |
| ● | Overall security selection detracted from returns, with selection in emerging markets, high yield, and Treasuries detracting the most. |
| ● | While overall sector allocation contributed to returns, an overweight to emerging markets relative to the Index detracted from performance. |
| ● | Looking at specific issuers, positions in Ukraine, Belarus, and Sinclair Broadcast Group (media &entertainment) detracted from performance. |
Did the Fund use derivatives?
The Fund held futures contracts on government securities, interest rate swaps, and options to help manage its duration and yield curve exposure during the period. In addition, the Fund traded foreign exchange derivatives. The Fund used credit default
PGIM Strategic Bond Fund 9
Strategy and Performance Overview* (continued)
swaps to hedge its credit risk in order to increase or decrease credit risk. Overall, the use of these derivative instruments detracted from performance.
Current outlook
| ● | Russia’s invasion of Ukraine has quickly led to a seismic shift in the global economy, with the dual risks of geopolitical upheavals and central bank hawkishness feeding into a sell-off in risky assets. In PGIM Fixed Income’s view, the most salient question at this juncture is whether global central banks will succeed in engineering a soft landing by simultaneously fighting inflation and mitigating the negative consequences of the invasion. |
| ● | PGIM Fixed Income has raised its rate-hike forecast to four increases in 2022—still materially fewer than the hikes that have been priced in Fed funds futures—while acknowledging that the risk is more uncertain due to the conflict in Ukraine. PGIM Fixed Income’s reluctance in joining the chorus of hawkish calls (more hawkish prior to the invasion) reflects the limits to extrapolating the present conditions into the future, as it is simply too difficult to predict how the economy will fare in the latter part of 2022 once the initial rate hikes, quantitative tightening, and the impact of the Russian invasion trickle down to the real economy. |
| ● | As for credit sectors, PGIM Fixed Income believes spreads should benefit from the ongoing economic expansion and its positive impact on fundamentals. However, the bulk of the spread narrowing has already occurred, leaving future returns from spread product likely to be much more modest. Most geopolitical conflicts in post-war history have turned out to be a red herring for investors, but it may be misplaced to extrapolate the past at this inflection point, in PGIM Fixed Income’s view. Even after the dramatic sell-off, valuations remain rich by historical standards, and this backdrop further emphasizes the importance of identifying sector rotation and alpha-generating opportunities going forward. |
*This strategy and performance overview, which discusses what strategies or holdings (including derivatives, if applicable) affected the Fund’s performance, is compiled based on how the Fund performed relative to the Fund’s assigned index and is viewed for performance attribution purposes at the aggregate Fund level, which in most instances will not directly correlate to the amounts disclosed in the Statement of Operations which conform to U.S. generally accepted accounting principles.
10 Visit our website at pgim.com/investments
Fees and Expenses (unaudited)
As a shareholder of the Fund, you incur two types of costs: (1) transaction costs, including sales charges (loads) on purchase payments and redemptions, as applicable, and (2) ongoing costs, including management fees, distribution and/or service (12b-1) fees, and other Fund expenses, as applicable. This example is intended to help you understand your ongoing costs (in dollars) of investing in the Fund and to compare these costs with the ongoing costs of investing in other mutual funds.
The example is based on an investment of $1,000 held through the six-month period ended February 28, 2022. The example is for illustrative purposes only; you should consult the Prospectus for information on initial and subsequent minimum investment requirements.
Actual Expenses
The first line for each share class in the table on the following page provides information about actual account values and actual expenses. You may use the information on this line, together with the amount you invested, to estimate the expenses that you paid over the period. Simply divide your account value by $1,000 (for example, an $8,600 account value ÷ $1,000 =8.6), then multiply the result by the number on the first line under the heading “Expenses Paid During the Six-Month Period” to estimate the expenses you paid on your account during this period.
Hypothetical Example for Comparison Purposes
The second line for each share class in the table on the following page provides information about hypothetical account values and hypothetical expenses based on the Fund’s actual expense ratio and an assumed rate of return of 5% per year before expenses, which is not the Fund’s actual return. The hypothetical account values and expenses may not be used to estimate the actual ending account balance or expenses you paid for the period. You may use this information to compare the ongoing costs of investing in the Fund and other funds. To do so, compare this 5% hypothetical example with the 5% hypothetical examples that appear in the shareholder reports of the other funds.
The Fund’s transfer agent may charge additional fees to holders of certain accounts that are not included in the expenses shown in the table on the following page. These fees apply to individual retirement accounts (IRAs) and Section 403(b) accounts. As of the close of the six-month period covered by the table, IRA fees included an annual maintenance fee of $15 per account (subject to a maximum annual maintenance fee of $25 for all accounts held by the same shareholder). Section 403(b) accounts are charged an annual $25 fiduciary maintenance fee. Some of the fees may vary in amount, or may be waived, based on your total account balance or the number of PGIM funds, including the Fund, that you own. You should consider the additional fees that were charged to your Fund account over the six-month period when you estimate the total ongoing expenses paid over the period and the impact of these fees on your ending account value, as these additional expenses are not reflected in the information
PGIM Strategic Bond Fund 11
Fees and Expenses (continued)
provided in the expense table. Additional fees have the effect of reducing investment returns.
Please note that the expenses shown in the table are meant to highlight your ongoing costs only and do not reflect any transactional costs such as sales charges (loads). Therefore, the second line for each share class in the table is useful in comparing ongoing costs only and will not help you determine the relative total costs of owning different funds. In addition, if these transactional costs were included, your costs would have been higher.
| | | | | | | | | | |
| | | | |
| PGIM Strategic Bond Fund | | Beginning
Account Value
September 1, 2021 | | Ending
Account Value
February 28, 2022 | | Annualized
Expense
Ratio Based on
the
Six-Month Period | | Expenses Paid
During the
Six-Month
Period* |
| Class A | | Actual | | $1,000.00 | | $ 948.20 | | 0.95% | | $4.59 |
| | Hypothetical | | $1,000.00 | | $1,020.08 | | 0.95% | | $4.76 |
| Class C | | Actual | | $1,000.00 | | $ 944.50 | | 1.73% | | $8.34 |
| | Hypothetical | | $1,000.00 | | $1,016.22 | | 1.73% | | $8.65 |
| Class Z | | Actual | | $1,000.00 | | $ 949.80 | | 0.62% | | $3.00 |
| | Hypothetical | | $1,000.00 | | $1,021.72 | | 0.62% | | $3.11 |
| Class R6 | | Actual | | $1,000.00 | | $ 949.00 | | 0.59% | | $2.85 |
| | | Hypothetical | | $1,000.00 | | $1,021.87 | | 0.59% | | $2.96 |
*Fund expenses (net of fee waivers or subsidies, if any) for each share class are equal to the annualized expense ratio for each share class (provided in the table), multiplied by the average account value over the period, multiplied by the 181 days in the six-month period ended February 28, 2022, and divided by the 365 days in the Fund’s fiscal year ended February 28, 2022 (to reflect the six-month period). Expenses presented in the table include the expenses of any underlying portfolios in which the Fund may invest.
12 Visit our website at pgim.com/investments
Schedule of Investments
as of February 28, 2022
| | | | | | | | | | | | |
| | | | |
| Description | | Interest
Rate | | Maturity
Date | | Principal
Amount (000)# | | | Value | |
| | | | |
LONG-TERM INVESTMENTS 100.1% | | | | | | | | | | | | |
| | | | |
ASSET-BACKED SECURITIES 14.1% | | | | | | | | | | | | |
| | | | |
Automobiles 0.7% | | | | | | | | | | | | |
Avis Budget Rental Car Funding AESOP LLC, | | | | | | | | | | | | |
Series 2019-02A, Class D, 144A | | 3.040% | | 09/22/25 | | | 5,000 | | | $ | 4,834,181 | |
Exeter Automobile Receivables Trust, | | | | | | | | | | | | |
Series 2022-01A, Class E, 144A | | 5.020 | | 10/15/29 | | | 1,700 | | | | 1,695,236 | |
Hertz Vehicle Financing III LP, | | | | | | | | | | | | |
Series 2021-02A, Class B, 144A | | 2.120 | | 12/27/27 | | | 800 | | | | 774,281 | |
JPMorgan Chase Bank, NA, | | | | | | | | | | | | |
Series 2020-01, Class R, 144A | | 33.784 | | 01/25/28 | | | 750 | | | | 911,547 | |
Series 2020-02, Class F, 144A | | 5.763 | | 02/25/28 | | | 700 | | | | 711,221 | |
Series 2021-01, Class E, 144A | | 2.365 | | 09/25/28 | | | 398 | | | | 393,772 | |
Series 2021-02, Class F, 144A | | 4.393 | | 12/26/28 | | | 600 | | | | 588,620 | |
Santander Bank Auto Credit-Linked Notes, | | | | | | | | | | | | |
Series 2021-01A, Class D, 144A | | 5.004 | | 12/15/31 | | | 600 | | | | 589,730 | |
Santander Consumer Auto Receivables Trust, | | | | | | | | | | | | |
Series 2021-AA, Class E, 144A | | 3.280 | | 03/15/27 | | | 1,000 | | | | 979,863 | |
| | | | | | | | | | | | |
| | | | |
| | | | | | | | | | | 11,478,451 | |
| | | | |
Collateralized Loan Obligations 11.0% | | | | | | | | | | | | |
| | | | |
Anchorage Capital CLO Ltd. (Cayman Islands), | | | | | | | | | | | | |
Series 2021-21A, Class B, 144A, 3 Month LIBOR | | | | | | | | | | | | |
+ 1.750% (Cap N/A, Floor 1.750%) | | 1.887(c) | | 10/20/34 | | | 7,500 | | | | 7,451,753 | |
| | | | |
Ares European CLO DAC (Ireland), | | | | | | | | | | | | |
Series 2013-06A, Class B1RR, 144A, 3 Month | | | | | | | | | | | | |
EURIBOR + 1.250% (Cap N/A, Floor 1.250%) | | 1.250(c) | | 04/15/30 | | EUR | 4,450 | | | | 4,965,320 | |
| | | | |
Armada Euro CLO DAC (Ireland), | | | | | | | | | | | | |
Series 02A, Class A3, 144A | | 1.500 | | 11/15/31 | | EUR | 250 | | | | 280,009 | |
| | | | |
Bain Capital Euro CLO DAC (Ireland), | | | | | | | | | | | | |
Series 2020-01A, Class A, 144A, 3 Month | | | | | | | | | | | | |
EURIBOR + 1.100% (Cap N/A, Floor 1.100%) | | 1.100(c) | | 01/24/33 | | EUR | 10,000 | | | | 11,226,280 | |
| | | | |
Battalion CLO Ltd., | | | | | | | | | | | | |
Series 2018-12A, Class B2R, 144A, 3 Month | | | | | | | | | | | | |
LIBOR + 2.080% (Cap N/A, Floor 2.080%) | | 2.549(c) | | 05/17/31 | | | 11,250 | | | | 11,244,676 | |
| | | | |
Bilbao CLO DAC (Ireland), | | | | | | | | | | | | |
Series 4A, Class B, 144A | | — (p) | | 04/15/36 | | EUR | 5,900 | | | | 6,408,340 | |
| | | | |
Brookside Mill CLO Ltd. (Cayman Islands), | | | | | | | | | | | | |
Series 2013-01A, Class BR, 144A, 3 Month LIBOR | | | | | | | | | | | | |
+ 1.350% (Cap N/A, Floor 0.000%) | | 1.591(c) | | 01/17/28 | | | 500 | | | | 496,628 | |
| | | | |
Carlyle Euro CLO DAC (Ireland), | | | | | | | | | | | | |
Series 2017-02A, Class AA2R, 144A, 3 Month | | | | | | | | | | | | |
EURIBOR + 1.300% (Cap N/A, Floor 1.300%) | | 1.300(c) | | 08/15/30 | | EUR | 5,000 | | | | 5,500,893 | |
See Notes to Financial Statements.
PGIM Strategic Bond Fund 13
Schedule of Investments (continued)
as of February 28, 2022
| | | | | | | | | | | | |
| | | | |
| Description | | Interest
Rate | | Maturity
Date | | Principal
Amount (000)# | | | Value | |
| | | | |
ASSET-BACKED SECURITIES (Continued) | | | | | | | | | | | | |
| | | | |
Collateralized Loan Obligations (cont’d.) | | | | | | | | | | | | |
| | | | |
Carlyle Euro CLO DAC (Ireland), (cont’d.) | | | | | | | | | | | | |
Series 2019-01A, Class A2RA, 144A, 3 Month | | | | | | | | | | | | |
EURIBOR + 1.650% (Cap N/A, Floor 1.650%) | | 1.650%(c) | | 03/15/32 | | EUR | 8,250 | | | $ | 9,171,608 | |
| | | | |
Carlyle Euro CLO Ltd. (Ireland), | | | | | | | | | | | | |
Series 2021-02A, Class A2B, 144A | | 2.100 | | 10/15/35 | | EUR | 9,100 | | | | 10,109,902 | |
| | | | |
CVC Cordatus Loan Fund DAC (Ireland), | | | | | | | | | | | | |
Series 03A, Class A2RR, 144A | | 1.750 | | 08/15/32 | | EUR | 500 | | | | 558,839 | |
| | | | |
Elevation CLO Ltd. (Cayman Islands), | | | | | | | | | | | | |
Series 2021-14A, Class B, 144A, 3 Month LIBOR | | | | | | | | | | | | |
+ 1.750% (Cap N/A, Floor 1.750%) | | 1.869(c) | | 10/20/34 | | | 4,500 | | | | 4,468,330 | |
| | | | |
Fidelity Grand Harbour CLO DAC (Ireland), | | | | | | | | | | | | |
Series 2021-01A, Class B1, 144A, 3 Month | | | | | | | | | | | | |
EURIBOR + 1.750% (Cap N/A, Floor 1.750%) | | 1.750(c) | | 10/15/34 | | EUR | 9,000 | | | | 10,096,529 | |
| | | | |
Golub Capital Partners CLO Ltd. (Cayman Islands), | | | | | | | | | | | | |
Series 2020-50A, Class A, 144A, 3 Month LIBOR | | | | | | | | | | | | |
+ 1.550% (Cap N/A, Floor 1.550%) | | 1.804(c) | | 10/20/31 | | | 10,000 | | | | 10,011,489 | |
| | | | |
HPC Investment Partners CLO, | | | | | | | | | | | | |
Series 2013-02RR, Class A2, 144A, 3 Month | | | | | | | | | | | | |
LIBOR + 1.625% (Cap N/A, Floor 0.000%) | | 1.879(c) | | 10/20/29 | | | 750 | | | | 747,219 | |
| | | | |
Jefferson Mill CLO Ltd. (Cayman Islands), | | | | | | | | | | | | |
Series 2015-01A, Class BR, 144A, 3 Month LIBOR | | | | | | | | | | | | |
+ 1.950% (Cap N/A, Floor 0.000%) | | 2.204(c) | | 10/20/31 | | | 500 | | | | 499,733 | |
| | | | |
Madison Park Euro Funding DAC (Ireland), | | | | | | | | | | | | |
Series 14A, Class B1R, 144A, 3 Month EURIBOR | | | | | | | | | | | | |
+ 1.700% (Cap N/A, Floor 1.700%) | | 1.700(c) | | 07/15/32 | | EUR | 8,050 | | | | 8,939,358 | |
| | | | |
Madison Park Funding Ltd. (Cayman Islands), | | | | | | | | | | | | |
Series 2021-59A, Class B, 144A, 3 Month LIBOR | | | | | | | | | | | | |
+ 1.700% (Cap N/A, Floor 1.700%) | | 1.945(c) | | 01/18/34 | | | 4,500 | | | | 4,499,436 | |
| | | | |
MidOcean Credit CLO (Cayman Islands), | | | | | | | | | | | | |
Series 2016-05A, Class AR, 144A, 3 Month LIBOR | | | | | | | | | | | | |
+ 1.120% (Cap N/A, Floor 0.000%) | | 1.368(c) | | 07/19/28 | | | 1,058 | | | | 1,056,220 | |
Series 2018-08A, Class B, 144A, 3 Month LIBOR | | | | | | | | | | | | |
+ 1.650% (Cap N/A, Floor 0.000%) | | 2.130(c) | | 02/20/31 | | | 250 | | | | 249,377 | |
| | | | |
Northwoods Capital Ltd. (Cayman Islands), | | | | | | | | | | | | |
Series 2020-22A, Class B1, 144A, 3 Month LIBOR | | | | | | | | | | | | |
+ 2.700% (Cap N/A, Floor 2.700%) | | 2.871(c) | | 09/01/31 | | | 5,000 | | | | 4,997,679 | |
| | | | |
Ocean Trails CLO (Cayman Islands), | | | | | | | | | | | | |
Series 2020-09A, Class BR, 144A, 3 Month LIBOR | | | | | | | | | | | | |
+ 1.750% (Cap N/A, Floor 1.750%) | | 1.991(c) | | 10/15/34 | | | 10,000 | | | | 9,992,610 | |
See Notes to Financial Statements.
14
| | | | | | | | | | | | |
| | | | |
| Description | | Interest
Rate | | Maturity
Date | | Principal
Amount
(000)# | | | Value | |
| | | | |
ASSET-BACKED SECURITIES (Continued) | | | | | | | | | | | | |
| | | | |
Collateralized Loan Obligations (cont’d.) | | | | | | | | | | | | |
| | | | |
Park Avenue Institutional Advisers CLO Ltd. | | | | | | | | | | | | |
(Cayman Islands), | | | | | | | | | | | | |
Series 2019-02A, Class A2R, 144A, 3 Month | | | | | | | | | | | | |
LIBOR + 1.700% (Cap N/A, Floor 1.700%) | | 1.941%(c) | | 10/15/34 | | | 15,000 | | | $ | 14,891,815 | |
| | | | |
Rockford Tower CLO Ltd. (Cayman Islands), | | | | | | | | | | | | |
Series 2021-03A, Class B, 144A, 3 Month LIBOR | | | | | | | | | | | | |
+ 1.750% (Cap N/A, Floor 1.750%) | | 1.877(c) | | 10/20/34 | | | 8,700 | | | | 8,694,409 | |
| | | | |
Shackleton CLO Ltd. (Cayman Islands), | | | | | | | | | | | | |
Series 2017-11A, Class AR, 144A, 3 Month LIBOR | | | | | | | | | | | | |
+ 1.090% (Cap N/A, Floor 0.000%) | | 1.596(c) | | 08/15/30 | | | 4,000 | | | | 3,997,774 | |
| | | | |
St. Pauls CLO (Netherlands), | | | | | | | | | | | | |
Series 11A, Class C2R, 144A | | 2.500 | | 01/17/32 | | EUR | 8,500 | | | | 9,441,991 | |
| | | | |
St. Paul’s CLO DAC (Ireland), | | | | | | | | | | | | |
Series 4A, Class AR2B, 144A | | 1.870 | | 04/25/30 | | EUR | 9,200 | | | | 10,229,511 | |
| | | | |
Strata CLO Ltd. (Cayman Islands), | | | | | | | | | | | | |
Series 2018-01A, Class A, 144A, 3 Month LIBOR | | | | | | | | | | | | |
+ 1.590% (Cap N/A, Floor 1.590%) | | 1.831(c) | | 01/15/31 | | | 1,750 | | | | 1,748,989 | |
| | | | |
TCW CLO Ltd. (Cayman Islands), | | | | | | | | | | | | |
Series 2017-01A, Class BRR, 144A, 3 Month | | | | | | | | | | | | |
LIBOR + 1.700% (Cap N/A, Floor 1.700%) | | 1.999(c) | | 10/29/34 | | | 6,000 | | | | 5,964,652 | |
| | | | | | | | | | | | |
| | | | |
| | | | | | | | | | | 177,941,369 | |
| | | | |
Consumer Loans 0.3% | | | | | | | | | | | | |
| | | | |
Lendmark Funding Trust, | | | | | | | | | | | | |
Series 2021-01A, Class D, 144A | | 5.050 | | 11/20/31 | | | 600 | | | | 593,648 | |
| | | | |
OneMain Financial Issuance Trust, | | | | | | | | | | | | |
Series 2018-01A, Class C, 144A | | 3.770 | | 03/14/29 | | | 1,000 | | | | 1,007,277 | |
| | | | |
Oportun Funding XIII LLC, | | | | | | | | | | | | |
Series 2019-A, Class B, 144A | | 3.870 | | 08/08/25 | | | 1,100 | | | | 1,106,795 | |
Series 2019-A, Class D, 144A | | 6.220 | | 08/08/25 | | | 1,300 | | | | 1,312,071 | |
| | | | |
Oportun Funding XIV LLC, | | | | | | | | | | | | |
Series 2021-A, Class C, 144A | | 3.440 | | 03/08/28 | | | 400 | | | | 401,236 | |
Series 2021-A, Class D, 144A | | 5.400 | | 03/08/28 | | | 500 | | | | 501,214 | |
| | | | | | | | | | | | |
| | | | |
| | | | | | | | | | | 4,922,241 | |
See Notes to Financial Statements.
PGIM Strategic Bond Fund 15
Schedule of Investments (continued)
as of February 28, 2022
| | | | | | | | | | | | |
| | | | |
| Description | | Interest
Rate | | Maturity
Date | | Principal
Amount
(000)# | | | Value | |
| | | | |
ASSET-BACKED SECURITIES (Continued) | | | | | | | | | | | | |
| | | | |
Other 1.0% | | | | | | | | | | | | |
| | | | |
PNMAC FMSR Issuer Trust, | | | | | | | | | | | | |
Series 2018-FT01, Class A, 144A, 1 Month LIBOR + 2.350% (Cap N/A, Floor 0.000%) | | 2.537%(c) | | 04/25/23 | | | 5,130 | | | $ | 5,092,836 | |
| | | | |
TH MSR Issuer Trust, | | | | | | | | | | | | |
Series 2019-FT01, Class A, 144A, 1 Month LIBOR + 2.800% (Cap N/A, Floor 2.800%) | | 2.987(c) | | 06/25/24 | | | 10,600 | | | | 10,558,086 | |
| | | | | | | | | | | | |
| | | | |
| | | | | | | | | | | 15,650,922 | |
| | | | |
Residential Mortgage-Backed Securities 0.7% | | | | | | | | | | | | |
| | | | |
European Residential Loan Securitisation (Ireland), | | | | | | | | | | | | |
Series 2021-NPLA, Class A1, 144A | | 0.000(cc) | | 11/25/60 | | EUR | 3,800 | | | | 4,208,221 | |
| | | | |
Legacy Mortgage Asset Trust, | | | | | | | | | | | | |
Series 2019-GS02, Class A1, 144A | | 3.750 | | 01/25/59 | | | 244 | | | | 244,395 | |
Series 2019-GS04, Class A1, 144A | | 3.438 | | 05/25/59 | | | 827 | | | | 828,669 | |
| | | | |
Rathlin Residential DAC (Ireland), | | | | | | | | | | | | |
Series 2021-01A, Class A, 144A, 1 Month EURIBOR + 2.000% (Cap N/A, Floor 0.000%) | | 1.438(c) | | 09/27/75 | | EUR | 5,989 | | | | 6,591,342 | |
| | | | | | | | | | | | |
| | | | |
| | | | | | | | | | | 11,872,627 | |
| | | | |
Student Loans 0.4% | | | | | | | | | | | | |
| | | | |
Laurel Road Prime Student Loan Trust, | | | | | | | | | | | | |
Series 2019-A, Class R, 144A | | 0.000 | | 10/25/48 | | | 884 | | | | 177,133 | |
| | | | |
SoFi Alternative Trust, | | | | | | | | | | | | |
Series 2019-D, Class 1PT, 144A | | 2.945(cc) | | 01/16/46 | | | 1,432 | | | | 1,445,628 | |
Series 2019-F, Class PT1, 144A | | 1.565(cc) | | 02/15/45 | | | 2,474 | | | | 2,466,695 | |
SoFi RR Funding II Trust, | | | | | | | | | | | | |
Series 2019-01, Class A, 144A, 1 Month LIBOR + 1.250% (Cap N/A, Floor 1.250%) | | 1.437(c) | | 11/29/24 | | | 1,307 | | | | 1,306,790 | |
SoFi RR Funding III Trust, | | | | | | | | | | | | |
Series 2020-01, Class A, 144A, 1 Month LIBOR + 1.250% (Cap N/A, Floor 3.750%) | | 1.437(c) | | 11/29/24 | | | 1,154 | | | | 1,153,588 | |
| | | | | | | | | | | | |
| | | | | | | | | | | 6,549,834 | |
| | | | | | | | | | | | |
| | | | |
TOTAL ASSET-BACKED SECURITIES
(cost $232,957,684) | | | | | | | | | | | 228,415,444 | |
| | | | | | | | | | | | |
See Notes to Financial Statements.
16
| | | | | | | | | | | | |
| | | | |
| Description | | Interest
Rate | | Maturity
Date | | Principal
Amount (000)# | | | Value | |
| | | | |
BANK LOANS 2.3% | | | | | | | | | | | | |
| | | | |
Airlines 0.1% | | | | | | | | | | | | |
| | | | |
United Airlines, Inc., | | | | | | | | | | | | |
Class B Term Loan, 3 Month LIBOR + 3.750% | | 4.500%(c) | | 04/21/28 | | | 1,246 | | | $ | 1,237,941 | |
| | | | |
Auto Parts & Equipment 0.1% | | | | | | | | | | | | |
| | | | |
American Axle & Manufacturing, Inc., | | | | | | | | | | | | |
Tranche B Term Loan, 1 Month LIBOR + 2.250% | | 3.000(c) | | 04/06/24 | | | 1,000 | | | | 992,000 | |
| | | | |
Chemicals 0.2% | | | | | | | | | | | | |
| | | | |
Alpha BV (United Kingdom), | | | | | | | | | | | | |
Initial Dollar Term Loan, 1 Month LIBOR + 2.500% | | 3.000(c) | | 03/18/28 | | | 1,642 | | | | 1,631,489 | |
| | | | |
Axalta Coating Systems U.S. Holdings, Inc., | | | | | | | | | | | | |
Term B-3 Dollar Loan, 3 Month LIBOR + 1.750% | | 1.974(c) | | 06/01/24 | | | 642 | | | | 634,717 | |
| | | | |
Starfruit Finco BV (Netherlands), | | | | | | | | | | | | |
Initial Dollar Term Loan, 1 Month LIBOR + 3.000% | | 3.209(c) | | 10/01/25 | | | 507 | | | | 500,737 | |
| | | | | | | | | | | | |
| | | | |
| | | | | | | | | | | 2,766,943 | |
| | | | |
Commercial Services 0.1% | | | | | | | | | | | | |
| | | | |
Adtalem Global Education, Inc., | | | | | | | | | | | | |
Term B Loan, 1 Month LIBOR + 4.500% | | 5.250(c) | | 08/12/28 | | | 1,450 | | | | 1,430,969 | |
| | | | |
Computers 0.3% | | | | | | | | | | | | |
| | | | |
Condor Merger Sub, Inc., | | | | | | | | | | | | |
Term Loan | | — (p) | | 06/30/29 | | | 1,925 | | | | 1,898,531 | |
| | | | |
McAfee LLC, | | | | | | | | | | | | |
Term B USD Loan, 3 Month LIBOR + 2.750% | | 6.000(c) | | 09/30/24 | | | 1,708 | | | | 1,704,411 | |
| | | | |
Peraton Corp., | | | | | | | | | | | | |
First Lien Term B Loan, 1 Month LIBOR + 3.750% | | 4.500(c) | | 02/01/28 | | | 1,836 | | | | 1,826,562 | |
| | | | | | | | | | | | |
| | | | |
| | | | | | | | | | | 5,429,504 | |
| | | | |
Insurance 0.1% | | | | | | | | | | | | |
| | | | |
AmWINS Group, Inc., | | | | | | | | | | | | |
Term Loan, 1 Month LIBOR + 2.250% | | 3.000(c) | | 02/19/28 | | | 283 | | | | 278,434 | |
| | | | |
Asurion LLC, | | | | | | | | | | | | |
New B-7 Term Loan, 1 Month LIBOR + 3.000% | | 3.209(c) | | 11/03/24 | | | 713 | | | | 702,639 | |
New B-9 Term Loan, 1 Month LIBOR + 3.250% | | 3.459(c) | | 07/31/27 | | | 645 | | | | 632,706 | |
| | | | | | | | | | | | |
| | | | |
| | | | | | | | | | | 1,613,779 | |
See Notes to Financial Statements.
PGIM Strategic Bond Fund 17
Schedule of Investments (continued)
as of February 28, 2022
| | | | | | | | | | | | |
| | | | |
| Description | | Interest
Rate | | Maturity
Date | | Principal
Amount (000)# | | | Value | |
| | | | |
BANK LOANS (Continued) | | | | | | | | | | | | |
| | | | |
Investment Companies 0.3% | | | | | | | | | | | | |
| | | | |
Rainbow Midco Ltd. (United Kingdom), | | | | | | | | | | | | |
Term Loan^ | | — %(p) | | 01/31/30 | | | 4,300 | | | $ | 4,821,375 | |
| | | | |
Media 0.2% | | | | | | | | | | | | |
CSC Holdings LLC, | | | | | | | | | | | | |
2017 Refinancing Term Loan, 1 Month LIBOR + 2.250% | | 2.441(c) | | 07/17/25 | | | 643 | | | | 622,985 | |
September 2019 Term Loan, 1 Month LIBOR + 2.500% | | 2.691(c) | | 04/15/27 | | | 1,094 | | | | 1,060,046 | |
Diamond Sports Group LLC, | | | | | | | | | | | | |
Term Loan, PRIME + 2.250% | | 5.500(c) | | 08/24/26 | | | 874 | | | | 325,398 | |
iHeartCommunications, Inc., | | | | | | | | | | | | |
New Term Loan, 1 Month LIBOR + 3.000% | | 3.209(c) | | 05/01/26 | | | 582 | | | | 576,128 | |
| | | | | | | | | | | | |
| | | | | | | | | | | 2,584,557 | |
| | | | |
Oil & Gas 0.1% | | | | | | | | | | | | |
Ascent Resources Utica Holdings LLC, | | | | | | | | | | | | |
Second Lien Term Loan, 3 Month LIBOR + 9.000% | | 10.000(c) | | 11/01/25 | | | 2,105 | | | | 2,249,719 | |
| | | | |
Pharmaceuticals 0.1% | | | | | | | | | | | | |
Change Healthcare Holdings LLC, | | | | | | | | | | | | |
Closing Date Term Loan, 1 Month LIBOR + 2.500% | | 3.500(c) | | 03/01/24 | | | 2,178 | | | | 2,164,867 | |
| | | | |
Real Estate Investment Trusts (REITs) 0.0% | | | | | | | | | | | | |
Blackstone Mortgage Trust, Inc., | | | | | | | | | | | | |
Term Loan, 1 Month LIBOR + 2.250%^ | | 2.459(c) | | 04/23/26 | | | 766 | | | �� | 748,924 | |
| | | | |
Retail 0.5% | | | | | | | | | | | | |
EG Group Ltd. (United Kingdom), | | | | | | | | | | | | |
Additional Second Lien Loan Facility, 3 Month EURIBOR + 7.000% (Cap N/A, Floor 0.000%) | | 7.000(c) | | 04/30/27 | | EUR | 7,300 | | | | 8,116,918 | |
| | | | |
Telecommunications 0.2% | | | | | | | | | | | | |
CenturyLink, Inc., | | | | | | | | | | | | |
Term B Loan, 1 Month LIBOR + 2.250% | | 2.459(c) | | 03/15/27 | | | 633 | | | | 614,001 | |
See Notes to Financial Statements.
18
| | | | | | | | | | | | |
| | | | |
| Description | | Interest
Rate | | Maturity
Date | | Principal
Amount
(000)# | | | Value | |
| | | | |
BANK LOANS (Continued) | | | | | | | | | | | | |
| | | | |
Telecommunications (cont’d.) | | | | | | | | | | | | |
| | | | |
Digicel International Finance Ltd. (Saint Lucia), | | | | | | | | | | | | |
First Lien Initial Term B Loan, 1 - 3 Month LIBOR + 3.250% | | 3.500%(c) | | 05/27/24 | | | 1,641 | | | $ | 1,572,182 | |
| | | | |
West Corp., | | | | | | | | | | | | |
Initial Term B Loan, 3 Month LIBOR + 4.000% | | 5.000(c) | | 10/10/24 | | | 873 | | | | 777,836 | |
| | | | | | | | | | | | |
| | | | |
| | | | | | | | | | | 2,964,019 | |
| | | | | | | | | | | | |
| | | | |
TOTAL BANK LOANS
(cost $38,038,931) | | | | | | | | | | | 37,121,515 | |
| | | | | | | | | | | | |
| | | | |
COMMERCIAL MORTGAGE-BACKED SECURITIES 10.3% | | | | | | | | | | | | |
20 Times Square Trust, | | | | | | | | | | | | |
Series 2018-20TS, Class F, 144A | | 3.100(cc) | | 05/15/35 | | | 4,900 | | | | 4,604,781 | |
Series 2018-20TS, Class G, 144A | | 3.100(cc) | | 05/15/35 | | | 5,000 | | | | 4,631,979 | |
Series 2018-20TS, Class H, 144A | | 3.100(cc) | | 05/15/35 | | | 100 | | | | 91,393 | |
Barclays Commercial Mortgage Securities Trust, | | | | | | | | | | | | |
Series 2016-ETC, Class E, 144A | | 3.609(cc) | | 08/14/36 | | | 250 | | | | 211,301 | |
Series 2018-CHRS, Class D, 144A | | 4.267(cc) | | 08/05/38 | | | 250 | | | | 234,286 | |
Series 2018-TALL, Class D, 144A, 1 Month LIBOR + 1.449% (Cap N/A, Floor 1.449%) | | 1.640(c) | | 03/15/37 | | | 450 | | | | 426,317 | |
Barclays Commercial Mortgage Trust, | | | | | | | | | | | | |
Series 2019-C04, Class A4 | | 2.661 | | 08/15/52 | | | 12,000 | | | | 11,803,663 | |
Series 2019-C04, Class XB, IO | | 1.144(cc) | | 08/15/52 | | | 43,170 | | | | 3,218,056 | |
BX Commercial Mortgage Trust, | | | | | | | | | | | | |
Series 2019-XL, Class J, 144A, 1 Month LIBOR + 2.650% (Cap N/A, Floor 2.650%) | | 2.841(c) | | 10/15/36 | | | 6,163 | | | | 6,023,457 | |
CD Mortgage Trust, | | | | | | | | | | | | |
Series 2019-CD08, Class A3 | | 2.657 | | 08/15/57 | | | 12,000 | | | | 11,579,462 | |
Citigroup Commercial Mortgage Trust, | | | | | | | | | | | | |
Series 2019-SMRT, Class E, 144A | | 4.745(cc) | | 01/10/36 | | | 3,700 | | | | 3,713,307 | |
Cold Storage Trust, | | | | | | | | | | | | |
Series 2020-ICE05, Class E, 144A, 1 Month LIBOR + 2.766% (Cap N/A, Floor 2.833%) | | 2.957(c) | | 11/15/37 | | | 1,769 | | | | 1,756,089 | |
Credit Suisse Mortgage Capital Certificates, | | | | | | | | | | | | |
Series 2019-ICE04, Class E, 144A, 1 Month LIBOR + 2.150% (Cap N/A, Floor 2.150%) | | 2.341(c) | | 05/15/36 | | | 5,000 | | | | 4,930,770 | |
Series 2019-ICE04, Class F, 144A, 1 Month LIBOR + 2.650% (Cap N/A, Floor 2.650%) | | 2.841(c) | | 05/15/36 | | | 2,100 | | | | 2,065,865 | |
CSAIL Commercial Mortgage Trust, | | | | | | | | | | | | |
Series 2018-CX11, Class A3 | | 4.095 | | 04/15/51 | | | 500 | | | | 512,457 | |
See Notes to Financial Statements.
PGIM Strategic Bond Fund 19
Schedule of Investments (continued)
as of February 28, 2022
| | | | | | | | | | | | |
| | | | |
| Description | | Interest
Rate | | Maturity
Date | | Principal
Amount
(000)# | | | Value | |
| | | | |
COMMERCIAL MORTGAGE-BACKED SECURITIES (Continued) | | | | | | | | | | | | |
DBGS Mortgage Trust, | | | | | | | | | | | | |
Series 2018-BIOD, Class E, 144A, 1 Month LIBOR + 1.700% (Cap N/A, Floor 1.700%) | | 1.825%(c) | | 05/15/35 | | | 91 | | | $ | 90,231 | |
Series 2018-BIOD, Class F, 144A, 1 Month LIBOR + 2.000% (Cap N/A, Floor 2.000%) | | 2.125(c) | | 05/15/35 | | | 320 | | | | 313,405 | |
DBWF Mortgage Trust, | | | | | | | | | | | | |
Series 2016-85T, Class D, 144A | | 3.808(cc) | | 12/10/36 | | | 250 | | | | 244,196 | |
Series 2016-85T, Class E, 144A | | 3.808(cc) | | 12/10/36 | | | 250 | | | | 229,506 | |
FHLMC Multifamily Structured Pass-Through | | | | | | | | | | | | |
Certificates, | | | | | | | | | | | | |
Series K055, Class X1, IO | | 1.353(cc) | | 03/25/26 | | | 1,102 | | | | 51,499 | |
Series K066, Class X1, IO | | 0.750(cc) | | 06/25/27 | | | 7,392 | | | | 254,903 | |
Series K103, Class X1, IO | | 0.639(cc) | | 11/25/29 | | | 149,860 | | | | 6,584,388 | |
Series KC02, Class X1, IO | | 0.374(cc) | | 03/25/24 | | | 79,488 | | | | 518,429 | |
Greystone Commercial Capital Trust, | | | | | | | | | | | | |
Series 2021-03, Class A, 144A, 1 Month LIBOR + 2.230% (Cap N/A, Floor 2.230%)^ | | 2.355(c) | | 08/17/23 | | | 5,500 | | | | 5,500,000 | |
GS Mortgage Securities Corp. Trust, | | | | | | | | | | | | |
Series 2021-IP, Class F, 144A, 1 Month LIBOR + 4.550% (Cap N/A, Floor 4.550%) | | 4.741(c) | | 10/15/36 | | | 3,090 | | | | 3,030,549 | |
Independence Plaza Trust, | | | | | | | | | | | | |
Series 2018-INDP, Class E, 144A | | 4.996 | | 07/10/35 | | | 175 | | | | 165,129 | |
JPMorgan Chase Commercial Mortgage Securities
Trust, | | | | | | | | | | | | |
Series 2016-JP02, Class A3 | | 2.559 | | 08/15/49 | | | 292 | | | | 289,220 | |
Series 2018-AON, Class D, 144A | | 4.613(cc) | | 07/05/31 | | | 8,800 | | | | 8,925,575 | |
Series 2018-AON, Class E, 144A | | 4.613(cc) | | 07/05/31 | | | 9,825 | | | | 9,857,123 | |
Series 2021-NYAH, Class H, 144A, 1 Month LIBOR + 3.390% (Cap N/A, Floor 3.390%) | | 3.581(c) | | 06/15/38 | | | 5,900 | | | | 5,774,676 | |
MAD Commercial Mortgage Trust, | | | | | | | | | | | | |
Series 2019-650M, Class A, 144A | | 3.460(cc) | | 12/12/34 | | | 10,385 | | | | 8,842,539 | |
MKT Mortgage Trust, | | | | | | | | | | | | |
Series 2020-525M, Class F, 144A | | 2.941(cc) | | 02/12/40 | | | 7,125 | | | | 6,073,747 | |
Morgan Stanley Capital I Trust, | | | | | | | | | | | | |
Series 2019-MEAD, Class E, 144A | | 3.177(cc) | | 11/10/36 | | | 20,580 | | | | 19,097,483 | |
Series 2019-MEAD, Class XA, IO, 144A | | 0.007(cc) | | 11/10/36 | | | 297,065 | | | | 396,641 | |
Salus European Loan Conduit DAC (United Kingdom), | | | | | | | | | | | | |
Series 33A, Class A, 144A, 3 Month GBP LIBOR + 1.500% (Cap 6.500%, Floor 1.500%) | | 2.069(c) | | 01/23/29 | | GBP | 450 | | | | 606,758 | |
UBS Commercial Mortgage Trust, | | | | | | | | | | | | |
Series 2018-C15, Class A4 | | 4.341 | | 12/15/51 | | | 7,150 | | | | 7,722,891 | |
Series 2019-C17, Class A3 | | 2.669 | | 10/15/52 | | | 16,000 | | | | 15,672,584 | |
See Notes to Financial Statements.
20
| | | | | | | | | | | | |
| | | | |
| Description | | Interest
Rate | | Maturity
Date | | Principal
Amount
(000)# | | | Value | |
| | | |
COMMERCIAL MORTGAGE-BACKED SECURITIES (Continued) | | | | | | | | | | |
Wells Fargo Commercial Mortgage Trust, | | | | | | | | | | | | |
Series 2021-FCMT, Class E, 144A, 1 Month LIBOR + 4.500% (Cap N/A, Floor 4.500%) | | 4.691%(c) | | 05/15/31 | | | 11,200 | | | $ | 10,976,097 | |
| | | | | | | | | | | | |
| | | |
TOTAL COMMERCIAL MORTGAGE-BACKED SECURITIES | | | | | | | | | | |
(cost $170,759,961) | | | | | | | | | | | 167,020,752 | |
| | | | | | | | | | | | |
| | | | |
CORPORATE BONDS 55.9% | | | | | | | | | | | | |
| | | | |
Advertising 0.1% | | | | | | | | | | | | |
Terrier Media Buyer, Inc., | | | | | | | | | | | | |
Gtd. Notes, 144A | | 8.875 | | 12/15/27 | | | 1,608 | | | | 1,654,701 | |
| | | | |
Aerospace & Defense 1.0% | | | | | | | | | | | | |
Boeing Co. (The), | | | | | | | | | | | | |
Sr. Unsec’d. Notes(a) | | 2.700 | | 02/01/27 | | | 1,035 | | | | 1,020,904 | |
Sr. Unsec’d. Notes | | 3.825 | | 03/01/59 | | | 1,500 | | | | 1,311,716 | |
Bombardier, Inc. (Canada), | | | | | | | | | | | | |
Sr. Unsec’d. Notes, 144A | | 6.000 | | 02/15/28 | | | 2,750 | | | | 2,629,832 | |
Sr. Unsec’d. Notes, 144A | | 7.125 | | 06/15/26 | | | 1,475 | | | | 1,476,016 | |
Sr. Unsec’d. Notes, 144A | | 7.500 | | 12/01/24 | | | 600 | | | | 621,376 | |
Sr. Unsec’d. Notes, 144A | | 7.500 | | 03/15/25 | | | 200 | | | | 202,080 | |
Sr. Unsec’d. Notes, 144A(a) | | 7.875 | | 04/15/27 | | | 8,225 | | | | 8,338,412 | |
Embraer Netherlands Finance BV (Brazil), | | | | | | | | | | | | |
Gtd. Notes(a) | | 5.400 | | 02/01/27 | | | 1,040 | | | | 1,050,027 | |
| | | | | | | | | | | | |
| | | | |
| | | | | | | | | | | 16,650,363 | |
| | | | |
Agriculture 0.3% | | | | | | | | | | | | |
Altria Group, Inc., | | | | | | | | | | | | |
Gtd. Notes | | 3.400 | | 05/06/30 | | | 1,100 | | | | 1,087,277 | |
Vector Group Ltd., | | | | | | | | | | | | |
Sr. Sec’d. Notes, 144A | | 5.750 | | 02/01/29 | | | 3,825 | | | | 3,548,562 | |
| | | | | | | | | | | | |
| | | | |
| | | | | | | | | | | 4,635,839 | |
| | | | |
Airlines 0.5% | | | | | | | | | | | | |
American Airlines, Inc./AAdvantage Loyalty IP Ltd., | | | | | | | | | | | | |
Sr. Sec’d. Notes, 144A | | 5.750 | | 04/20/29 | | | 1,925 | | | | 1,967,311 | |
Delta Air Lines, Inc., | | | | | | | | | | | | |
Sr. Unsec’d. Notes(a) | | 3.750 | | 10/28/29 | | | 1,720 | | | | 1,633,526 | |
Southwest Airlines Co., | | | | | | | | | | | | |
Sr. Unsec’d. Notes | | 5.125 | | 06/15/27 | | | 695 | | | | 771,392 | |
Sr. Unsec’d. Notes | | 5.250 | | 05/04/25 | | | 1,545 | | | | 1,666,204 | |
See Notes to Financial Statements.
PGIM Strategic Bond Fund 21
Schedule of Investments (continued)
as of February 28, 2022
| | | | | | | | | | | | |
| | | | |
| Description | | Interest
Rate | | Maturity
Date | | Principal
Amount
(000)# | | | Value | |
| | | | |
CORPORATE BONDS (Continued) | | | | | | | | | | | | |
| | | | |
Airlines (cont’d.) | | | | | | | | | | | | |
United Airlines 2019-2 Class AA Pass-Through
Trust,
Pass-Through Certificates(h) | | 2.700% | | 11/01/33 | | | 430 | | | $ | 413,996 | |
United Airlines, Inc., | | | | | | | | | | | | |
Sr. Sec’d. Notes, 144A | | 4.375 | | 04/15/26 | | | 1,350 | | | | 1,347,198 | |
Sr. Sec’d. Notes, 144A | | 4.625 | | 04/15/29 | | | 400 | | | | 390,575 | |
| | | | | | | | | | | | |
| | | | |
| | | | | | | | | | | 8,190,202 | |
| | | | |
Auto Manufacturers 0.8% | | | | | | | | | | | | |
Ford Motor Co., | | | | | | | | | | | | |
Sr. Unsec’d. Notes(a) | | 3.250 | | 02/12/32 | | | 875 | | | | 825,924 | |
Sr. Unsec’d. Notes | | 4.750 | | 01/15/43 | | | 4,225 | | | | 4,088,889 | |
Sr. Unsec’d. Notes | | 5.291 | | 12/08/46 | | | 45 | | | | 46,192 | |
Ford Motor Credit Co. LLC, | | | | | | | | | | | | |
Sr. Unsec’d. Notes | | 2.900 | | 02/16/28 | | | 550 | | | | 515,115 | |
Sr. Unsec’d. Notes | | 3.350 | | 11/01/22 | | | 2,080 | | | | 2,090,625 | |
General Motors Co., | | | | | | | | | | | | |
Sr. Unsec’d. Notes | | 5.000 | | 04/01/35 | | | 970 | | | | 1,049,751 | |
Sr. Unsec’d. Notes | | 5.150 | | 04/01/38 | | | 1,250 | | | | 1,356,544 | |
Sr. Unsec’d. Notes | | 6.250 | | 10/02/43 | | | 80 | | | | 97,009 | |
Sr. Unsec’d. Notes | | 6.800 | | 10/01/27 | | | 1,810 | | | | 2,133,293 | |
General Motors Financial Co., Inc., | | | | | | | | | | | | |
Sr. Unsec’d. Notes(a) | | 3.600 | | 06/21/30 | | | 1,365 | | | | 1,370,441 | |
| | | | | | | | | | | | |
| | | | |
| | | | | | | | | | | 13,573,783 | |
| | | | |
Auto Parts & Equipment 0.7% | | | | | | | | | | | | |
Adient Global Holdings Ltd., | | | | | | | | | | | | |
Gtd. Notes, 144A(a) | | 4.875 | | 08/15/26 | | | 850 | | | | 846,794 | |
American Axle & Manufacturing, Inc., | | | | | | | | | | | | |
Gtd. Notes | | 6.250 | | 03/15/26 | | | 2,350 | | | | 2,381,595 | |
Gtd. Notes(a) | | 6.500 | | 04/01/27 | | | 1,350 | | | | 1,380,347 | |
Gtd. Notes(a) | | 6.875 | | 07/01/28 | | | 1,500 | | | | 1,545,000 | |
Cooper-Standard Automotive, Inc., | | | | | | | | | | | | |
Gtd. Notes, 144A(a) | | 5.625 | | 11/15/26 | | | 1,700 | | | | 1,168,874 | |
Dana Financing Luxembourg Sarl, | | | | | | | | | | | | |
Gtd. Notes, 144A | | 5.750 | | 04/15/25 | | | 250 | | | | 253,205 | |
See Notes to Financial Statements.
22
| | | | | | | | | | | | |
| | | | |
| Description | | Interest
Rate | | Maturity
Date | | Principal
Amount
(000)# | | | Value | |
| | | | |
CORPORATE BONDS (Continued) | | | | | | | | | | | | |
| | | | |
Auto Parts & Equipment (cont’d.) | | | | | | | | | | | | |
Dana, Inc., | | | | | | | | | | | | |
Sr. Unsec’d. Notes | | 5.375% | | 11/15/27 | | | 3,015 | | | $ | 3,075,300 | |
Nemak SAB de CV (Mexico), | | | | | | | | | | | | |
Sr. Unsec’d. Notes, 144A | | 3.625 | | 06/28/31 | | | 1,190 | | | | 1,062,191 | |
| | | | | | | | | | | | |
| | | | |
| | | | | | | | | | | 11,713,306 | |
| | | | |
Banks 9.0% | | | | | | | | | | | | |
Agenzia Nazionale per l’Attrazione degli | | | | | | | | | | | | |
Investimenti e lo Sviluppo d’Impresa (Italy), | | | | | | | | | | | | |
Sr. Unsec’d. Notes | | 1.375 | | 07/20/22 | | EUR | 200 | | | | 225,417 | |
Banco de Credito del Peru (Peru), | | | | | | | | | | | | |
Sub. Notes, 144A, MTN | | 3.250(ff) | | 09/30/31 | | | 3,345 | | | | 3,151,320 | |
Banco do Brasil SA (Brazil), | | | | | | | | | | | | |
Sr. Unsec’d. Notes, 144A | | 4.875 | | 01/11/29 | | | 415 | | | | 417,532 | |
Banco Mercantil del Norte SA (Mexico), | | | | | | | | | | | | |
Jr. Sub. Notes, 144A | | 6.625(ff) | | 01/24/32(oo) | | | 3,245 | | | | 2,995,888 | |
Bangkok Bank PCL (Thailand), | | | | | | | | | | | | |
Sub. Notes, 144A(a) | | 3.466(ff) | | 09/23/36 | | | 3,285 | | | | 3,102,405 | |
Bank Mandiri Persero Tbk PT (Indonesia), | | | | | | | | | | | | |
Sr. Unsec’d. Notes, EMTN | | 3.750 | | 04/11/24 | | | 475 | | | | 481,551 | |
Bank of America Corp., | | | | | | | | | | | | |
Jr. Sub. Notes, Series JJ | | 5.125(ff) | | 06/20/24(oo) | | | 5,800 | | | | 5,858,954 | |
Jr. Sub. Notes, Series MM | | 4.300(ff) | | 01/28/25(oo) | | | 3,685 | | | | 3,548,477 | |
Sr. Unsec’d. Notes | | 2.592(ff) | | 04/29/31 | | | 2,820 | | | | 2,698,384 | |
Sr. Unsec’d. Notes, MTN | | 2.884(ff) | | 10/22/30 | | | 2,450 | | | | 2,400,865 | |
Sr. Unsec’d. Notes, MTN(a) | | 3.194(ff) | | 07/23/30 | | | 1,000 | | | | 1,001,179 | |
Sr. Unsec’d. Notes, MTN(a) | | 4.083(ff) | | 03/20/51 | | | 750 | | | | 806,310 | |
Sub. Notes, MTN | | 4.250 | | 10/22/26 | | | 460 | | | | 488,058 | |
Sub. Notes, MTN | | 4.450 | | 03/03/26 | | | 1,820 | | | | 1,935,053 | |
Barclays PLC (United Kingdom), | | | | | | | | | | | | |
Sr. Unsec’d. Notes | | 2.645(ff) | | 06/24/31 | | | 2,865 | | | | 2,704,025 | |
Sr. Unsec’d. Notes | | 3.932(ff) | | 05/07/25 | | | 600 | | | | 616,376 | |
Sub. Notes | | 4.836 | | 05/09/28 | | | 1,270 | | | | 1,344,423 | |
BNP Paribas SA (France), | | | | | | | | | | | | |
Sr. Unsec’d. Notes, 144A | | 1.323(ff) | | 01/13/27 | | | 670 | | | | 629,874 | |
Sr. Unsec’d. Notes, 144A, MTN | | 3.052(ff) | | 01/13/31 | | | 2,020 | | | | 1,964,862 | |
Citigroup, Inc., | | | | | | | | | | | | |
Jr. Sub. Notes, Series U | | 5.000(ff) | | 09/12/24(oo) | | | 975 | | | | 980,818 | |
Jr. Sub. Notes, Series V | | 4.700(ff) | | 01/30/25(oo) | | | 7,301 | | | | 7,156,760 | |
Jr. Sub. Notes, Series W | | 4.000(ff) | | 12/10/25(oo) | | | 605 | | | | 581,728 | |
Sr. Unsec’d. Notes | | 2.976(ff) | | 11/05/30 | | | 8,950 | | | | 8,836,616 | |
See Notes to Financial Statements.
PGIM Strategic Bond Fund 23
Schedule of Investments (continued)
as of February 28, 2022
| | | | | | | | | | | | |
| | | | |
| Description | | Interest
Rate | | Maturity
Date | | Principal
Amount
(000)# | | | Value | |
| | | | |
CORPORATE BONDS (Continued) | | | | | | | | | | | | |
| | | | |
Banks (cont’d.) | | | | | | | | | | | | |
Credit Suisse Group AG (Switzerland), | | | | | | | | | | | | |
Sr. Unsec’d. Notes, 144A | | 3.869%(ff) | | 01/12/29 | | | 1,100 | | | $ | 1,122,679 | |
Development Bank of the Republic of Belarus JSC | | | | | | | | | | | | |
(Belarus), | | | | | | | | | | | | |
Sr. Unsec’d. Notes | | 6.750 | | 05/02/24 | | | 2,020 | | | | 1,395,319 | |
Sr. Unsec’d. Notes, 144A | | 6.750 | | 05/02/24 | | | 1,200 | | | | 828,903 | |
Discover Bank, | | | | | | | | | | | | |
Sr. Unsec’d. Notes | | 2.700 | | 02/06/30 | | | 3,275 | | | | 3,156,412 | |
Goldman Sachs Group, Inc. (The), | | | | | | | | | | | | |
Jr. Sub. Notes, Series U | | 3.650(ff) | | 08/10/26(oo) | | | 1,415 | | | | 1,309,276 | |
Sr. Unsec’d. Notes | | 3.814(ff) | | 04/23/29 | | | 265 | | | | 275,043 | |
Sr. Unsec’d. Notes | | 3.850 | | 01/26/27 | | | 150 | | | | 156,262 | |
Sr. Unsec’d. Notes | | 4.223(ff) | | 05/01/29 | | | 1,040 | | | | 1,102,412 | |
Grupo Aval Ltd. (Colombia), | | | | | | | | | | | | |
Gtd. Notes, 144A(a) | | 4.375 | | 02/04/30 | | | 2,400 | | | | 2,127,374 | |
HSBC Holdings PLC (United Kingdom), | | | | | | | | | | | | |
Sr. Unsec’d. Notes | | 3.973(ff) | | 05/22/30 | | | 2,000 | | | | 2,062,734 | |
Intesa Sanpaolo SpA (Italy), | | | | | | | | | | | | |
Sub. Notes, 144A | | 4.198(ff) | | 06/01/32 | | | 700 | | | | 635,711 | |
JPMorgan Chase & Co., | | | | | | | | | | | | |
Jr. Sub. Notes, Series FF | | 5.000(ff) | | 08/01/24(oo) | | | 8,150 | | | | 8,159,787 | |
Jr. Sub. Notes, Series HH | | 4.600(ff) | | 02/01/25(oo) | | | 2,065 | | | | 2,023,807 | |
Jr. Sub. Notes, Series I, 3 Month LIBOR + 3.470% | | 3.769(c) | | 04/30/22(oo) | | | 61 | | | | 60,763 | |
Jr. Sub. Notes, Series KK | | 3.650(ff) | | 06/01/26(oo) | | | 18,000 | | | | 17,078,231 | |
Sr. Unsec’d. Notes | | 3.509(ff) | | 01/23/29 | | | 95 | | | | 97,563 | |
Sr. Unsec’d. Notes(v) | | 4.005(ff) | | 04/23/29 | | | 3,750 | | | | 3,952,032 | |
Sr. Unsec’d. Notes(v) | | 4.452(ff) | | 12/05/29 | | | 2,925 | | | | 3,160,560 | |
Sub. Notes(a) | | 2.956(ff) | | 05/13/31 | | | 1,195 | | | | 1,160,136 | |
Lloyds Banking Group PLC (United Kingdom), | | | | | | | | | | | | |
Sr. Unsec’d. Notes | | 3.900 | | 03/12/24 | | | 200 | | | | 207,204 | |
Mizrahi Tefahot Bank Ltd. (Israel), | | | | | | | | | | | | |
Sub. Notes, 144A | | 3.077(ff) | | 04/07/31 | | | 4,925 | | | | 4,728,000 | |
Morgan Stanley, | | | | | | | | | | | | |
Sr. Unsec’d. Notes, GMTN(v) | | 3.772(ff) | | 01/24/29 | | | 3,780 | | | | 3,923,913 | |
Sr. Unsec’d. Notes, GMTN(v) | | 4.431(ff) | | 01/23/30 | | | 5,500 | | | | 5,939,370 | |
Sr. Unsec’d. Notes, MTN | | 2.943(ff) | | 01/21/33 | | | 6,820 | | | | 6,676,229 | |
Sub. Notes, GMTN | | 4.350 | | 09/08/26 | | | 2,000 | | | | 2,123,964 | |
Sub. Notes, MTN | | 3.950 | | 04/23/27 | | | 1,750 | | | | 1,836,877 | |
NatWest Group PLC (United Kingdom), | | | | | | | | | | | | |
Sr. Unsec’d. Notes | | 4.519(ff) | | 06/25/24 | | | 1,300 | | | | 1,337,589 | |
Sr. Unsec’d. Notes | | 5.076(ff) | | 01/27/30 | | | 300 | | | | 330,580 | |
See Notes to Financial Statements.
24
| | | | | | | | | | | | |
| | | | |
| Description | | Interest
Rate | | Maturity
Date | | Principal
Amount
(000)# | | | Value | |
| | | | |
CORPORATE BONDS (Continued) | | | | | | | | | | | | |
| | | | |
Banks (cont’d.) | | | | | | | | | | | | |
State Bank of India (India), | | | | | | | | | | | | |
Sr. Unsec’d. Notes, 144A | | 4.375% | | 01/24/24 | | | 280 | | | $ | 289,607 | |
Texas Capital Bank NA, | | | | | | | | | | | | |
Sr. Unsec’d. Notes, 144A, 3 Month LIBOR + 4.500% | | 4.724(c) | | 09/30/24 | | | 5,340 | | | | 5,307,251 | |
Truist Financial Corp., | | | | | | | | | | | | |
Jr. Sub. Notes, Series N | | 4.800(ff) | | 09/01/24(oo) | | | 710 | | | | 710,300 | |
U.S. Bancorp, | | | | | | | | | | | | |
Jr. Sub. Notes(v) | | 3.700(ff) | | 01/15/27(oo) | | | 3,660 | | | | 3,402,784 | |
UBS Group AG (Switzerland), | | | | | | | | | | | | |
Sr. Unsec’d. Notes, 144A | | 1.364(ff) | | 01/30/27 | | | 200 | | | | 189,511 | |
Sr. Unsec’d. Notes, 144A | | 4.125 | | 09/24/25 | | | 310 | | | | 324,380 | |
VTB Bank OJSC Via VTB Capital SA (Russia), | | | | | | | | | | | | |
Sub. Notes(a) | | 6.950 | | 10/17/22 | | | 2,240 | | | | 1,116,875 | |
Wells Fargo & Co., | | | | | | | | | | | | |
Sr. Unsec’d. Notes(v) | | 3.068(ff) | | 04/30/41 | | | 3,150 | | | | 2,938,540 | |
| | | | | | | | | | | | |
| | | | |
| | | | | | | | | | | 145,174,853 | |
| | | | |
Beverages 0.1% | | | | | | | | | | | | |
Anheuser-Busch InBev Worldwide, Inc. (Belgium), | | | | | | | | | | | | |
Gtd. Notes | | 5.550 | | 01/23/49 | | | 1,320 | | | | 1,634,345 | |
| | | | |
Building Materials 0.7% | | | | | | | | | | | | |
Cemex SAB de CV (Mexico), | | | | | | | | | | | | |
Gtd. Notes | | 5.200 | | 09/17/30 | | | 583 | | | | 569,630 | |
Gtd. Notes(a) | | 5.450 | | 11/19/29 | | | 1,917 | | | | 1,911,507 | |
Gtd. Notes, 144A(a) | | 5.450 | | 11/19/29 | | | 595 | | �� | | 593,295 | |
Gtd. Notes, 144A | | 7.375 | | 06/05/27 | | | 560 | | | | 600,643 | |
Cornerstone Building Brands, Inc., | | | | | | | | | | | | |
Gtd. Notes, 144A | | 6.125 | | 01/15/29 | | | 175 | | | | 167,523 | |
Griffon Corp., | | | | | | | | | | | | |
Gtd. Notes | | 5.750 | | 03/01/28 | | | 2,010 | | | | 2,000,662 | |
Masonite International Corp., | | | | | | | | | | | | |
Gtd. Notes, 144A | | 5.375 | | 02/01/28 | | | 895 | | | | 914,650 | |
Owens Corning, | | | | | | | | | | | | |
Sr. Unsec’d. Notes | | 4.400 | | 01/30/48 | | | 600 | | | | 636,851 | |
SRM Escrow Issuer LLC, | | | | | | | | | | | | |
Sr. Sec’d. Notes, 144A | | 6.000 | | 11/01/28 | | | 2,125 | | | | 2,125,044 | |
Standard Industries, Inc., | | | | | | | | | | | | |
Sr. Unsec’d. Notes, 144A | | 4.375 | | 07/15/30 | | | 1,850 | | | | 1,746,858 | |
| | | | | | | | | | | | |
| | | | |
| | | | | | | | | | | 11,266,663 | |
See Notes to Financial Statements.
PGIM Strategic Bond Fund 25
Schedule of Investments (continued)
as of February 28, 2022
| | | | | | | | | | | | |
| | | | |
| Description | | Interest
Rate | | Maturity
Date | | Principal
Amount
(000)# | | | Value | |
| | | | |
CORPORATE BONDS (Continued) | | | | | | | | | | | | |
| | | | |
Chemicals 1.8% | | | | | | | | | | | | |
| | | | |
Ashland Services BV, | | | | | | | | | | | | |
Gtd. Notes | | 2.000% | | 01/30/28 | | EUR | 2,400 | | | $ | 2,489,175 | |
| | | | |
Braskem Netherlands Finance BV (Brazil), | | | | | | | | | | | | |
Gtd. Notes, 144A | | 4.500 | | 01/10/28 | | | 1,325 | | | | 1,340,266 | |
Gtd. Notes, 144A(a) | | 4.500 | | 01/31/30 | | | 1,160 | | | | 1,147,591 | |
| | | | |
CF Industries, Inc., | | | | | | | | | | | | |
Gtd. Notes | | 5.375 | | 03/15/44 | | | 1,600 | | | | 1,805,458 | |
Gtd. Notes, 144A | | 4.500 | | 12/01/26 | | | 100 | | | | 107,621 | |
| | | | |
Chemours Co. (The), | | | | | | | | | | | | |
Gtd. Notes | | 5.375 | | 05/15/27 | | | 1,675 | | | | 1,682,254 | |
| | | | |
Dow Chemical Co. (The), | | | | | | | | | | | | |
Sr. Unsec’d. Notes | | 5.250 | | 11/15/41 | | | 220 | | | | 260,435 | |
| | | | |
Eurochem Finance DAC (Russia), | | | | | | | | | | | | |
Gtd. Notes, 144A | | 5.500 | | 03/13/24 | | | 1,390 | | | | 695,000 | |
| | | | |
Hexion, Inc., | | | | | | | | | | | | |
Gtd. Notes, 144A | | 7.875 | | 07/15/27 | | | 1,500 | | | | 1,583,909 | |
| | | | |
LYB International Finance III LLC, | | | | | | | | | | | | |
Gtd. Notes | | 4.200 | | 10/15/49 | | | 1,280 | | | | 1,298,379 | |
| | | | |
MEGlobal Canada ULC (Kuwait), | | | | | | | | | | | | |
Gtd. Notes, EMTN | | 5.875 | | 05/18/30 | | | 1,400 | | | | 1,591,290 | |
| | | | |
Nutrien Ltd. (Canada), | | | | | | | | | | | | |
Sr. Unsec’d. Notes | | 5.250 | | 01/15/45 | | | 596 | | | | 722,402 | |
| | | | |
OCP SA (Morocco), | | | | | | | | | | | | |
Sr. Unsec’d. Notes, 144A | | 3.750 | | 06/23/31 | | | 875 | | | | 770,888 | |
| | | | |
Olympus Water US Holding Corp., | | | | | | | | | | | | |
Sr. Unsec’d. Notes, 144A | | 5.375 | | 10/01/29 | | EUR | 3,000 | | | | 3,027,309 | |
| | | | |
Sasol Financing International Ltd. (South Africa), | | | | | | | | | | | | |
Gtd. Notes | | 4.500 | | 11/14/22 | | | 5,460 | | | | 5,497,786 | |
| | | | |
Sasol Financing USA LLC (South Africa), | | | | | | | | | | | | |
Gtd. Notes | | 4.375 | | 09/18/26 | | | 730 | | | | 709,371 | |
Gtd. Notes | | 5.875 | | 03/27/24 | | | 1,450 | | | | 1,477,840 | |
| | | | |
Sherwin-Williams Co. (The), | | | | | | | | | | | | |
Sr. Unsec’d. Notes | | 2.950 | | 08/15/29 | | | 815 | | | | 817,310 | |
Sr. Unsec’d. Notes | | 3.450 | | 08/01/25 | | | 10 | | | | 10,291 | |
| | | | |
TPC Group, Inc., | | | | | | | | | | | | |
Sr. Sec’d. Notes, 144A (original cost $2,010,625; | | | | | | | | | | | | |
purchased 07/19/19 - 06/18/20)(f) | | 10.500 | | 08/01/24 | | | 2,125 | | | | 1,261,467 | |
Sr. Sec’d. Notes, 144A (original cost $513,380; | | | | | | | | | | | | |
purchased 02/01/21)(f) | | 10.875 | | 08/01/24 | | | 524 | | | | 548,786 | |
| | | | |
Valvoline, Inc., | | | | | | | | | | | | |
Gtd. Notes, 144A | | 4.250 | | 02/15/30 | | | 430 | | | | 407,596 | |
| | | | | | | | | | | | |
| | | | |
| | | | | | | | | | | 29,252,424 | |
See Notes to Financial Statements.
26
| | | | | | | | | | | | |
| | | | |
| Description | | Interest
Rate | | Maturity
Date | | Principal
Amount
(000)# | | | Value | |
| | | | |
CORPORATE BONDS (Continued) | | | | | | | | | | | | |
| | | | |
Commercial Services 1.7% | | | | | | | | | | | | |
Adtalem Global Education, Inc., | | | | | | | | | | | | |
Sr. Sec’d. Notes, 144A | | 5.500% | | 03/01/28 | | | 1,875 | | | $ | 1,675,820 | |
Allied Universal Holdco LLC/Allied Universal Finance Corp., | | | | | | | | | | | | |
Sr. Sec’d. Notes, 144A | | 6.625 | | 07/15/26 | | | 2,076 | | | | 2,127,376 | |
Sr. Unsec’d. Notes, 144A | | 6.000 | | 06/01/29 | | | 2,825 | | | | 2,641,622 | |
Allied Universal Holdco LLC/Allied Universal Finance Corp./Atlas Luxco 4 Sarl, | | | | | | | | | | | | |
Sr. Sec’d. Notes, 144A | | 4.625 | | 06/01/28 | | | 680 | | | | 645,165 | |
Sr. Sec’d. Notes, 144A | | 4.625 | | 06/01/28 | | | 420 | | | | 393,802 | |
DP World PLC (United Arab Emirates), | | | | | | | | | | | | |
Sr. Unsec’d. Notes | | 4.250 | | 09/25/30 | | GBP | 500 | | | | 711,343 | |
ERAC USA Finance LLC, | | | | | | | | | | | | |
Gtd. Notes, 144A(h) | | 4.200 | | 11/01/46 | | | 100 | | | | 106,477 | |
Gartner, Inc., | | | | | | | | | | | | |
Gtd. Notes, 144A | | 4.500 | | 07/01/28 | | | 350 | | | | 354,407 | |
Global Payments, Inc., | | | | | | | | | | | | |
Sr. Unsec’d. Notes | | 2.650 | | 02/15/25 | | | 605 | | | | 607,787 | |
La Financiere Atalian SASU (France), | | | | | | | | | | | | |
Gtd. Notes(a) | | 4.000 | | 05/15/24 | | EUR | 3,307 | | | | 3,411,336 | |
Gtd. Notes(a) | | 5.125 | | 05/15/25 | | EUR | 1,800 | | | | 1,831,887 | |
Loxam SAS (France), | | | | | | | | | | | | |
Sr. Sub. Notes(a) | | 4.500 | | 04/15/27 | | EUR | 2,700 | | | | 2,851,242 | |
Sr. Sub. Notes(a) | | 5.750 | | 07/15/27 | | EUR | 1,800 | | | | 1,936,166 | |
Nexi SpA (Italy), | | | | | | | | | | | | |
Sr. Unsec’d. Notes | | 2.125 | | 04/30/29 | | EUR | 3,700 | | | | 3,734,431 | |
Service Corp. International, | | | | | | | | | | | | |
Sr. Unsec’d. Notes | | 3.375 | | 08/15/30 | | | 465 | | | | 429,723 | |
United Rentals North America, Inc., | | | | | | | | | | | | |
Gtd. Notes | | 3.750 | | 01/15/32 | | | 2,700 | | | | 2,566,025 | |
Gtd. Notes | | 3.875 | | 02/15/31 | | | 425 | | | | 410,831 | |
Gtd. Notes | | 5.250 | | 01/15/30 | | | 1,233 | | | | 1,283,009 | |
| | | | | | | | | | | | |
| | | | |
| | | | | | | | | | | 27,718,449 | |
| | | | |
Computers 0.5% | | | | | | | | | | | | |
CA Magnum Holdings (India), | | | | | | | | | | | | |
Sr. Sec’d. Notes, 144A | | 5.375 | | 10/31/26 | | | 735 | | | | 738,057 | |
See Notes to Financial Statements.
PGIM Strategic Bond Fund 27
Schedule of Investments (continued)
as of February 28, 2022
| | | | | | | | | | | | |
| | | | |
| Description | | Interest
Rate | | Maturity
Date | | Principal
Amount
(000)# | | | Value | |
| | | | |
CORPORATE BONDS (Continued) | | | | | | | | | | | | |
| | | | |
Computers (cont’d.) | | | | | | | | | | | | |
Genpact Luxembourg Sarl, | | | | | | | | | | | | |
Gtd. Notes | | 3.375% | | 12/01/24 | | | 3,175 | | | $ | 3,260,928 | |
Hurricane Finance PLC (United Kingdom), | | | | | | | | | | | | |
Sr. Sec’d. Notes, 144A | | 8.000 | | 10/15/25 | | GBP | 2,500 | | | | 3,391,622 | |
| | | | | | | | | | | | |
| | | | |
| | | | | | | | | | | 7,390,607 | |
| | | | |
Distribution/Wholesale 0.3% | | | | | | | | | | | | |
H&E Equipment Services, Inc., | | | | | | | | | | | | |
Gtd. Notes, 144A | | 3.875 | | 12/15/28 | | | 4,900 | | | | 4,584,224 | |
| | | | |
Diversified Financial Services 2.1% | | | | | | | | | | | | |
Cantor Fitzgerald LP, | | | | | | | | | | | | |
Sr. Unsec’d. Notes, 144A | | 4.875 | | 05/01/24 | | | 2,930 | | | | 3,069,521 | |
Greystone Commercial Capital Trust, | | | | | | | | | | | | |
Sr. Unsec’d. Notes, Series 1A-1, 144A, 1 Month LIBOR + 2.830% (Cap 0.000%, Floor 3.030%)^ | | 3.030(c) | | 02/01/24 | | | 2,200 | | | | 2,200,000 | |
Sr. Unsec’d. Notes, Series A, 144A, 1 Month LIBOR + 2.270%^ | | 2.390(c) | | 05/31/25 | | | 6,300 | | | | 6,300,000 | |
Jefferies Group LLC/Jefferies Group Capital Finance, Inc., | | | | | | | | | | | | |
Sr. Unsec’d. Notes | | 4.150 | | 01/23/30 | | | 350 | | | | 367,815 | |
Nationstar Mortgage Holdings, Inc., | | | | | | | | | | | | |
Gtd. Notes, 144A | | 5.500 | | 08/15/28 | | | 1,740 | | | | 1,739,434 | |
Gtd. Notes, 144A | | 6.000 | | 01/15/27 | | | 800 | | | | 812,533 | |
OneMain Finance Corp., | | | | | | | | | | | | |
Gtd. Notes(a) | | 3.875 | | 09/15/28 | | | 1,600 | | | | 1,481,394 | |
Gtd. Notes(a) | | 4.000 | | 09/15/30 | | | 900 | | | | 820,739 | |
Gtd. Notes | | 5.375 | | 11/15/29 | | | 1,750 | | | | 1,760,624 | |
Gtd. Notes | | 6.625 | | 01/15/28 | | | 1,250 | | | | 1,337,141 | |
PennyMac Financial Services, Inc., | | | | | | | | | | | | |
Gtd. Notes, 144A(a) | | 4.250 | | 02/15/29 | | | 1,800 | | | | 1,605,619 | |
Power Finance Corp. Ltd. (India), | | | | | | | | | | | | |
Sr. Unsec’d. Notes, EMTN | | 5.250 | | 08/10/28 | | | 800 | | | | 858,818 | |
Sherwood Financing PLC (United Kingdom), | | | | | | | | | | | | |
Sr. Sec’d. Notes, 144A | | 6.000 | | 11/15/26 | | GBP | 4,225 | | | | 5,373,862 | |
Stifel Financial Corp., | | | | | | | | | | | | |
Sr. Unsec’d. Notes | | 4.000 | | 05/15/30 | | | 6,525 | | | | 6,856,317 | |
| | | | | | | | | | | | |
| | | | |
| | | | | | | | | | | 34,583,817 | |
See Notes to Financial Statements.
28
| | | | | | | | | | | | |
| | | | |
| Description | | Interest
Rate | | Maturity
Date | | Principal
Amount
(000)# | | | Value | |
| | | | |
CORPORATE BONDS (Continued) | | | | | | | | | | | | |
| | | | |
Electric 3.9% | | | | | | | | | | | | |
AES Panama Generation Holdings SRL (Panama), | | | | | | | | | | | | |
Sr. Sec’d. Notes, 144A | | 4.375% | | 05/31/30 | | | 3,955 | | | $ | 3,819,346 | |
Calpine Corp., | | | | | | | | | | | | |
Sr. Sec’d. Notes, 144A | | 4.500 | | 02/15/28 | | | 3,395 | | | | 3,313,282 | |
Sr. Unsec’d. Notes, 144A | | 4.625 | | 02/01/29 | | | 2,775 | | | | 2,580,447 | |
Sr. Unsec’d. Notes, 144A | | 5.000 | | 02/01/31 | | | 1,175 | | | | 1,084,824 | |
Sr. Unsec’d. Notes, 144A(a) | | 5.125 | | 03/15/28 | | | 4,000 | | | | 3,857,380 | |
Clean Renewable Power Mauritius Pte Ltd. (India), | | | | | | | | | | | | |
Sr. Sec’d. Notes, 144A | | 4.250 | | 03/25/27 | | | 1,550 | | | | 1,503,713 | |
Cleco Corporate Holdings LLC, | | | | | | | | | | | | |
Sr. Unsec’d. Notes | | 3.375 | | 09/15/29 | | | 295 | | | | 291,229 | |
CMS Energy Corp., | | | | | | | | | | | | |
Jr. Sub. Notes | | 4.750(ff) | | 06/01/50 | | | 1,550 | | | | 1,560,889 | |
Dominion Energy, Inc., | | | | | | | | | | | | |
Jr. Sub. Notes | | 3.071 | | 08/15/24 | | | 2,655 | | | | 2,705,176 | |
Jr. Sub. Notes, Series B | | 4.650(ff) | | 12/15/24(oo) | | | 2,625 | | | | 2,606,287 | |
DTE Energy Co., | | | | | | | | | | | | |
Sr. Unsec’d. Notes | | 2.950 | | 03/01/30 | | | 345 | | | | 339,051 | |
Sr. Unsec’d. Notes, Series C | | 3.400 | | 06/15/29 | | | 607 | | | | 620,284 | |
Electricidad Firme de Mexico Holdings SA de CV (Mexico), | | | | | | | | | | | | |
Sr. Sec’d. Notes, 144A | | 4.900 | | 11/20/26 | | | 1,180 | | | | 1,142,034 | |
Eskom Holdings SOC Ltd. (South Africa), | | | | | | | | | | | | |
Sr. Unsec’d. Notes, 144A | | 7.125 | | 02/11/25 | | | 2,075 | | | | 2,040,013 | |
Sr. Unsec’d. Notes, 144A, MTN | | 6.750 | | 08/06/23 | | | 2,050 | | | | 2,046,895 | |
Sr. Unsec’d. Notes, EMTN | | 6.750 | | 08/06/23 | | | 560 | | | | 559,152 | |
FEL Energy VI Sarl (Mexico), | | | | | | | | | | | | |
Sr. Sec’d. Notes, 144A | | 5.750 | | 12/01/40 | | | 2,986 | | | | 2,875,559 | |
Kallpa Generacion SA (Peru), | | | | | | | | | | | | |
Gtd. Notes, 144A | | 4.125 | | 08/16/27 | | | 2,810 | | | | 2,795,286 | |
Light Servicos de Eletricidade SA/Light Energia SA (Brazil), | | | | | | | | | | | | |
Gtd. Notes, 144A(a) | | 4.375 | | 06/18/26 | | | 2,000 | | | | 1,898,179 | |
Mong Duong Finance Holdings BV (Vietnam), | | | | | | | | | | | | |
Sr. Sec’d. Notes | | 5.125 | | 05/07/29 | | | 1,275 | | | | 1,128,301 | |
NRG Energy, Inc., | | | | | | | | | | | | |
Gtd. Notes | | 5.750 | | 01/15/28 | | | 225 | | | | 230,040 | |
Gtd. Notes, 144A | | 3.375 | | 02/15/29 | | | 200 | | | | 185,665 | |
Gtd. Notes, 144A | | 3.625 | | 02/15/31 | | | 3,275 | | | | 3,014,137 | |
Gtd. Notes, 144A | | 3.875 | | 02/15/32 | | | 1,000 | | | | 926,790 | |
Gtd. Notes, 144A | | 5.250 | | 06/15/29 | | | 2,000 | | | | 2,039,297 | |
See Notes to Financial Statements.
PGIM Strategic Bond Fund 29
Schedule of Investments (continued)
as of February 28, 2022
| | | | | | | | | | | | | | | | | | | | |
| | | | |
| Description | | Interest
Rate | | | Maturity Date | | | Principal
Amount
(000)# | | | Value | |
| | | | | |
CORPORATE BONDS (Continued) | | | | | | | | | | | | | | | | | | | | |
| | | | | |
Electric (cont’d.) | | | | | | | | | | | | | | | | | | | | |
| | | | | |
Pacific Gas & Electric Co., | | | | | | | | | | | | | | | | | | | | |
First Mortgage | | | 4.550% | | | | 07/01/30 | | | | | | | | 1,750 | | | $ | 1,798,949 | |
Perusahaan Listrik Negara PT (Indonesia), | | | | | | | | | | | | | | | | | | | | |
Sr. Unsec’d. Notes, 144A | | | 1.875 | | | | 11/05/31 | | | | EUR | | | | 1,106 | | | | 1,101,224 | |
PG&E Corp., | | | | | | | | | | | | | | | | | | | | |
Sr. Sec’d. Notes(a) | | | 5.250 | | | | 07/01/30 | | | | | | | | 1,446 | | | | 1,435,370 | |
Puget Energy, Inc., | | | | | | | | | | | | | | | | | | | | |
Sr. Sec’d. Notes | | | 4.100 | | | | 06/15/30 | | | | | | | | 4,130 | | | | 4,307,844 | |
State Grid Overseas Investment BVI Ltd. (China), | | | | | | | | | | | | | | | | | | | | |
Gtd. Notes, EMTN | | | 2.750 | | | | 05/04/22 | | | | | | | | 300 | | | | 300,563 | |
Vistra Corp., | | | | | | | | | | | | | | | | | | | | |
Jr. Sub. Notes, 144A(oo) | | | 7.000(ff) | | | | 12/15/26 | | | | | | | | 875 | | | | 868,580 | |
Jr. Sub. Notes, 144A | | | 8.000(ff) | | | | 10/15/26(oo) | | | | | | | | 3,125 | | | | 3,215,772 | |
Vistra Operations Co. LLC, | | | | | | | | | | | | | | | | | | | | |
Gtd. Notes, 144A(a) | | | 4.375 | | | | 05/01/29 | | | | | | | | 800 | | | | 776,584 | |
Gtd. Notes, 144A | | | 5.000 | | | | 07/31/27 | | | | | | | | 405 | | | | 408,256 | |
Sr. Sec’d. Notes, 144A | | | 3.550 | | | | 07/15/24 | | | | | | | | 750 | | | | 759,528 | |
Sr. Sec’d. Notes, 144A | | | 3.700 | | | | 01/30/27 | | | | | | | | 3,105 | | | | 3,117,193 | |
| | | | | | | | | | | | | | | | | | | | |
| | | | | |
| | | | | | | | | | | | | | | | | | | 63,253,119 | |
| | | | | |
Electrical Components & Equipment 0.1% | | | | | | | | | | | | | | | | | | | | |
WESCO Distribution, Inc., | | | | | | | | | | | | | | | | | | | | |
Gtd. Notes, 144A | | | 7.125 | | | | 06/15/25 | | | | | | | | 550 | | | | 575,645 | |
Gtd. Notes, 144A | | | 7.250 | | | | 06/15/28 | | | | | | | | 1,200 | | | | 1,288,629 | |
| | | | | | | | | | | | | | | | | | | | |
| | | | | |
| | | | | | | | | | | | | | | | | | | 1,864,274 | |
| | | | | |
Electronics 0.0% | | | | | | | | | | | | | | | | | | | | |
Sensata Technologies, Inc., | | | | | | | | | | | | | | | | | | | | |
Gtd. Notes, 144A(a) | | | 3.750 | | | | 02/15/31 | | | | | | | | 665 | | | | 622,272 | |
| | | | | |
Energy-Alternate Sources 0.2% | | | | | | | | | | | | | | | | | | | | |
Aydem Yenilenebilir Enerji A/S (Turkey), | | | | | | | | | | | | | | | | | | | | |
Sr. Sec’d. Notes, 144A | | | 7.750 | | | | 02/02/27 | | | | | | | | 3,095 | | | | 2,504,018 | |
| | | | | |
Engineering & Construction 1.0% | | | | | | | | | | | | | | | | | | | | |
AECOM, | | | | | | | | | | | | | | | | | | | | |
Gtd. Notes | | | 5.125 | | | | 03/15/27 | | | | | | | | 825 | | | | 846,028 | |
Cellnex Finance Co. SA (Spain), | | | | | | | | | | | | | | | | | | | | |
Gtd. Notes, EMTN | | | 2.000 | | | | 02/15/33 | | | | EUR | | | | 2,500 | | | | 2,365,699 | |
See Notes to Financial Statements.
30
| | | | | | | | | | | | | | | | | | | | |
| | | | |
| Description | | Interest
Rate | | | Maturity
Date | | | Principal
Amount
(000)# | | | Value | |
| | | | | |
CORPORATE BONDS (Continued) | | | | | | | | | | | | | | | | | | | | |
| | | | | |
Engineering & Construction (cont’d.) | | | | | | | | | | | | | | | | | | | | |
Cellnex Telecom SA (Spain), | | | | | | | | | | | | | | | | | | | | |
Sr. Unsec’d. Notes, EMTN | | | 1.750% | | | | 10/23/30 | | | | EUR | | | | 5,900 | | | $ | 5,821,100 | |
Delhi International Airport Ltd. (India), | | | | | | | | | | | | | | | | | | | | |
Sr. Sec’d. Notes, 144A | | | 6.450 | | | | 06/04/29 | | | | | | | | 690 | | | | 644,192 | |
IHS Holding Ltd. (Nigeria), | | | | | | | | | | | | | | | | | | | | |
Gtd. Notes, 144A(a) | | | 6.250 | | | | 11/29/28 | | | | | | | | 2,270 | | | | 2,210,084 | |
Mexico City Airport Trust (Mexico), | | | | | | | | | | | | | | | | | | | | |
Sr. Sec’d. Notes, 144A | | | 3.875 | | | | 04/30/28 | | | | | | | | 2,330 | | | | 2,281,126 | |
Sr. Sec’d. Notes, 144A(a) | | | 5.500 | | | | 07/31/47 | | | | | | | | 1,000 | | | | 903,776 | |
TopBuild Corp., | | | | | | | | | | | | | | | | | | | | |
Gtd. Notes, 144A | | | 4.125 | | | | 02/15/32 | | | | | | | | 1,050 | | | | 998,333 | |
| | | | | | | | | | | | | | | | | | | | |
| | | | | |
| | | | | | | | | | | | | | | | | | | 16,070,338 | |
| | | | | |
Entertainment 1.7% | | | | | | | | | | | | | | | | | | | | |
AMC Entertainment Holdings, Inc., | | | | | | | | | | | | | | | | | | | | |
Sec’d. Notes, 144A, Cash coupon 10.000% or PIK 12.000% or Cash coupon 5.000% and PIK 6.000% | | | 10.000 | | | | 06/15/26 | | | | | | | | 902 | | | | 832,655 | |
Caesars Entertainment, Inc., | | | | | | | | | | | | | | | | | | | | |
Sr. Sec’d. Notes, 144A | | | 6.250 | | | | 07/01/25 | | | | | | | | 1,470 | | | | 1,524,225 | |
Sr. Unsec’d. Notes, 144A | | | 4.625 | | | | 10/15/29 | | | | | | | | 1,175 | | | | 1,114,535 | |
CCM Merger, Inc., | | | | | | | | | | | | | | | | | | | | |
Sr. Unsec’d. Notes, 144A | | | 6.375 | | | | 05/01/26 | | | | | | | | 2,175 | | | | 2,225,531 | |
Codere Finance 2 Luxembourg SA (Spain), | | | | | | | | | | | | | | | | | | | | |
Sr. Sec’d. Notes, Cash coupon 2.000% and PIK 10.750% | | | 12.750 | | | | 11/30/27(d) | | | | EUR | | | | 54 | | | | 59,214 | |
Sr. Sec’d. Notes, 144A, Cash coupon 8.000% and PIK 3.000%(a) | | | 11.000 | | | | 09/30/26(d) | | | | EUR | | | | 840 | | | | 999,827 | |
Sr. Sec’d. Notes, 144A, Cash coupon 2.000% and PIK 11.625% | | | 13.625 | | | | 11/30/27(d) | | | | | | | | 244 | | | | 232,886 | |
Codere New Holdco SA (Spain), | | | | | | | | | | | | | | | | | | | | |
Sr. Sec’d. Notes, 144A, 7.500% PIK^ | | | 7.500 | | | | 11/30/27(d) | | | | EUR | | | | 332 | | | | 322,079 | |
Everi Holdings, Inc., | | | | | | | | | | | | | | | | | | | | |
Gtd. Notes, 144A | | | 5.000 | | | | 07/15/29 | | | | | | | | 225 | | | | 220,586 | |
Golden Entertainment, Inc., | | | | | | | | | | | | | | | | | | | | |
Sr. Unsec’d. Notes, 144A | | | 7.625 | | | | 04/15/26 | | | | | | | | 2,800 | | | | 2,874,717 | |
International Game Technology PLC, | | | | | | | | | | | | | | | | | | | | |
Sr. Sec’d. Notes, 144A | | | 6.500 | | | | 02/15/25 | | | | | | | | 1,475 | | | | 1,559,297 | |
Motion Bondco DAC (United Kingdom), | | | | | | | | | | | | | | | | | | | | |
Gtd. Notes, 144A | | | 6.625 | | | | 11/15/27 | | | | | | | | 3,375 | | | | 3,323,164 | |
See Notes to Financial Statements.
PGIM Strategic Bond Fund 31
Schedule of Investments (continued)
as of February 28, 2022
| | | | | | | | | | | | | | | | |
| | | | | |
| Description | | Interest
Rate | | Maturity
Date | | | | | Principal
Amount
(000)# | | | Value | |
| | | | | |
CORPORATE BONDS (Continued) | | | | | | | | | | | | | | | | |
| | | | | |
Entertainment (cont’d.) | | | | | | | | | | | | | | | | |
Penn National Gaming, Inc., | | | | | | | | | | | | | | | | |
Sr. Unsec’d. Notes, 144A | | 5.625% | | 01/15/27 | | | | | | | 3,125 | | | $ | 3,165,872 | |
Premier Entertainment Sub LLC/Premier Entertainment Finance Corp., | | | | | | | | | | | | | | | | |
Gtd. Notes, 144A | | 5.625 | | 09/01/29 | | | | | | | 1,100 | | | | 999,370 | |
Gtd. Notes, 144A | | 5.875 | | 09/01/31 | | | | | | | 1,525 | | | | 1,383,937 | |
Scientific Games International, Inc., | | | | | | | | | | | | | | | | |
Gtd. Notes, 144A | | 8.250 | | 03/15/26 | | | | | | | 1,916 | | | | 2,001,138 | |
Gtd. Notes, 144A | | 8.625 | | 07/01/25 | | | | | | | 1,775 | | | | 1,880,522 | |
Wynn Resorts Finance LLC/Wynn Resorts Capital Corp., | | | | | | | | | | | | | | | | |
Sr. Unsec’d. Notes, 144A | | 7.750 | | 04/15/25 | | | | | | | 3,000 | | | | 3,135,050 | |
| | | | | | | | | | | | | | | | |
| | | | | |
| | | | | | | | | | | | | | | 27,854,605 | |
| | | | | |
Environmental Control 0.1% | | | | | | | | | | | | | | | | |
Madison IAQ LLC, | | | | | | | | | | | | | | | | |
Sr. Unsec’d. Notes, 144A | | 5.875 | | 06/30/29 | | | | | | | 800 | | | | 725,651 | |
| | | | | |
Foods 1.8% | | | | | | | | | | | | | | | | |
Albertson’s Cos., Inc./Safeway, Inc./New Albertson’s LP/Albertson’s LLC, | | | | | | | | | | | | | | | | |
Gtd. Notes, 144A | | 3.500 | | 03/15/29 | | | | | | | 250 | | | | 232,494 | |
Gtd. Notes, 144A | | 5.875 | | 02/15/28 | | | | | | | 1,775 | | | | 1,843,622 | |
Bellis Acquisition Co. PLC (United Kingdom), | | | | | | | | | | | | | | | | |
Sr. Sec’d. Notes, 144A | | 3.250 | | 02/16/26 | | | GBP | | | | 7,600 | | | | 9,279,855 | |
Bellis Finco PLC (United Kingdom), | | | | | | | | | | | | | | | | |
Sr. Unsec’d. Notes, 144A | | 4.000 | | 02/16/27 | | | GBP | | | | 3,500 | | | | 4,168,067 | |
C&S Group Enterprises LLC, | | | | | | | | | | | | | | | | |
Gtd. Notes, 144A | | 5.000 | | 12/15/28 | | | | | | | 1,344 | | | | 1,168,889 | |
JBS USA LUX SA/JBS USA Food Co./JBS USA Finance, Inc., | | | | | | | | | | | | | | | | |
Gtd. Notes, 144A | | 6.500 | | 04/15/29 | | | | | | | 2,907 | | | | 3,096,306 | |
Sr. Unsec’d. Notes, 144A | | 5.500 | | 01/15/30 | | | | | | | 25 | | | | 25,850 | |
Kraft Heinz Foods Co., | | | | | | | | | | | | | | | | |
Gtd. Notes | | 4.625 | | 10/01/39 | | | | | | | 585 | | | | 625,690 | |
Gtd. Notes(a) | | 4.875 | | 10/01/49 | | | | | | | 1,832 | | | | 2,028,057 | |
Lamb Weston Holdings, Inc., | | | | | | | | | | | | | | | | |
Gtd. Notes, 144A | | 4.125 | | 01/31/30 | | | | | | | 750 | | | | 725,118 | |
Gtd. Notes, 144A(a) | | 4.375 | | 01/31/32 | | | | | | | 750 | | | | 728,997 | |
Pilgrim’s Pride Corp., | | | | | | | | | | | | | | | | |
Gtd. Notes, 144A | | 4.250 | | 04/15/31 | | | | | | | 2,000 | | | | 1,932,848 | |
See Notes to Financial Statements.
32
| | | | | | | | | | | | | | | | |
| | | | | |
| Description | | Interest
Rate | | Maturity
Date | | | | | Principal Amount
(000)# | | | Value | |
| | | | | |
CORPORATE BONDS (Continued) | | | | | | | | | | | | | | | | |
| | | | | |
Foods (cont’d.) | | | | | | | | | | | | | | | | |
Pilgrim’s Pride Corp., (cont’d.) | | | | | | | | | | | | | | | | |
Gtd. Notes, 144A | | 5.875% | | 09/30/27 | | | | | | | 2,201 | | | $ | 2,263,325 | |
Post Holdings, Inc., | | | | | | | | | | | | | | | | |
Sr. Unsec’d. Notes, 144A | | 4.500 | | 09/15/31 | | | | | | | 1,000 | | | | 926,008 | |
| | | | | | | | | | | | | | | | |
| | | | | |
| | | | | | | | | | | | | | | 29,045,126 | |
| | | | | |
Forest Products & Paper 0.2% | | | | | | | | | | | | | | | | |
Suzano Austria GmbH (Brazil), | | | | | | | | | | | | | | | | |
Gtd. Notes(a) | | 6.000 | | 01/15/29 | | | | | | | 2,230 | | | | 2,450,292 | |
| | | | | |
Gas 1.2% | | | | | | | | | | | | | | | | |
AmeriGas Partners LP/AmeriGas Finance Corp., | | | | | | | | | | | | | | | | |
Sr. Unsec’d. Notes | | 5.500 | | 05/20/25 | | | | | | | 200 | | | | 203,437 | |
Sr. Unsec’d. Notes | | 5.750 | | 05/20/27 | | | | | | | 1,300 | | | | 1,312,883 | |
Sr. Unsec’d. Notes | | 5.875 | | 08/20/26 | | | | | | | 3,475 | | | | 3,547,764 | |
ENN Clean Energy International Investment Ltd. (China), | | | | | | | | | | | | | | | | |
Gtd. Notes, 144A(a) | | 3.375 | | 05/12/26 | | | | | | | 4,635 | | | | 4,540,591 | |
Ferrellgas Escrow LLC, | | | | | | | | | | | | | | | | |
Sr. Unsec’d. Notes^ | | 8.956 | | 03/30/31 | | | | | | | 9,500 | | | | 9,500,000 | |
| | | | | | | | | | | | | | | | |
| | | | | |
| | | | | | | | | | | | | | | 19,104,675 | |
| | | | | |
Healthcare-Products 0.3% | | | | | | | | | | | | | | | | |
Avantor Funding, Inc., | | | | | | | | | | | | | | | | |
Sr. Sec’d. Notes, 144A | | 2.625 | | 11/01/25 | | | EUR | | | | 2,125 | | | | 2,368,926 | |
DH Europe Finance II Sarl, | | | | | | | | | | | | | | | | |
Gtd. Notes(a) | | 1.350 | | 09/18/39 | | | EUR | | | | 775 | | | | 782,349 | |
Mozart Debt Merger Sub, Inc., | | | | | | | | | | | | | | | | |
Sr. Sec’d. Notes, 144A | | 3.875 | | 04/01/29 | | | | | | | 500 | | | | 474,817 | |
Sr. Unsec’d. Notes, 144A | | 5.250 | | 10/01/29 | | | | | | | 325 | | | | 311,378 | |
Thermo Fisher Scientific, Inc., | | | | | | | | | | | | | | | | |
Sr. Unsec’d. Notes, EMTN | | 1.500 | | 10/01/39 | | | EUR | | | | 400 | | | | 410,590 | |
Sr. Unsec’d. Notes, EMTN | | 1.875 | | 10/01/49 | | | EUR | | | | 275 | | | | 278,598 | |
| | | | | | | | | | | | | | | | |
| | | | | |
| | | | | | | | | | | | | | | 4,626,658 | |
| | | | | |
Healthcare-Services 1.1% | | | | | | | | | | | | | | | | |
DaVita, Inc., | | | | | | | | | | | | | | | | |
Gtd. Notes, 144A | | 4.625 | | 06/01/30 | | | | | | | 1,475 | | | | 1,414,119 | |
HCA, Inc., | | | | | | | | | | | | | | | | |
Gtd. Notes | | 5.375 | | 02/01/25 | | | | | | | 175 | | | | 185,464 | |
See Notes to Financial Statements.
PGIM Strategic Bond Fund 33
Schedule of Investments (continued)
as of February 28, 2022
| | | | | | | | | | | | |
| | | | |
| Description | | Interest
Rate | | Maturity
Date | | Principal
Amount
(000)# | | | Value | |
| | | | |
CORPORATE BONDS (Continued) | | | | | | | | | | | | |
| | | | |
Healthcare-Services (cont’d.) | | | | | | | | | | | | |
HCA, Inc., (cont’d.) | | | | | | | | | | | | |
Gtd. Notes | | 5.875% | | 02/15/26 | | | 200 | | | $ | 216,343 | |
Gtd. Notes | | 7.500 | | 11/06/33 | | | 2,000 | | | | 2,642,932 | |
Gtd. Notes, MTN | | 7.750 | | 07/15/36 | | | 1,500 | | | | 1,950,981 | |
Humana, Inc., | | | | | | | | | | | | |
Sr. Unsec’d. Notes | | 3.125 | | 08/15/29 | | | 1,110 | | | | 1,116,087 | |
MEDNAX, Inc., | | | | | | | | | | | | |
Gtd. Notes, 144A | | 5.375 | | 02/15/30 | | | 200 | | | | 199,035 | |
Prime Healthcare Services, Inc., | | | | | | | | | | | | |
Sr. Sec’d. Notes, 144A | | 7.250 | | 11/01/25 | | | 1,150 | | | | 1,175,460 | |
RegionalCare Hospital Partners Holdings, Inc./LifePoint Health, Inc., | | | | | | | | | | |
Gtd. Notes, 144A | | 9.750 | | 12/01/26 | | | 1,750 | | | | 1,836,174 | |
Tenet Healthcare Corp., | | | | | | | | | | | | |
Gtd. Notes, 144A(a) | | 6.125 | | 10/01/28 | | | 2,250 | | | | 2,278,179 | |
Sr. Sec’d. Notes, 144A | | 4.625 | | 06/15/28 | | | 305 | | | | 298,607 | |
Sr. Sec’d. Notes, 144A | | 5.125 | | 11/01/27 | | | 1,200 | | | | 1,223,349 | |
Sr. Unsec’d. Notes | | 6.750 | | 06/15/23 | | | 2,750 | | | | 2,863,878 | |
| | | | | | | | | | | | |
| | | | |
| | | | | | | | | | | 17,400,608 | |
| | | | |
Holding Companies-Diversified 0.0% | | | | | | | | | | | | |
CK Hutchison International 17 Ltd. (United Kingdom), | | | | | | | | | | |
Gtd. Notes, 144A | | 2.875 | | 04/05/22 | | | 300 | | | | 300,375 | |
| | | | |
Home Builders 1.3% | | | | | | | | | | | | |
Ashton Woods USA LLC/Ashton Woods Finance Co., | | | | | | | | | | |
Sr. Unsec’d. Notes, 144A | | 4.625 | | 08/01/29 | | | 675 | | | | 640,086 | |
Sr. Unsec’d. Notes, 144A | | 4.625 | | 04/01/30 | | | 825 | | | | 775,919 | |
Beazer Homes USA, Inc., | | | | | | | | | | | | |
Gtd. Notes | | 5.875 | | 10/15/27 | | | 175 | | | | 174,235 | |
Gtd. Notes | | 6.750 | | 03/15/25 | | | 500 | | | | 506,814 | |
Gtd. Notes | | 7.250 | | 10/15/29 | | | 3,358 | | | | 3,398,460 | |
Brookfield Residential Properties, Inc./Brookfield Residential US LLC (Canada), | | | | | | | | | | |
Gtd. Notes, 144A | | 4.875 | | 02/15/30 | | | 1,325 | | | | 1,212,965 | |
Gtd. Notes, 144A | | 6.250 | | 09/15/27 | | | 275 | | | | 276,791 | |
Sr. Unsec’d. Notes, 144A | | 5.000 | | 06/15/29 | | | 1,200 | | | | 1,128,835 | |
Century Communities, Inc., | | | | | | | | | | | | |
Gtd. Notes, 144A | | 3.875 | | 08/15/29 | | | 800 | | | | 742,502 | |
See Notes to Financial Statements.
34
| | | | | | | | | | | | |
| | | | |
| Description | | Interest
Rate | | Maturity
Date | | Principal
Amount
(000)# | | | Value | |
| | | |
CORPORATE BONDS (Continued) | | | | | | | | | | |
| | | | |
Home Builders (cont’d.) | | | | | | | | | | | | |
KB Home, | | | | | | | | | | | | |
Gtd. Notes | | 4.000% | | 06/15/31 | | | 615 | | | $ | 590,268 | |
Gtd. Notes | | 6.875 | | 06/15/27 | | | 941 | | | | 1,034,081 | |
Mattamy Group Corp. (Canada), | | | | | | | | | | |
Sr. Unsec’d. Notes, 144A | | 4.625 | | 03/01/30 | | | 3,575 | | | | 3,360,132 | |
Meritage Homes Corp., | | | | | | | | | | | | |
Gtd. Notes | | 5.125 | | 06/06/27 | | | 275 | | | | 285,831 | |
Shea Homes LP/Shea Homes Funding Corp., | | | | | | | | | | |
Sr. Unsec’d. Notes, 144A | | 4.750 | | 02/15/28 | | | 1,925 | | | | 1,852,694 | |
Taylor Morrison Communities, Inc., | | | | | | | | | | |
Gtd. Notes, 144A | | 5.875 | | 06/15/27 | | | 400 | | | | 419,819 | |
Gtd. Notes, 144A | | 6.625 | | 07/15/27 | | | 1,225 | | | | 1,260,231 | |
Sr. Unsec’d. Notes, 144A | | 5.125 | | 08/01/30 | | | 2,680 | | | | 2,675,345 | |
Taylor Morrison Communities, Inc./Taylor Morrison Holdings II, Inc., | | | | | | | | | | |
Gtd. Notes, 144A | | 5.625 | | 03/01/24 | | | 350 | | | | 361,245 | |
Gtd. Notes, 144A | | 5.875 | | 04/15/23 | | | 150 | | | | 153,284 | |
| | | | | | | | | | | | |
| | | | |
| | | | | | | | | | | 20,849,537 | |
| | | | |
Household Products/Wares 0.2% | | | | | | | | | | | | |
ACCO Brands Corp., | | | | | | | | | | | | |
Gtd. Notes, 144A | | 4.250 | | 03/15/29 | | | 2,675 | | | | 2,498,647 | |
Central Garden & Pet Co., | | | | | | | | | | | | |
Gtd. Notes, 144A | | 4.125 | | 04/30/31 | | | 250 | | | | 233,817 | |
| | | | | | | | | | | | |
| | | | |
| | | | | | | | | | | 2,732,464 | |
| | | | |
Insurance 0.3% | | | | | | | | | | | | |
American International Group, Inc., | | | | | | | | | | |
Sr. Unsec’d. Notes(v) | | 4.500 | | 07/16/44 | | | 2,518 | | | | 2,792,205 | |
Markel Corp., | | | | | | | | | | | | |
Sr. Unsec’d. Notes | | 4.150 | | 09/17/50 | | | 2,000 | | | | 2,092,494 | |
Teachers Insurance & Annuity Association of America, | | | | | | | | | | |
Sub. Notes, 144A | | 4.900 | | 09/15/44 | | | 75 | | | | 87,918 | |
| | | | | | | | | | | | |
| | | | |
| | | | | | | | | | | 4,972,617 | |
| | | | |
Internet 0.7% | | | | | | | | | | | | |
Prosus NV (China), | | | | | | | | | | | | |
Sr. Unsec’d. Notes, 144A | | 3.680 | | 01/21/30 | | | 1,200 | | | | 1,076,151 | |
Sr. Unsec’d. Notes, 144A | | 4.193 | | 01/19/32 | | | 3,335 | | | | 2,986,916 | |
See Notes to Financial Statements.
PGIM Strategic Bond Fund 35
Schedule of Investments (continued)
as of February 28, 2022
| | | | | | | | | | | | | | | | |
| | | | | |
| Description | | Interest
Rate | | Maturity
Date | | | | | Principal
Amount
(000)# | | | Value | |
| | | | | |
CORPORATE BONDS (Continued) | | | | | | | | | | | | | | | | |
| | | | | |
Internet (cont’d.) | | | | | | | | | | | | | | | | |
United Group BV (Netherlands), | | | | | | | | | | | | | | | | |
Sr. Sec’d. Notes | | 3.125% | | 02/15/26 | | | EUR | | | | 5,000 | | | $ | 5,221,242 | |
Sr. Sec’d. Notes | | 4.875 | | 07/01/24 | | | EUR | | | | 1,125 | | | | 1,262,722 | |
Sr. Sec’d. Notes, 144A | | 3.125 | | 02/15/26 | | | EUR | | | | 1,150 | | | | 1,200,886 | |
Sr. Sec’d. Notes, 144A | | 3.625 | | 02/15/28 | | | EUR | | | | 100 | | | | 100,779 | |
| | | | | | | | | | | | | | | | |
| | | | | |
| | | | | | | | | | | | | | | 11,848,696 | |
| | | | | |
Iron/Steel 0.2% | | | | | | | | | | | | | | | | |
Steel Dynamics, Inc., | | | | | | | | | | | | | | | | |
Sr. Unsec’d. Notes(a) | | 3.450 | | 04/15/30 | | | | | | | 2,325 | | | | 2,364,575 | |
| | | | | |
Leisure Time 0.6% | | | | | | | | | | | | | | | | |
Saga PLC (United Kingdom), | | | | | | | | | | | | | | | | |
Gtd. Notes | | 5.500 | | 07/15/26 | | | GBP | | | | 7,300 | | | | 9,340,968 | |
| | | | | |
Lodging 0.9% | | | | | | | | | | | | | | | | |
Gohl Capital Ltd. (Malaysia), | | | | | | | | | | | | | | | | |
Gtd. Notes | | 4.250 | | 01/24/27 | | | | | | | 2,170 | | | | 2,128,575 | |
Hilton Domestic Operating Co., Inc., | | | | | | | | | | | | | | | | |
Gtd. Notes, 144A | | 3.625 | | 02/15/32 | | | | | | | 2,000 | | | | 1,901,070 | |
Gtd. Notes, 144A | | 3.750 | | 05/01/29 | | | | | | | 1,350 | | | | 1,306,877 | |
Las Vegas Sands Corp., | | | | | | | | | | | | | | | | |
Sr. Unsec’d. Notes | | 3.900 | | 08/08/29 | | | | | | | 255 | | | | 244,051 | |
Marriott International, Inc., | | | | | | | | | | | | | | | | |
Sr. Unsec’d. Notes, Series FF | | 4.625 | | 06/15/30 | | | | | | | 920 | | | | 994,228 | |
MGM China Holdings Ltd. (Macau), | | | | | | | | | | | | | | | | |
Sr. Unsec’d. Notes, 144A(a) | | 4.750 | | 02/01/27 | | | | | | | 2,160 | | | | 1,965,895 | |
MGM Resorts International, | | | | | | | | | | | | | | | | |
Gtd. Notes | | 4.750 | | 10/15/28 | | | | | | | 1,500 | | | | 1,496,455 | |
Gtd. Notes | | 5.500 | | 04/15/27 | | | | | | | 500 | | | | 516,134 | |
Gtd. Notes | | 6.750 | | 05/01/25 | | | | | | | 2,500 | | | | 2,589,178 | |
Sands China Ltd. (Macau), | | | | | | | | | | | | | | | | |
Sr. Unsec’d. Notes | | 5.125(c) | | 08/08/25 | | | | | | | 200 | | | | 201,395 | |
Wynn Macau Ltd. (Macau), | | | | | | | | | | | | | | | | |
Sr. Unsec’d. Notes, 144A(a) | | 5.500 | | 01/15/26 | | | | | | | 1,600 | | | | 1,455,867 | |
| | | | | | | | | | | | | | | | |
| | | | | |
| | | | | | | | | | | | | | | 14,799,725 | |
| | | | | |
Machinery-Diversified 0.1% | | | | | | | | | | | | | | | | |
TK Elevator Holdco GmbH (Germany), | | | | | | | | | | | | | | | | |
Sr. Unsec’d. Notes, 144A(a) | | 6.625 | | 07/15/28 | | | EUR | | | | 1,980 | | | | 2,218,480 | |
See Notes to Financial Statements.
36
| | | | | | | | | | | | | | |
| | | | |
| Description | | Interest
Rate | | Maturity
Date | | Principal
Amount
(000)# | | | Value | |
| | | | | |
CORPORATE BONDS (Continued) | | | | | | | | | | | | | | |
| | | | | |
Media 2.6% | | | | | | | | | | | | | | |
CCO Holdings LLC/CCO Holdings Capital Corp., | | | | | | | | | | | | | | |
Sr. Unsec’d. Notes(a) | | 4.500% | | 05/01/32 | | | | | 3,800 | | | $ | 3,609,239 | |
Sr. Unsec’d. Notes, 144A | | 4.250 | | 02/01/31 | | | | | 1,300 | | | | 1,220,119 | |
Sr. Unsec’d. Notes, 144A | | 4.250 | | 01/15/34 | | | | | 1,000 | | | | 919,185 | |
Sr. Unsec’d. Notes, 144A(a) | | 5.375 | | 06/01/29 | | | | | 3,775 | | | | 3,834,313 | |
Charter Communications Operating LLC/Charter Communications Operating Capital, | | | | | | | | | | | | | | |
Sr. Sec’d. Notes | | 5.375 | | 04/01/38 | | | | | 100 | | | | 105,794 | |
Sr. Sec’d. Notes | | 5.375 | | 05/01/47 | | | | | 205 | | | | 215,586 | |
Sr. Sec’d. Notes | | 5.750 | | 04/01/48 | | | | | 500 | | | | 551,337 | |
Sr. Sec’d. Notes | | 6.384 | | 10/23/35 | | | | | 1,515 | | | | 1,812,745 | |
Sr. Sec’d. Notes | | 6.484 | | 10/23/45 | | | | | 50 | | | | 59,462 | |
CSC Holdings LLC, | | | | | | | | | | | | | | |
Gtd. Notes, 144A | | 3.375 | | 02/15/31 | | | | | 1,480 | | | | 1,258,330 | |
Gtd. Notes, 144A | | 5.500 | | 04/15/27 | | | | | 1,300 | | | | 1,302,258 | |
Sr. Unsec’d. Notes, 144A(a) | | 4.625 | | 12/01/30 | | | | | 1,475 | | | | 1,229,764 | |
Sr. Unsec’d. Notes, 144A | | 5.750 | | 01/15/30 | | | | | 4,000 | | | | 3,539,049 | |
Diamond Sports Group LLC/Diamond Sports Finance Co., | | | | | | | | | | | | | | |
Gtd. Notes, 144A | | 6.625 | | 08/15/27 | | | | | 5,940 | | | | 1,394,944 | |
Sr. Sec’d. Notes, 144A(a) | | 5.375 | | 08/15/26 | | | | | 1,000 | | | | 411,147 | |
Discovery Communications LLC, | | | | | | | | | | | | | | |
Gtd. Notes | | 4.650 | | 05/15/50 | | | | | 850 | | | | 869,009 | |
Gtd. Notes | | 5.200 | | 09/20/47 | | | | | 645 | | | | 700,300 | |
Gtd. Notes | | 5.300 | | 05/15/49 | | | | | 2,220 | | | | 2,455,574 | |
DISH DBS Corp., | | | | | | | | | | | | | | |
Gtd. Notes(a) | | 7.375 | | 07/01/28 | | | | | 500 | | | | 471,599 | |
Gtd. Notes | | 7.750 | | 07/01/26 | | | | | 4,570 | | | | 4,611,695 | |
iHeartCommunications, Inc., | | | | | | | | | | | | | | |
Sr. Sec’d. Notes | | 6.375 | | 05/01/26 | | | | | 700 | | | | 721,654 | |
Univision Communications, Inc., | | | | | | | | | | | | | | |
Sr. Sec’d. Notes, 144A | | 6.625 | | 06/01/27 | | | | | 1,875 | | | | 1,956,095 | |
Virgin Media Secured Finance PLC (United Kingdom), | | | | | | | | | | | | | | |
Sr. Sec’d. Notes(a) | | 4.250 | | 01/15/30 | | GBP | | | 2,000 | | | | 2,454,796 | |
Sr. Sec’d. Notes | | 5.000 | | 04/15/27 | | GBP | | | 700 | | | | 947,903 | |
Sr. Sec’d. Notes | | 5.250 | | 05/15/29 | | GBP | | | 500 | | | | 663,589 | |
See Notes to Financial Statements.
PGIM Strategic Bond Fund 37
Schedule of Investments (continued)
as of February 28, 2022
| | | | | | | | | | | | | | | | |
| | | | | |
| Description | | Interest
Rate | | Maturity Date | | | | | Principal
Amount (000)# | | | Value | |
| | | | | |
CORPORATE BONDS (Continued) | | | | | | | | | | | | | | | | |
| | | | | |
Media (cont’d.) | | | | | | | | | | | | | | | | |
Virgin Media Vendor Financing Notes III DAC (United Kingdom), | | | | | | | | | | | | | | | | |
Gtd. Notes, 144A | | 4.875% | | 07/15/28 | | | GBP | | | | 1,900 | | | $ | 2,391,058 | |
Ziggo BV (Netherlands), | | | | | | | | | | | | | | | | |
Sr. Sec’d. Notes | | 2.875 | | 01/15/30 | | | EUR | | | | 2,530 | | | | 2,622,289 | |
| | | | | | | | | | | | | | | | |
| | | | | |
| | | | | | | | | | | | | | | 42,328,833 | |
| | | | | |
Mining 1.2% | | | | | | | | | | | | | | | | |
AngloGold Ashanti Holdings PLC (Tanzania), | | | | | | | | | | | | | | | | |
Gtd. Notes | | 3.375 | | 11/01/28 | | | | | | | 1,405 | | | | 1,320,640 | |
First Quantum Minerals Ltd. (Zambia), | | | | | | | | | | | | | | | | |
Gtd. Notes, 144A | | 7.500 | | 04/01/25 | | | | | | | 4,600 | | | | 4,693,678 | |
Indonesia Asahan Aluminium Persero PT (Indonesia), | | | | | | | | | | | | | | | | |
Sr. Unsec’d. Notes(a) | | 6.530 | | 11/15/28 | | | | | | | 1,710 | | | | 1,935,165 | |
Newmont Corp., | | | | | | | | | | | | | | | | |
Gtd. Notes | | 2.800 | | 10/01/29 | | | | | | | 1,075 | | | | 1,051,298 | |
Novelis Corp., | | | | | | | | | | | | | | | | |
Gtd. Notes, 144A | | 3.250 | | 11/15/26 | | | | | | | 1,675 | | | | 1,598,685 | |
Teck Resources Ltd. (Canada), | | | | | | | | | | | | | | | | |
Sr. Unsec’d. Notes | | 6.000 | | 08/15/40 | | | | | | | 760 | | | | 899,618 | |
Vedanta Resources Finance II PLC (India), | | | | | | | | | | | | | | | | |
Gtd. Notes | | 13.875 | | 01/21/24 | | | | | | | 2,430 | | | | 2,469,420 | |
Yamana Gold, Inc. (Canada), | | | | | | | | | | | | | | | | |
Gtd. Notes | | 2.630 | | 08/15/31 | | | | | | | 5,000 | | | | 4,642,111 | |
| | | | | | | | | | | | | | | | |
| | | | | |
| | | | | | | | | | | | | | | 18,610,615 | |
| | | | | |
Oil & Gas 5.0% | | | | | | | | | | | | | | | | |
Aethon United BR LP/Aethon United Finance Corp., | | | | | | | | | | | | | | | | |
Sr. Unsec’d. Notes, 144A | | 8.250 | | 02/15/26 | | | | | | | 1,575 | | | | 1,664,969 | |
Aker BP ASA (Norway), | | | | | | | | | | | | | | | | |
Sr. Unsec’d. Notes, 144A | | 3.000 | | 01/15/25 | | | | | | | 2,700 | | | | 2,733,251 | |
Sr. Unsec’d. Notes, 144A | | 3.750 | | 01/15/30 | | | | | | | 150 | | | | 151,991 | |
Alta Mesa Holdings LP/Alta Mesa Finance Services Corp., | | | | | | | | | | | | | | | | |
Sr. Unsec’d. Notes^ | | 7.875 | | 12/15/24(d) | | | | | | | 2,950 | | | | 20,060 | |
Antero Resources Corp., | | | | | | | | | | | | | | | | |
Gtd. Notes, 144A | | 8.375 | | 07/15/26 | | | | | | | 974 | | | | 1,069,678 | |
Ascent Resources Utica Holdings LLC/ARU Finance Corp., | | | | | | | | | | | | | | | | |
Gtd. Notes, 144A | | 7.000 | | 11/01/26 | | | | | | | 1,525 | | | | 1,507,210 | |
See Notes to Financial Statements.
38
| | | | | | | | | | | | | | | | |
| | | | |
| Description | | Interest
Rate | | Maturity
Date | | Principal
Amount
(000)# | | | Value | |
| | | | | |
CORPORATE BONDS (Continued) | | | | | | | | | | | | | | | | |
| | | | | |
Oil & Gas (cont’d.) | | | | | | | | | | | | | | | | |
Ascent Resources Utica Holdings LLC/ARU Finance Corp., (cont’d.) | | | | | | | | | | | | | | |
Gtd. Notes, 144A | | 9.000% | | 11/01/27 | | | | | | | 1,104 | | | $ | 1,434,334 | |
Sr. Unsec’d. Notes, 144A | | 8.250 | | 12/31/28 | | | | | | | 2,325 | | | | 2,381,507 | |
BP Capital Markets PLC (United Kingdom), | | | | | | | | | | | | | | | | |
Gtd. Notes | | 4.375(ff) | | 06/22/25(oo) | | | | | | | 3,080 | | | | 3,065,828 | |
Cenovus Energy, Inc. (Canada), | | | | | | | | | | | | | | | | |
Sr. Unsec’d. Notes | | 4.250 | | 04/15/27 | | | | | | | 1,600 | | | | 1,697,678 | |
Sr. Unsec’d. Notes | | 4.400 | | 04/15/29 | | | | | | | 1,500 | | | | 1,598,339 | |
Chesapeake Energy Corp., | | | | | | | | | | | | | | | | |
Gtd. Notes, 144A | | 5.500 | | 02/01/26 | | | | | | | 475 | | | | 488,198 | |
Gtd. Notes, 144A | | 5.875 | | 02/01/29 | | | | | | | 425 | | | | 439,253 | |
Citgo Holding, Inc., | | | | | | | | | | | | | | | | |
Sr. Sec’d. Notes, 144A | | 9.250 | | 08/01/24 | | | | | | | 675 | | | | 674,941 | |
CITGO Petroleum Corp., | | | | | | | | | | | | | | | | |
Sr. Sec’d. Notes, 144A | | 7.000 | | 06/15/25 | | | | | | | 1,100 | | | | 1,102,819 | |
CNX Resources Corp., | | | | | | | | | | | | | | | | |
Gtd. Notes, 144A | | 7.250 | | 03/14/27 | | | | | | | 1,525 | | | | 1,612,491 | |
ConocoPhillips, | | | | | | | | | | | | | | | | |
Gtd. Notes, 144A(h) | | 4.300 | | 08/15/28 | | | | | | | 1,900 | | | | 2,081,921 | |
Continental Resources, Inc., | | | | | | | | | | | | | | | | |
Gtd. Notes | | 3.800 | | 06/01/24 | | | | | | | 2,282 | | | | 2,330,815 | |
Gtd. Notes | | 4.375 | | 01/15/28 | | | | | | | 600 | | | | 621,749 | |
Devon Energy Corp., | | | | | | | | | | | | | | | | |
Sr. Unsec’d. Notes | | 5.875 | | 06/15/28 | | | | | | | 1,105 | | | | 1,176,443 | |
Ecopetrol SA (Colombia), | | | | | | | | | | | | | | | | |
Sr. Unsec’d. Notes | | 4.625 | | 11/02/31 | | | | | | | 1,065 | | | | 956,058 | |
Sr. Unsec’d. Notes | | 6.875 | | 04/29/30 | | | | | | | 373 | | | | 390,945 | |
Endeavor Energy Resources LP/EER Finance, Inc., | | | | | | | | | | | | | | | | |
Sr. Unsec’d. Notes, 144A | | 5.750 | | 01/30/28 | | | | | | | 1,500 | | | | 1,554,711 | |
Sr. Unsec’d. Notes, 144A | | 6.625 | | 07/15/25 | | | | | | | 2,000 | | | | 2,089,844 | |
Energean Israel Finance Ltd. (Israel), | | | | | | | | | | | | | | | | |
Sr. Sec’d. Notes, 144A(a) | | 4.500 | | 03/30/24 | | | | | | | 2,000 | | | | 1,936,269 | |
Sr. Sec’d. Notes, 144A(a) | | 4.875 | | 03/30/26 | | | | | | | 1,992 | | | | 1,886,967 | |
Sr. Sec’d. Notes, 144A | | 5.375 | | 03/30/28 | | | | | | | 1,320 | | | | 1,240,137 | |
Gazprom PJSC Via Gaz Capital SA (Russia), | | | | | | | | | | | | | | | | |
Sr. Unsec’d. Notes, 144A | | 6.510 | | 03/07/22 | | | | | | | 100 | | | | 60,000 | |
Harvest Operations Corp. (South Korea), | | | | | | | | | | | | | | | | |
Gtd. Notes, 144A | | 4.200 | | 06/01/23 | | | | | | | 200 | | | | 205,662 | |
Hilcorp Energy I LP/Hilcorp Finance Co., | | | | | | | | | | | | | | | | |
Sr. Unsec’d. Notes, 144A | | 5.750 | | 02/01/29 | | | | | | | 675 | | | | 677,693 | |
Sr. Unsec’d. Notes, 144A | | 6.000 | | 02/01/31 | | | | | | | 675 | | | | 685,465 | |
Sr. Unsec’d. Notes, 144A | | 6.250 | | 11/01/28 | | | | | | | 700 | | | | 713,944 | |
See Notes to Financial Statements.
PGIM Strategic Bond Fund 39
Schedule of Investments (continued)
as of February 28, 2022
| | | | | | | | | | | | | | | | |
| | | | |
| Description | | Interest
Rate | | Maturity
Date | | Principal
Amount
(000)# | | | Value | |
| | | | | |
CORPORATE BONDS (Continued) | | | | | | | | | | | | | | | | |
| | | | | |
Oil & Gas (cont’d.) | | | | | | | | | | | | | | | | |
KazMunayGas National Co. JSC (Kazakhstan), | | | | | | | | | | | | | | | | |
Sr. Unsec’d. Notes, 144A | | 4.750% | | 04/24/25 | | | | | | | 2,380 | | | $ | 2,464,537 | |
Leviathan Bond Ltd. (Israel), | | | | | | | | | | | | | | | | |
Sr. Sec’d. Notes, 144A(a) | | 6.500 | | 06/30/27 | | | | | | | 1,900 | | | | 1,955,014 | |
Sr. Sec’d. Notes, 144A | | 6.750 | | 06/30/30 | | | | | | | 2,070 | | | | 2,100,325 | |
MEG Energy Corp. (Canada), | | | | | | | | | | | | | | | | |
Gtd. Notes, 144A | | 5.875 | | 02/01/29 | | | | | | | 1,800 | | | | 1,821,011 | |
Gtd. Notes, 144A | | 7.125 | | 02/01/27 | | | | | | | 1,400 | | | | 1,461,449 | |
Sec’d. Notes, 144A | | 6.500 | | 01/15/25 | | | | | | | 656 | | | | 665,841 | |
Nabors Industries, Inc., | | | | | | | | | | | | | | | | |
Gtd. Notes | | 5.750 | | 02/01/25 | | | | | | | 375 | | | | 359,293 | |
Ovintiv Exploration, Inc., | | | | | | | | | | | | | | | | |
Gtd. Notes(a) | | 5.375 | | 01/01/26 | | | | | | | 1,580 | | | | 1,707,940 | |
Petrobras Global Finance BV (Brazil), | | | | | | | | | | | | | | | | |
Gtd. Notes | | 5.375 | | 10/01/29 | | | GBP | | | | 350 | | | | 464,830 | |
Gtd. Notes(a) | | 5.600 | | 01/03/31 | | | | | | | 1,000 | | | | 997,674 | |
Gtd. Notes(a) | | 5.750 | | 02/01/29 | | | | | | | 613 | | | | 635,994 | |
Gtd. Notes | | 6.625 | | 01/16/34 | | | GBP | | | | 730 | | | | 1,016,977 | |
Gtd. Notes | | 7.375 | | 01/17/27 | | | | | | | 773 | | | | 869,705 | |
Gtd. Notes, EMTN | | 6.250 | | 12/14/26 | | | GBP | | | | 2,095 | | | | 2,957,253 | |
Petroleos Mexicanos (Mexico), | | | | | | | | | | | | | | | | |
Gtd. Notes | | 2.500 | | 11/24/22 | | | EUR | | | | 500 | | | | 562,816 | |
Gtd. Notes | | 4.750 | | 02/26/29 | | | EUR | | | | 800 | | | | 839,568 | |
Gtd. Notes | | 5.350 | | 02/12/28 | | | | | | | 241 | | | | 232,354 | |
Gtd. Notes | | 6.350 | | 02/12/48 | | | | | | | 276 | | | | 220,732 | |
Gtd. Notes | | 6.490 | | 01/23/27 | | | | | | | 1,006 | | | | 1,034,529 | |
Gtd. Notes | | 6.500 | | 03/13/27 | | | | | | | 5,732 | | | | 5,892,698 | |
Gtd. Notes | | 6.500 | | 01/23/29 | | | | | | | 100 | | | | 100,249 | |
Gtd. Notes | | 6.625 | | 06/15/35 | | | | | | | 400 | | | | 362,500 | |
Gtd. Notes | | 6.840 | | 01/23/30 | | | | | | | 100 | | | | 100,275 | |
Gtd. Notes | | 7.690 | | 01/23/50 | | | | | | | 2,325 | | | | 2,089,580 | |
Gtd. Notes, EMTN | | 1.875 | | 04/21/22 | | | EUR | | | | 500 | | | | 560,742 | |
Gtd. Notes, EMTN | | 3.750 | | 02/21/24 | | | EUR | | | | 1,220 | | | | 1,379,140 | |
Gtd. Notes, EMTN | | 3.750 | | 11/16/25 | | | GBP | | | | 400 | | | | 509,998 | |
Gtd. Notes, EMTN | | 4.875 | | 02/21/28 | | | EUR | | | | 1,680 | | | | 1,808,340 | |
Gtd. Notes, MTN | | 6.875 | | 08/04/26 | | | | | | | 630 | | | | 667,724 | |
Qatar Energy (Qatar), | | | | | | | | | | | | | | | | |
Sr. Unsec’d. Notes, 144A | | 3.125 | | 07/12/41 | | | | | | | 960 | | | | 920,238 | |
Sinopec Group Overseas Development 2013 Ltd. (China), | | | | | | | | | | | | | | | | |
Gtd. Notes | | 4.375 | | 10/17/23 | | | | | | | 200 | | | | 207,941 | |
See Notes to Financial Statements.
40
| | | | | | | | | | | | | | | | | | | | |
| | | | |
| Description | | Interest
Rate | | | Maturity
Date | | | Principal
Amount
(000)# | | | Value | |
| | | | | |
CORPORATE BONDS (Continued) | | | | | | | | | | | | | | | | | | | | |
| | | | | |
Oil & Gas (cont’d.) | | | | | | | | | | | | | | | | | | | | |
Transocean, Inc., | | | | | | | | | | | | | | | | | | | | |
Gtd. Notes, 144A | | | 7.250% | | | | 11/01/25 | | | | | | | | 700 | | | $ | 545,001 | |
Gtd. Notes, 144A | | | 8.000 | | | | 02/01/27 | | | | | | | | 600 | | | | 444,735 | |
Tullow Oil PLC (Ghana), | | | | | | | | | | | | | | | | | | | | |
Sr. Sec’d. Notes, 144A | | | 10.250 | | | | 05/15/26 | | | | | | | | 3,160 | | | | 3,090,747 | |
| | | | | | | | | | | | | | | | | | | | |
| | | | | |
| | | | | | | | | | | | | | | | | | | 81,298,920 | |
| | | | | |
Packaging & Containers 1.1% | | | | | | | | | | | | | | | | | | | | |
ARD Finance SA (Luxembourg), | | | | | | | | | | | | | | | | | | | | |
Sr. Sec’d. Notes, Cash coupon 5.000% or PIK 5.750% | | | 5.000 | | | | 06/30/27 | | | | EUR | | | | 1,708 | | | | 1,829,623 | |
Sr. Sec’d. Notes, 144A, Cash coupon 5.000% or PIK 5.750% | | | 5.000 | | | | 06/30/27 | | | | EUR | | | | 2,643 | | | | 2,830,530 | |
Ardagh Packaging Finance PLC/Ardagh Holdings USA, Inc., | | | | | | | | | | | | | | | | | | | | |
Sr. Sec’d. Notes(a) | | | 2.125 | | | | 08/15/26 | | | | EUR | | | | 4,000 | | | | 4,139,858 | |
Pactiv Evergreen Group Issuer LLC/Pactiv Evergreen Group Issuer, Inc., | | | | | | | | | | | | | | | | | | | | |
Sr. Sec’d. Notes, 144A | | | 4.375 | | | | 10/15/28 | | | | | | | | 1,000 | | | | 923,557 | |
Titan Holdings II BV (Netherlands), | | | | | | | | | | | | | | | | | | | | |
Sr. Unsec’d. Notes, 144A | | | 5.125 | | | | 07/15/29 | | | | EUR | | | | 4,200 | | | | 4,301,401 | |
Verallia SA (France), | | | | | | | | | | | | | | | | | | | | |
Gtd. Notes | | | 1.625 | | | | 05/14/28 | | | | EUR | | | | 4,000 | | | | 4,226,716 | |
| | | | | | | | | | | | | | | | | | | | |
| | | | | |
| | | | | | | | | | | | | | | | | | | 18,251,685 | |
| | | | | |
Pharmaceuticals 1.6% | | | | | | | | | | | | | | | | | | | | |
AbbVie, Inc., | | | | | | | | | | | | | | | | | | | | |
Sr. Unsec’d. Notes | | | 4.050 | | | | 11/21/39 | | | | | | | | 4,880 | | | | 5,123,229 | |
Sr. Unsec’d. Notes | | | 4.700 | | | | 05/14/45 | | | | | | | | 715 | | | | 794,619 | |
Sr. Unsec’d. Notes | | | 4.750 | | | | 03/15/45 | | | | | | | | 1,150 | | | | 1,278,953 | |
AdaptHealth LLC, | | | | | | | | | | | | | | | | | | | | |
Gtd. Notes, 144A(a) | | | 4.625 | | | | 08/01/29 | | | | | | | | 700 | | | | 631,781 | |
Bausch Health Americas, Inc., | | | | | | | | | | | | | | | | | | | | |
Gtd. Notes, 144A | | | 8.500 | | | | 01/31/27 | | | | | | | | 90 | | | | 91,136 | |
Bausch Health Cos., Inc., | | | | | | | | | | | | | | | | | | | | |
Gtd. Notes, 144A | | | 5.000 | | | | 01/30/28 | | | | | | | | 500 | | | | 418,569 | |
Gtd. Notes, 144A | | | 5.000 | | | | 02/15/29 | | | | | | | | 1,100 | | | | 890,713 | |
Gtd. Notes, 144A(a) | | | 5.250 | | | | 01/30/30 | | | | | | | | 500 | | | | 403,925 | |
Gtd. Notes, 144A(a) | | | 5.250 | | | | 02/15/31 | | | | | | | | 4,700 | | | | 3,736,500 | |
Gtd. Notes, 144A | | | 6.125 | | | | 04/15/25 | | | | | | | | 2,488 | | | | 2,513,179 | |
See Notes to Financial Statements.
PGIM Strategic Bond Fund 41
Schedule of Investments (continued)
as of February 28, 2022
| | | | | | | | | | | | |
| | | | |
| Description | | Interest
Rate | | Maturity
Date | | Principal
Amount
(000)# | | | Value | |
| | | | |
CORPORATE BONDS (Continued) | | | | | | | | | | | | |
| | | | |
Pharmaceuticals (cont’d.) | | | | | | | | | | | | |
Bausch Health Cos., Inc., (cont’d.) | | | | | | | | | | | | |
Gtd. Notes, 144A | | 6.250% | | 02/15/29 | | | 1,250 | | | $ | 1,065,189 | |
Gtd. Notes, 144A | | 7.000 | | 01/15/28 | | | 2,400 | | | | 2,196,940 | |
Sr. Sec’d. Notes, 144A | | 4.875 | | 06/01/28 | | | 1,075 | | | | 1,033,759 | |
Bristol-Myers Squibb Co., | | | | | | | | | | | | |
Sr. Unsec’d. Notes | | 4.125 | | 06/15/39 | | | 90 | | | | 98,681 | |
Sr. Unsec’d. Notes | | 4.350 | | 11/15/47 | | | 45 | | | | 51,051 | |
Sr. Unsec’d. Notes | | 5.000 | | 08/15/45 | | | 171 | | | | 211,569 | |
Cigna Corp., | | | | | | | | | | | | |
Gtd. Notes | | 3.400 | | 03/01/27 | | | 40 | | | | 41,444 | |
Gtd. Notes | | 4.375 | | 10/15/28 | | | 115 | | | | 124,651 | |
CVS Health Corp.,
Sr. Unsec’d. Notes | | 5.125 | | 07/20/45 | | | 25 | | | | 28,974 | |
Endo Dac/Endo Finance LLC/Endo Finco, Inc.,
Gtd. Notes, 144A(a) | | 6.000 | | 06/30/28 | | | 105 | | | | 69,496 | |
Mylan, Inc.,
Gtd. Notes(a) | | 5.400 | | 11/29/43 | | | 3,000 | | | | 3,340,665 | |
Organon & Co./Organon Foreign Debt Co-Issuer BV,
Sr. Unsec’d. Notes, 144A | | 5.125 | | 04/30/31 | | | 925 | | | | 923,889 | |
Viatris, Inc.,
Gtd. Notes(a) | | 4.000 | | 06/22/50 | | | 1,495 | | | | 1,323,418 | |
| | | | | | | | | | | | |
| | | | |
| | | | | | | | | | | 26,392,330 | |
| | | | |
Pipelines 1.3% | | | | | | | | | | | | |
AI Candelaria Spain SA (Colombia),
Sr. Sec’d. Notes, 144A | | 5.750 | | 06/15/33 | | | 2,720 | | | | 2,373,216 | |
Antero Midstream Partners LP/Antero Midstream Finance Corp., | | | | | | | | | | | | |
Gtd. Notes, 144A | | 5.750 | | 01/15/28 | | | 2,800 | | | | 2,836,691 | |
Energy Transfer LP, | | | | | | | | | | | | |
Jr. Sub. Notes, Series G | | 7.125(ff) | | 05/15/30(oo) | | | 2,900 | | | | 2,833,450 | |
Jr. Sub. Notes, Series H | | 6.500(ff) | | 11/15/26(oo) | | | 655 | | | | 645,561 | |
Sr. Unsec’d. Notes | | 5.000 | | 05/15/50 | | | 1,900 | | | | 1,979,680 | |
Sr. Unsec’d. Notes | | 5.300 | | 04/15/47 | | | 5 | | | | 5,241 | |
Sr. Unsec’d. Notes | | 6.250 | | 04/15/49 | | | 750 | | | | 875,608 | |
Enterprise Products Operating LLC, | | | | | | | | | | | | |
Gtd. Notes | | 4.200 | | 01/31/50 | | | 435 | | | | 436,890 | |
Gtd. Notes, Series D | | 4.875(ff) | | 08/16/77 | | | 400 | | | | 342,993 | |
ONEOK, Inc.,
Gtd. Notes | | 4.950 | | 07/13/47 | | | 25 | | | | 26,224 | |
See Notes to Financial Statements.
42
| | | | | | | | | | | | |
| | | | |
| Description | | Interest
Rate | | Maturity
Date | | Principal
Amount
(000)# | | | Value | |
| | | | |
CORPORATE BONDS (Continued) | | | | | | | | | | | | |
| | | | |
Pipelines (cont’d.) | | | | | | | | | | | | |
Plains All American Pipeline LP/PAA Finance Corp.,
Sr. Unsec’d. Notes | | 3.550% | | 12/15/29 | | | 1,600 | | | $ | 1,583,089 | |
Rockies Express Pipeline LLC, | | | | | | | | | | | | |
Sr. Unsec’d. Notes, 144A | | 3.600 | | 05/15/25 | | | 1,485 | | | | 1,456,453 | |
Sr. Unsec’d. Notes, 144A | | 6.875 | | 04/15/40 | | | 225 | | | | 228,809 | |
Tallgrass Energy Partners LP/Tallgrass Energy Finance Corp., | | | | | | | | | | | | |
Gtd. Notes, 144A | | 5.500 | | 01/15/28 | | | 1,800 | | | | 1,734,411 | |
Gtd. Notes, 144A | | 6.000 | | 12/31/30 | | | 2,150 | | | | 2,071,160 | |
Gtd. Notes, 144A | | 7.500 | | 10/01/25 | | | 1,250 | | | | 1,311,997 | |
Venture Global Calcasieu Pass LLC, | | | | | | | | | | | | |
Sr. Sec’d. Notes, 144A | | 3.875 | | 08/15/29 | | | 155 | | | | 152,042 | |
Sr. Sec’d. Notes, 144A | | 4.125 | | 08/15/31 | | | 155 | | | | 153,479 | |
Williams Cos., Inc. (The),
Sr. Unsec’d. Notes | | 4.900 | | 01/15/45 | | | 76 | | | | 81,861 | |
| | | | | | | | | | | | |
| | | | |
| | | | | | | | | | | 21,128,855 | |
| | | | |
Real Estate 0.6% | | | | | | | | | | | | |
Agile Group Holdings Ltd. (China),
Sr. Sec’d. Notes(a) | | 6.050 | | 10/13/25 | | | 2,085 | | | | 787,920 | |
Arabian Centres Sukuk Ltd. (Saudi Arabia),
Gtd. Notes, 144A | | 5.375 | | 11/26/24 | | | 1,655 | | | | 1,624,302 | |
Greystar Real Estate Partners LLC,
Sr. Sec’d. Notes, 144A | | 5.750 | | 12/01/25 | | | 1,350 | | | | 1,368,247 | |
Howard Hughes Corp. (The), | | | | | | | | | | | | |
Gtd. Notes, 144A | | 4.125 | | 02/01/29 | | | 4,000 | | | | 3,796,069 | |
Gtd. Notes, 144A | | 5.375 | | 08/01/28 | | | 920 | | | | 929,243 | |
Hunt Cos., Inc.,
Sr. Sec’d. Notes, 144A | | 5.250 | | 04/15/29 | | | 2,000 | | | | 1,916,517 | |
| | | | | | | | | | | | |
| | | | |
| | | | | | | | | | | 10,422,298 | |
| | | | |
Real Estate Investment Trusts (REITs) 0.8% | | | | | | | | | | | | |
Brixmor Operating Partnership LP,
Sr. Unsec’d. Notes | | 4.050 | | 07/01/30 | | | 1,590 | | | | 1,663,568 | |
Diversified Healthcare Trust, | | | | | | | | | | | | |
Gtd. Notes | | 4.375 | | 03/01/31 | | | 2,000 | | | | 1,730,328 | |
Gtd. Notes | | 9.750 | | 06/15/25 | | | 2,000 | | | | 2,114,963 | |
Sr. Unsec’d. Notes | | 4.750 | | 02/15/28 | | | 3,000 | | | | 2,720,899 | |
GLP Capital LP/GLP Financing II, Inc.,
Gtd. Notes | | 3.350 | | 09/01/24 | | | 745 | | | | 753,708 | |
See Notes to Financial Statements.
PGIM Strategic Bond Fund 43
Schedule of Investments (continued)
as of February 28, 2022
| | | | | | | | | | | | | | | | |
| | | | |
| Description | | Interest
Rate | | Maturity
Date | | Principal
Amount (000)# | | | Value | |
| | | | | |
CORPORATE BONDS (Continued) | | | | | | | | | | | | | | | | |
| | | | | |
Real Estate Investment Trusts (REITs) (cont’d.) | | | | | | | | | | | | | | | | |
Healthpeak Properties, Inc.,
Sr. Unsec’d. Notes | | 2.875% | | 01/15/31 | | | | | | | 505 | | | $ | 496,375 | |
MGM Growth Properties Operating Partnership LP/MGP Finance Co-Issuer, Inc., | | | | | | | | | | | | | | | | |
Gtd. Notes | | 4.500 | | 09/01/26 | | | | | | | 75 | | | | 76,483 | |
Gtd. Notes, 144A | | 4.625 | | 06/15/25 | | | | | | | 440 | | | | 455,600 | |
Park Intermediate Holdings LLC/PK Domestic Property LLC/PK Finance Co-Issuer, | | | | | | | | | | | | | | | | |
Sr. Sec’d. Notes, 144A | | 5.875 | | 10/01/28 | | | | | | | 1,025 | | | | 1,043,548 | |
Sr. Sec’d. Notes, 144A | | 7.500 | | 06/01/25 | | | | | | | 1,500 | | | | 1,568,194 | |
VICI Properties LP/VICI Note Co., Inc., | | | | | | | | | | | | | | | | |
Gtd. Notes, 144A | | 4.250 | | 12/01/26 | | | | | | | 345 | | | | 348,843 | |
Gtd. Notes, 144A | | 4.625 | | 12/01/29 | | | | | | | 285 | | | | 291,210 | |
| | | | | | | | | | | | | | | | |
| | | | | |
| | | | | | | | | | | | | | | 13,263,719 | |
| | | | | |
Retail 1.9% | | | | | | | | | | | | | | | | |
1011778 BC ULC/New Red Finance, Inc. (Canada),
Sec’d. Notes, 144A | | 4.000 | | 10/15/30 | | | | | | | 3,400 | | | | 3,139,080 | |
At Home Group, Inc.,
Sr. Sec’d. Notes, 144A | | 4.875 | | 07/15/28 | | | | | | | 550 | | | | 507,105 | |
AutoNation, Inc.,
Sr. Unsec’d. Notes | | 4.750 | | 06/01/30 | | | | | | | 1,880 | | | | 2,027,880 | |
Brinker International, Inc.,
Gtd. Notes, 144A | | 5.000 | | 10/01/24 | | | | | | | 4,400 | | | | 4,508,765 | |
Dollar Tree, Inc., | | | | | | | | | | | | | | | | |
Sr. Unsec’d. Notes(a) | | 4.200 | | 05/15/28 | | | | | | | 1,700 | | | | 1,816,887 | |
eG Global Finance PLC (United Kingdom), | | | | | | | | | | | | | | | | |
Sr. Sec’d. Notes(a) | | 4.375 | | 02/07/25 | | | EUR | | | | 900 | | | | 966,237 | |
Sr. Sec’d. Notes(a) | | 6.250 | | 10/30/25 | | | EUR | | | | 2,500 | | | | 2,754,070 | |
Sr. Sec’d. Notes, 144A | | 4.375 | | 02/07/25 | | | EUR | | | | 1,000 | | | | 1,073,597 | |
Falabella SA (Chile),
Sr. Unsec’d. Notes, 144A(a) | | 3.375 | | 01/15/32 | | | | | | | 2,305 | | | | 2,164,620 | |
Gap, Inc. (The), | | | | | | | | | | | | | | | | |
Gtd. Notes, 144A | | 3.625 | | 10/01/29 | | | | | | | 825 | | | | 748,094 | |
Gtd. Notes, 144A | | 3.875 | | 10/01/31 | | | | | | | 850 | | | | 762,721 | |
JSM Global Sarl (Brazil),
Gtd. Notes, 144A | | 4.750 | | 10/20/30 | | | | | | | 2,425 | | | | 2,127,948 | |
See Notes to Financial Statements.
44
| | | | | | | | | | | | | | | | | | |
| | | | | |
| Description | | Interest
Rate | | | Maturity
Date | | | | | Principal
Amount
(000)# | | | Value | |
| | | | | |
CORPORATE BONDS (Continued) | | | | | | | | | | | | | | | | | | |
| | | | | |
Retail (cont’d.) | | | | | | | | | | | | | | | | | | |
Sally Holdings LLC/Sally Capital, Inc.,
Gtd. Notes | | | 5.625% | | | 12/01/25 | | | | | | | 4,675 | | | $ | 4,737,696 | |
Suburban Propane Partners LP/Suburban Energy Finance Corp., Sr. Unsec’d. Notes | | | 5.875 | | | 03/01/27 | | | | | | | 2,675 | | | | 2,728,520 | |
| | | | | | | | | | | | | | | | | | |
| | | | | |
| | | | | | | | | | | | | | | | | 30,063,220 | |
| | | | | |
Semiconductors 0.1% | | | | | | | | | | | | | | | | | | |
NXP BV/NXP Funding LLC/NXP USA, Inc. (China), | | | | | | | | | | | | | | | | | | |
Gtd. Notes, 144A | | | 3.150 | | | 05/01/27 | | | | | | | 675 | | | | 683,977 | |
Gtd. Notes, 144A | | | 3.400 | | | 05/01/30 | | | | | | | 875 | | | | 882,686 | |
| | | | | | | | | | | | | | | | | | |
| | | | | |
| | | | | | | | | | | | | | | | | 1,566,663 | |
| | | | | |
Software 0.0% | | | | | | | | | | | | | | | | | | |
Microsoft Corp.,
Sr. Unsec’d. Notes | | | 2.525 | | | 06/01/50 | | | | | | | 25 | | | | 22,203 | |
| | | | | |
Telecommunications 4.1% | | | | | | | | | | | | | | | | | | |
Altice France Holding SA (Luxembourg), | | | | | | | | | | | | | | | | | | |
Gtd. Notes(a) | | | 4.000 | | | 02/15/28 | | | EUR | | | | 300 | | | | 297,692 | |
Gtd. Notes, 144A | | | 4.000 | | | 02/15/28 | | | EUR | | | | 1,000 | | | | 992,306 | |
Altice France SA (France), | | | | | | | | | | | | | | | | | | |
Sr. Sec’d. Notes | | | 3.375 | | | 01/15/28 | | | EUR | | | | 1,650 | | | | 1,684,836 | |
Sr. Sec’d. Notes, 144A | | | 2.500 | | | 01/15/25 | | | EUR | | | | 900 | | | | 964,028 | |
Sr. Sec’d. Notes, 144A | | | 3.375 | | | 01/15/28 | | | EUR | | | | 700 | | | | 714,779 | |
AT&T, Inc., | | | | | | | | | | | | | | | | | | |
Sr. Unsec’d. Notes | | | 2.550 | | | 12/01/33 | | | | | | | 28 | | | | 25,972 | |
Sr. Unsec’d. Notes | | | 3.500 | | | 09/15/53 | | | | | | | 1,073 | | | | 983,262 | |
Sr. Unsec’d. Notes(a) | | | 3.550 | | | 09/15/55 | | | | | | | 2,795 | | | | 2,534,932 | |
Sr. Unsec’d. Notes | | | 3.650 | | | 09/15/59 | | | | | | | 43 | | | | 39,030 | |
Sr. Unsec’d. Notes | | | 3.800 | | | 12/01/57 | | | | | | | 956 | | | | 899,603 | |
CT Trust (Guatemala),
Sr. Sec’d. Notes, 144A | | | 5.125 | | | 02/03/32 | | | | | | | 1,980 | | | | 1,985,065 | |
Digicel Group Holdings Ltd. (Jamaica),
Sr. Sec’d. Notes, Cash coupon 8.000% and PIK 2.000% | | | 10.000 | | | 04/01/24 | | | | | | | 1,114 | | | | 1,111,999 | |
Digicel International Finance Ltd./Digicel International Holdings Ltd. (Jamaica), Gtd. Notes, 144A | | | 8.000 | | | 12/31/26 | | | | | | | 550 | | | | 526,625 | |
See Notes to Financial Statements.
PGIM Strategic Bond Fund 45
Schedule of Investments (continued)
as of February 28, 2022
| | | | | | | | | | | | | | |
| | | | |
| Description | | Interest
Rate | | | Maturity
Date | | Principal
Amount
(000)# | | | Value | |
| | | | |
CORPORATE BONDS (Continued) | | | | | | | | | | | | | | |
| | | | |
Telecommunications (cont’d.) | | | | | | | | | | | | | | |
Digicel International Finance Ltd./Digicel International Holdings Ltd. (Jamaica), (cont’d.) | | | | | | | | | | | |
Gtd. Notes, 144A, Cash coupon 6.000% and PIK 7.000%(a) | | | 13.000 | % | | 12/31/25 | | | 2,142 | | | $ | 2,139,442 | |
Sr. Sec’d. Notes, 144A(a) | | | 8.750 | | | 05/25/24 | | | 6,000 | | | | 6,060,006 | |
Sr. Sec’d. Notes, 144A | | | 8.750 | | | 05/25/24 | | | 2,000 | | | | 2,023,616 | |
Digicel Ltd. (Jamaica), | | | | | | | | | | | | | | |
Gtd. Notes, 144A | | | 6.750 | | | 03/01/23 | | | 1,375 | | | | 1,295,810 | |
Iliad Holding SASU (France), | | | | | | | | | | | | | | |
Sr. Sec’d. Notes, 144A | | | 5.625 | | | 10/15/28 | | | EUR 5,700 | | | | 6,295,476 | |
Intelsat Jackson Holdings SA (Luxembourg), | | | | | | | | | | | | | | |
Sr. Sec’d. Notes, 144A | | | 6.500 | | | 03/15/30 | | | 2,800 | | | | 2,821,328 | |
Intelsat Jackson Holdings SA Escrow (Luxembourg), | | | | | | | | | | | | | | |
Sr. Unsec’d. Notes^ | | | 5.500 | | | 08/01/23(d) | | | 4,585 | | | | 5 | |
Sr. Unsec’d. Notes, 144A^ | | | 8.500 | | | 10/15/24(d) | | | 75 | | | | 0 | |
Sr. Unsec’d. Notes, 144A^ | | | 9.750 | | | 07/15/25(d) | | | 75 | | | | 0 | |
Kaixo Bondco Telecom SA (Spain), | | | | | | | | | | | | | | |
Sr. Unsec’d. Notes, 144A | | | 5.125 | | | 09/30/29 | | | EUR 5,350 | | | | 5,580,464 | |
Level 3 Financing, Inc., | | | | | | | | | | | | | | |
Sr. Sec’d. Notes, 144A | | | 3.400 | | | 03/01/27 | | | 3,000 | | | | 2,954,197 | |
Lumen Technologies, Inc., | | | | | | | | | | | | | | |
Sr. Unsec’d. Notes, Series P | | | 7.600 | | | 09/15/39 | | | 1,905 | | | | 1,676,603 | |
Matterhorn Telecom SA (Luxembourg), | | | | | | | | | | | | | | |
Sr. Sec’d. Notes | | | 3.125 | | | 09/15/26 | | | EUR 7,750 | | | | 8,233,479 | |
Millicom International Cellular SA (Colombia), | | | | | | | | | | | | | | |
Sr. Unsec’d. Notes, 144A | | | 4.500 | | | 04/27/31 | | | 720 | | | | 672,817 | |
Sprint Capital Corp., | | | | | | | | | | | | | | |
Gtd. Notes(a) | | | 8.750 | | | 03/15/32 | | | 3,000 | | | | 4,160,785 | |
Sprint Corp., | | | | | | | | | | | | | | |
Gtd. Notes | | | 7.875 | | | 09/15/23 | | | 1,000 | | | | 1,074,659 | |
Telefonica Emisiones SA (Spain), | | | | | | | | | | | | | | |
Gtd. Notes | | | 4.895 | | | 03/06/48 | | | 1,325 | | | | 1,382,671 | |
T-Mobile USA, Inc., | | | | | | | | | | | | | | |
Sr. Sec’d. Notes | | | 4.375 | | | 04/15/40 | | | 1,850 | | | | 1,924,745 | |
Total Play Telecomunicaciones SA de CV (Mexico), | | | | | | | | | | | | | | |
Gtd. Notes, 144A | | | 6.375 | | | 09/20/28 | | | 1,710 | | | | 1,551,329 | |
Verizon Communications, Inc., | | | | | | | | | | | | | | |
Sr. Unsec’d. Notes(h) | | | 3.400 | | | 03/22/41 | | | 4,330 | | | | 4,169,225 | |
| | | | | | | | | | | | | | |
| | | | |
| | | | | | | | | | | | | 66,776,786 | |
See Notes to Financial Statements.
46
| | | | | | | | | | | | |
| | | | |
| Description | | Interest
Rate | | Maturity
Date | | Principal
Amount
(000)# | | | Value | |
| | | | |
CORPORATE BONDS (Continued) | | | | | | | | | | | | |
| | | | |
Transportation 0.1% | | | | | | | | | | | | |
Indian Railway Finance Corp. Ltd. (India), | | | | | | | | | | | | |
Sr. Unsec’d. Notes, 144A, MTN | | 3.570% | | 01/21/32 | | | 705 | | | $ | 687,395 | |
Lima Metro Line 2 Finance Ltd. (Peru), | | | | | | | | | | | | |
Sr. Sec’d. Notes | | 5.875 | | 07/05/34 | | | 99 | | | | 108,189 | |
Pelabuhan Indonesia III Persero PT (Indonesia), | | | | | | | | | | | | |
Sr. Unsec’d. Notes | | 4.875 | | 10/01/24 | | | 650 | | | | 676,903 | |
| | | | | | | | | | | | |
| | | | |
| | | | | | | | | | | 1,472,487 | |
| | | | | | | | | | | | |
| | | | |
TOTAL CORPORATE BONDS
(cost $944,347,473) | | | | | | | | | | | 904,571,263 | |
| | | | | | | | | | | | |
| | | | |
MUNICIPAL BONDS 0.2% | | | | | | | | | | | | |
| | | | |
Illinois 0.1% | | | | | | | | | | | | |
State of Illinois, | | | | | | | | | | | | |
General Obligation Unlimited, Taxable, Pension | | 5.100 | | 06/01/33 | | | 1,210 | | | | 1,333,658 | |
| | | | |
Puerto Rico 0.1% | | | | | | | | | | | | |
Puerto Rico Sales Tax Financing Corp. Sales Tax Revenue, | | | | | | | | | | | | |
Revenue Bonds, Restructured, Series A-1 | | 4.750 | | 07/01/53 | | | 700 | | | | 771,708 | |
Revenue Bonds, Series A-1 | | 5.000 | | 07/01/58 | | | 1,780 | | | | 1,985,905 | |
| | | | | | | | | | | | |
| | | | |
| | | | | | | | | | | 2,757,613 | |
| | | | | | | | | | | | |
| | | | |
TOTAL MUNICIPAL BONDS
(cost $3,718,448) | | | | | | | | | | | 4,091,271 | |
| | | | | | | | | | | | |
| | | | |
RESIDENTIAL MORTGAGE-BACKED SECURITIES 9.4% | | | | | | | | | | | | |
Bellemeade Re Ltd. (Bermuda), | | | | | | | | | | | | |
Series 2018-03A, Class M1B, 144A, 1 Month LIBOR + 1.850% (Cap N/A, Floor 1.850%) | | 2.037(c) | | 10/25/28 | | | 169 | | | | 168,613 | |
Series 2019-02A, Class M1B, 144A, 1 Month LIBOR + 1.450% (Cap N/A, Floor 1.450%) | | 1.637(c) | | 04/25/29 | | | 124 | | | | 124,021 | |
Series 2019-03A, Class M1B, 144A, 1 Month LIBOR + 1.600% (Cap N/A, Floor 1.600%) | | 1.787(c) | | 07/25/29 | | | 1,019 | | | | 1,017,690 | |
Series 2019-04A, Class M1B, 144A, 1 Month LIBOR + 2.000% (Cap N/A, Floor 2.000%) | | 2.187(c) | | 10/25/29 | | | 2,432 | | | | 2,431,275 | |
Series 2020-02A, Class M1C, 144A, 1 Month LIBOR + 4.000% (Cap N/A, Floor 4.000%) | | 4.187(c) | | 08/26/30 | | | 694 | | | | 697,113 | |
Series 2020-04A, Class M2B, 144A, 1 Month LIBOR + 3.600% (Cap N/A, Floor 3.600%) | | 3.787(c) | | 06/25/30 | | | 5,664 | | | | 5,671,270 | |
See Notes to Financial Statements.
PGIM Strategic Bond Fund 47
Schedule of Investments (continued)
as of February 28, 2022
| | | | | | | | | | | | |
| | | | |
| Description | | Interest
Rate | | Maturity
Date | | Principal
Amount
(000)# | | | Value | |
| | | | |
RESIDENTIAL MORTGAGE-BACKED SECURITIES (Continued) | | | | | | | | | | | | |
Bellemeade Re Ltd. (Bermuda), (cont’d.) | | | | | | | | | | | | |
Series 2021-01A, Class M1C, 144A, 30 Day Average SOFR + 2.950% (Cap N/A, Floor 2.950%) | | 2.999%(c) | | 03/25/31 | | | 2,280 | | | $ | 2,267,585 | |
Series 2021-03A, Class M1B, 144A, 30 Day Average SOFR + 1.400% (Cap N/A, Floor 1.400%) | | 1.449(c) | | 09/25/31 | | | 900 | | | | 873,838 | |
BVRT Financing Trust, | | | | | | | | | | | | |
Series 2021-04, Class F, 144A, SOFR + 2.000%^ | | 2.048(c) | | 09/12/26 | | | 10,999 | | | | 10,998,621 | |
Central Park Funding Trust, | | | | | | | | | | | | |
Series 2021-01, Class PT, 144A, 1 Month LIBOR + 2.750% (Cap N/A, Floor 2.750%) | | 2.858(c) | | 08/29/22 | | | 6,632 | | | | 6,599,851 | |
Connecticut Avenue Securities Trust, | | | | | | | | | | | | |
Series 2019-R03, Class 1M2, 144A, 1 Month LIBOR + 2.150% (Cap N/A, Floor 0.000%) | | 2.337(c) | | 09/25/31 | | | 1,058 | | | | 1,060,993 | |
Series 2019-R07, Class 1M2, 144A, 1 Month LIBOR + 2.100% (Cap N/A, Floor 0.000%) | | 2.287(c) | | 10/25/39 | | | 454 | | | | 455,351 | |
Series 2020-R01, Class 1M2, 144A, 1 Month LIBOR + 2.050% (Cap N/A, Floor 2.050%) | | 2.237(c) | | 01/25/40 | | | 1,408 | | | | 1,405,959 | |
Series 2021-R01, Class 1B1, 144A, 30 Day Average SOFR + 3.100% (Cap N/A, Floor 0.000%) | | 3.149(c) | | 10/25/41 | | | 3,670 | | | | 3,455,170 | |
Eagle Re Ltd. (Bermuda), | | | | | | | | | | | | |
Series 2018-01, Class M1, 144A, 1 Month LIBOR + 1.700% (Cap N/A, Floor 1.700%) | | 1.887(c) | | 11/25/28 | | | 52 | | | | 51,517 | |
Series 2019-01, Class M1B, 144A, 1 Month LIBOR + 1.800% (Cap N/A, Floor 0.000%) | | 1.987(c) | | 04/25/29 | | | 90 | | | | 89,677 | |
Series 2020-02, Class M1C, 144A, 1 Month LIBOR + 4.500% (Cap N/A, Floor 0.000%) | | 4.687(c) | | 10/25/30 | | | 3 | | | | 3,171 | |
Series 2021-02, Class M1C, 144A, 30 Day Average SOFR + 3.450% (Cap N/A, Floor 3.450%) | | 3.499(c) | | 04/25/34 | | | 3,590 | | | | 3,487,548 | |
Fannie Mae Connecticut Avenue Securities, | | | | | | | | | | | | |
Series 2017-C07, Class 1M2, 1 Month LIBOR + 2.400% (Cap N/A, Floor 2.400%) | | 2.587(c) | | 05/25/30 | | | 629 | | | | 636,780 | |
Series 2018-C03, Class 1M2, 1 Month LIBOR + 2.150% (Cap N/A, Floor 2.150%) | | 2.337(c) | | 10/25/30 | | | 853 | | | | 863,952 | |
Fannie Mae Interest Strips, | | | | | | | | | | | | |
Series 422, Class C7, IO | | 3.500 | | 11/25/35 | | | 4,021 | | | | 538,128 | |
Fannie Mae REMICS, | | | | | | | | | | | | |
Series 2018-80, Class GC | | 3.500 | | 10/25/48 | | | 1,500 | | | | 1,584,159 | |
See Notes to Financial Statements.
48
| | | | | | | | | | | | |
| | | | |
| Description | | Interest
Rate | | Maturity
Date | | Principal
Amount
(000)# | | | Value | |
| | | | |
RESIDENTIAL MORTGAGE-BACKED SECURITIES (Continued) | | | | | | | | | | | | |
FHLMC Structured Agency Credit Risk Debt Notes, | | | | | | | | | | | | |
Series 2021-DNA02, Class B1, 144A, 30 Day Average SOFR + 3.400% (Cap N/A, Floor 0.000%) | | 3.449%(c) | | 08/25/33 | | | 6,150 | | | $ | 5,845,496 | |
Series 2021-DNA07, Class B1, 144A, 30 Day Average SOFR + 3.650% (Cap N/A, Floor 0.000%) | | 3.699(c) | | 11/25/41 | | | 2,250 | | | | 2,172,303 | |
FHLMC Structured Agency Credit Risk REMIC Trust, | | | | | | | | | | | | |
Series 2020-DNA03, Class B1, 144A, 1 Month LIBOR + 5.100% (Cap N/A, Floor 0.000%) | | 5.287(c) | | 06/25/50 | | | 615 | | | | 633,304 | |
Series 2020-DNA03, Class M2, 144A, 1 Month LIBOR + 3.000% (Cap N/A, Floor 0.000%) | | 3.187(c) | | 06/25/50 | | | 4 | | | | 4,464 | |
Series 2020-DNA04, Class B1, 144A, 1 Month LIBOR + 6.000% (Cap N/A, Floor 0.000%) | | 6.187(c) | | 08/25/50 | | | 4,190 | | | | 4,324,848 | |
Series 2020-DNA05, Class B1, 144A, 30 Day Average SOFR + 4.800% (Cap N/A, Floor 0.000%) | | 4.849(c) | | 10/25/50 | | | 630 | | | | 645,714 | |
Series 2020-DNA05, Class M2, 144A, 30 Day Average SOFR + 2.800% (Cap N/A, Floor 0.000%) | | 2.849(c) | | 10/25/50 | | | 289 | | | | 290,956 | |
Series 2020-DNA06, Class B1, 144A, 30 Day Average SOFR + 3.000% (Cap N/A, Floor 0.000%) | | 3.049(c) | | 12/25/50 | | | 3,240 | | | | 3,025,173 | |
Series 2020-HQA02, Class M2, 144A, 1 Month LIBOR + 3.100% (Cap N/A, Floor 0.000%) | | 3.287(c) | | 03/25/50 | | | 159 | | | | 160,193 | |
Series 2020-HQA03, Class M2, 144A, 1 Month LIBOR + 3.600% (Cap N/A, Floor 0.000%) | | 3.787(c) | | 07/25/50 | | | 921 | | | | 922,633 | |
Series 2020-HQA04, Class B1, 144A, 1 Month LIBOR + 5.250% (Cap N/A, Floor 0.000%) | | 5.437(c) | | 09/25/50 | | | 1,080 | | | | 1,112,415 | |
Series 2021-DNA05, Class B1, 144A, 30 Day Average SOFR + 3.050% (Cap N/A, Floor 0.000%) | | 3.099(c) | | 01/25/34 | | | 2,320 | | | | 2,204,297 | |
Series 2021-HQA03, Class B1, 144A, 30 Day Average SOFR + 3.350% (Cap N/A, Floor 0.000%) | | 3.399(c) | | 09/25/41 | | | 2,190 | | | | 2,059,151 | |
Government National Mortgage Assoc., | | | | | | | | | | | | |
Series 2016-69, Class B | | 3.000 | | 05/20/46 | | | 4,206 | | | | 4,297,228 | |
Series 2019-137, Class IO, IO | | 3.000 | | 11/20/49 | | | 5,535 | | | | 754,537 | |
Series 2019-159, Class IJ, IO | | 3.500 | | 12/20/49 | | | 990 | | | | 175,655 | |
Home Re Ltd. (Bermuda), | | | | | | | | | | | | |
Series 2018-01, Class M1, 144A, 1 Month LIBOR + 1.600% (Cap N/A, Floor 0.000%) | | 1.787(c) | | 10/25/28 | | | 53 | | | | 53,187 | |
Series 2019-01, Class M1, 144A, 1 Month LIBOR + 1.650% (Cap N/A, Floor 0.000%) | | 1.837(c) | | 05/25/29 | | | 138 | | | | 137,864 | |
See Notes to Financial Statements.
PGIM Strategic Bond Fund 49
Schedule of Investments (continued)
as of February 28, 2022
| | | | | | | | | | | | |
| | | | |
| Description | | Interest
Rate | | Maturity
Date | | Principal
Amount
(000)# | | | Value | |
| | | |
RESIDENTIAL MORTGAGE-BACKED SECURITIES (Continued) | | | | | | | | | | |
| | | | |
Legacy Mortgage Asset Trust, | | | | | | | | | | | | |
Series 2019-GS06, Class A1, 144A | | 3.000% | | 06/25/59 | | | 829 | | | $ | 828,361 | |
Series 2020-GS05, Class A1, 144A | | 3.250 | | 06/25/60 | | | 1,670 | | | | 1,676,396 | |
Series 2020-SL01, Class A, 144A | | 2.734 | | 01/25/60 | | | 2,115 | | | | 2,113,027 | |
Series 2021-SL01, Class A, 144A | | 1.991(cc) | | 09/25/60 | | | 1,487 | | | | 1,478,927 | |
| | | | |
Loan Revolving Advance Investment Trust, | | | | | | | | | | | | |
Series 2021-01, Class A1X, 144A, 1 Month LIBOR + 2.750% (Cap N/A, Floor 2.750%) | | 2.750(c) | | 12/31/22 | | | 267 | | | | 266,387 | |
Series 2021-02, Class A1X, 144A, 1 Month LIBOR + 2.750% (Cap N/A, Floor 2.750%) | | 2.840(c) | | 06/30/23 | | | 11,800 | | | | 11,765,527 | |
| | | | |
MRA Issuance Trust, | | | | | | | | | | | | |
Series 2020-07, Class A, 144A, 1 Month LIBOR + 1.300% (Cap N/A, Floor 1.600%) | | 1.406(c) | | 09/15/22 | | | 18,520 | | | | 18,507,269 | |
Series 2021-EBO03, Class A1X, 144A, 1 Month LIBOR + 1.750% (Cap N/A, Floor 1.750%) | | 1.849(c) | | 03/31/23 | | | 4,620 | | | | 4,617,242 | |
Series 2021-EBO03, Class A2, 144A, 1 Month LIBOR + 2.750% (Cap N/A, Floor 2.750%) | | 2.849(c) | | 03/31/23 | | | 5,330 | | | | 5,327,147 | |
Series 2021-EBO06, Class A1X, 144A, 1 Month LIBOR + 1.600% (Cap N/A, Floor 1.600%) | | 1.650(c) | | 03/02/22 | | | 6,560 | | | | 6,548,357 | |
| | | | |
New Residential Mortgage Loan Trust, | | | | | | | | | | | | |
Series 2018-04A, Class A1S, 144A, 1 Month LIBOR + 0.750% (Cap N/A, Floor 0.750%) | | 0.937(c) | | 01/25/48 | | | 157 | | | | 156,575 | |
| | | | |
Oaktown Re VII Ltd. (Bermuda), | | | | | | | | | | | | |
Series 2021-02, Class M1B, 144A, 30 Day Average SOFR + 2.900% (Cap N/A, Floor 2.900%) | | 2.949(c) | | 04/25/34 | | | 3,900 | | | | 3,792,700 | |
| | | | |
PMT Credit Risk Transfer Trust, | | | | | | | | | | | | |
Series 2020-02R, Class A, 144A, 1 Month LIBOR + 3.815% (Cap N/A, Floor 3.815%) | | 3.923(c) | | 12/25/22 | | | 4,018 | | | | 4,012,924 | |
Series 2021-01R, Class A, 144A, 1 Month LIBOR + 2.900% (Cap N/A, Floor 2.900%) | | 3.087(c) | | 02/27/24 | | | 6,503 | | | | 6,601,582 | |
| | | | |
PNMAC GMSR Issuer Trust, | | | | | | | | | | | | |
Series 2018-GT01, Class A, 144A, 1 Month LIBOR + 2.850% (Cap N/A, Floor 2.850%) | | 3.037(c) | | 02/25/23 | | | 1,720 | | | | 1,720,995 | |
Series 2018-GT02, Class A, 144A, 1 Month LIBOR + 2.650% (Cap N/A, Floor 0.000%) | | 2.837(c) | | 08/25/25 | | | 1,300 | | | | 1,301,018 | |
| | | | |
Radnor Re Ltd. (Bermuda), | | | | | | | | | | | | |
Series 2021-02, Class M1B, 144A, 30 Day Average SOFR + 3.700% (Cap N/A, Floor 3.700%) | | 3.749(c) | | 11/25/31 | | | 3,700 | | | | 3,643,254 | |
| | | | |
Retiro Mortgage Securities DAC (Ireland), | | | | | | | | | | | | |
Series 01A, Class A1, 144A, 3 Month EURIBOR + 2.000% (Cap 5.000%, Floor 0.000%) | | 1.453(c) | | 07/30/75 | | EUR | 2,689 | | | | 3,003,036 | |
See Notes to Financial Statements.
50
| | | | | | | | | | | | |
| | | | |
| Description | | Interest
Rate | | Maturity
Date | | Principal
Amount
(000)# | | | Value | |
| | | | |
RESIDENTIAL MORTGAGE-BACKED SECURITIES (Continued) | | | | | | | | | | | | |
| | | | |
TFS (Spain), | | | | | | | | | | | | |
Series 2018-03^ | | 0.000%(s) | | 04/16/40 | | EUR | — | (r) | | $ | 471 | |
Series 2018-03, Class A1, 1 Month EURIBOR + 3.000% | | 3.000(c) | | 04/16/23 | | EUR | 591 | | | | 596,391 | |
| | | | | | | | | | | | |
| | | | |
TOTAL RESIDENTIAL MORTGAGE-BACKED SECURITIES
(cost $152,519,970) | | | | | | | | | | | 151,259,286 | |
| | | | | | | | | | | | |
| | | | |
SOVEREIGN BONDS 3.6% | | | | | | | | | | | | |
1MDB Global Investments Ltd. (Malaysia), | | | | | | | | | | | | |
Sr. Unsec’d. Notes | | 4.400 | | 03/09/23 | | | 4,000 | | | | 3,891,614 | |
Angolan Government International Bond (Angola), | | | | | | | | | | | | |
Sr. Unsec’d. Notes | | 9.500 | | 11/12/25 | | | 2,360 | | | | 2,531,175 | |
Bermuda Government International Bond (Bermuda), | | | | | | | | | | | | |
Sr. Unsec’d. Notes, 144A | | 2.375 | | 08/20/30 | | | 735 | | | | 692,657 | |
Brazil Minas SPE via State of Minas Gerais (Brazil), | | | | | | | | | | | | |
Gov’t. Gtd. Notes | | 5.333 | | 02/15/28 | | | 2,118 | | | | 2,136,024 | |
Bulgaria Government International Bond (Bulgaria), | | | | | | | | | | | | |
Sr. Unsec’d. Notes(a) | | 1.375 | | 09/23/50 | | EUR | 1,690 | | | | 1,449,983 | |
Dominican Republic International Bond (Dominican Republic), | | | | | | | | | | | | |
Sr. Unsec’d. Notes, 144A | | 5.500 | | 02/22/29 | | | 3,095 | | | | 3,081,855 | |
Sr. Unsec’d. Notes, 144A(a) | | 5.950 | | 01/25/27 | | | 3,370 | | | | 3,504,380 | |
Hellenic Republic Government International Bond (Greece), | | | | | | | | | | | | |
Sr. Unsec’d. Notes | | 5.200 | | 07/17/34 | | EUR | 120 | | | | 161,479 | |
Hungary Government International Bond (Hungary), | | | | | | | | | | | | |
Sr. Unsec’d. Notes, 144A | | 3.125 | | 09/21/51 | | | 665 | | | | 553,101 | |
Indonesia Government International Bond (Indonesia), | | | | | | | | | | | | |
Sr. Unsec’d. Notes(a) | | 0.900 | | 02/14/27 | | EUR | 1,080 | | | | 1,150,403 | |
Sr. Unsec’d. Notes | | 1.100 | | 03/12/33 | | EUR | 615 | | | | 603,373 | |
Sr. Unsec’d. Notes | | 1.450 | | 09/18/26 | | EUR | 135 | | | | 149,341 | |
Sr. Unsec’d. Notes(a) | | 1.750 | | 04/24/25 | | EUR | 860 | | | | 970,897 | |
Sr. Unsec’d. Notes, EMTN | | 3.750 | | 06/14/28 | | EUR | 380 | | | | 464,534 | |
Ivory Coast Government International Bond (Ivory Coast), | | | | | | | | | | | | |
Sr. Unsec’d. Notes, 144A | | 5.125 | | 06/15/25 | | EUR | 1,670 | | | | 1,981,008 | |
Sr. Unsec’d. Notes, 144A | | 5.750 | | 12/31/32 | | | 782 | | | | 763,777 | |
Japan Finance Organization for Municipalities (Japan), | | | | | | | | | | | | |
Sr. Unsec’d. Notes, 144A, MTN | | 1.750 | | 09/05/24 | | | 200 | | | | 199,795 | |
Sr. Unsec’d. Notes, 144A, MTN | | 3.000 | | 03/12/24 | | | 200 | | | | 205,073 | |
See Notes to Financial Statements.
PGIM Strategic Bond Fund 51
Schedule of Investments (continued)
as of February 28, 2022
| | | | | | | | | | | | |
| | | | |
| Description | | Interest
Rate | | Maturity
Date | | Principal
Amount
(000)# | | | Value | |
| | | | |
SOVEREIGN BONDS (Continued) | | | | | | | | | | | | |
Lembaga Pembiayaan Ekspor Indonesia (Indonesia), | | | | | | | | | | | | |
Sr. Unsec’d. Notes, EMTN | | 3.875% | | 04/06/24 | | | 801 | | | $ | 815,238 | |
Nigeria Government International Bond (Nigeria), | | | | | | | | | | | | |
Sr. Unsec’d. Notes | | 7.625 | | 11/21/25 | | | 205 | | | | 217,294 | |
Sr. Unsec’d. Notes, 144A | | 7.625 | | 11/21/25 | | | 2,410 | | | | 2,554,532 | |
Oman Government International Bond (Oman), | | | | | | | | | | | | |
Sr. Unsec’d. Notes | | 3.875 | | 03/08/22 | | | 1,550 | | | | 1,550,063 | |
Pakistan Government International Bond (Pakistan), | | | | | | | | | | | | |
Sr. Unsec’d. Notes, 144A | | 8.250 | | 04/15/24 | | | 1,699 | | | | 1,723,977 | |
Sr. Unsec’d. Notes, 144A | | 8.250 | | 09/30/25 | | | 600 | | | | 607,132 | |
Qatar Government International Bond (Qatar), | | | | | | | | | | | | |
Sr. Unsec’d. Notes, 144A | | 5.103 | | 04/23/48 | | | 640 | | | | 807,896 | |
Republic of Italy Government International Bond (Italy), | | | | | | | | | | | | |
Sr. Unsec’d. Notes | | 2.875 | | 10/17/29 | | | 1,000 | | | | 986,130 | |
Sr. Unsec’d. Notes, EMTN | | 6.000 | | 08/04/28 | | GBP | 1,540 | | | | 2,483,051 | |
Sr. Unsec’d. Notes, MTN(a) | | 5.375 | | 06/15/33 | | | 3,300 | | | | 3,894,515 | |
Romanian Government International Bond (Romania), | | | | | | | | | | | | |
Sr. Unsec’d. Notes, 144A, MTN | | 3.875 | | 10/29/35 | | EUR | 3,103 | | | | 3,200,900 | |
Sr. Unsec’d. Notes, EMTN(a) | | 3.875 | | 10/29/35 | | EUR | 250 | | | | 257,888 | |
Sr. Unsec’d. Notes, EMTN | | 4.125 | | 03/11/39 | | EUR | 318 | | | | 328,200 | |
Sr. Unsec’d. Notes, EMTN | | 4.625 | | 04/03/49 | | EUR | 200 | | | | 212,887 | |
Saudi Government International Bond (Saudi Arabia), | | | | | | | | | | | | |
Sr. Unsec’d. Notes, 144A, MTN | | 4.000 | | 04/17/25 | | | 200 | | | | 210,637 | |
Serbia International Bond (Serbia), | | | | | | | | | | | | |
Sr. Unsec’d. Notes(a) | | 1.500 | | 06/26/29 | | EUR | 943 | | | | 901,802 | |
Sr. Unsec’d. Notes | | 3.125 | | 05/15/27 | | EUR | 2,391 | | | | 2,627,512 | |
Sr. Unsec’d. Notes, 144A | | 1.500 | | 06/26/29 | | EUR | 1,095 | | | | 1,047,161 | |
Sr. Unsec’d. Notes, 144A | | 1.650 | | 03/03/33 | | EUR | 2,110 | | | | 1,824,240 | |
Sr. Unsec’d. Notes, 144A | | 2.125 | | 12/01/30 | | | 508 | | | | 427,239 | |
Third Pakistan International Sukuk Co. Ltd. (The) (Pakistan), | | | | | | | | | | | | |
Sr. Unsec’d. Notes | | 5.625 | | 12/05/22 | | | 2,360 | | | | 2,372,290 | |
Ukraine Government International Bond (Ukraine), | | | | | | | | | | | | |
Sr. Unsec’d. Notes | | 7.750 | | 09/01/22 | | | 100 | | | | 50,652 | |
Sr. Unsec’d. Notes | | 7.750 | | 09/01/24 | | | 430 | | | | 147,015 | |
Sr. Unsec’d. Notes | | 8.994 | | 02/01/24 | | | 200 | | | | 70,274 | |
Sr. Unsec’d. Notes, 144A | | 4.375 | | 01/27/30 | | EUR | 2,355 | | | | 860,025 | |
Sr. Unsec’d. Notes, 144A | | 7.750 | | 09/01/22 | | | 3,550 | | | | 1,798,147 | |
Sr. Unsec’d. Notes, 144A | | 7.750 | | 09/01/23 | | | 520 | | | | 225,420 | |
See Notes to Financial Statements.
52
| | | | | | | | | | | | |
| | | | |
| Description | | Interest
Rate | | Maturity
Date | | Principal
Amount
(000)# | | | Value | |
| | | | |
SOVEREIGN BONDS (Continued) | | | | | | | | | | | | |
Ukraine Government International Bond (Ukraine), (cont’d.) | | | | | | | | | | | | |
Sr. Unsec’d. Notes, 144A | | 8.994% | | 02/01/24 | | | 650 | | | $ | 228,390 | |
Uruguay Government International Bond (Uruguay), | | | | | | | | | | | | |
Sr. Unsec’d. Notes | | 4.975 | | 04/20/55 | | | 500 | | | | 592,387 | |
| | | | | | | | | | | | |
| | | | |
TOTAL SOVEREIGN BONDS
(cost $66,197,768) | | | | | | | | | | | 57,513,363 | |
| | | | | | | | | | | | |
| | | | |
U.S. TREASURY OBLIGATIONS 3.3% | | | | | | | | | | | | |
U.S. Treasury Bonds | | 1.875 | | 11/15/51 | | | 490 | | | | 457,384 | |
U.S. Treasury Bonds(h) | | 2.000 | | 08/15/51 | | | 2,005 | | | | 1,924,800 | |
U.S. Treasury Bonds(h)(k) | | 2.250 | | 05/15/41 | | | 11,620 | | | | 11,590,950 | |
U.S. Treasury Bonds(k) | | 3.000 | | 11/15/44 | | | 165 | | | | 185,084 | |
U.S. Treasury Bonds(k) | | 3.000 | | 05/15/45 | | | 865 | | | | 971,908 | |
U.S. Treasury Bonds(k) | | 3.125 | | 02/15/43 | | | 4,825 | | | | 5,491,453 | |
U.S. Treasury Bonds(k) | | 3.625 | | 02/15/44 | | | 1,765 | | | | 2,167,089 | |
U.S. Treasury Notes(k) | | 2.125 | | 05/15/25 | | | 7,015 | | | | 7,112,552 | |
U.S. Treasury Notes(k) | | 2.250 | | 11/15/27 | | | 55 | | | | 56,345 | |
U.S. Treasury Notes(k) | | 2.375 | | 08/15/24 | | | 280 | | | | 285,316 | |
U.S. Treasury Strips Coupon | | 1.394(s) | | 11/15/41 | | | 525 | | | | 326,013 | |
U.S. Treasury Strips Coupon | | 1.450(s) | | 08/15/42 | | | 305 | | | | 185,192 | |
U.S. Treasury Strips Coupon(k)(v) | | 1.781(s) | | 08/15/40 | | | 12,460 | | | | 8,053,735 | |
U.S. Treasury Strips Coupon(v) | | 1.810(s) | | 02/15/40 | | | 4,360 | | | | 2,869,936 | |
U.S. Treasury Strips Coupon(k) | | 1.960(s) | | 05/15/41 | | | 785 | | | | 494,397 | |
U.S. Treasury Strips Coupon(k) | | 2.056(s) | | 11/15/38 | | | 110 | | | | 75,909 | |
U.S. Treasury Strips Coupon(k) | | 2.058(s) | | 02/15/39 | | | 1,200 | | | | 815,484 | |
U.S. Treasury Strips Coupon | | 2.071(s) | | 08/15/41 | | | 220 | | | | 137,551 | |
U.S. Treasury Strips Coupon(k)(v) | | 2.208(s) | | 05/15/39 | | | 2,435 | | | | 1,652,566 | |
U.S. Treasury Strips Coupon(k)(v) | | 2.340(s) | | 02/15/43 | | | 7,190 | | | | 4,312,315 | |
U.S. Treasury Strips Coupon(v) | | 2.394(s) | | 11/15/43 | | | 2,247 | | | | 1,321,605 | |
U.S. Treasury Strips Coupon | | 2.423(s) | | 11/15/40 | | | 640 | | | | 409,750 | |
U.S. Treasury Strips Coupon(v) | | 2.437(s) | | 05/15/44 | | | 2,230 | | | | 1,296,362 | |
U.S. Treasury Strips Principal | | 2.060(s) | | 11/15/44 | | | 1,145 | | | | 671,614 | |
| | | | | | | | | | | | |
| | | | |
TOTAL U.S. TREASURY OBLIGATIONS
(cost $54,873,029) | | | | | | | | | | | 52,865,310 | |
| | | | | | | | | | | | |
| | | | |
| | | | | | | Shares | | | | |
| | | | |
COMMON STOCKS 1.0% | | | | | | | | | | | | |
| | | | |
Chemicals 0.0% | | | | | | | | | | | | |
Hexion Holdings Corp. (Class B Stock)* | | | | | | | 1,179 | | | | 34,993 | |
See Notes to Financial Statements.
PGIM Strategic Bond Fund 53
Schedule of Investments (continued)
as of February 28, 2022
| | | | | | | | |
| | |
| Description | | Shares | | | Value | |
| | |
COMMON STOCKS (Continued) | | | | | | | | |
| | |
Diversified Telecommunication Services 0.1% | | | | | | | | |
Intelsat Emergence SA (Luxembourg) | | | 44,309 | | | $ | 1,509,275 | |
| | |
Electric Utilities 0.0% | | | | | | | | |
GenOn Energy Holdings, Inc. (Class A Stock) (original cost | | | | | | | | |
$81,798; purchased 02/28/19)*^(f) | | | 677 | | | | 94,780 | |
| | |
Entertainment 0.0% | | | | | | | | |
Codere New Topco SA (Spain)*^ | | | 12,376 | | | | — | |
| | |
Gas Utilities 0.2% | | | | | | | | |
Ferrellgas Partners LP (Class B Stock) | | | 14,838 | | | | 3,754,014 | |
| | |
Independent Power & Renewable Electricity Producers 0.0% | | | | | | | | |
Vistra Corp. | | | 10,516 | | | | 239,975 | |
| | |
Oil, Gas & Consumable Fuels 0.7% | | | | | | | | |
Chesapeake Energy Corp. | | | 134,120 | | | | �� 10,360,770 | |
Chesapeake Energy Corp. Backstop Commitment | | | 771 | | | | 59,560 | |
Civitas Resources, Inc. | | | 1,953 | | | | 98,568 | |
| | | | | | | | |
| | |
| | | | | | | 10,518,898 | |
| | | | | | | | |
| | |
TOTAL COMMON STOCKS | | | | | | | | |
(cost $6,177,938) | | | | | | | 16,151,935 | |
| | | | | | | | |
| | |
| | | Units | | | | |
| | |
RIGHTS* 0.0% | | | | | | | | |
| | |
Diversified Telecommunication Services | | | | | | | | |
Intelsat Jackson Holdings SA, Series A (Luxembourg), expiring 12/05/25^ | | | 4,639 | | | | 8,843 | |
Intelsat Jackson Holdings SA, Series B (Luxembourg), expiring 12/05/25^ | | | 4,639 | | | | 1,630 | |
| | | | | | | | |
| | |
TOTAL RIGHTS | | | | | | | | |
(cost $0) | | | | | | | 10,473 | |
| | | | | | | | |
See Notes to Financial Statements.
54
| | | | | | | | |
| | |
| Description | | Units | | | Value | |
| | |
WARRANTS* 0.0% | | | | | | | | |
| | |
Chemicals | | | | | | | | |
TPC Group, Inc., expiring 08/01/24 (original cost $0; purchased 02/02/21)^(f) | | | | | | | | |
(cost $0) | | | 1,488,709 | | | $ | 6,997 | |
| | | | | | | | |
| |
TOTAL LONG-TERM INVESTMENTS | | | | | |
(cost $1,669,591,202) | | | | | | | 1,619,027,609 | |
| | | | | | | | |
| | |
| | | Shares | | | | |
| | |
SHORT-TERM INVESTMENTS 8.4% | | | | | | | | |
| | |
AFFILIATED MUTUAL FUND 6.0% | | | | | | | | |
PGIM Institutional Money Market Fund | | | | | |
(cost $97,069,950; includes $97,064,422 of cash collateral for securities on loan)(b)(wa) | | | 97,152,673 | | | | 97,074,951 | |
| | | | | | | | |
| | |
UNAFFILIATED FUND 2.4% | | | | | | | | |
Dreyfus Government Cash Management (Institutional Shares) | |
(cost $38,353,180) | | | 38,353,180 | | | | 38,353,180 | |
| | | | | | | | |
| |
TOTAL SHORT-TERM INVESTMENTS | | | | | |
(cost $135,423,130) | | | | | | | 135,428,131 | |
| | | | | | | | |
| |
TOTAL INVESTMENTS, BEFORE OPTIONS WRITTEN 108.5% | | | | | |
(cost $1,805,014,332) | | | | | | | 1,754,455,740 | |
| | | | | | | | |
| |
OPTIONS WRITTEN*~ (0.0)% | | | | | |
(premiums received $232,448) | | | | (161,346 | ) |
| | | | | | | | |
| |
TOTAL INVESTMENTS, NET OF OPTIONS WRITTEN 108.5% | | | | | |
(cost $1,804,781,884) | | | | | | | 1,754,294,394 | |
Liabilities in excess of other assets(z) (8.5)% | | | | (137,379,133 | ) |
| | | | | | | | |
| | |
NET ASSETS 100.0% | | | | | | $ | 1,616,915,261 | |
| | | | | | | | |
Below is a list of the abbreviation(s) used in the annual report:
|
BRL—Brazilian Real |
CLP—Chilean Peso |
CNH—Chinese Renminbi |
COP—Colombian Peso |
CZK—Czech Koruna |
EUR—Euro |
GBP—British Pound |
HUF—Hungarian Forint |
IDR—Indonesian Rupiah |
ILS—Israeli Shekel |
See Notes to Financial Statements.
PGIM Strategic Bond Fund 55
Schedule of Investments (continued)
as of February 28, 2022
|
INR—Indian Rupee |
KRW—South Korean Won |
MXN—Mexican Peso |
NZD—New Zealand Dollar |
PEN—Peruvian Nuevo Sol |
PHP—Philippine Peso |
PLN—Polish Zloty |
RUB—Russian Ruble |
SGD—Singapore Dollar |
THB—Thai Baht |
TWD—New Taiwanese Dollar |
USD—US Dollar |
ZAR—South African Rand 144A—Security was purchased pursuant to Rule 144A under the Securities Act of 1933 and, pursuant to the requirements of Rule 144A, may not be resold except to qualified institutional buyers. |
A—Annual payment frequency for swaps |
BROIS—Brazil Overnight Index Swap |
BUBOR—Budapest Interbank Offered Rate |
CDX—Credit Derivative Index |
CLO—Collateralized Loan Obligation |
COOIS—Colombia Overnight Interbank Reference Rate |
CPI—Consumer Price Index |
EMTN—Euro Medium Term Note |
EURIBOR—Euro Interbank Offered Rate |
FHLMC—Federal Home Loan Mortgage Corporation |
GMTN—Global Medium Term Note |
IO—Interest Only (Principal amount represents notional) iTraxx—International Credit Derivative Index |
JIBAR—Johannesburg Interbank Agreed Rate |
LIBOR—London Interbank Offered Rate |
LP—Limited Partnership |
M—Monthly payment frequency for swaps |
MTN—Medium Term Note |
NSA—Non-Seasonally Adjusted |
OJSC—Open Joint-Stock Company |
OTC—Over-the-counter |
PIK—Payment-in-Kind |
PJSC—Public Joint-Stock Company |
Q—Quarterly payment frequency for swaps |
REITs—Real Estate Investment Trust |
REMICS—Real Estate Mortgage Investment Conduit Security |
S—Semiannual payment frequency for swaps |
SOFR—Secured Overnight Financing Rate |
SONIA—Sterling Overnight Index Average |
STRIPs—Separate Trading of Registered Interest and Principal of Securities |
T—Swap payment upon termination |
WIBOR—Warsaw Interbank Offered Rate |
| * | Non-income producing security. |
| # | Principal or notional amount is shown in U.S. dollars unless otherwise stated. |
| ~ | See tables subsequent to the Schedule of Investments for options detail. |
| ^ | Indicates a Level 3 instrument. The aggregate value of Level 3 instruments is $40,586,233 and 2.5% of net assets. |
See Notes to Financial Statements.
56
| (a) | All or a portion of security is on loan. The aggregate market value of such securities, including those sold and pending settlement, is $91,759,782; cash collateral of $97,064,422 (included in liabilities) was received with which the Fund purchased highly liquid short-term investments. In the event of significant appreciation in value of securities on loan on the last business day of the reporting period, the Fund may reflect a collateral value that is less than the market value of the loaned securities and such shortfall is remedied the following business day. |
| (b) | Represents security, or portion thereof, purchased with cash collateral received for securities on loan and includes dividend reinvestment. |
| (c) | Variable rate instrument. The interest rate shown reflects the rate in effect at February 28, 2022. |
| (cc) | Variable rate instrument. The rate shown is based on the latest available information as of February 28, 2022. Certain variable rate securities are not based on a published reference rate and spread but are determined by the issuer or agent and are based on current market conditions. These securities do not indicate a reference rate and spread in their description. |
| (d) | Represents issuer in default on interest payments and/or principal repayment. Non-income producing security. Such securities may be post-maturity. |
| (f) | Indicates a restricted security that is acquired in unregistered, private sales from the issuing company or from an affiliate of the issuer and is considered restricted as to disposition under federal securities law; the aggregate original cost of such securities is $2,605,803. The aggregate value of $1,912,030 is 0.1% of net assets. |
| (ff) | Variable rate security. Security may be issued at a fixed coupon rate, which converts to a variable rate at a specified date. Rate shown is the rate in effect as of period end. |
| (h) | Represents security, or a portion thereof, segregated as collateral for OTC derivatives. |
| (k) | Represents security, or a portion thereof, segregated as collateral for centrally cleared/exchange-traded derivatives. |
| (oo) | Perpetual security. Maturity date represents next call date. |
| (p) | Represents a security with a delayed settlement and therefore the interest rate is not available until settlement which is after the period end. |
| (r) | Principal or notional amount is less than $500 par. |
| (s) | Represents zero coupon bond or principal only security. Rate represents yield to maturity at purchase date. |
| (v) | Represents security, or a portion thereof, segregated as collateral for reverse repurchase agreements. |
| (wa) | PGIM Investments LLC, the manager of the Fund, also serves as manager of the PGIM Core Ultra Short Bond Fund and PGIM Institutional Money Market Fund, if applicable. |
| (z) | Includes net unrealized appreciation/(depreciation) and/or market value of the below holdings which are excluded from the Schedule of Investments: |
Options Written:
OTC Swaptions
| | | | | | | | | | | | | | | | | | |
Description | | Call/
Put | | Counterparty | | Expiration
Date | | Strike | | Receive | | Pay | | Notional
Amount
(000)# | | Value | |
GS_21-PJ2A††^ | | Put | | Goldman Sachs
International | | 11/15/24 | | 0.50% | | 0.50%(S) | | GS_21-PJ2A(M) | | 23,300 | | $ | (1,074 | ) |
GS_21-PJA††^ | | Put | | Goldman Sachs
International | | 06/17/24 | | 0.25% | | 0.25%(M) | | GS_21-PJA(M) | | 44,920 | | | (1,843 | ) |
iTraxx.XO.35.V1, 06/20/26 | | Put | | Barclays Bank
PLC | | 06/15/22 | | 7.00% | | 5.00%(Q) | | iTraxx.XO.35.V1(Q) | | EUR 31,090 | | | (88,665 | ) |
iTraxx.XO.36.V1, 12/20/26 | | Put | | Barclays Bank
PLC | | 09/21/22 | | 8.00% | | 5.00%(Q) | | iTraxx.XO.36.V1(Q) | | EUR 10,000 | | | (69,764 | ) |
| | | | | | | | | | | | | | | | | | |
Total Options Written (premiums received $232,448) | | | | | | $ | (161,346 | ) |
| | | | | | | | | | | | | | | | | | |
†† The value of the contracts, GS_21-PJA and GS_21-PJ2A, is derived from the pool of senior prime jumbo mortgages.
See Notes to Financial Statements.
PGIM Strategic Bond Fund 57
Schedule of Investments (continued)
as of February 28, 2022
Futures contracts outstanding at February 28, 2022:
| | | | | | | | | | | | | | | | | |
Number
of
Contracts | | Type | | Expiration
Date | | Current
Notional
Amount | | Value /
Unrealized
Appreciation
(Depreciation) |
| | |
Long Positions: | | | | | | | | | | | |
3,763 | | 5 Year U.S. Treasury Notes | | | | Jun. 2022 | | | | $ | 445,092,344 | | | | $ | 3,095,953 | |
69 | | 10 Year U.S. Treasury Notes | | | | Jun. 2022 | | | | | 8,793,187 | | | | | 76,935 | |
395 | | 10 Year U.S. Ultra Treasury Notes | | | | Jun. 2022 | | | | | 55,824,611 | | | | | 686,253 | |
324 | | 20 Year U.S. Treasury Bonds | | | | Jun. 2022 | | | | | 50,766,750 | | | | | 666,654 | |
128 | | 30 Year U.S. Ultra Treasury Bonds | | | | Jun. 2022 | | | | | 23,800,000 | | | | | 360,521 | |
| | | | | | | | | | | | | | | | | |
| | | | | | | | | | | | | | | | 4,886,316 | |
| | | | | | | | | | | | | | | | | |
| | |
Short Positions: | | | | | | | | | | | |
3,290 | | 2 Year U.S. Treasury Notes | | | | Jun. 2022 | | | | | 708,095,389 | | | | | (2,260,703 | ) |
391 | | 5 Year Euro-Bobl | | | | Mar. 2022 | | | | | 57,808,578 | | | | | 1,083,594 | |
313 | | 10 Year Euro-Bund | | | | Mar. 2022 | | | | | 58,622,897 | | | | | 2,514,477 | |
274 | | Euro Schatz Index | | | | Mar. 2022 | | | | | 34,405,848 | | | | | 69,764 | |
| | | | | | | | | | | | | | | | | |
| | | | | | | | | | | | | | | | 1,407,132 | |
| | | | | | | | | | | | | | | | | |
| | | | | | | | | | | | | | | $ | 6,293,448 | |
| | | | | | | | | | | | | | | | | |
Forward foreign currency exchange contracts outstanding at February 28, 2022:
| | | | | | | | | | | | | | | | | | | | | | |
| | | | | | |
Purchase Contracts | | Counterparty | | Notional
Amount
(000) | | | Value at
Settlement
Date | | | Current
Value | | | Unrealized
Appreciation | | | Unrealized
Depreciation | |
| | | |
OTC Forward Foreign Currency Exchange Contracts: | | | | | | | | | | | | | |
Brazilian Real, | | | | | | | | | | | | | | | | | | | | |
Expiring 03/03/22 | | Credit Suisse International | | BRL | 156,372 | | | $ | 28,808,866 | | | $ | 30,330,837 | | | $ | 1,521,971 | | | $ | — | |
Expiring 04/04/22 | | JPMorgan Chase Bank, N.A. | | BRL | 43,881 | | | | 8,596,184 | | | | 8,436,112 | | | | — | | | | (160,072 | ) |
Chilean Peso, | | | | | | | | | | | | | | | | | | | | |
Expiring 03/16/22 | | Morgan Stanley & Co. International PLC | | CLP | 1,259,805 | | | | 1,476,305 | | | | 1,573,275 | | | | 96,970 | | | | — | |
Expiring 03/16/22 | | UBS AG | | CLP | 2,558,430 | | | | 3,197,917 | | | | 3,195,029 | | | | — | | | | (2,888 | ) |
Expiring 03/16/22 | | UBS AG | | CLP | 1,549,453 | | | | 1,945,083 | | | | 1,934,995 | | | | — | | | | (10,088 | ) |
Chinese Renminbi, | | | | | | | | | | | | | | | | | | | | |
Expiring 05/23/22 | | Goldman Sachs International | | CNH | 20,181 | | | | 3,168,000 | | | | 3,177,029 | | | | 9,029 | | | | — | |
Expiring 05/23/22 | | HSBC Bank PLC | | CNH | 44,211 | | | | 6,951,000 | | | | 6,959,857 | | | | 8,857 | | | | — | |
Expiring 05/23/22 | | HSBC Bank PLC | | CNH | 43,659 | | | | 6,877,000 | | | | 6,873,021 | | | | — | | | | (3,979 | ) |
Expiring 05/23/22 | | HSBC Bank PLC | | CNH | 30,660 | | | | 4,810,000 | | | | 4,826,586 | | | | 16,586 | | | | — | |
Colombian Peso, | | | | | | | | | | | | | | | | | | | | |
Expiring 03/16/22 | | BNP Paribas S.A. | | COP | 18,578,059 | | | | 4,666,857 | | | | 4,710,754 | | | | 43,897 | | | | — | |
Expiring 03/16/22 | | UBS AG | | COP | 15,780,677 | | | | 3,937,000 | | | | 4,001,434 | | | | 64,434 | | | | — | |
Czech Koruna, | | | | | | | | | | | | | | | | | | | | |
Expiring 04/19/22 | | Barclays Bank PLC | | CZK | 164,045 | | | | 7,561,599 | | | | 7,271,935 | | | | — | | | | (289,664 | ) |
See Notes to Financial Statements.
58
Forward foreign currency exchange contracts outstanding at February 28, 2022 (continued):
| | | | | | | | | | | | | | | | | | | | | | |
Purchase Contracts | | Counterparty | | Notional
Amount
(000) | | | Value at
Settlement
Date | | | Current
Value | | | Unrealized
Appreciation | | | Unrealized
Depreciation | |
| | | |
OTC Forward Foreign Currency Exchange Contracts (cont’d.): | | | | | | | | | | | | | |
Czech Koruna (cont’d.), | | | | | | | | | | | | | | | | | | | | |
Expiring 04/19/22 | | Barclays Bank PLC | | CZK | 82,170 | | | $ | 3,811,000 | | | $ | 3,642,509 | | | $ | — | | | $ | (168,491 | ) |
Expiring 04/19/22 | | Citibank, N.A. | | CZK | 97,770 | | | | 4,452,000 | | | | 4,334,051 | | | | — | | | | (117,949 | ) |
Expiring 04/19/22 | | Morgan Stanley & Co. International PLC | | CZK | 124,601 | | | | 5,728,000 | | | | 5,523,431 | | | | — | | | | (204,569 | ) |
Expiring 04/19/22 | | UBS AG | | CZK | 83,233 | | | | 3,778,000 | | | | 3,689,647 | | | | — | | | | (88,353 | ) |
Expiring 04/19/22 | | UBS AG | | CZK | 81,449 | | | | 3,722,000 | | | | 3,610,522 | | | | — | | | | (111,478 | ) |
Euro, | | | | | | | | | | | | | | | | | | | | |
Expiring 04/19/22 | | Bank of America, N.A. | | EUR | 6,890 | | | | 7,767,489 | | | | 7,740,666 | | | | — | | | | (26,823 | ) |
Expiring 04/19/22 | | Citibank, N.A. | | EUR | 1,204 | | | | 1,367,000 | | | | 1,352,841 | | | | — | | | | (14,159 | ) |
Expiring 04/19/22 | | HSBC Bank PLC | | EUR | 2,000 | | | | 2,252,526 | | | | 2,246,928 | | | | — | | | | (5,598 | ) |
Expiring 04/19/22 | | JPMorgan Chase Bank, N.A. | | EUR | 1,780 | | | | 2,033,000 | | | | 1,999,322 | | | | — | | | | (33,678 | ) |
Expiring 04/19/22 | | Morgan Stanley & Co. International PLC | | EUR | 3,617 | | | | 4,074,000 | | | | 4,063,916 | | | | — | | | | (10,084 | ) |
Hungarian Forint, | | | | | | | | | | | | | | | | | | | | |
Expiring 04/19/22 | | BNP Paribas S.A. | | HUF | 3,131,958 | | | | 9,908,438 | | | | 9,394,052 | | | | — | | | | (514,386 | ) |
Expiring 04/19/22 | | Morgan Stanley & Co. International PLC | | HUF | 902,599 | | | | 2,891,000 | | | | 2,707,272 | | | | — | | | | (183,728 | ) |
Indian Rupee, | | | | | | | | | | | | | | | | | | | | |
Expiring 03/16/22 | | Citibank, N.A. | | INR | 383,609 | | | | 5,142,000 | | | | 5,080,303 | | | | — | | | | (61,697 | ) |
Expiring 03/16/22 | | Citibank, N.A. | | INR | 230,956 | | | | 3,079,000 | | | | 3,058,652 | | | | — | | | | (20,348 | ) |
Expiring 03/16/22 | | Goldman Sachs International | | INR | 254,413 | | | | 3,421,000 | | | | 3,369,306 | | | | — | | | | (51,694 | ) |
Expiring 03/16/22 | | HSBC Bank PLC | | INR | 289,618 | | | | 3,856,000 | | | | 3,835,543 | | | | — | | | | (20,457 | ) |
Expiring 03/16/22 | | JPMorgan Chase Bank, N.A. | | INR | 3,185,315 | | | | 41,908,177 | | | | 42,184,572 | | | | 276,395 | | | | — | |
Expiring 03/16/22 | | JPMorgan Chase Bank, N.A. | | INR | 329,432 | | | | 4,403,000 | | | | 4,362,824 | | | | — | | | | (40,176 | ) |
Expiring 03/16/22 | | JPMorgan Chase Bank, N.A. | | INR | 273,812 | | | | 3,665,000 | | | | 3,626,219 | | | | — | | | | (38,781 | ) |
Expiring 03/16/22 | | Morgan Stanley & Co. International PLC | | INR | 320,539 | | | | 4,287,000 | | | | 4,245,044 | | | | — | | | | (41,956 | ) |
Expiring 03/16/22 | | Standard Chartered Bank | | INR | 736,988 | | | | 9,857,000 | | | | 9,760,269 | | | | — | | | | (96,731 | ) |
Expiring 03/16/22 | | UBS AG | | INR | 190,253 | | | | 2,535,000 | | | | 2,519,607 | | | | — | | | | (15,393 | ) |
Indonesian Rupiah, | | | | | | | | | | | | | | | | | | | | |
Expiring 03/16/22 | | Bank of America, N.A. | | IDR | 55,072,062 | | | | 3,807,000 | | | | 3,826,751 | | | | 19,751 | | | | — | |
Expiring 03/16/22 | | JPMorgan Chase Bank, N.A. | | IDR | 189,563,555 | | | | 13,043,663 | | | | 13,172,060 | | | | 128,397 | | | | — | |
Expiring 03/16/22 | | JPMorgan Chase Bank, N.A. | | IDR | 54,053,656 | | | | 3,748,000 | | | | 3,755,986 | | | | 7,986 | | | | — | |
See Notes to Financial Statements.
PGIM Strategic Bond Fund 59
Schedule of Investments (continued)
as of February 28, 2022
Forward foreign currency exchange contracts outstanding at February 28, 2022 (continued):
| | | | | | | | | | | | | | | | | | | | | | |
Purchase Contracts | | Counterparty | | Notional
Amount
(000) | | | Value at
Settlement
Date | | | Current
Value | | | Unrealized
Appreciation | | | Unrealized
Depreciation | |
| | | |
OTC Forward Foreign Currency Exchange Contracts (cont’d.): | | | | | | | | | | | | | |
Indonesian Rupiah (cont’d.), | | | | | | | | | | | | | | | | | | | | |
Expiring 03/16/22 | | Morgan Stanley & Co. International PLC | | IDR | 47,821,968 | | | $ | 3,312,000 | | | $ | 3,322,969 | | | $ | 10,969 | | | $ | — | |
Expiring 03/16/22 | | Standard Chartered Bank | | IDR | 67,380,350 | | | | 4,663,000 | | | | 4,682,007 | | | | 19,007 | | | | — | |
Expiring 03/16/22 | | Standard Chartered Bank | | IDR | 64,912,605 | | | | 4,477,000 | | | | 4,510,533 | | | | 33,533 | | | | — | |
Expiring 03/16/22 | | Standard Chartered Bank | | IDR | 51,000,064 | | | | 3,526,000 | | | | 3,543,803 | | | | 17,803 | | | | — | |
Israeli Shekel, | | | | | | | | | | | | | | | | | | | | |
Expiring 03/16/22 | | Bank of America, N.A. | | ILS | 17,343 | | | | 5,437,000 | | | | 5,404,154 | | | | — | | | | (32,846 | ) |
Expiring 03/16/22 | | Bank of America, N.A. | | ILS | 15,491 | | | | 4,802,000 | | | | 4,827,006 | | | | 25,006 | | | | — | |
Expiring 03/16/22 | | Barclays Bank PLC | | ILS | 11,416 | | | | 3,583,000 | | | | 3,557,246 | | | | — | | | | (25,754 | ) |
Expiring 03/16/22 | | Citibank, N.A. | | ILS | 13,419 | | | | 4,156,000 | | | | 4,181,294 | | | | 25,294 | | | | — | |
Expiring 03/16/22 | | Citibank, N.A. | | ILS | 12,651 | | | | 4,086,000 | | | | 3,941,840 | | | | — | | | | (144,160 | ) |
Mexican Peso, | | | | | | | | | | | | | | | | | | | | |
Expiring 03/16/22 | | HSBC Bank PLC | | MXN | 87,574 | | | | 4,081,000 | | | | 4,263,941 | | | | 182,941 | | | | — | |
Expiring 03/16/22 | | JPMorgan Chase Bank, N.A. | | MXN | 72,962 | | | | 3,580,000 | | | | 3,552,508 | | | | — | | | | (27,492 | ) |
Expiring 03/16/22 | | Morgan Stanley & Co. International PLC | | MXN | 480,378 | | | | 22,159,712 | | | | 23,389,422 | | | | 1,229,710 | | | | — | |
Expiring 03/16/22 | | Morgan Stanley & Co. International PLC | | MXN | 402,567 | | | | 18,551,486 | | | | 19,600,836 | | | | 1,049,350 | | | | — | |
New Taiwanese Dollar, | | | | | | | | | | | | | | | | | | | | |
Expiring 03/16/22 | | Citibank, N.A. | | TWD | 172,342 | | | | 6,186,000 | | | | 6,152,021 | | | | — | | | | (33,979 | ) |
Expiring 03/16/22 | | Credit Suisse International | | TWD | 201,941 | | | | 7,274,000 | | | | 7,208,599 | | | | — | | | | (65,401 | ) |
Expiring 03/16/22 | | Credit Suisse International | | TWD | 150,324 | | | | 5,402,000 | | | | 5,366,061 | | | | — | | | | (35,939 | ) |
Expiring 03/16/22 | | HSBC Bank PLC | | TWD | 205,735 | | | | 7,404,000 | | | | 7,344,037 | | | | — | | | | (59,963 | ) |
Expiring 03/16/22 | | JPMorgan Chase Bank, N.A. | | TWD | 294,261 | | | | 10,604,000 | | | | 10,504,116 | | | | — | | | | (99,884 | ) |
Expiring 03/16/22 | | JPMorgan Chase Bank, N.A. | | TWD | 185,830 | | | | 6,673,000 | | | | 6,633,488 | | | | — | | | | (39,512 | ) |
Expiring 03/16/22 | | JPMorgan Chase Bank, N.A. | | TWD | 142,563 | | | | 5,141,000 | | | | 5,088,996 | | | | — | | | | (52,004 | ) |
New Zealand Dollar, | | | | | | | | | | | | | | | | | | | | |
Expiring 04/19/22 | | JPMorgan Chase Bank, N.A. | | NZD | 2,506 | | | | 1,695,633 | | | | 1,694,514 | | | | — | | | | (1,119 | ) |
Peruvian Nuevo Sol, | | | | | | | | | | | | | | | | | | | | |
Expiring 03/16/22 | | Citibank, N.A. | | PEN | 13,203 | | | | 3,552,000 | | | | 3,482,174 | | | | — | | | | (69,826 | ) |
Expiring 03/16/22 | | Citibank, N.A. | | PEN | 4,563 | | | | 1,223,040 | | | | 1,203,516 | | | | — | | | | (19,524 | ) |
See Notes to Financial Statements.
60
Forward foreign currency exchange contracts outstanding at February 28, 2022 (continued):
| | | | | | | | | | | | | | | | | | | | | | |
Purchase Contracts | | Counterparty | | Notional
Amount
(000) | | | Value at
Settlement
Date | | | Current
Value | | | Unrealized
Appreciation | | | Unrealized
Depreciation | |
| | | |
OTC Forward Foreign Currency Exchange Contracts (cont’d.): | | | | | | | | | | | | | |
Peruvian Nuevo Sol (cont’d.), | | | | | | | | | | | | | | | | | | | | |
Expiring 03/16/22 | | Goldman Sachs International | | PEN | 15,355 | | | $ | 3,982,000 | | | $ | 4,049,751 | | | $ | 67,751 | | | $ | — | |
Expiring 03/16/22 | | Standard Chartered Bank | | PEN | 5,519 | | | | 1,462,374 | | | | 1,455,552 | | | | — | | | | (6,822 | ) |
Expiring 03/16/22 | | Standard Chartered Bank | | PEN | 3,699 | | | | 983,610 | | | | 975,488 | | | | — | | | | (8,122 | ) |
Philippine Peso, | | | | | | | | | | | | | | | | | | | | |
Expiring 03/16/22 | | Citibank, N.A. | | PHP | 184,093 | | | | 3,544,000 | | | | 3,591,005 | | | | 47,005 | | | | — | |
Expiring 03/16/22 | | HSBC Bank PLC | | PHP | 285,299 | | | | 5,549,000 | | | | 5,565,175 | | | | 16,175 | | | | — | |
Expiring 03/16/22 | | JPMorgan Chase Bank, N.A. | | PHP | 409,187 | | | | 7,896,000 | | | | 7,981,781 | | | | 85,781 | | | | — | |
Expiring 03/16/22 | | JPMorgan Chase Bank, N.A. | | PHP | 391,819 | | | | 7,567,000 | | | | 7,643,008 | | | | 76,008 | | | | — | |
Expiring 03/16/22 | | JPMorgan Chase Bank, N.A. | | PHP | 388,634 | | | | 7,479,000 | | | | 7,580,865 | | | | 101,865 | | | | — | |
Expiring 03/16/22 | | JPMorgan Chase Bank, N.A. | | PHP | 382,277 | | | | 7,423,000 | | | | 7,456,873 | | | | 33,873 | | | | — | |
Expiring 03/16/22 | | JPMorgan Chase Bank, N.A. | | PHP | 339,951 | | | | 6,535,000 | | | | 6,631,235 | | | | 96,235 | | | | — | |
Expiring 03/16/22 | | JPMorgan Chase Bank, N.A. | | PHP | 244,856 | | | | 4,751,136 | | | | 4,776,274 | | | | 25,138 | | | | — | |
Expiring 03/16/22 | | Morgan Stanley & Co. International PLC | | PHP | 295,894 | | | | 5,831,000 | | | | 5,771,847 | | | | — | | | | (59,153 | ) |
Expiring 03/16/22 | | Standard Chartered Bank | | PHP | 293,983 | | | | 5,698,000 | | | | 5,734,561 | | | | 36,561 | | | | — | |
Expiring 03/16/22 | | Standard Chartered Bank | | PHP | 226,395 | | | | 4,472,000 | | | | 4,416,165 | | | | — | | | | (55,835 | ) |
Expiring 03/16/22 | | Standard Chartered Bank | | PHP | 220,332 | | | | 4,261,000 | | | | 4,297,899 | | | | 36,899 | | | | — | |
Polish Zloty, | | | | | | | | | | | | | | | | | | | | |
Expiring 04/19/22 | | HSBC Bank PLC | | PLN | 185,811 | | | | 46,786,121 | | | | 44,097,146 | | | | — | | | | (2,688,975 | ) |
Russian Ruble, | | | | | | | | | | | | | | | | | | | | |
Expiring 03/16/22 | | Barclays Bank PLC | | RUB | 213,214 | | | | 2,766,000 | | | | 1,962,623 | | | | — | | | | (803,377 | ) |
Expiring 03/16/22 | | Barclays Bank PLC | | RUB | 201,283 | | | | 2,604,000 | | | | 1,852,800 | | | | — | | | | (751,200 | ) |
Expiring 03/16/22 | | Credit Suisse International | | RUB | 264,145 | | | | 3,420,000 | | | | 2,431,445 | | | | — | | | | (988,555 | ) |
Expiring 03/16/22 | | Morgan Stanley & Co. International PLC | | RUB | 1,350,925 | | | | 17,611,375 | | | | 12,435,212 | | | | — | | | | (5,176,163 | ) |
Expiring 03/16/22 | | Morgan Stanley & Co. International PLC | | RUB | 274,522 | | | | 3,636,000 | | | | 2,526,962 | | | | — | | | | (1,109,038 | ) |
Expiring 03/16/22 | | Morgan Stanley & Co. International PLC | | RUB | 225,966 | | | | 2,994,000 | | | | 2,080,010 | | | | — | | | | (913,990 | ) |
See Notes to Financial Statements.
PGIM Strategic Bond Fund 61
Schedule of Investments (continued)
as of February 28, 2022
Forward foreign currency exchange contracts outstanding at February 28, 2022 (continued):
| | | | | | | | | | | | | | | | | | | | | | |
Purchase Contracts | | Counterparty | | Notional
Amount
(000) | | | Value at
Settlement
Date | | | Current
Value | | | Unrealized
Appreciation | | | Unrealized
Depreciation | |
| | | |
OTC Forward Foreign Currency Exchange Contracts (cont’d.): | | | | | | | | | | | | | |
Russian Ruble (cont’d.), | | | | | | | | | | | | | | | | | | | | |
Expiring 03/16/22 | | Morgan Stanley & Co. International PLC | | RUB | 218,839 | | | $ | 2,823,000 | | | $ | 2,014,405 | | | $ | — | | | $ | (808,595 | ) |
Expiring 03/16/22 | | Morgan Stanley & Co. International PLC | | RUB | 212,389 | | | | 2,764,000 | | | | 1,955,029 | | | | — | | | | (808,971 | ) |
Singapore Dollar, | | | | | | | | | | | | | | | | | | | | |
Expiring 03/16/22 | | Citibank, N.A. | | SGD | 7,796 | | | | 5,802,000 | | | | 5,750,038 | | | | — | | | | (51,962 | ) |
Expiring 03/16/22 | | Credit Suisse International | | SGD | 9,025 | | | | 6,723,000 | | | | 6,656,145 | | | | — | | | | (66,855 | ) |
Expiring 03/16/22 | | HSBC Bank PLC | | SGD | 9,593 | | | | 7,123,000 | | | | 7,075,310 | | | | — | | | | (47,690 | ) |
Expiring 03/16/22 | | HSBC Bank PLC | | SGD | 7,389 | | | | 5,495,000 | | | | 5,449,516 | | | | — | | | | (45,484 | ) |
Expiring 03/16/22 | | Morgan Stanley & Co. International PLC | | SGD | 8,310 | | | | 6,179,000 | | | | 6,128,857 | | | | — | | | | (50,143 | ) |
Expiring 03/16/22 | | Morgan Stanley & Co. International PLC | | SGD | 7,569 | | | | 5,626,000 | | | | 5,582,669 | | | | — | | | | (43,331 | ) |
Expiring 03/16/22 | | Standard Chartered Bank | | SGD | 11,149 | | | | 8,274,000 | | | | 8,222,839 | | | | — | | | | (51,161 | ) |
Expiring 03/16/22 | | UBS AG | | SGD | 9,545 | | | | 7,096,000 | | | | 7,040,153 | | | | — | | | | (55,847 | ) |
South African Rand, | | | | | | | | | | | | | | | | | | | | |
Expiring 03/16/22 | | Barclays Bank PLC | | ZAR | 61,186 | | | | 3,794,000 | | | | 3,970,942 | | | | 176,942 | | | | — | |
Expiring 03/16/22 | | Barclays Bank PLC | | ZAR | 58,516 | | | | 3,646,000 | | | | 3,797,642 | | | | 151,642 | | | | — | |
Expiring 03/16/22 | | Barclays Bank PLC | | ZAR | 48,245 | | | | 2,991,000 | | | | 3,131,113 | | | | 140,113 | | | | — | |
Expiring 03/16/22 | | Barclays Bank PLC | | ZAR | 47,835 | | | | 2,980,000 | | | | 3,104,463 | | | | 124,463 | | | | — | |
Expiring 03/16/22 | | JPMorgan Chase Bank, N.A. | | ZAR | 60,180 | | | | 3,952,000 | | | | 3,905,673 | | | | — | | | | (46,327 | ) |
Expiring 03/16/22 | | Morgan Stanley & Co. International PLC | | ZAR | 60,020 | | | | 3,865,000 | | | | 3,895,250 | | | | 30,250 | | | | — | |
Expiring 03/16/22 | | The Toronto-Dominion Bank | | ZAR | 64,116 | | | | 3,954,000 | | | | 4,161,114 | | | | 207,114 | | | | — | |
Expiring 03/16/22 | | The Toronto-Dominion Bank | | ZAR | 43,560 | | | | 2,720,720 | | | | 2,827,029 | | | | 106,309 | | | | — | |
South Korean Won, | | | | | | | | | | | | | | | | | | | | |
Expiring 03/16/22 | | Citibank, N.A. | | KRW | 4,625,174 | | | | 3,838,000 | | | | 3,845,131 | | | | 7,131 | | | | — | |
Expiring 03/16/22 | | Credit Suisse International | | KRW | 6,765,824 | | | | 5,687,000 | | | | 5,624,757 | | | | — | | | | (62,243 | ) |
Expiring 03/16/22 | | Credit Suisse International | | KRW | 6,344,355 | | | | 5,298,000 | | | | 5,274,370 | | | | — | | | | (23,630 | ) |
Expiring 03/16/22 | | HSBC Bank PLC | | KRW | 4,284,417 | | | | 3,565,000 | | | | 3,561,844 | | | | — | | | | (3,156 | ) |
Expiring 03/16/22 | | Morgan Stanley & Co. International PLC | | KRW | 6,279,230 | | | | 5,234,000 | | | | 5,220,228 | | | | — | | | | (13,772 | ) |
Expiring 03/16/22 | | Standard Chartered Bank | | KRW | 9,340,868 | | | | 7,747,000 | | | | 7,765,516 | | | | 18,516 | | | | — | |
See Notes to Financial Statements.
62
Forward foreign currency exchange contracts outstanding at February 28, 2022 (continued):
| | | | | | | | | | | | | | | | | | | | | | |
Purchase Contracts | | Counterparty | | Notional
Amount
(000) | | | Value at
Settlement
Date | | | Current
Value | | | Unrealized
Appreciation | | | Unrealized
Depreciation | |
| | | |
OTC Forward Foreign Currency Exchange Contracts (cont’d.): | | | | | | | | | | | | | |
South Korean Won (cont’d.), | | | | | | | | | | | | | | | | | | | | |
Expiring 03/16/22 | | Standard Chartered Bank | | KRW | 6,873,939 | | | $ | 5,718,000 | | | $ | 5,714,639 | | | $ | — | | | $ | (3,361 | ) |
Thai Baht, | | | | | | | | | | | | | | | | | | | | |
Expiring 03/16/22 | | Citibank, N.A. | | THB | 272,695 | | | | 8,210,000 | | | | 8,345,889 | | | | 135,889 | | | | — | |
Expiring 03/16/22 | | HSBC Bank PLC | | THB | 232,792 | | | | 6,994,000 | | | | 7,124,639 | | | | 130,639 | | | | — | |
Expiring 03/16/22 | | HSBC Bank PLC | | THB | 157,695 | | | | 4,716,000 | | | | 4,826,302 | | | | 110,302 | | | | — | |
Expiring 03/16/22 | | HSBC Bank PLC | | THB | 116,554 | | | | 3,489,000 | | | | 3,567,144 | | | | 78,144 | | | | — | |
Expiring 03/16/22 | | JPMorgan Chase Bank, N.A. | | THB | 186,696 | | | | 5,583,000 | | | | 5,713,853 | | | | 130,853 | | | | — | |
Expiring 03/16/22 | | Morgan Stanley & Co. International PLC | | THB | 152,426 | | | | 4,587,000 | | | | 4,665,028 | | | | 78,028 | | | | — | |
Expiring 03/16/22 | | Morgan Stanley & Co. International PLC | | THB | 138,471 | | | | 4,153,000 | | | | 4,237,945 | | | | 84,945 | | | | — | |
Expiring 03/16/22 | | Standard Chartered Bank | | THB | 152,493 | | | | 4,525,000 | | | | 4,667,063 | | | | 142,063 | | | | — | |
| | | | | | | | | | | | | | | | | | | | | | |
| | | | | | | | $ | 700,504,311 | | | $ | 689,984,450 | | | | 7,264,520 | | | | (17,784,381 | ) |
| | | | | | | | | | | | | | | | | | | | | | |
| | | | | | | | | | | | | | | | | | | | | | |
Sale
Contracts | | Counterparty | | Notional
Amount
(000) | | | Value at
Settlement
Date | | | Current
Value | | | Unrealized
Appreciation | | | Unrealized
Depreciation | |
| | | |
OTC Forward Foreign Currency Exchange Contracts: | | | | | | | | | | | | | |
Brazilian Real, | | | | | | | | | | | | | | | | | | | | |
Expiring 03/03/22 | | Citibank, N.A. | | BRL | 32,317 | | | $ | 5,956,000 | | | $ | 6,268,408 | | | $ | — | | | $ | (312,408 | ) |
Expiring 03/03/22 | | Credit Suisse International | | BRL | 24,242 | | | | 4,689,000 | | | | 4,702,040 | | | | — | | | | (13,040 | ) |
Expiring 03/03/22 | | Credit Suisse International | | BRL | 18,152 | | | | 3,419,000 | | | | 3,520,891 | | | | — | | | | (101,891 | ) |
Expiring 03/03/22 | | Goldman Sachs International | | BRL | 14,854 | | | | 2,845,000 | | | | 2,881,147 | | | | — | | | | (36,147 | ) |
Expiring 03/03/22 | | JPMorgan Chase Bank, N.A. | | BRL | 43,881 | | | | 8,672,122 | | | | 8,511,386 | | | | 160,736 | | | | — | |
Expiring 03/03/22 | | JPMorgan Chase Bank, N.A. | | BRL | 22,927 | | | | 4,305,000 | | | | 4,446,964 | | | | — | | | | (141,964 | ) |
Expiring 04/04/22 | | Morgan Stanley & Co. International PLC | | BRL | 7,543 | | | | 1,492,919 | | | | 1,450,211 | | | | 42,708 | | | | — | |
British Pound, | | | | | | | | | | | | | | | | | | | | |
Expiring 04/19/22 | | Standard Chartered Bank | | GBP | 37,652 | | | | 51,336,799 | | | | 50,522,020 | | | | 814,779 | | | | — | |
See Notes to Financial Statements.
PGIM Strategic Bond Fund 63
Schedule of Investments (continued)
as of February 28, 2022
Forward foreign currency exchange contracts outstanding at February 28, 2022 (continued):
| | | | | | | | | | | | | | | | | | | | | | |
Sale Contracts | | Counterparty | | Notional
Amount
(000) | | | Value at
Settlement
Date | | | Current
Value | | | Unrealized
Appreciation | | | Unrealized
Depreciation | |
OTC Forward Foreign Currency Exchange Contracts (cont’d.): | |
Chilean Peso, | | | | | | | | | | | | | | | | | | |
Expiring 03/16/22 | | Citibank, N.A. | | CLP | 3,256,915 | | | $ | 4,056,338 | | | $ | 4,067,315 | | | $ | — | | | $ | (10,977 | ) |
Expiring 03/16/22 | | Morgan Stanley & Co. International PLC | | CLP | 2,170,620 | | | | 2,674,000 | | | | 2,710,722 | | | | — | | | | (36,722 | ) |
Chinese Renminbi, | | | | | | | | | | | | | | | | | | |
Expiring 05/23/22 | | JPMorgan Chase Bank, N.A. | | CNH | 365,910 | | | | 57,290,777 | | | | 57,602,871 | | | | — | | | | (312,094 | ) |
Colombian Peso, | | | | | | | | | | | | | | | | | | |
Expiring 03/16/22 | | Goldman Sachs International | | COP | 7,592,264 | | | | 1,907,844 | | | | 1,925,136 | | | | — | | | | (17,292 | ) |
Czech Koruna, | | | | | | | | | | | | | | | | | | |
Expiring 04/19/22 | | Barclays Bank PLC | | CZK | 83,370 | | | | 3,886,000 | | | | 3,695,709 | | | | 190,291 | | | | — | |
Expiring 04/19/22 | | Barclays Bank PLC | | CZK | 75,219 | | | | 3,459,000 | | | | 3,334,392 | | | | 124,608 | | | | — | |
Expiring 04/19/22 | | Barclays Bank PLC | | CZK | 56,525 | | | | 2,617,000 | | | | 2,505,671 | | | | 111,329 | | | | — | |
Expiring 04/19/22 | | Citibank, N.A. | | CZK | 117,032 | | | | 5,336,000 | | | | 5,187,913 | | | | 148,087 | | | | — | |
Expiring 04/19/22 | | Citibank, N.A. | | CZK | 82,639 | | | | 3,745,000 | | | | 3,663,279 | | | | 81,721 | | | | — | |
Expiring 04/19/22 | | JPMorgan Chase Bank, N.A. | | CZK | 74,464 | | | | 3,309,000 | | | | 3,300,909 | | | | 8,091 | | | | — | |
Euro, | | | | | | | | | | | | | | | | | | |
Expiring 04/19/22 | | BNP Paribas S.A. | | EUR | 76,937 | | | | 87,607,173 | | | | 86,435,793 | | | | 1,171,380 | | | | — | |
Expiring 04/19/22 | | HSBC Bank PLC | | EUR | 108 | | | | 123,975 | | | | 121,778 | | | | 2,197 | | | | — | |
Expiring 04/19/22 | | Morgan Stanley & Co. International PLC | | EUR | 53 | | | | 60,366 | | | | 59,166 | | | | 1,200 | | | | — | |
Expiring 04/19/22 | | Standard Chartered Bank | | EUR | 88,220 | | | | 101,387,314 | | | | 99,111,582 | | | | 2,275,732 | | | | — | |
Expiring 04/19/22 | | UBS AG | | EUR | 51,812 | | | | 59,443,173 | | | | 58,208,390 | | | | 1,234,783 | | | | — | |
Hungarian Forint, | | | | | | | | | | | | | | | | | | |
Expiring 04/19/22 | | BNP Paribas S.A. | | HUF | 1,708,956 | | | | 5,411,600 | | | | 5,125,874 | | | | 285,726 | | | | — | |
Expiring 04/19/22 | | BNP Paribas S.A. | | HUF | 1,462,706 | | | | 4,627,000 | | | | 4,387,266 | | | | 239,734 | | | | — | |
Expiring 04/19/22 | | BNP Paribas S.A. | | HUF | 895,959 | | | | 2,787,200 | | | | 2,687,357 | | | | 99,843 | | | | — | |
Expiring 04/19/22 | | Citibank, N.A. | | HUF | 835,753 | | | | 2,509,000 | | | | 2,506,772 | | | | 2,228 | | | | — | |
Expiring 04/19/22 | | HSBC Bank PLC | | HUF | 1,128,437 | | | | 3,542,000 | | | | 3,384,654 | | | | 157,346 | | | | — | |
Expiring 04/19/22 | | Morgan Stanley & Co. International PLC | | HUF | 834,436 | | | | 2,572,800 | | | | 2,502,823 | | | | 69,977 | | | | — | |
Expiring 04/19/22 | | UBS AG | | HUF | 902,223 | | | | 2,751,000 | | | | 2,706,144 | | | | 44,856 | | | | — | |
See Notes to Financial Statements.
64
Forward foreign currency exchange contracts outstanding at February 28, 2022 (continued):
| | | | | | | | | | | | | | | | | | | | | | |
Sale Contracts | | Counterparty | | Notional
Amount
(000) | | | Value at
Settlement
Date | | | Current
Value | | | Unrealized
Appreciation | | | Unrealized
Depreciation | |
|
OTC Forward Foreign Currency Exchange Contracts (cont’d.): | |
Indian Rupee, | | | | | | | | | | | | | | | | | | |
Expiring 03/16/22 | | Credit Suisse International | | INR | 329,033 | | | $ | 4,312,000 | | | $ | 4,357,536 | | | $ | — | | | $ | (45,536 | ) |
Expiring 03/16/22 | | Goldman Sachs International | | INR | 526,472 | | | | 6,914,891 | | | | 6,972,310 | | | | — | | | | (57,419 | ) |
Expiring 03/16/22 | | HSBC Bank PLC | | INR | 670,114 | | | | 8,774,000 | | | | 8,874,628 | | | | — | | | | (100,628 | ) |
Expiring 03/16/22 | | HSBC Bank PLC | | INR | 283,834 | | | | 3,723,000 | | | | 3,758,944 | | | | — | | | | (35,944 | ) |
Expiring 03/16/22 | | UBS AG | | INR | 228,958 | | | | 3,039,000 | | | | 3,032,198 | | | | 6,802 | | | | — | |
Indonesian Rupiah, | | | | | | | | | | | | | | | | | | |
Expiring 03/16/22 | | Citibank, N.A. | | IDR | 60,598,044 | | | | 4,212,000 | | | | 4,210,731 | | | | 1,269 | | | | — | |
Expiring 03/16/22 | | JPMorgan Chase Bank, N.A. | | IDR | 82,565,422 | | | | 5,748,000 | | | | 5,737,161 | | | | 10,839 | | | | — | |
Expiring 03/16/22 | | JPMorgan Chase Bank, N.A. | | IDR | 81,583,800 | | | | 5,675,000 | | | | 5,668,952 | | | | 6,048 | | | | — | |
Expiring 03/16/22 | | JPMorgan Chase Bank, N.A. | | IDR | 61,545,664 | | | | 4,288,000 | | | | 4,276,577 | | | | 11,423 | | | | — | |
Expiring 03/16/22 | | Standard Chartered Bank | | IDR
|
108,763,320 |
| | | 7,530,000 | | | | 7,557,555 | | | | — | | | | (27,555 | ) |
Expiring 03/16/22 | | Standard Chartered Bank | | IDR | 88,466,971 | | | | 6,162,000 | | | | 6,147,238 | | | | 14,762 | | | | — | |
Expiring 03/16/22 | | Standard Chartered Bank | | IDR | 79,369,675 | | | | 5,521,000 | | | | 5,515,101 | | | | 5,899 | | | | — | |
Expiring 03/16/22 | | Standard Chartered Bank | | IDR | 78,975,303 | | | | 5,527,000 | | | | 5,487,697 | | | | 39,303 | | | | — | |
Expiring 03/16/22 | | Standard Chartered Bank | | IDR | 62,836,711 | | | | 4,361,000 | | | | 4,366,287 | | | | — | | | | (5,287 | ) |
Expiring 03/16/22 | | Standard Chartered Bank | | IDR | 56,845,376 | | | | 3,983,000 | | | | 3,949,972 | | | | 33,028 | | | | — | |
Expiring 03/16/22 | | Standard Chartered Bank | | IDR | 47,703,347 | | | | 3,315,000 | | | | 3,314,726 | | | | 274 | | | | — | |
Expiring 03/16/22 | | UBS AG | | IDR | 49,267,216 | | | | 3,428,000 | | | | 3,423,394 | | | | 4,606 | | | | — | |
Israeli Shekel, | | | | | | | | | | | | | | | | | | |
Expiring 03/16/22 | | Citibank, N.A. | | ILS | 37,586 | | | | 11,922,657 | | | | 11,711,686 | | | | 210,971 | | | | — | |
Expiring 03/16/22 | | Citibank, N.A. | | ILS | 15,356 | | | | 4,812,000 | | | | 4,784,804 | | | | 27,196 | | | | — | |
Expiring 03/16/22 | | HSBC Bank PLC | | ILS | 19,578 | | | | 6,198,000 | | | | 6,100,494 | | | | 97,506 | | | | — | |
Mexican Peso, | | | | | | | | | | | | | | | | | | |
Expiring 03/16/22 | | Bank of America, N.A. | | MXN | 144,089 | | | | 6,947,000 | | | | 7,015,644 | | | | — | | | | (68,644 | ) |
Expiring 03/16/22 | | Bank of America, N.A. | | MXN | 87,484 | | | | 4,254,000 | | | | 4,259,545 | | | | — | | | | (5,545 | ) |
Expiring 03/16/22 | | Goldman Sachs International | | MXN | 89,415 | | | | 4,313,000 | | | | 4,353,587 | | | | — | | | | (40,587 | ) |
See Notes to Financial Statements.
PGIM Strategic Bond Fund 65
Schedule of Investments (continued)
as of February 28, 2022
Forward foreign currency exchange contracts outstanding at February 28, 2022 (continued):
| | | | | | | | | | | | | | | | | | | | | | | | | | |
Sale Contracts | | Counterparty | | Notional
Amount
(000) | | | Value at
Settlement
Date | | | Current
Value | | | Unrealized
Appreciation | | | Unrealized
Depreciation | |
OTC Forward Foreign Currency Exchange Contracts (cont’d.): | |
New Taiwanese Dollar, | | | | | | | | | | | | | | | | | | | | | | | | | | |
Expiring 03/16/22 | | Barclays Bank PLC | | | TWD | | | | 99,590 | | | $ | 3,609,000 | | | $ | 3,555,037 | | | $ | 53,963 | | | $ | — | |
Expiring 03/16/22 | | Citibank, N.A. | | | TWD | | | | 890,937 | | | | 32,355,250 | | | | 31,803,403 | | | | 551,847 | | | | — | |
Expiring 03/16/22 | | Citibank, N.A. | | | TWD | | | | 85,348 | | | | 3,120,000 | | | | 3,046,619 | | | | 73,381 | | | | — | |
Expiring 03/16/22 | | Credit Suisse International | | | TWD | | | | 381,830 | | | | 13,862,546 | | | | 13,630,030 | | | | 232,516 | | | | — | |
Expiring 03/16/22 | | Credit Suisse International | | | TWD | | | | 163,564 | | | | 5,930,000 | | | | 5,838,686 | | | | 91,314 | | | | — | |
Expiring 03/16/22 | | Credit Suisse International | | | TWD | | | | 147,172 | | | | 5,348,000 | | | | 5,253,526 | | | | 94,474 | | | | — | |
Expiring 03/16/22 | | Credit Suisse International | | | TWD | | | | 145,156 | | | | 5,265,000 | | | | 5,181,577 | | | | 83,423 | | | | — | |
Expiring 03/16/22 | | Credit Suisse International | | | TWD | | | | 98,925 | | | | 3,594,000 | | | | 3,531,280 | | | | 62,720 | | | | — | |
Expiring 03/16/22 | | JPMorgan Chase Bank, N.A. | | | TWD | | | | 121,960 | | | | 4,425,000 | | | | 4,353,544 | | | | 71,456 | | | | — | |
Expiring 03/16/22 | | Morgan Stanley & Co. International PLC | | | TWD | | | | 94,872 | | | | 3,437,000 | | | | 3,386,590 | | | | 50,410 | | | | — | |
Peruvian Nuevo Sol, | | | | | | | | | | | | | | | | | | | | | | | | | | |
Expiring 03/16/22 | | Goldman Sachs International | | | PEN | | | | 11,774 | | | | 2,963,000 | | | | 3,105,155 | | | | — | | | | (142,155 | ) |
Expiring 03/16/22 | | Standard Chartered Bank | | | PEN | | | | 17,010 | | | | 4,239,000 | | | | 4,486,198 | | | | — | | | | (247,198 | ) |
Philippine Peso, | | | | | | | | | | | | | | | | | | | | | | | | | | |
Expiring 03/16/22 | | Citibank, N.A. | | | PHP | | | | 244,612 | | | | 4,741,000 | | | | 4,771,513 | | | | — | | | | (30,513 | ) |
Expiring 03/16/22 | | Citibank, N.A. | | | PHP | | | | 237,931 | | | | 4,629,000 | | | | 4,641,184 | | | | — | | | | (12,184 | ) |
Expiring 03/16/22 | | JPMorgan Chase Bank, N.A. | | | PHP | | | | 1,613,846 | | | | 31,800,107 | | | | 31,480,424 | | | | 319,683 | | | | — | |
Expiring 03/16/22 | | JPMorgan Chase Bank, N.A. | | | PHP | | | | 361,079 | | | | 7,024,000 | | | | 7,043,379 | | | | — | | | | (19,379 | ) |
Expiring 03/16/22 | | JPMorgan Chase Bank, N.A. | | | PHP | | | | 314,753 | | | | 6,112,000 | | | | 6,139,712 | | | | — | | | | (27,712 | ) |
Expiring 03/16/22 | | JPMorgan Chase Bank, N.A. | | | PHP | | | | 295,955 | | | | 5,733,000 | | | | 5,773,028 | | | | — | | | | (40,028 | ) |
Expiring 03/16/22 | | JPMorgan Chase Bank, N.A. | | | PHP | | | | 244,753 | | | | 4,762,000 | | | | 4,774,274 | | | | — | | | | (12,274 | ) |
Expiring 03/16/22 | | JPMorgan Chase Bank, N.A. | | | PHP | | | | 216,516 | | | | 4,234,000 | | | | 4,223,465 | | | | 10,535 | | | | — | |
Expiring 03/16/22 | | JPMorgan Chase Bank, N.A. | | | PHP | | | | 199,046 | | | | 3,919,000 | | | | 3,882,683 | | | | 36,317 | | | | — | |
See Notes to Financial Statements.
66
Forward foreign currency exchange contracts outstanding at February 28, 2022 (continued):
| | | | | | | | | | | | | | | | | | | | | | | | | | |
Sale Contracts | | Counterparty | | Notional
Amount
(000) | | | Value at
Settlement
Date | | | Current
Value | | | Unrealized
Appreciation | | | Unrealized
Depreciation | |
OTC Forward Foreign Currency Exchange Contracts (cont’d.): | |
Philippine Peso (cont’d.), | | | | | | | | | | | | | | | | | | | | | | | | | | |
Expiring 03/16/22 | | Standard Chartered Bank | | | PHP | | | | 167,874 | | | $ | 3,308,000 | | | $ | 3,274,635 | | | $ | 33,365 | | | $ | — | |
Polish Zloty, | | | | | | | | | | | | | | | | | | | | | | | | | | |
Expiring 04/19/22 | | JPMorgan Chase Bank, N.A. | | | PLN | | | | 26,341 | | | | 6,622,000 | | | | 6,251,404 | | | | 370,596 | | | | — | |
Expiring 04/19/22 | | JPMorgan Chase Bank, N.A. | | | PLN | | | | 16,321 | | | | 4,069,000 | | | | 3,873,399 | | | | 195,601 | | | | — | |
Expiring 04/19/22 | | JPMorgan Chase Bank, N.A. | | | PLN | | | | 11,348 | | | | 2,816,000 | | | | 2,693,096 | | | | 122,904 | | | | — | |
Expiring 04/19/22 | | JPMorgan Chase Bank, N.A. | | | PLN | | | | 10,787 | | | | 2,567,000 | | | | 2,560,082 | | | | 6,918 | | | | — | |
Expiring 04/19/22 | | Morgan Stanley & Co. International PLC | | | PLN | | | | 17,576 | | | | 4,381,000 | | | | 4,171,212 | | | | 209,788 | | | | — | |
Expiring 04/19/22 | | UBS AG | | | PLN | | | | 16,463 | | | | 4,091,000 | | | | 3,906,972 | | | | 184,028 | | | | — | |
Expiring 04/19/22 | | UBS AG | | | PLN | | | | 15,945 | | | | 3,910,000 | | | | 3,784,203 | | | | 125,797 | | | | — | |
Russian Ruble, | | | | | | | | | | | | | | | | | | | | | | | | | | |
Expiring 03/16/22 | | Barclays Bank PLC | | | RUB | | | | 351,250 | | | | 4,634,000 | | | | 3,233,246 | | | | 1,400,754 | | | | — | |
Expiring 03/16/22 | | Barclays Bank PLC | | | RUB | | | | 235,744 | | | | 2,224,000 | | | | 2,170,015 | | | | 53,985 | | | | — | |
Expiring 03/16/22 | | Barclays Bank PLC | | | RUB | | | | 233,842 | | | | 3,005,000 | | | | 2,152,503 | | | | 852,497 | | | | — | |
Expiring 03/16/22 | | Barclays Bank PLC | | | RUB | | | | 207,323 | | | | 2,686,000 | | | | 1,908,398 | | | | 777,602 | | | | — | |
Expiring 03/16/22 | | JPMorgan Chase Bank, N.A. | | | RUB | | | | 237,864 | | | | 3,102,000 | | | | 2,189,534 | | | | 912,466 | | | | — | |
Expiring 03/16/22 | | Morgan Stanley & Co. International PLC | | | RUB | | | | 378,084 | | | | 4,981,000 | | | | 3,480,252 | | | | 1,500,748 | | | | — | |
Expiring 03/16/22 | | Morgan Stanley & Co. International PLC | | | RUB | | | | 347,149 | | | | 4,548,000 | | | | 3,195,493 | | | | 1,352,507 | | | | — | |
Expiring 03/16/22 | | Morgan Stanley & Co. International PLC | | | RUB | | | | 270,972 | | | | 3,608,000 | | | | 2,494,284 | | | | 1,113,716 | | | | — | |
Singapore Dollar, | | | | | | | | | | | | | | | | | | | | | | | | | | |
Expiring 03/16/22 | | HSBC Bank PLC | | | SGD | | | | 95,285 | | | | 69,731,580 | | | | 70,277,640 | | | | — | | | | (546,060 | ) |
Expiring 03/16/22 | | Morgan Stanley & Co. International PLC | | | SGD | | | | 5,481 | | | | 4,026,000 | | | | 4,042,591 | | | | — | | | | (16,591 | ) |
See Notes to Financial Statements.
PGIM Strategic Bond Fund 67
Schedule of Investments (continued)
as of February 28, 2022
Forward foreign currency exchange contracts outstanding at February 28, 2022 (continued):
| | | | | | | | | | | | | | | | | | | | | | |
Sale Contracts | | Counterparty | | Notional
Amount
(000) | | | Value at
Settlement
Date | | | Current
Value | | | Unrealized
Appreciation | | | Unrealized
Depreciation | |
OTC Forward Foreign Currency Exchange Contracts (cont’d.): | |
Singapore Dollar (cont’d.), | | | | | | | | | | | | | | | | | | | | |
Expiring 03/16/22 | | The Toronto-Dominion Bank | | SGD | 6,726 | | | $ | 4,964,000 | | | $ | 4,961,135 | | | $ | 2,865 | | | $ | — | |
South African Rand, | | | | | | | | | | | | | | | | | | | | |
Expiring 03/16/22 | | Barclays Bank PLC | | ZAR | 47,953 | | | | 2,917,000 | | | | 3,112,106 | | | | — | | | | (195,106 | ) |
Expiring 03/16/22 | | Goldman Sachs International | | ZAR | 78,375 | | | | 4,856,000 | | | | 5,086,491 | | | | — | | | | (230,491 | ) |
Expiring 03/16/22 | | JPMorgan Chase Bank, N.A. | | ZAR | 76,862 | | | | 4,992,000 | | | | 4,988,305 | | | | 3,695 | | | | — | |
Expiring 03/16/22 | | JPMorgan Chase Bank, N.A. | | ZAR | 66,614 | | | | 4,302,000 | | | | 4,323,237 | | | | — | | | | (21,237 | ) |
Expiring 03/16/22 | | JPMorgan Chase Bank, N.A. | | ZAR | 66,249 | | | | 4,408,000 | | | | 4,299,538 | | | | 108,462 | | | | — | |
Expiring 03/16/22 | | JPMorgan Chase Bank, N.A. | | ZAR | 63,654 | | | | 4,198,000 | | | | 4,131,118 | | | | 66,882 | | | | — | |
Expiring 03/16/22 | | JPMorgan Chase Bank, N.A. | | ZAR | 29,813 | | | | 1,924,000 | | | | 1,934,872 | | | | — | | | | (10,872 | ) |
South Korean Won, | | | | | | | | | | | | | | | | | | | | |
Expiring 03/16/22 | | BNP Paribas S.A. | | KRW | 31,103,249 | | | | 26,361,590 | | | | 25,857,639 | | | | 503,951 | | | | — | |
Expiring 03/16/22 | | Credit Suisse International | | KRW | 8,353,396 | | | | 7,012,000 | | | | 6,944,583 | | | | 67,417 | | | | — | |
Expiring 03/16/22 | | Credit Suisse International | | KRW | 5,467,022 | | | | 4,598,000 | | | | 4,545,000 | | | | 53,000 | | | | — | |
Expiring 03/16/22 | | HSBC Bank PLC | | KRW | 7,045,139 | | | | 5,843,000 | | | | 5,856,966 | | | | — | | | | (13,966 | ) |
Expiring 03/16/22 | | HSBC Bank PLC | | KRW | 5,085,266 | | | | 4,219,000 | | | | 4,227,628 | | | | — | | | | (8,628 | ) |
Expiring 03/16/22 | | JPMorgan Chase Bank, N.A. | | KRW | 6,724,904 | | | | 5,670,000 | | | | 5,590,738 | | | | 79,262 | | | | — | |
Expiring 03/16/22 | | JPMorgan Chase Bank, N.A. | | KRW | 5,441,353 | | | | 4,539,000 | | | | 4,523,661 | | | | 15,339 | | | | — | |
Expiring 03/16/22 | | JPMorgan Chase Bank, N.A. | | KRW | 4,603,685 | | | | 3,883,000 | | | | 3,827,266 | | | | 55,734 | | | | — | |
Expiring 03/16/22 | | Standard Chartered Bank | | KRW | 7,720,538 | | | | 6,437,000 | | | | 6,418,457 | | | | 18,543 | | | | — | |
Expiring 03/16/22 | | Standard Chartered Bank | | KRW | 7,088,577 | | | | 5,919,000 | | | | 5,893,077 | | | | 25,923 | | | | — | |
Expiring 03/16/22 | | The Toronto-Dominion Bank | | KRW | 5,334,539 | | | | 4,493,000 | | | | 4,434,861 | | | | 58,139 | | | | — | |
Thai Baht, | | | | | | | | | | | | | | | | | | | | |
Expiring 03/16/22 | | Citibank, N.A. | | THB | 109,805 | | | | 3,360,000 | | | | 3,360,598 | | | | — | | | | (598 | ) |
Expiring 03/16/22 | | HSBC Bank PLC | | THB | 139,931 | | | | 4,164,000 | | | | 4,282,623 | | | | — | | | | (118,623 | ) |
See Notes to Financial Statements.
68
Forward foreign currency exchange contracts outstanding at February 28, 2022 (continued):
| | | | | | | | | | | | | | | | | | | | | | | | | | |
Sale Contracts | | Counterparty | | Notional
Amount
(000) | | | Value at
Settlement
Date | | | Current
Value | | | Unrealized
Appreciation | | | Unrealized
Depreciation | |
| | | |
OTC Forward Foreign Currency Exchange Contracts (cont’d.): | | | | | | | | | | | | | |
Thai Baht (cont’d.), | | | | | | | | | | | | | | | | | | | | | | | | | | |
Expiring 03/16/22 | | JPMorgan Chase Bank, N.A. | | | THB | | | | 1,513,424 | | | $ | 44,571,473 | | | $ | 46,318,653 | | | $ | — | | | $ | (1,747,180 | ) |
Expiring 03/16/22 | | Morgan Stanley & Co. International PLC | | | THB | | | | 498,038 | | | | 14,790,649 | | | | 15,242,556 | | | | — | | | | (451,907 | ) |
Expiring 03/16/22 | | Morgan Stanley & Co. International PLC | | | THB | | | | 164,401 | | | | 4,938,000 | | | | 5,031,520 | | | | — | | | | (93,520 | ) |
Expiring 03/16/22 | | Morgan Stanley & Co. International PLC | | | THB | | | | 122,751 | | | | 3,720,000 | | | | 3,756,810 | | | | — | | | | (36,810 | ) |
Expiring 03/16/22 | | Morgan Stanley & Co. International PLC | | | THB | | | | 101,900 | | | | 3,084,000 | | | | 3,118,669 | | | | — | | | | (34,669 | ) |
Expiring 03/16/22 | | Standard Chartered Bank | | | THB | | | | 206,893 | | | | 6,354,000 | | | | 6,331,989 | | | | 22,011 | | | | — | |
Expiring 03/16/22 | | Standard Chartered Bank | | | THB | | | | 140,553 | | | | 4,238,000 | | | | 4,301,661 | | | | — | | | | (63,661 | ) |
Expiring 03/16/22 | | Standard Chartered Bank | | | THB | | | | 120,886 | | | | 3,671,000 | | | | 3,699,741 | | | | — | | | | (28,741 | ) |
| | | | | | | | | | | | | | | | | | | | | | | | | | |
| | | | | | | | | | | | $ | 1,068,617,143 | | | $ | 1,054,373,114 | | | | 19,763,812 | | | | (5,519,783 | ) |
| | | | | | | | | | | | | | | | | | | | | | | | | | |
| | | | | | | | | | | | | | | | | | | | | | | | | | |
| | | | | | | | | | | | | | | | | | | | $ | 27,028,332 | | | $ | (23,304,164 | ) |
| | | | | | | | | | | | | | | | | | | | | | | | | | |
Credit default swap agreements outstanding at February 28, 2022:
| | | | | | | | | | | | | | | | | | | | | | |
Reference
Entity/
Obligation | | Termination
Date | | Fixed
Rate | | Notional
Amount
(000)#(3) | | Implied
Credit
Spread at
February 28,
2022(4) | | Fair
Value | | | Upfront
Premiums
Paid
(Received) | | | Unrealized
Appreciation
(Depreciation) | | | Counterparty |
OTC Credit Default Swap Agreements on asset-backed and/or mortgage-backed securities - Sell Protection(2)^: |
AMSR Trust | | 03/30/22 | | 1.250%(M) | | 3,153 | | * | | $ | 109 | | | $ | — | | | $ | 109 | | | Goldman Sachs International |
Bank of America Corp. | | 03/30/22 | | 0.500%(M) | | 6,047 | | * | | | 84 | | | | — | | | | 84 | | | Goldman Sachs International |
BSREP Commercial Mortgage Trust | | 03/29/22 | | 1.250%(M) | | 1,904 | | * | | | 2,446 | | | | — | | | | 2,446 | | | Goldman Sachs International |
See Notes to Financial Statements.
PGIM Strategic Bond Fund 69
Schedule of Investments (continued)
as of February 28, 2022
Credit default swap agreements outstanding at February 28, 2022 (continued):
| | | | | | | | | | | | | | | | | | | | | | | | |
Reference
Entity/
Obligation | | Termination
Date | | Fixed
Rate | | Notional
Amount
(000)#(3) | | | Implied
Credit
Spread at
February 28,
2022(4) | | Fair
Value | | | Upfront
Premiums
Paid
(Received) | | | Unrealized
Appreciation
(Depreciation) | | | Counterparty |
|
| OTC Credit Default Swap Agreements on asset-backed and/or mortgage-backed securities - Sell Protection(2)^ (cont’d.): |
Citigroup Mortgage Loan Trust | | 03/30/22 | | 1.000%(M) | | | 8,159 | | | * | | $ | 227 | | | $ | — | | | $ | 227 | | | Goldman Sachs International |
COMM Mortgage Trust | | 03/29/22 | | 1.250%(M) | | | 1,557 | | | * | | | 2,000 | | | | — | | | | 2,000 | | | Goldman Sachs International |
COMM Mortgage Trust | | 03/29/22 | | 1.250%(M) | | | 1,051 | | | * | | | 1,350 | | | | — | | | | 1,350 | | | Goldman Sachs International |
Delta Home Equity | | 03/30/22 | | 1.250%(M) | | | 6,205 | | | * | | | 215 | | | | — | | | | 215 | | | Goldman Sachs International |
GS Mortgage Securities Corp. | | 03/29/22 | | 1.250%(M) | | | 882 | | | * | | | 1,133 | | | | — | | | | 1,133 | | | Goldman Sachs International |
GS_21-PJ2A†† | | 03/14/22 | | 0.500%(M) | | | 23,300 | | | * | | | 18,123 | | | | (2,427 | ) | | | 20,550 | | | Goldman Sachs International |
GS_21-PJA†† | | 03/14/22 | | 0.250%(M) | | | 44,920 | | | * | | | 17,469 | | | | (2,340 | ) | | | 19,809 | | | Goldman Sachs International |
Harborview Mortgage Loan Trust | | 03/30/22 | | 0.500%(M) | | | 1,023 | | | * | | | 14 | | | | — | | | | 14 | | | Goldman Sachs International |
IMPAC CMB Trust | | 03/30/22 | | 0.500%(M) | | | 618 | | | * | | | 9 | | | | — | | | | 9 | | | Goldman Sachs International |
LHOME Mortgage Trust | | 03/30/22 | | 0.500%(M) | | | 390 | | | * | | | 5 | | | | — | | | | 5 | | | Goldman Sachs International |
Multi-Family Structure Credit Risk | | 03/29/22 | | 1.250%(M) | | | 11,820 | | | * | | | 15,183 | | | | — | | | | 15,183 | | | Goldman Sachs International |
Preston Ridge Partners Mortgage Trust | | 03/30/22 | | 0.500%(M) | | | 2,387 | | | * | | | 33 | | | | — | | | | 33 | | | Goldman Sachs International |
Preston Ridge Partners Mortgage Trust | | 03/30/22 | | 0.500%(M) | | | 979 | | | * | | | 14 | | | | — | | | | 14 | | | Goldman Sachs International |
See Notes to Financial Statements.
70
Credit default swap agreements outstanding at February 28, 2022 (continued):
| | | | | | | | | | | | | | | | | | | | | | | | |
Reference
Entity/
Obligation | | Termination
Date | | Fixed
Rate | | Notional
Amount
(000)#(3) | | | Implied
Credit
Spread at
February 28,
2022(4) | | Fair
Value | | | Upfront
Premiums
Paid
(Received) | | | Unrealized
Appreciation
(Depreciation) | | | Counterparty |
| | | | | | | | | | | | | | | | | | | | | | | | |
|
| OTC Credit Default Swap Agreements on asset-backed and/or mortgage-backed securities - Sell Protection(2)^ (cont’d.): |
PRET LLC | | 03/30/22 | | 0.500%(M) | | | 594 | | | * | | $ | 8 | | | $ | — | | | $ | 8 | | | Goldman
Sachs
International |
Renaissance Home Equity Loan Trust | | 03/30/22 | | 1.250%(M) | | | 4,747 | | | * | | | 165 | | | | — | | | | 165 | | | Goldman
Sachs
International |
Renaissance Home Equity Loan Trust | | 03/30/22 | | 1.250%(M) | | | 928 | | | * | | | 32 | | | | — | | | | 32 | | | Goldman
Sachs
International |
Renaissance Home Equity Loan Trust | | 03/30/22 | | 1.250%(M) | | | 682 | | | * | | | 24 | | | | — | | | | 24 | | | Goldman
Sachs
International |
Residential Accredit Loans | | 03/30/22 | | 0.500%(M) | | | 1,372 | | | * | | | 19 | | | | — | | | | 19 | | | Goldman
Sachs
International |
Tharaldson Hotel Potfolio Trust | | 03/29/22 | | 1.250%(M) | | | 5,188 | | | * | | | 6,664 | | | | — | | | | 6,664 | | | Goldman
Sachs
International |
Zillow | | 03/30/22 | | 0.500%(M) | | | 2,785 | | | * | | | 39 | | | | — | | | | 39 | | | Goldman
Sachs
International |
| | | | | | | | | | | | | | | | | | | | | | | | |
| | | | | | | | | | | | $ | 65,365 | | | $ | (4,767 | ) | | $ | 70,132 | | | |
| | | | | | | | | | | | | | | | | | | | | | | | |
†† The value of the contracts, GS_21-PJA and GS_21-PJ2A, is derived from the pool of senior prime jumbo mortgages.
| | | | | | | | | | | | | | | | | | | | | | | | |
Reference
Entity/
Obligation | | Termination
Date | | Fixed
Rate | | Notional
Amount
(000)#(3) | | | Fair
Value | | | Upfront
Premiums
Paid
(Received) | | | Unrealized
Appreciation
(Depreciation) | | | Counterparty | |
| | | | | | | | | | | | | | | | | | | | | | | | |
| |
| OTC Credit Default Swap Agreements on corporate and/or sovereign issues - Buy Protection(1): | | | | | |
Republic of France | | 12/20/26 | | 0.250%(Q) | | | 2,485 | | | | $ (4,707) | | | $ | (4,707 | ) | | $ | 588 | | | | Deutsche Bank AG | |
United Mexican States | | 06/20/23 | | 1.000%(Q) | | | 35 | | | | (312 | ) | | | 59 | | | | (371 | ) | | | Citibank, N.A. | |
United Mexican States | | 06/20/23 | | 1.000%(Q) | | | 30 | | | | (267 | ) | | | 125 | | | | (392 | ) | | | Citibank, N.A. | |
United Mexican States | | 06/20/23 | | 1.000%(Q) | | | 10 | | | | (89 | ) | | | 46 | | | | (135 | ) | | | Citibank, N.A. | |
United Mexican States | | 06/20/23 | | 1.000%(Q) | | | 10 | | | | (89 | ) | | | 43 | | | | (132 | ) | | | Citibank, N.A. | |
United Mexican States | | 06/20/23 | | 1.000%(Q) | | | 10 | | | | (89 | ) | | | 16 | | | | (105 | ) | | | Citibank, N.A. | |
United Mexican States | | 06/20/23 | | 1.000%(Q) | | | 5 | | | | (45 | ) | | | 8 | | | | (53 | ) | | | Citibank, N.A. | |
See Notes to Financial Statements.
PGIM Strategic Bond Fund 71
Schedule of Investments (continued)
as of February 28, 2022
Credit default swap agreements outstanding at February 28, 2022 (continued):
| | | | | | | | | | | | | | | | | | | | | | | | |
Reference
Entity/
Obligation | | Termination
Date | | Fixed
Rate | | Notional
Amount
(000)#(3) | | | Fair
Value | | | Upfront
Premiums
Paid
(Received) | | | Unrealized
Appreciation
(Depreciation) | | | Counterparty | |
| | | | | | | | | | | | | | | | | | | | | | | | |
| | |
| OTC Credit Default Swap Agreements on corporate and/or sovereign issues - Buy Protection(1)(cont’d.): | | | | | | | | | |
United Mexican States | | 06/20/24 | | 1.000%(Q) | | | 2,340 | | | $ | (25,008 | ) | | $ | 1,147 | | | $ | (26,155 | ) | | | Barclays Bank PLC | |
United Mexican States | | 12/20/24 | | 1.000%(Q) | | | 180 | | | | (1,905 | ) | | | 712 | | | | (2,617 | ) | | | Citibank, N.A. | |
| | | | | | | | | | | | | | | | | | | | | | | | |
| | | | | | | | | | $ | (31,923 | ) | | $ | (2,551 | ) | | $ | (29,372 | ) | | | | |
| | | | | | | | | | | | | | | | | | | | | | | | |
| | | | | | | | | | | | | | | | | | | | | | | | |
Reference
Entity/
Obligation | | Termination
Date | | Fixed
Rate | | Notional
Amount
(000)#(3) | | | Implied
Credit
Spread at
February 28,
2022(4) | | Fair
Value | | | Upfront
Premiums
Paid
(Received) | | | Unrealized
Appreciation
(Depreciation) | | | Counterparty |
| | | | | | | | | | | | | | | | | | | | | | | | |
|
| OTC Credit Default Swap Agreements on corporate and/or sovereign issues - Sell Protection(2): |
AT&T, Inc. | | 03/20/22 | | 1.000%(Q) | | | 5,130 | | | 0.301% | | $ | 12,108 | | | $ | 1,774 | | | $ | 10,334 | | | Credit Suisse
International |
AT&T, Inc. | | 06/20/22 | | 1.000%(Q) | | | 8,640 | | | 0.320% | | | 35,283 | | | | 20,504 | | | | 14,779 | | | Goldman Sachs
International |
Bank of America Corp. | | 06/20/22 | | 1.000%(Q) | | | 9,500 | | | 0.297% | | | 39,471 | | | | 22,839 | | | | 16,632 | | | Goldman Sachs
International |
Boeing Co. | | 06/20/24 | | 1.000%(Q) | | | 4,310 | | | 0.782% | | | 29,866 | | | | 13,754 | | | | 16,112 | | | Goldman Sachs
International |
Calpine Corp. | | 06/20/22 | | 5.000%(Q) | | | 10,000 | | | 1.010% | | | 222,287 | | | | 127,897 | | | | 94,390 | | | Credit Suisse
International |
Calpine Corp. | | 06/20/22
| | 5.000%(Q)
| |
| 6,000
|
| | 1.010%
| |
| 133,372
|
| |
| 75,843
|
| |
| 57,529
|
| | Credit Suisse
International |
Casino Guichard Perrachon SA | | 06/20/24 | | 5.000%(Q) | | EUR | 2,860 | | | 11.343% | | | (347,067 | ) | | | 43,258 | | | | (390,325 | ) | | Goldman Sachs
International |
Casino Guichard Perrachon SA | | 06/20/24 | | 5.000%(Q) | | EUR | 1,520 | | | 11.343% | | | (184,455 | ) | | | 23,837 | | | | (208,292 | ) | | Goldman Sachs
International |
Citigroup, Inc. | | 06/20/22 | | 1.000%(Q) | | | 7,780 | | | 0.348% | | | 31,100 | | | | 18,465 | | | | 12,635 | | | Goldman Sachs
International |
Delta Air Lines, Inc. | | 06/20/22 | | 5.000%(Q) | | | 2,320 | | | 0.845% | | | 52,779 | | | | 28,425 | | | | 24,354 | | | Credit Suisse
International |
Electricite de France SA | | 12/20/22 | | 1.000%(Q) | | EUR | 5,550 | | | 0.315% | | | 47,214 | | | | 41,611 | | | | 5,603 | | | Goldman Sachs
International |
EQT Corp. | | 06/20/22 | | 5.000%(Q) | | | 2,340 | | | 1.458% | | | 48,737 | | | | 25,836 | | | | 22,901 | | | Credit Suisse
International |
General Electric Co. | | 06/20/22 | | 1.000%(Q) | | | 8,050 | | | 0.217% | | | 35,458 | | | | 17,346 | | | | 18,112 | | | Morgan Stanley
& Co.
International
PLC |
See Notes to Financial Statements.
72
Credit default swap agreements outstanding at February 28, 2022 (continued):
| | | | | | | | | | | | | | | | | | | | | | | | | | | | |
Reference Entity/ Obligation | | Termination
Date | | | Fixed Rate | | Notional
Amount
(000)#(3) | | | Implied
Credit Spread at February 28, 2022(4) | | | Fair Value | | | Upfront
Premiums
Paid (Received) | | | Unrealized Appreciation
(Depreciation) | | | Counterparty |
| | | | | | | | | | | | | | | | | | | | | | | | | | | | |
OTC Credit Default Swap Agreements on corporate and/or sovereign issues - Sell Protection(2)(cont’d.): |
General Motors Co. | | | 06/20/26 | | | 5.000%(Q) | | | 2,390 | | | | 1.288 | % | | $ | 385,871 | | | $ | 401,497 | | | $ | (15,626 | ) | | Goldman Sachs International |
Halliburton Co. | | | 12/20/26 | | | 1.000%(Q) | | | 2,770 | | | | 0.828 | % | | | 27,304 | | | | 25,536 | | | | 1,768 | | | Goldman Sachs International |
Hellenic Republic | | | 12/20/22 | | | 1.000%(Q) | | | 770 | | | | 0.390 | % | | | 5,347 | | | | 4,201 | | | | 1,146 | | | Barclays Bank PLC |
Hess Corp. | | | 06/20/22 | | | 1.000%(Q) | | | 10,650 | | | | 0.404 | % | | | 40,696 | | | | 21,422 | | | | 19,274 | | | Goldman Sachs International |
Host Hotels & Resorts LP | | | 06/20/24 | | | 1.000%(Q) | | | 1,460 | | | | 0.667 | % | | | 13,975 | | | | 13,060 | | | | 915 | | | Goldman Sachs International |
Naturgy Energy Group SA | | | 06/20/22 | | | 1.000%(Q) | | EUR | 9,550 | | | | 0.278 | % | | | 45,209 | | | | 26,952 | | | | 18,257 | | | Goldman Sachs International |
Petroleos Mexicanos | | | 06/20/23 | | | 1.000%(Q) | | | 550 | | | | 2.109 | % | | | (6,820 | ) | | | (13,655 | ) | | | 6,835 | | | BNP Paribas S.A. |
Petroleos Mexicanos | | | 06/20/23 | | | 1.000%(Q) | | | 25 | | | | 2.109 | % | | | (310 | ) | | | (435 | ) | | | 125 | | | Citibank, N.A. |
Petroleos Mexicanos | | | 06/20/23 | | | 1.000%(Q) | | | 25 | | | | 2.109 | % | | | (310 | ) | | | (369 | ) | | | 59 | | | Citibank, N.A. |
Petroleos Mexicanos | | | 06/20/23 | | | 1.000%(Q) | | | 10 | | | | 2.109 | % | | | (124 | ) | | | (178 | ) | | | 54 | | | Citibank, N.A. |
Petroleos Mexicanos | | | 06/20/23 | | | 1.000%(Q) | | | 10 | | | | 2.109 | % | | | (124 | ) | | | (175 | ) | | | 51 | | | Citibank, N.A. |
Petroleos Mexicanos | | | 06/20/23 | | | 1.000%(Q) | | | 10 | | | | 2.109 | % | | | (124 | ) | | | (147 | ) | | | 23 | | | Citibank, N.A. |
Petroleos Mexicanos | | | 06/20/23 | | | 1.000%(Q) | | | 5 | | | | 2.109 | % | | | (62 | ) | | | (74 | ) | | | 12 | | | Citibank, N.A. |
Petroleos Mexicanos | | | 06/20/24 | | | 1.000%(Q) | | | 2,340 | | | | 2.585 | % | | | (78,075 | ) | | | (101,531 | ) | | | 23,456 | | | Barclays Bank PLC |
Petroleos Mexicanos | | | 12/20/24 | | | 1.000%(Q) | | | 180 | | | | 2.773 | % | | | (8,181 | ) | | | (9,537 | ) | | | 1,356 | | | Citibank, N.A. |
Pioneer Natural Resources Co. | | | 06/20/22 | | | 1.000%(Q) | | | 9,670 | | | | 0.208 | % | | | 42,868 | | | | 23,548 | | | | 19,320 | | | Goldman Sachs International |
Republic of France | | | 12/20/26 | | | 0.250%(Q) | | | 2,485 | | | | 0.225 | % | | | 4,119 | | | | 18,630 | | | | (14,511 | ) | | Deutsche Bank AG |
Republic of Italy | | | 09/20/22 | | | 1.000%(Q) | | | 2,030 | | | | 0.197 | % | | | 13,208 | | | | 10,542 | | | | 2,666 | | | Bank of America, N.A. |
Republic of Ukraine | | | 12/20/26 | | | 1.000%(Q) | | | 1,100 | | | | 44.963 | % | | | (673,579 | ) | | | (297,546 | ) | | | (376,033 | ) | | Barclays Bank PLC |
See Notes to Financial Statements.
PGIM Strategic Bond Fund 73
Schedule of Investments (continued)
as of February 28, 2022
Credit default swap agreements outstanding at February 28, 2022 (continued):
| | | | | | | | | | | | | | | | | | | | | | | | | | | | |
Reference Entity/ Obligation | | Termination
Date | | | Fixed Rate | | Notional
Amount
(000)#(3) | | | Implied
Credit Spread at February 28, 2022(4) | | | Fair Value | | | Upfront
Premiums
Paid (Received) | | | Unrealized Appreciation
(Depreciation) | | | Counterparty |
| | | | | | | | | | | | | | | | | | | | | | | | | | | | |
OTC Credit Default Swap Agreements on corporate and/or sovereign issues - Sell Protection(2)(cont’d.): |
Simon Property Group LP | | | 06/20/26 | | | 1.000%(Q) | | | 3,820 | | | | 0.750 | % | | $ | 47,093 | | | $ | 38,222 | | | $ | 8,871 | | | Goldman Sachs International |
Verizon Communications, Inc. | | | 06/20/26 | | | 1.000%(Q) | | | 5,130 | | | | 0.684 | % | | | 77,284 | | | | 92,702 | | | | (15,418 | ) | | Goldman Sachs International |
| | | | | | | | | | | | | | | | | | | | | | | | | | | | |
| | | | | | | | | | | | | | | | $ | 91,418 | | | $ | 714,054 | | | $ | (622,636 | ) | | |
| | | | | | | | | | | | | | | | | | | | | | | | | | | | |
| | | | | | | | | | | | | | | | | | | | | | |
Reference Entity/ Obligation | | Termination
Date | | | Fixed Rate | | Notional
Amount
(000)#(3) | | | Value at Trade Date | | | Value at
February 28,
2022 | | | Unrealized
Appreciation
(Depreciation) | |
| | | | | | | | | | | | | | | | | | | | | | |
Centrally Cleared Credit Default Swap Agreement on credit indices - Buy Protection(1): | |
CDX.NA.IG.37.V1 | | | 12/20/26 | | | 1.000%(Q) | | | 380,000 | | | $ | (7,342,146 | ) | | $ | (6,389,292 | ) | | $ | 952,854 | |
| | | | | | | | | | | | | | | | | | | | | | |
| | | | | | | | | | | | | | | | | | | | | | | | | | |
Reference Entity/ Obligation | | Termination
Date | | | Fixed Rate | | Notional
Amount
(000)#(3) | | | Implied Credit
Spread at
February 28,
2022(4) | | | Value at
Trade Date | | | Value at
February 28,
2022 | | | Unrealized
Appreciation
(Depreciation) | |
| | | | | | | | | | | | | | | | | | | | | | | | | | |
Centrally Cleared Credit Default Swap Agreement on credit indices - Sell Protection(2): | | | | | |
CDX.NA.HY.37.V1 | | | 12/20/26 | | | 5.000%(Q) | | | 123,865 | | | | 3.645 | % | | $ | 10,200,763 | | | $ | 8,203,783 | | | $ | (1,996,980 | ) |
| | | | | | | | | | | | | | | | | | | | | | | | | | |
The Fund entered into credit default swaps (“CDS”) to provide a measure of protection against defaults or to take an active long or short position with respect to the likelihood of a particular issuer’s default or the reference entity’s credit soundness. CDS contracts generally trade based on a spread which represents the cost a protection buyer has to pay the protection seller. The protection buyer is said to be short the credit as the value of the contract rises the more the credit deteriorates. The value of the CDS contract increases for the protection buyer if the spread increases.
| (1) | If the Fund is a buyer of protection, it pays the fixed rate. When a credit event occurs, as defined under the terms of that particular swap agreement, the Fund will either (i) receive from the seller of protection an amount equal to the notional amount of the swap and make delivery of the referenced obligation or underlying securities comprising the referenced index or (ii) receive a net settlement amount in the form of cash or securities equal to the notional amount of the swap less the recovery value of the referenced obligation or underlying securities comprising the referenced index. |
| (2) | If the Fund is a seller of protection, it receives the fixed rate. When a credit event occurs, as defined under the terms of that particular swap agreement, the Fund will either (i) pay to the buyer of protection an amount equal to the notional amount of the swap and take delivery of the referenced obligation or underlying securities comprising the referenced |
See Notes to Financial Statements.
74
| | index or (ii) pay a net settlement amount in the form of cash or securities equal to the notional amount of the swap less the recovery value of the referenced obligation or underlying securities comprising the referenced index. |
| (3) | Notional amount represents the maximum potential amount the Fund could be required to pay as a seller of credit protection or receive as a buyer of credit protection if a credit event occurs as defined under the terms of that particular swap agreement. |
| (4) | Implied credit spreads, represented in absolute terms, utilized in determining the fair value of credit default swap agreements where the Fund is the seller of protection as of the reporting date serve as an indicator of the current status of the payment/ performance risk and represent the likelihood of risk of default for the credit derivative. The implied credit spread of a particular referenced entity reflects the cost of buying/selling protection and may include up-front payments required to be made to enter into the agreement. Wider credit spreads represent a deterioration of the referenced entity’s credit soundness and a greater likelihood of risk of default or other credit event occurring as defined under the terms of the agreement. |
| * | When an implied credit spread is not available, reference the fair value of credit default swap agreements on credit indices and asset-backed securities. Where the Fund is the seller of protection, it serves as an indicator of the current status of the payment/performance risk and represents the likelihood of an expected liability (or profit) for the credit derivative should the notional amount of the swap agreement be closed/sold as of the reporting date. Increasing fair value in absolute terms, when compared to the notional amount of the swap, represents a deterioration of the referenced entity’s credit soundness and a greater likelihood of risk of default or other credit event occurring as defined under the terms of the agreement. |
Inflation swap agreements outstanding at February 28, 2022:
| | | | | | | | | | | | | | | | | | | | |
Notional Amount (000)# | | Termination
Date | | | Fixed
Rate | | Floating Rate | | Value at
Trade Date | | | Value at
February 28,
2022 | | | Unrealized
Appreciation
(Depreciation) | |
| | | | | | | | | | | | | | | | | | | | |
Centrally Cleared Inflation Swap Agreements: | | | | | | | | | | | | |
1,200 | | | 01/13/31 | | | 2.229%(T) | | U.S. CPI Urban Consumers NSA Index(2)(T) | | $ | — | | | $ | (141,472 | ) | | $ | (141,472 | ) |
4,390 | | | 04/07/31 | | | 2.469%(T) | | U.S. CPI Urban Consumers NSA Index(2)(T) | | | — | | | | (393,208 | ) | | | (393,208 | ) |
5,170 | | | 04/09/31 | | | 2.448%(T) | | U.S. CPI Urban Consumers NSA Index(2)(T) | | | — | | | | (474,144 | ) | | | (474,144 | ) |
5,140 | | | 04/13/31 | | | 2.445%(T) | | U.S. CPI Urban Consumers NSA Index(2)(T) | | | — | | | | (471,812 | ) | | | (471,812 | ) |
4,955 | | | 04/15/31 | | | 2.465%(T) | | U.S. CPI Urban Consumers NSA Index(2)(T) | | | — | | | | (443,201 | ) | | | (443,201 | ) |
| | | | | | | | | | | | | | | | | | | | |
| | | | | | | | | | $ | — | | | $ | (1,923,837 | ) | | $ | (1,923,837 | ) |
| | | | | | | | | | | | | | | | | | | | |
| (1) | The Fund pays the fixed rate and receives the floating rate. |
| (2) | The Fund pays the floating rate and receives the fixed rate. |
See Notes to Financial Statements.
PGIM Strategic Bond Fund 75
Schedule of Investments (continued)
as of February 28, 2022
Interest rate swap agreements outstanding at February 28, 2022:
| | | | | | | | | | | | | | | | | | | | | | | | |
Notional
Amount
(000)# | | | Termination
Date | | | Fixed
Rate | | Floating Rate | | Value at Trade Date | | | Value at
February 28,
2022 | | | Unrealized
Appreciation
(Depreciation) | |
| | | | | | | | | | | | | | | | | | | | | |
Centrally Cleared Interest Rate Swap Agreements: | | | | | | | | | | | | |
BRL | | | 18,408 | | | | 01/04/27 | | | 6.845%(T) | | 1 Day BROIS(2)(T) | | $ | — | | | $ | (635,222 | ) | | $ | (635,222 | ) |
BRL | | | 18,030 | | | | 01/04/27 | | | 6.890%(T) | | 1 Day BROIS(2)(T) | | | — | | | | (614,635 | ) | | | (614,635 | ) |
BRL | | | 32,041 | | | | 01/04/27 | | | 6.890%(T) | | 1 Day BROIS(2)(T) | | | — | | | | (1,094,267 | ) | | | (1,094,267 | ) |
BRL | | | 27,530 | | | | 01/04/27 | | | 6.890%(T) | | 1 Day BROIS(2)(T) | | | — | | | | (941,074 | ) | | | (941,074 | ) |
COP | | | 6,516,000 | | | | 02/18/25 | | | 4.505%(Q) | | 1 Day COOIS(2)(Q) | | | — | | | | (151,726 | ) | | | (151,726 | ) |
COP | | | 7,607,250 | | | | 02/21/25 | | | 4.565%(Q) | | 1 Day COOIS(2)(Q) | | | — | | | | (174,512 | ) | | | (174,512 | ) |
COP | | | 7,380,000 | | | | 01/20/26 | | | 3.085%(Q) | | 1 Day COOIS(2)(Q) | | | — | | | | (308,051 | ) | | | (308,051 | ) |
COP | | | 3,000,000 | | | | 01/29/26 | | | 3.065%(Q) | | 1 Day COOIS(2)(Q) | | | — | | | | (126,461 | ) | | | (126,461 | ) |
COP | | | 50,425,000 | | | | 02/03/26 | | | 3.080%(Q) | | 1 Day COOIS(2)(Q) | | | — | | | | (2,124,356 | ) | | | (2,124,356 | ) |
GBP | | | 3,655 | | | | 05/08/24 | | | 0.950%(A) | | 1 Day SONIA(1)(A) | | | (47,980 | ) | | | 34,211 | | | | 82,191 | |
GBP | | | 4,196 | | | | 05/08/25 | | | 1.000%(A) | | 1 Day SONIA(1)(A) | | | (262,597 | ) | | | 64,129 | | | | 326,726 | |
GBP | | | 10,795 | | | | 05/08/26 | | | 1.000%(A) | | 1 Day SONIA(1)(A) | | | (482,678 | ) | | | 224,314 | | | | 706,992 | |
GBP | | | 8,575 | | | | 05/08/27 | | | 1.050%(A) | | 1 Day SONIA(1)(A) | | | (127,254 | ) | | | 211,829 | | | | 339,083 | |
GBP | | | 366 | | | | 10/22/28 | | | 0.680%(A) | | 1 Day SONIA(1)(A) | | | — | | | | 23,140 | | | | 23,140 | |
GBP | | | 2,730 | | | | 05/08/29 | | | 1.100%(A) | | 1 Day SONIA(1)(A) | | | (125,022 | ) | | | 55,332 | | | | 180,354 | |
GBP | | | 422 | | | | 05/08/31 | | | 1.150%(A) | | 1 Day SONIA(1)(A) | | | (18,372 | ) | | | 9,191 | | | | 27,563 | |
GBP | | | 340 | | | | 05/08/32 | | | 1.150%(A) | | 1 Day SONIA(1)(A) | | | (18,242 | ) | | | 8,101 | | | | 26,343 | |
GBP | | | 155 | | | | 05/08/34 | | | 1.200%(A) | | 1 Day SONIA(1)(A) | | | (5,055 | ) | | | 2,484 | | | | 7,539 | |
GBP | | | 65 | | | | 05/08/42 | | | 1.250%(A) | | 1 Day SONIA(1)(A) | | | (9,659 | ) | | | 500 | | | | 10,159 | |
HUF | | | 1,072,000 | | | | 02/14/30 | | | 1.605%(A) | | 6 Month BUBOR(2)(S) | | | — | | | | (743,433 | ) | | | (743,433 | ) |
PLN | | | 3,230 | | | | 01/21/31 | | | 1.170%(A) | | 6 Month WIBOR(2)(S) | | | (4,484 | ) | | | (156,379 | ) | | | (151,895 | ) |
PLN | | | 2,720 | | | | 08/02/31 | | | 1.650%(A) | | 6 Month WIBOR(2)(S) | | | (7,928 | ) | | | (108,542 | ) | | | (100,614 | ) |
See Notes to Financial Statements.
76
Interest rate swap agreements outstanding at February 28, 2022 (continued):
| | | | | | | | | | | | | | | | | | | | | | | | | | |
Notional
Amount
(000)# | | | Termination
Date | | | Fixed
Rate | | | Floating
Rate | | Value at
Trade Date | | | Value at
February 28,
2022 | | | Unrealized
Appreciation
(Depreciation) | |
| | | | | | | | | | | | | | | | | | | | | | | |
Centrally Cleared Interest Rate Swap Agreements (cont’d.): | | | | | | | | | | | | |
| | | 14,800 | | | | 08/15/28 | | | | 1.220%(A) | | | 1 Day SOFR(1)(A) | | $ | — | | | $ | 312,118 | | | $ | 312,118 | |
ZAR | | | 22,000 | | | | 02/11/30 | | | | 7.481%(Q) | | | 3 Month JIBAR(2)(Q) | | | (1,207 | ) | | | 13,835 | | | | 15,042 | |
ZAR | | | 36,300 | | | | 02/28/30 | | | | 7.500%(Q) | | | 3 Month JIBAR(2)(Q) | | | (11,368 | ) | | | 20,575 | | | | 31,943 | |
ZAR | | | 35,600 | | | | 03/02/30 | | | | 7.625%(Q) | | | 3 Month JIBAR(2)(Q) | | | 819 | | | | 58,834 | | | | 58,015 | |
ZAR | | | 37,400 | | | | 03/12/30 | | | | 7.840%(Q) | | | 3 Month JIBAR(2)(Q) | | | (280 | ) | | | 92,366 | | | | 92,646 | |
ZAR | | | 24,800 | | | | 03/12/30 | | | | 7.900%(Q) | | | 3 Month JIBAR(2)(Q) | | | (193 | ) | | | 67,438 | | | | 67,631 | |
ZAR | | | 85,000 | | | | 03/18/30 | | | | 10.650%(Q) | | | 3 Month JIBAR(2)(Q) | | | — | | | | 431,535 | | | | 431,535 | |
ZAR | | | 7,700 | | | | 03/27/30 | | | | 9.150%(Q) | | | 3 Month JIBAR(2)(Q) | | | (131 | ) | | | 59,920 | | | | 60,051 | |
ZAR | | | 16,300 | | | | 04/01/30 | | | | 8.600%(Q) | | | 3 Month JIBAR(2)(Q) | | | (58 | ) | | | 88,996 | | | | 89,054 | |
ZAR | | | 35,900 | | | | 04/03/30 | | | | 9.300%(Q) | | | 3 Month JIBAR(2)(Q) | | | (592 | ) | | | 299,306 | | | | 299,898 | |
ZAR | | | 17,300 | | | | 06/12/30 | | | | 7.250%(Q) | | | 3 Month JIBAR(2)(Q) | | | (858 | ) | | | (3,150 | ) | | | (2,292 | ) |
ZAR | | | 114,900 | | | | 07/07/30 | | | | 7.040%(Q) | | | 3 Month JIBAR(2)(Q) | | | (2,710 | ) | | | (145,966 | ) | | | (143,256 | ) |
ZAR | | | 30,200 | | | | 08/03/30 | | | | 7.030%(Q) | | | 3 Month JIBAR(2)(Q) | | | 3,459 | | | | (46,854 | ) | | | (50,313 | ) |
ZAR | | | 96,100 | | | | 03/18/31 | | | | 7.660%(Q) | | | 3 Month JIBAR(2)(Q) | | | 99,746 | | | | 99,577 | | | | (169 | ) |
ZAR | | | 30,800 | | | | 10/28/31 | | | | 7.780%(Q) | | | 3 Month JIBAR(2)(Q) | | | (7,103 | ) | | | 28,354 | | | | 35,457 | |
| | | | | | | | | | | | | | | | | | | | | | | | | | |
| | | | | | | |
| | | | | | | | | | | | | | | | $ | (1,029,747 | ) | | $ | (5,168,543 | ) | | $ | (4,138,796 | ) |
| | | | | | | | | | | | | | | | | | | | | | | | | | |
| (1) | The Fund pays the fixed rate and receives the floating rate. |
| (2) | The Fund pays the floating rate and receives the fixed rate. |
Total return swap agreements outstanding at February 28, 2022:
| | | | | | | | | | | | | | | | | | | | | | | | |
| Reference Entity | | Financing
Rate | | Counterparty | | Termination
Date | | | Long
(Short)
Notional
Amount
(000)#(1) | | | Fair
Value | | | Upfront
Premiums
Paid
(Received) | | | Unrealized
Appreciation
(Depreciation)(2) | |
| | | | | | | | | | | | | | | | | | | | | | | | |
OTC Total Return Swap Agreement: | | | | | | | | | | | | | | | | | | | | |
iBoxx US Dollar Liquid High Yield Index(T) | | 3 Month LIBOR(T) | | BNP Paribas S.A. | | | 3/20/22 | | | | 16,780 | | | $ | (475,753 | ) | | $ | — | | | $ | (475,753 | ) |
| | | | | | | | | | | | | | | | | | | | | | | | |
See Notes to Financial Statements.
PGIM Strategic Bond Fund 77
Schedule of Investments (continued)
as of February 28, 2022
| (1) | On a long total return swap, the Fund receives payments for any positive return on the reference entity (makes payments for any negative return) and pays the financing rate. On a short total return swap, the Fund makes payments for any positive return on the reference entity (receives payments for any negative return) and receives the financing rate. |
| (2) | Upfront/recurring fees or commissions, as applicable, are included in the net unrealized appreciation (depreciation). |
Reverse repurchase agreements outstanding at February 28, 2022:
| | | | | | | | | | | | | | | | | | | | |
Broker | | Interest
Rate | | | Trade
Date | | | Cost | | | Maturity
Date | | | Value at
February 28,
2022 | |
BNP Paribas S.A. | | | 0.100% | | | | 02/09/22 | | | $ | 1,455,904 | | | | 03/11/22 | | | $ | 1,455,904 | |
BNP Paribas S.A. | | | 0.100% | | | | 02/09/22 | | | | 2,780,597 | | | | 03/11/22 | | | | 2,780,597 | |
BNP Paribas S.A. | | | 0.100% | | | | 02/09/22 | | | | 7,240,237 | | | | 03/11/22 | | | | 7,240,237 | |
BNP Paribas S.A. | | | 0.100% | | | | 02/09/22 | | | | 4,021,710 | | | | 03/11/22 | | | | 4,021,710 | |
BNP Paribas S.A. | | | 0.100% | | | | 02/09/22 | | | | 1,276,187 | | | | 03/11/22 | | | | 1,276,187 | |
BNP Paribas S.A. | | | 0.100% | | | | 02/09/22 | | | | 1,261,083 | | | | 03/11/22 | | | | 1,261,083 | |
BNP Paribas S.A. | | | 0.290% | | | | 02/09/22 | | | | 2,696,100 | | | | 03/11/22 | | | | 2,696,100 | |
BNP Paribas S.A. | | | 0.290% | | | | 02/09/22 | | | | 3,820,781 | | | | 03/11/22 | | | | 3,820,781 | |
BNP Paribas S.A. | | | 0.290% | | | | 02/09/22 | | | | 5,711,448 | | | | 03/11/22 | | | | 5,711,448 | |
BNP Paribas S.A. | | | 0.290% | | | | 02/09/22 | | | | 3,739,556 | | | | 03/11/22 | | | | 3,739,556 | |
BNP Paribas S.A. | | | 0.290% | | | | 02/09/22 | | | | 3,245,238 | | | | 03/11/22 | | | | 3,245,238 | |
BNP Paribas S.A. | | | 0.290% | | | | 02/09/22 | | | | 2,860,232 | | | | 03/11/22 | | | | 2,860,232 | |
BNP Paribas S.A. | | | 0.290% | | | | 02/09/22 | | | | 3,045,788 | | | | 03/11/22 | | | | 3,045,788 | |
| | | | | | | | | | | | | | | | | | | | |
| | | | | |
| | | | | | | | | | $ | 43,154,861 | | | | | | | $ | 43,154,861 | |
| | | | | | | | | | | | | | | | | | | | |
During the reporting period ended February 28, 2022, Strategic Bond Fund held reverse repurchase agreements the entire period with an average value of $6,319,392 and a daily weighted average interest rate of 0.209%. In addition, Corporate Bonds and U.S. Treasury Obligations with a combined market value of $44,345,910 have been segregated as collateral to cover the requirement for the reverse repurchase agreements outstanding at period end.
Balances Reported in the Statement of Assets and Liabilities for OTC Swap Agreements:
| | | | | | | | | | | | | | |
| | | | |
| | | Premiums Paid | | | Premiums Received | | Unrealized
Appreciation | | | Unrealized
Depreciation | |
| | | | |
OTC Swap Agreements | | | $1,139,857 | | | $(433,121) | | | $468,289 | | | | $(1,525,918) | |
See Notes to Financial Statements.
78
Summary of Collateral for Centrally Cleared/Exchange-traded Derivatives:
Cash and securities segregated as collateral, including pending settlement for closed positions, to cover requirements for centrally cleared/exchange-traded derivatives are listed by broker as follows:
| | | | | | | | | | |
Broker | | Cash and/or Foreign Currency | | Securities Market Value |
Citigroup Global Markets, Inc. | | | $ | — | | | | $ | 19,799,304 | |
| | | | | | | | | | |
Fair Value Measurements:
Various inputs are used in determining the value of the Fund’s investments. These inputs are summarized in the three broad levels listed below.
Level 1—unadjusted quoted prices generally in active markets for identical securities.
Level 2—quoted prices for similar securities, interest rates and yield curves, prepayment speeds, foreign currency exchange rates and other observable inputs.
Level 3—unobservable inputs for securities valued in accordance with Board approved fair valuation procedures.
The following is a summary of the inputs used as of February 28, 2022 in valuing such portfolio securities:
| | | | | | | | | | | | |
| | | Level 1 | | | Level 2 | | | Level 3 | |
| | | |
Investments in Securities | | | | | | | | | | | | |
Assets | | | | | | | | | | | | |
Long-Term Investments | | | | | | | | | | | | |
Asset-Backed Securities | | | | | | | | | | | | |
Automobiles | | $ | — | | | $ | 11,478,451 | | | $ | — | |
Collateralized Loan Obligations | | | — | | | | 177,941,369 | | | | — | |
Consumer Loans | | | — | | | | 4,922,241 | | | | — | |
Other | | | — | | | | 15,650,922 | | | | — | |
Residential Mortgage-Backed Securities | | | — | | | | 11,872,627 | | | | — | |
Student Loans | | | — | | | | 6,549,834 | | | | — | |
Bank Loans | | | — | | | | 31,551,216 | | | | 5,570,299 | |
Commercial Mortgage-Backed Securities | | | — | | | | 161,520,752 | | | | 5,500,000 | |
Corporate Bonds | | | — | | | | 886,229,119 | | | | 18,342,144 | |
Municipal Bonds | | | — | | | | 4,091,271 | | | | — | |
Residential Mortgage-Backed Securities | | | — | | | | 140,260,194 | | | | 10,999,092 | |
Sovereign Bonds | | | — | | | | 57,513,363 | | | | — | |
U.S. Treasury Obligations | | | — | | | | 52,865,310 | | | | — | |
Common Stocks | | | 10,734,306 | | | | 5,322,849 | | | | 94,780 | |
Rights | | | — | | | | — | | | | 10,473 | |
Warrants | | | — | | | | — | | | | 6,997 | |
Short-Term Investments | | | | | | | | | | | | |
Affiliated Mutual Fund | | | 97,074,951 | | | | — | | | | — | |
Unaffiliated Fund | | | 38,353,180 | | | | — | | | | — | |
| | | | | | | | | | | | |
| | | |
Total | | $ | 146,162,437 | | | $ | 1,567,769,518 | | | $ | 40,523,785 | |
| | | | | | | | | | | | |
| | | |
Liabilities | | | | | | | | | | | | |
Options Written | | $ | — | | | $ | (158,429 | ) | | $ | (2,917 | ) |
| | | | | | | | | | | | |
See Notes to Financial Statements.
PGIM Strategic Bond Fund 79
Schedule of Investments (continued)
as of February 28, 2022
| | | | | | | | | | | | | | | |
| | | Level 1 | | Level 2 | | Level 3 |
| | | |
Other Financial Instruments* | | | | | | | | | | | | | | | |
Assets | | | | | | | | | | | | | | | |
Futures Contracts | | | $ | 8,554,151 | | | | $ | — | | | | $ | — | |
OTC Forward Foreign Currency Exchange Contracts | | | | — | | | | | 27,028,332 | | | | | — | |
Centrally Cleared Credit Default Swap Agreement | | | | — | | | | | 952,854 | | | | | — | |
OTC Credit Default Swap Agreements | | | | — | | | | | 1,390,649 | | | | | 65,365 | |
Centrally Cleared Interest Rate Swap Agreements | | | | — | | | | | 3,223,480 | | | | | — | |
| | | | | | | | | | | | | | | |
| | | |
Total | | | $ | 8,554,151 | | | | $ | 32,595,315 | | | | $ | 65,365 | |
| | | | | | | | | | | | | | | |
| | | |
Liabilities | | | | | | | | | | | | | | | |
Futures Contracts | | | $ | (2,260,703 | ) | | | $ | — | | | | $ | — | |
OTC Forward Foreign Currency Exchange Contracts | | | | — | | | | | (23,304,164 | ) | | | | — | |
Centrally Cleared Credit Default Swap Agreement | | | | — | | | | | (1,996,980 | ) | | | | — | |
OTC Credit Default Swap Agreements | | | | — | | | | | (1,331,154 | ) | | | | — | |
Centrally Cleared Inflation Swap Agreements | | | | — | | | | | (1,923,837 | ) | | | | — | |
Centrally Cleared Interest Rate Swap Agreements | | | | — | | | | | (7,362,276 | ) | | | | — | |
OTC Total Return Swap Agreement | | | | — | | | | | (475,753 | ) | | | | — | |
| | | | | | | | | | | | | | | |
| | | |
Total | | | $ | (2,260,703 | ) | | | $ | (36,394,164 | ) | | | $ | — | |
| | | | | | | | | | | | | | | |
| * | Other financial instruments are derivative instruments not reflected in the Schedule of Investments, such as futures, forwards and centrally cleared swap contracts, which are recorded at the unrealized appreciation (depreciation) on the instrument, and OTC swap contracts which are recorded at fair value. |
The following is a reconciliation of assets in which unobservable inputs (Level 3) were used in determining fair value:
| | | | | | | | | | | | | | | | | | | | | | | | | |
| | | Bank
Loans | | Commercial
Mortgage-
Backed
Securities | | Corporate
Bonds | | Residential
Mortgage-Backed
Securities | | Common
Stocks |
Balance as of 02/28/21 | | | $ | 7,073,890 | | | | $ | — | | | | $ | 2,200,000 | | | | $ | 7,073,613 | | | | $ | 94,780 | |
Realized gain (loss) | | | | 468,924 | | | | | — | | | | | — | | | | | — | | | | | — | |
Change in unrealized appreciation (depreciation) | | | | (137,701 | ) | | | | — | | | | | (1,306,146 | ) | | | | 36,016 | | | | | — | |
Purchases/Exchanges/Issuances | | | | 4,794,070 | | | | | 5,500,000 | | | | | 17,219,983 | | | | | 18,300,001 | | | | | — | |
Sales/Paydowns | | | | (5,960,477 | ) | | | | — | | | | | — | | | | | (14,410,538 | ) | | | | — | |
Accrued discount/premium | | | | 1,068 | | | | | — | | | | | 228,307 | | | | | — | | | | | — | |
Transfers into Level 3* | | | | — | | | | | — | | | | | — | | | | | — | | | | | — | |
Transfers out of Level 3* | | | | (669,475 | ) | | | | — | | | | | — | | | | | — | | | | | — | |
| | | | | | | | | | | | | | | | | | | | | | | | | |
Balance as of 02/28/22 | | | $ | 5,570,299 | | | | $ | 5,500,000 | | | | $ | 18,342,144 | | | | $ | 10,999,092 | | | | $ | 94,780 | |
| | | | | | | | | | | | | | | | | | | | | | | | | |
Change in unrealized appreciation (depreciation) relating to securities still held at reporting period end | | | $ | 20,554 | | | | $ | — | | | | $ | (1,306,146 | ) | | | $ | 470 | | | | $ | — | |
| | | | | | | | | | | | | | | | | | | | | | | | | |
See Notes to Financial Statements.
80
| | | | | | | | | | | | | | | | | | | | |
| | | Rights | | Warrants | | Options
Written | | OTC
Credit Default Swap
Agreements |
Balance as of 02/28/21 | | | $ | — | | | | $ | — | | | | $ | — | | | | $ | 10,888 | |
Realized gain (loss) | | | | — | | | | | — | | | | | — | | | | | 9,606 | |
Change in unrealized appreciation (depreciation) | | | | 10,473 | | | | | 6,997 | | | | | (2,917 | ) | | | | 65,365 | |
Purchases/Exchanges/Issuances | | | | — | | | | | — | | | | | — | | | | | — | |
Sales/Paydowns | | | | — | | | | | — | | | | | — | | | | | (20,494 | ) |
Accrued discount/premium | | | | — | | | | | — | | | | | — | | | | | — | |
Transfers into Level 3* | | | | — | | | | | — | | | | | — | | | | | — | |
Transfers out of Level 3* | | | | — | | | | | — | | | | | — | | | | | — | |
| | | | | | | | | | | | | | | | | | | | |
Balance as of 02/28/22 | | | $ | 10,473 | | | | $ | 6,997 | | | | $ | (2,917 | ) | | | $ | 65,365 | |
| | | | | | | | | | | | | | | | | | | | |
Change in unrealized appreciation (depreciation) relating to securities still held at reporting period end | | | $ | 10,473 | | | | $ | 6,997 | | | | $ | (2,917 | ) | | | $ | 65,365 | |
| | | | | | | | | | | | | | | | | | | | |
* It is the Fund’s policy to recognize transfers in and transfers out at the fair value as of the beginning of period. Securities transferred levels due to a change in observable and/or unobservable inputs.
Level 3 securities as presented in the table above are being fair valued using pricing methodologies approved by the Board, which contain unobservable inputs as follows:
| | | | | | | | | | | |
Level 3 Securities** | | Fair Value as of
February 28, 2022 | | Valuation
Approach | | Valuation
Methodology | | Unobservable Inputs |
Bank Loans | | | $ | 4,821,375 | | | Market | | Market Approach | | Unadjusted Purchase Price |
Corporate Bonds | | | | 2,200,000 | | | Market | | Comparable Bond Spread | | Adjusted Credit Spread |
Corporate Bonds | | | | 20,060 | | | Market | | Market Approach | | Unadjusted Last Trade Price |
Corporate Bonds | | | | 9,500,000 | | | Market | | Market Approach | | Unadjusted Purchase Price |
Corporate Bonds | | | | 5 | | | Market | | Worthless | | Estimated Future Distributions |
Residential Mortgage-Backed Securities | | | | 471 | | | Market | | Pro Rata Distribution | | Estimated Distribution |
Rights | | | | 10,473 | | | Market | | Enterprise Value | | Estimated Weighted
value |
| | | | | | | | | | | |
| | | $ | 16,552,384 | | | | | | | |
| | | | | | | | | | | |
| ** | The table does not include Level 3 securities and/or derivatives that are valued by independent pricing vendors or brokers. As of February 28, 2022, the aggregate value of these securities and/or derivatives was $24,033,849. The unobservable inputs for these investments were not developed by the Fund and are not readily available. |
See Notes to Financial Statements.
PGIM Strategic Bond Fund 81
Schedule of Investments (continued)
as of February 28, 2022
Industry Classification:
The industry classification of investments and liabilities in excess of other assets shown as a percentage of net assets as of February 28, 2022 were as follows (unaudited):
| | | | |
Collateralized Loan Obligations | | | 11.0 | % |
Commercial Mortgage-Backed Securities | | | 10.3 | |
Residential Mortgage-Backed Securities | | | 10.1 | |
Banks | | | 9.0 | |
Affiliated Mutual Fund (6.0% represents investments purchased with collateral from securities on loan) | | | 6.0 | |
Oil & Gas | | | 5.1 | |
Telecommunications | | | 4.3 | |
Electric | | | 3.9 | |
Sovereign Bonds | | | 3.6 | |
U.S. Treasury Obligations | | | 3.3 | |
Media | | | 2.8 | |
Unaffiliated Fund | | | 2.4 | |
Retail | | | 2.4 | |
Diversified Financial Services | | | 2.1 | |
Chemicals | | | 2.0 | |
Commercial Services | | | 1.8 | |
Foods | | | 1.8 | |
Pharmaceuticals | | | 1.7 | |
Entertainment | | | 1.7 | |
Pipelines | | | 1.3 | |
Home Builders | | | 1.3 | |
Gas | | | 1.2 | |
Mining | | | 1.2 | |
Packaging & Containers | | | 1.1 | |
Healthcare-Services | | | 1.1 | |
Aerospace & Defense | | | 1.0 | |
Engineering & Construction | | | 1.0 | |
Other | | | 1.0 | |
Lodging | | | 0.9 | |
Real Estate Investment Trusts (REITs) | | | 0.8 | |
Auto Manufacturers | | | 0.8 | |
Computers | | | 0.8 | |
Auto Parts & Equipment | | | 0.8 | |
Internet | | | 0.7 | |
Automobiles | | | 0.7 | |
Building Materials | | | 0.7 | |
Oil, Gas & Consumable Fuels | | | 0.7 | |
| | | | |
Real Estate | | | 0.6 | % |
Airlines | | | 0.6 | |
Leisure Time | | | 0.6 | |
Insurance | | | 0.4 | |
Student Loans | | | 0.4 | |
Consumer Loans | | | 0.3 | |
Investment Companies | | | 0.3 | |
Agriculture | | | 0.3 | |
Healthcare-Products | | | 0.3 | |
Distribution/Wholesale | | | 0.3 | |
Municipal Bonds | | | 0.2 | |
Gas Utilities | | | 0.2 | |
Household Products/Wares | | | 0.2 | |
Energy-Alternate Sources | | | 0.2 | |
Forest Products & Paper | | | 0.2 | |
Iron/Steel | | | 0.2 | |
Machinery-Diversified | | | 0.1 | |
Electrical Components & Equipment | | | 0.1 | |
Advertising | | | 0.1 | |
Beverages | | | 0.1 | |
Semiconductors | | | 0.1 | |
Diversified Telecommunication Services | | | 0.1 | |
Transportation | | | 0.1 | |
Environmental Control | | | 0.1 | |
Electronics | | | 0.0 | * |
Holding Companies-Diversified | | | 0.0 | * |
Independent Power & Renewable Electricity Producers | | | 0.0 | * |
Electric Utilities | | | 0.0 | * |
Software | | | 0.0 | * |
| | | | |
| | | 108.5 | |
Options Written | | | (0.0 | )* |
Liabilities in excess of other assets | | | (8.5 | ) |
| | | | |
| | | 100.0 | % |
| | | | |
See Notes to Financial Statements.
82
Effects of Derivative Instruments on the Financial Statements and Primary Underlying Risk Exposure:
The Fund invested in derivative instruments during the reporting period. The primary types of risk associated with these derivative instruments are credit contracts risk, foreign exchange contracts risk and interest rate contracts risk. See the Notes to Financial Statements for additional detail regarding these derivative instruments and their risks. The effect of such derivative instruments on the Fund’s financial position and financial performance as reflected in the Statement of Assets and Liabilities and Statement of Operations is presented in the summary below.
Fair values of derivative instruments as of February 28, 2022 as presented in the Statement of Assets and Liabilities:
| | | | | | | | | | | | |
| | | Asset Derivatives | | | Liability Derivatives | |
Derivatives not accounted for as hedging instruments, carried at fair value | | Statement of Assets and Liabilities Location | | Fair
Value | | | Statement of Assets and Liabilities Location | | Fair
Value | |
Credit contracts | | Due from/to broker-variation margin swaps | | $ | 952,854 | * | | Due from/to broker-variation margin swaps | | $ | 1,996,980 | * |
Credit contracts | | Premiums paid for OTC swap agreements | | | 1,139,857 | | | Premiums received for OTC swap agreements | | | 433,121 | |
Credit contracts | | — | | | — | | | Options written outstanding, at value | | | 161,346 | |
Credit contracts | | Unrealized appreciation on OTC swap agreements | | | 468,289 | | | Unrealized depreciation on OTC swap agreements | | | 1,050,165 | |
Foreign exchange contracts | | Unrealized appreciation on OTC forward foreign currency exchange contracts | | | 27,028,332 | | | Unrealized depreciation on OTC forward foreign currency exchange contracts | | | 23,304,164 | |
Interest rate contracts | | Due from/to broker-variation margin futures | | | 8,554,151 | * | | Due from/to broker-variation margin futures | | | 2,260,703 | * |
Interest rate contracts | | Due from/to broker-variation margin swaps | | | 3,223,480 | * | | Due from/to broker-variation margin swaps | | | 9,286,113 | * |
Interest rate contracts | | — | | | — | | | Unrealized depreciation on OTC swap agreements | | | 475,753 | |
| | | | | | | | | | | | |
| | | | $ | 41,366,963 | | | | | $ | 38,968,345 | |
| | | | | | | | | | | | |
| * | Includes cumulative appreciation (depreciation) as reported in the schedule of open futures and centrally cleared swap contracts. Only unsettled variation margin receivable (payable) is reported within the Statement of Assets and Liabilities. |
See Notes to Financial Statements.
PGIM Strategic Bond Fund 83
Schedule of Investments (continued)
as of February 28, 2022
The effects of derivative instruments on the Statement of Operations for the year ended February 28, 2022 are as follows:
| | | | | | | | | | | | | | | | | | | | |
Amount of Realized Gain (Loss) on Derivatives Recognized in Income | |
Derivatives not accounted for as hedging instruments, carried at fair value | | Options
Purchased(1) | | | Options
Written | | | Futures | | | Forward
Currency
Exchange
Contracts | | | Swaps | |
Credit contracts | | $ | (793,159 | ) | | $ | 1,155,206 | | | $ | — | | | $ | — | | | $ | 8,097,241 | |
Foreign exchange contracts | | | — | | | | — | | | | — | | | | 20,782,553 | | | | — | |
Interest rate contracts | | | — | | | | — | | | | (14,874,817 | ) | | | — | | | | (19,994,659 | ) |
| | | | | | | | | | | | | | | | | | | | |
Total | | $ | (793,159 | ) | | $ | 1,155,206 | | | $ | (14,874,817 | ) | | $ | 20,782,553 | | | $ | (11,897,418 | ) |
| | | | | | | | | | | | | | | | | | | | |
| (1) | Included in net realized gain (loss) on investment transactions in the Statement of Operations. |
| | | | | | | | | | | | | | | | |
Change in Unrealized Appreciation (Depreciation) on Derivatives Recognized in Income | |
Derivatives not accounted for as hedging instruments, carried at fair value | | Options
Written | | | Futures | | | Forward
Currency
Exchange
Contracts | | | Swaps | |
Credit contracts | | $ | 71,102 | | | $ | — | | | $ | — | | | $ | (3,504,251 | ) |
Foreign exchange contracts | | | — | | | | — | | | | 421,852 | | | | — | |
Interest rate contracts | | | — | | | | 10,759,128 | | | | — | | | | 7,960 | |
| | | | | | | | | | | | | | | | |
Total | | $ | 71,102 | | | $ | 10,759,128 | | | $ | 421,852 | | | $ | (3,496,291 | ) |
| | | | | | | | | | | | | | | | |
For the year ended February 28, 2022, the Fund’s average volume of derivative activities is as follows:
| | | | | | | | |
Options
Purchased(1) | | Options
Written(2) | | Futures
Contracts—
Long
Positions(2) | | Futures
Contracts—
Short
Positions(2) | | Forward Foreign
Currency Exchange
Contracts— Purchased(3) |
| $134,928 | | $87,038,845 | | $756,879,606 | | $1,195,947,496 | | $637,312,484 |
| | | | |
Forward Foreign
Currency Exchange
Contracts—Sold(3) | | Interest Rate
Swap
Agreements(2) | | Credit Default
Swap Agreements—
Buy Protection(2) |
| $916,087,445 | | $282,782,792 | | $85,864,493 |
| | | | | | |
Credit Default
Swap Agreements—
Sell Protection(2) | | Currency
Swap
Agreements(2) | | Total Return
Swap
Agreements(2) | | Inflation Swap
Agreements(2) |
| $313,315,025 | | $107,800 | | $6,712,000 | | $30,036,000 |
| (2) | Notional Amount in USD. |
| (3) | Value at Settlement Date. |
Average volume is based on average quarter end balances as noted for the year ended February 28, 2022.
See Notes to Financial Statements.
84
Financial Instruments/Transactions—Summary of Offsetting and Netting Arrangements:
The Fund invested in OTC derivatives and entered into financial instruments/transactions during the reporting period that are either offset in accordance with current requirements or are subject to enforceable master netting arrangements or similar agreements that permit offsetting. The information about offsetting and related netting arrangements for OTC derivatives and financial instruments/transactions where the legal right to set-off exists is presented in the summary below.
Offsetting of financial instrument/transaction assets and liabilities:
| | | | | | | | | | | | | | |
| Description | | Counterparty | | Gross Market
Value of
Recognized
Assets/(Liabilities) | | | Collateral
Pledged/(Received)(2) | | | Net
Amount | |
Securities on Loan | | N/A | | $ | 91,759,782 | | | | $(91,759,782) | | | | $— | |
Reverse Repurchase Agreements | | BNP Paribas S.A. | | | (43,154,861 | ) | | | 43,154,861 | | | | — | |
| | | | | | | | | | | | | | |
| | | | $ | 48,604,921 | | | | | | | | | |
| | | | | | | | | | | | | | |
| | | | | | | | | | | | | | | |
Offsetting of OTC derivative assets and liabilities:
| | | | | | | | | | | | | | | | | | | | | | | | | |
Counterparty | | Gross Amounts of
Recognized
Assets(1) | | Gross Amounts of
Recognized
Liabilities(1) | | Net Amounts of
Recognized
Assets/(Liabilities) | | Collateral
Pledged/(Received)(2) | | Net Amount |
Bank of America, N.A. | | | $ | 57,965 | | | | $ | (133,858 | ) | | | $ | (75,893 | ) | | | $ | — | | | | $ | (75,893 | ) |
Barclays Bank PLC | | | | 4,188,139 | | | | | (3,193,286 | ) | | | | 994,853 | | | | | — | | | | | 994,853 | |
BNP Paribas S.A. | | | | 2,351,366 | | | | | (1,003,794 | ) | | | | 1,347,572 | | | | | (1,164,436 | ) | | | | 183,136 | |
Citibank, N.A. | | | | 1,314,708 | | | | | (915,004 | ) | | | | 399,704 | | | | | (399,704 | ) | | | | — | |
Credit Suisse International | | | | 2,676,118 | | | | | (1,403,090 | ) | | | | 1,273,028 | | | | | (1,273,028 | ) | | | | — | |
Deutsche Bank AG | | | | 19,218 | | | | | (19,218 | ) | | | | — | | | | | — | | | | | — | |
Goldman Sachs International | | | | 1,108,285 | | | | | (1,213,130 | ) | | | | (104,845 | ) | | | | 104,845 | | | | | — | |
HSBC Bank PLC | | | | 800,693 | | | | | (3,699,151 | ) | | | | (2,898,458 | ) | | | | 2,898,458 | | | | | — | |
JPMorgan Chase Bank, N.A. | | | | 3,535,518 | | | | | (2,871,785 | ) | | | | 663,733 | | | | | — | | | | | 663,733 | |
Morgan Stanley & Co. International PLC | | | | 6,956,734 | | | | | (10,093,712 | ) | | | | (3,136,978 | ) | | | | — | | | | | (3,136,978 | ) |
Standard Chartered Bank | | | | 3,588,001 | | | | | (594,474 | ) | | | | 2,993,527 | | | | | (2,680,000 | ) | | | | 313,527 | |
The Toronto-Dominion Bank | | | | 374,427 | | | | | — | | | | | 374,427 | | | | | (260,000 | ) | | | | 114,427 | |
UBS AG | | | | 1,665,306 | | | | | (284,047 | ) | | | | 1,381,259 | | | | | (325,801 | ) | | | | 1,055,458 | |
| | | | | | | | | | | | | | | | | | | | | | | | | |
| | | $ | 28,636,478 | | | | $ | (25,424,549 | ) | | | $ | 3,211,929 | | | | $ | (3,099,666 | ) | | | $ | 112,263 | |
| | | | | | | | | | | | | | | | | | | | | | | | | |
See Notes to Financial Statements.
PGIM Strategic Bond Fund 85
Schedule of Investments (continued)
as of February 28, 2022
| (1) | Includes unrealized appreciation/(depreciation) on swaps and forwards, premiums paid/(received) on swap agreements and market value of purchased and written options, as represented on the Statement of Assets and Liabilities. |
| (2) | Collateral amount disclosed by the Fund is limited to the market value of financial instruments/transactions and the Fund’s OTC derivative exposure by counterparty. |
See Notes to Financial Statements.
86
Statement of Assets and Liabilities
as of February 28, 2022
| | | | |
| |
Assets | | | | |
Investments at value, including securities on loan of $91,759,782: | | | | |
Unaffiliated investments (cost $1,707,944,382) | | $ | 1,657,380,789 | |
Affiliated investments (cost $97,069,950) | | | 97,074,951 | |
Cash | | | 1,804,927 | |
Foreign currency, at value (cost $2,846,716) | | | 2,835,081 | |
Cash segregated for counterparty - OTC and reverse repurchase agreements | | | 777,000 | |
Unrealized appreciation on OTC forward foreign currency exchange contracts | | | 27,028,332 | |
Dividends and interest receivable | | | 14,417,182 | |
Receivable for Fund shares sold | | | 9,116,356 | |
Due from broker—variation margin futures | | | 2,387,577 | |
Premiums paid for OTC swap agreements | | | 1,139,857 | |
Unrealized appreciation on OTC swap agreements | | | 468,289 | |
Receivable for investments sold | | | 133,724 | |
Prepaid expenses and other assets | | | 779,761 | |
| | | | |
Total Assets | | | 1,815,343,826 | |
| | | | |
| |
Liabilities | | | | |
Payable to broker for collateral for securities on loan | | | 97,064,422 | |
Reverse repurchase agreements (cost $43,154,861) | | | 43,154,861 | |
Unrealized depreciation on OTC forward foreign currency exchange contracts | | | 23,304,164 | |
Payable for investments purchased | | | 16,401,805 | |
Payable for Fund shares purchased | | | 14,371,390 | |
Unrealized depreciation on OTC swap agreements | | | 1,525,918 | |
Due to broker—variation margin swaps | | | 697,475 | |
Accrued expenses and other liabilities | | | 634,355 | |
Management fee payable | | | 562,661 | |
Premiums received for OTC swap agreements | | | 433,121 | |
Options written outstanding, at value (premiums received $232,448) | | | 161,346 | |
Distribution fee payable | | | 59,140 | |
Dividends payable | | | 52,154 | |
Trustees’ fees payable | | | 4,134 | |
Affiliated transfer agent fee payable | | | 1,619 | |
| | | | |
Total Liabilities | | | 198,428,565 | |
| | | | |
| |
Net Assets | | $ | 1,616,915,261 | |
| | | | |
| |
| | | | | |
Net assets were comprised of: | | | | |
Shares of beneficial interest, at par | | $ | 166,884 | |
Paid-in capital in excess of par | | | 1,750,697,626 | |
Total distributable earnings (loss) | | | (133,949,249 | ) |
| | | | |
Net assets, February 28, 2022 | | $ | 1,616,915,261 | |
| | | | |
See Notes to Financial Statements.
PGIM Strategic Bond Fund 87
Statement of Assets and Liabilities
as of February 28, 2022
| | | | | | | | |
Class A | | | | | | | | |
| | |
Net asset value and redemption price per share, ($78,153,705 ÷ 8,062,920 shares of beneficial interest issued and outstanding) | | | $ 9.69 | | | | | |
| | |
Maximum sales charge (3.25% of offering price) | | | 0.33 | | | | | |
| | | | | | | | |
| | |
Maximum offering price to public | | | $10.02 | | | | | |
| | | | | | | | |
| | |
Class C | | | | | | | | |
| | |
Net asset value, offering price and redemption price per share, ($56,098,972 ÷ 5,796,479 shares of beneficial interest issued and outstanding) | | | $ 9.68 | | | | | |
| | | | | | | | |
| | |
Class Z | | | | | | | | |
| | |
Net asset value, offering price and redemption price per share, ($1,445,527,170 ÷ 149,194,079 shares of beneficial interest issued and outstanding) | | | $ 9.69 | | | | | |
| | | | | | | | |
| | |
Class R6 | | | | | | | | |
| | |
Net asset value, offering price and redemption price per share, ($37,135,414 ÷ 3,830,319 shares of beneficial interest issued and outstanding) | | | $ 9.70 | | | | | |
| | | | | | | | |
See Notes to Financial Statements.
88
Statement of Operations
Year Ended February 28, 2022
| | | | |
Net Investment Income (Loss) | | | | |
Income | | | | |
Interest income (net of $12,394 foreign withholding tax) | | $ | 70,484,421 | |
Unaffiliated dividend income (net of $64 foreign withholding tax) | | | 608,309 | |
Income from securities lending, net (including affiliated income of $21,848) | | | 308,150 | |
Affiliated dividend income | | | 45,396 | |
| | | | |
Total income | | | 71,446,276 | |
| | | | |
| |
Expenses | | | | |
Management fee | | | 11,215,795 | |
Distribution fee(a) | | | 822,378 | |
Transfer agent’s fees and expenses (including affiliated expense of $45,256)(a) | | | 2,285,406 | |
Custodian and accounting fees | | | 201,575 | |
Registration fees(a) | | | 128,602 | |
Shareholders’ reports | | | 113,207 | |
Audit fee | | | 61,107 | |
SEC registration fees | | | 54,268 | |
Trustees’ fees | | | 29,694 | |
Legal fees and expenses | | | 29,083 | |
Miscellaneous | | | 48,353 | |
| | | | |
Total expenses | | | 14,989,468 | |
Less: Fee waiver and/or expense reimbursement(a) | | | (2,261,130 | ) |
| | | | |
Net expenses | | | 12,728,338 | |
| | | | |
Net investment income (loss) | | | 58,717,938 | |
| | | | |
| |
Realized And Unrealized Gain (Loss) On Investment And Foreign Currency Transactions | | | | |
Net realized gain (loss) on: | | | | |
Investment transactions (including affiliated of $(13,631)) | | | 1,645,658 | |
Futures transactions | | | (14,874,817 | ) |
Forward currency contract transactions | | | 20,782,553 | |
Options written transactions | | | 1,155,206 | |
Swap agreement transactions | | | (11,897,418 | ) |
Foreign currency transactions | | | 6,386,953 | |
| | | | |
| | | 3,198,135 | |
| | | | |
Net change in unrealized appreciation (depreciation) on: | | | | |
Investments (including affiliated of $(19,451)) | | | (105,906,787 | ) |
Futures | | | 10,759,128 | |
Forward currency contracts | | | 421,852 | |
Options written | | | 71,102 | |
Swap agreements | | | (3,496,291 | ) |
Foreign currencies | | | 203,623 | |
| | | | |
| | | (97,947,373 | ) |
| | | | |
Net gain (loss) on investment and foreign currency transactions | | | (94,749,238 | ) |
| | | | |
Net Increase (Decrease) In Net Assets Resulting From Operations | | $ | (36,031,300 | ) |
| | | | |
See Notes to Financial Statements.
PGIM Strategic Bond Fund 89
Statement of Operations
Year Ended February 28, 2022
| (a) | Class specific expenses and waivers were as follows: |
| | | | | | | | | | | | | | | | |
| | | Class A | | | Class C | | | Class Z | | | Class R6 | |
Distribution fee | | | 214,484 | | | | 607,894 | | | | — | | | | — | |
Transfer agent’s fees and expenses | | | 71,627 | | | | 59,224 | | | | 2,152,961 | | | | 1,594 | |
Registration fees | | | 23,185 | | | | 18,434 | | | | 68,747 | | | | 18,236 | |
Fee waiver and/or expense reimbursement | | | (23,678 | ) | | | (16,777 | ) | | | (2,190,543 | ) | | | (30,132 | ) |
See Notes to Financial Statements.
90
Statements of Changes in Net Assets
| | | | | | | | |
| | | Year Ended
February 28, | |
| | | 2022 | | | 2021 | |
| | |
Increase (Decrease) in Net Assets | | | | | | | | |
| | |
Operations | | | | | | | | |
Net investment income (loss) | | $ | 58,717,938 | | | $ | 51,577,953 | |
Net realized gain (loss) on investment and foreign currency transactions | | | 3,198,135 | | | | (58,949,690 | ) |
Net change in unrealized appreciation (depreciation) on investments and foreign currencies | | | (97,947,373 | ) | | | 49,798,196 | |
| | | | | | | | |
Net increase (decrease) in net assets resulting from operations | | | (36,031,300 | ) | | | 42,426,459 | |
| | | | | | | | |
Dividends and Distributions | | | | | | | | |
Distributions from distributable earnings | | | | | | | | |
Class A | | | (3,144,127 | ) | | | (3,185,567 | ) |
Class C | | | (1,760,431 | ) | | | (1,935,740 | ) |
Class Z | | | (68,591,566 | ) | | | (65,411,136 | ) |
Class R6 | | | (1,503,535 | ) | | | (667,556 | ) |
| | | | | | | | |
| | | (74,999,659 | ) | | | (71,199,999 | ) |
| | | | | | | | |
| | |
Tax return of capital distributions | | | | | | | | |
Class A | | | — | | | | (420,054 | ) |
Class C | | | — | | | | (255,249 | ) |
Class Z | | | — | | | | (8,625,207 | ) |
Class R6 | | | — | | | | (88,025 | ) |
| | | | | | | | |
| | | — | | | | (9,388,535 | ) |
| | | | | | | | |
| | |
Fund share transactions (Net of share conversions) | | | | | | | | |
Net proceeds from shares sold | | | 819,818,108 | | | | 1,393,852,191 | |
Net asset value of shares issued in reinvestment of dividends and distributions | | | 73,900,487 | | | | 79,147,512 | |
Cost of shares purchased | | | (1,095,152,185 | ) | | | (964,562,060 | ) |
| | | | | | | | |
Net increase (decrease) in net assets from Fund share transactions | | | (201,433,590 | ) | | | 508,437,643 | |
| | | | | | | | |
Total increase (decrease) | | | (312,464,549 | ) | | | 470,275,568 | |
| | |
Net Assets: | | | | | | | | |
| | |
Beginning of year | | | 1,929,379,810 | | | | 1,459,104,242 | |
| | | | | | | | |
End of year | | $ | 1,616,915,261 | | | $ | 1,929,379,810 | |
| | | | | | | | |
See Notes to Financial Statements.
PGIM Strategic Bond Fund 91
Financial Highlights
| | | | | | | | | | | | | | | | | | | | | | | | |
| | | | | | | |
| Class A Shares | | | | | | | | | | | | | | | | | | |
| | | |
| | | Year Ended February 28/29, | | | | |
| | | | | | | |
| | | 2022 | | | 2021 | | | 2020 | | | 2019 | | | 2018 | | | | |
| | | | | | | |
Per Share Operating Performance(a): | | | | | | | | | | | | | | | | | | | | | | | | |
| | | | | | | |
Net Asset Value, Beginning of Year | | | $10.32 | | | | $10.48 | | | | $10.10 | | | | $10.31 | | | | $10.15 | | | | | |
| | | | | | | |
Income (loss) from investment operations: | | | | | | | | | | | | | | | | | | | | | | | | |
| | | | | | | |
Net investment income (loss) | | | 0.29 | | | | 0.31 | | | | 0.33 | | | | 0.33 | | | | 0.33 | | | | | |
| | | | | | | |
| Net realized and unrealized gain (loss) on investment and foreign currency transactions | | | (0.54 | ) | | | 0.02 | (b) | | | 0.70 | | | | (0.02 | ) | | | 0.25 | | | | | |
| | | | | | | |
Total from investment operations | | | (0.25 | ) | | | 0.33 | | | | 1.03 | | | | 0.31 | | | | 0.58 | | | | | |
| | | | | | | |
Less Dividends and Distributions: | | | | | | | | | | | | | | | | | | | | | | | | |
| | | | | | | |
Dividends from net investment income | | | (0.38 | ) | | | (0.33 | ) | | | (0.45 | ) | | | (0.52 | ) | | | (0.38 | ) | | | | |
| | | | | | | |
Tax return of capital distributions | | | - | | | | (0.06 | ) | | | - | | | | (- | )(c) | | | - | | | | | |
| | | | | | | |
Distributions from net realized gains | | | - | | | | (0.10 | ) | | | (0.20 | ) | | | - | | | | (0.04 | ) | | | | |
| | | | | | | |
Total dividends and distributions | | | (0.38 | ) | | | (0.49 | ) | | | (0.65 | ) | | | (0.52 | ) | | | (0.42 | ) | | | | |
| | | | | | | |
Net asset value, end of year | | | $9.69 | | | | $10.32 | | | | $10.48 | | | | $10.10 | | | | $10.31 | | | | | |
| | | | | | | |
Total Return(d): | | | (2.59 | )% | | | 3.27 | % | | | 10.41 | % | | | 3.13 | % | | | 5.84 | % | | | | |
| | | | | | | | | | | | | | | | | | | | | | | | |
| | | | | | | |
Ratios/Supplemental Data: | | | | | | | | | | | | | | | | | | | | | | | | |
| | | | | | | |
Net assets, end of year (000) | | | $78,154 | | | | $88,108 | | | | $76,854 | | | | $8,958 | | | | $3,989 | | | | | |
| | | | | | | |
Average net assets (000) | | | $85,794 | | | | $74,555 | | | | $39,714 | | | | $4,751 | | | | $1,491 | | | | | |
| | | | | | | |
Ratios to average net assets(e)(f): | | | | | | | | | | | | | | | | | | | | | | | | |
| | | | | | | |
Expenses after waivers and/or expense reimbursement | | | 0.95 | % | | | 0.98 | % | | | 1.08 | % | | | 1.15 | % | | | 1.15 | % | | | | |
| | | | | | | |
Expenses before waivers and/or expense reimbursement | | | 0.98 | % | | | 1.02 | % | | | 1.12 | % | | | 1.77 | % | | | 2.11 | % | | | | |
| | | | | | | |
Net investment income (loss) | | | 2.81 | % | | | 3.01 | % | | | 3.16 | % | | | 3.26 | % | | | 3.24 | % | | | | |
| | | | | | | |
Portfolio turnover rate(g) | | | 54 | % | | | 105 | % | | | 239 | % | | | 81 | % | | | 74 | % | | | | |
| (a) | Calculated based on average shares outstanding during the year. |
| (b) | The per share amount of realized and unrealized gain (loss) on investments does not directly correlate to the amounts reported in the Statement of Operations due to the timing of portfolio share transactions in relation to fluctuating market values. |
| (c) | Amount rounds to zero. |
| (d) | Total return does not consider the effects of sales loads. Total return is calculated assuming a purchase of a share on the first day and a sale on the last day of each year reported and includes reinvestment of dividends and distributions, if any. Total returns may reflect adjustments to conform to GAAP. |
| (e) | Effective January 1, 2018, class specific expenses include transfer agent fees and expenses and registration fees, which are charged to their respective share class. |
| (f) | Does not include expenses of the underlying funds in which the Fund invests. |
| (g) | The Fund’s portfolio turnover rate is calculated in accordance with regulatory requirements, without regard to transactions involving short-term investments, certain derivatives and in-kind transactions (if any). If such transactions were included, the Fund’s portfolio turnover rate may be higher. |
See Notes to Financial Statements.
92
| | | | | | | | | | | | | | | | | | | | | | | | |
| | | | | | | |
| Class C Shares | | | | | | | | | | | | | | | | | | |
| | | |
| | | Year Ended February 28/29, | | | | |
| | | | | | | |
| | | 2022 | | | 2021 | | | 2020 | | | 2019 | | | 2018 | | | | |
| | | | | | | |
Per Share Operating Performance(a): | | | | | | | | | | | | | | | | | | | | | | | | |
| | | | | | | |
Net Asset Value, Beginning of Year | | | $10.30 | | | | $10.46 | | | | $10.09 | | | | $10.29 | | | | $10.14 | | | | | |
| | | | | | | |
Income (loss) from investment operations: | | | | | | | | | | | | | | | | | | | | | | | | |
| | | | | | | |
Net investment income (loss) | | | 0.21 | | | | 0.23 | | | | 0.26 | | | | 0.26 | | | | 0.26 | | | | | |
| | | | | | | |
| Net realized and unrealized gain (loss) on investment and foreign currency transactions | | | (0.53 | ) | | | 0.02 | (b) | | | 0.68 | | | | (0.01 | ) | | | 0.24 | | | | | |
| | | | | | | |
Total from investment operations | | | (0.32 | ) | | | 0.25 | | | | 0.94 | | | | 0.25 | | | | 0.50 | | | | | |
| | | | | | | |
Less Dividends and Distributions: | | | | | | | | | | | | | | | | | | | | | | | | |
| | | | | | | |
Dividends from net investment income | | | (0.30 | ) | | | (0.25 | ) | | | (0.37 | ) | | | (0.45 | ) | | | (0.31 | ) | | | | |
| | | | | | | |
Tax return of capital distributions | | | - | | | | (0.06 | ) | | | - | | | | (- | )(c) | | | - | | | | | |
| | | | | | | |
Distributions from net realized gains | | | - | | | | (0.10 | ) | | | (0.20 | ) | | | - | | | | (0.04 | ) | | | | |
| | | | | | | |
Total dividends and distributions | | | (0.30 | ) | | | (0.41 | ) | | | (0.57 | ) | | | (0.45 | ) | | | (0.35 | ) | | | | |
| | | | | | | |
Net asset value, end of year | | | $9.68 | | | | $10.30 | | | | $10.46 | | | | $10.09 | | | | $10.29 | | | | | |
| | | | | | | |
Total Return(d): | | | (3.25 | )% | | | 2.50 | % | | | 9.47 | % | | | 2.46 | % | | | 4.96 | % | | | | |
| | | | | | | | | | | | | | | | | | | | | | | | | |
| | | | | | | |
Ratios/Supplemental Data: | | | | | | | | | | | | | | | | | | | | | | | | |
| | | | | | | |
Net assets, end of year (000) | | | $56,099 | | | | $59,419 | | | | $49,844 | | | | $7,971 | | | | $1,206 | | | | | |
| | | | | | | |
Average net assets (000) | | | $60,789 | | | | $53,620 | | | | $24,666 | | | | $3,161 | | | | $852 | | | | | |
| | | | | | | |
Ratios to average net assets(e)(f): | | | | | | | | | | | | | | | | | | | | | | | | |
| | | | | | | |
Expenses after waivers and/or expense reimbursement | | | 1.72 | % | | | 1.73 | % | | | 1.83 | % | | | 1.90 | % | | | 1.90 | % | | | | |
| | | | | | | |
Expenses before waivers and/or expense reimbursement | | | 1.75 | % | | | 1.77 | % | | | 1.87 | % | | | 2.60 | % | | | 3.05 | % | | | | |
| | | | | | | |
Net investment income (loss) | | | 2.04 | % | | | 2.26 | % | | | 2.50 | % | | | 2.53 | % | | | 2.55 | % | | | | |
| | | | | | | |
Portfolio turnover rate(g) | | | 54 | % | | | 105 | % | | | 239 | % | | | 81 | % | | | 74 | % | | | | |
| (a) | Calculated based on average shares outstanding during the year. |
| (b) | The per share amount of realized and unrealized gain (loss) on investments does not directly correlate to the amounts reported in the Statement of Operations due to the timing of portfolio share transactions in relation to fluctuating market values. |
| (c) | Amount rounds to zero. |
| (d) | Total return does not consider the effects of sales loads. Total return is calculated assuming a purchase of a share on the first day and a sale on the last day of each year reported and includes reinvestment of dividends and distributions, if any. Total returns may reflect adjustments to conform to GAAP. |
| (e) | Effective January 1, 2018, class specific expenses include transfer agent fees and expenses and registration fees, which are charged to their respective share class. |
| (f) | Does not include expenses of the underlying funds in which the Fund invests. |
| (g) | The Fund’s portfolio turnover rate is calculated in accordance with regulatory requirements, without regard to transactions involving short-term investments, certain derivatives and in-kind transactions (if any). If such transactions were included, the Fund’s portfolio turnover rate may be higher. |
See Notes to Financial Statements.
PGIM Strategic Bond Fund 93
Financial Highlights (continued)
| | | | | | | | | | | | | | | | | | | | | | | | |
| | | | | | | |
| Class Z Shares | | | | | | | | | | | | | | | | | | |
| | | |
| | | Year Ended February 28/29, | | | | |
| | | | | | | |
| | | 2022 | | | 2021 | | | 2020 | | | 2019 | | | 2018 | | | | |
| | | | | | | |
Per Share Operating Performance(a): | | | | | | | | | | | | | | | | | | | | | | | | |
| | | | | | | |
Net Asset Value, Beginning of Year | | | $10.31 | | | | $10.47 | | | | $10.10 | | | | $10.30 | | | | $10.15 | | | | | |
| | | | | | | |
Income (loss) from investment operations: | | | | | | | | | | | | | | | | | | | | | | | | |
| | | | | | | |
Net investment income (loss) | | | 0.32 | | | | 0.34 | | | | 0.38 | | | | 0.37 | | | | 0.37 | | | | | |
| | | | | | | |
| Net realized and unrealized gain (loss) on investment and foreign currency transactions | | | (0.53 | ) | | | 0.02 | (b) | | | 0.68 | | | | (0.01 | ) | | | 0.23 | | | | | |
| | | | | | | |
Total from investment operations | | | (0.21 | ) | | | 0.36 | | | | 1.06 | | | | 0.36 | | | | 0.60 | | | | | |
| | | | | | | |
Less Dividends and Distributions: | | | | | | | | | | | | | | | | | | | | | | | | |
| | | | | | | |
Dividends from net investment income | | | (0.41 | ) | | | (0.36 | ) | | | (0.49 | ) | | | (0.56 | ) | | | (0.41 | ) | | | | |
| | | | | | | |
Tax return of capital distributions | | | - | | | | (0.06 | ) | | | - | | | | (- | )(c) | | | - | | | | | |
| | | | | | | |
Distributions from net realized gains | | | - | | | | (0.10 | ) | | | (0.20 | ) | | | - | | | | (0.04 | ) | | | | |
| | | | | | | |
Total dividends and distributions | | | (0.41 | ) | | | (0.52 | ) | | | (0.69 | ) | | | (0.56 | ) | | | (0.45 | ) | | | | |
| | | | | | | |
Net asset value, end of year | | | $9.69 | | | | $10.31 | | | | $10.47 | | | | $10.10 | | | | $10.30 | | | | | |
| | | | | | | |
Total Return(d): | | | (2.17 | )% | | | 3.64 | % | | | 10.73 | % | | | 3.60 | % | | | 6.02 | % | | | | |
| | | | | | | | | | | | | | | | | | | | | | | | | |
| | | | | | | |
Ratios/Supplemental Data: | | | | | | | | | | | | | | | | | | | | | | | | |
| | | | | | | |
Net assets, end of year (000) | | | $1,445,527 | | | | $1,748,446 | | | | $1,330,912 | | | | $157,026 | | | | $43,647 | | | | | |
| | | | | | | |
Average net assets (000) | | | $1,717,073 | | | | $1,421,196 | | | | $668,011 | | | | $81,750 | | | | $35,152 | | | | | |
| | | | | | | |
Ratios to average net assets(e)(f): | | | | | | | | | | | | | | | | | | | | | | | | |
| | | | | | | |
Expenses after waivers and/or expense reimbursement | | | 0.62 | % | | | 0.62 | % | | | 0.68 | % | | | 0.78 | % | | | 0.88 | % | | | | |
| | | | | | | |
Expenses before waivers and/or expense reimbursement | | | 0.75 | % | | | 0.77 | % | | | 0.82 | % | | | 1.09 | % | | | 1.60 | % | | | | |
| | | | | | | |
Net investment income (loss) | | | 3.14 | % | | | 3.35 | % | | | 3.62 | % | | | 3.62 | % | | | 3.61 | % | | | | |
| | | | | | | |
Portfolio turnover rate(g) | | | 54 | % | | | 105 | % | | | 239 | % | | | 81 | % | | | 74 | % | | | | |
| (a) | Calculated based on average shares outstanding during the year. |
| (b) | The per share amount of realized and unrealized gain (loss) on investments does not directly correlate to the amounts reported in the Statement of Operations due to the timing of portfolio share transactions in relation to fluctuating market values. |
| (c) | Amount rounds to zero. |
| (d) | Total return is calculated assuming a purchase of a share on the first day and a sale on the last day of each year reported and includes reinvestment of dividends and distributions, if any. Total returns may reflect adjustments to conform to GAAP. |
| (e) | Effective January 1, 2018, class specific expenses include transfer agent fees and expenses and registration fees, which are charged to their respective share class. |
| (f) | Does not include expenses of the underlying funds in which the Fund invests. |
| (g) | The Fund’s portfolio turnover rate is calculated in accordance with regulatory requirements, without regard to transactions involving short-term investments, certain derivatives and in-kind transactions (if any). If such transactions were included, the Fund’s portfolio turnover rate may be higher. |
See Notes to Financial Statements.
94
| | | | | | | | | | | | | | | | | | | | | | | | | | |
| | | | | | | | |
| Class R6 Shares | | | | | | | | | | | | | | | | | | | | |
| | | | | |
| | | Year Ended February 28/29, | | | | | April 26, 2017(a)
through February 28, | | | | |
| | | | | | | | |
| | | 2022 | | | 2021 | | | 2020 | | | 2019 | | | | | 2018 | | | | |
| | | | | | | | |
Per Share Operating Performance(b): | | | | | | | | | | | | | | | | | | | | | | | | | | |
| | | | | | | | |
Net Asset Value, Beginning of Period | | | $10.32 | | | | $10.48 | | | | $10.11 | | | | $10.30 | | | | | | $10.17 | | | | | |
| | | | | | | | |
Income (loss) from investment operations: | | | | | | | | | | | | | | | | | | | | | | | | | | |
| | | | | | | | |
Net investment income (loss) | | | 0.33 | | | | 0.34 | | | | 0.38 | | | | 0.39 | | | | | | 0.31 | | | | | |
| | | | | | | | |
| Net realized and unrealized gain (loss) on investment and foreign currency transactions | | | (0.54 | ) | | | 0.03 | (c) | | | 0.68 | | | | (0.01 | ) | | | | | 0.20 | | | | | |
| | | | | | | | |
Total from investment operations | | | (0.21 | ) | | | 0.37 | | | | 1.06 | | | | 0.38 | | | | | | 0.51 | | | | | |
| | | | | | | | |
Less Dividends and Distributions: | | | | | | | | | | | | | | | | | | | | | | | | | | |
| | | | | | | | |
Dividends from net investment income | | | (0.41 | ) | | | (0.37 | ) | | | (0.49 | ) | | | (0.57 | ) | | | | | (0.34 | ) | | | | |
| | | | | | | | |
Tax return of capital distributions | | | - | | | | (0.06 | ) | | | - | | | | (- | )(d) | | | | | - | | | | | |
| | | | | | | | |
Distributions from net realized gains | | | - | | | | (0.10 | ) | | | (0.20 | ) | | | - | | | | | | (0.04 | ) | | | | |
| | | | | | | | |
Total dividends and distributions | | | (0.41 | ) | | | (0.53 | ) | | | (0.69 | ) | | | (0.57 | ) | | | | | (0.38 | ) | | | | |
| | | | | | | | |
Net asset value, end of period | | | $9.70 | | | | $10.32 | | | | $10.48 | | | | $10.11 | | | | | | $10.30 | | | | | |
| | | | | | | | |
Total Return(e): | | | (2.24 | )% | | | 3.66 | % | | | 10.75 | % | | | 3.75 | % | | | | | 5.12 | % | | | | |
| | | | | | | | | | | | | | | | | | | | | | | | | | | |
| | | | | | | | |
Ratios/Supplemental Data: | | | | | | | | | | | | | | | | | | | | | | | | | | |
| | | | | | | | |
Net assets, end of period (000) | | | $37,135 | | | | $33,407 | | | | $1,493 | | | | $137 | | | | | | $11 | | | | | |
| | | | | | | | |
Average net assets (000) | | | $37,326 | | | | $13,732 | | | | $564 | | | | $19 | | | | | | $10 | | | | | |
| | | | | | | | |
Ratios to average net assets(f)(g): | | | | | | | | | | | | | | | | | | | | | | | | | | |
| | | | | | | | |
Expenses after waivers and/or expense reimbursement | | | 0.59 | % | | | 0.59 | % | | | 0.65 | % | | | 0.72 | % | | | | | 0.87 | %(h) | | | | |
| | | | | | | | |
Expenses before waivers and/or expense reimbursement | | | 0.67 | % | | | 0.76 | % | | | 3.24 | % | | | 62.77 | % | | | | | 115.14 | %(h) | | | | |
| | | | | | | | |
Net investment income (loss) | | | 3.17 | % | | | 3.26 | % | | | 3.62 | % | | | 3.80 | % | | | | | 3.54 | %(h) | | | | |
| | | | | | | | |
Portfolio turnover rate(i) | | | 54 | % | | | 105 | % | | | 239 | % | | | 81 | % | | | | | 74 | % | | | | |
| (a) | Commencement of offering. |
| (b) | Calculated based on average shares outstanding during the period. |
| (c) | The per share amount of realized and unrealized gain (loss) on investments does not directly correlate to the amounts reported in the Statement of Operations due to the timing of portfolio share transactions in relation to fluctuating market values. |
| (d) | Amount rounds to zero. |
| (e) | Total return is calculated assuming a purchase of a share on the first day and a sale on the last day of each period reported and includes reinvestment of dividends and distributions, if any. Total returns may reflect adjustments to conform to GAAP. Total returns for periods less than one full year are not annualized. |
| (f) | Effective January 1, 2018, class specific expenses include transfer agent fees and expenses and registration fees, which are charged to their respective share class. |
| (g) | Does not include expenses of the underlying funds in which the Fund invests. |
| (i) | The Fund’s portfolio turnover rate is calculated in accordance with regulatory requirements, without regard to transactions involving short-term investments, certain derivatives and in-kind transactions (if any). If such transactions were included, the Fund’s portfolio turnover rate may be higher. |
See Notes to Financial Statements.
PGIM Strategic Bond Fund 95
Notes to Financial Statements
1. Organization
Prudential Investment Portfolios 3 (the “Registered Investment Company” or “RIC”) is registered under the Investment Company Act of 1940, as amended (“1940 Act”), as an open-end management investment company. The RIC is organized as a Delaware Statutory Trust. These financial statements relate only to the PGIM Strategic Bond Fund (the “Fund”), a series of the RIC. The Fund is classified as a diversified fund for purposes of the 1940 Act.
The investment objective of the Fund is to seek to maximize total return, through a combination of current income and capital appreciation.
The Fund is subject to compliance with applicable regulations governing commodity pools including Commodity Futures Trading Commission (“CFTC”) rules.
2. Accounting Policies
The Fund follows the investment company accounting and reporting guidance of the Financial Accounting Standards Board (“FASB”) Accounting Standard Codification (“ASC”) Topic 946 Financial Services — Investment Companies. The following is a summary of significant accounting policies followed by the Fund in the preparation of its financial statements. The policies conform to U.S. generally accepted accounting principles (“GAAP”). The Fund consistently follows such policies in the preparation of its financial statements.
Securities Valuation: The Fund holds securities and other assets and liabilities that are fair valued as of the close of each day (generally, 4:00 PM Eastern time) the New York Stock Exchange (“NYSE”) is open for trading. As described in further detail below, the Fund’s investments are valued daily based on a number of factors, including the type of investment and whether market quotations are readily available. The RIC’s Board of Trustees (the “Board”) has adopted valuation procedures for security valuation under which fair valuation responsibilities have been delegated to PGIM Investments LLC (“PGIM Investments” or the “Manager”). Pursuant to the Board’s delegation, the Manager has established a Valuation Committee responsible for supervising the fair valuation of portfolio securities and other assets and liabilities. The valuation procedures permit the Fund to utilize independent pricing vendor services, quotations from market makers, and alternative valuation methods when market quotations are either not readily available or not deemed representative of fair value. Fair value is the price that would be received to sell an asset or paid to transfer a liability in an orderly transaction between market participants on the measurement date. A record of the Valuation Committee’s actions is subject to the Board’s review at its first quarterly meeting following the quarter in which such actions take place.
96
For the fiscal reporting year-end, securities and other assets and liabilities were fair valued at the close of the last U.S. business day. Trading in certain foreign securities may occur when the NYSE is closed (including weekends and holidays). Because such foreign securities trade in markets that are open on weekends and U.S. holidays, the values of some of the Fund’s foreign investments may change on days when investors cannot purchase or redeem Fund shares.
Various inputs determine how the Fund’s investments are valued, all of which are categorized according to the three broad levels (Level 1, 2, or 3) detailed in the Schedule of Investments and referred to herein as the “fair value hierarchy” in accordance with FASB ASC Topic 820 - Fair Value Measurement.
Common or preferred stocks, exchange-traded funds and derivative instruments, if applicable, that are traded on a national securities exchange are valued at the last sale price as of the close of trading on the applicable exchange where the security principally trades. Securities traded via NASDAQ are valued at the NASDAQ official closing price. To the extent these securities are valued at the last sale price or NASDAQ official closing price, they are classified as Level 1 in the fair value hierarchy. In the event that no sale or official closing price on valuation date exists, these securities are generally valued at the mean between the last reported bid and ask prices, or at the last bid price in the absence of an ask price. These securities are classified as Level 2 in the fair value hierarchy.
Investments in open-end funds (other than exchange-traded funds) are valued at their net asset values as of the close of the NYSE on the date of valuation. These securities are classified as Level 1 in the fair value hierarchy since they may be purchased or sold at their net asset values on the date of valuation.
Fixed income securities traded in the OTC market are generally classified as Level 2 in the fair value hierarchy. Such fixed income securities are typically valued using the market approach which generally involves obtaining data from an approved independent third-party vendor source. The Fund utilizes the market approach as the primary method to value securities when market prices of identical or comparable instruments are available. The third-party vendors’ valuation techniques used to derive the evaluated bid price are based on evaluating observable inputs, including but not limited to, yield curves, yield spreads, credit ratings, deal terms, tranche level attributes, default rates, cash flows, prepayment speeds, broker/dealer quotations and reported trades. Certain Level 3 securities are also valued using the market approach when obtaining a single broker quote or when utilizing transaction prices for identical securities that have been used in excess of five business days. During the reporting period, there were no changes to report with respect to the valuation approach and/or valuation techniques discussed above.
Bank loans are generally valued at prices provided by approved independent pricing vendors. The pricing vendors utilize broker/dealer quotations and provide prices based on the average of such quotations. Bank loans valued using such vendor prices are generally classified as Level 2 in the fair value hierarchy. Bank loans valued based on a single broker
PGIM Strategic Bond Fund 97
Notes to Financial Statements (continued)
quote or at the original transaction price in excess of five business days are classified as Level 3 in the fair value hierarchy.
OTC and centrally cleared derivative instruments are generally classified as Level 2 in the fair value hierarchy. Such derivative instruments are typically valued using the market approach and/or income approach which generally involves obtaining data from an approved independent third-party vendor source. The Fund utilizes the market approach when quoted prices in broker-dealer markets are available but also includes consideration of alternative valuation approaches, including the income approach. In the absence of reliable market quotations, the income approach is typically utilized for purposes of valuing derivatives such as interest rate swaps based on a discounted cash flow analysis whereby the value of the instrument is equal to the present value of its future cash inflows or outflows. Such analysis includes projecting future cash flows and determining the discount rate (including the present value factors that affect the discount rate) used to discount the future cash flows. In addition, the third-party vendors’ valuation techniques used to derive the evaluated derivative price is based on evaluating observable inputs, including but not limited to, underlying asset prices, indices, spreads, interest rates and exchange rates. Certain derivatives may be classified as Level 3 when valued using the market approach by obtaining a single broker quote or when utilizing unobservable inputs in the income approach. During the reporting period, there were no changes to report with respect to the valuation approach and/or valuation techniques discussed above.
Securities and other assets that cannot be priced according to the methods described above are valued based on pricing methodologies approved by the Board. In the event that unobservable inputs are used when determining such valuations, the securities will be classified as Level 3 in the fair value hierarchy. Altering one or more unobservable inputs may result in a significant change to a Level 3 security’s fair value measurement.
When determining the fair value of securities, some of the factors influencing the valuation include: the nature of any restrictions on disposition of the securities; assessment of the general liquidity of the securities; the issuer’s financial condition and the markets in which it does business; the cost of the investment; the size of the holding and the capitalization of the issuer; the prices of any recent transactions or bids/offers for such securities or any comparable securities; any available analyst media or other reports or information deemed reliable by the Manager regarding the issuer or the markets or industry in which it operates. Using fair value to price securities may result in a value that is different from a security’s most recent closing price and from the price used by other unaffiliated mutual funds to calculate their net asset values.
Foreign Currency Translation: The books and records of the Fund are maintained in U.S. dollars. Foreign currency amounts are translated into U.S. dollars on the following basis:
98
(i) market value of investment securities, other assets and liabilities — at the exchange rate as of the valuation date;
(ii) purchases and sales of investment securities, income and expenses — at the rates of exchange prevailing on the respective dates of such transactions.
Although the net assets of the Fund are presented at the foreign exchange rates and market values at the close of the period, the Fund does not generally isolate that portion of the results of operations arising as a result of changes in the foreign exchange rates from the fluctuations arising from changes in the market prices of long-term portfolio securities held at the end of the period. Similarly, the Fund does not isolate the effect of changes in foreign exchange rates from the fluctuations arising from changes in the market prices of long-term portfolio securities sold during the period. Accordingly, holding period unrealized and realized foreign currency gains (losses) are included in the reported net change in unrealized appreciation (depreciation) on investments and net realized gains (losses) on investment transactions on the Statements of Operations. Notwithstanding the above, the Fund does isolate the effect of fluctuations in foreign currency exchange rates when determining the gain (loss) upon the sale or maturity of foreign currency denominated debt obligations; such amounts are included in net realized gains (losses) on foreign currency transactions.
Additionally, net realized gains (losses) on foreign currency transactions represent net foreign exchange gains (losses) from the disposition of holdings of foreign currencies, currency gains (losses) realized between the trade and settlement dates on investment transactions, and the difference between the amounts of interest, dividends and foreign withholding taxes recorded on the Fund’s books and the U.S. dollar equivalent amounts actually received or paid. Net unrealized currency gains (losses) arise from valuing foreign currency denominated assets and liabilities (other than investments) at period end exchange rates.
Forward and Cross Currency Contracts: A forward currency contract is a commitment to purchase or sell a foreign currency at a future date at a negotiated forward rate. The Fund enters into forward currency contracts, as defined in the prospectus, in order to hedge its exposure to changes in foreign currency exchange rates on its foreign portfolio holdings or on specific receivables and payables denominated in a foreign currency and to gain exposure to certain currencies. The contracts are valued daily at current forward exchange rates and any unrealized gain (loss) is included in net unrealized appreciation or depreciation on forward and cross currency contracts. Gain (loss) is realized on the settlement date of the contract equal to the difference between the settlement value of the original and negotiated forward contracts. This gain (loss), if any, is included in net realized gain (loss) on forward and cross currency contract transactions. Risks may arise upon entering into these contracts from the potential inability of the counterparties to meet the terms of their contracts. Forward currency contracts involve risks from currency exchange rate and credit risk in excess of the amounts reflected on the Statement of Assets and Liabilities. The Fund’s maximum risk of loss from counterparty credit risk is the net value of
PGIM Strategic Bond Fund 99
Notes to Financial Statements (continued)
the cash flows to be received from the counterparty at the end of the contract’s life. A cross currency contract is a forward contract where a specified amount of one foreign currency will be exchanged for a specified amount of another foreign currency.
Options: The Fund purchased and/or wrote options in order to hedge against adverse market movements or fluctuations in value caused by changes in prevailing interest rates, value of equities or foreign currency exchange rates with respect to securities or financial instruments which the Fund currently owns or intends to purchase. The Fund may also use options to gain additional market exposure. The Fund’s principal reason for writing options is to realize, through receipt of premiums, a greater current return than would be realized on the underlying security alone. When the Fund purchases an option, it pays a premium and an amount equal to that premium is recorded as an asset. When the Fund writes an option, it receives a premium and an amount equal to that premium is recorded as a liability. The asset or liability is adjusted daily to reflect the current market value of the option. If an option expires unexercised, the Fund realizes a gain (loss) to the extent of the premium received or paid. If an option is exercised, the premium received or paid is recorded as an adjustment to the proceeds from the sale or the cost of the purchase in determining whether the Fund has realized a gain (loss). The difference between the premium and the amount received or paid at the closing of a purchase or sale transaction is also treated as a realized gain (loss). Gain (loss) on purchased options is included in net realized gain (loss) on investment transactions. Gain (loss) on written options is presented separately as net realized gain (loss) on options written transactions.
The Fund, as writer of an option, may have no control over whether the underlying securities or financial instruments may be sold (called) or purchased (put). As a result, the Fund bears the market risk of an unfavorable change in the price of the security or financial instrument underlying the written option. The Fund, as purchaser of an OTC option, bears the risk of the potential inability of the counterparties to meet the terms of their contracts. With exchange-traded options contracts, there is minimal counterparty credit risk to the Fund since the exchanges’ clearinghouse acts as counterparty to all exchange-traded options and guarantees the options contracts against default.
When the Fund writes an option on a swap, an amount equal to any premium received by the Fund is recorded as a liability and is subsequently adjusted to the current market value of the written option on the swap. If a call option on a swap is exercised, the Fund becomes obligated to pay a fixed interest rate (noted as the strike price) and receive a variable interest rate on a notional amount. If a put option on a swap is exercised, the Fund becomes obligated to pay a variable interest rate and receive a fixed interest rate (noted as the strike price) on a notional amount. Premiums received from writing options on swaps that expire or are exercised are treated as realized gains upon the expiration or exercise of such options on
100
swaps. The risk associated with writing put and call options on swaps is that the Fund will be obligated to be party to a swap agreement if an option on a swap is exercised.
Financial Futures Contracts: A financial futures contract is an agreement to purchase (long) or sell (short) an agreed amount of securities at a set price for delivery on a future date. Upon entering into a financial futures contract, the Fund is required to pledge to the broker an amount of cash and/or other assets equal to a certain percentage of the contract amount. This amount is known as the “initial margin.” Subsequent payments, known as “variation margin,” are made or received by the Fund each day, depending on the daily fluctuations in the value of the underlying security. Such variation margin is recorded for financial statement purposes on a daily basis as unrealized gain (loss). When the contract expires or is closed, the gain (loss) is realized and is presented in the Statement of Operations as net realized gain (loss) on futures transactions.
The Fund invested in financial futures contracts in order to hedge its existing portfolio securities, or securities the Fund intends to purchase, against fluctuations in value caused by changes in prevailing interest rates. Should interest rates move unexpectedly, the Fund may not achieve the anticipated benefits of the financial futures contracts and may realize a loss. The use of futures transactions involves the risk of imperfect correlation in movements in the price of futures contracts, interest rates and the underlying hedged assets. Since futures contracts are exchange-traded, there is minimal counterparty credit risk to the Fund since the exchanges’ clearinghouse acts as counterparty to all exchange-traded futures and guarantees the futures contracts against default.
Swap Agreements: The Fund entered into certain types of swap agreements detailed in the disclosures below. A swap agreement is an agreement to exchange the return generated by one instrument for the return generated by another instrument. Swap agreements are negotiated in the OTC market and may be executed either directly with a counterparty (“OTC-traded”) or through a central clearing facility, such as a registered exchange. Swap agreements are valued daily at current market value and any change in value is included in the net unrealized appreciation or depreciation on swap agreements. Centrally cleared swaps pay or receive an amount known as “variation margin”, based on daily changes in the valuation of the swap contract. For OTC-traded, upfront premiums paid and received are shown as swap premiums paid and swap premiums received in the Statement of Assets and Liabilities. Risk of loss may exceed amounts recognized on the Statement of Assets and Liabilities. Swap agreements outstanding at period end, if any, are listed on the Schedule of Investments.
Interest Rate Swaps: Interest rate swaps represent an agreement between counterparties to exchange cash flows based on the difference between two interest rates, applied to a notional principal amount for a specified period. The Fund is subject to interest rate risk exposure in the normal course of pursuing its investment objective. The Fund used interest rate swaps to maintain its ability to generate steady cash flow by receiving a stream of fixed rate payments or to increase exposure to prevailing market rates by receiving floating rate
PGIM Strategic Bond Fund 101
Notes to Financial Statements (continued)
payments. The Fund’s maximum risk of loss from counterparty credit risk is the discounted net present value of the cash flows to be received from the counterparty over the contract’s remaining life.
Inflation Swaps: The Fund entered into inflation swap agreements to protect against fluctuations in inflation rates. Inflation swaps are characterized by one party paying a fixed rate in exchange for a floating rate that is derived from an inflation index, such as the Consumer Price Index or UK Retail Price Index. Inflation swaps subject the Fund to interest rate risk.
Credit Default Swaps (“CDS”): CDS involve one party (the protection buyer) making a stream of payments to another party (the protection seller) in exchange for the right to receive a specified payment in the event of a default or as a result of a default (collectively a “credit event”) for the referenced entity (typically corporate issues or sovereign issues of an emerging country) on its obligation; or in the event of a write-down, principal shortfall, interest shortfall or default of all or part of the referenced entities comprising a credit index.
The Fund is subject to credit risk in the normal course of pursuing its investment objectives, and as such, has entered into CDS contracts to provide a measure of protection against defaults or to take an active long or short position with respect to the likelihood of a particular issuer’s default or the reference entity’s credit soundness. CDS contracts generally trade based on a spread which represents the cost a protection buyer has to pay the protection seller. The protection buyer is said to be short the credit as the value of the contract rises the more the credit deteriorates. The value of the CDS contract increases for the protection buyer if the spread increases. The Fund’s maximum risk of loss from counterparty credit risk for purchased CDS is the inability of the counterparty to honor the contract up to the notional value due to a credit event.
As a seller of protection on credit default swap agreements, the Fund generally receives an agreed upon payment from the buyer of protection throughout the term of the swap, provided no credit event occurs. As the seller, the Fund effectively increases its investment risk because, in addition to its total net assets, the Fund may be subject to investment exposure on the notional amount of the swap.
The maximum amount of the payment that the Fund, as a seller of protection, could be required to make under a credit default swap agreement would be equal to the notional amount of the underlying security or index contract as a result of a credit event. This potential amount will be partially offset by any recovery values of the respective referenced obligations, or net amounts received from the settlement of buy protection credit default swap agreements which the Fund entered into for the same referenced entity or index. As a
102
buyer of protection, the Fund generally receives an amount up to the notional value of the swap if a credit event occurs.
Implied credit spreads, represented in absolute terms, utilized in determining the market value of credit default swap agreements where the Fund is the seller of protection as of period end are disclosed in the footnotes to the Schedule of Investments, if applicable. These spreads serve as indicators of the current status of the payment/performance risk and represent the likelihood of default risk for the credit derivative. The implied credit spread of a particular referenced entity reflects the cost of buying/selling protection and may include upfront payments required to enter into the agreement. Wider credit spreads and increased market value in absolute terms, when compared to the notional amount of the swap, represent a deterioration of the referenced entity’s credit soundness and a greater likelihood of risk of default or other credit event occurring as defined under the terms of the agreement.
Currency Swaps: The Fund entered into currency swap agreements primarily to gain yield exposure on foreign bonds. Currency swap agreements involve two parties exchanging two different currencies with an agreement to reverse the exchange at a later date at specified exchange rates.
Total Return Swaps: In a total return swap, one party receives payments based on the market value of the security or the commodity involved, or total return of a specific referenced asset, such as an equity, index or bond, and in return pays a defined amount. The Fund is subject to risk exposures associated with the referenced asset in the normal course of pursuing its investment objectives. The Fund entered into total return swaps to manage its exposure to a security or an index. The Fund’s maximum risk of loss from counterparty credit risk is the change in the value of the security, in the Fund’s favor, from the point of entering into the contract.
Bank Loans: The Fund invested in bank loans. Bank loans include fixed and floating rate loans that are privately negotiated between a corporate borrower and one or more financial institutions, including, but not limited to, term loans, revolvers, and other instruments issued in the bank loan market. The Fund acquire interests in loans directly (by way of assignment from the selling institution) and/or indirectly (by way of the purchase of a participation interest from the selling institution). Under a bank loan assignment, the Fund generally will succeed to all the rights and obligations of an assigning lending institution and become a lender under the loan agreement with the relevant borrower in connection with that loan. Under a bank loan participation, the Fund generally will have a contractual relationship only with the lender, not with the relevant borrower. As a result, the Fund generally will have the right to receive payments of principal, interest, and any fees to which they are entitled only from the lender selling the participation and only upon receipt by the lender of the payments from the relevant borrower. The Fund may not directly benefit from the collateral supporting the debt obligation in which they have purchased the participation. As a result, the Fund will assume the credit risk of both the borrower and the institution selling the participation to the Fund.
PGIM Strategic Bond Fund 103
Notes to Financial Statements (continued)
Reverse Repurchase Agreements: The Fund enters reverse repurchase agreements with qualified third-party broker-dealers in which the Fund sells securities to a bank or broker-dealer and agrees to repurchase the same securities at a mutually agreed upon date and price. The Fund receives securities and/or cash as collateral with a market value in-excess of the repurchase price to be paid by the Fund upon the maturity of the transaction. During the term of the agreement, the Fund continues to receive the principal and interest payments on the securities sold. Certain agreements have no stated maturity and can be terminated by either party at any time. Due to the short-term nature of reverse repurchase agreements, face value approximates fair value. Cash received in exchange for securities delivered plus accrued interest due to the counterparty is recorded as a liability in the Statement of Assets and Liabilities. Interest payments made by the Fund to the counterparties are recorded as a component of interest expense in the Statement of Operations.
Mortgage-Backed and Asset-Backed Securities: Mortgage-backed securities are pass-through securities, meaning that principal and interest payments made by the borrower on the underlying mortgages are passed through to the Fund. Asset-backed securities directly or indirectly represent a participation interest in, or are secured by and payable from, a stream of payments generated by particular assets such as motor vehicle or credit card receivables. Asset-backed securities may be classified as pass-through certificates or collateralized obligations, such as collateralized bond obligations, collateralized loan obligations and other similarly structured securities. The value of mortgage-backed and asset-backed securities varies with changes in interest rates and may be affected by changes in credit quality or value of the mortgage loans or other assets that support the securities.
Stripped mortgage-backed securities are usually structured with two classes that receive different proportions of the interest (“IO”) and principal (“PO”) distributions on a pool of mortgage assets. Payments received for IOs are included in interest income on the Statements of Operations. Because no principal will be received at the maturity of an IO, adjustments are made to the cost of the security on a monthly basis until maturity. These adjustments are included in interest income on the Statements of Operations. Payments received for POs are treated as reductions to the cost and par value of the securities.
Master Netting Arrangements: The RIC, on behalf of the Fund, is subject to various Master Agreements, or netting arrangements, with select counterparties. These are agreements which a subadviser may have negotiated and entered into on behalf of all or a portion of the Fund. A master netting arrangement between the Fund and the counterparty permits the Fund to offset amounts payable by the Fund to the same counterparty against amounts to be received; and by the receipt of collateral from the counterparty by the Fund to cover the Fund’s exposure to the counterparty. However, there is no assurance that such mitigating
104
factors are easily enforceable. In addition to master netting arrangements, the right to set-off exists when all the conditions are met such that each of the parties owes the other determinable amounts, the reporting party has the right to set-off the amount owed with the amount owed by the other party, the reporting party intends to set-off and the right of set-off is enforceable by law.
The RIC, on behalf of the Fund, is a party to International Swaps and Derivatives Association, Inc. (“ISDA”) Master Agreements with certain counterparties that govern OTC derivative and foreign exchange contracts entered into from time to time. The Master Agreements may contain provisions regarding, among other things, the parties’ general obligations, representations, agreements, collateral requirements, events of default and early termination. With respect to certain counterparties, in accordance with the terms of the Master Agreements, collateral posted to the Fund is held in a segregated account by the Fund’s custodian and with respect to those amounts which can be sold or re-pledged, is presented in the Schedule of Investments. Collateral pledged by the Fund is segregated by the Fund’s custodian and identified in the Schedule of Investments. Collateral can be in the form of cash or debt securities issued by the U.S. Government or related agencies or other securities as agreed to by the Fund and the applicable counterparty. Collateral requirements are determined based on the Fund’s net position with each counterparty. Termination events applicable to the Fund may occur upon a decline in the Fund’s net assets below a specified threshold over a certain period of time. Termination events applicable to counterparties may occur upon a decline in the counterparty’s long-term and short-term credit ratings below a specified level. In each case, upon occurrence, the other party may elect to terminate early and cause settlement of all derivative and foreign exchange contracts outstanding, including the payment of any losses and costs resulting from such early termination, as reasonably determined by the terminating party. Any decision by one or more of the Fund’s counterparties to elect early termination could impact the Fund’s future derivative activity.
In addition to each instrument’s primary underlying risk exposure (e.g. interest rate, credit, equity or foreign exchange, etc.), swap agreements involve, to varying degrees, elements of credit, market and documentation risk. Such risks involve the possibility that no liquid market for these agreements will exist, the counterparty to the agreement may default on its obligation to perform or disagree on the contractual terms of the agreement, and changes in net interest rates will be unfavorable. In connection with these agreements, securities in the portfolio may be identified or received as collateral from the counterparty in accordance with the terms of the respective swap agreements to provide or receive assets of value and to serve as recourse in the event of default or bankruptcy/insolvency of either party. Such OTC derivative agreements include conditions which, when materialized, give the counterparty the right to cause an early termination of the transactions under those agreements. Any election by the counterparty for early termination of the contract(s) may impact the amounts reported on financial statements.
Short sales and OTC contracts, including forward foreign currency exchange contracts, swaps, forward rate agreements and written options involve elements of both market and
PGIM Strategic Bond Fund 105
Notes to Financial Statements (continued)
credit risk in excess of the amounts reflected on the Statement of Assets and Liabilities, if applicable. Such risks may be mitigated by engaging in master netting arrangements.
Warrants and Rights: The Fund held warrants and rights acquired either through a direct purchase or pursuant to corporate actions. Warrants and rights entitle the holder to buy a proportionate amount of common stock, or such other security that the issuer may specify, at a specific price and time through the expiration dates. Such warrants and rights are held as long positions by the Fund until exercised, sold or expired. Warrants and rights are valued at fair value in accordance with the Board approved fair valuation procedures.
Payment-In-Kind: The Fund invested in the open market or received pursuant to debt restructuring, securities that pay-in-kind (PIK) the interest due on such debt instruments. The PIK interest, computed at the contractual rate specified, is added to the existing principal balance of the debt when issued bonds have same terms as the bond or recorded as a separate bond when terms are different from the existing debt, and is recorded as interest income.
Securities Lending: The Fund lends its portfolio securities to banks and broker-dealers. The loans are secured by collateral at least equal to the market value of the securities loaned. Collateral pledged by each borrower is invested in an affiliated money market fund and is marked to market daily, based on the previous day’s market value, such that the value of the collateral exceeds the value of the loaned securities. In the event of significant appreciation in value of securities on loan on the last business day of the reporting period, the financial statements may reflect a collateral value that is less than the market value of the loaned securities. Such shortfall is remedied as described above. Loans are subject to termination at the option of the borrower or the Fund. Upon termination of the loan, the borrower will return to the Fund securities identical to the loaned securities. The remaining maturities of the securities lending transactions are considered overnight and continuous. Should the borrower of the securities fail financially, the Fund has the right to repurchase the securities in the open market using the collateral.
The Fund recognizes income, net of any rebate and securities lending agent fees, for lending its securities in the form of fees or interest on the investment of any cash received as collateral. The borrower receives all interest and dividends from the securities loaned and such payments are passed back to the lender in amounts equivalent thereto, which are reflected in interest income or unaffiliated dividend income based on the nature of the payment on the Statement of Operations. The Fund also continues to recognize any unrealized gain (loss) in the market price of the securities loaned and on the change in the value of the collateral invested that may occur during the term of the loan. In addition, realized gain (loss) is recognized on changes in the value of the collateral invested upon
106
liquidation of the collateral. Net earnings from securities lending are disclosed in the Statement of Operations.
Securities Transactions and Net Investment Income: Securities transactions are recorded on the trade date. Realized gains (losses) from investment and currency transactions are calculated on the specific identification method. Dividend income is recorded on the ex-date, or for certain foreign securities, when the Fund becomes aware of such dividends. Interest income, including amortization of premium and accretion of discount on debt securities, as required, is recorded on the accrual basis. Expenses are recorded on an accrual basis, which may require the use of certain estimates by management that may differ from actual. Net investment income or loss (other than class specific expenses and waivers, which are allocated as noted below) and unrealized and realized gains (losses) are allocated daily to each class of shares based upon the relative proportion of adjusted net assets of each class at the beginning of the day. Class specific expenses and waivers, where applicable, are charged to the respective share classes. Such class specific expenses and waivers include distribution fees and distribution fee waivers, shareholder servicing fees, transfer agent’s fees and expenses, registration fees and fee waivers and/or expense reimbursements, as applicable.
Taxes: It is the Fund’s policy to continue to meet the requirements of the Internal Revenue Code applicable to regulated investment companies and to distribute all of its taxable net investment income and capital gains, if any, to its shareholders. Therefore, no federal income tax provision is required. Withholding taxes on foreign dividends, interest and capital gains, if any, are recorded, net of reclaimable amounts, at the time the related income is earned.
Dividends and Distributions: Dividends and distributions to shareholders, which are determined in accordance with federal income tax regulations and which may differ from GAAP, are recorded on the ex-date. Permanent book/tax differences relating to income and gain (loss) are reclassified between total distributable earnings (loss) and paid-in capital in excess of par, as appropriate. The chart below sets forth the expected frequency of dividend and capital gains distributions to shareholders. Various factors may impact the frequency of dividend distributions to shareholders, including but not limited to adverse market conditions or portfolio holding-specific events.
| | | | |
| | |
| Expected Distribution Schedule to Shareholders* | | Frequency | |
| |
Net Investment Income | | | Monthly | |
| |
Short-Term Capital Gains | | | Annually | |
| |
Long-Term Capital Gains | | | Annually | |
| * | Under certain circumstances, the Fund may make more than one distribution of short-term and/or long-term capital gains during a fiscal year. |
Estimates: The preparation of financial statements requires management to make estimates and assumptions that affect the reported amounts and disclosures in the financial statements. Actual results could differ from those estimates.
PGIM Strategic Bond Fund 107
Notes to Financial Statements (continued)
3. Agreements
The RIC, on behalf of the Fund, has a management agreement with the Manager. Pursuant to this agreement, the Manager has responsibility for all investment advisory services and supervises the subadvisers’ performance of such services.
The Manager has entered into a subadvisory agreement with PGIM, Inc., which provides subadvisory services to the Fund through its business unit PGIM Fixed Income, and PGIM, Inc. has entered into a sub-subadvisory agreement with PGIM Limited (collectively the “subadviser”). The Manager pays for the services of the subadviser.
Fees payable under the management agreement are computed daily and paid monthly. For the reporting period ended February 28, 2022, the contractual and effective management fee rates were as follows:
| | | | |
| Contractual Management Rate | | Effective Management Fee, before any waivers
and/or expense reimbursements | |
0.590% on average daily net assets up to $2.5 billion; | | | 0.59% | |
0.565% on average daily net assets from $2.5 billion to $5 billion; | | | | |
0.540% on average daily net assets over $5 billion. | | | | |
The Manager has contractually agreed, through June 30, 2023, to limit total annual operating expenses after fee waivers and/or expense reimbursements.
This contractual waiver excludes interest, brokerage, taxes (such as income and foreign withholding taxes, stamp duty and deferred tax expenses), acquired fund fees and expenses, extraordinary expenses, and certain other Fund expenses such as dividend and interest expense and broker charges on short sales.
Where applicable, the Manager agrees to waive management fees or shared operating expenses on any share class to the same extent that it waives such expenses on any other share class and, in addition, total annual operating expenses for Class R6 shares will not exceed total annual operating expenses for Class Z shares. Fees and/or expenses waived by the Manager may be recouped by the Manager within the same fiscal year during which such waiver and/or reimbursement is made if such recoupment can be realized without exceeding the expense limit in effect at the time of the recoupment for that fiscal year. The expense limitations attributable to each class are as follows:
| | |
| Class | | Expense
Limitations |
A | | 1.15% |
C | | 1.90 |
Z | | 0.62 |
108
| | |
| Class | | Expense
Limitations |
R6 | | 0.59% |
The RIC, on behalf of the Fund, has a distribution agreement with Prudential Investment Management Services LLC (“PIMS”), which acts as the distributor of the Class A, Class C, Class Z and Class R6 shares of the Fund. The Fund compensates PIMS for distributing and servicing the Fund’s Class A and Class C shares, pursuant to the plans of distribution (the “Distribution Plans”), regardless of expenses actually incurred by PIMS.
Pursuant to the Distribution Plans, the Fund compensates PIMS for distribution related activities at an annual rate based on average daily net assets per class. The distribution fees are accrued daily and payable monthly. The Fund’s annual distribution contractual rate and limit where applicable are as follows:
| | | | | | |
| Class | | Contractual Rate | | Limit | |
A | | 0.25% | | | — | % |
C | | 1.00 | | | — | |
Z | | N/A | | | N/A | |
R6 | | N/A | | | N/A | |
For the reporting period ended February 28, 2022, PIMS received front-end sales charges (“FESL”) resulting from sales of certain class shares and contingent deferred sales charges (“CDSC”) imposed upon redemptions by certain shareholders. From these fees, PIMS paid such sales charges to broker-dealers, who in turn paid commissions to salespersons and incurred other distribution costs. The sales charges are as follows where applicable:
| | | | |
| FESL by Class | | Amount | |
A | | | $218,578 | |
C | | | — | |
| | | | |
| CDSC by Class | | Amount | |
A | | | $5,006 | |
C | | | 9,809 | |
PGIM Investments, PIMS, PGIM, Inc. and PGIM Limited are indirect, wholly-owned subsidiaries of Prudential Financial, Inc. (“Prudential”).
4. Other Transactions with Affiliates
Prudential Mutual Fund Services LLC (“PMFS”), an affiliate of PGIM Investments and an indirect, wholly-owned subsidiary of Prudential, serves as the Fund’s transfer agent. Transfer agent’s fees and expenses in the Statement of Operations include certain out-of-pocket expenses paid to non-affiliates, where applicable.
The Fund may invest its overnight sweep cash in the PGIM Core Ultra Short Bond Fund (the “Core Fund”), and its securities lending cash collateral in the PGIM Institutional Money Market Fund (the “Money Market Fund”), each a fund of Prudential Investment Portfolios 2,
PGIM Strategic Bond Fund 109
Notes to Financial Statements (continued)
registered under the 1940 Act and managed by PGIM Investments. PGIM Investments and/or its affiliates are paid fees or reimbursed for providing their services to the Core Fund and the Money Market Fund. In addition to the realized and unrealized gains on investments in the Core Fund and Money Market Fund, earnings from such investments are disclosed on the Statement of Operations as “Affiliated dividend income” and “Income from securities lending, net”, respectively. Effective January 2022, the Fund changed its overnight cash sweep vehicle from the Core Fund to an unaffiliated money market fund.
The Fund may enter into certain securities purchase or sale transactions under Board approved Rule 17a-7 procedures. Rule 17a-7 is an exemptive rule under the 1940 Act, that subject to certain conditions, permits purchase and sale transactions among affiliated investment companies, or between an investment company and a person that is affiliated solely by reason of having a common (or affiliated) investment adviser, common directors/trustees, and/or common officers. For the year ended February 28, 2022, no 17a-7 transactions were entered into by the Fund.
5. Portfolio Securities
The aggregate cost of purchases and proceeds from sales of portfolio securities (excluding short-term investments and U.S. Government securities) for the reporting period ended February 28, 2022, were as follows:
| | |
| Cost of Purchases | | Proceeds from Sales |
$934,555,929 | | $1,026,624,196 |
A summary of the cost of purchases and proceeds from sales of shares of affiliated mutual funds for the year ended February 28, 2022, is presented as follows:
| | | | | | | | | | | | | | | | | | | | | | | | | | | | | | |
Value,
Beginning
of Year | | | Cost of
Purchases | | | Proceeds
from Sales | | | Change in
Unrealized
Gain
(Loss) | | | Realized
Gain
(Loss) | | | Value,
End of Year | | | Shares,
End
of Year | | | Income | |
|
| | Short-Term Investments - Affiliated Mutual Funds: | |
|
| | PGIM Core Ultra Short Bond Fund(1)(wa) | |
| | $ 61,448,248 | | | $ | 521,848,633 | | | $ | 583,296,881 | | | $ | — | | | $ | — | | | $ | — | | | | — | | | $ | 45,396 | |
|
| | PGIM Institutional Money Market Fund(1)(b)(wa) | |
| | 62,429,238 | | | | 598,177,416 | | | | 563,498,621 | | | | (19,451 | ) | | | (13,631 | ) | | | 97,074,951 | | | | 97,152,673 | | | | 21,848 | (2) |
| | $123,877,486 | | | $ | 1,120,026,049 | | | $ | 1,146,795,502 | | | $ | (19,451 | ) | | $ | (13,631 | ) | | $ | 97,074,951 | | | | | | | $ | 67,244 | |
| (1) | The Fund did not have any capital gain distributions during the reporting period. |
| (2) | The amount, or a portion thereof, represents the affiliated securities lending income shown on the Statement of Operations. |
110
| (b) | Represents security, or portion thereof, purchased with cash collateral received for securities on loan and includes dividend reinvestment. |
| (wa) | PGIM Investments LLC, the manager of the Fund, also serves as manager of the PGIM Core Ultra Short Bond Fund and PGIM Institutional Money Market Fund, if applicable. |
6. Distributions and Tax Information
Distributions to shareholders, which are determined in accordance with federal income tax regulations and which may differ from GAAP, are recorded on the ex-date.
For the year ended February 28, 2022, the tax character of dividends paid by the Fund was $74,999,659 of ordinary income. For the year ended February 28, 2021, the tax character of dividends paid by the Fund were $62,873,577 of ordinary income and $8,326,422 of long-term capital gains.
As of February 28, 2022, the accumulated undistributed earnings on a tax basis was $5,248,919 of ordinary income.
The United States federal income tax basis of the Fund’s investments and the net unrealized appreciation as of February 28, 2022 were as follows:
| | | | | | | | | | |
| Tax Basis | | Gross
Unrealized
Appreciation | | Gross
Unrealized
Depreciation | | | Net
Unrealized
Depreciation | |
| $1,824,673,971 | | $63,161,389 | | $ | (130,981,002 | ) | | $ | (67,819,613 | ) |
The difference between GAAP and tax basis is primarily attributable to the difference in the treatment of amortization of premiums, deferred losses on wash sales, straddles, futures contracts and other book to tax differences.
For federal income tax purposes, the Fund had a capital loss carryforward as of February 28, 2022 of approximately $71,322,000 which can be carried forward for an unlimited period. No capital gains distributions are expected to be paid to shareholders until net gains have been realized in excess of such losses.
The Manager has analyzed the Fund’s tax positions taken on federal, state and local income tax returns for all open tax years and has concluded that no provision for income tax is required in the Fund’s financial statements for the current reporting period. Since tax authorities can examine previously filed tax returns, the Fund’s U.S. federal and state tax returns for each of the four fiscal years up to the most recent fiscal year ended February 28, 2022 are subject to such review.
7. Capital and Ownership
The Fund offers Class A, Class C, Class Z and Class R6 shares. Class A shares are sold with a maximum front-end sales charge of 3.25%. Investors who purchase $500,000 or more of Class A shares and sell those shares within 12 months of purchase are subject to a
PGIM Strategic Bond Fund 111
Notes to Financial Statements (continued)
contingent deferred sales charge (“CDSC”) of 1.00% on sales although these purchases are not subject to a front-end sales charge. The Class A CDSC is waived for certain retirement and/or benefit plans. A special exchange privilege is also available for shareholders who qualified to purchase Class A shares at net asset value. Class C shares are sold with a CDSC of 1% on sales made within 12 months of purchase. Class C shares will automatically convert to Class A shares on a monthly basis approximately eight years (ten years prior to January 22, 2021) after purchase. Class Z and Class R6 shares are not subject to any sales or redemption charges and are available exclusively for sale to a limited group of investors.
Under certain circumstances, an exchange may be made from specified share classes of the Fund to one or more other share classes of the Fund as presented in the table of transactions in shares of beneficial interest, below.
The RIC has authorized an unlimited number of shares of beneficial interest of the Fund at $0.001 par value per share.
As of February 28, 2022, Prudential, through its affiliated entities, including affiliated funds (if applicable), did not own any shares of the Fund.
At the reporting period end, the number of shareholders holding greater than 5% of the Fund are as follows:
| | | | |
| | | Number of Shareholders | | Percentage of Outstanding Shares |
Affiliated | | — | | —% |
Unaffiliated | | 6 | | 86.2% |
112
Transactions in shares of beneficial interest were as follows:
| | | | | | | | |
| | | |
| Share Class | | Shares | | | Amount | |
| | |
Class A | | | | | | | | |
Year ended February 28, 2022: | | | | | | | | |
Shares sold | | | 3,805,994 | | | $ | 39,008,616 | |
Shares issued in reinvestment of dividends and distributions | | | 305,367 | | | | 3,116,058 | |
Shares purchased | | | (4,454,173 | ) | | | (45,512,101 | ) |
Net increase (decrease) in shares outstanding before conversion | | | (342,812 | ) | | | (3,387,427 | ) |
Shares issued upon conversion from other share class(es) | | | 158,688 | | | | 1,619,742 | |
Shares purchased upon conversion into other share class(es) | | | (291,592 | ) | | | (2,979,242 | ) |
Net increase (decrease) in shares outstanding | | | (475,716 | ) | | $ | (4,746,927 | ) |
| | |
Year ended February 28, 2021: | | | | | | | | |
Shares sold | | | 4,892,766 | | | $ | 50,048,093 | |
Shares issued in reinvestment of dividends and distributions | | | 346,685 | | | | 3,548,513 | |
Shares purchased | | | (3,887,096 | ) | | | (38,303,863 | ) |
Net increase (decrease) in shares outstanding before conversion | | | 1,352,355 | | | | 15,292,743 | |
Shares issued upon conversion from other share class(es) | | | 112,916 | | | | 1,155,239 | |
Shares purchased upon conversion into other share class(es) | | | (261,128 | ) | | | (2,735,136 | ) |
Net increase (decrease) in shares outstanding | | | 1,204,143 | | | $ | 13,712,846 | |
| | |
Class C | | | | | | | | |
Year ended February 28, 2022: | | | | | | | | |
Shares sold | | | 1,610,349 | | | $ | 16,522,477 | |
Shares issued in reinvestment of dividends and distributions | | | 172,659 | | | | 1,759,268 | |
Shares purchased | | | (1,462,942 | ) | | | (14,907,828 | ) |
Net increase (decrease) in shares outstanding before conversion | | | 320,066 | | | | 3,373,917 | |
Shares purchased upon conversion into other share class(es) | | | (290,734 | ) | | | (2,968,658 | ) |
Net increase (decrease) in shares outstanding | | | 29,332 | | | $ | 405,259 | |
| | |
Year ended February 28, 2021: | | | | | | | | |
Shares sold | | | 2,061,060 | | | $ | 20,967,638 | |
Shares issued in reinvestment of dividends and distributions | | | 213,952 | | | | 2,188,962 | |
Shares purchased | | | (1,008,038 | ) | | | (10,080,618 | ) |
Net increase (decrease) in shares outstanding before conversion | | | 1,266,974 | | | | 13,075,982 | |
Shares purchased upon conversion into other share class(es) | | | (264,097 | ) | | | (2,689,988 | ) |
Net increase (decrease) in shares outstanding | | | 1,002,877 | | | $ | 10,385,994 | |
PGIM Strategic Bond Fund 113
Notes to Financial Statements (continued)
| | | | | | | | |
| | | |
| Share Class | | Shares | | | Amount | |
| | |
Class Z | | | | | | | | |
Year ended February 28, 2022: | | | | | | | | |
Shares sold | | | 72,624,382 | | | $ | 743,439,906 | |
Shares issued in reinvestment of dividends and distributions | | | 6,615,813 | | | | 67,531,996 | |
Shares purchased | | | (99,834,364 | ) | | | (1,016,830,943 | ) |
Net increase (decrease) in shares outstanding before conversion | | | (20,594,169 | ) | | | (205,859,041 | ) |
Shares issued upon conversion from other share class(es) | | | 1,039,418 | | | | 10,546,093 | |
Shares purchased upon conversion into other share class(es) | | | (763,912 | ) | | | (7,793,146 | ) |
Net increase (decrease) in shares outstanding | | | (20,318,663 | ) | | $ | (203,106,094 | ) |
| | |
Year ended February 28, 2021: | | | | | | | | |
Shares sold | | | 127,213,177 | | | $ | 1,288,561,021 | |
Shares issued in reinvestment of dividends and distributions | | | 7,096,455 | | | | 72,662,024 | |
Shares purchased | | | (92,285,180 | ) | | | (913,095,393 | ) |
Net increase (decrease) in shares outstanding before conversion | | | 42,024,452 | | | | 448,127,652 | |
Shares issued upon conversion from other share class(es) | | | 450,723 | | | | 4,650,796 | |
Shares purchased upon conversion into other share class(es) | | | (38,743 | ) | | | (380,911 | ) |
Net increase (decrease) in shares outstanding | | | 42,436,432 | | | $ | 452,397,537 | |
| | |
Class R6 | | | | | | | | |
Year ended February 28, 2022: | | | | | | | | |
Shares sold | | | 2,054,010 | | | $ | 20,847,109 | |
Shares issued in reinvestment of dividends and distributions | | | 146,334 | | | | 1,493,165 | |
Shares purchased | | | (1,754,519 | ) | | | (17,901,313 | ) |
Net increase (decrease) in shares outstanding before conversion | | | 445,825 | | | | 4,438,961 | |
Shares issued upon conversion from other share class(es) | | | 655,062 | | | | 6,688,955 | |
Shares purchased upon conversion into other share class(es) | | | (507,316 | ) | | | (5,113,744 | ) |
Net increase (decrease) in shares outstanding | | | 593,571 | | | $ | 6,014,172 | |
| | |
Year ended February 28, 2021: | | | | | | | | |
Shares sold | | | 3,324,447 | | | $ | 34,275,439 | |
Shares issued in reinvestment of dividends and distributions | | | 71,872 | | | | 748,013 | |
Shares purchased | | | (302,063 | ) | | | (3,082,186 | ) |
Net increase (decrease) in shares outstanding | | | 3,094,256 | | | $ | 31,941,266 | |
8. Borrowings
The RIC, on behalf of the Fund, along with other affiliated registered investment companies (the “Participating Funds”), is a party to a Syndicated Credit Agreement (“SCA”) with a group of banks. The purpose of the SCA is to provide an alternative source of temporary
114
funding for capital share redemptions. The table below provides details of the current SCA in effect at the reporting period-end as well as the prior SCA.
| | | | |
| | | |
| | | Current SCA | | Prior SCA |
| | |
Term of Commitment | | 10/1/2021 – 9/29/2022 | | 10/2/2020 – 9/30/2021 |
| | |
Total Commitment | | $ 1,200,000,000 | | $ 1,200,000,000 |
| | |
Annualized Commitment Fee on the Unused Portion of the SCA | | 0.15% | | 0.15% |
| | |
Annualized Interest Rate on Borrowings | | 1.20% plus the higher of (1) the effective federal funds rate, (2) the one-month LIBOR rate or (3) zero percent | | 1.30% plus the higher of (1) the effective federal funds rate, (2) the one-month LIBOR rate or (3) zero percent |
Certain affiliated registered investment companies that are parties to the SCA include portfolios that are subject to a predetermined mathematical formula used to manage certain benefit guarantees offered under variable annuity contracts. The formula may result in large scale asset flows into and out of these portfolios. Consequently, these portfolios may be more likely to utilize the SCA for purposes of funding redemptions. It may be possible for those portfolios to fully exhaust the committed amount of the SCA, thereby requiring the Manager to allocate available funding per a Board-approved methodology designed to treat the Participating Funds in the SCA equitably.
The Fund utilized the SCA during the year ended February 28, 2022. The average daily balance for the 11 days that the Fund had loans outstanding during the period was approximately $5,392,182, borrowed at a weighted average interest rate of 1.31%. The maximum loan outstanding amount during the period was $26,661,000. At February 28, 2022, the Fund did not have an outstanding loan amount.
9. Risks of Investing in the Fund
The Fund’s risks include, but are not limited to, some or all of the risks discussed below. For further information on the Fund’s risks, please refer to the Fund’s Prospectus and Statement of Additional Information.
Active Trading Risk: The Fund actively and frequently trades its portfolio securities. High portfolio turnover results in higher transaction costs, which can affect the Fund’s performance and have adverse tax consequences. In addition, high portfolio turnover may also mean that a proportionately greater amount of distributions to shareholders will be taxed as ordinary income rather than long-term capital gains compared to investment companies with lower portfolio turnover.
Bank Loan Investments Risk: The Fund’s ability to receive payments of principal and interest and other amounts in connection with loans (whether through participations, assignments or otherwise) will depend primarily on the financial condition of the borrower. The failure by the Fund to receive scheduled interest or principal payments on a loan because of a default, bankruptcy or any other reason would adversely affect the income of
PGIM Strategic Bond Fund 115
Notes to Financial Statements (continued)
the Fund and would likely reduce the value of its assets. Even with loans secured by collateral, there is the risk that the value of the collateral may decline, may be insufficient to meet the obligations of the borrower, or be difficult to liquidate. In the event of a default, the Fund may have difficulty collecting on any collateral and would not have the ability to collect on any collateral for an uncollateralized loan. Further, the Fund’s access to collateral, if any, may be limited by bankruptcy laws. Due to the nature of the private syndication of senior loans, including, for example, lack of publicly-available information, some senior loans are not as easily purchased or sold as publicly-traded securities. In addition, loan participations generally are subject to restrictions on transfer, and only limited opportunities may exist to sell loan participations in secondary markets. As a result, it may be difficult for the Fund to value loans or sell loans at an acceptable price when it wants to sell them. Loans trade in an over-the-counter market, and confirmation and settlement, which are effected through standardized procedures and documentation, may take significantly longer than seven days to complete. Extended trade settlement periods may, in unusual market conditions with a high volume of shareholder redemptions, present a risk to shareholders regarding the Fund’s ability to pay redemption proceeds in a timely manner. In some instances, loans and loan participations are not rated by independent credit rating agencies; in such instances, a decision by the Fund to invest in a particular loan or loan participation could depend exclusively on the subadviser’s credit analysis of the borrower, or in the case of a loan participation, of the intermediary holding the portion of the loan that the Fund has purchased. To the extent the Fund invests in loans of non-U.S. issuers, the risks of investing in non-U.S. issuers are applicable. Loans may not be considered to be “securities” and as a result may not benefit from the protections of the federal securities laws, including anti-fraud protections and those with respect to the use of material non-public information, so that purchasers, such as the Fund, may not have the benefit of these protections. If the Fund is in possession of material non-public information about a borrower as a result of its investment in such borrower’s loan, the Fund may not be able to enter into a transaction with respect to a publicly-traded security of the borrower when it would otherwise be advantageous to do so.
Commodity Regulatory Risk: The Fund is deemed a “commodity pool” and the Manager is considered a “commodity pool operator” with respect to the Fund under the Commodity Exchange Act. The Manager, directly or through its affiliates, is therefore subject to dual regulation by the Securities and Exchange Commission and the CFTC. The regulatory requirements governing the use of commodity futures (which include futures on broad-based securities indexes, interest rate futures and currency futures), options on commodity futures, certain swaps or certain other investments could change at any time.
“Covenant-Lite” Risk: Some of the loans or debt obligations in which the Fund may invest or get exposure to may be “covenant-lite”, which means the loans or obligations contain fewer financial maintenance covenants than other loans or obligations (in some cases, none) and
116
do not include terms which allow the lender to monitor the borrower’s performance and declare a default if certain criteria are breached. An investment by the Fund in a covenant-lite loan may potentially hinder the ability to reprice credit risk associated with the issuer and reduce the ability to restructure a problematic loan and mitigate potential loss. The Fund may also experience difficulty, expenses or delays in enforcing its rights on its holdings of covenant-lite loans or obligations. As a result of these risks, the Fund’s exposure to losses may be increased, which could result in an adverse impact on the Fund’s net income and NAV.
Credit Risk/Counterparty Risk: The ability, or perceived ability, of the issuer or guarantor of a debt security, or the counterparty (the party on the other side of the transaction) to a derivatives contract or other financial contract to meet its financial obligations will affect the value of the security or derivative. Counterparty and credit risk are especially important in the context of privately negotiated instruments. The Fund expects to enter into certain privately negotiated agreements where the counterparty assumes the physical settlement obligations of the Fund under such transactions. Under this type of arrangement, there is a risk that the relevant counterparty or intermediary would, due to insolvency or other reasons, be unable to or fail to assume the physical settlement obligations of the Fund, in which case the Fund could be required to sell portfolio instruments at unfavorable times or prices or could have insufficient assets to satisfy its physical settlement obligations.
Credit ratings are intended to provide a measure of credit risk. However, credit ratings are only the opinions of the credit rating agency issuing the ratings and are not guarantees as to quality. The lower the rating of a debt security held by the Fund, the greater the degree of credit risk that is perceived to exist by the credit rating agency with respect to that security. Increasing the amount of Fund assets allocated to lower-rated securities generally will increase the credit risk to which the Fund is subject. Not all securities in which the Fund invests are rated. The longer the maturity and the lower the credit quality of a bond, the more sensitive it is to credit risk.
Currency Risk: The Fund’s net asset value could decline as a result of changes in exchange rates, which could adversely affect the Fund’s investments in currencies, or in securities that trade in, and receive revenues related to, currencies, or in derivatives that provide exposure to currencies. Certain foreign countries may impose restrictions on the ability of issuers of foreign securities to make payment of principal and interest or dividends to investors located outside the country, due to blockage of foreign currency exchanges or otherwise.
Cyber Security Risk: Failures or breaches of the electronic systems of the Fund, the Fund’s manager, subadviser and other service providers, or the issuers of securities in which the Fund invests have the ability to cause disruptions and negatively impact the Fund’s business operations, potentially resulting in financial losses to the Fund and its shareholders. While the Fund has established business continuity plans and risk management systems seeking to address system breaches or failures, there are inherent limitations in such plans and systems. Furthermore, the Fund cannot control the cyber security plans and systems of the Fund’s service providers or issuers of securities in which the Fund invests.
PGIM Strategic Bond Fund 117
Notes to Financial Statements (continued)
Derivatives Risk: Derivatives involve special risks and costs and may result in losses to the Fund. The successful use of derivatives requires sophisticated management, and, to the extent that derivatives are used, the Fund will depend on the subadviser’s ability to analyze and manage derivative transactions. The prices of derivatives may move in unexpected ways, especially in abnormal market conditions. Some derivatives are “leveraged” and therefore may magnify or otherwise increase investment losses to the Fund. The Fund’s use of derivatives may also increase the amount of taxes payable by shareholders. Other risks arise from the potential inability to terminate or sell derivatives positions. A liquid secondary market may not always exist for the Fund’s derivatives positions. In fact, many OTC derivative instruments will not have liquidity beyond the counterparty to the instrument. OTC derivative instruments also involve the risk that the other party will not meet its obligations to the Fund.
The U.S. Government and foreign governments have adopted (and may adopt further) regulations governing derivatives markets, including mandatory clearing of certain derivatives, margin and reporting requirements and risk exposure limitations. The ultimate impact of the regulations remains unclear. Additional regulation of derivatives may make derivatives more costly, limit their availability or utility, or otherwise adversely affect their performance or disrupt markets.
Economic and Market Events Risk: Events in the U.S. and global financial markets, including actions taken by the U.S. Federal Reserve or foreign central banks to stimulate or stabilize economic growth or the functioning of the securities markets, may at times result in unusually high market volatility, which could negatively impact performance. Relatively reduced liquidity in credit and fixed income markets could adversely affect issuers worldwide.
Emerging Markets Risk: The risks of foreign investments are greater for investments in or exposed to emerging markets. Emerging market countries typically have economic and political systems that are less fully developed, and can be expected to be less stable, than those of more developed countries. For example, the economies of such countries can be subject to rapid and unpredictable rates of inflation or deflation. Low trading volumes may result in a lack of liquidity and price volatility. Emerging market countries may have policies that restrict investment by non-US investors, or that prevent non-US investors from withdrawing their money at will.
The Fund may invest in some emerging markets that subject it to risks such as those associated with illiquidity, custody of assets, different settlement and clearance procedures and asserting legal title under a developing legal and regulatory regime to a greater degree than in developed markets or even in other emerging markets.
118
Fixed Income Risk: As with credit risk, market risk and interest rate risk, the Fund’s holdings, share price, yield and total return may fluctuate in response to bond market movements. The value of bonds may decline for issuer-related reasons, including management performance, financial leverage and reduced demand for the issuer’s goods and services. Certain types of fixed income obligations also may be subject to call and redemption risk, which is the risk that the issuer may call a bond held by the Fund for redemption before it matures and the Fund may lose income.
Foreign Securities Risk: The Fund’s investments in securities of foreign issuers or issuers with significant exposure to foreign markets involve additional risk. The securities of such issuers may trade in markets that are less liquid, less regulated and more volatile than US markets. The value of the Fund’s investments may decline because of factors affecting the particular issuer as well as foreign markets and issuers generally, such as unfavorable government actions, and political or financial instability. Lack of information may also affect the value of these securities.
Increase in Expenses Risk: Your actual cost of investing in the Fund may be higher than the expenses shown in the expense table in the Fund’s prospectus for a variety of reasons. For example, expense ratios may be higher than those shown if average net assets decrease. Net assets are more likely to decrease and Fund expense ratios are more likely to increase when markets are volatile. Active and frequent trading of Fund securities can increase expenses.
Interest Rate Risk: The value of your investment may go down when interest rates rise. A rise in rates tends to have a greater impact on the prices of longer term or duration debt securities. For example, a fixed income security with a duration of three years is expected to decrease in value by approximately 3% if interest rates increase by 1%. This is referred to as “duration risk.” When interest rates fall, the issuers of debt obligations may prepay principal more quickly than expected, and the Fund may be required to reinvest the proceeds at a lower interest rate. This is referred to as “prepayment risk.” When interest rates rise, debt obligations may be repaid more slowly than expected, and the value of the Fund’s holdings may fall sharply. This is referred to as “extension risk.” The Fund may lose money if short-term or long-term interest rates rise sharply or in a manner not anticipated by the subadviser.
Junk Bonds Risks: High-yield, high-risk bonds have predominantly speculative characteristics, including particularly high credit risk. Junk bonds tend to have lower market liquidity than higher-rated securities. The liquidity of particular issuers or industries within a particular investment category may shrink or disappear suddenly and without warning. The non-investment grade bond market can experience sudden and sharp price swings and become illiquid due to a variety of factors, including changes in economic forecasts, stock market activity, large sustained sales by major investors, a high profile default or a change in the market’s psychology.
PGIM Strategic Bond Fund 119
Notes to Financial Statements (continued)
Large Shareholder and Large Scale Redemption Risk: Certain individuals, accounts, funds (including funds affiliated with the Manager) or institutions, including the Manager and its affiliates, may from time to time own or control a substantial amount of the Fund’s shares. There is no requirement that these entities maintain their investment in the Fund. There is a risk that such large shareholders or that the Fund’s shareholders generally may redeem all or a substantial portion of their investments in the Fund in a short period of time, which could have a significant negative impact on the Fund’s NAV, liquidity, and brokerage costs. Large redemptions could also result in tax consequences to shareholders and impact the Fund’s ability to implement its investment strategy. The Fund’s ability to pursue its investment objective after one or more large scale redemptions may be impaired and, as a result, the Fund may invest a larger portion of its assets in cash or cash equivalents.
Leverage Risk: Certain transactions in which the Fund may engage may give rise to leverage. The use of leverage exaggerates the effect of any increase or decrease in the value of the Fund’s holdings, and makes any change in the Fund’s net asset value (“NAV”) greater than it would be without the use of leverage. This could result in increased volatility of investment return.
LIBOR Risk: Many financial instruments use or may use a floating rate based on the London Interbank Offered Rate, or “LIBOR,” which is the offered rate for short-term Eurodollar deposits between major international banks. Over the course of the last several years, global regulators have indicated an intent to phase out the use of LIBOR and similar interbank offering rates (“IBORs”). There still remains uncertainty regarding the nature of any replacement rates for LIBOR and the other IBORs as well as around fallback approaches for instruments extending beyond the any phase-out of these reference rates. The lack of consensus around replacement rates and the uncertainty of the phase out of LIBOR and other IBORs may result in increased volatility in corporate or governmental debt, bank loans, derivatives and other instruments invested in by the Fund as well as loan facilities used by the Fund.
The potential effect of a transition away from LIBOR on the Fund or the financial instruments in which the Fund invests cannot yet be determined. The elimination of LIBOR or changes to other reference rates or any other changes or reforms to the determination or supervision of reference rates could have an adverse impact on the market for, or value of, any securities or payments linked to those reference rates, which may adversely affect the Fund’s performance and/or net asset value. Certain proposed replacement rates to LIBOR, such as the Secured Overnight Financing Rate (“SOFR”), are materially different from LIBOR, and changes in the applicable spread for instruments previously linked to LIBOR will need to be made in order for instruments to pay similar rates. Uncertainty and risk also remain regarding the willingness and ability of issuers and lenders to include revised provisions in new and existing contracts or instruments. Consequently, the transition away from LIBOR to
120
other reference rates may lead to reduced coupons on debt held by the Fund, higher rates required to be paid by the Fund on bank lines of credit due to increases in spreads, increased volatility and illiquidity in markets that are tied to LIBOR, fluctuations in values of LIBOR-related investments or investments in issuers that utilize LIBOR, increased difficulty in borrowing or refinancing and diminished effectiveness of hedging strategies, adversely affecting the Fund’s performance. Furthermore, the risks associated with the expected discontinuation of LIBOR and transition may be exacerbated if the work necessary to effect an orderly transition to an alternative reference rate is not completed in a timely manner. Because the usefulness of LIBOR and the other IBORs as benchmarks could deteriorate during the transition period, these effects could begin to be experienced by the end of 2021 and beyond until the anticipated discontinuance date in 2023 for the majority of the LIBOR rates.
Liquidity Risk: Liquidity risk is the risk that the Fund could not meet requests to redeem shares issued by the Fund without significant dilution of remaining investors’ interests in the Fund. The Fund may invest in instruments that trade in lower volumes and are more illiquid than other investments. If the Fund is forced to sell these investments to pay redemption proceeds or for other reasons, the Fund may lose money. In addition, when there is no willing buyer and investments cannot be readily sold at the desired time or price, the Fund may have to accept a lower price or may not be able to sell the instrument at all. An inability to sell a portfolio position can adversely affect the Fund’s value or prevent the Fund from being able to take advantage of other investment opportunities.
Management Risk: The value of your investment may decrease if judgments by the subadviser about the attractiveness, value or market trends affecting a particular security, industry or sector or about market movements are incorrect.
Market Disruption and Geopolitical Risks: Market disruption can be caused by economic, financial or political events and factors, including but not limited to, international wars or conflicts (including Russia’s military invasion of Ukraine), geopolitical developments (including trading and tariff arrangements, sanctions and cybersecurity attacks), instability in regions such as Asia, Eastern Europe and the Middle East, terrorism, natural disasters and public health epidemics (including the outbreak of COVID-19 globally).
The extent and duration of such events and resulting market disruptions cannot be predicted, but could be substantial and could magnify the impact of other risks to the Fund. These and other similar events could adversely affect the U.S. and foreign financial markets and lead to increased market volatility, reduced liquidity in the securities markets, significant negative impacts on issuers and the markets for certain securities and commodities and/or government intervention. They may also cause short- or long-term economic uncertainties in the United States and worldwide. As a result, whether or not the Fund invests in securities of issuers located in or with significant exposure to the countries directly affected, the value and liquidity of the Fund’s investments may be negatively impacted. Further, due to closures of certain markets and restrictions on trading certain securities, the value of certain
PGIM Strategic Bond Fund 121
Notes to Financial Statements (continued)
securities held by the Fund could be significantly impacted, which could lead to such securities being valued at zero.
COVID-19 and the related governmental and public responses have had and may continue to have an impact on the Fund’s investments and net asset value and have led and may continue to lead to increased market volatility and the potential for illiquidity in certain classes of securities and sectors of the market. They have also had and may continue to result in periods of business disruption, business closures, inability to obtain raw materials, supplies and component parts, and reduced or disrupted operations for the issuers in which the Fund invests. The occurrence reoccurrence and pendency of public health epidemics could adversely affect the economies and financial markets either in specific countries or worldwide.
Market Risk: Securities markets may be volatile and the market prices of the Fund’s securities may decline. Securities fluctuate in price based on changes in an issuer’s financial condition and overall market and economic conditions. If the market prices of the securities owned by the Fund fall, the value of your investment in the Fund will decline.
Mortgage-Backed and Asset-Backed Securities Risk: Mortgage-backed and asset-backed securities tend to increase in value less than other debt securities when interest rates decline, but are subject to similar risk of decline in market value during periods of rising interest rates. The values of mortgage-backed and asset-backed securities become more volatile as interest rates rise. In a period of declining interest rates, the Fund may be required to reinvest more frequent prepayments on mortgage-backed and asset-backed securities in lower-yielding investments.
U.S. Government and Agency Securities Risk: U.S. Government and agency securities are subject to market risk, interest rate risk and credit risk. Not all U.S. Government securities are insured or guaranteed by the full faith and credit of the U.S. Government; some are only insured or guaranteed by the issuing agency, which must rely on its own resources to repay the debt. The maximum potential liability of the issuers of some U.S. Government securities held by the Fund may greatly exceed their current resources, including their legal right to support from the U.S. Treasury. No assurance can be given that the U.S. government would provide financial support to any such issuers if it is not obligated to do so by law. It is possible that these issuers will not have the funds to meet their payment obligations in the future. In addition, the value of U.S. Government securities may be affected by changes in the credit rating of the U.S. Government.
122
10. Recent Accounting Pronouncement and Regulatory Developments
In March 2020, the FASB issued Accounting Standard Update (“ASU”) No. 2020-04, which provides optional guidance for applying GAAP to contract modifications, hedging relationships and other transactions affected by the reference rate reform if certain criteria are met. ASU 2020-04 is elective and is effective on March 12, 2020 through December 31, 2022. Management does not expect ASU 2020-04 to have a material impact on the financial statements.
On December 3, 2020, the SEC announced that it voted to adopt a new rule that establishes an updated regulatory framework for fund valuation practices (the “Rule”). The Rule, in part, provides (i) a framework for determining fair value in good faith and (ii) provides for a fund Board’s assignment of its responsibility for the execution of valuation-related activities to a fund’s investment adviser. Further, the SEC is rescinding previously issued guidance on related issues. The Rule took effect on March 8, 2021, with a compliance date of September 8, 2022. Management is currently evaluating the Rule and its impact to the Fund.
PGIM Strategic Bond Fund 123
Report of Independent Registered Public Accounting Firm
To the Board of Trustees of Prudential Investment Portfolios 3 and Shareholders of PGIM Strategic Bond Fund
Opinion on the Financial Statements
We have audited the accompanying statement of assets and liabilities, including the schedule of investments, of PGIM Strategic Bond Fund (one of the funds constituting Prudential Investment Portfolios 3, referred to hereafter as the “Fund”) as of February 28, 2022, the related statement of operations for the year ended February 28, 2022, the statement of changes in net assets for each of the two years in the period ended February 28, 2022, including the related notes, and the financial highlights for each of the two years in the period ended February 28, 2022 (collectively referred to as the “financial statements”). In our opinion, the financial statements present fairly, in all material respects, the financial position of the Fund as of February 28, 2022, the results of its operations for the year then ended, and the changes in its net assets and the financial highlights for each of the two years in the period ended February 28, 2022 in conformity with accounting principles generally accepted in the United States of America.
The financial statements of the Fund as of and for the year ended February 29, 2020 and the financial highlights for each of the periods ended on or prior to February 29, 2020 (not presented herein, other than the financial highlights) were audited by other auditors whose report dated April 17, 2020 expressed an unqualified opinion on those financial statements and financial highlights.
Basis for Opinion
These financial statements are the responsibility of the Fund’s management. Our responsibility is to express an opinion on the Fund’s financial statements based on our audits. We are a public accounting firm registered with the Public Company Accounting Oversight Board (United States) (PCAOB) and are required to be independent with respect to the Fund in accordance with the U.S. federal securities laws and the applicable rules and regulations of the Securities and Exchange Commission and the PCAOB.
We conducted our audits of these financial statements in accordance with the standards of the PCAOB. Those standards require that we plan and perform the audit to obtain reasonable assurance about whether the financial statements are free of material misstatement, whether due to error or fraud.
Our audits included performing procedures to assess the risks of material misstatement of the financial statements, whether due to error or fraud, and performing procedures that respond to those risks. Such procedures included examining, on a test basis, evidence regarding the amounts and disclosures in the financial statements. Our audits also included evaluating the accounting principles used and significant estimates made by management, as well as evaluating the overall presentation of the financial statements. Our procedures included confirmation of securities owned as of February 28, 2022 by correspondence with the custodian, transfer agent and brokers; when replies were not received from brokers, we performed other auditing procedures. We believe that our audits provide a reasonable basis for our opinion.
/s/PricewaterhouseCoopers LLP
New York, New York
April 20, 2022
We have served as the auditor of one or more investment companies in the PGIM Retail Funds complex since 2020.
124
Income Tax Information (unaudited)
For the year ended February 28, 2022 the Fund reports the maximum amount allowable but not less than 50.94% as interest-related dividends in accordance with Sections 871(k)(1) and 881(e)(1) of the Internal Revenue Code.
In January 2023, you will be advised on IRS Form 1099-DIV or substitute 1099-DIV, as to the federal tax status of the dividends received by you in calendar year 2022.
We are required by Massachusetts, Missouri and Oregon to inform you that dividends which have been derived from interest on federal obligations are not taxable to shareholders provided that the Fund meets certain requirements mandated by the respective state’s taxing authorities. We are pleased to report that 4.36% of the dividends paid by the Fund qualify for such deduction.
For more detailed information regarding your state and local taxes, you should contact your tax advisor or the state/local taxing authorities.
PGIM Strategic Bond Fund 125
INFORMATION ABOUT BOARD MEMBERS AND OFFICERS (unaudited)
Information about Board Members and Officers of the Fund is set forth below. Board Members who are not deemed to be “interested persons” of the Fund, as defined in the 1940 Act, are referred to as “Independent Board Members.” Board Members who are deemed to be “interested persons” of the Fund are referred to as “Interested Board Members.” The Board Members are responsible for the overall supervision of the operations of the Fund and perform the various duties imposed on the directors of investment companies by the 1940 Act. The Board in turn elects the Officers, who are responsible for administering the day-to-day operations of the Fund.
| | | | | | |
Independent Board Members | | | | |
| | | | |
Name Year of Birth Position(s) Portfolios Overseen | | Principal Occupation(s) During Past Five Years | | Other Directorships Held During Past Five Years | | Length of
Board Service |
| | | | |
Ellen S. Alberding 1958 Board Member Portfolios Overseen: 95 | | President and Board Member, The Joyce Foundation (charitable foundation) (since 2002); formerly Vice Chair, City Colleges of Chicago (community college system) (2011-2015); Trustee, National Park Foundation (charitable foundation for national park system) (2009-2018); Trustee, Economic Club of Chicago (2009-2016); Trustee, Loyola University (since 2018). | | None. | | Since September 2013 |
| | | | |
Kevin J. Bannon 1952 Board Member Portfolios Overseen: 95 | | Retired; formerly Managing Director (April 2008-May 2015) and Chief Investment Officer (October 2008-November 2013) of Highmount Capital LLC (registered investment adviser); formerly Executive Vice President and Chief Investment Officer (April 1993-August 2007) of Bank of New York Company; President (May 2003-May 2007) of BNY Hamilton Family of Mutual Funds. | | Director of Urstadt Biddle Properties (equity real estate investment trust) (since September 2008). | | Since July 2008 |
PGIM Strategic Bond Fund
| | | | | | |
Independent Board Members | | | | | | |
| | | | |
Name Year of Birth Position(s) Portfolios Overseen | | Principal Occupation(s) During Past Five Years | | Other Directorships Held During Past Five Years | | Length of
Board Service |
| | | | |
Linda W. Bynoe 1952 Board Member Portfolios Overseen: 92 | | President and Chief Executive Officer (since March 1995) and formerly Chief Operating Officer (December 1989-February 1995) of Telemat Limited LLC (formerly Telemat Ltd) (management consulting); formerly Vice President (January 1985-June 1989) at Morgan Stanley & Co. (broker-dealer). | | Trustee of Equity Residential (residential real estate) (since December 2009); Director of Northern Trust Corporation (financial services) (since April 2006); formerly Director of Anixter International, Inc. (communication products distributor) (January 2006-June 2020). | | Since March 2005 |
| | | | |
Barry H. Evans 1960 Board Member Portfolios Overseen: 94 | | Retired; formerly President (2005-2016), Global Chief Operating Officer (2014-2016), Chief Investment Officer - Global Head of Fixed Income (1998-2014), and various portfolio manager roles (1986-2006), Manulife Asset Management (asset management). | | Formerly Director, Manulife Trust Company (2011-2018); formerly Director, Manulife Asset Management Limited (2015-2017); formerly Chairman of the Board of Directors of Manulife Asset Management U.S. (2005-2016); formerly Chairman of the Board, Declaration Investment Management and Research (2008-2016). | | Since September 2017 |
| | | | |
Keith F. Hartstein 1956 Board Member & Independent Chair Portfolios Overseen: 95 | | Retired; Member (since November 2014) of the Governing Council of the Independent Directors Council (IDC) (organization of independent mutual fund directors); formerly Executive Committee of the IDC Board of Governors (October 2019-December 2021); formerly President and Chief Executive Officer (2005-2012), Senior Vice President (2004-2005), Senior Vice President of Sales and Marketing (1997-2004), and various executive management positions (1990-1997), John Hancock Funds, LLC (asset management); Chairman, Investment Company Institute’s Sales Force Marketing Committee (2003-2008). | | None. | | Since September 2013 |
Visit our website at pgim.com/investments
| | | | | | |
Independent Board Members |
| | | | |
Name Year of Birth Position(s) Portfolios Overseen | | Principal Occupation(s) During Past Five Years | | Other Directorships Held During Past Five Years | | Length of
Board Service |
| | | | |
Laurie Simon Hodrick 1962 Board Member Portfolios Overseen: 91 | | A. Barton Hepburn Professor Emerita of Economics in the Faculty of Business, Columbia Business School (since 2018); Visiting Fellow at the Hoover Institution, Stanford University (since 2015); Sole Member, ReidCourt LLC (since 2008) (a consulting firm); formerly Visiting Professor of Law, Stanford Law School (2015-2021); formerly A. Barton Hepburn Professor of Economics in the Faculty of Business, Columbia Business School (1996-2017); formerly Managing Director, Global Head of Alternative Investment Strategies, Deutsche Bank (2006-2008). | | Independent Director, Andela (since January 2022) (global talent network); Independent Director, Roku (since December 2020) (communication services); formerly Independent Director, Synnex Corporation (2019-2021) (information technology); formerly Independent Director, Kabbage, Inc. (2018-2020) (financial services); formerly Independent Director, Corporate Capital Trust (2017-2018) (a business development company). | | Since September 2017 |
| | | | |
Brian K. Reid 1961 Board Member Portfolios Overseen: 94 | | Retired; formerly Chief Economist for the Investment Company Institute (ICI) (2005-2017); formerly Senior Economist and Director of Industry and Financial Analysis at the ICI (1998-2004); formerly Senior Economist, Industry and Financial Analysis at the ICI (1996-1998); formerly Staff Economist at the Federal Reserve Board (1989-1996); Director, ICI Mutual Insurance Company (2012-2017). | | None. | | Since March 2018 |
PGIM Strategic Bond Fund
| | | | | | |
Independent Board Members |
| | | | |
Name Year of Birth Position(s) Portfolios Overseen | | Principal Occupation(s) During Past Five Years | | Other Directorships Held During Past Five Years | | Length of
Board Service |
| | | | |
Grace C. Torres 1959 Board Member Portfolios Overseen: 94 | | Retired; formerly Treasurer and Principal Financial and Accounting Officer of the PGIM Funds, Target Funds, Advanced Series Trust, Prudential Variable Contract Accounts and The Prudential Series Fund (1998-June 2014); Assistant Treasurer (March 1999-June 2014) and Senior Vice President (September 1999-June 2014) of PGIM Investments LLC; Assistant Treasurer (May 2003-June 2014) and Vice President (June 2005-June 2014) of AST Investment Services, Inc.; Senior Vice President and Assistant Treasurer (May 2003-June 2014) of Prudential Annuities Advisory Services, Inc. | | Director (since January 2018) of OceanFirst Financial Corp. and OceanFirst Bank; formerly Director (July 2015-January 2018) of Sun Bancorp, Inc. N.A. and Sun National Bank. | | Since November 2014 |
| | | | | | |
Interested Board Members |
| | | | |
Name Year of Birth Position(s) Portfolios Overseen | | Principal Occupation(s) During Past Five Years | | Other Directorships Held During Past Five Years | | Length of
Board Service |
| | | | |
Stuart S. Parker 1962 Board Member & President Portfolios Overseen: 94 | | President, Chief Executive Officer, Chief Operating Officer and Officer in Charge of PGIM Investments LLC (formerly known as Prudential Investments LLC) (since January 2012); formerly Executive Vice President of Jennison Associates LLC and Head of Retail Distribution of PGIM Investments LLC (June 2005-December 2011); Investment Company Institute - Board of Governors (since May 2012). | | None. | | Since January 2012 |
Visit our website at pgim.com/investments
| | | | | | |
Interested Board Members | | | | | | |
| | | | |
Name Year of Birth Position(s) Portfolios Overseen | | Principal Occupation(s) During Past Five Years | | Other Directorships Held During Past Five Years | | Length of
Board Service |
| | | | |
Scott E. Benjamin 1973 Board Member & Vice President Portfolios Overseen: 95 | | Executive Vice President (since May 2009) of PGIM Investments LLC; Vice President (since June 2012) of Prudential Investment Management Services LLC; Executive Vice President (since September 2009) of AST Investment Services, Inc.; Senior Vice President of Product Development and Marketing, PGIM Investments (since February 2006); formerly Vice President of Product Development and Product Management, PGIM Investments LLC (2003-2006). | | None. | | Since March 2010 |
| | | | |
Fund Officers(a) | | | | |
| | | |
Name Year of Birth Fund Position | | Principal Occupation(s) During Past Five Years | | Length of
Service as Fund
Officer |
| | | |
Claudia DiGiacomo 1974 Chief Legal Officer | | Chief Legal Officer, Executive Vice President and Secretary of PGIM Investments LLC (since August 2020); Chief Legal Officer of Prudential Mutual Fund Services LLC (since August 2020); Chief Legal Officer of PIFM Holdco, LLC (since August 2020); Vice President and Corporate Counsel (since January 2005) of Prudential; and Corporate Counsel of AST Investment Services, Inc. (since August 2020); formerly Vice President and Assistant Secretary of PGIM Investments LLC (2005-2020); formerly Associate at Sidley Austin Brown & Wood LLP (1999-2004). | | Since December 2005 |
| | | |
Isabelle Sajous 1976 Chief Compliance Officer | | Chief Compliance Officer (since April 2022) of the PGIM Funds, Target Funds, PGIM Global High Yield Fund, Inc., PGIM High Yield Bond Fund, Inc., PGIM Short Duration High Yield Opportunities Fund, Advanced Series Trust, The Prudential Series Fund and Prudential’s Gibraltar Fund, Inc.; Chief Compliance Officer (since March 2022) of the PGIM Private Real Estate Fund; Vice President, Compliance of PGIM Investments LLC (since December 2020); formerly Director, Compliance (July 2018-December 2020) of Credit Suisse Asset Management LLC; and Vice President, Associate General Counsel & Deputy Chief Compliance Officer of Cramer Rosenthal McGlynn, LLC (August 2014-July 2018). | | Since April 2022 |
PGIM Strategic Bond Fund
| | | | |
Fund Officers(a) |
| | | |
Name Year of Birth Fund Position | | Principal Occupation(s) During Past Five Years | | Length of
Service as Fund
Officer |
| | | |
Andrew R. French 1962 Secretary | | Vice President (since December 2018) of PGIM Investments LLC; formerly Vice President and Corporate Counsel (2010-2018) of Prudential; formerly Director and Corporate Counsel (2006-2010) of Prudential; Vice President and Assistant Secretary (since January 2007) of PGIM Investments LLC; Vice President and Assistant Secretary (since January 2007) of Prudential Mutual Fund Services LLC. | | Since October 2006 |
| | | |
Diana N. Huffman 1982 Assistant Secretary | | Vice President and Corporate Counsel (since September 2015) of Prudential; Vice President and Assistant Secretary (since August 2020) of PGIM Investments LLC; formerly Associate at Willkie Farr & Gallagher LLP (2009-2015). | | Since March 2019 |
| | | |
Melissa Gonzalez 1980 Assistant Secretary | | Vice President and Corporate Counsel (since September 2018) of Prudential; Vice President and Assistant Secretary (since August 2020) of PGIM Investments LLC; formerly Director and Corporate Counsel (March 2014-September 2018) of Prudential. | | Since March 2020 |
| | | |
Patrick E. McGuinness 1986 Assistant Secretary | | Vice President and Assistant Secretary (since August 2020) of PGIM Investments LLC; Director and Corporate Counsel (since February 2017) of Prudential; and Corporate Counsel (2012-2017) of IIL, Inc. | | Since June 2020 |
| | | |
Debra Rubano 1975 Assistant Secretary | | Vice President and Corporate Counsel (since November 2020) of Prudential; formerly Director and Senior Counsel of Allianz Global Investors U.S. Holdings LLC (2010-2020) and Assistant Secretary of numerous funds in the Allianz fund complex (2015-2020). | | Since December 2020 |
| | | |
Kelly A. Coyne 1968 Assistant Secretary | | Director, Investment Operations of Prudential Mutual Fund Services LLC (since 2010). | | Since March 2015 |
| | | |
Christian J. Kelly 1975 Treasurer and Principal Financial and Accounting Officer | | Vice President, Head of Fund Administration of PGIM Investments LLC (since November 2018); formerly Director of Fund Administration of Lord Abbett & Co. LLC (2009-2018), Treasurer and Principal Accounting Officer of the Lord Abbett Family of Funds (2017-2018); Director of Accounting, Avenue Capital Group (2008-2009); Senior Manager, Investment Management Practice of Deloitte & Touche LLP (1998-2007). | | Since January 2019 |
| | | |
Lana Lomuti 1967 Assistant Treasurer | | Vice President (since 2007) and Director (2005-2007), within PGIM Investments Fund Administration; formerly Assistant Treasurer (December 2007-February 2014) of The Greater China Fund, Inc. | | Since April 2014 |
| | | |
Russ Shupak 1973 Assistant Treasurer | | Vice President (since 2017) and Director (2013-2017), within PGIM Investments Fund Administration. | | Since October 2019 |
Visit our website at pgim.com/investments
| | | | |
Fund Officers(a) | | | | |
| | | |
Name Year of Birth Fund Position | | Principal Occupation(s) During Past Five Years | | Length of Service as Fund Officer |
| | | |
Deborah Conway 1969 Assistant Treasurer | | Vice President (since 2017) and Director (2007-2017), within PGIM Investments Fund Administration. | | Since October 2019 |
| | | |
Elyse M. McLaughlin 1974 Assistant Treasurer | | Vice President (since 2017) and Director (2011-2017), within PGIM Investments Fund Administration. | | Since October 2019 |
| | | |
Jonathan Corbett 1983 Anti-Money Laundering Compliance Officer | | Vice President, Corporate Compliance, Global Compliance Programs and Compliance Risk Management (since August 2019) of Prudential; formerly Vice President and Head of Key Risk Areas Compliance (March 2016 to July 2019), Chief Privacy Officer (March 2016 to July 2019) and Head of Global Financial Crimes Unit (April 2014 to March 2016) at MetLife. | | Since October 2021 |
(a) Excludes Mr. Parker and Mr. Benjamin, interested Board Members who also serve as President and Vice President, respectively.
Explanatory Notes to Tables:
| ∎ | Board Members are deemed to be “Interested,” as defined in the 1940 Act, by reason of their affiliation with PGIM Investments LLC and/or an affiliate of PGIM Investments LLC. |
| ∎ | Unless otherwise noted, the address of all Board Members and Officers is c/o PGIM Investments LLC, 655 Broad Street, Newark, New Jersey 07102-4410. |
| ∎ | There is no set term of office for Board Members or Officers. The Board Members have adopted a retirement policy, which calls for the retirement of Board Members on December 31 of the year in which they reach the age of 75. |
| ∎ | “Other Directorships Held” includes all directorships of companies required to register or file reports with the SEC under the 1934 Act (that is, “public companies”) or other investment companies registered under the 1940 Act. |
| ∎ | “Portfolios Overseen” includes all investment companies managed by PGIM Investments LLC. The investment companies for which PGIM Investments LLC serves as manager include the PGIM Funds, Target Funds, The Prudential Variable Contract Accounts, PGIM ETF Trust, PGIM High Yield Bond Fund, Inc., PGIM Global High Yield Fund, Inc., PGIM Short Duration High Yield Opportunities Fund, The Prudential Series Fund, Prudential’s Gibraltar Fund, Inc. and the Advanced Series Trust. |
| ∎ | As used in the Fund Officers table “Prudential” means The Prudential Insurance Company of America. |
PGIM Strategic Bond Fund
| | | | |
| | | |
| ∎ MAIL | | ∎ TELEPHONE | | ∎ WEBSITE |
655 Broad Street | | (800) 225-1852 | | pgim.com/investments |
Newark, NJ 07102 | | | | |
| | | | |
| | | |
| PROXY VOTING | | | | |
The Board of Trustees of the Fund has delegated to the Fund’s subadvisers the responsibility for voting any proxies and maintaining proxy recordkeeping with respect to the Fund. A description of these proxy voting policies and procedures is available without charge, upon request, by calling (800) 225-1852 or by visiting the Securities and Exchange Commission’s website at sec.gov. Information regarding how the Fund voted proxies relating to portfolio securities during the most recent 12-month period ended June 30 is available on the Fund’s website and on the Securities and Exchange Commission’s website. |
| | | | | |
| | | |
| TRUSTEES | | | | |
Ellen S. Alberding · Kevin J. Bannon · Scott E. Benjamin · Linda W. Bynoe · Barry H. Evans · Keith F. Hartstein · Laurie Simon Hodrick · Stuart S. Parker · Brian K. Reid · Grace C. Torres |
| |
| | | |
| OFFICERS | | | | |
Stuart S. Parker, President · Scott E. Benjamin, Vice President · Christian J. Kelly, Treasurer and Principal Financial and Accounting Officer · Claudia DiGiacomo, Chief Legal Officer · Isabelle Sajous, Chief Compliance Officer · Jonathan Corbett, Anti-Money Laundering Compliance Officer · Andrew R. French, Secretary · Melissa Gonzalez, Assistant Secretary · Diana N. Huffman, Assistant Secretary · Kelly A. Coyne, Assistant Secretary · Patrick E. McGuinness, Assistant Secretary · Debra Rubano, Assistant Secretary · Lana Lomuti, Assistant Treasurer · Russ Shupak, Assistant Treasurer · Elyse M. McLaughlin, Assistant Treasurer · Deborah Conway, Assistant Treasurer |
| | | | |
| | |
| MANAGER | | PGIM Investments LLC | | 655 Broad Street Newark, NJ 07102 |
| | |
| SUBADVISERS | | PGIM Fixed Income | | 655 Broad Street Newark, NJ 07102 |
| | |
| | | PGIM Limited | | Grand Buildings, 1-3 Strand Trafalgar Square London, WC2N 5HR United Kingdom |
| | |
| DISTRIBUTOR | | Prudential Investment Management Services LLC | | 655 Broad Street Newark, NJ 07102 |
| | |
| CUSTODIAN | | The Bank of New York Mellon | | 240 Greenwich Street New York, NY 10286 |
| | |
| TRANSFER AGENT | | Prudential Mutual Fund Services LLC | | PO Box 9658 Providence, RI 02940 |
| | |
| INDEPENDENT REGISTERED PUBLIC ACCOUNTING FIRM | | PricewaterhouseCoopers LLP | | 300 Madison Avenue New York, NY 10017 |
| | |
| FUND COUNSEL | | Willkie Farr & Gallagher LLP | | 787 Seventh Avenue New York, NY 10019 |
An investor should consider the investment objectives, risks, charges, and expenses of the Fund carefully before investing. The prospectus and summary prospectus contain this and other information about the Fund. An investor may obtain the prospectus and summary prospectus by visiting our website at pgim.com/investments or by calling (800) 225-1852. The prospectus and summary prospectus should be read carefully before investing.
E-DELIVERY
To receive your mutual fund documents online, go to pgim.com/investments/resource/edelivery and enroll. Instead of receiving printed documents by mail, you will receive notification via email when new materials are available. You can cancel your enrollment or change your email address at any time by visiting the website address above.
SHAREHOLDER COMMUNICATIONS WITH TRUSTEES
Shareholders can communicate directly with the Board of Trustees by writing to the Chair of the Board, PGIM Strategic Bond Fund, PGIM Investments, Attn: Board of Trustees, 655 Broad Street, Newark, NJ 07102. Shareholders can communicate directly with an individual Trustee by writing to that Trustee at the same address. Communications are not screened before being delivered to the addressee.
AVAILABILITY OF PORTFOLIO HOLDINGS
The Fund files its complete schedule of portfolio holdings with the Securities and Exchange Commission on Form N-PORT. The Fund’s Form N-PORT filings are available on the Commission’s website at sec.gov. Form N-PORT is filed with the Commission quarterly, and each Fund’s full portfolio holdings as of the first and third fiscal quarter-ends will be made publicly available 60 days after the end of each quarter at sec.gov.
The Fund’s Statement of Additional Information contains additional information about the Fund’s Trustees and is available without charge, upon request, by calling (800) 225-1852.
| | | | |
| Mutual Funds: | | | | |
| | | |
| ARE NOT INSURED BY THE FDIC OR ANY | | MAY LOSE VALUE | | ARE NOT A DEPOSIT OF OR GUARANTEED |
FEDERAL GOVERNMENT AGENCY | | BY ANY BANK OR ANY BANK AFFILIATE |

PGIM STRATEGIC BOND FUND
| | | | | | | | |
| | | | |
| SHARE CLASS | | A | | C | | Z | | R6 |
| | | | |
| NASDAQ | | PUCAX | | PUCCX | | PUCZX | | PUCQX |
| | | | |
| CUSIP | | 74440K678 | | 74440K660 | | 74440K652 | | 74440K520 |
| | | | |
| MF231E | | | | | | | | |
Item 2 – Code of Ethics — See Exhibit (a)
As of the end of the period covered by this report, the registrant has adopted a code of ethics (the “Section 406 Standards for Investment Companies – Ethical Standards for Principal Executive and Financial Officers”) that applies to the registrant’s Principal Executive Officer and Principal Financial Officer; the registrant’s Principal Financial Officer also serves as the Principal Accounting Officer.
The registrant hereby undertakes to provide any person, without charge, upon request, a copy of the code of ethics. To request a copy of the code of ethics, contact the registrant 800-225-1852, and ask for a copy of the Section 406 Standards for Investment Companies - Ethical Standards for Principal Executive and Financial Officers.
Item 3 – Audit Committee Financial Expert –
The registrant’s Board has determined that Ms. Grace C. Torres, member of the Board’s Audit Committee is an “audit committee financial expert,” and that she is “independent,” for purposes of this item.
Item 4 – Principal Accountant Fees and Services –
(a) Audit Fees
For the fiscal years ended February 28, 2022 and February 28, 2021, PricewaterhouseCoopers LLP (“PwC”), the Registrant’s principal accountant, billed the Registrant $111,000 and $161,000 respectively, for professional services rendered for the audit of the Registrant’s annual financial statements or services that are normally provided in connection with statutory and regulatory filings.
(b) Audit-Related Fees
For the fiscal years ended February 28, 2022 and February 28, 2021, PwC did not bill the Registrant for audit-related services.
For the fiscal year ended February 28, 2021, fees of $8,698 were billed to the Registrant for services rendered by KPMG LLP (the Registrant’s prior principal accountant) in connection with the auditor transition.
(c) Tax Fees
For the fiscal years ended February 28, 2022 and February 28, 2021: none.
(d) All Other Fees
For the fiscal years ended February 28, 2022 and February 28, 2021: none.
(e) (1) Audit Committee Pre-Approval Policies and Procedures
THE PGIM MUTUAL FUNDS
AUDIT COMMITTEE POLICY
on
Pre-Approval of Services Provided by the Independent
Accountants
The Audit Committee of each PGIM Mutual Fund is charged with the responsibility to monitor the independence of the Fund’s independent accountants. As part of this responsibility, the Audit Committee must pre-approve the independent accounting firm’s engagement to render audit and/or permissible non-audit services, as required by law. In evaluating a proposed engagement of the independent accountants, the Audit Committee will assess the effect that the engagement might reasonably be expected to have on the accountant’s independence. The Committee’s evaluation will be based on:
| | • | | a review of the nature of the professional services expected to be provided, |
| | • | | a review of the safeguards put into place by the accounting firm to safeguard independence, and |
| | • | | periodic meetings with the accounting firm. |
Policy for Audit and Non-Audit Services Provided to the Funds
On an annual basis, the scope of audits for each Fund, audit fees and expenses, and audit-related and non-audit services (and fees proposed in respect thereof) proposed to be performed by the Fund’s independent accountants will be presented by the Treasurer and the independent accountants to the Audit Committee for review and, as appropriate, approval prior to the initiation of such services.
Such presentation shall be accompanied by confirmation by both the Treasurer and the independent accountants that the proposed
non-audit services will not adversely affect the independence of the independent accountants. Such proposed non-audit services shall be described in sufficient detail to enable the Audit Committee to assess the appropriateness of such services and fees, and the compatibility of the provision of such services with the auditor’s independence. The Committee shall receive periodic reports on the progress of the audit and other services which are approved by the Committee or by the Committee Chair pursuant to authority delegated in this Policy.
The categories of services enumerated under “Audit Services”, “Audit-related Services”, and “Tax Services” are intended to provide guidance to the Treasurer and the independent accountants as to those categories of services which the Committee believes are generally consistent with the independence of the independent accountants and which the Committee (or the Committee Chair) would expect upon the presentation of specific proposals to pre-approve. The enumerated categories are not intended as an exclusive list of audit, audit-related or tax services, which the Committee (or the Committee Chair) would consider for pre-approval.
Audit Services
The following categories of audit services are considered to be consistent with the role of the Fund’s independent accountants:
| | • | | Annual Fund financial statement audits |
| | • | | Seed audits (related to new product filings, as required) |
| | • | | SEC and regulatory filings and consents |
Audit-related Services
The following categories of audit-related services are considered to be consistent with the role of the Fund’s independent accountants:
| | • | | Accounting consultations |
| | • | | Fund merger support services |
| | • | | Agreed Upon Procedure Reports |
| | • | | Other Internal Control Reports |
Individual audit-related services that fall within one of these categories (except for fund merger support services) and are not presented to the Audit Committee as part of the annual pre-approval process are subject to an authorized pre-approval by the Audit Committee so long as the estimated fee for those services does not exceed $30,000. Any services provided under such pre-approval will be reported to the Audit Committee at its next regular meeting. Should the amount of such services exceed $30,000 any additional fees will be subject to pre-approval by the Committee Chair (or any other Committee member on whom this responsibility has been delegated). Fees related to fund merger support services are subject to a separate authorized pre-approval by the Audit Committee with fees determined on a per occurrence and merger complexity basis.
Tax Services
The following categories of tax services are considered to be consistent with the role of the Fund’s independent accountants:
| | • | | Tax compliance services related to the filing or amendment of the following: |
| | • | | Federal, state and local income tax compliance; and, |
| | • | | Sales and use tax compliance |
| | • | | Timely RIC qualification reviews |
| | • | | Tax distribution analysis and planning |
| | • | | Tax authority examination services |
| | • | | Tax appeals support services |
| | • | | Accounting methods studies |
| | • | | Fund merger support services |
| | • | | Tax consulting services and related projects |
Individual tax services that fall within one of these categories and are not presented to the Audit Committee as part of the annual pre-approval process are subject to an authorized pre-approval by the Audit Committee so long as the estimated fee for those services does not exceed $30,000. Any services provided under such pre-approval will be reported to the Audit Committee at its next regular meeting. Should the amount of such services exceed $30,000 any additional fees will be subject to pre-approval by the Committee Chair (or any other Committee member on whom this responsibility has been delegated).
Other Non-Audit Services
Certain non-audit services that the independent accountants are legally permitted to render will be subject to pre-approval by the Committee or by one or more Committee members to whom the Committee has delegated this authority and who will report to the full Committee any pre-approval decisions made pursuant to this Policy. Non-audit services presented for pre-approval pursuant to this paragraph will be accompanied by a confirmation from both the Treasurer and the independent accountants that the proposed services will not adversely affect the independence of the independent accountants.
Proscribed Services
The Fund’s independent accountants will not render services in the following categories of non-audit services:
| | • | | Bookkeeping or other services related to the accounting records or financial statements of the Fund |
| | • | | Financial information systems design and implementation |
| | • | | Appraisal or valuation services, fairness opinions, or contribution-in-kind reports |
| | • | | Internal audit outsourcing services |
| | • | | Management functions or human resources |
| | • | | Broker or dealer, investment adviser, or investment banking services |
| | • | | Legal services and expert services unrelated to the audit |
| | • | | Any other service that the Public Company Accounting Oversight Board determines, by regulation, is impermissible. |
Pre-approval of Non-Audit Services Provided to Other Entities Within the PGIM Fund Complex
Certain non-audit services provided to PGIM Investments LLC or any of its affiliates that also provide ongoing services to the PGIM Mutual Funds will be subject to pre-approval by the Audit Committee. The only non-audit services provided to these entities that will require pre-approval are those related directly to the operations and financial reporting of the Funds. Individual projects that are not presented to the Audit Committee as part of the annual pre-approval process will be subject to pre-approval by the Committee Chair (or any other Committee member on whom this responsibility has been delegated) so long as the estimated fee for those services does not exceed $30,000. Services presented for pre-approval pursuant to this paragraph will be accompanied by a confirmation from both the Treasurer and the independent accountants that the proposed services will not adversely affect the independence of the independent accountants.
Although the Audit Committee will not pre-approve all services provided to PGIM Investments LLC and its affiliates, the Committee will receive an annual report from the Fund’s independent accounting firm showing the aggregate fees for all services provided to PGIM Investments and its affiliates.
(e) (2) Percentage of services referred to in 4(b) – 4(d) that were approved by the audit committee –
For the fiscal years ended February 28, 2022 and February 28, 2021, 100% of the services referred to in Item 4(b) was approved by the audit committee.
(f) Percentage of hours expended attributable to work performed by other than full time employees of principal accountant if greater than 50%.
The percentage of hours expended on the principal accountant’s engagement to audit the registrant’s financial statements for the most recent fiscal year that were attributed to work performed by persons other than the principal accountant’s full-time, permanent employees was 0%.
(g) Non-Audit Fees
The aggregate non-audit fees billed by the Registrant’s principal accountant for services rendered to the registrant’s investment adviser and any entity controlling, controlled by, or under common control with the investment adviser that provides ongoing services to the registrant for the fiscal years ended February 28, 2022 and February 28, 2021 was $0 and $0, respectively.
(h) Principal Accountant’s Independence
Not applicable as the Registrant’s principal accountant has not provided non-audit services to the registrant’s investment adviser and any entity controlling, controlled by, or under common control with the investment adviser that provides ongoing services to the registrant that were not pre-approved pursuant to Rule 2-01(c)(7)(ii) of Regulation S-X.
Item 5 – Audit Committee of Listed Registrants – Not applicable.
| Item 6 – | Schedule of Investments – The schedule is included as part of the report to shareholders filed under Item 1 of this Form. |
| Item 7 – | Disclosure of Proxy Voting Policies and Procedures for Closed-End Management Investment Companies – Not applicable. |
Item 8 – Portfolio Managers of Closed-End Management Investment Companies – Not applicable.
| Item 9 – | Purchases of Equity Securities by Closed-End Management Investment Company and Affiliated Purchasers – Not applicable. |
Item 10 – Submission of Matters to a Vote of Security Holders – There have been no material changes to these procedures.
Item 11 – Controls and Procedures
| | (a) | It is the conclusion of the registrant’s principal executive officer and principal financial officer that the effectiveness of the registrant’s current disclosure controls and procedures (such disclosure controls and procedures having been evaluated within 90 days of the date of this filing) provide reasonable assurance that the information required to be disclosed by the registrant has been recorded, processed, summarized and reported within the time period specified in the Commission’s rules and forms and that the information required to be disclosed by the registrant has been accumulated and communicated to the registrant’s principal executive officer and principal financial officer in order to allow timely decisions regarding required disclosure. |
| | (b) | There has been no significant change in the registrant’s internal control over financial reporting that occurred during the registrant’s most recent fiscal quarter of the period covered by this report that has materially affected, or is likely to materially affect, the registrant’s internal control over financial reporting. |
Item 12 – Controls and Procedures - Disclosure of Securities Lending Activities for Closed-End Management Investment Companies – Not applicable.
Item 13 – Exhibits
SIGNATURES
Pursuant to the requirements of the Securities Exchange Act of 1934 and the Investment Company Act of 1940, the registrant has duly caused this report to be signed on its behalf by the undersigned, thereunto duly authorized.
| | |
| Registrant: | | Prudential Investment Portfolios 3 |
| |
| By: | | /s/ Andrew R. French |
| | Andrew R. French |
| | Secretary |
| |
| Date: | | April 20, 2022 |
Pursuant to the requirements of the Securities Exchange Act of 1934 and the Investment Company Act of 1940, this report has been signed below by the following persons on behalf of the registrant and in the capacities and on the dates indicated.
| | |
| By: | | /s/ Stuart S. Parker |
| | Stuart S. Parker |
| | President and Principal Executive Officer |
| |
| Date: | | April 20, 2022 |
| |
| By: | | /s/ Christian J. Kelly |
| | Christian J. Kelly |
| | Treasurer and Principal Financial and Accounting Officer |
| |
| Date: | | April 20, 2022 |