UNITED STATES SECURITIES AND EXCHANGE COMMISSION
WASHINGTON, D. C. 20549
FORM 20-F
ANNUAL REPORT PURSUANT TO SECTION 13 OR 15(D)
OF THE SECURITIES EXCHANGE ACT OF 1934
For the fiscal year ended December 31, 2008
Commission File Number: 000-30540
GIGAMEDIA LIMITED
(Exact name of registrant as specified in its charter)
REPUBLIC OF SINGAPORE
(Jurisdiction of incorporation or organization)
8TH FLOOR,
207 TIDING BOULEVARD, SECTION 2, TAIPEI 114, TAIWAN, R.O.C.
(Address of principal executive offices)
Registrant’s telephone number, including area code
886-2- 2656-8000
Securities registered or to be registered pursuant to Section 12(b) of the Exchange Act:
| | | |
| Title of Each Class | | Name of Each Exchange on Which Registered |
| | | |
| Ordinary Shares | | The NASDAQ Stock Market LLC |
Securities registered or to be registered pursuant to Section 12(g) of the Exchange Act:
None
Securities for which there is a reporting obligation pursuant to Section 15(d) of the Act:
None
Indicate the number of outstanding shares of each of the issuer’s classes of capital or common stock as of the close of the period covered by the annual report:
54,365,065 ordinary shares
Indicate by check mark if the registrant is a well-known seasoned issuer, as defined in Rule 405 of the Securities Act. Yeso Noþ
If this annual report is an annual or transition report, indicate by check mark if the registrant is not required to file reports pursuant to Section 13 or 15(d) of the Securities Exchange Act of 1934. Yeso Noþ
Note — Checking the box above will not relieve any registrant required to file reports pursuant to Section 13 or 15(d) of the Securities Exchange Act of 1934 from their obligations under those Sections.
Indicate by check mark whether the registrant (1) has filed all reports required to be filed by Section 13 or 15(d) of the Securities Exchange Act of 1934 during the preceding 12 months (or for such shorter period that the registrant was required to file such reports), and (2) has been subject to such filing requirements for the past 90 days. Yesþ Noo
Indicate by check mark whether the registrant is a large accelerated filer, an accelerated filer, or a non-accelerated filer. See definition of “accelerated filer and large accelerated filer” in Rule 12b-2 of the Exchange Act. (Check one):
| | | | | |
| Large accelerated filero | | Accelerated filerþ | | Non-accelerated filero |
Indicate by check mark which basis of accounting the registrant has used to prepare the financial statements included in this filing:
| | | | | |
| U.S. GAAPþ | | International Financial Reporting Standards as issued
by the International Accounting Standards Boardo | | Othero |
If “Other” has been checked in response to the previous question, indicate by check mark which financial statement item the registrant has elected to follow.o Item 17o Item 18
If this is an annual report, indicate by check mark whether the registrant is a shell company (as defined in Rule 12b-2 of the Exchange Act). Yeso Noþ
Indicate by check mark whether the registrant has submitted electronically and posted on its corporate Web site, if any, every Interactive Data File required to be submitted and posted pursuant to Rule 405 of Regulation S — T (§ 232.405 of this chapter) during the preceding 12 months (or for such shorter period that the registrant was required to submit and post such files). Yeso Noo
TABLE OF CONTENTS
| | | | | |
| | | Page | |
| | | 2 | |
| | | | | |
| | | 2 | |
| | | | | |
| | | 2 | |
| | | | | |
| | | 3 | |
| | | | | |
| | | 20 | |
| | | | | |
| | | 44 | |
| | | | | |
| | | 44 | |
| | | | | |
| | | 70 | |
| | | | | |
| | | 77 | |
| | | | | |
| | | 79 | |
| | | | | |
| | | 81 | |
| | | | | |
| | | 82 | |
| | | | | |
| | | 91 | |
| | | | | |
| | | 92 | |
| | | | | |
| | | 92 | |
| | | | | |
| | | 92 | |
| | | | | |
| | | 92 | |
| | | | | |
| | | 92 | |
| | | | | |
| | | 93 | |
| | | | | |
| | | 93 | |
| | | | | |
| | | 94 | |
| | | | | |
| | | 94 | |
| | | | | |
| | | 95 | |
| | | | | |
| | | 95 | |
| | | | | |
| | | 95 | |
| | | | | |
| | | 95 | |
| | | | | |
| | | 95 | |
| | | | | |
| | | 95 | |
| | | | | |
| | | 96 | |
| | | | | |
| | | 96 | |
| | | | | |
| EX-4.4 FOURTH AMENDMENT TO THE END-USER LICENSE AGREEMENT BETWEEN INTERNET MEDIA LICENSING LIMITED AND ULTRA INTERNET MEDIA, S.A., DATED MARCH 1, 2008 |
| EX-4.24 AGREEMENT FOR PLEDGE OF SHARES IN JINYOU AMONG YANG ZHUOJUN, TAN YIHUI AND T2 TECHNOLOGY, DATED JUNE 15, 2009 |
| EX-4.25 EXCLUSIVE CALL OPTION AGREEMENT REGARDING JINYOU AMONG YANG ZHUOJUN, TAN YIHUI, JINYOU AND T2 TECHNOLOGY, DATED JUNE 15, 2009 |
| EX-4.26 PROXY VOTING AGREEMENT REGARDING JINYOU AMONG T2 TECHNOLOGY, JINYOU, YANG ZHUOJUN AND TAN YIHUI, DATED JUNE 15, 2009 |
| EX-4.27 EXCLUSIVE BUSINESS CONSULTANCY SERVICE AGREEMENT BETWEEN T2 TECHNOLOGY AND JINYOU, DATED NOVEMBER 26, 2007 |
| EX-4.28 EXCLUSIVE TECHNICAL SERVICE AND CONSULTANCY AGREEMENT BETWEEN JINYOU AND T2 TECHNOLOGY, DATED NOVEMBER 26, 2007 |
| EX-4.29 SHARE SALE AND PURCHASE AGREEMENT AMONG CHAMPION LIMITED, GIGAMEDIA INTERNATIONAL HOLDINGS LIMITED AND GIGAMEDIA, DATED AUGUST 28, 2008 |
| EX-4.30 SHARE SALE AND PURCHASE AGREEMENT BETWEEN CHINA NETWORK SYSTEMS CO., LTD. AND HOSHIN GIGAMEDIA, DATED AUGUST 28, 2008 |
| EX-4.31 ASSET SALE AND PURCHASE AGREEMENT AMONG KO YING, HOSHIN GIGAMEDIA AND CHINA NETWORK SYSTEMS CO., LTD., DATED AUGUST 28, 2008 |
| EX-4.32 TRANSITIONAL SERVICE AGREEMENT AMONG KO YING, HOSHIN GIGAMEDIA AND KBT, DATED SEPTEMBER 3, 2008 |
| EX-4.33 ASSIGNMENT AND ASSUMPTION AGREEMENT BETWEEN HOSHIN GIGAMEDIA AND HOSHIN MULTIMEDIA, DATED SEPTEMBER 3, 2008 |
| EX-8.1 LIST OF SUBSIDIARIES |
| EX-12.1 CERTIFICATION BY CEO |
| EX-12.2 CERTIFICATION BY CFO |
| EX-13.1 CERTIFICATION BY CEO |
| EX-13.2 CERTIFICATION BY CFO |
| EX-15.1 CONSENT OF GHP HORWATH, P.C. |
i
CERTAIN TERMS AND CONVENTSIONS
In this annual report, all references to (i) “we,” “us,” “our,” “our Company” or “GigaMedia” are to GigaMedia Limited and, unless the context requires otherwise, its subsidiaries, or where the context refers to any time prior to the incorporation of any of its subsidiaries, the business which predecessors of the present subsidiaries were engaged in and which were subsequently assumed by such subsidiaries; (ii) “Shares” are to ordinary shares of our Company; (iii) “CESL” are to Cambridge Entertainment Software Limited (formerly known as Grand Virtual International Limited), a company incorporated under the laws of The British Virgin Islands; (iv) “Hoshin GigaMedia” are to Hoshin GigaMedia Center Inc., a company incorporated under the laws of Taiwan, Republic of China, (“Taiwan” or “R.O.C.”); (v) “FunTown” are to our online games business operated through our two operating subsidiaries, Hoshin GigaMedia and FunTown World Limited, a company incorporated under the laws of The British Virgin Islands; (vi) “T2CN” are to T2CN Holding Limited, a company incorporated under the laws of The British Virgin Islands, and its subsidiaries; and (vii) “Internet access and service business” are to Internet access and service business that we historically operated through Koos Broadband Telecom Co., Ltd. (“KBT”) and completely disposed of in September 2008.
For the purpose of this annual report only, geographical references to “China” and the “PRC” are to the People’s Republic of China and do not include Taiwan, the Hong Kong Special Administrative Region (“Hong Kong”) and the Macau Special Administrative Region (“Macau”). Except the context otherwise requires and for the purposes of this annual report only, references to “Greater China” include the PRC, Taiwan, Hong Kong and Macau. References to “South Korea” are to the Republic of Korea.
All references in this annual report to “U.S. dollar,” “$” and “US$” are to the legal currency of the United States; all references to “NT dollar” or “New Taiwan dollar” are to the legal currency of Taiwan; all references to “RMB,” “Rmb” or “Renminbi“are to the legal currency of the PRC; and all references to “Hong Kong dollar” are to the legal currency of Hong Kong.
We have sourced various online gaming industry information used in this annual report from third-party sources, including the Committee on the Internal Market and Consumer Protection of European Parliament and PokerScout, each of which is an independent organization or entity. We have assumed the correctness and truthfulness of such data, including projections and estimates, when we use them in this annual report.
We have approximated certain numbers in this annual report to their closest round numbers or a given number of decimal places. Due to rounding, figures shown as totals in tables may not be arithmetic aggregations of the figures preceding them.
DISCLOSURE REGARDING FORWARD-LOOKING STATEMENTS
This annual report includes “forward-looking statements” within the meaning of, and intended to qualify for the safe harbor from liability established by, the United States Private Securities Litigation Reform Act of 1995. These statements, which are not statements of historical fact, may contain estimates, assumptions, projections and/or expectations regarding future events, which may or may not occur. These statements involve known and unknown risks, uncertainties and other factors which may cause our actual results, performance or achievements to be materially different from any future results, performance or achievements expressed or implied by the forward-looking statements. Some of the risks are listed under Item 3, “Key Information — D. Risk Factors” and elsewhere in this annual report. In some cases, you can identify these forward-looking statements by words such as “anticipate,” “believe,” “could,” “estimate,” “expect,” “intend,” “may,” “plan,” “potential,” “should,” “will,” “would,” or similar expressions, including their negatives. These forward-looking statements include, without limitation, statements relating to:
| | • | | our business plan and strategies; |
| | • | | our future business development and potential financial condition, results of operations and other projected financial information; |
| | • | | our ability to manage current and potential future growth; |
| | • | | expected continued acceptance of our revenue model; |
| | • | | our plans for strategic partnerships, licenses and alliances; |
| | • | | our acquisition and strategic investment strategy, and ability to successfully integrate any past, current, or future acquisitions into our operations; |
1
| | • | | our ability to protect our intellectual property rights and the security of our customers’ information; |
| | • | | launch of new online games according to our timetable; |
| | • | | expected continued acceptance of our online games and gaming software, including expected growth of the online games and online gaming industry, and consumer preferences for our products and services; |
| | • | | the in-house development of new online game and gaming software products and our plans to expand our in-house online game development team; |
| | • | | our plans to license additional games from third parties, and the launch of these new games or gaming software systems, including the timing of any such development, licenses or launches, in various geographic markets; |
| | • | | our ability to maintain and strengthen our position as one of the largest online MahJong operators in Taiwan; |
| | • | | our ability to maintain the well-established online sports game platform in the PRC; |
| | • | | potential entry of new competitors in any of our business lines; |
| | • | | changes in the global regulatory environment relating to gaming software and services business; |
| | • | | changes or stability in certain regulatory environments relating to our software licensees’ operations or gaming licenses; |
| | • | | changes in PRC laws and regulations, and future enforcement of those laws and regulations, including laws and regulations relating to Internet usage, advertising over the Internet, Internet content providers, foreign investment and ownership in online business, distribution of dividends and foreign exchange controls; |
| | • | | the outcome of ongoing, or any future, litigation or arbitration; and |
| | • | | our corporate classification by various governmental entities. |
These forward-looking statements are based on our own information and on information from other sources we believe to be reliable. Our actual results may differ materially from those expressed or implied by these forward-looking statements as a result of risk factors and other factors noted throughout this annual report, including those described under Item 3, “Key Information — D. Risk Factors” and those detailed from time to time in other filings with the U.S. Securities and Exchange Commission (the “SEC”). We do not guarantee that the transactions and events described in this annual report will happen as described or that they will happen at all. We undertake no obligation to update or revise any forward-looking statements to reflect events or circumstances after the date of this annual report or to reflect the occurrence of unanticipated events. Whether actual results will conform with our expectations and predictions is subject to a number of risks and uncertainties, many of which are beyond our control, and reflect future business decisions that are subject to change. Given this level of uncertainty, you are advised not to place undue reliance on such forward-looking statements.
PART I
ITEM 1. IDENTITY OF DIRECTORS, SENIOR MANAGEMENT AND ADVISERS
Not applicable, but see Item 6, “Directors, Senior Management and Employees — A. Directors and Senior Management” in this annual report.
ITEM 2. OFFER STATISTICS AND EXPECTED TIMETABLE
Not applicable.
2
ITEM 3. KEY INFORMATION
Exchange Rates
Our consolidated financial statements were historically reported in New Taiwan dollars. Effective January 1, 2004, we adopted the U.S. dollar as our reporting currency because operations denominated in U.S. dollars represented a significant portion of our business following the acquisition of our gaming software and service business.
Assets and liabilities on our balance sheet denominated in non-U.S. dollars are translated into U.S. dollars using year-end exchange rates. Income and expense items in our statement of operations denominated in non-U.S. dollars are translated into U.S. dollars using the weighted-average exchange rates. Certain other operating financial information denominated in non-U.S. dollars, not included in our consolidated financial statements and provided in this annual report, are translated using weighted-average exchange rates. For convenience, transactions in 2009 denominated in non-U.S. dollars are translated into U.S. dollars using the year-end exchange rate for 2008. We make no representation that the non-U.S. dollars could be converted to U.S. dollars at such rate or any particular rates.
A. Selected Financial Data
The following selected consolidated balance sheet data as of December 31, 2007 and 2008 and the selected consolidated statement of operations data for the years ended December 31, 2006, 2007 and 2008 have been derived from our audited consolidated financial statements included in Item 18 in this annual report. The selected consolidated balance sheet data as of December 31, 2004, 2005 and 2006, and the selected consolidated statement of operations data for the years ended December 31, 2004 and 2005 have been derived from our audited consolidated financial statements for the years ended December 31, 2004, 2005 and 2006, which are not included in this annual report. The consolidated financial statements have been prepared and presented in accordance with generally accepted accounting principles in the United States, or U.S. GAAP. You should read the following selected consolidated financial data in conjunction with Item 5, “Operating and Financial Review and Prospects,” and the consolidated financial statements and the accompanying notes to those statements included in this annual report. The statements of operations for the years ended December 31, 2004, 2005, 2006 and 2007 have been restated to reflect (i) the results of our music distribution business, which was sold in September 2005, and (ii) the results of our Internet access and service business, which was sold in September 2008, as discontinued operations. Certain prior-year amounts have been reclassified to conform to the current-year presentation. These reclassifications had no effect on the results of operations or shareholders’ equity as previously reported.
For the Years Ended December 31,
(in thousands except for earnings per share amounts)
| | | | | | | | | | | | | | | | | | | | | |
| | | 2004 | | | 2005 | | | 2006 | | | 2007 | | | 2008 | |
| | | US$ | | | US$ | | | US$ | | | US$ | | | US$ | |
| STATEMENT OF OPERATIONS DATA: | | | | | | | | | | | | | | | | | | | | |
| OPERATING REVENUES | | | | | | | | | | | | | | | | | | | | |
| Gaming software and service revenues | | | 11,434 | | | | 22,511 | | | | 55,019 | | | | 118,950 | | | | 144,765 | |
| Online game and service revenues | | | 0 | | | | 0 | | | | 18,692 | | | | 32,764 | | | | 45,604 | |
| Other revenues | | | 20 | | | | 0 | | | | 0 | | | | 0 | | | | 0 | |
| | | | | | | | | | | | | | | | |
| Total operating revenues | | | 11,454 | | | | 22,511 | | | | 73,711 | | | | 151,714 | | | | 190,369 | |
| | | | | | | | | | | | | | | | |
| | | | | | | | | | | | | | | | | | | | | |
| OPERATING COSTS | | | | | | | | | | | | | | | | | | | | |
| Cost of gaming software and service revenues | | | (1,592 | ) | | | (3,327 | ) | | | (7,824 | ) | | | (16,201 | ) | | | 22,770 | |
| Cost of online game and service revenues | | | 0 | | | | 0 | | | | (3,667 | ) | | | (9,118 | ) | | | 12,404 | |
| Cost of other revenues | | | (2 | ) | | | 0 | | | | 0 | | | | 0 | | | | 0 | |
| | | | | | | | | | | | | | | | |
| Total operating costs | | | (1,594 | ) | | | (3,327 | ) | | | (11,491 | ) | | | (25,319 | ) | | | (35,174 | ) |
| | | | | | | | | | | | | | | | |
| GROSS PROFIT | | | 9,860 | | | | 19,184 | | | | 62,220 | | | | 126,395 | | | | 155,195 | |
| | | | | | | | | | | | | | | | |
| | | | | | | | | | | | | | | | | | | | | |
| OPERATING EXPENSES | | | | | | | | | | | | | | | | | | | | |
| Product development and engineering expenses | | | (1,408 | ) | | | (2,524 | ) | | | (5,244 | ) | | | (7,338 | ) | | | (13,455 | ) |
| Selling and marketing expenses | | | (3,444 | ) | | | (8,042 | ) | | | (27,653 | ) | | | (60,106 | ) | | | (74,173 | ) |
| General and administrative expenses | | | (3,493 | ) | | | (6,374 | ) | | | (11,096 | ) | | | (20,983 | ) | | | (25,035 | ) |
| Bad debt expenses | | | 0 | | | | 0 | | | | (448 | ) | | | (548 | ) | | | (2,905 | ) |
3
| | | | | | | | | | | | | | | | | | | | | |
| | | 2004 | | | 2005 | | | 2006 | | | 2007 | | | 2008 | |
| | | US$ | | | US$ | | | US$ | | | US$ | | | US$ | |
| Impairment loss on prepaid licensing fees and intangible assets | | | 0 | | | | 0 | | | | 0 | | | | 0 | | | | (1,524 | ) |
| | | | | | | | | | | | | | | | |
| Total operating expenses | | | (8,345 | ) | | | (16,940 | ) | | | (44,441 | ) | | | (88,975 | ) | | | (117,092 | ) |
| | | | | | | | | | | | | | | | |
| Income from operations | | | 1,515 | | | | 2,244 | | | | 17,779 | | | | 37,420 | | | | 38,103 | |
| | | | | | | | | | | | | | | | |
| Income from continuing operations | | | 299 | | | | 3,375 | | | | 17,852 | | | | 37,802 | | | | 34,953 | |
| | | | | | | | | | | | | | | | |
| Income from discontinued operations | | | 1,383 | | | | 2,961 | | | | 12,932 | | | | 1,088 | | | | 9,435 | |
| | | | | | | | | | | | | | | | |
| Net income | | | 1,682 | | | | 6,336 | | | | 30,784 | | | | 38,890 | | | | 44,388 | |
| | | | | | | | | | | | | | | | |
| | | | | | | | | | | | | | | | | | | | | |
| Earnings per share (in dollars): | | | | | | | | | | | | | | | | | | | | |
| Basic: | | | | | | | | | | | | | | | | | | | | |
| Income from continuing operations | | | 0.01 | | | | 0.07 | | | | 0.35 | | | | 0.72 | | | | 0.65 | |
| Income from discontinued operations | | | 0.02 | | | | 0.06 | | | | 0.25 | | | | 0.02 | | | | 0.17 | |
| | | | | | | | | | | | | | | | |
| Net income | | | 0.03 | | | | 0.13 | | | | 0.60 | | | | 0.74 | | | | 0.82 | |
| | | | | | | | | | | | | | | | |
| Diluted: | | | | | | | | | | | | | | | | | | | | |
| Income from continuing operations | | | 0.01 | | | | 0.06 | | | | 0.30 | | | | 0.63 | | | | 0.58 | |
| Income from discontinued operations | | | 0.02 | | | | 0.06 | | | | 0.21 | | | | 0.02 | | | | 0.16 | |
| | | | | | | | | | | | | | | | |
| Net income | | | 0.03 | | | | 0.12 | | | | 0.51 | | | | 0.65 | | | | 0.74 | |
| | | | | | | | | | | | | | | | |
As of December 31,
(US dollars in thousands except for number of issued shares)
| | | | | | | | | | | | | | | | | | | | | |
| | | 2004 | | | 2005 | | | 2006 | | | 2007 | | | 2008 | |
| | | US$ | | | US$ | | | US$ | | | US$ | | | US$ | |
| BALANCE SHEET DATA: | | | | | | | | | | | | | | | | | | | | |
| Total current assets | | | 67,726 | | | | 70,204 | | | | 64,176 | | | | 115,417 | | | | 128,799 | |
| Property, plant and equipment-net | | | 15,056 | | | | 10,747 | | | | 10,098 | | | | 13,008 | | | | 13,468 | |
| Goodwill | | | 29,607 | | | | 29,243 | | | | 55,817 | | | | 85,149 | | | | 87,098 | |
| Intangible assets-net | | | 8,372 | | | | 2,704 | | | | 23,067 | | | | 26,060 | | | | 28,930 | |
| Total assets | | | 125,977 | | | | 113,519 | | | | 182,619 | | | | 283,865 | | | | 316,793 | |
| Total shareholders’ equity | | | 95,971 | | | | 100,648 | | | | 134,087 | | | | 180,665 | | | | 228,456 | |
| Common shares, no par value, and additional paid-in capital | | | 287,657 | | | | 287,920 | | | | 289,495 | | | | 296,793 | | | | 300,021 | |
| Number of issued shares (in thousands) | | | 50,154 | | | | 50,344 | | | | 51,495 | | | | 53,700 | | | | 54,365 | |
| Dividends declared per share (in dollars) | | | 0 | | | | 0 | | | | 0 | | | | 0 | | | | 0 | |
Presentation of financial information for the years ended December 31, 2004, 2005, 2006 and 2007 has been reclassified to conform with the presentation for the year ended December 31, 2008.
B. Capitalization and Indebtedness
Not applicable.
C. Reasons for the Offer and Use of Proceeds
Not applicable.
4
D. Risk Factors
Risks Related to Our Business and Industries
The limited operating history of our gaming software and services business and our online games business may not provide you with an adequate basis upon which to evaluate our business and prospects
We commenced our gaming software and service business operations in April 2004 and our online games business in January 2006. Our operating history as an gaming software and services provider and an online games operator may be too short to give you a sufficient basis for evaluating our business and financial performance. It is also difficult to evaluate our prospective business, because we may not have sufficient experience to address the risks frequently encountered by companies entering new and rapidly evolving markets such as the gaming software market and online games market. These risks include our potential failure to:
| | • | | respond to technological changes or resolve unexpected service interruptions in a timely manner; |
| | • | | adapt to regulatory changes; |
| | • | | retain existing customers or attract new customers; |
| | • | | license, develop, or acquire additional online games that are appealing to consumers; |
| | • | | anticipate and adapt to changing consumer preferences; |
| | • | | adapt to competitive market conditions; |
| | • | | adequately and efficiently operate, upgrade and develop our transaction and service platforms; and |
| | • | | maintain adequate control of our expenses. |
If we are unsuccessful in addressing any of these risks, our business and financial condition will be adversely affected. In addition, certain management members have worked at our Company for a relatively short period. We may not be able to achieve similar results or growth in future periods. Accordingly, you should not rely on our results of operations for any prior periods as an indication of our future performance.
The uncertain global legal and regulatory environment could have a negative impact on our gaming software and services business and prospects
We currently rely on our gaming software and services business for a substantial majority of our revenues. Our gaming software and services business includes software development and the provision of application services for Internet gaming, including online poker rooms, casinos and the related marketing affiliate programs. We license our gaming software to UIM, which operates various online poker rooms and casinos and also sub-licenses our software products to third parties. Fees earned by us are based on UIM’s gross receipt from the operation utilizing the licensed software.
UIM currently holds a gaming license issued by the Kahnawake Gaming Commission in Canada and a provisional gaming license issued by issued by Lotteries and Gaming Authority in Malta. Issues such as determining the physical location of a gaming event and significant differences among the gaming laws and “Cyberlaws” of various countries make traditional concepts of jurisdiction and conflicts of laws difficult to apply. In addition, the substantial uncertainties in the global regulatory environment relating to online gaming expose us to the risk that regulatory authorities in various jurisdictions may determine that our Company provides online gaming services (rather than only licensing software and providing application services) and thus subject our Company to gaming laws and regulations in such jurisdictions.
5
UIM primarily targets non-U.S. markets, predominantly in Continental European markets. Several European countries have adopted a regulated online gaming approach. For example, Italy has recently introduced a new set of regulations on online gaming. In Italy, there is a general prohibition on casino-type games. Online poker tournaments, pari-mutuel betting on horseraces and sports events are legal, provided that the game operators are licensed by the relevant authorities. The French government has also recently published a draft gaming bill. The bill would establish a regulatory regime of online gaming in France from January 1, 2010. The proposed new regime would allow private operators of sports betting, pari-mutual horserace betting and poker to offer their services online, provided they obtain a license from a new regulatory authority. Other jurisdictions in which UIM operates may require local licensing in the future. There can be no assurance that UIM will be successful in its efforts to obtain a gaming license from these jurisdictions, and that UIM would not face the potential loss of users in these jurisdictions. In addition, some European countries, including Sweden, The Netherlands and Germany, have taken actions or introduced legislation aimed at banning foreign online gaming operators, which could have a material adverse effect on UIM and consequently on our Company.
The Internet gaming industry is still in an early stage of development and the global legal and regulatory environment in which the Internet gaming businesses operate remains highly uncertain and is subject to change. While many jurisdictions have some form of legal framework applicable to games of chance and land-based casinos, few provide clear guidance on how this framework applies to Internet gaming. In addition, the very nature of Internet gaming creates new and unique forms of entertainment that were neither contemplated nor feasible in the past. There can be no assurance that legislation prohibiting Internet gaming or regulating various aspects of Internet gaming industry will not be proposed and passed in potentially relevant jurisdictions. We cannot assure you that we as an application service provider to the gaming industry, or UIM as an online gaming operator, are in compliance with all laws and regulations of the jurisdictions where our gaming software products are used, or that changes in such laws and regulations, or in their interpretation, will not adversely affect our business and results of operations.
For additional information on the regulatory environment relating to online gaming, see Item 4, “Information on the Company — B. Business Overview — Regulation” in this annual report.
In operating our online games business, we may fail to launch new games according to our timetable, and our new games may not be commercially successful
In order for our online games business strategy to succeed over time, we will need to license, acquire or develop new online games that can generate additional revenue and further diversify our revenue sources. A number of factors, including technical difficulties, government approvals and game licenses required for launching new games, lack of sufficient game development personnel and other resources, and adverse developments in our relationship with the licensors of our new licensed games could result in delay in launching our new games. Therefore, we cannot assure you that we will be able to meet our timetable for new game launches.
In January 2009, we introduced Holic Online, an adventure-themed massively multi-player online role playing game (“MMORPG”), in Taiwan. On June 25, 2009, we launched Warhammer Online: Age of Reckoning, a war-themed MMORPG, in Taiwan, Hong Kong and Macau, which we expect will become an additional revenue stream for our online games segment in the second half of 2009. In addition, we have four MMORPGs and one advanced casual games in the pipeline, that we expect to launch in various target markets in Greater China, including the PRC, Taiwan, Hong Kong and Macau.There are many factors that may adversely affect the popularity of our new games. For example, we may fail to anticipate and adapt to future technical trends and new business models, fail to satisfy game player preferences and requirements, fail to effectively plan and organize marketing and promotion activities, fail to effectively detect and prevent programming errors or defects in the games, and fail to operate our new games at acceptable costs. We cannot assure you that our new games will gain the market acceptance and become commercially successful. If we are not able to license, develop or acquire additional online games that are commercially successful, our future revenues and profitability may decline.
Due to increased competition among online games operators in the PRC and Taiwan, license fees for online games have increased and most licensors are demanding upfront license fees and guaranteed minimum royalty payments. If any of the new games we license from third parties fails to appeal to players, we may not be able to fully recover upfront and/or minimum royalty licensing costs, which can be significant. As a result, our results of operations and financial condition may be materially and adversely affected.
We may not be successful in operating and improving our existing online games to satisfy the changing demands and preferences of players
The level of demand and market acceptance of our existing online games is subject to a high degree of uncertainty. Our future operating results will depend on numerous factors, many of which are beyond our control. These factors include:
| | • | | the popularity of existing and new online games operated by us; |
| | • | | the introduction of new online games by us or third parties, competing with or replacing our existing online games; |
6
| | • | | general economic conditions, particularly economic conditions adversely affecting discretionary consumer spending; |
| | • | | changes in our customer demands and preferences; |
| | • | | the availability of other forms of entertainment; and |
| | • | | critical reviews and public tastes and preferences, all of which change rapidly and cannot be predicted. |
Our ability to plan for product development and distribution and promotional activities will be significantly affected by how well we anticipate and adapt to relatively rapid changes in consumer tastes and preferences. Currently, a substantial portion of our online games revenue is derived from revenues from Freestyle, an online sports game offered in the PRC, and the online MahJong games offered in Taiwan and Hong Kong. However, there is no assurance that these games will continue to be popular. A decline in the popularity of online games in general or, in particular, Freestyle and online MahJong, is likely to adversely affect our business, financial condition and results of operations. To maintain competitiveness of our games, we are generally required to continuously invest in enhancing, improving, expanding or upgrading our games. If we fail to do so, revenues generated from our existing games may decline.
In addition, we expect that as we introduce new online games, a portion of our existing customers will switch to the new games. If this transfer of players from our existing games exceeds our expectations, we may have to adjust our marketing, pricing and other business plans and, as a result, our growth and profitability could be materially and adversely affected.
Our results of operations are subject to significant fluctuations
Our revenues, expenses and results of operations have varied in the past and may fluctuate significantly in the future due to a variety of factors, many of which are beyond our control. The key factors affecting our businesses include:
| | • | | Gaming software and service business: the regulatory restrictions applicable to the Internet gaming industry; the revenues, expenses and results of operations of UIM, our largest licensee; global economic conditions and general economic conditions of the markets where our products target; availability of the Internet infrastructure; and the technological and other competition from existing and new competitors. |
| | • | | Online games business: our ability to retain existing users; attract new users and maintain user satisfaction; the pace of rollout of new games or update to existing games by us or our competitors; the amount and timing of operating costs and capital expenditures relating to our business operations and expansion; seasonal trends in Internet use; price competition in the industry; regulatory and other risks associated from our operations in China and Taiwan. |
In addition, our operating expenses are based on our expectations of the future demand for our services and are relatively fixed in the short term. We may be unable to adjust spending quickly enough to offset any unexpected demand shortfall. A decrease in revenues in relation to our expenses could have a material and adverse effect on our business, results of operations and financial condition. You should not place undue reliance on our financial guidance, nor should you rely on year-to-year or quarter-to-quarter comparisons of our results of operations as indicators of our future performance.
The gaming software markets and the online games markets are characterized by rapid technological change, and failure to respond quickly and effectively to new Internet technologies or standards may have a material adverse effect on our business
The markets for our gaming software and service business and online games business are characterized by rapid technological advances, evolving industry standards, changes in user requirements and frequent new service introductions and enhancements.
To maintain the competitiveness of our gaming software products, we need to continue to anticipate the emergence of new technologies and games, assess their acceptance and make appropriate adjustments accordingly. If we are unable to do so, new technologies in online gaming programming or operations could render our gaming software products and online games obsolete or unattractive.
7
The online games industry is evolving rapidly. Any new technologies and new standards may require increases in expenditures for online game development and operations. In addition, we use internally developed software systems that support nearly all aspects of our billing and payment transactions in our online games business. All of our businesses may be adversely affected if we are unable to upgrade our systems effectively to accommodate future traffic levels, to avoid obsolescence or to successfully integrate any newly developed or acquired technology with our existing systems. Capacity constraints could cause unanticipated system disruptions and slower responses, which could adversely affect data transmission and game play. These factors could, among other things, cause us to lose existing or potential users and existing or potential game development partners.
The current global economic slowdown and other adverse economic conditions may negatively impact our business
The current global economic slowdown has resulted in an increased level of commercial and consumer delinquencies, lack of consumer confidence and increased market volatility. These unfavorable changes in economic conditions have resulted in decreased spending of our customers. The impact of economic conditions on our licensees and business partners could adversely affect our business and revenues. In addition, the current global financial turmoil and the tightening of credit have resulted in a general credit crunch and have negatively impacted our ability to obtain additional financings. If the current global economic slowdown and global financial turmoil continue on a sustained basis, they will further negatively impact the demand for our gaming software products and services and our online games and adversely affect our business, revenues, cash flows, profitability and financial condition.
Our business could suffer if we do not successfully manage current growth and potential future growth
We are pursuing a number of growth strategies. Some of these strategies relate to services, products or markets in which we lack experience and expertise. In connection with our expansion plan for the gaming software and services business, we entered into a strategic partnership with Victor Chandler International Group (“Victor Chandler”) in December 2008, with a view to adding sports betting into our online gaming software platform and driving cross-selling across the platform. We cannot assure you that we will be able to deliver new products or services on a commercially viable basis or in a timely manner, or at all. We have developed Polish and Hungarian language versions of our gaming software products and seek to enter the online games markets in Poland and Hungary. We also intend to expand our gaming software and services business into other Eastern European and Central European countries and Russia. As part of our growth strategy for the online games operation, in December 2006, we entered into a strategic alliance with Infocomm Asia Holdings Pte Ltd (“Infocomm Asia”), an online gaming operator and distributor operating primarily in the Southeast Asia region, in which we currently have no business operations. We cannot assure you that we will be able to leverage our past experience as we expand into these new markets.
Our growth to date has placed, and our anticipated further expansion of our operations, including a significant expansion of our headcount, will continue to place, a significant strain on our management, operation systems and resources. In addition to training and managing our workforce, we will need to continue to develop and improve our financial and management controls and our reporting systems and procedures, including those of acquired businesses. We cannot assure you that we will be able to effectively manage the growth of our operations, and any failure to do so may limit our future growth and materially and adversely affect our business, financial condition and results of operations.
Our business strategy, which contemplates growth through acquisitions and strategic investments, exposes us to significant risks
We have pursued and may continue to pursue growth through acquisitions and strategic investments. Any acquisition or investment is subject to a number of risks. Such risks include the diversion of management time and resources, disruption of our ongoing business, lack of familiarity with new markets, difficulties in supporting the acquired business, and dilution to existing stockholders if our common stock is issued in consideration for an acquisition or investment, incurring or assuming indebtedness or other liabilities in connection with an acquisition.
The total costs incurred in connection with our acquisitions and investments in various businesses in 2008 were approximately US$8.6 million. For additional information with respect to our acquisitions and investments, see Item 4, “Information on The Company — A. History and Development of Our Company” in this annual report. Our financial results may be affected by such acquisitions or investments. We may incur debts upon an acquisition or suffer losses related to the impairment of goodwill and other intangible assets following the acquisition. These debts or losses could negatively impact our results of operations. As of December 31, 2008, we carried US$87.1 million of goodwill, including the goodwill recorded in connection with our acquisition of T2CN. Any write-off of goodwill in the future may have a negative impact on our financial results.
8
We will continue to examine the merits, risks and feasibility of potential transactions, and expect to explore additional acquisition opportunities in the future. Such examination and exploration efforts, and any related discussions with third parties, may or may not lead to future acquisitions and investments. We may not be able to complete acquiring or investing transactions that we initiate. Our ability to grow through such acquisitions and investments will depend on many factors, including the availability of suitable acquisition candidates at an acceptable cost, our ability to reach agreement with acquisition candidates or investee companies on commercially reasonable terms, the availability of financing to complete the transactions and our ability to obtain any required governmental approvals.
We also face challenges in integrating any acquired business. These challenges include eliminating redundant operations, facilities and systems, coordinating management and personnel, retaining key employees, managing different corporate cultures, maintaining the relationship with the suppliers, vendors and/or distributors of acquired businesses, and achieving cost reductions and cross-selling opportunities. There can be no assurance that we will be able to successfully integrate all aspects of acquired businesses. The process of integrating the acquired business may disrupt our business and divert our resources. In addition, the benefits of an acquisition or investment transaction may take considerable time to be fully realized and we cannot assure you that any particular acquisition or investment and the subsequent integration will produce the intended benefits.
Our businesses face intense competition, which may adversely affect our revenues, profitability and planned business expansion
Competition in the gaming software and service business
The Internet gaming software industry is characterized by rapid technological changes, and we face significant and intense competition from gaming software design houses and application service providers. Our primary competitors include online gaming software design houses and application service providers, which provide gaming software, marketing tools and solutions, customer support tools and solutions, and e-commerce tools and solutions to online poker and casino sectors.
Given the relatively low barriers to entry into the software industry and the increasing popularity of Internet-based businesses, we face a large number of potential competitors from many different segments of the software and Internet industries. We potentially compete with a number of public and private companies, which provide Internet architecture design/development, web design/development and online gaming software design/development. In addition, traditional Internet service providers (“ISPs”) and other entities may provide online gaming services in the future and engage in direct competition with us by developing and offering online gaming software solutions and tools. Some of them may have greater technical, marketing, financial and other resources, broader name recognition and more established relationships in certain geographic markets than we do.
We are also exposed to competition among UIM and other game operators in the online gaming industry, as our proceeds of the license fees are based on the gross receipt earned by UIM from its operations utilizing our software. UIM faces intense competition in the online gaming industry, which is characterized by low barriers to entry, rapid technological change and ever-changing consumer preferences. New entrants to the online gaming industry, increasingly competitive market consolidations and aggressive marketing and pricing by competitors may lead to a significant decline in the customer base, revenues and margins of UIM. In addition, the online gaming industry is influenced by various other factors, including changes in policies and regulations and economic conditions in different jurisdictions. For example, as a result of the Unlawful Internet Gambling Enforcement Act of 2006 (“UIGEA”) and the subsequent closing of the online gaming market in the United States, UIM faces increased competition from entertainment service providers in markets in Continental Europe, which are also increasingly subject to regulation from governmental authorities. Furthermore, some of UIM’s competitors have greater experiences, resources and distribution capabilities. For additional information, see Item 4, “Information on the Company — B. Business Overview — Gaming Software and Service Business — Competition” in this annual report.
Competition in the online games business
The online games market is highly competitive. Our main competitors in the online games business are online game operators in Taiwan and China. Our major competitors in Taiwan include Gamania Digital Entertainment Co., Ltd. (“Gamania”), Soft-World International Corporation (“Soft-World”) and International Games System, Co., Ltd. (“IGS”). Our major competitors in the PRC include NetEase.com, Inc. (“NetEase”), Shanda Interactive Entertainment Ltd. (“Shanda”), Giant Interactive Group, Inc. (“Giant”), Changyou.com Limited (“Changyou”), The9 Limited, Shanghai Everstar Online Entertainment Co., Ltd. (“Nineyou”), Tencent Holdings Limited (“Tencent”), Beijing Globalink Computer Technology Co., Ltd.(“Ourgames.com”) and Chinagames.net.
In addition, we compete for users against various offline games, such as console games, arcade games and handheld games, as well as various other forms of traditional or other online entertainment.
9
We expect more online games operating companies to enter in the markets where we operate, including Taiwan, the PRC and Hong Kong, and a wider range of online games to be introduced to these markets given the relatively low entry barriers to the online games industry. Our competitors vary in size and include private and public companies, many of which have greater financial, marketing and technical resources as well as name recognition. We intend to continue to enhance our market position through providing competitive products and quality services that meet market trends and users’ preferences, as well as strengthening sales effectiveness.
As a result of the above, the significant competition may reduce the number of our users or the growth rate of our user base, reduce the average number of hours played by our users, or cause us to reduce usage fees. All of these competitive factors could have a material adverse effect on our business, financial condition and results of operations.
We expect the marketing costs for our gaming software and services business to continue to be significant, which could have an adverse effect on our business
Our selling and marketing costs have been increasing rapidly, primarily due to increasing competition in our core markets, the lack of available new markets and the high level of advertising by our competitors in Europe. These costs increased by 126.2 percent, from US$22.1 million in 2006 to US$50.0 million in 2007, and by 28.0 percent from US$50.0 million in 2007 to US$64.1 million in 2008. We expect that we will need to continue to incur significant marketing expenses for our gaming software and services business, which could have an adverse effect on our business and financial results.
Our gaming software and services business is dependent on UIM, our largest licensee, and any adverse effect on UIM’s business could have an adverse effect on our revenues, results of operations and financial condition
Historically, substantially all of our revenues from our gaming software and service business have been derived from UIM, our largest licensee. UIM operates various online gaming sites and sub-licenses our software products to third parties. On April 1, 2004, we entered into an end user license agreement with UIM, pursuant to which we granted a nonexclusive, non-transferable, worldwide license to UIM to use our software and certain operational and support services. The term of the agreement is 10 years. The license fees and service fees were determined based on a revenue sharing mechanism. UIM’s revenues are derived principally from its operations of online poker rooms and casinos. Although we do not have any equity ownership interest in UIM, we consolidate its assets, liabilities and results of operations in our financial statements in accordance with FASB Interpretation No. 46R (“FIN 46(R)”). See Item 4, “The Information on The Company — B. Business Overview — Relationship with UIM” in this annual report. We do not control its management and hence have no control over its business decisions. In addition, there is significant competition in the online poker and casino industry. There can be no assurance that online poker or casinos operated by UIM or its sub-licensees will continue to appeal to their existing users. Any significant difficulties encountered by UIM in its operations or significant deviation from the agreement terms on UIM’s part, may have a material and adverse effect on our revenue, business and financial results.
Our gaming software and services business will be materially and adversely affected if credit card companies and other financial institutions cease to accept online gaming transactions
A substantial portion of UIM’s proceeds from its online gaming operations is from the deposits or payments made by its customers through credit card transactions. Financial institutions in the United States have ceased to accept online gaming transactions after the enactment of the UIGEA, which prohibits the use of communication facilities and financial transactions in connection with Internet gambling. For additional information, see Item 4, “The Information on The Company — B. Business Overview — Regulation” in this annual report. Although UIM primarily targets non-U.S. markets, predominantly in Continental European markets, there can be no assurance that credit card companies or other financial institutions in the jurisdictions where UIM operates will continue to accept and process online gaming transactions. Furthermore, there is a higher incidence of fraud associated with online credit card payments than with other types of payments, which could further discourage issuing banks from processing online gaming transactions. If credit card companies or other financial institutions cease to accept online gaming transactions, either generally or in the jurisdictions where UIM operates, UIM’s revenues and, in turn, our gaming software and service business could be materially and adversely affected.
Our gaming software and services business and online games business depend on the reliability of our network infrastructure, which is subject to physical, technological, security and other risks
The development and operation of our online networks are subject to physical, technological, security and other risks which may result in interruption in service or reduced capacity. These risks include physical damage, power loss, telecommunications failure, capacity limitation, hardware or software failures or defects and breaches of security by computer viruses, system break-ins or otherwise. An increase in the volume of usage of online services could strain the capacity of our software and hardware employed, which could result in slower response time or system failures. We have a variety of backup servers at our primary site to deal with possible system failures. However, we do not have redundant facilities in the event of an emergency. The occurrence of any of these events could result in interruptions, delays or cessation in service to users of our online services, which could have a material adverse effect on our business and results of operations.
10
While we have implemented industry-standard security measures, our network may still be vulnerable to unauthorized access, computer viruses, denial of service and other disruptive problems. Our Internet-based services may be interrupted as a result of the accidental or intentional actions of Internet users, our current and former employees or others. A party that is able to circumvent security measures could misappropriate proprietary information, attack our security and network system, and, perhaps, most importantly, cause interruptions in our operations. We have experienced, in the past, and may experience, in the future, security breaches and attacks. We may be required to expend significant capital or other resources to protect against the threat of security breaches and attacks or to alleviate problems caused by such actions. There can be no assurance that any measures implemented will not be circumvented in the future.
Our business is also vulnerable to delays or interruptions due to our reliance on infrastructure and related services provided by third parties. End-users of our gaming software depend on ISPs and our system infrastructure for access to the Internet gaming sites operated by UIM and its sub-licensees. Many of these services have experienced service outages in the past and could experience service outages, delays and other difficulties due to system failures, stability or interruption. For example, in February 2007, an earthquake off the coast of Taiwan damaged several undersea optic-fiber cables linking countries such as Malaysia, Singapore, Australia, Japan, South Korea, China, the United States and Europe, causing disruptions in Internet traffic worldwide. Our licensees may lose customers as a result of delays or interruption in service, including delays or interruptions relating to high volumes of traffic or technological problems, which may prevent communication over the Internet and could materially adversely affect our business, revenues, results of operations and financial condition.
Any failure to maintain a stable and efficient distribution and payment network could have a material and adverse impact on our online games business, financial condition and results of operations
Our online games business operation relies heavily on a multi-layer distribution and payment network composed of third party distributors for our sales to, and collection of payment from, our users. As we do not enter into long-term agreements with any of our distributors, we cannot assure you that we will continue to maintain favorable relationships with them. If we fail to maintain a stable and efficient distribution and payment network, our business, financial condition and results of operations could be materially and adversely affected.
In addition, our ability to process electronic commerce transactions depends on bank processing and credit card systems. In order to prepare for certain types of system problems, we have a formal disaster recovery plan. Nevertheless, any system failure, including network, software or hardware failure, which causes a delay or interruption in our e-commerce services could have a material adverse effect on our business, revenues, results of operations and financial condition.
We could be liable for breaches of security on our websites and fraudulent transactions by users of our websites
A portion of our transactions are conducted through our websites and websites of our licensees. In such transactions, secured transmission of confidential information (such as customers’ credit card numbers and expiration dates, personal information and billing addresses) over public networks is essential to maintain consumer confidence. In addition, we and our licensees may face internal fraud, including potential unauthorized usage of customer credit card information by our employees and those of our licensees. While we have taken steps to prevent this, including the implementation of payment card industry data security standards, our current security measures may not be adequate. Security breaches could expose us to litigation and possible liability for failing to secure confidential customer information and could harm our or our licensees’ reputation and ability to attract and retain customers.
Undetected programming errors or defects in our software, services and games and the proliferation of cheating programs could materially and adversely affect our gaming software and services and online games businesses, financial condition and results of operations
Our software, services and games may contain undetected programming errors or other defects. These errors or other defects could result in losses to the licensees of our gaming software, end-users and us. Claims resulting from losses to end users could damage our reputation and subject us to liability. As to online games, parties unrelated to us may develop Internet cheating programs that enable users to acquire superior features for their game characters that they would not have otherwise. Furthermore, certain cheating programs could cause the loss of a character’s superior features acquired by a user. The occurrence of undetected errors or defects in our games, and our failure to discover and disable cheating programs affecting the fairness of our game environment, could disrupt our operations, damage our reputation and detract from the game experience of our users. As a result, such errors, defects and cheating programs could materially and adversely affect our business, financial condition and results of operations.
11
Our gaming software and services business is international and therefore faces associated risks
There are certain difficulties and inherent risks faced by our Company and UIM, our largest licensee, in doing business internationally, including the burden of complying with multiple and conflicting regulatory requirements, foreign exchange controls, potential restrictions or tariffs on gaming activities that may be imposed, potentially adverse tax consequences and tax risks. Changes in the political and economic stability, regulatory and taxation structures, and the interpretation thereof, in jurisdictions in which we or UIM operate, and in which our, UIM’s or its sub-licensees’ customers are located could have a material adverse effect on our business, revenues, results of operations and financial condition. In addition, while the functional currency of our gaming software and services business is U.S. dollar, the principal geographic markets of our gaming software products and services are Continental European markets. The fluctuation of exchange rate between Euro and U.S. dollar may adversely affect spending of players from Continental Europe and the demand for our gaming software products and services, and in turn, adversely affect our business and revenues.
Online gaming is a relatively new industry and therefore, we do not know if the market will continue to grow
The online gaming industry is at an early stage of development, and the extent of acceptance of online gaming products and services is uncertain. Market data for the online gaming industry is not as readily available as that on other more established industries where trends can be assessed more reliably from data gathered over a longer period of time. In addition, the success of our gaming software and service business will largely depend on the widespread adoption of the Internet for commercial transactions. If the market fails to develop, develops more slowly than expected, or becomes saturated with our competitors, or if our products and services do not achieve market acceptance, or if the availability of the Internet commercial transactions fails to develop sufficiently to support the online gaming industry, our business, revenues, results of operations and financial condition could be materially and adversely affected.
Operation of pirate game servers and the expenses incurred in protecting our online games operation against unlawful operations through pirate servers may adversely affect our business
We continue to face challenges from pirate game servers, which are game servers that operate unauthorized copies of our online games and permit users to play those games without purchasing pre-paid game cards from us. The existence of unauthorized servers may attract game players away from our games and may result in decreases in our revenues. We have detected the operation by pirate servers of unauthorized copies of several of our games. In January 2009, for example, we discovered that certain unauthorized third parties have misappropriated the source codes of Luna Online and have set up unauthorized servers to unlawfully operate the game in the PRC. Although we have made efforts to detect and shutdown pirate servers in China, Taiwan and Hong Kong, we cannot assure you that such efforts will be successful in eliminating these unauthorized servers. In addition, detailed comparisons of software codes and litigation proceedings are often necessary to enforce the intellectual property rights, whether owned by or licensed by us, which sometimes result in substantial costs. The continued illegal operation of any of our existing games by pirate game servers, or the illegal operation of any of our new games by pirate servers, may materially and adversely affect our business, financial condition and results of operations.
We may be subject to claims of intellectual property right infringement by third parties, which could subject us to significant liabilities and other costs
Our success depends largely on our ability to use and develop our technology and know-how without infringing the intellectual property rights of third parties. We cannot assure you that third parties will not assert intellectual property claims against us. The validity and scope of claims relating to the intellectual property of online gaming software development and technology may involve complex scientific, legal and factual questions and analysis, and tend to be uncertain. If third parties assert copyright or patent infringement or violation of other intellectual property rights against us, we have to defend ourselves in legal or administrative proceedings, which can be costly and time consuming and may significantly divert the efforts and resources of our technical and management personnel. An adverse determination in any such proceedings to which we may become a party could subject us to significant liability to third parties, require us to seek licenses from third parties, and prevent us from selling our products and services. The imposition of liabilities that is not covered by insurance, in excess of insurance coverage or for which we are not indemnified by a content provider, could have a material adverse effect on our business, results of operations and financial condition.
We may need to incur significant expenses to protect our intellectual property rights, and if we are unable to adequately protect our intellectual property rights, our competitive position could be harmed
We regard our copyrights, service marks, trademarks, trade secrets, patents and other intellectual property as critical to our success. We rely on a combination of copyright and trademark laws, trade secret protection, confidentiality and non-disclosure agreements, and other contractual provisions to protect our proprietary software, trade secrets and similar intellectual property. We have patents, copyrights and trademarks in certain jurisdictions and may apply for further trademark and copyright registrations and additional patents, which may provide such protection in relevant jurisdictions. However, we cannot assure you that our efforts will prove to be sufficient or that third parties will not infringe upon or misappropriate our proprietary rights. Unauthorized use of the intellectual property, whether owned by or licensed to us, could adversely affect our business and reputation.
12
The validity, enforceability and scope of protection of intellectual property in Internet-related industries are evolving, and therefore, uncertain. In particular, the laws and enforcement procedures of the PRC, Taiwan and Hong Kong are uncertain or do not protect intellectual property rights to the same extent as the laws and enforcement procedures of the United States do. We may have to engage in litigation or other legal proceedings to enforce and protect our intellectual property rights, which could result in substantial costs and diversion of our resources, and have a material adverse effect on our business, financial condition and results of operations.
Our future results of operations or the growth of our business may suffer if we are unable to maintain a satisfactory relationship with the licensors of our online games
We primarily source MMORPGs and advanced casual games through licensing from developers in various regions where online game development is relatively established. As of the date of this annual report, we have four licensed MMORPGs and five licensed advance casual games in our online game portfolio, including the games we currently offer and the games in the pipeline. We need to maintain stable and satisfactory working relationships with our licensors in order to ensure the continued operation of our licensed online games and our continued access to new online game licenses. We depend on our licensors to provide the necessary technical support for the operation of the licensed games as well as expansion packs and upgrades that sustain continuing interest in the games. Our ability to maintain satisfactory working relationships with our licensors may also influence our ability to license new online games developed by the same or other licensors. If we are unable to maintain satisfactory relationships with our licensors, our financial condition, results of operations, future profitability and growth prospects may be materially and adversely affected.
Failure to maintain effective internal controls could have a material adverse effect on our business, results of operations and the trading price of our Shares
Effective internal controls are necessary for us to provide reasonable assurance with respect to its financial reports and to effectively prevent fraud. If we cannot provide reasonable assurance with respect to our financial reports and effectively prevent fraud, our results of operations could be materially and adversely affected. We are subject to reporting requirements under the U.S. securities laws. The SEC, as required by Section 404 of the Sarbanes-Oxley Act of 2002, has adopted rules requiring public companies to include a report of management on such company’s internal control over financial reporting in its annual report, which must contain an assessment by management of the effectiveness of such company’s internal control over financial reporting. In addition, an independent registered public accounting firm must express an opinion on the effectiveness of our Company’s internal control over financial reporting.
Our management conducted an evaluation of the effectiveness of our internal control over financial reporting and concluded that our internal control over financial reporting was effective as of December 31, 2008. In addition, the report of our independent registered public accounting firm includes an opinion regarding the effectiveness of our internal control over financial reporting. We have successfully completed our Section 404 assessment under the Sarbanes-Oxley Act and received our auditors’ attestation as of December 31, 2008. However, internal control over financial reporting may not prevent or detect misstatements because of its inherent limitations, including the possibility of human error, the circumvention or overriding of controls, or fraud. Therefore, even effective internal controls can provide only reasonable assurance with respect to the preparation and fair presentation of financial statements. In addition, projections of any evaluation of effectiveness of internal control over financial reporting to future periods are subject to the risk that the control may become inadequate because of changes in conditions, or that the degree of compliance with the policies or procedures may deteriorate.
Our failure to maintain effective internal control over financial reporting could result in the loss of investor confidence in the reliability of our financial statements, which in turn could harm our business and negatively impact the trading price of our Shares. Furthermore, we may incur additional costs and use significant management and other resources in an effort to comply with Section 404 and other requirements of the Sarbanes-Oxley Act going forward.
We may need additional capital in the future, and it may not be available on acceptable terms
The development of our business may require significant additional capital in the future to:
| | • | | enhance and expand the range of products and services we offer; and |
| | • | | respond to competitive pressures and perceived opportunities, such as investment, acquisition and international expansion activities. |
13
We cannot assure you that additional financing will be available on terms favorable to us, if at all. If adequate funds are not available on acceptable terms, we may be forced to curtail or cease our operations. Moreover, even if we are able to continue our operations, any failure to obtain additional financing could have a material and adverse effect on our business, financial condition and results of operations, and we may need to delay the deployment of our services. See Item 5, “Operating and Financial Review and Prospects — B. Liquidity and Capital Resources.”
We depend on our key personnel, and our business and growth prospects may be severely disrupted if we lose their services
Our future success is heavily dependent upon the continued service of our key executives and other key employees. In particular, we rely on the expertise, experience and leadership ability of our chief executive officer, Arthur M. Wang, and our president and chief operating officer, Thomas Hui, in our business operations, and rely on their personal relationships with our employees, the relevant regulatory authorities, and our game and service suppliers. We also rely on a number of key technology officers and staff for the development and operation of our online gaming software and online games. In addition, as we expect to focus increasingly on our online games business, we will need to continue attracting and retaining skilled and experienced professionals to maintain our competitiveness.
If one or more of our key personnel are unable or unwilling to continue in their present positions, we may not be able to easily replace them and may incur additional expenses to recruit and train new personnel. As a result, our business could be severely disrupted, and our financial condition and results of operations could be materially and adversely affected. Furthermore, since our industry is characterized by high demand and intense competition for talent, we may need to offer higher compensation and other benefits in order to attract and retain key personnel in the future. We cannot assure you that we will be able to attract or retain the key personnel that we will need to achieve our business objectives.
Our results of operations and financial condition are affected by political stability, as well as the occurrence of natural disasters and epidemics
We operate our online games business both in Taiwan and the PRC. Political unrest, war, acts of terrorism and other instability, as well as natural disasters such as earthquakes and typhoons which are common in Taiwan and the PRC, can result in disruption to our business or the businesses of our customers.
Our business could be adversely affected by natural disasters and the effects of influenza A (H1N1), avian flu, SARS or other epidemics. Any prolonged recurrence of such adverse public health developments in the regions where we operate may have material adverse effect on our business operations. These could include illness and loss of our management and key employees. Natural disasters or outbreak of epidemics may result in decrease in economic activities or temporary closure of many businesses and disruption in our operations. In addition, other major natural disasters may also adversely affect our business by, for example, causing disruptions of the Internet network or otherwise affecting access to our games.
Risks Related to Doing Business in Greater China
PRC laws and regulations restrict foreign ownership and investment in the online game industry, and substantial uncertainties exist with respect to the application and implementation of PRC laws and regulations
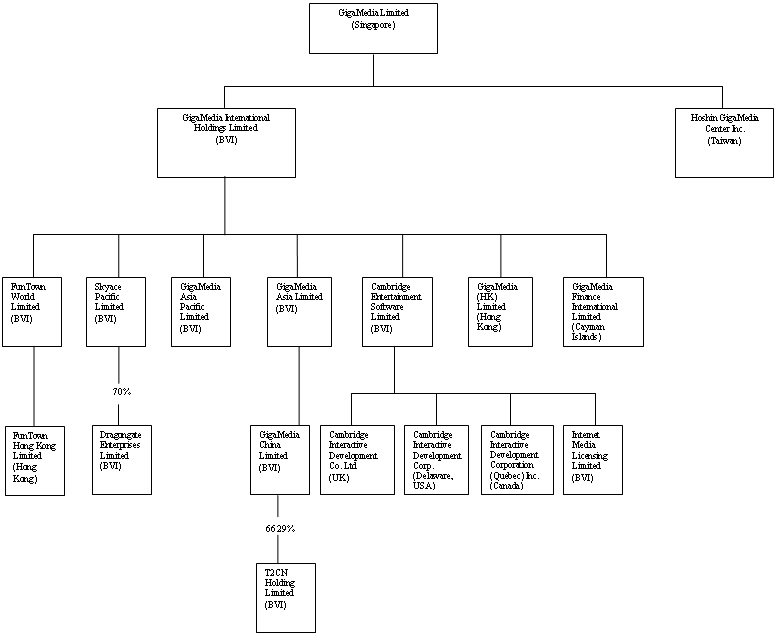
We are classified as a foreign enterprise under PRC laws and various regulations in the PRC currently restrict foreign or foreign-owned enterprises from holding certain licenses required to provide online games over the Internet in the PRC, including Internet content provision, Internet culture operation and Internet publishing licenses. In order to comply with foreign ownership restrictions, we operate our online games business in the PRC through our three variable interest entities (“VIEs”), including Shanghai T2 Entertainment Co., Ltd. (“T2 Entertainment”), Shanghai T2 Advertisement Co., Ltd. (“T2 Advertisement”) and Shanghai Jinyou Network & Technology Co., Ltd. (“Jinyou”). All the VIEs are effectively controlled by T2CN though contractual arrangements. T2 Entertainment and Jinyou hold the Internet content provision and Internet cultural operation licenses that are required to operate our online games business in the PRC, and T2 Advertisement holds advertising license that is require to sell advertisements on our websites in the PRC. Beginning in June 2007, the results of T2 Entertainment and T2 Advertisement have been included in our consolidated financial statements. The results of Jinyou have been included in our consolidated financial statements starting from September 2008. For additional information, see Item 4, “Information on the Company — B. Business Overview — Regulation — Regulations Relating to Online Games in the PRC — Foreign Ownership Restrictions” and Item 4, “Information on the Company — C. Organizational Structure” in this annual report.
14
In July 2006, the Ministry of Industry and Information Technology (“MIIT”, formerly the Ministry of Information Industry) issued a notice, which prohibits holders of value-added telecommunications business operation licenses (“ICP licenses”) from leasing, transferring or selling a telecommunications business operating license to any foreign investors in any form, or providing any resource, sites or facilities to any foreign investors for their illegal operation of telecommunications business in the PRC. The notice also requires that ICP license holders and their shareholders directly own the domain names and trademarks used by such ICP license holders in their daily operations. The notice further requires each ICP license holder to have the necessary facilities for its approved business operations and to maintain such facilities in the regions covered by its license. In addition, all value-added telecommunication service providers are required to maintain network and information security in accordance with the standards set forth under relevant PRC regulations. Local authorities in the various regions were required to ensure that existing ICP license holders conducted self-assessments of their compliance with the Notice and submitted their status reports to the MIIT prior to November 1, 2006. T2 Entertainment has conducted its self-assessment and believes that it is in compliance with the requirements of notice. Jinyou obtained the ICP license in September 2008.
We believe that the ownership structure and business operation models of our PRC subsidiaries comply with all existing PRC laws, rules and regulations, and no consent, approval or license is required under any of the existing PRC laws and regulations for their ownership structure, businesses and operations, except those which we have already obtained or which would not have a material adverse effect on our business or operations as a whole. There are, however, substantial uncertainties regarding the interpretation and application of current or future PRC laws and regulations. Accordingly, we cannot assure you that PRC government authorities will ultimately take a view that is consistent with our view. If we or any of our PRC operating companies are found to be in violation of any existing or future PRC laws or regulations, the relevant government authorities would have broad discretion in dealing with such violations and could impose significant penalties and sanctions or other regulatory or enforcement actions, including levying fines, that could be harmful to our business. Any of these actions could have a material adverse effect on our business, financial condition and results of operations.
We could also face material and adverse tax consequences if the PRC tax authorities determine that our contractual arrangements with T2 Entertainment, T2 Advertisement and Jinyou were not made on reasonable commercial terms. In such an event, they could adjust our income and expenses for PRC tax purposes in the form of a transfer pricing adjustment which could result in an increase in our PRC subsidiaries’ tax liability or limit our PRC subsidiaries’ ability to maintain preferential tax treatments and other financial incentives.
The contractual arrangements with T2 Entertainment, T2 Advertisement and Jinyou and their shareholders may not be as effective in providing operational control as direct ownership
We operate our online games business through T2 Entertainment, T2 Advertisement and Jinyou, all of which are our VIEs. We have no ownership interest in any of these VIEs and rely on a series of contractual arrangements that are intended to give us effective control over them. However, the contractual arrangements may not be as effective as compared to having direct ownership and control over these companies. Direct ownership would allow us, for example, to directly exercise our rights as a shareholder to effect changes in the board of directors, which, in turn, could affect changes, at the management level. In addition, these VIEs could violate their contractual arrangements with us, go bankrupt, suffer from problems in their businesses or otherwise become unable to perform their contracts with us. As a result, our business could be disrupted and our results of operations may be materially and adversely affected.
Most principal shareholders of T2 Entertainment, T2 Advertisement and Jinyou are executive officers of T2CN and have no substantial shareholdings in our Company. Thus, their interests as shareholders of the VIEs and their duties to our Company may conflict. We cannot assure you that when conflicts of interest arise, these persons will act completely in our interests or that conflicts of interests will be resolved in our favor. Any legal proceeding could result in the disruption of our business, diversion of our resources and the incurring of substantial costs.
All of these contractual arrangements are governed by PRC laws and provide for the resolution of disputes through either arbitration or litigation in the PRC. Accordingly, the underlying contracts would be interpreted in accordance with PRC laws and any disputes would be resolved in accordance with PRC legal procedures. The legal environment in the PRC is not as developed as in other jurisdictions, such as the United States. As a result, uncertainties in the PRC legal system could limit our ability to enforce these contractual arrangements. In the event we are unable to enforce these contractual arrangements, we may be unable to exert effective control over our PRC operating VIEs, and our ability to conduct our business may be negatively affected. See Item 4, “Information on the Company — C. Organizational Structure” in this annual report.
15
The laws and regulations governing the online games industry in the PRC are evolving and new regulations may adversely affect our business
Our provision of online games and online game-related content on our websites in China is subject to various PRC laws and regulations relating to the telecommunications industry and Internet and online games, and is regulated by various government and regulatory authorities. The principal PRC regulations governing the provision of Internet content and online gaming services include (among others) the Telecommunications Regulations (2000), the Administrative Rules for Foreign Investments in Telecommunications Enterprises (2001), the Administrative Measures for Telecommunications Business Operating Licenses (2001), the Tentative Measures for Administration of Internet Culture (2003), the Tentative Measures for the Administration of Internet Publications (2002), the Opinions on the Development and Management of Online Games (2005) and the Anti-Internet Addiction Regulations (2007). We may be affected by these regulations, which seek to regulate the content of online games and discourage online game players from spending excessive amounts of time playing online games. This may reduce the number of our users, the growth rate of our user base, the general online games market in the PRC or the average number of hours played by online game players, or cause us to reduce usage fees or other charges in connection with our online games business. In addition, compliance with such regulations may require us to incur substantial costs in modifying or adapting our game software to comply with the regulatory requirements. This may adversely affect our business, financial condition and results of operations.
The adoption of new laws or regulations in the PRC relating to the Internet, or particular applications or interpretations of existing laws, could decrease the growth in the use of the Internet, decrease the demand for our products and services, increase the cost of conducting our business or could otherwise have a material adverse effect on our business, revenues, results of operations and financial condition.
New PRC laws and regulations that address issues such as user privacy, pricing, online content, taxation, advertising, intellectual property, information security, and the characteristics and quality of online products and services may be enacted. For example, in order to counter the Internet addiction, in April 2007, eight PRC government authorities issued regulations to discourage online game-players who are minors from spending excessive amounts of time playing online games. Pursuant to these regulations, Internet game operators have been ordered to install anti-addiction software features on games offered in the PRC, which will, among other features, limit the number of points and other benefits which can be awarded to game players after they have been online in excess of specified periods of time. Internet game operators will also be required to adopt real-name registration, which will require online game players to register their real identity information before they will be allowed to play online games. See Item 4, “Information on the Company — B. Business Overview — Regulation” in this annual report.
There are no clear laws or regulations governing virtual asset property rights, in particular, in Greater China, and therefore, it is not clear what liabilities, if any, online game operators may have in respect of virtual assets
In the course of playing online games, some virtual assets, such as special equipment, player experience grades and other features of our users’ game characters, are acquired and accumulated. Such virtual assets can be important to online game players. In practice, virtual assets can be lost for various reasons, often through unauthorized use of user identifications by other users and occasionally through data loss caused by delay of network service or by a network crash. Currently there are no clear laws or regulations governing virtual asset property rights, in particular, in Greater China where we operate our online games business. In the case of a loss of virtual assets, we may be sued by online game players and could be held liable for damages, which may negatively affect our business, financial condition and results of operations.
Restrictions on virtual currency may adversely affect our revenues from online game operations in the PRC
Our online game operations revenues in the PRC are primarily collected through the sale of our prepaid game cards or online sale of game points. On February 15, 2007, 14 PRC government authorities jointly issued Circular for Further Strengthening the Administration of Internet Café and Online Games, which directs the People’s Bank of China (“PBOC”) to strengthen the administration of virtual currency in online games to avoid any adverse impact on the PRC economy and financial system. This circular provides that the total amount of virtual currency issued by online game operators and the amount purchased by individual game players should be strictly limited, with a strict and clear division between virtual transactions and real transactions carried out by way of electronic commerce. This notice also provides that virtual currency should only be used to purchase virtual items. These restrictions may result in lower sales of our prepaid game cards or game points, and could have an adverse effect on our game operations revenues.
16
Our business may be adversely affected by government policies and regulation of Internet cafés in the PRC
Internet cafés are one of our primary venues where our online games were distributed and played in the PRC. The PRC government has tightened its regulations of Internet cafés including through limiting the number of new operating licenses issued and reducing the operating hours of such cafés. In February 2007, 14 PRC government authorities jointly issued a notice, which suspended approval for the establishment of new Internet cafés and called for strengthened regulation of existing Internet cafés. It is unclear when or if this suspension will be lifted. The PRC governmental authorities may from time to time impose stricter requirements, such as the customers’ age limit and hours of operation, among others, as a result of the occurrence and perception of, and the media attention on, gang fights, arson and other incidents in or related to Internet cafés. The implementation of these measures, or enactment by the PRC government of any additional laws to further regulate Internet cafés, may result in fewer customers or less time spent by customers playing our online games, which could restrict our ability to maintain or increase our revenues and expand our customer base. See Item 4, “Information on the Company — B. Business Overview — Regulation — Internet Café Regulation” in this annual report.
Fluctuations in the exchange rates between the U.S. dollar and other currencies in which we conduct our business could adversely affect our profitability
The operations of our online games business are conducted in NT dollars, Hong Kong dollars and Renminbi. Accordingly, fluctuations in the exchange rates could have a positive or negative effect on our reported results. Generally, an appreciation of NT dollars, Hong Kong dollars or Renminbi against U.S. dollars results in a foreign exchange loss for monetary assets denominated in U.S. dollars, and a foreign exchange gain for monetary liabilities denominated in U.S. dollars. On the contrary, a devaluation of NT dollars, Hong Kong dollars or Renminbi against U.S. dollars results in a foreign exchange gain for monetary assets denominated in U.S. dollars, and a foreign exchange loss for monetary liabilities denominated in U.S. dollars. Given the constantly changing currency exposures and the substantial volatility of currency exchange rates, we cannot predict the effect of exchange rate fluctuations upon future operating results. There can be no assurance that we will not experience currency losses in the future, which could have a material adverse effect on our business, revenues, results of operations and financial condition.
Changes in foreign exchange and foreign investment regulations and limitations on dividend payment in the PRC may affect our ability to invest in China and the ability of our PRC subsidiaries to pay dividends and service debts
Renminbi is not a freely convertible currency at present. The PRC government regulates conversion between Renminbi and foreign currencies. Changes in PRC laws and regulations on foreign exchange may result in uncertainties in our financing and operating plans in China. Over the years, China has significantly reduced the government’s control over routine foreign exchange transactions under current accounts, including trade and service related foreign exchange transactions, payment of dividends and service of foreign debts. In accordance with the existing foreign exchange regulations in China, our PRC subsidiaries may, within the scope of current account transactions, pay dividends and service debts in foreign currencies without prior approval from the PRC State Administration of Foreign Exchange, or SAFE, by complying with certain procedural requirements. However, there can be no assurance that the current PRC foreign exchange policies with respect to debt service and payment of dividends in foreign currencies will continue in the future. Changes in PRC foreign exchange policies may have a negative impact on our ability to service our foreign currency-denominated indebtedness and to distribute dividends to our shareholders in foreign currencies since our subsidiaries in China need to convert their Renminbi cash flow to service such foreign debt and to make such dividend payments.
Foreign exchange transactions by our PRC subsidiaries under the capital account continue to be subject to significant foreign exchange controls. In particular, foreign exchange transactions involving foreign direct investment, foreign debts and outbound investment in securities and derivatives are subject to limitations and require approvals from the relevant SAFE authorities. We have the choice, as permitted by the PRC foreign investment regulations, to invest in the form of registered capital or a shareholder loan into our PRC subsidiaries to finance our operations in China. Our choice of investment is affected by the different treatments under the relevant PRC regulations with respect to capital-account and current-account foreign exchange transactions in China. For example, our transfer of funds to our subsidiaries in China is subject to approval of PRC governmental authorities in case of an increase in registered capital, or subject to registration with PRC governmental authorities in case of a shareholder loan. These and other limitations on the flow of funds between us and our PRC subsidiaries could restrict our ability to act in response to changing market conditions and limit our flexibility in the management of our cash flow and financings. See Item 10, “Additional Information — D. Exchange Controls” in this annual report.
In addition, recent PRC regulations relating to the establishment of offshore special purpose companies by PRC residents may subject the PRC resident shareholders of our PRC subsidiaries or us to penalties and limit our ability to inject capital into our PRC subsidiaries, limit our subsidiaries’ ability to increase their registered capital, distribute profits to us, or otherwise adversely affect us. Moreover, our PRC subsidiaries are required to set aside a certain percentage of their after-tax profit based on PRC accounting standards each year for their reserve fund in accordance with the requirements of relevant PRC laws and the relevant provisions in their respective articles of associations. As a result, our PRC subsidiaries may be restricted in their ability to transfer any portion of their net income to us whether in the form of dividends, loans or advances.
17
There are economic risks associated with doing business in Taiwan, particularly due to the tense relationship between Taiwan and the PRC
Our principal executive offices and a significant portion of our assets are located in Taiwan and a major portion of our revenues of online games business are derived from our operations in Taiwan. Taiwan, as part of the Republic of China, has a unique international political status. The PRC asserts sovereignty over mainland China and Taiwan and does not recognize the legitimacy of the Taiwan government. Relations between Taiwan and the PRC and other factors affecting the political or economic conditions of Taiwan could also affect our online games business.
Risks Related to Ownership of our Shares
The price of our Shares has been volatile historically and may continue to be volatile, which may make it difficult for holders to resell our Shares when desired or at attractive prices
The trading price of our Shares has been and may continue to be subject to wide fluctuations. In 2008, the closing prices of our Shares on the NASDAQ Stock Market have ranged from US$2.90 to US$20.70 per share, and the closing price on June 25, 2009 was US$5.77. Our Share price may fluctuate in response to a number of events and factors. In addition, the financial markets in general, and the market prices for Internet-related companies in particular, have experienced extreme volatility that often has been unrelated to the operating performance of such companies. These broad market and industry fluctuations may adversely affect the price of our Shares, regardless of our operating performance.
We are controlled by the Koo family, which has significant influence in determining the outcome of any corporate transaction or other matters submitted to our shareholders for approval, and their interests may conflict with your interests
As of March 31, 2009, members of the Koo family beneficially owned approximately 19.85 percent of our outstanding Shares. Accordingly, the members of the Koo family have significant influence in determining the outcome of any corporate transaction or other matters submitted to our shareholders for approval, including mergers, consolidations, the sale of all or substantially all of our assets and the power to prevent or cause a change in control. The interests of such members of the Koo family may differ from or conflict with your interests.
Our transactions with related parties may not benefit us and may harm our Company
We have entered into several transactions with our certain related parties. We believe that we have conducted our related-party transactions on an arm’s-length basis and on terms comparable to, or more favorable to us than, similar transactions we would enter into with independent third parties. However, we cannot assure you that all our future transactions with related parties will be beneficial to us. See Item 7, “Major Shareholders and Related-Party Transactions” in this annual report.
Our online games business in the PRC relies on payments made by our PRC VIEs to T2CN, our majority-owned subsidiary, pursuant to contractual arrangements to transfer any such revenues to T2CN. Any restriction on such payments and any increase in the amount of PRC taxes applicable to such payments may materially and adversely affect our business and our ability to pay dividends to our shareholders
T2 Entertainment, T2 Advertisement and Jinyou are not owned by us and they are not able to make dividend payments to us. Instead, T2CN, our majority-owned subsidiary in China, entered into a number of agreements with T2 Entertainment, T2 Advertisement and Jinyou, including certain exclusive technical service and consultancy agreement and exclusive business consultancy service agreements, pursuant to which T2 Entertainment, T2 Advertisement and Jinyou pay T2CN for certain services that T2CN provides to these companies. However, depending on the nature of services provided, certain of these payments are subject to PRC taxes at different rates, including business taxes and VATs, which effectively reduce the amount that T2CN receives from T2 Entertainment, T2 Advertisement and Jinyou. We cannot assure you that the PRC government will not impose restrictions on such payments or change the tax rates applicable to such payments. Any such restrictions on such payment or increases in the applicable tax rates may materially and adversely affect our ability to receive payments from T2 Entertainment, T2 Advertisement and Jinyou or the amount of such payments, and may in turn materially and adversely affect our business, our net income and our ability to pay dividends to our shareholders.
18
The ability of our subsidiaries in Taiwan to distribute dividends to us may be subject to restrictions under the laws of Taiwan
We are a holding company, and some of our assets constitute our ownership interests in our subsidiaries in Taiwan, including Hoshin GigaMedia, which owns the Taiwan-based operations of our online games business. Accordingly, part of our primary internal source of funds to meet our cash needs is our share of the dividends, if any, paid by our subsidiaries, including those in Taiwan. The distribution of dividends to us from these subsidiaries in Taiwan is subject to restrictions imposed by the applicable corporate and tax regulations in these countries, which are more fully described in Item 5, “Operating and Financial Review and Prospects — B. Liquidity and Capital Resources — Dividends from Our Subsidiaries” in this annual report. In addition, although there are currently no foreign exchange control regulations which restrict the ability of our subsidiaries in Taiwan to distribute dividends to us, the relevant regulations may be changed and the ability of these subsidiaries to distribute dividends to us may be restricted in the future.
Anti-takeover provisions under the Singapore Securities and Futures Act (Chapter 289) and the Singapore Code on Take-overs and Mergers may delay, deter or prevent a future takeover or change of control of our Company, which could adversely affect the price of our Shares
There are provisions under the Singapore Securities and Futures Act (Chapter 289) and the Singapore Code on Take-overs and Mergers (the “Code”) that may delay, deter or prevent a future takeover or change of control of our Company. Anyone acquiring an interest, either on his own or together with parties acting in concert with him, in 30 percent or more of our voting shares must extend a takeover offer for the remaining voting shares in accordance with the provisions of the Code. A person holding between 30 percent and 50 percent of our voting shares, either on his own or together with parties acting in concert with him, must also make a takeover offer in accordance with the provisions of the Code if that person together with parties acting in concert with him acquires additional voting shares in excess of one percent of the total number of voting shares in any six-month period. These provisions may discourage or prevent transactions that involve an actual or threatened change of control of our Company. This may harm you because an acquisition bid may allow you to sell your Shares at a price above the prevailing market price.
Our shareholders may be subject to Singapore taxes
Singapore tax law may differ from the tax laws of other jurisdictions, including the United States. Gains from the sale of our Shares by a person not tax resident in Singapore may be taxable in Singapore if such gains are part of the profits of any business carried on in Singapore. For additional information, see Item 10, “Additional Information — E. Taxation — Singapore Tax Consideration” in this annual report. You should consult your tax advisors concerning the overall tax consequences of acquiring, owning or selling the Shares.
We are a Singapore company, and because the rights of shareholders under Singapore law differ from those under U.S. law, you may have difficulty in protecting your shareholder rights or enforcing any judgment obtained in the U.S. against us or our affiliates
Our corporate affairs are governed by our memorandum and articles of association and by the laws governing corporations incorporated in Singapore. The rights of our shareholders and the responsibilities of members of our board of directors under Singapore law are different from those applicable to a corporation incorporated in the United States and, therefore, our shareholders may have more difficulty protecting their interests in connection with actions by the management, members of our board of directors or our controlling shareholders than they would as shareholders of a corporation incorporated in the United States.
Our Company is incorporated under the laws of the Republic of Singapore. Many of our directors and senior management reside outside the United States. As a result, it may be difficult for investors to effect service of process within the United States upon us or any of these persons or to enforce in the United States any judgment obtained in the U.S. courts against us or any of these persons, including judgments based upon the civil liability provisions of the U.S. federal securities laws or any state or territory of the United States. Judgments of the U.S. courts based upon the civil liability provisions of the U.S. federal securities laws may not be enforceable in Singapore courts, and there is doubt as to whether Singapore courts will enter judgments in original actions brought in Singapore courts based solely upon the civil liability provisions of the U.S. federal securities laws.
We may be classified as a passive foreign investment company for U.S. federal income tax purposes. As a result, you may be subject to materially adverse tax consequences with respect to our Shares
Although we do not believe we should be classified as a passive foreign investment company for the 2009 taxable year, no assurances may be given that we will not be classified as a passive foreign investment company in the current or any future taxable year. For a discussion of the factors that will affect whether or not we are classified as a passive foreign investment company, see Item 10, “Additional Information — E. Taxation — U.S. Tax Considerations — Passive Foreign Investment Company Rules.” If you are a U.S. person holding Shares, (or have held Shares during a taxable year in respect of which we were classified as a passive foreign investment company and you continue to hold such Shares or portion thereof) and we are classified as a passive foreign investment company and you do not determine to make a mark-to-market election, you will be subject to special U.S. federal income tax rules that may have materially adverse tax consequences and will require annual reporting.
19
ITEM 4. INFORMATION ON THE COMPANY
A. History and Development of Our Company
Our legal and commercial name is GigaMedia Limited. We trace our origin back to the incorporation of Hoshin GigaMedia in Taiwan in October 1998. For the purpose of a public equity offering, we were incorporated in Singapore in September 1999 as a company limited by shares. We acquired 99.99 percent of equity interest in Hoshin GigaMedia in November 1999 and the remaining 0.01 percent in October 2002.
In February 2000, we completed the initial public offering of our Shares. Our Shares are traded on the NASDAQ Stock Market under the symbol GIGM.
Prior to September 2002, we primarily provided broadband Internet access and services in Taiwan through Hoshin GigaMedia. In September 2002, we acquired Rose Records (formerly known as Point Records Co., Ltd.) and Tachung Records (formerly known as Music King Co., Ltd.), two of the largest music store chains in Taiwan. Subsequent to these two acquisitions, we commenced the recorded music distribution business.
In 2004, we began the restructuring of our principal business operations with a view to shifting our strategic focus to gaming software and services business and online games business. The following chart highlights some of the major historical developments of our restructuring and the relevant strategic acquisitions and investments from 2004 to 2007:
| | | |
| Time | | Event |
| | | |
| April 2004 | | We acquired the business and operations of Grand Virtual, Inc., a privately-held gaming software developer and application service provider, and its affiliates. |
| | | |
| April 2004 | | We entered into an end user license agreement with UIM, pursuant to which we granted a nonexclusive, non-transferable worldwide license to UIM to use our software and certain operational and support services. The royalties under the agreement were determined based on a revenue sharing mechanism. The term of the agreement is 10 years. |
| | | |
| September 2005 | | We sold all of our ownership interest in the Rose Records and Tachung Records music store chains with a view to eliminating the non-core operations. |
| | | |
| January 2006 | | We acquired FunTown, an online games business operated in Taiwan and Hong Kong, to enhance our position in the online entertainment market. |
| | | |
| May 2006 | | We disposed of our ADSL business, which was an operational line of our Internet access and services business. |
| | | |
| December 2006 | | We entered into a strategic alliance with Infocomm Asia, an operator and distributor of online games in Southeast Asia. In connection with the strategic alliance, we acquired preferred shares convertible into the issued ordinary shares of Infocomm Asia. As of May 31, 2009, we held preferred shares convertible into 28.43 percent of the ordinary shares of Infocomm Asia. Upon conversion of the preferred shares held by us into the ordinary shares of Infocomm Asia, we expect to become the largest shareholder of Infocomm Asia. |
| | | |
| June 2007 | | We completed the acquisition of the controlling interest in T2CN, one of the online casual game operators in the PRC. As of May 31, 2009, we hold 66.29 percent of the total outstanding voting rights of T2CN. |
20
On January 18, 2008, we entered into a strategic alliance with Access China Holding Limited (“Access China”), an online game developer in the PRC. In connection with the strategic alliance, we acquired preferred shares convertible into the common shares of Access China. As of May 31, 2009, we held preferred shares convertible into approximately 30 percent of the common shares of Access China.
On May 15, 2008, we entered into certain agreements with SuperCup Entertainment (Holdings) Limited (“SuperCup”) and its affiliates, pursuant to which we purchased preferred shares convertible into the common shares of SuperCup and obtained worldwide exclusive rights to cooperate with SuperCup in MahJong and certain Asian card games business. As of May 31, 2009, we held preferred shares convertible into 39.7 percent of the issued share capital of SuperCup. In addition, as part of our investment, we agreed to provide a loan, on an arm’s length basis, in the amount of up to US$1.0 million to SuperCup.
We developed and licensed to UIM the game client application software for a series of Japanese online chance-based games, which were launched on June 25, 2008 in Japan and are offered through Janpachi, a game website.
On September 3, 2008, we sold our last remaining non-core business, our consumer cable modem and corporate ISP business, to China Network Systems Co., Ltd. and its affiliates. The disposal effectively completed our business restructuring process which we began in 2004. For additional information, see Item 5, “Operating and Financial Review and Prospects — Certain Significant Events affecting Our Results of Operations for 2006, 2007 and 2008 — Divestiture of our legacy Internet access and service business” and Item 10, “Additional Information — C. Material Contracts — Sale of Internet Access and Service Business” in this annual report.
On October 24, 2008, we entered into a software and supply agreement with a third-party gaming software developer with a view to adding the flash downloadable Internet casino games in our gaming platform.
On December 23, 2008, we entered into a strategic partnership with Victor Chandler, a renowned sports betting operator. Under the partnership, we cooperate with Victor Chandler in marketing its online sports betting on Everest Bets, an affiliate website utilizing our software solution, with a view to further enhancing cross-selling across the games on the Everest-branded platform.
On January 1, 2009, we launched Holic Online, an adventure-themed MMORPG, in Taiwan.
On January 22, 2009, we entered into a game license agreement with a third-party online game developer with respect to the licensing of an online game titled “Luna Online” in the PRC and Macau. We expect to launch the game in the second half of 2009.
On March 9, 2009, we entered into a strategic alliance with Numen Soft Co. Ltd. (“Numen Soft”), an online game developer in South Korea. In connection with the strategic alliance, we acquired the ordinary shares of Numen Soft. As of May 31, 2009, we held 10 percent of the ordinary shares of Numen Soft.
On May 26, 2009, we entered into a strategic alliance with Gorilla Banana Entertainment Corp. (“GBE”), an online game developer in South Korea. In connection with the strategic partnership, we acquired the ordinary shares of GBE. Upon completion of the transactions on June 6, 2009, we held 19.9 percent of the ordinary shares of GBE.
On June 25, 2009, we launched Warhammer Online: Age of Reckoning, a war-themed MMORPG developed by Electronic Arts Inc., in Taiwan, Hong Kong and Macau.
Our Singapore company registration number is 199905474H. Our principal executive offices are located at 8th Floor, 207 Tiding Boulevard, Section 2, Taipei 114, Taiwan, and our telephone number is 886-2-2656-8000. Our website address is: http://www.gigamedia.com.tw.
21
B. Business Overview
We are a provider of gaming software and services to the online gaming industry, particularly the online poker and casino markets, and an operator of online games in Greater China, including the PRC, Taiwan, Hong Kong and Macau. We were incorporated in Singapore in September 1999. Our principal business operations remained limited to the provision of Internet access and service business and recorded music distribution in Taiwan until 2004 when we commenced a business restructuring to shift our strategic focus to the gaming software and services and online games operations. We began our gaming software and services business in 2004 by acquiring the business of a gaming software provider. In 2006, through a series of strategic acquisitions, we expanded our operations into the online games market, which we believe has high growth potential. During the restructuring process, we disposed of our non-core businesses, including our retail music distribution and Internet and access service businesses. We completed the entire business restructuring in September 2008 with the sale of our last non-core business.
Subsequent to completion of the restructuring, we generate our revenue primarily through providing gaming software products and application services and operating online games. We operate our gaming software and services through CESL, our wholly-owned subsidiary. Since 2004, we have been focused on developing software packages for online poker and casino operations. We provide the Everest-branded gaming platform to various online poker and casino game sites, including Everest Poker, one of the world’s largest online poker websites in term of seven-day average player counts according to PokerScout, a third-party online poker review service. Our products and services include online poker and casino gaming software packages, extensive online gaming management tools, and application and consulting services. To improve usability of our products in international markets and serve customers seeking geographic expansion, we have developed the expertise and infrastructure to make our products suitable for the local markets in which the games are offered. Our gaming software products and services are currently available in 15 major languages. Our gaming software and services business is dependent on our largest licensee, UIM. UIM operates various online poker and casino websites, including Everest Poker, principally targeting players from Continental European markets. Fees earned by us are based on UIM’s gross receipt from the operation utilizing the licensed software. Historically, we have experienced seasonality primarily as a result of UIM’s slower sales in the second and third quarters, during which people tend to spend less time indoors and online as daylight hours increase and the weather in Continental Europe improve. Typically, our first and fourth quarters are our strongest revenue periods. The financial results of UIM were incorporated into our consolidated financial statements in accordance with FIN 46(R) although we do not own any equity interest in UIM.
We operate an increasingly diversified online games business in Greater China markets. We conduct our online games business in the PRC primarily through T2CN and in Taiwan, Hong Kong and Macau primarily through FunTown. Our online game portfolio currently includes online MahJong, MMORPGs, advanced casual games and a variety of online card, chance-based and simple casual games. We offer online MahJong through FunTown-branded game platform, which we believe is one of the largest online MahJong networks in Taiwan. In accordance with our online games expansion strategy, we have recently added MMORPGs to our online game portfolio. We currently offer two licensed MMORPGs, including Warhammer Online: Age of Reckoning in Taiwan, Hong Kong and Macau, and Holic Online in Taiwan. We also expect to introduce Holic Online in the PRC, Hong Kong and Macau. In addition, we expect to launch three new MMORPGs, including one in-house developed game and two licensed games, in Greater China markets. Our online game portfolio also includes various advanced casual games which, as compared to MMORPGs, are easier to play and can attract a broader range of players. We currently offer four advanced casual games and expect to launch NBA Street Online, a new sports game, in the second half of 2009. In addition, through our integrated FunTown-branded game platform, we offer over 40 online card, chance-based and simple casual games. To complement our online games, we offer various value-added services and virtual items for players to enhance their game experience, skills and online personal character. We focus on building community-based online platforms to cater to different social networking needs of our users and provide various channels to facilitate communications among them.
We intend to continue to seek growth and enhance our market position in gaming software and online games industries through competitive products and quality services. For our gaming software and services business, we will continue to provide quality software products, support tools and services that meet the evolving needs of online gaming industry. We also intend to increase the player base and cross-selling opportunities through development of the common wallet system, which will enable players to play across the games in our Everest-branded gaming platform as well as third party products with a single registration. For our online games business, we will continue to focus on the Greater China markets and further diversify our online game portfolio. While we will continue to broaden our access to high quality online games through licensing, we intend to expand our in-house game development team and strengthen our online game development capabilities, particularly in development of MMORPGs and advanced casual games.
We have historically experienced significant growth in our operations of gaming software and services and online games. For the years ended December 31, 2006, 2007 and 2008, our revenue from the gaming software and services segment was US$55.0 million, US$119.0 million and US$144.8 million, respectively, and our revenue from the online games segment was US$18.7 million, US$32.8 million and US$45.6 million, respectively. For the years ended December 31, 2006, 2007 and 2008, our consolidated net income was US$30.8 million, US$38.9 million and US$44.4 million, respectively.
22
Gaming Software and Service Business
We operate our gaming software and service business through CESL, our wholly-owned subsidiary. We offer online gaming solutions principally focused on the online poker and casino segments of the global online gaming industry. We partner with UIM, our largest licensee, to provide a multilingual, multi-product game platform, namely the Everest-branded gaming platform. On December 23, 2008, we entered into a strategic partnership with Victor Chandler with a view to driving cross-selling across the Everest-branded platform. Under the partnership, we and UIM currently market Victor Chandler’s online sports betting through Everest Bets, a sports betting affiliate website.
Our Products and Services
We primarily provide the software and services for the online poker rooms, casinos and the related marketing affiliate programs operated by UIM. Our online gaming solution is comprised of online gaming software, online gaming management tools, and application and consulting services.
Online Gaming Software for Players
Our major software products are downloadable game client software programs, or game clients, which provide an intuitive user interface for players to register, deposit and withdraw funds, play free and real money games, manage their accounts and profiles, and seek assistance. Our game clients process locally in each end-user’s computer and interact remotely with UIM’s gaming servers to display virtual poker rooms and casinos, generate a sequence of random numbers for game playing, and enable users to play poker and casino games through the Internet. To improve the usability of our software and the accessibility of our gaming platform for customers around the world, we localize our game clients to reflect the local languages and conventions. Our game clients are currently available in 15 supported languages, including Danish, Dutch, English, Finnish, French, German, Greek, Hungarian, Italian, Japanese, Norwegian, Polish, Portuguese, Spanish and Swedish. The game clients can be installed directly from websites. Patches and updates are provided automatically and apply to the product content each time the software programs start.
Our poker game client supports popular poker games, including Texas Hold’em and Omaha. All poker games are real-time and multi-player capable. The poker game client features 3D graphics and realistic visual effects.
Our casino game client supports a full range of traditional and new casino games, including blackjack, video poker, slots, roulette, solitaire and others. The game client can be skinned with different interfaces, enabling UIM to market casinos under a number of different brands and custom-branded casinos for its affiliates.
Online Gaming Management Tools
Our gaming management tools enable UIM to deliver high-quality end user support and operation management. We develop and offer an extensive set of gaming management tools, including an e-commerce system, marketing support tools and backoffice applications. Our e-commerce system accommodates a broad array of deposit and payment options such as credit card processors and various electronic wallet programs. The online cashier accounts can be opened in U.S. dollars. With the multiple payment processor gateway capabilities, our e-commerce system and support enable operators to handle the complexities of international markets.
Our marketing support tools can apply to both direct and affiliate marketing channels. We provide UIM with a highly integrated web-based promotion platform, which can be interactively edited through a content management system. Our web-based affiliate marketing application is available in 15 language versions and enables UIM and its affiliates to register on the website and utilize various promotion tools, including banner libraries and media servers for each of UIM’s game offerings.
Our back-office applications provide tools for e-commerce promotions, player accounts and customer support. The back-office platform also includes a sophisticated system that features data warehousing and management and business intelligence functions. These functions are designed to assist UIM in understanding and developing relationships with its game players. In addition, our gaming solution provides tools for preventing and detecting fraud and other irregularities during the games as well the e-commerce transactions.
23
Application and Consulting Services
In addition to licensing our software products, we also provide to UIM a variety of software application and support services. We endeavor to provide quality application and consulting services to enhance UIM’ ability to fully leverage the power of our software products in its online gaming operations. These services include:
| | • | | Infrastructure Design and Management Services. We provide the architectural design of various infrastructure elements, including the servers, databases, networks, routers, firewalls and management tools that are required for Internet gaming operations. As part of customer support, we also provide round-the-clock monitoring services to ensure the functionality and security of the infrastructure. |
| | • | | Transaction Processing Services. These services include (i) payment consultation for designing timely collection and distribution systems for payments through a variety of channels and merchants; (ii) billing consultation for designing real-time and out-of-band transaction processing and order management; and (iii) risk management consultation for creating and designing tools and processes for fraud detection, prevention and management. |
| | • | | Customer Support Services. We offer clients a comprehensive round-the-clock consultation support to resolve infrastructure issues. We also provide platform technical support during periodic maintenance to update, patch, and fine-tune the system performance of our software solutions. |
| | • | | Custom Gaming Software Development Services. We customize the entertainment modules and interfaces for the gaming platform to meet specific requests of UIM’s affiliates or partners. |
| | • | | Marketing Support Services. We create branded websites and provide marketing support services to assist UIM in attracting new players. |
Our Technology and Infrastructure
Our online gaming platform is based on a sophisticated transaction processing architecture that is designed to be flexible, extensible, scalable and secure. Composed of multiple fault-tolerant distributed modules, our backend infrastructure supports a wide range of functionality, including the server application program, loyalty program management, financial stored-value management, e-commerce engines, and an extensive set of tools to perform fraud screening, data mining, player support and affiliate marketing programs. The infrastructure is built on cost-effective and reliable technologies, incorporating software components from IBM, Oracle and SAP, as well as best-of-breed open source software resources.
Our real-time gaming server software enables integrated management of end user registration, account administration, deposit and transactions. By utilizing our software, end users on various platforms can communicate securely across Internet through multiple real-time gaming servers.
Our transaction server software encapsulates business logic and abstract data and third-party services, such as payment processors. This feature allows us to isolate the core processing module when the server system needs to be extended and effectively reduce the amount of extension work.
We intend to increase the player base and enhance cross-selling through development of a common wallet system, which will enable players to play across the games in our Everest-branded gaming platform as well as third party products with a single registration.
Relationship with UIM
License Arrangement with UIM
Our gaming software and services business is dependent on our largest licensee, UIM, an online gaming operator. On April 1, 2004, we entered into an end user license agreement with UIM, pursuant to which we granted a nonexclusive, non-transferable, worldwide license to UIM to use our software and certain operational and support services. The end user license agreement was amended on March 1, 2006 and March 1, 2007, respectively. The term of the agreement is 10 years. The license fees were determined based on a revenue sharing mechanism under the end user agreement, as amended. In addition to licensing software, we provide UIM with application services and consulting services for its Internet infrastructure, including website design, payment gateways and database and operating systems, in return for a fixed percentage of UIM’s gross receipt. The financial results of UIM were incorporated into our consolidated financial statements in accordance with FIN 46(R) although we do not own any equity interest in UIM.
24
UIM
UIM is an online entertainment operator that provides online gaming entertainments, including online casinos and virtual poker rooms. By utilizing our software, UIM offers these entertainment contents through several websites, including Everest Poker (www.everestpoker.com), which was named the Poker Operation of the Year for each of 2007 and 2008 by e-Gaming Review, a UK-based gambling magazine. UIM markets its game sites through two affiliate programs, including Affiliated Web Attractions (www.affiliatedweb.com) and Website Everest Affiliates (www.everestaffiliates.com), both of which are operated by utilizing our software. Under these programs, private and commercial owners of websites are invited to place on their websites banners containing links to UIM’s websites, in return for fees with reference to the number of qualified new player sign-ups, or based on revenues generated by users that have been directed to UIM’s website from such banners. UIM intends to phase out the Affiliated Web Attractions and use Website Everest Affiliates as the primary online marketing channels.
In March 2008, UIM secured a key multi-year promotional agreement to sponsor the World Series of Poker, or WSOP, a premier worldwide poker event. Pursuant to the terms of the agreement, Everest Poker will be the sole poker-related table sponsor of the WSOP and will enjoy a prominent logo position on all the table felt as well as the inner-rung of the final table used in WSOP competitions. Everest Poker will also be given other prominent on-site visibility during the events, including hanging banners and barricade logos. In the first year of sponsorship by Everest Poker, the 2008 WSOP was the largest in history with over 58,000 participants from 118 different countries and recorded for the most cashes with a prize pool of over US$180 million.
UIM operates exclusively from computer servers located in the Kahnawake Territory in Canada under a gaming license issued by the Kahnawake Gaming Commission, subject to continuing compliance with applicable licensing requirements. UIM has obtained a provisional gaming license issued by Malta Lotteries and Gaming Authority, subject to certain conditions, and is currently in the process of acquiring the full remote gaming license in Malta. See “ — Regulation — Regulation Relating to Online Gaming.”
Since we have no equity interest in UIM and do not exercise any control over it, the foregoing information with respect to UIM has been obtained from publicly available sources, and in part was provided to us by management and staff of UIM. Although we have no reason to believe the information above is inaccurate, we could not independently verify the accuracy of such information.
Competition
The Internet gaming software industry is characterized by rapid technological change. Our success depends, in part, upon our ability to enhance our products and services to keep pace with technological developments, respond to evolving customer requirements and achieve continued market acceptance.
We focus on developing software products and providing application services for online poker and casino operations. Our primary competitors include online gaming software design houses and application service providers, which provide gaming software, marketing tools and solutions, customer support tools and solutions, and e-commerce tools and solutions to online poker and casino sectors.
Given the low barriers to entry in the software industry and the increasing popularity of Internet-based businesses, there are a large number of potential competitors across many different segments of software and Internet industries. We potentially compete with a number of public and private companies, which provide Internet property architecture design/development, web design/development and online gaming software design/development. In addition, traditional ISPs and other entities may provide online gaming services in the future and engage in direct competition with us by developing and offering online gaming software solutions and tools. Some of them may have greater technical, marketing, financial and other resources, broader name recognition and more established relationships in certain geographic markets than we do.
We are also exposed to competition among UIM and other game operators in the online gaming industry, as our proceeds of the license fees are based on the gross receipt earned by UIM from its operations utilizing our software. UIM faces intense competition in the online gaming industry, which is characterized by low barriers to entry, rapid technological change and ever-changing consumer preferences. New entrants to the online gaming industry, increasingly competitive market consolidations and aggressive marketing and pricing by competitors may lead to a significant decline in the customer base, revenues and margins of UIM. In addition, online gaming industry is influenced by various other factors, including changes in policies and regulations and economic conditions in different jurisdictions. For example, as a result of the UIGEA and the subsequent closing of the online gaming market in the United States, UIM faces increased competition from entertainment service providers in markets in Continental Europe, which are also increasingly subject to regulation from governmental authorities. Furthermore, some of UIM’s competitors have greater experiences, resources and distribution capabilities.
25
To compete effectively against our existing competitors and new competitors in the future, we intend to continue to improve the principal competitive factors that we believe can keep us competitive, including brand, technology, financial stability and resources, regulatory compliance, independent oversight and transparency of business practices.
Online Games Business
Our Games
We offer an increasingly diversified portfolio of online games, including MahJong, MMORPGs, advanced casual games, and a variety of card, chance-based and simple casual games. Our online games business is operated in Taiwan and Hong Kong primarily through FunTown and in the PRC primarily through T2CN.
MahJong
MahJong is a traditional and highly popular Chinese tile game, which is widely played in Taiwan, Hong Kong, the PRC, Japan, South Korea and many other Asian regions. Similar to poker, MahJong involves skill, strategy, calculation, as well as certain degree of chance.
Through our FunTown-branded platform, we offer various local versions of MahJong for players in Asia, particularly for those from Taiwan and Hong Kong. To play our online MahJong games, players install the client-end software which can be downloaded free of charge from our game websites. Players can compete with anyone throughout FunTown network. Our MahJong games are designed for players of all levels of skills and experience. To accommodate various needs of players, we offer different online MahJong rooms based on skill levels or stakes. We believe our online MahJong game site is one of the largest online MahJong networks in Taiwan.
Players may play our online MahJong with a limited amount of free virtual currency. To continue to play on a regular basis and establish track record inside our online MahJong community, players may choose to purchase the game points or game-playing time through various distribution channels, such as convenient stores, telephones, computer-based payment processing terminals, and credit cards. By purchasing our game points, players may exchange for virtual currency and deposit into their virtual bank accounts. The virtual currency may be used to play MahJong and other games in the FunTown game site or to purchase in-game virtual items, but may not be redeemed for cash.
We continue to expand and diversify the game platforms for our online MahJong. In January 2009, in cooperation with Microsoft Corporation (“Microsoft”), we launched FunTown’s online MahJong on the Xbox 360 game consoles for worldwide release.
MMORPGs
MMORPGs are Internet-based computer games in which a large number of players interact with one another in an online virtual world. Like any role playing game, a player controls a character with an avatar, which he or she directs to complete tasks for experience, interact with other characters and acquire items.
26
Since 2006, we have expanded our online game operations to include several MMORPGs. We continue to enlarge and diversify our MMORPG portfolio, which includes five MMORPGs that we currently offer or expect to launch in various target markets in Greater China. Our MMORPGs encompass various genres, including adventure, action, war and casual fantasy. The following table summarizes the two MMORPGs that we offered as of the date of this annual report:
| | | | | | | | | | | |
| | | | | Commercial | | Game | | Revenue | | |
| Game | | Description | | Launch | | Source | | Model | | Market |
| Holic Online | | Cartoon style adventure | | January 2009 | | Licensed | | Item-billing | | Taiwan |
| | | | | | | | | | | |
Warhammer Online:
Age of Reckoning | | War | | June 2009 | | Licensed | | Pay-to-play | | Taiwan
Hong Kong
Macau |
The following table summarizes the MMORPGs which we expect to launch in various geographic markets in the near future:
| | | | | | | | | |
| Game | | Description | | Status | | Game Source | | Target Market |
| Luna Online | | Casual fantasy | | Close Beta Testing | | Licensed | | PRC |
| | | | | | | | | |
| XK Online | | Martial arts adventure | | Game Development | | In-house Developed | | PRC |
| | | | | | | | | |
| Holic Online | | Cartoon style adventure | | Game Localization | | Licensed | | PRC
Hong Kong
Macau |
| | | | | | | | | |
| Hellgate: London | | Dark fantasy themed action | | Game Localization | | Licensed | | Taiwan
Hong Kong
Macau |
Warhammer Online: Age of Reckoning is operated under the pay-to-play revenue model that requires the subscription or purchase of game cards by users. By subscribing or purchasing game cards, users may play for an unlimited amount of time within a specified number of days, or for a specified amount of time.
Our other MMORPGs are operated or expected to be operated under the item-billing revenue model. Under item-billing model, users are able to play the basic functions of a MMORPG for free. Players may choose to purchase in-game value-added services as well as in-game virtual items and premium features to enhance the game experience. These services and items allow players to utilize more functions, improve performance and skills, and personalize the appearance of a game character. Game points are consumed as users purchase value-added services and in-game items.
Advanced Casual Games
As compared to MMORPGs, advanced casual games have relatively simple rules and require no long-term commitment to play. They are targeted to the casual players across all the game genres.
We operate a diversified portfolio of advanced casual games. We believe that advanced casual games provide us with a broader range of players than MMORPGs, due to the casual nature and relatively short duration,
In Taiwan and Hong Kong, we offer various advanced casual games through FunTown. In June 2006, we launched our first advanced casual game, Tales Runner. Tales Runner is a multi-player obstacle running game in which players compete by running, jumping, dashing and using items. Since the launch, Tales Runner has become one of the most popular online sports games in Hong Kong. In December 2007, we launched Nanaimo, a cute style action-based casual game.
27
In the PRC, we operate our advanced casual games through T2CN. We currently operate Freestyle, a highly popular online basketball game in the PRC. Freestyle is a peer-to-peer street basketball game, in which players can form teams to compete against other teams and customize in-game character appearances and skills by purchasing virtual items. The cartoon characters and the scenes modes are embodied by full 3D graphics. Players improve the skills through more practice and competitions. We also offer Paipaijoy, another sports game, in the PRC. Going forward, we intend to leverage our well-established sports game platform to offer a wide range of advanced casual games in the PRC.
The following table summarizes our four advanced casual games that we offered as of the date of this annual report:
| | | | | | | | | | | |
| | | | | Commercial | | Game | | Revenue | | |
| Game | | Description | | Launch | | Source | | Model | | Market |
| Tales Runner | | Sports — Obstacle running | | June 2006 in Taiwan August 2006 in Hong Kong | | Licensed | | Item-billing | | Taiwan
Hong Kong |
| | | | | | | | | | | |
| Freestyle | | Sports — Basketball | | May 2007 | | Licensed | | Item-billing | | PRC |
| | | | | | | | | | | |
| Nanaimo | | Action | | December 2007 | | Licensed | | Item-billing | | Hong Kong |
| | | | | | | | | | | |
| Paipaijoy | | Sports — Tennis | | June 2008 | | Licensed | | Item-billing | | PRC |
We have secured an exclusive license from Electronic Arts Asia Pacific Pte. Ltd. to offer and operate NBA Street Online, an online basketball game featuring fast paced streetball action with star players of the NBA, in the PRC, Taiwan and Hong Kong. We expect to launch the game in the second half of 2009.
Players download and install client software from our websites. Our advanced casual games are offered free-of-charge to all players. In order to enhance their online game playing experience, players may purchase virtual items that enhance their characters’ performance and game playing experience, or personalize their characters.
Card, Chance-Based and Simple Casual Games
Through our FunTown-branded platform, we offer various online games, including card, chance-based and simple casual games. Most of these games are developed through adaptation of non-computer games, which are traditionally played offline. The FunTown platform targets players from different regions, particularly Taiwan and Hong Kong.
We provide many different online card games, which are popular in various regions in Asia. Players can select their desired table based on the level of skill or stakes. These games are designed with online multiplayer features that allow players to compete against one another. To diversify FunTown products, we also offer chance-based games, including bingo, lotto, horse racing, Sic-Bo, slots and various simple casual games.
Like online MahJong, players may play our FunTown games for free. They may choose to purchase playing time or virtual currency to play on a continuous and regular basis. Virtual currencies may be used to play all the games in the FunTown game site or to purchase virtual items, but may not be redeemed for cash.
Game Sources
In-house development of MahJong, Card, Chance-Based and Simple Casual Games
We develop our games offered on FunTown game platform, including online MahJong, card, chance-based and simple casual games. Our in-house development enables us to have better control of the game features and allow for seamless integration into our FunTown platform. In order to support product development capabilities and develop our proprietary online games, we have an in-house team, which was comprised of approximately 67 software engineers in Taipei and Shanghai as of May 31, 2009.
28
Sources of MMORPGs and Advanced Casual Games
We primarily source MMORPGs and advanced casual games through licensing from developers in various regions where online game development is more well established. We monitor each of the United States, South Korean, the PRC, Japanese and European markets and maintain communications with a number of leading game development studios to identify and source new online games.
In selecting games, we evaluate the key factors that indicate the market trend and player demand and interest in the regions where we operate. We believe that our market analysis enables us to better assess the quality, risks, costs and potential returns of the games.
Prior to negotiating a license agreement with a game developer, our game testing team evaluates the game and prepares detailed evaluation reports covering the theme, storyline, in-game culture and environment, character progression, system architecture, game art and design, virtual articles and items.
We enter into the license agreement after we decide to operate the selected game based on the evaluation result. The cost of licensing games from developers generally consists of an upfront licensing fee, which we normally pay in several installments, and ongoing licensing fees, or royalties, which are equal to a percentage of revenues generated from operation of the game. We may also have to provide certain minimum guarantee in royalties to developers.
In preparing for the commercial launch of each new game, we cooperate with the game developer to localize the game to make it suitable for the target markets where we plan to launch. Once the developer completes the localization and provides the first-built version, we conduct closed beta testing of the game with a select group of users. During the test period, we identify and eliminate any technical problems, assess how likely users will be to play the game regularly over a period of time (referred to as user “stickiness”), and modify and add certain game features in order to increase user stickiness. The closed beta testing is followed by open beta testing, during which we operate our games under open market conditions and monitor the performance, consistency and stability of operational systems for the game.
Following the commercial launch of a game, we continuously implement improvements and upgrades to our games.
While we will continue to broaden our access to high quality MMORPGs and advanced casual games through licensing, we intend to expand our in-house game development team and strengthen our online game development capabilities. We are currently testing XK Online, which is expected to be our first in-house developed MMORPG.
Our Primary Platforms and Services
FunTown
Our FunTown platform provides many online game services for the users to enhance their playing and entertainment experiences, facilitate information communication among them and support the development of a strong player community. These services include:
| | • | | Player Clubs. We offer online club services in the FunTown game community. FunTown players can form their own clubs, invite other players with similar interests or skill levels to join, and organize online and offline events for club members. Player clubs complement the strong social features of online games by helping to maintain an online game community. |
| | • | | Tournaments. As one of the key services, FunTown provides various tournaments for its online MahJong players. After players join a club, they can participate online in-club tournaments and compete in weekly online inter-club tournaments. On an annual basis, FunTown organizes large-scale tournaments, in which a large number of players are invited to the tournament premises and compete online via computers. |
| | • | | Avatars. To enhance players’ overall entertainment experience, FunTown offers many in-game virtual items which may be purchased by players to customize their online personal graphic profiles, or avatars. Players use avatars to create their own unique look while participating in the online community. The virtual items for avatars include facial expressions, clothes and different accessories. These items are particularly popular with younger players, who customize their avatars to establish unique identities and pursue distinct fashions in the online community. |
| | • | | Friends and Family Messenger. The FunTown platform has a unique function designed for players’ personal contacts, which is similar to the contact list of instant message programs. This enables players to see when their friends and family members are online and invite people in their personal network to play games together. |
29
| | • | | Social Networking. The FunTown platform provides an online social networking community called FunTown Village, in which players meet each other through their online avatars. In FunTown Village, players can interact and communicate, purchase virtual items, and even get married virtually. We plan to introduce more virtual items within FunTown Village to address the strong social interests of our players and to help increase FunTown’s overall appeal as a distinct online game community. |
| | • | | Game Masters. FunTown delegates game masters to provide various in-game services for our MMORPG players. Game masters are responsible for organizing in-game events, troubleshooting and actively and continuously monitoring the online game environment. They respond to players’ inquiries, handle error reporting and removal process, and identify and deter inappropriate player behaviors. We believe that the provision of game masters is an important customer service function to maintain customer loyalty and effectively address technical problems as they arise. |
| | • | | Customer Services. FunTown provides support and services to its customers primarily through walk-in customer service centers in Taipei and Hong Kong and e-mails and online bulletin boards where players can inquire and receive responses from us and other players. |
T2CN
Our T2CN platform provides the following services and player support to our users in the PRC:
| | • | | Membership Management. T2CN utilizes an integrated service platform, namely T2CN-Passport, to provide one-stop service to customers as well as distributors. T2CN-Passport is an integrated membership management and payment system, which allows T2CN to maintain a single customer database containing each customer’s profile and transaction history. Customers may log in, pay and use any of the fee-based products and services. In addition, T2CN-Passport allows our distributors to sell our game points to Internet cafés. Internet cafés can also use T2CN-Passport to check their point-balances and make payment on behalf of individual purchasers. |
| | • | | Social Networking. T2CN’s integrated system also incorporates a variety of online community features, such as bulletin boards which allow registered users to post notes or inquiries and respond to other users’ questions and comments. We believe these features increase the user stickiness on our site and facilitate player interaction. T2CN is currently building an online social networking community to further facilitate access to our online game offering and accommodate different social net working needs of our users in the PRC. |
| | • | | Game Masters. T2CN delegates game masters to provide various in-game services for our MMORPG players. Game masters are responsible for organizing in-game events, troubleshooting and actively and continuously monitoring the online game environment. They respond to players’ inquiries, handle error reporting and removal process, and identify and deter inappropriate player behaviors. |
| | • | | Customer Services. T2CN focuses on providing quality customer service in order to retain its existing customers as well as attract new customers. T2CN offers multiple communication channels, including telephone hotline and customer service email, for the customers to provide feedback and complaints about our products or services at any time. |
Non-Computer Based Platforms for Certain Games
As technologies advance and enable people to access the Internet in new ways, we plan to expand our offerings to match these new access technologies and platforms. We are currently working with Microsoft to develop and offer some of our games available on the Xbox 360 platform. In January 2009, we launched FunTown MahJong, our first Xbox 360 game title for worldwide release. We are in the process of offering certain of our popular games on the media-on-demand (“MOD”) digital TV platform, which involves the cooperation with Intel by utilizing its Viiv technology. In January 2009, FunTown Game Zone section was activated on the MOD system operated by Chungwa Telecom Co., Ltd. We expect FunTown Game Zone to be commercially launched in the second half of 2009. In addition, as the video games become an emerging facet of in-flight entertainment, we offer various in-flight games to certain airlines, which are networked to allow interactive game play among multiple passengers on the same flight. We do not expect the games offered through non-computer based platforms to contribute materially to our revenue in the near future.
30
Our Marketing
Our marketing strategy is to capitalize on our established brand names and utilize our diverse distribution networks to retain our existing users and attract new users. We use various qualitative and quantitative market research methods to analyze our target market and to differentiate our product offerings from those of our competitors. We are engaged in a variety of traditional and online marketing programs and promotional activities, including the following:
In-Game Events and Marketing
We organize in-game events for our users, which we believe encourages the development of online communication and teamwork among our users and increases user interest in our games. Examples of in-game events include scheduled challenges or competitions for prizes. In addition, we use in-game events to introduce new features of our games.
Cross-Marketing
We have cross-marketing relationships with popular consumer brands, major technology companies and telecommunication carriers. We believe that our cross-marketing relationships with certain well-known companies, including Coca-Cola, 7-11 and Microsoft, will increase the recognition of our online game brands.
Open Beta Testing
Our open beta testing is conducted under open market conditions. During open beta testing, we do not charge users to play the new game. Open beta testing serves important marketing functions, including instilling initial interests, establishing an initial user base, and generating word-of-mouth publicity to support the following commercial launch of the game.
Advertisements and Offline Promotions
We advertise our brand names and our games across a variety of media, including newspapers, the Internet, television, radio and outdoor advertisements. From time to time we distribute game-related posters, promotional prepaid cards for new users and souvenirs at trade shows, selected Internet cafés and other locations. We also conduct events at popular venues to stage exhibitions, distribute software and game content-related merchandise, and interact directly with our users.
Game Magazines
In addition to advertising certain games in various magazines, we also collaborate with certain game magazines for various promotions, including giving away copies of certain games free of charge with each magazine sold.
Direct Marketing
We use email correspondence to inform our users of new games, promotions and other game-related services.
Our Distribution and Payment Channels
We sell game points for our online games through various channels. Our distribution and payment channels include:
Offline Physical Distribution Channels
Physical distribution channels include convenience chain stores and Internet cafés. At these locations, users may purchase pre-paid game cards with varying amounts of game points. Alternatively, users may purchase game packs to play specific games on FunTown’s and T2CN’s game platforms.
Internet-Based Distribution Channels
Internet-based distribution channels consist of various websites, including official websites of FunTown and T2CN. Users may purchase game points through these websites with their credit cards or computer-based payment processing terminals.
31
Telecommunication Network Operators
We also distribute game points through cooperation with telecommunication network operators and their service providers. Our cooperating operators and service providers charge the fees to the purchasers’ phone bills, which are prepared and collected by the network operators.
Our Operation Architecture
We have a scalable and modular operation architecture that enables us to support and expand our game offerings and services. The architecture consists of several key subsystems, including game services, central user database, billing and payment, online customer service, game telemetry and monitoring. Both FunTown and T2CN have their own unified user account systems, which allow players to use a single account to access all FunTown games and T2CN games, respectively. Our billing and game management system supports various billing models and deposit options, and is sufficiently flexible to accommodate in-house developed games and licensed games. Our customer service system enables us to assist our players inside and outside the games. Our game telemetry and monitoring system allows us to track our concurrent online users in real time and effectively identify and fix technical problems in our server network.
Technology Infrastructure
Due to the real-time interaction among thousands of users, the stable operation of our MMORPGs and advanced casual games requires a significant number of servers and a significant amount of connectivity bandwidth. We have developed an extensive technology infrastructure that supports the operation of our online games.
As of December 31, 2008, we owned approximately 583 servers and leased 26 servers from ISPs for our online games operation in the PRC. As of the same date, our server network in the PRC consisted of approximately 487 game servers.
As of December 31, 2008, we owned approximately 489 servers and leased 2 servers from ISPs for our online games operation in Taiwan and Hong Kong. As of the same date, our server network in Taiwan and Hong Kong consisted of approximately 307 game servers.
We seek to adapt our infrastructure promptly in response to changing circumstances.
Our Players
In the PRC, as of December 31, 2008, we had an aggregate of over 84.4 million registered accounts of our online games. In the fourth quarter of 2008, we recorded over 335 thousand monthly average paying players and approximately 111 thousand peak concurrent users.
In Taiwan and Hong Kong, as of December 31, 2008, we had an aggregate of over 12.8 million registered accounts of our online games. In the fourth quarter of 2008, we recorded over 102 thousand monthly average paying players and approximately 38 thousand peak concurrent users.
Competition
Our primary competitors in the online games business are online game operators based in Taiwan and the PRC. Our major competitors in Taiwan include Gamania, Soft-World and IGS. Our major competitors in the PRC include NetEase, Shanda, Giant, Changyou, The9 Limited, Nineyou, Tencent, Ourgames.com and Chinagames.net.
In addition, we compete for users against various offline games, such as console games, arcade games and handheld games, as well as various other forms of traditional or other online entertainment.
We expect that more online games operating companies to enter in the markets where we operate, including Taiwan, the PRC and Hong Kong, and that a wider range of online games to be introduced to the these market given the relatively low entry barriers to the online games industry. Our competitors vary in size and include private and public companies, many of which have greater financial, marketing and technical resources as well as name recognition. We intend to continue to enhance our market position through providing competitive products and quality services that meet market trends and users’ preferences, as well as strengthening sales effectiveness.
32
Intellectual Property
We rely on a combination of patent, trademark, copyright and trade secret laws in the U.S. and other jurisdictions as well as confidentiality procedures and contractual provisions to protect our proprietary technology and our brand. We have patents, copyrights and trademarks in certain jurisdictions and may apply for further trademark and copyright registrations and additional patents, which may provide such protection in relevant jurisdictions. However, there is no assurance that this will be sufficient to fully protect our proprietary technology. In addition, our technologies may not be able to withstand any third-party claims or rights against their use.
We also enter into confidentiality and invention assignment agreements with our employees and consultants and confidentiality agreements with other third parties, and we rigorously control access to proprietary technology.
Regulation
Global Regulatory Environment Relating to Our Gaming Software and Services Business
We operate our gaming software and services business primarily through providing software solutions for online poker rooms, casinos and the related marketing affiliate programs operated by UIM and its sub-licensees. We earn fees from UIM based upon revenues earned by UIM from its operations utilizing our software.
We are incorporated in Singapore, and Singapore law does not prohibit us from providing software products and application services to online gaming operators. However, the end users of our software products, including the online gaming customers of UIM and its sub-licensees, are located around the world and it is, in many cases, uncertain which governments have authority to legislate or regulate different aspects of online gaming industries. Issues such as determining the physical location of an online gaming event as well as significant differences in the gaming laws and “Cyberlaws” of various countries all make traditional concepts of jurisdiction and conflicts of laws difficult to apply. Substantial uncertainties in the global regulatory environment relating to online gaming expose our Company to a real risk that regulatory authorities in various jurisdictions may determine that our gaming software and services business provides online gaming services (rather than only providing software and application services to UIM and its sub-licensees) and thus subject our Company to the gaming laws and regulations in those jurisdictions.
The Internet gaming industry is still at an early stage of development. The very nature of Internet gaming creates new and unique forms of entertainment that were neither contemplated nor feasible in the past. While many jurisdictions have some form of legal framework applicable to games of chance, few provide clear guidance on how this framework applies to the online gaming industry. Although governments around the world are increasingly seeking to regulate online gaming, the shifting political and economic landscape subject online gaming industry to significant uncertainties. As a result, it is difficult for us to assess whether our status as an application service provider to the online gaming industry, or the Internet gaming services provided by UIM, are in compliance with all laws and regulations of the jurisdictions where our gaming software products are used.
UIM currently holds a gaming license issued by the Kahnawake Gaming Commission in Canada. On December 1, 2008, Malta Lottories and Gaming Authority issued a letter of intent, which granted UIM a provisional remote gaming license, subject to certain conditions. UIM is currently in the process of acquiring the full remote gaming license in Malta. UIM primarily targets non-U.S. markets, predominantly in Continental Europe.
U.S. Regulations on Online Gaming
The U.S. government has been of the view that Internet gambling that crosses state boundaries is unlawful. Under the Wire Act of 1961, the Department of Justice has prosecuted online gambling operators in the United States. Under the Uniting and Strengthening America by Providing Appropriate Tools Required to Intercept and Obstruct Terrorism Act of 2001, both U.S. and non-U.S. banks that process online gaming transactions for U.S. persons may face potential criminal proceedings, as U.S. jurisdiction extends to non-U.S. banks that have correspondent accounts in the United States. Internet gambling activity also constitutes illegal gambling activity in all 50 U.S. states, including those states where other forms of gambling are legal.
33
Effective October 13, 2006, the UIGEA prohibits the use of communication facilities and financial transactions in connection with Internet gambling by restricting the payment methods for such activities and by imposing criminal penalties on Internet gambling businesses which accept wagers or payment in violation of such restrictions. The UIGEA criminalizes any gambling business which arises from using a communication facility to transmit bets or wagers, or to transmit information assisting in the placing of bets and wagers, to or from the United States, and prevents gambling businesses from accepting credit cards or other bank instruments in connection with illegal Internet gambling. The UIGEA also directs various federal agencies to implement regulations that would require financial institutions with electronic payment systems to establish policies and procedures to identify and block unlawful Internet gambling transactions, and creates judicial procedures through which federal agencies could obtain injunctions directing interactive computer services to remove or disable access to online sites that violate the law. The United States Treasury drafted UIGEA regulations in late 2007 and implemented the regulations on January 19, 2009. Financial institutions are not required to comply with the UIGEA regulations until December 1, 2009. The UIGEA regulations, however, did not define what specifically constitutes an unlawful Internet gambling transaction under UIGEA. Congressman Barney Frank has recently introduced the bill entitled the Payment System Protection Act, which would seem clarify, among other things, what constitutes unlawful Internet gambling transactions under UIGEA. Congressman Barney Frank has announced his intention to resubmit the bill in the upcoming congressional session.
Regulatory Environment in Europe
According to the Report on Integrity of Online Gambling by the Committee on the Internal Market and Consumer Protection of European Parliament, dated February 17, 2009, the European online gambling markets are regulated and the regulatory frameworks for the online gambling market in the European Union (“EU”) member states are very much heterogeneous.
Several European countries have adopted a regulated online gaming approach. Italy has recently introduced a new set of regulations on online gaming. In Italy, there is a general prohibition on casino-type games. Online poker tournaments, pari-mutuel betting on horseraces and sports events are legal provided that the game operators are licensed by the relevant authorities. The French government has recently published a draft gaming bill. The bill would establish a regulatory regime of online gaming in France starting January 1, 2010. The proposed new regime would allow private operators of sports betting, pari-mutual horserace betting and poker to offer their services online, provided they obtain a license from a new regulatory authority. The bill also included detailed provision of tax rates, the establishment of a regulatory agency, licensing requirements, and fines and prison sentences for illegal operators. Spain and Ireland have announced their intentions to introduce a regulatory framework on online gaming.
Some European countries, where there are state-owned gaming monopolies, have taken actions or introduced legislation aimed at banning foreign online gaming operators, which could have a material adverse effect on our licensees and consequently on our Company. Such actions were in contrast with rulings from the European Court of Justice, and have prompted the European Commission (“EC”) to explore the possibility of creating new legislation that could harmonize online gaming within the EU, in line with the EU’s principles regarding the European single market.
In Sweden, gambling is controlled by government-owned entities. As a result of a ruling by the European Court of Justice, which deemed Sweden and eight other EU state members as having restrictive gaming legislation, Sweden is currently in the process of creating new online gaming laws.
The Netherlands continues to threaten to enforce domestic laws that permit online gaming to be offered only by domestic government-controlled monopolies. In 2007, two government-owned online gaming operators in The Netherlands were under investigation by the EC for holding an alleged monopoly on the online gaming market in The Netherlands. In February 2008, the EC gave The Netherlands a final warning before court action is taken over their restrictions in the gambling market. As of May 31, 2009, no formal action has been taken against The Netherlands.
In Germany, the German Interstate Gambling Treaty came into force on January 1, 2008, an agreement that seeks a prohibition on the use of the Internet for all gambling services (except horserace betting). In January 2008, the EC requested information from Germany, explaining the new law. It was expected that the European Court of Justice would take action to oppose the ban. As of May 31, 2009, no formal action has been taken against Germany’s Interstate Gambling Treaty.
For additional information on the regulatory environment relating to online gaming, see Item 3, “Key Information — D. Risk Factors — Risks Related to our Business and Industries — The uncertain global legal and regulatory environment could have a negative impact on our gaming software and services business and prospects.”
34
Regulations Relating to Online Games in Taiwan
At present, there is no specific law in Taiwan governing online game services, nor are there any specific licensing requirements imposed on Internet content providers in connection with offering online game services. The National Communications Commission (the “NCC”) was established in March 2006. In December 2006, the NCC proposed the overhaul of the regulatory framework in the communications and broadcasting sectors by amending the Telecommunications Act, the Radio and Television Act, the Cable Radio and Television Act and the Satellite Radio and Television Act. Pursuant to the original proposal, the legislation at issue would be consolidated into a new legislative Act to be known as the Communications and Broadcasting Act. In December 2008, the NCC announced a change its policy, stating that it had decided to delay enacting the Communication and Broadcasting Act for two to four years.
Rating of Internet Content. The Government Information Office, which was the agency in charge of Internet content prior to establishment of the NCC, promulgated the Regulations for the Rating of Internet Content in April 2004, as amended in October 2005. In general, Internet content shall not include any illegal or banned materials. To avoid negative impact on the physical or mental development of children or adolescents, Internet content containing any of the following materials shall be rated as restricted and shall not be viewed by those below the age of 18: (i) excessive depiction of gambling, robbery or other criminal offenses; (ii) excessive depiction of suicide; (iii) depiction involving terror, blood or cruelty which is presented in an matter acceptable to adults; or (iv) depiction of sexual acts or sexual obscenity which does not embarrass or disgust adults in general. If Internet content is in violation of the Regulations for the Rating of Internet Content, competent authorities may order the relevant ISPs to restrict access to children or adolescents or remove the offending content and impose an administrative fine on the offenders.
Computer Software Ratings.The Ministry of Economic Affairs announced in July 2006 the Regulations Governing Computer Software Rating, which took effect in January 2007. Computer software includes the game software which can be installed in computers. The provider of computer software shall identify the rating of the computer software when it provides it to users. There are four ratings: (i) Mature Audience Only (not suitable for those below the age of 18); (ii) Parental Guidance Advisable (not suitable for those below the age of 12; parental guidance is advisable for those between the age of 12 to 18); (iii) Parental Guidance Strongly Suggested (not suitable for those below the age of 6; guidance from parents, teachers or adults is strongly suggested for those between the age of 6 to 12); and (iv) General Audience (suitable for all ages).
Online Game Contract Template.The Ministry of Economic Affairs and the Consumer Protection Commission have published a model contract template which sets out permitted terms and limitations with respect to online game services offered in Taiwan, pursuant to the Consumer Protection Act. Generally, consumers should be given at least three days to review such contract. Amendments or changes to fees payable for services offered must be publicly announced at least thirty days prior to such amendment, and notification provided to consumers. Consumer game records must be maintained by each online game operator for a minimum period of thirty days and shall be open to inspection by such consumers. Suspension periods for consumers who have breached the terms of their online game contracts may not exceed a period of seven days.
Regulations Relating to Online Games in the PRC
As the online games industry is at an early stage of development in the PRC, the PRC laws and regulations governing the online games industry and related business in the PRC involve substantial uncertainties and are subject to further changes. See Item 3, “Key Information — D. Risk Factors — Risks Related to Doing Business in Greater China — The laws and regulations governing the online games industry in the PRC are evolving and new regulations may adversely affect our business” in this annual report.
The principal PRC regulations governing the provision of Internet content and online gaming services include (among others) the Telecommunications Regulations (2000), the Administrative Rules for Foreign Investments in Telecommunications Enterprises (2001), the Administrative Measures for Telecommunications Business Operating Licenses (2001), the Tentative Measures for Administration of Internet Culture (2003), the Tentative Measures for the Administration of Internet Publications (2002), the Opinions on the Development and Management of Online Games (2005) and the Anti-Internet Addiction Regulations (2007).
35
Our provision of online games and online game-related content on our websites in the PRC is subject to various Chinese laws and regulations relating to the telecommunications industry, Internet and online games, and is regulated by various government and regulatory authorities, including:
| | • | | MIIT (formerly the Ministry of Information Industry); |
| | • | | the Ministry of Culture, or MOC; |
| | • | | the General Administration of Press and Publication, or GAPP; |
| | • | | the Ministry of Public Security; |
| | • | | the State Administration of Industry and Commerce, or SAIC; |
| | • | | the State Administration for Radio, Film and Television, or SARFT; |
| | • | | the State Council Information Office, or SCIO; and |
| | • | | the Ministry of Commerce, or MOFCOM. |
Foreign Ownership Restrictions
Current PRC laws and regulations impose substantial restrictions on the foreign ownership of companies that provide Internet content services in the PRC. Foreign investors are also restricted from owning equity in entities which provide Internet publications. In addition, foreign or foreign-owned enterprises are currently not able to apply for the required licenses for operating online games in the PRC. These licenses can only be held by domestic PRC persons. Under PRC law, we are not considered to be a domestic PRC person for this purpose. In order to comply with foreign ownership restrictions, we operate our online games business in the PRC through contractual arrangements with T2 Entertainment, T2 Advertisement and Jinyou, all of which are VIEs. For further information of our VIEs, see “ — C. Organizational Structure” in this annual report.
We believe that the ownership structure and business operation models of our PRC subsidiaries comply with all existing PRC laws, rules and regulations, and no consent, approval or license is required under any of the existing laws and regulations of the PRC for their ownership structure, businesses and operations, except those which we have already obtained or which would not have a material adverse effect on our business or operations as a whole. There are, however, substantial uncertainties regarding the interpretation and application of current or future PRC laws and regulations. Accordingly, we cannot assure you that PRC government authorities will ultimately take a view that is consistent with our view. See Item 3, “Key Information — D. Risk Factors — Risks Related to Doing Business in Greater China — PRC laws and regulations restrict foreign ownership and investment in the online game industry, and substantial uncertainties exist with respect to the application and implementation of PRC laws and regulations” in this annual report.
Licenses
As Internet content providers, our PRC operating companies are required to either hold ICP licenses issued by MIIT or be sublicensed by qualified ICP license holders. Internet content providers offering ICP services in multiple provinces, autonomous regions and centrally administered municipalities may be required to obtain an inter-regional ICP license. Since online games fall within the definition of “Internet culture products” under the Tentative Measures for Internet Culture Administration of 2003, a commercial operator of online games must, in addition to the ICP licenses, obtain an Internet culture operation license from MOC for its operation of online games, and foreign investors are restricted from owning equity in such entities. The provision of online games is also deemed an Internet publication activity, within the meaning of the Tentative Measures for Internet Publication Administration of 2002, and therefore, an online game operator must also obtain the approval of the relevant press and publication administrative authorities or cooperate with a licensed Internet publisher, as well as the appropriate licenses, in order to carry on its online games business in the PRC.
T2 Entertainment and Jinyou hold the ICP licenses, Internet culture operation licenses and other licenses that are required to operate our online games business in the PRC. T2 Advertisement holds advertising license that is required to sell advertisements on our websites in the PRC.
36
Online Games Regulations
In April 2007, eight PRC governmental authorities, including GAPP, MIIT, the Ministry of Education and the Ministry of Public Security, jointly promulgated the Notice on the Implementation of Online Game Anti-addiction System to Protect the Physical and Psychological Health of Minors, which requires online game operators to implement anti-addiction measures for users under eighteen years of age. Under this anti-addiction notice, the first three hours of game-playing time of a user are considered “healthy time”, the following two hours are designated “fatigue time” and any time spent playing beyond five consecutive hours is categorized as “unhealthy time”. Online game operators are required to establish anti-addiction system and develop software features on all existing online games to reduce “fatigue time” and “unhealthy time” such that, when a user has been playing in excess of specified periods of time, periodic in-game warnings will be sent to prompt the user to leave the game and the number of points or other benefits will be limited. Internet game operators are also required to develop identification verification system and registration software, which will require online game players to register their real identity information before they are allowed to play online games. Failure to comply with these requirements may subject the operator to penalties, including but not limited to suspension of operation of online games, revocation of operating licenses and approvals for operations, rejection or suspension of application for approvals, licenses, or filings for any new game, or prohibition of operating any new game. See Item 3, “Key Information — D. Risk Factors — Risks Related to Doing Business in Greater China — The laws and regulations governing the online games industry in the PRC are evolving and new regulations may adversely affect our business” in this annual report.
In addition, the current PRC law prohibits any online game products involving illegal money-collecting. On February 15, 2007, 14 governmental authorities, including the Ministry of Culture, the Ministry of Information Industry, the State Administration for Industry and Commerce, and PBOC, jointly issued the Circular for Further Strengthening the Administration of Internet Café and Online Games. This circular grants the PBOC administrative authority over virtual currencies issued by online game operators for use by players in online games to avoid the potential impact such virtual currencies may have on the real-world financial systems. The circular also restricts the volume of virtual currency that may be issued and the purchase of such virtual currencies. Virtual currency must not be used to purchase any physical products, refunded with a premium, or otherwise illegally traded. See Item 3, “Key Information — D. Risk Factors — Risks Related to Doing Business in Greater China — Restrictions on virtual currency may adversely affect our revenues from online game operations in the PRC” in this annual report.
Internet Content and Publishing Regulations
The PRC government has promulgated measures relating to Internet content through a number of ministries and agencies, including MIIT, MOC and GAPP. These measures specifically prohibit Internet activities, which includes the operation of online games that result in the publication of any content which is found to, among other things, propagate obscenity, gambling or violence, instigate crimes, undermine public morality or the cultural traditions of the PRC, or compromise State security or secrets. If an ICP license holder violates these measures, the PRC government may revoke its ICP license and shut down its websites.
Import Regulations
Our ability to license online games from abroad and import them into China is subject to various registration requirements under the relevant PRC laws and regulations. We are required to register with the MOFCOM any license agreement with a foreign licensor that involves imports of technologies, including online game software into China. Without that registration, we cannot remit licensing fees out of China to any foreign game licensor. The State Copyright Bureau requires us to register copyright license agreements relating to imported software. Without the State Copyright Bureau registration, we are not allowed to publish or reproduce the imported game software in China. Furthermore, imported online game software is also required to pass a content examination by the MOC. Any imported online game software, which has not been examined and approved by the MOC, is not allowed to be put into operation in China.
Information Security Regulations
Internet content in the PRC is regulated and restricted from a State security standpoint. The Standing Committee of the National People’s Congress, the PRC’s national legislative body, issued a decision in December 2000, according to which following conducts in China may be subject to criminal punishment in China any effort to: (i) gain improper entry into a computer or system of strategic importance; (ii) disseminate politically disruptive information; (iii) leak State secrets; (iv) spread false commercial information; or (v) infringe intellectual property rights. The Ministry of Public Security has promulgated measures that prohibit use of the Internet in ways which, among other things, result in a leakage of State secrets or a spread of socially destabilizing content. The Ministry of Public Security has supervision and inspection rights in this regard, and we may be subject to the jurisdiction of the local security bureaus. If an ICP license holder violates these measures, the PRC government may revoke its ICP license and shut down its websites. In addition, the MOC will censor online games that threaten state security, disturb the social order, or contain obscenity or violence.
37
Internet Café Regulation
Internet cafés are required to obtain a license from MOC and SAIC, and are subject to requirements and regulations with respect to location, size, number of computers, age limit of customers and business hours. Although we do not own or operate any Internet cafés, many Internet cafés distribute our virtual pre-paid game cards. The PRC government has announced its intention, and has begun, to intensify its regulation of Internet cafés, which are currently one of the primary venues for our users to play online games. In February 2004, the SAIC and other related government agencies issued a notice to suspend issuance of new Internet café licenses for a six month period. In February 2007, 14 PRC government authorities jointly issued a notice, which suspended approval for the establishment of new Internet cafés and called for strengthened regulation of existing Internet cafés. Intensified government regulation of Internet cafés could restrict our ability to maintain or increase our revenues and expand our customer base.
Privacy Protection
PRC laws do not prohibit Internet content providers from collecting and analyzing personal information from their users. We require our users to accept a user agreement whereby they agree to provide certain personal information to us. However, PRC law prohibits Internet content providers from disclosing to any third parties any information transmitted by users through their networks unless otherwise permitted by law. PRC government authorities have recently enacted legislation regarding the use of the Internet, which recognizes the importance of protecting personal information from unauthorized disclosure. Under the Internet Information Service Administrative Measures issued by the State Council on September 25, 2000, Internet information service providers are prohibited from producing, copying, publishing or distributing information that is humiliating or slanderous to others or that infringes the lawful rights and interests of others. If an Internet content provider violates these measures, the MIIT or its local bureaus may impose penalties, and the Internet content provider may be liable for damages caused to its users.
In addition, the PRC government retains the power and authority to order Internet content providers to turn over personal information of Internet users if the users post any prohibited content or engage in illegal activities on the Internet.
C. Organizational Structure
We were incorporated in Singapore as a company limited by shares on September 13, 1999. As of the date of this annual report, our principal operating subsidiaries include CESL, Hoshin GigaMedia, FunTown World Limited and T2CN. CESL, our wholly owned subsidiary incorporated in The British Virgin Islands, operates our gaming software and services business. CESL provides software solutions through Cambridge Interactive Development Corporation (“CIDC”), its wholly-owned subsidiary with principal offices located in the United States and Canada, and application services through Internet Media Licensing Limited (“IMLL”), its wholly-owned subsidiary with principal offices located in Canada. Hoshin GigaMedia, our wholly owned subsidiary incorporated in Taiwan, operates our online games business in Taiwan. FunTown World Limited, our wholly owned subsidiary incorporated in The British Virgin Islands, operates our online games business in Hong Kong and Macau. T2CN, our majority owned subsidiary incorporated in The British Virgin Islands, operates our online games business in the PRC.
Due to restrictions in the PRC on foreign equity ownership of companies providing Internet content services and certain other licensing restrictions, we operate the online games business in the PRC through our three VIEs, T2 Entertainment, T2 Advertisement and Jinyou, which hold the licenses required for the operation of our online games business in the PRC, and all of which are owned by PRC nationals. All of the three VIEs are controlled by T2CN though the following contractual arrangements:
| | • | | Each of the shareholders of T2 Entertainment has irrevocably granted T2CN Information Technology (Shanghai) Co., Ltd. (“T2 Technology”), the wholly-owned subsidiary of T2CN in the PRC, the power to exercise all of their voting rights of T2 Entertainment pursuant to the relevant voting rights and proxy agreement; |
| | • | | Each of the shareholders of T2 Advertisement has irrevocably granted T2 Technology the power to exercise all of their voting rights of T2 Advertisement pursuant to the relevant voting rights and proxy agreement; |
| | • | | Each of the shareholders of Jinyou has irrevocably granted T2 Technology the power to exercise all of their voting rights of Jinyou pursuant to the relevant voting rights and proxy agreement; |
| | • | | Our majority-owned subsidiary in China has the power to appoint all directors and senior management members of the three VIEs; |
| | • | | Each of the shareholders of T2 Entertainment has pledged all of their respective equity interests in T2 Entertainment as security for the full performance of their respective obligations under all of their agreements with T2 Technology; |
38
| | • | | Each of the shareholders of T2 Advertisement has pledged all of their respective equity interests in T2 Advertisement as security for the full performance of their respective obligations under all of their agreements with T2 Technology; |
| | • | | Each of the shareholders of Jinyou has pledged all of their respective equity interests in Jinyou as security for the full performance of their respective obligations under all of their agreements with T2 Technology; |
| | • | | Each of the shareholders of T2 Entertainment has granted T2 Technology an irrevocable option to acquire all or part of the equity interests held by them in T2 Entertainment pursuant to the relevant exclusive call option agreement, to the extent permitted by then-effective laws and regulations in the PRC; |
| | • | | Each of the shareholders of T2 Advertisement has granted T2 Technology an irrevocable option to acquire all or part of the equity interests held by them in T2 Advertisement pursuant to the relevant exclusive call option agreement, to the extent permitted by then-effective laws and regulations in the PRC; and |
| | • | | Each of the shareholders of Jinyou has granted T2 Technology an irrevocable option to acquire all or part of the equity interests held by them in Jinyou pursuant to the relevant exclusive call option agreement, to the extent permitted by then-effective laws and regulations in the PRC. |
In addition, through T2 Technology, we have entered into certain exclusive technical service agreements and exclusive commercial service agreements with T2 Entertainment, T2 Advertisement and Jinyou, respectively, under which T2 Technology provides various technical consulting services, business consulting services and other services to these VIEs in exchange for substantially all of their net incomes. See Item 3, “Key Information — D. Risk Factors — Risks Related to Doing Business in Greater China — PRC laws and regulations restrict foreign ownership and investment in the online game industry, and substantial uncertainties exist with respect to the application and implementation of PRC laws and regulations” and “ — B. Business Overview — Regulation — Regulations Relating to Online Games in the PRC — Foreign Ownership Restrictions” in this annual report.
39
The following organization chart and table set forth our business structure and selected information for each of our principal subsidiaries and VIEs as of the date of this annual report:
| | | |
| * | | Includes our principal operating subsidiaries only. All subsidiaries are 100% owned unless otherwise indicated. |
40
| | | | | | | | | | | | | |
| | | | | | | | | Our | | | |
| | | Year of | | | Place of | | Percentage | | | |
| Entity | | Incorporation | | | Incorporation | | Holding | | | Principal Activities |
| | | | | | | | | | | | | |
Held by our Company | | | | | | | | | | | | |
| GigaMedia International Holdings Limited | | | 2004 | | | British Virgin Islands | | | 100% | | | Holding company |
| Hoshin GigaMedia Center Inc. | | | 1998 | | | Taiwan | | | 100% | | | Online games |
Held by GigaMedia International Holdings Limited | | | | | | | | | | | | |
| Cambridge Entertainment Software Limited | | | 2004 | | | British Virgin Islands | | | 100% | | | Holding company |
| FunTown World Limited | | | 2005 | | | British Virgin Islands | | | 100% | | | Holding company |
| GigaMedia Asia Limited | | | 2005 | | | British Virgin Islands | | | 100% | | | Holding company |
| GigaMedia Asia Pacific Limited | | | 2006 | | | British Virgin Islands | | | 100% | | | Holding company |
| GigaMedia Finance International Limited | | | 2000 | | | Cayman Islands | | | 100% | | | Holding company |
| GigaMedia Global Limited | | | 2004 | | | British Virgin Islands | | | 100% | | | Online games |
| GigaMedia (HK) Limited | | | 2004 | | | Hong Kong | | | 100% | | | Holding company |
| Skyace Pacific Limited | | | 2006 | | | British Virgin Islands | | | 100% | | | Holding company |
| Centermax Limited | | | 2007 | | | British Virgin Islands | | | 100% | | | Holding company |
| GigaMedia Capital Limited | | | 2007 | | | British Virgin Islands | | | 100% | | | Holding company |
| GigaMedia Development Limited | | | 2007 | | | British Virgin Islands | | | 100% | | | Holding company |
| Giga Slam Dunk Corporation | | | 2007 | | | Malaysia | | | 100% | | | Online games |
| Giga Wartime Corporation | | | 2007 | | | Malaysia | | | 100% | | | Online games |
| E-Sports International Corporation Limited | | | 2008 | | | Hong Kong | | | 100% | | | Online games |
| GigaMedia SuperCup Holdings Limited | | | 2008 | | | British Virgin Islands | | | 100% | | | Holding company |
41
| | | | | | | | | | | | | |
| | | | | | | | | Our | | | |
| | | Year of | | | Place of | | Percentage | | | |
| Entity | | Incorporation | | | Incorporation | | Holding | | | Principal Activities |
| | | | | | | | | | | | | |
| Dragon Mark Holdings Limited | | | 2008 | | | British Virgin Islands | | | 100% | | | Holding company |
| Premier Vantage Holdings Limited | | | 2009 | | | British Virgin Islands | | | 100% | | | Holding company |
Held by FunTown World Limited | | | | | | | | | | | | |
| FunTown Hong Kong Limited | | | 1999 | | | Hong Kong | | | 100% | | | Online games |
Held by FunTown Hong Kong Limited | | | | | | | | | | | | |
| FunTown Software (Shanghai) Limited | | | 2006 | | | PRC | | | 100% | | | Online games |
Held by GigaMedia Asia Limited | | | | | | | | | | | | |
| GigaMedia China Limited | | | 2005 | | | British Virgin Islands | | | 100% | | | Holding company |
Held by Skyace Pacific Limited | | | | | | | | | | | | |
| Dragongate Enterprises Limited | | | 2006 | | | British Virgin Islands | | | 70% | | | Online games |
Held by Dragongate Enterprises Limited | | | | | | | | | | | | |
| GigaMedia Dragongate Limited | | | 2007 | | | Malaysia | | | 70% | | | Online games |
Held by Cambridge Entertainment Software Limited | | | | | | | | | | | | |
| Cambridge Interactive Development Corporation | | | 1997 | | | U.S.A. | | | 100% | | | Software development and
application services |
| Cambridge Interactive Development Corporation (Quebec) Inc. | | | 2005 | | | Canada | | | 100% | | | Financial and management services |
| Cambridge Interactive Development Co., Ltd | | | 2008 | | | United Kingdom | | | 100% | | | Software support services |
| Internet Media Licensing Limited | | | 2005 | | | British Virgin Islands | | | 100% | | | Software development and application services |
Held by Internet Media Licensing Limited | | | | | | | | | | | | |
| Apexstar Pacific Limited | | | 2007 | | | British Virgin Islands | | | 100% | | | Software development and application services |
42
| | | | | | | | | | | | | |
| | | | | | | | | Our | | | |
| | | Year of | | | Place of | | Percentage | | | |
| Entity | | Incorporation | | | Incorporation | | Holding | | | Principal Activities |
| | | | | | | | | | | | | |
Held by GigaMedia China Limited | | | | | | | | | | | | |
| T2CN Holding Limited | | | 2004 | | | British Virgin Islands | | | 66.29% | | | Online games |
Held by T2CN Holding Limited | | | | | | | | | | | | |
| J-Town Information Co. (Shanghai), Ltd. | | | 2005 | | | PRC | | | 66.29% | | | Online games |
| T2CN Information Technology (Shanghai) Co., Ltd. | | | 2004 | | | PRC | | | 66.29% | | | Online games |
Controlled by T2CN Information Technology (Shanghai) Co., Ltd. | | | | | | | | | | | | |
| Shanghai T2 Entertainment Co., Ltd. | | | 2004 | | | PRC | | | —* | | | Online games |
| Shanghai T2 Advertisement Co., Ltd. | | | 2006 | | | PRC | | | —* | | | Advertising |
| Shanghai Jinyou Network & Technology Co., Ltd. | | | 2007 | | | PRC | | | —* | | | Online games |
Held by Dragon Mark Holdings Limited | | | | | | | | | | | | |
| Wolverine Holdings Group Limited | | | 2009 | | | British Virgin Islands | | | 100% | | | Holding company |
| | | |
| * | | We have entered into a series of contractual arrangements through which we have effective control over these entities. |
D. Property, Plant and Equipment
Our headquarters are located on the 7th to 9th Floors, 207 Tiding Boulevard, Section 2, Taipei 114, Taiwan. As of May 31, 2009, our headquarters occupied approximately 35,398 square feet.
We also lease office and warehouse space, including space for our servers, in various other locations.
As of May 31, 2009, we leased approximately 8,992 square feet as office premises in Hong Kong.
As of May 31, 2009, we leased approximately 54,000 square feet as office premises for CESL’s head office in Cambridge, Massachusetts, U.S.A, and approximately 1,700 square feet as CESL’s additional office premises in Montreal, Quebec, Canada.
As of May 31, 2009, we leased approximately 47,137 square feet as office premises for FunTown’s head office in Taipei, Taiwan and approximately 4,831 square feet as office premises for FunTown’s office in Hong Kong. In addition, we leased approximately 1,265 square feet of warehouse space in Hong Kong.
As of May 31, 2009, we leased approximately 32,305 square feet as office premises for T2CN’s head office in Shanghai, the PRC.
43
ITEM 4A. UNRESOLVED STAFF COMMENTS
On July 31, 2008, we received a comment letter from the SEC related to various issues with respect to our annual report on Form 20-F for the year ended December 31, 2007 (File No. 000-30540). We responded to the SEC on September 12, 2008. Subsequently, on October 3, 2008, December 8, 2008, December 19, 2008 and February 19, 2009, we received additional comment letters from the SEC on these and other matters. We responded to these comment letters on November 14, 2008, January 20, 2009 and March 18, 2009, respectively, and provided the SEC with supplemental explanations and information requested by the SEC in these comment letters. On March 23, 2009, we received a letter from the SEC indicating it had no further comments.
ITEM 5. OPERATING AND FINANCIAL REVIEW AND PROSPECTS
A. Operating Results
Unless stated otherwise, the discussion and analysis of our financial condition and results of operations in this section apply to our consolidated financial statements as prepared in accordance with U.S. GAAP. You should read the following discussion of our financial condition and results of operations together with the financial statements and the notes to these statements included elsewhere in this annual report.
Overview
We are a holding company. We operate two principal businesses through our subsidiaries:
| | • | | Through our gaming software and service business, we develop and license online poker and casino gaming software solutions and application services, primarily targeting continental European markets. |
| | • | | Our online games business operates a portfolio of online games, primarily targeting online Greater China markets. |
In 2008, we recorded total operating revenues of approximately US$190.4 million, an increase of approximately US$38.6 million year-over-year, resulting from revenue growth in both business segments. Our gaming software and service business had an increase in operating revenues of approximately US$25.8 million year-over-year and online game business had an increase of approximately US$12.8 million. Our total costs and expenses increased by approximately US$38.0 million year-over-year to US$152.3 million. We recorded net income in 2008 of approximately US$44.4 million, an increase of approximately US$5.5 million year-over-year.
Gaming Software and Service Business. We operate our gaming software and service business through our subsidiary, CESL, and through its wholly-owned subsidiaries, CIDC and IMLL. Our gaming software and service business generated revenues of approximately US$144.8 million, gross profit of approximately US$122.0 million, and operating income of approximately US$36.4 million in 2008.
We are dependent on our licensee, UIM, whose financial results were incorporated into our consolidated financial statements pursuant to FIN 46(R) although we do not own any equity in UIM. See “ — A. Operating Results — Certain Significant Events Affecting Our Results of Operations for 2006, 2007 and 2008 — Consolidation of UIM, T2 Entertainment, T2 Advertisement, and Jinyou under FIN 46(R).” Under the terms of the licenses granted by us to UIM, we are entitled to a share of the revenues of such licensee, and as such, we bear certain economic risks with respect to, and derive certain economic benefits from, their operations.
44
Online gaming software design houses and application service providers are our primary competitors. However, given the low barriers to entry in the software industry and the increasing popularity of Internet-based businesses, there are a large number of competitors scattered throughout many different segments of the software and Internet industries. In addition to known current competitors, traditional gaming service providers and other entities, many of which have significant financial resources and name brand recognition, may provide online gaming services in the future, and thus become our competitors.
Faced with our known competitors, and most likely several new competitors which may be established in the near future, we will continue to focus on the principal competitive factors that we believe can differentiate our product offerings from those of our competitors, including: brand, technology, financial stability and resources, proven track record, regulatory compliance, independent oversight and transparency of business practices in our industry.
Online Games Business.We operate our online games business through FunTown and T2CN. We acquired FunTown in January 2006 and incorporated results of the business into our consolidated financial statements starting from January 1, 2006. We consolidated and incorporated T2CN’s operating results into our consolidated financial statements starting from June 1, 2007. Our online games business generated revenues of approximately US$45.6 million, a gross profit of approximately US$33.2 million, and operating income of approximately US$8.0 million in 2008.
In December 2006, we entered into a strategic alliance with Infocomm Asia, a Southeast Asia online games operator and distributor offering online games, including Granado Espada and Hellgate: London, both under exclusive license for most of Southeast Asia. We also secured an exclusive license to offer and operate Hellgate: London in Taiwan, Hong Kong and Macau. We will operate Hellgate: London through a strategic joint venture, Dragongate Enterprises, in which we hold a 70 percent interest and Cyber Gateway Pte. Ltd., a wholly-owned subsidiary of Infocomm Asia, holds the remaining 30 percent interest.
We also entered into strategic alliances with Neostorm, XL Games, and Access China in October 2007, December 2007, and January 2008, respectively. Neostorm was formed by the merger of four previously independent game development studios creating one of the largest independent game development companies in South Korea. Neostorm focuses on medium-core casual game titles. XL Games was founded by the creator of one of the most popular online game franchises in history and focuses on MMORPGs with studios in Seoul, South Korea and Austin, Texas. Access China is an online game software developer in the PRC. For additional information with respect to our acquisitions and investments, see Item 4, “Information on The Company — A. History and Development of Our Company” in this annual report.
Online casual game operators in Greater China are currently our primary competitors. We also compete with online casual game and MMORPG operators throughout Greater China. Given the low barriers to entry in the online game industry and the increasing popularity of Internet-based businesses, there are a large number of potential competitors scattered throughout many different segments of the software and Internet industries. In addition to the aforementioned competitors, traditional entertainment service providers and other entities, many of which have significant financial resources and name brand recognition, may provide online game services in the future, and thus become our competitors.
Faced with our known competitors, and most likely several new competitors which may be established in the near future, we will continue to improve the principal competitive factors that we believe can differentiate our product offerings from those offered by our competitors, including: brand, technology, financial stability and resources, proven track record, independent oversight and transparency of business practices in our industry.
Certain Significant Events Affecting Our Results of Operations for 2006, 2007 and 2008
Divestiture of Our ADSL Business
In May 2006, we sold our ADSL Internet access and service business to Webs-TV Digital International Corporation (“Webs-TV”). The total transaction price of approximately US$18.1 million consisted of a cash consideration of approximately US$8.9 million related to the sale of the ADSL business, and cash consideration of approximately US$9.2 million related to the provision of certain agreed upon services, including bandwidth, billing, and consulting services, and the right to use GigaMedia’s ADSL brand for a period of five years. See Note 25 to our consolidated financial statements for additional information. Cash proceeds in 2006 and 2007 from the sale of the ADSL business, net of transaction costs and VAT, were approximately US$3.3 million and US$4.9 million, respectively. The pre-tax one-time gain from the sale of the ADSL business was approximately US$7.7 million. Before we sold the remaining portion of the Internet access and service business in September 2008, we reported the ADSL business in continuing operations since the operations and cash flows of our ADSL business could not be clearly distinguished operationally and for financial reporting purposes from the rest of our Internet access and service business. As we have completed the sale of the Internet access and service business, see below, we are now reporting the ADSL business in discontinued operations.
45
Divestiture of Our Legacy Internet Access and Service Business
In September 2008, we sold the remaining portion of our Internet access and service business. We sold 100 percent of our wholly-owned subsidiaries, KBT and Hoshin Multimedia Center Inc. (“Hoshin Multimedia”), and disposed of certain assets and liabilities related to our Internet access and service business for a total transaction price of US$20.0 million.
The total transaction price was subject to adjustments following completion of a post-transaction audit. In March 2009, a transaction price adjustment was finalized and recorded as of December 31, 2008 based on the results of the post-transaction audit. The transaction price, net of transaction costs, price adjustment and cash transferred, was approximately US$16.5 million. The after-tax gain from the sale of the Internet access and service business was approximately US$9.8 million.
An amount of US$2.5 million of the transaction price was deposited into an escrow account established with the escrow agent for an agreed period, to be available for any price adjustment payment, severance payment, and indemnification payment set forth in the agreements. As of December 31, 2008, the escrow account balance was approximately US$2.1 million after payment of the severance payment. See Note 13 to our consolidated financial statements for more information. As of March 2009, the escrow amount was reduced to approximately US$1.0 million in accordance with the final results of the post-transaction audit.
In addition to the above purchase price, we may be entitled to receive additional cash payments of US$3.0 million and US$2.0 million if the Internet access and service business that we sold achieves certain earn-out targets by September 2009 and 2010. The earn-out targets will be determined by future gross profits in accordance with a formula and timeline set forth in the agreements.
Results for the Internet access and service operations are reported as discontinued operations in 2006, 2007 and 2008. In 2008, income from discontinued operations was US$9.4 million, which included an after-tax loss from the Internet access and service business of US$0.4 million and an after-tax gain on the sale of the business of US$9.8 million. See Note 1 to our consolidated financial statements for more information.
Summarized selected financial information for discontinued operations is as follows:
| | | | | | | | | | | | | |
| (in US$ thousands) | | 2006 | | | 2007 | | | 2008 | |
| | | | | | | | | | | | | |
| Revenue | | $ | 20,581 | | | $ | 15,164 | | | $ | 9,289 | |
| | | | | | | | | | |
| | | | | | | | | | | | | |
| Income (loss) from discontinued operations before tax | | $ | 6,290 | | | $ | 1,090 | | | $ | (593 | ) |
| Gain on sale of the discontinued operations before tax | | | 7,668 | | | | — | | | | 11,014 | |
| Income tax expenses | | | (1,026 | ) | | | (2 | ) | | | (986 | ) |
| | | | | | | | | | |
| Income from discontinued operations | | $ | 12,932 | | | $ | 1,088 | | | $ | 9,435 | |
| | | | | | | | | | |
Major classes of assets and liabilities which comprised the Internet access and service business at the date of disposal, September 2008, included the following:
| | | | | |
| (in US$ thousands) | | | | |
| Cash | | $ | 493 | |
| Accounts receivable | | | 2,325 | |
| Other current assets | | | 1,125 | |
| Property and equipment | | | 4,328 | |
| Other assets | | | 165 | |
| | | | |
| Total assets | | $ | 8,436 | |
| | | | |
| Accounts payable | | $ | 1,056 | |
| Other current liabilities | | | 759 | |
| Noncurrent liabilities | | | 672 | |
| | | | |
| Total liabilities | | $ | 2,487 | |
| | | | |
46
Consolidation of UIM, T2 Entertainment, T2 Advertisement, and Jinyou under FIN 46(R)
The financial statements of the following VIEs have been consolidated into our Company’s consolidated financial statements in accordance with FIN 46(R). Our Company entered into a software license and support service contract with UIM to provide Internet software support services for UIM’s online gaming operations. The contract allows for us to charge a percentage of UIM gross receipts resulting from UIM’s online gaming operations. The percentage of gross receipts varies depending upon the software and support services provided to UIM. We analyzed the provisions of FIN 46(R) as it relates to contractual relationships and determined that we were and continue to be a primary beneficiary of UIM. As a result of such determination, we have incorporated the results of UIM into our consolidated US financial statements even though we own none of UIM’s equity and recorded goodwill arising from the consolidation of UIM totaling US$209 thousand. The net assets, total assets and total liabilities of UIM were approximately US$933 thousand, US$52.6 million and US$51.7 million, respectively, as of December 31, 2007, and US$448 thousand, US$87.4 million and US$86.9 million, respectively, as of December 31, 2008. For the years ended December 31, 2006, 2007 and 2008, total revenue and net income (loss) of UIM were as follows:
| | | | | | | | | | | | | |
| (in US$ thousands) | | 2006 | | | 2007 | | | 2008 | |
| Total revenue | | $ | 55,019 | | | $ | 118,650 | | | $ | 144,765 | |
| | | | | | | | | | |
| Net income (loss) | | $ | 320 | | | $ | 348 | | | $ | (206 | ) |
| | | | | | | | | | |
Beginning in June 2007, we consolidated T2CN. Pursuant to various agreements entered into between T2CN, T2 Entertainment, T2 Advertisement and the equity owners of T2 Entertainment and T2 Advertisement, T2CN generally has control and the risks and rewards of ownership of T2 Entertainment and T2 Advertisement and is further considered the primary beneficiary of T2 Entertainment and T2 Advertisement. T2 Entertainment and T2 Advertisement were established to hold the necessary licenses for our participation in online game and related advertisement services in the PRC. Accordingly, from the date that we consolidated T2CN, the results of T2 Entertainment and T2 Advertisement have been included in the accompanying consolidated financial statements.
In November 2007, T2CN entered into various agreements with Jinyou and the equity owners of Jinyou. The agreements provided for T2CN to obtain conditional effective and enforceable clauses upon acquiring an ICP license by Jinyou. Jinyou was established to hold the necessary licenses for our participation in online games in the PRC. In September 2008, Jinyou acquired the ICP license and the above agreements became effective. T2CN generally has control and the risks and rewards of ownership of Jinyou and is considered the primary beneficiary of Jinyou. Accordingly, the results of Jinyou are included in the accompanying consolidated financial statements starting from September 2008.
As of and for the years ended December 31, 2007 and 2008, the net assets, total assets, total liabilities, total revenue and net income in the aggregate of T2 Entertainment, T2 Advertisement and Jinyou were as follows:
| | | | | | | | | |
| (in US$ thousands) | | 2007 | | | 2008 | |
| Net assets | | $ | 178 | | | $ | 3,258 | |
| | | | | | | |
| Total assets | | $ | 11,666 | | | $ | 17,524 | |
| | | | | | | |
| Total liabilities | | $ | 11,488 | | | $ | 14,265 | |
| | | | | | | |
| Total revenues | | $ | 14,973 | | | $ | 20,312 | |
| | | | | | | |
| Net income | | $ | 2,429 | | | $ | 1,571 | |
| | | | | | | |
See Item 3, “Key Information — D. Risk Factors — Risks Related to Doing Business in Greater China — The contractual arrangements with T2 Entertainment, T2 Advertisement and Jinyou and their shareholders may not be as effective in providing operational control as direct ownership” in this annual report.
47
Acquisitions
FunTown
On December 19, 2005, we entered into a definitive agreement with TWP to acquire FunTown in order to establish our position in the online games market. This primary factor, among others, contributed to a purchase price in excess of the fair market value of the net tangible assets and intangible assets acquired. In January 2006, we completed the acquisition of FunTown and purchased certain assets and assumed certain liabilities of FunTown for a total consideration of approximately US$43.0 million, which included cash payments of approximately US$27.2 million and zero coupon convertible notes in the aggregate principal amount of approximately US$15.0 million with a valuation premium on the convertible notes of approximately US$756 thousand. In 2007, we made an additional incentive payment of approximately US$4.8 million, net of VAT, an amount determined based on the adjusted pre-tax income of FunTown in 2006 as compared to 2005.
In connection with the acquisition of FunTown, we recorded goodwill of US$26.2 million, which was assigned to our online games business. Such amount of goodwill is deductible for tax purposes. Since the completion of the acquisition on January 2, 2006, FunTown’s operating results have been included in our consolidated financial statements under the online games business. The identified intangible assets (other than the trade name and trademark) are being amortized on a straight-line basis over their useful lives ranging from five to nine years, and the overall weighted-average life is 7.47 years.
T2CN
Beginning in June 2007, we consolidated T2CN. We acquired T2CN in order to enhance our position in the online games market in Asia. This primary factor, among others, contributed to a purchase price in excess of the fair market value of the net tangible assets and intangible assets acquired. As of May 31, 2009, we owned 43,113,681 common shares of T2CN, which represents a controlling interest of 66.29 percent of the total outstanding voting rights of T2CN.
The following summarizes the key stages in our acquisition of T2CN:
2006
In April 2006, our Company entered into a strategic investment agreement with T2CN, pursuant to which we made an investment of US$15.0 million to acquire 7,500,000 voting preferred shares convertible into 7,500,000 common shares, or 19.02 percent interest in T2CN.
2007
In February 2007, we made an additional investment of US$19.3 million to acquire 18,118,926 common shares of T2CN, representing a 39.87 percent holding in T2CN’s common shares. The investment in T2CN was accounted for under the equity method. The first payment was paid on February 12, 2007, which consisted of approximately US$9.4 million, including related costs, in cash and 173,814 shares of common stock of GigaMedia, valued at approximately US$2.1 million. The value of the 173,814 common shares issued was determined based on the market price of GigaMedia’s common shares at the time the terms of acquisition were agreed to and the number of shares became fixed. The remaining purchase price of US$7.8 million was paid in cash on August 15, 2007.
In May 2007, we acquired additional 7,500,000 convertible preferred shares of T2CN for all-cash consideration of US$75 thousand, pursuant to our exercise of the rights stated in a shareholder agreement which we entered into with T2CN and certain of its shareholders in April 2006, which was amended and restated in November 2006. We were granted rights to subscribe for additional convertible preferred shares of T2CN based on the financial performance of T2CN during each of the twelve-month periods ending March 31, 2007 and December 31, 2007.
48
In June 2007, we entered into a voting trust agreement with a shareholder of T2CN, pursuant to which we obtained an additional 1.28 percent of the outstanding voting rights of T2CN. This voting trust agreement expired August 31, 2007.
In July 2007, we converted our 15,000,000 convertible voting preferred shares of T2CN into 15,000,000 common shares. We also acquired an additional 5,494,755 common shares of T2CN for approximately US$3.7 million in cash and 52,571 shares of common stock of GigaMedia, valued at approximately US$656 thousand. The value of the 52,571 common shares issued was determined based on the market price of GigaMedia’s common shares at the time the terms of acquisition were agreed to and the number of shares became fixed.
In connection with the acquisition, we recorded goodwill of US$29.4 million. Such goodwill amount is non-deductible for tax purposes. Since June 1, 2007, results of T2CN’s operations have been included on our consolidated financial statements under the online game business. The identified intangible assets are being amortized on a straight-line basis over their useful lives of 3.5 years.
2008
In May 2008, we acquired 4,500,000 additional common shares of T2CN for all-cash consideration of US$3.4 million.
In connection with the purchase of additional common shares of T2CN, we recorded additional goodwill of US$1.7 million. Such goodwill amount is non-deductible for tax purposes. We also recorded additional identified intangible assets of US$136 thousand which are being amortized on a straight-line basis over their useful lives of three years.
In addition, T2CN bought back and cancelled part of its common shares owned by independent third parties for US$1.3 million during 2008, resulting in an increase of our ownership interest in T2CN, and we recorded additional goodwill of US$511 thousand.
These additional acquisitions of T2CN in 2008 were not material to our consolidated financial statements as a whole.
Subsequent Events
In January 2009, we entered into a three-year game license agreement with a third-party online game developer with respect to the licensing of an online game titled “Luna Online” in the PRC including Macau, but excluding Hong Kong and Taiwan. Under the agreement, we agreed to pay a fixed license fee by installments, starting from January 2009. The game license fee is payable in addition to royalties and other committed marketing expenditures.
Critical Accounting Policies
The discussion and analysis of our financial condition and results of operations are derived from our consolidated financial statements, which have been prepared in accordance with accounting principles generally accepted in the U.S., or U.S. GAAP. The preparation of these financial statements requires us to make estimates and assumptions that affect the reported amounts of assets, liabilities, revenues and expenses, and the related disclosure of contingent assets and liabilities as of the date of the consolidated financial statements. We continually evaluate our estimates and assumptions, which are based on historical experience and other various factors that we believe are reasonable under the circumstances. The results of these estimates and assumptions form the basis for making judgments about the carrying values of certain assets and liabilities. Our actual results could differ significantly from those estimates under different assumptions and conditions. We believe that the following discussion addresses the most critical accounting policies applicable to our Company, which are those that are most important to the portrayal of the financial condition and results of operations of our Company, and require management’s most difficult, subjective and complex judgments, often as a result of the need to make estimates about the effect of matters that are inherently uncertain.
49
Consolidation
The consolidated financial statements include the accounts of GigaMedia and our wholly-owned and majority-owned subsidiaries after elimination of all inter-company accounts and transactions. In addition, the accounts of our VIEs as defined by FIN 46(R) are included in the consolidated financial statements. See Note 3 to our consolidated financial statements for additional information. The accounting policies for other less than majority-owned investments are described in Note 1 to our consolidated financial statements in the paragraphs headed “Marketable Securities” and “Investments.”
Acquisitions
Our Company has accounted for its business acquisitions using the purchase method as required by Statement of Financial Accounting Standards (“FAS”) No. 141, “Business Combinations” (“FAS 141”). Under FAS 141, the acquiring company allocates the purchase price to the assets acquired and liabilities assumed based on their estimated fair values at the date of acquisition, including intangible assets that can be identified. The purchase price in excess of the fair value of the net assets and liabilities identified is recorded as goodwill, for which the provisions of FAS No. 142, “Goodwill and Other Intangible Assets” (“FAS 142”) apply. Business acquisitions that our Company enters into in the future will be accounted for in accordance with FAS No. 141(R).
Revenue Recognition
Our Company recognizes revenues when persuasive evidence of an arrangement exists, delivery occurs or services are rendered, the sales price is fixed or determinable and collectability is reasonably assured. We present the sales taxes assessed by governmental authorities on our revenue transactions on a net basis in our consolidated financial statements.
Our Company enters into multiple-element revenue arrangements, which may include any combination of services, software, and/or products. To the extent that a deliverable in a multiple-element arrangement is subject to specific guidance, whether and/or how to separate multiple deliverable arrangements into separate units of accounting (separability) and how to allocate the arrangement consideration among those separate units of accounting (allocation) for that deliverable is accounted for in accordance with such specific guidance. All other deliverables in multiple-element arrangements are accounted for in accordance with Emerging Issues Task Force (“EITF “) 00-21, “Revenue Arrangements with Multiple Deliverables”.
In addition to the aforementioned general policies, the following are the specific revenue recognition policies for each major category of revenue.
Gaming Software and Service Revenues
Gaming software and service revenues are related to software products we develop and license and support services we provide for online real-money gaming solutions and applications.
Under the provisions of FIN 46(R), the results of a software licensee of our Company, UIM have been incorporated into our consolidated financial statements. UIM and GigaMedia are separately owned. See Note 3 to our consolidated financial statements for more information. Our software licensing and support service revenues are based upon a percentage of gross receipts generated by UIM’s online gaming operations, and are recognized monthly. Software licensing and support service revenues we receive from providing such services to UIM have been eliminated in consolidation.
UIM generates revenues by providing and promoting online games of skill and chance that are available on its free download gaming software. Multiple-element revenue arrangements involving UIM’s provision of software and software-related elements to customers are accounted for in accordance with the American Institute of Certified Public Accountants (“AICPA”) Statement of Position (“SOP”) No. 97-2, “Software Revenue Recognition” (“SOP 97-2”). UIM’s online gaming service is inseparable from the software element involved and UIM does not sell each element separately. UIM’s online gaming service does not involve significant production, modification, or customization of the gaming software. Revenues derived from UIM’s online gaming software platform, which were included in our consolidated financial statements in accordance with FIN 46(R), are recognized at the time games are played and are net of player winnings. Transaction fee revenues derived from UIM’s online multi-player poker platform are recognized as services are provided.
50
Online Game and Service Revenues
Online game and service revenues are related to our online game business that operates play-for-fun games online in Asia.
Online game revenues are earned through the sale of online game points, pre-paid cards, and game packs. Virtual online game points are sold directly to end-users who can make the payments through credit cards, the Internet ATMs or telecommunication service operators. Physical pre-paid cards and game packs are sold through distributors and convenience stores. Proceeds from sales of physical cards and game packs, net of sales discounts, and online game points are deferred when received and revenue is recognized upon the actual usage of the playing time or in-game virtual items by the end-users; over the estimated useful life of virtual items; or when the sold game points expire and can no longer be used to access the online games or products in accordance with our published game points expiration policy.
In accordance with EITF 99-19, “Reporting Revenue Gross as a Principal Versus Net as an Agent”, we report sales of virtual online game points on a gross basis. In the sales of virtual online game points, we act as principal and we have latitude in establishing price. Fixed percentage fees retained by service providers for payment processing related to our online game services are recognized as cost of online game revenues.
Online game and service revenues also include revenues derived from online advertising arrangements, sponsorship arrangements, or a combination of both. These service arrangements allow advertisers to place advertisements on particular areas of our Company’s websites and online game platforms over a stated period of time. Service revenues from online advertising arrangements are recognized ratably over the displayed period of the contract when the collectability is reasonably assured.
Discontinued Operations
For 2006, 2007 and 2008, a portion of our Company’s revenues was generated from our Internet access and service business. We disposed of the remaining portion of our Internet access and service business in September 2008, and as a result have classified the income from these revenue-generating activities as part of discontinued operations. See Note 4 to our consolidated financial statements for additional information.
Our Internet access and service business revenues consisted of cable modem, ADSL, and corporate Internet and access services provided by us. Cable modem, ADSL, and corporate Internet access revenues were recorded net of discounts, and in the case of our cable modem and corporate services, net of fees paid to our cable partners in accordance with revenue sharing agreements in effect between our Company and our cable partners. Any advanced payment receipts were recorded as deferred revenues included in other current liabilities in our consolidated balance sheets and were amortized over the subscription period.
All the Internet access and service revenues were recognized on a straight-line basis over the subscription period or for the period in which the service was performed if no significant outstanding obligations of our Company remained and collection of the receivables was reasonably assured. The sale of other Internet access-related products and rental income from the lease of Internet access-related equipment to subscribers of our Company’s Internet access and service business were recognized when products were delivered or services were provided.
Player Account Balances
Player account balances are related to player deposits from our gaming software and service business. Player account balances are presented as current liabilities, which are first accrued for in full upon the receipt of player deposits, and increased or decreased based on player activities, including player wins or losses, withdrawals and refunds.
51
Deferred Revenues
Deferred revenues are included in other current liabilities, and consist of the prepaid income related to our online game business, and the advance payment receipts related to our Internet access and services business, which we sold in September 2008 See Note 4 to our consolidated financial statements for additional information.
Operating Costs
Operating costs primarily consist of gaming software and online game processing costs, online game royalties, production costs for prepaid game cards and game packs, amortization of intangible assets, customer service department costs for our online games, and depreciation, maintenance and other overhead expenses directly attributable to our gaming software and service revenues and online game and service revenues.
Prepaid Licensing and Royalty Fees
Our Company, through our subsidiaries and VIE subsidiaries, entered into several license agreements with licensors to acquire licenses for the using, marketing, distributing, selling and publishing of multi-player online games.
Prepaid licensing fees paid to licensors are capitalized when technological feasibility is achieved, and amortized on a straight-line basis over the shorter of the useful economic life of the relevant online game or license period, which is usually within two to five years. The annual amortization shall be modified if the amount computed using the ratio that current gross revenues for a game license bear to the total of current and anticipated future gross revenues for that game license is greater than the amount computed using the straight-line method.
Prepaid royalty fees and related costs are recognized in the period in which the related online game revenue is recognized.
Fair Value Measurement
Effective January 1, 2008, we adopted the provisions of FAS No. 157 “Fair Value Measurements” (“FAS 157”), which defines fair value as the exchange price that would be received to sell an asset or paid to transfer a liability (an exit price) in the principal or most advantageous market for the asset or liability in an orderly transaction between market participants at the measurement date. FAS 157 establishes a three-level fair value hierarchy that prioritizes the inputs used to measure fair value. Observable inputs obtained from sources independent of the reporting entity are classified within Level 1 and 2 of the hierarchy, and unobservable inputs based on our Company’s own assumptions are classified within Level 3 of the hierarchy.
We also adopted the provisions of FAS No. 159, “The Fair Value Option for Financial Assets and Financial Liabilities” (“FAS 159”) on January 1, 2008. FAS 159 requires that unrealized gains and losses on items for which the fair value option has been elected be reported in earnings. We did not elect to apply the fair value option to any financial instruments or other items upon adoption of FAS 159. As a result, the adoption of FAS 159 did not impact our consolidated financial position, results of operations, or cash flows.
Our Company measures fair value as an exit price using the procedures described below for all assets and liabilities measured at fair value. When available, our Company uses unadjusted quoted market prices in active markets to measure fair value and classifies such items within Level 1. If quoted market prices in active markets are not available, fair value is based upon internally developed models that use, where possible, current market-based or independently-sourced market parameters such as interest rates and currency rates. Items valued using internally generated models are classified according to the lowest level input or value driver that is significant to the valuation. Thus, an item may be classified in Level 3 even though there may be certain inputs that are readily observable. If quoted market prices are not available, the valuation model used generally depends on the specific asset or liability being valued. The determination of fair value considers various factors including interest rate yield curves and time value underlying the financial instruments.
52
Our Company has segregated all financial assets and liabilities that are measured at fair value on a recurring basis (at least annually) into the most appropriate level within the fair value hierarchy based on the inputs used to determine the fair value at the measurement date in the table below. FASB Staff Position (“FSP”) FAS 157-2 “Effective Date of FASB Statement No. 157” (“FSP 157-2”) delayed the effective date for all nonfinancial assets and liabilities until January 1, 2009, except those that are recognized or disclosed at fair value in the consolidated financial statements on a recurring basis.
Financial assets and liabilities measured, as of December 31, 2008, at fair value on a recurring basis are summarized as below:
| | | | | | | | | | | | | | | | | | | | | | | | | | | | | |
| | | December 31, 2008 | |
| Assets | | Level 1 | | | Level 2 | | | Level 3 | | | Fair Value
Measurements | |
| | | | | | | % of | | | | | | | % of | | | | | | | % of | | | | |
| | | | | | | total assets | | | | | | | total assets | | | | | | | total assets | | | | |
| | | | | | | measured at | | | | | | | measured at | | | | | | | measured at | | | | |
| | | Amount | | | fair value | | | Amount | | | fair value | | | Amount | | | fair value | | | Amount | |
| Cash equivalents — time deposits | | $ | — | | | | — | | | $ | 12,512 | | | | 29.8 | % | | $ | — | | | | — | | | $ | 12,512 | |
| Marketable securities — current | | | — | | | | — | | | | 3,419 | | | | 8.2 | % | | | — | | | | — | | | | 3,419 | |
| Marketable securities — noncurrent | | | — | | | | — | | | | — | | | | — | | | | 26,041 | | | | 62.0 | % | | | 26,041 | |
| | | | | | | | | | | | | | | | | | | | | | |
| Total | | $ | — | | | | — | | | $ | 15,931 | | | | 38.0 | % | | $ | 26,041 | | | | 62.0 | % | | $ | 41,972 | |
| | | | | | | | | | | | | | | | | | | | | | |
Cash equivalents — time deposits were convertible into a known amount of cash and are subject to an insignificant risk of change in value. Marketable securities — current were valued using a market approach based on the quoted market prices of identical instruments when available or other observable inputs such as trading prices of identical instruments in inactive markets. The fair value of the marketable securities — noncurrent was derived using a discounted cash flow method, which incorporates available market discount rate information and our estimates of non-performance and liquidity risk. Once calculated, the fair value was then allocated to the class of shares we purchased by using the Option-Pricing Method. The major assumptions used in the Option-Pricing Model included volatility which was calculated based on reference to the industry average, and expected life which was determined based on the expected timing of triggering events.
For financial assets and liabilities measured at fair value on a recurring basis using significant unobservable inputs (Level 3) during 2008, a reconciliation of the beginning and ending balances are presented as follows:
| | | | | |
| | | Fair Value Measurements Using | |
| | | Significant Unobservable Inputs | |
| | | (Level 3) | |
| | | Marketable Securities-Noncurrent | |
| Beginning Balance | | $ | 21,018 | |
| Total gains or losses (realized/unrealized) | | | | |
| Included in earnings | | | — | |
| Included in other comprehensive income | | | — | |
| Purchases and settlements | | | 5,023 | |
| Transfer in and/or out of Level 3 | | | — | |
| | | | |
| Ending Balance | | $ | 26,041 | |
| | | | |
| | | | | |
| The amount of total gains or losses for the period included in earnings attributable to the change in unrealized gains or losses relating to assets still held at the reporting date | | | None | |
| | | | |
There were no gains or losses (realized or unrealized) included in earnings for the year ending December 31, 2008; therefore, there was no impact on our results of operations, liquidity or capital resources in 2008.
53
Investments other than marketable securities are valued on a nonrecurring basis when deemed necessary, using other observable inputs such as trading price of different class of the share or using discounted cash flows, incorporating available market discount rate information and our estimates for non-performance and liquidity risk.
The carrying amounts of our Company’s cash, accounts receivable, accounts payable, and short-term debt approximate fair value due to their short-term maturities.
Allowance for Doubtful Accounts
An allowance for doubtful accounts is provided based on an evaluation of the collectability of notes receivable, accounts receivable, and other receivables. An allowance for doubtful accounts is also provided, when considered necessary, to loans receivable. We review the collectability of loans receivable on an individual basis and the evaluation primarily consists of an analysis based upon current information available about the borrower.
For those accounts in which a loss is probable, we record a specific reserve. Receivable losses are charged against the allowance when we believe the uncollectability of the receivable is confirmed. Subsequent recoveries, if any, are credited to the allowance.
Marketable Securities
All of our Company’s investments in marketable securities are classified as available-for-sale. Available-for-sale marketable securities are accounted for in accordance with FAS No. 115 “Accounting for Certain Investments in Debt and Equity Securities” (“FAS 115”). These marketable securities are stated at fair value with any unrealized gains or losses recorded in accumulated other comprehensive income (loss) in shareholders’ equity until realized.
Other-than-temporary declines in market value from original cost, if any, are charged to non-operating income and expense in the period in which the loss occurs. In determining whether an other-than-temporary decline in the market value has occurred, our Company considers the duration that, and extent to which, fair value of the investment is below its cost. Realized gains and losses also are included in non-operating income and expense in the consolidated statements of operations. There were no other-than-temporary market value declines in 2007 and 2008.
Investments
We apply Accounting Principles Board Opinion (“APB”) No. 18, “The Equity Method of Accounting for Investments in Common Stock” in accounting for our investments.
Equity investments in non-publicly traded securities of companies over which our Company has no ability to exercise significant influence are accounted for under the cost method. The equity investments accounted for under the cost method as of December 31, 2007 and 2008 were US$1,850 thousand and US$1,830 thousand, respectively.
Equity investments in companies over which our Company has the ability to exercise significant influence but does not hold a controlling interest are accounted for under the equity method and our Company’s income or loss on equity method investments is recorded in non-operating income or expenses. The difference between the cost of the acquisition and our Company’s share of fair value of the net identifiable assets is recognized as goodwill and is included in the carrying amount of the investment. When our Company’s carrying value in an equity method investee company is reduced to zero, no further losses are recorded in our Company’s consolidated financial statements unless our Company guaranteed obligations of the investee company or has committed additional funding. When the investee company subsequently reports income, our Company will not record its share of such income until it equals the amount of its share of losses not previously recognized.
54
Unrealized losses that are considered other-than-temporary, if any, are included in the current year’s Consolidated Statement of Operations. Realized gains and losses, measured against carrying amount, are also included in the current year’s Consolidated Statement of Operations. There were no other-than-temporary losses in 2007 and 2008.
Impairment of Intangible Assets, Goodwill and Long-Lived Assets
Our Company’s intangible assets with definite useful lives are being amortized by the straight-line method over their estimated useful lives, ranging from three to ten years. Our Company’s intangible assets with indefinite useful lives are not amortized. The recoverability of intangible assets is evaluated periodically. In making the evaluation, consideration is given to events or circumstances that warrant revised estimates of the useful lives of intangible assets or that indicate that impairment exists. Goodwill is not amortized.
Potential impairment of goodwill and intangible assets with indefinite useful lives has been evaluated using the specific guidance provided by FAS 142. This impairment analysis is performed, at the reporting unit level, at least annually, or whenever events or changes in circumstances indicate that the carrying value of an asset might not be recoverable from its related future undiscounted cash flows. Impairment is measured as the difference between the carrying amounts and the fair value of the assets, and is recognized as a loss from operations.
Potential impairment of long-lived assets other than goodwill and intangible assets not being amortized (which includes prepaid licensing and royalty fees) has been evaluated using the guidance provided by FAS No. 144, “Accounting for the Impairment or Disposal of Long-Lived Assets.” This impairment analysis is performed, at least annually, or whenever events or changes in circumstances indicate that the carrying value of an asset might not be recoverable from its related future undiscounted cash flows. If such assets are considered to be impaired, the impairment to be recognized is measured by the amount to the extent of which the carrying amount of the assets exceeds the fair value of the assets. When an impairment is identified, the carrying amount of the asset is reduced to its estimated fair value.
Software Cost
We recognize costs in developing our gaming software and online game software products in accordance with FAS No. 86, “Accounting for Costs of Computer Software to be Sold, Leased or Otherwise Marketed.” Accordingly, costs in developing a software product are capitalized after technological feasibility has been achieved, and the capitalization will cease when the product is available for general release to customers. Costs incurred prior to the achievement of technological feasibility are expensed as incurred and are included in product development and engineering expenses. Capitalized amounts are amortized using the straight-line method, which is applied over the useful economic life of the software, ranging from three to five years. The annual amortization shall be modified if the amount computed using the ratio that current gross revenues for a product bear to the total of current and anticipated future gross revenues for that product is greater than the amount computed using the straight-line method.
We capitalize certain costs incurred in purchasing or creating and implementing internal-use computer software, which includes software coding, installation, testing and certain data conversion in accordance with SOP 98-1, “Accounting for the Costs of Computer Software Developed or Obtained for Internal Use.” These capitalized costs shall be amortized on a straight-line basis over the shorter of the useful economic life of a software product or its contractual licensing period, which ranges from three to five years.
Advertising
Direct-response advertising costs incurred in acquiring a new customer or originating a customer relationship are capitalized and deferred. The deferred costs are recognized on the consolidated statements of operations over the estimated lives of customer relationship. Costs of communicating advertising are recorded as expenses as advertising space or airtime is used. Other advertising expenditures are expensed as incurred.
Advertising expenses incurred in 2006, 2007 and 2008 totaled US$20.6 million, US$50.1 million and US$60.1 million, respectively (including US$108 thousand, US$28 thousand, and US$42 thousand reported in discontinued operations in 2006, 2007 and 2008, respectively). As of December 31, 2007 and 2008, prepaid advertising amounted to US$4.1 million and US$8.3 million, respectively.
55
Income Taxes
Income taxes are accounted for under the asset and liability method. Deferred tax assets and liabilities are recognized for the future tax consequences attributable to differences between the financial statement carrying amounts of existing assets and liabilities and their respective tax bases. We recognize the tax benefit from investment credits and certain equity investments using the flow-through method. Loss carryforwards and investment credits are measured using the enacted tax rate and laws that will be in effect in different jurisdictions in which we operate when the differences are expected to reverse. Deferred tax assets and liabilities are measured using enacted tax rates expected to apply to taxable income in the years in which those temporary differences are expected to be recovered or settled. The effect on deferred tax assets and liabilities of a change in tax rates is recognized in income in the period that includes the tax rate’s enactment date. Deferred tax assets are subject to valuation allowances based upon the management’s estimate of realization. Due to slow market growth and the strong competition we face in our Internet access and service business and certain subsidiaries and VIE subsidiaries of our online game and services business that will not be able to utilize their operating loss carryforwards, we made a substantial allowance for all of the aggregate net deferred tax assets as of December 31, 2007. As of December 31, 2008, we evaluated the available evidence and determined that it was more likely than not that we would realize the benefit of the deferred tax assets. The primary reason for the reversal of the valuation allowance in 2008 was that the sale of our Internet access and service operation was completed in September 2008. Based on weighing all available evidence, we determined that evidence exists to conclude that it is more likely than not that we will generate sufficient taxable income to utilize the majority of the deferred tax assets within the allowable carryforward periods. Actual results may differ significantly from management’s estimate.
Effective January 1, 2007, we adopted FIN No. 48, “Accounting for Uncertainty in Income Taxes, an Interpretation of FASB Statement No. 109” (“FIN 48”), which prescribes a recognition threshold and measurement attribute for financial statement recognition and measurement of tax positions taken or expected to be taken in a tax return. Under FIN 48, our Company recognizes the financial statement impact of a tax position when it is more likely than not that the position will be sustained upon examination. If the tax position meets the more-likely-than-not recognition threshold, the tax effect is recognized at the largest amount of the benefit that has greater than a fifty percent likelihood of being realized upon ultimate settlement. The interest and penalties are reflected as income tax benefits (expenses) on our consolidated financial statements. The current portion of FIN 48 tax liabilities is included in income tax liability and the non-current portion of tax liabilities is included in other liabilities on the consolidated balance sheets. See Note 23 to our consolidated financial statements for additional information.
Minority Interest
Minority interest includes 100 percent of the common stock of UIM held by third-party shareholders. UIM was deemed a VIE as defined by FIN 46(R) and our Company was considered the primary beneficiary of UIM. Under the provisions of FIN 46(R), we have incorporated the results of UIM into our 2006, 2007 and 2008 consolidated financial statements, even though we do not own any of UIM’s equity. See Note 3 to our consolidated financial statements for additional information.
Beginning in December 2006, minority interest also includes 30 percent of the common stock of Dragongate Enterprises Limited (“Dragongate Enterprises”), which is held by Cyber Gateway Pte. Ltd. (“Cyber Gateway”), which is 100 percent owned by Infocomm Asia. We also own 500,000 voting convertible preferred shares of Infocomm Asia. See Note 12 to our consolidated financial statements for additional information.
Beginning in June 2007, we consolidated T2CN, which is included in the online game business. As of December 31, 2007 and 2008, minority interest also includes 41.89 percent and 33.71 percent, respectively, of the common stock of T2CN, which is held by third-party shareholders. See Note 5 to our consolidated financial statements for additional information.
Share-Based Compensation
We recognize share-based compensation in accordance with FAS No. 123(R), “Share-Based Payment” (“FAS 123(R)”), using the modified prospective method. FAS 123(R) requires companies to estimate the fair value of share-based payment awards on the date of grant using an option-pricing model. The value of the portion of the award that is ultimately expected to vest is recognized as expense over the vesting period. We have also applied the provisions of Staff Accounting Bulletin No. 107 (“SAB 107”) in our adoption of FAS 123(R). See Note 21 to our consolidated financial statements for additional information.
56
Our Company accounts for shares and stock options granted to non-employees in accordance with EITF 96-18, “Accounting for Equity Instruments That Are Issued to Other Than Employees for Acquiring or In Conjunction with Selling Goods or Services”, (“EITF 96-18”). Accordingly, we measure the fair value of the equity instruments granted to non-employees at the earlier of the performance commitment date or when the performance is completed.
Retirement Plan and Net Periodic Pension Cost
Under our defined benefit pension plan, net periodic pension cost, which includes service cost, interest cost, expected return on plan assets, amortization of unrecognized net transition obligation and gains or losses on plan assets, is recognized based on an actuarial valuation report. Effective December 31, 2006, our Company adopted the provisions of FAS No. 158, “Employer’s Accounting for Defined Benefit Pension and Other Post-Retirement Plans — An Amendment of FASB Statements Nos. 87, 88, 106, and 132(R)”, (“FAS 158”). FAS 158 requires the recognition of the funded status of pension plans and non-pension post-retirement benefit plans (retirement-related benefit plans) as an asset or a liability in the consolidated balance sheets. In addition, the pronouncement requires previously unrecognized items, such as actuarial gains and unrecognized prior service costs or credits, to be recognized in the consolidated balance sheets as a component of accumulated other comprehensive income (loss). The provisions of FAS 158 were adopted pursuant to the transition provisions therein.
Under our defined contribution pension plan, net periodic pension cost is recognized as incurred.
Foreign Currency Translation
The consolidated financial statements of our Company and our subsidiaries have been reported in U.S. dollars. Assets and liabilities denominated in non-U.S. currency are translated to U.S. dollars at year-end exchange rates. Income and expense items are translated at weighted-average rates of exchange prevailing during the year. Cumulative translation adjustments resulting from this process are charged or credited to other comprehensive income in shareholders’ equity. Gains and losses on foreign currency transactions are included in other income and expenses. Cumulative translation adjustments as of December 31, 2006, 2007, and 2008 were ($28) million, ($27) million, and ($27) million, respectively.
Taxation
The current corporate income tax rate in Taiwan is 25 percent. In addition to the corporate income tax rate, all retained earnings generated beginning January 1, 1998 by our subsidiaries under Taiwan law and not distributed to us as dividends in the following year are assessed a 10 percent retained earnings tax. This rule applies primarily to our Internet access and service business, which was sold in September 2008 and our FunTown online games portal, whose principal operating entities are incorporated under Taiwan law.
On January 1, 2006, the Taiwanese government enacted the AMT Act. Taxes imposed under the AMT Act are supplemental tax payable if the income tax payable pursuant to the R.O.C. Income Tax Act is below the minimum amount prescribed under the AMT Act. The AMT rate for business entities is 10 percent. The taxable income for calculating the AMT includes most income that is exempted from income tax under various legislation such as tax holidays and investment tax credits. For example, gains on disposal of marketable securities from our Taiwan-based entities were exempt from income tax based on Taiwan tax laws prior to the AMT Act. However, such gains will need to be included for the purpose of calculating the AMT.
Effective from January 1, 2008, T2CN’s subsidiaries and its VIE subsidiaries that are incorporated in the PRC, are subject to Enterprise Income Tax (“EIT”) on the taxable income as reported in their respective statutory financial statements adjusted in accordance with the Corporate Income Tax Law of the PRC (“the New CIT Law”) as enacted by the National People’s Congress on March 16, 2007.
Pursuant to the New CIT Laws, T2CN’s subsidiaries and its VIE subsidiaries in the PRC are generally subject to EIT at a statutory rate of 25 percent unless they qualify under certain limited exceptions.
57
In 2007, T2 Entertainment and J-Town Information Co. (Shanghai), Ltd. (“J-Town”) received approval from certain government authorities to be classified as a “Software Enterprise”. This classification, subject to annual inspection, entitles these two entities to two years of EIT exemption for 2006 and 2007 followed by three years of a 50 percent EIT tax reduction for 2008, 2009 and 2010, for which the related tax authorities have granted approval. The New CIT Law provides grandfather treatment for Software Enterprises that received special tax holidays under the previous Corporate Income Tax Law, which allow them to continue to enjoy their tax holidays until expiration. The applicable income tax rate of T2 Entertainment and J-Town is 12.5 percent for the year ended December 31, 2008.
Under the previous Corporate Income Tax Law, T2 Technology, which is located in the Pudong New District of Shanghai, is subject to a 15 percent preferential EIT rate. However, the New CIT Law provides a five-year transition period for certain entities that enjoyed a favorable income tax rate of less than 25 percent under the previous Corporate Income Tax Law to gradually phase into 25 percent tax rate from 2008 to 2012. The applicable income tax rate of T2 Technology is 18 percent for the year ended December 31, 2008.
The majority of our gaming software and service business is located outside the United States, with the exception of CIDC, an entity registered in Delaware which is subject to U.S. federal income tax, state tax and local tax. Current U.S. federal income tax rates and state and local tax rates applicable to our business for the year ended December 31, 2008 are 34.0 percent and 6.3 percent, respectively. Our operations in the United States did not have a significant tax impact on our Company’s consolidated financial statements.
Recent Accounting Pronouncements
In December 2007, the FASB issued FAS No. 141(R), “Business Combinations” (“FAS 141(R)”). Under FAS 141(R), an acquiring entity will be required to recognize all the assets acquired and liabilities assumed in a transaction at the acquisition-date fair value, with limited exceptions. FAS 141(R) applies prospectively to business combinations for which the acquisition date is on or after the beginning of the first annual reporting period beginning on or after December 15, 2008. We believe it will have a material impact on accounting for business acquisitions completed subsequent to December 31, 2008.
In December 2007, the FASB issued FAS No. 160, “Noncontrolling Interests in Consolidated Financial Statements — an Amendment of ARB No. 51”, (“FAS 160”). FAS 160 establishes new accounting and reporting standards for the noncontrolling interest in a subsidiary and for the deconsolidation of a subsidiary. FAS 160 will be effective for fiscal years, and interim periods within those fiscal years, beginning on or after December 15, 2008. FAS 160 establishes accounting and reporting standards for the noncontrolling interest in a subsidiary and for the deconsolidation of a subsidiary. It clarifies that a noncontrolling interest in a subsidiary is an ownership interest in the consolidated entity that should be reported as equity in the consolidated financial statements. Pursuant to the transition provisions of FAS 160, our Company will adopt FAS 160 on January 1, 2009 via retrospective application of the presentation and disclosure requirements of this standard. As a result, our Company will be required to reclassify financial statement line items within our consolidated balance sheets and our consolidated statements of operations for all periods presented to conform to this standard.
In March 2008, the FASB issued FAS No. 161, “Disclosure about Derivative Instruments and Hedging Activities” — an amendment to FAS No. 133, “Accounting for Derivatives Instruments and Hedging Activities”, (“FAS 161”). FAS 161 requires enhanced disclosures about an entity’s derivative and hedging activities and thereby improves the transparency of financial reporting. FAS 161 will be effective for financial statements issued for fiscal years and interim periods beginning after November 15, 2008. The adoption of FAS 161 is not expected to have a material effect on our consolidated financial statements.
In April 2008, the FASB issued FSP FAS 142-3, “Determination of the Useful Life of Intangible Assets”, (“FSP 142-3”). FSP 142-3 amends the factors to be considered in developing renewal or extension assumptions used to determine the useful life of intangible assets under FAS 142. FSP 142-3 will be effective for financial statements issued for fiscal years beginning after December 15, 2008. We are in the process of determining what effect, if any, the adoption of FSP 142-3 will have on our consolidated financial statements.
In May 2008, the FASB issued FAS No. 162, “The Hierarchy of Generally Accepted Accounting Principles” (“FAS 162”). FAS 162 is intended to improve financial reporting by identifying a consistent framework, or hierarchy, for selecting accounting principles to be used in preparing financial statements that are presented in conformity with U.S. generally accepted accounting principles for nongovernmental entities. FAS 162 is effective November 15, 2008. The adoption of FAS 162 did not have a material effect on our consolidated financial statements.
58
In June 2008, the FASB ratified EITF Issue No. 07-5, “Determining Whether an Instrument (or Embedded Feature) is Indexed to an Entity’s Own Stock” (“EITF 07-5”). Paragraph 11(a) of FAS No. 133 specifies that a contract that would otherwise meet the definition of a derivative but is both (a) indexed to our Company’s own stock and (b) classified in stockholders’ equity in the statement of financial position would not be considered a derivative financial instrument. EITF 07-5 provides a new two-step model to be applied in determining whether a financial instrument or an embedded feature is indexed to an issuer’s own stock and thus able to qualify for the FAS No. 133 paragraph 11(a) scope exception. EITF 07-5 is effective for financial statements issued for fiscal years beginning after December 15, 2008. We are in the process of evaluating what effect, if any, the adoption of EITF 07-5 may have on our consolidated financial statements.
In November 2008, the FASB ratified the consensus reached by the EITF on Issue EITF No. 08-6, “Equity Method Investment Accounting Considerations” (“EITF 08-6”), which clarifies the accounting for certain transactions and impairment considerations involving equity method investments. The prospective provisions of EITF 08-6 were effective on January 1, 2009. The adoption of EITF 08-6 is not expected to have a material impact on our consolidated financial statements.
In May 2009, the FASB issued FAS No. 165, “Subsequent Events,” (“FAS 165”) to be effective for the interim or annual financial periods ending June 15, 2009. FAS 165 establishes general standards of accounting for and disclosure of events that occur after the balance sheet date but before financial statements are issued or are available to be issued. The adoption of FAS 165 is not expected to have a material effect on our consolidated financial statements.
Discussion of Results of Operations
Factors Affecting Our Performance
We believe that the following are the principal factors affecting our results of operations:
Acquisitions and disposals.We have made several significant acquisitions and dispositions of businesses during the past several years, and may enter into additional acquisition and disposition transactions in the future. Past acquisitions and dispositions have had a significant impact on our results of operations over the past several years, and if we engage in such transactions in the future, the nature, amounts and timing of our revenues, expenses and cash flows and the nature and amounts our assets and liabilities are likely to be materially affected.
Development of gaming software and service and online games industries.The online gaming and online games industries are in relatively early stages of development. We believe that our results of operations are likely to be affected by developments in these industries, including:
| | • | | the development and regulation of these industries generally; |
| | • | | our adaptation to technological change; |
| | • | | changing consumer preferences; |
| | • | | legal development affecting these industries, in particular the gaming software and service industry; and |
| | • | | general economic conditions in the markets where we or our licensees operate. |
Competition.All of our businesses are in industries that are extremely competitive. Our gaming software and online games businesses are characterized by rapid technological change and we face significant and intense competition from online gaming software design houses, application service providers and casual games operators.
59
For each of our businesses, we cannot assure you that we will be successful in adapting to technological developments and achieving widespread acceptance of our services before our competitors offer services similar to our current or prospective offerings. As a consequence, we may lose our existing customers and not expand our client base, which would have a material adverse effect on our revenues and financial condition.
The table below presents, for the periods indicated, information regarding certain revenues and expense items for our consolidated operations. In September 2008, we sold our legacy Internet access and service business and therefore the results of operations of the Internet access and service business have been removed from continuing operations to discontinued operation for all periods presented. The presentation of financial information for the financial years ended December 31, 2006 and December 31, 2007 has been reclassified to conform with the current year presentation for the year ended December 31, 2008:
| | | | | | | | | | | | | | | | | | | | | | | | | |
| | | For the year ended December 31, | |
| | | 2006 | | | 2007 | | | 2008 | |
| | | Amount in | | | % of | | | Amount | | | % of | | | Amount | | | % of | |
| | | US$ | | | total | | | in US$ | | | total | | | in US$ | | | total | |
| | | thousands | | | revenues | | | thousands | | | revenues | | | thousands | | | revenues | |
Particulars | | | | | | | | | | | | | | | | | | | | | | | | |
OPERATING REVENUES | | | | | | | | | | | | | | | | | | | | | | | | |
| | | | | | | | | | | | | | | | | | | | | | | | | |
| Gaming software and service revenues | | | 55,019 | | | | 74.6 | | | | 118,950 | | | | 78.4 | | | | 144,765 | | | | 76.0 | |
| Online game and service revenues | | | 18,692 | | | | 25.4 | | | | 32,764 | | | | 21.6 | | | | 45,604 | | | | 24.0 | |
| | | | | | | | | | | | | | | | | | | |
| | | | | | | | | | | | | | | | | | | | | | | | | |
| Total operating revenues | | | 73,711 | | | | 100.0 | | | | 151,714 | | | | 100.0 | | | | 190,369 | | | | 100.0 | |
| | | | | | | | | | | | | | | | | | | |
| | | | | | | | | | | | | | | | | | | | | | | | | |
OPERATING COSTS | | | | | | | | | | | | | | | | | | | | | | | | |
| | | | | | | | | | | | | | | | | | | | | | | | | |
| Cost of gaming software and service revenues | | | 7,824 | | | | 10.6 | | | | 16,201 | | | | 10.7 | | | | 22,770 | | | | 12.0 | |
| Cost of online game and service revenues | | | 3,667 | | | | 5.0 | | | | 9,118 | | | | 6.0 | | | | 12,404 | | | | 6.5 | |
| | | | | | | | | | | | | | | | | | | |
| | | | | | | | | | | | | | | | | | | | | | | | | |
| Total operating costs | | | 11,491 | | | | 15.6 | | | | 25,319 | | | | 16.7 | | | | 35,174 | | | | 18.5 | |
| | | | | | | | | | | | | | | | | | | |
| | | | | | | | | | | | | | | | | | | | | | | | | |
| Gross profit | | | 62,220 | | | | 84.4 | | | | 126,395 | | | | 83.3 | | | | 155,195 | | | | 81.5 | |
| | | | | | | | | | | | | | | | | | | |
| | | | | | | | | | | | | | | | | | | | | | | | | |
| OPERATING EXPENSES | | | | | | | | | | | | | | | | | | | | | | | | |
| | | | | | | | | | | | | | | | | | | | | | | | | |
| Product development and engineering expenses | | | 5,244 | | | | 7.1 | | | | 7,338 | | | | 4.8 | | | | 13,455 | | | | 7.1 | |
| Selling and marketing expenses | | | 27,653 | | | | 37.5 | | | | 60,106 | | | | 39.6 | | | | 74,173 | | | | 39.0 | |
| General and administrative expenses | | | 11,096 | | | | 15.1 | | | | 20,983 | | | | 13.8 | | | | 25,035 | | | | 13.2 | |
| Bad debt expense | | | 448 | | | | 0.6 | | | | 548 | | | | 0.4 | | | | 2,905 | | | | 1.5 | |
| Impairment loss on prepaid licensing fees and intangible assets | | | — | | | | — | | | | — | | | | — | | | | 1,524 | | | | 0.8 | |
| | | | | | | | | | | | | | | | | | | |
| | | | | | | | | | | | | | | | | | | | | | | | | |
| Total operating expenses | | | 44,441 | | | | 60.3 | | | | 88,975 | | | | 58.6 | | | | 117,092 | | | | 61.5 | |
| | | | | | | | | | | | | | | | | | | |
| | | | | | | | | | | | | | | | | | | | | | | | | |
| Income from operations | | | 17,779 | | | | 24.1 | | | | 37,420 | | | | 24.7 | | | | 38,103 | | | | 20.0 | |
| | | | | | | | | | | | | | | | | | | |
| | | | | | | | | | | | | | | | | | | | | | | | | |
| NON-OPERATING INCOME (EXPENSES) | | | 917 | | | | 1.2 | | | | 2,064 | | | | 1.4 | | | | (1,324 | ) | | | (0.7 | ) |
| | | | | | | | | | | | | | | | | | | |
| | | | | | | | | | | | | | | | | | | | | | | | | |
| INCOME TAX EXPENSE | | | (523 | ) | | | (0.7 | ) | | | (401 | ) | | | (0.3 | ) | | | (1,069 | ) | | | (0.6 | ) |
| | | | | | | | | | | | | | | | | | | |
| | | | | | | | | | | | | | | | | | | | | | | | | |
| MINORITY INTEREST | | | (321 | ) | | | (0.4 | ) | | | (1,281 | ) | | | (0.8 | ) | | | (757 | ) | | | (0.4 | ) |
| | | | | | | | | | | | | | | | | | | |
| | | | | | | | | | | | | | | | | | | | | | | | | |
| INCOME FROM CONTINUING OPERATIONS | | | 17,852 | | | | 24.2 | | | | 37,802 | | | | 24.9 | | | | 34,953 | | | | 18.4 | |
| | | | | | | | | | | | | | | | | | | |
| | | | | | | | | | | | | | | | | | | | | | | | | |
| INCOME FROM DISCONTINUED OPERATIONS | | | 12,932 | | | | 17.5 | | | | 1,088 | | | | 0.7 | | | | 9,435 | | | | 5.0 | |
| | | | | | | | | | | | | | | | | | | |
| | | | | | | | | | | | | | | | | | | | | | | | | |
| NET INCOME | | | 30,784 | | | | 41.8 | | | | 38,890 | | | | 25.6 | | | | 44,388 | | | | 23.3 | |
| | | | | | | | | | | | | | | | | | | |
60
The key items included in our income statement are:
OPERATING REVENUES. Our operating revenues consist of revenues from our gaming software and service business, and online games business. Revenues from the gaming software and service business include revenues of UIM, our licensee, from providing and promoting online games of skill and chance. Software licensing and support services revenues received by our subsidiary, CESL, from UIM have been eliminated in consolidation. Online game revenues are related to our online games business in Asia and are collected through the sale of online game points, pre-paid cards and game packs.
OPERATING COSTS. Operating costs consist primarily of gaming software and online game processing costs, online game royalties, production costs for prepaid game cards and game packs, amortization of intangible assets, customer service department costs, operational department costs, depreciation, maintenance and other overhead expenses directly attributable to the provision of gaming software and services and online games and services.
OPERATING EXPENSES. Operating expenses include product development and engineering expenses, selling and marketing expenses, general and administrative expenses, bad debt expenses and impairment losses.
NON-OPERATING INCOME (EXPENSES). Non-operating income and expenses consist of interest income and expenses, gain or loss on sales of marketable securities, foreign exchange gain or loss, gain or loss on disposal of property, plant and equipment, and loss on equity method investments.
INCOME TAX EXPENSES. Taxes include current income tax in various jurisdictions in which our subsidiaries operate and deferred tax expenses related to temporary tax assets or liabilities that arise due to the timing differences between book profits and taxable profits that originate in one period and are capable of reversal in one or more subsequent periods. Taxes are measured using the tax rates and laws that have been enacted or subsequently enacted as of the date of the financial statements.
MINORITY INTEREST. Minority interest represents the portion of net income allocated to the non-controlling voting stock of our majority-owned subsidiaries (T2CN and Dragongate Enterprises) as well as UIM, which is consolidated pursuant to FIN 46(R).
The financial information in relation to our business segments is provided net of inter-segment transactions.
For the Years Ended December 31, 2008 and 2007
Consolidated Results of Operations
OPERATING REVENUES. Operating revenues for 2008 grew by approximately 25.5 percent to approximately US$190.4 million from approximately US$151.7 million in 2007. The increase was primarily a result of a 21.7 percent revenue growth in our gaming software and service business, which contributed approximately US$144.8 million or 76.0 percent of our total revenues in 2008. Our online games and service business revenues also increased by 39.2 percent to approximately US$45.6 million, or 24.0 percent of our total revenues in 2008.
OPERATING COSTS. Operating costs increased by approximately 38.9 percent to approximately US$35.2 million in 2008 from approximately US$25.3 million in 2007. The increase in total operating costs was mainly due to a US$6.6 million or 40.6 percent increase in operating costs in our gaming software and service business related to a higher level of volume in 2008, and a US$3.3 million or 36.0 percent increase in operating costs in our online games and service business which was also related to a higher level of volume in 2008.
GROSS PROFIT. Gross profit increased by approximately 22.8 percent to approximately US$155.2 million in 2008 from approximately US$126.4 million in 2007. The increase in consolidated gross profit resulted from respective 18.7 percent and 40.4 percent increases in gross profits in our gaming software and service business and our online games and service business.
OPERATING EXPENSES. Total operating expenses increased by approximately 31.6 percent to approximately US$117.1 million in 2008 from approximately US$89.0 million in 2007. The increase in total operating expenses was mainly due to a US$20.6 million or 31.7 percent increase in expenses in our gaming software and service business, and a US$8.4 million or 50.0 percent increase in expenses in our online games and service business.
61
Consolidated product development and engineering expenses increased by approximately 83.4 percent in 2008 to approximately US$13.5 million from US$7.3 million in 2007, mainly due to a US$4.9 million or 67.2 percent increase in our gaming software and service business.
Consolidated selling and marketing expenses increased by approximately 23.4 percent to approximately US$74.2 million in 2008 from US$60.1 million in 2007, primarily due to an increase of US$14.0 million or 28.0 percent in selling and marketing expenses in our gaming software and service business, and a US$0.4 million or 4.1 percent increase in selling and marketing expenses in our online games business.
Consolidated general and administrative expenses increased by approximately 19.3 percent in 2008 to US$25.0 million from US$21.0 million in 2007, primarily reflecting a US$1.6 million or 20.8 percent increase in our gaming software and service business and a US$2.9 million or 44.7 percent increase in our online games and service business.
OPERATING INCOME. Operating income for 2008 increased by approximately 1.8 percent to US$38.1 million from approximately US$37.4 million in 2007. The increase was primarily due to a 3.6 percent decrease in operating income in our gaming software and service business and a 16.9 percent increase in operating income in our online games business.
NON-OPERATING INCOME (EXPENSES). Non-operating items decreased from approximately US$2.1 million income in 2007 to a loss of approximately US$1.3 million in 2008. This was principally due to an investment loss on CJIT2, an equity method investment, of approximately US$2.9 million recognized in 2008.
INCOME FROM DISCONTINUED OPERATIONS. Income from discontinued operations increased in 2008 by approximately 767.0 percent to approximately US$9.4 million in 2008 from approximately US$1.1 million in 2007. The increase was principally due to the sale of our legacy Internet access and service business in September 2008, which contributed approximately US$9.8 million of an after tax disposal gain.
NET INCOME. Net income for 2008 increased by approximately 14.1 percent to US$44.4 million from approximately US$38.9 million in 2007.
Business Segment Results
Gaming Software and Service Business
OPERATING REVENUES. Consolidated revenues of our gaming software and service business include the revenues of UIM, our licensee. Software licensing and support services revenues received by us from UIM have been eliminated in consolidation. Total operating revenues in 2008 increased by 21.7 percent to approximately US$144.8 million from US$119.0 million in 2007. Such increase was attributable to growth in both our poker software business and casino software business in 2008. Software licensing and support services revenues received by us from UIM increased by 23.6 percent from US$53.6 million in 2007 to US$66.2 million in 2008. Revenues from our poker software business grew from approximately US$89.7 million in 2007 to US$104.5 million in 2008 and accounted for approximately 72.2 percent of our gaming software and service revenues in 2008 compared to 75.6 percent in 2007. Revenues from our casino software business increased to approximately US$40.2 million in 2008 from US$29.0 million in 2007.
OPERATING COSTS. Cost of our gaming software and service revenues increased by 40.6 percent to approximately US$22.8 million in 2008 from US$16.2 million in 2007. The increase was due to higher business volume and the associated increase in payment processing costs in 2008.
62
GROSS PROFIT. Gross profit increased by 18.7 percent to approximately US$122.0 million in 2008 from US$102.7 million in 2007. The increase was primarily due to revenue growth in both poker software business and casino software business in the period. Gross profit margin decreased from approximately 86.4 percent in 2007 to approximately 84.3 percent in 2008. The decrease was due primarily to increased payment processing fees and departmental costs in both the customer service department and operational department.
OPERATING EXPENSES. Total operating expenses increased by approximately 31.7 percent to approximately US$85.6 million in 2008 from approximately US$65.0 million in 2007. The increase in total operating expenses resulted from increases in selling and marketing expenses, general and administrative expenses, and product development and engineering expenses incurred to support revenue growth.
Selling and marketing expenses. Selling and marketing expenses increased by approximately 28.0 percent to approximately US$64.1 million in 2008 from US$50.0 million in 2007. The increase was attributable to increases in payments to marketing affiliates, as well as increases in sales and marketing headcount and our sponsorship of the World Series of Poker.
General and administrative expenses. General and administrative expenses increased by approximately US$1.6 million to US$9.3 million in 2008 from US$7.7 million in 2007. The increase was due to more professional fees and general and administrative departmental cost incurred to support revenue growth.
Product development and engineering expenses. Product development and engineering expenses increased by approximately US$4.9 million to US$12.2 million in 2008 from US$7.3 million in 2007, mainly due to increases in product development and engineering headcounts incurred to support revenue growth.
OPERATING INCOME. Operating income in 2008 decreased by 3.6 percent to approximately US$36.4 million from US$37.7 million in 2007. The decrease was due to operating margin decline from 31.7 percent in 2007 to 25.1 percent in 2008. The decrease was primarily due to increases in sales and marketing, general and administrative, and product development and engineering expenses. Operating income does not reflect certain corporate headquarters expenses. For a reconciliation of business segment results to our consolidated net income, see Note 27 to our consolidated financial statements.
Online Games Business
OPERATING REVENUES. Total operating revenues increased 39.2 percent to approximately US$45.6 million in 2008 from approximately US$32.8 million in 2007. Such increase was driven by organic growth of FunTown in Taiwan and Hong Kong and full year consolidation of T2CN in China. Revenue from FunTown grew 9.0 percent from US$23.8 million in 2007 to US$25.9 million in 2008. Revenue from T2CN increased by 118.7 percent to approximately US$19.7 million in 2008 from US$9.0 million in 2007, for the seven months of 2007 from initial consolidation of T2CN in June 2007.
OPERATING COSTS. Cost of our online game revenues increased by 36.0 percent to approximately US$12.4 million in 2008 from US$9.1 million in 2007. The increase was due to increased bandwidth costs, increased royalty fees and licensing fees related to the licensing of new games.
GROSS PROFIT. Gross profit increased by 40.4 percent to approximately US$33.2 million in 2008 from US$23.6 million in 2007. The increase resulted from organic revenue growth of FunTown and full year consolidation of T2CN in 2008. Gross profit margin slightly increased from approximately 72.2 percent in 2007 to approximately 72.8 percent in 2008.
OPERATING EXPENSES. Total operating expenses increased by approximately 50.0 percent to approximately US$25.2 million in 2008 from approximately US$16.8 million in 2007. The increase was due to increased general and administrative expenses incurred to support revenue growth, bad debt expenses related to the loans to Flagship, as well as an impairment loss on write-off of capitalized license costs and intangible assets.
63
Selling and marketing expenses. Selling and marketing expenses increased by approximately US$400 thousand to US$10.1 million in 2008 from US$9.7 million in 2007. The increase was primarily due to full year consolidation of T2CN.
General and administrative expenses. General and administrative expenses increased by approximately 44.7 percent to approximately US$9.5 million in 2008 from US$6.6 million in 2007, primarily due to full year consolidation of T2CN.
Bad debt expense and impairment loss. Bad debt expenses increased by approximately 430.3 percent to US$2.9 million in 2008 from 548 thousand in 2007 as we recognized US$2.6 million of bad debt expenses related to the loans to Flagship. We also recognized an impairment loss of US$1.5 million in 2008 on write-off of capitalized license costs and intangible assets.
OPERATING INCOME. Operating income in 2008 increased by approximately 16.9 percent to US$8.0 million from US$6.8 million in 2007. The increase was due to revenue growth during the period. Operating margin declined from 20.9 percent in 2007 to 17.6 percent in 2008, which reflected the aforementioned higher general and administrative expenses, and bad debt expense related to the loans to Flagship as well as the impairment loss. Operating income does not reflect certain corporate headquarter expenses.
NON-OPERATING INCOME (EXPENSES). Non-operating items decreased from US$1.6 million income in 2007 to a loss of US$2.0 million in 2008. The decrease was due to the equity investment loss on CJIT2 of approximately US$2.9 million in 2008.
For a reconciliation of business segment results to our consolidated net income, see Note 27 to our consolidated financial statements.
For the Years Ended December 31, 2007 and 2006
Consolidated Results of Operations
OPERATING REVENUES. Operating revenues for 2007 grew by approximately 105.8 percent to approximately US$151.7 million from approximately US$73.7 million in 2006. The increase was primarily a result of a 116.2 percent revenue growth in our gaming software and service business, which contributed approximately US$119.0 million or 78.4 percent of our total revenues in 2007. Our online games business revenues also increased by 75.3 percent, primarily due to consolidation of T2CN from June 2007, to approximately US$32.8 million, or 21.6 percent of our total revenues in 2007.
OPERATING COSTS. Operating costs increased by approximately 120.3 percent to approximately US$25.3 million in 2007 from approximately US$11.5 million in 2006. The increase in total operating costs was mainly due to an US$8.4 million or 107.1 percent increase in operating costs in our gaming software and service business related to a higher level of volume in 2007, and a US$5.5 million or 148.7 percent increase in operating costs in our online games and service business primarily resulting from the consolidation of T2CN with effect from June 2007, which increased operating costs in that business unit by approximately US$3.9 million from 2006.
GROSS PROFIT. Gross profit increased by approximately 103.1 percent to approximately US$126.4 million in 2007 from approximately US$62.2 million in 2006. The increase in consolidated gross profit resulted from respective 117.7 percent and 57.4 percent increases in gross profits in our gaming software and service business and our online games and service business.
OPERATING EXPENSES. Total operating expenses increased by approximately 100.2 percent to approximately US$89.0 million in 2007 from approximately US$44.4 million in 2006. The increase in total operating expenses was mainly due to a US$34.6 million or 113.8 percent increase in expenses in our gaming software and service business, and a US$7.4 million or 78.6 percent increase in expenses in our online games and service business.
Consolidated product development and engineering expenses increased by approximately 39.9 percent in 2007 to approximately US$7.3 million from US$5.2 million in 2006, mainly due to a US$3.0 million or 69.1 percent increase in our gaming software and service business.
64
Consolidated selling and marketing expenses increased by approximately 117.4 percent to approximately US$60.1 million in 2007 from US$27.7 million in 2006, primarily due to an increase of US$27.9 million or 126.2 percent in selling and marketing expenses in our gaming software and service business, and a US$4.2 million or 75.9 percent increase in selling and marketing expenses in our online game business.
Consolidated general and administrative expenses increased by approximately 89.1 percent in 2007 to US$21.0 million from US$11.1 million in 2006, reflecting a US$3.7 million or 93.5 percent increase in our gaming software and service business and a US$4.1 million or 161.5 percent increase in our online games and service business.
OPERATING INCOME. Operating income for 2007 increased by approximately 110.5 percent to US$37.4 million from approximately US$17.8 million in 2006. The increase was primarily due to a 124.8 percent increase in operating income in our gaming software and service business and a 21.8 percent increase in operating income in our online game business.
NON-OPERATING INCOME (EXPENSES). Non-operating income increased in 2007 by approximately 125.1 percent to approximately US$2.1 million in 2007 from approximately US$0.9 million in 2006, which was mainly due to gains from cancellation of certain warrant liabilities of T2CN and from the termination of a game licensing agreement.
INCOME FROM DISCONTINUED OPERATIONS. Income from discontinued operations decreased in 2007 by approximately 91.6 percent to approximately US$1.1 million in 2007 from approximately US$12.9 million in 2006. This was principally due to the sale of our ADSL business to Webs-TV in May 2006, which contributed approximately US$7.7 million to income from discontinued operations.
NET INCOME. Net income for 2007 increased by approximately 26.3 percent to US$38.9 million from approximately US$30.8 million in 2006.
Business Segment Results
Gaming Software and Service Business
OPERATING REVENUES. Consolidated revenues of our gaming software and service business include the revenues of UIM, our licensee. Software licensing and support services revenues received by us from UIM have been eliminated or consolidated. Total operating revenues in 2007 increased by 116.2 percent to approximately US$119.0 million from US$55.0 million in 2006. Such increase was primarily attributable to strong growth in our poker software business, and growth in our casino software business in 2007. Software licensing and support services revenues received by us from UIM increased by 94.9 percent from US$27.5 million in 2006 to US$53.6 million in 2007. Revenues from our poker software business grew from approximately US$30.9 million in 2006 to US$89.7 million in 2007 and accounted for approximately 75.4 percent of our gaming software and service revenues in 2007 compared to 56.1 percent in 2006. Revenues from our casino software business increased to approximately US$29.0 million in 2007 from US$24.1 million in 2006.
OPERATING COSTS. Cost of our gaming software and service revenues increased by 107.1 percent to approximately US$16.2 million in 2007 from US$7.8 million in 2006. The increase was due to higher business volume and the associated increase in payment processing costs in 2007.
GROSS PROFIT. Gross profit increased by 117.7 percent to approximately US$102.7 million in 2007 from US$47.2 million in 2006. The increase was primarily due to strong revenue growth in our poker software business in the period.
OPERATING EXPENSES. Total operating expenses increased by approximately 113.8 percent to approximately US$65.0 million in 2007 from approximately US$30.4 million in 2006. The increase in total operating expenses resulted from increases in selling and marketing expenses, general and administrative expenses, and product development and engineering expenses incurred to support revenue growth.
65
Selling and marketing expenses. Selling and marketing expenses increased by approximately 126.2 percent to approximately US$50.0 million in 2007 from US$22.1 million in 2006, primarily due to an increase in commissions to partners related to growth in revenue, and an increase in advertising and promotional expenses.
OPERATING INCOME. Operating income in 2007 increased 124.8 percent to approximately US$37.7 million from US$16.8 million in 2006. The increase was primarily due to strong revenue growth and operating margin increase from 30.5 percent in 2006 to 31.7 percent in 2007. Operating income does not reflect certain corporate headquarters expenses. For a reconciliation of business segment results to our consolidated net income, see Note 27 to our consolidated financial statements.
Online Games Business
OPERATING REVENUES. Total operating revenues increased 75.3 percent to approximately US$32.8 million in 2007 from approximately US$18.7 million in 2006. Such increase was driven by organic growth of FunTown in Taiwan and Hong Kong and the consolidation of T2CN in China. Revenue from FunTown grew 27.1 percent from US$18.7 million in 2006 to US$23.8 million in 2007. Revenue consolidated from T2CN beginning in June 2007 was US$9.0 million in 2007.
OPERATING COSTS. Cost of our online game revenues increased by 148.7 percent to approximately US$9.1 million in 2007 from US$3.7 million in 2006. The increase was due to increased bandwidth costs, increased royalty fees and licensing fees related to the licensing of new games, and consolidation of T2CN from June 2007.
GROSS PROFIT. Gross profit increased by 57.4 percent to approximately US$23.6 million in 2007 from US$15.0 million in 2006. The increase resulted from organic revenue growth and the consolidation of T2CN beginning in June 2007. Gross profit margin decreased to 72.2 percent from 80.4 percent in 2006. The decline reflected an increase in revenue contributions from licensed games that have lower margins than self-developed games.
OPERATING EXPENSES. Total operating expenses increased by approximately 78.6 percent to approximately US$16.8 million in 2007 from approximately US$9.4 million in 2006. The increase was due to increased selling and marketing expenses and general and administrative expenses, as well as consolidation of T2CN.
Selling and marketing expenses. Selling and marketing expenses increased by approximately 75.9 percent to approximately US$9.7 million in 2007 from US$5.5 million in 2006, primarily due to increases in mass media marketing of FunTown’s game products and services during the period, as well as consolidation of T2CN.
OPERATING INCOME. Operating income in 2007 increased 21.8 percent to approximately US$6.8 million from US$5.6 million in 2006. The increase was due to revenue growth during the period. Operating margin declined from 30.1 percent in 2006 to 20.9 percent in 2007, which reflected the aforementioned decrease in gross margin and an increase in selling and marketing expenses, as well as higher general and administrative expenses related to expansion of the online games and service business. Operating income does not reflect certain corporate headquarter expenses. For a reconciliation of business segment results to our consolidated net income, see Note 27 to our consolidated financial statements.
B. Liquidity and Capital Resources
Our principal sources of liquidity consist of cash generated from our operations, proceeds generated from the disposal of our investments and other assets, bank borrowings, and interest derived from our investments. Our cash and cash equivalents are held primarily in U.S. dollars, RMB and NT dollars. Our policy with respect to liquidity management is to maintain sufficient cash and cash equivalents to fund operations and strategic transactions, while placing remaining funds in higher yield investment instruments.
66
Our future cash requirements will depend on a number of factors including:
| | • | | the rate at which we enter into strategic transactions; |
| | • | | the rate at which we expand our operations and employee base; |
| | • | | the timing of entry into new markets and new services offered; |
| | • | | changes in revenues and cost splits with our business partners; |
| | • | | the rate at which we invest in developing and licensing our products and upgrading and maintaining our network and future technologies; and |
| | • | | the rate at which we grow and monetize our customer bases. |
As a result of our operating, investing and financing activities during 2008, the amount of our cash and cash equivalents increased from approximately US$68.6 million as of December 31, 2007 to US$96.0 million as of December 31, 2008. Such increase was primarily attributable to the cash inflows for our operating activities and proceeds from disposal of our Internet access and service business, and partially offset by repayment of our short term loans, capital expenditures, and investments in T2CN, Access China, and SuperCup.
We believe that our existing cash, cash equivalents, marketable securities and expected cash flow from operations will be sufficient to meet our capital expenditure, working capital, and cash obligations under our existing lease arrangements and license agreements through 2009. We continue to seek and review potential merger and acquisition opportunities on an ongoing basis, which may be funded through cash on our balance sheet, bank borrowings or equity offerings. We do not believe that any potential merger or acquisition that we may be engaged in would alter our goal of preserving sufficient cash and cash equivalents to fund future operations.
OPERATING ACTIVITIES. In 2008, our net cash provided by operating activities amounted to approximately US$50.8 million. This mainly resulted from income from continuing operations of approximately US$35.0 million. In 2007, our net cash provided by operating activities amounted to US$56.2 million. This was primarily from income from continuing operations of US$37.8 million, and a net increase in player account balances of US$17.6 million.
INVESTING ACTIVITIES. Our net cash used in investment activities in 2008 was approximately US$6.4 million. This was primarily due to capital expenditures of approximately US$16.7 million, further acquisition in T2CN of approximately US$3.4 million, as well as strategic investment in Access China and SuperCup of approximately US$5.0 million, which partially offset by proceeds from disposal of our Internet access and service business of approximately US$16.5 million. Our net cash used in investing activities in 2007 was US$33.2 million. This was primarily due to a net cash out flow for the acquisition of T2CN of US$9.2 million, which resulted from cash paid of US$21.0 million, net of cash acquired at consolidation of US$11.8 million, an incentive payment of US$4.8 million for the acquisition of FunTown, and strategic investments in game development studios, including Softstar, Neostorm and XL Games, of US$10.6 million.
FINANCING ACTIVITIES. Our net cash used in financing activities in 2008 was approximately US$17.9 million, which was primarily due to repayment of approximately US$18.1 million of short term loans. Our net cash generated from financing activities in 2007 was US$22.6 million. This was primarily due to proceeds from short-term borrowings of US$20.1 million.
OTHER. Set forth below are the aggregate amounts, as of December 31, 2008, of our future cash payment obligations under our existing contractual obligations.
67
Capital Expenditures
We typically finance our capital expenditures through cash holdings. Our gross capital expenditures for equipment, furniture and fixtures, software, intangible assets and other deferred assets were US$5.7 million, US$9.9 million, and US$16.7 million for 2006, 2007, and 2008 respectively. Capital expenditures during 2008 were primarily for capitalized software development and computer hardware equipment for our gaming software and service business and online games business. Our capital expenditure plans for 2009 will continue to focus primarily on software development and computer hardware equipment for our gaming software and service business and for our online games business. We may adjust the amount of our capital expenditures upward or downward based on cash flow from operations, the progress of our expansion plans, and market conditions.
Indebtedness
As of December 31, 2007 and 2008, our short-term borrowings totaled US$33.3 million and US$15.2 million, respectively. These amounts were borrowed from certain financial institutions. The annual interest rates on these borrowings ranged from 1.865 percent to 4.238 percent for 2007, and from 2.5 percent to 5.038 percent for 2008, respectively. The maturity dates ranged from February 2008 to October 2008 as of December 31, 2007, and from March 2009 to September 2009 as of December 31, 2008, respectively. As of December 31, 2007 and 2008, the weighted-average interest rate on total short-term borrowings was 3.35 percent and 3.20 percent, respectively.
As of December 31, 2008, our unused lines of credit under short-term borrowing agreements were approximately US$4.6 million.
In March 2009, we renewed short-term borrowing agreements totaling US$4.6 million due in March 2009 through April 2010.
We pledged certain time deposits (See Note 13 to our consolidated financial statements for more information), land, and buildings as collateral for borrowings from certain banks. The total value of collateral amounted to US$7.9 million and US$1.6 million as of December 31, 2007 and 2008, respectively.
Dividends From Our Subsidiaries
Under Singapore tax regulations, foreign-sourced dividend income used for capital expenditures, including investments, and repayment of borrowings, would not be deemed as remitted to Singapore and is therefore not taxable. As of December 31, 2008, our Company has not accrued deferred income taxes on US$101.5 million of unremitted earnings from non-Singapore subsidiaries as such earnings are considered to be reinvested overseas or repayment of borrowings. Determination of the amount of unrecognized deferred tax liability related to these earnings is considered impracticable.
In accordance with R.O.C. law, an appropriation for legal reserve amounting to 10 percent of a company’s net profit is required until the reserve equals the aggregate par value of such Taiwan company’s issued capital stock. As of December 31, 2007 and 2008, the legal reserves of Hoshin GigaMedia, which represent a component of our accumulated deficits, were US$2.0 million, and US$2.3 million, respectively. The reserve can only be used to offset a deficit or be distributed as a stock dividend of up to 50 percent of the reserve balance when the reserve balance has reached 50 percent of the aggregate paid-in capital of Hoshin GigaMedia.
In accordance with the regulations in the PRC and their respective articles of association, subsidiaries and VIE subsidiaries of T2CN incorporated in the PRC are required to make an appropriation of retained earnings for statutory reserve equal to at least 10 percent of their respective after-tax profits, calculated in accordance with the PRC accounting standards and regulations until the reserve equals 50 percent of the registered capital of the respective companies. As of December 31, 2007 and 2008, the statutory reserves of subsidiaries and VIE subsidiaries of T2CN in the aggregate of US$125 thousand and US$339 thousand, respectively, are included as a component of GigaMedia’s consolidated accumulated deficit.
The statutory reserves can be used to offset a deficit or to increase capital of the respective companies. They are not transferable to our Company in the form of dividends, advances, or loans.
Under PRC laws and regulations, there are certain foreign exchange restrictions on our Company’s PRC subsidiaries and VIE subsidiaries with respect to transferring certain of their net assets to our Company either in the form of dividends, loans or advances.
As of December 31, 2007 and 2008, our Company’s total restricted net assets, which include paid up capital and statutory reserve funds of PRC subsidiaries and the net assets of VIE subsidiaries in which our Company has no legal ownership, were approximately US$8.6 million and US$13.2 million, representing approximately 3.0 percent and 4.2 percent of our total assets, respectively.
68
C. Research, Development, Patents and Licenses, etc.
We make investments in research and development to keep pace and remain competitive with technology advancements and product development relating to our gaming software and service business and our online game business. For the years 2006, 2007, and 2008, we incurred US$5.2 million, US$7.3 million, and US$13.5 million, respectively, on research and development activities.
D. Trend Information
Please see Item 3, “Key Information — D. Risk Factors” and Item 5, “Operating and Financial Review and Prospects — A. Operating Results — Overview — Subsequent Events” for a discussion of the most recent trends in our operating costs and revenues since the end of 2008. In addition, please refer to discussions included in this Item for a discussion of known trends, uncertainties, demands, commitments or events that we believe are reasonable likely to have a material effect on our net operating revenues, income from continuing operations, profitability or capital resources, or that would cause reported financial information not necessarily to be indicative of future operating results or financial condition.
We have historically experienced significant growth in our operations of gaming software and services and online games. The current global economic slowdown and financial market crisis, however, are posing a tremendous challenge to the future development of the online gaming industry and online games industry. Given the challenging operating environment, we are taking various measures to control costs and improve efficiency. We expect our gaming software and services business to face significant challenges in 2009 due to the global economic slowdown and uncertain global regulatory environment. We plan to launch new online games in Greater China and expect our online games business to continue to grow in 2009.
E. Off-Balance Sheet Arrangements
Other than as disclosed in Note 25 to our consolidated financial statements, we currently do not have (a) any obligation under a guarantee contract that has any of the characteristics identified in paragraph 3 of FASB Interpretation No. 45, “Guarantor’s Accounting and Disclosure Requirements for Guarantees, Including Indirect Guarantees of Indebtedness of Others” (“FIN 45”), as may be modified or supplemented, excluding the types of guarantee contracts described in paragraphs 6 and 7 of FIN 45; (b) a retained or contingent interest in assets transferred to an unconsolidated entity or similar arrangement that serves as credit, liquidity or market risk support to such entity for such assets; (c) any obligation under a derivative instrument that is both indexed to our Company’s own stock and classified in stockholders’ equity, or not reflected, in our Company’s statement of financial position; (d) any obligation, including a contingent obligation, arising out of a variable interest (as referenced in FASB Interpretation No. 46, “Consolidation of Variable Interest Entities”, as may be modified or supplemented) in an unconsolidated entity that is held by, and material to, our Company, where such entity provides financing, liquidity, market risk or credit risk support to, or engages in leasing, hedging or research and development services with, our Company.
F. Tabular Disclosure of Contractual Obligations
| | | | | | | | | | | | | | | | | | | | | |
| | | Payment Due by Period (in US dollars) | |
| | | Within 1 year | | | 1-3 years | | | 3-5 years | | | >5 years | | | Total | |
| 1. Operating leases | | | 5,255,902 | | | | 8,975,000 | | | | 5,683,733 | | | | 1,747,162 | | | | 21,661,797 | |
| 2. License fees | | | 1,012,500 | | | | 3,300,000 | | | | — | | | | — | | | | 4,312,500 | |
| 3. Minimum guarantees against royalties | | | 7,815,000 | | | | 22,400,000 | | | | 5,600,000 | | | | — | | | | 35,815,000 | |
| | | | | | | | | | | | | | | | |
| Total contractual cash obligations | | | 14,083,402 | | | | 34,675,000 | | | | 11,283,733 | | | | 1,747,162 | | | | 61,789,297 | |
| | | | | | | | | | | | | | | | |
| 4. Other liabilities-accrued pension liabilities | | | — | | | | — | | | | — | | | | 107,616 | | | | 107,616 | |
| | | | | | | | | | | | | | | | |
| 5. Other long-term obligations | | | — | | | | 186,070 | | | | — | | | | — | | | | 186,070 | |
| | | | | | | | | | | | | | | | |
The initial minimum guarantees against future royalties and license fees are not required to be paid until the licensed games are commercially released or until certain milestones are achieved, as stipulated in the individual license agreements. The remaining minimum guarantees are generally required to be paid within three years subsequent to the commercial release dates of the licensed games.
69
Additionally, we also have contractually committed to support related marketing, promotion and advertising activities for certain games, and our commitments are contingent to occur based on the payment schedules set forth in the individual license agreements. As of December 31, 2008, our total commitments to these marketing expenditures amounted to not less than US$17.7 million. However, we are not required to make these payments pursuant to any timeline and therefore the yearly amount were not included in the table above.
Quantitative and Qualitative Disclosure About Market Risk
Please refer to Item 11, “Quantitative and Qualitative Disclosures About Market Risk” in this annual report.
ITEM 6. DIRECTORS, SENIOR MANAGEMENT AND EMPLOYEES
A. Directors and Senior Management
The following table sets forth information with respect to our directors and executive officers as of May 31, 2009:
| | | | | | | | | | | |
| | | | | | | | | Year Appointed to |
| Name | | Age | | Position | | Current Position |
| DING, Michael Y.J. | | | 52 | | | Chairman of the Board and Independent Non-Executive Director | | | 2009*/2003 | |
| WANG, Arthur M. | | | 48 | | | Director and Chief Executive Officer | | | 2003 | |
| HUI, Thomas T. | | | 37 | | | Director, President and Chief Operating Officer | | | 2005/2007 | |
| BAO, Gilbert | | | 45 | | | Independent Non-Executive Director | | | 2003 | |
| HSU, Emmet Yu-Jui | | | 46 | | | Independent Non-Executive Director | | | 2003 | |
| HU ZEE, Nancy Jing-Ying | | | 50 | | | Independent Non-Executive Director | | | 2003 | |
| LEE, Howe Yong | | | 53 | | | Independent Non-Executive Director | | | 2004 | |
| LEE, Yichin | | | 48 | | | Independent Non-Executive Director | | | 2003 | |
| TANG, Quincy | | | 46 | | | Chief Financial Officer | | | 2008 | |
| WONG, Lester A. | | | 42 | | | General Counsel | | | 2008 | |
| CAHILL, Robert J. | | | 43 | | | Head of Gaming software and Services Business | | | 2004 | |
| CHEN, Yautian | | | 39 | | | Head of Online Games Business in Taiwan and Hong Kong | | | 2008 | |
| WANG, Jim Ji | | | 38 | | | Head of Online Games Business in the PRC | | | 2008 | |
| | | |
| * | | Mr. Ding was appointed as chairman of the board of directors of our Company on May 14, 2009 following the resignation of Mr. Daniel Chuen-Tai Wu, the former chairman, on April 29, 2009. |
Biographical information with respect to each of our directors and executive officers is set forth below.
Directors
MICHAEL Y.J. DING is chairman of the board of directors of our Company and an independent non-executive director of our Company. Mr. Ding is currently the chairman and CEO of Waterland Securities Co, Ltd. Previously, Mr. Ding was chairman of Fubon Securities Investment Consulting Co., Ltd., and president and chief executive officer of Fubon Asset Management Co., Ltd., president and fund manager of the R.O.C. Fund (listed on the New York Stock Exchange), as well as president of the International Investment Trust Co. in Taiwan, where he also served as chief investment officer and a senior vice president. Mr. Ding was previously chief economist and head of research at Citicorp International Securities Ltd. in Taipei and head of research and information for the Greater China region at McKinsey & Co., Inc. Mr. Ding holds a bachelor’s degree in laws from Chinese Cultural University and a master’s degree and a doctorate degree in economics from Indiana University.
70
ARTHUR M. WANG is chief executive officer and a director of our Company. He is also a member of the board of Linmark Group, a Hong Kong Stock Exchange listed global sourcing firm, where he serves as chair of the compensation committee. Previously, Mr. Wang was a managing partner of 698 Capital Limited, an Asian investment firm, as well as an executive director of KGI Asia Limited (“KGI”). At KGI, Mr. Wang served as head of corporate finance. He also served as an investment advisor and board member of UFJ Asia Finance Technology Fund of the UFJ Group (formerly the Sanwa Bank Group of Japan), and as a board member and director of Softbank Investment International (Strategic) Limited, the Hong Kong Stock Exchange listed arm of Softbank Corporation. He practiced corporate and securities law in the New York and Hong Kong offices of Skadden, Arps, Slate, Meagher & Flom LLP. Mr. Wang received his bachelor’s degree from the University of California, Los Angeles, and his Juris Doctorate degree from Yale Law School.
THOMAS T. HUI is president, chief operating officer and a director of our Company. Mr. Hui joined GigaMedia from Goldman Sachs (Asia) L.L.C. (“Goldman Sachs”), where he was an executive director of the investment banking division. At Goldman Sachs, Mr. Hui originated and executed a broad range of mergers and acquisitions and financing transactions in Asia. Prior to working at Goldman Sachs, Mr. Hui served as an investment banker at Merrill Lynch & Co. and as a management consultant at McKinsey & Company, both in Hong Kong. Mr. Hui received a bachelor’s degree in electrical engineering from the University of Wisconsin — Madison and a master’s degree in electrical engineering from Cornell University.
GILBERT BAO is an independent non-executive director of our Company. He also currently serves in various positions, including chairman of Chung Shing Textile Co., Ltd., general supervisor of Taiwan Spinners Association, an independent director of China Development Financial Holding Corporation, and chairman of Taiwan Manmade Fiber Industry Association. He graduated from the University of Southern California in 1986.
EMMET YU-JUI HSU is an independent non-executive director of our Company. He is also currently chairman and president of Shihlin Electric and Engineering Corp., Hsinchu Transportation Co. Ltd., and The Ambassador Hotel in Taipei, Taiwan. He majored in business administration at the University of Southern California and received an MBA degree from Chengchi University in Taiwan.
NANCY JING-YING HU ZEE is an independent non-executive director of our Company. Ms. Hu is currently chief executive officer of Asia Television Limited, which is one of the free-to-air television broadcasters in Hong Kong. Ms. Hu holds a bachelor’s degree from National Taiwan University, a master’s degree in computers from Barry University and an MBA degree from Florida International University.
HOWE YONG LEE is an independent non-executive director of our Company. He is currently the managing director of Lee Kim Yew (Pte) Ltd., an investment company based in Singapore. Mr. Lee received a bachelor’s degree in business administration from the University of Washington in 1984.
YICHIN LEE is an independent non-executive director of our Company. He is also currently the managing director of Giant Management Consulting, LLC of Taiwan and a founder of AMIA, Inc., an education consultancy based in Belmont, California. Since 2007, Mr. Lee has also served as an independent director of the Board of Asia Pacific Wire & Cable Corp. Ltd. (NASDAQ: AWRCF.PK). Mr. Lee holds a doctorate degree in resource planning and management from Stanford University.
Executive Officers
QUINCY TANG is the chief financial officer of our Company. Mr. Tang has over 20 years of financial and managerial experience. Prior to joining us, Mr. Tang was chief financial officer of Vimicro International Corporation and served in various corporate management and finance positions, including the finance director of TOM Group, a Hong Kong-listed Internet and media company, and an auditor at Deloitte Touche Tohmatsu. Mr. Tang is a fellow member of the Hong Kong Institute of Certified Public Accountants, a fellow member of the Association of Chartered Certified Accountants in the United Kingdom, and an associate member of the Hong Kong Institute of Chartered Secretaries. Mr. Tang graduated from Hong Kong Polytechnic University with a bachelor’s degree in accountancy.
LESTER A. WONG is general counsel of our Company. Prior to joining us, Mr. Wong was the senior legal counsel in CDC Corporation (NASDAQ: CHINA), a provider of enterprise software, online games, and Internet and media services. Prior to that, Mr. Wong was an associate in Latitude Capital Group, an Asian merchant banking firm. Mr. Wong was admitted to the Law Society of Upper Canada (Ontario) in 1993, Law Society of British Columbia in 1993 and Law Society of Hong Kong in 1997. Mr. Wong obtained a bachelor’s degree from the University of Western Ontario and the bachelor of law degree from the University of British Columbia in Canada.
71
ROBERT J. CAHILL is the head of the gaming software and services business of our Company. Mr. Cahill is chief executive officer of CESL. Prior to joining our Company, Mr. Cahill served as chief financial officer for Smarterkids.com. He also previously served in the finance group for Gensym Corporation and as an audit manager at Ernst & Young, LLC. Mr. Cahill received a bachelor’s degree in business administration from the University of Massachusetts and an MBA degree from Bentley College.
YAUTIAN CHEN is the head of the online games business in Taiwan and Hong Kong. Mr. Chen has been chief executive officer of FunTown since November 2008. Prior to joining us, Mr. Chen was chief executive officer for Cayenne Techology Co., Ltd., an online game company. Prior to that, he served in various positions, including chief executive officer for Webzen Taiwan Corporation, an online game company, and the manager of the strategic division in Taiwan Index Co., which is also engaged in online games business. Mr. Chen received a master’s degree in sociology from National Cheng-Chi University in Taiwan.
JIM JI WANG is the head of the online games business in the PRC. Mr. Wang has been chief executive officer of T2CN since March 2008, and also held various positions within T2CN, including chief strategy officer, president and director. Prior to joining T2CN, he was the founder and president of HDT Technologies, Inc., an Internet technology and service provider in the PRC. Mr. Wang graduated from Fudan University in China with a bachelor’s degree in computer software.
B. Compensation
Compensation of Directors and Executive Officers
For the year ended December 31, 2008, the aggregate cash compensation paid by us to our directors and executive officers was approximately US$2.4 million. For information on total amounts set aside by our Company to provide pension and retirement benefits, see Note 19 to our consolidated financial statements.
As of December 31, 2008, the total outstanding number of share options granted to our directors and officers was 5,024,000, of which 4,084,000 shares were vested and 940,000 were unvested. As of the same date, the total number of restricted stock units granted to our directors and officers was 542,256, of which 49,160 shares were vested and 493,096 were unvested. For more information on stock option plans and equity incentive plans, see “ — E. Share Ownership” below.
Employment of Executive Officers
Officers are selected by and serve at the discretion of our board of directors. No executive officer is entitled to any severance benefits upon termination of his or her employment with our Company.
C. Board Practices
Our board of directors is currently comprised of eight directors, including six independent non-executive members. Each of our directors is elected by our Company’s shareholders and hold office until such director’s successor is elected and duly qualified, or until such director’s earlier death, bankruptcy, insanity, resignation or removal. No director is entitled to any severance benefits on termination of his or her service. We have established two committees of the board of directors, including the audit committee and the compensation committee.
Our audit committee currently consists of Michael Y. J. Ding, Gilbert Bao and Yichin Lee. Our audit committee will select and evaluate, on our behalf, the independent public accountants who audit our annual financial statements, and will review and approve the planned scope of our annual audit, subject to the appointment, replacement or removal from office of our independent public accountants as has been approved by our shareholders at our Annual General Meeting. In accordance with our Articles of Association and our audit committee charter, all of the members of our audit committee must be persons who qualify as independent directors under the standards set forth in NASDAQ Marketplace Rules 4350(d)(2)(A)(i) and (ii) and each of them is able to read and understand fundamental financial statements.
Our compensation committee currently consists of Michael Y.J. Ding and Yichin Lee. Our compensation committee reviews and evaluates the compensation and performance of executive officers, our Company’s general compensation plans and other employee benefit plans, and performs other duties and responsibilities pursuant to the compensation committee charter. In accordance with our compensation committee charter, all of the members of the compensation committee are qualified independent directors under the standards set forth in NASDAQ Marketplace Rules 4350(d)(2)(A)(i) and (ii).
72
D. Employees
In the years ended December 31, 2006, 2007 and 2008, our total employees were 503, 975 and 751, respectively.
As of May 31, 2009, we had a total of 839 employees, excluding part-time and temporary personnel and consultants. Of the total 839 employees as of May 31, 2009, 93 were located at our corporate headquarters; 173 were employed for our gaming software and service business; and 573 were employed for our online games business, including 295 employees in FunTown and 278 employees in T2CN. Of the total 839 employees, 666 were in Asia and 173 were in North America.
E. Share Ownership
Share Ownership of Directors and Executive Officers
The table below sets forth information as to our directors’ and executive officers’ share ownership in our Company as of May 31, 2009:
| | | | | | | | | |
| | | Number of | | | Number of Shares | |
| | | Common | | | Issuable upon exercise | |
| Person | | Shares | | | of options | |
| DING, Michael Y.J. | | | * | | | | * | |
| WANG, Arthur M. | | | * | | | | 2,249,000 | |
| HUI, Thomas T. | | | * | | | | 1,600,000 | |
| BAO, Gilbert T.C. | | | * | | | | * | |
| HSU, Emmet Yu-Jui | | | 0 | | | | * | |
| HU ZEE, Nancy Jing-Ying | | | * | | | | * | |
| LEE, Howe Yong | | | * | | | | * | |
| LEE, Yichin | | | * | | | | * | |
| TANG, Quincy | | | 0 | | | | * | |
| WONG, Lester A. | | | 0 | | | | * | |
| CAHILL, Robert J. | | | * | | | | 600,000 | |
| CHEN, Yautian | | | 0 | | | | 0 | |
| WANG, Jim Ji | | | * | | | | 0 | |
| Directors and Officers as a group | | | * | | | | 5,024,000 | |
All options granted to our directors and executive officers were granted pursuant to the option plans and the equity incentive plans as described under “ — Employee Share Option Plans and Equity Incentive Plans” below.
Employee Share Option Plans and Equity Incentive Plans
2002 Employee Share Option Plan
At the June 2002 Annual General Meeting, the shareholders of our Company approved the GigaMedia Limited 2002 Employee Share Option Plan (the “2002 Plan”) under which up to 3,000,000 common shares of our Company were reserved for issuance. All employees, officers, directors, advisors and consultants of our Company are eligible to participate in the 2002 Plan. The 2002 Plan is administered by a committee designated by the board of directors. The committee as plan administrator has complete discretion to determine the exercise price for the option grants, to determine which eligible individuals are to receive option grants, the time or times when options grants are to be made, the number of shares subject to grant and vesting schedule.
73
In August 2004, options to purchase 3,000,000 shares of our Company’s common stock were granted and vested at an exercise price of US$0.79 pursuant to the 2002 Plan. The maximum contractual term under the 2002 Plan is approximately 10 years. Termination of employment will not affect rights of exercise under vested options.
2004 Employee Share Option Plan
At the June 2004 Annual General Meeting, the shareholders of our Company approved the GigaMedia Limited 2004 Employee Share Option Plan (the “2004 Plan”) under which up to 7,000,000 common shares of our Company were reserved for issuance. All employees, officers, directors, advisors and consultants of our Company are eligible to participate in the 2004 Plan. The 2004 Plan is administered by a committee designated by the board of directors. The committee as plan administrator has complete discretion to determine the exercise price for the option grants, to determine which eligible individuals are to receive option grants, the time or times when options grants are to be made and the number of shares subject to grant vesting schedule.
In August 2004, options to purchase 5,462,530 shares of our Company’s common stock were granted at an exercise price of US$0.79 pursuant to the 2004 Plan. These options were subject to two vesting schedules. In accordance with the terms of the first vesting schedule, 3,863,888 options were vested and exercisable upon granting. In accordance with the terms of the second vesting schedule, 1,598,642 options were granted, of which 399,663 options were vested and exercisable upon granting. The remaining 1,198,979 options were vested at a rate of 399,661 options per year from the grant date.
In May 2005, options to purchase 100,000 shares of our Company’s common stock were granted at an exercise price of US$1.45 pursuant to the 2004 Plan. In accordance with the terms of the vesting schedule, 25,000 options were vested and exercisable upon granting. The remaining 75,000 options were vested at the rate of 25,000 options per year from the grant date.
In December 2005, options to purchase 1,805,655 shares of our Company’s common stock were granted at an exercise price of US$2.55. These options were subject to two vesting schedules. In accordance with the terms of the first vesting schedule, 1,570,655 options were vested and exercisable upon granting. In accordance with the terms of the second vesting schedule, 94,000 options were vested and exercisable in December 2007. The remaining 141,000 options were vested and exercisable in December 2008.
The maximum contractual term under the 2004 Plan is 10 years. Termination of employment will not affect exercise rights under vested options. Unvested options will be forfeited upon termination of employment.
2006 Equity Incentive Plan
At the June 2006 Annual General Meeting, the shareholders of our Company approved the GigaMedia Limited 2006 Equity Incentive Plan (the “2006 Plan”) under which up to 1,000,000 common shares of our Company have been reserved for issuance. The 2006 Plan is administered by a committee designated by the board of directors. The committee as plan administrator has complete discretion to determine the grant of awards under the 2006 Plan.
In December 2006, we granted 115,000 restricted stock units (“RSUs”) to our employees. These RSUs were subject to two schedules for the lapsing of restrictions on transfer. 25,000 RSUs are subject to the terms of the first lapsing schedule, under which the restrictions on transfer shall lapse with respect to the first 33 percent of the RSUs upon granting with the remaining 67 percent of the RSUs vesting over a two-year period so long as the employee is employed by or providing services to our Company. 90,000 RSUs are subject to the terms of the second lapsing schedule, under which the restrictions on transfer shall lapse with respect to approximately 33 percent of the RSUs annually over a three-year period, beginning April 1, 2007 so long as the employee is employed by or providing services to our Company.
74
In March 2007, we granted 49,000 RSUs to employees of our Company. In accordance with the terms of the lapsing schedule, the restrictions on transfer shall lapse with respect to approximately 14.29 percent of the RSUs quarterly from June 2007 to December 2008 so long as the employee is employed by or providing services to our Company.
In August 2007, we granted 30,000 RSUs to directors of our Company. In accordance with the terms of the lapsing schedule, the restrictions on transfer shall lapse with respect to 25 percent of the RSUs quarterly from November 2007 to August 2008 so long as the directors are providing services to our Company. In August 2007, we also granted 126,443 RSUs to employees of our Company. These RSUs were subject to two schedules for the lapsing of restrictions on transfer. 6,443 RSUs are subject to the terms of the first lapsing schedule, under which the restrictions on transfer shall lapse with respect to approximately 33 percent of the RSUs annually over a three-year period, beginning January 1, 2008 so long as the employee is employed by or providing services to our Company. 120,000 RSUs are subject to the terms of the second lapsing schedule, under which the restrictions on transfer shall lapse with respect to 6.25 percent of the RSUs quarterly from November 2007 to August 2011 so long as the employee is employed by or providing services to our Company. Also in August 2007, options to purchase 580,000 shares of our Company’s common stock were granted at an exercise price of US$10.15. In accordance with the terms of the vesting schedule, 6.25 percent of the options are vested quarterly from November 2007 to August 2011.
In October 2007, options to purchase 50,000 shares of our Company’s common stock were granted at an exercise price of US$16.60. In accordance with the terms of the vesting schedule, 6.25 percent of the options are vested quarterly from January 2008 to October 2011.
In January 2008, options to purchase 31,987 shares of our Company’s common stock were granted at an exercise price of US$16.01. In accordance with the terms of the vesting schedule, 50 percent of the options are vested annually from January 2009 to January 2010.
In January 2008, we also granted 17,113 RSUs to employees of our Company. In accordance with the terms of the lapsing schedule, the restrictions on transfer shall lapse with respect to approximately 50 percent of the RSUs annually from January 2009 to January 2010 so long as the employee is employed by or providing services to our Company.
The maximum contractual term under the 2006 Plan is 10 years. Options will be forfeited upon termination of employment, unless the relevant award agreement extends the exercisability of the outstanding options. In the event that the employee’s employment with or service to our Company is terminated prior to the lapsing of restrictions with respect to any portion of the RSUs, such portion of the RSUs shall become forfeited.
2007 Equity Incentive Plan
At the June 2007 Annual General Meeting, the shareholders of our Company approved the GigaMedia Limited 2007 Equity Incentive Plan (the “2007 Plan”) under which up to 2,000,000 common shares of our Company have been reserved for issuance. The 2007 Plan is administered by a committee designated by the board of directors. The committee as plan administrator has complete discretion to determine the grant of awards under the 2007 Plan.
In August 2007, options to purchase 465,000 shares of our Company’s common stock were granted at an exercise price of US$10.15. These options were subject to two vesting schedules. In accordance with the terms of the first vesting schedule, 6.25 percent of the 400,000 options are vested quarterly from November 2007 to August 2011. In accordance with the terms of the second vesting schedule, 25 percent of the 65,000 options are vested annually from August 2008 to August 2011.
In December 2007, options to purchase 50,000 shares of our Company’s common stock were granted at an exercise price of US$18.17. In accordance with the terms of the vesting schedule, 6.25 percent of the options are vested quarterly from March 2008 to December 2011.
In January 2008, options to purchase 18,818 shares of our Company’s common stock were granted at an exercise price of US$16.01. In accordance with the terms of the vesting schedule, 50 percent of the options are vested annually from January 2009 to January 2010.
75
In March 2008, we granted 51,735 RSUs to employees of our Company. In accordance with the terms of the lapsing schedule, the restrictions on transfer shall lapse with respect to approximately 12.5 percent of the RSUs quarterly from April 2008 to January 2010 so long as the employee is employed by or providing services to our Company.
In September 2008, we granted 465,000 RSUs to employees of our Company. In accordance with the terms of the lapsing schedule, the restrictions on transfer shall lapse upon the occurrence of a Change of Control so long as the employee is employed by or providing services to our Company.
In December 2008, we granted 100,000 RSUs to employees of our Company. In accordance with the terms of the lapsing schedule, the restrictions on transfer shall lapse with respect to approximately 25 percent of the RSUs quarterly from December 2009 to December 2012 so long as the employee is employed by or providing services to our Company.
In December 2008, options to purchase 730,000 shares of our Company’s common stock were granted at an exercise price of US$4.24. In accordance with the terms of the vesting schedule, 25 percent of the options will be vested annully from December 2009 to December 2012.
The maximum contractual term under the 2007 Plan is 10 years. Options will be forfeited upon termination of employment, unless the relevant award agreement extends the exercisability of the outstanding options.
2008 Equity Incentive Plan
At the June 2008 Annual General Meeting, the shareholders of our Company approved the GigaMedia Limited 2008 Equity Incentive Plan (the “2008 Plan”) under which up to 1,000,000 common shares of our Company have been reserved for issuance. The 2008 Plan is administered by a committee designated by the board of directors. The committee as plan administrator has complete discretion to determine the grant of awards under the 2008 Plan.
In December 2008, options to purchase 560,000 shares of our Company’s common stock were granted at an exercise price of US$4.24. These options were subject to two vesting schedules. In accordance with the terms of the first vesting schedule, 25 percent of 360,000 options are vested annually from December 2009 to December 2012. In accordance with the terms of the second vesting schedule, 16.7 percent of the remaining 200,000 options will be vested annually from December 2009 to December 2014.
The maximum contractual term under the 2008 Plan is 10 years. Options will be forfeited upon termination of employment, unless the relevant award agreement extends the exercisability of the outstanding options.
All options, RSUs and other share-based awards are expected to be settled by issuing new shares.
Options
In 2006, 2007 and 2008, 1,151,514, 1,910,996 and 518,284 options were exercised, respectively, and cash received from the exercise of stock options was US$1.3 million, US$2.7 million and US$0.5 million respectively, which resulted in no significant tax benefit realized on a consolidated basis.
The impact resulting from our adoption of FAS 123(R) on income before income taxes and net income on our 2006 consolidated financial statement was US$310 thousand, and US$250 thousand, respectively. The impact on basic and diluted earnings per share was not material.
76
Employee Share Purchase Plans
At the June 2004 Annual General Meeting, the shareholders of our Company approved the GigaMedia Limited 2004 Employee Share Purchase Plan (the “2004 ESPP”) under which up to 2,000,000 common shares of our Company were reserved for issuance. Pursuant to the 2004 ESPP, our Company offered the Shares to qualified employees on favorable terms and established a restricted period of six months during which employees may not transfer the shares after purchasing them. To be eligible, employees must be employed by our Company or its subsidiaries and the customary employment shall be employed to work not less than 20 hours per week. Employees are also subject to certain restrictions on the amount that may be invested to purchase the shares and to other terms and conditions of the 2004 ESPP. The 2004 ESPP is a one-time plan and is administered by a committee designated by the board of directors. In March 2005, there were 189,642 shares subscribed by eligible employees at a purchase price of approximately US$1.39 per share.
At the June 2008 Annual General Meeting, the shareholders of our Company approved the GigaMedia Limited 2008 Employee Share Purchase Plan (the “2008 ESPP”) under which up to 200,000 common shares of our Company were reserved for issuance. Any person who is regularly employed by our Company or our designated subsidiaries shall be eligible to participate in the 2008 ESPP. Pursuant to the 2008 ESPP, our Company would offer the Shares to qualified employees on favorable terms. Employees are also subject to certain restrictions on the amount that may be invested to purchase the shares and to other terms and conditions of the 2008 ESPP. The 2008 ESPP is administered by a committee designated by the board of directors. As of the date of this annual report, no shares have been subscribed by qualified employees.
Outstanding Options Granted Under Our Employee Share Option Plans and Equity Incentive Plans
The following table summarizes, as of May 31, 2009, the outstanding options granted under our employee share option plans and equity incentive plans to our directors and executive officers as a group.
| | | | | | | | | | | | | |
| | | Ordinary Shares | | | | | | | |
| | | Underlying | | | | | | | |
| | | Outstanding | | | Exercise Price | | | | |
| Date of Grant | | Options | | | ($/Share) | | | Date of Expiration | |
| August 12, 2004 | | | 3,559,000 | | | | 0.79 | | | June 29, 2014 |
| December 18, 2005 | | | 400,000 | | | | 2.55 | | | June 29, 2014 |
| August 9, 2007 | | | 400,000 | | | | 10.15 | | | August 9, 2017 |
| December 1, 2008 | | | 150,000 | | | | 4.24 | | | June 29, 2017 |
| | | | 515,000 | | | | 4.24 | | | June 19, 2018 |
| | | | | | | | | | | | |
| Total | | | 5,024,000 | | | | | | | | | |
| | | | | | | | | | | | |
ITEM 7. MAJOR SHAREHOLDERS AND RELATED-PARTY TRANSACTIONS
A. Major Shareholders
The following table sets forth information known to us with respect to the ownership of our Shares as of March 31, 2009 by each shareholder known by us to own more than 5 percent of our Shares:
| | | | | | | | | |
| | | | | | | Percentage of | |
| Name of Owner | | Shares Owned | | | Shares Owned | |
| Best Method Limited (1) | | | 10,799,999 | | | | 19.85 | % |
| Criterion Capital Management, LLC | | | 7,937,694 | | | | 14.59 | % |
| | | |
| (1) | | Through Best Method Limited, a British Virgin Islands company, Jeffrey Koo, Jr. and Andre Koo jointly have a beneficial ownership of 10,799,999 common shares of our Company. |
77
As of March 31, 2009, we had 54,418,123 Shares outstanding, of which 35,680,430 shares representing approximately 65.57 percent of our total outstanding shares were not held by our major shareholders as disclosed above. As of March 31, 2009, 54,197,265 Shares were held by 22 record holders, including nominee holders, with a registered address in the United States.
None of our major shareholders have voting rights different from those of our other shareholders.
B. Related-Party Transactions
We have engaged from time to time in various transactions with related parties.
Until September 2008, in the course of operating our business, we provided Internet access and services to, or sourced services from, our Company’s related parties, including companies in which we hold an interest and companies with which members of our board, senior managers of our Company, and our major shareholders or beneficial owners are associated. Transactions with these related parties did not have material effect on our business operations.
Except for the following transactions, we were not a party to any transaction with any related party that did not arise in the ordinary course of business or that was material to us.
Licensing Contractual Arrangements
As of December 31, 2007, December 31, 2008 and May 31, 2009, JC Entertainment Corporation (“JC”) owned 10.5, 10.8 and 10.8 percent, respectively, of the total outstanding voting rights of T2CN. On December 24, 2007, T2 Entertainment, our PRC operating VIE, entered into a game license agreement with JC and an independent third party (the “co-licensor”), under which JC and the co-licensor granted a game software license to T2 Entertainment. During 2007, after our consolidation of T2CN, T2CN paid to JC the total licensing fees of approximately US$3.0 million and total royalty fees of approximately US$1.4 million. During 2008, T2CN paid to JC the total licensing fees of approximately US$1.2 million and total royalty fees of approximately US$2.8 million. During the period from January 1, 2009 until March 23, 2009, T2 Entertainment paid to JC the total licensing fees of nil and total royalty fees of approximately US$1.2 million. On March 23, 2009, T2 Entertainment and JC and the co-licensor entered into a termination and transfer agreement, under which the game license agreement was terminated and T2 Entertainment agreed to transfer all its rights under the game license agreement to the co-licensor in exchange for the total consideration of US$2 million in cash. The total amount of US$2 million has been fully paid.
Borrowings
A former key management member of Fubon Financial Holdings Limited (who resigned from Fubon Finanical Holdings Limited in 2008), is one of our directors. Fubon Financial Holdings Limited owned 100 percent of Taipei Fubon Commercial Bank, As of December 31, 2007, we had short-term borrowings in the amount of US$6.2 million, bearing interest of 3.902 percent, indebted to Taipei Fubon Commercial Bank, and we pledged time deposits as collateral for borrowings from Taipei Fubon Commercial Bank of approximately US$2.5 million. We have repaid in full our borrowings from Taipei Fubon Commercial Bank. As of May 31, 2009, we had no short-term borrowings owed to Taipei Fubon Commercial Bank.
A key manager of Waterland Financial Holdings is one of our directors. As of May 31, 2009, we had short-term borrowings in the amount of US$1.5 million, bearing interest of 3.788 percent, indebted to Waterland Financial Holdings.
Stock Transaction
In December 2006, we resigned from the board of directors of Gamania Digital Entertainment Co., Ltd. (“Gamania”). Following our resignation from the board of Gamania, we sold in the public market all of our Gamania shares, which resulted in gains of US$2.1 million reported in discontinued operations.
78
Stock Option Grants and Employee Share Purchase
See Item 6, “Directors, Senior Management and Employees — E. Share Ownership.”
C. Interests of Experts and Counsel
Not applicable.
ITEM 8. FINANCIAL INFORMATION
A. Consolidated Statements and Other Financial Information
Financial Statements
See pages beginning on page F-1 in this annual report.
Information on Legal or Arbitration Proceedings
Class Action
In December 2001, a class action lawsuit was filed in the U.S. District Court for the Southern District of New York against our Company and some of its former directors and officers, its registration agent as well as various underwriters in connection with our initial public offering of the Shares. Substantially similar actions were filed concerning the initial public offerings by more than 300 issuers and the cases were consolidated asIn re Initial Public Offering Sec Litig, No. 91 MC 92 for pretrial purposes. After the consolidation by the District Court, there are approximately 310 consolidated actions, including action against our Company. In April 2002, a consolidated amended complaint was filed in the matter against our Company under the captionIn re GigaMedia Ltd. Initial Public Offering Securities, Litig., 01 Civ. 10884.
The complaint named as defendants our Company, its former officers and directors and its registration agent, including Chester Koo, Angelo Koo, Jeffrey Koo, Jr., Leslie Koo, Andre Koo, Morris Chang, Stephen Wu, Kent Yen, Raymond Chang, Yichun Chang and Donald Puglisi (collectively, the “Individual Defendants”). The complaint also named as defendants certain underwriters, including Goldman Sachs & Co., Inc. and Deutsche Bank Alex Brown, Inc.
The plaintiffs asserted claims against the defendants for alleged violations of Sections 11 and 15 of the Securities Act of 1933 (the “Securities Act”), Section 10(b) of the Securities Exchange Act of 1934 (the “Securities Exchange Act”), Rule 10b-5 under the Securities Exchange Act and Section 20(a) of the Securities Exchange Act. The plaintiffs’ substantive allegations included: (i) unlawful conduct in connection with the initial public offering; (ii) the registration statement or prospectus was materially false and misleading; (iii) market manipulation through the use of analysts; and (iv) unlawful conduct through the artificial inflation of the stock price. The plaintiffs sought to hold all defendants jointly and severally liable for class damages and statutory compensation in an amount to be determined at trial, plus interest, costs and attorneys’ fees.
In July 2002, the underwriter defendants filed their motion to dismiss the amended complaints. Subsequently, the issuer defendants filed their motion to dismiss the amended complaints. The parties completed the briefing on the motions to dismiss and the District Court held oral arguments on these motions. In October 2002, the plaintiffs voluntarily dismissed their claims against the Individual Defendants without prejudice. In February 2003, the District Court granted the motions in part and denied the motions in part. As to our Company, the Rule 10b-5 claims were dismissed without prejudice while the Section 11 claims survived the motion.
79
In June 2004, the plaintiffs and the issuer defendants, including our Company, presented the executed settlement agreement to the presiding judge during a court conference. The proposed settlement agreement did not resolve plaintiffs’ claims against the underwriter defendants. The terms of settlement, if approved, would have dismissed and released all of the settling issuer defendants, including our Company. In February 2005, the District Court granted preliminary approval to the settlement agreement, subject to a narrowing of the proposed bar order as to only contribution claims. In July 2005, the settling parties reached agreement and submitted modifications to the settlement agreement in accordance with the District Court’s opinion. In August 2005, the District Court issued an order preliminarily approving the settlement. In April, 2006, the District Court held a fairness hearing on the proposed settlement. In June 2006 and October 2006, the District Court held meetings with all legal counsel involved in the case to discuss the proposed settlement. Subsequent to these meetings, the parties submitted an amendment to the proposed settlement.
In December 2006, the United States Court of Appeals for the Second Circuit issued an opinion vacating the District Court’s class certification of a litigation class in that portion of the case between the plaintiffs and the underwriter defendants. In January 2007, plaintiffs filed a petition in the Second Circuit for rehearing regarding the decision on class certification. In April 2007, the Second Circuit rendered its decision, which denied the rehearing petition. In June 2007, the District Court signed an order terminating the settlement.
In September 2007, discovery moved forward in the six focus cases, which do not include our Company. Plaintiffs filed amended complaints against underwriter defendants and issuer defendants in the six focus cases and moved for class certification in those actions. The underwriter defendants and issuer defendants filed a motion to dismiss the amended complaints in the focus cases. In March 2008, the District Court granted in part and denied in part the motion to dismiss the focus cases. The motion to dismiss was granted only as to claims brought under Section 11 of the Securities Act by plaintiffs who sold their securities for a price in excess of the initial offering price and by those plaintiffs who purchased outside the previously certified class period. In May 2008, the parties completed briefing on class certification. However, in October 2008, the motion for class certification was withdrawn without prejudice.
In February 2009, liaison counsel for the plaintiffs informed the District Court that a settlement agreement had been reached among all the parties to these actions. Pursuant to the settlement agreement, the defendants agreed to pay a total amount of US$586 million (the “Settlement Amount”) in exchange for the plaintiffs’ agreement to release all claims arising from or related to the allegations in the complaint. In addition, the issuers’ insurers and the underwriter defendants agreed to advance US$10 million for the purposes of notice and administration costs. The parties stipulated that final approval of the settlement in all actions is required. Subsequently in February 2009, the plaintiffs made a motion for preliminary approval of the settlement. On or around June 10, 2009, the District Court granted the plaintiffs’ motion for preliminary approval of the settlement agreement, and set the date for a hearing on final approval of the settlement on September 10, 2009.
Our Company’s share of the Settlement Amount will be paid by the insurance. We had an insurance policy with American Insurance Group with US$10 million of liability coverage when the class action lawsuit was made. According to the insurance policy, our Company is required to pay a US$500,000 deductible. We recorded a provision of US$500,000 in 2003, representing our deductible amount, related to these claims. In 2005, our legal counsel advised that it is unlikely that we will have to pay any remaining, unused portion of our deductible with respect to the claims. Accordingly, we reversed the provision of US$500,000 in 2005. We believe that the insurance coverage is sufficient to cover the liability arising from the settlement and claims.
Patent Litigation
In July 2006, Hoshin GigaMedia, our wholly-owned subsidiary, obtained a patent in Taiwan (Patent No. I258284), which entitles us to use the method of “Point to Point Protocol over Ethernet” to distribute fixed internet protocol addresses to our ADSL users (the “PPPoE Patent”).
Two major Taiwanese Internet access and service providers, Taiwan Fixed Network Co., Ltd. (“TFN”) and Chunghwa Telecom Co., Ltd. (“CHT”), are using the PPPoE method to distribute fixed Internet protocol addresses to their ADSL users, which we believe infringes our PPPoE Patent.
80
In April and May 2008, we filed lawsuits in Taipei District Court against TFN and CHT for infringement of our PPPoE Patent and claimed damages amounting to approximately US$1.54 million and US$15.42 million, respectively. Both TFN and CHT have submitted their defenses and the court procedures are proceeding. On May 12, 2009, Taipei District Court completed the sixth hearing in connection with our allegations against CHT and instructed the parties to continue the negotiation for a settlement. On May 26, 2009, Taipei District Court completed the third hearing in connection with our allegations against TFN and set the next hearing for further investigation. Neither we, nor our legal counsel, are able to assess the likelihood of the outcome.
In addition, TFN and CHT filed patent invalidation applications with Taiwan Intellectual Property Office and Taiwan Ministry of Economic Affairs to invalidate the PPPoE Patent against us in July 2008 and January 2009, respectively. The patent invalidation applications are still under review and investigation by Taiwan Intellectual Property Office, we are not able to assess the likelihood of the outcome, nor can we provide a timeline for the eventual resolutions.
We are not involved in any other litigation or legal or administrative proceedings that, in our management’s view, would have a material adverse effect on our business operations.
Dividend Policy
We have neither declared nor paid any dividends on our Shares. We anticipate that we will continue to retain any earnings for use in the operation of our business, and we do not intend to pay dividends in the foreseeable future. See Item 10, “Additional Information — B. Memorandum and Articles of Association — Dividends” in this annual report.
B. Significant Changes
Except as disclosed in this annual report, no significant change has occurred since the date of our consolidated financial statements.
ITEM 9. THE OFFER AND LISTING
Not applicable, except for “ — A. Offer and Listing Details — 4. Information Regarding the Price History of the Stock” and “ — C. Markets” as disclosed below.
Our Shares have been listed and traded on the NASDAQ Stock Market since February 18, 2000.
The following table shows, for the periods indicated, the high and low closing prices for our Shares as quoted on the NASDAQ Stock Market.
| | | | | | | | | |
| | | Common Shares | |
| Year Ending December 31 | | High | | | Low | |
| | | (in US$) | |
| 2004 | | $ | 2.43 | | | $ | 0.70 | |
| 2005 | | $ | 2.99 | | | $ | 1.30 | |
| 2006 | | $ | 12.38 | | | $ | 2.90 | |
| 2007 | | $ | 24.61 | | | $ | 9.28 | |
| 2008 | | $ | 20.70 | | | $ | 2.90 | |
| | | | | | | | | |
| | | Common Shares | |
| Year Ending December 31, 2007 | | High | | | Low | |
| | | (in US$) | |
| First quarter | | $ | 14.34 | | | $ | 9.28 | |
| Second quarter | | $ | 15.97 | | | $ | 12.96 | |
| Third quarter | | $ | 16.76 | | | $ | 9.45 | |
| Fourth quarter | | $ | 24.61 | | | $ | 16.43 | |
81
| | | | | | | | | |
| | | Common Shares | |
| Year Ending December 31, 2008 | | High | | | Low | |
| | | (in US$) | |
| First quarter | | $ | 20.70 | | | $ | 14.24 | |
| Second quarter | | $ | 19.26 | | | $ | 11.93 | |
| Third quarter | | $ | 13.32 | | | $ | 6.83 | |
| Fourth quarter | | $ | 7.30 | | | $ | 2.90 | |
| | | | | | | | | |
| | | Common Shares | |
| Year Ending December 31, 2009 | | High | | | Low | |
| | | (in US$) | |
| First quarter | | $ | 7.47 | | | $ | 4.33 | |
| Second quarter (through June 25, 2009) | | $ | 7.02 | | | $ | 5.29 | |
| | | | | | | | | |
| | | Common Shares | |
| Monthly Highs and Lows | | High | | | Low | |
| | | (in US$) | |
| December 2008 | | $ | 6.48 | | | $ | 4.24 | |
| January 2009 | | $ | 6.92 | | | $ | 5.63 | |
| February 2009 | | $ | 7.47 | | | $ | 5.85 | |
| March 2009 | | $ | 6.36 | | | $ | 4.33 | |
| April 2009 | | $ | 7.02 | | | $ | 5.51 | |
| May 2009 | | $ | 6.70 | | | $ | 5.79 | |
| June 2009 (only through June 25, 2009) | | $ | 6.30 | | | $ | 5.29 | |
Under NASDAQ Rule 4350(l), as amended (“Rule 4350(1)”), all securities listed on NASDAQ must be eligible for a direct registration program, or DRS, operated by a registered clearing agency, unless the foreign private issuer is prohibited from complying by a law or regulation in its home country. In order to fulfill the direct registration program eligibility requirements, we are required to, among other provisions; amend our constitutional documents to allow for the issue of non-certificated securities.
We are incorporated in the Republic of Singapore and are subject to the Singapore Companies Act (Cap.50). We are advised by our Singapore counsel that, under the Singapore Companies Act, Singapore-incorporated companies are required to issue physical share certificates to its registered shareholders, and there are no exceptions to or exemptions from this requirement that would enable us to amend our constitutional documents to allow for the issue of non-certificated securities. Therefore, we will not be able to comply with the DRS eligibility provisions of Rule 4350(l).
Under Rule 4350(1), as a foreign private issuer, we are allowed to follow our home country practice in lieu of the requirements set out in the rule, subject to certain exceptions. We will be relying on this rule for an exemption from the DRS eligibility requirement under Rule 4350(l). We have informed the NASDAQ Stock Market about our election to comply with the laws of Singapore in lieu of the DRS eligibility provisions of Rule 4350(l).
ITEM 10. ADDITIONAL INFORMATION
A. Share Capital
Not applicable.
82
| B. | | Memorandum and Articles of Association |
We incorporate by reference into this annual report the description of our amended memorandum and articles of association contained in our annual report for the year ended December 31, 2007 on Form 20-F (File No. 000-30540), filed with the SEC on June 30, 2008.
As of May 31, 2009, an aggregate of 54,517,356 shares have been issued and are outstanding.
C. Material Contracts
The following are summaries of our certain material contracts. However, these summaries may not contain all the information important to you. For more complete information, you should read the entire agreements, which have been included as exhibits to this annual report.
Sale of Internet Access and Service Business
Share Sale and Purchase Agreement among Champion Limited, Gigamedia International Holdings Limited and GigaMedia, dated August 28, 2008
On August 28, 2008, we entered into a share sale and purchase agreement, pursuant to which we sold 100 percent of Hoshin Multimedia to Champion Limited, an affiliate of China Network Systems Co., Ltd. for an aggregate sale price of US$7.0 million.
Share Sale and Purchase Agreement between China Network Systems Co., Ltd. and Hoshin GigaMedia, dated August 28, 2008
On August 28, 2008, we entered into a share sale and purchase agreement, pursuant to which we sold 100 percent of KBT, our wholly-owned subsidiary, to China Network Systems Co., Ltd. for an aggregate sale price of US$10.0 million. In addition, we may be entitled to receive additional cash payments of US$3.0 million and US$2.0 million if the Internet access and service business that we sold achieves certain earn-out targets by September 2009 and September 2010, respectively. The earn-out targets will be determined by future gross profits in accordance with a formula and timeline set forth in the agreement.
Asset Sale and Purchase Agreement among Ko Ying Co., Ltd., Hoshin GigaMedia and China Network Systems Co., Ltd., dated August 28, 2008
On August 28, 2008, we entered into an asset sale and purchase agreement, pursuant to which we sold certain assets, rights, interests related to our Internet access and service business to Ko Ying Co., Ltd. (“Ko Ying”), a wholly-owned subsidiary of China Network Systems Co., Ltd., and Ko Ying assumed certain liabilities, for a total sale price of US$3.0 million, subject to certain adjustment.
Transitional Service Agreement among Ko Ying, Hoshin GigaMedia and KBT, dated September 3, 2008
On September 3, 2008, we entered into a transitional service agreement with Ko Ying, under which we agreed to provide certain transitional services to facilitate the sale of our Internet access and service business under the relevant sale and purchase agreements.
Assignment and Assumption Agreement between Hoshin GigaMedia and Hoshin Multimedia, dated September 3, 2008
In connection with our sale of 100 percent of Hoshin Multimedia to Champion Limited, an affiliate of China Network Systems Co., Ltd., on September 3, 2008, Hoshin GigaMedia entered into an assignment and assumption agreement with Hoshin Multimedia, under which Hoshin GigaMedia assigned to Hoshin Multimedia all of the its rights, interests, duties and obligations with respect to certain broadband service agreement. Before the assignment and assumption, Hoshin GigaMedia had exclusive rights and interests to provide broadband internet services through the cable TV system under the broadband service agreement.
83
T2CN Agreement with Jinyou
See Item 4, “Information on the Company — C. Organizational Structure” in this annual report.
Other Material Contracts
Other material contracts are incorporated by reference to our annual report for the year ended December 31, 2007 on Form 20-F (File No. 000-30540) and for additional information on our material contracts, see Item 7, “Major Shareholders and Related Party Transactions — B. Related Party Transactions” in this annual report.
D. Exchange Controls
There are no limitations imposed by Singapore law or by our Articles of Association on the right of a non-resident or foreign owner to hold or vote the Shares.
As we have disclosed in Item 3, “Key Information — D. Risk Factors — Risk Related to Doing Business in Greater China — Changes in foreign exchange and foreign investment regulations and limitations on dividend payment in the PRC may affect our ability to invest in China and the ability of our PRC subsidiaries to pay dividends and service debts” in this annual report, Renminbi is not a freely convertible currency at present. Under the current PRC regulations, conversion of Renminbi is permitted in China for routine current-account foreign exchange transactions, including trade and service related foreign exchange transactions, payment of dividends and service of foreign debts. Conversion of Renminbi for most capital-account items, such as direct investments, investments in PRC securities markets and repatriation of investments, however, is still subject to the approval of SAFE.
Pursuant to the above-mentioned administrative rules, foreign-invested enterprises, such as our PRC subsidiaries, may buy, sell and/or remit foreign currencies for current-account transactions at banks in the PRC with authorization to conduct foreign exchange business by complying with certain procedural requirements, such as presentment of valid commercial documents. For capital-account transactions involving foreign direct investment, foreign debts and outbound investment in securities and derivatives, approval from SAFE is a pre-condition. Capital investments by foreign-invested enterprises outside the PRC are subject to limitations and requirements in the PRC, such as prior approvals from the MOFCOM, SAFE and National Development and Reform Commission of the PRC.
E. Taxation
Singapore Tax Considerations
Taxation of Dividends received by Singapore Resident Shareholders
Dividends paid by us would be taxable in Singapore if they are received in Singapore or if they are considered, in the hands of a particular shareholder, to be derived in Singapore (for example if they constitute the income of a trade or business carried out in Singapore).
Under the Singapore-Taiwan Tax Treaty, if a dividend is paid by a company which is tax resident in Taiwan to a person who is tax resident in Singapore, the tax on the dividend shall not exceed an amount which, together with the corporate income tax on the profits of the company paying the dividends, constitutes 40 percent of that part of the taxable income out of which the dividends are paid. The term “corporate income tax payable” shall be deemed to include the corporate income tax that would have been paid but for the reduction or exemption under the laws designed to promote economic development.
84
If our shareholder is a company receiving or deriving such dividends is tax resident in Singapore, he would be entitled to foreign tax credits under the Singapore-Taiwan Tax Treaty and, if the recipient is a company which owns not less than 25 percent of our Shares, the tax credit will include underlying tax paid by us.
Singapore foreign tax credit is limited to the lower of the foreign tax suffered and the Singapore tax payable on the net foreign income (after attributable and allowable expenses). Certain foreign dividends received by a Singapore resident person on or after June 1, 2003 will, however, be exempt from tax. The main conditions to be satisfied for such exemption are that:
| | • | | the dividends are received from a jurisdiction with a maximum tax rate on the trade or business income of a company of at least 15 percent; and |
| | • | | the dividends themselves, or the income from which they are paid, have been subject to tax in the foreign jurisdiction or have been exempted from tax under an incentive granted for substantive business activities. |
The normal tax rate for corporate profits in Singapore is 18 percent for the year of assessment 2009 (i.e., for the income earned in the financial year or other basis period ended 2008). With effect from year of assessment 2010 as announced in the 2009 budget, the corporate tax rate is reduced to 17 percent. Resident individuals are subject to tax at progressive rates.
If our shareholders are corporations, our shareholders will be regarded as being tax resident in Singapore if the control and management of our shareholders’ business is exercised in Singapore. For example, if our shareholders’ board of directors meets and conducts the business of our shareholders’ company in Singapore, our shareholders will be regarded as tax resident in Singapore. If our shareholders are individuals, our shareholders will be regarded as being tax resident in Singapore in a year of assessment if, in the preceding year, our shareholders were physically present in Singapore or exercised an employment in Singapore (other than as directors of a company) for 183 days or more, or if our shareholders had resided in Singapore.
All foreign-sourced income received in Singapore (except for income received through a partnership in Singapore) on or after January 1, 2004 by tax resident individuals will be exempt from tax.
Gains on Disposal of Shares
Singapore does not impose a tax on capital gains. However, there are no specific laws or regulations which deal with the characterization of capital gains and hence, gains may be construed to be of an income nature and subject to tax if they arise from activities which the Inland Revenue Authority of Singapore regards as the carrying on of a trade or business in Singapore. You should consult your tax advisors concerning the Singapore tax consequences of acquiring, owning, selling or otherwise disposing the Shares.
Stamp Duty
There is no stamp duty payable in respect of the issuance and holding of our Shares. Where existing shares are acquired in Singapore, stamp duty is payable on the instrument of transfer of the shares at the rate of S$2.00 for every S$1,000 of the consideration for or market value of the shares, whichever is higher. The stamp duty is borne by the purchaser unless there is an agreement to the contrary. Where an instrument is executed outside Singapore, or no instrument of transfer is executed, no stamp duty is payable on the acquisition of existing shares. However, stamp duty would be payable if an instrument of transfer which is executed outside Singapore is received in Singapore.
Under Singapore law, our directors may not register a transfer of our Shares unless the instrument of transfer has been duly stamped.
85
Singapore Estate Duty
With respect to deaths occurring on or after January 1, 2002, the movable property of persons who are not domiciled in Singapore at the time of death are exempt from estate duty. Therefore, an individual holder of our Shares who is not domiciled in Singapore at the time of his or her death will not be subject to Singapore estate duty on the value of our Shares.
If our shareholders are individuals who are domiciled in Singapore, Singapore estate duty is imposed on the value of most immoveable property situated in Singapore and on most movable property, wherever it may be situated, subject to specific exemption limits. Accordingly, Shares held by an individual domiciled in Singapore are subject to Singapore estate duty upon such an individual’s death. Singapore estate duty is payable to the extent that the value of our Shares aggregated with any other assets subject to Singapore estate duty exceeds S$600,000. Unless other exemptions apply to the other assets, (i.e., the separate exemption limit for residential properties) any excess beyond S$600,000 will be taxed at 5 percent on the first S$12,000,000 of the individual’s Singapore chargeable assets and thereafter at 10 percent.
Estate duty has been abolished for deaths occurring on or after February 2008.
You should consult your tax advisors regarding the Singapore estate duty consequences of your ownership of our Shares.
Goods and Services Tax (“GST”)
The sale of our Shares by an investor belonging in Singapore to another person belonging in Singapore is an exempt supply not subject to GST. Any GST directly or indirectly incurred by the investor in respect of this exempt supply is a cost to the investor.
Where our Shares are sold by a GST-registered investor to a person belonging outside Singapore, the sale is a taxable supply subject to GST at zero-rate. Any GST incurred by the investor in the making of this sale, if the same is a supply in the course of furtherance of a business, is claimable as a refund from the Comptroller of GST.
Services such as brokerage, handling and clearing services rendered by a GST-registered person to an investor belonging in Singapore in connection with the investor’s purchase, sale or holding of our Shares will be subject to GST at the rate of 7 percent effective July 1, 2007 (previously, the GST rate was 5 percent). Similar services rendered to an investor belonging outside Singapore are subject to GST at zero-rate.
U.S. Tax Considerations
U.S. Federal Income Tax Considerations for U.S. Holders
The following is a discussion of certain U.S. federal income tax considerations for investors in Shares that are U.S. persons (as defined below) that hold the Shares as a capital asset. This discussion is based on U.S. federal income tax law as in effect on the date hereof, which is subject to change, possibly on a retroactive basis. This discussion is for general information only and does not address all of the tax considerations that may be relevant to you in light of your particular circumstances or if you are subject to special treatment under the U.S. federal income tax laws, including if you are a:
| | • | | financial institution or insurance company; |
86
| | • | | person holding Shares as part of a straddle, hedge, conversion or other integrated investment; |
| | • | | a person owning, actually or constructively, 10 percent or more of the combined voting power of all classes of our stock; or |
| | • | | a person whose “functional currency” is not the U.S. dollar. |
This discussion does not address any U.S. state, local or foreign tax, or any U.S. federal estate, gift or alternative minimum tax consideration of a holder of our Shares.
As used in this discussion, the term “U.S. person” means a:
| | • | | individual who is a citizen or resident of the United States; |
| | • | | corporation, or other entity treated as a corporation, created or organized under the laws of the United States or any political subdivision thereof; |
| | • | | estate, the income of which is subject to U.S. federal income taxation regardless of its source; or |
| | • | | trust if (1) it is subject to the primary supervision of a court within the United States and one or more U.S. persons have the authority to control all substantial decisions of the trust, or (2) it has otherwise elected to be treated as a U.S. person under the Internal Revenue Code. |
If a partnership (including any entity treated as a partnership for U.S. federal income tax purposes) holds Shares, the tax treatment of a partner in such partnership will generally depend upon the status of the partner and the activities of the partnership. If you are a partner of a partnership holding Shares, you are urged to consult your tax advisors as to the particular U.S. federal income tax consequences as applicable to you.
You are urged to consult your tax advisor concerning the particular U.S. federal, state, local and foreign income and other tax considerations regarding the ownership and disposition of the Shares, including the application of the passive foreign investment company rules discussed below. Investors should carefully review the discussion below under “¾Passive Foreign Investment Company Rules.”
Taxation of Dividends
Except as discussed below with respect to the passive foreign investment company tax rules, the amount of distributions you receive on your Shares (other than certain pro rata distributions of our Shares or rights to subscribe for Shares) will generally be treated as dividend income to you if the distributions are made from our current and accumulated earnings and profits as calculated according to U.S. federal income tax principles. Because we do not intend to determine our earnings and profits on the basis of U.S. federal income tax principles, any distribution paid will generally be treated as a “dividend” for U.S. federal income tax purposes. You will include such dividends in your gross income as ordinary income on the day you actually or constructively receive them. The amount of any distribution of property other than cash will be the fair market value of such property on the date it is distributed. A non-corporate recipient of dividend income will generally be subject to tax on dividend income from a “qualified foreign corporation” at a maximum U.S. federal tax rate of 15 percent rather than the marginal tax rates generally applicable to ordinary income, so long as certain holding period requirements are met. A non-U.S. corporation (other than a passive foreign investment company) generally will be considered to be a qualified foreign corporation (i) if it is eligible for the benefits of a comprehensive tax treaty with the United States which the Secretary of Treasury of the United States determines is satisfactory for purposes of this provision and which includes an exchange of information program or (ii) with respect to any dividend it pays on stock which is readily tradable on an established securities market in the United States. There is currently no tax treaty in effect between the United States and Singapore. Shares are expected to be readily tradable on the NASDAQ Global Market, an established securities market in the United States. U.S. corporate holders will generally not be eligible for the dividends received deduction for distributions to domestic corporations with regard to distributions on Shares.
87
The amount of any distribution paid in a currency other than the U.S. dollar will equal the U.S. dollar value of the foreign currency you receive, calculated by reference to the exchange rate in effect on the date you actually or constructively receive the distribution, regardless of whether the foreign currency is actually converted into U.S. dollars. If you do not convert the foreign currency you receive as a dividend on the date of receipt, you will have a basis in such foreign currency equal to its U.S. dollar value on the date of receipt. Any gain or loss you realize when you subsequently sell or otherwise dispose of such foreign currency generally will be ordinary income or loss from sources within the United States for foreign tax credit limitation purposes.
Holders may generally elect to claim a credit against their U.S. federal income tax liability for Singapore tax withheld from dividends received with regard to the Shares. The rules relating to the determination of the foreign tax credit are complex, and prospective purchasers are urged to consult their personal tax advisors to determine whether and to what extent they would be entitled to such credit. Holders that do not elect or are not permitted to claim foreign tax credits may instead claim a deduction for Singapore tax withheld, but only for a year in which such holder elects to do so for all creditable foreign income taxes. You will not be eligible for a foreign tax credit for the underlying Singapore taxes on profits paid by us with respect to such dividends.
Sale or other disposition of Shares.Except as discussed below with respect to the passive foreign investment company tax rules, a holder generally will recognize capital gain or loss for U.S. federal income tax purposes upon a sale or other disposition of our Shares in an amount equal to the difference between the amount realized from the sale or disposition and the holder’s adjusted tax basis in the Shares. Such gain or loss generally will be long-term (taxable at a reduced rate for individuals) if, on the date of sale or disposition, the Shares were held by the holder for more than one year and will generally be treated as gain or loss from U.S. sources for foreign tax credit purposes. The deductibility of a capital loss may be subject to limitations.
Passive Foreign Investment Company Rules
In general, we will be classified as a “passive foreign investment company” (“PFIC”) for any taxable year if either (i) at least 75 percent of our gross income is passive income or (ii) at least 50 percent of the value (determined on the basis of a quarterly average) of our assets produce or are held for the production of passive income. Based upon an analysis of our income and assets for the 2009 taxable year as reasonably approximated for purposes of applying the PFIC rules, we do not believe we should be classified as a PFIC for the 2009 taxable year. Whether we are classified as a PFIC in the current or any future taxable year will be determined on the basis of, among other things, our asset values (including, among other items, the level of our cash, cash equivalents and short-term investments) and gross income (including whether such income is active versus passive income as specially determined under the PFIC rules) for such taxable year, which assets, both of which and gross income are subject to change from year to year. Between April 2006 and June 2007, we acquired control over a majority of the voting rights in T2CN, consideration for which mainly comprised cash. In July 2007 and May 2008, we acquired additional equity interests in T2CN, also for primarily cash consideration. We will continue to investigate opportunities that may give rise to the acquisition of additional businesses for cash, thereby reducing our cash or other investment assets. If we acquire additional businesses for cash, we may, in turn, mitigate our risk of being or becoming classified as a PFIC. Because the determination of whether we are a PFIC is a factual determination made annually and because there are uncertainties in the application of the relevant rules, there can be no assurance we will not be classified a PFIC in the current or any future taxable year. Provided we are a PFIC for any taxable year during your holding period of our Shares, the PFIC tax rules discussed below generally will apply in future years even if we cease to be a PFIC in subsequent years. The 15 percent maximum rate on our dividends would not apply if we are or become classified as a PFIC.
88
If we are classified as a PFIC for any taxable year during which you hold Shares, and unless you make a mark-to-market election (as described below), you will generally be subject to special tax rules that have a penalizing effect, regardless of whether we remain a PFIC, on (i) any excess distribution that we make to you (which generally means any distribution received by you in a taxable year that is greater than 125 percent of the average annual distributions received by you in the three preceding taxable years or your holding period for the Shares, if shorter), and (ii) any gain realized on the sale or other disposition, including a pledge, of our Shares. Under these PFIC rules the:
| | • | | excess distribution or gain would be allocated ratably over your holding period for the Shares; |
| | • | | amount allocated to the current taxable year and any taxable year prior to the first taxable year in which we are classified as a PFIC (a “pre-PFIC year”) would be taxable as ordinary income; |
| | • | | amount allocated to each prior taxable year, other than the current taxable year or a pre-PFIC year, would be subject to tax at the highest tax rate in effect applicable to you for that year; and |
| | • | | interest charge generally applicable to underpayments of tax would be imposed on the tax attributable to each prior taxable year, other than the current taxable year or a pre-PFIC year. |
As an alternative to the foregoing rules, a holder of “marketable stock” in a PFIC may make a mark-to-market election, provided that the Shares are actively traded on a “qualified exchange.” Under applicable Treasury regulations, a “qualified exchange” includes a national securities exchange that is registered with the SEC or the national market system established under the Securities and Exchange Act of 1934 (i.e., the NASDAQ Global Market). In addition, we believe that, based on the current level of trading activity of our Shares on the NASDAQ Global Market, Shares should qualify as being actively traded, but no assurances may be given in this regard. If you make this election, you will generally (i) include as income for each taxable year the excess, if any, of the fair market value of your Shares at the end of the taxable year over the adjusted tax basis of the Shares and (ii) deduct as a loss the excess, if any, of the adjusted tax basis of the Shares over the fair market value of the Shares at the end of the taxable year, but only to the extent of the amount previously included in income as a result of the mark-to-market election. Your adjusted tax basis in the Shares would be adjusted to reflect any income or loss resulting from the mark-to-market election. If you make a mark-to-market election in respect of a corporation classified as a PFIC and such corporation ceases to be classified as a PFIC, you will generally not be required to take into account the gain or loss described above during any period that such corporation is not classified as a PFIC.
The “QEF Election,” which serves as a further alternative to the foregoing rules, is not available.
If you own Shares during any year that we are a PFIC, you must file an annual IRS Form 8621. In the case of investors who have held Shares during any taxable year in respect of which we were classified as a PFIC and continue to hold such Shares (or any portion thereof), who have not previously determined to make a mark-to-market election, and who are now considering making a mark-to-market election, special tax rules may apply relating to purging the PFIC taint of such Shares. You are urged to consult your tax advisor concerning the U.S. federal income tax consequences of purchasing, holding, and disposing Shares if we are or become classified as a PFIC, including the possibility of making a mark-to-market election.
Information Reporting and Backup Withholding
In general, unless you are an exempt recipient, such as a corporation, and demonstrate this when required, information reporting will apply to dividend payments that we make to you paid within the United States (and in some cases, outside of the United States). Additionally, if you fail to provide your taxpayer identification number, or fail either to report in full dividend and interest income or to make the necessary certifications, you will be subject to backup withholding.
In general, payment of the proceeds from the sale of our Shares to or through a U.S. office of a broker is subject to both U.S. backup withholding and information reporting unless you certify as to your non-U.S. status under penalties of perjury or otherwise establish an exemption. U.S. information reporting and backup withholding generally will not apply to a payment made outside the United States or the proceeds of a sale of our Shares through an office outside the United States of a non-U.S. broker. However, U.S. information reporting requirements (but not backup withholding) will apply to a payment made outside the United States or the proceeds of a sale of our Shares through an office outside the United States if the broker is:
| | • | | a foreign person 50 percent or more of whose gross income is effectively connected with a U.S. trade or business for a specified three-year period; |
89
| | • | | a “controlled foreign corporation” for U.S. tax purposes; or |
| | • | | a foreign partnership, if at any time during its tax year; |
| | • | | one or more of its partners are U.S. holders (as defined in U.S. Treasury regulations) who in the aggregate hold more than 50 percent of the income or capital interest in the partnership; or |
| | • | | such foreign partnership is engaged in a U.S. trade or business; |
unless the broker has documentary evidence in its files that you are a non-U.S. person or you otherwise establish an exemption.
Any amounts withheld under the backup withholding rules will be allowed as a refund or a credit against your U.S. federal income tax liability, provided you furnish the required information to the Internal Revenue Service.
F. Dividends and Paying Agents
Not applicable.
G. Statements by Experts
Not applicable.
H. Documents on Display
The SEC allows us to “incorporate by reference” the information we file with the SEC. This means that we can disclose important information to you by referring you to another document filed separately with the SEC. The information incorporated by reference in this annual report is considered to be part of this annual report. We therefore incorporate by reference in Item 19 of this annual report certain exhibits, which we filed with the SEC in prior filings. You may read and copy this annual report, including the exhibits incorporated by reference in this annual report, at the public reference room maintained by the SEC at 100 F Street, N.E., Washington, D.C. 20549. You can request copies of these documents upon payment of a duplicating fee, by writing to the SEC. Please call the SEC at 1-800-SEC-0330 for further information on the operation of the public reference rooms. Additional information may also be obtained over the Internet at the SEC’s website at www.sec.gov.
You may also request a copy of our SEC filings, at no cost, upon written request to our investor relations department at 8th Floor, 207 Tiding Boulevard, Section 2, Taipei 114, Taiwan, R.O.C., or by e-mail to: Brad.miller@GigaMedia.com.tw. A copy of each report submitted in accordance with applicable U.S. law is also available for public review at our principal executive offices.
As a foreign private issuer, we are exempt under the Securities Exchange Act from, among other things, the rules prescribing the furnishing and content of proxy statements, and our executive officers, directors and principal shareholders are exempt from the reporting and short-swing profit recovery provisions contained in Section 16 of the Securities Exchange Act. In addition, we will not be required under the Securities Exchange Act to file periodic reports and financial statements with the SEC as frequently or as promptly as U.S. companies whose securities are registered under the Securities Exchange Act.
I. Subsidiary Information
Not applicable.
90
ITEM 11. QUANTITATIVE AND QUALITATIVE DISCLOSURES ABOUT MARKET RISK
Market risk is the risk of loss related to adverse changes in market prices, including interest rates and foreign exchange rates, of financial instruments. We are exposed to various types of market risks in the normal course of business, including changes in interest rates and foreign currency exchange rates.
Foreign Currency Risk
Our subsidiaries conduct most of their business transactions in their own measurement currencies; therefore the foreign currency risks derived from operations are not significant. However, we hold some assets or liabilities in foreign currencies other than measurement currency and the value of these assets and liabilities are subject to foreign currency risks resulting from fluctuations in exchange rates between the foreign-denominated currency and the measurement currency. We have not used hedging transactions to reduce our exposure to exchange rate fluctuations; however, we may choose to do so in the future. For more information on foreign currency translations for our financial reporting purposes, see Note 1(b) to our audited consolidated financial statements beginning on page F-1 in this annual report.
As of December 31, 2008, we had bank deposits of approximately US$0.8 million denominated in foreign currencies other than measurement currencies of the entities holding such assets. These assets are subject to foreign currency exchange risk. We recorded a realized foreign exchange gain of approximately US$131 thousand and unrealized foreign exchange gain of approximately US$109 thousand in the year ended December 31, 2008.
As of December 31, 2008, we had available-for-sale marketable securities of approximately US$5.5 million recorded under FAS 115 and denominated in foreign currencies other than measurement currencies of the entity holding such assets. Future fluctuation of the exchange rates could impact the periodic impairment assessment on other-than-temporary loss of these assets. We did not record any impairment loss on these marketable securities in 2008.
Based on the sensitivity analysis of our exposure to foreign currency exchange rate risk related our bank deposits and available-for-sale marketable securities which were denominated in a foreign currency other than functional currencies of the entities holding such assets, a hypothetical 10 percent change in the exchange rate between the U.S. dollar and the underlying currencies of those instruments subject to foreign currency exchange rate risk would result in a change of approximately 0.3 percent in our total equity as of December 31, 2008.
Interest Rate Risk
Our exposure to interest rates relates primarily to our short-term loans from various banks. The variations in fair value of the marketable securities that we owned as of December 31, 2008 do not have direct relationship with interest rates changes. As of December 31, 2008, we had no investment in fixed-income or money market investment funds. Declines in interest rates over time will, however, reduce our interest income from our bank deposits. Increases in interest rates of the loans will increase our interest expenses. As of December 31, 2008, we had approximately US$15.2 million of short-term loans, with a weighted average interest rate of approximately 3.2 percent. Based on our sensitivity analysis with respect to our short-term loans, we have no significant exposure to fluctuations in interest rates. We have not entered into any interest rate swaps, caps or hedge contracts to modify our exposure to interest rate fluctuations.
We did not include a quantitative tabular disclosure regarding the foreign currency risk and the interest rate risk. As noted above, we believe that the magnitude of selected hypothetical changes to such market risks on the consolidated financial statements is not significant. However, we cannot assure you that we will not be affected by these risks in the future.
91
Other Market Risks
We are also exposed to other market risks, which are mainly derived from our investments. Changes in the stock price, performance or net asset value of the companies that we invested and investment funds might have significant impact on our financial positions or operating results.
ITEM 12. DESCRIPTION OF SECURITIES OTHER THAN EQUITY SECURITIES
Not applicable.
PART II
ITEM 13. DEFAULTS, DIVIDEND ARREARAGES AND DELINQUENCIES
None.
ITEM 14. MATERIAL MODIFICATIONS TO THE RIGHTS OF SECURITY HOLDERS AND USE OF PROCEEDS
A. Material Modification to the Instruments Defining the Rights of Security Holders
None.
B. Material Modification to the Rights of Registered Securities by Issuing or Modifying or any Other Class of Securities
None.
C. Withdrawal or Substitution of a Material Amount of the Assets Securing any Registered Securities
Not applicable.
D. Change of Trustees or Paying Agents for any Registered Securities
None.
E. Use of Proceeds
Not applicable.
ITEM 15. CONTROLS AND PROCEDURES
Disclosure Controls and Procedures
Our management, with the participation of our chief executive officer and our chief financial officer, has evaluated the effectiveness of our disclosure controls and procedures (as defined by Rules 13a-15(e) and 15d-15(e) under the Securities Exchange Act) as December 31, 2008. There are inherent limitations to the effectiveness of any system of disclosure controls and procedures, including the possibility of human error and the circumvention or overriding of the controls and procedures. Accordingly, in designing and evaluating the disclosure controls and procedures, management recognized that any controls and procedures, no matter how well designed and operated, can provide only reasonable, rather than absolute, assurance of achieving the desired control objectives, and management necessarily was required to apply its judgment in evaluating the cost-benefit relationship of possible controls and procedures.
92
Based upon that evaluation, and taking into account the foregoing, our chief executive officer and chief financial officer have concluded that, as of December 31, 2008, our disclosure controls and procedures were effective in providing reasonable assurance that information required to be disclosed by us in the reports that we file or submit under the Exchange Act was recorded, processed, summarized and reported on a timely basis, and these controls and procedures were effective in ensuring that information required to be disclosed by us in the reports that we file or submit under the Exchange Act was accumulated and communicated to our management, including our chief executive officer and chief financial officer, as appropriate to allow timely decisions regarding required disclosure.
Management’s Annual Report on Internal Control Over Financial Reporting
Management is responsible for establishing and maintaining adequate internal control over financial reporting (as defined by Rules 13a-15(f) and 15d-15(f) under the Exchange Act). Our internal control over financial reporting is designed to provide reasonable assurance regarding the reliability of financial reporting and the preparation of financial statements for external purposes in accordance with generally accepted accounting principles in the United States. Our internal control over financial reporting includes those policies and procedures that (i) pertain to the maintenance of records that, in reasonable detail, accurately and fairly reflect the transactions and dispositions of our assets; (ii) provide reasonable assurance that transactions are recorded as necessary to permit preparation of financial statements in accordance with generally accepted accounting principles in the United States and that receipts and expenditures are being made only in accordance with authorizations of our management and directors and (iii) provide reasonable assurance regarding prevention or timely detection of unauthorized acquisition, use or disposition of our assets that could have a material effect on the financial statements.
Because of its inherent limitations, internal control over financial reporting may not prevent or detect all misstatements. Also, projections of any evaluation of the effectiveness of internal control to future periods are subject to the risk that controls may become inadequate because of changes in conditions, and that the degree of compliance with the policies or procedures may deteriorate.
Management assessed the effectiveness of our internal control over financial reporting as of December 31, 2008. In making this assessment, management used the criteria set forth by the Committee of Sponsoring Organizations of the Treadway Commission (COSO) in Internal Control — Integrated Frameworks. Based on our assessment using those criteria, our management has concluded that our internal control over financial reporting as of December 31, 2008 was effective.
Attestation Report of the Independent Registered Public Accounting Firm
The effectiveness of our internal control over financial reporting as of December 31, 2008 has been audited by GHP Horwath, P.C., our independent registered public accounting firm, who has also audited the consolidated financial statements included in this annual report on Form 20-F and, as part of the audit, has issued a report, which appears on pages F-1 and F-2 of this annual report, on the effectiveness of our internal control over financial reporting.
Changes in Internal Control Over Financial Reporting
During the year ended December 31, 2008, there were no changes in our internal control over financial reporting that have materially affected, or are reasonably likely to materially affect, our internal control over financial reporting.
ITEM 16. Reserved
ITEM16A. AUDIT COMMITTEE FINANCIAL EXPERT
Our board of directors has determined that Mr. Michael Y. J. Ding, an independent director and a member of our audit committee, is an audit committee financial expert.
93
ITEM 16B. CODE OF ETHICS
We have adopted a code of ethics, as defined in Item 16B of Form 20-F. Our code of ethics applies to our chief executive officer, chief financial officer and persons performing similar functions, as well as to our directors, other officers, employees and consultants. The code of ethics was amended on December 19, 2005 in order to conform certain provisions in it with our newly adopted anti-fraud policy. The full text of our code of ethics is available on our website, www.gigamedia.com.tw. If we further amend any provisions of our code of ethics that apply to our chief executive officer, chief financial officer or persons performing similar functions, or if we grant any waiver of such provisions, we will disclose such amendment or waiver on our website at the same address. We will also provide any person without charge a copy of our code of ethics upon written request to our investor relations department at 8th Floor, No. 207 Tiding Boulevard, Section 2, Taipei 114, Taiwan, R.O.C., or by e-mail to: Brad.miller@GigaMedia.com.tw.
On December 19, 2005, our board of directors adopted an anti-fraud policy for the purpose of preventing fraud schemes, including fraudulent financial reporting misappropriation of assets, any fraud committed by senior management, and information technology fraud. According to our anti-fraud policy, our audit committee is responsible for monitoring the implementation of our anti-fraud policy and procedures, and an anti-fraud taskforce is assigned by our audit committee to be responsible for the anti-fraud hotline management, risk assessment, complaint investigation and resolution, and reporting to our chief executive officer, chief financial officer and audit committee.
On May 10, 2006, our audit committee adopted a whistleblower program pursuant to our anti-fraud policy. The whistleblower program enables all employees to know how and when to use the whistleblower hotline and communicate or report, on a confidential or anonymous basis, without fear of retribution, concerns related to wrongdoings or violations, and ensures that all reported incidents are properly investigated.
ITEM 16C. PRINCIPAL ACCOUNTANT FEES AND SERVICES
The following table summarizes the aggregate fees billed to us by GHP Horwath, P.C. for services performed relating to the fiscal years ended December 31, 2007 and 2008.
| | | | | | | | | |
| | | For the Years Ended December 31, | |
| | | 2007 | | | 2008 | |
| | | (in US$) | | | (in US$) | |
| Audit Fees | | | 1,036,738 | | | | 1,190,974 | |
| Audit-Related Fees | | | 9,867 | | | | 0 | |
| Tax Fees | | | 42,847 | | | | 23,004 | |
| All Other Fees | | | 0 | | | | 0 | |
A. Audit Fees
Audit fees consist of fees billed for the annual audit of our consolidated financial statements. Audit fees also include fees for services that are normally provided by the independent registered public accounting firm in connection with statutory and regulatory filings or engagements for 2007 and 2008.
B. Audit-Related Fees
Audit-related fees consist of fees billed for assurance and related services that are reasonably related to the performance of the audit or review of our financial statements, and are not reported under the paragraph captioned “Audit Fees” above. Audit related fees billed in 2007 consisted of an agreed-upon report for a special purpose.
C. Tax Fees
Tax fees include fees billed for tax compliance services, including the preparation of original and amended tax returns, and tax advisory services.
D. All Other Fees
All other fees are fees billed for services provided by the independent registered public accounting firm other than the services reported as audit fees, audit-related fees and tax fees above. No other fees were billed during 2007 and 2008.
94
E. Audit Committee Pre-Approval Policies and Procedures
In May 2005, we adopted our audit committee charter. Consistent with the SEC’s policies regarding auditor independence, our audit committee is directly responsible for the appointment, compensation, retention and oversight of the work of auditors engaged to provide us with audit, review or attest services. Our audit committee has sole discretion to review and pre-approve the appointment of auditors and to set their fees for the performance of audit and non-prohibited non-audit services in accordance with the Sarbanes-Oxley Act of 2002 and the SEC rules and regulations promulgated thereunder, subject to the appointment, replacement or removal from office of our independent public accountants as approved by our shareholders at our Annual General Meeting.
The appointment of our independent registered public accounting firm, GHP Horwath, P.C., as well as the scope of each audit, audit-related or non-prohibited, as well as any non-audit services provided pursuant to such appointment, and our auditors’ fees for all such services, were approved by our audit committee.
ITEM 16D. EXEMPTIONS FROM THE LISTING STANDARDS FOR AUDIT COMMITTEES
Not applicable.
ITEM 16E. PURCHASES OF EQUITY SECURITIES BY THE ISSUER AND AFFILIATED PURCHASERS
None.
ITEM 16F. CHANGES IN REGISTRANT’S CERTIFYING ACCOUNTANTS
Not applicable.
ITEM 16G. CORPORATE GOVERNANCE
Summary of Significant Differences in Corporate Governance Practices
Our Shares are currently listed on the NASDAQ Stock Market and, for so long as our securities continue to be listed, we will remain subject to the rules and regulations established by NASDAQ as being applicable to listed companies. Under NASDAQ Rule 5615(a)(3), a foreign private issuer such as our Company may follow its home country practice in lieu of the requirements of the NASDAQ Rule 5600 Series, with certain exceptions, provided that it discloses each requirement that it does not follow and describes the home country practice followed in lieu of such requirements. In addition, NASDAQ has amended its Rule 4350(a)(1) to permit foreign private issuers to follow certain home country corporate governance practices without the need to seek an individual exemption from NASDAQ. However, a foreign private issuer must disclose in its annual report filed with the SEC each requirement it does not follow and the alternative home country practice it does follow.
We are incorporated under the laws of Singapore. We currently comply with the specifically mandated provisions of NASDAQ Rule 4350. We are currently exempt from the DRS eligibility provisions of NASDAQ Rule 4350(1) as we are not allowed to issue of non-certificated securities under Singapore law. See Item 9, “The Offer and Listing” in this annual report. We have elected to voluntarily comply with other requirements of NASDAQ Rule 4350 in all material aspects, notwithstanding that our home country does not mandate compliance; although we may in the future determine to cease voluntary compliance with those provisions of NASDAQ Rule 4350.
PART III
ITEM 17. FINANCIAL STATEMENTS
We have elected to provide financial statements pursuant to Item 18.
95
ITEM 18. FINANCIAL STATEMENTS
Our consolidated financial statements and the reports thereon by our independent registered public accounting firm listed below are attached hereto as follows:
| | | | | |
| | | Page | |
| | | F-1¾F-2 | |
| | | | | |
| | | F-3¾F-4 | |
| | | | | |
| | | F-5 | |
| | | | | |
| | | F-6 | |
| | | | | |
| | | F-7¾F-8 | |
| | | | | |
| | | F-9¾F-89 | |
ITEM 19. EXHIBITS
| | | | | |
| EXHIBIT | | INDEX |
| | | | | |
| | 1.1 | | | Amended Memorandum and Articles of Association of our Company, incorporated by reference to Exhibit 1.3 to our annual report for the year 2006 on Form 20-F filed with the SEC on June 29, 2007 |
| | | | | |
| | 4.1 | | | End-User License Agreement between Internet Media Licensing Limited and Ultra Internet Media, S.A., dated April 1, 2004, incorporated by reference to Exhibit 4.41 to our annual report for the year 2004 on Form 20-F filed with the SEC on June 30, 2005 |
| | | | | |
| | 4.2 | | | Second Amendment to the End-User License Agreement between Internet Media Licensing Limited and Ultra Internet Media, S.A., dated March 1, 2006, incorporated by reference to Exhibit 4.41 to our annual report for the year 2005 on Form 20-F filed with the SEC on June 28, 2006 |
| | | | | |
| | 4.3 | | | Third Amendment to the End-User License Agreement between Internet Media Licensing Limited and Ultra Internet Media, S.A., dated March 1, 2007, incorporated by reference to Exhibit 4.50 to our annual report for the year 2006 on Form 20-F filed with the SEC on June 29, 2007 |
| | | | | |
| | 4.4 | | | Fourth Amendment to the End-User License Agreement between Internet Media Licensing Limited and Ultra Internet Media, S.A., dated March 1, 2008# |
| | | | | |
| | 4.5 | | | Exclusive Business Consultancy Service Agreement between T2 Technology and T2 Entertainment, dated November 15, 2006, incorporated by reference to Exhibit 4.55 to our annual report for the year 2007 on Form 20-F filed with the SEC on June 30, 2008 |
| | | | | |
| | 4.6 | | | Supplemental Agreement to Exclusive Business Consultancy Service Agreement between T2 Technology and T2 Entertainment, dated April 1, 2007, incorporated by reference to Exhibit 4.56 to our annual report for the year 2007 on Form 20-F filed with the SEC on June 30, 2008 |
| | | | | |
| | 4.7 | | | Exclusive Technical Service and Consultancy Agreement between T2 Entertainment and T2 Technology, dated November 15, 2006, incorporated by reference to Exhibit 4.57 to our annual report for the year 2007 on Form 20-F filed with the SEC on June 30, 2008 |
| | | | | |
| | 4.8 | | | Supplemental Agreement to Exclusive Technical Service and Consultancy Agreement between T2 Entertainment and T2 Technology, dated April 1, 2007, incorporated by reference to Exhibit 4.58 to our annual report for the year 2007 on Form 20-F filed with the SEC on June 30, 2008 |
| | | | | |
| | 4.9 | | | Agreement for Pledge of Shares in T2 Entertainment between Wang Chi, Lu Ning and T2 Technology, dated February 9, 2007, incorporated by reference to Exhibit 4.59 to our annual report for the year 2007 on Form 20-F filed with the SEC on June 30, 2008 |
| | | | | |
| | 4.10 | | | Exclusive Call Option Agreement regarding T2 Entertainment between Wang Chi, Lu Ning, T2 Entertainment and T2 Technology, dated February 9, 2007, incorporated by reference to Exhibit 4.60 to our annual report for the year 2007 on Form 20-F filed with the SEC on June 30, 2008 |
96
| | | | | |
| EXHIBIT | | INDEX |
| | | | | |
| | 4.11 | | | Proxy Voting Agreement regarding T2 Entertainment between T2 Technology, T2 Entertainment, Wang Chi and Lu Ning, dated February 9, 2007, incorporated by reference to Exhibit 4.61 to our annual report for the year 2007 on Form 20-F filed with the SEC on June 30, 2008 |
| | | | | |
| | 4.12 | | | Exclusive Business Consultancy Service Agreement between T2 Technology and T2 Advertisement, dated November 15, 2006, incorporated by reference to Exhibit 4.62 to our annual report for the year 2007 on Form 20-F filed with the SEC on June 30, 2008 |
| | | | | |
| | 4.13 | | | Supplemental Agreement to Exclusive Business Consultancy Service Agreement between T2 Technology and T2 Advertisement, dated January 1, 2007, incorporated by reference to Exhibit 4.63 to our annual report for the year 2007 on Form 20-F filed with the SEC on June 30, 2008 |
| | | | | |
| | 4.14 | | | Agreement for Pledge of Shares in T2 Advertisement between Chi Min, Chang Tao and T2 Technology, dated March 20, 2008, incorporated by reference to Exhibit 4.64 to our annual report for the year 2007 on Form 20-F filed with the SEC on June 30, 2008 |
| | | | | |
| | 4.15 | | | Exclusive Call Option Agreement regarding T2 Advertisement between Chi Min, Chang Tao, T2 Advertisement and T2 Technology, dated March 20, 2008, incorporated by reference to Exhibit 4.65 to our annual report for the year 2007 on Form 20-F filed with the SEC on June 30, 2008 |
| | | | | |
| | 4.16 | | | Proxy Voting Agreement regarding T2 Advertisement between T2 Technology, T2 Advertisement, Chi Min and Chang Tao, dated March 20, 2008, incorporated by reference to Exhibit 4.66 to our annual report for the year 2007 on Form 20-F filed with the SEC on June 30, 2008 |
| | | | | |
| | 4.17 | | | Share Purchase Agreement between William Zhu and GigaMedia China Limited, dated June 3, 2007, incorporated by reference to Exhibit 4.67 to our annual report for the year 2007 on Form 20-F filed with the SEC on June 30, 2008 |
| | | | | |
| | 4.18 | | | Share Purchase Agreement between Yu-Chia Lee and GigaMedia China Limited, dated June 6, 2007, incorporated by reference to Exhibit 4.68 to our annual report for the year 2007 on Form 20-F filed with the SEC on June 30, 2008 |
| | | | | |
| | 4.19 | | | Share Purchase Agreement between Zheng Bin and GigaMedia China Limited, dated June 10, 2007, incorporated by reference to Exhibit 4.69 to our annual report for the year 2007 on Form 20-F filed with the SEC on June 30, 2008 |
| | | | | |
| | 4.20 | | | Share Purchase Agreement between J&R Music LLC, Ya-Tsen Lin and GigaMedia China Limited, dated July 5, 2007, incorporated by reference to Exhibit 4.70 to our annual report for the year 2007 on Form 20-F filed with the SEC on June 30, 2008 |
| | | | | |
| | 4.21 | | | Share Purchase Agreement between Kingland Overseas Development Inc. and GigaMedia China Limited, dated July 6, 2007, incorporated by reference to Exhibit 4.71 to our annual report for the year 2007 on Form 20-F filed with the SEC on June 30, 2008 |
| | | | | |
| | 4.22 | | | Share Purchase Agreement between Jim Ji Wang and GigaMedia China Limited, dated July 6, 2007, incorporated by reference to Exhibit 4.72 to our annual report for the year 2007 on Form 20-F filed with the SEC on June 30, 2008 |
| | | | | |
| | 4.23 | | | Share Purchase Agreement between Marvel City Investments Limited and GigaMedia China Limited, dated May 26, 2008, incorporated by reference to Exhibit 4.73 to our annual report for the year 2007 on Form 20-F filed with the SEC on June 30, 2008 |
| | | | | |
| | 4.24 | | | Agreement for Pledge of Shares in Jinyou among Yang Zhuojun, Tan Yihui and T2 Technology, dated June 15, 2009# |
| | | | | |
| | 4.25 | | | Exclusive Call Option Agreement regarding Jinyou among Yang Zhuojun, Tan Yihui, Jinyou and T2 Technology, dated June 15, 2009# |
| | | | | |
| | 4.26 | | | Proxy Voting Agreement regarding Jinyou among T2 Technology, Jinyou, Yang Zhuojun and Tan Yihui, dated June 15, 2009# |
97
| | | | | |
| EXHIBIT | | INDEX |
| | | | | |
| | 4.27 | | | Exclusive Business Consultancy Service Agreement between T2 Technology and Jinyou, dated November 26, 2007# |
| | | | | |
| | 4.28 | | | Exclusive Technical Service and Consultancy Agreement between Jinyou and T2 Technology, dated November 26, 2007# |
| | | | | |
| | 4.29 | | | Share Sale and Purchase Agreement among Champion Limited, Gigamedia International Holdings Limited and GigaMedia, dated August 28, 2008# |
| | | | | |
| | 4.30 | | | Share Sale and Purchase Agreement between China Network Systems Co., Ltd. and Hoshin GigaMedia, dated August 28, 2008# |
| | | | | |
| | 4.31 | | | Asset Sale and Purchase Agreement among Ko Ying, Hoshin GigaMedia and China Network Systems Co., Ltd., dated August 28, 2008# |
| | | | | |
| | 4.32 | | | Transitional Service Agreement among Ko Ying, Hoshin GigaMedia and KBT, dated September 3, 2008# |
| | | | | |
| | 4.33 | | | Assignment and Assumption Agreement between Hoshin GigaMedia and Hoshin Multimedia, dated September 3, 2008# |
| | | | | |
| | 8.1 | | | List of Subsidiaries# |
| | | | | |
| | 12.1 | | | Certification by our Chief Executive Officer pursuant to Rule 13a-14(b) of the Securities Exchange Act# |
| | | | | |
| | 12.2 | | | Certification by our Chief Financial Officer pursuant to Rule13a-14(b) of the Securities Exchange Act# |
| | | | | |
| | 13.1 | | | Certification by our Chief Executive Officer pursuant to 18 U.S.C. Section 1350 as adopted pursuant to Section 906 of the Sarbanes-Oxley Act of 2002# |
| | | | | |
| | 13.2 | | | Certification by our Chief Financial Officer pursuant to 18 U.S.C. Section 1350 as adopted pursuant to Section 906 of the Sarbanes-Oxley Act of 2002# |
| | | | | |
| | 15.1 | | | Consent of GHP Horwath, P.C., Independent Registered Public Accounting Firm# |
98
SIGNATURE
The registrant hereby certifies that it meets all of the requirements for filing on Form 20-F and that it has duly caused and authorized the undersigned to sign this annual report on its behalf.
| | | | | |
| GIGAMEDIA LIMITED | | |
| | | | | |
| By: | | /s/ Arthur M. Wang | | |
| | | Arthur M. Wang | | |
| | | Chief Executive Officer | | |
| | | Date: June 26, 2009 | | |
99
REPORT OF INDEPENDENT REGISTERED PUBLIC ACCOUNTING FIRM
Board of Directors and Shareholders
GigaMedia Limited
We have audited the accompanying consolidated balance sheets of GigaMedia Limited and subsidiaries (the “Company”) as of December 31, 2008 and 2007, and the related consolidated statements of operations, shareholders’ equity, and cash flows for each of the years in the three-year period ended December 31, 2008. We also have audited the Company’s internal control over financial reporting as of December 31, 2008, based on criteria established inInternal Control—Integrated Frameworkissued by the Committee of Sponsoring Organizations of the Treadway Commission (COSO). The Company’s management is responsible for these financial statements, for maintaining effective internal control over financial reporting, and for its assessment of the effectiveness of internal control over financial reporting. Our responsibility is to express an opinion on these financial statements and an opinion on the Company’s internal control over financial reporting based on our audits.
We conducted our audits in accordance with the standards of the Public Company Accounting Oversight Board (United States). Those standards require that we plan and perform the audits to obtain reasonable assurance about whether the financial statements are free of material misstatement and whether effective internal control over financial reporting was maintained in all material respects. Our audit of the financial statements included examining, on a test basis, evidence supporting the amounts and disclosures in the financial statements, assessing the accounting principles used and significant estimates made by management, and evaluating the overall financial statement presentation. Our audit of internal control over financial reporting included obtaining an understanding of internal control over financial reporting, assessing the risk that a material weakness exists, and testing and evaluating the design and operating effectiveness of internal control based on the assessed risk. Our audits also included performing such other procedures as we considered necessary in the circumstances. We believe that our audits provide a reasonable basis for our opinions.
A company’s internal control over financial reporting is a process designed to provide reasonable assurance regarding the reliability of financial reporting and the preparation of financial statements for external purposes in accordance with generally accepted accounting principles. A company’s internal control over financial reporting includes those policies and procedures that (1) pertain to the maintenance of records that, in reasonable detail, accurately and fairly reflect the transactions and dispositions of the assets of the company; (2) provide reasonable assurance that transactions are recorded as necessary to permit preparation of financial statements in accordance with generally accepted accounting principles, and that receipts and expenditures of the company are being made only in accordance with authorizations of management and directors of the company; and (3) provide reasonable assurance regarding prevention or timely detection of unauthorized acquisition, use, or disposition of the company’s assets that could have a material effect on the financial statements.
F-1
Because of its inherent limitations, internal control over financial reporting may not prevent or detect misstatements. Also, projections of any evaluation of effectiveness to future periods are subject to the risk that controls may become inadequate because of changes in conditions, or that the degree of compliance with the policies or procedures may deteriorate.
In our opinion, the consolidated financial statements referred to above present fairly, in all material respects, the financial position of GigaMedia Limited and subsidiaries as of December 31, 2008 and 2007, and the results of their operations and their cash flows for each of the years in the three-year period ended December 31, 2008 in conformity with accounting principles generally accepted in the United States of America. Also in our opinion, the Company maintained, in all material respects, effective internal control over financial reporting as of December 31, 2008, based on criteria established inInternal Control—Integrated Frameworkissued by the Committee of Sponsoring Organizations of the Treadway Commission (COSO).
/S/ GHP HORWATH, P.C.
Denver, Colorado
May 15, 2009
F-2
GIGAMEDIA LIMITED
CONSOLIDATED BALANCE SHEETS
December 31, 2007 and 2008
(in thousands)
| | | | | | | | | |
| | | December 31 | |
| | | 2007 | | | 2008 | |
| | | | | | | | | |
| ASSETS | | | | | | | | |
| | | | | | | | | |
| CURRENT ASSETS | | | | | | | | |
| Cash and cash equivalents (Note 9) | | $ | 68,563 | | | $ | 95,953 | |
| Marketable securities-current (Note 10) | | | 11,354 | | | | 3,419 | |
| Accounts receivable-net (Note 11) | | | 18,291 | | | | 15,188 | |
| Prepaid expenses (Note 1) | | | 5,615 | | | | 9,907 | |
| Restricted cash (Note 13) | | | 6,247 | | | | — | |
| Other current assets (Notes 14 and 23) | | | 5,347 | | | | 4,332 | |
| | | | | | | |
| Total Current Assets | | | 115,417 | | | | 128,799 | |
| | | | | | | |
| | | | | | | | | |
| Marketable securities-noncurrent (Note 12) | | | 21,018 | | | | 26,041 | |
| | | | | | | |
| Investments | | | 4,612 | | | | 1,905 | |
| | | | | | | |
| | | | | | | | | |
| PROPERTY, PLANT AND EQUIPMENT | | | | | | | | |
| Land and buildings | | | 1,853 | | | | 1,832 | |
| Information and communication equipment | | | 23,163 | | | | 11,601 | |
| Office furniture and fixtures | | | 2,029 | | | | 2,575 | |
| Leasehold improvements | | | 2,222 | | | | 5,115 | |
| Other | | | 2,020 | | | | 250 | |
| | | | | | | |
| | | | 31,287 | | | | 21,373 | |
| Less: Accumulated depreciation | | | (18,279 | ) | | | (7,905 | ) |
| | | | | | | |
| | | | 13,008 | | | | 13,468 | |
| | | | | | | |
| | | | | | | | | |
| GOODWILL (Notes 5 and 6) | | | 85,149 | | | | 87,098 | |
| | | | | | | |
| | | | | | | | | |
| INTANGIBLE ASSETS-NET (Notes 5 and 7) | | | 26,060 | | | | 28,930 | |
| | | | | | | |
| | | | | | | | | |
| OTHER ASSETS | | | | | | | | |
| Restricted cash (Note 13) | | | — | | | | 2,125 | |
| Refundable deposits | | | 1,528 | | | | 7,265 | |
| Prepaid licensing and royalty fees (Note 24) | | | 16,739 | | | | 20,540 | |
| Other (Note 23) | | | 334 | | | | 622 | |
| | | | | | | |
| Total Other Assets | | | 18,601 | | | | 30,552 | |
| | | | | | | |
| | | | | | | | | |
| TOTAL ASSETS | | $ | 283,865 | | | $ | 316,793 | |
| | | | | | | |
(Continued)
F-3
GIGAMEDIA LIMITED
CONSOLIDATED BALANCE SHEETS—(Continued)
December 31, 2007 and 2008
(in thousands)
| | | | | | | | | |
| | | December 31 | |
| | | 2007 | | | 2008 | |
| | | | | | | | | |
| LIABILITIES & SHAREHOLDERS’ EQUITY | | | | | | | | |
| | | | | | | | | |
| CURRENT LIABILITIES | | | | | | | | |
| Short-term borrowings (Notes 15 and 24) | | $ | 33,301 | | | $ | 15,243 | |
| Accounts payable | | | 1,922 | | | | 899 | |
| Accrued compensation | | | 5,750 | | | | 3,503 | |
| Accrued expenses (Note 16) | | | 9,151 | | | | 11,345 | |
| Player account balances | | | 27,136 | | | | 32,827 | |
| Other current liabilities (Notes 17 and 23) | | | 14,652 | | | | 12,386 | |
| | | | | | | |
| Total Current Liabilities | | | 91,912 | | | | 76,203 | |
| | | | | | | |
| | | | | | | | | |
| OTHER LIABILITIES | | | | | | | | |
| Accrued pension liabilities (Note 19) | | | 436 | | | | 108 | |
| Other (Notes 23 and 25) | | | 1,042 | | | | 3,406 | |
| | | | | | | |
| Total Other Liabilities | | | 1,478 | | | | 3,514 | |
| | | | | | | |
| Total Liabilities | | | 93,390 | | | | 79,717 | |
| | | | | | | |
| | | | | | | | | |
| MINORITY INTERESTS | | | 9,810 | | | | 8,620 | |
| | | | | | | |
| | | | | | | | | |
| COMMITMENTS AND CONTINGENCIES (Notes 25 and 26) | | | — | | | | — | |
| | | | | | | | | |
| SHAREHOLDERS’ EQUITY (Note 20) | | | | | | | | |
| Common shares, no par value, and additional paid-in capital; issued and outstanding 53,700 thousand and 54,365 thousand shares on December 31, 2007 and 2008 | | | 296,793 | | | | 300,021 | |
| Accumulated deficit | | | (89,692 | ) | | | (45,304 | ) |
| Accumulated other comprehensive loss | | | (26,436 | ) | | | (26,261 | ) |
| | | | | | | |
| Total Shareholders’ Equity | | | 180,665 | | | | 228,456 | |
| | | | | | | |
| | | | | | | | | |
| TOTAL LIABILITIES AND SHAREHOLDERS’ EQUITY | | $ | 283,865 | | | $ | 316,793 | |
| | | | | | | |
The accompanying notes are an integral part of these consolidated financial statements.
F-4
GIGAMEDIA LIMITED
CONSOLIDATED STATEMENTS OF OPERATIONS
For the Years Ended December 31, 2006, 2007 and 2008
(in thousands except for earnings per share amounts)
| | | | | | | | | | | | | |
| | | 2006 | | | 2007 | | | 2008 | |
| | | | | | | | | | | | | |
| OPERATING REVENUES | | | | | | | | | | | | |
| Gaming software and service revenues | | $ | 55,019 | | | $ | 118,950 | | | $ | 144,765 | |
| Online game and service revenues | | | 18,692 | | | | 32,764 | | | | 45,604 | |
| | | | | | | | | | |
| Total | | | 73,711 | | | | 151,714 | | | | 190,369 | |
| | | | | | | | | | |
| | | | | | | | | | | | | |
| OPERATING COSTS | | | | | | | | | | | | |
| Cost of gaming software and service revenues | | | (7,824 | ) | | | (16,201 | ) | | | (22,770 | ) |
| Cost of online game and service revenues | | | (3,667 | ) | | | (9,118 | ) | | | (12,404 | ) |
| | | | | | | | | | |
| | | | (11,491 | ) | | | (25,319 | ) | | | (35,174 | ) |
| | | | | | | | | | |
| | | | | | | | | | | | | |
| GROSS PROFIT | | | 62,220 | | | | 126,395 | | | | 155,195 | |
| | | | | | | | | | |
| | | | | | | | | | | | | |
| OPERATING EXPENSES | | | | | | | | | | | | |
| Product development and engineering expenses | | | (5,244 | ) | | | (7,338 | ) | | | (13,455 | ) |
| Selling and marketing expenses | | | (27,653 | ) | | | (60,106 | ) | | | (74,173 | ) |
| General and administrative expenses | | | (11,096 | ) | | | (20,983 | ) | | | (25,035 | ) |
| Bad debt expenses (Notes 11 and 14) | | | (448 | ) | | | (548 | ) | | | (2,905 | ) |
| Impairment loss on prepaid licensing fees and intangible assets (Note 1) | | | — | | | | — | | | | (1,524 | ) |
| | | | | | | | | | |
| | | | (44,441 | ) | | | (88,975 | ) | | | (117,092 | ) |
| | | | | | | | | | |
| | | | | | | | | | | | | |
| INCOME FROM OPERATIONS | | | 17,779 | | | | 37,420 | | | | 38,103 | |
| | | | | | | | | | |
| | | | | | | | | | | | | |
| NON-OPERATING INCOME (EXPENSES) | | | | | | | | | | | | |
| Interest income | | | 716 | | | | 1,434 | | | | 1,460 | |
| Gains on sales of marketable securities | | | 70 | | | | 184 | | | | 373 | |
| Interest expense | | | (428 | ) | | | (547 | ) | | | (976 | ) |
| Foreign exchange gain (loss) | | | (122 | ) | | | (679 | ) | | | 240 | |
| Loss on disposal of property, plant and equipment | | | (3 | ) | | | (102 | ) | | | (253 | ) |
| Loss on equity method investments (Note 1) | | | — | | | | (369 | ) | | | (3,010 | ) |
| Other (Note 22) | | | 684 | | | | 2,143 | | | | 842 | |
| | | | | | | | | | |
| | | | 917 | | | | 2,064 | | | | (1,324 | ) |
| | | | | | | | | | |
| | | | | | | | | | | | | |
| INCOME FROM CONTINUING OPERATIONS BEFORE INCOME TAXES AND MINORITY INTEREST | | | 18,696 | | | | 39,484 | | | | 36,779 | |
| INCOME TAX EXPENSES (Note 23) | | | (523 | ) | | | (401 | ) | | | (1,069 | ) |
| | | | | | | | | | |
| INCOME FROM CONTINUING OPERATIONS BEFORE MINORITY INTEREST | | | 18,173 | | | | 39,083 | | | | 35,710 | |
| MINORITY INTEREST | | | (321 | ) | | | (1,281 | ) | | | (757 | ) |
| | | | | | | | | | |
| INCOME FROM CONTINUING OPERATIONS | | | 17,852 | | | | 37,802 | | | | 34,953 | |
| | | | | | | | | | |
| INCOME FROM DISCONTINUED OPERATIONS-NET OF TAX (Note 4) | | | 12,932 | | | | 1,088 | | | | 9,435 | |
| | | | | | | | | | |
| NET INCOME | | $ | 30,784 | | | $ | 38,890 | | | $ | 44,388 | |
| | | | | | | | | | |
| | | | | | | | | | | | | |
| EARNINGS PER SHARE (Note 2) | | | | | | | | | | | | |
| Basic: | | | | | | | | | | | | |
| Income from continuing operations | | $ | 0.35 | | | $ | 0.72 | | | $ | 0.65 | |
| Income from discontinued operations | | | 0.25 | | | | 0.02 | | | | 0.17 | |
| | | | | | | | | | |
| Net income | | $ | 0.60 | | | $ | 0.74 | | | $ | 0.82 | |
| | | | | | | | | | |
| Diluted: | | | | | | | | | | | | |
| Income from continuing operations | | $ | 0.30 | | | $ | 0.63 | | | $ | 0.58 | |
| Income from discontinued operations | | | 0.21 | | | | 0.02 | | | | 0.16 | |
| | | | | | | | | | |
| Net income | | $ | 0.51 | | | $ | 0.65 | | | $ | 0.74 | |
| | | | | | | | | | |
| | | | | | | | | | | | | |
| WEIGHTED AVERAGE SHARES USED TO COMPUTE EARNINGS PER SHARE (Note 2) | | | | | | | | | | | | |
| Basic | | | 50,921 | | | | 52,876 | | | | 54,110 | |
| | | | | | | | | | |
| Diluted | | | 61,114 | | | | 60,022 | | | | 60,152 | |
| | | | | | | | | | |
The accompanying notes are an integral part of these consolidated financial statements.
F-5
GIGAMEDIA LIMITED
CONSOLIDATED STATEMENTS OF SHAREHOLDERS’ EQUITY
For the Years Ended December 31, 2006, 2007 and 2008
(in thousands, except per share amounts)
| | | | | | | | | | | | | | | | | | | | | |
| | | Common shares | | | | | | | Accumulated other | | | | |
| | | and additional paid-in capital | | | Accumulated | | | comprehensive | | | | |
| | | Shares | | | Amount | | | deficit (Note 20) | | | income (loss) | | | Total | |
| Balance as of January 1, 2006 | | | 50,344 | | | $ | 287,920 | | | $ | (159,223 | ) | | $ | (28,049 | ) | | $ | 100,648 | |
| Issuance of common shares from exercise of stock options | | | 1,151 | | | | 1,265 | | | | — | | | | — | | | | 1,265 | |
| Stock-based compensation | | | — | | | | 310 | | | | — | | | | — | | | | 310 | |
| Adjustment for initial application of FAS 158 | | | — | | | | — | | | | — | | | | 235 | | | | 235 | |
| Net income | | | — | | | | — | | | | 30,784 | | | | — | | | | 30,784 | |
| Components of other comprehensive income: | | | | | | | | | | | | | | | | | | | — | |
| |
| Change in unrealized gain (loss) on marketable securities | | | — | | | | — | | | | — | | | | 335 | | | | 335 | |
| Foreign currency translation adjustment | | | — | | | | — | | | | — | | | | 510 | | | | 510 | |
| | | | | | | | | | | | | | | | | | | | |
| Total comprehensive income | | | — | | | | — | | | | — | | | | — | | | | 31,629 | |
| | | | | | | | | | | | | | | | |
| Balance as of December 31, 2006 | | | 51,495 | | | | 289,495 | | | | (128,439 | ) | | | (26,969 | ) | | | 134,087 | |
| Issuance of common shares from exercise of stock options and RSUs | | | 1,979 | | | | 2,733 | | | | — | | | | — | | | | 2,733 | |
| Issuance of common shares for acquisition (Note 5) | | | 226 | | | | 2,703 | | | | — | | | | — | | | | 2,703 | |
| Stock-based compensation | | | — | | | | 1,862 | | | | — | | | | — | | | | 1,862 | |
| Adjustment for initial application of FIN 48 (Note 23) | | | — | | | | — | | | | (143 | ) | | | — | | | | (143 | ) |
| Net income | | | — | | | | — | | | | 38,890 | | | | — | | | | 38,890 | |
| Components of other comprehensive income: | | | | | | | | | | | | | | | | | | | | |
| Change in unrealized gain (loss) on marketable securities | | | — | | | | — | | | | — | | | | 58 | | | | 58 | |
| Defined benefit pension plan adjustment | | | — | | | | — | | | | — | | | | (54 | ) | | | (54 | ) |
| Foreign currency translation adjustment | | | — | | | | — | | | | — | | | | 529 | | | | 529 | |
| | | | | | | | | | | | | | | | | | | | |
| Total comprehensive income | | | — | | | | — | | | | — | | | | — | | | | 39,423 | |
| | | | | | | | | | | | | | | | |
| Balance as of December 31, 2007 | | | 53,700 | | | | 296,793 | | | | (89,692 | ) | | | (26,436 | ) | | | 180,665 | |
| Issuance of common shares from exercise of stock options and RSUs | | | 665 | | | | 495 | | | | — | | | | — | | | | 495 | |
| Stock-based compensation | | | — | | | | 2,733 | | | | — | | | | — | | | | 2,733 | |
| Net income | | | — | | | | — | | | | 44,388 | | | | — | | | | 44,388 | |
| Components of other comprehensive income: | | | | | | | | | | | | | | | | | | | | |
| Change in unrealized gain (loss) on marketable securities | | | — | | | | — | | | | — | | | | (282 | ) | | | (282 | ) |
| Defined benefit pension plan adjustment | | | — | | | | — | | | | — | | | | 95 | | | | 95 | |
| Foreign currency translation adjustment | | | — | | | | — | | | | — | | | | 362 | | | | 362 | |
| | | | | | | | | | | | | | | | | | | | |
| Total comprehensive income | | | — | | | | — | | | | — | | | | — | | | | 44,563 | |
| | | | | | | | | | | | | | | | |
| Balance as of December 31, 2008 | | | 54,365 | | | $ | 300,021 | | | $ | (45,304 | ) | | $ | (26,261 | ) | | $ | 228,456 | |
| | | | | | | | | | | | | | | | |
The accompanying notes are an integral part of these consolidated financial statements.
F-6
GIGAMEDIA LIMITED
CONSOLIDATED STATEMENTS OF CASH FLOWS
For the Years Ended December 31, 2006, 2007 and 2008
(in thousands)
| | | | | | | | | | | | | |
| | | 2006 | | | 2007 | | | 2008 | |
| | | | | | | | | | | | | |
| CASH FLOWS FROM OPERATING ACTIVITIES: | | | | | | | | | | | | |
| Net income | | $ | 30,784 | | | $ | 38,890 | | | $ | 44,388 | |
| Adjustments to reconcile net income to net cash provided by operating activities: | | | | | | | | | | | | |
| Depreciation | | | 3,167 | | | | 3,184 | | | | 4,031 | |
| Amortization | | | 2,876 | | | | 3,214 | | | | 4,342 | |
| Stock-based compensation | | | 310 | | | | 1,862 | | | | 2,780 | |
| Impairment loss on prepaid licensing fees and intangible assets | | | — | | | | — | | | | 1,524 | |
| Provision for bad debt expenses | | | 715 | | | | 743 | | | | 2,953 | |
| Gain on divestiture of business | | | (7,668 | ) | | | — | | | | (11,014 | ) |
| Gain on sales of investment option rights | | | — | | | | (498 | ) | | | — | |
| Gain on cancellation of prefered share call options | | | — | | | | (1,069 | ) | | | — | |
| Loss on disposal of property, plant and equipment | | | 37 | | | | 134 | | | | 282 | |
| Gain on sale of marketable securities | | | (2,189 | ) | | | (205 | ) | | | (400 | ) |
| Loss on equity method investments | | | — | | | | 369 | | | | 3,010 | |
| Interest income from premium of convertible notes | | | (140 | ) | | | — | | | | — | |
| Gain on early redemption of convertible notes | | | (625 | ) | | | — | | | | — | |
| Minority interest | | | 321 | | | | 1,281 | | | | 757 | |
| Other | | | 63 | | | | (86 | ) | | | 300 | |
| Net changes in operating assets and liabilities, net of business acquisitions: | | | | | | | | | | | | |
| Accounts receivable | | | (5,723 | ) | | | (3,864 | ) | | | 465 | |
| Prepaid expenses | | | (2,422 | ) | | | (2,316 | ) | | | (4,373 | ) |
| Other current assets | | | (438 | ) | | | 3,673 | | | | (2,304 | ) |
| Accounts payable | | | 69 | | | | (327 | ) | | | 33 | |
| Accrued expenses | | | 2,419 | | | | 2,893 | | | | 2,326 | |
| Accrued compensation | | | 2,264 | | | | 1,991 | | | | (2,057 | ) |
| Player account balances | | | 7,440 | | | | 17,609 | | | | 5,691 | |
| Other current liabilities | | | 254 | | | | (1,259 | ) | | | 336 | |
| Accrued pension liabilities | | | (150 | ) | | | (62 | ) | | | (167 | ) |
| Prepaid licensing and royalty fees | | | (3,374 | ) | | | (9,829 | ) | | | (4,685 | ) |
| Other | | | 1,553 | | | | (165 | ) | | | 2,532 | |
| | | | | | | | | | |
| Net cash provided by operating activities | | | 29,543 | | | | 56,163 | | | | 50,750 | |
| | | | | | | | | | |
| | | | | | | | | | | | | |
| CASH FLOWS FROM INVESTING ACTIVITIES: | | | | | | | | | | | | |
| Decrease (increase) in restricted cash | | | (2,697 | ) | | | (3,550 | ) | | | 4,122 | |
| Proceeds from disposal of marketable securities | | | 26,700 | | | | 20,151 | | | | 25,095 | |
| Divestiture of business, net of cash transferred | | | 3,318 | | | | 4,930 | | | | 16,471 | |
| Purchase of property, plant and equipment | | | (2,716 | ) | | | (4,900 | ) | | | (8,814 | ) |
| Proceeds from disposal of property, plant and equipment | | | 8 | | | | 46 | | | | 35 | |
| Proceeds from sales of investment option rights | | | — | | | | 580 | | | | — | |
| Purchase of marketable securities | | | (42,509 | ) | | | (26,552 | ) | | | (24,746 | ) |
| Purchase of investments | | | — | | | | (1,827 | ) | | | (190 | ) |
| Purchase of intangible assets | | | (2,583 | ) | | | (4,642 | ) | | | (7,509 | ) |
| Acquisitions, net of cash acquired | | | (26,760 | ) | | | (13,983 | ) | | | (4,642 | ) |
| Increase in loan receivable | | | — | | | | (2,500 | ) | | | — | |
| Increase in refundable deposits | | | (197 | ) | | | (610 | ) | | | (5,862 | ) |
| Decrease in other assets | | | (82 | ) | | | — | | | | — | |
| Other | | | (368 | ) | | | (314 | ) | | | (380 | ) |
| | | | | | | | | | |
| Net cash used in investing activities | | | (47,886 | ) | | | (33,171 | ) | | | (6,420 | ) |
| | | | | | | | | | |
(Continued)
F-7
GIGAMEDIA LIMITED
CONSOLIDATED STATEMENTS OF CASH FLOWS — (Continued)
For the Years Ended December 31, 2006, 2007 and 2008
(in thousands)
| | | | | | | | | | | | | |
| | | 2006 | | | 2007 | | | 2008 | |
| CASH FLOWS FROM FINANCING ACTIVITIES: | | | | | | | | | | | | |
| Proceeds from (repayment of) short-term borrowings | | | 12,853 | | | | 20,126 | | | | (18,058 | ) |
| Capital contribution received from minority shareholders | | | — | | | | 30 | | | | — | |
| Redemption of convertible notes | | | (15,000 | ) | | | — | | | | — | |
| Cash received from the exercise of stock options | | | 1,265 | | | | 2,733 | | | | 495 | |
| Cash dividend to minority interest shareholders of variable interest entity | | | (100 | ) | | | (200 | ) | | | (300 | ) |
| Other | | | (80 | ) | | | (117 | ) | | | (13 | ) |
| | | | | | | | | | |
| Net cash (used in) provided by financing activities | | | (1,062 | ) | | | 22,572 | | | | (17,876 | ) |
| | | | | | | | | | |
| | | | | | | | | | | | | |
| Exchange difference | | | 46 | | | | 627 | | | | 936 | |
| | | | | | | | | | |
| NET INCREASE (DECREASE) IN CASH AND CASH EQUIVALENTS | | | (19,359 | ) | | | 46,191 | | | | 27,390 | |
| CASH AND CASH EQUIVALENTS AT BEGINNING OF YEAR | | | 41,731 | | | | 22,372 | | | | 68,563 | |
| | | | | | | | | | |
| CASH AND CASH EQUIVALENTS AT END OF YEAR | | $ | 22,372 | | | $ | 68,563 | | | $ | 95,953 | |
| | | | | | | | | | |
| | | | | | | | | | | | | |
| SUPPLEMENTAL DISCLOSURES OF CASH FLOW INFORMATION: | | | | | | | | | | | | |
| Interest paid during the year | | $ | 581 | | | $ | 621 | | | $ | 1,008 | |
| | | | | | | | | | |
| Income tax paid during the year | | $ | 455 | | | $ | 827 | | | $ | 1,412 | |
| | | | | | | | | | |
| NON-CASH FINANCING AND INVESTING ACTIVITIES: | | | | | | | | | | | | |
| Change in unrealized holding (loss) gain on available-for-sale securities | | $ | 335 | | | $ | 58 | | | $ | (282 | ) |
| | | | | | | | | | |
| Accrual for investing in marketable securities | | | — | | | $ | 2,204 | | | | — | |
| | | | | | | | | | |
| Issuance of common shares for acquisition | | | — | | | $ | 2,703 | | | | — | |
| | | | | | | | | | |
| Issuance of convertible notes as acquisition consideration | | $ | 15,000 | | | | — | | | | — | |
| | | | | | | | | | |
| Adjustment to acquisition purchase price | | $ | 5,000 | | | | — | | | | — | |
| | | | | | | |
| Divestiture of business — consideration receivable | | $ | 4,966 | | | | — | | | | 1,006 | |
| | | | | | | | | | |
The accompanying notes are an integral part of these consolidated financial statements.
F-8
GIGAMEDIA LIMITED
NOTES TO THE CONSOLIDATED FINANCIAL STATEMENTS
YEARS ENDED DECEMBER 31, 2006, 2007 AND 2008
| | |
| NOTE 1. | | BUSINESS OVERVIEW, BASIS OF PRESENTATION, AND SUMMARY OF SIGNIFICANT ACCOUNTING POLICIES |
(a) Business Overview
GigaMedia Limited (referred to hereinafter as GigaMedia, our Company, we, us, or our) is a provider of online entertainment software and services, with headquarters in Taipei, Taiwan.
We conduct our online entertainment business in two business segments: our gaming software and service business, which develops and licenses software for online real-money gaming solutions and applications; and our online game and service business, which operates play-for-fun games online.
The gaming software and service business develops and licenses online poker and casino gaming software solutions and application services, primarily targeting continental European markets. As a software developer and support service provider, we offer software solutions for online gaming, which we license under a software license and support service contract.
The online game and service business operates a suite of play-for-fun online games and provides related services, mainly targeting online game players in Asia.
(b) Basis of Presentation
In September 2008, we sold the remaining portion of our legacy Internet access and service business (See Note 4, “Divestitures”, for additional information). The Internet access and service business has been accounted for as a discontinued operation under accounting principles generally accepted in the United States of America (“GAAP”) and, therefore, the results of operations of the Internet access and service business have been removed from our Company’s results of continuing operations for all periods presented.
F-9
GIGAMEDIA LIMITED
NOTES TO THE CONSOLIDATED FINANCIAL STATEMENTS — (Continued)
YEARS ENDED DECEMBER 31, 2006, 2007 AND 2008
Principles of Consolidation
The Consolidated Financial Statements include the accounts of GigaMedia and our wholly-owned and majority-owned subsidiaries after elimination of all inter-company accounts and transactions. In addition, the accounts of our Company’s variable-interest entities (“VIE”) as defined by the Financial Accounting Standards Board (“FASB”) Interpretation No. 46(R) (“FIN 46(R)”) are included in the Consolidated Financial Statements. (See Note 3, “Variable-Interest Entities”). The accounting policies for other less than majority-owned investments are described in Note 1 below within the paragraphs headed “Marketable Securities” and “Investments”.
Foreign Currency Translation
The Consolidated Financial Statements of our Company and our subsidiaries have been reported in U.S. dollars. Assets and liabilities denominated in non-U.S. currency are translated to U.S. dollars at year-end exchange rates. Income and expense items are translated at weighted-average rates of exchange prevailing during the year. Cumulative translation adjustments resulting from this process are charged or credited to other comprehensive income in shareholders’ equity. Gains and losses on foreign currency transactions are included in other income and expenses. Cumulative translation adjustments as of December 31, 2006, 2007, and 2008 were ($28) million, ($27) million, and ($27) million, respectively.
(c) Summary of significant accounting policies
Use of Estimates
The preparation of Consolidated Financial Statements in conformity with GAAP requires management to make estimates and assumptions that affect the reported amounts of assets and liabilities and disclosures of contingent assets and liabilities at the dates of the Consolidated Financial Statements and the reported amounts of revenues and expenses during the reporting periods. Actual results could differ from those estimates.
F-10
GIGAMEDIA LIMITED
NOTES TO THE CONSOLIDATED FINANCIAL STATEMENTS — (Continued)
YEARS ENDED DECEMBER 31, 2006, 2007 AND 2008
Revenue Recognition
General
Our Company recognizes revenues when persuasive evidence of an arrangement exists, delivery occurs or services are rendered, the sales price is fixed or determinable and collectability is reasonably assured.
We present the sales taxes assessed by governmental authorities on our revenue transactions on a net basis in our Consolidated Financial Statements.
Multiple-Element Arrangements
Our Company enters into multiple-element revenue arrangements, which may include any combination of services, software, and/or products. To the extent that a deliverable in a multiple-element arrangement is subject to specific guidance, whether and/or how to separate multiple deliverable arrangements into separate units of accounting (separability) and how to allocate the arrangement consideration among those separate units of accounting (allocation) for that deliverable is accounted for in accordance with such specific guidance. All other deliverables in multiple-element arrangements are accounted for in accordance with Emerging Issues Task Force (“EITF”) 00-21, “Revenue Arrangements with Multiple Deliverables”.
In addition to the aforementioned general policies, the following are the specific revenue recognition policies for each major category of revenue.
Gaming Software and Service Revenues
Gaming software and service revenues are related to software products we develop and license and support services we provide for online real-money gaming solutions and applications.
F-11
GIGAMEDIA LIMITED
NOTES TO THE CONSOLIDATED FINANCIAL STATEMENTS — (Continued)
YEARS ENDED DECEMBER 31, 2006, 2007 AND 2008
Under the provisions of FIN 46(R), the results of a software licensee of our Company, Ultra Internet Media, S.A. (“UIM”) have been incorporated into our Consolidated Financial Statements. UIM and GigaMedia are separately owned. (See Note 3, “Variable-Interest Entities”, for additional information). Our software licensing and support service revenues are based upon a percentage of gross receipts generated by UIM’s online gaming operations, and are recognized monthly. Software licensing and support service revenues we receive from providing such services to UIM have been eliminated in consolidation.
UIM generates revenues by providing and promoting online games of skill and chance that are available on its free download gaming software. Multiple-element revenue arrangements involving UIM’s provision of software and software-related elements to customers are accounted for in accordance with the American Institute of Certified Public Accountants (“AICPA”) Statement of Position (“SOP”) No. 97-2, “Software Revenue Recognition” (“SOP 97-2”). UIM’s online gaming service is inseparable from the software element involved and UIM does not sell each element separately. UIM’s online gaming service does not involve significant production, modification, or customization of the gaming software. Revenues derived from UIM’s online gaming software platform, which were included in our Consolidated Financial Statements in accordance with FIN 46(R), are recognized at the time games are played and are net of player winnings. Transaction fee revenues derived from UIM’s online multi-player poker platform are recognized as services are provided.
Online Game and Service Revenues
Online game and service revenues are related to our online game and service business that operates play-for-fun games online in Asia.
Online game revenues are earned through the sale of online game points, pre-paid cards, and game packs. Virtual online game points are sold directly to end-users who can make the payments through credit cards, the Internet ATMs or telecommunication service operators. Physical pre-paid cards and game packs are sold through distributors and convenience stores. Proceeds from sales of physical cards and game packs, net of sales discounts, and online game points are deferred when received and revenue is recognized upon the actual usage of the playing time or in-game virtual items by the end-users; over the estimated useful life of virtual items; or when the sold game points expire and can no longer be used to access the online games or products in accordance with our published game points expiration policy.
F-12
GIGAMEDIA LIMITED
NOTES TO THE CONSOLIDATED FINANCIAL STATEMENTS — (Continued)
YEARS ENDED DECEMBER 31, 2006, 2007 AND 2008
In accordance with EITF 99-19, “Reporting Revenue Gross as a Principal Versus Net as an Agent”, we report sales of virtual online game points on a gross basis. In the sales of virtual online game points, we act as principal and we have latitude in establishing price. Fixed percentage fees retained by service providers for payment processing related to our online game services are recognized as cost of online game revenues.
Online game and service revenues also include revenues derived from online advertising arrangements, sponsorship arrangements, or a combination of both. These service arrangements allow advertisers to place advertisements on particular areas of our Company’s websites and online game platforms over a stated period of time. Service revenues from online advertising arrangements are recognized ratably over the displayed period of the contract when the collectability is reasonably assured.
Discontinued Operations
For 2006, 2007 and 2008, a portion of our Company’s revenues was generated from our Internet access and service business. We disposed of the remaining portion of our Internet access and service business in September 2008, and as a result have classified the income from these revenue-generating activities as part of discontinued operations. (See Note 4, “Divestitures”, for additional information).
Our Internet access and service business revenues consisted of cable modem, ADSL, and corporate Internet access services provided by us. Cable modem, ADSL, and corporate Internet access revenues were recorded net of discounts, and in the case of our cable modem and corporate services, net of fees paid to our cable partners in accordance with revenue sharing agreements in effect between our Company and our cable partners. Any advanced payment receipts were recorded as deferred revenues included in other current liabilities in our Consolidated Balance Sheets and were amortized over the subscription period.
F-13
GIGAMEDIA LIMITED
NOTES TO THE CONSOLIDATED FINANCIAL STATEMENTS — (Continued)
YEARS ENDED DECEMBER 31, 2006, 2007 AND 2008
All the Internet access and service revenues were recognized on a straight-line basis over the subscription period or for the period in which the service was performed if no significant outstanding obligations of our Company remained and collection of the receivables was reasonably assured. The sale of other Internet access-related products and rental income from the lease of Internet access-related equipment to subscribers of our Company’s Internet access and service business were recognized when products were delivered or services were provided.
Player Account Balances
Player account balances are related to player deposits from our gaming software and service business. Player account balances are presented as current liabilities, which are first accrued for in full upon the receipt of player deposits, and increased or decreased based on player activities, including player wins or losses, withdrawals and refunds.
Deferred Revenues
Deferred revenues are included in other current liabilities, and consist of the prepaid income related to our online game and service business, and the advance payment receipts related to our Internet access and services business, which we sold in September 2008 (See Note 4, “Divestitures”, for additional information).
Operating Costs
Operating costs primarily consist of gaming software and online game processing costs, online game royalties, production costs for prepaid game cards and game packs, amortization of intangible assets, customer service department costs for our online games, and depreciation, maintenance and other overhead expenses directly attributable to our gaming software and service revenues and online game and service revenues.
Prepaid Licensing and Royalty Fees
Our Company, through our subsidiaries and VIE subsidiaries, entered into several license agreements with licensors to acquire licenses for the using, marketing, distributing, selling and publishing of multi-player online games.
F-14
GIGAMEDIA LIMITED
NOTES TO THE CONSOLIDATED FINANCIAL STATEMENTS — (Continued)
YEARS ENDED DECEMBER 31, 2006, 2007 AND 2008
Prepaid licensing fees paid to licensors are capitalized when technological feasibility is achieved, and amortized on a straight-line basis over the shorter of the useful economic life of the relevant online game or license period, which is usually within two to five years. The annual amortization shall be modified if the amount computed using the ratio that current gross revenues for a game license bear to the total of current and anticipated future gross revenues for that game license is greater than the amount computed using the straight-line method.
Prepaid royalty fees and related costs are recognized in the period in which the related online game revenue is recognized.
Fair Value Measurement
We adopted the provisions of Statement of Financial Accounting Standards (“FAS”) No. 157, “Fair Value Measurements” (“FAS 157”) on January 1, 2008, on a prospective basis, as amended by FASB Staff Position (“FSP”) FAS 157-1, “Application of FASB Statement No. 157 to FASB Statement No. 13 and Other Accounting Pronouncements That Address Fair Value Measurements for Purposes of Lease Classification or Measurement under Statement 13” (“FSP FAS 157-1”), FSP FAS 157-2, “Effective Date of FASB Statement No. 157” (“FSP FAS 157-2”) and FSP FAS 157-3 “Determining the Fair value of a Financial Asset When the Market for That Asset Is Not Active” (“FSP FAS 157-3”). FAS 157 defines fair value, establishes a framework for measuring fair value in GAAP and provides for expanded disclosure about fair value measurements. FAS 157 applies prospectively to all other accounting pronouncements that require or permit fair value measurements. FSP FAS 157-1 amends FAS 157 to exclude from the scope of FAS 157 certain leasing transactions accounted for under FAS No. 13, “Accounting for Leases.” FSP FAS 157-2 amends FAS 157 to defer the effective date of FAS 157 for all non-financial assets and non-financial liabilities except those that are recognized or disclosed at fair value in the financial statements on a recurring basis to fiscal years beginning after November 15, 2008. FSP FAS 157-3 clarifies the application of FAS 157 to financial instruments in an inactive market. The adoption of FAS 157 and the related amendments did not have a material impact in our Company’s Consolidated Financial Statements.
F-15
GIGAMEDIA LIMITED
NOTES TO THE CONSOLIDATED FINANCIAL STATEMENTS — (Continued)
YEARS ENDED DECEMBER 31, 2006, 2007 AND 2008
We also adopted the provisions of FAS No. 159, “The Fair Value Option for Financial Assets and Financial Liabilities” (“FAS 159”) on January 1, 2008. FAS 159 requires that unrealized gains and losses on items for which the fair value option has been elected be reported in earnings. We did not elect to apply the fair value option to any financial instruments or other items upon adoption of FAS 159. As a result, the adoption of FAS 159 did not impact our consolidated financial position, results of operations, or cash flows.
The Company generally determines or calculates the fair value of financial instruments using quoted market prices in active markets when such information is available or using appropriate present value or other valuation techniques, such as discounted cash flow analyses, incorporating available market discount rate information and the Company’s estimates for non-performance and liquidity risk. These techniques rely extensively on the use of a number of assumptions, including the discount rate, credit spreads, and estimates of future cash flows. (See Note 8, “Fair Value Measurement”, for additional information).
Cash Equivalents
Cash equivalents are short-term, highly liquid investments that are readily convertible to known amounts of cash and so near to their maturity that they present relatively insignificant risk from changes in interest rates. Commercial paper, negotiable certificates of deposit, time deposits and bank acceptances with original maturities of three months or less are considered to be cash equivalents.
Marketable Securities
All of our Company’s investments in marketable securities are classified as available-for-sale. Available-for-sale marketable securities are accounted for in accordance with FAS No. 115 “Accounting for Certain Investments in Debt and Equity Securities” (“FAS 115”). These marketable securities are stated at fair value with any unrealized gains or losses recorded in accumulated other comprehensive income (loss) in shareholders’ equity until realized.
F-16
GIGAMEDIA LIMITED
NOTES TO THE CONSOLIDATED FINANCIAL STATEMENTS — (Continued)
YEARS ENDED DECEMBER 31, 2006, 2007 AND 2008
Other-than-temporary declines in market value from original cost, if any, are charged to non-operating income and expense in the period in which the loss occurs. In determining whether an other-than-temporary decline in the market value has occurred, our Company considers the duration that, and extent to which, fair value of the investment is below its cost. Realized gains and losses also are included in non-operating income and expense in the Consolidated Statements of Operations. There were no other-than-temporary market value declines in 2007 and 2008.
Investments
We apply Accounting Principles Board Opinion (“APB”) No. 18, “The Equity Method of Accounting for Investments in Common Stock” in accounting for our investments.
Equity investments in non-publicly traded securities of companies over which our Company has no ability to exercise significant influence are accounted for under the cost method. The equity investments accounted for under the cost method as of December 31, 2007 and 2008 were $1,850 thousand and $1,830 thousand, respectively.
Equity investments in companies over which our Company has the ability to exercise significant influence but does not hold a controlling interest are accounted for under the equity method and our Company’s income or loss on equity method investments is recorded in non-operating income or expenses. The difference between the cost of the acquisition and the Company’s share of fair value of the net identifiable assets is recognized as goodwill and is included in the carrying amount of the investment. When our Company’s carrying value in an equity method investee company is reduced to zero, no further losses are recorded in our Company’s Consolidated Financial Statements unless our Company guaranteed obligations of the investee company or has committed additional funding. When the investee company subsequently reports income, our Company will not record its share of such income until it equals the amount of its share of losses not previously recognized.
F-17
GIGAMEDIA LIMITED
NOTES TO THE CONSOLIDATED FINANCIAL STATEMENTS — (Continued)
YEARS ENDED DECEMBER 31, 2006, 2007 AND 2008
As of December 31, 2008, we had investments in CJIT2 Holding Limited and Taiwan E-Sport League Co., Ltd representing an approximate 23 percent interest and 20 percent interest, respectively, which we accounted for under the equity method of accounting. During 2008, we recognized our share of losses under the equity method of accounting of $3,010 thousand.
Unrealized losses that are considered other-than-temporary, if any, are included in the current year’s Consolidated Statement of Operations. Realized gains and losses, measured against carrying amount, are also included in the current year’s Consolidated Statement of Operations. There were no other-than-temporary losses in 2007 and 2008.
Allowance for Doubtful Accounts
An allowance for doubtful accounts is provided based on an evaluation of the collectability of notes receivable, accounts receivable, and other receivables. An allowance for doubtful accounts is also provided, when considered necessary, to loans receivable. We review the collectability of loans receivable on an individual basis and the evaluation primarily consists of an analysis based upon current information available about the borrower.
For those accounts in which a loss is probable, we record a specific reserve. Receivable losses are charged against the allowance when the Company believes the uncollectability of the receivable is confirmed. Subsequent recoveries, if any, are credited to the allowance.
F-18
GIGAMEDIA LIMITED
NOTES TO THE CONSOLIDATED FINANCIAL STATEMENTS — (Continued)
YEARS ENDED DECEMBER 31, 2006, 2007 AND 2008
Property, Plant and Equipment
Property, plant and equipment are stated at cost, less accumulated depreciation. Depreciation is provided on a straight-line basis over useful lives that correspond to categories as follows:
| | | | | |
| Categories | | Years | |
| Buildings | | | 50 | |
| Information and communication equipment | | | 2 to 5 | |
| Office furniture and equipment | | | 3 to 5 | |
| Leasehold improvements | | | 2 to 5 | |
| Other | | | 5 | |
Leasehold improvements are depreciated over the life of the lease or the assets, whichever is shorter. Improvements and replacements are capitalized and depreciated over their estimated useful lives, while ordinary repairs and maintenance are expensed as incurred.
In September 2008, we entered into agreements to lease certain of our Company’s land and buildings to a third party under an operating lease, which expires no later than September 2010. As of December 31, 2008, the carrying amount of the land and buildings was $1.6 million (net of accumulated depreciation of $191 thousand). The rental income under the operating lease amounted to $21 thousand for 2008. The following table sets forth our future aggregate minimum rental income to be received under this operating lease:
| | | | | |
| | | Amount | |
| Year | | (in US$ thousands) | |
| 2009 | | $ | 43 | |
| 2010 | | | 20 | |
Acquisitions
Our Company has accounted for its business acquisitions using the purchase method as required by FAS No. 141, “Business Combinations” (“FAS 141”). Under FAS 141, the acquiring company allocates the purchase price to the assets acquired and liabilities assumed based on their estimated fair values at the date of acquisition, including intangible assets that can be identified. The purchase price in excess of the fair value of the net assets and liabilities identified is recorded as goodwill, for which the provisions of FAS No. 142, “Goodwill and Other Intangible Assets” (“FAS 142”) apply. Business acquisitions that our Company enters into in the future will be accounted for in accordance with FAS No. 141(R).
F-19
GIGAMEDIA LIMITED
NOTES TO THE CONSOLIDATED FINANCIAL STATEMENTS — (Continued)
YEARS ENDED DECEMBER 31, 2006, 2007 AND 2008
Intangible Assets and Goodwill
Our Company’s intangible assets with definite lives are being amortized by the straight-line method over their estimated useful lives, ranging from three to ten years. Our Company’s intangible assets with an indefinite useful life are not amortized. The recoverability of intangible assets is evaluated periodically. In making the evaluation, consideration is given to events or circumstances that warrant revised estimates of useful lives or that indicate that impairment exists. Goodwill is not amortized.
Impairment of Intangible Assets, Goodwill and Long-Lived Assets
Potential impairment of goodwill and intangible assets with indefinite useful lives has been evaluated using the specific guidance provided by FAS 142. This impairment analysis is performed, at the reporting unit level, at least annually, or whenever events or changes in circumstances indicate that the carrying value of an asset might not be recoverable from its related future undiscounted cash flows. Impairment is measured as the difference between the carrying amounts and the fair value of the assets, and is recognized as a loss from operations.
Potential impairment of long-lived assets other than goodwill and intangible assets not being amortized (which includes prepaid licensing and royalty fees) has been evaluated using the guidance provided by FAS No. 144, “Accounting for the Impairment or Disposal of Long-Lived Assets”, (“FAS 144”). This impairment analysis is performed, at least annually, or whenever events or changes in circumstances indicate that the carrying value of an asset might not be recoverable from its related future undiscounted cash flows. If such assets are considered to be impaired, the impairment to be recognized is measured by the amount to the extent of which the carrying amount of the assets exceeds the fair value of the assets. When an impairment is identified, the carrying amount of the asset is reduced to its estimated fair value.
F-20
GIGAMEDIA LIMITED
NOTES TO THE CONSOLIDATED FINANCIAL STATEMENTS — (Continued)
YEARS ENDED DECEMBER 31, 2006, 2007 AND 2008
In 2008, we recognized an impairment charge of $641 thousand related to capitalized software costs and an impairment loss of $883 thousand on prepaid licensing fees. The impairment charges were the result of certain projects that we ceased further development on, and certain licensed games we stopped operating.
Software Cost
We recognize costs to develop our gaming software and online game products in accordance with FAS No. 86, “Accounting for Costs of Computer Software to be Sold, Leased or Otherwise Marketed”. Accordingly, costs are capitalized after technological feasibility has been established, and cease when the product is available for general release to customers. Costs incurred prior to the establishment of technological feasibility are expensed when incurred and are included in product development and engineering expenses. Capitalized amounts are amortized using the straight-line method, which is applied over the useful economic life of the software, ranging from three to five years. The annual amortization is modified if the amount computed using the ratio that current gross revenues for a product bear to the total of current and anticipated future gross revenues for that product is greater than the amount computed using the straight-line method.
We capitalize certain costs incurred to purchase or to create and implement internal-use computer software, which includes software coding, installation, testing and certain data conversion in accordance with SOP 98-1, “Accounting for the Costs of Computer Software Developed or Obtained for Internal Use”. These capitalized costs are amortized on a straight-line basis over the shorter of the useful economic life of the software or its contractual license period, which range from three to five years.
Product Development and Engineering
Product development and engineering expenses primarily consist of research compensation, depreciation, and amortization, and are expensed as incurred.
F-21
GIGAMEDIA LIMITED
NOTES TO THE CONSOLIDATED FINANCIAL STATEMENTS — (Continued)
YEARS ENDED DECEMBER 31, 2006, 2007 AND 2008
Advertising
Direct-response advertising costs incurred related to the acquisition or origination of a customer relationship are capitalized and deferred. The deferred costs are recognized on the Consolidated Statements of Operations over the estimated lives of customer relationship. Costs of communicating advertising are recorded as expenses as advertising airtime is used. Other advertising expenditures are expensed as incurred.
Advertising expenses incurred in 2006, 2007 and 2008 totaled $20.6 million, $50.1 million and $60.1 million, respectively (including $108 thousand, $28 thousand, and $42 thousand reported in discontinued operations in 2006, 2007 and 2008, respectively). As of December 31, 2007 and 2008, prepaid advertising amounted to $4.1 million and $8.3 million, respectively.
Leases
Leases for which substantially all of the risks and rewards of ownership of assets remain with the leasing company are accounted for as operating leases. Payments made under operating leases, net of any incentives received by our Company from the leasing company, are charged to the Consolidated Statements of Operations on a straight-line basis over the lease periods.
Share-Based Compensation
We recognize share-based compensation in accordance with FAS No. 123(R), “Share-Based Payment” (“FAS 123(R)”), using the modified prospective method. FAS 123(R) requires companies to estimate the fair value of share-based payment awards on the date of grant using an option-pricing model. The value of the portion of the award that is ultimately expected to vest is recognized as expense over the vesting period. We have also applied the provisions of Staff Accounting Bulletin No. 107 (“SAB 107”) in our adoption of FAS 123(R). (See Note 21, “Share-Based Compensation”, for additional information).
F-22
GIGAMEDIA LIMITED
NOTES TO THE CONSOLIDATED FINANCIAL STATEMENTS — (Continued)
YEARS ENDED DECEMBER 31, 2006, 2007 AND 2008
Our Company accounts for shares and stock options granted to non-employees in accordance with EITF 96-18, “Accounting for Equity Instruments That Are Issued to Other Than Employees for Acquiring or In Conjunction with Selling Goods or Services”, (“EITF 96-18”). Accordingly, we measure the fair value of the equity instruments granted to non-employees at the earlier of the performance commitment date or when the performance is completed.
Retirement Plan and Net Periodic Pension Cost
Under our defined benefit pension plan, net periodic pension cost, which includes service cost, interest cost, expected return on plan assets, amortization of unrecognized net transition obligation and gains or losses on plan assets, is recognized based on an actuarial valuation report. Effective December 31, 2006, our Company adopted the provisions of FAS No. 158, “Employer’s Accounting for Defined Benefit Pension and Other Post-Retirement Plans — An Amendment of FASB Statements Nos. 87, 88, 106, and 132(R)”, (“FAS 158”). FAS 158 requires the recognition of the funded status of pension plans and non-pension post-retirement benefit plans (retirement-related benefit plans) as an asset or a liability in the Consolidated Balance Sheets. In addition, the pronouncement requires previously unrecognized items, such as actuarial gains and unrecognized prior service costs or credits, to be recognized in the Consolidated Balance Sheets as a component of accumulated other comprehensive income (loss). The provisions of FAS 158 were adopted pursuant to the transition provisions therein.
Under our defined contribution pension plan, net periodic pension cost is recognized as incurred.
Comprehensive Income (Loss)
Comprehensive income (loss) is defined as the change in equity of a company from transactions and other events and circumstances, excluding transactions resulting from investments from owners and distributions to owners. Comprehensive income (loss) is recorded as a component of shareholders’ equity. Our Company’s comprehensive income (loss) consists of net income or loss, foreign currency translation adjustments, changes in unrealized holding gains and losses on marketable securities, and unrecognized actuarial gains or losses related to our defined benefit pension plan.
F-23
GIGAMEDIA LIMITED
NOTES TO THE CONSOLIDATED FINANCIAL STATEMENTS — (Continued)
YEARS ENDED DECEMBER 31, 2006, 2007 AND 2008
Accounting for Income Taxes
We have adopted FAS No. 109, “Accounting for Income Taxes”, (“FAS 109”). Under FAS 109, the asset and liability method is used in accounting for income taxes. Under this method, deferred tax assets and liabilities are determined based on the differences between financial reporting and tax bases of assets and liabilities. We recognize the tax benefit from the purchase of equipment and technology, research and development expenditures, employee training, and certain equity investments using the flow-through method. Loss carryforwards and investment credits are measured using the enacted tax rate and laws that will be in effect when the differences are expected to reverse. Valuation allowances are established when necessary to reduce deferred tax assets to the amount that will more-likely-than-not be realized. In assessing the likelihood of realization, management considers estimates of future taxable income.
Effective January 1, 2007, we adopted FASB Interpretation (“FIN”) No. 48, “Accounting for Uncertainty in Income Taxes, an Interpretation of FASB Statement No. 109”, (“FIN 48”) , which prescribes a recognition threshold and measurement attribute for financial statement recognition and measurement of tax positions taken or expected to be taken in a tax return. Under FIN 48, our Company recognizes the financial statement impact of a tax position when it is more-likely-than-not that the position will be sustained upon examination. If the tax position meets the more-likely-than-not recognition threshold, the tax effect is recognized at the largest amount of the benefit that has greater than a fifty percent likelihood of being realized upon ultimate settlement. The interest and penalties are reflected as income taxes benefits (expenses) in our Consolidated Financial Statements. (See Note 23, “Income Taxes”, for more information).
F-24
GIGAMEDIA LIMITED
NOTES TO THE CONSOLIDATED FINANCIAL STATEMENTS — (Continued)
YEARS ENDED DECEMBER 31, 2006, 2007 AND 2008
Earnings Per Share
We compute earnings per share in accordance with FAS No. 128, “Earnings Per Share”, (“FAS 128”). Under the provisions of FAS 128, basic earnings per share is computed by dividing the net income available to common shareholders for the period by the weighted average number of common shares outstanding during the period. Diluted earnings per share is computed by dividing the net income for the period by the weighted average number of common shares and potential common shares outstanding during the period. Potential common shares, composed of incremental common shares issuable upon the exercise of warrants and options in all periods and the assumed conversion of convertible debt in 2006, are included in the computation of diluted earnings per share to the extent such shares are dilutive. Diluted EPS also takes into consideration the effect of diluted securities issued by subsidiaries.
Minority Interest
Minority interest includes 100 percent of the common stock of UIM held by third-party shareholders. UIM was deemed a VIE as defined by FIN 46(R) and our Company was considered the primary beneficiary of UIM. Under the provisions of FIN 46(R), we have incorporated the results of UIM into our 2006, 2007 and 2008 Consolidated Financial Statements, even though we do not own any of UIM’s equity. (See Note 3, “Variable-Interest Entities”, for more information).
Beginning in December 2006, minority interest also includes 30 percent of the common stock of Dragongate Enterprises Limited (“Dragongate Enterprises”), which is held by Cyber Gateway Pte. Ltd. (“Cyber Gateway”), which is 100 percent owned by Infocomm Asia Holdings Pte. Ltd. (“Infocomm Asia”). We also own 500,000 voting convertible preferred shares of Infocomm Asia. (See Note 12, “Marketable Securities — Noncurrent”, for additional information).
Beginning in June 2007, we consolidated T2CN Holding Limited (“T2CN”), which is included in the online game and service business. As of December 31, 2007 and 2008, minority interest also includes 41.89 percent and 33.71 percent, respectively, of the common stock of T2CN, which is held by third-party shareholders. (See Note 5, “Acquisitions”, for more information).
F-25
GIGAMEDIA LIMITED
NOTES TO THE CONSOLIDATED FINANCIAL STATEMENTS — (Continued)
YEARS ENDED DECEMBER 31, 2006, 2007 AND 2008
Reclassification
The presentation of certain prior years’ information has been reclassified to conform with current year presentations.
Recent Accounting Pronouncements
In December 2007, the FASB issued FAS No. 141(R), “Business Combinations” (“FAS 141(R)”). Under FAS 141(R), an acquiring entity will be required to recognize all the assets acquired and liabilities assumed in a transaction at the acquisition-date fair value with limited exceptions. FAS 141(R) applies prospectively to business combinations for which the acquisition date is on or after the beginning of the first annual reporting period beginning on or after December 15, 2008. We believe it will have a material impact on accounting for business acquisitions completed subsequent to December 31, 2008.
In December 2007, the FASB issued FAS No. 160, “Noncontrolling Interests in Consolidated Financial Statements — an Amendment of ARB No. 51”, (“FAS 160”). FAS 160 establishes new accounting and reporting standards for the noncontrolling interest in a subsidiary and for the deconsolidation of a subsidiary. FAS 160 will be effective for fiscal years, and interim periods within those fiscal years, beginning on or after December 15, 2008. FAS 160 establishes accounting and reporting standards for the noncontrolling interest in a subsidiary and for the deconsolidation of a subsidiary. It clarifies that a noncontrolling interest in a subsidiary is an ownership interest in the consolidated entity that should be reported as equity in the consolidated financial statements. Pursuant to the transition provisions of FAS 160, our Company will adopt FAS 160 on January 1, 2009 via retrospective application of the presentation and disclosure requirements of this standard. As a result, our Company will be required to reclassify financial statement line items within our Consolidated Balance Sheets and our Consolidated Statements of Operations for all periods presented to conform with this standard.
F-26
GIGAMEDIA LIMITED
NOTES TO THE CONSOLIDATED FINANCIAL STATEMENTS — (Continued)
YEARS ENDED DECEMBER 31, 2006, 2007 AND 2008
In March 2008, the FASB issued FAS No. 161, “Disclosure about Derivative Instruments and Hedging Activities” — an amendment to FAS No. 133, “Accounting for Derivatives Instruments and Hedging Activities”, (“FAS 161”). FAS 161 requires enhanced disclosures about an entity’s derivative and hedging activities and thereby improves the transparency of financial reporting. FAS 161 will be effective for financial statements issued for fiscal years and interim periods beginning after November 15, 2008. The adoption of FAS 161 is not expected to have a material effect in our Consolidated Financial Statements.
In April 2008, the FASB issued FSP FAS 142-3, “Determination of the Useful Life of Intangible Assets”, (“FSP 142-3”). FSP 142-3 amends the factors to be considered in developing renewal or extension assumptions used to determine the useful life of intangible assets under FAS 142. FSP 142-3 will be effective for financial statements issued for fiscal years beginning after December 15, 2008. We are in the process of determining what effect, if any, the adoption of FSP 142-3 will have in our Consolidated Financial Statements.
In May 2008, the FASB issued FAS No. 162, “The Hierarchy of Generally Accepted Accounting Principles” (“FAS 162”). FAS 162 is intended to improve financial reporting by identifying a consistent framework, or hierarchy, for selecting accounting principles to be used in preparing financial statements that are presented in conformity with U.S. generally accepted accounting principles for nongovernmental entities. FAS 162 is effective November 15, 2008.The adoption of FAS 162 did not have a material effect in our Consolidated Financial Statements.
F-27
GIGAMEDIA LIMITED
NOTES TO THE CONSOLIDATED FINANCIAL STATEMENTS — (Continued)
YEARS ENDED DECEMBER 31, 2006, 2007 AND 2008
In June 2008, the FASB ratified EITF Issue No. 07-5,“Determining Whether an Instrument (or Embedded Feature) is Indexed to an Entity’s Own Stock”(“EITF 07-5”). Paragraph 11(a) of FAS No. 133 specifies that a contract that would otherwise meet the definition of a derivative but is both (a) indexed to the Company’s own stock and (b) classified in stockholders’ equity in the statement of financial position would not be considered a derivative financial instrument. EITF 07-5 provides a new two-step model to be applied in determining whether a financial instrument or an embedded feature is indexed to an issuer’s own stock and thus able to qualify for the FAS No. 133 paragraph 11(a) scope exception. EITF 07-5 is effective for financial statements issued for fiscal years beginning after December 15, 2008. We are in the process of evaluating what effect, if any, the adoption of EITF 07-5 may have in our Consolidated Financial Statements.
In November 2008, the FASB ratified the consensus reached by the EITF on Issue EITF No. 08-6, “Equity Method Investment Accounting Considerations” (“EITF 08-6”), which clarifies the accounting for certain transactions and impairment considerations involving equity method investments. The prospective provisions of EITF 08-6 were effective on January 1, 2009. The adoption of EITF 08-6 is not expected to have a material impact in our Consolidated Financial Statements.
F-28
GIGAMEDIA LIMITED
NOTES TO THE CONSOLIDATED FINANCIAL STATEMENTS — (Continued)
YEARS ENDED DECEMBER 31, 2006, 2007 AND 2008
NOTE 2.EARNINGS PER SHARE
| | | | | | | | | | | | | |
| (in US$ thousands, except per share figures) | | 2006 | | | 2007 | | | 2008 | |
| | | | | | | | | | | | | |
Weighted average outstanding shares | | | | | | | | | | | | |
| Basic | | | 50,921 | | | | 52,876 | | | | 54,110 | |
| Effect of dilutive securities | | | | | | | | | | | | |
| Employee share-based compensation | | | 7,509 | | | | 7,146 | | | | 6,042 | |
| Convertible notes | | | 2,684 | | | | — | | | | — | |
| | | | | | | | | | |
| |
| Diluted | | | 61,114 | | | | 60,022 | | | | 60,152 | |
| | | | | | | | | | |
Earnings Per Share — Basic | | | | | | | | | | | | |
| Income from continuing operations | | $ | 17,852 | | | $ | 37,802 | | | $ | 34,953 | |
| Income from discontinued operations, net of taxes | | | 12,932 | | | | 1,088 | | | | 9,435 | |
| | | | | | | | | | |
| Net income | | $ | 30,784 | | | $ | 38,890 | | | $ | 44,388 | |
| | | | | | | | | | |
| | | | | | | | | | | | | |
| Earnings per share | | | | | | | | | | | | |
| Continuing operations | | $ | 0.35 | | | $ | 0.72 | | | $ | 0.65 | |
| Discontinued operations | | | 0.25 | | | | 0.02 | | | | 0.17 | |
| | | | | | | | | | |
| |
| | | $ | 0.60 | | | $ | 0.74 | | | $ | 0.82 | |
| | | | | | | | | | |
Earnings Per Share — Diluted | | | | | | | | | | | | |
| Income from continuing operations | | $ | 17,852 | | | $ | 37,802 | | | $ | 34,953 | |
| Interest charges associated with convertible notes | | | 288 | | | | — | | | | — | |
| | | | | | | | | | |
| Income from continuing operations after assumed conversion of convertible notes | | | 18,140 | | | | 37,802 | | | | 34,953 | |
| | | | | | | | | | |
| Income from discontinued operations, net of taxes | | | 12,932 | | | | 1,088 | | | | 9,435 | |
| | | | | | | | | | |
| Net income after assumed conversion of convertible notes and discontinued operations | | $ | 31,072 | | | $ | 38,890 | | | $ | 44,388 | |
| | | | | | | | | | |
| Earnings per share | | | | | | | | | | | | |
| Continuing operations | | $ | 0.30 | | | $ | 0.63 | | | $ | 0.58 | |
| Discontinued operations | | | 0.21 | | | | 0.02 | | | | 0.16 | |
| | | | | | | | | | |
| |
| | | $ | 0.51 | | | $ | 0.65 | | | $ | 0.74 | |
| | | | | | | | | | |
F-29
GIGAMEDIA LIMITED
NOTES TO THE CONSOLIDATED FINANCIAL STATEMENTS — (Continued)
YEARS ENDED DECEMBER 31, 2006, 2007 AND 2008
NOTE 3.VARIABLE-INTEREST ENTITIES
The financial statements of the following VIEs have been consolidated into our Company’s Consolidated Financial Statements in accordance with FIN 46(R).
Our Company entered into a software license and support service contract with UIM to provide Internet software and support services for UIM’s online gaming operations. The contract allows us to charge a percentage of UIM gross receipts resulting from UIM’s online gaming operations. The percentage of gross receipts varies depending upon the software and support services provided to UIM. We analyzed the provisions of FIN 46(R) as it relates to contractual relationships and determined that we were and continue to be a primary beneficiary of UIM. As a result of such determination, we have incorporated the results of UIM into our Consolidated Financial Statements, even though we do not own any of UIM’s equity, and recorded goodwill arising from the consolidation of UIM totaling $209 thousand. The net assets, total assets and total liabilities of UIM were approximately $933 thousand, $52.6 million and $51.7 million, respectively, as of December 31, 2007, and $448 thousand, $87.4 million and $86.9 million, respectively, as of December 31, 2008. For the years ended December 31, 2006, 2007 and 2008, total revenue and net income (loss) of UIM were as follows:
| | | | | | | | | | | | | |
| (in US$ thousands) | | 2006 | | | 2007 | | | 2008 | |
| Total revenue | | $ | 55,019 | | | $ | 118,650 | | | $ | 144,765 | |
| | | | | | | | | | |
| Net income (loss) | | $ | 320 | | | $ | 348 | | | $ | (206 | ) |
| | | | | | | | | | |
Beginning in June 2007, we consolidated T2CN. Pursuant to various agreements entered into between T2CN, Shanghai T2 Entertainment Co., Ltd. (“T2 Entertainment”), Shanghai T2 Advertisement Co., Ltd. (“T2 Advertisement”) and the equity owners of T2 Entertainment and T2 Advertisement, T2CN generally has control and the risks and rewards of ownership of T2 Entertainment and T2 Advertisement and is considered the primary beneficiary of T2 Entertainment and T2 Advertisement. T2 Entertainment and T2 Advertisement were established to hold the necessary licenses for our participation in online game and related advertisement services in the People’s Republic of China (“PRC”). Accordingly, from the date that we consolidated T2CN, the results of T2 Entertainment and T2 Advertisement are included in the accompanying Consolidated Financial Statements.
F-30
GIGAMEDIA LIMITED
NOTES TO THE CONSOLIDATED FINANCIAL STATEMENTS — (Continued)
YEARS ENDED DECEMBER 31, 2006, 2007 AND 2008
In November 2007, T2CN entered into various agreements with Shanghai Jinyou Network & Technology Co., Ltd. (“Jinyou”) and the equity owners of Jinyou. The agreements provided for T2CN to obtain conditional effective and enforceable clauses upon acquiring an Internet Content Provider (“ICP”) license by Jinyou. Jinyou was established to hold the necessary licenses for our participation in online games in the PRC. In September 2008, Jinyou acquired the ICP license and the above agreements became effective. T2CN generally has control and the risks and rewards of ownership of Jinyou and is considered the primary beneficiary of Jinyou. Accordingly, the results of Jinyou are included in the accompanying Consolidated Financial Statements starting from September 2008.
Details of certain key agreements between T2CN and its VIEs are as follows:
Shareholder Voting Rights Proxy Agreements. The shareholders of T2 Entertainment, T2 Advertisement and Jinyou entered into Shareholder Voting Rights Proxy Agreements with T2CN Information Technology (Shanghai) Co., Ltd. (“T2CN Technology”), under which each shareholder irrevocably granted T2CN Technology the power to exercise all voting rights to which they were entitled as shareholders of T2 Entertainment, T2 Advertisement and Jinyou.
Exclusive Equity Transfer Call Agreements. T2CN entered into exclusive equity transfer call agreements with each of the shareholders of T2 Entertainment, T2 Advertisement and Jinyou, under which the parties irrevocably agreed that, at T2CN’s sole discretion, it will be entitled to acquire all or part of the equity interests in T2 Entertainment, T2 Advertisement and Jinyou, to the extent as permitted by the then-effective PRC laws and regulations.
F-31
GIGAMEDIA LIMITED
NOTES TO THE CONSOLIDATED FINANCIAL STATEMENTS — (Continued)
YEARS ENDED DECEMBER 31, 2006, 2007 AND 2008
Exclusive Technical Service and Consultancy Agreement.T2CN Technology and T2 Entertainment, T2 Advertisement and Jinyou entered into certain exclusive technical service and consultancy agreements whereby T2CN Technology provides T2 Entertainment, T2 Advertisement and Jinyou with technical consulting and related services and information services. T2CN Technology is the exclusive provider of these services. The initial term of these agreements is seventeen to eighteen years. In consideration for those services, T2 Entertainment, T2 Advertisement and Jinyou agreed to pay service fees to T2CN Technology. The service fees are eliminated upon consolidation.
Equity Pledge Agreements.To secure the full performance of their respective obligations under a related exclusive technical service and consultancy agreement and shareholder voting rights proxy agreements, the shareholders of T2 Entertainment, T2 Advertisement and Jinyou have pledged all of their equity interests in T2 Entertainment, T2 Advertisement and Jinyou to T2CN Technology under equity pledge agreements.
As of and for the years ended December 31, 2007 and 2008, the net assets, total assets, total liabilities, total revenue and net income in the aggregate of T2 Entertainment, T2 Advertisement and Jinyou were as follows:
| | | | | | | | | |
| (in US$ thousands) | | 2007 | | | 2008 | |
| Net assets | | $ | 178 | | | $ | 3,258 | |
| | | | | | | |
| Total assets | | $ | 11,666 | | | $ | 17,524 | |
| | | | | | | |
| Total liabilities | | $ | 11,488 | | | $ | 14,265 | |
| | | | | | | |
| Total revenues | | $ | 14,973 | | | $ | 20,312 | |
| | | | | | | |
| Net income | | $ | 2,429 | | | $ | 1,571 | |
| | | | | | | |
F-32
GIGAMEDIA LIMITED
NOTES TO THE CONSOLIDATED FINANCIAL STATEMENTS — (Continued)
YEARS ENDED DECEMBER 31, 2006, 2007 AND 2008
NOTE 4.DIVESTITURES
Divestiture — ADSL Business
In May 2006, we sold our ADSL Internet access and service business to Webs-TV Digital International Corporation (“Webs-TV”). The total transaction price of approximately $18.1 million consisted of a cash consideration of approximately $8.9 million related to the sale of the ADSL business, and cash consideration of approximately $9.2 million related to the provision of certain agreed upon services, including bandwidth, billing, and consulting services, and the right to use GigaMedia’s ADSL brand for a period of five years. (See Note 25, “Commitments and Contingencies”, for additional information). Cash proceeds in 2006 and 2007 from the sale of the ADSL business, net of transaction costs and VAT, were approximately $3.3 million and $4.9 million, respectively. The pre-tax one-time gain from the sale of the ADSL business was approximately $7.7 million. Before we sold the remaining portion of the Internet access and service business in September 2008, we reported the ADSL business in continuing operations since the operations and cash flows of our ADSL business could not be clearly distinguished operationally and for financial reporting purposes from the rest of our Internet access and service business. As we have completed the sale of the Internet access and service business, see below, we are now reporting the ADSL business in discontinued operations.
Divestiture — Internet access and service business
In September 2008, we sold the remaining portion of our Internet access and service business. We sold 100 percent of our wholly-owned subsidiaries, Koos Broadband Telecom Co., Ltd. (“KBT”) and Hoshin Multimedia Center Inc., and disposed of certain assets and liabilities related to our Internet access and service business for a total transaction price of $20.0 million.
The total transaction price was subject to adjustments following completion of a post-transaction audit. In March 2009, a transaction price adjustment was finalized and recorded as of December 31, 2008 based on the results of the post-transaction audit. The transaction price, net of transaction costs, price adjustment and cash transferred, was approximately $16.5 million. The after-tax gain from the sale of the Internet access and service business was approximately $9.8 million.
An amount of $2.5 million of the transaction price was deposited into an escrow account established with the escrow agent for an agreed period, to be available for any price adjustment payment, severance payment, and indemnification payment set forth in the agreements. As of December 31, 2008, the escrow account balance was approximately $2.1 million after payment of the severance payment. (See Note 13, “Restricted Cash”, for more information). As of March 2009, the escrow amount was reduced to approximately $1.0 million in accordance with the final results of the post-transaction audit.
F-33
GIGAMEDIA LIMITED
NOTES TO THE CONSOLIDATED FINANCIAL STATEMENTS — (Continued)
YEARS ENDED DECEMBER 31, 2006, 2007 AND 2008
In addition to the above purchase price, we may be entitled to receive additional cash payments of $3.0 million and $2.0 million if the Internet access and service business that we sold achieves certain earn-out targets by September 2009 and 2010. The earn-out targets will be determined by future gross profits in accordance with a formula and timeline set forth in the agreements.
Results for the Internet access and service operations are reported as discontinued operations in 2006, 2007 and 2008. In 2008, income from discontinued operations was $9.4 million, which included an after-tax loss from the Internet access and service business of $0.4 million and an after-tax gain on the sale of the business of $9.8 million. (See Note 1, “Business Overview, Basis of Presentation, and Summary of Significant Accounting Policies” — (b) “Basis of Presentation”, for additional information).
Summarized selected financial information for discontinued operations is as follows:
| | | | | | | | | | | | | |
| (in US$ thousands) | | 2006 | | | 2007 | | | 2008 | |
| Revenue | | $ | 20,581 | | | $ | 15,164 | | | $ | 9,289 | |
| | | | | | | | | | |
| | | | | | | | | | | | | |
| Income (loss) from discontinued operations before tax | | $ | 6,290 | | | $ | 1,090 | | | $ | (593 | ) |
| Gain on sale of the discontinued operations before tax | | | 7,668 | | | | — | | | | 11,014 | |
| |
| Income tax expenses | | | (1,026 | ) | | | (2 | ) | | | (986 | ) |
| | | | | | | | | | |
| Income (loss) from discontinued operations | | $ | 12,932 | | | $ | 1,088 | | | $ | 9,435 | |
| | | | | | | | | | |
F-34
GIGAMEDIA LIMITED
NOTES TO THE CONSOLIDATED FINANCIAL STATEMENTS — (Continued)
YEARS ENDED DECEMBER 31, 2006, 2007 AND 2008
Major classes of assets and liabilities which comprised the Internet access and service business at the date of disposal, September 2008, included the following:
| | | | | |
| (in US$ thousands) | | | | |
| Cash | | $ | 493 | |
| Accounts receivable | | | 2,325 | |
| Other current assets | | | 1,125 | |
| Property and equipment | | | 4,328 | |
| Other assets | | | 165 | |
| | | | |
| Total assets | | $ | 8,436 | |
| | | | |
| Accounts payable | | $ | 1,056 | |
| Other current liabilities | | | 759 | |
| Noncurrent liabilities | | | 672 | |
| | | | |
| Total liabilities | | $ | 2,487 | |
| | | | |
NOTE 5.ACQUISITIONS
Acquisition — T2CN
Beginning in June 2007, we consolidated T2CN. T2CN is a leading operator and provider of online sport games in the PRC. We acquired T2CN in order to enhance our position in the online game market in Asia. This primary factor among others, contributed to a purchase price in excess of the fair market value of the net tangible assets and intangible assets acquired.
As of December 31, 2007 and 2008, we owned 38,613,681 and 43,113,681 common shares of T2CN, which represents a controlling interest of 58.11 percent and 66.29 percent, respectively, of the total outstanding voting rights of T2CN. The following summarizes our acquisitions of T2CN during the period from 2006 to 2008.
2006
In April 2006, our Company entered into a strategic investment agreement with T2CN, pursuant to which we made an investment of $15.0 million to acquire 7,500,000 voting preferred shares convertible into 7,500,000 common shares, or an approximately 19.02 percent interest in T2CN.
F-35
GIGAMEDIA LIMITED
NOTES TO THE CONSOLIDATED FINANCIAL STATEMENTS — (Continued)
YEARS ENDED DECEMBER 31, 2006, 2007 AND 2008
2007
In February 2007, we made an additional investment of $19.3 million to acquire 18,118,926 common shares of T2CN, representing a 39.87 percent holding in T2CN’s common shares. The investment in T2CN was accounted for under the equity method. The first payment was paid on February 12, 2007, which consisted of approximately $9.4 million, including related costs, in cash and 173,814 shares of common stock of GigaMedia, valued at approximately $2.1 million. The value of the 173,814 common shares issued was determined based on the market price of GigaMedia’s common shares at the time the terms of acquisition were agreed to and the number of shares became fixed. The remaining purchase price of $7.8 million was paid in cash on August 15, 2007.
In May 2007, we acquired 7,500,000 additional convertible preferred shares of T2CN for all-cash consideration of $75 thousand, pursuant to our exercise of the rights stated in a shareholder agreement which we entered into with T2CN and certain of its shareholders in April 2006 and was amended and restated in November 2006. We were granted rights to subscribe for additional convertible preferred shares of T2CN, based on the financial performance of T2CN during each of the twelve-month periods ending March 31, 2007 and December 31, 2007.
In June 2007, we entered into a voting trust agreement with a shareholder of T2CN, pursuant to which we obtained an additional 1.28 percent of the outstanding voting rights of T2CN. This voting trust agreement expired August 31, 2007.
In July 2007, we converted our 15,000,000 convertible voting preferred shares of T2CN into 15,000,000 of its common shares. We also acquired 5,494,755 common shares of T2CN for approximately $3.7 million in cash and 52,571 shares of common stock of GigaMedia, valued at approximately $656 thousand. The value of the 52,571 common shares issued was determined based on the market price of GigaMedia’s common shares at the time the terms of acquisition were agreed to and the number of shares became fixed.
F-36
GIGAMEDIA LIMITED
NOTES TO THE CONSOLIDATED FINANCIAL STATEMENTS — (Continued)
YEARS ENDED DECEMBER 31, 2006, 2007 AND 2008
In connection with the acquisitions, we recorded goodwill of $29.4 million. Such goodwill amount is non-deductible for tax purposes. Since June 1, 2007, results of T2CN’s operations have been included in our Consolidated Financial Statements under the online game and service business. The identified intangible assets are being amortized on a straight-line basis over their useful lives of 3.5 years.
The purchase price of T2CN shares was determined based on management’s estimate of the fair value of T2CN in connection with the acquisitions. The purchase price allocation of the acquisition is as follows:
| | | | | | | | | |
| | | Amortization life | | | | |
| (in US$ thousands) | | (in years) | | | Amount | |
| Cash acquired | | | | | | $ | 11,773 | |
| Marketable securities / Investments | | | | | | | 3,724 | |
| Other current assets | | | | | | | 5,892 | |
| Fixed assets / non-current assets | | | | | | | 3,717 | |
| Intangible assets | | | | | | | | |
| Capitalized software cost | | | 3.5~5 | | | | 2,974 | |
| Goodwill | | | N/A | | | | 29,354 | |
| | | | | | | | |
| Total assets acquired | | | | | | | 57,434 | |
| | | | | | | | |
| | | | | | | | | |
| Current liabilities | | | | | | | 11,500 | |
| Noncurrent liabilities | | | | | | | 1,050 | |
| Minority interest | | | | | | | 6,171 | |
| | | | | | | | |
| Total liabilities assumed | | | | | | | 18,721 | |
| | | | | | | | |
| Total purchase price | | | | | | $ | 38,713 | |
| | | | | | | | |
The following unaudited pro-forma information presents a summary of the results of operations of our Company for the years ended December 31, 2006 and 2007 as if we controlled 58.11 percent of the total outstanding voting rights of T2CN and consolidated T2CN as of the beginning of the periods presented.
F-37
GIGAMEDIA LIMITED
NOTES TO THE CONSOLIDATED FINANCIAL STATEMENTS — (Continued)
YEARS ENDED DECEMBER 31, 2006, 2007 AND 2008
| | | | | | | | | |
| (in US$ thousands, | | Year ended December 31 | |
| except per share figures) | | 2006 | | | 2007 | |
| | | Unaudited | | | Unaudited | |
| Net revenue | | $ | 105,629 | | | $ | 172,473 | |
| Income from operations | | | 4,186 | | | | 38,617 | |
| Net income | | | 21,009 | | | | 38,980 | |
| Basic earnings per share | | | 0.41 | | | | 0.74 | |
| Diluted earnings per share | | | 0.35 | | | | 0.65 | |
The unaudited pro forma supplemental information is based on estimates and assumptions, which we believe are reasonable; it is not necessarily indicative of the consolidated financial position or results of operations in future periods or the results that actually would have been realized had we been a combined company during 2006 and 2007. The above unaudited pro-forma financial information includes adjustments for the amortization of identified intangible assets.
2008
In May 2008, we acquired 4,500,000 additional common shares of T2CN for all-cash consideration of $3.4 million.
In connection with the purchase of additional common shares of T2CN, we recorded additional goodwill of $1.7 million. Such goodwill amount is non-deductible for tax purposes. We also recorded additional identified intangible assets of $136 thousand which are being amortized on a straight-line basis over their useful lives of three years.
In addition, T2CN bought back and cancelled part of its common shares owned by independent third parties for $1.3 million during 2008, resulting in an increase of our ownership interest in T2CN, and we recorded additional goodwill of $511 thousand.
These additional acquisitions of T2CN were not material to our Consolidated Financial Statements as a whole.
F-38
GIGAMEDIA LIMITED
NOTES TO THE CONSOLIDATED FINANCIAL STATEMENTS — (Continued)
YEARS ENDED DECEMBER 31, 2006, 2007 AND 2008
Acquisition — FunTown
On January 2, 2006, GigaMedia acquired from TWP Corporation certain assets and liabilities of FunTown, which are included in our online game and service business. FunTown is one of the leading online game operators in Asia. We acquired FunTown in order to establish our position in the online game market. This primary factor among others, contributed to a purchase price in excess of the fair market value of the net tangible assets and intangible assets acquired. The total purchase price of approximately $43.0 million, excluding incentive payments, consisted of a cash payment of approximately $27.2 million and convertible notes in the aggregate principal amount of $15.0 million with a yield to maturity of 0 percent per annum excluding any contingent interest, representing a valuation premium of approximately $756 thousand. Direct transaction costs amounting to approximately $110 thousand were included as part of the acquisition cost. The convertible notes were issued on January 1, 2006 by our Company to TWP Corporation, in the aggregate principal amount of approximately NT$494 million ($15.0 million) with 50 percent maturing on January 1, 2008 and 50 percent maturing on January 1, 2009 and were convertible into 4,794,323 shares of our common stock at $3.1287 per share. (The conversion price was subject to adjustment for stock dividends, stock splits, reverse stock splits, recapitalizations, mergers, and other dilutions). On January 1, 2006, we pledged our share holdings in Hoshin GigaMedia Center Inc. (“Hoshin GigaMedia”), one of our subsidiaries, as collateral for the convertible notes. These convertible notes were fully redeemed in July and September, 2006. (See Note 18, “Convertible Notes”, for more information).
In 2007, we made an additional incentive payment of approximately $4.8 million, net of VAT, which amount was determined based on the adjusted pre-tax income of FunTown in 2006 as compared to 2005.
F-39
GIGAMEDIA LIMITED
NOTES TO THE CONSOLIDATED FINANCIAL STATEMENTS — (Continued)
YEARS ENDED DECEMBER 31, 2006, 2007 AND 2008
In connection with the acquisition, including the incentive payment, we recorded goodwill of $26.2 million, which was assigned to our online game and service business. Such goodwill amount is deductible for tax purposes. Since the closing of the acquisition on January 2, 2006, results of FunTown’s operations have been included in our Consolidated Financial Statements under the online game and service business. The identified intangible assets (other than the trade name and trademark) are being amortized on a straight-line basis over their useful lives ranging from five to nine years, and the overall weighted-average life is 7.47 years.
The purchase price allocation of the acquisition, including the additional incentive payment paid in 2007, is as follows:
| | | | | | | | | | | | | | | | | |
| | | Amortization life | | | Original | | | Price | | | Total | |
| (in US$ thousands) | | (in years) | | | amount | | | adjustment | | | allocation | |
| Cash acquired | | | | | | $ | 463 | | | $ | — | | | $ | 463 | |
| Accounts receivable | | | | | | | 3,626 | | | | — | | | | 3,626 | |
| Other current assets | | | | | | | 106 | | | | — | | | | 106 | |
| Fixed assets / non-current assets | | | | | | | 628 | | | | — | | | | 628 | |
| Intangible assets | | | | | | | | | | | | | | | | |
| Trade name and trademark | | | N/A | | | | 10,795 | | | | — | | | | 10,795 | |
| Customer relationships | | | 9 | | | | 5,546 | | | | — | | | | 5,546 | |
| Completed technology | | | 7 | | | | 2,301 | | | | — | | | | 2,301 | |
| Self-developed software | | | 5 | | | | 1,534 | | | | — | | | | 1,534 | |
| Other | | | 5 | | | | 73 | | | | — | | | | 73 | |
| Goodwill | | | N/A | | | | 21,409 | | | | 4,762 | | | | 26,171 | |
| | | | | | | | | | | | | | |
| Total assets acquired | | | | | | | 46,481 | | | | 4,762 | | | | 51,243 | |
| | | | | | | | | | | | | | |
| Current liabilities | | | | | | | (3,501 | ) | | | — | | | | (3,501 | ) |
| Noncurrent liabilities | | | | | | | (1 | ) | | | — | | | | (1 | ) |
| | | | | | | | | | | | | | |
| Total liabilities assumed | | | | | | | (3,502 | ) | | | — | | | | (3,502 | ) |
| | | | | | | | | | | | | | |
| |
| Total purchase price | | | | | | $ | 42,979 | | | $ | 4,762 | | | $ | 47,741 | |
| | | | | | | | | | | | | | |
F-40
GIGAMEDIA LIMITED
NOTES TO THE CONSOLIDATED FINANCIAL STATEMENTS — (Continued)
YEARS ENDED DECEMBER 31, 2006, 2007 AND 2008
NOTE 6.GOODWILL
| | | | | | | | | | | | | |
| | | Gaming software | | | Online game | | | | |
| (in US$ thousands) | | and service | | | and service | | | Total | |
| Balance as of December 31, 2006 | | | 29,243 | | | | 26,574 | | | $ | 55,817 | |
| Acquisition-T2CN | | | — | | | | 29,354 | | | | 29,354 | |
| Post-acquisition adjustment | | | — | | | | (238 | ) | | | (238 | ) |
| Translation adjustment | | | — | | | | 216 | | | | 216 | |
| | | | | | | | | | |
| Balance as of December 31, 2007 | | | 29,243 | | | | 55,906 | | | | 85,149 | |
| Acquisition-T2CN | | | — | | | | 1,738 | | | | 1,738 | |
| Other adjustment | | | — | | | | 511 | | | | 511 | |
| Translation adjustment | | | — | | | | (300 | ) | | | (300 | ) |
| | | | | | | | | | |
| |
| Balance as of December 31, 2008 | | $ | 29,243 | | | $ | 57,855 | | | $ | 87,098 | |
| | | | | | | | | | |
No impairment of goodwill has been identified during 2006, 2007, and 2008.
In 2007, we reduced goodwill by $238 thousand as a result of an adjustment of VAT.
NOTE 7.INTANGIBLE ASSETS — NET
The following table summarizes our Company’s intangible assets, by major asset class:
| | | | | | | | | | | | | |
| | | December 31, 2007 | |
| | | Gross carrying | | | Accumulated | | | | |
| (in US$ thousands) | | amount | | | amortization | | | Net | |
| Completed technology | | $ | 3,631 | | | $ | (1,966 | ) | | $ | 1,665 | |
| Trade name, trademark and non-competition agreement | | | 11,898 | | | | (423 | ) | | | 11,475 | |
| Capitalized software cost | | | 12,222 | | | | (3,711 | ) | | | 8,511 | |
| Customer relationships | | | 5,618 | | | | (1,249 | ) | | | 4,369 | |
| Other | | | 66 | | | | (26 | ) | | | 40 | |
| | | | | | | | | | |
| |
| Total | | $ | 33,435 | | | $ | (7,375 | ) | | $ | 26,060 | |
| | | | | | | | | | |
F-41
GIGAMEDIA LIMITED
NOTES TO THE CONSOLIDATED FINANCIAL STATEMENTS — (Continued)
YEARS ENDED DECEMBER 31, 2006, 2007 AND 2008
| | | | | | | | | | | | | |
| | | December 31, 2008 | |
| | | Gross carrying | | | Accumulated | | | | |
| (in US$ thousands) | | amount | | | amortization | | | Net | |
| Completed technology | | $ | 3,605 | | | $ | (2,288 | ) | | $ | 1,317 | |
| Trade name, trademark and non-competition agreement | | | 11,774 | | | | (539 | ) | | | 11,235 | |
| Capitalized software cost | | | 19,077 | | | | (6,435 | ) | | | 12,642 | |
| Customer relationships | | | 5,555 | | | | (1,852 | ) | | | 3,703 | |
| Other | | | 66 | | | | (33 | ) | | | 33 | |
| | | | | | | | | | |
| |
| Total | | $ | 40,077 | | | $ | (11,147 | ) | | $ | 28,930 | |
| | | | | | | | | | |
Intangible assets include trade name assets of approximately $10.8 million which are not amortized. The remaining intangible assets are amortized over their estimated useful lives ranging from three to ten years, and the overall weighted-average life is 4.3 years.
For the years ended December 31, 2006, 2007 and 2008, total amortization expenses of intangible assets were $2.7 million, $3.0 million, and $4.1 million, respectively (including $0, $5 thousand and $20 thousand reported in discontinued operations in 2006, 2007 and 2008, respectively), which included amortization of capitalized software costs of $1.2 million, $1.9 million, and $3.0 million. As of December 31, 2008, based on the current amount of intangibles subject to amortization, the estimated amortization expense for each of the succeeding five years is as follows:
| | | | | |
| | | Amount | |
| | | (in US$ thousands) | |
| 2009 | | $ | 5,147 | |
| 2010 | | | 5,307 | |
| 2011 | | | 4,203 | |
| 2012 | | | 1,667 | |
| 2013 | | | 700 | |
| | | | |
| | | | | |
| | | $ | 17,024 | |
| | | | |
F-42
GIGAMEDIA LIMITED
NOTES TO THE CONSOLIDATED FINANCIAL STATEMENTS — (Continued)
YEARS ENDED DECEMBER 31, 2006, 2007 AND 2008
NOTE 8.FAIR VALUE MEASUREMENTS
Effective January 1, 2008, we adopted FAS 157, which defines fair value as the exchange price that would be received to sell an asset or paid to transfer a liability (an exit price) in the principal or most advantageous market for the asset or liability in an orderly transaction between market participants at the measurement date. FAS 157 establishes a three-level fair value hierarchy that prioritizes the inputs used to measure fair value. Observable inputs obtained from sources independent of the reporting entity are classified within Level 1 and 2 of the hierarchy, and unobservable inputs based on our Company’s own assumptions are classified within Level 3 of the hierarchy.
Our Company measures fair value as an exit price using the procedures described below for all assets and liabilities measured at fair value. When available, our Company uses unadjusted quoted market prices in active markets to measure fair value and classifies such items within Level 1. If quoted market prices in active markets are not available, fair value is based upon internally developed models that use, where possible, current market-based or independently-sourced market parameters such as interest rates and currency rates. Items valued using internally generated models are classified according to the lowest level input or value driver that is significant to the valuation. Thus, an item may be classified in Level 3 even though there may be certain inputs that are readily observable. If quoted market prices are not available, the valuation model used generally depends on the specific asset or liability being valued. The determination of fair value considers various factors including interest rate yield curves and time value underlying the financial instruments.
Our Company has segregated all financial assets and liabilities that are measured at fair value on a recurring basis (at least annually) into the most appropriate level within the fair value hierarchy based on the inputs used to determine the fair value at the measurement date in the table below. FSP 157-2 delayed the effective date for all nonfinancial assets and liabilities until January 1, 2009, except those that are recognized or disclosed at fair value in the Consolidated Financial Statements on a recurring basis.
F-43
GIGAMEDIA LIMITED
NOTES TO THE CONSOLIDATED FINANCIAL STATEMENTS — (Continued)
YEARS ENDED DECEMBER 31, 2006, 2007 AND 2008
Assets and liabilities measured at fair value on a recurring basis are summarized as below:
| | | | | | | | | | | | | | | | | |
| | | December 31, 2008 | |
| | | | | | | | | | | | | | | Fair Value | |
| (in US$ thousands) | | Level 1 | | | Level 2 | | | Level 3 | | | Measurements | |
| Assets | | | | | | | | | | | | | | | | |
| Cash equivalents — time deposits | | $ | — | | | $ | 12,512 | | | $ | — | | | $ | 12,512 | |
| Marketable securities — current | | | — | | | | 3,419 | | | | — | | | | 3,419 | |
| Marketable securities — noncurrent | | | — | | | | — | | | | 26,041 | | | | 26,041 | |
| | | | | | | | | | | | | |
| Total | | $ | — | | | $ | 15,931 | | | $ | 26,041 | | | $ | 41,972 | |
| | | | | | | | | | | | | |
Cash equivalents — time deposits were convertible into a know amount of cash and is subject to an insignificant risk of change in value. Marketable securities — current were valued using a market approach based on the quoted market prices of identical instruments when available or other observable inputs such as trading prices of identical instruments in inactive markets. The fair value of the marketable securities — noncurrent was derived using a discounted cash flow method, which incorporates available market discount rate information and the Company’s estimates of non-performance and liquidity risk. Once calculated, the fair value was then allocated to the class of shares we purchased by using the Option-Pricing Method. The major assumptions used in the Option-Pricing Model included volatility which was calculated based on reference to the industry average, and expected life which was determined based on the expected timing of triggering events.
F-44
GIGAMEDIA LIMITED
NOTES TO THE CONSOLIDATED FINANCIAL STATEMENTS — (Continued)
YEARS ENDED DECEMBER 31, 2006, 2007 AND 2008
For assets and liabilities measured at fair value on a recurring basis using significant unobservable inputs (Level 3) during 2008, a reconciliation of the beginning and ending balances are presented as follows:
| | | | | |
| | | Fair Value
Measurements | |
| | | Using Significant | |
| | | Unobservable Inputs | |
| | | (Level 3) | |
| | | Marketable Securities - | |
| (in US$ thousands) | | Noncurrent | |
| Beginning Balance | | $ | 21,018 | |
Total gains or losses (realized/unrealized)
Included in earnings | | | — | |
| Included in other comprehensive income | | | — | |
| Purchases and settlements | | | 5,023 | |
| Transfers in and/or out of Level 3 | | | — | |
| | | | |
| Ending Balance | | $ | 26,041 | |
| | | | |
| | | | | |
| The amount of total gains or losses for the period included in earnings attributable to the change in unrealized gains or losses relating to assets still held at the reporting date. | | None | |
| | | | |
There were no gains or losses (realized and unrealized) included in earnings for 2008.
Investments other than marketable securities are valued on a nonrecurring basis when deemed necessary, using other observable inputs such as trading price of different class of the share or using discounted cash flows, incorporating available market discount rate information and the Company’s estimates for non-performance and liquidity risk. There were no investments other than marketable securities measured at fair value on a nonrecurring basis during 2008.
The carrying amounts of the Company’s cash, accounts receivable, accounts payable, and short-term debt approximate fair value due to their short-term maturities.
F-45
GIGAMEDIA LIMITED
NOTES TO THE CONSOLIDATED FINANCIAL STATEMENTS — (Continued)
YEARS ENDED DECEMBER 31, 2006, 2007 AND 2008
NOTE 9.CASH AND CASH EQUIVALENTS
| | | | | | | | | |
| | | December 31, | |
| (in US$ thousands) | | 2007 | | | 2008 | |
| | | | | | | | | |
| Checking and savings accounts | | $ | 60,809 | | | $ | 83,441 | |
| Time deposits | | | 7,754 | | | | 12,512 | |
| | | | | | | |
| |
| Total | | $ | 68,563 | | | $ | 95,953 | |
| | | | | | | |
NOTE 10.MARKETABLE SECURITIES — CURRENT
| | | | | | | | | |
| | | December 31, | |
| (in US$ thousands) | | 2007 | | | 2008 | |
| | | | | | | | | |
| Available-for-sale securities | | | | | | | | |
| Open-end funds | | $ | 11,354 | | | $ | 3,419 | |
| | | | | | | |
All of our Company’s marketable securities — current are classified as available-for-sale. As of December 31, 2007 and 2008, the balances of unrealized gains for marketable securities — current were $669 thousand and $387 thousand, respectively. During 2006, 2007 and 2008, realized gains from disposal of marketable securities — current amounted to $2.2 million, $205 thousand, and $400 thousand, respectively, (including $2.1 million, $21 thousand, $27 thousand reported in discontinued operations in 2006, 2007 and 2008, respectively). The costs for calculating gains on disposal were based on each security’s average cost.
On December 21, 2005, our Company entered into a put-call option agreement with an independent third party JSDWAY Digital Technology Co., Ltd., (“JSDWAY”) regarding the purchase and sale of shares of Gamania Digital Entertainment Co., Ltd. (“Gamania”) owned by us. From the period December 21, 2005 to December 21, 2006, we granted JSDWAY an option to buy, at NT$18.70 per share, a total of 4,905,000 common shares of Gamania owned by our Company, and JSDWAY granted us an option to sell to JSDWAY, at NT$18.70 per share, the Gamania shares owned by our Company. JSDWAY also provided a time deposit to our Company to guarantee fulfillment of its payment obligations under the aforementioned agreement. Due to this arrangement with JSDWAY, the Gamania securities had been classified as marketable securities — current and marked to market at NT$18.70 per share.
F-46
GIGAMEDIA LIMITED
NOTES TO THE CONSOLIDATED FINANCIAL STATEMENTS — (Continued)
YEARS ENDED DECEMBER 31, 2006, 2007 AND 2008
On December 4, 2006, our Company entered into a termination agreement with JSDWAY to terminate the put-call option agreement regarding the purchase and sale of shares of Gamania. We then sold all of our Gamania shares in the public market in December 2006, which resulted in a gain of $2.1 million, which is reported in discontinued operations. (See Note 24, “Related Party Transactions”, for additional information).
NOTE 11.ACCOUNTS RECEIVABLE — NET
| | | | | | | | | |
| | | December 31, | |
| (in US$ thousands) | | 2007 | | | 2008 | |
| | | | | | | | | |
| Accounts receivable | | $ | 19,653 | | | $ | 15,442 | |
| Less: Allowance for doubtful accounts | | | (1,362 | ) | | | (254 | ) |
| | | | | | | |
| |
| Net | | $ | 18,291 | | | $ | 15,188 | |
| | | | | | | |
| | | | | | | | | | | | | |
| | | For the years ended December 31, | |
| (in US$ thousands) | | 2006 | | | 2007 | | | 2008 | |
| Allowance for doubtful accounts | | | | | | | | | | | | |
| Balance at beginning of year | | $ | 1,684 | | | $ | 1,895 | | | $ | 1,362 | |
| Business acquisition | | | 163 | | | | — | | | | — | |
| Additions: Provision for bad debt expenses | | | 715 | | | | 743 | | | | 313 | |
| Less: Write-offs | | | (681 | ) | | | (1,279 | ) | | | (399 | ) |
| Divestiture — Internet access and service business | | | — | | | | — | | | | (1,041 | ) |
| Translation adjustment | | | 14 | | | | 3 | | | | 19 | |
| | | | | | | | | | |
| |
| Balance at end of year | | $ | 1,895 | | | $ | 1,362 | | | $ | 254 | |
| | | | | | | | | | |
F-47
GIGAMEDIA LIMITED
NOTES TO THE CONSOLIDATED FINANCIAL STATEMENTS — (Continued)
YEARS ENDED DECEMBER 31, 2006, 2007 AND 2008
NOTE 12.MARKETABLE SECURITIES — NONCURRENT
| | | | | | | | | |
| | | December 31, | |
| (in US$ thousands) | | 2007 | | | 2008 | |
| | | | | | | | | |
| Available-for-sale securities | | | | | | | | |
| Debt securites | | $ | 21,018 | | | $ | 26,041 | |
| | | | | | | |
All of our Company’s marketable securities — noncurrent are invested in convertible preferred shares and classified as available-for-sale under FAS 115. The convertible preferred shares are carried at estimated fair values, with no unrealized gain or loss as of December 31, 2007 and 2008.
The preferred shares are convertible into common shares on 1:1 basis, subject to certain adjustments, and shall be automatically converted upon certain conditions outlined in the agreements. The convertible preferred shares are all redeemable at certain agreed-upon conditions.
The embedded conversion options of the convertible preferred shares do not meet the definition of derivative instruments under FAS 133, “Accounting for Derivatives Instruments and Hedging Activities”, (“FAS 133”) and are not bifurcated from the preferred share investment.
We have referred to the guidance provided in EITF 02-14, “Whether an Investor Should Apply the Equity Method of Accounting to Investment Other Than Common Stock”, (“EITF 02-14”), to determine whether our investments in preferred shares are in-substance common shares which should be accounted for under the equity method. Given that our convertible preferred shares have substantive redemption rights and thus do not meet the criteria of in-substance common shares, we have accounted for them as debt securities under FAS 115. We assessed the estimated fair values and potential impairment of our investments and concluded that the estimated fair values are approximately represented by their carrying costs.
F-48
GIGAMEDIA LIMITED
NOTES TO THE CONSOLIDATED FINANCIAL STATEMENTS — (Continued)
YEARS ENDED DECEMBER 31, 2006, 2007 AND 2008
NOTE 13.RESTRICTED CASH
Restricted cash recorded in current assets as of December 31, 2007 and 2008 consisted of the following:
| | | | | | | | | |
| | | December 31, | |
| (in US$ thousands) | | 2007 | | | 2008 | |
| | | | | | | | | |
| Current assets: | | | | | | | | |
| Time deposit pledged to banks as guarantees for bank loans | | $ | 6,247 | | | $ | — | |
| Other assets: | | | | | | | | |
| Time deposit pledged to a Bank as escrow amount for divestiture of Internet access and service business (See Note 4, “Divestitures”, for additional information) | | | — | | | | 2,125 | |
| | | | | | | |
| Total | | $ | 6,247 | | | $ | 2,125 | |
| | | | | | | |
NOTE 14.OTHER CURRENT ASSETS
Other current assets include a loan receivable of approximately $2.5 million from Flagship Studios, Inc. (“Flagship”). In December 2007, our Company entered into a loan agreement with Flagship, receiving a note with an interest rate of 10 percent per annum from Flagship. For 2007 and 2008, we have accrued, based on the stated interest rate, interest income of $14 thousand and $126 thousand, respectively. The outstanding principal balance of this note, together with all accrued and unpaid interest thereon, was due on or before December 31, 2008, and is currently past due. Due to the financial status of Flagship, we do not expect to collect all principal and interest. Therefore, we have recognized a full provision for the loan and interest receivable, in the aggregate of $2.6 million in 2008, and discontinued to recognize interest income.
NOTE 15.SHORT-TERM BORROWINGS
As of December 31, 2007 and 2008, short-term borrowings totaled $33.3 million and $15.2 million, respectively. These amounts were borrowed from certain financial institutions. The annual interest rates on these borrowings ranged from 1.865 percent to 4.238 percent for 2007, and from 2.5 percent to 5.038 percent for 2008, respectively. The maturity dates ranged from February 2008 to October 2008 as of December 31, 2007, and from March 2009 to September 2009 as of December 31, 2008, respectively. As of December 31, 2007 and 2008, the weighted-average interest rate on total short-term borrowings was 3.35 percent and 3.20 percent, respectively.
F-49
GIGAMEDIA LIMITED
NOTES TO THE CONSOLIDATED FINANCIAL STATEMENTS — (Continued)
YEARS ENDED DECEMBER 31, 2006, 2007 AND 2008
As of December 31, 2008, the unused lines of credit under short-term borrowing agreements were approximately $4.6 million.
In March 2009, we renewed short-term borrowing agreements totaling $4.6 million due in March 2009 through April 2010.
We pledged certain time deposits (See Note 13, “Restricted Cash”, for more information), land, and buildings as collateral for borrowings from certain banks. The total value of collateral amounted to $7.9 million and $1.6 million as of December 31, 2007 and 2008, respectively.
NOTE 16.ACCRUED EXPENSES
| | | | | | | | | |
| | | December 31, | |
| (in US$ thousands) | | 2007 | | | 2008 | |
| | | | | | | | | |
| Accrued advertising expenses | | $ | 3,402 | | | $ | 5,013 | |
| Accrued professional fees | | | 1,832 | | | | 2,627 | |
| Other | | | 3,917 | | | | 3,705 | |
| | | | | | | |
| |
| Total | | $ | 9,151 | | | $ | 11,345 | |
| | | | | | | |
F-50
GIGAMEDIA LIMITED
NOTES TO THE CONSOLIDATED FINANCIAL STATEMENTS — (Continued)
YEARS ENDED DECEMBER 31, 2006, 2007 AND 2008
NOTE 17.OTHER CURRENT LIABILITIES
| | | | | | | | | |
| | | December 31, | |
| (in US$ thousands) | | 2007 | | | 2008 | |
| | | | | | | | | |
| Deferred revenue | | $ | 7,647 | | | $ | 7,738 | |
| Accrual for investing in marketable securities | | | 2,204 | | | | — | |
| Income taxes | | | 1,041 | | | | 1,431 | |
| Other | | | 3,760 | | | | 3,217 | |
| | | | | | | |
| |
| Total | | $ | 14,652 | | | $ | 12,386 | |
| | | | | | | |
NOTE 18.CONVERTIBLE NOTES
On January 1, 2006, we issued convertible notes, in relation to the acquisition of FunTown, to TWP Corporation in the aggregate principal amount of approximately NT$494 million (approximately $15.0 million) with 50 percent maturing on January 1, 2008 and 50 percent maturing on January 1, 2009. These notes were convertible into 4,794,323 shares of our common stock at $3.1287 per share. (The conversion price was subject to adjustment for stock dividends, stock splits, reserve stock splits, recapitalizations, mergers, and other dilutions). On January 1, 2006, we pledged our share holdings in Hoshin GigaMedia as collateral for the notes. Under the underlying agreement, GigaMedia had an option to redeem the convertible notes, in whole or in part, within the first 12 months after the issue date, together with the accrued interest at 5 percent per annum.
On July 6, 2006, our Company repurchased a portion of convertible notes from TWP Corporation with an aggregate face value of NT$380 million (approximately $11.5 million) and related accrued interest, resulting in a gain of approximately $487 thousand. On September 4, 2006, we repurchased the remainder of our convertible notes, with an aggregate face value of approximately NT$113.7 million (approximately $3.5 million) and related accrued interest, resulting in a gain of approximately $138 thousand. The gain realized from the retirement of these convertible notes was included in other non-operating income. The pledge of our shareholdings in Hoshin GigaMedia was released upon the repurchase.
F-51
GIGAMEDIA LIMITED
NOTES TO THE CONSOLIDATED FINANCIAL STATEMENTS — (Continued)
YEARS ENDED DECEMBER 31, 2006, 2007 AND 2008
NOTE 19.PENSION BENEFITS
Our Company and our subsidiaries have defined benefit and defined contribution pension plans that cover substantially all of our employees.
Defined Benefit Pension Plan
We have a defined benefit pension plan in accordance with the Labor Standards Law of the Republic of China (R.O.C.) for our employees located in Taiwan, covering substantially all full-time employees for services provided prior to July 1, 2005, and employees who have elected to remain in the defined benefit pension plan subsequent to the enactment of the Labor Pension Act on July 1, 2005. Under the defined benefit pension plan, employees are entitled to two base points for every year of service for the first 15 years and one base point for every additional year of service, up to a maximum of 45 base points. The pension payment to employees is computed based on base point and average salaries or wages for the six months prior to approved retirement.
F-52
GIGAMEDIA LIMITED
NOTES TO THE CONSOLIDATED FINANCIAL STATEMENTS — (Continued)
YEARS ENDED DECEMBER 31, 2006, 2007 AND 2008
We use a December 31 measurement date for our defined benefit pension plan. The following tables set forth the actuarial assumptions of our defined benefit pension plan:
| | | | | | | | | |
| (in US$ thousands) | | 2007 | | | 2008 | |
Change in benefit obligation | | | | | | | | |
| Benefit obligation at beginning of year | | $ | 541 | | | $ | 600 | |
| Service cost | | | 14 | | | | — | |
| Interest cost | | | 15 | | | | 11 | |
| Actuarial gain (loss) | | | 27 | | | | (37 | ) |
| Curtailment | | | — | | | | (87 | ) |
| Divestiture | | | — | | | | (208 | ) |
| Translation adjustment | | | 3 | | | | 6 | |
| | | | | | | |
| |
| Benefit obligation at end of year | | $ | 600 | | | $ | 285 | |
| | | | | | | |
| | | | | | | | | |
Change in plan assets | | | | | | | | |
| Fair value of plan assets at beginning of year | | $ | 135 | | | $ | 204 | |
| Actual return on plan assets | | | 3 | | | | 5 | |
| Employer contribution | | | 66 | | | | 37 | |
| Divestiture | | | — | | | | (67 | ) |
| Translation adjustment | | | — | | | | (2 | ) |
| | | | | | | |
| Fair value of plan assets at end of year | | $ | 204 | | | $ | 177 | |
| | | | | | | |
| | | | | | | | | |
Accumulated benefit obligation | | $ | (497 | ) | | $ | (229 | ) |
| | | | | | | |
| | | | | | | | | |
Funded status | | $ | (396 | ) | | $ | (108 | ) |
| | | | | | | |
Amounts recognized in our Consolidated Balance Sheets consisted of the following:
| | | | | | | | | |
| | | Pension Benefits | |
| (in US$ thousands) | | 2007 | | | 2008 | |
| | | | | | | | | |
Accrued benefit cost | | $ | (396 | ) | | $ | (108 | ) |
| | | | | | | |
| | | | | | | | | |
Accumulated other comprehensive income | | | | | | | | |
| Unrecognized transition obligation | | $ | 76 | | | $ | — | |
| Unrecognized net gain | | | (257 | ) | | | (276 | ) |
| | | | | | | |
| |
| Accumulated other comprehensive income | | $ | (181 | ) | | $ | (276 | ) |
| | | | | | | |
Included in accumulated other comprehensive income, is a net pension gain of $19 thousand as of December 31, 2008 which is expected to be recognized in 2009.
F-53
GIGAMEDIA LIMITED
NOTES TO THE CONSOLIDATED FINANCIAL STATEMENTS — (Continued)
YEARS ENDED DECEMBER 31, 2006, 2007 AND 2008
The net periodic benefit cost for the plans included the following components:
| | | | | | | | | | | | | |
| (in US$ thousands) | | 2006 | | | 2007 | | | 2008 | |
| | | | | | | | | | | | | |
| Service cost | | $ | 12 | | | $ | 14 | | | $ | — | |
| Interest cost | | | 16 | | | | 15 | | | | 11 | |
| Expected return on plan assets | | | (4 | ) | | | (5 | ) | | | (4 | ) |
| Amortization of transition obligation | | | 4 | | | | 4 | | | | — | |
| Amortization of net gain | | | (47 | ) | | | (29 | ) | | | (21 | ) |
| | | | | | | | | | |
| Net periodic benefit cost | | $ | (19 | ) | | $ | (1 | ) | | $ | (14 | ) |
| | | | | | | | | | |
| |
| Curtailment gain | | $ | (42 | ) | | $ | — | | | $ | (87 | ) |
| | | | | | | | | | |
Assumptions
Weighted-average assumptions used to determine benefit obligations and net periodic pension costs at December 31, 2006, 2007 and 2008 were as follows:
| | | | | | | | | | | | | |
| | | 2006 | | | 2007 | | | 2008 | |
| Discount rate | | | 2.75 | % | | | 2.75 | % | | | 2.50 | % |
| Rate of return on plan assets | | | 2.75 | % | | | 2.75 | % | | | 2.50 | % |
| Rate of compensation increase | | | 1.00 | % | | | 1.00 | % | | | 1.00 | % |
Discount rate. The discount rate assumptions used for defined benefit pension plan accounting reflect the rates of return on high-quality, fixed income investments currently available and expected to be available during the period to maturity of the pension benefits. In countries where there is no deep market in such bonds, the market yields (at the balance sheet date) on government bonds are used. For our defined benefit pension plan in Taiwan, markets for high-quality, long-term bonds are not generally as well developed, and the government owned Central Trust of China is the only funding vehicle for statutory pension scheme. Therefore, the yield of government issued bonds and the interest rate from the Central Trust of China are often used as the benchmark for developing the discount rate, with adjustment made to take into consideration the differences in maturities.
F-54
GIGAMEDIA LIMITED
NOTES TO THE CONSOLIDATED FINANCIAL STATEMENTS — (Continued)
YEARS ENDED DECEMBER 31, 2006, 2007 AND 2008
Rate of return on plan assets. The rate of return on plan assets is determined by using the interest rate from the Central Trust of China as a base. All of our pension assets are deposited and managed by the government owned Central Trust of China. Under R.O.C. regulations, government authorities collect the cash contribution from companies as a Labor Retirement Fund and determine asset allocations and investment policy. Participants are guaranteed to receive a minimum rate of return not lower than the interest rate of two-year term time deposits from the Central Trust of China.
Rate of compensation increase. The rate of compensation increase is estimated by our Company, based upon our actual rate of compensation increase during a year, and the long-term plans for such increases.
We have contributed an amount equal to 2 percent of the salaries and wages paid to all qualified employees located in Taiwan to a pension fund (the “Fund”). The Fund is administered by a pension fund monitoring committee (the “Committee”) and deposited in the Committee’s name in the Central Trust of China in Taiwan. Our Company makes pension payments from our account in the Fund unless the Fund is insufficient, in which case we make payments from internal funds as payments become due. We seek to maintain a normal, highly liquid working capital balance to ensure payments are made timely.
We expect to make a contribution of $29 thousand to the Fund in 2009. The benefits expected to be paid are $5 thousand in aggregate, from 2009 through 2013, and $59 thousand in aggregate, from 2014 to 2018.
Defined Contribution Pension Plan
We have provided defined contribution plans for employees located in Taiwan, North America, the PRC and Hong Kong. Contributions to the plans are expensed as incurred.
F-55
GIGAMEDIA LIMITED
NOTES TO THE CONSOLIDATED FINANCIAL STATEMENTS — (Continued)
YEARS ENDED DECEMBER 31, 2006, 2007 AND 2008
Taiwan
Pursuant to the new “Labor Pension Act” enacted on July 1, 2005, our Company has a defined contribution pension plan for our employees located in Taiwan. For eligible employees who elect to participate in the defined contribution pension plan, we contribute no less than 6 percent of an employees monthly salary and wage and up to the maximum amount of NT$9 thousand (approximately $278), to each of the eligible employees’ individual pension accounts at the Bureau of Labor Insurance each month. Pension payments to employees are made either by monthly installments or in a lump sum from the accumulated contributions and earnings in employees’ individual accounts.
North America
We provide a defined contribution plan for employees located in the United States. Participants under the age of 50 are allowed to defer up to $10 thousand of their annual compensation under the plan, whereas participants over the age of 50 are allowed to defer up to $12.5 thousand annually. Our Company contributes an amount equal to the lesser of 3 percent of the participant’s compensation or 100 percent of the amount deferred by the employee.
We also provide a defined contribution plan for employees located in Canada. Participants are permitted to contribute a percentage of their earnings to this plan and select their own investments. Each participant’s annual contributions are limited to 18 percent of his or her prior year compensation or $19 thousand, whichever is less. Our Company contributes an amount equal to the lesser of 3 percent of the participant’s compensation or 100 percent of the amount contributed by the participant.
PRC
All PRC employees participate in employee social security plans, including pension and other welfare benefits, which are organized and administered by governmental authorities. We have no other substantial commitments to employees. The premiums and welfare benefit contributions that should be borne by our Company are calculated in accordance with relevant PRC regulations, and are paid to the labor and social welfare authorities.
F-56
GIGAMEDIA LIMITED
NOTES TO THE CONSOLIDATED FINANCIAL STATEMENTS — (Continued)
YEARS ENDED DECEMBER 31, 2006, 2007 AND 2008
Hong Kong
According to the relevant Hong Kong regulations, we provide a contribution plan for the eligible employees in Hong Kong. We must contribute at least 5 percent of the employees’ total salaries. For this purpose, the monthly relevant contribution to their individual contribution accounts is subject to a cap of HK$1 thousand (approximately $128). After the termination of employment, the benefits still belong to the employees in any circumstances.
The total amount of defined contribution pension expenses pursuant to the plans in Taiwan, North America, the PRC and Hong Kong for the years ended December 31, 2006, 2007, and 2008 were $496 thousand, $852 thousand, and $1.1 million, respectively.
NOTE 20.SHAREHOLDERS’ EQUITY
Effective January 30, 2006, Singapore law was amended to eliminate the concept of par value and authorized shares. As a result, our January 1, 2006 Statement of Shareholders’ Equity presentation has been retroactively revised accordingly.
In accordance with R.O.C. law, an appropriation for legal reserve amounting to 10 percent of a company’s net profit is required until the reserve equals the aggregate par value of such Taiwan company’s issued capital stock. As of December 31, 2007 and 2008, the legal reserves of Hoshin GigaMedia, which represent a component of our accumulated deficits, were $2.0 million, and $2.3 million, respectively. The reserve can only be used to offset a deficit or be distributed as a stock dividend of up to 50 percent of the reserve balance when the reserve balance has reached 50 percent of the aggregate paid-in capital of Hoshin GigaMedia.
F-57
GIGAMEDIA LIMITED
NOTES TO THE CONSOLIDATED FINANCIAL STATEMENTS — (Continued)
YEARS ENDED DECEMBER 31, 2006, 2007 AND 2008
In accordance with the regulations in the PRC and their respective articles of association, subsidiaries and VIE subsidiaries of T2CN incorporated in the PRC are required to make an appropriation of retained earnings for statutory reserve equal to at least 10 percent of their respective after-tax profits, calculated in accordance with the PRC accounting standards and regulations until the reserve equals 50 percent of the registered capital of the respective companies. As of December 31, 2007 and 2008, the statutory reserves of subsidiaries and VIE subsidiaries of T2CN in the aggregate of $125 thousand and $339 thousand, respectively, are included as a component of GigaMedia’s consolidated accumulated deficit.
The statutory reserves can be used to offset a deficit or to increase capital of the respective companies. They are not transferable to our Company in the form of dividends, advances, or loans.
Under PRC laws and regulations, there are certain foreign exchange restrictions on our Company’s PRC subsidiaries and VIE subsidiaries with respect to transferring certain of their net assets to our Company either in the form of dividends, loans or advances.
As of December 31, 2007 and 2008, our Company’s total restricted net assets, which include paid up capital and statutory reserve funds of PRC subsidiaries and the net assets of VIE subsidiaries in which our Company has no legal ownership, were approximately $8.6 million and $13.2 million, respectively.
NOTE 21.SHARE-BASED COMPENSATION
Effective January 1, 2006, we adopted the fair value recognition provisions of FAS 123(R), using the modified prospective transition method. Under this transition method, stock-based compensation expense for 2006 included compensation expense for all stock-based compensation awards granted prior to, but not yet vested as of January 1, 2006, based on the grant date fair value estimated in accordance with the original provisions of FAS 123. Stock-based compensation expense for all share-based payment awards granted after January 1, 2006 is based on the grant-date fair value estimated in accordance with the provisions of FAS 123(R). FAS 123(R) requires companies to estimate the fair value of shared-based payment awards on the date of grant using an option-pricing model. The value of the portion of the award that is ultimately expected to vest is recognized as expense over the vesting periods. In connection with the adoption of FAS 123(R), we changed our method of attributing the value of stock-based compensation that we record to expense from the graded-vesting method to the straight-line method. Compensation expense for all share-based payment awards granted on or prior to January 1, 2006 will continue to be recognized using the graded-vesting method while compensation expense for all share-based payment awards granted subsequent to January 1, 2006 is recognized using the straight-line method. As stock-based compensation expense is based on awards ultimately expected to vest, it has been reduced for estimated forfeitures. We estimated the forfeiture rate based on our historical experience.
F-58
GIGAMEDIA LIMITED
NOTES TO THE CONSOLIDATED FINANCIAL STATEMENTS — (Continued)
YEARS ENDED DECEMBER 31, 2006, 2007 AND 2008
The following table summarizes the total stock-based compensation expense recognized in our Consolidated Statements of Operations:
| | | | | | | | | | | | | |
| (in US$ thousands) | | 2006 | | | 2007 | | | 2008 | |
| Cost of online game and service revenues | | $ | — | | | $ | 48 | | | $ | 27 | |
| Product development & engineering expenses | | | 115 | | | | 250 | | | | 480 | |
| Selling and marketing expenses | | | 56 | | | | 142 | | | | 244 | |
| General and administrative expenses | | | 54 | | | | 1,394 | | | | 1,954 | |
| | | | | | | | | | |
| Pre-tax stock-based compensation expense | | | 225 | | | | 1,834 | | | | 2,705 | |
| Income tax benefit | | | 33 | | | | 249 | | | | 269 | |
| | | | | | | | | | |
| Total stock-based compensation expense reported in continuing operations | | $ | 192 | | | $ | 1,585 | | | $ | 2,436 | |
| | | | | | | | | | |
| Total stock-based compensation expense reported in discontinued operations, net of tax | | $ | 58 | | | $ | 28 | | | $ | 63 | |
| | | | | | | | | | |
There were no significant capitalized stock-based compensation costs at December 31, 2007 and 2008.
F-59
GIGAMEDIA LIMITED
NOTES TO THE CONSOLIDATED FINANCIAL STATEMENTS — (Continued)
YEARS ENDED DECEMBER 31, 2006, 2007 AND 2008
GigaMedia
(a) Overview of Stock-Based Compensation Plan
2002 Employee Share Option Plan
At the June 2002 annual general meeting of shareholders, the shareholders of our Company approved the GigaMedia Limited 2002 Employee Share Option Plan (the “2002 Plan”) under which up to three million common shares of our Company have been reserved for issuance. All employees, officers, directors, supervisors, advisors, and consultants of our Company are eligible to participate in the 2002 Plan. The 2002 Plan is administered by a committee designated by the board of directors. The committee as plan administrator has complete discretion to determine the exercise price for the option grants, the eligible individuals who are to receive option grants, the time or times when options grants are to be made, the number of shares subject to grant and the vesting schedule. The maximum contractual term for the options under the 2002 Plan is 10 years.
2004 Employee Share Option Plan
At the June 2004 annual general meeting of shareholders, the shareholders of our Company approved the GigaMedia Limited 2004 Employee Share Option Plan (the “2004 Plan”) under which up to seven million common shares of our Company have been reserved for issuance. All employees, officers, directors, supervisors, advisors, and consultants of our Company are eligible to participate in the 2004 Plan. The 2004 Plan is administered by a committee designated by the board of directors. The committee as plan administrator has complete discretion to determine the exercise price for the option grants, the eligible individuals who are to receive option grants, the time or times when options grants are to be made, the number of shares subject to grant and the vesting schedule. The maximum contractual term for the options under the 2004 Plan is 10 years.
2006 Equity Incentive Plan
At the June 2006 annual general meeting of shareholders, the shareholders of our Company approved the GigaMedia Limited 2006 Equity Incentive Plan (the “2006 Plan”) under which up to one million common shares of our Company have been reserved for issuance. The 2006 Plan is administered by a committee designated by the board of directors. The committee as plan administrator has complete discretion to determine the grant of awards under the 2006 Plan. The maximum contractual term for the options under the 2006 Plan is 10 years.
F-60
GIGAMEDIA LIMITED
NOTES TO THE CONSOLIDATED FINANCIAL STATEMENTS — (Continued)
YEARS ENDED DECEMBER 31, 2006, 2007 AND 2008
2007 Equity Incentive Plan
At the June 2007 annual general meeting of shareholders, the shareholders of our Company approved the GigaMedia Limited 2007 Equity Incentive Plan (the “2007 Plan”) under which up to two million common shares of our Company have been reserved for issuance. The 2007 Plan is administered by a committee designated by the board of directors. The committee as plan administrator has complete discretion to determine the grant of awards under the 2007 Plan. The maximum contractual term for the options under the 2007 Plan is 10 years.
2008 Equity Incentive Plan
At the June 2008 annual general meeting of shareholders, the shareholders of our Company approved the GigaMedia Limited 2008 Equity Incentive Plan (the “2008 Plan”) under which up to one million common shares of our Company have been reserved for issuance. The 2008 Plan is administered by a committee designated by the board of directors. The committee as plan administrator has complete discretion to determine the grant of awards under the 2008 Plan. The maximum contractual term for the options under the 2008 Plan is 10 years.
Summarized below are the general terms of our stock-based compensation plans as of December 31, 2008.
F-61
GIGAMEDIA LIMITED
NOTES TO THE CONSOLIDATED FINANCIAL STATEMENTS — (Continued)
YEARS ENDED DECEMBER 31, 2006, 2007 AND 2008
| | | | | | | | | | | |
| Stock-Based | | | | | | | | | |
| compensation | | Granted | | | | | Options’ exercise | | RSUs’ grant |
| plan | | awards | | | Vesting schedule | | price | | date fair value |
| 2002 plan | | | 3,000,000 | | | immediately upon granting | | $0.79 | | — |
| 2004 plan | | | 7,528,185 | | | immediately upon granting to three years | | $0.79 ~ $2.55 | | — |
| 2006 plan | | | 999,543 | | | immediately upon granting to four years | | $10.15 ~ $16.6 | | $9.81 ~ $16.01 |
| 2007 plan | | | 1,980,907 | | | one to four years | | $4.24 ~ $18.17 | | $4.24 ~ $15.35 |
| 2008 plan | | | 560,000 | | | four to six years | | $4.24 | | — |
Options and RSU generally vest over the schedule described above. Certain RSU provide for accelerated vesting if there is a change in control. All options and RSUs are expected to be settled by issuing new shares.
(b) Options
In 2007 and 2008, 1,910,996 and 518,284 options were exercised, and cash received from the exercise of stock options was $2.7 million and $0.5 million, respectively, which resulted in no significant tax benefit realized on a consolidated basis.
The impact resulting from our adoption of FAS 123(R) on income from continuing operations before income taxes and net income on our 2006 Consolidated Financial Statements was $(225) thousand, and $(250) thousand, respectively. The impact on basic and diluted earnings per share was not material.
F-62
GIGAMEDIA LIMITED
NOTES TO THE CONSOLIDATED FINANCIAL STATEMENTS — (Continued)
YEARS ENDED DECEMBER 31, 2006, 2007 AND 2008
Prior to adoption of SFAS 123(R), our Company used the Black-Scholes formula to estimate the value of stock options granted to employees. We continue to use this option valuation model following our adoption of FAS 123(R). There were no stock options granted in 2006 and the following summarizes the assumptions used in the model for options granted during the years ended 2007 and 2008:
| | | | | | | | | |
| For the years ended December 31, | | 2006 | | | 2007 | | 2008 |
| |
| Option term (years) | | | — | | | 2.77 | | 2.77~4.58 |
| Volatility | | | — | | | 57.41%~58.80% | | 57.83%~64.58% |
| Weighted-average volatility | | | — | | | 58.68% | | 64.01% |
| Risk-free interest rate | | | — | | | 3.24%~4.56% | | 1.72%~2.88% |
| Dividend yield | | | — | | | 0% | | 0% |
| Weighted-average fair value of option granted | | | — | | | $4.46 | | $2.36 |
Option term. The expected term of the options granted represents the period of time that they are expected to be outstanding. Our Company estimates the expected term of options granted based on historical experience with grants and option exercises.
Expected volatility rate. An analysis of historical volatility was used to develop the estimate of expected volatility.
Risk-free interest rate. The risk-free interest rate is based on five-year U.S. Treasury bonds for the expected term of the options.
Expected dividend yield. The dividend yield is based on our Company’s current dividend yield.
F-63
GIGAMEDIA LIMITED
NOTES TO THE CONSOLIDATED FINANCIAL STATEMENTS — (Continued)
YEARS ENDED DECEMBER 31, 2006, 2007 AND 2008
Option transactions during the last three years are summarized as follows:
| | | | | | | | | | | | | | | | | | | | | | | | | | | | | | | | | |
| | | 2006 | | | 2007 | | | 2008 | |
| | | | | | | | | | | | | | | | | | | | | | | | | | | Weighted | | | | |
| | | Weighted | | | | | | | Weighted | | | | | | | Weighted | | | | | | | -Average | | | Aggregate | |
| | | Avg. | | | | | | | Avg. | | | | | | | Avg. | | | | | | | Remaining | | | Intrinsic | |
| | | Exercise | | | No. of Shares | | | Exercise | | | No. of Shares | | | Exercise | | | No. of Shares | | | Contractual | | | Value | |
| | | Price | | | (in thousands) | | | Price | | | (in thousands) | | | Price | | | (in thousands) | | | Term | | | (in thousands) | |
| Balance at January 1, | | $ | 1.11 | | | | 10,000 | | | $ | 1.11 | | | | 8,789 | | | $ | 2.42 | | | | 7,912 | | | | | | | | | |
| Options granted | | | — | | | | — | | | | 10.78 | | | | 1,145 | | | | 4.69 | | | | 1,341 | | | | | | | | | |
| Options exercised | | | 1.10 | | | | (1,152 | ) | | | 1.43 | | | | (1,911 | ) | | | 0.95 | | | | (518 | ) | | | | | | | | |
| Options Forfeited/canceled /expired | | | 1.48 | | | | (59 | ) | | | 2.47 | | | | (111 | ) | | | 9.97 | | | | (448 | ) | | | | | | | | |
| | | | | | | | | | | | | | | | | | | | | | | | | | | |
| Balance at December 31, | | $ | 1.11 | | | | 8,789 | | | $ | 2.42 | | | | 7,912 | | | $ | 2.47 | | | | 8,287 | | | | 6.32 | | | $ | 30,644 | |
| | | | | | | | | | | | | | | | | | | | | | | | | |
| Exercisable at December 31, | | $ | 1.08 | | | | 8,318 | | | $ | 1.06 | | | | 6,692 | | | $ | 1.33 | | | | 6,448 | | | | 5.59 | | | $ | 28,851 | |
| | | | | | | | | | | | | | | | | | | | | | | | | |
| | | | | | | | | | | | | | | | | | | | | | | | | | | | | | | | | |
| Vested and expected to vest at December 31, | | $ | 1.11 | | | | 8,783 | | | $ | 2.42 | | | | 7,912 | | | $ | 2.47 | | | | 8,287 | | | | 6.32 | | | $ | 30,644 | |
| | | | | | | | | | | | | | | | | | | | | | | | | |
The aggregate intrinsic value in the table above represents the total pretax intrinsic value (the difference between GigaMedia’s closing stock price on the last trading day of 2008 and the fair value of the exercise price, multiplied by the number of in-the-money options) that would have been received by the option holders and all option holders had they exercised their options on December 31, 2008. This amount changes based on the fair market value of GigaMedia’s stock. The total intrinsic value of options exercised for the years ended December 31, 2006, 2007, and 2008 were $8.8 million, $25.1 million, and $7.2 million, respectively.
As of December 31 2008, there was approximately $5.2 million of unrecognized compensation cost related to nonvested options. That cost is expected to be recognized over a period of 3.70 years.
F-64
GIGAMEDIA LIMITED
NOTES TO THE CONSOLIDATED FINANCIAL STATEMENTS — (Continued)
YEARS ENDED DECEMBER 31, 2006, 2007 AND 2008
The following table sets forth information about stock options outstanding at December 31, 2008:
| | | | | | | | | | | | | | | |
| | | Options outstanding | | | Options currently exercisable | |
| | | | | | | Weighted average | | | | | | |
| | | No. of Shares | | | remaining | | | | | No. of Shares | |
| Exercise price | | (in thousands) | | | contractual life | | | Exercise price | | (in thousands) | |
| under $1 | | | 5,431 | | | 5.50 years | | under $1 | | | 5,431 | |
| $1~$10 | | | 2,094 | | | 7.61 years | | $1~$10 | | | 804 | |
| $10~$20 | | | 762 | | | 8.67 years | | $10~$20 | | | 213 | |
| | | | | | | | | | | | | |
| | | | 8,287 | | | | | | | | | | 6,448 | |
| | | | | | | | | | | | | |
(c) RSUs
Nonvested RSUs during 2008 were as follows:
| | | | | | | | | |
| | | Number of units | | | Weighted-average | |
| | | (in thousands) | | | grant date fair value | |
| Nonvested at December 31, 2007 | | | 238 | | | $ | 10.25 | |
| Granted | | | 634 | | | $ | 10.65 | |
| Vested | | | (132 | ) | | $ | 11.12 | |
| Forfeited | | | (99 | ) | | $ | 10.63 | |
| | | | | | | | |
| Nonvested at December 31, 2008 | | | 641 | | | $ | 10.41 | |
| | | | | | | | |
The fair value of RSUs is determined and fixed on the grant date based on our stock price. The fair value of RSUs granted during the years ended December 31, 2006, 2007 and 2008 was $1.1 million, $2.2 million and $6.8 million, respectively. The total fair value of RSUs vested during the years ended December 31, 2006, 2007 and 2008 was $81 thousand, $773 thousand and $1.5 million, respectively, which resulted in no significant tax benefit realized on a consolidated basis.
As of December 31 2008, there was approximately $6.3 million of unrecognized compensation cost related to nonvested RSUs. That cost is expected to be recognized over a weighted-average period of 2.59 years. Our Company received no cash from employees as a result of employee stock award vesting and the release of RSUs during 2006, 2007 and 2008.
F-65
GIGAMEDIA LIMITED
NOTES TO THE CONSOLIDATED FINANCIAL STATEMENTS — (Continued)
YEARS ENDED DECEMBER 31, 2006, 2007 AND 2008
T2CN
(a) Overview of Stock-Based Compensation Plan
The board members of T2CN approved the T2CN stock-based compensation plan for which up to 10.8 million common shares of T2CN have been reserved for issuance. The maximum contractual term is 11 years.
The stock options of T2CN generally vest over one to three years. Certain stock options contingently vest upon meeting a specific performance goal. T2CN recognizes expenses for its stock options that are ultimately expected to vest using the straight-line method over the vesting period. The options generally expire five to 10 years after the grant date. The total value of compensation expense for stock options is equal to the fair value of the award on the grant date. All stock options are expected to be settled by issuing new shares.
(b) Options
No options have been exercised since our consolidation of T2CN in June 2007.
T2CN used the Black-Scholes option-pricing model to estimate the fair value of stock options. The following summarizes the assumptions used in the model for options granted during each of the years ended 2006, 2007 and 2008:
| | | | | | | |
| For the years ended December 31, | | 2006 | | 2007 | | 2008 |
| | | | | | | |
| Option term (years) | | 5.63~6.41 | | 5.44~6.02 | | 3.50~6.26 |
| Volatility | | 47.39%~56.10% | | 44.64%~46.96% | | 47.85%~57.41% |
| Weighted-average volatility | | 53.81% | | 45.03% | | 48.19% |
| Risk-free interest rate | | 4.54%~4.82% | | 4.31%~4.68% | | 2.20%~4.54% |
| Dividend yield | | 0% | | 0% | | 0% |
| Weighted-average fair value of option granted | | $0.39 | | $0.52 | | $0.38 |
F-66
GIGAMEDIA LIMITED
NOTES TO THE CONSOLIDATED FINANCIAL STATEMENTS — (Continued)
YEARS ENDED DECEMBER 31, 2006, 2007 AND 2008
Option term. The expected term of the options granted represents the period of time that they are expected to be outstanding. In the absence of sufficient historical data in the exercise behavior of option holders, T2CN applies the mid point of option life and average vesting period.
Expected volatility rate. The expected volatility is based on the weighted average historical volatility of the stock prices of the comparable companies as at the grant dates.
Risk-free interest rate. The risk-free interest rate is based on yields of U.S. Treasury bonds for the expected term of the options.
Expected dividend yield. The dividend yield is based on T2CN’s current dividend yield.
Option and grant transactions for the period from June 1, 2007 to December 31, 2008 are summarized as follows:
| | | | | | | | | | | | | | | | | | | | | | | | | |
| | | 2007 | | | 2008 | |
| | | | | | | | | | | | | | | | | | Weighted- | | | | |
| | | | | | | | | | | | | | | | | | Average | | | | |
| | | | | | | | | | | | | | | | | | Remaining | | | Aggregate | |
| | | Weighted Avg. | | | No. of Shares | | | Weighted Avg. | | | No. of Shares | | | Contractual | | | Intrinsic Value | |
| | | Exercise Price | | | (in thousands) | | | Exercise Price | | | (in thousands) | | | Term | | | (in thousands) | |
| Balance at Beginning of the year | | $ | 1.30 | | | | 2,973 | | | $ | 1.24 | | | | 3,300 | | | | | | | | | |
| Options granted | | | 1.00 | | | | 501 | | | $ | 1.02 | | | | 6,500 | | | | | | | | | |
| Options | | | | | | | | | | | | | | | | | | | | | | | | |
| Forfeited/canceled /expired | | | 1.57 | | | | (174 | ) | | $ | 1.15 | | | | (2,959 | ) | | | | | | | | |
| | | | | | | | | | | | | | | | | | | | | |
| | | | | | | | | | | | | | | | | | | | | | | | | |
| Balance at December 31, | | $ | 1.24 | | | | 3,300 | | | $ | 1.07 | | | | 6,841 | | | | 5.20 | | | $ | 3,584 | |
| | | | | | | | | | | | | | | | | | | |
| Exercisable at December 31, | | $ | 1.20 | | | | 937 | | | $ | 1.27 | | | | 1,406 | | | | 7.76 | | | $ | 461 | |
| | | | | | | | | | | | | | | | | | | |
| Vested and expected to vest at December 31, | | $ | 1.24 | | | | 3,016 | | | $ | 1.06 | | | | 5,753 | | | | 5.20 | | | $ | 3,070 | |
| | | | | | | | | | | | | | | | | | | |
F-67
GIGAMEDIA LIMITED
NOTES TO THE CONSOLIDATED FINANCIAL STATEMENTS — (Continued)
YEARS ENDED DECEMBER 31, 2006, 2007 AND 2008
The aggregate intrinsic value in the table above represents the total pretax intrinsic value that would have been received by the option holders and all option holders had they exercised their options on December 31, 2008. This amount changes based on the estimated fair value of T2CN’s stock.
As of December 31, 2008 there was $1.6 million of total unrecognized compensation cost, net of estimated forfeitures, related to unvested share options which are expected to be recognized over a weighted average period of 2.19 years. Total unrecognized compensation cost may be adjusted for future changes in estimated forfeitures.
The following table sets forth information about stock options outstanding at December 31, 2008:
| | | | | | | | | | | | | | | | | |
| | | Options outstanding | | | Options currently exercisable | |
| | | | | | | Weighted average | | | | | | | |
| Range of | | No. of Shares | | | remaining | | | Weighted average | | | No. of Shares | |
| exercise price | | (in thousands) | | | contractual life | | | exercise price | | | (in thousands) | |
| $1.00 | | | 6,075 | | | 4.86 years | | $ | 1.00 | | | | 782 | |
| $1.60 | | | 766 | | | 7.94 years | | $ | 1.60 | | | | 624 | |
| | | | | | | | | | | | | | | |
| | | | 6,841 | | | | | | | | | | | | 1,406 | |
| | | | | | | | | | | | | | | |
NOTE 22.OTHER NON-OPERATING INCOME
| | | | | | | | | | | | | |
| | | For the years ended December 31, | |
| (in US$ thousands) | | 2006 | | | 2007 | | | 2008 | |
| | | | | | | | | | | | | |
| Gain on cancellation of preferred share call options | | $ | — | | | $ | 1,069 | | | $ | — | |
| Indemnification from termination of game licensing | | | — | | | | 601 | | | | — | |
| Compensation from termination of investment option rights | | | — | | | | 498 | | | | — | |
| Gain on early redemption of convertible notes | | | 625 | | | | — | | | | — | |
| Subsidy received from tax authority | | | | | | | | | | | 561 | |
| Other | | | 59 | | | | (25 | ) | | | 281 | |
| | | | | | | | | | |
| | | $ | 684 | | | $ | 2,143 | | | $ | 842 | |
| | | | | | | | | | |
F-68
GIGAMEDIA LIMITED
NOTES TO THE CONSOLIDATED FINANCIAL STATEMENTS — (Continued)
YEARS ENDED DECEMBER 31, 2006, 2007 AND 2008
NOTE 23.INCOME TAXES
| | | | | | | | | | | | | |
| | | For the years ended December 31, | |
| (in US$ thousands) | | 2006 | | | 2007 | | | 2008 | |
| Income from continuing operations before income taxes U.S. operations | | $ | 865 | | | $ | 489 | | | $ | 1,095 | |
| Non-U.S. operations | | | 17,831 | | | | 38,995 | | | | 35,684 | |
| | | | | | | | | | |
| Total income from continuing operations before income taxes | | $ | 18,696 | | | $ | 39,484 | | | $ | 36,779 | |
| | | | | | | | | | |
Income tax provision from continuing operations by geographic location is as follows:
| | | | | | | | | | | | | |
| | | For the years ended December 31, | |
| (in US$ thousands) | | 2006 | | | 2007 | | | 2008 | |
| U.S. operations | | $ | 366 | | | $ | 224 | | | $ | 620 | |
| Non-U.S. operations | | | 157 | | | | 177 | | | | 449 | |
| | | | | | | | | | |
| | | $ | 523 | | | $ | 401 | | | $ | 1,069 | |
| | | | | | | | | | |
The components of income tax provision from continuing operations by taxing jurisdiction are as follows:
| | | | | | | | | | | | | |
| | | For the years ended December 31, | |
| (in US$ thousands) | | 2006 | | | 2007 | | | 2008 | |
| U.S. federal | | | | | | | | | | | | |
| Current | | $ | 266 | | | $ | 281 | | | $ | (57 | ) |
| Deferred | | | 8 | | | | (111 | ) | | | 528 | |
| | | | | | | | | | |
| | | $ | 274 | | | $ | 170 | | | $ | 471 | |
| | | | | | | | | | |
| | | | | | | | | | | | | |
| U.S. state and local : | | | | | | | | | | | | |
| Current | | $ | 90 | | | $ | 84 | | | $ | 208 | |
| Deferred | | | 2 | | | | (30 | ) | | | (59 | ) |
| | | | | | | | | | |
| | | $ | 92 | | | $ | 54 | | | $ | 149 | |
| | | | | | | | | | |
| | | | | | | | | | | | | |
| Non — U.S. : | | | | | | | | | | | | |
| Current | | $ | 173 | | | $ | 132 | | | $ | 976 | |
| Deferred | | | (16 | ) | | | 45 | | | | (527 | ) |
| | | | | | | | | | |
| | | $ | 157 | | | $ | 177 | | | $ | 449 | |
| | | | | | | | | | |
| | | | | | | | | | | | | |
| Total income tax provisions | | $ | 523 | | | $ | 401 | | | $ | 1,069 | |
| | | | | | | | | | |
F-69
GIGAMEDIA LIMITED
NOTES TO THE CONSOLIDATED FINANCIAL STATEMENTS — (Continued)
YEARS ENDED DECEMBER 31, 2006, 2007 AND 2008
A reconciliation of our continuing operations effective tax rate to the statutory U.S. federal tax rate is as follows:
| | | | | | | | | | | | | |
| | | For the years ended December 31, | |
| (in US$ thousands) | | 2006 | | | 2007 | | | 2008 | |
| | | | | | | | | | | | | |
| Federal statutory rate | | | 34.00 | % | | | 34.00 | % | | | 34.00 | % |
| State and local — net of federal tax benefit | | | 6.78 | % | | | 6.27 | % | | | 6.27 | % |
| Foreign tax differential | | | (35.75 | %) | | | (36.16 | %) | | | (31.10 | %) |
| Loss carryforward utilized | | | (5.67 | %) | | | (3.33 | %) | | | (2.89 | %) |
| Reversal of valuation allowance | | | — | | | | — | | | | (4.69 | %) |
| Other | | | 3.44 | % | | | 0.24 | % | | | 1.32 | % |
| | | | | | | | | | |
| Effective rate | | | 2.80 | % | | | 1.02 | % | | | 2.91 | % |
| | | | | | | | | | |
The provision for income taxes attributable to discontinued operations is $1.0 million, $2 thousand, and $986 thousand for the years ended December 31, 2006, 2007 and 2008, respectively.
Significant components of our deferred tax assets and liabilities consist of the following:
| | | | | | | | | |
| | | December 31, | |
| (in US$ thousands) | | 2007 | | | 2008 | |
| | | | | | | | | |
| Deferred tax assets: | | | | | | | | |
| Net operating loss carryforwards | | $ | 1,128 | | | $ | 1 | |
| Deferred revenue | | | 451 | | | | 472 | |
| Amortization | | | 213 | | | | 378 | |
| Investment credits | | | 322 | | | | 185 | |
| Share-based compensation | | | 74 | | | | 116 | |
| Allowance for doubtful accounts | | | 284 | | | | — | |
| Pension expense | | | 145 | | | | 80 | |
| Depreciation | | | 201 | | | | 22 | |
| Others | | | 194 | | | | 214 | |
| | | | | | | |
| | | | 3,012 | | | | 1,468 | |
| | | | | | | | | |
| Less: valuation allowance | | | (3,012 | ) | | | (106 | ) |
| | | | | | | |
| Deferred tax assets — net | | $ | — | | | $ | 1,362 | |
| | | | | | | |
F-70
GIGAMEDIA LIMITED
NOTES TO THE CONSOLIDATED FINANCIAL STATEMENTS — (Continued)
YEARS ENDED DECEMBER 31, 2006, 2007 AND 2008
As of December 31, 2007 and 2008, $0 thousand and $442 thousand, respectively of net deferred tax assets were reported as non-current deferred tax assets and included in the other assets.
| | | | | | | | | |
| | | December 31, | |
| (in US$ thousands) | | 2007 | | | 2008 | |
| | | | | | | | | |
| Deferred tax liabilities: | | | | | | | | |
| Depreciation and amortization | | $ | — | | | $ | 1,754 | |
| Others | | | (107 | ) | | | (244 | ) |
| | | | | | | |
| Deferred tax liabilities — net | | $ | (107 | ) | | $ | 1,510 | |
| | | | | | | |
As of December 31, 2007 and 2008, $0 thousand and $1.1 million, respectively of deferred tax liabilities were reported as non-current deferred tax liabilities and included in the other liabilities.
| | | | | | | | | | | | | |
| | | For the years ended December 31, | |
| (in US$ thousands) | | 2006 | | | 2007 | | | 2008 | |
| | | | | | | | | | | | | |
| Valuation allowance: | | | | | | | | | | | | |
| Balance at beginning of year | | $ | 10,396 | | | $ | 4,032 | | | $ | 3,012 | |
| Subsequent reversal/utilization of valuation allowance | | | (4,160 | ) | | | (1,224 | ) | | | (2,787 | ) |
| Reversal of valuation allowance due to loss carryforwards expired unused | | | (2,283 | ) | | | (990 | ) | | | — | |
| Divestiture | | | — | | | | — | | | | (219 | ) |
| Acquisition | | | — | | | | 1,197 | | | | — | |
| Exchange differences | | | 79 | | | | (3 | ) | | | 100 | |
| | | | | | | | | | |
| Balance at end of year | | $ | 4,032 | | | $ | 3,012 | | | $ | 106 | |
| | | | | | | | | | |
As of December 31, 2006 and 2007, we did not believe that sufficient objective, positive evidence existed to conclude that the realization of deferred tax assets was more likely than not. Our Internet access and service operations faced slow market growth and intense market competition, and certain subsidiaries and VIE subsidiaries of our online game and service business were not likely to be able to utilize their operating loss carryforwards. As a result, we provided a valuation allowance covering substantially all of the deferred tax assets as of December 31, 2006 and 2007.
F-71
GIGAMEDIA LIMITED
NOTES TO THE CONSOLIDATED FINANCIAL STATEMENTS — (Continued)
YEARS ENDED DECEMBER 31, 2006, 2007 AND 2008
For deferred tax assets as of December 31, 2008, we evaluated the available evidence and determined that it was more likely than not that we would realize the benefit of the deferred tax assets. The primary reason for the reversal of the valuation allowance in 2008 was that the sale of our Internet access and service operation was completed in September 2008. Based on weighing all available evidence, we determined that evidence exists to conclude that it is more likely than not that we will generate sufficient taxable income to utilize the majority of the deferred tax assets within the allowable carryforward periods.
In 2007 and 2008, we applied for investment tax credits and research and development tax credits in the Taiwan tax jurisdiction.
Under Singapore tax regulations, foreign-sourced dividend income used for capital expenditures, including investments, and repayment of borrowings, would not be deemed as remitted to Singapore and is therefore not taxable. As of December 31, 2008, the Company has not accrued deferred income taxes on $101.5 million of unremitted earnings from non-Singapore subsidiaries as such earnings are considered to be reinvested overseas or repayment of borrowings. Determination of the amount of unrecognized deferred tax liability related to these earnings is considered impracticable.
FIN 48
As noted in Note 1, “Business Overview, Basis of Presentation, and Summary of Significant Accounting Policies”, on January 1, 2007, we adopted FIN 48, an interpretation which was issued to clarify the accounting for income taxes by providing a methodology for financial statement recognition and the measurement of uncertain income tax positions taken or expected to be taken in a tax return. The cumulative effects of adopting FIN 48 were an increase of FIN 48 liabilities of $143 thousand, an increase of the January 1, 2007 accumulated deficit of $143 thousand and the derecognition of deferred tax assets and the associated valuation allowance of $66 thousand. Including the cumulative effect increase at January 1, 2007, we had approximately $209 thousand of total gross unrecognized tax benefits.
F-72
GIGAMEDIA LIMITED
NOTES TO THE CONSOLIDATED FINANCIAL STATEMENTS — (Continued)
YEARS ENDED DECEMBER 31, 2006, 2007 AND 2008
A reconciliation of the beginning and ending amount of unrecognized tax benefits (excluding the effects of accrued interest) for the years 2007 and 2008 are as follows:
| | | | | |
| (in US$ thousands) | | | | |
| Balance at January 1, 2007 | | $ | 209 | |
| Decrease due to settlement | | | (82 | ) |
| | | | |
| Balance at December 31, 2007 | | | 127 | |
| Decrease due to settlement | | | (127 | ) |
| | | | |
| Balance at December 31, 2008 | | $ | — | |
| | | | |
As of December 31, 2007, if recognized, the $61 thousand of unrecognized tax benefits would reduce the effective tax rate by a minimal amount. The remaining $66 thousand would be subject to the provision of deferred tax assets and would not have an impact on our effective tax rate.
Interest and penalties related to income tax liabilities are included in income tax expense. In 2007 and 2008, there were no significant interest and penalties recognized in income tax expenses.
Our major tax jurisdictions are located in Taiwan, the PRC and the United States. As of December 31, 2007, the income tax filings under tax jurisdictions located in Taiwan have been examined through 2005. The tax authority in the PRC has only examined the tax filings of T2 Entertainment through 2006. Our Company files income tax returns in the United States federal and state jurisdictions. With few exceptions, our Company is no longer subject to U.S. federal and state income tax examinations by tax authorities for years before 2001.
All of our gross unrecognized tax benefits are related to research and development credits. During 2007, income tax authority proposed adjustments of $143 thousand on the research and development credits for our 2005 tax filing. We filed appeals for credits, which amounted to $61 thousand. With regard to the remaining $82 thousand, the Company did not appeal and the examination is considered closed.
F-73
GIGAMEDIA LIMITED
NOTES TO THE CONSOLIDATED FINANCIAL STATEMENTS — (Continued)
YEARS ENDED DECEMBER 31, 2006, 2007 AND 2008
In March 2008, we received a final determination on the aforementioned appeals for the 2005 tax filing, which stated that of the total $61 thousand research and development credits, $42 thousand was sustained and $19 thousand could not be recognized. As for $66 thousand of research and development credits for our 2006 tax filing, we have notified the income tax authority and agreed to forgo this research and development tax credit. As a result, all remaining unrecognized tax benefits were settled during 2008 and there was no unrecognized tax benefit as of December 31, 2008.
The amount of unrecognized tax benefits may increase or decrease in the future for various reasons such as current year tax positions, expiration of statutes of limitations, litigation, legislative activity, or other changes in facts regarding realizability. However, at this time, an estimate of the potential range of change cannot be reasonably made.
NOTE 24.RELATED-PARTY TRANSACTIONS
Through September 2008, in the course of operating our business, we provided Internet access services to, or sourced services from, our Company’s business partners. These partners included companies in which we held an interest, and companies with which members of our board, senior managers of our Company, and our major shareholders or beneficial owners were associated. The volume of business with such companies was not material to our Consolidated Financial Statement.
Except for the following transactions, we were not a party to any transaction with any related party that did not arise in the ordinary course of business or that was material to us.
F-74
GIGAMEDIA LIMITED
NOTES TO THE CONSOLIDATED FINANCIAL STATEMENTS — (Continued)
YEARS ENDED DECEMBER 31, 2006, 2007 AND 2008
As of December 31, 2007 and 2008, JC Entertainment Corporation (“JC”) owned 10.5 percent and 10.8 percent, respectively, of the total outstanding voting rights of T2CN. During 2007, subsequent to the date we began consolidating T2CN, T2CN paid certain licensing and royalty fees, totaling approximately $3.0 million, and $1.4 million, respectively, to JC. During 2008, T2CN paid certain licensing and royalty fees, totaling approximately $1.2 million, and $2.8 million, respectively, to JC. As of December 31, 2007 and 2008, we had a royalty payable to JC of approximately $593 thousand and $445 thousand, respectively, and prepaid licensing fees of approximately $3.8 million and $6.6 million, respectively. As of December 31, 2008, based on the game licensing agreements signed with JC, T2CN also committed to pay certain licensing fees and a minimum guarantee for royalty payments in the future years totaling approximately $3 million and $9 million, respectively.
A key manager of Fubon Financial Holdings Limited (who resigned from Fubon Financial Holdings Limited in 2008), which owned 100 percent of Taipei Fubon Commercial Bank, was one of our directors. As of December 31, 2007, we had short-term borrowings in the amount of $6.2 million, bearing interest of 3.902 percent, indebted to Taipei Fubon Commercial Bank, and we pledged time deposits as collateral for borrowings from Taipei Fubon Commercial Bank of approximately $2.5million. As of December 31, 2008, we did not have short-term borrowings owed to Taipei Fubon Commercial Bank.
In 2008, a key manager of Waterland Financial Holdings was one of our directors. As of December 31, 2008, we had short-term borrowings in the amount of $1.5 million, bearing interest of 5.038 percent, owed to Waterland Financial Holdings.
In December 2006, we resigned from the board of directors of Gamania. Following our resignation from such board, we sold in the public market all of our Gamania shares, which resulted in gains of $2.1 million reported in discontinued operations. (See Note 10, “Marketable Securities-Current” for additional information)
F-75
GIGAMEDIA LIMITED
NOTES TO THE CONSOLIDATED FINANCIAL STATEMENTS — (Continued)
YEARS ENDED DECEMBER 31, 2006, 2007 AND 2008
NOTE 25.COMMITMENTS AND CONTINGENCIES
Commitments
(a) Operating Leases
We rent certain properties used as office premises under lease agreements that expire at various dates through 2014. The following table sets forth our future aggregate minimum lease payments required under these operating leases, as of December 31, 2008:
| | | | | |
| | | Amount | |
| Year | | (in US$ thousands) | |
| 2009 | | $ | 5,256 | |
| 2010 | | | 5,272 | |
| 2011 | | | 3,703 | |
| 2012 | | | 3,302 | |
| 2013 | | | 2,382 | |
| Thereafter | | | 1,747 | |
| | | | |
| Total | | $ | 21,662 | |
| | | | |
Rental expenses for operating leases amounted to $2.5 million, $3.3 million and $5.0 million for the years ended December 31, 2006, 2007 and 2008, respectively (including rental expense amounts of $1.5 million, $1.8 million, and $1.6 million reported in discontinued operations in 2006, 2007 and 2008, respectively). As of December 31, 2007 and 2008, our Company recorded deferred rent of $85 thousand and $2.4 million, respectively, of which $57 thousand and $2.1 million were included in the other liabilities.
(b) Webs-TV Services Related Commitment
In May 2006, our Company entered into an asset purchase and sale agreement and a service agreement with Webs-TV to sell GigaMedia’s ADSL business and provide the agreed upon services. The sale of the ADSL business was completed in 2006. (Please see Note 4, “Divestitures”, for additional information). Upon completion of the sale of our Internet access and services business in September 2008, the above obligation for the services agreed upon was transferred to the buyer, except for the right to use GigaMedia’s ADSL brand. Our Company is still allowing Webs-TV to use GigaMedia’s ADSL brand for five years from May 2006.
F-76
GIGAMEDIA LIMITED
NOTES TO THE CONSOLIDATED FINANCIAL STATEMENTS — (Continued)
YEARS ENDED DECEMBER 31, 2006, 2007 AND 2008
(c) License Agreements
We have contractual obligations under various license agreements to pay the licensors license fees and minimum guarantees against future royalties. The following table summarizes the committed license fees and minimum guarantees against future royalties set forth in the major license agreements.
| | | | | | | | | | | | | |
| | | | | | | Minimum | | | | |
| | | | | | | guarantees against | | | | |
| | | License fees | | | future royalties | | | Total | |
| | | | | | | | | | | | | |
| Minimum required payments: | | | | | | | | | | | | |
| In 2009 | | $ | 1,013 | | | $ | 7,815 | | | $ | 8,828 | |
| After 2009 | | | 3,300 | | | | 28,000 | | | | 31,300 | |
| | | | | | | | | | |
| | | $ | 4,313 | | | $ | 35,815 | | | $ | 40,128 | |
| | | | | | | | | | |
The initial minimum guarantees against future royalties and license fees are not required to be paid until the licensed games are commercially released or until certain milestones are achieved, as stipulated in the individual license agreements. The remaining minimum guarantees are generally required to be paid within three years subsequent to the commercial release dates of the licensed games.
Additionally, we also have contractually committed to support related marketing, promotion and advertising activities for certain games, and our commitments are contingent to occur based on the payment schedules set forth in the individual license agreements. As of December 31, 2008, our total commitments to these marketing expenditures amounted to not less than $17.7 million.
F-77
GIGAMEDIA LIMITED
NOTES TO THE CONSOLIDATED FINANCIAL STATEMENTS — (Continued)
YEARS ENDED DECEMBER 31, 2006, 2007 AND 2008
Contingencies
(a) T2CN VIE
PRC laws and regulations currently limit foreign ownership of companies that provide Internet content services in the PRC, which include operating online games. In addition, foreign invested enterprises are currently not eligible to apply for licenses required for operating online games in the PRC. T2CN is incorporated in the British Virgin Islands and considered a foreign entity under PRC laws. Due to the restrictions on foreign ownership on the provision of online games, T2 Entertainment and Jinyou hold necessary licenses and approvals that are essential for the online game and service business of T2CN. Hence, T2CN online games operation in the PRC is dependent on the game licenses and approvals held by T2 Entertainment and Jinyou. T2CN and its subsidiaries have entered into contractual arrangements with T2 Entertainment and Jinyou for use of the relevant licenses and websites. Pursuant to certain other agreements and undertakings, T2CN in substance controls T2 Entertainment and Jinyou. In the opinion of T2CN’s directors as of December 31, 2008, the ownership structures and the contractual arrangements with T2 Entertainment, Jinyou and their equity owners as well as their operations are in compliance with all existing PRC laws and regulations. However, there may be changes and other developments in PRC laws and regulations or their interpretation. Accordingly, T2CN cannot be assured that in the future the PRC government authorities will not take a view contrary to the opinion of T2CN’s directors. If the current ownership structures of T2CN and its contractual arrangements with T2 Entertainment and Jinyou were found to be in violation of any existing or future PRC laws or regulations, T2CN might be required to restructure its ownership structure and operations in the PRC to comply with changing or new PRC laws and regulations.
(b) Other
We are subject to legal proceedings and claims that arise in the normal course of business. We believe the ultimate liabilities with respect to these actions will not have a material adverse effect on our financial condition, results of operations or cash flows. (See Note 26, “Litigation”, for additional information).
F-78
GIGAMEDIA LIMITED
NOTES TO THE CONSOLIDATED FINANCIAL STATEMENTS — (Continued)
YEARS ENDED DECEMBER 31, 2006, 2007 AND 2008
NOTE 26.LITIGATION
Class Action
In December 2001, a class action lawsuit was filed in the United States District Court for the Southern District of New York (“District Court”) against our Company in connection with the initial public offering of our stock.
The complaint alleged that we violated Section 11 and Section 15 of the Securities Exchange Act of 1933 and Section 10(b) of the Securities Exchange Act of 1934 and Rule 10b-5 promulgated thereunder. In October 2002, plaintiffs voluntarily dismissed the individual defendants without prejudice. On February 19, 2003, the court issued an opinion and order on defendants’ motions to dismiss, which granted the motions in part and denied the motions in part. As to GigaMedia, the Rule 10b-5 claims were dismissed without prejudice, while the Section 11 claims survived the motion. Discovery in the actions commenced.
In June 2004, plaintiffs and issuer defendants, including our Company, presented the executed settlement agreement (the “Issuers’ Settlement”) to the judge during a court conference. Subsequently, plaintiffs and issuer defendants made a motion for preliminary approval of the settlement agreement. The key terms of the Issuers’ Settlement included: 1) the insurers of the issuers would provide an undertaking to guarantee that plaintiffs would recover a total of $1 billion; 2) the insurers would pay up to $15 million for the notice costs arising from the settlement; 3) the issuers would assign their interest in certain claims against the underwriters to a litigation trust, represented by plaintiffs’ counsel; and 4) the plaintiffs would release all of the settling issuer defendants. That is, if plaintiffs were successful in recovering more than $1 billion from the underwriters, the issuer defendants would not be obligated to pay any additional amounts. If plaintiffs recovered less than $1 billion from the underwriters, the insurers would pay the deficit between $1 billion and the amount received from the underwriters.
On February 15, 2005, the judge issued an opinion and order granting preliminary approval to the settlement agreement subject to a narrowing of the proposed bar order as to only contribution claims. On April 24, 2006, the court held a fairness hearing on the proposed Issuers’ Settlement, which is subject to the court’s approval.
F-79
GIGAMEDIA LIMITED
NOTES TO THE CONSOLIDATED FINANCIAL STATEMENTS — (Continued)
YEARS ENDED DECEMBER 31, 2006, 2007 AND 2008
On December 5, 2006, the United States Court of Appeals for the Second Circuit issued an opinion vacating the District Court’s class certification in the six focus cases, which do not include the Company. Because the Second Circuit’s opinion was directed to class certification in the focus cases, the opinion’s effect on the proposed class to be certified by the District Court in connection with the Issuers’ Settlement was unclear.
On December 15, 2006, the District Court held a conference with all counsel in the IPO securities class action lawsuit to discuss the impact of the foregoing opinion. In the conference, the District Court agreed to stay all proceedings, including discovery and consideration of the Issuers’ Settlement, pending further decisions from the Second Circuit.
On January 5, 2007, plaintiffs filed a petition in the Second Circuit for rehearing and rehearing en banc regarding the decision on class certification (the “Petition”). On April 6, 2007, the Second Circuit rendered its decision which denied the Petition.
In April, May, and June 2007, the District Court held several conferences to discuss the issues regarding class certification, statute of limitations, the Issuers’ Settlement and discovery. In June 2007, a stipulation terminating the Issuers’ Settlement was submitted to the District Court.
In September 2007, discovery moved forward in the six focus cases, which do not include the Company. Plaintiffs filed amended complaints against the focus case issuer and underwriter defendants and moved for class certification in those actions. In November 2007, the underwriters and issuers filed motions to dismiss the amended complaints in the focus cases. In December 2007, plaintiffs filed their opposition to defendants’ motions to dismiss. In January 2008, defendants filed their reply briefs in further support of the motions to dismiss.
F-80
GIGAMEDIA LIMITED
NOTES TO THE CONSOLIDATED FINANCIAL STATEMENTS — (Continued)
YEARS ENDED DECEMBER 31, 2006, 2007 AND 2008
On or about March 26, 2008, the District Court granted in part and denied in part the motion to dismiss the focus cases. The motion to dismiss was granted only as to claims brought under Section 11 of the Securities Act by plaintiffs who sold their securities for a price in excess of the initial offering price and by those plaintiffs who purchased outside the previously certified class period.
On April 9, 2008, the underwriters filed a motion for reconsideration of the holding in the March 26, 2008 opinion that the Section 11 claims against the focus case issuer was not time barred, on the basis that no Section 11 class in that case was certified in 2004. The issuers joined in that motion on behalf of the focus case issuer by letter to the District Court on April 10, 2008.
In December 2007, the issuers filed their oppositions to class certification in the focus cases. In March 2008, plaintiffs filed their reply brief in further support of class certification. The underwriters and issuers submitted sur-replies in further opposition to class certification on April 22, 2008, addressing issues related to the deposition of the plaintiffs’ expert.
As set forth in Plaintiffs’ Motion For Preliminary Approval of the Settlement and accompanying documents, which were filed on April 2, 2009, after eight years of litigation all parties to the IPO Cases have agreed to settle the actions on a global basis. Pursuant to the settlement, the defendants have agreed to pay $586 million in total to settle all 309 IPO Cases, including the GigaMedia action. The agreement to settle was reached after a lengthy mediation followed by months of negotiation to reach agreement on the details. As to our Company’s portion of the settlement payment, our insurance companies are paying the settlement amount, which means the Company will not have to pay anything out of pocket for the settlement.
Neither we, nor our Company’s legal counsel, are able to assess the probability of the outcome of our Company’s settlement in relation to the class action lawsuit filed in the U.S. District Court against our Company in 2001, nor can we determine the probability of an unfavorable outcome or the amount or range of potential loss, if any. However, in February 2009, liaison counsel for plaintiffs informed the court that a settlement agreement had been reached pursuant to formal approval by all parties. The motion for preliminary approval of the settlement is now pending before the District Court. It is not known whether the District Court will approve the settlement.
F-81
GIGAMEDIA LIMITED
NOTES TO THE CONSOLIDATED FINANCIAL STATEMENTS — (Continued)
YEARS ENDED DECEMBER 31, 2006, 2007 AND 2008
We had an insurance policy with American Insurance Group with $10 million of liability coverage when the class action lawsuit was made. We believe that the insurance coverage is sufficient to cover the liability arising from the settlement and claim.
Patent Litigation
In July 2006, Hoshin GigaMedia obtained a patent in Taiwan (Patent No. I258284), which entitles us to use the method of “Point to Point Protocol over Ethernet” to distribute fixed internet protocol addresses to our ADSL users (the “PPPoE Patent”).
Two major Taiwanese Internet access service providers, Taiwan Fixed Network Co., Ltd. (“TFN”) and Chunghwa Telecom Co., Ltd. (“CHT”), are using the PPPoE method to distribute fixed Internet protocol addresses to their ADSL users, which we believe infringes our PPPoE Patent. In April and May 2008, we filed lawsuits in Taipei District Court against TFN and CHT for infringement of our PPPoE Patent and claimed damages amounting to approximately $1.5 million and $15.4 million, respectively.
Both TFN and CHT have submitted their defenses and the court procedures are proceeding. As the litigation is still under investigation by the Court, neither we, nor our legal counsel, are able to assess the likelihood of the outcome.
In addition, TFN and CHT filed patent invalidation applications with the Intellectual Property Office, Ministry Economic Affairs, R.O.C. to invalidate the PPPoE Patent against Hoshin GigaMedia in July 2008 and January 2009 respectively. The patent invalidation applications are still at an early stage, we are not able to assess the likelihood of the outcome, nor can we provide a timeline for the eventual resolutions.
F-82
GIGAMEDIA LIMITED
NOTES TO THE CONSOLIDATED FINANCIAL STATEMENTS — (Continued)
YEARS ENDED DECEMBER 31, 2006, 2007 AND 2008
NOTE 27.SEGMENT INFORMATION
Segment data
Subsequent to the sale of Internet access and service business in 2008, we realigned our reportable business segments. The corresponding segment profit or loss information for 2006 and 2007 has been restated to conform to the current year presentation. All income (loss) related to our Internet access and service business has been excluded from the reconciliation of our segment totals to the GigaMedia consolidated totals.
In compliance with FAS 131, “Disclosures about Segments of an Enterprise and Related Information”, we have identified two reportable segments: a gaming software and service business segment and an online game and service business segment. The gaming software and service business segment mainly derives its revenues from developing and licensing online games of chance and skill. The online game and service business segment mainly derives its revenues from recognizing the usage of game playing time or in-game items by the end-users.
Our management relies on an internal management reporting process that provides revenue and segment information for making financial decisions and allocating resources. The results are based on our method of internal reporting and are not necessarily in conformity with GAAP. Management measures the performance of each segment based on several metrics, including revenues and income or loss from operations.
F-83
GIGAMEDIA LIMITED
NOTES TO THE CONSOLIDATED FINANCIAL STATEMENTS — (Continued)
YEARS ENDED DECEMBER 31, 2006, 2007 AND 2008
Financial information for each reportable segment was as follows as of and for the years ended December 31, 2006, 2007, and 2008:
| | | | | | | | | | | | | |
| | | Gaming | | | | | | | |
| | | software and | | | Online game | | | | |
| (in US$ thousands) | | service | | | and service | | | Total | |
2006: | | | | | | | | | | | | |
| | | | | | | | | | | | | |
Segment profit or loss: | | | | | | | | | | | | |
| Net revenue from external customers | | $ | 55,019 | | | $ | 18,692 | | | $ | 73,711 | |
| | | | | | | | | | |
| Income from operations | | $ | 16,772 | | | $ | 5,618 | | | $ | 22,390 | |
| | | | | | | | | | |
| Share-based compensation | | $ | 82 | | | $ | 101 | | | $ | 183 | |
| | | | | | | | | | |
| Interest income | | $ | 212 | | | $ | 20 | | | $ | 232 | |
| | | | | | | | | | |
| Interest expense | | $ | — | | | $ | 1 | | | $ | 1 | |
| | | | | | | | | | |
| Gains on sales of marketable securities | | $ | — | | | $ | 4 | | | $ | 4 | |
| | | | | | | | | | |
| Foreign exchange loss | | $ | 27 | | | $ | 1 | | | $ | 28 | |
| | | | | | | | | | |
| Depreciation | | $ | 517 | | | $ | 250 | | | $ | 767 | |
| | | | | | | | | | |
| Amortization, including intangible assets | | $ | 1,292 | | | $ | 1,423 | | | $ | 2,715 | |
| | | | | | | | | | |
| Income tax expense | | $ | 415 | | | $ | 108 | | | $ | 523 | |
| | | | | | | | | | |
| |
Segment assets: | | | | | | | | | | | | |
| Additions to property, plant and equipment | | $ | 1,701 | | | $ | 738 | | | $ | 2,439 | |
| | | | | | | | | | |
| Additions to intangible assets | | $ | 1,172 | | | $ | 21,359 | | | $ | 22,531 | |
| | | | | | | | | | |
| Additions to goodwill | | $ | — | | | $ | 26,409 | | | $ | 26,409 | |
| | | | | | | | | | |
| Total assets | | $ | 56,850 | | | $ | 54,457 | | | $ | 111,307 | |
| | | | | | | | | | |
The reconciliation of the segment information to GigaMedia’s consolidated information was not included in the above table, as it is provided below in detail.
F-84
GIGAMEDIA LIMITED
NOTES TO THE CONSOLIDATED FINANCIAL STATEMENTS — (Continued)
YEARS ENDED DECEMBER 31, 2006, 2007 AND 2008
| | | | | | | | | | | | | |
| | | Gaming | | | | | | | |
| | | software and | | | Online game | | | | |
| (in US$ thousands) | | service | | | and service | | | Total | |
2007: | | | | | | | | | | | | |
Segment profit or loss: | | | | | | | | | | | | |
| | | | | | | | | | | | | |
| Net revenue from external customers | | $ | 118,950 | | | $ | 32,764 | | | $ | 151,714 | |
| | | | | | | | | | |
| Income from operations | | $ | 37,703 | | | $ | 6,844 | | | $ | 44,547 | |
| | | | | | | | | | |
| Share-based compensation | | $ | 548 | | | $ | 373 | | | $ | 921 | |
| | | | | | | | | | |
| Interest income | | $ | 871 | | | $ | 194 | | | $ | 1,065 | |
| | | | | | | | | | |
| Interest expense | | $ | 1 | | | $ | — | | | $ | 1 | |
| | | | | | | | | | |
| Loss on sales of marketable securities | | $ | — | | | $ | 104 | | | $ | 104 | |
| | | | | | | | | | |
| Foreign exchange loss | | $ | 486 | | | $ | 195 | | | $ | 681 | |
| | | | | | | | | | |
| Loss on equity method investments | | $ | — | | | $ | 369 | | | $ | 369 | |
| | | | | | | | | | |
| Depreciation | | $ | 1,060 | | | $ | 589 | | | $ | 1,649 | |
| | | | | | | | | | |
| Amortization, including intangible assets | | $ | 1,271 | | | $ | 1,852 | | | $ | 3,123 | |
| | | | | | | | | | |
| Income tax expense | | $ | 229 | | | $ | 172 | | | $ | 401 | |
| | | | | | | | | | |
| | | | | | | | | | | | | |
Segment assets: | | | | | | | | | | | | |
| Equity method investments | | $ | — | | | $ | 2,762 | | | $ | 2,762 | |
| | | | | | | | | | |
| Additions to property, plant and equipment | | $ | 2,280 | | | $ | 2,575 | | | $ | 4,855 | |
| | | | | | | | | | |
| Additions to intangible assets | | $ | 2,070 | | | $ | 3,575 | | | $ | 5,645 | |
| | | | | | | | | | |
| Additions to goodwill | | $ | — | | | $ | 29,354 | | | $ | 29,354 | |
| | | | | | | | | | |
| Total assets | | $ | 93,144 | | | $ | 92,597 | | | $ | 185,741 | |
| | | | | | | | | | |
The reconciliation of the segment information to GigaMedia’s consolidated information was not included in the above table, as it is provided below in detail.
F-85
GIGAMEDIA LIMITED
NOTES TO THE CONSOLIDATED FINANCIAL STATEMENTS — (Continued)
YEARS ENDED DECEMBER 31, 2006, 2007 AND 2008
| | | | | | | | | | | | | |
| | | Gaming | | | | | | | |
| | | software and | | | Online game | | | | |
| (in US$ thousands) | | | service | | and service | | | Total | |
2008: | | | | | | | | | | | | |
| | | | | | | | | | | | | |
Segment profit or loss: | | | | | | | | | | | | |
| Net revenue from external customers | | $ | 144,765 | | | $ | 45,604 | | | $ | 190,369 | |
| | | | | | | | | | |
| Income from operations | | $ | 36,360 | | | $ | 7,998 | | | $ | 44,358 | |
| | | | | | | | | | |
| Share-based compensation | | $ | 1,249 | | | $ | 547 | | | $ | 1,796 | |
| | | | | | | | | | |
| Impairment loss on prepaid licensing fees and intangible assets | | $ | — | | | $ | 1,524 | | | $ | 1,524 | |
| | | | | | | | | | |
| Interest income | | $ | 680 | | | $ | 367 | | | $ | 1,047 | |
| | | | | | | | | | |
| Interest expense | | $ | 7 | | | $ | — | | | $ | 7 | |
| | | | | | | | | | |
| Gains on sales of marketable securities | | $ | — | | | $ | 4 | | | $ | 4 | |
| | | | | | | | | | |
| Foreign exchange gain (loss) | | $ | 269 | | | $ | (124 | ) | | $ | 145 | |
| | | | | | | | | | |
| Loss on equity method investments | | $ | — | | | $ | 3,010 | | | $ | 3,010 | |
| | | | | | | | | | |
| Depreciation | | $ | 2,064 | | | $ | 1,080 | | | $ | 3,144 | |
| | | | | | | | | | |
| Amortization, including intangible assets | | $ | 1,704 | | | $ | 2,549 | | | $ | 4,253 | |
| | | | | | | | | | |
| Income tax expense | | $ | 743 | | | $ | 326 | | | $ | 1,069 | |
| | | | | | | | | | |
| | | | | | | | | | | | | |
Segment assets: | | | | | | | | | | | | |
| Equity method investments | | $ | — | | | $ | 75 | | | $ | 75 | |
| | | | | | | | | | |
| Additions to property, plant and equipment | | $ | 6,095 | | | $ | 1,585 | | | $ | 7,680 | |
| | | | | | | | | | |
| Additions to intangible assets | | $ | 3,953 | | | $ | 3,383 | | | $ | 7,336 | |
| | | | | | | | | | |
| Additions to goodwill | | $ | — | | | $ | 2,249 | | | $ | 2,249 | |
| | | | | | | | | | |
| Total assets | | $ | 132,631 | | | $ | 130,327 | | | $ | 262,958 | |
| | | | | | | | | | |
The reconciliation of the segment information to GigaMedia’s consolidated information was not included in the above table, as it is provided below in detail.
F-86
GIGAMEDIA LIMITED
NOTES TO THE CONSOLIDATED FINANCIAL STATEMENTS — (Continued)
YEARS ENDED DECEMBER 31, 2006, 2007 AND 2008
The reconciliations of segment information to GigaMedia’s consolidated totals are as follows:
| | | | | | | | | | | | | |
| (in US$ thousands) | | 2006 | | | 2007 | | | 2008 | |
Income (loss) from operations: | | | | | | | | | | | | |
| Total segments | | $ | 22,390 | | | $ | 44,547 | | | $ | 44,358 | |
| Adjustment* | | | (4,611 | ) | | | (7,127 | ) | | | (6,255 | ) |
| | | | | | | | | | |
| Total GigaMedia consolidated | | $ | 17,779 | | | $ | 37,420 | | | $ | 38,103 | |
| | | | | | | | | | |
| | | | | | | | | | | | | |
Share-based compensation | | | | | | | | | | | | |
| Total segments | | $ | 183 | | | $ | 921 | | | $ | 1,796 | |
| Adjustment* | | | 42 | | | | 913 | | | | 909 | |
| | | | | | | | | | |
| Total GigaMedia consolidated | | $ | 225 | | | $ | 1,834 | | | $ | 2,705 | |
| | | | | | | | | | |
| | | | | | | | | | | | | |
Interest income: | | | | | | | | | | | | |
| Total segments | | $ | 232 | | | $ | 1,065 | | | $ | 1,047 | |
| Adjustment* | | | 484 | | | | 369 | | | | 413 | |
| | | | | | | | | | |
| Total GigaMedia consolidated | | $ | 716 | | | $ | 1,434 | | | $ | 1,460 | |
| | | | | | | | | | |
| | | | | | | | | | | | | |
Interest expense: | | | | | | | | | | | | |
| Total segments | | $ | 1 | | | $ | 1 | | | $ | 7 | |
| Adjustment* | | | 427 | | | | 546 | | | | 969 | |
| | | | | | | | | | |
| Total GigaMedia consolidated | | $ | 428 | | | $ | 547 | | | $ | 976 | |
| | | | | | | | | | |
| | | | | | | | | | | | | |
Gain (loss) on sales of marketable securities: | | | | | | | | | | | | |
| Total segments | | $ | 4 | | | $ | (104 | ) | | $ | 4 | |
| Adjustments* | | | 66 | | | | 288 | | | | 369 | |
| | | | | | | | | | |
| Total GigaMedia consolidated | | $ | 70 | | | $ | 184 | | | $ | 373 | |
| | | | | | | | | | |
| | | | | | | | | | | | | |
Foreign exchange gain (loss): | | | | | | | | | | | | |
| Total segments | | $ | (28 | ) | | $ | (681 | ) | | $ | 145 | |
| Adjustments* | | | (94 | ) | | | 2 | | | | 95 | |
| | | | | | | | | | |
| Total GigaMedia consolidated | | $ | (122 | ) | | $ | (679 | ) | | $ | 240 | |
| | | | | | | | | | |
| | | | | | | | | | | | | |
Depreciation: | | | | | | | | | | | | |
| Total segments | | $ | 767 | | | $ | 1,649 | | | $ | 3,144 | |
| Adjustments* | | | — | | | | — | | | | 177 | |
| | | | | | | | | | |
| Total GigaMedia consolidated | | $ | 767 | | | $ | 1,649 | | | $ | 3,321 | |
| | | | | | | | | | |
| | | | | | | | | | | | | |
Amortization: | | | | | | | | | | | | |
| Total segments | | $ | 2,715 | | | $ | 3,123 | | | $ | 4,253 | |
| Adjustments* | | | 16 | | | | 26 | | | | 34 | |
| | | | | | | | | | |
| Total GigaMedia consolidated | | $ | 2,731 | | | $ | 3,149 | | | $ | 4,287 | |
| | | | | | | | | | |
| | | | | | | | | | | | | |
Income tax expense: | | | | | | | | | | | | |
| Total segments | | $ | 523 | | | $ | 401 | | | $ | 1,069 | |
| Adjustments* | | | — | | | | — | | | | — | |
| | | | | | | | | | |
| Total GigaMedia consolidated | | $ | 523 | | | $ | 401 | | | $ | 1,069 | |
| | | | | | | | | | |
F-87
GIGAMEDIA LIMITED
NOTES TO THE CONSOLIDATED FINANCIAL STATEMENTS — (Continued)
YEARS ENDED DECEMBER 31, 2006, 2007 AND 2008
| | | | | | | | | | | | | |
| (in US$ thousands) | | 2006 | | | 2007 | | | 2008 | |
Equity method investment: | | | | | | | | | | | | |
| Total segments | | $ | — | | | $ | 2,762 | | | $ | 75 | |
| Adjustments** | | | — | | | | — | | | | — | |
| | | | | | | | | | |
| Total GigaMedia consolidated | | $ | — | | | $ | 2,762 | | | $ | 75 | |
| | | | | | | | | | |
| | | | | | | | | | | | | |
Additions to property, plant and equipment: | | | | | | | | | | | | |
| Total segments | | $ | 2,439 | | | $ | 4,855 | | | $ | 7,680 | |
| Adjustments** | | | 750 | | | | 1,392 | | | | 1,134 | |
| | | | | | | | | | |
| Total GigaMedia consolidated | | $ | 3,189 | | | $ | 6,247 | | | $ | 8,814 | |
| | | | | | | | | | |
| | | | | | | | | | | | | |
Additions to intangible assets: | | | | | | | | | | | | |
| Total segments | | $ | 22,531 | | | $ | 5,645 | | | $ | 7,336 | |
| Adjustments** | | | 301 | | | | 1,088 | | | | 309 | |
| | | | | | | | | | |
| Total GigaMedia consolidated | | $ | 22,832 | | | $ | 6,733 | | | $ | 7,645 | |
| | | | | | | | | | |
| | | | | | | | | | | | | |
Additions to goodwill: | | | | | | | | | | | | |
| Total segments | | $ | 26,409 | | | $ | 29,354 | | | $ | 2,249 | |
| Adjustments** | | | — | | | | — | | | | — | |
| | | | | | | | | | |
| Total GigaMedia consolidated | | $ | 26,409 | | | $ | 29,354 | | | $ | 2,249 | |
| | | | | | | | | | |
| | | | | | | | | | | | | |
Total assets: | | | | | | | | | | | | |
| Total segments | | $ | 111,307 | | | $ | 185,741 | | | $ | 262,958 | |
| Adjustment** | | | 71,312 | | | | 98,124 | | | | 53,835 | |
| | | | | | | | | | |
| Total GigaMedia consolidated | | $ | 182,619 | | | $ | 283,865 | | | $ | 316,793 | |
| | | | | | | | | | |
| | | |
| * | | Adjustment items include corporate and certain back-office costs and expenses not attributable to any specific segment. |
| |
| ** | | Adjustment items include total corporate assets, the Internet access and service business segment and eliminations. |
Major Customers
No single customer represented 10 percent or more of GigaMedia’s total net revenues in any period presented.
F-88
GIGAMEDIA LIMITED
NOTES TO THE CONSOLIDATED FINANCIAL STATEMENTS — (Continued)
YEARS ENDED DECEMBER 31, 2006, 2007 AND 2008
Geographic Information
Revenues by geographic area are attributed by country of the server location. Revenue from unaffiliated customers by geographic region is as follows:
| | | | | | | | | | | | | |
| (in US$ thousands) | | | | | | | | | |
| Geographic region/country | | 2006 | | | 2007 | | | 2008 | |
| | | | | | | | | | | | | |
| Canada | | $ | 55,019 | | | $ | 118,650 | | | $ | 144,765 | |
| Taiwan | | | 16,854 | | | | 18,388 | | | | 20,932 | |
| PRC | | | 7 | | | | 8,883 | | | | 19,652 | |
| Hong Kong | | | 1,831 | | | | 5,360 | | | | 4,964 | |
| Others | | | — | | | | 433 | | | | 56 | |
| | | | | | | | | | |
| Total | | $ | 73,711 | | | $ | 151,714 | | | $ | 190,369 | |
| | | | | | | | | | |
Net long-lived assets by geographic region are as follows:
| | | | | | | | | | | | | |
| (in US$ thousands) | | December 31, | |
| Geographic region | | 2006 | | | 2007 | | | 2008 | |
| | | | | | | | | | | | | |
| Taiwan | | $ | 8,241 | | | $ | 8,431 | | | $ | 4,118 | |
| Canada | | | 1,143 | | | | 2,053 | | | | 2,264 | |
| PRC | | | 51 | | | | 1,334 | | | | 1,734 | |
| United States | | | 632 | | | | 943 | | | | 4,642 | |
| Hong Kong | | | 31 | | | | 247 | | | | 710 | |
| | | | | | | | | | |
| Total | | $ | 10,098 | | | $ | 13,008 | | | $ | 13,468 | |
| | | | | | | | | | |
Note 28.SUBSEQUENT EVENTS
In January 2009, our Company entered into a three-year game license agreement with a third-party online game developer with respect to the licensing of an online game titled “Luna Online” in the PRC including Macau, but excluding Hong Kong and Taiwan. Under the agreement, our Company agreed to pay a fixed license fee by installments, starting from January 2009. The game license fee is payable in addition to royalties and other committed marketing expenditures.
F-89
EXHIBIT INDEX
| | | | | |
| EXHIBIT | | |
| No. | | DESCRIPTION |
| | | | | |
| | 1.1 | | | Amended Memorandum and Articles of Association of our Company, incorporated by reference to Exhibit 1.3 to our annual report for the year 2006 on Form 20-F filed with the SEC on June 29, 2007 |
| | | | | |
| | 4.1 | | | End-User License Agreement between Internet Media Licensing Limited and Ultra Internet Media, S.A., dated April 1, 2004, incorporated by reference to Exhibit 4.41 to our annual report for the year 2004 on Form 20-F filed with the SEC on June 30, 2005 |
| | | | | |
| | 4.2 | | | Second Amendment to the End-User License Agreement between Internet Media Licensing Limited and Ultra Internet Media, S.A., dated March 1, 2006, incorporated by reference to Exhibit 4.41 to our annual report for the year 2005 on Form 20-F filed with the SEC on June 28, 2006 |
| | | | | |
| | 4.3 | | | Third Amendment to the End-User License Agreement between Internet Media Licensing Limited and Ultra Internet Media, S.A., dated March 1, 2007, incorporated by reference to Exhibit 4.50 to our annual report for the year 2006 on Form 20-F filed with the SEC on June 29, 2007 |
| | | | | |
| | 4.4 | | | Fourth Amendment to the End-User License Agreement between Internet Media Licensing Limited and Ultra Internet Media, S.A., dated March 1, 2008# |
| | | | | |
| | 4.5 | | | Exclusive Business Consultancy Service Agreement between T2 Technology and T2 Entertainment, dated November 15, 2006, incorporated by reference to Exhibit 4.55 to our annual report for the year 2007 on Form 20-F filed with the SEC on June 30, 2008 |
| | | | | |
| | 4.6 | | | Supplemental Agreement to Exclusive Business Consultancy Service Agreement between T2 Technology and T2 Entertainment, dated April 1, 2007, incorporated by reference to Exhibit 4.56 to our annual report for the year 2007 on Form 20-F filed with the SEC on June 30, 2008 |
| | | | | |
| | 4.7 | | | Exclusive Technical Service and Consultancy Agreement between T2 Entertainment and T2 Technology, dated November 15, 2006, incorporated by reference to Exhibit 4.57 to our annual report for the year 2007 on Form 20-F filed with the SEC on June 30, 2008 |
| | | | | |
| | 4.8 | | | Supplemental Agreement to Exclusive Technical Service and Consultancy Agreement between T2 Entertainment and T2 Technology, dated April 1, 2007, incorporated by reference to Exhibit 4.58 to our annual report for the year 2007 on Form 20-F filed with the SEC on June 30, 2008 |
| | | | | |
| | 4.9 | | | Agreement for Pledge of Shares in T2 Entertainment between Wang Chi, Lu Ning and T2 Technology, dated February 9, 2007, incorporated by reference to Exhibit 4.59 to our annual report for the year 2007 on Form 20-F filed with the SEC on June 30, 2008 |
| | | | | |
| | 4.10 | | | Exclusive Call Option Agreement regarding T2 Entertainment between Wang Chi, Lu Ning, T2 Entertainment and T2 Technology, dated February 9, 2007, incorporated by reference to Exhibit 4.60 to our annual report for the year 2007 on Form 20-F filed with the SEC on June 30, 2008 |
| | | | | |
| | 4.11 | | | Proxy Voting Agreement regarding T2 Entertainment between T2 Technology, T2 Entertainment, Wang Chi and Lu Ning, dated February 9, 2007, incorporated by reference to Exhibit 4.61 to our annual report for the year 2007 on Form 20-F filed with the SEC on June 30, 2008 |
| | | | | |
| | 4.12 | | | Exclusive Business Consultancy Service Agreement between T2 Technology and T2 Advertisement, dated November 15, 2006, incorporated by reference to Exhibit 4.62 to our annual report for the year 2007 on Form 20-F filed with the SEC on June 30, 2008 |
| | | | | |
| | 4.13 | | | Supplemental Agreement to Exclusive Business Consultancy Service Agreement between T2 Technology and T2 Advertisement, dated January 1, 2007, incorporated by reference to Exhibit 4.63 to our annual report for the year 2007 on Form 20-F filed with the SEC on June 30, 2008 |
| | | | | |
| EXHIBIT | | |
| No. | | DESCRIPTION |
| | | | | |
| | 4.14 | | | Agreement for Pledge of Shares in T2 Advertisement between Chi Min, Chang Tao and T2 Technology, dated March 20, 2008, incorporated by reference to Exhibit 4.64 to our annual report for the year 2007 on Form 20-F filed with the SEC on June 30, 2008 |
| | | | | |
| | 4.15 | | | Exclusive Call Option Agreement regarding T2 Advertisement between Chi Min, Chang Tao, T2 Advertisement and T2 Technology, dated March 20, 2008, incorporated by reference to Exhibit 4.65 to our annual report for the year 2007 on Form 20-F filed with the SEC on June 30, 2008 |
| | | | | |
| | 4.16 | | | Proxy Voting Agreement regarding T2 Advertisement between T2 Technology, T2 Advertisement, Chi Min and Chang Tao, dated March 20, 2008, incorporated by reference to Exhibit 4.66 to our annual report for the year 2007 on Form 20-F filed with the SEC on June 30, 2008 |
| | | | | |
| | 4.17 | | | Share Purchase Agreement between William Zhu and GigaMedia China Limited, dated June 3, 2007, incorporated by reference to Exhibit 4.67 to our annual report for the year 2007 on Form 20-F filed with the SEC on June 30, 2008 |
| | | | | |
| | 4.18 | | | Share Purchase Agreement between Yu-Chia Lee and GigaMedia China Limited, dated June 6, 2007, incorporated by reference to Exhibit 4.68 to our annual report for the year 2007 on Form 20-F filed with the SEC on June 30, 2008 |
| | | | | |
| | 4.19 | | | Share Purchase Agreement between Zheng Bin and GigaMedia China Limited, dated June 10, 2007, incorporated by reference to Exhibit 4.69 to our annual report for the year 2007 on Form 20-F filed with the SEC on June 30, 2008 |
| | | | | |
| | 4.20 | | | Share Purchase Agreement between J&R Music LLC, Ya-Tsen Lin and GigaMedia China Limited, dated July 5, 2007, incorporated by reference to Exhibit 4.70 to our annual report for the year 2007 on Form 20-F filed with the SEC on June 30, 2008 |
| | | | | |
| | 4.21 | | | Share Purchase Agreement between Kingland Overseas Development Inc. and GigaMedia China Limited, dated July 6, 2007, incorporated by reference to Exhibit 4.71 to our annual report for the year 2007 on Form 20-F filed with the SEC on June 30, 2008 |
| | | | | |
| | 4.22 | | | Share Purchase Agreement between Jim Ji Wang and GigaMedia China Limited, dated July 6, 2007, incorporated by reference to Exhibit 4.72 to our annual report for the year 2007 on Form 20-F filed with the SEC on June 30, 2008 |
| | | | | |
| | 4.23 | | | Share Purchase Agreement between Marvel City Investments Limited and GigaMedia China Limited, dated May 26, 2008, incorporated by reference to Exhibit 4.73 to our annual report for the year 2007 on Form 20-F filed with the SEC on June 30, 2008 |
| | | | | |
| | 4.24 | | | Agreement for Pledge of Shares in Jinyou among Yang Zhuojun, Tan Yihui and T2 Technology, dated June 15, 2009# |
| | | | | |
| | 4.25 | | | Exclusive Call Option Agreement regarding Jinyou among Yang Zhuojun, Tan Yihui, Jinyou and T2 Technology, dated June 15, 2009# |
| | | | | |
| | 4.26 | | | Proxy Voting Agreement regarding Jinyou among T2 Technology, Jinyou, Yang Zhuojun and Tan Yihui, dated June 15, 2009# |
| | | | | |
| | 4.27 | | | Exclusive Business Consultancy Service Agreement between T2 Technology and Jinyou, dated November 26, 2007# |
| | | | | |
| | 4.28 | | | Exclusive Technical Service and Consultancy Agreement between Jinyou and T2 Technology, dated November 26, 2007# |
| | | | | |
| | 4.29 | | | Share Sale and Purchase Agreement among Champion Limited, Gigamedia International Holdings Limited and GigaMedia, dated August 28, 2008# |
| | | | | |
| | 4.30 | | | Share Sale and Purchase Agreement between China Network Systems Co., Ltd. and Hoshin GigaMedia, dated August 28, 2008# |
| | | | | |
| | 4.31 | | | Asset Sale and Purchase Agreement among Ko Ying, Hoshin GigaMedia and China Network Systems Co., Ltd., dated August 28, 2008# |
| | | | | |
| EXHIBIT | | |
| No. | | DESCRIPTION |
| | | | | |
| | 4.32 | | | Transitional Service Agreement among Ko Ying, Hoshin GigaMedia and KBT, dated September 3, 2008# |
| | | | | |
| | 4.33 | | | Assignment and Assumption Agreement between Hoshin GigaMedia and Hoshin Multimedia, dated September 3, 2008# |
| | | | | |
| | 8.1 | | | List of Subsidiaries# |
| | | | | |
| | 12.1 | | | Certification by our Chief Executive Officer pursuant to Rule 13a-14(b) of the Securities Exchange Act# |
| | | | | |
| | 12.2 | | | Certification by our Chief Financial Officer pursuant to Rule13a-14(b) of the Securities Exchange Act# |
| | | | | |
| | 13.1 | | | Certification by our Chief Executive Officer pursuant to 18 U.S.C. Section 1350 as adopted pursuant to Section 906 of the Sarbanes-Oxley Act of 2002# |
| | | | | |
| | 13.2 | | | Certification by our Chief Financial Officer pursuant to 18 U.S.C. Section 1350 as adopted pursuant to Section 906 of the Sarbanes-Oxley Act of 2002# |
| | | | | |
| | 15.1 | | | Consent of GHP Horwath, P.C., Independent Registered Public Accounting Firm# |