UNITED STATES SECURITIES AND EXCHANGE COMMISSION
WASHINGTON, D. C. 20549
FORM 20-F
ANNUAL REPORT PURSUANT TO SECTION 13 OR 15(D)
OF THE SECURITIES EXCHANGE ACT OF 1934
For the fiscal year ended December 31, 2010
Commission File Number: 000-30540
GIGAMEDIA LIMITED
(Exact name of registrant as specified in its charter)
REPUBLIC OF SINGAPORE
(Jurisdiction of incorporation or organization)
8THFLOOR, 207 TIDING BOULEVARD, SECTION 2, TAIPEI 114, TAIWAN, R.O.C.
(Address of principal executive offices)
Yichin LEE, Chief Executive Officer
8THFLOOR, 207 TIDING BOULEVARD, SECTION 2, TAIPEI 114, TAIWAN, R.O.C.
Tel: 886-2-2656-8000; Fax: 886-2-2656-8003
Securities registered or to be registered pursuant to Section 12(b) of the Exchange Act:
| | | |
| Title of Each Class | | Name of Each Exchange on Which Registered |
| Ordinary Shares | | The NASDAQ Stock Market LLC |
Securities registered or to be registered pursuant to Section 12(g) of the Exchange Act:
None
Securities for which there is a reporting obligation pursuant to Section 15(d) of the Act:
None
Indicate the number of outstanding shares of each of the issuer’s classes of capital or common stock as of the close of the period covered by the annual report:
56,262,575 ordinary shares
Indicate by check mark if the registrant is a well-known seasoned issuer, as defined in Rule 405 of the Securities Act. Yeso Noþ
If this annual report is an annual or transition report, indicate by check mark if the registrant is not required to file reports pursuant to Section 13 or 15(d) of the Securities Exchange Act of 1934. Yeso Noþ
Note — Checking the box above will not relieve any registrant required to file reports pursuant to Section 13 or 15(d) of the Securities Exchange Act of 1934 from their obligations under those Sections.
Indicate by check mark whether the registrant has submitted electronically and posted on its corporate Web site, if any, every Interactive Data File required to be submitted and posted pursuant to Rule 405 of Regulation S–T (§ 232.405 of this chapter) during the preceding 12 months (or for such shorter period that the registrant was required to submit and post such files). Yesþ Noo
Indicate by check mark whether the registrant (1) has filed all reports required to be filed by Section 13 or 15(d) of the Securities Exchange Act of 1934 during the preceding 12 months (or for such shorter period that the registrant was required to file such reports), and (2) has been subject to such filing requirements for the past 90 days. Yesþ Noo
Indicate by check mark whether the registrant is a large accelerated filer, an accelerated filer, or a non-accelerated filer. See definition of “accelerated filer and large accelerated filer” in Rule 12b-2 of the Exchange Act. (Check one):
| | | | | |
|
| Large accelerated filero | | Accelerated filerþ | | Non-accelerated filero |
Indicate by check mark which basis of accounting the registrant has used to prepare the financial statements included in this filing:
| | | | | |
|
| U.S. GAAPþ | | International Financial Reporting Standards as issued by the International Accounting Standards Boardo | | Othero |
If “Other” has been checked in response to the previous question, indicate by check mark which financial statement item the registrant has elected to follow.o Item 17o Item 18
If this is an annual report, indicate by check mark whether the registrant is a shell company (as defined in Rule 12b-2 of the Exchange Act). Yeso Noþ
CERTAIN TERMS AND CONVENTSIONS
In this annual report, all references to (i) “we,” “us,” “our,” “our Company” or “GigaMedia” are to GigaMedia Limited and, unless the context requires otherwise, its subsidiaries, or where the context refers to any time prior to the incorporation of any of its subsidiaries, the business which predecessors of the present subsidiaries were engaged in and which were subsequently assumed by such subsidiaries; (ii) “Shares” are to ordinary shares of our Company; (iii) “CESL” are to Cambridge Entertainment Software Limited (formerly known as Grand Virtual International Limited), a company incorporated under the laws of The British Virgin Islands; (iv) “Hoshin GigaMedia” are to Hoshin GigaMedia Center Inc., a company incorporated under the laws of Taiwan, Republic of China, (“Taiwan” or “R.O.C.”); (v) “FunTown” are to our Asian online game and service business operated through our two operating subsidiaries, Hoshin GigaMedia and FunTown World Limited, a company incorporated under the laws of The British Virgin Islands; (vi) “T2CN” are to T2CN Holding Limited, a company incorporated under the laws of The British Virgin Islands, and T2CN Operating Entities; (vii) “T2CN Operating Entities” are to T2CN Holding Limited’s two wholly owned subsidiaries, T2CN Information Technology (Shanghai) Co., Ltd. (“T2 Technology”) and J-Town Information (Shanghai) Co., Ltd. (“J-Town”), and three variable interest entities, Shanghai T2 Entertainment Co., Ltd. (“T2 Entertainment”), Shanghai T2 Advertisement Co., Ltd. (“T2 Advertisement”) and Shanghai Jinyou Network & Technology Co., Ltd. (“Jinyou”)); (viii) “Internet access and service business” are to an Internet access and service business that we historically operated through Koos Broadband Telecom Co., Ltd. (“KBT”) and completely disposed of in September 2008; and (ix) “UIM” are to Ultra Internet Media S.A., a company incorporated under the laws of Nevis; (ixi) “Everest Gaming” are to Mangas Everest S.A.S, a société par actions simplifiée registered with the Trade and Companies Registry of Paris and organized under the laws of France; (ixii) “BetClic” are to BetClic Everest Group, formerly named as Mangas Gaming S.A.S, a company organized under the laws of France. BetClic, owned equally by Lov Group and La Société des Bains de Mer, is one of the leaders in the online gaming industry and has a unique portfolio comprising four diverse and complementary international brands, Everest Gaming, BetClic, bet-at-home.com and Expekt; (ixiii) “IAHGames” are to Infocomm Asia Holdings Pte. Ltd., an online game operator, publisher and distributor in Southeast Asia and incorporated under the laws of the Republic of Singapore; (ixiv) “Monsoon” are to Monsoon Online Pte. Ltd., a company incorporated under the laws of the Republic of Singapore and wholly owned by IAHGames; (ixv) “JIDI” are to JIDI Network Technology (Shanghai) Co., Ltd., our wholly owned subsidiary incorporated under the laws of the PRC; and (ixvi) “Shanghai JIDI” are to Shanghai JIDI Network Technology Co., Ltd., a company incorporated under the laws of the PRC.
For the purpose of this annual report only, geographical references to “China” and the “PRC” are to the People’s Republic of China and do not include Taiwan, the Hong Kong Special Administrative Region (“Hong Kong”) and the Macau Special Administrative Region (“Macau”). Except if the context otherwise requires and for the purposes of this annual report only, references to “Greater China” include the PRC, Taiwan, Hong Kong and Macau. References to “South Korea” are to the Republic of Korea.
All references in this annual report to “U.S. dollar,” “$” and “US$” are to the legal currency of the United States; all references to “NT dollar” or “New Taiwan dollar” are to the legal currency of Taiwan; all references to “RMB,” “Rmb” or “Renminbi” are to the legal currency of the PRC; all references to “Hong Kong dollar” are to the legal currency of Hong Kong and all references to “Singapore dollar” and “S$” are to the legal currency of the Republic of Singapore.
We have approximated certain numbers in this annual report to their closest round numbers or a given number of decimal places. Due to rounding, figures shown as totals in tables may not be arithmetic aggregations of the figures preceding them.
DISCLOSURE REGARDING FORWARD-LOOKING STATEMENTS
This annual report includes “forward-looking statements” within the meaning of, and intended to qualify for the safe harbor from liability established by, the United States Private Securities Litigation Reform Act of 1995. These statements, which are not statements of historical fact, may contain estimates, assumptions, projections and/or expectations regarding future events, which may or may not occur. These statements involve known and unknown risks, uncertainties and other factors which may cause our actual results, performance or achievements to be materially different from any future results, performance or achievements expressed or implied by the forward-looking statements. Some of the risks are listed under Item 3, “Key Information — D. Risk Factors” and elsewhere in this annual report. In some cases, you can identify these forward-looking statements by words such as “anticipate,” “believe,” “could,” “estimate,” “expect,” “intend,” “may,” “plan,” “potential,” “should,” “will,” “would,” or similar expressions, including their negatives. These forward-looking statements include, without limitation, statements relating to:
| | • | | our business plan and strategies; |
| | • | | our future business development and potential financial condition, results of operations and other projected financial information; |
| | • | | our ability to manage current and potential future growth; |
| | • | | expected continued acceptance of our revenue model; |
1
| | • | | our plans for strategic partnerships, licenses and alliances; |
| | • | | our acquisition and strategic investment strategy, and ability to successfully integrate any past, current, or future acquisitions into our operations; |
| | • | | our ability to protect our intellectual property rights and the security of our customers’ information; |
| | • | | the launch of new online games according to our timetable; |
| | • | | expected continued acceptance of our online games, including expected growth of the online games industry, and consumer preferences for our products and services; |
| | • | | the in-house development of new online games and our plans to expand our in-house online game development team; |
| | • | | the performance of Everest Gaming and developments in the online gaming industry; |
| | • | | our plans to license additional games from third parties, and the launch of these new games or gaming software systems, including the timing of any such development, licenses or launches, in various geographic markets; |
| | • | | our ability to maintain and strengthen our position as one of the largest online MahJong operators in Taiwan; |
| | • | | the potential entry of new competitors in any of our business lines; |
| | • | | changes in the global regulatory environment relating to the online gaming business; |
| | • | | changes or stability in certain regulatory environments relating to Everest Gaming’s operations or gaming licenses; |
| | • | | changes in PRC laws and regulations, and future enforcement of those laws and regulations, including laws and regulations relating to Internet usage, advertising over the Internet, Internet content providers, foreign investment and ownership in online business, distribution of dividends and foreign exchange controls; |
| | • | | the outcome of ongoing, or any future, litigation or arbitration; and |
| | • | | our corporate classification by various governmental entities. |
These forward-looking statements are based on our own information and on information from other sources we believe to be reliable. Our actual results may differ materially from those expressed or implied by these forward-looking statements as a result of risk factors and other factors noted throughout this annual report, including those described under Item 3, “Key Information — D. Risk Factors” and those detailed from time to time in other filings with the U.S. Securities and Exchange Commission (the “SEC”). We do not guarantee that the transactions and events described in this annual report will happen as described or that they will happen at all. We undertake no obligation to update or revise any forward-looking statements to reflect events or circumstances after the date of this annual report or to reflect the occurrence of unanticipated events. Whether actual results will conform to our expectations and predictions is subject to a number of risks and uncertainties, many of which are beyond our control, and reflect future business decisions that are subject to change. Given this level of uncertainty, you are advised not to place undue reliance on such forward-looking statements.
PART I
| | |
| ITEM 1. | | IDENTITY OF DIRECTORS, SENIOR MANAGEMENT AND ADVISERS |
Not applicable, but see Item 6, “Directors, Senior Management and Employees — A. Directors and Senior Management” in this annual report.
| | |
| ITEM 2. | | OFFER STATISTICS AND EXPECTED TIMETABLE |
Not applicable.
2
Exchange Rates
Assets and liabilities on our balance sheet denominated in non-U.S. dollars are translated into U.S. dollars using year-end exchange rates. Income and expense items in our statement of operations denominated in non-U.S. dollars are translated into U.S. dollars using weighted-average exchange rates. Certain other operating financial information denominated in non-U.S. dollars, not included in our consolidated financial statements and provided in this annual report, are translated using weighted-average exchange rates. For convenience, transactions in 2011 denominated in non-U.S. dollars have been translated into U.S. dollars using the year-end exchange rate for 2010. We make no representation that the non-U.S. dollars could be converted to U.S. dollars at such rate or any particular rates.
A. Selected Financial Data
The following selected consolidated balance sheet data as of December 31, 2009 and 2010 and the selected consolidated statement of operations data for the years ended December 31, 2008, 2009 and 2010 have been derived from our audited consolidated financial statements included in Item 18 in this annual report. The selected consolidated balance sheet data as of December 31, 2006, 2007 and 2008, and the selected consolidated statement of operations data for the years ended December 31, 2006 and 2007 have been derived from our audited consolidated financial statements for the years ended December 31, 2006, 2007 and 2008, which are not included in this annual report. The consolidated financial statements have been prepared and presented in accordance with generally accepted accounting principles in the United States, or U.S. GAAP. You should read the following selected consolidated financial data in conjunction with Item 5, “Operating and Financial Review and Prospects,” and the consolidated financial statements and the accompanying notes to those statements included in this annual report. The statements of operations for the years ended December 31, 2006, 2007, and 2008 have been restated to reflect the results of our Internet access and service business, which was sold in September 2008, as discontinued operations. Certain prior-year amounts have been reclassified to conform to the current-year presentation. These reclassifications had no effect on the results of operations or shareholders’ equity as previously reported.
For the Years Ended December 31,
(in thousands except for earnings per share amounts)
| | | | | | | | | | | | | | | | | | | | | |
| | | 2006 | | | 2007 | | | 2008 | | | 2009 | | | 2010 | |
| | | US$ | | | US$ | | | US$ | | | US$ | | | US$ | |
| STATEMENT OF OPERATIONS DATA: | | | | | | | | | | | | | | | | | | | | |
| OPERATING REVENUES | | | | | | | | | | | | | | | | | | | | |
| Gaming software and service revenues | | | 55,019 | | | | 118,950 | | | | 144,765 | | | | 112,694 | | | | 25,820 | |
| Asian online game and service revenues | | | 18,692 | | | | 32,764 | | | | 45,604 | | | | 46,887 | | | | 38,862 | |
| | | | | | | | | | | | | | | | |
| Total operating revenues | | | 73,711 | | | | 151,714 | | | | 190,369 | | | | 159,581 | | | | 64,682 | |
| | | | | | | | | | | | | | | | |
| | | | | | | | | | | | | | | | | | | | | |
| OPERATING COSTS | | | | | | | | | | | | | | | | | | | | |
| Cost of gaming software and service revenues | | | (7,824 | ) | | | (16,201 | ) | | | (22,770 | ) | | | (20,102 | ) | | | (4,010 | ) |
| Cost of Asian online game and service revenues | | | (3,667 | ) | | | (9,118 | ) | | | (12,404 | ) | | | (16,785 | ) | | | (17,103 | ) |
| | | | | | | | | | | | | | | | |
| Total operating costs | | | (11,491 | ) | | | (25,319 | ) | | | (35,174 | ) | | | (36,887 | ) | | | (21,113 | ) |
| | | | | | | | | | | | | | | | |
| GROSS PROFIT | | | 62,220 | | | | 126,395 | | | | 155,195 | | | | 122,694 | | | | 43,569 | |
| | | | | | | | | | | | | | | | |
| | | | | | | | | | | | | | | | | | | | | |
| OPERATING EXPENSES | | | | | | | | | | | | | | | | | | | | |
| Product development and engineering expenses | | | (5,244 | ) | | | (7,338 | ) | | | (13,455 | ) | | | (14,195 | ) | | | (7,301 | ) |
| Selling and marketing expenses | | | (27,653 | ) | | | (60,106 | ) | | | (74,173 | ) | | | (79,421 | ) | | | (21,589 | ) |
| General and administrative expenses | | | (11,096 | ) | | | (20,983 | ) | | | (25,035 | ) | | | (29,692 | ) | | | (31,780 | ) |
| Bad debt expenses | | | (448 | ) | | | (548 | ) | | | (2,905 | ) | | | (1,092 | ) | | | (1,639 | ) |
| Impairment loss on property, plant, and equipment | | | 0 | | | | 0 | | | | 0 | | | | (1,250 | ) | | | (278 | ) |
| Impairment loss on goodwill | | | 0 | | | | 0 | | | | 0 | | | | (14,103 | ) | | | (2,255 | ) |
| Impairment loss on prepaid licensing fees and intangible assets | | | 0 | | | | 0 | | | | (1,524 | ) | | | (23,002 | ) | | | (2,200 | ) |
| Impairment loss on deconsolidation of T2CN | | | 0 | | | | 0 | | | | 0 | | | | 0 | | | | (22,234 | ) |
| Other | | | 0 | | | | 0 | | | | 0 | | | | 0 | | | | (1,989 | ) |
| | | | | | | | | | | | | | | | |
| Total operating expenses | | | (44,441 | ) | | | (88,975 | ) | | | (117,092 | ) | | | (162,755 | ) | | | (91,265 | ) |
| | | | | | | | | | | | | | | | |
| Income (loss) from operations | | | 17,779 | | | | 37,420 | | | | 38,103 | | | | (40,061 | ) | | | (47,696 | ) |
| | | | | | | | | | | | | | | | |
| Income (loss) from continuing operations | | | 18,173 | | | | 39,083 | | | | 35,710 | | | | (56,102 | ) | | | 1,408 | |
| | | | | | | | | | | | | | | | |
| Income (loss) from discontinued operations | | | 12,932 | | | | 1,088 | | | | 9,435 | | | | 222 | | | | (128 | ) |
| | | | | | | | | | | | | | | | |
| Net income (loss) | | | 31,105 | | | | 40,171 | | | | 45,145 | | | | (55,880 | ) | | | 1,280 | |
3
| | | | | | | | | | | | | | | | | | | | | |
| | | 2006 | | | 2007 | | | 2008 | | | 2009 | | | 2010 | |
| | | US$ | | | US$ | | | US$ | | | US$ | | | US$ | |
| Less: Net (income) loss attributable to the noncontrolling interest and subsidiary preferred shares | | | (321 | ) | | | (1,281 | ) | | | (757 | ) | | | 6,795 | | | | 1,370 | |
| | | | | | | | | | | | | | | | |
| Net income (loss) attributable to GigaMedia | | | 30,784 | | | | 38,890 | | | | 44,388 | | | | (49,085 | ) | | | 2,650 | |
| | | | | | | | | | | | | | | | |
| | | | | | | | | | | | | | | | | | | | | |
| Earnings (loss) per share (in dollars): | | | | | | | | | | | | | | | | | | | | |
| Basic: | | | | | | | | | | | | | | | | | | | | |
| Income (loss) from continuing operations | | | 0.35 | | | | 0.72 | | | | 0.65 | | | | (0.90 | ) | | | 0.05 | |
| Income (loss) from discontinued operations | | | 0.25 | | | | 0.02 | | | | 0.17 | | | | 0.00 | | | | 0.00 | |
| | | | | | | | | | | | | | | | |
| Net income (loss) | | | 0.60 | | | | 0.74 | | | | 0.82 | | | | (0.90 | ) | | | 0.05 | |
| | | | | | | | | | | | | | | | |
| Diluted: | | | | | | | | | | | | | | | | | | | | |
| Income (loss) from continuing operations | | | 0.30 | | | | 0.63 | | | | 0.58 | | | | (0.90 | ) | | | 0.04 | |
| Income (loss) from discontinued operations | | | 0.21 | | | | 0.02 | | | | 0.16 | | | | 0.00 | | | | 0.00 | |
| | | | | | | | | | | | | | | | |
| Net income (loss) | | | 0.51 | | | | 0.65 | | | | 0.74 | | | | (0.90 | ) | | | 0.04 | |
| | | | | | | | | | | | | | | | |
As of December 31,
(US dollars in thousands except for number of issued shares)
| | | | | | | | | | | | | | | | | | | | | |
| | | 2006 | | | 2007 | | | 2008 | | | 2009 | | | 2010 | |
| | | US$ | | | US$ | | | US$ | | | US$ | | | US$ | |
| BALANCE SHEET DATA: | | | | | | | | | | | | | | | | | | | | |
| Total current assets | | | 64,176 | | | | 115,417 | | | | 128,799 | | | | 104,839 | | | | 93,088 | |
| Property, plant and equipment-net | | | 10,098 | | | | 13,008 | | | | 13,468 | | | | 5,989 | | | | 5,301 | |
| Goodwill | | | 55,817 | | | | 85,149 | | | | 87,098 | | | | 44,417 | | | | 39,493 | |
| Intangible assets-net | | | 23,067 | | | | 26,060 | | | | 28,930 | | | | 18,924 | | | | 19,769 | |
| Total assets | | | 182,619 | | | | 283,865 | | | | 316,793 | | | | 260,181 | | | | 267,589 | |
| Total GigaMedia’s shareholders’ equity | | | 134,087 | | | | 180,655 | | | | 228,456 | | | | 184,745 | | | | 217,521 | |
| Common shares, no par value, and additional paid-in capital | | | 289,495 | �� | | | 296,793 | | | | 300,021 | | | | 304,379 | | | | 309,332 | |
| Number of issued shares (in thousands) | | | 51,495 | | | | 53,700 | | | | 54,365 | | | | 54,995 | | | | 56,263 | |
| Dividends declared per share (in dollars) | | | 0 | | | | 0 | | | | 0 | | | | 0 | | | | 0 | |
B. Capitalization and Indebtedness
Not applicable.
C. Reasons for the Offer and Use of Proceeds
Not applicable.
4
D. Risk Factors
Risks Related to Our Business and Industries
The limited operating history of the Everest Gaming business and our Asian online game and service business may not provide you with an adequate basis upon which to evaluate our business and prospects
We commenced our gaming software and service business operations in April 2004 and our Asian online game and service business in January 2006. We sold 60 percent interest in our gaming software business to BetClic, a leading European sports betting and online gaming group, on April 8, 2010. The strategic alliance with BetClic was structured as a stock and asset sale to a newly-formed French entity, Everest Gaming, in which we hold a 40 percent stake. Everest Gaming’s operating history as an online gambling operator and our operating history as an online games operator may be too short to give you a sufficient basis for evaluating our business and financial performance. It is also difficult to evaluate our prospective business, because we may not have sufficient experience to address the risks frequently encountered by companies entering new and rapidly evolving markets such as the online gaming and online games market. These risks include our potential failure to:
| | • | | respond to technological changes or resolve unexpected service interruptions in a timely manner; |
| | • | | adapt to regulatory changes; |
| | • | | retain existing customers or attract new customers; |
| | • | | license, develop, or acquire additional online games that are appealing to consumers; |
| | • | | anticipate and adapt to changing consumer preferences; |
| | • | | adapt to competitive market conditions; |
| | • | | adequately and efficiently operate, upgrade and develop our transaction and service platforms; and |
| | • | | maintain adequate control of our expenses. |
If we are unsuccessful in addressing any of these risks, our business and financial condition will be adversely affected. We may not be able to achieve similar results or growth in future periods. Accordingly, you should not rely on our results of operations for any prior periods as an indication of our future performance.
In operating our Asian online game and service business, we may fail to launch new games according to our timetable, and our new games may not be commercially successful
In order for our Asian online game and service business strategy to succeed over time, we will need to license, acquire or develop new online games that can generate additional revenue and further diversify our revenue sources. A number of factors, including technical difficulties, government approvals and game licenses required for launching new games, lack of sufficient game development personnel and other resources, and adverse developments in our relationship with the licensors of our new licensed games could result in delay in launching our new games. Therefore, we cannot assure you that we will be able to meet our timetable for new game launches.
In January 2009, we introduced Holic Online, an adventure-themed massively multi-player online role playing game (“MMORPG”), in Taiwan. Holic Online was not commercially successful in Taiwan. As a result, we terminated the Holic Online exclusive game license agreement in December 2010 and completely ceased the operation in March 2011. On June 25, 2009, we launched Warhammer Online: Age of Reckoning, a war-themed MMORPG, in Taiwan, Hong Kong and Macau. On July 7, 2009, we launched Luna Online, a casual fantasy-themed MMORPG in the PRC. Warhammer Online: Age of Reckoning and Luna Online were not commercially successful in the territories in which they were launched. As a result, we terminated the license agreements for these two games in April 2010 and June 2010, respectively. In addition, we have three MMORPGs and two advanced casual games non-role playing massively multiplayer online games (“non-RPG MMOs”) in the pipeline, which we expect to launch in various target markets in Greater China. There are many factors that may adversely affect the popularity of our new games. For example, we may fail to anticipate and adapt to future technical trends and new business models, fail to satisfy game player preferences and requirements, fail to effectively plan and organize marketing and promotion activities, fail to effectively detect and prevent programming errors or defects in the games, and fail to operate our new games at acceptable costs. We cannot assure you that our new games will gain market acceptance and become commercially successful. If we are not able to license, develop or acquire additional online games that are commercially successful, our future revenues and profitability may decline.
Due to increased competition among online games operators in the PRC, Taiwan and Southeast Asia, license fees for online games have increased and most licensors are demanding upfront license fees and guaranteed minimum royalty payments. If any of the new games we license from third parties fails to appeal to players, we may not be able to fully recover upfront and/or minimum royalty licensing costs, which can be significant. As a result, our results of operations and financial condition may be materially and adversely affected.
5
We may not be able to maintain a stable relationship with Blizzard, and we may experience difficulties in the operation of the online games licensed from Blizzard
Monsoon, a wholly owned subsidiary of IAHGames in which we are a controlling shareholder, entered into various agreements with Blizzard Entertainment International, a division of Coöperatie Activision Blizzard International U.A. (“Blizzard”) to distribute selected Blizzard Entertainment® games in Singapore, Malaysia, Thailand, Indonesia and the Philippines. The license and distribution agreements include bestselling games from Blizzard’s Diablo® action-role-playing-game series, Warcraft® and StarCraft® real-time strategy-game series, including StarCraft II: Wings of Liberty™, and World of Warcraft® and its three expansion sets, The Burning Crusade®, Wrath of the Lich King® and Cataclysm™. We have guaranteed to Blizzard the due and punctual observance by each of Monsoon and IAHGames of all of its respective financial obligations under various license and distribution agreements and services agreements and agreed to pay to Blizzard from time to time on demand by Blizzard all sums of money which either Monsoon and/or IAHGames is liable to pay to Blizzard under those agreements. Blizzard has the right to terminate those license and distribution agreements or services agreements under certain circumstances. See Item 4.B. “Business Overview — Asian Online Game and Service Business — Our Operating Entities — IAHGames.”
We have limited experience working with Blizzard. If we are unable to maintain a stable relationship with Blizzard, or if Blizzard either establishes similar or more favorable relationships with our competitors in violation of its contractual arrangements with us or otherwise, we may not be able to ensure smooth operation of these licensed online games, and Blizzard could terminate the license and distribution agreements and services agreements with us, which could adversely affect our business, financial condition and results of operations. Also, the benefits of our arrangements with Blizzard may take considerable time to develop, and we cannot be certain that such arrangements will produce its intended benefits. We cannot assure you that we will be able to leverage our past experience and successfully manage our expansion into Southeast Asia markets.
In addition, we cannot be certain that these licensed online games will be viewed by the applicable regulatory authorities as complying with content restrictions, will be launched or distributed as scheduled, or at all, will be attractive to game players or will be able to compete with games operated by our competitors. We may not be able to fully recover the costs associated with licensing these licensed games if these games are not popular among game players, and any difficulties in the operation or distribution of these licensed games could adversely affect our business, financial condition and results of operations.
Due to our ongoing dispute with the former chief executive officer of T2CN, we have lost effective control over the T2CN Operating Entities and we may not be able to regain effective control over the T2CN Operating Entities or T2CN’s assets
Due to our dispute with Wang Ji, the former head of our Asian online game and service business in the PRC and former chief executive officer of T2CN, that arose in July 2010, we have lost effective control over a majority of T2CN’s assets and its financial reporting process since July 1, 2010.
We believe that Wang Ji currently has in his possession, among other things, the company seals, financial chops and business registration certificates of the T2CN Operating Entities. We also believe that Wang Ji has in his possession all documents, records and data and tangible property, including license agreements, trademark and domain name documentation, held in the offices of the T2CN Operating Entities. The company seals, financial chops and business registration certificates of the T2CN Operating Entities are necessary for the respective entities to, among other things, declare dividends and approve service fee payments to us. These documents are necessary for us to run our Asian online game and service business in the PRC. Under PRC law, the company seals, financial chops and business registration certificates are essential for entering into contracts, conducting banking business, or taking official corporate action of any sort including registering any change to the composition of the board or management with the relevant PRC authorities.
Consequently, we have not been able to register the resolutions removing Wang Ji from his position as a director of T2 Technology and J-Town and as the legal representative, executive director and manager of T2 Entertainment. As a result, Wang Ji has effectively usurped control over T2 Technology, J-Town and T2 Entertainment’s operations and accounts.
We have been seeking to regain effective control over T2CN and its assets by a range of means, including pursuing legal remedies in the courts of the PRC, Hong Kong, Singapore and the British Virgin Islands. While we continue to pursue these actions, we have to date not been successful in regaining to control of T2CN or recovering its assets. We deconsolidated T2CN’s financial results with effect from July 1, 2010 and wrote off our investment and advances to the entities held or controlled by T2CN (amounting to US$23.6 million, including the recorded investment of $22.2 million and advances of approximately $1.4 million) in the fourth quarter of 2010. While we will continue pursue legal remedies, we may also seek to reach a settlement with Wang Ji.
If our efforts to regain control over T2CN or its assets are unsuccessful, our future results of operations will likely be harmed. Our loss of control over T2CN and efforts to regain control also continues to occupy significant management time and resources. Moreover, our efforts to regain control over T2CN could hamper future business development efforts in China.
See Item 8, “Financial Information — A. Consolidated Statements and Other Financial Information — Information on Legal or Arbitration Proceedings — Dispute with the former head of our Asian online game and service business in the PRC and former Chief Executive Officer of T2CN” in this annual report.
6
Failure to maintain effective internal controls could have a material adverse effect on our business, results of operations and the trading price of our Shares
Effective internal controls are necessary for us to provide reasonable assurance with respect to our financial reports and to effectively prevent fraud. If we cannot provide reasonable assurance with respect to our financial reports and effectively prevent fraud, our results of operations could be materially and adversely affected. We are subject to reporting requirements under the U.S. securities laws. The SEC, as required by Section 404 of the Sarbanes-Oxley Act of 2002, has adopted rules requiring public companies to include a report of management on such company’s internal control over financial reporting in its annual report, which must contain an assessment by management of the effectiveness of such company’s internal control over financial reporting. In making such assessment, our management also used the criteria set forth by the Committee of Sponsoring Organizations of the Treadway Commission in Internal Control-Integrated Framework. In addition, an independent registered public accounting firm must express an opinion on the effectiveness of our Company’s internal control over financial reporting.
Our management conducted an evaluation of the effectiveness of our internal control over financial reporting and concluded that as of December 31, 2010, our disclosure controls and procedures were not effective at a reasonable assurance level in that they failed to timely detect the circumvention of our internal controls and procedures which resulted in our inability to exercise sufficient control over a majority of T2CN’s assets and its financial reporting process. We excluded IAHGames from our assessment of internal control over financial reporting as of December 31, 2010 because we acquired a controlling financial interest in the assets underlying the business of IAHGames and began to consolidate this business on July 1, 2010, which qualified under current SEC interpretive guidance for exclusion from our assessment of internal control over financial reporting. Since early July 2010 when the Company started to implement the internal restructuring plan with respect to T2CN’s leadership team, there have been disputes between the Company and the former chief executive officer of T2CN over his future role in the Company and T2CN. Due to these disputes, the former chief executive officer of T2CN effectively usurped control over and access to the accounts of the T2CN Operating Entities, and has taken actions or directed subordinates to take actions that circumvented the existing internal control system. As a result, we determined that there were inadequate controls in place to address risks related to usurpation of established policies, procedures and control systems related to T2CN which resulted in our inability to exercise sufficient control over a majority of T2CN’s assets and its financial reporting process, which eventually resulted in a significant loss to the Company. Our management believes that our loss of and continuing inability to maintain sufficient control over a majority of T2CN’s assets and its financial reporting process has been mainly caused by the actions of the former chief executive officer of T2CN as described above. As a result of this loss of control, in the fourth quarter of 2010, we recorded a full impairment of $22.2 million against our remaining investment in T2CN and we have recognized a full provision against the loan of $1.4 million due from T2CN. Our management does not believe that the material weakness described above has caused our financial statements as of and for the year ended December 31, 2010 to contain a material misstatement, as management completely impaired both the Company’s investment in and advances to T2CN during the fourth quarter of 2010 in order to properly reflect the Company’s financial position as of December 31, 2010.
We have completed our Section 404 assessment under the Sarbanes-Oxley Act and received our auditors’ attestation as of December 31, 2010. The report of our independent registered public accounting firm includes an opinion regarding the effectiveness of our internal control over financial reporting. However, internal control over financial reporting may not prevent or detect misstatements because of its inherent limitations, including the possibility of human error, the circumvention or overriding of controls, or fraud. Therefore, even effective internal controls can provide only reasonable assurance with respect to the preparation and fair presentation of financial statements. In addition, projections of any evaluation of effectiveness of internal control over financial reporting to future periods are subject to the risk that the control may become inadequate because of changes in conditions, or that the degree of compliance with the policies or procedures may deteriorate.
Our failure to maintain effective internal control over financial reporting could result in the loss of investor confidence in the reliability of our financial statements, which in turn could harm our business and negatively impact the trading price of our Shares. Furthermore, we may incur additional costs and use significant management and other resources in an effort to comply with Section 404 and other requirements of the Sarbanes-Oxley Act going forward.
We may not be successful in operating and improving our existing online games to satisfy the changing demands and preferences of players
The level of demand and market acceptance of our existing online games is subject to a high degree of uncertainty. Our future operating results will depend on numerous factors, many of which are beyond our control. These factors include:
| | • | | the popularity of existing and new online games operated by us; |
| | • | | the introduction of new online games by us or third parties, competing with or replacing our existing online games; |
| | • | | general economic conditions, particularly economic conditions adversely affecting discretionary consumer spending; |
7
| | • | | changes in our customer demands and preferences; |
| | • | | regulatory and other risks associated with our operations in China, Taiwan and Southeast Asia; |
| | • | | the availability of other forms of entertainment; and |
| | • | | critical reviews and public tastes and preferences, all of which change rapidly and cannot be predicted. |
Our ability to plan for product development and distribution and promotional activities will be significantly affected by how well we anticipate and adapt to relatively rapid changes in consumer tastes and preferences. Currently, a substantial portion of our online games revenue is derived from revenues from the online MahJong games and other casual games offered in Taiwan and Hong Kong by FunTown and from three licensed games, FIFA Online 2, Dragonica Online and Granado Espada, operated by IAHGames in Southeast Asia. However, there is no assurance that these games will continue to be popular. A decline in the popularity of online games in general is likely to adversely affect our business, financial condition and results of operations. To maintain competitiveness of our games, we are generally required to continuously invest in enhancing, improving, expanding or upgrading our games. If we fail to do so, revenues generated from our existing games may decline.
In addition, we expect that as we introduce new online games, a portion of our existing customers will switch to the new games. If this transfer of players from our existing games exceeds our expectations, we may have to adjust our marketing, pricing and other business plans and, as a result, our growth and profitability could be materially and adversely affected.
Our results of operations are subject to significant fluctuations
Our revenues, expenses and results of operations have varied in the past and may fluctuate significantly in the future due to a variety of factors, many of which are beyond our control. The key factors affecting our businesses include:
| | • | | Gaming software and service business: the regulatory restrictions applicable to the Internet gaming industry; global economic conditions and general economic conditions of the markets where the products of Everest Gaming target; availability of the Internet infrastructure; and the technological and other competition from existing and new competitors of Everest Gaming. |
| | • | | Asian online game and service business: our ability to retain existing users; attract new users and maintain user satisfaction; the pace of rolling out new games or updating existing games by us or our competitors; the amount and timing of operating costs and capital expenditures relating to our business operations and expansion; seasonal trends in Internet use; price competition in the industry; regulatory and other risks associated from our operations in the PRC, Taiwan and Southeast Asia. |
In addition, our operating expenses are based on our expectations of the future demand for our services and are relatively fixed in the short term. We may be unable to adjust spending quickly enough to offset any unexpected demand shortfall. A decrease in revenues in relation to our expenses could have a material and adverse effect on our business, results of operations and financial condition. You should not place undue reliance on our financial guidance, nor should you rely on year-to-year or quarter-to-quarter comparisons of our results of operations as indicators of our future performance.
Our business strategy, which contemplates growth through acquisitions and strategic investments, exposes us to significant risks
We have pursued and may continue to pursue growth through acquisitions and strategic investments. Any acquisition or investment is subject to a number of risks. Such risks include the diversion of management time and resources, disruption of our ongoing business, lack of familiarity with new markets, difficulties in supporting the acquired business, and dilution to existing stockholders if our common stock is issued in consideration for an acquisition or investment, incurring or assuming indebtedness or other liabilities in connection with an acquisition.
We entered into strategic alliances with SoftStar Entertainment Inc. (“SoftStar”), Neostorm Holdings Limited (“Neostorm”), XLGames Inc. (“XL Games”), Access China Holding Limited (“Access China”), Gorilla Banana Entertainment Corp. (“Gorilla Banana Entertainment”), JC Entertainment Corporation (“JC Entertainment”), Possibility Space Incorporated, and East Gate Media Contents & Technology Fund (“East Gate”) in June 2007, October 2007, December 2007, January 2008, May 2009, September 2009, December 2009, and August 2010, respectively. SoftStar is an online game development and publishing company incorporated in Taiwan. Neostorm was formed by the merger of four previously independent game development studios creating one of the largest independent game development companies in South Korea. Neostorm focuses on medium-core casual game titles. XL Games was founded by the creator of one of the most popular online game franchises in history and focuses on MMORPGs with studios in Seoul, South Korea and Austin, Texas. Access China is an online game software developer in the PRC. Gorilla Banana Entertainment is an online game software developer in Korea. JC Entertainment is a publicly-listed company which develops online games in Korea. Possibility Space Incorporated is an online game software developer in the PRC. East Gate is a Korean Fund which invests in online game businesses and films. For additional information with respect to our acquisitions and investments, see Item 4, “Information on The Company — A. History and Development of Our Company” in this annual report.
8
The total costs incurred in connection with our acquisitions and investments in various businesses in 2010 were approximately US$23.9 million. Our financial results may be affected by such acquisitions or investments. We may incur debts upon an acquisition or suffer losses related to the impairment of goodwill and other intangible assets following these acquisitions. These debts or losses could negatively impact our results of operations. We recognized an impairment loss on goodwill of approximately US$2.3 million, and an impairment loss on marketable securities and investments of approximately US$4.7 million in 2010. See note 10 to our consolidated financial statements for additional information. Any impairment on goodwill and marketable securities and investments in the future may have a negative impact on our financial results. We will continue to examine the merits, risks and feasibility of potential transactions, and expect to explore additional acquisition opportunities in the future. Such examination and exploration efforts, and any related discussions with third parties, may or may not lead to future acquisitions and investments. We may not be able to complete acquiring or investing transactions that we initiate. Our ability to grow through such acquisitions and investments will depend on many factors, including the availability of suitable acquisition candidates at an acceptable cost, our ability to reach agreement with acquisition candidates or investee companies on commercially reasonable terms, the availability of financing to complete the transactions and our ability to obtain any required governmental approvals.
We also face challenges in integrating any acquired business. These challenges include eliminating redundant operations, facilities and systems, coordinating management and personnel, retaining key employees, managing different corporate cultures, maintaining the relationship with the suppliers, vendors and/or distributors of acquired businesses, and achieving cost reductions and cross-selling opportunities. There can be no assurance that we will be able to successfully integrate all aspects of acquired businesses. The process of integrating the acquired business may disrupt our business and divert our resources. In addition, the benefits of an acquisition or investment transaction may take considerable time to be fully realized and we cannot assure you that any particular acquisition or investment and the subsequent integration will produce the intended benefits.
The online games market is characterized by rapid technological change, and failure to respond quickly and effectively to new Internet technologies or standards may have a material adverse effect on our business
The online games industry is evolving rapidly. Any new technologies and new standards may require increases in expenditures for online game development and operations. In addition, we use internally developed software systems that support nearly all aspects of our billing and payment transactions in our Asian online game and service business. All of our businesses may be adversely affected if we are unable to upgrade our systems effectively to accommodate future traffic levels, to avoid obsolescence or to successfully integrate any newly developed or acquired technology with our existing systems. Capacity constraints could cause unanticipated system disruptions and slower responses, which could adversely affect data transmission and game play. These factors could, among other things, cause us to lose existing or potential users and existing or potential game development partners.
Our business could suffer if we do not successfully manage current growth and potential future growth
We are pursuing a number of growth strategies. Some of these strategies relate to services, products or markets in which we lack experience and expertise. Our growth to date has placed, and our anticipated further expansion of our operations will continue to place, a significant strain on our management, operation systems and resources. In addition to training and managing our workforce, we will need to continue to develop and improve our financial and management controls and our reporting systems and procedures, including those of acquired businesses. We cannot assure you that we will be able to effectively manage the growth of our operations, and any failure to do so may limit our future growth and materially and adversely affect our business, financial condition and results of operations.
The current global economic slowdown and other adverse economic conditions may negatively impact our business
The current global economic slowdown has resulted in an increased level of commercial and consumer delinquencies, lack of consumer confidence and increased market volatility. These unfavorable changes in economic conditions have resulted in decreased spending by our customers. The impact of economic conditions on our licensees and business partners could adversely affect our business and revenues. In addition, the current global financial turmoil and the tightening of credit have resulted in a general credit crunch and have negatively impacted our ability to obtain additional financings. If the current global economic slowdown and global financial turmoil continue on a sustained basis, they will further negatively impact our Asian online game and service business and the demand for Everest Gaming’s gaming software products and services, which will adversely affect our business, revenues, cash flows, profitability and financial condition.
9
Our Asian online game and service business faces intense competition, which may adversely affect our revenues, profitability and planned business expansion
The online games market is highly competitive. Online casual game operators in Greater China and Southeast Asia are currently our primary competitors. We also compete with MMORPG operators throughout Greater China and Southeast Asia. Our major competitors in Taiwan include Gamania Digital Entertainment Co., Ltd. (“Gamania”), Soft-World International Corporation (“Soft-World”), International Games System, Co., Ltd. (“IGS”), UserJoy Technology Co., Ltd. (“UserJoy”) and GodGame Inc. (“GodGame”). Our major competitors in the PRC include Shanda Interactive Entertainment Ltd. (“Shanda”), Giant Interactive Group, Inc. (“Giant”), Changyou.com Limited (“Changyou”), The9 Limited, Shanghai Everstar Online Entertainment Co., Ltd. (“Nineyou”), Tencent Holdings Limited (“Tencent”), Perfect World Co., Ltd. (“Perfect World”), Kingsoft Corporation Limited (“Kingsoft”), Beijing Globalink Computer Technology Co., Ltd.(“Ourgames.com”) and Chinagames.net. Our major competitors in Southeast Asia are Asiasoft International Co., Ltd. (“Asiasoft”) and Lyto.Net (“Lyto”).
In addition, we compete for users against various offline games, such as console games, arcade games and handheld games, as well as various other forms of traditional or online entertainment.
We expect more online games operating companies to enter in the markets where we operate, including Greater China and Southeast Asia, and a wider range of online games to be introduced to these markets, given the relatively low entry barriers to the online games industry and the increasing popularity of Internet-based businesses. Our competitors vary in size and include private and public companies, many of which have greater financial, marketing and technical resources as well as name brand recognition. We intend to continue to enhance our market position through providing competitive products and quality services that meet market trends and users’ preferences, as well as strengthening sales effectiveness.
As a result of the above, significant competition may reduce the number of our users or the growth rate of our user base, reduce the average number of hours played by our users, or cause us to reduce usage fees. All of these competitive factors could have a material adverse effect on our business, financial condition and results of operations.
Our Asian online game and service business depends on the reliability of the network infrastructure and related services provided by ourselves and third parties, which is subject to physical, technological, security and other risks; the Everest Gaming business also faces similar risks
The development and operation of our online networks and those of Everest Gaming are subject to physical, technological, security and other risks which may result in interruption in service or reduced capacity. These risks include physical damage, power loss, telecommunications failure, capacity limitation, hardware or software failures or defects and breaches of security by computer viruses, system break-ins or otherwise. An increase in the volume of usage of online services could strain the capacity of the software and hardware employed, which could result in slower response time or system failures. We have a variety of backup servers at our primary site to deal with possible system failures. However, we do not have redundant facilities in the event of an emergency. The occurrence of any of these events could result in interruptions, delays or cessation in service to users of our online services, which could have a material adverse effect on our business and results of operations.
While we and Everest Gaming have implemented industry-standard security measures, our network and those of Everest Gaming may still be vulnerable to unauthorized access, computer viruses, denial of service and other disruptive problems. Our Internet-based services may be interrupted as a result of the accidental or intentional actions of Internet users, our current and former employees or others. A party that is able to circumvent security measures could misappropriate proprietary information, attack our security and network system, and, perhaps, most importantly, cause interruptions in our operations. We and Everest Gaming have experienced in the past, and may experience in the future, security breaches and attacks. We may be required to expend significant capital or other resources to protect against the threat of security breaches and attacks or to alleviate problems caused by such actions. There can be no assurance that any measures implemented will not be circumvented in the future.
Our business and that of Everest Gaming are also vulnerable to delays or interruptions due to our reliance on infrastructure and related services provided by third parties. End-users of Everest Gaming’s gaming software depend on ISPs and Everest Gaming’s system infrastructure for access to the Internet gaming sites operated by UIM and its sub-licensees and currently by Everest Gaming. Many of these services have experienced service outages in the past and could experience service outages, delays and other difficulties due to system failures, stability or interruption. For example, in February 2007, an earthquake off the coast of Taiwan, and in March 2011 an earthquake off the north-east coast of Japan, damaged several undersea fiber optic cables linking countries such as Malaysia, Singapore, Australia, Japan, South Korea, China, the United States and Europe, causing disruptions in Internet traffic worldwide. We may lose customers as a result of delays or interruption in service, including delays or interruptions relating to high volumes of traffic or technological problems, which may prevent communication over the Internet and could materially adversely affect our business, revenues, results of operations and financial condition.
10
Any failure to maintain a stable and efficient distribution and payment network could have a material and adverse impact on our Asian online game and service business, financial condition and results of operations
Our Asian online game and service business operation relies heavily on a multi-layer distribution and payment network composed of third party distributors for our sales to, and collection of payment from, our users. As we do not enter into long-term agreements with any of our distributors, we cannot assure you that we will continue to maintain favorable relationships with them. If we fail to maintain a stable and efficient distribution and payment network, our business, financial condition and results of operations could be materially and adversely affected.
In addition, our ability to process electronic commerce transactions depends on bank processing and credit card systems. In order to prepare for certain types of system problems, we have a formal disaster recovery plan. Nevertheless, any system failure, including network, software or hardware failure, which causes a delay or interruption in our e-commerce services could have a material adverse effect on our business, revenues, results of operations and financial condition.
We could be liable for breaches of security on our websites and fraudulent transactions by users of our websites
A portion of our transactions are conducted through our websites. In such transactions, secured transmission of confidential information (such as customers’ credit card numbers and expiration dates, personal information and billing addresses) over public networks is essential to maintain consumer confidence. In addition, we may face internal fraud, including potential unauthorized usage of customer credit card information by our employees. While we have taken steps to prevent this, including the implementation of payment card industry data security standards, our current security measures may not be adequate. Security breaches could expose us to litigation and possible liability for failing to secure confidential customer information and could harm our or our licensees’ reputation and ability to attract and retain customers. Everest Gaming may also face similar risks in its online gaming operations.
Undetected programming errors or defects in our software, services and games and the proliferation of cheating programs could materially and adversely affect our Asian online game and service business and the Everest Gaming business, financial condition and results of operations
Everest Gaming’s software, services and games may contain undetected programming errors or other defects. These errors or other defects could damage Everest Gaming’s reputation and subject it to liability. As to online games, parties unrelated to us may develop cheating programs that enable users to acquire superior features for their game characters that they would not have otherwise. Furthermore, certain cheating programs could cause the loss of a character’s superior features acquired by a user. The occurrence of undetected errors or defects in our games, and our failure to discover and disable cheating programs affecting the fairness of our game environment, could disrupt our operations, damage our reputation and detract from the game experience of our users. As a result, such errors, defects and cheating programs could materially and adversely affect our business, financial condition and results of operations. If such errors, defects and cheating programs occur in software, services and games Everest Gaming operates, Everest Gaming’s business operations and, in turn, our business and financial condition, could be materially and adversely affected.
Operation of pirate game servers and the expenses incurred in protecting our Asian online game and service business operation against unlawful operations through pirate servers may adversely affect our business
We continue to face challenges from pirate game servers, which are game servers that operate unauthorized copies of our online games and permit users to play those games without purchasing pre-paid game cards from us. The existence of unauthorized servers may attract game players away from our games and may result in decreases in our revenues. We have detected the operation by pirate servers of unauthorized copies of several of our games. In January 2009, for example, we discovered that certain unauthorized third parties had misappropriated the source codes of Luna Online and had set up unauthorized servers to unlawfully operate the game in the PRC. Although we have made efforts to detect and shutdown pirate servers in China, Taiwan and Hong Kong, we cannot assure you that such efforts will be successful in eliminating these unauthorized servers. In addition, detailed comparisons of software codes and litigation proceedings are often necessary to enforce the intellectual property rights, whether owned by or licensed by us, which sometimes result in substantial costs. The continued illegal operation of any of our existing games by pirate game servers, or the illegal operation of any of our new games by pirate servers, may materially and adversely affect our business, financial condition and results of operations.
We may be subject to claims of intellectual property right infringement by third parties, which could subject us to significant liabilities and other costs
Our success depends largely on our ability to use and develop our technology and know-how without infringing upon the intellectual property rights of third parties. We cannot assure you that third parties will not assert intellectual property claims against us. The validity and scope of claims relating to the intellectual property may involve complex scientific, legal and factual questions and analysis, and tend to be uncertain. If third parties assert copyright or patent infringement or violation of other intellectual property rights against us, we have to defend ourselves in legal or administrative proceedings, which can be costly and time consuming and may significantly divert the efforts and resources of our technical and management personnel. An adverse determination in any such proceedings to which we may become a party could subject us to significant liability to third parties, require us to seek licenses from third parties, and prevent us from selling our products and services. The imposition of liabilities that are not covered by insurance, in excess of insurance coverage or for which we are not indemnified by a content provider, could have a material adverse effect on our business, results of operations and financial condition.
11
We may need to incur significant expenses to protect our intellectual property rights, and if we are unable toadequately protect our intellectual property rights, our competitive position could be harmed
We regard our copyrights, service marks, trademarks, trade secrets, patents and other intellectual property as critical to our success. We rely on a combination of copyright and trademark laws, trade secret protection, confidentiality and non-disclosure agreements, and other contractual provisions to protect our proprietary software, trade secrets and similar intellectual property. We have patents, copyrights and trademarks in certain jurisdictions and may apply for further trademark and copyright registrations and additional patents, which may provide such protection in relevant jurisdictions. However, we cannot assure you that our efforts will prove to be sufficient or that third parties will not infringe upon or misappropriate our proprietary rights. Unauthorized use of the intellectual property, whether owned by or licensed to us, could adversely affect our business and reputation.
The validity, enforceability and scope of protection of intellectual property in Internet-related industries are evolving, and therefore, uncertain. In particular, the laws and enforcement procedures of the PRC, Taiwan, Hong Kong and Southeast Asia are uncertain or do not protect intellectual property rights to the same extent as the laws and enforcement procedures of the United States do. We may have to engage in litigation or other legal proceedings to enforce and protect our intellectual property rights, which could result in substantial costs and diversion of our resources, and have a material adverse effect on our business, financial condition and results of operations.
Our future results of operations or the growth of our business may suffer if we are unable to maintain satisfactory relationships with the licensors of our online games
We primarily source MMORPGs, advanced casual games and non-RPG MMOs through licensing from developers in various regions where online game development is relatively established. As of the date of this annual report, we have seven licensed MMORPGs and nine licensed advanced casual games and non-RPG MMOs in our online game portfolio, including the games we currently offer and the games in the pipeline. We need to maintain stable and satisfactory working relationships with our licensors in order to ensure the continued operation of our licensed online games and our continued access to new online game licenses. We depend on our licensors to provide the necessary technical support for the operation of the licensed games as well as expansion packs and upgrades that sustain continuing interest in the games. Our ability to maintain satisfactory working relationships with our licensors may also influence our ability to license new online games developed by the same or other licensors. If we are unable to maintain satisfactory relationships with our licensors, our financial condition, results of operations, future profitability and growth prospects may be materially and adversely affected.
We may need additional capital in the future, and it may not be available on acceptable terms
The development of our business may require significant additional capital in the future to:
| | • | | enhance and expand the range of products and services we offer; and |
| | • | | respond to competitive pressures and perceived opportunities, such as investment, acquisition and international expansion activities. |
We cannot assure you that additional financing will be available on terms favorable to us, if at all. If adequate funds are not available on acceptable terms, we may be forced to curtail or cease our operations. Moreover, even if we are able to continue our operations, any failure to obtain additional financing could have a material and adverse effect on our business, financial condition and results of operations, and we may need to delay the deployment of our services. See Item 5, “Operating and Financial Review and Prospects — B. Liquidity and Capital Resources.”
We depend on our key personnel, and our business and growth prospects may be severely disrupted if we lose their services
Our future success is heavily dependent upon the continued service of our key executives and other key employees. We rely on a number of key technology officers and staff for the development and operation of our online games. In addition, as we expect to focus increasingly on our Asian online game and service business, we will need to continue attracting and retaining skilled and experienced professionals to maintain our competitiveness.
12
If one or more of our key personnel are unable or unwilling to continue in their present positions, we may not be able to easily replace them and may incur additional expenses to recruit and train new personnel. As a result, our business could be severely disrupted, and our financial condition and results of operations could be materially and adversely affected. Furthermore, since our industry is characterized by high demand and intense competition for talent, we may need to offer higher compensation and other benefits in order to attract and retain key personnel in the future. We cannot assure you that we will be able to attract or retain the key personnel that we will need to achieve our business objectives.
Our results of operations and financial condition are affected by political stability, as well as the occurrence of natural disasters and epidemics
We operate our Asian online game and service business in Greater China and Southeast Asia. Political unrest, war, acts of terrorism and other instability, as well as natural disasters such as earthquakes and typhoons which are common in Greater China and Southeast Asia, can result in disruption to our business or the businesses of our customers.
Our business could be adversely affected by natural disasters and the effects of influenza A (H1N1), Avian influenza (H5N1), SARS or other epidemics. Any prolonged recurrence of such adverse public health developments in the regions where we operate may have material adverse effects on our business operations. These could include illness and loss of our management and key employees. Natural disasters or outbreak of epidemics may result in a decrease in economic activities or temporary closure of many businesses and disruption in our operations. In addition, other major natural disasters may also adversely affect our business by, for example, causing disruptions of the Internet network or otherwise affecting access to our games.
In 2010, we recorded operating losses, and we may experience losses in the future
In 2010, we recorded an operating loss of US$47.7 million. Our future profitability will depend primarily upon the performance of our Asian online game and service business and the Everest Gaming business. We cannot assure you that we will not experience operating or net losses in future periods.
Risks Related to Our Joint Venture with BetClic
We do not control the management of our joint venture with BetClic and have no control over its day-to-day business operations and any significant difficulties encountered by the joint venture in its operations may have a material and adverse effect on our business and financial results
On April 8, 2010, we completed the sale of a 60 percent interest in our online gaming software business to BetClic, a leading European sports betting and online gaming group. The strategic alliance with BetClic was structured as a stock and asset sale to a newly-formed French entity, Everest Gaming, in which we received a 40 percent stake. Concurrent with the transaction, we purchased the shares of UIM, our then-major licensee which provided online gaming services, and sold all of UIM’s material assets (including the Everest Poker operations) to Everest Gaming.
We hold the remaining 40 percent of Everest Gaming with a put option to sell all or part of our shares to BetClic. The put option is exercisable in 2013, 2014 and 2015. BetClic holds a call option on any remaining Everest Gaming interests held by us which it may exercise in 2015 and 2016. For both our put option and BetClic’ call option, the price paid will be determined based upon the fair market value of Everest Gaming as of December 31 of the prior year, as determined by mutual agreement between the parties or, failing that, an appraisal process.
While BetClic will generally control the day-to-day operations of Everest Gaming, so long as we hold at least 20 percent of Everest Gaming’s share capital, we will have approval rights over certain material actions of Everest Gaming, including certain issuances of securities of Everest Gaming, acquisitions and dispositions of certain assets and material changes to the principal business of Everest Gaming. In addition, so long as we hold at least 10 percent of Everest Gaming’s share capital, we will have representation on the board of directors of Everest Gaming.
We do not control Everest Gaming’s management and hence have no control over its day-to-day business operations. Our rights under the earn-out and the put or call option are of uncertain value. We may have disputes with BetClic regarding the operations of Everest Gaming or the calculation of the earn-out or put or call option payments. We cannot assure you that our strategic alliance with BetClic through such joint venture structure will be commercially successful. Any significant difficulties encountered by Everest Gaming in its operations or significant deviation from the terms of the agreement with BetClic, may have a material and adverse effect on our business and financial results.
13
The uncertain global legal and regulatory environment could have a negative impact on the Everest Gaming business and prospects
Everest Gaming primarily targets non-U.S. markets, predominantly the Continental European markets. Several European countries have adopted a regulated online gaming approach. For example, Italy has recently introduced a new set of regulations on online gaming. Italy, while initially a poker-only jurisdiction, has set forth a regulatory regime for casino. Italy does, however, prohibit cash games in online poker offerings, thereby restricting the poker activity to tournaments. Online poker tournaments, pari-mutual betting on horseraces and sports events are legal provided that the game operators are licensed by the relevant authorities. The French issued a license to Everest Gaming for online poker in June 2010. Online casino is widely seen as being prohibited under French law and Everest Gaming has stopped offering online casino gaming to people in France. Spain has promulgated a regulatory framework on online gaming. The regulations are currently awaiting review by the European Court of Justice and are expected to become effective shortly, and license applications will be accepted by the regulator by January 1, 2012. Everest Gaming plans on pursuing a license at that time. Other jurisdictions in which Everest Gaming operates may require local licensing in the future. There can be no assurance that Everest Gaming will be successful in its efforts to obtain a gaming license from these jurisdictions, and that Everest Gaming would not face the potential loss of users in these jurisdictions. In addition, many European countries, including the Netherlands, Denmark and Germany, have taken actions or introduced legislation aimed at banning foreign online gaming operators, which could have a material adverse effect on Everest Gaming and consequently on our Company.
The Internet gaming industry is still in an early stage of development and the global legal and regulatory environment in which Internet gaming businesses operate remains highly uncertain and is subject to change. While many jurisdictions have some form of legal framework applicable to games of chance and land-based casinos, few provide clear guidance on how this framework applies to Internet gaming. In addition, the very nature of Internet gaming creates new and unique forms of entertainment that were neither contemplated nor feasible in the past. There can be no assurance that legislation prohibiting Internet gaming or regulating various aspects of Internet gaming industry will not be proposed and passed in potentially relevant jurisdictions. We cannot assure you that Everest Gaming, as an online gaming operator, is in compliance with all laws and regulations of the jurisdictions in which it operates, or that changes in such laws and regulations, or in their interpretation, will not adversely affect our business and results of operations.
For additional information on the regulatory environment relating to online gaming, see Item 4, “Information on the Company — B. Business Overview — Regulation” in this annual report.
The Everest Gaming business faces intense competition, which may adversely affect our financial results
We are exposed to competition among Everest Gaming and other game operators in the online gaming industry. Everest Gaming faces intense competition in the online gaming industry, which is characterized by low barriers to entry, rapid technological change and ever-changing consumer preferences. New entrants to the online gaming industry, increasingly competitive market consolidations and aggressive marketing and pricing by competitors may lead to a significant decline in the customer base, revenues and margins of Everest Gaming. In addition, the online gaming industry is influenced by various other factors, including changes in policies and regulations and economic conditions in different jurisdictions. For example, many European countries such as Spain and Germany, where there are state-owned gaming monopolies, have taken actions or introduced legislation aimed at ring fencing the “liquidity” of online poker players by allowing players to play within their borders only. This decrease in liquidity will have an adverse effect on the Everest Gaming poker business. Furthermore, some of Everest Gaming’s competitors have greater experiences, resources and distribution capabilities. For additional information, see Item 4, “Information on the Company — B. Business Overview — Gaming Software and Service Business — Competition” in this annual report.
The Everest Gaming business will be materially and adversely affected if credit card companies and other financial institutions cease to accept online gaming transactions
A substantial portion of Everest Gaming’s proceeds from its online gaming operations is from the deposits or payments made by its customers through credit card transactions. Financial institutions in the United States have ceased to accept online gaming transactions after the enactment of the UIGEA, which prohibits the use of communication facilities and financial transactions in connection with Internet gambling. For additional information, see Item 4, “The Information on The Company — B. Business Overview — Regulation” in this annual report. Although Everest Gaming primarily targets non-U.S. markets, predominantly in Continental European markets, there can be no assurance that credit card companies or other financial institutions in the jurisdictions where Everest Gaming operates will continue to accept and process online gaming transactions. Furthermore, there is a higher incidence of fraud associated with online credit card payments than with other types of payments, which could further discourage issuing banks from processing online gaming transactions. If credit card companies or other financial institutions cease to accept online gaming transactions, either generally or in the jurisdictions where Everest Gaming operates, Everest Gaming’s revenues and, in turn, its gaming software and service business could be materially and adversely affected.
The Everest Gaming business is international and therefore faces associated risks
There are certain difficulties and inherent risks faced by our Company and Everest Gaming, our joint venture with BetClic, in doing business internationally, including the burden of complying with multiple and conflicting regulatory requirements, foreign exchange controls, potential restrictions or tariffs on gaming activities that may be imposed, potentially adverse tax consequences and tax risks. Changes in the political and economic stability, regulatory and taxation structures, and the interpretation thereof, in jurisdictions in which we or Everest Gaming operate, and in which our or Everest Gaming’s customers are located could have a material adverse effect on our business, revenues, results of operations and financial condition.
14
Risks Related to Doing Business in Greater China
PRC laws and regulations restrict foreign ownership and investment in the online game industry, and substantial uncertainties exist with respect to the application and implementation of PRC laws and regulations
We are classified as a foreign enterprise under PRC laws and various regulations in the PRC currently restrict foreign or foreign-owned enterprises from holding certain licenses required to provide and operate online games over the Internet in the PRC, including Internet content provider license (“ICP license”), Internet culture operation license, Internet publishing license and Internet advertising license. In order to comply with foreign ownership restrictions, we operate our Asian online game and service business in the PRC through our four variable interest entities (“VIEs”), including T2 Entertainment, T2 Advertisement, Jinyou and Shanghai JIDI. Until June 30, 2010, T2 Entertainment, T2 Advertisement and Jinyou had been effectively controlled by T2 Technology, a wholly owned subsidiary of T2CN, through contractual arrangements. T2 Entertainment and Jinyou hold ICP licenses and Internet cultural operation licenses that are required for operating our Asian online game and service business in the PRC, and T2 Advertisement holds an advertising license that is required to sell advertisements on our websites in the PRC. Beginning in June 2007, the financial results of T2 Entertainment and T2 Advertisement have been included in our consolidated financial statements. The financial results of Jinyou have been included in our consolidated financial statements starting from September 2008. Shanghai JIDI was established on December 6, 2010 and is effectively controlled by us through a series of contractual arrangements. Shanghai JIDI also holds an ICP license and Internet cultural operation licenses and is in the process of applying for an Internet publishing license. The financial results of Shanghai JIDI have been included into our consolidated financial statements since January 2011. For additional information, see Item 4, “Information on the Company — B. Business Overview — Regulation — Regulations Relating to Online Games in the PRC—Foreign Ownership Restrictions” and Item 4, “Information on the Company — C. Organizational Structure” in this annual report.
As part of contractual arrangements, T2 Technology entered into certain equity pledge agreements with the shareholders of T2 Entertainment, T2 Advertisement and Jinyou, respectively, pursuant to which the shareholders of T2 Entertainment, T2 Advertisement and Jinyou state that they pledge all of their respective equity interests to T2 Technology as security for the full performance of their respective obligations under certain exclusive call option agreements, voting rights and proxy agreements and loan agreements as well as the full performance of T2 Entertainment, T2 Advertisement and Jinyou’s respective obligations under certain exclusive technical service agreements, exclusive commercial service agreements, exclusive call option agreements and voting rights and proxy agreements. Each of the shareholders of Shanghai JIDI has agreed to pledge their respective shares in Shanghai JIDI on request to secure the payments granted by GigaMedia (HK) Limited, our wholly owned subsidiary, to each shareholder respectively for the purpose of establishing Shanghai JIDI. However, according to the PRC Property Rights Law, a pledge over the equity interests of a limited liability company is created only when such equity pledge agreements are registered with the relevant local branch of the State Administration for Industry and Commerce (the “SAIC”). T2 Entertainment, T2 Advertisement, Jinyou and Shanghai JIDI have not registered the equity pledge agreements with the relevant local branch of the SAIC. Consequently, we believe that unless and until these equity pledge agreements have been properly registered, we will not be able to enforce these pledges in the PRC courts. We cannot assure you that we will be able to validly obtain the rights to the equity interests of T2 Entertainment, T2 Advertisement, Jinyou and Shanghai JIDI without due registration of relevant equity pledge agreements.
In July 2006, the Ministry of Industry and Information Technology (“MIIT”, formerly the Ministry of Information Industry) issued a notice, which prohibits holders of ICP licenses and holders of value-added telecommunications business operation licenses from leasing, transferring or selling a telecommunications business operating license to any foreign investors in any form, or providing any resource, sites or facilities to any foreign investors for their illegal operation of telecommunications business in the PRC. The notice also requires that ICP license holders and their shareholders directly own the domain names and trademarks used by such ICP license holders in their daily operations. The notice further requires each ICP license holder to have the necessary facilities for its approved business operations and to maintain such facilities in the regions covered by its license. In addition, all value-added telecommunication service providers are required to maintain network and information security in accordance with the standards set forth under relevant PRC regulations. Local authorities in the various regions were required to ensure that existing ICP license holders conducted self-assessments of their compliance with the notice and submitted their status reports to the MIIT prior to November 1, 2006. T2 Entertainment, Jinyou and Shanghai JIDI have conducted their self-assessments and believe that they are in compliance with the requirements of the notice. T2 Entertainment, Jinyou and Shanghai JIDI have obtained the ICP licenses required for online games operation in the PRC.
On September 28, 2009, the PRC General Administration of Press and Publication (“GAPP”), National Copyright Administration, and National Office of Combating Pornography and Illegal Publications jointly published a notice, which, among others, (i) provides that GAPP is responsible for pre-examination and approval of Internet games as authorized by the central government and State Council, and that the provision of Internet games either online or on a downloaded basis constitutes Internet game publishing, which is subject to pre-examination and approval by GAPP; and (ii) prohibits foreign investors from participating in Internet game operating businesses via wholly owned, equity joint venture or cooperative joint venture investments in the PRC, and from controlling and participating in such businesses directly or indirectly through contractual or technical support arrangements. If applied literally and uniformly, such notice would render our ownership structure in the PRC invalid and illegal. To date, however, there are substantial uncertainties regarding the interpretation and application of such notice.
15
There are substantial uncertainties regarding the interpretation and application of current or future PRC laws and regulations. Accordingly, we cannot assure you that PRC government authorities will ultimately take a view that is consistent with our view. If we or any of our PRC operating companies are found to be in violation of any existing or future PRC laws or regulations, the relevant government authorities would have broad discretion in dealing with such violations and could impose significant penalties and sanctions or other regulatory or enforcement actions, including levying fines, confiscating income, revoking business or operating licenses, requiring us to restructure our ownership structure, and requiring us to discontinue all or any part of our business operations. Any of these actions could have a material adverse effect on our business, financial condition and results of operations.
Since July 1, 2010, we have lost effective control over a majority of T2CN’s assets and its financial reporting process due to the disputes with Wang Ji, the former chief executive officer of T2CN (“Wang Ji”), that arose in July 2010. Therefore, we deconsolidated T2CN’s financial results with effect from July 1, 2010 and completely wrote off our investment and advances to the entities held or controlled by T2CN in the fourth quarter of 2010. We have been pursuing all means to regain effective control over a majority of T2CN’s assets, including but not limited to the filing of lawsuits against Wang Ji in the courts of the PRC, Hong Kong, Singapore and the British Virgin Islands. If our contractual arrangements between T2 Technology and three VIEs are found in the PRC courts or by applicable PRC government authorities to be in violation of existing PRC laws or regulations, it could have a material adverse effect on our PRC lawsuits against Wang Ji in connection with T2 Entertainment and therefore we may not be able to regain our effective control over T2 Entertainment, T2 Advertisement and Jinyou. See Item 8, “Financial Information — A. Consolidated Statements and Other Financial Information — Information on Legal or Arbitration Proceedings — Dispute with the former head of our Asian online game and service business in the PRC and former Chief Executive Officer of T2CN” in this annual report.
The contractual arrangements with T2 Entertainment, T2 Advertisement, Jinyou and Shanghai JIDI and their shareholders may not be as effective in providing operational control as direct ownership and the shareholders of T2 Entertainment, T2 Advertisement, Jinyou and Shanghai JIDI may have potential conflicts of interest with us
We operate our Asian online game and service business in the PRC through T2 Entertainment, T2 Advertisement, Jinyou and Shanghai JIDI, all of which are our VIEs. We have no ownership interest in any of these VIEs and rely on a series of contractual arrangements that are intended to give us effective control over them. However, the contractual arrangements may not be as effective as compared to having direct ownership and control over these companies. Direct ownership would allow us, for example, to directly exercise our rights as a shareholder to effect changes in the board of directors, which, in turn, could affect changes, at the management level. In addition, these VIEs could violate their contractual arrangements with us, go bankrupt, suffer from problems in their businesses or otherwise become unable to perform their contracts with us. As a result, our business could be disrupted and our results of operations may be materially and adversely affected.
Most principal shareholders of T2 Entertainment, T2 Advertisement, Jinyou and Shanghai JIDI have no substantial shareholdings in our Company. Thus, their interests as shareholders of the VIEs and their duties to our Company may conflict. We cannot assure you that when conflicts of interest arise, these persons will act completely in our interests or that conflicts of interests will be resolved in our favor. Any legal proceeding could result in the disruption of our business, diversion of our resources and the incurring of substantial costs.
All of these contractual arrangements are governed by PRC laws and provide for the resolution of disputes through either arbitration or litigation in the PRC. Accordingly, the underlying contracts would be interpreted in accordance with PRC laws and any disputes would be resolved in accordance with PRC legal procedures. The legal environment in the PRC is not as developed as in other jurisdictions, such as the United States. As a result, uncertainties in the PRC legal system could limit our ability to enforce these contractual arrangements. In the event we are unable to enforce these contractual arrangements, we may be unable to exert effective control over our PRC operating VIEs, and our ability to conduct our business may be negatively affected. See Item 4, “Information on the Company — C. Organizational Structure” in this annual report.
Since July 1, 2010, we have lost effective control over a majority of T2CN’s assets and its financial reporting process due to the dispute with Wang Ji. We have been pursuing all means to regain effective control over a majority of T2CN’s assets, including but not limited to the filing of lawsuits against Wang Ji in the courts of the PRC, Hong Kong, Singapore and the British Virgin Islands. See Item 8, “Financial Information — A. Consolidated Statements and Other Financial Information — Information on Legal or Arbitration Proceedings — Dispute with the former head of our Asian online game and service business in the PRC and former Chief Executive Officer of T2CN” in this annual report. We cannot assure that we can successfully and eventually regain effective control over our three VIEs, T2 Entertainment, T2 Advertisement and Jinyou, and we have incurred and may continue to incur a significant amount of legal fees in connection with the litigations in various jurisdictions. There is no assurance that similar issues will not arise in connection with the business operations of Shanghai JIDI, our newly established VIE in the PRC. In the event that Shanghai JIDI violates its contractual arrangements with us, becomes bankrupt, suffers from problems in its businesses or otherwise becomes unable to perform its contracts with us or any legal procedures initiated due to any dispute with the shareholders of Shanghai JIDI, our business could be disrupted and our results of operations may be materially and adversely affected.
16
The laws and regulations governing the online games industry in the PRC are evolving and new regulations may adversely affect our business
Our provision of online games and online game-related content on our websites in China is subject to various PRC laws and regulations relating to the telecommunications industry and Internet and online games, and is regulated by various government and regulatory authorities. The principal PRC regulations governing the provision of Internet content and online gaming services include (among others) the Telecommunications Regulations (2000), the Administrative Rules for Foreign Investments in Telecommunications Enterprises (2001), the Tentative Measures for the Administration of Internet Publications (2002), the Opinions on the Development and Management of Online Games (2005), the Anti-Internet Addiction Regulations (2007), the Administrative Measures for Telecommunications Business Operating Licenses (2009), and the Tentative Measures for Online Games Administration (2010) and the Tentative Measures for Administration of Internet Culture (2011). We may be affected by these regulations, which seek to regulate the content of online games and the business operation of online game operators and discourage online game players from spending excessive amounts of time playing online games. This may reduce the number of our users, the growth rate of our user base, the general online games market in the PRC or the average number of hours played by online game players, or cause us to reduce usage fees or other charges in connection with our Asian online game and service business. In addition, compliance with such regulations may require us to incur substantial costs in modifying or adapting our game software to comply with the regulatory requirements. This may adversely affect our business, financial condition and results of operations.
The adoption of new laws or regulations in the PRC relating to the Internet, or particular applications or interpretations of existing laws, could decrease the growth in the use of the Internet, decrease the demand for our products and services, increase the cost of conducting our business or could otherwise have a material adverse effect on our business, revenues, results of operations and financial condition.
New PRC laws and regulations that address issues such as user privacy, pricing, online content, taxation, advertising, intellectual property, information security, and the characteristics and quality of online products and services may be enacted. For example, in order to counter Internet addiction, in April 2007, eight PRC government authorities issued regulations to discourage online game-players who are minors from spending excessive amounts of time playing online games. Pursuant to these regulations, Internet game operators have been ordered to install anti-addiction software features on games offered in the PRC, which will, among other features, limit the number of points and other benefits which can be awarded to game players after they have been online in excess of specified periods of time. Internet game operators will also be required to adopt real-name registration, which will require online game players to register their real identity information before they will be allowed to play online games. See Item 4, “Information on the Company — B. Business Overview — Regulation” in this annual report.
There are currently no clear laws or regulations governing virtual asset property rights, in particular, in Greater China, and therefore, it is not clear what liabilities, if any, online game operators may have in respect of virtual assets
In the course of playing online games, some virtual assets, such as special equipment, player experience grades and other features of our users’ game characters, are acquired and accumulated. Such virtual assets can be important to online game players. In practice, virtual assets can be lost for various reasons, often through unauthorized use of user identifications by other users and occasionally through data loss caused by delay of network service or by a network crash. Currently there are no clear laws or regulations governing virtual asset property rights, in particular, in Greater China where we operate our Asian online game and service business. As a result, it is unclear under PRC law whether an operator of online games such as us would have any liability (whether in contract, tort or otherwise) for loss of such virtual assets by game players. Based on several judgments regarding the liabilities of online game operators for loss of virtual assets by game players, the PRC courts have generally required online game operators to provide well-developed security systems to protect such virtual assets owned by game players. In the case of a loss of virtual assets, we may be sued by online game players and could be held liable for damages, which may negatively affect our business, financial condition and results of operations.
Restrictions on virtual currency may adversely affect our revenues from online game operations in the PRC
Our online game operations revenues in the PRC are primarily collected through the sale of our prepaid game cards or online sale of game points. On February 15, 2007, 14 PRC government authorities jointly issued the Circular for Further Strengthening the Administration of Internet Café and Online Games, which directs the People’s Bank of China (“PBOC”) to strengthen the administration of virtual currency in online games to avoid any adverse impact on the PRC economy and financial system. This circular provides that the total amount of virtual currency issued by online game operators and the amount purchased by individual game players should be strictly limited, with a strict and clear division between virtual transactions and real transactions carried out by way of electronic commerce. This notice also provides that virtual currency should only be used to purchase virtual items. On June 4, 2009, the Ministry of Culture and the Ministry of Commerce jointly issued the Circular on Strengthening the Administration of Virtual Currency in Online Games. According to this circular, any PRC entities engaging in issuance or trade service of virtual currency in online games shall meet the requirements of “Commercial Online Cultural Entities” as prescribed in the Tentative Measures for Administration of Internet Culture (first issued in 2003 and revised in 2011) and are required to apply to the Ministry of Culture for an approval. This circular further provides, among others, that (i) the form, issuance scope and unit purchase price of virtual currency, the refund method in case of termination of online games, the purchase method for the users (including cash, bank card, payment via Internet, etc.), the protection measures for users’ rights and interests, and the technology security safeguard measures, shall be filed with the Ministry of Culture for record; (ii) the unit purchase price of virtual currency shall not be changed by online games operators; (iii) the new type of virtual currency shall be filed with the Ministry of Culture for record before issuance by online games operators; and (iv) the virtual currency trade service shall not be open to the minors. On June 3, 2010, the MOC issued the Tentative Measures for Online Games Administration (the “Tentative Measures”), which will take effect as of August 1, 2010. The Tentative Measures’ provisions with respect to virtual currency substantially reiterate current law, although they also impose a prohibition on trading services for unapproved or unfiled online games. “Virtual Currency for Online Games” was defined as a virtual exchange tool represented by special numerical units, issued by online game operators and deposited by magnetic recording in a server outside online games and should be directly or indirectly purchased at certain rates by game players with legal tender. Providing virtual currency trading services to minors is prohibited. Virtual currency can only be used for the online game products and service and shall not be used to purchase other goods and service and all users’ purchase record shall be kept for at least 180 days. These restrictions may result in lower sales of our prepaid game cards or game points, and could have an adverse effect on our game operations revenues.
17
Our business may be adversely affected by government policies and regulation of Internet cafés in the PRC
Internet cafés are one of the primary venues where our online games were distributed and played in the PRC. In April 2001, the PRC government began tightening its regulation and supervision of Internet cafés. In particular, a large number of Internet cafés without requisite government licenses have been closed. In addition, the PRC government has imposed higher capital and facility requirements for the establishment of Internet cafés. The PRC government’s policy, which encourages the development of a limited number of national and regional Internet café chains and discourages the establishment of independent Internet cafés, may also slow down the growth in the number of new Internet cafés. In February 2007, 14 PRC government authorities jointly issued a notice, which suspended approval for the establishment of new Internet cafés and called for strengthened regulation of existing Internet cafés. It is unclear when or if this suspension will be lifted. The PRC governmental authorities may from time to time impose stricter requirements, such as the customers’ age limit and hours of operation, among others, as a result of the occurrence and perception of, and the media attention on, gang fights, arson and other incidents in or related to Internet cafés. The implementation of these measures, or enactment by the PRC government of any additional laws to further regulate Internet cafés, may result in fewer customers or less time spent by customers playing our online games, which could restrict our ability to maintain or increase our revenues and expand our customer base. See Item 4, “Information on the Company — B. Business Overview — Regulation — Internet Café Regulation” in this annual report.
Changes in foreign exchange and foreign investment regulations and limitations on dividend payment in the PRC may affect our ability to invest in China and the ability of our PRC subsidiaries to pay dividends and service debts
Renminbi is not a freely convertible currency at present. The PRC government regulates conversion between Renminbi and foreign currencies. Changes in PRC laws and regulations on foreign exchange may result in uncertainties in our financing and operating plans in China. Over the years, China has significantly reduced the government’s control over routine foreign exchange transactions under current accounts, including trade and service related foreign exchange transactions, payment of dividends and service of foreign debts. In accordance with the existing foreign exchange regulations in China, our PRC subsidiaries may, within the scope of current account transactions, pay dividends and service debts in foreign currencies without prior approval from the PRC State Administration of Foreign Exchange, or SAFE, by complying with certain procedural requirements. However, there can be no assurance that the current PRC foreign exchange policies with respect to debt service and payment of dividends in foreign currencies will continue in the future. Changes in PRC foreign exchange policies may have a negative impact on our ability to service our foreign currency-denominated indebtedness and to distribute dividends to our shareholders in foreign currencies since our subsidiaries in China need to convert their Renminbi cash flow to service such foreign debt and to make such dividend payments.
Foreign exchange transactions by our PRC subsidiaries under the capital account continue to be subject to significant foreign exchange controls. In particular, foreign exchange transactions involving foreign direct investment, foreign debts and outbound investment in securities and derivatives are subject to limitations and require approvals from the relevant SAFE authorities. We have the choice, as permitted by the PRC foreign investment regulations, to invest in the form of registered capital or a shareholder loan into our PRC subsidiaries to finance our operations in China. Our choice of investment is affected by the different treatments under the relevant PRC regulations with respect to capital-account and current-account foreign exchange transactions in China. For example, our transfer of funds to our subsidiaries in China is subject to approval of PRC governmental authorities in case of an increase in registered capital, or subject to registration with PRC governmental authorities in case of a shareholder loan. These and other limitations on the flow of funds between us and our PRC subsidiaries could restrict our ability to act in response to changing market conditions and limit our flexibility in the management of our cash flow and financings. See Item 10, “Additional Information — D. Exchange Controls” in this annual report.
In addition, recent PRC regulations relating to the establishment of offshore special purpose companies by PRC residents may subject the PRC resident shareholders of our PRC subsidiaries or us to penalties and limit our ability to inject capital into our PRC subsidiaries, limit our subsidiaries’ ability to increase their registered capital, distribute profits to us, or otherwise adversely affect us. Moreover, our PRC subsidiaries are required to set aside a certain percentage of their after-tax profit based on PRC accounting standards each year for their reserve fund in accordance with the requirements of relevant PRC laws and the relevant provisions in their respective articles of associations. As a result, our PRC subsidiaries may be restricted in their ability to transfer any portion of their net income to us whether in the form of dividends, loans or advances.
18
There are economic risks associated with doing business in Taiwan, particularly due to the tense relationship between Taiwan and the PRC
Our principal executive offices and a significant portion of our assets are located in Taiwan and a major portion of our revenues of Asian online game and service business are derived from our operations in Taiwan. Taiwan, as part of the Republic of China, has a unique international political status. The PRC asserts sovereignty over mainland China and Taiwan and does not recognize the legitimacy of the Taiwan government. Relations between Taiwan and the PRC and other factors affecting the political or economic conditions of Taiwan could also affect our Asian online game and service business.
Risks Related to Ownership of our Shares
The price of our Shares has been volatile historically and may continue to be volatile, which may make it difficult for holders to resell our Shares when desired or at attractive prices
The trading price of our Shares has been and may continue to be subject to wide fluctuations. In 2010, the closing prices of our Shares on the NASDAQ Stock Market have ranged from US$1.40 to US$3.32 per share, and the closing price on June 24, 2011 was US$1.29. Our Share price may fluctuate in response to a number of events and factors. In addition, the financial markets in general, and the market prices for Internet-related companies in particular, have experienced extreme volatility that often has been unrelated to the operating performance of such companies. These broad market and industry fluctuations may adversely affect the price of our Shares, regardless of our operating performance.
We are controlled by the Koo family, which has significant influence in determining the outcome of any corporate transaction or other matters submitted to our shareholders for approval, and their interests may conflict with your interests
As of March 31, 2011, members of the Koo family beneficially owned approximately 19.19 percent of our outstanding Shares. Accordingly, the members of the Koo family have significant influence in determining the outcome of any corporate transaction or other matters submitted to our shareholders for approval, including mergers, consolidations, the sale of all or substantially all of our assets and the power to prevent or cause a change in control. The interests of such members of the Koo family may differ from or conflict with your interests.
Our transactions with related parties may not benefit us and may harm our Company
We have entered into several transactions with certain related parties. We believe that we have conducted our related-party transactions on an arm’s-length basis and on terms comparable to, or more favorable to us than, similar transactions we would enter into with independent third parties. However, we cannot assure you that all our future transactions with related parties will be beneficial to us. See Item 7, “Major Shareholders and Related-Party Transactions” in this annual report.
Our Asian online game and service business in the PRC relies on revenues transferred from our PRC VIEs to us pursuant to contractual arrangements. Any restriction on such payments for revenue transfer and any increase in the amount of PRC taxes applicable to such payments may materially and adversely affect our business and our ability to pay dividends to our shareholders
T2 Entertainment, T2 Advertisement and Jinyou are not owned by us and they are not able to make dividend payments to us. Instead, T2 Technology, T2CN’s wholly owned subsidiary in the PRC, entered into a number of agreements with T2 Entertainment, T2 Advertisement and Jinyou, including certain exclusive technical service and consultancy agreement and exclusive business consultancy service agreements, pursuant to which T2 Entertainment, T2 Advertisement and Jinyou pay T2 Technology for certain services that T2 Technology provides to these companies. Since July 2007 and through June 2010, T2 Entertainment, T2 Advertisement and Jinyou had transferred substantially all of their net incomes to T2 Technology in exchange for certain exclusive technical consulting services and business consulting services provided by T2 Technology. Since July 1, 2010, we have lost effective control over a majority of T2CN’s assets and its financial reporting process due to the dispute with Wang Ji. While we are not aware that there has been any disruption to the ordinary business operations of the T2CN Operating Entities, no dividends or service fees have been declared or paid to us since the dispute began.
JIDI, our wholly owned subsidiary in the PRC, entered into a consulting services agreement with Shanghai JIDI, one of our PRC VIEs, under which JIDI provides certain technical consulting services to Shanghai JIDI in exchange for substantially all of Shanghai JIDI’s net income. However, depending on the nature of services provided, certain of these payments are subject to PRC taxes at different rates, including business taxes and VATs, which would effectively reduce the amount that JIDI will receive from Shanghai JIDI. We cannot assure you that the PRC government will not impose restrictions on such payments or change the tax rates applicable to such payments. Any such restrictions on such payment or increases in the applicable tax rates may materially and adversely affect our ability to receive payments from T2 Entertainment, T2 Advertisement and Jinyou or the amount of such payments in the event that we regain effective control over these VIEs, and from Shanghai JIDI or the amount of such payments, and may in turn materially and adversely affect our business, our net income and our ability to pay dividends to our shareholders.
19
The ability of our subsidiaries in Taiwan to distribute dividends to us may be subject to restrictions under the laws of Taiwan
We are a holding company, and some of our assets constitute our ownership interests in our subsidiaries in Taiwan, including Hoshin GigaMedia, which owns the Taiwan-based operations of our Asian online game and service business. Accordingly, part of our primary internal source of funds to meet our cash needs is our share of the dividends, if any, paid by our subsidiaries, including those in Taiwan. The distribution of dividends to us from these subsidiaries in Taiwan is subject to restrictions imposed by the applicable corporate and tax regulations in these countries, which are more fully described in Item 5, “Operating and Financial Review and Prospects — B. Liquidity and Capital Resources — Dividends from Our Subsidiaries” in this annual report. In addition, although there are currently no foreign exchange control regulations which restrict the ability of our subsidiaries in Taiwan to distribute dividends to us, the relevant regulations may be changed and the ability of these subsidiaries to distribute dividends to us may be restricted in the future.
Anti-takeover provisions under the Singapore Securities and Futures Act (Chapter 289) and the Singapore Code on Take-overs and Mergers may delay, deter or prevent a future takeover or change of control of our Company, which could adversely affect the price of our Shares
The Singapore Code on Take-overs and Mergers (the “Code”), issued pursuant to Section 321 of the Singapore Securities and Futures Act (Chapter 289) regulates the acquisition of ordinary shares of, inter alia, listed public companies and contains certain provisions that may delay, deter or prevent a future takeover or change of control of our Company. Any person acquiring an interest, either on his own or together with parties acting in concert with him, in 30 percent or more of the voting shares in our Company must, except with the prior consent of the Singapore Securities Industry Council (the “SIC”), extend a takeover offer for the remaining voting shares in our Company in accordance with the provisions of the Code. Likewise, any person holding between 30 percent and 50 percent of the voting shares in our Company, either on his own or together with parties acting in concert with him, must, except with the prior consent of the SIC, make a takeover offer in accordance with the provisions of the Code if that person together with parties acting in concert with him acquires additional voting shares in excess of one percent of the total number of voting shares in any six-month period.
Under the Code, an offeror must treat all shareholders of the same class in an offeree company equally. A fundamental requirement is that shareholders in the company subject to the takeover offer must be given sufficient information, advice and time to consider and decide on the offer.
These provisions contained in the Code may discourage or prevent transactions that involve an actual or threatened change of control of our Company. This may harm you because an acquisition bid may allow you to sell your Shares at a price above the prevailing market price.
Our shareholders may be subject to Singapore taxes
Singapore tax law may differ from the tax laws of other jurisdictions, including the United States. Gains from the sale of our Shares by a person not tax resident in Singapore may be taxable in Singapore if such gains are part of the profits of any business carried on in Singapore. For additional information, see Item 10, “Additional Information — E. Taxation — Singapore Tax Consideration” in this annual report. You should consult your tax advisors concerning the overall tax consequences of acquiring, owning or selling the Shares.
We are a Singapore company, and because the rights of shareholders under Singapore law differ from those under U.S. law, you may have difficulty in protecting your shareholder rights or enforcing any judgment obtained in the U.S. against us or our affiliates
Our corporate affairs are governed by our memorandum and articles of association and by the applicable laws governing corporations incorporated in Singapore. The rights of our shareholders and the responsibilities of members of our board of directors under Singapore law are different from those applicable to a corporation incorporated in the United States and, therefore, our shareholders may have more difficulty protecting their interests in connection with actions by the management, members of our board of directors or our controlling shareholders than they would as shareholders of a corporation incorporated in the United States.
Our Company is incorporated under the laws of the Republic of Singapore. Many of our directors and senior management reside outside the United States. As a result, it may be difficult for investors to effect service of process within the United States upon us or any of these persons or to enforce in the United States any judgment obtained in the U.S. courts against us or any of these persons, including judgments based upon the civil liability provisions of the U.S. federal securities laws or any state or territory of the United States. Judgments of the U.S. courts based upon the civil liability provisions of the U.S. federal securities laws may not be enforceable in Singapore courts, and there is doubt as to whether Singapore courts will enter judgments in original actions brought in Singapore courts based solely upon the civil liability provisions of the U.S. federal securities laws.
20
We may be deemed to be an investment company under the United States Investment Company Act of 1940, which could have a significant negative impact on our results of operations
We may be deemed to be an investment company under the United States Investment Company Act of 1940 (the “1940 Act”), and may suffer adverse consequences as a result. Generally, the 1940 Act provides that a company is an investment company if the company (i) is, holds itself out as or proposes to be engaged primarily in the business of investing, reinvesting or trading in securities or (ii) is engaged or proposes to engage in the business of investing, reinvesting, owning, holding or trading in securities and owns or proposes to acquire “investment securities” having a value exceeding 40% of the value of its total assets (exclusive of U.S. government securities or cash items) on an unconsolidated basis. Under the 1940 Act, investment securities include, among other things, securities of non-majority owned businesses. However, a company that is primarily engaged, directly or through wholly-owned subsidiaries, in a business or businesses other than that of investing, reinvesting, owning, holding or trading in securities is not an investment company.
Following the completion of our restructuring efforts in September 2008, we have devoted our efforts and resources to gaming software products and application services and operating online games businesses primarily through CESL, our wholly-owned subsidiary. From time to time, we also make strategic non-controlling investments in entities that we believe, at the time of such investments, complement or enhance our business (“Strategic Investments”). These Strategic Investments may be deemed to be investment securities under the 1940 Act. In April 2010, we consummated the sale of a 60 percent interest in our gaming software business to BetClic, a leading European sports betting and online gaming group, for US$100 million in cash and the right to a possible earnout payment based on the future performance of the business. As part of the transaction, we purchased the shares of UIM, our then-major licensee which provided online gaming services, and sold all of UIM’s material assets to Everest Gaming. We and BetClic also hold, respectively, put and call options on our 40 percent interest in the gaming software and service business exercisable at fair market value at various dates over the next several years. As a result of the transaction with BetClic, we no longer have majority control of the gaming software and service business and have a significant amount of cash on hand. See Item 4, “Information on the Company — B. Business Overview — Gaming Software and Service Business” for additional information. Consequently, there is a risk that we could be deemed to be an investment company because our investment securities may be deemed to comprise more than 40% of our total assets (exclusive of U.S. government securities or cash items) on an unconsolidated basis pending investment of the proceeds of the sale into our remaining businesses.
However, based on our historical and current business activities, our intentions, the manner in which we hold ourselves out to the public, the primary activities of our officers and directors and an analysis of our non-cash assets and income during 2010, the first quarter of 2011 and in prior periods, we believe that the better view is that we are not an investment company. Nevertheless, a part of the determination of whether we are an investment company is based upon the composition and value of our non-cash assets, a significant portion of which are presently comprised of our Strategic Investments. As a result, we could be deemed to be an investment company.
We intend to continue to conduct our businesses and operations so as to avoid being required to register as an investment company. Since the completion of the transaction with BetClic, we have sought opportunities to deploy our capital in a manner which would result in the Company acquiring majority interests in entities or businesses that complement or enhance our remaining businesses or would otherwise assist the Company in achieving our current corporate objectives. We have also limited, and intend to continue to limit, new Strategic Investments to those opportunities which would present excellent opportunities to complement or enhance our remaining businesses or would otherwise assist the Company in achieving our current corporate objectives. If, nevertheless, we were to be required to register as an investment company, because we are a foreign company, the 1940 Act would prohibit us and any person deemed to be an underwriter of our securities from offering for sale, selling or delivering after sale, in connection with a public offering, any security issued by the Company in the United States. Additionally, we may be unable to continue operating as we currently do and might need to acquire or sell assets that we would not otherwise acquire or sell in order to avoid being treated as an “investment company” as defined under the 1940 Act. We may incur significant costs and management time in this regard, which could have a significant negative impact on our results of operations.
We may be classified as a passive foreign investment company for U.S. federal income tax purposes. As a result, you may be subject to materially adverse tax consequences with respect to Shares
In light of our significant cash balances and portfolio of investment securities, we believe that it is likely that we were classified as a passive foreign investment company, or PFIC, for the taxable year ended December 31, 2010, and we will likely be a PFIC for our current taxable year ending December 31, 2011, unless our share value increases and/or we invest a substantial amount of the cash and other passive assets we hold in assets that produce or are held for the production of non-passive income. A non-United States corporation, such as us, will be treated as a PFIC for any taxably year in which 75 percent or more if its gross income consists of “passive” income or 50 percent or more of its assets (based on an average of the quarterly values during such taxable year) are classified as passive assets. For this purpose, cash and other liquid assets are generally classified as passive and goodwill and other unbooked intangibles associated with active business activities may generally be classified as non-passive.
If we were to be classified as a PFIC in any taxable year, a U.S. person (as defined in “E. Taxation — U.S. Tax Considerations — Passive Foreign Investment Company”) would be subject to special rules generally intended to reduce or eliminate any benefits from the deferral of United States federal income tax that a U.S. person could derive from investing in a non-United States corporation that does not distribute all of its earnings on a current basis. Further, if we are classified as a PFIC for any year during which a U.S. person holds our Shares, we generally will continue to be treated as a PFIC for all succeeding years during which such U.S. person holds our Shares. For more information, see the section entitled “E. Taxation — U.S. Tax Considerations — Passive Foreign Investment Company”.
21
Fluctuations in the exchange rates between the U.S. dollar and other currencies in which we conduct our business could adversely affect our profitability
The operations of our Asian online game and service business are conducted in NT dollars, Hong Kong dollars, Renminbi and Singapore dollars. Accordingly, fluctuations in the exchange rates could have a positive or negative effect on our reported results. Generally, an appreciation of NT dollars, Hong Kong dollars, Renminbi or Singapore dollars against U.S. dollars results in a foreign exchange loss for monetary assets denominated in U.S. dollars, and a foreign exchange gain for monetary liabilities denominated in U.S. dollars. On the contrary, a devaluation of NT dollars, Hong Kong dollars, Renminbi or Singapore dollars against U.S. dollars results in a foreign exchange gain for monetary assets denominated in U.S. dollars, and a foreign exchange loss for monetary liabilities denominated in U.S. dollars. Given the constantly changing currency exposures and the substantial volatility of currency exchange rates, we cannot predict the effect of exchange rate fluctuations upon future operating results. There can be no assurance that we will not experience currency losses in the future, which could have a material adverse effect on our business, revenues, results of operations and financial condition.
| | |
| ITEM 4. | | INFORMATION ON THE COMPANY |
A. History and Development of Our Company
Our legal and commercial name is GigaMedia Limited. We trace our origin back to the incorporation of Hoshin GigaMedia in Taiwan in October 1998. For the purpose of a public equity offering, we were incorporated in Singapore in September 1999 as a company limited by shares. We acquired 99.99 percent of equity interest in Hoshin GigaMedia in November 1999 and the remaining 0.01 percent in October 2002.
In February 2000, we completed the initial public offering of our Shares. Our Shares are traded on the NASDAQ Stock Market under the symbol GIGM.
Prior to September 2002, we primarily provided broadband Internet access and services in Taiwan through Hoshin GigaMedia. In September 2002, we acquired Rose Records (formerly known as Point Records Co., Ltd.) and Tachung Records (formerly known as Music King Co., Ltd.), two of the largest music store chains in Taiwan. Subsequent to these two acquisitions, we commenced the recorded music distribution business.
In 2004, we began the restructuring of our principal business operations with a view to shifting our strategic focus to gaming software and service business and Asian online game and service business. The following chart highlights some of the major historical developments of our Company from 2004 to 2010:
| | | |
| Time | | Event |
| | | |
| April 2004 | | We acquired the business and operations of Grand Virtual, Inc., a privately-held gaming software developer and application service provider, and its affiliates. |
| | | |
| September 2005 | | We sold all of our ownership interest in the Rose Records and Tachung Records music store chains with a view to eliminating non-core operations. |
| | | |
| January 2006 | | We acquired FunTown, an Asian online game and service business operated in Taiwan and Hong Kong, to enhance our position in the online entertainment market. |
| | | |
| May 2006 | | We disposed of our ADSL business, which was an operational line of our Internet access and services business. |
| | | |
| December 2006 | | We acquired preferred shares in IAHGames, a leading online game operator, publisher and distributor in Southeast Asia, which were convertible into a 32.26 percent ordinary share interest in IAHGames. In 2007, due to IAHGames’ issuance of new preferred shares to third parties, the Company’s ownership percentage in IAHGames’ common equity on an as converted basis was reduced to 28.43 percent. In July 2010, we increased our ownership percentage in IAHGames to 80 percent by the acquisition of certain preferred shares from existing shareholders and the subscription for new preferred shares. |
| | | |
| June 2007 | | We completed the acquisition of the controlling interest in T2CN, one of the online casual game operators in the PRC. On August 8 and August 12, 2009, we acquired certain ordinary shares of T2CN from two existing shareholders respectively. As of May 31, 2011, we held approximately 67.09 percent of the total outstanding voting rights of T2CN. |
| | | |
| September 2008 | | We sold our last remaining non-core business, our consumer cable modem and corporate ISP business, to China Network Systems Co., Ltd. and its affiliates. The disposal effectively completed our business restructuring process which we began in 2004. For additional information, see Item 5, “Operating and Financial Review and Prospects — Certain Significant Events affecting Our Results of Operations for 2007, 2008 and 2009 — Divestiture of our legacy Internet access and service business” and Item 10, “Additional Information — C. Material Contracts — Sale of Internet Access and Service Business” in this annual report. |
| | | |
| April 2010 | | We completed the sale of a 60 percent interest in our online gaming software business to BetClic, a leading European sports betting and online gaming group. The strategic alliance with BetClic was structured as a stock and asset sale to a newly-formed French entity, Everest Gaming, in which we received a 40 percent stake. As part of and as a condition to the completion of the transaction, we purchased the shares of our then-major licensee, UIM, all of the material assets of which were sold to Everest Gaming as part of the transaction. |
| | | |
| April 2010 | | We entered into several agreements with IAHGames itself and certain shareholders of IAHGames, to acquire additional preferred shares of IAHGames. The acquisition of IAHGames was completed on July 1, 2010. As a result of the acquisition, we hold preferred shares convertible into 80 percent of common shares of IAHGames. IAHGames is a leading publisher, operator and distributor based in Singapore and operates several award-winning titles including EA SPORTS™ FIFA Online 2, Granado Espada and Dragonica and distributes Take Two Interactive products such as Grand Theft Auto IV™ and the NBA®2K series. IAHGames, through its wholly owned subsidiary Monsoon, entered into various agreements with Blizzard to distribute selected Blizzard Entertainment® games in Singapore, Malaysia, Thailand, Indonesia and the Philippines, including bestselling games from Blizzard’s Diablo® action-role-playing-game series, Warcraft® and StarCraft® real-time strategy-game series, including StarCraft II: |
| | | Wings of Liberty™, and World of Warcraft® and its three expansion sets, The Burning Crusade®, Wrath of the Lich King® and Cataclysm™. |
22
Our Singapore company registration number is 199905474H. Our principal executive offices are located at 8th Floor, 207 Tiding Boulevard, Section 2, Taipei 114, Taiwan, and our telephone number is 886-2-2656-8000. Our website address is: http://www.gigamedia.com.
Descriptions of our principal capital expenditures and divestitures and descriptions of acquisitions of material assets are found in our discussion and analysis of financial condition and results of operation and in the notes to our consolidated financial statements included elsewhere in this annual report.
There have been no public takeover offers by third parties in respect of our shares or by us in respect of other companies’ shares which have occurred during the last and current financial year.
B. Business Overview
We are an operator of online games in Greater China including the PRC, Taiwan, Hong Kong and Macau and Southeast Asia. We were incorporated in Singapore in September 1999. Our principal business operations remained limited to the provision of Internet access and service business, and recorded music distribution in Taiwan until 2004, when we commenced a business restructuring to shift our strategic focus to the gaming software and service and online games operations. We began our gaming software and service business in 2004 by acquiring the business of a gaming software provider. In 2006, through a series of strategic acquisitions, we expanded our operations into the online games market, which we believe has high growth potential. During the restructuring process, we disposed of our non-core businesses, including our retail music distribution and Internet and access service businesses. We completed the entire business restructuring in September 2008 with the sale of our last non-core business. We continued our business as provider of gaming software and service to the online gaming industry, particularly the online poker and casino markets, until the sale of the 60 percent interest in our gaming software and service business to BetClic on April 8, 2010.
Subsequent to completion of the restructuring and through April 8, 2010, we generated our revenue primarily through providing gaming software products and application services and operating online games. We operated our gaming software and service through CESL, our wholly-owned subsidiary. Since 2004, we have been focused on developing software packages for online poker and casino operations. We provided the Everest-branded gaming platform to various online poker and casino game sites, including Everest Poker, one of the world’s largest online poker websites in terms of seven-day average player counts according to PokerScout, a third-party online poker review service. Our products and services included online poker and casino gaming software packages, extensive online gaming management tools, and application and consulting services. To improve usability of our products in international markets and serve customers seeking geographic expansion, we developed the expertise and infrastructure to make our products suitable for the local markets in which the games are offered. Our gaming software products and services, now operated by Everest Gaming, are currently available in 15 major languages. Our gaming software and service business was historically dependent on our then-largest licensee, UIM. UIM operated various online poker and casino websites, including Everest Poker, primarily targeting players from Continental European markets. Fees earned by us were historically based on UIM’s gross receipts from the operation utilizing the licensed software. Historically, we had experienced seasonality primarily as a result of UIM’s slower sales in the second and third quarters, during which people tend to spend less time indoors and online as daylight hours increase and the weather conditions in Continental Europe improve. Typically, our first and fourth quarters were our strongest revenue periods. The financial results of UIM were historically incorporated into our consolidated financial statements in accordance with the FASB Accounting Standards Codification although we did not historically own any equity interest in UIM.
On April 8, 2010, we completed the sale of a 60 percent interest in our online gaming software business to BetClic, a leading European sports betting and online gaming group. The strategic alliance with BetClic was structured as a stock and asset sale to a newly-formed French entity, Everest Gaming, in which we received a 40 percent stake. As part of and as a condition to the completion of the transaction, we purchased the shares of our then-major licensee, UIM, all of the material assets (including the Everest Poker operations) of which were sold to Everest Gaming as part of the transaction. In accordance with the terms of the strategic alliance, Everest Gaming has been seeking to migrate all BetClic poker players to the Everest Poker platform creating one of the largest poker player “liquidity” platforms in Europe. On June 7, 2010, Everest Gaming received online poker licenses as part of the first grant of licenses in France. In July 2010, BetClic.fr and Everestpoker.fr, sites were approved by L’autorité de régulation des jeux en ligne (“ARJEL”), the French gaming regulatory authority for the French online poker market. Since July 2010, all of BetClic French poker players have been able to play on the Everest Poker platform by logging on to the BetClic.fr website and clicking a link. Chips are purchased using BetClic’s software and may be transferred for use on the Everest Poker platform. Everest Gaming plans to increase migration between the Everest Poker and BetClic Poker operations by allowing all of BetClic’s non-French European poker players to play on the Everest Poker platform by logging on to the BetClic.com website beginning in the third quarter of 2011. The combined user base of Everest Poker and BetClic Poker — both leading brands in France — strongly positions the alliance to capture dominant market share within the regulated French market, one of the largest in Europe. From and after April 9, 2010, we no longer consolidate the financial results of the gaming software and service business in our consolidated financial statements. From that date, we account for our interest in Everest Gaming using the equity method of accounting. As a result, it may be difficult to compare our results of operations in future periods to our historical results of operations.
23
We operate an increasingly diversified Asian online game and service business in Greater China markets. Since July 2007 and through June 2010, we conducted our Asian online game and service business in the PRC primarily through T2CN. Due to the dispute with Wang Ji, the former head of our Asian online game and service business in the PRC that arose in July 2010, we have been prevented from obtaining and currently do not have access to the financial information of T2CN. Given the uncertain timeline relating to the resolution of the dispute, and primarily because we still cannot exercise control over a majority of T2CN’s assets and its financial reporting process, we deconsolidated T2CN’s financial results with effect from July 1, 2010 and completely wrote off our investment and advances to the entities held or controlled by T2CN in the fourth quarter of 2010. See Item 8, “Financial Information — A. Consolidated Statements and Other Financial Information — Information on Legal or Arbitration Proceedings — Dispute with the former head of our Asian online game and service business in the PRC and former Chief Executive Officer of T2CN” in this annual report.
We operate our Asian online game and service business in Taiwan, Hong Kong and Macau primarily through FunTown and in the PRC through a newly established Chinese entity, JIDI, and our VIE, Shanghai JIDI. Our online game portfolio currently includes online MahJong, card, chance-based and simple casual games, advanced casual games, non-RPG MMOs and MMORPGs. We offer online MahJong through FunTown-branded game platform, which we believe is one of the largest online MahJong networks in Taiwan. We currently offer three advanced casual games and non-RPG MMOs through FunTown, including Tales Runner in Taiwan and Hong Kong, Nanaimo in Hong Kong and Alliance of Valiant Arms in Taiwan, Hong Kong and Macau. In addition, through our integrated FunTown-branded game platform, we offer over 34 online card, chance-based and simple casual games. To complement our online games, we offer various value-added services and virtual items for players to enhance their game experience, skills and online personal character. We focus on building community-based online platforms to cater to different social networking needs of our users and provide various channels to facilitate communications among them. We also launched our Mahjong game application which uses a web-based technology with no download required. This simplified user sign-in procedures and enabled tighter integration with the social networking platform.
We intend to continue to seek growth and enhance our market position in the online games industry. We will continue to focus on the Greater China markets and further diversify our online game portfolio. While we will continue to broaden our access to high quality online games through licensing, we intend to expand our in-house game development team and strengthen our online game development capabilities.
We also believe that Southeast Asia is a large and fast growing market opportunity. We entered into various agreements with Blizzard through Southeast Asia games operator IAHGames, of which we became a controlling shareholder since July 2010. In connection with the strategic alliance, IAHGames, through its wholly owned subsidiary Monsoon, entered into various agreements with Blizzard to distribute selected Blizzard Entertainment® games in Singapore, Malaysia, Thailand, Indonesia and the Philippines, include bestselling games from Blizzard’s Diablo® action-role-playing-game series, Warcraft® and StarCraft® real-time strategy-game series, including StarCraft II: Wings of Liberty™, and World of Warcraft® and its three expansion sets, The Burning Crusade®, Wrath of the Lich King® and Cataclysm™. IAHGames also operates award-winning titles including EA SPORTS™ FIFA Online 2, Granado Espada, Dragonica and distributes Take Two Interactive products such as Grand Theft Auto IV™ and the NBA®2K series.
While we have historically experienced significant growth in our operations of gaming software and service and Asian online game and service business, we experienced a significant downturn in 2009 and 2010. For the years ended December 31, 2008, 2009 and 2010, our revenue from the gaming software and service segment was US$144.8 million, US$112.7 million and US$25.8 million, respectively, and our revenue from the online games segment was US$45.6 million, US$46.9 million and US$38.9 million, respectively. For the years ended December 31, 2008, 2009 and 2010, our consolidated net income attributable to us was US$44.4 million, (US$49.1) million, and US$2.7 million, respectively.
Asian Online Game and Service Business
Our Operating Entities
FunTown
In January 2006, we acquired FunTown, an online game and service provider operated in Taiwan, Hong Kong and Macau, to enhance our position in the online entertainment market. We consolidated the financial results of FunTown into our consolidated financial statements since January 1, 2006. Through the FunTown-branded platform, we develop and offer various local versions of MahJong for players in Asia, particularly for those in Taiwan and Hong Kong. FunTown’s game portfolio currently includes advanced casual games and non-RPG MMOs and a variety of online card, chance-based and simple casual games.
T2CN
In June 2007, we completed the acquisition of the controlling interest in T2CN, one of the online casual game operators in the PRC. On August 8 and August 12, 2009, we acquired certain ordinary shares of T2CN from two existing shareholders respectively. As of December 31, 2010, we held approximately 67.09 percent of the total outstanding voting rights of T2CN.
24
Due to restrictions in the PRC on foreign equity ownership of companies providing Internet content services and certain other licensing restrictions, until June 30, 2010, we had operated our Asian online game and service business in the PRC through our three VIEs, T2 Entertainment, T2 Advertisement and Jinyou, which hold the licenses required for the operation of our Asian online game and service business in the PRC, and all of which are owned by PRC nationals. We licensed Freestyle, a highly popular online basketball game, from JC Entertainment and operate Freestyle in the PRC through T2 Entertainment. Until June 30, 2010, all of the three VIEs had been effectively controlled by T2 Technology, a wholly owned subsidiary of T2CN, through a series of contractual arrangements. See Item 4, “Information on the Company — C. Organizational Structure” in this annual report.
In addition, through T2 Technology, we entered into certain exclusive technical service agreements and exclusive commercial service agreements with T2 Entertainment, T2 Advertisement and Jinyou, respectively, under which T2 Technology provides various technical consulting services, business consulting services and other services to these VIEs in exchange for substantially all of their net incomes. We consolidated the financial results of T2 Entertainment and T2 Advertisement into our consolidated financial statements since July 2007 and the financial results of Jinyou since September 2008.
Due to the dispute related to our Asian online game and service business in the PRC with Wang Ji, the former head of our Asian online game and service business in the PRC, that arose in July 2010, we have been prevented from obtaining and currently do not have access to the financial information of the T2CN Operating Entities. While we are not aware that there has been any disruption to the ordinary business operations of the T2CN Operating Entities, no dividends or service fees have been declared or paid to the Company since the dispute began. We believe that Wang Ji currently has in his possession, among other things, the company seals, financial chops and business registration certificates of the T2CN Operating Entities. We have filed lawsuits against Wang Ji in the courts of the PRC, Hong Kong, Singapore and the British Virgin Islands seeking to recover, among other things, the tangible property of T2 Technology, J-Town and T2 Entertainment, including the company seals, financial chops and business certificates. The lawsuits assert a number of claims, including, among others, breach of fiduciary duty and conversion. In these matters, the Company is seeking to recover, among other things, the tangible property of T2 Technology, J-Town and T2 Entertainment, including the company seals, financial chops and business certificates, and monetary damages. These lawsuits are continuing in the relevant courts.
Given the uncertain timeline relating to the resolution of the dispute, and primarily because we still cannot exercise effective control over a majority of T2CN’s assets and its financial reporting process, although we still own 67.09 percent of T2CN’s common shares, we deconsolidated T2CN’s financial results with effect from July 1, 2010 and completely wrote off the recorded investment of $22.2 million (after removing the other comprehensive income component of equity related to T2CN from the Company’s balance) and advances of approximately $1.4 million in order to properly reflect the Company’s financial position as of December 31, 2010. We have been pursuing all means to regain effective control over the T2CN Operating Entities. See Item 8, “Financial Information — A. Consolidated Statements and Other Financial Information — Information on Legal or Arbitration Proceedings — Dispute with the former head of our Asian online game and service business in the PRC and former Chief Executive Officer of T2CN” in this annual report.
IAHGames
In December 2006, we acquired voting preferred shares in IAHGames, a leading online game operator, publisher and distributor in Southeast Asia, which were convertible into a 32.26 percent ordinary share interest in IAHGames. In 2007, due to IAHGames’ issuance of new preferred shares to third parties, the Company’s ownership percentage in IAHGames’ common equity on an as converted basis was reduced to 28.43 percent. In July 2010, we increased our ownership percentage in IAHGames to 80 percent through the acquisition of certain preferred shares and the subscription for new preferred shares. We consolidated the financial results of IAHGames into our consolidated financial statements since July 1, 2010. We acquired IAH in order to enhance our position in the online game market in Southeast Asia and strengthen our online entertainment product portfolio. See Item 5, “Operating and Financial Review and Prospects — A. Operating Results — Certain Significant Events Affecting Our Results of Operations for 2008, 2009 and 2010 — Acquisition of IAHGames”.
IAHGames, through Monsoon, its wholly owned subsidiary, entered into various agreements with Blizzard to distribute selected Blizzard Entertainment® games in Singapore, Malaysia, Thailand, Indonesia and the Philippines. The license and distribution agreements include bestselling games from Blizzard’s Diablo® action-role-playing-game series, Warcraft® and StarCraft® real-time strategy-game series, including StarCraft II: Wings of Liberty™, and World of Warcraft® and its three expansion sets, The Burning Crusade®, Wrath of the Lich King® and Cataclysm™. Although IAHGames owns 100 percent of the common shares of Monsoon, we determined that Monsoon cannot be consolidated by IAHGames due to the substantive participating rights that Blizzard has in Monsoon pursuant to Monsoon’s management agreement.
We have guaranteed to Blizzard the due and punctual observance by each of Monsoon and IAHGames of all of its respective financial obligations under various distribution agreements and services agreements and agreed to pay to Blizzard from time to time on demand by Blizzard all sums of money which either Monsoon and/or IAHGames is liable to pay to Blizzard under those agreements. Blizzard has the right to terminate those distribution or license agreements under certain circumstances.
IAHGames has agreed to create and issue to Blizzard warrants to subscribe for an aggregate of 15 percent of IAHGames’ ordinary shares, on a fully diluted basis, which is subject to certain adjustments in accordance with the warrant agreement. The subscription rights may be exercised by the warrant holder conditional upon the occurrence of certain circumstances. The warrants expire upon the expiration of certain game licenses or the date on which IAHGames’ shares commence trading on any domestic or international stock exchange. According to the terms and conditions of the warrant agreement, if IAHGames subsequently issues additional shares, IAHGames shall be obligated to issue additional warrants to the warrant holder necessary for the holder to maintain its 15 percent share ownership on a fully diluted basis, regardless of whether such additional shares are issued at, above, or below the market price.
25
In addition, IAHGames currently operates award-winning titles including EA SPORTS™ FIFA Online 2, Granado Espada, Dragonica and distributes Take Two Interactive products such as Grand Theft Auto IV™ and the NBA®2K series.
JIDI
We established JIDI, a wholly owned subsidiary in the PRC on October 22, 2010. We operate part of our Asian online game and service business in the PRC through our VIE, Shanghai JIDI, which was established in the PRC on December 6, 2010. Shanghai JIDI holds an ICP license and Internet cultural operation license and is in the process of applying for an Internet publishing license. Shanghai JIDI is owned by PRC nationals. We effectively control our VIE, Shanghai JIDI, through a series of contractual arrangements. We consolidated the financial results of Shanghai JIDI into our consolidated financial statements since January 2011. See Item 4, “Information on the Company — C. Organizational Structure” in this annual report.
Shanghai JIDI commercially launched the first jointly operated web game, Nan Di Bei Gai or NS Master, on April 25, 2011.
Our Games
We offer an increasingly diversified portfolio of online games, including MahJong, card, chance-based and simple casual games, advanced casual games, non-RPG MMOs and MMORPGs. Our Asian online game and service business is operated in Taiwan and Hong Kong primarily through FunTown, in the PRC through Shanghai JIDI, and in Southeast Asia through IAHGames.
MahJong
MahJong is a traditional and highly popular Chinese title game, which is widely played in Taiwan, Hong Kong, the PRC, Japan, South Korea and many other Asian regions. Similar to poker, MahJong involves skill, strategy, calculation, as well as a certain degree of chance.
Through our FunTown-branded platform, we develop and offer various local versions of MahJong for players in Asia, particularly for those from Taiwan and Hong Kong. To play our online MahJong games, players install the client-end software which can be downloaded free of charge from our game websites. Players can compete with anyone throughout the FunTown network. Our MahJong games are designed for players of all levels of skills and experience. To accommodate various needs of players, we offer different online MahJong rooms based on skill levels or stakes. We believe our online MahJong game site is one of the largest online MahJong networks in Taiwan.
Players may play our online MahJong free of charge. To continue to play on a regular basis and establish a track record inside our online MahJong community, players may choose to purchase game points or game-playing time through various distribution channels, such as convenience stores and computer-based payment processing terminals. By purchasing our game points, players may exchange for virtual currency and deposit into their virtual bank accounts. The virtual currency may be used to play MahJong and other games in the FunTown game site or to purchase in-game virtual items, but may not be redeemed for cash.
We continue to expand and diversify the game platforms for our online MahJong. In January 2009, in cooperation with Microsoft, we launched FunTown’s online MahJong on the Xbox 360 game consoles for worldwide release. Since April 2009, in cooperation with Skype Limited, we integrated Skype software’s Voice over IP functions into our online MahJong game system, allowing our MahJong game players to add friends from Skype to our game system and use Skype’s voice chatting function while playing our online MahJong games.
Our MahJong offering faced strong competition in 2010 from an explosion of online games offered on social network platforms. We responded by launching our MahJong game application which uses a web-based technology with no download required on January 11, 2011. This simplified user sign-in procedures and enabled tighter integration with social networking platform by allowing users to log into our game directly via their accounts at the social networking platform. We also recently launched a single person variation of our MahJong product on the iPad platform as a way of further broadening our platform reach.
We organize offline events from time to time with a view to attract more players and enhance our leading position in the online MahJong market. We organized the annual MahJong tournament for individual players in Taipei and over 4,000 players attended the final match in 2010.
Card, Chance-Based and Simple Casual Games
Through our FunTown-branded platform, we offer various online games, including card, chance-based and simple casual games. These online games are Internet-based and developed through computer simulation and adaptation of non-computer games, which are traditionally played offline. The FunTown platform targets players from different regions, particularly Taiwan and Hong Kong.
26
We provide many different online card games, which are popular in various regions in Asia. Players can select their desired table based on the level of skill or stakes. These games are designed with online multiplayer features that allow players to compete against one another. To diversify FunTown products, we also offer chance-based games, including bingo, lotto, horse racing, Sic-Bo, slots and various simple casual games. We are working towards expanding the casual games platform by providing a variety of casual games. Since 2009, we introduced World Tour Video Slot, Race Course Winner, Baccarat, Pirates Pachi Slot, Paradise Island, Red Dog, Roshambo, Pai Gow Poker, Double Double Bonus Poker, Grand Slam Mahjong, Four Saint Beast Pachi Slot, Pirates Pachi Slot II and Mahjong-Bingo into our game contents. These newly added games improve the competitiveness of our Asian online game and service business and help to increase our revenues.
Like online MahJong, players may play our FunTown games for free. They may choose to purchase playing time or virtual currency to play on a continuous and regular basis. Virtual currencies may be used to play all the games in the FunTown game site or to purchase virtual items, but may not be redeemed for cash.
Advanced Casual Games and Non-RPG MMOs
As compared to MMORPGs, advanced casual games and non-RPG MMOs have relatively simple rules and require no long-term commitment to play. They are targeted to the casual players across all game genres. We operate a diversified portfolio of advanced casual games and non-RPG MMOs. We believe that advanced casual games and non-RPG MMOs provide us with certain benefits and opportunities not typically available through MMORPGs, including:
| | • | | broader range of players, including casual players, due to the casual nature and relatively short duration; and |
| | • | | a greater breadth of tools, engines, middleware and server solutions that can make development of casual games relatively more cost-effective. |
In Taiwan and Hong Kong, we offer various advanced casual games and non-RPG MMOs through FunTown. In June 2006, we launched our first advanced casual game, Tales Runner. Tales Runner is a multi-player obstacle running game in which players compete by running, jumping, dashing and using items. Since the launch, Tales Runner has become one of the most popular online sports games in Hong Kong. In December 2007, we launched Nanaimo, a cute style action-based casual game. In Southeast Asia, we offer various advanced casual games and non-RPG MMOs through IAHGames. In March, 2010, we secured an exclusive license from Neowiz Corporation, an online game company in South Korea, to operate Alliance of Valiant Arms (“A.V.A”), an online massively multiplayer first person shooter game which provides large-scale and team-based combat. We commercially launched A.V.A in Taiwan, Hong Kong and Macau on November 17, 2010.
The following table summarizes our advanced casual games and non-RPG MMOs that we offered as of the date of this annual report:
| | | | | | | | | | | |
| | | | | Commercial | | | | Revenue | | |
| Game | | Description | | Launch | | Game Source | | Model | | Market |
| | | | | | | | | | | |
| Tales Runner | | Sports — Obstacle running | | June 2006 in Taiwan August 2006 in Hong Kong | | Licensed | | Item-billing | | Taiwan Hong Kong |
| | | | | | | | | | | |
| Nanaimo | | Action | | December 2007 | | Licensed | | Item-billing | | Hong Kong |
| | | | | | | | | | | |
EA Sports™ FIFA
Online 2 (Thai) | | Online Sports Game | | December 11, 2008 | | Licensed | | Item-billing | | Thailand |
| | | | | | | | | | | |
EA Sports™ FIFA
Online 2
(Vietnamese) | | Online Sports Game | | January 8, 2009 | | Licensed | | Item-billing | | Vietnam |
| | | | | | | | | | | |
EA Sports™ FIFA
Online 2 (English) | | Online Sports Game | | January 23, 2009 | | Licensed | | Item-billing | | Singapore Malaysia |
| |
| | Casual Web Game | | December 23, 2009 in Hong Kong
March 25, 2010 in Taiwan | | Licensed | | Item-billing | | Hong Kong |
| | | | | | | | | | | |
StarCraft® II: Wings of Liberty™ | | Real-time Strategy
Game | | July 27, 2010 release of boxed licensed products
November 2010 Commercial launch of licensed game online | | Licensed | | Buy-to-play or Pay-to-Play | | Singapore Malaysia
Thailand Indonesia
Philippines Hong
Kong
Macau |
| | | | | | | | | | | |
| Counter-Strike Online | | First Person
Shooting Game | | October 27, 2010 | | Licensed | | Item-billing | | Singapore Malaysia |
| | | | | | | | | | | |
| Paperman | | First Person
Shooting Game | | November 12, 2010 | | Licensed | | Item-billing | | Thailand |
| | | | | | | | | | | |
| Alliance of Valiant Arms | | Massively
multiplayer First
Person Shooting
Game | | November 17, 2010 | | Licensed | | Item-billing | | Taiwan
Hong Kong
Macau |
27
The following table summarizes our advanced casual games and non-RPG MMOs which we expect to launch in various geographic markets as indicated at regular intervals in 2011:
| | | | | | | | | |
| Game | | Description | | Status | | Game Source | | Target Market |
| | | | | | | | | |
| Paperman | | First Person
Shooting Game | | Game Localization | | Licensed | | Indonesia |
| | | | | | | | | |
EA Sports™ FIFA
Online 2 (English) | | Online Sports Game | | Closed Beta Testing | | Licensed | | Indonesia |
Players download and install client software from our websites. Our advanced casual games and non-RPG MMOs are offered free-of-charge to all players. In order to enhance their online game playing experience, players may purchase virtual items that enhance their characters’ performance and game playing experience, or personalize their characters.
MMORPGs
MMORPGs are Internet-based computer games in which a large number of players interact with one another in an online virtual world. Like any role playing video game, a player controls a character with an avatar, which he or she directs to complete tasks for experience points, interact with other characters and acquire items.
Since 2006, we have expanded our online game operations to include several MMORPGs. We continue to enlarge and diversify our MMORPG portfolio, which includes seven MMORPGs that we currently offer or expect to launch in various target markets in Greater China and Southeast Asia. Our MMORPGs encompass various genres, including adventure, action, war and casual fantasy. The following table summarizes MMORPGs that we offered as of the date of this annual report:
| | | | | | | | | | | |
| | | | | Commercial | | Game | | Revenue | | |
| Game | | Description | | Launch | | Source | | Model | | Market |
| Granado Espada | | MMORPG | | August 20, 2007 | | Licensed | | Item-billing | | Singapore
Malaysia
Philippines |
| | | | | | | | | | | |
| Emil Chronicle Online | | MMORPG | | September 14, 2007 | | Licensed | | Item-billing | | Thailand |
| | | | | | | | | | | |
| Dragonica (Chinese) | | MMORPG | | June 4, 2009 | | Licensed | | Item-billing | | Malaysia |
| | | | | | | | | | | |
Nan Di Bei Gai
or NS Master | | 2D Flash MMORPG | | April 25, 2011 | | Joint Operation | | Free-to-Play | | PRC |
28
We launched Warhammer Online: Age of Reckoning in Taiwan, Hong Kong and Macau in June 2009 and Luna Online in the PRC in July 2009, respectively. These two games were not commercially successful in the territories in which they were launched. As a result, we terminated the Warhammer Online: Age of Reckoning license and distribution agreement and the Luna Online game license agreement with the relevant game developers by mutual agreement on April 22, 2010 and June 1, 2010, respectively. As part of the termination of the operation of these games and to provide a transition for end users, we allowed end users to continue playing Warhammer Online and Luna Online for a certain period after the termination date of the license agreements. We completely ceased the operation of the Warhammer Online and the Luna Online on June 17, 2010 and August 30, 2010, respectively.
We launched Holic Online in Taiwan in January 2009. This game was not commercially successful in Taiwan. We did not commercially launch the game in the PRC. As a result, we terminated the Holic Online exclusive game license agreements in relation to the licensing of the Holic Online both in Taiwan and the PRC with the relevant game developer by mutual agreement on December 10, 2010. As part of the termination of the operation of this game and to provide a transition for end users, we allowed end users to continue playing the Holic Online for a certain period after the termination date of the license agreement. On March 31, 2011, we completely ceased the operation of the Holic Online in Taiwan.
Nan Di Bei Gai is jointly operated by Shanghai JIDI and a third party game developer. Under the joint operation model, the third party game developer is responsible for game development and providing technical support to game operation and JIDI is responsible for installing and maintaining game servers, operating the game on JIDI platform and providing online game services for the users to enhance their playing and entertainment experiences. The third party game developer and JIDI share game revenues generated by the operation of such game proportionally as agreed by both parties.
We also sell boxed MMORPGs licensed from third party game developers or publishers in certain authorized territories. Players can play games online and interact with others within a virtual game world. The following table summarizes MMORPGs that we distributed as of the date of this annual report:
| | | | | | | | | |
| | | | | Started | | | | |
| Game | | Description | | Distribution | | Game Source | | Market |
| | | | | | | | | |
World of Warcraft®: Cataclysm™ | | MMORPG | | December 7, 2010 | | Licensed | | Singapore, Malaysia
Thailand, Indonesia
Philippines |
World of Warcraft®: Wrath of the Lich King® | | MMORPG | | January 12, 2010 | | Licensed | | Singapore, Malaysia
Thailand, Indonesia
Philippines |
World of Warcraft®: The Burning Crusade® | | MMORPG | | January 12, 2010 | | Licensed | | Singapore, Malaysia
Thailand, Indonesia
Philippines |
World of Warcraft® | | MMORPG | | January 12, 2010 | | Licensed | | Singapore, Malaysia
Thailand, Indonesia
Philippines |
World of Warcraft® Prepaid Game Cards | | MMORPG | | January 12, 2010 | | Licensed | | Singapore, Malaysia
Thailand, Indonesia
Philippines |
The following table summarizes three MMORPGs which we expect to launch in various geographic markets in the next few years:
| | | | | | | | | |
| Game | | Description | | Status | | Game Source | | Target Market |
| ArcheAge | | Medieval Fantasy Themed Action Role-Playing Game | | Closed Beta Testing in Korea | | Licensed | | Taiwan
Hong Kong
Macau |
| 4Story | | Cartoon Fantasy Themed Role-Playing Game | | Game Localization | | Licensed | | Taiwan
Hong Kong
Macau |
| SpongeBob SquarePants | | MMORPG | | Under Development | | Co-Development | | Asia |
29
On March 18, 2010, we entered into a game development, publishing and distribution agreement with Nickelodeon pursuant to which we agreed to develop, publish and distribute a MMORPG in the PRC, Korea, Japan, Taiwan, Southeast Asia and India based upon and branded with the Nickelodeon animated television program “SpongeBob SquarePants” for Nickelodeon.
Certain games like the StarCraft® II series are operated under the buy-to-play revenue model (“Buy-to-Play”), where gamers purchase the retail box of the games, giving them unlimited lifetime access to the games.
Others are operated or expected to be operated under the item-billing revenue model (“Item-Billing”). Under the Item-Billing model, users are able to access the basic functions of a MMORPG for free. Players may choose to purchase in-game value-added services as well as in-game virtual items and premium features to enhance the game experience. These services and items allow players to utilize more functions, improve performance and skills, and personalize the appearance of a game character. Game points are consumed as users purchase value-added services and in-game items.
PC and Console Games
We sell boxed game products licensed from third party game developers or publishers in certain authorized territories. In January 2010, we entered into various agreements with Blizzard, a leading online game, personal computer, console and hand-held game publisher based in the U.S. to distribute select Blizzard Entertainment® games in Singapore, Malaysia, Thailand, Indonesia and the Philippines. Unlike our other online games, PC and Console game players cannot interact with others by playing online. The following table summarizes games that we distributed as of the date of this annual report:
| | | | | | | | | |
| Game | | Description | | Started Distribution | | Game Source | | Markets |
| | | | | | | | | |
| Grand Theft Auto IV™ | | Action | | April 29, 2008 | | Licensed | | Singapore, Malaysia, Thailand, Indonesia, Philippines |
| | | | | | | | | |
| Borderlands | | First Person Shooter & RPG | | October 20, 2009 | | Licensed | | Singapore, Malaysia, Thailand, Indonesia, Philippines |
| | | | | | | | | |
StarCraft® Battle Chest® | | Real-time Strategy Game | | January 12, 2010 | | Licensed | | Singapore, Malaysia, Thailand, Indonesia, Philippines |
| | | | | | | | | |
Warcraft® Battle Chest® | | Real-time Strategy Game | | January 12, 2010 | | Licensed | | Singapore, Malaysia, Thailand, Indonesia, Philippines |
| | | | | | | | | |
Diablo® Battle Chest® | | Action Role Playing Game | | January 12, 2010 | | Licensed | | Singapore, Malaysia, Thailand, Indonesia, Philippines |
| | | | | | | | | |
Diablo® II | | Action Role Playing Game | | January 12, 2010 | | Licensed | | Singapore, Malaysia, Thailand, Indonesia, Philippines |
| | | | | | | | | |
Diablo® II Expansion Set: Lord of Destruction® | | Action Role Playing Game | | January 12, 2010 | | Licensed | | Singapore, Malaysia, Thailand, Indonesia, Philippines |
| | | | | | | | | |
Warcraft® III: Reign of Chaos® | | Real-time Strategy Game | | January 12, 2010 | | Licensed | | Singapore, Malaysia, Thailand, Indonesia, Philippines |
| | | | | | | | | |
Warcraft® III: The Frozen Throne® | | Real-time Strategy Game | | January 12, 2010 | | Licensed | | Singapore, Malaysia, Thailand, Indonesia, Philippines |
| | | | | | | | | |
| Red Dead Redemption | | Open War Shooter | | May 18, 2010 | | Licensed | | Singapore, Malaysia, Thailand, Indonesia, Philippines |
| | | | | | | | | |
Sid Meier’s Civilization V® | | Strategy | | September 21, 2010 | | Licensed | | Singapore, Malaysia, Thailand, Indonesia, Philippines |
30
Game Sources
In-house development of MahJong, Card, Chance-Based and Simple Casual Games
We develop our games offered on FunTown’s game platform, including online MahJong, card, chance-based and simple casual games. Our in-house development enables us to have better control of the game features and allow for seamless integration into our FunTown platform. In order to support product development capabilities and develop our proprietary online games, we have an in-house team, which was comprised of approximately 46 software engineers in Taipei as of May 31, 2011.
Sources of MMORPGs, Advanced Casual Games and Non-RPG MMOs
We primarily source MMORPGs, advanced casual games and non-RPG MMOs through licensing from developers in various regions where online game development is well established. We monitor each of the United States, South Korean, the PRC, Japanese, Southeast Asia and European markets and maintain communications with a number of leading game development studios to identify and source new online games.
In selecting games, we evaluate the key factors that indicate the market trend and player demand and interest in the regions where we operate. We believe that our market analysis enables us to better assess the quality, risks, costs and potential returns of the games.
Prior to negotiating a license agreement with a game developer, our game testing team evaluates the game and prepares detailed evaluation reports covering the theme, storyline, in-game culture and environment, character progression, system architecture, game art and design, virtual articles and items.
We enter into the license agreement after we decide to operate the selected game based on the results of our evaluation. The cost of licensing games from developers generally consists of an upfront licensing fee, which we normally pay in several installments, and ongoing licensing fees, or royalties, which are equal to a percentage of revenues generated from operation of the game. We may also have to provide certain minimum guarantees in royalties to developers.
In preparing for the commercial launch of each new game, we cooperate with the game developer to localize the game to make it suitable for the target markets where we plan to launch. Once the developer completes the localization and provides the first-built version, we conduct closed beta testing of the game with a select group of users. During the test period, we identify and eliminate any technical problems, assess how likely users will be to play the game regularly over a period of time (referred to as user “stickiness”), and modify and add certain game features in order to increase user stickiness. The closed beta testing is followed by open beta testing, during which we operate our games under open market conditions and monitor the performance, consistency and stability of operational systems for the game.
Following the commercial launch of a game, we continuously implement improvements and upgrades to our games.
While we will continue to broaden our access to high quality online games through licensing, we intend to expand our in-house game development team and strengthen our online game development capabilities.
31
Our Primary Platforms and Services
FunTown
Our FunTown platform provides many online game services for the users to enhance their playing and entertainment experiences, facilitate information communication among them and support the development of a strong player community. These services include:
| | • | | Player Clubs. FunTown offers online club services in its game community. FunTown players can form their own clubs, invite other players with similar interests or skill levels to join, and organize online and offline events for club members. Player clubs complement the strong social features of online games by helping to maintain an online game community. |
| | • | | Tournaments. FunTown provides various tournaments for its online MahJong players. After players join a club, they can participate in online in-club tournaments and compete in weekly online inter-club tournaments. On an annual basis, FunTown organizes large-scale tournaments, in which a large number of players are invited to the tournament premises and compete online via computers. |
| | • | | Avatars. To enhance players’ overall entertainment experience, FunTown offers many in-game virtual items which may be purchased by players to customize their online personal graphic profiles, or avatars. Players use avatars to create their own unique look while participating in the online community. The virtual items for avatars include facial expressions, clothes and different accessories. These items are particularly popular with younger players, who customize their avatars to establish unique identities and pursue distinct fashions in the online community. |
| | • | | Friends and Family Messenger. The FunTown platform has a unique function designed for players’ personal contacts, which is similar to the contact list of instant message programs. This enables players to see when their friends and family members are online and invite people in their personal network to play games together. |
| | • | | Social Networking. The FunTown platform provides an online social networking community called FunTown Village, in which players meet each other through their online avatars. In FunTown Village, players can interact and communicate, purchase virtual items, and even get married virtually. FunTown plans to introduce more virtual items within FunTown Village to address the strong social interests of its players and to help increase FunTown’s overall appeal as a distinct online game community. |
| | • | | Customer Services. FunTown provides support and services to its customers primarily through walk-in customer service centers in Taipei and Hong Kong and e-mails and online bulletin boards where players can inquire and receive responses from FunTown and other players. |
| | • | | Other Platforms. FunTown expects to launch its current online games onto other platforms, including Android platform and Apple’s iOS platform and to allow data synchronization between each of these platforms. |
IAHGames
Our IAHGames platform provides the following services and player support to our users in the Southeast Asia:
| | • | | Membership Management. IAHGames utilizes an integrated service platform, namely IAHGames Passport, to provide one-stop service to customers. IAHGames Passport is an integrated membership management and payment system, which allows IAHGames to maintain a single customer database containing each customer’s profile and transaction history. Customers may log in, activate the games they wish to play, top up their game accounts or pay to use any of the fee-based products and services. IAHGames Passport offers a variety of payment methods including pre-paid cards, online payments, credit card payment as well as mobile payment. To date, IAHGames Passport can collect payment (with pre-paid card integration) from Singapore, Thailand, Malaysia, Indonesia, Philippines, Hong Kong and Taiwan. Players can use IAHGames Passport to purchase game credits for any game offered by IAHGames in micro transactions. Apart from IAHGames Passport, IAHGames has an ecosystem of websites, forums and customer relationship management for any online game IAHGames publishes and operates. IAHGames Passport offers users “single sign-in” access to all these services. |
| | • | | Tournaments. IAHGames provides various tournaments for its online games players. IAHGames organizes both online and off-line tournaments for its various games, where the winners can win prizes and qualify to take part in national or regional tournaments. On an annual basis, IAHGames organizes large-scale tournaments, where winners of national tournaments come together to compete in a regional competition. |
| | • | | Game Masters. IAHGames delegates game masters to provide various in-game services for its online game players. Game masters are responsible for organizing in-game events, troubleshooting and actively and continuously monitoring the online game environment. They respond to players’ inquiries, handle error reporting and removal process, and identify and deter inappropriate player behaviors. IAHGames believes that the provision of game masters is an important customer service function to maintain customer loyalty and effectively address technical problems as they arise. |
32
| | • | | Customer Services. IAHGames focuses on providing quality customer service in order to retain its existing customers as well as attract new customers. IAHGames offers multiple communication channels, including telephone hotline and customer service ticketing system, for the customers to provide feedback and complaints about its products or services at any time. |
JIDI
Our JIDI platform provides the following services and player support to our users in the PRC:
| | • | | Membership Management. JIDI utilizes an integrated service platform, namely JIDI-Passport, to provide one-stop service to customers as well as distributors. JIDI-Passport is an integrated membership management and payment system, which allows JIDI to maintain a single customer database containing each customer’s profile and transaction history. Customers may log in, pay and use any of the fee-based products and services. In addition, JIDI-Passport allows our distributors to sell our game points to Internet cafés. Internet cafés can also use JIDI-Passport to check their point-balances and make payment on behalf of individual purchasers. |
| | • | | Virtual Items. To enhance players’ overall entertainment experience, JIDI offers many in-game virtual items which may be purchased by players to enhance the player attacking or defense power, the armor and weapons and to customize their online personal graphic profiles or avatars. Players are able to enhance their attacking and/or defense power with an alternative virtual item purchase instead of going through a certain amount of hours in game mission based practice. Such armor and weapon virtual items are popular for players in war story line based and Chinese Kung Fu type online games. Furthermore, players use avatars to create their own unique look while participating in the online community. The virtual items for avatars include facial expressions, clothes and different accessories. These items are particularly popular with younger players, who customize their avatars to establish unique identities and pursue distinct fashions in the online community. |
| | • | | Social Networking. JIDI’s integrated system also incorporates a variety of online community features, such as bulletin boards which allow registered users to post notes or inquiries and respond to other users’ questions and comments. JIDI believes these features increase the user stickiness on our site and facilitate player interaction. JIDI is currently building an online social networking community to further facilitate access to its online game offering and accommodate different social net working needs of its users in the PRC. |
| | • | | Customer Services. JIDI focuses on providing quality customer service in order to retain its existing customers as well as attract new customers. JIDI offers multiple communication channels, including telephone hotline and customer service email, for the customers to provide feedback and complaints about its products or services at any time. |
PC Based Platforms for Certain Games
As technologies advance and enable people to access the Internet in new ways, we plan to expand our offerings to match these new access technologies and platforms. In January 2009, we launched FunTown MahJong, our first Xbox 360 game title for worldwide release. We also offer certain of our popular games on the media-on-demand (“MOD”) digital TV platform, called FunTown Game Zone, which involves cooperation with Intel by utilizing its Viiv technology.
33
We launched our Mahjong game application which uses a web-based technology with no download required. This simplified user sign-in procedures and enabled tighter integration with social networking platform by allowing users to log into our game directly via their accounts at the social networking platform. We also launched a single person variation of our MahJong product on the iPad platform as a way of further broadening our platform reach.
We have also developed mobile phone versions of our certain games. In addition, as the video games become an emerging facet of in-flight entertainment, we offer various in-flight games to certain airlines, which are networked to allow interactive game play among multiple passengers on the same flight.
Our Marketing
Our marketing strategy is to capitalize on our established brand names and utilize our diverse distribution networks to retain our existing users and attract new users. We use various qualitative and quantitative market research methods to analyze our target market and to differentiate our product offerings from those of our competitors. We are engaged in a variety of traditional and online marketing programs and promotional activities, including the following:
In-Game Events and Marketing
We organize in-game events for our users, which we believe encourages the development of online communication and teamwork among our users and increases user interest in our games. Examples of in-game events include scheduled challenges or competitions for prizes. In addition, we use in-game events to introduce new features of our games.
Cross-Marketing
We have cross-marketing relationships with popular consumer brands, major technology companies, telecommunication carriers, popular movie producers and publishers. We believe that our cross-marketing relationships with certain well-known companies, including Coca-Cola, 7-11 and Microsoft, Adidas, Razer, Steel Series, Toshiba, Dell, Western Digital, SingTel, StarHub, will increase the recognition of our online game brands.
Open Beta Testing
Our open beta testing is conducted under open market conditions. During open beta testing, we do not charge users to play the new game. Open beta testing serves important marketing functions, including instilling initial interests, establishing an initial user base, and generating word-of-mouth publicity to support the following commercial launch of the game.
Advertisements and Offline Promotions
We advertise our brand names and our games across a variety of media, including newspapers, the Internet, television, radio and outdoor advertisements. From time to time we distribute game-related posters, promotional prepaid cards for new users and souvenirs at trade shows, selected Internet cafés and other locations. We have contracted with various Internet café unions directly or via agents to promote our games in Internet café, or popup windows to designated Internet portals in the PRC. We also conduct events at popular venues to stage exhibitions, distribute software and game content-related merchandise, and interact directly with our users.
Game Magazines
In addition to advertising certain games in various magazines, we also collaborate with certain game magazines for various promotions, including giving away copies of certain games free of charge with each magazine sold.
New Media Promotion
In addition to advertising certain games in conventional channels described above, we also collaborate with certain new media channels, for example, the micro-blogging services provided with Sina and the PRC focused search engine services.
34
Direct Marketing
We use telemarketing and email correspondence to inform our users of new games, promotions and other game-related services.
Our Distribution and Payment Channels
We sell game points for our online games through various channels. Our distribution and payment channels include:
Offline Physical Distribution Channels
Physical distribution channels include convenience chain stores, gaming and related retail stores, supermarkets and Internet cafés. At these locations, users may purchase pre-paid game cards with varying amounts of game points. Alternatively, users may purchase game packs to play specific games on FunTown, IAHGames and JIDI’s game platforms.
Internet-Based Distribution Channels
Internet-based distribution channels consist of various websites, including official websites of FunTown, IAHGames and JIDI. Users may purchase game points through these websites with their credit cards or computer-based payment processing terminals.
Telecommunication Network Operators
We also distribute game points through cooperation with telecommunication network operators and their service providers. Our cooperating operators and service providers charge the fees to the purchasers’ phone bills, which are prepared and collected by the network operators.
Payment Aggregators
We also work with established payment aggregators. These payment aggregators allow users to pay for a variety of products and services, such as mobile phone calls and game points of different game operators, using their pre-paid scratch cards, vouchers or codes printed on receipts.
We sell our game points to distributors at prices lower than the face value of the game points. The costs of distributing game points through Internet-based channels are generally lower than the costs involved in offline distribution of physical game cards. To encourage use of the Internet-based channels and provide more convenience for users, in certain markets we give our users the computer-based payment processing terminals for free so that they can purchase game points online.
Our Operation Architecture
We have a scalable and modular operation architecture that enables us to support and expand our game offerings and services. The architecture consists of several key subsystems, including game services, central user database, billing and payment, online customer service, game telemetry and monitoring. FunTown, IAHGames and JIDI have their own unified user account systems, which allow players to use a single account to access all FunTown games, IAHGames games and JIDI games, respectively. Our billing and game management system supports various billing models and deposit options, and is sufficiently flexible to accommodate in-house developed games and licensed games. Our customer service system enables us to assist our players inside and outside the games. Our game telemetry and monitoring system allows us to track our concurrent online users in real time and effectively identify and fix technical problems in our server network.
Technology Infrastructure
Due to the real-time interaction among thousands of users, the stable operation of our onlíne games requires a significant number of servers and a significant amount of connectivity bandwidth. We have developed an extensive technology infrastructure that supports the operation of our online games.
As of May 31, 2011, we owned approximately 54 servers for our online games operation in the PRC.
35
As of May 31, 2011, we owned approximately 764 servers and leased 15 servers from ISPs for our online games operation in Taiwan and Hong Kong. As of the same date, our server network in Taiwan and Hong Kong consisted of approximately 503 game servers.
As of May 31, 2011, we owned more than 300 servers for our online games operation in Southeast Asia.
We seek to adapt our infrastructure promptly in response to changing circumstances.
Our Players
In the PRC, as we launched our first web game, Nan Di Bei Gai or NS Master, on April 25, 2011, we did not have a significant number for registered usernames of our online games as of May 31, 2011.
In Taiwan and Hong Kong, as of May 31, 2011, we had an aggregate of over 17.2 million registered usernames of our online games. In the month of December 2010, we recorded over 66.1 thousand paying players, approximately 38.1 thousand peak concurrent users.
In Southeast Asia, as of May 31, 2011, we had an aggregate of 16.7 million registered usernames of our online games. In the month of December 2010, we recorded over 200,000 paying players and approximately 82,000 peak concurrent users.
Competition
Our primary competitors in the Asian online game and service business are online game operators based in Taiwan, the PRC and Southeast Asia. Our major competitors in Taiwan include Gamania, Soft-World, IGS, UserJoy and GodGame. Our major competitors in the PRC include Shanda, Giant, Changyou, The9 Limited, Nineyou, Tencent, Perfect World, Kingsoft, Ourgames.com and Chinagames.net. Our major competitors in Southeast Asia include Asiasoft and Lyto.
In addition, we compete for users against various offline games, such as console games, arcade games and handheld games, as well as various other forms of traditional or other online entertainment.
We expect more online games operating companies to enter into the markets where we operate, including Taiwan, the PRC, Hong Kong and Southeast Asia, and that a wider range of online games to be introduced to the these market given the relatively low entry barriers to the online games industry. Our competitors vary in size and include private and public companies, many of which have greater financial, marketing and technical resources as well as name recognition. We intend to continue to enhance our market position through providing competitive products and quality services that meet market trends and users’ preferences, as well as strengthening sales effectiveness.
Gaming Software and Service Business
On April 8, 2010, we completed the sale of a 60 percent interest in our online gaming software and service business to BetClic, a leading European sports betting and online gaming group. We hold the remaining 40 percent of Everest Gaming with a put option to sell all or part of our share to BetClic and BetClic holds a call option on any remaining Everest Gaming interests held by us. For both our put option and BetClic’ call option, the price paid will be determined based upon the fair market value of Everest Gaming as of December 31 of the prior year, as determined by mutual agreement between the parties or, failing that, an appraisal process. See “— Sale of Material Assets of CESL and UIM to Everest Gaming, and Investment in Everest Gaming” below. Everest Gaming operates a multilingual, multi-product game platform, namely the Everest-branded gaming platform, which offers online poker and casino games.
Everest Gaming
Following the acquisition of the 60 percent interest in our online gaming software and service business to BetClic on April 8, 2010, Everest Gaming operates directly the software and service business previously operated by CESL and the online entertainment operator business previously operated directly by UIM. While BetClic generally controls the day-to-day operations of Everest Gaming, we have approval rights over certain material actions of Everest Gaming, including certain issuances of securities of Everest Gaming, certain acquisitions and dispositions of assets and material changes to the principal business of Everest Gaming. New CIDC Delaware Corp., a company wholly owned by Everest Gaming and incorporated in the U.S., provides software development services to Everest Gaming.
Everest Gaming operates online poker games and online casinos. Everest Gaming’s games are available in 15 supported languages, including Danish, Dutch, English, Finnish, French, German, Greek, Hungarian, Italian, Japanese, Norwegian, Polish, Portuguese, Spanish and Swedish. Its poker offering includes popular poker games such as Texas Hold’em and Omaha. All of Everest Gaming’s poker games are real-time and multi-player capable and features 3D graphics and realistic visual effects. Everest Gaming also offers a full range of traditional and new casino games, including blackjack, video poker, slots, roulette, solitaire and others. Its casino game client can be skinned with different interfaces, enabling Everest Gaming to market casinos under a number of different brands and custom-branded casinos for its affiliates.
36
Everest Gaming operates under two full remote gaming licenses (a Class 1 and a Class 3) issued by Malta Lotteries and Gaming Authority and a license issued by the Kahnawake Gaming Commission, subject to continuing compliance with applicable licensing requirements. Everest Gaming’s primary computer server operations are located in Malta with certain non-operational components of its business operating from servers in Kahnawake. See Item 4, “Information on the Company — B. Business Overview — Regulation — Regulation Relating to Online Gaming.”
In accordance with the terms of the strategic alliance, Everest Gaming has been seeking to migrate all BetClic poker players to the Everest Poker platform in order to create one of the largest poker player “liquidity” platforms in Europe. On June 7, 2010, Everest Gaming received online poker licenses as part of the first grant of licenses in France. In July 2010, BetClic.fr and Everestpoker.fr, sites were approved by ARJEL, the French gaming regulatory authority for the French online poker market. Since July 2010, all of BetClic French poker players have been able to play on the Everest Poker platform by logging on to the BetClic.fr website and clicking a link. Chips are purchased using BetClic’s software and may be transferred for use on the Everest Poker platform. Everest Gaming plans to increase migration between the Everest Poker and BetClic Poker operations by allowing all of BetClic’s non-French European poker players to play on the Everest Poker platform by logging on to the BetClic.com website beginning in the third quarter of 2011. The combined user base of Everest Poker and BetClic Poker — both leading brands in France — strongly positions the alliance to capture dominant market share within the regulated French market, one of the largest in Europe.
Terms of our joint venture with BetClic regarding Everest Gaming
On April 8, 2010, we completed the sale of a 60 percent interest in our online gaming software business to BetClic. BetClic is jointly owned by former media tycoon Stephane Courbit’s Lov Group and the world renowned Monte Carlo Casino owner Société des Bains de Mer de Monaco, controlled by the Principality of Monaco. BetClic has an extensive European gambling portfolio, including BetClic, Expekt, and Bet-at-Home, together offering sports betting, poker and casino services to over four million registered users in over 25 countries. The strategic alliance with BetClic was structured as a stock and asset sale to a newly-formed French entity, Everest Gaming, in which we received a 40 percent stake.
As part of and as a condition to the completion of the transaction, we purchased the shares of our then-major licensee UIM all of the material assets of which were sold to Everest Gaming as part of the transaction. We sometimes refer to our online gaming software business and UIM’s business as the “Everest Business.” For its 60 percent stake in the Everest Business, BetClic made an initial cash payment of approximately US$100 million, which may be followed by a final earn-out payment in 2012 to be determined by reference to the fair-market value of Everest Gaming in May 2012, as defined in the agreement.
We hold the remaining 40 percent of Everest Gaming with a put option to sell all or part of its share to BetClic. The put option is exercisable in 2013, 2014 and 2015. BetClic holds a call option on any remaining Everest Gaming interests held by us which it may exercise in 2015 and 2016. For both our put option and BetClic’ call option, the price paid will be determined based upon the fair market value of Everest Gaming as of December 31 of the prior year, as determined by mutual agreement between the parties or, failing that, an appraisal process.
We have retained the liability, if any, for certain potential tax claims, if any, and existing liabilities of the Everest Business, and also has agreed to provide a limited indemnity with respect to breaches of representations and warranties (which generally survive until December 31, 2011) and covenants contained in the purchase agreement.
While BetClic generally controls the day-to-day operations of Everest Gaming, so long as we own at least 20 percent of Everest Gaming’s share capital, we will have approval rights over certain material actions of Everest Gaming, including certain issuances of securities of Everest Gaming, certain acquisitions and dispositions of assets and material changes to the principal business of Everest Gaming. In addition, so long as we hold at least 10 percent of Everest Gaming’s share capital, we will have representation on the board of directors of Everest Gaming.
BetClic has agreed that it will not acquire other online poker businesses without first giving Everest Gaming the opportunity to acquire such business, at our discretion, so long as we hold at least 20 percent of Everest Gaming’s share capital.
Competition
Everest Gaming faces intense competition in the online gaming industry, which is characterized by low barriers to entry, rapid technological change and ever-changing consumer preferences. New entrants to the online gaming industry, increasingly competitive market consolidations and aggressive marketing and pricing by competitors may lead to a significant decline in the customer base, revenues and margins of Everest Gaming. In addition, online gaming industry is influenced by various other factors, including changes in policies and regulations and economic conditions in different jurisdictions. For example, many European countries such as Spain and Germany, where there are state-owned gaming monopolies, have taken actions or introduced legislation aimed at ring fencing the “liquidity” of online poker players by allowing players to play within their borders only. This decrease in liquidity will have an adverse effect on the Everest Gaming poker business.
37
To compete effectively against Everest Gaming’s existing competitors and new competitors in the future, Everest Gaming intends to continue to improve the principal competitive factors that it believes can keep it competitive, including brand, technology, financial stability and resources, regulatory compliance, independent oversight and transparency of business practices.
Our Gaming Software and Service Business Prior to the Strategic Alliance with BetClic
Prior to completing the sale of a 60 percent interest to BetClic on April 8, 2010, we operated our gaming software and service business through CESL, our wholly-owned subsidiary. We offered online gaming solutions primarily focused on the online poker and casino segments of the global online gaming industry. We historically partnered with UIM, our then-largest licensee, to provide a multilingual, multi-product game platform, namely the Everest-branded gaming platform.
CESL’s Products and Services
We historically and primarily provided the software and service for the online poker rooms, casinos and the related marketing affiliate programs operated by UIM through CESL. CESL’s online gaming solution comprised online gaming software, online gaming management tools, and application and consulting services.
Online Gaming Software and Management Tools
CESL’s major software products were downloadable game client software programs, or game clients, which provided an intuitive user interface for players to register, deposit and withdraw funds, play free and real money games, manage their accounts and profiles, and seek assistance. CESL’s game clients processed locally in each end-user’s computer and interacted remotely with UIM’s gaming servers to display virtual poker rooms and casinos, generated a sequence of random numbers for game playing, and enabled users to play poker and casino games through the Internet. To improve the usability of CESL’s software and the accessibility of CESL’s gaming platform for customers around the world, CESL localized its game clients to reflect the local languages and conventions. CESL’s game clients were available in 15 supported languages. The game clients were installed directly from websites. Patches and updates were provided automatically and applied to the product content each time the software programs started.
CESL’s gaming management tools included an e-commerce system, marketing support tools and back-office applications. CESL’s e-commerce system accommodated a broad array of deposit and payment options such as credit card processors and various electronic wallet programs. CESL’s marketing support tools provided UIM with a highly integrated web-based promotion platform, which could be interactively edited through a content management system. CESL’s back-office applications provided tools for e-commerce promotions, player accounts and customer support. The back-office platform also included a sophisticated system that features data warehousing and management, business intelligence functions and provided tools for preventing and detecting fraud and other irregularities during the games as well the e-commerce transactions.
Application and Consulting Services
In addition to licensing CESL’s software products, CESL also provided to UIM a variety of software application and support services including:
| | • | | Infrastructure Design and Management Services. CESL provided the architectural design of various infrastructure elements, including the servers, databases, networks, routers, firewalls and management tools that are required for Internet gaming operations. |
| | • | | Transaction Processing Services. These services included (i) payment consultation for designing timely collection and distribution systems for payments through a variety of channels and merchants; (ii) billing consultation for designing real-time and out-of-band transaction processing and order management; and (iii) risk management consultation for creating and designing tools and processes for fraud detection, prevention and management. |
| | • | | Customer Support Services. CESL offered UIM a comprehensive round-the-clock consultation support to resolve infrastructure issues. CESL also provided platform technical support during periodic maintenance to update, patch, and fine-tune the system performance of our software solutions. |
38
| | • | | Custom Gaming Software Development Services. CESL customized the entertainment modules and interfaces for the gaming platform to meet specific requests of UIM’s affiliates or partners. |
| | • | | Marketing Support Services. CESL created branded websites and provide marketing support services to assist UIM in attracting new players. |
CESL’s Technology and Infrastructure
CESL’s online gaming platform was composed of multiple fault-tolerant distributed modules supporting a wide range of functionality, including the server application program, loyalty program management, financial stored-value management, e-commerce engines, and an extensive set of tools to perform fraud screening, data mining, player support and affiliate marketing programs. CESL’s real-time gaming server software enabled integrated management of end user registration, account administration, deposit and transactions. CESL’s transaction server software encapsulated business logic and abstract data and third-party services, such as payment processors.
Relationship with UIM
Prior License Arrangement with UIM
Our gaming software and service business was historically dependent on our largest licensee, UIM, an online gaming operator. On April 1, 2004, we entered into an end user license agreement with UIM, pursuant to which we granted a nonexclusive, non-transferable, worldwide license to UIM to use our software and certain operational and support services. The end user license agreement was amended on March 1, 2006, March 1, 2007, March 1, 2008 and April 1, 2009, respectively. The term of the agreement was 10 years. The license fees were determined based on a revenue sharing mechanism under the end user agreement, as amended. The end user license agreement with UIM was terminated in April 2010 as the part of the transaction with BetClic. See Item 5, “Operating and Financial Review and Prospects — A. Operating Results— Subsequent Events— Transaction with BetClic” for additional information. In addition to licensing software, we provided UIM with application services and consulting services for its Internet infrastructure, including website design, payment gateways and database and operating systems, in return for a fixed percentage of UIM’s gross receipt. The financial results of UIM were historically incorporated into our consolidated financial statements in accordance with the FASB Accounting Standards Codification although we did not historically own any equity interest in UIM.
UIM
UIM was an online entertainment operator that provided online gaming entertainment, including online casinos and virtual poker rooms. UIM offered this entertainment content through several websites, including Everest Poker (www.everestpoker.com), which was awarded Poker Operator of the Year for each of 2007 and 2008 and the Online Marketing Campaign of the Year for 2009 by e-Gaming Review, a UK-based independent industry journal magazine. UIM marketed its game sites through affiliate programs where private and commercial owners of websites were invited to place, on their websites, banners containing links to UIM’s websites, in return for fees with reference to the number of qualified new player sign-ups, or based on revenues generated by users that have been directed to UIM’s website from such banners.
UIM operated exclusively from computer servers located in the Kahnawake Territory in Canada under a gaming license issued by the Kahnawake Gaming Commission. On March 1, 2010, UIM received two full remote gaming licenses (a Class 1 and a Class 3) issued by Malta Lotteries and Gaming Authority. As part of the transaction with BetClic, all of the material assets of UIM (including various gaming licenses held by it) were transferred to Everest Gaming. UIM is now a dormant entity and has ceased its business operation since April 8, 2010.
Intellectual Property
We rely on a combination of patent, trademark, copyright and trade secret laws in the U.S. and other jurisdictions as well as confidentiality procedures and contractual provisions to protect our proprietary technology and our brand. We have patents, copyrights and trademarks in certain jurisdictions and may apply for further trademark and copyright registrations and additional patents, which may provide such protection in relevant jurisdictions. However, there is no assurance that this will be sufficient to fully protect our proprietary technology. In addition, our technologies may not be able to withstand any third-party claims or rights against their use.
We also enter into confidentiality and invention assignment agreements with our employees and consultants and confidentiality agreements with other third parties, and we rigorously control access to proprietary technology.
39
Regulation
Regulations Relating to Online Games in Taiwan
At present, there is no specific law in Taiwan governing online game services, nor are there any specific licensing requirements imposed on Internet content providers in connection with offering online game services. The National Communications Commission (the “NCC”) was established in March 2006. In December 2006, the NCC proposed the overhaul of the regulatory framework in the communications and broadcasting sectors by amending the Telecommunications Act, the Radio and Television Act, the Cable Radio and Television Act and the Satellite Radio and Television Act. Pursuant to the original proposal, the legislation at issue would be consolidated into a new legislative Act to be known as the Communications and Broadcasting Act. In December 2008, the NCC announced a change to its policy, stating that it had decided to delay enacting the Communication and Broadcasting Act for two to four years. According to the digital convergence plan adopted by the Executive Yuan in December 2010, digital convergence framework is expected to be approved in 2014 and digital convergence law is expected to be finalized in 2015.
Rating of Internet Content. The Government Information Office, which was the agency in charge of Internet content prior to establishment of the NCC, promulgated the Regulations for the Rating of Internet Content in April 2004, as amended in October 2005. In general, Internet content shall not include any illegal or banned materials. To avoid negative impact on the physical or mental development of children or adolescents, Internet content containing any of the following materials shall be rated as restricted and shall not be viewed by those below the age of 18: (i) excessive depiction of gambling, robbery or other criminal offenses; (ii) excessive depiction of suicide; (iii) depiction involving terror, blood or cruelty which is presented in a manner acceptable to adults; or (iv) depiction of sexual acts or sexual obscenity which does not embarrass or disgust adults in general. If Internet content is in violation of the Regulations for the Rating of Internet Content, competent authorities may order the relevant ISPs to restrict access to children or adolescents or remove the offending content and impose an administrative fine on the offenders.
Computer Software Ratings.The Ministry of Economic Affairs announced in July 2006 the Regulations Governing Computer Software Rating, which took effect in January 2007. This regulation was first amended in June 2009 and the first amendment took effect in December 2009 and further amended on March 10, 2011 and took effect on June 10, 2011. Computer software includes the game software which can be installed in computers, televisions and handheld gaming devices. The provider of computer software shall identify the rating of the computer software when it provides it to users. There are four ratings: (i) Mature Audience Only (not suitable for those below the age of 18); (ii) Parental Guidance Advisable (not suitable for those below the age of 12; parental guidance is advisable for those between the ages of 12 to 18); (iii) Parental Guidance Strongly Suggested (not suitable for those below the age of 6; guidance from parents, teachers or adults is strongly suggested for those between the ages of 6 to 12); and (iv) General Audience (suitable for all ages). According to the 2011 amendment, the computer gaming software that uses virtual currency to play simulated Mahjong, poker, dice, steel ball, horse racing, roulette, slot machine and other games of similar nature, and the outcome of the games may result in increase or decrease of the virtual currency, shall be rated as Parental Guidance Strongly Suggested. If the contents thereof meet the requirements under the rating criteria of Mature Audience Only or Parental Guidance Advisable, such games shall be rated accordingly.
Online Game Contract Template.The Ministry of Economic Affairs and the Consumer Protection Commission have published a model contract template which sets out permitted terms and limitations with respect to online game services offered in Taiwan, pursuant to the Consumer Protection Act. The contract template was last amended on December 2010. Generally, consumers should be given at least three days to review such contract. Amendments or changes to fees payable for services offered must be publicly announced at least thirty days prior to such amendment, and notification provided to consumers. Consumer game records must be maintained by each online game operator for a minimum period of thirty days and shall be open to inspection by such consumers. Suspension periods for consumers who have breached the terms of their online game contracts may not exceed a period of seven days. Apart from gifts, the on-line game operator cannot limit the use period of the game points in the on-line game contract. Furthermore, the on-line game operator cannot specify in the on-line game contract that it has the right to interpret the contract terms and conditions.
Personal Data Protection Act.On April 27, 2010, the Legislative Yuan passed a bill to amend the Computer-processed Personal Data Protection Act, which was renamed as the Personal Data Protection Act. Whenever an entity collects personal data from any individual, it shall inform such individual about (i) the name and identity of the collecting entity; (ii) the purpose of collection; (iii) how the collected personal data will be used; (iv) his/her rights; and (v) the consequences of his/her failure to provide the required personal data. If personal data is not provided by individuals, in addition to the information required to be disclosed as described above, the collecting entity shall inform such individual of the source of the data before processing or using the data. In principle, prior consent from the individual is required for use of his/her personal data. These requirements shall be exempted if relevant personal data of the individual (i) is used for public interests; or (ii) is available from the public domain and the interest to be protected is more important than the privacy of such individual. Depending on the gravity of a violation, damages of NT$500 to NT$20,000 may be claimed against a person for each violation of the Personal Data Protection Act even if the actual damage cannot be proved. If there is more than one victim in a single violation, the maximum damages would be up to NT$200,000,000. However, if the interests involved therein exceed NT$200,000,000, restrictions on maximum amount for damages to be claimed and on minimum amount for damages to be claimed (NT$500 per person for each violation) shall not apply. This new Personal Data Protection Act will take effect pursuant to the announcement of the Executive Yuan. Given that there may be some delay in the enactment of the enforcement rules, the new Personal Data Protection Act will come into force sometime in 2012.
40
Regulations Relating to Online Games in the PRC
As the online games industry is at an early stage of development in the PRC, the PRC laws and regulations governing the online games industry and related business in the PRC involve substantial uncertainties and are subject to further changes. See Item 3, “Key Information — D. Risk Factors — Risks Related to Doing Business in Greater China — The laws and regulations governing the online games industry in the PRC are evolving and new regulations may adversely affect our business” in this annual report.
The principal PRC regulations governing the provision of Internet content and online gaming services include (among others) the Telecommunications Regulations (2000), the Administrative Rules for Foreign Investments in Telecommunications Enterprises (2001), the Tentative Measures for the Administration of Internet Publications (2002), the Opinions on the Development and Management of Online Games (2005), the Anti-Internet Addiction Regulations (2007), the Administrative Measures for Telecommunications Business Operating Licenses (2009) and the Tentative Measures for Online Games Administration (2010) and the Tentative Measures for Administration of Internet Culture (2011).
Our provision of online games and online game-related content on our websites in the PRC is subject to various Chinese laws and regulations relating to the telecommunications industry, Internet and online games, and is regulated by various government and regulatory authorities, including:
| | • | | MIIT (formerly the Ministry of Information Industry); |
| | • | | the Ministry of Culture, or MOC; |
| | • | | the General Administration of Press and Publication, or GAPP (formerly known as the State Press and Publications Administration, or SPPA); |
| | • | | the Ministry of Public Security; |
| | • | | the State Administration of Industry and Commerce, or SAIC; |
| | • | | the State Administration for Radio, Film and Television, or SARFT; |
| | • | | the State Council Information Office, or SCIO; and |
| | • | | the Ministry of Commerce, or MOFCOM. |
Foreign Ownership Restrictions
Current PRC laws and regulations impose substantial restrictions on the foreign ownership of companies that provide Internet content services in the PRC. Foreign investors are also restricted from owning equity in entities which provide Internet publications. In addition, foreign or foreign-owned enterprises are currently not able to apply for the required licenses for operating online games in the PRC. These licenses can only be held by domestic PRC persons. Furthermore, pursuant to a notice promulgated by the GAPP, National Copyright Administration, and National Office of Combating Pornography and Illegal Publications on September 28, 2009, foreign investors are prohibited from participating in Internet game operating businesses via wholly owned, equity joint venture or cooperative joint venture investments in the PRC, and from controlling and participating in such businesses directly or indirectly through contractual or technical support arrangements. If applied literally and uniformly, such notice would render our ownership structure in the PRC invalid and illegal. To date, however, there are substantial uncertainties regarding the interpretation and application of such notice. Under PRC law, we are not considered to be a domestic PRC person for this purpose. In order to comply with foreign ownership restrictions, we operate our Asian online game and service business in the PRC through contractual arrangements with T2 Entertainment, T2 Advertisement, Jinyou and Shanghai JIDI, all of which are VIEs. For further information of our VIEs, see “— C. Organizational Structure” in this annual report.
There are substantial uncertainties regarding the interpretation and application of current or future PRC laws and regulations. Accordingly, we cannot assure you that PRC government authorities will ultimately take a view that is consistent with our view. If we or any of our PRC operating companies are found to be in violation of any existing or future PRC laws or regulations, the relevant government authorities would have broad discretion in dealing with such violations and could impose significant penalties and sanctions or other regulatory or enforcement actions, including levying fines, confiscating income, revoking business or operating licenses, requiring us to restructure our ownership structure, and requiring us to discontinue all or any part of our business operations. Any of these actions could have a material adverse effect on our business, financial condition and results of operations. See Item 3, “Key Information — D. Risk Factors — Risks Related to Doing Business in Greater China — PRC laws and regulations restrict foreign ownership and investment in the online game industry, and substantial uncertainties exist with respect to the application and implementation of PRC laws and regulations” in this annual report.
41
Licenses
As Internet content providers, our PRC operating companies are required to hold ICP licenses issued by MIIT. Internet content providers offering ICP services in multiple provinces, autonomous regions and centrally administered municipalities may be required to obtain an inter-regional ICP license. Since online games fall within the definition of “Internet culture products” under the Tentative Measures for Internet Culture Administration of 2011, a commercial operator of online games must, in addition to the ICP licenses, obtain an Internet culture operation license from the MOC for its operation of online games, and foreign investors are restricted from owning equity in such entities. The provision of online games is also deemed an Internet publication activity, within the meaning of the Tentative Measures for Internet Publication Administration of 2002, and therefore, an online game operator must also obtain the approval of the relevant press and publication administrative authorities or cooperate with a licensed Internet publisher, as well as the appropriate licenses, in order to carry on its Asian online game and service business in the PRC.
T2 Entertainment, Jinyou and Shanghai JIDI hold the ICP licenses, Internet culture operation licenses and other licenses that are required to operate our Asian online game and service business in the PRC. T2 Advertisement holds the advertising license that is required to sell advertisements on our websites in the PRC.
Online Games Regulations
In April 2007, eight PRC governmental authorities, including GAPP, MIIT, the Ministry of Education and the Ministry of Public Security, jointly promulgated the Notice on the Implementation of Online Game Anti-addiction System to Protect the Physical and Psychological Health of Minors, which requires online game operators to implement anti-addiction measures for users under eighteen years of age. Under this anti-addiction notice, the first three hours of game-playing time of a user are considered “healthy time”, the following two hours are designated “fatigue time” and any time spent playing beyond five consecutive hours is categorized as “unhealthy time”. Online game operators are required to establish anti-addiction system and develop software features on all existing online games to reduce “fatigue time” and “unhealthy time” such that, when a user has been playing in excess of specified periods of time, periodic in-game warnings will be sent to prompt the user to leave the game and the number of points or other benefits will be limited. Internet game operators are also required to develop identification verification system and registration software, which will require online game players to register their real identity information before they are allowed to play online games. Failure to comply with these requirements may subject the operator to penalties, including but not limited to suspension of operation of online games, revocation of operating licenses and approvals for operations, rejection or suspension of application for approvals, licenses, or filings for any new game, or prohibition of operating any new game. See Item 3, “Key Information — D. Risk Factors — Risks Related to Doing Business in Greater China — The laws and regulations governing the online games industry in the PRC are evolving and new regulations may adversely affect our business” in this annual report.
In addition, the current PRC law prohibits any online game products involving illegal money-collecting. On February 15, 2007, 14 governmental authorities, including the Ministry of Culture, the Ministry of Information Industry, the State Administration for Industry and Commerce, and PBOC, jointly issued the Circular for Further Strengthening the Administration of Internet Café and Online Games. This circular grants the PBOC administrative authority over virtual currencies issued by online game operators for use by players in online games to avoid the potential impact such virtual currencies may have on the real-world financial systems. The circular also restricts the volume of virtual currency that may be issued and the purchase of such virtual currencies. Virtual currency must not be used to purchase any physical products, refunded with a premium, or otherwise illegally traded. On June 4, 2009, the MOC and the MOFCOM jointly issued the Circular on Strengthening the Administration of Virtual Currency in Online Games. According to this circular, any PRC entities engaging in issuance or trade service of virtual currency in online games shall meet the requirements of “Commercial Online Cultural Entities” as prescribed in the Tentative Measures for Administration of Internet Culture (2011) and are required to apply to the MOC for an approval. This circular further provides, among others, that (i) the form, issuance scope and unit purchase price of virtual currency, the refund method in case of termination of online games, the purchase method for the users (including cash, bank card, payment via Internet, etc.), the protection measures for users’ rights and interests, and the technology security safeguard measures, shall be filed with the MOC for record; (ii) the unit purchase price of virtual currency shall not be changed by online games operators; (iii) the new type of virtual currency shall be filed with the MOC for record before issuance by online games operators; and (iv) the virtual currency trade service shall not be open to the minors. See Item 3, “Key Information — D. Risk Factors — Risks Related to Doing Business in Greater China — Restrictions on virtual currency may adversely affect our revenues from online game operations in the PRC” in this annual report.
On June 3, 2010, the MOC issued the Tentative Measures for Online Games Administration (the “Tentative Measures”), which will take effect as of August 1, 2010. As the first ministry-level rules specifically governing the regulation of China’s lucrative online games market, the Tentative Measures cover online games’ operation, research and development, as well as the issuance and trade of virtual currency. The Tentative Measures incorporate many of the MOC’s current rules and introduce a more comprehensive and predictable regulatory framework for the industry. “Online games” are defined as game products and services composed of software programs and information databases, provided via the Internet, mobile networks, or other information networks. “Online game operation” is defined as the provision of game products and services to the public through an information network by utilizing a user system or billing system. “Virtual Currency for Online Games” means a virtual exchange tool represented by special numerical units, issued by online game operators and deposited by magnetic recording in a server outside online games and should be directly or indirectly purchased at certain rates by game players with legal tender.
42
Enterprises engaging in the operation of online games must apply for an Internet culture operation license issued by the MOC. An Internet culture operation license applicant must provide, at a minimum, its name, domicile, organization structure, articles of incorporation and business scope, as well as show that its employees comply with national rules and its registered capital is not less than RMB 10 million. The registered capital amount is a significant increase from the previous threshold of RMB 1 million. Existing law provides that the national-level MOC has the final approval authority over Internet culture operation license. In the Tentative Measures, the MOC delegates this authority to its provincial-level branches.
After obtaining the Internet culture operation license, online games enterprises must also obtain MOC’s approval for the content of imported online games when (i) they become the exclusive licensee of the game (the “Domestic Licensee”) or (ii) when they have materially changed the content of an approved game. An applicant of MOC’s content approval must be an exclusive licensee of the imported online game. If an online game’s Domestic Licensee changes, the proposed new Domestic Licensee must re-apply for MOC’s content approval of the same game. “Material changes” include but are not limited to significant changes of a game’s storyline, language, characters’ images, task design, economic system, systems of production and construction, and sound effects. In contrast, no content approval is required for domestic online games. Online games enterprises only need to file a notification with MOC (i) within 30 days of the operation of a domestic online game or (ii) within 30 days of materially changing the game’s content.
The Tentative Measures also require online game companies to establish a self-censorship mechanism and ensure the lawfulness of the content of their games. All online game users are required to register using their real names and to provide to the game operator valid documentary proof of identity. Online game operators are required to keep records of such personal information. The termination of online game operations or a change of the operator of an online game must be announced by the operator in question 60 days in advance, by means of a public notice. User consent is required under the Tentative Measures for any mandatory combat gameplay.
The Tentative Measures’ provisions with respect to virtual currency substantially reiterate current law, although they also impose a prohibition on trading services for unapproved or unfiled online games. Providing virtual currency trading services to minors is prohibited. Virtual currency can only be used for the online game products and service and shall not be used to purchase other goods and service and all users’ purchase record shall be kept for at least 180 days. In addition, the Tentative Measures lay out detailed requirements for online game companies to protect minors from becoming addicted to online games. For example, technical measures must be taken to protect minors from inappropriate games, to limit time spent playing games, and to prevent game addiction. Liabilities for illegal activity by online game operators can include an official rectification order, the confiscation of any illicit gains, monetary penalties, the suspension of the operator’s business pending rectification, revocation of the corresponding Internet culture operation license, or criminal penalties.
In light of the battle between the two online games approval authorities’ (i.e., GAPP and MOC) over who regulates online gaming, the Tentative Measures appear to clarify MOC’s role as the “main authority regulating the online games” responsible for approving the content of imported online games. However, online games enterprises must still obtain GAPP approval for the publication of online games. For imported online games, GAPP’s approval entails the certification of the intellectual property owner and the licensing agreement.
On July 29, 2010, the MOC further issued the Notice on the Implementation of the Tentative Measures for Online Games Administration. Under this notice, the MOC provides for more detailed guideline on how to implement the Tentative Measures. It formulates, among others, some requisite clauses for the Standard Service Agreement of Online Games, and requires online game service operators to incorporate all such requisite clauses into their agreements with the users and to exclude any provisions which contravene the requisite clauses. The application of such requisite clauses should be carried out together with the real name registration measures. These requisite clauses provides that online game service operators are entitled to examining the authenticity of users’ identity and are obliged to actively ensure the security of users’ accounts. The online game service operators are entitled to stopping its users from conducting any illegal or improper acts in its online game. If the online game service operators stop providing online game services to its users accordingly, they will have the burden of proof to support their stop. Nevertheless, the online game operators should take necessary measures to secure the safety of personal information of the users, and, without permission of the users, should not disclose to or share with any third parties such information, but subject to certain exceptions.
On October 11, 2010, the MOC issued a notice to clarify the standard in determining whether the internal testing or public testing of online games constitutes commercial launch of the online games. According to this notice, online game service operators will be deemed to have commercially launched the online games if during the testing of such online games, they conduct any of the following acts: (i) open to the public for user registration of the online games; (ii) charging users service fees; or (iii) carrying out their operating activities in a manner of commercial cooperation or promotional sale or other means.
43
Internet Content and Publishing Regulations
The PRC government has promulgated measures relating to Internet content through a number of ministries and agencies, including MIIT, MOC and GAPP. These measures specifically prohibit Internet activities, which includes the operation of online games that result in the publication of any content which is found to, among other things, propagate obscenity, gambling or violence, instigate crimes, undermine public morality or the cultural traditions of the PRC, or compromise State security or secrets. If an ICP license holder violates these measures, the PRC government may revoke its ICP license and shut down its websites.
On June 27, 2002, the GAPP and the MIIT jointly promulgated the Tentative Measures for the Administration of Internet Publications which took effect as of August 1, 2002. The GAPP shall supervise and regulate the Internet publishing industry throughout the country. “Internet publishing” shall mean the act of online dissemination and it is the Internet information service providers’ publication of selected or edited works created by themselves or others on websites or the transmission of such works through the Internet to user terminals for public browsing, reading, using, or downloading. Engaging in Internet publishing activities must be approved. No organizations or individuals may carry on Internet publishing activities without approval.
On September 28, 2009, GAPP, National Copyright Administration and National Office of Combating Pornography and Illegal Publications jointly published the Notice Regarding the Consistent Implementation of the “Stipulations on ‘Three Provisions’” of the State Council and the Relevant Interpretations of the State Commission Office for Public Sector Reform and the Further Strengthening of the Administration of the Pre-examination and Approval of Internet Game and the Examination and of Imported Internet Games (the “Notice 13”), according to which, the acts of providing online interactive or downloading services of online games to the public via internet are “Internet publishing activities”, which are subject to the pre-examination and approval of the GAPP. In addition, Notice 13 specified,inter alia, that no online game is allowed to be commercially launched without obtaining the pre-approval from the GAPP, and the GAPP is responsible for the approval of imported online games.
On July 6, 2010, the MOC issued the Notice on Strengthening the Administration of Online Game Marketing Promotion and Preventing the Obscene Marketing Activities. In this Notice, the MOC demands its subordinate authorities to strengthen their administration over the entities who conduct online game marketing promotion and propaganda. Once obscene contents are detected in the marketing activities of online games, the MOC and its subordinate authorities may impose punishment on the entities concerned.
On February 17, 2011, the MOC issued the revised Tentative Provisions of Administration of Internet Culture, which come into effect as of April 1, 2011. Compared with the previous provisions, the newly amended provisions are more specific and explicit. They define “Internet culture products” as: (i) Internet music entertainment, Internet games, Internet dramas (programmes), Internet performances, Internet artworks and Internet animations specifically produced for the internet; and (ii) music entertainment, games, dramas (programmes), performances, artworks and animations that are produced using certain technical means and duplicated for online dissemination. “For-profit Internet cultural activities” means the provision of Internet cultural products and services for profit by collecting fees from online users or obtaining gains by way of electronic commerce, advertising and sponsorship. Applicants for establishing a for-profit Internet cultural entity shall have registered capital of at least RMB1 million, or RMB10 million in the case of application for engaging in Internet game business activities. Departments for cultural administration at the county level or above are responsible for supervision and management of Internet culture activities within their respective administrative areas.
Import Regulations
Our ability to license online games from abroad and import them into China is subject to various registration requirements under the relevant PRC laws and regulations. We are required to register with the MOFCOM any license agreement with a foreign licensor that involves imports of technologies, including online game software into China. Without that registration, we cannot remit licensing fees out of China to any foreign game licensor. The State Copyright Bureau requires us to register copyright license agreements relating to imported software. Without the State Copyright Bureau registration, we are not allowed to publish or reproduce the imported game software in China. Furthermore, imported online game software is also required to obtain an approval by the GAPP and pass a content examination by the MOC. Any imported online game software, which has not been examined and approved by the GAAP and the MOC, is not allowed to be launched in China.
Information Security Regulations
Internet content in the PRC is regulated and restricted from a State security standpoint. The Standing Committee of the National People’s Congress, the PRC’s national legislative body, issued a decision in December 2000, as amended in August 2009, according to which following conducts in China may be subject to criminal punishment in China; any effort to: (i) gain improper entry into a computer or system of strategic importance; (ii) disseminate politically disruptive information; (iii) leak State secrets; (iv) spread false commercial information; or (v) infringe intellectual property rights. The Ministry of Public Security has promulgated measures that prohibit use of the Internet in ways which, among other things, result in a leakage of State secrets or a spread of socially destabilizing content. The Ministry of Public Security has supervision and inspection rights in this regard, and we may be subject to the jurisdiction of the local security bureaus. If an ICP license holder violates these measures, the PRC government may revoke its ICP license and shut down its websites.
44
On May 14, 2004, the MOC issued the Notice Regarding the Strengthening of Online Game Censorship. The notice mandates the establishment of a new committee under the MOC that will screen the content of imported online games. In addition, all imported and domestic online games are required to be filed with the MOC.
On July 12, 2005, the MOC and the MIIT promulgated the Opinions on the Development and Administration of Online Game, which reflects the PRC government’s intent to foster and control the development of the online game industry in China.
In addition, the MOC will censor online games that threaten state security, disturb the social order, or contain obscenity or violence.
Internet Café Regulation
Internet cafés are required to obtain a license from MOC and SAIC, and are subject to requirements and regulations with respect to location, size, number of computers, age limit of customers and business hours. Although we do not own or operate any Internet cafés, many Internet cafés distribute our virtual pre-paid game cards. The PRC government has announced its intention, and has begun, to intensify its regulation of Internet cafés, which are currently one of the primary venues for our users to play online games. In April 2001, the PRC government began tightening its regulation and supervision of Internet cafés. In particular, a large number of Internet cafés without requisite government licenses have been closed. In addition, the PRC government has imposed higher capital and facility requirements for the establishment of Internet cafés. The PRC government’s policy, which encourages the development of a limited number of national and regional Internet café chains and discourages the establishment of independent Internet cafés, may also slow down the growth in the number of new Internet cafés. In February 2004, the SAIC and other related government agencies issued a notice to suspend issuance of new Internet café licenses for a six month period. Though this nationwide suspension was generally lifted in 2005, local authorities have the authority of controlling the number and recipients of new Internet café licenses at their own discretion. In addition, local and higher-level governmental authorities may from time to time strictly enforce customer age limits and other requirements relating to Internet cafés as a result of the occurrence of, and media coverage of, gang fights, arson or other incidents in or related to Internet cafés. In February 2007, 14 PRC government authorities jointly issued a notice, which suspended approval for the establishment of new Internet cafés and called for strengthened regulation of existing Internet cafés. Intensified government regulation of Internet cafés could restrict our ability to maintain or increase our revenues and expand our customer base.
Privacy Protection
PRC laws do not prohibit Internet content providers from collecting and analyzing personal information from their users. We require our users to accept a user agreement whereby they agree to provide certain personal information to us. However, PRC law prohibits Internet content providers from disclosing to any third parties any information transmitted by users through their networks unless otherwise permitted by law. PRC government authorities have recently enacted legislation regarding the use of the Internet, which recognizes the importance of protecting personal information from unauthorized disclosure. Under the Internet Information Service Administrative Measures issued by the State Council on September 25, 2000, Internet information service providers are prohibited from producing, copying, publishing or distributing information that is humiliating or slanderous to others or that infringes the lawful rights and interests of others. If an Internet content provider violates these measures, the MIIT or its local bureaus may impose penalties, and the Internet content provider may be liable for damages caused to its users.
On May 31, 2010, the SAIC issued the Tentative Measures for Administration of Online Commodity Trading and Relevant Services, which comes into effect as of July 1, 2010. The tentative measures stipulate, among others, that the operators who provide online services have the obligations to secure the safety of the personal information of customers, to reasonably use, hold within a time limit and destroy properly such personal information. The operators are prohibited from collecting any information irrelevant to the products and services provided, and from disclosing, leasing, and selling to any third parties the personal information collected from the users unless otherwise permitted by law.
In addition, the PRC government retains the power and authority to order Internet content providers to turn over personal information of Internet users if the users post any prohibited content or engage in illegal activities on the Internet.
Global Regulatory Environment Relating to the Everest Gaming Business
We historically operated our gaming software and service business primarily through providing software solutions for online poker rooms, casinos and the related marketing affiliate programs operated by UIM and its sub-licensees. We earned fees from UIM based upon revenues earned by UIM from its operations utilizing our software. After the completion of the transaction with BetClic, we operate our gaming software and service business primarily through Everest Gaming, our joint venture with BetClic.
45
The Internet gaming industry is still at an early stage of development. The very nature of Internet gaming creates new and unique forms of entertainment that were neither contemplated nor feasible in the past. While many jurisdictions have some form of legal framework applicable to games of chance, few provide clear guidance on how this framework applies to the online gaming industry. Although governments around the world are increasingly seeking to regulate online gaming, the shifting political and economic landscape subject online gaming industry to significant uncertainties. As a result, it is difficult for us to assess whether the Internet gaming services provided by Everest Gaming, are in compliance with all laws and regulations of the jurisdictions where it operates.
Everest Gaming operates under two full remote gaming licenses (a Class 1 and a Class 3) issued by Malta Lotteries and Gaming Authority and a license issued by the Kahnawake Gaming Commission, subject to continuing compliance with applicable licensing requirements. Mangas Everest’s primary computer server operations are located in Malta with certain non-operational components of its business operating from servers in Kahnawake. In accordance with the terms of the strategic alliance, Everest Gaming has been seeking to migrate all BetClic poker players to the Everest Poker platform creating one of the largest poker player “liquidity” platforms in Europe. On June 7, 2010, Everest Gaming received online poker licenses as part of the first grant of licenses in France. In July 2010, BetClic.fr and Everestpoker.fr, sites were approved by ARJEL, the French gaming regulatory authority for the French online poker market. Since July 2010, all of BetClic French poker players have been able to play on the Everest Poker platform by logging on to the BetClic.fr website and clicking a link. Chips are purchased using BetClic’s software and may be transferred for use on the Everest Poker platform. Everest Gaming plans to increase migration between the Everest Poker and BetClic Poker operations by allowing all of BetClic’s non-French European poker players to play on the Everest Poker platform by logging on to the BetClic.com website beginning in the third quarter of 2011. The combined user base of Everest Poker and BetClic Poker — both leading brands in France — strongly positions the alliance to capture dominant market share within the regulated French market, one of the largest in Europe.
U.S. Regulations on Online Gaming
The U.S. government has been of the view that Internet gambling that crosses state boundaries is unlawful. There are basically four laws that prohibit Internet gambling in the United States at the Federal level — the Wire Act of 1961, the Illegal Gambling Business Act, the Travel Act, and the Unlawful Internet Gambling Enforcement Act (“UIGEA”).
Under the Wire Act of 1961, the Department of Justice has prosecuted online gambling operators and payment providers to the online gambling industry in the United States. The Wire Act makes it illegal to place a wager or a bet via wire transmission. A case out of the 5th Circuit Court of Appeals seems to indicate that the Wire Act does not apply to online poker, however the law is still being debated in this respect.
The Illegal Gambling Business Act makes it a felony for 5 or more people to operate an “illegal gambling business” for more than 30 days or one whose earnings meet or exceed a certain minimum amount of money. An “illegal gambling business” is one which is a gambling business that is operating in violation of the law of a particular state.
The Travel Act provides that 1) any person who travels in interstate commerce; or 2) any use of a facility in interstate commerce for the purposes of operating an “illegal gambling business” is guilty of a felony. An “illegal gambling business” is one which is a gambling business that is operating in violation of the law of a particular state.
Effective October 13, 2006, the UIGEA prohibits the use of communication facilities and financial transactions in connection with Internet gambling by restricting the payment methods for such activities and by imposing criminal penalties on Internet gambling businesses which accept wagers or payment in violation of such restrictions. The UIGEA criminalizes any gambling business which arises from using a communication facility to transmit bets or wagers, or to transmit information assisting in the placing of bets and wagers, to or from the United States, and prevents gambling businesses from accepting credit cards or other bank instruments in connection with illegal Internet gambling. The UIGEA also directs various federal agencies to implement regulations that would require financial institutions with electronic payment systems to establish policies and procedures to identify and block unlawful Internet gambling transactions, and creates judicial procedures through which federal agencies could obtain injunctions directing interactive computer services to remove or disable access to online sites that violate the law. The United States Treasury drafted UIGEA regulations in late 2007 and implemented the regulations on January 19, 2009. Financial institutions were not required to comply with the UIGEA regulations until December 1, 2009. The UIGEA regulations, however, did not define what specifically constitutes an unlawful Internet gambling transaction under UIGEA. Rather the UIGEA relies on underlying state law to determine what transactions are illegal for the banks to process.
Under the Uniting and Strengthening America by Providing Appropriate Tools Required to Intercept and Obstruct Terrorism Act of 2001, both U.S. and non-U.S. banks that process online gaming transactions for U.S. persons may face potential criminal proceedings, as U.S. jurisdiction extends to non-U.S. banks that have correspondent accounts in the United States. Internet gambling activity also constitutes illegal gambling activity in all 50 U.S. states, including those states where other forms of gambling are legal.
46
Several draft bills have been scrutinized by a number of committees within the US government and at the state level over the past 12 months, however none have been passed into law to date. Many of the major land-based casinos have been lobbying at the Federal Level in an effort to persuade Congress to regulate online poker, but as of yet no firm data exists which would indicate a specific timeline for Federal regulation of the online gaming industry.
Regulatory Environment in Europe
According to the Report on Integrity of Online Gambling by the Committee on the Internal Market and Consumer Protection of European Parliament, dated February 17, 2009, the European online gambling markets are regulated and the regulatory frameworks for the online gambling market in the European Union (“EU”) member states are very much heterogeneous. This remains true today.
Several European countries have introduced regulatory frameworks on online gaming.
Spain has promulgated a regulatory framework on online gaming. The regulations are currently awaiting review by the European Court of Justice and are expected to become effective shortly, and license applications will be accepted by the regulator by January 1, 2012. Everest Gaming plans on pursuing a license at that time.
Italy has recently introduced a new set of regulations on online gaming. Italy, while initially a poker-only jurisdiction, has set forth a regulatory regime for casino. Italy does, however, prohibit cash games in online poker offerings, thereby restricting the poker activity to tournaments. Online poker tournaments, pari-mutual betting on horseraces and sports events are legal provided that the game operators are licensed by the relevant authorities.
The French issued a license to Everest Gaming for online poker in June 2010. Online casino is widely seen as being prohibited under the French law and Everest Gaming has stopped offering online casino gaming to people in France.
Many European countries, where there are state-owned gaming monopolies, have taken actions or introduced legislation aimed at banning foreign online gaming operators, which could have a material adverse effect on our licensees and consequently on our Company. Such actions were in contrast with rulings from the European Court of Justice and have prompted the European Commission (“EC”) to explore the possibility of creating new legislation that could harmonize online gaming within the EU, in line with the EU’s principles regarding the European single market.
Denmark has also passed online gaming regulations and has passed an act whereby online operators can apply for a license, and if granted, may accept wagers from players in Denmark.
The Netherlands established an investigatory commission focused around the viability of a regulatory framework for online poker. The commission found that regulating online poker would be advantageous for the country and the market, however no law has been passed as of yet. The Everest group has engaged in lobbying efforts in the Netherlands and continues to push primarily for the regulation of online poker, and also for online casino and sports betting.
In Germany, the German Interstate Gambling Treaty came into force on January 1, 2008, an agreement that seeks a prohibition on the use of the Internet for all gambling services (except horserace betting). Certain German states have sent out prohibition orders aimed at a number of online operators, however most operators have filed oppositions to these prohibition orders on various grounds. Efforts aimed at regulation on a federal level in Germany have to date been unsuccessful, however many organizations in the industry continue to lobby. Regulation before early 2012 is very unlikely on a federal level.
For additional information on the regulatory environment relating to online gaming, see Item 3, “Key Information — D. Risk Factors — Risks Related to our Business and Industries — The uncertain global legal and regulatory environment could have a negative impact on the Everest Gaming business and prospects.”
47
Regulations Relating to Online Games in Singapore
Presently, there are no laws in Singapore which specifically govern the provision of online gaming. However, depending on the type of games offered and services rendered as part of our online gaming operations, the operations may be subject to regulation under various Singapore legislation. Relevant legislation includes:
| | • | | the Broadcasting Act (Chapter 28) of Singapore (the “Broadcasting Act”) and its subsidiary legislation, which regulates, inter alia, the operation of Internet websites; |
| | • | | the Telecommunications Act (Chapter 323) of Singapore (the “Telecommunications Act”) and its subsidiary legislation, which regulates the operation of telecommunications systems and the provision of telecommunications services; and |
| | • | | the Common Gaming Houses Act (Chapter 49) of Singapore (the “CGH Act”) and the Betting Act (Chapter 21) of Singapore (the “Betting Act”) and subsidiary legislation, which regulate, inter alia, gaming and lotteries. |
Broadcasting Act
The Broadcasting Act provides for the general legal framework to regulate media and Internet content and empowers the Media Development Authority (“MDA”) of Singapore with the authority to grant licenses and to regulate and monitor licensees in relation to such media and Internet content. In particular, section 8 of the Broadcasting Act provides that “no person shall provide any licensable broadcasting service in or from Singapore without a broadcasting license granted by the Authority (MDA)”. A licensable broadcasting service” is defined in the Broadcasting Act to include “computer on-line services”.
The MDA also regulates online services through the Broadcasting (Class License) Notification (the “BCLN”). Under the BCLN, persons who provide VAN computer on-line services and computer on-line services that are provided by Internet Content Providers (as defined in the BCLN) are deemed automatically licensed, and are subject to the terms of the BCLN and the Internet Code of Practice issued by the MDA. The definition of “Internet Content Provider” under the BCLN includes any corporation or group of individuals, whether registrable or incorporated under the laws of Singapore, who provides any programme on the World Wide Web through the Internet. A programme is defined to mean, broadly, any matter the primary purpose of which is to entertain, educate or inform all or part of the public, or any advertising whether commercial or not, excluding any matter that is wholly related to or connected with any private communication.
Pursuant to the BCLN, a licensee must use its best efforts to ensure that its service complies with MDA’s codes of practice and is not used for any purpose and does not contain any programme that is against public interest, public order, national harmony or offends against good taste or decency. Further, licensees must also ensure that the services are not used for certain prohibited activities such as the furtherance of games and lotteries prohibited under the CGH Act, the advertisement or promotion of astrology, geomancy, palmistry or any other type of fortune telling device or the solicitation of prostitution or any other immoral activity.
Under the Internet Code of Practice issued by the MDA, an Internet Content Provider is required to ensure that it does not carry programmes which include material that is objectionable on the grounds of public interest, public morality, public order, public security, national harmony or is otherwise prohibited by applicable Singapore laws (“prohibited materials”). The Internet Content Provider is also required to deny access to such prohibited materials that he discovers in the normal course of exercising editorial duties, or is informed about.
Telecommunications Act
The provision of telecommunication services and systems in Singapore is regulated by the Telecommunications Act, which provides the general legal framework for the provision and operation of telecommunication systems and services in Singapore.
Under the Telecommunications Act, all persons who establish, install, maintain, provide or operate a telecommunication system or service within Singapore must be licensed by the Info-communications Development Authority (“IDA”) of Singapore. A telecommunication system is defined as any system used or intended to be used for telecommunications, and telecommunication service is defined as any service for telecommunications but excludes any broadcasting service. Telecommunications is defined as a transmission, emission or reception of signs, signals, writing, images, sounds or intelligence of any nature by wire, radio, optical or other electro-magnetic systems whether or not such signs, signals, writing, images, sounds or intelligence have been subject to rearrangement, computation or other processes by any means in the course of their transmission, emission or reception.
The existing telecommunications licensing framework provides for two broad categories of licenses — facilities based operator (“FBO”) licenses and services based operator (“SBO”) licenses. SBO licenses are, in turn, granted either on an individual or class license basis.
48
Pursuant to IDA’s published guidelines, the telecommunications services which are provided as licensable under an SBO license include store-and-retrieve value-added network services, examples of which include any online information and database retrieval services, online games or electronic chatting services, provided by telecommunication systems, built over and above the telecommunications systems operated by an FBO and accessed through public telecommunication systems or leased circuits, which allow telecommunication traffic between a user and the value-added network or between users.
CGH Act and Betting Act
Depending on the type of games and services being offered, the online gaming operations may also be regulated by the CGH Act and the Betting Act. Generally, the CGH Act and the Betting Act prohibit the operation and patronisation of unlicensed common gaming and betting houses as well as ancillary acts. In addition, the CGH Act prohibits the operation of and participation in a public lottery. The offences are wide-ranging in nature and encompass acts by the owner of the website, the player and assisting parties.
The CGH Act generally prohibits the engaging in gaming activities and arguably applies to gaming activities carried out online. In particular, the CGH Act prohibits, among other things, the following: (i) gaming in a “common gaming house” (as such term is defined in the CGH Act) or a public place; (ii) participation or assistance in any public lottery; (iii) advancing or furnishing money for the purpose of establishing or conducting the business of a common gaming house; and (iv) assisting in any manner in the management of a place kept or used as a common gaming house. Under the CGH Act, “gaming” is defined as the playing of any game of chance or of mixed chance and skill for money or money’s worth. “Lottery” includes any game, method, device, scheme or competition to which the public has or may have access, whereby money or money’s worth is distributed or allotted in any manner depending upon or to be determined by chance or lot, whether the same is held, drawn, exercised or managed within or without Singapore. A “public lottery” is defined as a lottery to which the public has or may have access, and every lottery shall, until the contrary is proved, be deemed to be a public lottery.
The Betting Act generally prohibits betting or wagering on any event relating to any horse-race or any other race, fight, game, sport or exercise and would arguably also apply where such betting or wagering is conducted online. In particular, the Betting Act prohibits, inter alia, the following: (i) betting or wagering in a “common betting-house” or with a “bookmaker” (as such terms are defined in the Betting Act) in any place or by any means; (ii) the receipt (directly or indirectly) of any money or valuable thing for or in respect of any bet or wager on any such event; (iii) the advancing or furnishing of money for the purpose of establishing or conducting the business of a common betting-house; and (iv) assisting in any manner in the management or in the business of a place kept or used as a common betting-house.
C. Organizational Structure
We were incorporated in Singapore as a company limited by shares on September 13, 1999. As of the date of this annual report, our principal operating subsidiaries include Hoshin GigaMedia, FunTown World Limited, T2CN, JIDI and IAHGames. Hoshin GigaMedia, our wholly owned subsidiary incorporated in Taiwan, operates our Asian online game and service business in Taiwan. FunTown World Limited, our wholly owned subsidiary incorporated in The British Virgin Islands, operates our Asian online game and service business in Hong Kong and Macau. T2CN, our majority owned subsidiary incorporated in The British Virgin Islands, operates part of our Asian online game and service business in the PRC. JIDI, our wholly owned subsidiary incorporated in the PRC, operates part of our Asian online game and service business in the PRC. IAHGames, our majority owned subsidiary incorporated in Singapore, operates our Asian online game and service business in Southeast Asia. We currently hold a 40 percent interest in Everest Gaming through GigaMedia Europe Limited S.à.r.l., our wholly owned subsidiary incorporated in Luxembourg. Our 40 percent interest in Everest Gaming is, from April 8, 2010, accounted for using the equity method.
Due to restrictions in the PRC on foreign equity ownership of companies providing Internet content services and certain other licensing restrictions, until June 30, 2010, we had operated the Asian online game and service business in the PRC through our three VIEs, T2 Entertainment, T2 Advertisement and Jinyou, which hold the licenses required for the operation of our Asian online game and service business in the PRC, and all of which are owned by PRC nationals. Until June 30, 2010, all of the three VIEs had been effectively controlled by T2 Technology though the following contractual arrangements:
| | • | | Each of the shareholders of T2 Entertainment has irrevocably granted T2 Technology, the wholly-owned subsidiary of T2CN in the PRC, the power to exercise all of their voting rights of T2 Entertainment pursuant to the relevant voting rights and proxy agreement; |
| | • | | Each of the shareholders of T2 Advertisement has irrevocably granted T2 Technology the power to exercise all of their voting rights of T2 Advertisement pursuant to the relevant voting rights and proxy agreement; |
| | • | | Each of the shareholders of Jinyou has irrevocably granted T2 Technology the power to exercise all of their voting rights of Jinyou pursuant to the relevant voting rights and proxy agreement; |
49
| | • | | Our majority-owned subsidiary in China has the power to appoint all directors and senior management members of the three VIEs; |
| | • | | Each of the shareholders of T2 Entertainment has pledged all of their respective equity interests in T2 Entertainment as security for the full performance of their respective obligations under all of their agreements with T2 Technology; |
| | • | | Each of the shareholders of T2 Advertisement has pledged all of their respective equity interests in T2 Advertisement as security for the full performance of their respective obligations under all of their agreements with T2 Technology; |
| | • | | Each of the shareholders of Jinyou has pledged all of their respective equity interests in Jinyou as security for the full performance of their respective obligations under all of their agreements with T2 Technology; |
| | • | | Each of the shareholders of T2 Entertainment has granted T2 Technology an irrevocable option to acquire all or part of the equity interests held by them in T2 Entertainment pursuant to the relevant exclusive call option agreement, to the extent permitted by then-effective laws and regulations in the PRC; |
| | • | | Each of the shareholders of T2 Advertisement has granted T2 Technology an irrevocable option to acquire all or part of the equity interests held by them in T2 Advertisement pursuant to the relevant exclusive call option agreement, to the extent permitted by then-effective laws and regulations in the PRC; and |
| | • | | Each of the shareholders of Jinyou has granted T2 Technology an irrevocable option to acquire all or part of the equity interests held by them in Jinyou pursuant to the relevant exclusive call option agreement, to the extent permitted by then-effective laws and regulations in the PRC. |
In addition, through T2 Technology, we have entered into certain exclusive technical service agreements and exclusive commercial service agreements with T2 Entertainment, T2 Advertisement and Jinyou, respectively, under which T2 Technology provides various technical consulting services, business consulting services and other services to these VIEs in exchange for substantially all of their net incomes.
Since July, 2010, we have lost effective control over a majority of T2CN’s assets (including T2CN Operating Entities) and its financial reporting process due to the dispute with Wang Ji, the former chief executive officer of T2CN that arose in July 2010.We deconsolidated T2CN’s financial results with effect from July 1, 2010 and completely wrote off our investment and advances to the entities held or controlled by T2CN in the fourth quarter of 2010. See Item 3, “Key Information — D. Risk Factors — Risks Related to Doing Business in Greater China — PRC laws and regulations restrict foreign ownership and investment in the online game industry, and substantial uncertainties exist with respect to the application and implementation of PRC laws and regulations” and “— B. Business Overview — Regulation — Regulations Relating to Online Games in the PRC— Foreign Ownership Restrictions” in this annual report. See Item 8, “Financial Information — A. Consolidated Statements and Other Financial Information — Information on Legal or Arbitration Proceedings — Dispute with the former head of our Asian online game and service business in the PRC and former Chief Executive Officer of T2CN” in this annual report.
We established JIDI, a wholly owned subsidiary in the PRC on October 22, 2010. We operate part of our Asian online game and service business in the PRC through our VIE, Shanghai JIDI, which was established on December 6, 2010. Shanghai JIDI holds an ICP license and Internet cultural operation license and is in the process of applying for an Internet publishing license. Shanghai JIDI is owned by PRC nationals. We effectively control our VIE, Shanghai JIDI, through the following contractual arrangements and consolidated the financial results of Shanghai JIDI into our consolidated financial statements since January 2011:
| | • | | Each of the shareholders of Shanghai JIDI has irrevocably granted JIDI, among other things, the power to attend shareholders meeting, to exercise voting rights, to exercise all other rights as shareholder of Shanghai JIDI and to appoint the legal representative, directors and senior management of Shanghai JIDI pursuant to an authorization and proxy letter; |
| | • | | Each of the shareholders of Shanghai JIDI has entered into an agreement with GigaMedia (HK) Limited, our wholly owned subsidiary under which each of the shareholders agrees to accept certain amount of payments provided by GigaMedia (HK) Limited and agrees to use such amount only for the incorporation of Shanghai JIDI; and |
| | • | | Each of the shareholders of Shanghai JIDI has agreed to pledge their respective shares in Shanghai JIDI on request to secure the payments granted by GigaMedia (HK) Limited to the shareholders respectively. |
In addition, JIDI entered into a consulting services agreement with Shanghai JIDI under which JIDI provides certain technical consulting services to Shanghai JIDI in exchange for substantially all of Shanghai JIDI’s net incomes. See Item 3, “Key Information — D. Risk Factors — Risks Related to Doing Business in Greater China — PRC laws and regulations restrict foreign ownership and investment in the online game industry, and substantial uncertainties exist with respect to the application and implementation of PRC laws and regulations” and “— B. Business Overview — Regulation — Regulations Relating to Online Games in the PRC—Foreign Ownership Restrictions” in this annual report.
50
The following organization chart and table set forth our business structure and selected information for each of our principal subsidiaries and VIEs as of the date of this annual report:
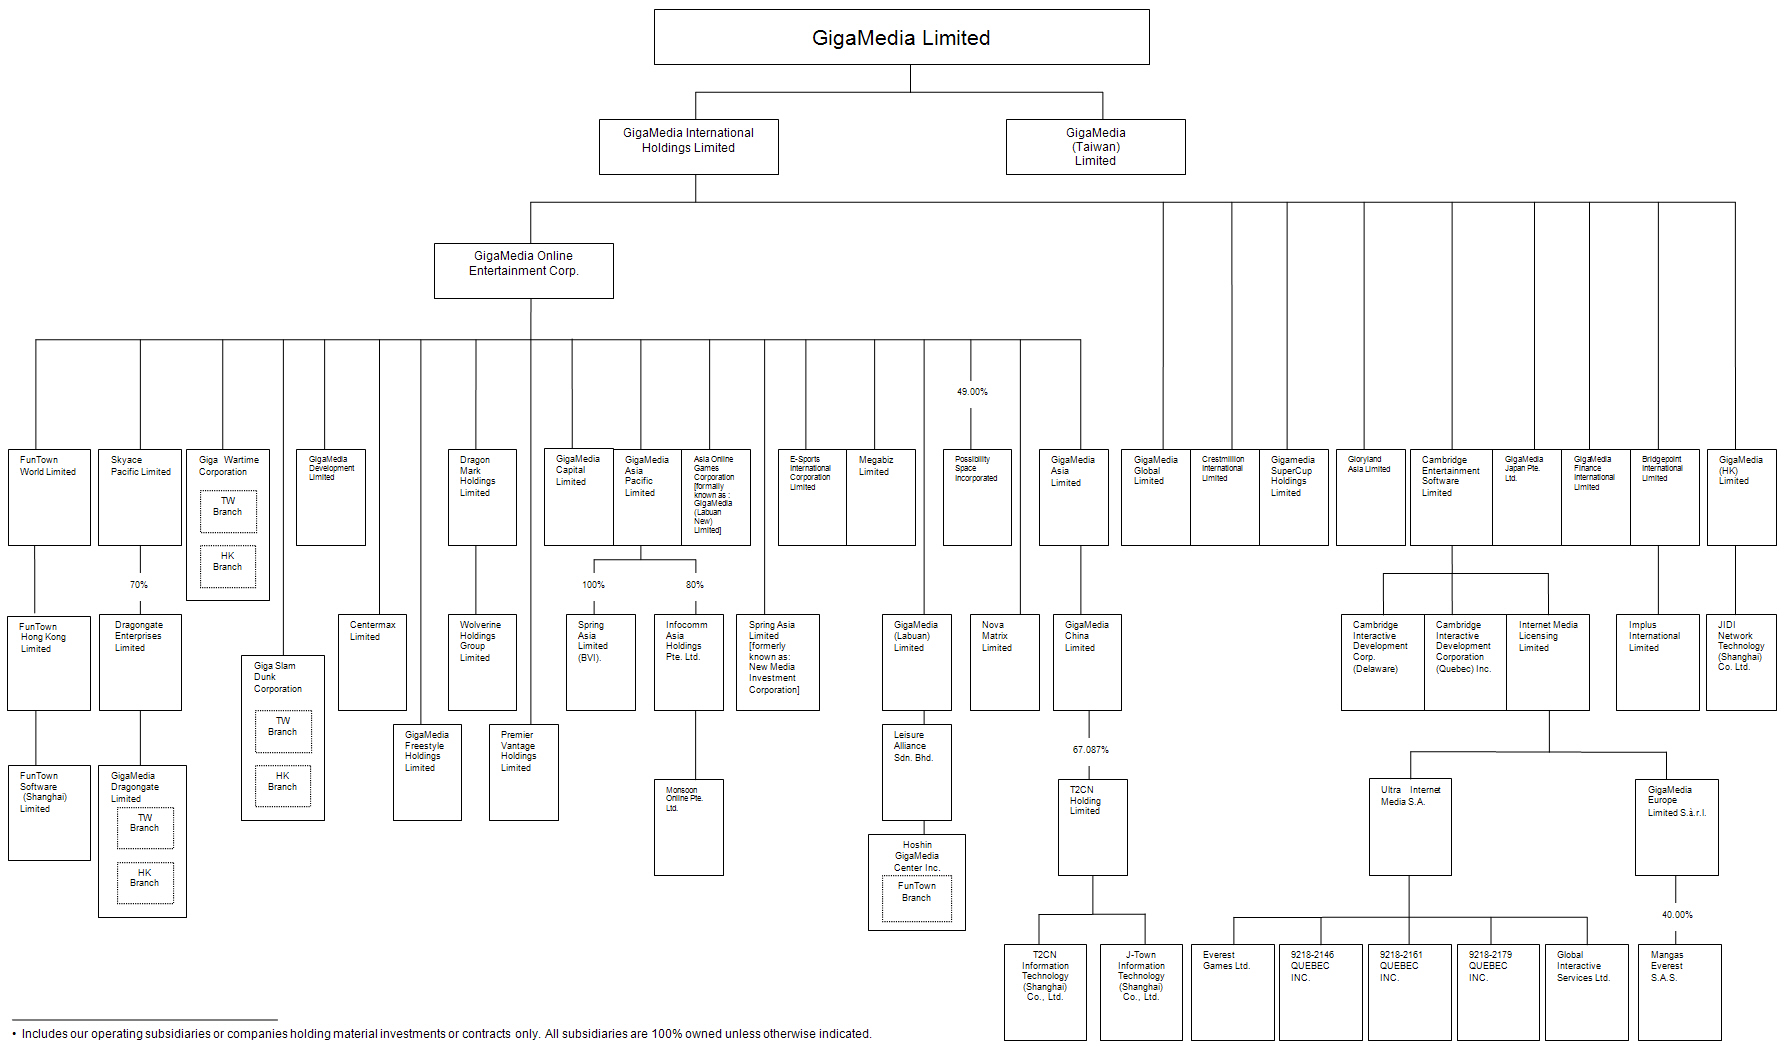
| | | | | | | | | | | | | |
| | | | | | | | | Our | | |
| | | Year of | | Place of | | Percentage | | |
| Entity | | Incorporation | | Incorporation | | Holding | | Principal Activities |
Held by our Company | | | | | | | | | | | | |
| GigaMedia International Holdings Limited | | | 2004 | | | British Virgin Islands | | | 100 | % | | Holding company |
| GigaMedia (Taiwan) Limited | | | 2004 | | | Taiwan | | | 100 | % | | Holding company |
Held by GigaMedia International Holdings Limited | | | | | | | | | | | | |
| GigaMedia SuperCup Holdings Limited | | | 2008 | | | British Virgin Islands | | | 100 | % | | Holding company |
| GigaMedia Global Limited | | | 2004 | | | British Virgin Islands | | | 100 | % | | Online games |
| Cambridge Entertainment Software Limited | | | 2004 | | | British Virgin Islands | | | 100 | % | | Holding company |
| GigaMedia (HK) Limited | | | 2004 | | | Hong Kong | | | 100 | % | | Holding company |
| Crestmillion International Limited | | | 2007 | | | British Virgin Islands | | | 100 | % | | Holding company |
| GigaMedia Japan Pte. Ltd. | | | 2007 | | | Singapore | | | 100 | % | | Holding company |
| GigaMedia Finance International Limited | | | 2000 | | | Cayman Islands | | | 100 | % | | Holding company |
| Bridgepoint International Limited | | | 2004 | | | British Virgin Islands | | | 100 | % | | Holding company |
| Gloryland Asia Limited | | | 2008 | | | British Virgin Islands | | | 100 | % | �� | Online games |
| GigaMedia Online Entertainment Corp. | | | 2009 | | | Cayman Islands | | | 100 | % | | Holding company |
Held by GigaMedia Online Entertainment Corp. | | | | | | | | | | | | |
| FunTown World Limited | | | 2005 | | | British Virgin Islands | | | 100 | % | | Holding company |
| GigaMedia Asia Limited | | | 2005 | | | British Virgin Islands | | | 100 | % | | Holding company |
| GigaMedia Asia Pacific Limited | | | 2006 | | | British Virgin Islands | | | 100 | % | | Holding company |
| Skyace Pacific Limited | | | 2006 | | | British Virgin Islands | | | 100 | % | | Online games |
52
| | | | | | | | | | | | | |
| | | | | | | | | Our | | |
| | | Year of | | Place of | | Percentage | | |
| Entity | | Incorporation | | Incorporation | | Holding | | Principal Activities |
| Centermax Limited | | | 2007 | | | British Virgin Islands | | | 100 | % | | Holding company |
| GigaMedia Capital Limited | | | 2007 | | | British Virgin Islands | | | 100 | % | | Holding company |
| GigaMedia Development Limited | | | 2007 | | | British Virgin Islands | | | 100 | % | | Online games |
| Giga Slam Dunk Corporation | | | 2007 | | | Labuan | | | 100 | % | | Online games |
| Giga Wartime Corporation | | | 2007 | | | Labuan | | | 100 | % | | Online games |
| E-Sports International Corporation Limited | | | 2008 | | | Hong Kong | | | 100 | % | | Online games |
| Dragon Mark Holdings Limited | | | 2008 | | | British Virgin Islands | | | 100 | % | | Holding company |
| Premier Vantage Holdings Limited | | | 2009 | | | British Virgin Islands | | | 100 | % | | Holding company |
| GigaMedia Freestyle Holdings Limited | | | 2009 | | | British Virgin Islands | | | 100 | % | | Holding company |
| Spring Asia Limited (formally known as New Media Investment Corporation) | | | 2009 | | | Labuan | | | 100 | % | | Holding company |
| Asia Online Games Corporation (formally known as GigaMedia (Labuan New) Limited) | | | 2006 | | | Labuan | | | 100 | % | | Holding company |
| GigaMedia (Labuan) Limited | | | 2005 | | | Labuan | | | 100 | % | | Holding company |
| Megabiz Limited | | | 2010 | | | British Virgin Islands | | | 100 | % | | Holding company |
| Nova Matrix Limited | | | 2010 | | | British Virgin Islands | | | 100 | % | | Holding company |
| Possibility Space Incorporated | | | 2005 | | | British Virgin Islands | | | 49 | % | | Holding company |
Held by FunTown World Limited | | | | | | | | | | | | |
| FunTown Hong Kong Limited | | | 1999 | | | Hong Kong | | | 100 | % | | Online games |
Held by FunTown Hong Kong Limited | | | | | | | | | | | | |
| FunTown Software (Shanghai) Limited | | | 2006 | | | PRC | | | 100 | % | | Online games |
Held by Skyace Pacific Limited | | | | | | | | | | | | |
| Dragongate Enterprises Limited | | | 2006 | | | British Virgin Islands | | | 70 | % | | Online games |
53
| | | | | | | | | | | | | |
| | | | | | | | | Our | | |
| | | Year of | | Place of | | Percentage | | |
| Entity | | Incorporation | | Incorporation | | Holding | | Principal Activities |
Held by Dragongate Enterprises Limited | | | | | | | | | | | | |
| GigaMedia Dragongate Limited | | | 2007 | | | Labuan | | | 100 | % | | Online games |
Held by Cambridge Entertainment Software Limited | | | | | | | | | | | | |
| Cambridge Interactive Development Corporation | | | 1997 | | | U.S.A. | | | 100 | % | | Software development and application services |
| Cambridge Interactive Development Corporation (Quebec) Inc. | | | 2005 | | | Canada | | | 100 | % | | Financial and management services |
| Internet Media Licensing Limited | | | 2005 | | | British Virgin Islands | | | 100 | % | | Software development and application services |
Held by Internet Media Licensing Limited | | | | | | | | | | | | |
| GigaMedia Europe Limited S.à.r.l. | | | 2010 | | | Luxembourg | | | 100 | % | | Holding company for 40% of Everest Gaming |
| Ultra Internet Media S.A. | | | 2004 | | | Nevis | | | 100 | % | | Online entertainment operator |
Held by Ultra Internet Media S.A. | | | | | | | | | | | | |
| Everest Games Ltd | | | 2008 | | | British Virgin Islands | | | 100 | % | | Online gaming operator |
| Global Interactive Services Inc. | | | 2005 | | | Canada | | | 100 | % | | Holding company |
| 9218-2146 Quebec Inc. | | | 2010 | | | Canada | | | 100 | % | | Holding company |
| 9218-2161 Quebec Inc. | | | 2010 | | | Canada | | | 100 | % | | Holding company |
| 9218-2179 Quebec Inc. | | | 2010 | | | Cananda | | | 100 | % | | Holding company |
Held by GigaMedia Europe Limited S.à.r.l. | | | | | | | | | | | | |
| Mangas Everest S.A.S. | | | 2010 | | | France | | | 40 | % | | Online gaming operator |
Held by Dragon Mark Holdings Limited | | | | | | | | | | | | |
| Wolverine Holdings Group Limited | | | 2009 | | | British Virgin Islands | | | 100 | % | | Holding company |
54
| | | | | | | | | | | | | |
| | | | | | | | | Our | | |
| | | Year of | | Place of | | Percentage | | |
| Entity | | Incorporation | | Incorporation | | Holding | | Principal Activities |
Held by GigaMedia (Labuan) Limited | | | | | | | | | | | | |
| Leisure Alliance Sdn. Bhd. | | | 2009 | | | Malaysia | | | 100 | % | | Holding company |
Held by Leisure Alliance Sdn. Bhd. | | | | | | | | | | | | |
| Hoshin GigaMedia Center Inc. | | | 1998 | | | Taiwan | | | 100 | % | | Online games |
Held by Bridgepoint International Limited | | | | | | | | | | | | |
| Implus International Limited | | | 2004 | | | British Virgin Islands | | | 100 | % | | Holding company |
Held by GigaMedia Asia Pacific Limited | | | | | | | | | | | | |
| Spring Asia Limited | | | 2005 | | | British Virgin Islands | | | 100 | % | | Holding company |
| Infocomm Asia Holdings Pte. Ltd. | | | 2004 | | | Singapore | | | 80 | % | | Online games |
Held by Infocomm Asia Holdings Pte. Ltd. | | | | | | | | | | | | |
| Monsoon Online Pte. Ltd. | | | 2009 | | | the Republic of Singapore | | | 100 | % | | Online games |
Held by GigaMedia Asia Limited | | | | | | | | | | | | |
| GigaMedia China Limited | | | 2005 | | | British Virgin Islands | | | 100 | % | | Holding company |
Held by GigaMedia China Limited | | | | | | | | | | | | |
| T2CN Holding Limited | | | 2004 | | | British Virgin Islands | | | 67.087 | % | | Online games |
Held by T2CN Holding Limited | | | | | | | | | | | | |
| J-Town Information (Shanghai) Co., Ltd. | | | 2005 | | | PRC | | | 100 | % | | Online games |
| T2CN Information Technology (Shanghai) Co., Ltd. | | | 2004 | | | PRC | | | 100 | % | | Online games |
Controlled by T2CN Information Technology (Shanghai) Co., Ltd. | | | | | | | | | | | | |
| Shanghai T2 Entertainment Co., Ltd. | | | 2004 | | | PRC | | | * | | | Online games |
| Shanghai T2 Advertisement Co., Ltd. | | | 2006 | | | PRC | | | * | | | Advertising |
| Shanghai Jinyou Network & Technology Co., Ltd. | | | 2007 | | | PRC | | | * | | | Online games |
Held by GigaMedia (HK) Limited | | | | | | | | | | | | |
| JIDI Network Technology (Shanghai) Co., Ltd. | | | 2010 | | | PRC | | | 100 | % | | Online games |
Controlled by JIDI Network Technology (Shanghai) Co., Ltd. | | | | | | | | | | | | |
| Shanghai JIDI Network Technology Co., Ltd. | | | 2010 | | | PRC | | | ** | | | Online games |
| | | |
| * | | We had entered into a series of contractual arrangements through which we had effective control over these entities until June 30, 2010. Due to the dispute with T2CN’s former chief executive officer, we have effectively lost control over these entities since July 1, 2010. |
| |
| ** | | We have entered into a series of contractual arrangements through which we have effective control over this entity. |
55
D. Property, Plant and Equipment
Our headquarters are located on the 7th to 9th Floors, 207 Tiding Boulevard, Section 2, Taipei 114, Taiwan. As of May 31, 2011, our headquarters occupied approximately 23,630 square feet.
We also lease office and warehouse space, including space for our servers, in various other locations.
As of May 31, 2011, we leased approximately 5,772 square feet as office premises in Hong Kong.
As of May 31, 2011, we leased approximately 47,137 square feet as office premises for FunTown’s head office in Taipei, Taiwan and approximately 4,831 square feet as office premises for FunTown’s office in Hong Kong. In addition, we leased approximately 1,265 square feet of warehouse space in Hong Kong.
As of May 31, 2011, we leased approximately 818 square feet as IAHGames’ office premises in Hong Kong, 15,000 square feet in Singapore, 2,690 square feet in Indonesia, 5,810 square feet in Thailand, and 334 square feet in Philippines.
As of May 31, 2011, we leased approximately 9,464 square feet as office premises for JIDI’s head office in Shanghai, the PRC.
ITEM 5. OPERATING AND FINANCIAL REVIEW AND PROSPECTS
A. Operating Results
Unless stated otherwise, the discussion and analysis of our financial condition and results of operations in this section apply to our consolidated financial statements as prepared in accordance with U.S. GAAP. You should read the following discussion of our financial condition and results of operations together with the consolidated financial statements and the notes to these statements included elsewhere in this annual report.
Overview
We are a holding company. We operate two principal businesses through our subsidiaries and equity method investees:
| | • | | Our Asian online game and service business operates a portfolio of online games, primarily targeting online game players across Asia, including Greater China and Southeast Asia. |
| | • | | Gaming software and service business, of which we retain a 40 percent equity interest, develops and licenses online poker, casino, and sports betting gaming software solutions and application services, primarily targeting continental European markets. |
56
In 2010, we recorded total operating revenues of approximately US$64.7 million, a decrease of approximately US$94.9 million year-over-year, primarily from a decrease of approximately US$86.9 million resulting from our sale of a 60 percent interest and subsequent deconsolidation in our gaming software and service business and a decrease of approximately US$8.0 million in our Asian online game and service business. Our total costs and expenses decreased by approximately US$87.3 million year-over-year to US$112.4 million. We recorded operating loss of approximately US$47.7 million, a decrease of approximately US$7.6 million year-over-year. We recognized net income attributable to us of approximately US$2.7 million, an increase of approximately US$51.7 million year-over-over.
Asian Online Game and Service Business.We operate our Asian online game and service business through FunTown, T2CN, and IAHGames. We acquired FunTown in January 2006 and incorporated results of the business into our consolidated financial statements starting from January 1, 2006. We have consolidated and incorporated T2CN’s operating results into our consolidated financial statements starting from June 1, 2007. However, due to the dispute with T2CN’s former Chief Executive Officer in July 2010, we have been prevented from obtaining its financial information and we effectively lost control over its financial reporting processes, therefore, we have deconsolidated T2CN’s results effective from July 1, 2010. See note 5 to our consolidated financial statements for additional information. We have consolidated and incorporated IAHGames’ operating results into our consolidated financial statements starting July 1, 2010.
In 2010, our Asian online game and service business generated revenue of approximately US$38.9 million, gross profit of approximately US$21.8 million, operating loss of approximately US$31.6 million, non-operating loss of approximately US$12.6 million, and net loss attributable to us of approximately US$42.4 million.
In addition to our majority-controlled subsidiaries, we also entered into strategic alliances with SoftStar, Neostorm, XL Games, Access China, Gorilla Banana Entertainment, JC Entertainment Corporation, Possibility Space Incorporated, and East Gate in June 2007, October 2007, December 2007, January 2008, May 2009, September 2009, December 2009, and August 2010, respectively. SoftStar is an online game development and publishing company incorporated in Taiwan. Neostorm was formed by the merger of four previously independent game development studios creating one of the largest independent game development companies in South Korea. Neostorm focuses on medium-core casual game titles. XL Games was founded by the creator of one of the most popular online game franchises in history and focuses on MMORPGs with studios in Seoul, South Korea and Austin, Texas. Access China is an online game software developer in the PRC. Gorilla Banana Entertainment is an online game software developer in Korea. JC Entertainment Corporation is a publicly-listed company which develops online games in Korea. Possibility Space Incorporated is an online game software developer in the PRC. East Gate is a Korean fund which invests in online game businesses and films. For additional information with respect to our acquisitions and investments, see Item 4, “Information on The Company — A. History and Development of Our Company” in this annual report.
Online casual game operators in Greater China and Southeast Asia are currently our primary competitors. We also compete with MMORPG operators throughout Greater China and Southeast Asia. Given the low barriers to entry in the online game industry and the increasing popularity of Internet-based businesses, there are a large number of potential competitors scattered throughout many different segments of the software and Internet industries. In addition to the aforementioned competitors, traditional entertainment service providers and other entities, many of which have significant financial resources and name brand recognition, may provide online game services in the future, and thus become our competitors.
Faced with our known competitors, and most likely several new competitors which may be established in the near future, we will continue to improve the principal competitive factors that we believe can differentiate our product offerings from those offered by our competitors, including: brand, technology, financial stability and resources, proven track record, independent oversight and transparency of business practices in our industry.
Gaming Software and Service Business.Until April 8, 2010, we operated our gaming software and service business through our subsidiary, CESL, and through its wholly-owned subsidiaries, CIDC and IMLL. Under the terms of the licenses granted by us to UIM, we were entitled to a share of the revenues of such licensee, and as such, we had certain economic risks with respect to, and derived certain economic benefits from, their operations. Therefore, through March 31, 2010, the financial results of UIM were incorporated into our consolidated financial statements as UIM met the criteria of a variable-interest entity (“VIE”) as defined by the FASB Accounting Standards Codification. See “— A. Operating Results — Certain Significant Events Affecting Our Results of Operations for 2008, 2009 and 2010 — Consolidation of UIM”.
57
On April 8, 2010, we sold a 60 percent interest in our gaming software and service business to Mangas Gaming S.A.S, a French Corporation, now renamed as BetClic Everest Group, and deconsolidated the gaming software and service business as we ceased to have a controlling financial interest from that date. The remaining 40 percent ownership interest that we retained in the gaming software and service business has been accounted for under the equity method accounting starting from April 2010. See note 6 to our consolidated financial statements for additional information. See Item 4 “Information on the Company — B. Business Overview — Gaming Software and Services Business — Terms of our joint venture with BetClic regarding Everest Gaming” for more information.
In 2010, our gaming software and service business generated revenue of approximately US$25.8 million, gross profit of approximately US$21.8 million, operating income of approximately US$78 thousand, non-operating income of approximately US$69.6 million, and net income attributable to us of approximately US$61.7 million.
Certain Significant Events Affecting Our Results of Operations for 2008, 2009 and 2010
Divestiture of Our Legacy Internet Access and Service Business
In September 2008, we completed the sale of our Internet access and service business, which included 100 percent of our wholly-owned subsidiaries, Koos Broadband Telecom Co., Ltd. and Hoshin Multimedia Center Inc., as well as certain assets and liabilities related to our Internet access and service business, for a total transaction price of $20.0 million.
The transaction price, net of transaction costs, price adjustments and cash transferred, was approximately $16.5 million. The after-tax gain from the sale of the Internet access and service business was approximately $9.8 million.
In addition to the above sales price, we were entitled to receive additional cash payments of $3.0 million and $2.0 million if the Internet access and service business that we sold achieved certain earn-out targets by September 2009 and 2010. The earn-out targets were to be determined by future gross profits in accordance with a formula and timeline set forth in the agreements. As of December 31, 2009 and 2010, we did not accrue any additional receivable for the sale of the Internet access and service business since the earn-out targets for the periods ended September 2009 and 2010 were not achieved.
Results for the Internet access and service operations are reported as discontinued operations in 2008, 2009 and 2010. In 2008, income from discontinued operations was $9.4 million, which included an after-tax loss from the Internet access and service business of $0.4 million and an after-tax gain on the sale of the business of $9.8 million.
Summarized selected financial information for discontinued operations is as follows:
| | | | | | | | | | | | | |
| (in US$ thousands) | | 2008 | | | 2009 | | | 2010 | |
| | | | | | | | | | | | | |
| Revenue | | $ | 9,289 | | | $ | 159 | | | $ | 146 | |
| | | | | | | | | | |
| | | | | | | | | | | | | |
| Income (loss) from discontinued operations before tax | | $ | (593 | ) | | $ | 222 | | | $ | (128 | ) |
| Gain on sale of the discontinued operations before tax | | | 11,014 | | | | — | | | | — | |
| Income tax expenses | | | (986 | ) | | | — | | | | — | |
| | | | | | | | | | |
| Income (loss) from discontinued operations | | $ | 9,435 | | | $ | 222 | | | $ | (128 | ) |
| | | | | | | | | | |
58
Major classes of assets and liabilities which comprised the Internet access and service business at the date of disposal, September 2008, included the following:
| | | | | |
| (in US$ thousands) | | Amount | |
| Cash | | $ | 493 | |
| Accounts receivable | | | 2,325 | |
| Other current assets | | | 1,125 | |
| Property and equipment | | | 4,328 | |
| Other assets | | | 165 | |
| | | | |
| Total assets | | $ | 8,436 | |
| | | | |
| Accounts payable | | $ | 1,056 | |
| Other current liabilities | | | 759 | |
| Noncurrent liabilities | | | 672 | |
| | | | |
| Total liabilities | | $ | 2,487 | |
| | | | |
Divestiture of Gaming Software and Service Business
On December 15, 2009, we entered into an agreement with BetClic to sell 60 percent of substantially all of the assets and liabilities of our gaming software and service business for approximately $100 million in cash, subject to certain adjustments. The closing of the sale occurred on April 8, 2010. The sale resulted in the recognition of a gain of $79.1 million, net of transaction costs. The sale of the remaining 40 percent is subject to a put and call mechanism in place between us and BetClic, as defined in the agreement. We will have the option to put all or part of its remaining 40 percent to BetClic in each of 2013, 2014, and 2015 at a value considering all relevant facts and circumstances after the end of each year. If the put option owned by us is not fully exercised, BetClic will have the option to call the remaining interest held by us in each of 2015 and 2016.
As of December 31, 2009, substantially all of the assets and liabilities in our gaming software and service business were reclassified to assets and liabilities held for sale. The assets and liabilities held for sale balances were reduced by 40 percent, which represents the ownership interest that we retained in the gaming software and service business and were recorded as “Retained ownership of gaming software and service business”, which amounted $26.0 million as of December 31, 2009. Therefore, the accompanying Consolidated Balance Sheet at December 31, 2009 includes the following:
| | | | | |
| (in US$ thousands) | | Amount | |
| Assets Held for Sale-Current | | | | |
| Cash | | $ | 35,015 | |
| Accounts receivable | | | 15,817 | |
| Prepaid expenses | | | 7,609 | |
| Other current assets | | | 632 | |
| Less: retained ownership | | | (23,629 | ) |
| | | | |
| | | $ | 35,444 | |
| | | | |
| Assets Held for Sale-Noncurrent | | | | |
| Property, plant and equipment | | $ | 7,358 | |
| Goodwill | | | 29,243 | |
| Intangible assets | | | 11,368 | |
| Other assets | | | 4,199 | |
| Less: retained ownership | | | (20,867 | ) |
| | | | |
| | | $ | 31,301 | |
| | | | |
| Liabilities Held for Sale-Current | | | | |
| Accounts payable | | $ | 11 | |
| Accrued compensation | | | 1,076 | |
| Accrued expenses | | | 6,869 | |
| Player account balances | | | 35,015 | |
| Other current liabilities | | | 1,126 | |
| Less: retained ownership | | | (17,639 | ) |
| | | | |
| | | $ | 26,458 | |
| | | | |
| Liabilities Held for Sale-Noncurrent | | | | |
| Other liabilities | | $ | 2,266 | |
| Less: retained ownership | | | (906 | ) |
| | | | |
| | | $ | 1,360 | |
| | | | |
In accordance with the FASB Accounting Standards Codification, the amount of goodwill to be included in the assets held for sale and the retained ownership as of December 31, 2009 is based on the relative fair values of the business to be sold and the portion of the business that will be retained.
59
The 40 percent ownership interest that we retained in the gaming software and service business is included in our Consolidated Balance Sheet as of December 31, 2009 as follows:
| | | | | |
| (in US$ thousands) | | Amount | |
| Retained ownership of gaming software and service business | | | | |
| Current assets | | $ | 23,629 | |
| Noncurrent assets | | | 20,867 | |
| Current liabilities | | | (17,639 | ) |
| Noncurrent liabilities | | | (906 | ) |
| | | | |
| | | $ | 25,951 | |
| | | | |
We deconsolidated the gaming software and service business and recognized a gain when we completed the sale of 60 percent of substantially all of the assets and liabilities to BetClic on April 8, 2010, which was the date that the Company ceased to have a controlling financial interest. The remaining 40 percent ownership interest that we retained in the gaming software and service business has been accounted for under the equity method accounting starting from April 2010. In 2010, we recorded US$9.8 million equity loss for the remaining 40 percent interest for the period from April to December, 2010.
The Company accounted for the deconsolidation of the gaming software and service business at fair value and recognized a gain of $79.1 million measured as the difference between:
| | | | | |
| (in US$ thousands) | | Amount | |
| The fair value of any consideration received, including purchase price adjustments, net of any transaction costs | | $ | 82,984 | |
| The fair value of the 40% retained noncontrolling investment in the gaming software and service business at the date the business was deconsolidated | | | 54,240 | |
| Less: The carrying amount of the gaming software and service business at the date of the deconsolidation | | | (58,084 | ) |
| | | | |
| Gain on deconsolidation of the gaming software and service business | | $ | 79,140 | |
| | | | |
Acquisition of IAHGames
In July 2010, we began consolidating IAHGames, an online game operator, publisher and distributor in Southeast Asia. We acquired IAHGames in order to enhance our position in the online game market in Southeast Asia and strengthen our online entertainment product portfolio. This primary factor among others, contributed to a purchase price in excess of the fair market value of the net tangible assets and intangible assets acquired.
As of December 31, 2010, we owned aggregate 7,191,111 shares of Series A and Series B preferred shares of IAHGames, which represents a controlling financial interest of 80 percent of the total outstanding voting rights of IAHGames. The preferred shares (Series A) are convertible into ordinary shares of IAHGames at a conversion rate of 10 Series A shares for 1 ordinary share. The preferred shares (Series B) are convertible into ordinary shares of IAHGames at a conversion rate of 1 Series B share for 1 ordinary share.
The following summarizes our acquisition of IAHGames during the period from 2006 to 2010:
| | | | | | | | | | | | | |
| | | | | | | | | | | Accumulated | |
| (in US$ thousands) | | | | | | | | | voting interest | |
| Date of acquisition | | | Amount | | | Description | | at those points in time | |
| | | | | | | | | | | | | |
| December, 2006 | | $ | 5,750 | * | | Purchased 500,000 convertible voting preferred shares-Series B | | | 32.26 | % |
| | | | | | | | | | | | | |
| May, 2010 | | $ | 2,192 | ** | | Purchased 208,881 convertible voting preferred shares-Series B | | | 40.30 | % |
| | | | | | | | | | | | | |
| July, 2010 | | $ | 4,500 | | | Purchased 5,982,230 convertible voting preferred shares-Series A | | | 57.87 | % |
| | | | | | | | | | | | | |
| July, 2010 | | $ | 10,000 | | | Purchased 500,000 convertible voting preferred shares-Series B | | | 80.00 | % |
| | | |
| * | | The original investment amount of $10 million was written down to $5.8 million, resulting from an impairment charge of $4.2 million recorded in 2009. |
| |
| ** | | We issued 866,373 common shares, valued at approximately $2.2 million as consideration. |
60
In connection with the step acquisitions through July 2010, we recorded goodwill of approximately $12.2 million. Such goodwill amount is non-deductible for tax purposes. Since July 1, 2010, the results of IAHGames’ operations have been included in our consolidated financial statements under the Asian online game and service business.
The purchase price allocation was determined based on management’s estimate of the fair value of IAHGames in connection with the acquisitions. The purchase price allocation of the acquisition was as follows:
| | | | | | | |
| (in US$ thousands) | | Amortization Life (in years) | | Amount | |
| Cash acquired | | | | $ | 9,070 | |
| Accounts receivable | | | | | 5,715 | |
| Other current assets | | | | | 5,129 | |
| Equity method investments | | | | | 20,319 | |
| Fixed assets/ non-current assets | | | | | 721 | |
| Non-compete contracts | | 3 | | | 387 | |
| Favorable lease right | | 13.5 | | | 2,861 | |
| Prepaid licensing and royalty fees | | 1.75 ~ 4 | | | 1,010 | |
| Goodwill | | N/A | | | 12,188 | |
| | | | | | |
| Total assets acquired | | | | | 57,400 | |
| | | | | | |
| | | | | | | |
| Current liabilities | | | | | 23,304 | |
| Noncurrent liabilities | | | | | 9,145 | |
| | | | | | |
| Total liabilities assumed | | | | | 32,449 | |
| | | | | | |
| | | | | | | |
| Preferred shares (Series A) | | | | | (1,317 | ) |
| Noncontrolling interest | | | | | (1,192 | ) |
| | | | | | |
| Total purchase price | | | | $ | 22,442 | |
| | | | | | |
The following unaudited pro-forma information presents a summary of the results of operations of our Company for the years ended December 31, 2009 and 2010 as if we controlled 80 percent of the total outstanding voting rights of IAHGames and consolidated IAHGames as of the beginning of the periods presented.
| | | | | | | | | |
| | | Year Ended December 31 | |
| (in US$ thousands, except per share figures) | | 2009 | | | 2010 | |
| | | Unaudited | | | Unaudited | |
| Net revenue | | $ | 165,883 | | | $ | 69,403 | |
| Loss from operations | | | (41,812 | ) | | | (50,378 | ) |
| Net loss | | | (56,226 | ) | | | (1,570 | ) |
| Net (loss) income attributable to us | | | (49,574 | ) | | | 255 | |
| Basic (loss) earnings per share attributable to us | | | (0.89 | ) | | | 0.00 | |
| Diluted (loss) earnings per share attributable to us | | | (0.89 | ) | | | 0.00 | |
The unaudited pro-forma supplemental information is based on estimates and assumptions, which we believe are reasonable; it is not necessarily indicative of the consolidated financial position or results of operations in future periods or the results that actually would have been realized had we been a combined company during all of 2009 and 2010. The above unaudited pro-forma financial information includes adjustments for the amortization of identified intangible assets with definite lives.
Deconsolidation of T2CN
Beginning in June 2007, we consolidated T2CN. T2CN is an operator and provider of online sports games in the PRC. As of December 31, 2009 and 2010, we owned 43,633,681 common shares of T2CN, which represents an ownership interest of 67.09 percent of the total outstanding voting rights of T2CN.
61
The following summarizes our acquisitions of T2CN during the period from 2006 to 2010:
| | | | | | | | | | | |
| | | | | | | | | Accumulated | |
| (in US$ thousands) | | | | | | | | voting interest | |
| Date of acquisition | | Amount | | | Description | | at those points in time | |
| | | | | | | | | | | |
| 2006 | | $ | 15,000 | | | Purchased 7,500,000 convertible voting preferred shares | | | 19.02 | % |
| 2007 | | $ | 23,736 | * | | Acquired 31,113,681 common shares (including convertible voting preferred shares converted into common shares) in total | | | 58.11 | % |
| | | | | | | | | | | |
| 2008 | | $ | 3,375 | | | Purchased 4,500,000 common shares | | | 65.68 | % |
| | | | | | | | | | | |
| 2009 | | $ | 285 | | | Purchased 520,000 common shares | | | 67.09 | % |
| | | |
| * | | The purchase price includes the issuance of 226,385 common shares of us, valued at approximately $2.7 million. |
As a result of a dispute with T2CN’s former Chief Executive Officer, which arose in July 2010, we have been prevented from obtaining its financial information and currently does not have access to the assets and financial information of the entities held by T2CN. Since we do not have access to the operating assets of T2CN and as we have been prevented from obtaining the financial information necessary to report the financial results of T2CN, we have effectively lost control over T2CN’s financial reporting process. Therefore, although we still own 67.09 percent of T2CN’s common stock, we deconsolidated T2CN’s results with effect from July 1, 2010. The following is a breakdown of our retained investment at the date of deconsolidation.
| | | | | |
| (in US$ thousands) | | Amount | |
| Cash | | $ | 12,903 | |
| Other current assets | | | 1,266 | |
| Fixed assets/ non-current assets | | | 1,679 | |
| Prepaid licensing and royalty | | | 5,339 | |
| Intangible assets | | | 1,098 | |
| | | | |
| Total assets of T2CN | | | 22,285 | |
| Total liabilities of T2CN | | | (12,331 | ) |
| | | | |
| Net equity of T2CN | | | 9,954 | |
| Noncontrolling interest | | | (3,276 | ) |
| Goodwill acquired | | | 17,500 | |
| Advances to the entities held by T2CN | | | 1,405 | |
| | | | |
| | | $ | 25,583 | |
| | | | |
In connection with our year-end financial reporting process, we were required to perform an impairment analysis for the Company’s investment in and advances to the entities held by T2CN as of December 31, 2010. Given the uncertain timeline relating to the resolution of the dispute, and primarily because the Company still cannot exercise any control over the operations of T2CN or obtain any financial data from the management of T2CN, management decided to completely write-off both the Company’s investment in and its advances to the entities held by T2CN in order to properly reflect our financial position as of December 31, 2010. The impairment charges recorded for the investment and the advances in 2010 are approximately $22.2 million (after removing the other comprehensive income component of equity related to T2CN from the Company’s balance sheet) and approximately $1.4 million, respectively.
Treatment of T2 Entertainment, T2 Advertisement, and Jinyou before Deconsolidation
Pursuant to various agreements entered into among T2 Entertainment, T2 Technology and the equity interest owners of T2 Entertainment, until June 30, 2010, T2CN, through its wholly owned subsidiary T2 Technology, had effective control over T2 Entertainment and was considered the primary beneficiary of T2 Entertainment. T2 Entertainment was established to hold the necessary licenses required for the operation of our Asian online game and services business in the PRC. Accordingly, from the date that we consolidated T2CN through July 1, 2010, the date we deconsolidated T2CN (see note 5 to our consolidated financial statements for additional information), the financial results of T2 Entertainment were included in the accompanying consolidated financial statements.
Pursuant to various agreements entered into among T2 Advertisement, T2 Technology and the equity interest owners of T2 Advertisement, until June 30, 2010, T2CN, through its wholly owned subsidiary T2 Technology, had effective control over T2 Advertisement and was considered the primary beneficiary of T2 Advertisement. T2 Advertisement was established to hold the necessary licenses required for the operation of our Asian online game related advertisement services in the PRC. Accordingly, from the date that we consolidated T2CN through July 1, 2010, the date we deconsolidated T2CN (see note 5 to our consolidated financial statements for additional information), the financial results of T2 Advertisement were included in the accompanying consolidated financial statements.
62
T2 Technology also entered into various agreements with Jinyou and the equity interest owners of Jinyou. Until June 30, 2010, T2CN, through its wholly owned subsidiary T2 Technology, had effective control over Jinyou and was considered the primary beneficiary of Jinyou. In September 2008, Jinyou acquired an ICP license required for the operation of our Asian online game and services business in the PRC and the agreements entered into by and among T2 Technology, Jinyou and the equity interest owners of Jinyou became effective. Accordingly, the financial results of Jinyou were included in the accompanying consolidated financial statements starting from September 2008 through July 1, 2010.
As a result of a dispute that arose in July 2010 with T2CN’s former Chief Executive Officer, we have been prevented from obtaining the financial information necessary to report the financial results of T2CN, and we effectively lost control over T2CN’s financial reporting process. Therefore, we deconsolidated T2CN’s results with effect from July 1, 2010. As a result, we also ceased treating T2 Entertainment, T2 Advertisement and Jinyou as our variable-interest entities. See note 5 to our consolidated financial statements for additional information.
The net assets, total assets and total liabilities in the aggregate of T2 Entertainment, T2 Advertisement and Jinyou were approximately $1.6 million, $18.2 million and $16.6 million, as of December 31, 2009, respectively, and $2.5 million, $20.9 million and $18.4 million, as of July 1, 2010 (the date of deconsolidation), respectively. For the years ended December 31, 2008, 2009 and the period from January to June 2010, total revenue and net income (loss) in the aggregate of T2 Entertainment, T2 Advertisement and Jinyou recorded in our consolidated financial statements were as follows:
| | | | | | | | | | | | | |
| (in US$ thousands) | | 2008 | | | 2009 | | | 2010 | |
| Total revenue | | $ | 20,312 | | | $ | 18,673 | | | $ | 10,126 | |
| | | | | | | | | | |
| Net income (loss) | | $ | 1,571 | | | $ | (2,990 | ) | | $ | 834 | |
| | | | | | | | | | |
Consolidation of UIM
Through the date of sale to BetClic in April 2010, our Company had a software license and support service contract with UIM to provide Internet software and support services for UIM’s online gaming operations. The contract allowed us to charge UIM a percentage of its gross receipts resulting from UIM’s online gaming operations. The percentage of gross receipts varied depending upon the software and support services provided to UIM. We analyzed our contractual relationships with UIM and determined that we were the primary beneficiary of UIM. As a result of such determination, we had incorporated the results of UIM into our consolidated financial statements, even though we did not own any of UIM’s equity. In connection with the sale to BetClic, we purchased 100 percent of the ownership in UIM from its shareholders for $400 thousand and adjusted additional paid-in capital and noncontrolling interest by approximately $178 thousand and ($578) thousand, respectively. Subsequent to the sale, UIM became dormant.
The net assets (liabilities), total assets and total liabilities of UIM were approximately $(932) thousand, $82.9 million and $83.8 million, respectively, as of December 31, 2009. For the years ended December 31, 2008 and 2009, and the period from January to March 2010, total revenue and net income (loss) of UIM were as follows:
| | | | | | | | | | | | | |
| (in US$ thousands) | | 2008 | | | 2009 | | | 2010 | |
| Total revenue | | $ | 144,765 | | | $ | 112,694 | | | $ | 25,820 | |
| | | | | | | | | | |
| Net income (loss) | | $ | (206 | ) | | $ | (1,226 | ) | | $ | 1,514 | |
| | | | | | | | | | |
63
Impairment Loss Related to Underperforming Game Projects in Our Asian Online Game and Service Business
2009 Impairment Loss
As a result of underperforming game projects including but not limited to Hellgate: Longon, Luna Online, Holic, Warhammer Online, and NBA Street Online, we recorded an impairment loss of approximately US$37.7 million within our Asian online game and service business in our consolidated financial statements for the year ended December 31, 2009 as follows:
1) US$14.1 million impairment loss on goodwill from the acquisition of T2CN. The goodwill had a carrying amount of US$31.6 million which was written down to its fair value of US$17.5 million, resulting in the impairment charge of US$14.1 million. Goodwill is valued on a nonrecurring basis when impairment exists, using a discounted cash flow model to determine fair value, incorporating available market discount information, our estimate for liquidity risk and other cash flow model related assumptions based on unobservable inputs.
2) US$18.3 million impairment loss on prepaid licensing and royalty fees, which was related to certain licensed games that we stopped operating or for which the carrying amounts were determined not to be recoverable due to lower than expected performances. Prepaid licensing and royalty fees are valued on a nonrecurring basis when impairment exists, using a discounted cash flow model to determine fair value, incorporating available market discount information, our estimate for liquidity risk and other cash flow model related assumptions based on unobservable inputs.
3) US$4.5 million impairment loss on intangible assets for capitalized software costs to reflect a full provision relating to certain projects that we have ceased to further develop; and
4) US$777 thousand impairment loss on fixed assets, which was related to servers used in certain impaired licensed games or internally developed games. Fixed assets are valued on a nonrecurring basis when impairment exists, using a discounted cash flow model to determine fair value, incorporating available market discount information, our estimate for liquidity risk and other cash flow model related assumptions based on unobservable inputs.
2010 Impairment Loss
We recorded an impairment loss of approximately $4.7 million due to certain underperforming game projects and of approximately $22.2 million due to the deconsolidation of T2CN within our Asian online game and service business in our consolidated financial statements for the year ended December 31, 2010 as follows:
1) US$2.3 million impairment loss on goodwill from the acquisition of IAHGames. The goodwill had a carrying amount of US$12.2 million which was written down to its fair value of US$9.9 million, resulting in the impairment charge of US$2.3 million. Goodwill is valued on a nonrecurring basis when impairment exists, using a discounted cash flow model to determine fair value, incorporating available market discount information, our estimate for liquidity risk and other cash flow model related assumptions based on unobservable inputs.
2) US$870 thousand impairment loss on prepaid licensing and royalty fees, which was related to certain licensed games that we stopped operating or for which the carrying amounts were determined not to be recoverable due to lower than expected performances. Prepaid licensing and royalty fees are valued on a nonrecurring basis when impairment exists, using a discounted cash flow model to determine fair value, incorporating available market discount information, our estimate for liquidity risk and other cash flow model related assumptions based on unobservable inputs.
3) US$1.3 million impairment loss on intangible assets for capitalized software costs to reflect a full provision relating to certain projects that we have ceased to further develop.
4) US$278 thousand impairment loss on fixed assets, which was related to servers used in certain impaired licensed games or internally developed games. Fixed assets are valued on a nonrecurring basis when impairment exists, using a discounted cash flow model to determine fair value, incorporating available market discount information, our estimate for liquidity risk and other cash flow model related assumptions based on unobservable inputs; and
64
5) US$22.2 million impairment loss on the deconsolidation of T2CN. Given the uncertain timeline relating to the resolution of our dispute with T2CN’s former Chief Executive Officer, and primarily because the Company still cannot exercise any control over the operations of T2CN or obtain any financial data from the management of T2CN, we decided to completely write-off both the Company’s investment of US$22.2 million and its advances of US$1.4 million to the entities held by T2CN as of December 31, 2010. The write off of advances of US$1.4 million was included in bad debt expense.
Impairment Loss on Marketable Securities and Investments
As a result of unsuccessful investments in game studios and companies, we recognized impairment loss on marketable securities and investments of US$15.7 million and US$4.7 million in 2009 and 2010, respectively. The major impairments are listed below:
2009 Impairment Loss on Marketable Securities and Investments
| 1) | | In 2006, we acquired voting preferred shares in IAHGames which were convertible into a 32.26% ordinary share interest in IAHGames at a cost of US$10 million. In 2007, due to IAHGames’ issuance of new preferred shares to third parties, the Company’s percentage ownership in IAHGames’ common equity on an as converted basis was reduced to 28.43%. As a result of deteriorating earnings by IAHGames during 2009, we determined our investment in IAHGames to be partially impaired. During the fourth quarter of 2009, we recorded an impairment charge of US$4.2 million to write down our investment to its fair value of approximately US$5.8 million. |
| 2) | | In 2007, we made an investment in preferred shares of Neostorm of US$5.6 million. During 2009, games developed by Neostorm proved to be unsuccessful, and we wrote off our investment in Neostorm. |
| 3) | | In 2008, we made an investment in preferred shares of SuperCup of US$2.0 million. SuperCup ceased operations in 2009, and we wrote off our investment in SuperCup. |
| 4) | | In 2009, we made an investment in common shares of JC Entertainment Corporation of US$7.1 million. We recorded impairment loss of $2.9 million in the fourth quarter of 2009 based on the excess of its market value derived from listed price as of December 31, 2009 over its carrying value. |
2010 Impairment Loss on Marketable Securities and Investments
| 1) | | In 2008, we made an investment in preferred shares of Access China (“ACC”) of US$3 million. As a result of deteriorating earnings and inability to meet its projections and forecasts, we decided to write off our investments in ACC in 2010. |
| 2) | | In 2010, we made an investment in preferred shares of PSI of US$1.5 million, which ceased operations in December 2010. We fully wrote off this investment in 2010. |
Subsequent Events
Share Repurchase Program
On May 20, 2011, our board of directors approved a share repurchase program for our common stock. Under the terms of the share repurchase program, we may repurchase up to $11 million of our issued and outstanding shares beginning on June 1, 2011. The repurchases will be made from time to time on the open market at prevailing market prices pursuant to a Rule 10b5-1 plan and will be subject to restrictions relating to volume, pricing and timing. The timing and extent of repurchases is dependent upon market conditions, the trading price of our shares and other factors. We are implementing this share repurchase program in a manner consistent with market conditions, in the interests of our shareholders, and in compliance with our securities trading policy and relevant Singapore and U.S. laws and regulations. Our board of directors will review the share repurchase program periodically, and may authorize adjustments to its terms and size. We are funding repurchases made under this program from our available cash balance. We plan to cancel all repurchased shares. Through June 29, 2011, repurchases under this program amounted to approximately 1.3 million shares at a cost of approximately US$1.7 million.
65
Critical Accounting Policies
The discussion and analysis of our financial condition and results of operations are derived from our consolidated financial statements, which have been prepared in accordance with accounting principles generally accepted in the U.S., or U.S. GAAP. The preparation of these consolidated financial statements requires us to make estimates and assumptions that affect the reported amounts of assets, liabilities, revenues and expenses, and the related disclosure of contingent assets and liabilities as of the date of the consolidated financial statements. We continually evaluate our estimates and assumptions, which are based on historical experience and other various factors that we believe are reasonable under the circumstances. The results of these estimates and assumptions form the basis for making judgments about the carrying values of certain assets and liabilities. Our actual results could differ significantly from those estimates under different assumptions and conditions. We believe that the following discussion addresses the most critical accounting policies applicable to our Company, which are those that are most important to the portrayal of the financial condition and results of operations of our Company, and require management’s most difficult, subjective and complex judgments, often as a result of the need to make estimates about the effect of matters that are inherently uncertain.
Consolidation
The consolidated financial statements include the accounts of us and our wholly-owned, majority-owned and majority-controlled subsidiaries after elimination of all inter-company accounts and transactions. In addition, the accounts of our Company’s VIE’s as defined by the FASB Accounting Standards Codification are included in the consolidated financial statements. See note 3 to our consolidated financial statements for additional information. The accounting policies for other less than majority-owned investments are described in note 1 to our consolidated financial statements in the paragraphs headed “Marketable Securities” and “Investments”.
Acquisitions
Before January 1, 2009, our Company accounted for its business acquisitions using the purchase method as required by the FASB. Under the purchase method, the acquiring company allocated the purchase price to the assets acquired and liabilities assumed based on their estimated fair values at the date of acquisition, including intangible assets that could be identified. The purchase price in excess of the fair value of the net assets and liabilities identified was recorded as goodwill. Business acquisitions that our Company enters into after January 1, 2009 are being accounted for in accordance with the new accounting guidance issued by the FASB using the acquisition method. Under the new accounting guidance, our Company recognizes and measures the identifiable assets acquired, the liabilities assumed and any noncontrolling interest at their acquisition-date fair values, with limited exceptions. Acquisition-related costs will be generally expensed as incurred.
Revenue Recognition
Our Company recognizes revenue when persuasive evidence of an arrangement exists, delivery occurs or services are rendered, the sales price is fixed or determinable and collectability is reasonably assured. We present the sales taxes assessed by governmental authorities on our revenue transactions on a net basis in our consolidated financial statements.
Our Company enters into multiple-element revenue arrangements, which may include any combination of services, software, and/or products. To the extent that a deliverable in a multiple-element arrangement is subject to specific accounting guidance, whether and/or how to separate multiple deliverable arrangements into separate units of accounting (separability) and how to allocate the arrangement consideration among those separate units of accounting (allocation) for that deliverable is accounted for in accordance with such specific guidance.
In addition to the aforementioned general policies, the following are the specific revenue recognition policies for each major category of revenue.
66
Gaming Software and Service Revenues
Prior to our sale of a 60 percent interest in our online gaming software and service business in April 2010, gaming software and service revenues were related to software products we developed and licensed and support services we provided for online real-money gaming solutions and applications. Subsequent to the sale, the remaining 40 percent ownership interest that we retained in the gaming software and service business has been accounted for under the equity method accounting starting from April 2010; therefore, no revenue directly from gaming software and service business was subsequently recorded.
The results of a software licensee of our Company, UIM had been incorporated into our consolidated financial statements as UIM met the criteria of a VIE as defined by the FASB Accounting Standards Codification. UIM and us were separately owned. See note 3 to our consolidated financial statements for additional information. Our software licensing and support service revenues were based upon a percentage of gross receipts generated by UIM’s online gaming operations, and were recognized monthly. Software licensing and support service revenues we received from providing such services to UIM had been eliminated in consolidation.
UIM generated revenues by providing and promoting online games of skill and chance that were available on its free download gaming software. We considered multiple-element revenue arrangements involving UIM’s provision of software and software-related elements to customers. UIM’s online gaming service was inseparable from the software element involved and UIM did not sell each element separately. UIM’s online gaming service did not involve significant production, modification, or customization of the gaming software. Revenues derived from UIM’s online gaming software platform were recognized at the time games were played and were net of player winnings. Transaction fee revenues derived from UIM’s online multi-player poker platform were recognized as services were provided.
As we sold a 60 percent interest in our gaming software and service business on April 8, 2010, we ceased to consolidated its financial results and no longer had revenue from the gaming software and service business from April 2010 onwards. The remaining 40 percent interest we retained in the gaming software and service business has been accounted for under the equity method accounting.
Asian Online Game and Service Revenues
Asian online game and service revenues are related to our Asian online game and service business that operates play-for-fun games online to players across Asia.
Asian online game revenues are earned through the sale of online game points, pre-paid cards, game packs and also through the sublicensing of certain games to distributors. Virtual online game points are sold to distributors or end-users who can make the payments through credit cards, Internet ATMs or telecommunication service operators. Physical pre-paid cards and game packs are sold through distributors and convenience stores. Proceeds from sales of physical cards and game packs, net of sales discounts, and online game points are deferred when received and revenue is recognized upon the actual usage of the playing time or in-game virtual items by the end-users; over the estimated useful life of virtual items; or when the sold game points expire and can no longer be used to access the online games or products in accordance with our published game points expiration policy. Sublicensing revenues from the distributors are recognized based on end users’ activation to the game system and when the performance obligations have been completed.
We report sales of virtual online game points on a gross basis. In the sales of virtual online game points, we act as principal and we have latitude in establishing price. Fixed percentage fees retained by service providers for payment processing related to our online game services are recognized as cost of online game revenues. We report sublicensing revenues on a net basis. In the sublicense agreements, we act as agent and the distributors are responsible for the operating and the marketing.
Asian online game and service revenues also include revenues derived from online advertising arrangements, sponsorship arrangements, or a combination of both. These service arrangements allow advertisers to place advertisements on particular areas of our Company’s websites and online game platforms over a stated period of time. Service revenues from online advertising arrangements are recognized ratably over the displayed period of the contract when the collectability is reasonably assured.
67
Revenue included within Discontinued Operations
For 2008, 2009 and 2010, a portion of our Company’s revenue was generated from our internet access and service business. We disposed of the remaining portion of our Internet access and service business in September 2008, and as a result, have classified the income from these revenue-generating activities as part of discontinued operations. See note 6 to our consolidated financial statements for additional information.
Our internet access and service business revenue were recorded net of discounts and net of fees paid to cable companies, and were recognized on a straight-line basis over the subscription period or for the period in which the service was performed. Any advanced payment receipts were recorded as deferred revenues included in other current liabilities in our consolidated balance sheets and were amortized over the subscription period. The sale of other Internet access-related products and rental income from the lease of Internet access-related equipment to subscribers were recognized when products were delivered or services were provided.
Deferred Revenues
Deferred revenues are included in other current liabilities, and consist of the prepaid income related to our Asian online game and service business.
Operating Costs
Operating costs primarily consist of processing costs, online game royalties, bandwidth, production costs for prepaid game cards and game packs, amortization of intangible assets, customer service department costs, depreciation, maintenance and other overhead expenses directly attributable to our online games.
Prepaid Licensing and Royalty Fees
Our Company, through our subsidiaries (including VIE subsidiaries), routinely enters into agreements with licensors to acquire licenses for using, marketing, distributing, selling and publishing of multi-player online games.
Prepaid licensing fees paid to licensors are capitalized when technological feasibility is achieved, and amortized on a straight-line basis over the shorter of the useful economic life of the relevant online game or license period, which is usually within two to five years. The annual amortization is modified if the amount computed using the ratio that current gross revenues for a game license bear to the total of current and anticipated future gross revenues for that game license is greater than the amount computed using the straight-line method.
Prepaid royalty fees and related costs are initially deferred when paid to licensors and recognized as operating costs in the period in which the related online game revenue is recognized.
Fair Value Measurement
We adopted the guidance issued by FASB for fair value measurements and the fair value option for financial assets and financial liabilities on January 1, 2008. We did not record an adjustment to retained earnings as a result of the adoption of the guidance for fair value measurements, and the adoption did not have a material impact on our consolidated financial statements. The guidance for the fair value option for financial assets and financial liabilities provides companies the irrevocable option to measure many financial assets and liabilities at fair value with changes in fair value recognized in earnings. Our Company has not elected to measure any financial assets or liabilities at fair value that were not previously required to be measured at fair value.
Our Company generally determines or calculates the fair value of financial instruments using quoted market prices in active markets when such information is available or using appropriate present value or other valuation techniques, such as discounted cash flow analyses, incorporating adjusted available market discount rate information and our Company’s estimates for non-performance and liquidity risk. These techniques rely extensively on the use of a number of assumptions, including the discount rate, credit spreads, and estimates of future cash flows. See note 10 to our consolidated financial statements for additional information.
68
Allowance for Doubtful Accounts
An allowance for doubtful accounts is provided based on an evaluation of the collectability of accounts receivable, and other receivables. An allowance for doubtful accounts is also provided, when considered necessary, for loans receivable. We review the collectability of loans receivable on an individual basis and the evaluation primarily consists of an analysis based upon current information available about the borrower.
For those accounts in which a loss is probable, we record a specific reserve. Receivable losses are charged against the allowance when the Company believes the uncollectability of the receivable is confirmed. Subsequent recoveries, if any, are credited to the allowance.
Marketable Securities
All of our Company’s investments in marketable securities are classified as available-for-sale. These marketable securities are stated at fair value with any unrealized gains or losses recorded in accumulated other comprehensive income (loss) within equity until realized.
Other-than-temporary impairments, if any, are charged to non-operating expense in the period in which the loss occurs. In determining whether an other-than-temporary impairment has occurred, our Company primarily considers, among other factors, the length of the time and the extent to which the fair value of an investment has been at a value less than cost, the financial condition of the issuer and our Company’s ability and intent to hold the investment for a period of time which may be sufficient for anticipated recovery in market value. When an other-than-temporary loss is recorded, the fair value of the investment becomes the new cost basis of the investment and is not adjusted for subsequent recoveries in fair value. Realized gains and losses also are included in non-operating income and expense in the consolidated statements of operations.
Investments
Equity investments in non-publicly traded securities of companies over which our Company has no ability to exercise significant influence are accounted for under the cost method.
Equity investments in companies over which our Company has the ability to exercise significant influence but does not hold a controlling financial interest are accounted for under the equity method and our Company’s income or loss on equity method investments is recorded in non-operating income or expenses. The difference between the cost of the acquisition and our Company’s share of the fair value of the net identifiable assets is recognized as goodwill and is included in the carrying amount of the investment. When our Company’s carrying value in an equity method investee is reduced to zero, no further losses are recorded in our consolidated financial statements unless our Company guaranteed obligations of the investee or has committed to additional funding. When the investee subsequently reports income, our Company will not record its share of such income until it equals the amount of its share of losses not previously recognized.
Unrealized losses that are considered other-than-temporary, if any, are charged to non-operating expenses. Realized gains and losses, measured against carrying amount, are also included in non-operating income and expenses. See note 10 to our consolidated financial statements for additional information.
69
Impairment of Intangible Assets, Goodwill and Long-Lived Assets
Potential impairment of intangible assets with indefinite useful lives is evaluated, at the reporting unit level, at least annually, or whenever events or changes in circumstances indicate that the carrying value of an asset might not be recoverable from its related future discounted cash flows. Impairment is measured as the difference between the carrying amounts and the fair value of the assets, and is recognized as a loss from operations.
Potential impairment of goodwill is tested annually, or sooner when circumstances indicate an impairment may exist, using a fair-value approach at the reporting unit level. A reporting unit is the operating segment, or a business, which is one level below that operating segment (the “component” level) if discrete financial information is prepared and regularly reviewed by management at the segment level. Components are aggregated as a single reporting unit if they have similar economic characteristics. The Company estimated the fair value of its reporting units using the discounted cash flow method, which involves the use of estimates and judgments including estimating future cash flows, determining discount rate and making other assumptions.
In 2010, the estimated fair value of FunTown exceeded its carrying amount by approximately 80 percent; therefore, no impairment loss was recorded for FunTown in 2010. If economic conditions deteriorate or other events adversely impact the business model and the related assumptions including revenue growth rates and the discount rates, there could be a change in the Company’s analysis. As the estimated fair value of the reporting unit substantially exceeded the carrying amount at the year end, the Company believes that any reasonably likely change in the assumptions used in the analysis would not cause the carrying value to exceed the estimated fair value under step one of the goodwill impairment analysis.
The estimated fair value of IAHGames was determined to be approximately 78 percent of its carrying amount; therefore, goodwill from the acquisition of IAHGames with a carrying amount of US$12.2 million was written down to its fair value of US$9.9 million, resulting in an impairment charge of US$2.3 million. In estimating the fair value of IAHGames, the Company notes that the fair value can be sensitive to changes in the projected cash flows and assumptions. In some instances, minor changes in the assumptions could decrease the fair value that the Company estimated and result in a different amount of implied goodwill, and ultimately the amount of goodwill impairment.
Potential impairment of long-lived assets other than goodwill and intangible assets not being amortized, is evaluated, at least annually or whenever events or changes in circumstances indicate that the carrying value of an asset might not be recoverable from its related future undiscounted cash flows. If such assets are considered to be impaired, the impairment to be recognized is measured by the extent to which the carrying amount of the assets exceeds the fair value of the assets. When impairment is identified, the carrying amount of the asset is reduced to its estimated fair value, and is recognized as a loss from operations.
Software Cost
Costs to develop our gaming software and Asian online game products are capitalized after technological feasibility has been established, and when the product is available for general release to customers, costs are expensed. Costs incurred prior to the establishment of technological feasibility are expensed when incurred and are included in product development and engineering expenses. Capitalized amounts are amortized using the straight-line method, which is applied over the estimated useful economic life of the software, ranging from three to five years. The annual amortization is modified if the amount computed using the ratio that current gross revenues for a product bear to the total of current and anticipated future gross revenues for that product is greater than the amount computed using the straight-line method.
We capitalize certain costs incurred to purchase or to internally create and implement internal-use computer software, which includes software coding, installation, testing and certain data conversion. These capitalized costs are amortized on a straight-line basis over the shorter of the useful economic life of the software or its contractual license period, which range from three to five years.
70
Advertising
Direct-response advertising costs incurred related to the acquisition or origination of a customer relationship are capitalized and deferred. The deferred costs are recognized in the consolidated statements of operations over the estimated lives of customer relationships. Costs of communicating advertising are recorded as expenses as advertising airtime is used. Other advertising expenditures are expensed as incurred. Subsequent to the sale of a 60 percent interest in our online gaming and software service business in April 2010, deferred costs related to advertising have not been significant.
Advertising expenses incurred in 2008, 2009 and 2010 totaled $60.1 million, $63.6 million and $12.7 million, respectively (including $42 thousand, $0, and $0 reported in discontinued operations in 2008, 2009 and 2010, respectively). As of December 31, 2009 and 2010, prepaid advertising amounted to $6.8 million (of which $6.8 million is included in assets held for sale and retained ownership of gaming software and service business, see note 6 to our consolidated financial statements for additional information) and $20 thousand, respectively.
Income Taxes
The asset and liability method is used in accounting for income taxes. Under this method, deferred tax assets and liabilities are determined based on the differences between financial reporting and tax bases of assets and liabilities. We recognize the tax benefit from the purchase of equipment and technology, research and development expenditures, employee training, and certain equity investments using the flow-through method. Net operating loss carryforwards and investment credits are measured using the enacted tax rate and laws that will be in effect when the differences are expected to reverse. A valuation allowance is established when necessary to reduce deferred tax assets to the amount that will more-likely-than-not be realized. In assessing the likelihood of realization, management considers estimates of future taxable income and prudent and feasible tax planning strategies.
In addition, we recognize the financial statement impact of a tax position when it is more-likely-than-not that the position will be sustained upon examination. If the tax position meets the more-likely-than-not recognition threshold, the tax effect is recognized at the largest amount of the benefit that has greater than a 50 percent likelihood of being realized upon ultimate settlement. The interest and penalties are reflected as income taxes expenses in the consolidated financial statements.
Noncontrolling Interest
We adopted the new accounting guidance issued by the FASB for noncontrolling interest on January 1, 2009. This guidance requires that the noncontrolling interest in the equity of a subsidiary be accounted for and reported as equity, provides revised guidance on the treatment of net income and losses attributable to the noncontrolling interest and changes in ownership interests in a subsidiary, and requires additional disclosures that identify and distinguish between the interests of the controlling and noncontrolling owners. As a result, we have retrospectively applied the presentation and disclosure requirements of the new standard and adjusted prior periods for comparative purposes as required. Changes in our Company’s ownership interest in a subsidiary that do not result in deconsolidation are accounted for as equity transactions. Any retained noncontrolling equity investment upon the deconsolidation of a subsidiary is initially measured at fair value.
Share-Based Compensation
Share-based compensation represents the cost related to share-based awards granted to employees. We measure share-based compensation cost at the grant date, based on the estimated fair value of the award. Share-based compensation is recognized for the portion of the award that is ultimately expected to vest and the cost is amortized on a straight-line basis (net of estimated forfeitures) over the vesting period. Our Company estimates the fair value of stock options using the Black-Scholes valuation model. The cost is recorded in operating costs and operating expenses in the consolidated statement of operations based on the employees’ respective function.
For shares and stock options granted to non-employees, we measure the fair value of the equity instruments granted at the earlier of the performance commitment date or when the performance is completed.
The determination of the fair value of share options on the date of grant using an option-pricing model is affected by our Company’s stock price as well as assumptions regarding a number of complex and subjective variables, including our expected stock price volatility over the expected term, the risk-free interest rate, the actual and projected employee stock option exercise behavior. Furthermore, we are required to estimate forfeitures at the time of the grant and recognize share-based compensation expense only for those awards that are expected to vest. If actual forfeitures differ from those estimates, we may need to revise those estimates used in subsequent periods.
71
Foreign Currency Translation
The consolidated financial statements of our Company and our subsidiaries have been reported in U.S. dollars. Assets and liabilities denominated in non-U.S. currency are translated to U.S. dollars at year-end exchange rates. Income and expense items are translated at weighted-average rates of exchange prevailing during the year. Cumulative translation adjustments resulting from this process are charged or credited to other comprehensive income within equity. Gains and losses on foreign currency transactions are included in other income and expenses. Cumulative translation adjustments as of December 31, 2008, 2009 and 2010 were ($26.9) million, ($25.9) million, and ($22.6) million, respectively.
Recent Accounting Pronouncements
In December 2010, the FASB issued updated guidance that modifies the goodwill impairment test. Goodwill is tested for impairment using a two-step process. The first step is to identify potential impairments by comparing the estimated fair value of a reporting unit to its carrying value, including goodwill. If the carrying value of a reporting unit exceeds the estimated fair value, a second step is performed to measure the amount of impairment, if any. The second step is to determine the implied fair value of the reporting unit’s goodwill, measured in the same manner as goodwill is recognized in a business combination, and compare the implied fair value with the carrying amount of the goodwill. If the carrying amount exceeds the implied fair value of the reporting unit’s goodwill, an impairment loss is recognized in an amount equal to that excess.
The updated guidance requires that, if the carrying amount of a reporting unit becomes zero or negative, the second step of the impairment test must be performed when it is more-likely-than-not that a goodwill impairment loss exists. In considering whether it is more-likely-than-not that an impairment loss exists, a company is required to evaluate qualitative factors, including the factors presented in existing guidance that trigger an interim impairment test of goodwill (e.g., a significant adverse change in business climate or an anticipated sale of a reporting unit). The provisions of the guidance were effective for annual reporting periods beginning after December 15, 2010. The adoption is not expected to have a material impact on our consolidated financial statements.
In January 2010, the FASB issued additional disclosure requirements for fair value measurements. In accordance with the new guidance, the fair value hierarchy disclosures are to be further disaggregated by class of assets and liabilities. A class is often a subset of assets or liabilities within a line item in the statement of financial position. In addition, significant transfers between Levels 1 and 2 of the fair value hierarchy are required to be disclosed. These additional requirements became effective for our Company on January 1, 2010. These amendments did not have a material impact on our consolidated financial statements; however they required additional disclosures. In addition, the guidance requires more detailed disclosures of the changes in Level 3 instruments; however, changes relating to Level 3 instruments will not be effective for our Company until reporting periods beginning after December 31, 2010. These disclosures are not expected to have a material impact on our consolidated financial statements.
In October 2009, the FASB issued amended revenue recognition guidance for arrangements with multiple deliverables. The new guidance eliminates the residual method of revenue recognition and allows the use of management’s best estimate of selling price for individual elements of an arrangement when vendor-specific objective evidence (VSOE), vendor objective evidence (VOE) or third-party evidence (TPE) is unavailable. The changes will be effective for our Company on January 1, 2011. Management is in the process of determining the impact that the adoption of this guidance will have on our consolidated financial statements.
In October 2009, the FASB issued guidance which amends the scope of existing software revenue recognition accounting. Tangible products containing software components and non-software components that function together to deliver the product’s essential functionality will be scoped out of the accounting guidance on software and accounted for based on other appropriate revenue recognition guidance. This guidance must be adopted in the same period that our Company adopts the amended accounting for arrangements with multiple deliverables described in the preceding paragraph. The changes will be effective for our Company on January 1, 2011. Management is in the process of determining the impact that the adoption of this guidance will have on our consolidated financial statements.
72
Taxation
Our major tax jurisdictions are located in Taiwan, PRC, Singapore and the United States.
The corporate income tax rate in Taiwan is 17 percent effective from 2010. In addition to the corporate income tax rate, all retained earnings generated beginning January 1, 1998 by our subsidiaries under Taiwan law and not distributed to us as dividends in the following year are assessed a 10 percent retained earnings tax. This rule applies primarily to our internet access and service business, which was sold in September 2008 and our FunTown online games portal, whose principal operating entities are incorporated under Taiwan law.
On January 1, 2006, the Taiwanese government enacted the AMT Act. Taxes imposed under the AMT Act are supplemental tax payable if the income tax payable pursuant to the R.O.C. Income Tax Act is below the minimum amount prescribed under the AMT Act. The AMT rate for business entities is 10 percent. The taxable income for calculating the AMT includes most income that is exempted from income tax under various legislation such as tax holidays and investment tax credits. For example, gains on disposal of marketable securities from our Taiwan-based entities were exempt from income tax based on Taiwan tax laws prior to the AMT Act. However, such gains will need to be included for the purpose of calculating the AMT.
The statutory enterprise income tax rate in the PRC is 25 percent unless the entities qualify under certain limited exceptions. Our Asian online games in the PRC would apply this income tax rate.
The corporate income tax rate in Singapore is 17 percent, which applies primarily to IAHGames acquired in July 2010.
The majority of our gaming software and service business is located outside the United States, with the exception of CIDC, an entity registered in Delaware which is subject to U.S. federal income tax, state tax and local tax. Current U.S. federal income tax rates and state and local tax rates applicable to our business for the year ended December 31, 2010 are 34 percent and 7 percent, respectively.
Discussion of Results of Operations
Factors Affecting Our Performance
We believe that the following are the principal factors affecting our results of operations:
Acquisitions and disposals.We have made several significant acquisitions and dispositions of businesses during the past several years, and may enter into additional acquisition and disposition transactions in the future. Past acquisitions and dispositions have had a significant impact on our results of operations over the past several years, and if we engage in such transactions in the future, the nature, amounts and timing of our revenues, expenses and cash flows and the nature and amounts our assets and liabilities are likely to be materially affected.
Development of online games and gaming software and service industries.The online gaming and online games industries are in relatively early stages of development. We believe that our results of operations are likely to be affected by developments in these industries, including:
| | • | | the development and regulation of these industries; |
| | • | | our adaptation to technological change; |
| | • | | changing consumer preferences; |
| | • | | legal development affecting these industries, in particular the gaming software and service industry; and |
| | • | | general economic conditions in the markets where we or our licensees operate. |
73
Competition.All of our businesses are in industries that are extremely competitive. Our Asian online games and gaming software businesses are characterized by rapid technological change and we face significant and intense competition from online gaming software design houses, application service providers and casual games operators.
Divestiture of Gaming Software and Service Business. As we sold a 60 percent interest in our gaming software and service business on April 8, 2010, we ceased to consolidated its financial results and no longer had revenue from the gaming software and service business from April 2010 onwards. The remaining 40 percent interest we retained in the gaming software and service business has been accounted for under the equity method accounting.
For each of our businesses, we cannot assure you that we will be successful in adapting to technological developments and achieving widespread acceptance of our services before our competitors offer services similar to our current or prospective offerings. As a consequence, we may lose our existing customers and not expand our client base, which would have a material adverse effect on our revenues and financial condition.
The table below presents, for the periods indicated, information regarding certain revenues and expense items for our consolidated operations.
| | | | | | | | | | | | | | | | | | | | | | | | | |
| | | For the Year Ended December 31, | |
| | | 2008 | | | 2009 | | | 2010 | |
| | | Amount in | | | % of | | | Amount | | | % of | | | Amount | | | % of | |
| | | US$ | | | total | | | in US$ | | | total | | | in US$ | | | total | |
| | | thousands | | | revenues | | | thousands | | | revenues | | | thousands | | | revenues | |
Particulars | | | | | | | | | | | | | | | | | | | | | | | | |
| OPERATING REVENUES | | | | | | | | | | | | | | | | | | | | | | | | |
| | | | | | | | | | | | | | | | | | | | | | | | | |
| Gaming software and service revenues | | | 144,765 | | | | 76.0 | | | | 112,694 | | | | 70.6 | | | | 25,820 | | | | 39.9 | |
| Asian online game and service revenues | | | 45,604 | | | | 24.0 | | | | 46,887 | | | | 29.4 | | | | 38,862 | | | | 60.1 | |
| | | | | | | | | | | | | | | | | | | |
| | | | | | | | | | | | | | | | | | | | | | | | | |
| Total operating revenues | | | 190,369 | | | | 100.0 | | | | 159,581 | | | | 100.0 | | | | 64,682 | | | | 100.0 | |
| | | | | | | | | | | | | | | | | | | |
| | | | | | | | | | | | | | | | | | | | | | | | | |
| OPERATING COSTS | | | | | | | | | | | | | | | | | | | | | | | | |
| | | | | | | | | | | | | | | | | | | | | | | | | |
| Cost of gaming software and service revenues | | | 22,770 | | | | 12.0 | | | | 20,102 | | | | 12.6 | | | | 4,010 | | | | 6.2 | |
| Cost of Asian online game and service revenues | | | 12,404 | | | | 6.5 | | | | 16,785 | | | | 10.5 | | | | 17,103 | | | | 26.4 | |
| | | | | | | | | | | | | | | | | | | |
| | | | | | | | | | | | | | | | | | | | | | | | | |
| Total operating costs | | | 35,174 | | | | 18.5 | | | | 36,887 | | | | 23.1 | | | | 21,113 | | | | 32.6 | |
| | | | | | | | | | | | | | | | | | | |
| | | | | | | | | | | | | | | | | | | | | | | | | |
| Gross profit | | | 155,195 | | | | 81.5 | | | | 122,694 | | | | 76.9 | | | | 43,569 | | | | 67.4 | |
| | | | | | | | | | | | | | | | | | | |
| | | | | | | | | | | | | | | | | | | | | | | | | |
| OPERATING EXPENSES | | | | | | | | | | | | | | | | | | | | | | | | |
| | | | | | | | | | | | | | | | | | | | | | | | | |
| Product development and engineering expenses | | | 13,455 | | | | 7.1 | | | | 14,195 | | | | 8.9 | | | | 7,301 | | | | 11.3 | |
| Selling and marketing expenses | | | 74,173 | | | | 39.0 | | | | 79,421 | | | | 49.8 | | | | 21,589 | | | | 33.4 | |
| General and administrative expenses | | | 25,035 | | | | 13.2 | | | | 29,692 | | | | 18.6 | | | | 31,780 | | | | 49.1 | |
| Bad debt expense | | | 2,905 | | | | 1.5 | | | | 1,092 | | | | 0.7 | | | | 1,639 | | | | 2.5 | |
| Impairment loss on property, plant, and equipment | | | — | | | | — | | | | 1,250 | | | | 0.8 | | | | 278 | | | | 0.4 | |
| Impairment loss on goodwill | | | — | | | | — | | | | 14,103 | | | | 8.8 | | | | 2,255 | | | | 3.5 | |
| Impairment loss on prepaid licensing fees and intangible assets | | | 1,524 | | | | 0.8 | | | | 23,002 | | | | 14.4 | | | | 2,200 | | | | 3.4 | |
| Impairment loss on deconsolidation of T2CN | | | — | | | | — | | | | — | | | | — | | | | 22,234 | | | | 34.4 | |
| Other | | | — | | | | — | | | | — | | | | — | | | | 1,989 | | | | 3.1 | |
| | | | | | | | | | | | | | | | | | | |
| Total operating expenses | | | 117,092 | | | | 61.6 | | | | 162,755 | | | | 102.0 | | | | 91,265 | | | | 141.1 | |
| | | | | | | | | | | | | | | | | | | |
| | | | | | | | | | | | | | | | | | | | | | | | | |
| Income (loss) from operations | | | 38,103 | | | | 19.9 | | | | (40,061 | ) | | | (25.1 | ) | | | (47,696 | ) | | | (73.7 | ) |
| | | | | | | | | | | | | | | | | | | |
74
| | | | | | | | | | | | | | | | | | | | | | | | | |
| | | For the Year Ended December 31, | |
| | | 2008 | | | 2009 | | | 2010 | |
| | | Amount in | | | % of | | | Amount | | | % of | | | Amount | | | % of | |
| | | US$ | | | total | | | in US$ | | | total | | | in US$ | | | total | |
| | | thousands | | | revenues | | | thousands | | | revenues | | | thousands | | | revenues | |
| NON-OPERATING INCOME (EXPENSES) | | | (1,324 | ) | | | (0.7 | ) | | | (15,524 | ) | | | (9.8 | ) | | | 56,364 | | | | 87.1 | |
| | | | | | | | | | | | | | | | | | | |
| | | | | | | | | | | | | | | | | | | | | | | | | |
| INCOME (LOSS) FROM CONTINUING OPERATIONS BEFORE INCOME TAXES | | | 36,779 | | | | 19.3 | | | | (55,585 | ) | | | (34.9 | ) | | | 8,668 | | | | 13.4 | |
| | | | | | | | | | | | | | | | | | | | | | | | | |
| INCOME TAX EXPENSE | | | (1,069 | ) | | | (0.6 | ) | | | (517 | ) | | | (0.3 | ) | | | (7,260 | ) | | | (11.2 | ) |
| | | | | | | | | | | | | | | | | | | |
| | | | | | | | | | | | | | | | | | | | | | | | | |
| INCOME (LOSS) FROM CONTINUING OPERATIONS | | | 35,710 | | | | 18.7 | | | | (56,102 | ) | | | (35.2 | ) | | | 1,408 | | | | 2.2 | |
| | | | | | | | | | | | | | | | | | | | | | | | | |
| INCOME (LOSS) FROM DISCONTINUED OPERATIONS | | | 9,435 | | | | 5.0 | | | | 222 | | | | 0.2 | | | | (128 | ) | | | (0.2 | ) |
| | | | | | | | | | | | | | | | | | | |
| | | | | | | | | | | | | | | | | | | | | | | | | |
| NET INCOME (LOSS) | | | 45,145 | | | | 23.7 | | | | (55,880 | ) | | | (35.0 | ) | | | 1,280 | | | | 2.0 | |
| | | | | | | | | | | | | | | | | | | | | | | | | |
| LESS: NET LOSS (INCOME) ATTRIBUTABLE TO NONCONTROLLING INTEREST AND SUBSIDIARY PREFERRED SHARES | | | (757 | ) | | | (0.4 | ) | | | 6,795 | | | | 4.2 | | | | 1,370 | | | | 2.1 | |
| | | | | | | | | | | | | | | | | | | |
| | | | | | | | | | | | | | | | | | | | | | | | | |
| NET INCOME (LOSS) ATTRIBUTABLE TO GIGAMEDIA | | | 44,388 | | | | 23.3 | | | | (49,085 | ) | | | (30.8 | ) | | | 2,650 | | | | 4.1 | |
| | | | | | | | | | | | | | | | | | | |
The key items included in our income statement are:
OPERATING REVENUES. Our operating revenues consist of revenues from our gaming software and service business, and Asian online game and service business. Until April 8, 2010, revenues from the gaming software and service business included revenues of UIM, our licensee, from providing and promoting online games of skill and chance. Software licensing and support services revenues received by our subsidiary, CESL, from UIM have been eliminated in consolidation. As we sold a 60 percent interest in our gaming software and service business on April 8, 2010, we deconsolidated its financial results and no longer had revenue from gaming software and service business from April 2010 onwards. The remaining 40 percent interest we retained in the gaming software and service business has been accounted for under the equity method accounting. Asian online game and service revenues are related to our online games business in Asia and are collected through the sale of online game points, pre-paid cards and game packs.
OPERATING COSTS. Operating costs consist primarily of gaming software and online game processing costs, online game royalties, production costs for prepaid game cards and game packs, amortization of intangible assets, customer service department costs, operational department costs, depreciation, maintenance and other overhead expenses directly attributable to the provision of gaming software and service and Asian online game and services.
OPERATING EXPENSES. Operating expenses include product development and engineering expenses, selling and marketing expenses, general and administrative expenses, bad debt expenses and impairment losses.
NON-OPERATING INCOME (EXPENSES). Non-operating income and expenses consist of interest income and expenses, gain or loss on sales of marketable securities, foreign exchange gain or loss, gain or loss on disposal of property, plant and equipment, loss on equity method investments, gain or loss on deconsolidation of business units, impairment loss on marketable securities and investments, and gain or loss on fair value changes of warrant derivatives.
INCOME TAX EXPENSES. Taxes include current income tax in various jurisdictions in which our subsidiaries operate and deferred tax expenses related to temporary tax assets or liabilities that arise due to the timing differences between book profits and taxable profits that originate in one period and are capable of reversal in one or more subsequent periods. Taxes are measured using the tax rates and laws that have been enacted or subsequently enacted as of the date of the financial statements.
75
NONCONTROLLING INTEREST. Noncontrolling interest represents the portion of net income allocated to the non-controlling voting shares of our majority-owned subsidiaries (T2CN, Dragongate Enterprises, and IAHGames) as well as UIM, which was consolidated pursuant to the FASB Accounting Standards Codification through March 31, 2010. In May 2005, IAHGames issued redeemable preferred shares, which are redeemable at the option of the investors, and as such these preferred shares are classified as mezzanine equity on our balance sheet.
The financial information in relation to our business segments is provided net of inter-segment transactions.
For the Years Ended December 31, 2010 and 2009
Consolidated Results of Operations
OPERATING REVENUES. Operating revenues for 2010 declined by approximately 59.5 percent to approximately US$64.7 million from approximately US$159.6 million in 2009. The decrease was primarily due to the sale of our 60 percent ownership interest in our gaming software and service business on April 8, 2010, and as a result, we deconsolidated the results of the gaming software and service business from April 2010 onwards and do not expect to generate revenue from the gaming software and service business going forward. Therefore, with only one quarter of results consolidated into our consolidated financial statements, revenue from our gaming software and service business declined 77.1 percent to approximately US$25.8 million in 2010, which accounted for 39.9 percent of our total revenues in 2010. Such decrease was also attributable to strong competition in the gaming software and service industry. Revenues from our Asian online game and service business decreased by 17.1 percent to approximately US$38.9 million, which represented 60.1 percent of our total revenues in 2010. The decrease was due to approximately US$5.5 million decrease from FunTown and approximately US$8.4 million decrease from T2CN, which was deconsolidated from July 2010, which was partially offset by the contribution of approximately US$5.9 million from IAHGames, which was consolidated from July 2010.
OPERATING COSTS. Operating costs decreased by approximately US$15.8 million, or 42.8 percent, to approximately US$21.1 million in 2010 from approximately US$36.9 million in 2009. The decrease in total operating costs was mainly due to a US$16.1 million or 80.1 percent decrease in operating costs in our gaming software and service business as a result of deconsolidation from April 2010. The operating costs of our Asian online game and service business in 2010 was flat compared with that in 2009.
GROSS PROFIT. Gross profit decreased by approximately 64.5 percent to approximately US$43.6 million in 2010 from approximately US$122.7 million in 2009. The decrease in consolidated gross profit resulted from a US$70.8 million or 76.4 percent and a US$8.3 million or 27.7 percent decrease in the gross profits of our gaming software and service business and our Asian online game and service business, respectively.
OPERATING EXPENSES. Total operating expenses decreased by approximately 43.9 percent to approximately US$91.3million in 2010 from approximately US$162.8 million in 2009. The decrease in total operating expenses was mainly due to a US$63.4 million or 74.5 percent decrease in operating expenses from our gaming software and service business, and a US$11.4 million or 17.7 percent decrease in operating expense from our Asian online game and service business.
Consolidated product development and engineering expenses decreased by approximately 48.6 percent in 2010 to approximately US$7.3 million from US$14.2 million in 2009. This decrease was mainly due to the deconsolidation of our gaming software and service business, which resulted in a decrease of US$9.4 million or 74.6 percent in related product development and engineering expenses, which was partially offset by a US$2.3 million increase in product development and engineering expenses in our Asian online game and service business.
Consolidated selling and marketing expenses decreased by approximately 72.8 percent to approximately US$21.6 million in 2010 from US$79.4 million in 2009, primarily due to an decrease of US$49.9 million or 80.2 percent in selling and marketing expenses as a result of the deconsolidation of our gaming software and service business and a decrease of US$6.3 million or 41.4 percent in selling and marketing expenses in our Asian online game and service business related to less promotions and activities during 2010 compared to those held for new games launched in 2009.
76
Consolidated general and administrative expenses increased by approximately US$2.1 million, or a 7.0 percent to approximately US$31.8 million in 2010 from US$29.7 million in 2009, primarily reflecting a US$6.0 million increase from corporate headquarter expenses due to an increase in legal fees expended in relation to our dispute with T2CN’s former Chief Executive Officer and increased compensation costs, which was partially offset by a US$3.9 million decrease in general and administrative expenses as a result of the deconsolidation of our gaming software and service business.
Consolidated impairment loss decreased by approximately US$11.4 million to approximately US$27.0 million in 2010 from US$38.4 million in 2009, primarily resulting from a decrease of US$10.7 million of impairment loss in our Asian online games and service business. Total consolidated impairment loss in 2010 was composed of a US$1.3 million impairment loss on intangible assets for capitalized software costs, a US$870 thousand impairment loss on prepaid licensing and royalty fees, a US$278 thousand impairment loss on fixed assets, a US$2.3 million impairment loss on goodwill related to IAHGames, and a US$22.2 impairment loss on deconsolidation of T2CN. The total consolidated impairment loss in 2009 was composed of a US$4.7 million impairment loss on intangible assets for capitalized software costs, a US$18.3 million impairment loss on prepaid licensing and royalty fees, a US$1.3 million impairment loss on fixed assets, and a US$14.1 million impairment loss on goodwill related to T2CN.
OPERATING LOSS. Operating loss for 2010 was US$47.7 million as composed to a loss of US$40.1 million in 2009. The increase in loss was primarily due to the deconsolidation of our gaming software and service business from April 2010 which resulted in a decrease of US$7.4 million in operating income.
NON-OPERATING INCOME (EXPENSES). Non-operating income was US$56.4 million in 2010 while it was a loss of approximately US$15.5 million in 2009. The non-operating income in 2010 primarily included (1) US$79.1 million gain on the sale of 60 percent ownership interest in our gaming software and service business, (2) US$20.8 million loss on equity method investments, (3) US$4.7 million impairment loss on marketable securities and investments, and (4) US$2.6 million gain on fair value changes of warrant derivative. The non-operating loss in 2009 mainly included a US$15.7 million impairment loss on marketable securities and investments.
INCOME FROM DISCONTINUED OPERATIONS. Income from discontinued operations decreased by approximately US$350 thousand to approximately a loss of US$128 thousand in 2010 from approximately US$222 thousand in 2009.
NET INCOME (LOSS) ATTRIBUTABLE TO GIGAMEDIA. Net income attributable to us for 2010 increased by approximately US$51.7 million to approximately US$2.7 million from a loss of approximately US$49.1million in 2009 for the reasons mentioned above.
Business Segment Results
Asian Online Game and Service Business
After our further investment in IAHGames in July 2010, we hold an approximate 80 percent of the controlling financial interest in IAHGames and started to consolidate IAHGames’ financial results in our consolidated financial statements from July 1, 2010 onwards. See “Item 5. Operating and Financial Review and Prospects — A. Operating Results— Certain Significant Events Affecting Our Results of Operations for 2008, 2009 and 2010 —Acquisition of IAHGames”.
In July 2010, due to the dispute with T2CN’s former Chief Executive Officer, we have been prevented from obtaining its financial information and we effectively lost control over its financial reporting process; therefore, we deconsolidated its financial results from our consolidated financial statements from July 1, 2010 onwards. See “Item 5. Operating and Financial Review and Prospects — A. Operating Results— Certain Significant Events Affecting Our Results of Operations for 2008, 2009 and 2010 —Deconsolidation of T2CN”.
Financial results of our Asian online game and service business in 2010 were affected by several factors, including but not limited to the deconsolidation of T2CN from July 2010, consolidation of IAHGames from July 2010, impairment charge on deconsolidation of T2CN, and strong competition from an increase of online games offered on social network platforms.
77
OPERATING REVENUES. Total operating revenues decreased by approximately US$8.0 million or 17.1 percent to approximately US$38.9 million in 2010 from approximately US$46.9 million in 2009. Such decrease was due to (1) approximately $5.5 million or 19.2 percent decrease related to FunTown operations in Taiwan and Hong Kong, which was mainly due to strong competition from an increase of online games offered on social network platforms, and (2) approximately $8.4 million or 46 percent decrease related to T2CN in China, which was deconsolidated from July 2010. The abovementioned decrease was partially offset by the contribution of approximately US$5.9 million from IAHGames which was consolidated from July 2010.
In 2010, FunTown’s number of registered users was approximately 17.2 million, representing an 13.8 percent increase in comparison with 2009. Peak concurrent users were approximately 38,000, representing a decrease of 23.2 percent compared to 2009. Average monthly active paying accounts were 72,000, representing a decrease of 25.6 percent compared to 2009. Average revenue per paying user (“ARPU”) was approximately US$26.84, representing a year-over-year increase of 8.6 percent. The decrease in active paying accounts was partially compensated by the increase in ARPU, which resulted in 19.2 percent decrease in revenue.
OPERATING COSTS. Costs of our Asian online game and service revenue in 2010 was approximately US$17.1 million, which is comparable with US$16.8 million in 2009.
GROSS PROFIT. Gross profit decreased by 27.7 percent to approximately US$21.8 million in 2010 from US$30.1 million in 2009. Gross profit margin decreased from approximately 64.2 percent in 2009 to approximately 56.0 percent in 2010 due to lower gross profit margin of IAHGames, which was consolidated in July 2010.
OPERATING EXPENSES. Total operating expenses decreased by approximately US$11.5 million to approximately US$53.3 million in 2010 from approximately US$64.8 million in 2009. The decrease was primarily due to less impairment losses related to prepaid licensing and royalty fees, intangible assets, and goodwill in 2010.
Selling and marketing expenses. Selling and marketing expenses decreased by approximately US$6.3 million to US$9.0 million in 2010 from US$15.3 million in 2009. The decrease was mainly due to the deconsolidation of T2CN and less promotion activities for new games launched in FunTown operations, both of which were partially offset by the consolidation of IAHGames in July 2010.
General and administrative expenses. General and administrative expenses incurred in 2010 was approximately US$10.3 million, which was comparable with that in 2009.
Impairment loss. Impairment loss decreased by approximately US$10.7 million to approximately US$27.0 million in 2010 from US$37.7 million in 2009. The impairment loss in 2010 was comprised of a US$1.3 million impairment loss on intangible assets for capitalized software costs, a US$870 thousand impairment loss on prepaid licensing and royalty fees, a US$278 thousand impairment loss on fixed assets, a US$2.3 million impairment loss on goodwill related to IAHGames, and a US$22.2 impairment loss on deconsolidation of T2CN. The impairment loss in 2009 was composed of a US$4.5 million impairment loss on intangible assets for capitalized software costs, a US$18.3 million impairment loss on prepaid licensing and royalty fees, a US$777 thousand impairment loss on fixed assets, and a US$14.1 million impairment loss on goodwill related to T2CN.
OPERATING LOSS. Operating loss in 2010 was US$31.6 million as compared to a loss of US$34.7 million in 2009. The decrease was due to the aforementioned factors. Operating loss does not reflect certain corporate headquarter expenses.
NON-OPERATING INCOME (EXPENSES). Non-operating loss in 2010 was US$12.6 million as compared to a loss of US$13.6 million in 2009. The non-operating loss in 2010 mainly included a loss of US$12.6 million on equity method investments in relation to IAHGames’ online game initiatives with Blizzard, an impairment loss of US$4.7 million on marketable securities and investments and a gain of US$2.6 million on fair value changes of warrant derivative issued in connection with IAHGames’ initiatives with Blizzard. The loss in 2009 was primarily attributable to an impairment loss of US$13.7 million on marketable securities and investments.
78
Gaming Software and Service Business
On April 8, 2010, we completed the sale of a 60 percent interest in our online gaming software and service business to BetClic. From then on, we ceased to consolidate the financial results of the gaming software and service business. Our 40 percent interest in Everest Gaming is, from April 8, 2010, accounted under equity method. See “Item 5. Operating and Financial Review and Prospects — A. Operating Results— Certain Significant Events Affecting Our Results of Operations for 2008, 2009 and 2010 —Divestiture of Gaming Software and Service Business”.
Financial results of Everest Gaming in 2010 were negatively affected by several factors. First, we faced strong competition in the markets with U.S. facing gaming sites. Second, market conditions in France have been unfavorable, with high taxes and limitations on international play pressuring margins and lowering the appeal of online poker. As a result, we recorded US$9.8 million equity loss for the remaining 40 percent interest for the period from April to December, 2010.
OPERATING REVENUES. Total operating revenues in 2010 decreased by 77.1 percent to approximately US$25.8 million from US$112.7 million in 2009. Such decrease was attributable to strong competition in this industry and only one quarter results being consolidated in 2010.
OPERATING COSTS. Costs of our gaming software and service revenues decreased by 80.1 percent to approximately US$4.0 million in 2010 from US$20.1 million in 2009. The decrease was in line with revenue decrease due to the deconsolidation of the gaming software and service business in April 2010.
GROSS PROFIT. Gross profit decreased by 76.4 percent to approximately US$21.8 million in 2010 from US$92.6 million in 2009 due to strong competition in the gaming software and service industry and the deconsolidation of the gaming software and service business in April 2010.
OPERATING EXPENSES. Total operating expenses decreased by approximately US$63.4 million to approximately US$21.7 million in 2010 from approximately US$85.1 million in 2009. The decrease is primarily due to the deconsolidation of the gaming software and service business in April 2010.
Selling and marketing expenses. Selling and marketing expenses decreased by approximately 80.2 percent to approximately US$12.3 million in 2010 from US$62.2 million in 2009, which was attributable to the deconsolidation of the gaming software and service business in April 2010
General and administrative expenses. General and administrative expenses decreased by approximately US$3.9 million to US$6.2 million in 2010 from US$10.1 million in 2009, resulting from the deconsolidation of the gaming software and service business in April 2010.
Product development and engineering expenses. Product development and engineering expenses decreased by approximately US$9.4 million to US$3.2 million in 2010 from US$12.6 million in 2009, mainly due to the deconsolidation of the gaming software and service business in April 2010.
OPERATING INCOME. Operating income in 2010 decreased by 99.0 percent to approximately US$78 thousand in 2010 from US$7.5 million in 2009, which was attributable to strong competition in the gaming software and service industry and the deconsolidation of the gaming software and service business in April 2010.
NON-OPERATING INCOME (EXPENSES). Non-operating income increased by approximately US$68.8 million from approximately US$764 thousand in 2009 to US$69.6 million in 2010. This increase is primarily because we recognized $79.1 million gain from the sale of 60 percent interest in our gaming software and service business, which was partially offset by equity loss of $9.8 million for the remaining 40 percent interest for the period from April to December, 2010.
79
For the Years Ended December 31, 2009 and 2008
Consolidated Results of Operations
OPERATING REVENUES. Operating revenues for 2009 declined by approximately 16.2 percent to approximately US$159.6 million from approximately US$190.4 million in 2008. The decrease was primarily a result of a 22.2 percent revenue decline in our gaming software and service business, which contributed approximately US$112.7 million or 70.6 percent of our total revenues in 2009. Our Asian online game and service business revenues increased by 2.8 percent to approximately US$46.9 million, or 29.4 percent of our total revenues in 2009.
OPERATING COSTS. Operating costs increased by approximately 4.9 percent to approximately US$36.9 million in 2009 from approximately US$35.2 million in 2008. The increase in total operating costs was mainly due to a US$4.4 million or 35.3 percent increase in operating costs in our Asian online game and service business related to a higher level of license fee and fixed costs resulting from newly launched games, which was offset by a US$2.7 million or 11.7 percent decrease in operating costs in our gaming software and service business, which was in line with the revenue decrease.
GROSS PROFIT. Gross profit decreased by approximately 20.9 percent to approximately US$122.7 million in 2009 from approximately US$155.2 million in 2008. The decrease in consolidated gross profit resulted from respective 24.1 percent and 9.3 percent decreases in gross profits in our gaming software and service business and our Asian online game and service business.
OPERATING EXPENSES. Total operating expenses increased by approximately 39.0 percent to approximately US$162.8 million in 2009 from approximately US$117.1 million in 2008. The increase in total operating expenses was mainly due to a US$39.5 million or 156.9 percent increase in expenses in our Asian online game and service business, while operating expense was flat in 2009 compared to 2008 in our gaming software and service business.
Consolidated product development and engineering expenses increased by approximately 5.5 percent in 2009 to approximately US$14.2 million from US$13.5 million in 2008, mainly due to a US$305 thousand or 2.5 percent increase in our gaming software and service business.
Consolidated selling and marketing expenses increased by approximately 7.1 percent to approximately US$79.4 million in 2009 from US$74.2 million in 2008, primarily due to an increase of US$5.2 million or 51.1 percent in selling and marketing expenses in our Asian online game and service business related to promotion and activities held for newly launched games.
Consolidated general and administrative expenses increased by approximately 18.6 percent in 2009 to US$29.7 million from US$25.0 million in 2008, primarily reflecting a US$872 thousand or 9.4 percent increase in our gaming software and service business and a US$771 thousand or 8.1 percent increase in our Asian online game and service business. The remaining US$3.0 million increase was related to corporate headquarter expenses.
Consolidated impairment loss increased by approximately US$36.8 million to approximately US$38.4 million in 2009 from US$1.5 million in 2008, primarily resulting from an increase of US$36.2 million in our Asian online game and service business. The total consolidated impairment loss was composed of a US$4.7 million impairment loss on intangible assets for capitalized software costs, a US$18.3 million impairment loss on prepaid licensing and royalty fees, a US$1.3 million impairment loss on fixed assets, and a US$14.1 million impairment loss on goodwill related to T2CN.
OPERATING INCOME. Operating income for 2009 decreased by approximately US$78.2 million to a loss of US$40.1 million from approximately US$38.1 million in 2008. The decrease was primarily due to a decrease of US$28.9 million in operating income in our gaming software and service business and a decrease of US$42.6 million in operating income in our Asian online game and service business.
NON-OPERATING INCOME (EXPENSES). Non-operating items decreased from a loss of approximately US$1.4 million in 2008 to a loss of approximately US$15.5 million in 2009. This was primarily due to US$15.7 million impairment losses on marketable securities and investments.
80
INCOME FROM DISCONTINUED OPERATIONS. Income from discontinued operations decreased by approximately US$9.2 million to approximately US$222 thousand in 2009 from approximately US$9.4 million in 2008. The decrease was principally due to the sale of our legacy Internet access and service business in September 2008, which contributed approximately US$9.8 million of an after tax disposal gain in 2008.
NET INCOME (LOSS) ATTRIBUTABLE TO GIGAMEDIA. Net income attributable to us for 2009 decreased by approximately US$93.5 million to a loss of approximately US$49.1 million from net income attributable to us of approximately US$44.4 million in 2008.
Business Segment Results
Asian Online Game and Service Business
OPERATING REVENUES. Total operating revenues increased by approximately 2.8 percent to approximately US$46.9 million in 2009 from approximately US$45.6 million in 2008. Such increase was driven by a 10.3 percent increase related to FunTown in Taiwan and Hong Kong, which was offset by a 7.1 percent decrease related to T2CN in China.
Revenue from FunTown increased by approximately US$2.7 million to US$28.6 million in 2009 from US$25.9 million in 2008, which is primarily due to contribution of new launched games titled Holic and Warhammer, as well as increase of mahjong, chess, and board games . In 2009, FunTown’s number of registered users was approximately 15.2 million, representing an 18.0 percent increase in comparison with 2008. Peak concurrent users were approximately 50,000, up 8.6 percent from a year ago. Average monthly active paying accounts were 96,000, representing a decrease of 12.1 percent compared to 2008. ARPU was approximately US$24.72, representing a year-over-year increase of 25.5 percent. The decrease in active paying accounts was compensated by the increase in ARPU and contributed to the 10.3 percent increase in revenue.
Revenue from T2CN decreased by approximately US$1.4 million to US$18.3 million in 2009 from US$19.7 million in 2008, and such decrease was primarily attributable to hacking problem of the game FreeStyle incurred in the fourth quarter of 2009. In 2009, T2CN’s number of registered users was approximately 101.5 million, representing a 20.3 percent increase in comparison with 2008. Peak concurrent users of FreeStyle were approximately 119,000, representing a decrease of 35.8 percent from a year ago. Average monthly active paying accounts were approximately 336,000, representing a 20.7 percent decrease compared to 2008. ARPU was approximately US$4.48, representing a year-over-year increase of 16.4 percent. The increase in ARPU could not compensate for the decrease in the number of active paying accounts and contributed to the 7.1 percent decrease in revenue.
OPERATING COSTS. Costs of our Asian online game and service revenues increased by 35.3 percent to approximately US$16.8 million in 2009 from US$12.4 million in 2008. The increase was due to increased bandwidth costs, royalty fees and licensing fees related to newly launched games in 2009.
GROSS PROFIT. Gross profit decreased by 9.3 percent to approximately US$30.1 million in 2009 from US$33.2 million in 2008. The decrease resulted from cost increases outpacing revenue growth. Gross profit margin decreased from approximately 72.8 percent in 2008 to approximately 64.2 percent in 2009.
OPERATING EXPENSES. Total operating expenses increased by approximately US$39.5 million to approximately US$64.8 million in 2009 from approximately US$25.2 million in 2008. The increase was due to increased selling and marketing expenses related to newly launched games and impairment losses primarily on prepaid licensing and royalty fees, intangible assets, and goodwill.
Selling and marketing expenses. Selling and marketing expenses increased by approximately US$5.2 million to US$15.3 million in 2009 from US$10.1 million in 2008. The increase was primarily related to new games launched in 2009.
General and administrative expenses. General and administrative expenses increased by approximately 8.1 percent to approximately US$10.3 million in 2009 from US$9.5 million in 2008, primarily due to additional professional fees and general and administrative department cost being incurred in 2009.
81
Bad debt expenses. Bad debt expenses decreased by approximately US$2.5 million to US$372 thousand in 2009 from US$2.9 million in 2008 as we recognized US$2.6 million of bad debt expenses related to the loans to Flagship in 2008.
Impairment loss. Impairment loss increased by approximately US$36.2 million to approximately US$37.7 million in 2009 from US$1.5 million in 2008. The impairment loss in 2009 was composed of a US$4.5 million impairment loss on intangible assets for capitalized software costs, a US$18.3 million impairment loss on prepaid licensing and royalty fees, a US$777 thousand impairment loss on fixed assets, and a US$14.1 million impairment loss on goodwill related to T2CN.
OPERATING INCOME. Operating income in 2009 decreased by approximately US$42.6 million to a loss of US$34.6 million from US$8.0 million in 2008. The decrease was due to the aforementioned higher selling and marketing expenses as well as impairment losses. Operating income does not reflect certain corporate headquarter expenses.
NON-OPERATING INCOME (EXPENSES). Non-operating items decreased by approximately US$11.6 million from a loss of US$2.0 million in 2008 to a loss of US$13.6 million in 2009. This was primarily due to $13.7 million of impairment losses on marketable securities and investments in 2009.
Gaming Software and Service Business
OPERATING REVENUES. Consolidated revenues of our gaming software and service business include the revenues of UIM, our licensee. Software licensing and support services revenues received by us from UIM have been eliminated in consolidation. Total operating revenues in 2009 decreased by 22.2 percent to approximately US$112.7 million from US$144.8 million in 2008. Such decrease was attributable to decline in both our poker software business and casino software business in 2009. Software licensing and support services revenues received by us from UIM decreased by 38.1 percent from US$66.2 million in 2008 to US$41.0 million in 2009. Revenues from our poker software business declined from approximately US$104.5 million in 2008 to US$73.7 million in 2009 and accounted for approximately 65.4 percent of our gaming software and service revenues in 2009 compared to 72.2percent in 2008. Revenues from our casino software business decreased to approximately US$39.0 million in 2009 from US$40.2 million in 2008.
OPERATING COSTS. Costs of our gaming software and service revenues decreased by 11.7 percent to approximately US$20.1 million in 2009 from US$22.8 million in 2008. The decrease was due to less business volume and the associated decrease in payment processing costs in 2009.
GROSS PROFIT. Gross profit decreased by 24.1 percent to approximately US$92.6 million in 2009 from US$122.0 million in 2008. The decrease was primarily due to revenue decline in both poker software business and casino software business in the period. Gross profit margin decreased from approximately 84.3 percent in 2008 to approximately 82.2 percent in 2009 because the revenue decline outpaced certain fixed cost.
OPERATING EXPENSES. Total operating expenses decreased by approximately US$515 thousand to approximately US$85.1 million in 2009 from approximately US$85.6 million in 2008. The decrease in total operating expenses resulted primarily from a 2.9 percent or approximately US$1.8 million decrease in selling and marketing expenses, which was offset by a 2.5 percent or US$305 thousand increase in product development and engineering expenses and a 9.4 percent or US$872 thousand increase in general and administrative expenses.
Selling and marketing expenses. Selling and marketing expenses decreased by approximately 2.9 percent to approximately US$62.2 million in 2009 from US$64.1 million in 2008, which was attributable to a decrease in payments to marketing affiliates.
General and administrative expenses. General and administrative expenses increased by approximately US$872 thousand to US$10.1 million in 2009 from US$9.3 million in 2008. The increase was due to additional general and administrative departmental cost being incurred in 2009.
Product development and engineering expenses. Product development and engineering expenses increased by approximately US$305 thousand to US$12.6 million in 2009 from US$12.2 million in 2008, mainly due to increases in headcount related cost.
82
OPERATING INCOME. Operating income in 2009 decreased by 79.5 percent to approximately US$7.5 million from US$36.4 million in 2008. The decrease was attributable to lower revenue, gross profit and operating expenses which despite a decrease in absolute terms were proportionately higher, resulting in a decrease in operating margin to 6.6 percent in 2009 from 25.1 percent in 2008. Operating income does not reflect certain corporate headquarters expenses. For a reconciliation of business segment results to our consolidated net income attributable to us, see note 29 to our consolidated financial statements.
For a reconciliation of business segment results to our consolidated net income attributable to us, see note 29 to our consolidated financial statements.
B. Liquidity and Capital Resources
Our principal sources of liquidity consist of cash generated from our operations, proceeds generated from the disposal of our 100 percent shareholdings in our internet access and service business, and 60 percent shareholdings in our gaming software and service business as well as marketable security investments and other assets, bank borrowings, and interest derived from our investments. Our cash and cash equivalents are held primarily in U.S. dollars, RMB and NT dollars. Our policy with respect to liquidity management is to maintain sufficient cash and cash equivalents to fund operations and strategic transactions, while placing remaining funds in higher yield investment instruments.
Our future cash requirements will depend on a number of factors including:
| | • | | the rate at which we enter into strategic transactions; |
| | • | | the rate at which we expand our operations and employee base; |
| | • | | the timing of entry into new markets and new services offered; |
| | • | | changes in revenues and cost splits with our business partners; |
| | • | | the rate at which we invest in developing and licensing our products and upgrading and maintaining our network and future technologies; and |
| | • | | the rate at which we grow and monetize our customer bases. |
As a result of our operating, investing and financing activities during 2010, the amount of our cash and cash equivalents increased from approximately US$55.6 million as of December 31, 2009 to US$71.0 million as of December 31, 2010. Such increase was primarily attributable to proceeds from disposal of a 60 percent interest of gaming software and service business in April, 2010, which was partially offset by repayment of our short term loans, capital expenditures, acquisition of IAHGames, and investment in PSI and East Gate.
The following table set forth the summary of our cash flows for the periods indicated:
| | | | | | | | | | | | | |
| | | For the Year Ended December, 31 | |
| (in US$ thousands) | | 2008 | | | 2009 | | | 2010 | |
| Net cash provided by (used in ) operating activities | | $ | 50,750 | | | $ | 8,636 | | | $ | (8,922 | ) |
| Net cash provided by (used in ) investing activities | | | (6,420 | ) | | | (22,078 | ) | | | 50,022 | |
| Net cash provided by (used in ) financing activities | | | (17,876 | ) | | | 8,426 | | | | (12,364 | ) |
| Exchange difference | | | 936 | | | | (356 | ) | | | (410 | ) |
| Cash balance included in assets held for sale and retained ownership of gaming software and service business | | | — | | | | (35,015 | ) | | | — | |
| Deconsolidation of T2CN | | | — | | | | — | | | | (12,903 | ) |
| | | | | | | | | | |
| Net increase (decrease) in cash and cash equivalent | | | 27,390 | | | | (40,387 | ) | | | 15,423 | |
| Cash and cash equivalents at beginning of year | | | 68,563 | | | | 95,953 | | | | 55,566 | |
| | | | | | | | | | |
| Cash and cash equivalents at end of year | | $ | 95,953 | | | $ | 55,566 | | | $ | 70,989 | |
| | | | | | | | | | |
83
OPERATING ACTIVITIES. In 2010, our net cash used in operating activities amounted to approximately US$8.9 million, which was primarily due to loss generated from the operations of our Asian online game and service business. In 2009, our net cash provided by operating activities amounted to approximately US$8.6 million. Although we had a loss from continuing operations in 2009, we still generated positive operating cash flow after non-cash adjustments, such as impairment losses, depreciation and amortization expenses, and stock-based compensation. In 2008, our net cash provided by operating activities amounted to US$50.8 million. This was primarily from income from continuing operations of US$35.7 million
INVESTING ACTIVITIES. Our net cash provided by investing activity amounted to approximately US$50.0 million in 2010. This was primarily due to proceeds from the sale of a 60 percent interest of gaming software and service business of approximately US$85.7 million, net of transaction costs, which was partially offset by capital expenditures of approximately US$6.1 million, strategic investments in East Gate and PSI of approximately US$6.6 million, as well as the acquisition of additional preferred shares of IAHGames of approximately US$5.8 million, net of cash acquired. Our net cash used in investment activities in 2009 was approximately US$22.1 million. This was primarily due to capital expenditures of approximately US$14.7 million, and a strategic investment in JC Entertainment of approximately US$7.1 million. Our net cash used in investment activities in 2008 was approximately US$6.4 million. This was primarily due to capital expenditures of approximately US$16.7 million, an additional acquisition in T2CN of approximately US$3.4 million, as well as strategic investments in Access China and SuperCup of approximately US$5.0 million, which were partially offset by proceeds from disposal of our Internet access and service business of approximately US$16.5 million.
FINANCING ACTIVITIES. Our net cash used in financing activities in 2010 was approximately US$12.3 million, which was primarily due to repayment of approximately US$12.5 million of short term loans. Our net cash generated from financing activities in 2009 was US$8.4 million. This was primarily due to proceeds from short-term borrowings of US$7.3 million. Our net cash used in financing activities in 2008 was approximately US$17.9 million, which was primarily due to repayment of approximately US$18.1 million of short term loans.
As we have effectively lost control over T2CN as a result of a dispute with its former Chief Executive Officer, we deconsolidated T2CN starting from July 1, 2010; therefore, our cash and cash equivalents decreased by approximately US$12.9 million during 2010.
We believe that our existing cash, cash equivalents, marketable securities and expected cash flow from operations will be sufficient to meet our capital expenditure, working capital, and cash obligations under our existing lease arrangements, license agreements and share repurchase program through 2011. We continue to seek and review potential merger and acquisition opportunities on an ongoing basis, which may be funded through cash on our balance sheet, bank borrowings or equity offerings. We do not believe that any potential merger or acquisition that we may be engaged in would alter our goal of preserving sufficient cash and cash equivalents to fund future operations.
Capital Expenditures
We typically finance our capital expenditures through cash holdings. Our gross capital expenditures for equipment, furniture and fixtures, software, intangible assets and other deferred assets were US$16.7 million, US$14.7 million and US$6.1 million for 2008, 2009, and 2010 respectively. Capital expenditures during 2010 were primarily for capitalized software development and computer hardware equipment for our gaming software and service business and Asian online game and service business. Our capital expenditure plans for 2011 will continue to focus primarily on software development and computer hardware equipment for our Asian online game and service business. We may adjust the amount of our capital expenditures upward or downward based on cash flow from operations, the progress of our expansion plans, and market conditions.
84
Indebtedness
As of December 31, 2009 and 2010, short-term borrowings totaled $22.5 million and $12.4 million, respectively. These amounts were borrowed from certain financial institutions. The annual interest rates on these borrowings ranged from 1.99 percent to 4.288 percent for 2009, and from 0.85 percent to 5.56 percent for 2010. The maturity dates ranged from January 2010 to June 2010 as of December 31, 2009, and from January 2011 to March 2011 as of December 31, 2010. As of December 31, 2009 and 2010, the weighted-average interest rate on total short-term borrowings was 2.24 percent and 1.835 percent, respectively.
As of December 31, 2010, the total amount of unused lines of credit available for borrowing under these agreements was approximately $28.5 million.
During the period from January 2011 to May 2011, we repaid certain short-term borrowings totaling $3.4 million, and renewed short-term borrowing agreements totaling $9.0 million.
We pledged certain time deposits, land, and buildings as collateral for borrowings from certain financial institutions. The total value of collateral amounted to $2.1 million and $6.3 million as of December 31, 2009 and 2010, respectively, in which time deposits pledged are recorded as restricted cash totaling $932 thousand and $5 million as of December 31, 2009 and 2010, respectively.
Dividends From Our Subsidiaries
Under Singapore tax regulations, foreign-sourced dividend income used for capital expenditures, including investments, and repayment of borrowings, would not be deemed as remitted to Singapore and is therefore not taxable. As of December 31, 2010, the Company has not accrued deferred income taxes on $26.4 million of unremitted earnings from non-Singapore subsidiaries, as such earnings are considered to be reinvested overseas or for repayment of borrowings. Determination of the amount of unrecognized deferred tax liability related to these earnings is considered impracticable.
In accordance with R.O.C. law, an appropriation for legal reserve amounting to 10 percent of a company’s net profit is required until the reserve equals the aggregate par value of such Taiwan company’s issued capital stock. As of December 31, 2009 and 2010, the legal reserves of Hoshin GigaMedia Center Inc. (“Hoshin GigaMedia”), which represent a component of our consolidated accumulated deficit, were $3.0 million for each period. The reserve can only be used to offset a deficit or be distributed as a stock dividend of up to 50 percent of the reserve balance when the reserve balance has reached 50 percent of the aggregate paid-in capital of Hoshin GigaMedia.
Under PRC laws and regulations, there are certain foreign exchange restrictions on our Company’s PRC subsidiaries and VIE subsidiaries with respect to transferring certain of their net assets to our Company either in the form of dividends, loans or advances.
As of December 31, 2010, our Company’s total restricted net assets, which include paid up capital of PRC subsidiaries and the net assets of VIE subsidiaries in which our Company has no legal ownership, were approximately $2.5 million.
C. Research, Development, Patents and Licenses, etc.
We make investments in research and development to keep pace and remain competitive with technology advancements and product development relating to our gaming software and service business and our Asian online game business. For the years 2008, 2009, and 2010, we incurred US$13.5 million, US$14.2 million and US$7.3 million, respectively, on research and development activities.
85
D. Trend Information
Please see Item 3, “Key Information — D. Risk Factors” and Item 5, “Operating and Financial Review and Prospects — A. Operating Results—Certain Significant Events Affecting Our Results of Operations for 2008, 2009, and 2010 “ for a discussion of the most recent trends in our operating costs and revenues since the end of 2010. In addition, please refer to discussions included in this Item for a discussion of known trends, uncertainties, demands, commitments or events that we believe are reasonable likely to have a material effect on our net operating revenues, income from continuing operations, profitability or capital resources, or that would cause reported financial information not necessarily to be indicative of future operating results or financial condition.
E. Off-Balance Sheet Arrangements
Other than as disclosed in note 27 to our consolidated financial statements, we currently do not have (a) any obligation under a guarantee contract that has any of the characteristics identified by the FASB Accounting Standards Codification; (b) a retained or contingent interest in assets transferred to an unconsolidated entity or similar arrangement that serves as credit, liquidity or market risk support to such entity for such assets; (c) any obligation under a derivative instrument that is both indexed to our Company’s own stock and classified in equity, or not reflected, in our Company’s statement of financial position; (d) any obligation, including a contingent obligation, arising out of a variable interest in an unconsolidated entity that is held by, and material to, our Company, where such entity provides financing, liquidity, market risk or credit risk support to, or engages in leasing, hedging or research and development services with, our Company.
F. Tabular Disclosure of Contractual Obligations
| | | | | | | | | | | | | | | | | | | | | |
| | | Payment Due by Period (in US$ thousand) | |
| | | Within 1 year | | | 1-3 years | | | 3-5 years | | | >5 years | | | Total | |
| 1. Operating leases | | | 1,151 | | | | 683 | | | | 239 | | | | 1,236 | | | | 3,309 | |
| 2. License fees* | | | 741 | | | | 500 | | | | 500 | | | | — | | | | 1,741 | |
| 3. Minimum guarantees against royalties | | | 9,633 | | | | 5,500 | | | | — | | | | — | | | | 15,133 | |
| | | | | | | | | | | | | | | | |
| Total contractual cash obligations | | | 11,525 | | | | 6,683 | | | | 739 | | | | 1,236 | | | | 20,183 | |
| | | | | | | | | | | | | | | | |
| 4. Other liabilities-accrued pension liabilities | | | — | | | | — | | | | — | | | | 44 | | | | 44 | |
| | | | | | | | | | | | | | | | |
| | | |
| * | | According to our license contracts, the total license fee payable, assuming all milestones or conditions under such license contracts were met, is approximately US$6.9 million. Considering game performance, industry environment and business situation, management determined that certain license fees will unlikely become payable and such amount have not been included in the above table. |
The initial minimum guarantees against future royalties and license fees are not required to be paid until the licensed games are commercially released or until certain milestones are achieved, as stipulated in the individual license agreements. The remaining minimum guarantees are generally required to be paid within three years subsequent to the commercial release dates of the licensed games.
Additionally, we also have contractually committed to support related marketing, promotion, and advertising activities for certain games, and our commitments are contingent to occur based on the payment schedules set forth in the individual license agreements. As of December 31, 2010, our total commitments to these marketing expenditures amounted to not less than $11.9 million.
Quantitative and Qualitative Disclosure About Market Risk
Please refer to Item 11, “Quantitative and Qualitative Disclosures About Market Risk” in this annual report.
86
ITEM 6. DIRECTORS, SENIOR MANAGEMENT AND EMPLOYEES
A. Directors and Senior Management
The following table sets forth information with respect to our directors and executive officers as of May 31, 2011:
| | | | | | | | | |
| | | | | | | Year Appointed to | |
| Name | | Age | | Position | | Current Position | |
| DING, Michael Y.J. | | 54 | | Chairman of the Board, Chairman of the Audit Committee of the Board and Independent Non-Executive Director | | | 2009/2003 | |
| LEE, Yichin | | 50 | | Chief Executive Officer and Director | | | 2011*/2003 | |
| HUI, Thomas T. | | 39 | | Director, President and Chief Operating Officer | | | 2005/2007 | |
| WANG, Arthur M. | | 50 | | Director | | | 2003 | |
| CHIEN, Mo-Na | | 67 | | Chairman of the Compensation of the Board and Independent Non-Executive Director | | | 2011**/2010 | |
| LEE, Howe Yong | | 55 | | Independent Non-Executive Director | | | 2004 | |
| HUANG, John Ping Chang | | 59 | | Independent Non-Executive Director | | | 2011 | *** |
| LIU, Nick Chia-En | | 49 | | Independent Non-Executive Director | | | 2011 | **** |
| TANG, Quincy Li Zhong | | 48 | | Chief Financial Officer | | | 2008 | |
| WONG, Lester A. | | 44 | | General Counsel | | | 2008 | |
| LEE, John Francis Woon-Jae | | 40 | | Chief Strategy Officer and Head of International Business | | | 2008 | |
| | | |
| * | | Mr. LEE Yichin was appointed as Chief Executive Officer of our Company following the resignation of Mr. WANG Arthur M., the former Chief Executive Officer, on March 15, 2011. |
| |
| ** | | Mr. CHIEN Mo-Na was appointed as Chairman of the Compensation Committee of the Board on March 15, 2011 following the resignation of Mr. LEE Yichin, the former Chairman of the Compensation Committee, on March 15, 2011. He was appointed as Independent Non-Executive Director of the Board on August 2, 2010. |
| |
| *** | | Mr. HUANG John Ping Chang was appointed as Independent Non-Executive Director of the Board on January 31, 2011. |
| |
| **** | | Mr. LIU Nick Chia-En was appointed as Independent Non-Executive Director of the Board on March 15, 2011. |
Biographical information with respect to each of our directors and executive officers is set forth below.
Directors
MICHAEL Y.J. DING is chairman of the board of directors of our Company. Mr. Ding currently serves as the chairman and CEO of Waterland Securities Co, Ltd. Prior to that, Mr. Ding was the chairman of Fubon Securities Investment Consulting Co., Ltd., and president and CEO of Fubon Asset Management Co., Ltd., president and fund manager of the R.O.C. Fund (listed on the New York Stock Exchange), as well as president of the International Investment Trust Co. in Taiwan, where he also served as chief investment officer and a senior vice president. Mr. Ding was previously chief economist and head of research at Citicorp International Securities Ltd. in Taipei and head of research and information for the Greater China region at McKinsey & Co., Inc. Mr. Ding holds a Bachelor of Laws degree from Chinese Cultural University and a master’s degree and a doctorate in economics from Indiana University.
YICHIN LEE is the chief executive officer and a director of our Company. He has extensive experience both as a leader of technology driven businesses in Asia and as a management consultant. His previous operational, management and consulting engagements include a leading Internet trading platform for China’s agricultural and commodity industries, the Internet content operations and consulting services of regional telecom giant PCCW, as well as advisory and leadership positions on technology and transportation projects for Booz & Company. Previously, he had also worked at McKinsey & Company in Greater China and Oracle Corporation in Silicon Valley. Mr. Lee is an alumnus of Stanford University, where he received both his Ph.D. and M.S. in Resource Planning and Management. He earned a Bachelor of Science degree in Civil Engineering from National Taiwan University.
THOMAS T. HUI is president, chief operating officer and a director of our Company. Mr. Hui joined our Company from Goldman Sachs (Asia) L.L.C., where he was an executive director of the investment banking division. At Goldman Sachs, Mr. Hui originated and executed a broad range of mergers and acquisitions and financing transactions in Asia. Prior to working at Goldman Sachs, Mr. Hui served as an investment banker at Merrill Lynch & Co. and as a management consultant at McKinsey & Company, both in Hong Kong. Mr. Hui holds a Master of Engineering degree in electrical engineering from Cornell University and a Bachelor of Science degree in electrical engineering from the University of Wisconsin — Madison.
87
ARTHUR M. WANG is a director of our Company and was formerly our CEO for the last seven years. He is also a member of the board and audit committee of Home Inns & Hotels Management Inc., a NASDAQ listed corporation and a leading hotel chain in China. Mr. Wang is also a member of the board of Linmark Group, a Hong Kong Stock Exchange listed global sourcing firm, where he serves as chair of the compensation committee. Previously, Mr. Wang was a managing partner of 698 Capital Limited, an Asian investment firm, as well as an executive director of KGI Asia Limited. At KGI, Mr. Wang served as head of corporate finance. He also served as an investment advisor and board member of UFJ Asia Finance Technology Fund of the UFJ Group (formerly the Sanwa Bank Group of Japan), and as a board member and director of Softbank Investment International (Strategic) Limited, the Hong Kong Stock Exchange listed arm of Softbank Corporation. Mr. Wang received his Bachelor of Arts degree from the University of California, Los Angeles and his Juris Doctorate degree from Yale Law School. He practiced corporate and securities law in the New York and Hong Kong offices of Skadden, Arps, Slate, Meagher & Flom LLP.
MO-NA CHIEN is an independent non-executive director of our Company. He is currently the chief advisor of Chailease Finance Co., Ltd., and honorary chairman of Taiwan-based Grand Pacific Investment & Development Co., Ltd., as well as supervisor of the board of the Taiwan Stock Exchange-listed microelectronics firm Maxtek Technology Co., Ltd. and director of the board of TECO Electric & Machinery Co., Ltd. and Chailease Holding Company Limited. Mr. Chien attended the MIT Sloan School of Management and holds a Bachelor of Arts degree from National Taiwan University.
HOWE YONG LEE is an independent non-executive director of our Company. He is currently the managing director of Lee Kim Yew (Pte) Ltd., an investment company based in Singapore. Mr. Lee received a Bachelor of Arts degree in business administration from the University of Washington in 1984.
JOHN PING CHANG HUANG is an independent non-executive director of our Company. He is also currently the chairman of Taiwan-based Grand Pacific Investment & Development Co., Ltd., as well as the firms Chailease Construction & Development Corp., Global Hospitality Group Inc., and Beijing He Qiao Property Management Co., Ltd. Mr. Huang holds a Bachelor of Arts degree from Taiwan’s Soochow University.
NICK LIU is an independent non-executive director of our Company. He was the managing director in Taiwan for a U.S. based game development company. Mr. Liu holds an MBA degree from the Stern School of Business at NYU and a bachelor’s degree from the University of Southern California.
Executive Officers
YICHIN LEE is the chief executive officer and a director of our Company. He has extensive experience both as a leader of technology driven businesses in Asia and as a management consultant. His previous operational, management and consulting engagements include a leading Internet trading platform for China’s agricultural and commodity industries, the Internet content operations and consulting services of regional telecom giant PCCW, as well as advisory and leadership positions on technology and transportation projects for Booz & Company. Previously, he had also worked at McKinsey & Company in Greater China and Oracle Corporation in Silicon Valley. Mr. Lee is an alumnus of Stanford University, where he received both his Ph.D. and M.S. in Resource Planning and Management. He earned a Bachelor of Science degree in Civil Engineering from National Taiwan University.
THOMAS T. HUI is president, chief operating officer and a director of our Company. Mr. Hui joined our Company from Goldman Sachs (Asia) L.L.C., where he was an executive director of the investment banking division. At Goldman Sachs, Mr. Hui originated and executed a broad range of mergers and acquisitions and financing transactions in Asia. Prior to working at Goldman Sachs, Mr. Hui served as an investment banker at Merrill Lynch & Co. and as a management consultant at McKinsey & Company, both in Hong Kong. Mr. Hui holds a Master of Engineering degree in electrical engineering from Cornell University and a Bachelor of Science degree in electrical engineering from the University of Wisconsin — Madison.
QUINCY TANG is the chief financial officer of our Company. Mr. Tang has over 20 years of financial and managerial experience. Prior to joining us, Mr. Tang was chief financial officer of Vimicro International Corporation and served in various corporate management and finance positions, including the finance director of TOM Group, a Hong Kong-listed Internet and media company, and an auditor at Deloitte Touche Tohmatsu. Mr. Tang is a fellow member of the Hong Kong Institute of Certified Public Accountants, a fellow member of the Association of Chartered Certified Accountants in the United Kingdom, and an associate member of the Hong Kong Institute of Chartered Secretaries. Mr. Tang graduated from Hong Kong Polytechnic University with a professional diploma in accountancy.
88
LESTER A. WONG is general counsel of our Company. Prior to joining us, Mr. Wong was the senior legal counsel in CDC Corporation (NASDAQ: CHINA), a provider of enterprise software, online games, and Internet and media services. Prior to that, Mr. Wong was a founding associate in Latitude Capital Group, an Asian merchant banking firm, that was subsequently acquired by the Cowen Group. Mr. Wong was admitted to the Law Society of Upper Canada (Ontario) in 1993, Law Society of British Columbia in 1993 and Law Society of Hong Kong in 1997. Mr. Wong obtained a bachelor’s degree from the University of Western Ontario and a bachelor of law degree from the University of British Columbia in Canada
JOHN LEE is the chief strategy officer of our Company and the head of international business of our company. Mr. Lee has held numerous executive positions in gaming and investment companies in the U.S. and Asia, including NCsoft Corporation, Turbine Entertainment and Softbank Corp. Earlier in his career, he was a management consultant at McKinsey & Company. Mr. Lee received a Master of Business Administration degree from New York University and a Bachelor of Arts degree in political science from the University of Michigan.
B. Compensation
Compensation of Directors and Executive Officers
For the year ended December 31, 2010, the aggregate cash compensation paid by us to our directors and executive officers was approximately US$4.3 million. For information on total amounts set aside by our Company to provide pension and retirement benefits, see note 20 to our consolidated financial statements.
As of December 31, 2010, the total outstanding number of share options granted to our directors and officers was 6,504,000, of which 4,473,720 shares were vested and 2,030,280 shares were unvested. As of the same date, the total number of restricted stock units granted to our directors and officers was 20,000, of which 20,000 shares were vested. For more information on stock option plans and equity incentive plans, see “— E. Share Ownership” below.
Employment of Executive Officers
Officers are selected by and serve at the discretion of our board of directors. YICHIN LEE, the chief executive officer of our Company is entitled to severance benefits upon termination of his employment with our Company.
C. Board Practices
Our board of directors is currently comprised of nine directors, including six independent non-executive members. Each of our directors is elected by our Company’s shareholders and hold office until such director’s successor is elected and duly qualified, or until such director’s earlier death, bankruptcy, insanity, resignation or removal. No director is entitled to any severance benefits on termination of his or her service. We have established two committees of the board of directors, including the audit committee and the compensation committee.
Our audit committee currently consists of Michael Y. J. DING, Nancy Jing- Ying HU and Nick Chia-En LIU. Our audit committee will select and evaluate, on our behalf, the independent public accountants who audit our annual financial statements, and will review and approve the planned scope of our annual audit, subject to the appointment, replacement or removal from office of our independent public accountants as has been approved by our shareholders at our Annual General Meeting. In accordance with our Articles of Association and our audit committee charter, all of the members of our audit committee must be persons who qualify as independent directors under the standards set forth in NASDAQ Marketplace Rules 4350(d)(2)(A)(i) and (ii) and each of them is able to read and understand fundamental financial statements.
Our compensation committee currently consists of Mo-Na CHIEN, Nancy Jing- Ying HU and John Ping Chang HUANG. Our compensation committee reviews and evaluates the compensation and performance of executive officers, our Company’s general compensation plans and other employee benefit plans, and performs other duties and responsibilities pursuant to the compensation committee charter. In accordance with our compensation committee charter, all of the members of the compensation committee are qualified independent directors under the standards set forth in NASDAQ Marketplace Rules 4350(d)(2)(A)(i) and (ii).
89
D. Employees
In the years ended December 31, 2008, 2009 and 2010, our total employees were 751, 835 and 489, respectively. The number of our total employees in 2010 excludes employees employed by the T2CN Operating Entities as we had lost effective control over T2CN Operating Entities since July 2010.
As of May 31, 2011, we had a total of 523 employees, excluding part-time and temporary personnel and consultants. Of the total 523 employees as of May 31, 2011, 58 were located at our corporate headquarters; 1 was employed for our gaming software and service business; and 464 were employed for our Asian online game and service business, including 273 employees in FunTown, 116 employees in IAHGames and 75 employees in JIDI. Of the total 523 employees, 522 were in Asia and 1 was in North America.
E. Share Ownership
Share Ownership of Directors and Executive Officers
The table below sets forth information as to our directors’ and executive officers’ share ownership in our Company as of May 31, 2011:
| | | | | | | | | |
| | | Number of | | | Number of Shares | |
| | | Common | | | Issuable upon exercise | |
| Person | | Shares | | | of options | |
| DING, Michael Y.J. | | | * | | | | * | |
| WANG, Arthur M. | | | * | | | | 2,409,000 | |
| HUI, Thomas T. | | | * | | | | 2,300,000 | |
| HU ZEE, Nancy Jing-Ying | | | * | | | | * | |
| LEE, Howe Yong | | | * | | | | * | |
| LEE, John Francis Woon-Jae | | | 0 | | | | * | |
| LEE, Yichin | | | * | | | | 1,100,000 | |
| TANG, Quincy Li Zhong | | | 0 | | | | * | |
| WONG, Lester A. | | | 0 | | | | * | |
| CHIEN, Mo-Na | | | 0 | | | | * | |
| HUANG, John Ping Chang | | | 0 | | | | * | |
| LIU, Nick Chia-En | | | 0 | | | | * | |
| Directors and Officers as a group | | | * | | | | 6,924,000 | |
All options granted to our directors and executive officers were granted pursuant to the option plans and the equity incentive plans as described under “— Employee Share Option Plans and Equity Incentive Plans” below.
Employee Share Option Plans and Equity Incentive Plans
2002 Employee Share Option Plan
At the June 2002 Annual General Meeting, the shareholders of our Company approved the GigaMedia Limited 2002 Employee Share Option Plan (the “2002 Plan”) under which up to 3,000,000 common shares of our Company were reserved for issuance. All employees, officers, directors, advisors and consultants of our Company are eligible to participate in the 2002 Plan. The 2002 Plan is administered by a committee designated by the board of directors. The committee as plan administrator has complete discretion to determine the exercise price for the option grants, to determine which eligible individuals are to receive option grants, the time or times when options grants are to be made, the number of shares subject to grant and vesting schedule.
90
In August 2004, options to purchase 3,000,000 shares of our Company’s common stock were granted and vested at an exercise price of US$0.79 pursuant to the 2002 Plan. The maximum contractual term under the 2002 Plan is approximately 10 years. Termination of employment will not affect rights of exercise under vested options.
2004 Employee Share Option Plan
At the June 2004 Annual General Meeting, the shareholders of our Company approved the GigaMedia Limited 2004 Employee Share Option Plan (the “2004 Plan”) under which up to 7,000,000 common shares of our Company were reserved for issuance. All employees, officers, directors, advisors and consultants of our Company are eligible to participate in the 2004 Plan. The 2004 Plan is administered by a committee designated by the board of directors. The committee as plan administrator has complete discretion to determine the exercise price for the option grants, to determine which eligible individuals are to receive option grants, the time or times when options grants are to be made and the number of shares subject to grant vesting schedule.
In August 2004, options to purchase 5,462,530 shares of our Company’s common stock were granted at an exercise price of US$0.79 pursuant to the 2004 Plan. These options were subject to two vesting schedules. In accordance with the terms of the first vesting schedule, 3,863,888 options were vested and exercisable upon granting. In accordance with the terms of the second vesting schedule, 1,598,642 options were granted, of which 399,663 options were vested and exercisable upon granting. The remaining 1,198,979 options were vested at a rate of 399,661 options per year from the grant date.
In May 2005, options to purchase 100,000 shares of our Company’s common stock were granted at an exercise price of US$1.45 pursuant to the 2004 Plan. In accordance with the terms of the vesting schedule, 25,000 options were vested and exercisable upon granting. The remaining 75,000 options were vested at the rate of 25,000 options per year from the grant date.
In December 2005, options to purchase 1,805,655 shares of our Company’s common stock were granted at an exercise price of US$2.55. These options were subject to two vesting schedules. In accordance with the terms of the first vesting schedule, 1,570,655 options were vested and exercisable upon granting. In accordance with the terms of the second vesting schedule, 94,000 options were vested and exercisable in December 2007. The remaining 141,000 options were vested and exercisable in December 2008.
In May, 2010, options to purchase 175,000 shares of our Company’s common stock were granted at an exercise price of US$2.47. These options will be vested annually from 2010 to 2014. In accordance with the terms of the vesting schedule, 20 percent of 175,000 options will be exercised on or after the grant date and the remaining 80 percent of 175,000 options will be exercised annually from the first anniversary of the grant date to the fourth anniversary of the grant date.
The maximum contractual term under the 2004 Plan is 10 years. Termination of employment will not affect exercise rights under vested options. Unvested options will be forfeited upon termination of employment.
2006 Equity Incentive Plan
At the June 2006 Annual General Meeting, the shareholders of our Company approved the GigaMedia Limited 2006 Equity Incentive Plan (the “2006 Plan”) under which up to 1,000,000 common shares of our Company have been reserved for issuance. The 2006 Plan is administered by a committee designated by the board of directors. The committee as plan administrator has complete discretion to determine the grant of awards under the 2006 Plan.
In December 2006, we granted 115,000 restricted stock units (“RSUs”) to our employees. These RSUs were subject to two schedules for the lapsing of restrictions on transfer. 25,000 RSUs are subject to the terms of the first lapsing schedule, under which the restrictions on transfer shall lapse with respect to the first 33 percent of the RSUs upon granting with the remaining 67 percent of the RSUs vesting over a two-year period so long as the employee is employed by or providing services to our Company. 90,000 RSUs are subject to the terms of the second lapsing schedule, under which the restrictions on transfer shall lapse with respect to approximately 33 percent of the RSUs annually over a three-year period, beginning April 1, 2007 so long as the employee is employed by or providing services to our Company.
91
In March 2007, we granted 49,000 RSUs to employees of our Company. In accordance with the terms of the lapsing schedule, the restrictions on transfer shall lapse with respect to approximately 14.29 percent of the RSUs quarterly from June 2007 to December 2008 so long as the employee is employed by or providing services to our Company.
In August 2007, we granted 30,000 RSUs to directors of our Company. In accordance with the terms of the lapsing schedule, the restrictions on transfer shall lapse with respect to 25 percent of the RSUs quarterly from November 2007 to August 2008 so long as the directors are providing services to our Company. In August 2007, we also granted 126,443 RSUs to employees of our Company. These RSUs were subject to two schedules for the lapsing of restrictions on transfer. 6,443 RSUs are subject to the terms of the first lapsing schedule, under which the restrictions on transfer shall lapse with respect to approximately 33 percent of the RSUs annually over a three-year period, beginning January 1, 2008 so long as the employee is employed by or providing services to our Company. 120,000 RSUs are subject to the terms of the second lapsing schedule, under which the restrictions on transfer shall lapse with respect to 6.25 percent of the RSUs quarterly from November 2007 to August 2011 so long as the employee is employed by or providing services to our Company. Also in August 2007, options to purchase 580,000 shares of our Company’s common stock were granted at an exercise price of US$10.15. In accordance with the terms of the vesting schedule, 6.25 percent of the options are vested quarterly from November 2007 to August 2011.
In October 2007, options to purchase 50,000 shares of our Company’s common stock were granted at an exercise price of US$16.60. In accordance with the terms of the vesting schedule, 6.25 percent of the options are vested quarterly from January 2008 to October 2011.
In January 2008, options to purchase 31,987 shares of our Company’s common stock were granted at an exercise price of US$16.01. In accordance with the terms of the vesting schedule, 50 percent of the options are vested annually from January 2009 to January 2010.
In January 2008, we also granted 17,113 RSUs to employees of our Company. In accordance with the terms of the lapsing schedule, the restrictions on transfer shall lapse with respect to approximately 50 percent of the RSUs annually from January 2009 to January 2010 so long as the employee is employed by or providing services to our Company.
In February, 2010, we granted 17,790 RSUs to employees of our Company. In accordance with the terms of the lapsing schedule, the restrictions on transfer shall lapse with respect to 100 percent of the RSUs on the first anniversary of the grant date so long as the employee is employed by or providing services to our Company.
In May, 2010, options to purchase 100,000 shares of our Company’s common stock were granted at an exercise price of US$2.47. These options will be vested annually from 2010 to 2014. In accordance with the terms of the vesting schedule, 20 percent of 100,000 options will be exercised on or after the grant date and the remaining 80 percent of 100,000 options will be exercised annually from the first anniversary of the grant date to the fourth anniversary of the grant date.
In May, 2011, options to purchase 60,000 shares of our Company’s common stock were granted at an exercise price of US$1.25. These options will be vested annually from 2012 to 2014. In accordance with the terms of the vesting schedule, 34 percent of 60,000 options will be exercised on or after the first anniversary of the grant date and the remaining 66 percent of 60,000 options will be exercised annually from the second anniversary of the grant date to the third anniversary of the grant date.
The maximum contractual term under the 2006 Plan is 10 years. Options will be forfeited upon termination of employment, unless the relevant award agreement extends the exercisability of the outstanding options. In the event that the employee’s employment with or service to our Company is terminated prior to the lapsing of restrictions with respect to any portion of the RSUs, such portion of the RSUs shall become forfeited.
2007 Equity Incentive Plan
At the June 2007 Annual General Meeting, the shareholders of our Company approved the GigaMedia Limited 2007 Equity Incentive Plan (the “2007 Plan”) under which up to 2,000,000 common shares of our Company have been reserved for issuance. The 2007 Plan is administered by a committee designated by the board of directors. The committee as plan administrator has complete discretion to determine the grant of awards under the 2007 Plan.
92
In August 2007, options to purchase 465,000 shares of our Company’s common stock were granted at an exercise price of US$10.15. These options were subject to two vesting schedules. In accordance with the terms of the first vesting schedule, 6.25 percent of the 400,000 options are vested quarterly from November 2007 to August 2011. In accordance with the terms of the second vesting schedule, 25 percent of the 65,000 options are vested annually from August 2008 to August 2011.
In December 2007, options to purchase 50,000 shares of our Company’s common stock were granted at an exercise price of US$18.17. In accordance with the terms of the vesting schedule, 6.25 percent of the options are vested quarterly from March 2008 to December 2011.
In January 2008, options to purchase 18,818 shares of our Company’s common stock were granted at an exercise price of US$16.01. In accordance with the terms of the vesting schedule, 50 percent of the options are vested annually from January 2009 to January 2010.
In March 2008, we granted 51,735 RSUs to employees of our Company. In accordance with the terms of the lapsing schedule, the restrictions on transfer shall lapse with respect to approximately 12.5 percent of the RSUs quarterly from April 2008 to January 2010 so long as the employee is employed by or providing services to our Company.
In September 2008, we granted 465,000 RSUs to employees of our Company. In accordance with the terms of the lapsing schedule, the restrictions on transfer shall lapse upon the occurrence of a Change of Control so long as the employee is employed by or providing services to our Company.
In December 2008, we granted 100,000 RSUs to employees of our Company. In accordance with the terms of the lapsing schedule, the restrictions on transfer shall lapse with respect to approximately 25 percent of the RSUs quarterly from December 2009 to December 2012 so long as the employee is employed by or providing services to our Company.
In December 2008, options to purchase 730,000 shares of our Company’s common stock were granted at an exercise price of US$4.24. In accordance with the terms of the vesting schedule, 25 percent of the options will be vested annually from December 2009 to December 2012.
In January 2009, we granted 100,354 RSUs to employees of our Company. In accordance with the terms of the lapsing schedule, the restrictions on transfer shall lapse with respect to 100 percent of the RSUs on the first anniversary of the grant date so long as the employee is employed by or providing services to our Company.
In March, 2010, we granted 31,000 RSUs to employees of our Company. In accordance with the terms of the lapsing schedule, the restrictions on transfer shall lapse with respect to approximately 50 percent of the RSUs quarterly from March 2010 to September 2010 so long as the employee is employed by or providing services to our Company.
In May, 2010, we granted 70,000 RSUs to employees of our Company. In accordance with the terms of the lapsing schedule, the restrictions on transfer shall lapse with respective to 100 percent of the RSUs on the grant date so long as the employee is employed by or providing services to our Company.
In May, 2010, options to purchase 350,000 shares of our Company’s common stock were granted at an exercise price of US$2.47. These options will be vested annually from 2010 to 2014. In accordance with the terms of the vesting schedule, 20 percent of 350,000 options will be exercised on or after the grant date and the remaining 80 percent of 350,000 options will be exercised annually from the first anniversary of the grant date to the fourth anniversary of the grant date.
93
The maximum contractual term under the 2007 Plan is 10 years. Options will be forfeited upon termination of employment, unless the relevant award agreement extends the exercisability of the outstanding options.
2008 Equity Incentive Plan
At the June 2008 Annual General Meeting, the shareholders of our Company approved the GigaMedia Limited 2008 Equity Incentive Plan (the “2008 Plan”) under which up to 1,000,000 common shares of our Company have been reserved for issuance. The 2008 Plan is administered by a committee designated by the board of directors. The committee as plan administrator has complete discretion to determine the grant of awards under the 2008 Plan.
In December 2008, options to purchase 560,000 shares of our Company’s common stock were granted at an exercise price of US$4.24. These options were subject to two vesting schedules. In accordance with the terms of the first vesting schedule, 25 percent of 360,000 options are vested annually from December 2009 to December 2012. In accordance with the terms of the second vesting schedule, 16.7 percent of the remaining 200,000 options will be vested annually from December 2009 to December 2014.
In May, 2010, options to purchase 340,000 shares of our Company’s common stock were granted at an exercise price of US$2.47. These options will be vested annually from 2010 to 2014. In accordance with the terms of the vesting schedule, 20 percent of 340,000 options will be exercised on or after the grant date and the remaining 80 percent of 340,000 options will be exercised annually from the first anniversary of the grant date to the fourth anniversary of the grant date.
In May 2010, options to purchase 100,000 shares of our Company’s common stock were granted at an exercise price of US$2.47. These options will be vested annually from 2010 to 2012. In accordance with the terms of the vesting schedule, 34 percent of 100,000 options will be exercised on or after the grant date and the remaining 66 percent of 100,000 options will be exercised annually from the first anniversary of the grant date to the second anniversary of the grant date.
The maximum contractual term under the 2008 Plan is 10 years. Options will be forfeited upon termination of employment, unless the relevant award agreement extends the exercisability of the outstanding options. All options, RSUs and other share-based awards are expected to be settled by issuing new shares.
2009 Equity Incentive Plan
At the June 2009 Annual General Meeting, the shareholders of our Company approved the GigaMedia Limited 2009 Equity Incentive Plan (the “2009 Plan”) under which up to 1,500,000 common shares of our Company have been reserved for issuance. The 2009 Plan is administered by a committee designated by the board of directors. The committee as plan administrator has complete discretion to determine the grant of awards under the 2009 Plan.
In May 2010, options to purchase 1,500,000 shares of our Company’s common stock were granted at an exercise price of US$2.47. These options will be vested annually from 2010 to 2014. In accordance with the terms of the vesting schedule, 20 percent of 1,500,000 options will be exercised on or after the grant date and the remaining 80 percent of 1,500,000 options will be exercised annually from the first anniversary of the grant date to the fourth anniversary of the grant date.
The maximum contractual term under the 2009 Plan is 10 years. Options will be forfeited upon termination of employment, unless the relevant award agreement extends the exercisability of the outstanding options. All options, RSUs and other share-based awards are expected to be settled by issuing new shares.
2010 Equity Incentive Plan
At the June 2010 annual general meeting of shareholders, the shareholders of our Company approved the GigaMedia Limited 2010 Equity Incentive Plan (the “2010 Plan”) under which up to 1,000,000 common shares of our Company have been reserved for issuance. The 2010 Plan is administered by a committee designated by the board of directors. The committee as plan administrator has complete discretion to determine the grant of awards under the 2010 Plan.
94
In March 2011, options to purchase 1,000,000 shares of our Company’s common stock were granted at an exercise price of US$1.05. These options will be vested annually from 2012 to 2014. In accordance with the terms of the vesting schedule, 34 percent of 1,000,000 options will be exercised on or after the first anniversary of the grant date and the remaining 66 percent of 1,000,000 options will be exercised annually from the second anniversary of the grant date to the third anniversary of the grant date.
The maximum contractual term for the options under the 2010 Plan is 10 years. Options will be forfeited upon termination of employment, unless the relevant award agreement extends the exercisability of the outstanding options. All options, RSUs and other share-based awards are expected to be settled by issuing new shares.
Options
In 2008, 2009 and 2010, 518,284, 543,049 and 200,500 options were exercised, respectively, and cash received from the exercise of stock options was US$0.5 million, US$1.3 million and US$0.2 million, respectively, which resulted in no significant tax benefit realized on a consolidated basis.
The options on ordinary shares of the Company outstanding as of December 31, 2010 are as follows:
| | | | | | | | | | | | | |
| Options outstanding | | Option currently exercisable | |
| | | | | | Weighted average | | | |
| | | No. of Shares | | | remaining contractual | | | | No. of Shares | |
| Exercise price | | (in thousands) | | | life | | Exercise price | | (in thousands) | |
| Under $1 | | | 5,201 | | | 3.50 years | | Under $1 | | | 5,201 | |
| $1~$10 | | | 3,950 | | | 8.19 years | | $1~$10 | | | 1,452 | |
| $10~$20 | | | 629 | | | 6.65 years | | $10~$20 | | | 537 | |
| | | | | | | | | | | |
| | | | 9,780 | | | | | | | | 7,190 | |
| | | | | | | | | | | |
The number of total outstanding options as of December 31, 2010 is 9,780,151, which includes options with exercise prices of US$0.79, US$1.45, US$2.47, US$2.55, US$4.24, US$10.15, US$16.01 and US$16.6. During the financial year ended December 31, 2010, a total of 272,995 options granted pursuant to the 2006 Plan and 2007 Plan had been cancelled or forfeited. During the financial year ended December 31, 2009, a total of 55 thousand options granted pursuant to the 2006 Plan and 2007 Plan had been cancelled or forfeited.
Employee Share Purchase Plans
At the June 2008 Annual General Meeting, the shareholders of our Company approved the GigaMedia Limited 2008 Employee Share Purchase Plan (the “2008 ESPP”) under which up to 200,000 common shares of our Company were reserved for issuance. Any person who is regularly employed by our Company or our designated subsidiaries shall be eligible to participate in the 2008 ESPP. Pursuant to the 2008 ESPP, our Company would offer the Shares to qualified employees on favorable terms. Employees are also subject to certain restrictions on the amount that may be invested to purchase the shares and to other terms and conditions of the 2008 ESPP. The 2008 ESPP is administered by a committee designated by the board of directors. As of the date of this annual report, no shares have been subscribed by qualified employees under the 2008 ESPP.
95
At the June 2009 Annual General Meeting, the shareholders of our Company approved the GigaMedia Limited 2009 Employee Share Purchase Plan (the “2009 ESPP”) under which up to 200,000 common shares of our Company were reserved for issuance. Any person who is regularly employed by our Company or our designated subsidiaries shall be eligible to participate in the 2009 ESPP. Pursuant to the 2009 ESPP, our Company would offer the Shares to qualified employees on favorable terms. Employees are also subject to certain restrictions on the amount that may be invested to purchase the shares and to other terms and conditions of the 2009 ESPP. The 2009 ESPP is administered by a committee designated by the board of directors. As of the date of this annual report, no shares have been subscribed by qualified employees under the 2009 ESPP.
At the June 2010 annual general meeting of shareholders, the shareholders of our Company approved the GigaMedia Limited 2010 Employee Share Purchase Plan (the “2010 ESPP”) under which up to 200,000 common shares of our Company have been reserved for issuance. To be eligible, employees must be regularly employed by us or our designated subsidiaries. Employees are also subject to certain restrictions on the amount that may be invested to purchase the shares and to other terms and conditions of the 2010 ESPP. The 2010 ESPP is administered by a committee designated by the board of directors. As of the date of this annual report, no shares have been subscribed by qualified employees under the 2010 ESPP.
Outstanding Options Granted Under Our Employee Share Option Plans and Equity Incentive Plans
The following table summarizes, as of May 31, 2011, the outstanding options granted under our employee share option plans and equity incentive plans to our directors and executive officers as a group.
| | | | | | | | | | | | | |
| | | Ordinary Shares | | | | | | | |
| | | Underlying | | | | | | | |
| | | Outstanding | | | Exercise Price | | | | |
| Date of Grant | | Options | | | ($/Share) | | | Date of Expiration | |
| August 12, 2004 | | | 3,519,000 | | | | 0.79 | | | June 29, 2014 |
| August 9, 2007 | | | 200,000 | | | | 10.15 | | | August 9, 2017 |
| December 1, 2008 | | | 400,000 | | | | 4.24 | | | June 29, 2017 |
| | | | 495,000 | | | | 4.24 | | | June 19, 2018 |
| May 13, 2010 | | | 1,250,000 | | | | 2.47 | | | May 13, 2020 |
| March 15, 2011 | | | 1,000,000 | | | | 1.05 | | | March 15, 2021 |
| May 20, 2011 | | | 60,000 | | | | 1.25 | | | May 20, 2021 |
| | | | | | | | | | | | |
| Total | | | 6,924,000 | | | | | | | | | |
| | | | | | | | | | | | |
ITEM 7. MAJOR SHAREHOLDERS AND RELATED-PARTY TRANSACTIONS
A. Major Shareholders
The following table sets forth information known to us with respect to the ownership of our shares as of March 31, 2011 by each shareholder known by us to own more than 5 percent of our shares:
| | | | | | | | | |
| | | | | | | Percentage of | |
| Name of Owner | | Shares Owned | | | Shares Owned | |
| Best Method Limited (1) | | | 10,799,999 | | | | 19.19 | % |
| Martin Currie Investment Management Ltd.(2) | | | 5,181,665 | | | | 9.21 | % |
| | | |
| (1) | | Through Best Method Limited, a British Virgin Islands company, Jeffrey Koo, Jr. and Andre Koo jointly have a beneficial ownership of 10,799,999 common shares of our Company. |
| |
| (2) | | Martin Currie Investment Management Ltd. owns 901,270 common shares of our Company through its wholly owned subsidiary Martin Currie China Ltd. |
As of March 31, 2011, we had 56,277,472 shares outstanding, of which 40,295,808 shares representing approximately 71.60 percent of our total outstanding shares were not held by our major shareholders as disclosed above. As of May 16, 2011, 56,277,472 shares were held by 286 record holders, including nominee holders, with a registered address in the United States.
96
The amounts and percentages of common shares beneficially owned are reported on the basis of regulations of the SEC, governing the determination of beneficial ownership of securities. Under the rules of the SEC, a person is deemed to be a “beneficial owner” of a security if that person has or shares “voting power,” which includes the power to vote or to direct the voting of such security, or “investment power,” which includes the power to dispose of or to direct the disposition of such security. A person is also deemed to be a beneficial owner of any securities of which that person has a right to acquire beneficial ownership within 60 days. Under these rules, more than one person may be deemed a beneficial owner of securities as to which such person has no economic interest. None of our major shareholders have voting rights different from those of our other shareholders.
B. Related-Party Transactions
We have engaged from time to time in various transactions with related parties.
Except for the following transactions, we were not a party to any transaction with any related party that did not arise in the ordinary course of business or that was material to us.
Borrowings
A key manager of Waterland Financial Holdings (“Waterland”) was one of our directors. As of December 31, 2008, December 31, 2009, December 31, 2010 and May 31, 2011, we had short-term indebtedness in the amount of US$1.5 million, US$1.5 million, $0, and $0, bearing interest of 5.038 percent, 3.288 percent, nil, and nil, respectively, owned to Waterland. The outstanding short-term indebtedness was utilized to support our current operations. The largest amounts of outstanding short-term indebtedness to Waterland during the years ended December 31, 2008, 2009 and 2010 were all $1.5 million.
Loan Receivables
We acquired an equity investment in Monsoon in connection with our acquisition of IAHGames with effect from July 1, 2010. In 2010, prior to our acquisition, IAHGames loaned $5.0 million to Monsoon to support Monsoon’s current operations. IAHGames has continued to support Monsoon’s operations subsequent to July 1, 2010. The loan bears interest at 7 percent per annum. The largest amount outstanding to Monsoon from July 1, 2010 through December 31, 2010 was $10.3 million. As of December 31, 2010 and May 31, 2011, the balance of the loan receivable was $3.4 million and $3.1 million, respectively, after being reduced in connection with absorbing additional losses of Monsoon. See note 16 to our consolidated financial statements for additional information.
Stock Transaction
In December 2006, we resigned from the board of directors of Gamania Digital Entertainment Co., Ltd. (“Gamania”). Following our resignation from the board of Gamania, we sold in the public market all of our Gamania shares, which resulted in gains of US$2.1 million reported in discontinued operations.
Stock Option Grants and Employee Share Purchase
See Item 6, “Directors, Senior Management and Employees — E. Share Ownership.”
C. Interests of Experts and Counsel
Not applicable.
97
ITEM 8. FINANCIAL INFORMATION
A. Consolidated Statements and Other Financial Information
Financial Statements
See pages beginning on page F-1 in this annual report.
Information on Legal or Arbitration Proceedings
98
Class Action
In December 2001, a class action lawsuit was filed in the United States District Court for the Southern District of New York (“District Court”) against our Company in connection with the initial public offering of our stock.
The complaint alleged that we violated Section 11 and Section 15 of the Securities Exchange Act of 1933 and Section 10(b) of the Securities Exchange Act of 1934 and Rule 10b-5 promulgated thereunder. In October 2002, plaintiffs voluntarily dismissed the individual defendants without prejudice. On February 19, 2003, the court issued an opinion and order on defendants’ motions to dismiss, which granted the motions in part and denied the motions in part. As to GigaMedia, the Rule 10b-5 claims were dismissed without prejudice, while the Section 11 claims survived the motion. Discovery in the actions commenced.
In June 2004, plaintiffs and issuer defendants, including our Company, presented the executed settlement agreement (the “Issuers’ Settlement”) to the judge during a court conference. Subsequently, plaintiffs and issuer defendants made a motion for preliminary approval of the settlement agreement. The key terms of the Issuers’ Settlement included: 1) the insurers of the issuers would provide an undertaking to guarantee that the plaintiffs would recover a total of $1 billion; 2) the insurers would pay up to $15 million for the notice costs arising from the settlement; 3) the issuers would assign their interest in certain claims against the underwriters to a litigation trust, represented by plaintiffs’ counsel; and 4) the plaintiffs would release all of the settling issuer defendants. That is, if plaintiffs were successful in recovering more than $1 billion from the underwriters, the issuer defendants would not be obligated to pay any additional amounts. If plaintiffs recovered less than $1 billion from the underwriters, the insurers would pay the deficit between $1 billion and the amount received from the underwriters.
On February 15, 2005, the judge issued an opinion and order granting preliminary approval to the settlement agreement subject to a narrowing of the proposed bar order as to only contribution claims. On April 24, 2006, the court held a fairness hearing on the proposed Issuers’ Settlement, which was subject to the court’s approval.
On December 5, 2006, the United States Court of Appeals for the Second Circuit issued an opinion vacating the District Court’s class certification in the six focus cases, which do not include the Company. Because the Second Circuit’s opinion was directed to class certification in the focus cases, the opinion’s effect on the proposed class to be certified by the District Court in connection with the Issuers’ Settlement was unclear.
On December 15, 2006, the District Court held a conference with all counsel in the IPO securities class action lawsuit to discuss the impact of the foregoing opinion. In the conference, the District Court agreed to stay all proceedings, including discovery and consideration of the Issuers’ Settlement, pending further decisions from the Second Circuit.
On January 5, 2007, plaintiffs filed a petition in the Second Circuit for rehearing and rehearing en banc regarding the decision on class certification (the “Petition”). On April 6, 2007, the Second Circuit rendered its decision which denied the Petition.
In April, May, and June 2007, the District Court held several conferences to discuss the issues regarding class certification, statute of limitations, the Issuers’ Settlement and discovery. In June 2007, a stipulation terminating the Issuers’ Settlement was submitted to the District Court.
In September 2007, discovery moved forward in the six focus cases, which do not include the Company. Plaintiffs filed amended complaints against the focus case issuer and underwriter defendants and moved for class certification in those actions. In November 2007, the underwriters and issuers filed motions to dismiss the amended complaints in the focus cases. In December 2007, plaintiffs filed their opposition to defendants’ motions to dismiss. In January 2008, defendants filed their reply briefs in further support of the motions to dismiss.
99
On or about March 26, 2008, the District Court granted in part and denied in part the motion to dismiss the focus cases. The motion to dismiss was granted only as to claims brought under Section 11 of the Securities Act by plaintiffs who sold their securities for a price in excess of the initial offering price and by those plaintiffs who purchased outside the previously certified class period.
On April 9, 2008, the underwriters filed a motion for reconsideration of the holding in the March 26, 2008 opinion that the Section 11 claims against the focus case issuer was not time barred, on the basis that no Section 11 class in that case was certified in 2004. The issuers joined in that motion on behalf of the focus case issuer by letter to the District Court on April 10, 2008.
In December 2007, the issuers filed their oppositions to class certification in the focus cases. In March 2008, plaintiffs filed their reply brief in further support of class certification. The underwriters and issuers submitted sur-replies in further opposition to class certification on April 22, 2008, addressing issues related to the deposition of the plaintiffs’ expert.
As set forth in Plaintiffs’ Motion For Preliminary Approval of the Settlement and accompanying documents, which were filed on April 2, 2009, after eight years of litigation all parties to the IPO Cases have agreed to settle the actions on a global basis (the “IPO Settlement Agreement”). Pursuant to the IPO Settlement Agreement, the defendants have agreed to pay $586 million in total to settle all 309 IPO Cases, including the GigaMedia action. The agreement to settle was reached after a lengthy mediation followed by months of negotiation to reach agreement on the details. As to our Company’s portion of the settlement payment, our insurance companies are paying the entire settlement amount.
In June 2009, the District Court granted the plaintiffs’ motion for preliminary approval of the IPO Settlement Agreement. Subsequently, in October 2009, the judge granted final approval to the settlement. Certain objectors have filed notices of appeal to the United States Circuit Court for the Second Circuit seeking to reverse or vacate the order granting final approval to the IPO Settlement Agreement. However, no briefs have been filed yet with respect to these appeals.
In January 2010, the IPO Settlement Agreement required that the IPO Securities Litigation Settlement Fund (the “Settlement Fund”) be treated as a Qualified Settlement Fund within the meaning of Treasury Regulation 1.468B-1 and that each transferor of funds to the Settlement Fund provide a statement to the administrators of the Settlement Fund pursuant to Treasury Regulation 1.468B-3(e) by January 31, 2010. Liaison counsel for the issuers has submitted a combined statement on behalf of all such issuers. Six notices of appeal and one petition to appeal the certified class have been filed and all but two of the six have been withdrawn. In October 2010, for the two appeals that were not withdrawn, plaintiffs-appellants filed their opening briefs. The opening briefs challenged the settlement on several grounds, including certification of the classes, the fees, and the expenses awarded to the plaintiffs’ counsel. On December 30, 2010, the answering briefs were filed, and on May 17, 2011, the Second Circuit issued a ruling on the two remaining appeals, granting the motion to dismiss one of the appeals, and remanding the other appeal back to the District Court to determine procedural issues relating to standing.
We had an insurance policy with American Insurance Group with $10 million of liability coverage when the class action lawsuit was made. We believe that the insurance coverage is sufficient to cover the liability arising from the settlement and claim.
World Series of Poker Litigation
On April 1, 2010, a complaint was filed on behalf of UIM against Harrah’s License Company, LLC (“Harrah’s”) in connection with the promotional agreement for the World Series of Poker dated February 24, 2008 (the “Agreement”) (the “Original Lawsuit”). UIM stated claims against Harrah’s for: 1) breach of the Agreement; 2) breach of the implied covenant of good faith and fair dealing; 3) unjust enrichment; 4) declaratory relief; and 5) injunctive relief. The complaint seeks compensatory damages, a declaration that Harrah’s materially breached the Agreement and the Agreement is therefore terminated as of April 1, 2010, an injunction precluding Harrah’s from violating the Agreement pending the outcome of the litigation, and attorney fees and costs.
A letter of termination was also sent by UIM to Harrah’s on April 1, 2010 to terminate the Agreement for multiple material breaches by Harrah’s and to demand the refund of past payments.
100
An application for a temporary restraining order (“TRO”) and motion for preliminary injunction was also filed. The request for the TRO was subsequently denied by the court. On April 28, 2010, UIM had a hearing on its motion asking the court to force Harrah’s to remove a certain non-Everest Poker name and logo reference from the broadcasts into France, as UIM has exclusive promotional and advertising rights pursuant to the Agreement. The motion was denied on the grounds that UIM failed to show that the broadcasts containing the other reference’s digital overlay were certain to continue into the future. The court did not rule on the merits of the underlying claims in any way. The judge has yet to issue a formal order.
Harrah’s also filed a motion to dismiss the complaint. In addition, on April 27, 2010, Harrah’s Interactive Entertainment, Inc. (“Harrah’s Interactive”) filed a separate lawsuit (the “Second Lawsuit”) against UIM for 1) breach of the Agreement; 2) breach of the implied covenant of good faith and fair dealing; and, 3) unjust enrichment, and included our Company as a defendant for tortious interference with contractual relations. In May 2009, the Agreement was assigned by Harrah’s to Harrah’s Interactive.
On May 14, 2010, UIM lodged a First Amended Complaint, asserting a new claim for fraud in the inducement and abandoning its claim for a preliminary injunction. Separately, UIM asserted compulsory counterclaims within the Second Lawsuit on June 11, 2010 which mirrored those made in the Original Lawsuit. On June 29, 2010, the Court consolidated the Original Lawsuit and the Second Lawsuit.
On June 14, 2010, Everest Gaming Limited, a subsidiary of Everest Gaming, filed a complaint for trademark infringement against Harrah’s (the “Everest Complaint”), which was consolidated with the Original Lawsuit and Second Lawsuit on June 29, 2010 as well.
Harrah’s moved to dismiss all of UIM’s claims in the First Amended Complaint, UIM’s counterclaims, and the Everest Complaint. UIM opposed the Motion in writing and at the hearing held on the matter. The Court denied Harrah’s request in its entirety on September 15, 2010.
On January 27, 2011, Harrah’s lodged a First Amended Complaint, naming Mangas Gaming S.A.S and Mangas Everest S.A.S as new co-defendants and asserting new claims for: 1) tortious interference with contractual relations; 2) tortious interference with prospective economic advantage; 3) fraudulent transfer; and 4) unjust enrichment. Harrah’s demanded a jury trial on its tort claims, whereas the remainder of the trial is set for a bench trial based upon the Court’s July 7, 2010 ruling that the jury waiver within the Agreement was valid and enforceable.
On May 3, 2011, we made a motion to the Court for partial summary judgment on Harrah’s claims against it for tortious interference of contract and tortious interference with prospective economic advantage. On March 31, 2010, we (through its subsidiary Internet Media Licensing Limited) purchased all issued and outstanding shares of common stock of UIM. Since we enjoy a legal privilege to interfere in the contracts and actions of its wholly owned subsidiary, and since UIM has been, since March 31, 2010 our wholly owned subsidiary, any interference by us would enjoy immunity. We believe that we are therefore entitled to summary judgment. The Court has yet to set a hearing date for this motion.
There are several motions before the Court relating to various discovery matters, and Harrah’s has filed motions for partial summary judgment on some key issues that could be dispositive of the contract dispute. UIM is opposing these motions on the ground that there are genuine issues of material fact outstanding, thus the Court is precluded from granting a motion for partial summary judgment as a matter of law. While we are hopeful that we will be successful in persuading the Court to deny these motions, there is no assurance that UIM will be successful in these motions.
The Magistrate Judge has also ruled that all discovery matters must be completed by August 31, 2011. There are several depositions to be taken by all parties to the suit, as well as document production. On June 28, 2011, UIM moved for leave to file a Second Amended Complaint for intentional misrepresentation based on evidence obtained during discovery. The briefing continues on this matter and no hearing has been set by the Court. Notwithstanding UIM’s request for leave to assert a new claim for intentional misrepresentation, its request for compensatory and punitive damages remains the same.
We believe UIM will be successful in pursuing and defending the lawsuits of Harrah’s. However, there is no assurance that UIM will be successful in its claims against Harrah’s, including its claim for compensatory damages and/or attorney fees and costs.
101
We have certain contractual obligations pursuant to the sale of a 60 percent ownership interest in our online gaming software and service business to BetClic. Pursuant to the terms of the sale, we agreed to pay 40 percent of the attorney fees incurred in connection with the World Series of Poker litigation if Everest Gaming does not pay the attorney fees. All the attorney fees incurred to date have been paid by Everest Gaming. However, we may be liable for 40 percent of any and all future attorney fees relating to this litigation if for some reason Everest Gaming does not continue to make these payments.
Dispute with the former head of Our Asian online game and service business in the PRC and former Chief Executive Officer of T2CN (“Wang Ji”)
In early 2010, the Company determined that changes in the leadership of its majority owned subsidiary T2CN were necessary to improve T2CN and our Asian online game and service business in the PRC. As a result of this restructuring of leadership, Wang Ji was to be moved from his role as the operating head of T2 Entertainment and T2 Technology to a high-level consulting position, or be given the board chairmanship role at T2CN. Originally, Wang Ji appeared to accept this change in position and did not object to the restructuring plans. T2CN started to implement the restructuring in early July 2010. However, at that time, Wang Ji refused to step down from his operating and executive roles at T2 Technology, J-Town and T2 Entertainment. As a result, T2CN, as the sole shareholder of T2 Technology and J-Town, removed Wang Ji as a director of T2 Technology and J-Town on July 27, 2010. Wang Ji was also duly removed as a director of T2CN on July 29, 2010. On August 7, 2010, Wang Ji was removed as the legal representative, executive director and manager of T2 Entertainment and Yan Guoming was appointed as the new legal representative, executive director and manager of T2 Entertainment with immediate effect by way of a shareholders’ resolution (“August 7 Resolution”) passed at a shareholders’ meeting of T2 Entertainment. On August 10, 2010, the authorized representatives of T2 Technology, J-Town and T2 Entertainment, together with their PRC legal advisers, went to the office premises to request that Wang Ji return all properties of T2 Technology, J-Town and T2 Entertainment in his possession, custody or control. At that time, the authorized representatives were forcibly removed from the office premises. Also, Wang Ji’s employment contract with T2 Technology was terminated on August 12, 2010.
The Company believes that Wang Ji currently has in his possession, among other things, the company seals, financial chops and business registration certificates of the T2CN Operating Entities. We also believe that Wang Ji has in his possession all documents, records and data and tangible property, including license agreements, trademark and domain name documentation, held in the offices of the T2CN Operating Entities. The company seals, financial chops and business registration certificates of the T2CN Operating Entities are necessary for the respective entities to, among other things, declare dividends and approve service fee payments to us. These documents are necessary for the Company to run its Asian online game and service business in the PRC. Under PRC law, the company seals, financial chops and business registration certificates are essential for entering into contracts, conducting banking business, or taking official corporate action of any sort including registering any change to the composition of the board or management with the relevant PRC authorities.
Consequently, the Company has not been able to register the resolutions removing Wang Ji from his position as a director of T2 Technology and J-Town and as the legal representative, executive director and manager of T2 Entertainment. As a result, Wang Ji has effectively usurped control over T2 Technology, J-Town and T2 Entertainment’s operations and accounts.
T2 Entertainment, as represented by the newly appointed legal representative Yan Guoming, filed lawsuit against Wang Ji and related persons in the courts of the PRC in August 2010, seeking to recover, among other things, the tangible property of T2 Entertainment, including the company seal, financial chops and business certificate. In August 2010, Wang Ji also filed two lawsuits against T2 Entertainment and Lu Ning, one of shareholders of T2 Entertainment, to invalidate two shareholder resolutions of T2 Entertainment: (i) the shareholders’ resolution dated in February 2010 approving a transfer of the shares of T2 Entertainment held by Wang Ji to a third party (“Wang Ji’s 1st Suit”); and (ii) the August 7 Resolution (“Wang Ji’s 2nd Suit”). Wang Ji’s 1st Suit is temporarily suspended due to the absence of the defendant Lu Ning in the first formal court hearing and pending the court’s decision as to T2 Entertainment’s standing, as represented by Yan Guoming, to join the suit. Wang Ji’s 2nd Suit was withdrawn by Wang Ji in April 2011.
102
As indicated above, Wang Ji was removed as the legal representative, executive director and manager of T2 Entertainment and Yan Guoming was appointed as the new legal representative, executive director and manager of T2 Entertainment with immediate effect by way of the August 7 Resolution at a shareholders’ meeting of T2 Entertainment. Wang Ji (who owned 20 percent of the equity interests of T2 Entertainment) and Lu Ning (who owned 80 percent of the equity interests of T2 Entertainment) appointed their respective representatives to attend such shareholders’ meeting and the August 7 Resolution was duly passed in accordance with the articles of association of T2 Entertainment. In late March, 2011, we were informed by the court that Wang Ji had submitted supplementary documents to the court. The documents included a purported shareholders’ resolution of T2 Entertainment dated February 14, 2011 (“February 14 Resolution”) which stated that the August 7 Resolution was invalid, that Yan Guoming has no authority or right to represent T2 Entertainment, and that Wang Ji is the executive director, legal representative and manager of T2 Entertainment and his acts representing T2 Entertainment are valid. The February 14 Resolution claimed that Lu Ning and Wang Ji attended the shareholder’s meeting in person and passed the February 14 Resolution by mutual agreement.
We believe that the February 14 Resolution may be invalid and that, in any event, it cannot invalidate the August 7 Resolution. We continue to believe that Wang Ji was removed from his position as the legal representative of T2 Entertainment on August 7, 2010 and has no right to represent T2 Entertainment and that Yan Guoming is the legal representative of T2 Entertainment duly appointed by the August 7 Resolution and has the right to represent T2 Entertainment. The PRC courts are now in the process of considering the February 14 Resolution submitted by Wang Ji as supplementary evidence and the effect, if any, the resolution might have on the ongoing litigation in connection with T2 Entertainment.
While management continues to believe that its general legal position is sound and is vigorously contesting the purported attempt by Wang Ji to invalidate the August 7 Resolution, if the courts disagree with the Company’s position and rule that the August 7 Resolution is not valid and Yan Guoming is not the legal representative of T2 Entertainment then the litigation against Wang Ji in connection with T2 Entertainment could be dismissed.
Each of T2 Technology and J-Town as represented by the newly appointed legal representative Yan Guoming filed lawsuits against Wang Ji in the courts of the PRC in October 2010 seeking to recover, among other things, the tangible property of T2 Technology and J-Town, including the company seals, financial chops and business certificates. Wang Ji’s appeals on the jurisdiction of the court in respect of the lawsuits filed by T2 Technology and J-Town were dismissed. Wang Ji has subsequently filed a motion seeking to stay the proceeding on the ground that he has filed a claim against the Company and T2CN in the United States. In response to such motion, we submitted a written objection to the court in May 2011. The court is now considering Wang Ji’s motion to stay and our objection but has not made any decision yet. For avoidance of doubt, the court’s decision on the February 14 Resolution and the August 7 Resolution will have no impact on the Company’s litigations against Wang Ji in connection with T2 Technology and J-Town.
T2 Technology and T2 Entertainment represented by the newly appointed legal representative also filed a lawsuit against Wang Ji in Singapore in August 2010 for breach of fiduciary duty seeking to recover, among other things, the properties of T2 Technology and T2 Entertainment including the company seals, financial chops and business certificates, and monetary damages. T2 Technology and T2 Entertainment obtained a Mareva Injunction against Wang Ji, thereby freezing his assets in Singapore up to the amount of SGD$2 million (approximately US$1.6 million). Wang Ji has filed his defense. Due to Wang Ji’s failure to comply with the timeline ordered by the court in producing evidence and supporting documentation referred to in his defense, T2 Technology and T2 Entertainment obtained a default judgment against Wang Ji in April 2011. Wang Ji has applied to set aside the default judgment, and the court procedures are proceeding accordingly.
Lawsuits against Wang Ji have also been filed by T2 Technology and T2 Entertainment in Hong Kong and the British Virgin Islands by T2CN respectively. The lawsuits assert a number of claims, including, breach of fiduciary duty and conversion, seeking to recover, among other things, the properties of T2 Technology and T2 Entertainment and monetary damages.
103
On November 10, 2010, the Company filed a lawsuit in the United States District Court for the Central District of California (the “California Action”) asserting a number of claims against the other shareholder of T2 Entertainment and our former head of operations in the PRC, including, among others, tortious interference with contract, tortious interference with prospective economic advantage, fraud, aiding and abetting conversion and breach of oral contract. In these matters, the Company is seeking to recover, among other things, monetary damages. Subsequently, Wang Ji filed a motion to intervene in the California Action on April 26, 2011. The court set Wang Ji’s motion to intervene for hearing on August 22, 2011. On May 24, 2011, Wang Ji filed an ex parte application to shorten the time with respect to the August 22, 2011 hearing date for his motion to intervene. We opposed the ex parte application on May 26, 2011. On May 27, 2011, the court issued a ruling denying Wang Ji’s ex parte application to shorten time. Hearing on the intervenors’ motion will be held on August 22, 2011. On April 18, 2011, Wang Ji also filed a complaint against the Company and T2CN in the United States District Court for the Central District of California. Wang Ji’s complaint was subsequently stricken by the court for failure to follow court rules, though, according to court records, that complaint has now been properly refiled.
While management continues to believe that its general legal position is sound, as a result of the increasing complexity of various ongoing litigations, it is now impractical for the Company to estimate with any degree of certainty the timeline for the eventual resolution of the dispute or the likelihood of a successful outcome. Our board of directors is exploring all possible options to resolve such dispute, including discussing with Wang Ji the settlement of the dispute or the sale of T2CN.
Patent Litigation
In July 2006, Hoshin GigaMedia, our wholly-owned subsidiary, obtained a patent in Taiwan (Patent No. I258284), which entitles us to use the method of “Point to Point Protocol over Ethernet” to distribute fixed Internet protocol addresses to our ADSL users (the “PPPoE Patent”).
Two major Taiwanese Internet access and service providers, Taiwan Fixed Network Co., Ltd. (“TFN”) and Chunghwa Telecom Co., Ltd. (“CHT”), are using the PPPoE method to distribute fixed Internet protocol addresses to their ADSL users, which we believe infringes our PPPoE Patent.
In April and May 2008, we filed lawsuits in Taipei District Court against TFN and CHT for infringement of our PPPoE Patent and claimed damages amounting to approximately US$1.54 million and US$15.42 million, respectively. Both TFN and CHT have submitted their defenses and the court procedures are proceeding. On August 14, 2009, the judgment ruled in favour of TFN made by Taipei District Court. After the cautious discussions with our lawyers, we found the chance to win this case in High Court will be remote. So we decided not to appeal. On September 25, 2009, a settlement agreement was made and entered into by and between CHT and Hoshin GigaMedia, so we applied to dismiss this litigation on the same day.
In addition, TFN and CHT filed patent invalidation applications with Taiwan Intellectual Property Office and Taiwan Ministry of Economic Affairs to invalidate the PPPoE Patent against us in July 2008 and January 2009, respectively. We submitted our responses to TFN and CHT’s patent invalidation applications in September 2008 and March 2009, respectively. The patent invalidation applications are still under review and investigation by Taiwan Intellectual Property Office, we are not able to assess the likelihood of the outcome, nor can we provide a timeline for the eventual resolutions. On November 20, 2008, we filed an application with Taiwan Intellectual Property Office to amend the contents of the specification and drawings of our PPPoE Patent to correct certain errors made therein.
Mgame Arbitration
On February 3, 2010, a notice of arbitration was submitted to the Singapore International Arbitration Centre (the “SIAC”) by Hoshin GigaMedia Center Inc. ( “HGC”) on its own behalf against Mgame Corporation (“Mgame”) in connection with an Exclusive Game License Agreement dated as of September 17, 2007 and a Supplemental Agreement dated as of January 1, 2008 (together, the “Agreement”) , under which Mgame granted a license to HGC and Funtown Hong Kong Limited to operate, promote, publish, produce and distribute the Holic Online game in Taiwan, Hong Kong and Macau (the “Notice of Arbitration”). In the Notice of Arbitration, HGC accused Mgame of wrongful actions and of breaching Article 6 of the Agreement.
104
On April 29, 2010, Mgame filed a response to notice of arbitration and counterclaim under which Mgame denied all HGC’s claims and allegations in the Notice of Arbitration and brought a counterclaim for (a) declaring that HGC breached its obligations under Article 4.2.2 of the Agreement; (b) ordering HGC to pay US$375,000 for its due and outstanding amount of the guarantee payment together with 3 percent per annum accrued thereon; and (c) ordering HGC to pay any other outstanding amounts for which it is liable under the Agreement.
HGC and Mgame agreed that the dispute shall be resolved by arbitration in Singapore in accordance with the Arbitration Rules of the SIAC and be heard and decided by a sole arbitrator selected by HGC and Mgame.
HGC and Mgame entered into an agreement (the “Termination Agreement”) under which the parties agree to terminate the Agreement by mutual consent effective as of December 10, 2010 (the “Termination Date”). The parties acknowledged and agreed that from the Termination Date the parties shall not be liable for any obligation or breach or default of any obligation arising out of, relating to, or in connection with the Agreement, and the parties will have no rights or obligations under, arising out of, relating to, or in connection with the Agreement. Effective upon the Termination Date, the parties released each other from any and all claims, which any party could or would be entitled to institute or assert against each other pursuant to the respective rights or obligations granted or imposed under the Agreement.
HGC and Mgame further agreed to fully, finally, and forever release and discharge each other from any and all past, present, or future rights, claims, demands, agreements, causes of action, actions, obligations, damages, liabilities, costs, expenses, and attorney’s fees, whether known or unknown, arising out of or in connection with the arbitration filed with the SIAC. HGC and Mgame agreed that each party shall cause all legal actions commenced by itself to be withdrawn, including the claims and counterclaims in the arbitration filed with the SIAC.
As agreed in the Termination Agreement, we will withdraw our claim against Mgame which was filed with the SIAC.
ESET Litigation
In September 2009, UIM and Internet Media Licensing Ltd. (“IML”), our wholly-owned subsidiary, became aware that ESET, LLC (“ESET”), an anti-virus software provider, had marked and identified the software used on the Everest Poker and Everest Casino online gaming websites (the “Everest Software”) as “malware,” which, in turn, resulted in users being blocked and prevented from accessing the Everest Software. In November 2009, UIM and IML filed a complaint in California against ESET for defamation, trade libel, tortious interference with contractual relations, intentional interference with prospective economic advantage and negligent interference with prospective economic advantage. A hearing was held on April 9, 2010 in San Diego. The motion for dismissal made by ESET was granted in April 2010. IML and UIM decided not to file an appeal.
Dividend Policy
We have neither declared nor paid any dividends on our Shares. We anticipate that we will continue to retain any earnings for use in the operation of our business, and we do not intend to pay dividends in the foreseeable future. See Item 10, “Additional Information — B. Memorandum and Articles of Association — Dividends” in this annual report.
B. Significant Changes
Except as disclosed in this annual report, no significant change has occurred since the date of our consolidated financial statements.
ITEM 9. THE OFFER AND LISTING
Not applicable, except for “— A. Offer and Listing Details — 4. Information Regarding the Price History of the Stock” and “— C. Markets” as disclosed below.
105
Our Shares have been listed and traded on the NASDAQ Stock Market since February 18, 2000.
The following table shows, for the periods indicated, the high and low closing prices for our Shares as quoted on the NASDAQ Stock Market.
| | | | | | | | | |
| | | Common Shares | |
| | | High | | | Low | |
| Year Ending December 31 | | (in US$) | |
| 2005 | | $ | 2.99 | | | $ | 1.30 | |
| 2006 | | $ | 12.38 | | | $ | 2.90 | |
| 2007 | | $ | 24.61 | | | $ | 9.28 | |
| 2008 | | $ | 20.70 | | | $ | 2.90 | |
| 2009 | | $ | 7.47 | | | $ | 3.04 | |
| 2010 | | $ | 3.32 | | | $ | 1.40 | |
| | | | | | | | | |
| | | Common Shares | |
| | | High | | | Low | |
| Year Ending December 31, 2010 | | (in US$) | |
| First quarter | | $ | 3.32 | | | $ | 2.74 | |
| Second quarter | | $ | 3.25 | | | $ | 2.03 | |
| Third quarter | | $ | 2.34 | | | $ | 1.91 | |
| Fourth quarter | | $ | 2.10 | | | $ | 1.40 | |
| | | | | | | | | |
| | | Common Shares | |
| | | High | | | Low | |
| Year Ending December 31, 2011 | | (in US$) | |
| First quarter | | $ | 1.56 | | | $ | 1.03 | |
| Second quarter (through June 24, 2011) | | $ | 1.60 | | | $ | 1.11 | |
| | | | | | | | | |
| | | Common Shares | |
| | | High | | | Low | |
| Monthly Highs and Lows | | (in US$) | |
| December 2010 | | $ | 1.60 | | | $ | 1.45 | |
| January 2011 | | $ | 1.56 | | | $ | 1.14 | |
| February 2011 | | $ | 1.28 | | | $ | 1.13 | |
| March 2011 | | $ | 1.48 | | | $ | 1.03 | |
| April 2011 | | $ | 1.60 | | | $ | 1.21 | |
| May 2011 | | $ | 1.47 | | | $ | 1.22 | |
| June 2011 (only through June 24, 2011) | | $ | 1.29 | | | $ | 1.11 | |
Under NASDAQ Rule 4350(l), as amended (“Rule 4350(1)”), all securities listed on NASDAQ must be eligible for a direct registration program, or DRS, operated by a registered clearing agency, unless the foreign private issuer is prohibited from complying by a law or regulation in its home country. In order to fulfill the direct registration program eligibility requirements, we are required to, among other provisions; amend our constitutional documents to allow for the issue of non-certificated securities.
Our Company is incorporated under the laws of the Republic of Singapore and is subject to the provisions of the Companies Act (Cap.50) of Singapore (the “Companies Act”). Under the Companies Act, Singapore-incorporated companies are required to issue physical share certificates to registered shareholders as prima facie evidence of a registered shareholder’s title to the Shares and there are no exceptions to or exemptions from this requirement that would enable us to amend our constitutional documents to allow for the issue of non-certificated shares. Therefore, we will not be able to comply with the DRS eligibility provisions of Rule 4350(l).
106
Under the DRS eligibility provisions, as a foreign private issuer, we are allowed to follow our home country practice in lieu of the requirements set out in Rule 4350(1), subject to certain exceptions. We will be relying on this for an exemption from the DRS eligibility requirements under Rule 4350(l). We have informed the NASDAQ Stock Market about our election to comply with the laws of Singapore in lieu of the DRS eligibility provisions of Rule 4350(l).
ITEM 10. ADDITIONAL INFORMATION
A. Share Capital
Not applicable.
B. Memorandum and Articles of Association
We incorporate by reference into this annual report the description of our amended memorandum and articles of association contained in our annual report for the year ended December 31, 2007 on Form 20-F (File No. 000-30540), filed with the SEC on June 30, 2008.
As of May 31, 2011, an aggregate of 56,277,472 shares have been issued and are outstanding.
C. Material Contracts
The following are summaries of our certain material contracts. However, these summaries may not contain all the information important to you. For more complete information, you should read the entire agreements, which have been included as exhibits to this annual report.
Sale of Internet Access and Service Business
Share Sales and Purchase Agreement among Champion Limited, Gigamedia International Holdings Limited and GigaMedia, dated August 28, 2008
On August 28, 2008, we entered into a share sale and purchase agreement, pursuant to which we sold 100 percent of Hoshin Multimedia to Champion Limited, an affiliate of China Network Systems Co., Ltd. for an aggregate sale price of US$7.0 million.
Share Sales and Purchase Agreement between China Network Systems Co., Ltd. and Hoshin GigaMedia, dated August 28, 2008
On August 28, 2008, we entered into a share sale and purchase agreement, pursuant to which we sold 100 percent of KBT, our wholly-owned subsidiary, to China Network Systems Co., Ltd. for an aggregate sale price of US$10.0 million.
Asset Sale and Purchase Agreement among Ko Ying Co., Ltd., Hoshin GigaMedia and China Network Systems Co., Ltd., dated August 28, 2008
On August 28, 2008, we entered into an asset sale and purchase agreement, pursuant to which we sold certain assets, rights, interests related to our Internet access and service business to Ko Ying Co., Ltd. (“Ko Ying”), a wholly-owned subsidiary of China Network Systems Co., Ltd., and Ko Ying assumed certain liabilities, for a total sale price of US$3.0 million, subject to certain adjustment.
Transitional Service Agreement among Ko Ying, Hoshin GigaMedia and KBT, dated September 3, 2008
On September 3, 2008, we entered into a transitional service agreement with Ko Ying, under which we agreed to provide certain transitional services to facilitate the sale of our Internet access and service business under the relevant sales and purchase agreements.
107
Assignment and Assumption Agreement between Hoshin GigaMedia and Hoshin Multimedia, dated September 3, 2008
In connection with our sale of 100 percent of Hoshin Multimedia to Champion Limited, an affiliate of China Network Systems Co., Ltd., on September 3, 2008, Hoshin GigaMedia entered into an assignment and assumption agreement with Hoshin Multimedia, under which Hoshin GigaMedia assigned to Hoshin Multimedia all of the its rights, interests, duties and obligations with respect to certain broadband service agreement. Before the assignment and assumption, Hoshin GigaMedia had exclusive rights and interests to provide broadband Internet services through the cable TV system under the broadband service agreement.
Transactions with IAHGames
Subscription Agreement between IAHGames and GigaMedia Asia Pacific Limited, dated April 30, 2010
On April 30, 2010, we entered into a subscription agreement with IAHGames, under which IAHGames agreed to allot and issue, and we agreed to subscribe for, an aggregate of 10,000,000 class B preference shares of IAHGames at US$1.00 for each share, for an aggregate consideration of US$10 million.
The Amendment to the Subscription Agreement between IAHGames and GigaMedia Asia Pacific Limited, June 25, 2010
On June 25, 2010, we entered into an amendment to the subscription agreement with IAHGames, under which IAHGames agreed to allot and issue, and we agreed to subscribe and pay for 500,000 class B preference shares of IAHGames at US$20.00 for each share, for an aggregate consideration of US$10 million. Except as expressly modified in this Amendment, all other terms and conditions contained in the Subscription Agreement dated April 30, 2010 shall remain in full force and effect.
Share Purchase Agreement between Infocomm Investments Pte Ltd and GigaMedia Asia Pacific Limited, dated April 30, 2010
On April 30, 2010, we entered into a share purchase agreement with Infocomm Investments Pte Ltd, under which Infocomm Investments Pte Ltd agreed to sell and we agreed to purchase, a total of 3,000,000 class A preference shares of IAHGames for an aggregate consideration of US$1.5 million.
Share Purchase Agreement between Bodhi Investments LLC and GigaMedia Asia Pacific Limited, dated April 30, 2010
On April 30, 2010, we entered into a share purchase agreement with Bodhi Investments LLC, under which Bodhi Investments LLC agreed to sell and we agreed to purchase, a total of 208,881 class B preference shares of IAHGames for an aggregate consideration of US$2,668,430.
Share Purchase Agreement between China Interactive Limited and GigaMedia Asia Pacific Limited, dated June 30, 2010
On June 30, 2010, we entered into a share purchase agreement with China Interactive Limited, under which China Interactive Limited agreed to sell and we agreed to purchase, a total of 3,000,000 class A preference shares of IAHGames for an aggregate consideration of US$3 million.
108
Deed of Guarantee, Undertaking and Indemnity among GigaMedia Asia Pacific Limited, Management Capital International Ltd and China Interactive Limited, dated April 30, 2010
On April 30, 2010, we entered into a deed of guarantee, undertaking and indemnity with Management Capital International and China Interactive Limited, under which we agreed to provide a guarantee on behalf of IAHGames and its wholly owned subsidiary Monsoon to a licensor of certain games to IAHGames and Monsoon. The guarantee includes but is not limited to payment of the royalties, license fees and the minimum guarantees associated with the licensed games as set forth within relevant licensing agreements.
Shareholder Loan Agreement between GigaMedia Asia Pacific Limited and IAHGames, dated April 30, 2010
On April 30, 2010, we entered into a shareholder loan agreement with IAHGames, under which we agreed to make available a loan facility to IAHGames and IAHGames agreed to borrow from us, in a fixed aggregate principal amount of US$7 million. The loan is to be used by IAHGames to support its current operations. The loan has a five year term and bears interest at 3 percent per annum. The shareholder loan agreement was amended on June 1, 2010.
Loan Assignment Agreement among GigaMedia Asia Pacific Limited, IAHGames and Spring Asia Limited, dated June 1, 2010
On June 1, 2010, we entered into a loan assignment agreement with IAHGames and Spring Asia Limited, under which we agreed to assign and transfer to Spring Asia Limited, a Labuan company wholly owned by us, and Spring Asia Limited agreed to accept the assignment and transfer from us of, all of our rights and interests as a lender under the Shareholder Loan Agreement dated April 30, 2010 and the Amendment to Shareholder Loan Agreement dated June 1, 2010.
Loan Agreement between Spring Asia Limited and IAHGames, dated May 20, 2010
On May 20, 2010, we entered into a loan agreement with IAHGames, under which we agreed to make available a loan facility to IAHGames and IAHGames agreed to borrow from us, in a fixed aggregate principal amount of US$6.5 million. IAHGames shall apply the loan towards meeting its working capital requirements. The loan will expire at the closing date of the subscription agreement between IAHGames and the Company dated April 30, 2010 and bears interest at 3 percent per annum. The loan agreement was amended on June 1, 2010.
Instrument Constituting Warrants to Subscribe for Shares in IAHGames among IAHGames, Management Capital International Limited and Mr. Ong Toon Wan, dated April 30, 2010 and Deed of Amendment, dated May 20, 2010
On April 30, 2010, IAHGames, Management Capital International Limited and Mr. Ong Toon Wan entered into an Instrument Constituting Warrants to Subscribe for Shares in IAHGames, under which IAHGames has agreed to create and issue to Blizzard warrants to subscribe for an aggregate of 15 percent of IAHGames’ ordinary shares, on a fully diluted basis, which is subject to certain adjustments in accordance with the warrant agreement. The subscription rights may be exercised by the warrant holder conditional upon the occurrence of certain circumstances. The warrants expire upon the expiration of certain game licenses or the date on which IAHGames’ shares commence trading on any domestic or international stock exchange. According to the terms and conditions of the warrant agreement, if IAHGames subsequently issues additional shares, IAHGames shall be obligated to issue additional warrants to the warrant holder necessary for the holder to maintain its 15 percent share ownership on a fully diluted basis, regardless of whether such additional shares are issued at, above, or below the market price. IAHGames shall be entitled to offer to purchase, and thereafter purchase, the Blizzard’s warrants by tender or by private treaty.
IAHGames also undertakes whilst any Blizzard’s warrants are outstanding, except with prior written consent by Blizzard: among other things, a) it will not purchase or redeem any preference shares; b) it will not permit or carry out any change of control or any sale or otherwise disposal of all or a material portion of IAHGames’ assets; c) it will not modify the rights attached to any shares in any way which could reasonably be expected to have an adverse effect on the rights of Blizzard; and d) it will not issue to any person any preference shares with a right of conversion or redemption unless such person executes a Deed of Undertaking in favour of Blizzard.
109
Security over Shares Agreement between IAHGames and Blizzard, dated April 30, 2010
On April 30, 2010, IAHGames and Blizzard entered into a security over shares agreement, under which IAHGames agreed to pledge Monsoon’s shares held by it to Blizzard. The security shall be enforceable on and at any time after the failure of IAHGames to comply with its obligations under the relevant Monsoon management agreement. After the security created by this agreement has become enforceable, Blizzard shall be entitled, without prior notice to IAHGames or prior authorization from any court, to sell or otherwise dispose of all or any part of Monsoon’s shares held by IAHGames and all dividends, interest and other monies payable in respect of such shares.
Deed of Undertaking between GigaMedia Asia Pacific Limited and Blizzard, dated April 30, 2010
On April 30, 2010, GigaMedia Asia Pacific Limited and Blizzard entered into a deed of undertaking under which GigaMedia Asia Pacific Limited, as Class B shareholder of IAHGames, undertakes that during the license term: a) it shall not exercise any right which would require IAHGames to redeem in cash the Class B shares; b) it acknowledges that, upon a conversion of the Class B shares of IAHGames into ordinary shares, it has no entitlement to and will not claim against IAHGames any dividend in respect of the Class B shares of IAHGames, the redemption price for the Class B shares of IAHGames or any accrued interest in connection with the same; and c) it shall procure that any transferee of the Class B shares held by it on the date thereof shall give an undertaking in favour of Blizzard substantially in the form hereof as a condition of any transfer of such Class B shares.
Transaction with BetClic
Stock and Asset Purchase Agreement among BetClic, GigaMedia Limited, UIM and the Other Parties Named Thereto, dated December 15, 2009 and Amendment No.1 to Stock and Asset Purchase Agreement, dated March 31, 2010
On December 15, 2009, we entered into a stock and asset purchase agreement with BetClic, UIM and the other parties named in the agreement, under which we agreed to sell 60 percent interest in our online game software business to BetClic, a leading European sports betting and online gaming group. The strategic alliance with BetClic was structured as a stock and asset sale to a newly-formed French entity, Everest Gaming, in which we received a 40 percent stake. The sale was completed on April 8, 2010.
As part of and as a condition to the completion of the transaction, we purchased the shares of our then-major licensee, UIM, all of the material assets of which were sold to Everest Gaming as part of the transaction. We had historically consolidated UIM’s assets, liabilities and results of operations in our consolidated financial statements in accordance with the FASB Accounting Standards Codification, although we did not historically hold any equity ownership in UIM. UIM was an online entertainment operator that provided online gaming services, including online casinos and virtual poker rooms. We sometimes refer to our online gaming software business and UIM’s business as the “Everest Business”. For its 60 percent stake in the Everest Business, BetClic made an initial cash payment of approximately US$100 million, which will be followed by a final earn-out payment in 2012 to be determined by reference to the fair-market value of Everest Gaming in May 2012.
We hold the remaining 40 percent of Everest Gaming with a put option to sell all or part of our share to BetClic. The put option is exercisable in 2013, 2014 and 2015. BetClic holds a call option on any remaining Everest Gaming interests held by us which it may exercise in 2015 and 2016. For both our put option and BetClic’s call option, the price paid will be determined based upon the fair market value of Everest Gaming as of December 31 of the prior year, as determined by mutual agreement between the parties or, failing that, an appraisal process.
We have retained liability for certain potential tax claims, if any, and existing liabilities of the Everest Business, and also has agreed to provide a limited indemnity with respect to breaches of representations and warranties (which generally survive until December 31, 2011) and covenants contained in the purchase agreement.
110
While BetClic will generally control the day-to-day operations of Everest Gaming, so long as we at least hold 20 percent of Everest Gaming’s share capital, we will have approval rights over certain material actions of Everest Gaming, including certain issuances of securities of Everest Gaming, certain acquisitions and dispositions of assets and material changes to the principal business of Everest Gaming. In addition, so long as we hold at least 10 percent of Everest Gaming’s share capital, we will have representation on the board of directors of Everest Gaming. BetClic has agreed that it will not acquire other online poker businesses without first giving Everest Gaming the opportunity to acquire such business, at our discretion, so long as we hold at least 20 percent of Everest Gaming’s share capital.
Contractual Arrangements among T2 Technology and T2 Entertainment, T2 Advertisement and Jinyou
See Item 4, “Information on the Company — C. Organizational Structure” in this annual report.
Contractual Arrangements in connection with Shanghai JIDI
See Item 4, “Information on the Company — C. Organizational Structure” in this annual report.
Other Material Contracts
Other material contracts are incorporated by reference to our annual reports for the year ended December 31, 2007, for the year ended December 31, 2008 and for the year ended December 31, 2009 on Form 20-F (File No. 000-30540) and for additional information on our material contracts, see Item 7, “Major Shareholders and Related Party Transactions — B. Related Party Transactions” in this annual report.
D. Exchange Controls
There are no limitations imposed by Singapore law or by our Articles of Association on the right of a non-resident or foreign owner to hold or vote the Shares.
As we have disclosed in Item 3, “Key Information — D. Risk Factors — Risk Related to Doing Business in Greater China — Changes in foreign exchange and foreign investment regulations and limitations on dividend payment in the PRC may affect our ability to invest in China and the ability of our PRC subsidiaries to pay dividends and service debts” in this annual report, Renminbi is not a freely convertible currency at present. Under the current PRC regulations, conversion of Renminbi is permitted in China for routine current-account foreign exchange transactions, including trade and service related foreign exchange transactions, payment of dividends and service of foreign debts. Conversion of Renminbi for most capital-account items, such as direct investments, investments in PRC securities markets and repatriation of investments, however, is still subject to the approval of SAFE or its local competent branches.
Pursuant to the above-mentioned administrative rules, foreign-invested enterprises, such as our PRC subsidiaries, may buy, sell and/or remit foreign currencies for current-account transactions at banks in the PRC with authorization to conduct foreign exchange business by complying with certain procedural requirements, such as presentment of valid commercial documents. For capital-account transactions involving foreign direct investment, foreign debts and outbound investment in securities and derivatives, approval from SAFE or its local competent branches is a pre-condition. Capital investments by foreign-invested enterprises outside the PRC are subject to limitations and requirements in the PRC, such as prior approvals from the MOFCOM, SAFE and National Development and Reform Commission of the PRC.
E. Taxation
Singapore Tax Considerations
Taxation of Dividends Received by Singapore Resident Shareholders
Dividends paid by us would be taxable in Singapore if they are received in Singapore or if they are considered, in the hands of a particular shareholder, to be derived in Singapore (for example if they constitute the income of a trade or business carried out in Singapore).
111
Under the Singapore-Taiwan Tax Treaty, if a dividend is paid by a company which is tax resident in Taiwan to a person who is tax resident in Singapore, the tax on the dividend shall not exceed an amount which, together with the corporate income tax on the profits of the company paying the dividends, constitutes 40 percent of that part of the taxable income out of which the dividends are paid. The term “corporate income tax payable” shall be deemed to include the corporate income tax that would have been paid but for the reduction or exemption under the laws designed to promote economic development.
If our shareholder is a company receiving or deriving such dividends is tax resident in Singapore, he would be entitled to foreign tax credits under the Singapore-Taiwan Tax Treaty and, if the recipient is a company which owns not less than 25 percent of our Shares, the tax credit will include underlying tax paid by us.
Singapore foreign tax credit is limited to the lower of the foreign tax suffered and the Singapore tax payable on the net foreign income (after attributable and allowable expenses). Certain foreign dividends received by a Singapore resident person on or after June 1, 2003 will, however, be exempt from tax. The main conditions to be satisfied for such exemption are that:
| | • | | the dividends are received from a jurisdiction with a maximum tax rate on the trade or business income of a company of at least 15 percent; and |
| |
| | • | | the dividends themselves, or the income from which they are paid, have been subject to tax in the foreign jurisdiction or have been exempted from tax under an incentive granted for substantive business activities. |
It was announced in the Singapore Budget Statement 2011 that effective from year of assessment 2012, a new Foreign Tax Credit Pooling System would be introduced to enable the amount of foreign tax credit allowable to be computed on a pooled basis, rather than by each stream of foreign-sourced income separately. This is subject to certain conditions which are to be released by the Inland Revenue Authority of Singapore by end June 2011.
The normal tax rate for corporate profits in Singapore is 17 percent for the year of assessment 2011 (i.e., for the income earned in the financial year or other basis period ended 2010). Resident individuals are subject to tax at progressive rates.
If our shareholders are corporations, our shareholders will be regarded as being tax resident in Singapore if the control and management of our shareholders’ business is exercised in Singapore. For example, if our shareholders’ board of directors meets and conducts the business of our shareholders’ company in Singapore, our shareholders will be regarded as tax resident in Singapore. If our shareholders are individuals, our shareholders will be regarded as being tax resident in Singapore in a year of assessment if, in the preceding year, our shareholders were physically present in Singapore or exercised an employment in Singapore (other than as directors of a company) for 183 days or more, or if our shareholders had resided in Singapore.
All foreign-sourced income received in Singapore (except for income received through a partnership in Singapore) on or after January 1, 2004 by tax resident individuals will be exempt from tax.
Gains on Disposal of Shares
Singapore does not impose tax on capital gains. However, there are no specific laws or regulations which deal with the characterization of capital gains and hence, gains on disposal of shares may be construed to be of an income nature and subject to Singapore income tax if they arise from or are otherwise connected with the activities which the Inland Revenue Authority of Singapore regards as the carrying on of a trade or business in Singapore. You should consult your tax advisors concerning the Singapore tax consequences of acquiring, owning, selling or otherwise disposing the Shares.
Stamp Duty
There is no stamp duty payable in respect of the issuance and holding of our Shares. Where existing shares are acquired in Singapore, stamp duty is payable on the instrument of transfer of the shares at the rate of S$2.00 for every S$1,000 or any part thereof, of the consideration for or market value of the shares, whichever is higher. The stamp duty is borne by the purchaser unless there is an agreement to the contrary. Where an instrument is executed outside Singapore, or no instrument of transfer is executed, no stamp duty is payable on the acquisition of existing shares. However, stamp duty would be payable if an instrument of transfer which is executed outside Singapore is received in Singapore.
112
Under Singapore law, our directors may not register a transfer of our Shares unless the instrument of transfer has been duly stamped.
Singapore Estate Duty
Estate duty has been abolished for deaths occurring on or after February 15, 2008.
You should consult your tax advisors regarding the non-Singapore estate duty consequences of your ownership of our Shares.
Goods and Services Tax (“GST”)
The sale of our Shares by an investor belonging in Singapore to another person belonging in Singapore is an exempt supply not subject to GST. Any GST directly or indirectly incurred by the investor in respect of this exempt supply would be a cost to the investor.
Where our Shares are sold by a GST-registered investor to a person belonging outside Singapore and that person is outside Singapore when the sale is executed, the sale should generally be considered as a taxable supply subject to GST at zero-rate. Any GST incurred by the investor in the making of such a supply, if the same is a supply in the course of or furtherance of a business may be fully recoverable from the Comptroller of GST.
Services such as brokerage, handling and clearing services rendered by a GST-registered person to an investor belonging in Singapore in connection with the investor’s purchase, sale or holding of our Shares will be subject to GST at the rate of 7 percent. Similar services rendered to an investor belonging outside Singapore should generally be subject to GST at zero-rate.
U.S. Tax Considerations
U.S. Federal Income Tax Considerations for U.S. Holders
The following is a discussion of certain U.S. federal income tax considerations for investors in Shares that are U.S. persons (as defined below) that hold the Shares as a capital asset. This discussion is based on U.S. federal income tax law as in effect on the date hereof, which is subject to differing interpretations or change, possibly on a retroactive basis. This discussion is for general information only and does not address all of the tax considerations that may be relevant to you in light of your particular circumstances or if you are subject to special treatment under the U.S. federal income tax laws, including if you are a:
| | • | | financial institution or insurance company; |
113
| | • | | person holding Shares as part of a straddle, hedge, conversion or other integrated investment; |
| | • | | a person owning, actually or constructively, 10 percent or more of the combined voting power of all classes of our stock; or |
| | • | | a person whose “functional currency” is not the U.S. dollar. |
This discussion does not address any U.S. state, local or foreign tax, or any U.S. federal estate, gift or alternative minimum tax consideration of a holder of our Shares.
As used in this discussion, the term “U.S. person” means a:
| | • | | individual who is a citizen or resident of the United States; |
| | • | | corporation, or other entity treated as a corporation, created or organized under the laws of the United States or any political subdivision thereof; |
| | • | | estate, the income of which is subject to U.S. federal income taxation regardless of its source; or |
| | • | | trust if (1) it is subject to the primary supervision of a court within the United States and one or more U.S. persons have the authority to control all substantial decisions of the trust, or (2) it has otherwise elected to be treated as a U.S. person under the Internal Revenue Code. |
If a partnership (including any entity treated as a partnership for U.S. federal income tax purposes) holds Shares, the tax treatment of a partner in such partnership will generally depend upon the status of the partner and the activities of the partnership. If you are a partner of a partnership holding Shares, you are urged to consult your tax advisors as to the particular U.S. federal income tax consequences as applicable to you.
You are urged to consult your tax advisor concerning the particular U.S. federal, state, local and foreign income and other tax considerations regarding the ownership and disposition of the Shares, including the application of the passive foreign investment company rules discussed below. Investors should carefully review the discussion below under “—Passive Foreign Investment Company Rules.”
Passive Foreign Investment Company
Due to the price of our Shares during 2010 and the composition of our assets (in particular, the retention of a large amount of cash and our significant portfolio of investment securities), we believe that is likely that we were classified as a passive foreign investment company (“PFIC”), for United States federal income tax purposes, for the taxable year ended December 31, 2010 and we will likely be a PFIC for our current taxable year ending December 31, 2011 unless our share value increases and/or we invest a substantial amount of the cash and other passive assets we hold in assets that produce or are held for the production of non-passive income. In general, we will be classified as a PFIC for any taxable year if either (i) at least 75 percent of its gross income is passive income or (ii) at least 50 percent of the value (determined on the basis of a quarterly average) of its assets produce or are held for the production of passive income. For this purpose, cash and other liquid assets are generally classified as passive and goodwill and other unbooked intangibles associated with active business activities may generally be classified as non-passive. We will be treated as owning a proportionate share of the assets and earning a proportionate share of the income of any other corporation in which we own, directly or indirectly, more than 25 percent (by value) of the stock.
114
If we are a PFIC for any year during which you hold Shares, the PFIC tax rules discussed below generally will apply in future years even if we cease to be a PFIC in subsequent years. The 15 percent maximum rate on our dividends (discussed below) would not apply if we are or become classified as a PFIC.
If we are classified as a PFIC for any taxable year during which you hold Shares, and unless you make a mark-to-market election (as described below), you will generally be subject to special tax rules that have a penalizing effect, regardless of whether we remain a PFIC, on (i) any excess distribution that we make to you (which generally means any distribution received by you in a taxable year that is greater than 125 percent of the average annual distributions received by you in the three preceding taxable years or your holding period for the Shares, if shorter), and (ii) any gain realized on the sale or other disposition, including a pledge, of our Shares. Under these PFIC rules the:
• excess distribution or gain would be allocated ratably over your holding period for the Shares;
• amount allocated to the current taxable year and any taxable year prior to the first taxable year in which we are classified as a PFIC (a “pre-PFIC year”) would be taxable as ordinary income;
• amount allocated to each prior taxable year, other than the current taxable year or a pre-PFIC year, would be subject to tax at the highest tax rate in effect applicable to you for that year; and
• interest charge generally applicable to underpayments of tax would be imposed on the tax attributable to each prior taxable year, other than the current taxable year or a pre-PFIC year.
As an alternative to the foregoing rules, a holder of “marketable stock” in a PFIC may make a mark-to-market election, provided that the Shares are “regularly traded” on a “qualified exchange”. Under applicable Treasury regulations, a “qualified exchange” includes a national securities exchange that is registered with the SEC or the national market system established under the Securities and Exchange Act of 1934 (i.e., the NASDAQ Global Market). Although we believe that, based on the current level of trading activity of our Shares on the NASDAQ Global Market, the Shares should qualify as being regularly traded, on a qualified exchange, no assurance can be given that the Shares will continue to be readily tradable on an established securities market in the United States. If you make this election, you will generally (i) include as income for each taxable year the excess, if any, of the fair market value of your Shares at the end of the taxable year over the adjusted tax basis of the Shares and (ii) deduct as a loss the excess, if any, of the adjusted tax basis of the Shares over the fair market value of the Shares at the end of the taxable year, but only to the extent of the amount previously included in income as a result of the mark-to-market election. Your adjusted tax basis in the Shares would be adjusted to reflect any income or loss resulting from the mark-to-market election. If you make a mark-to-market election in respect of a corporation classified as a PFIC and such corporation ceases to be classified as a PFIC, you will generally not be required to take into account the gain or loss described above during any period that such corporation is not classified as a PFIC.
The “QEF Election,” which serves as a further alternative to the foregoing rules, is not available.
Each U.S. person who holds a PFIC is required to file an annual report containing such information as the U.S. Treasury may require. In addition, if a U.S. person holds Shares in any year in which we are a PFIC, such holder will be required to file Internal Revenue Service Form 8621 regarding distributions received on the Shares, any gain realized on the disposition of the Shares, and any “reportable election.”
115
Taxation of Dividends
Except as discussed above with respect to the passive foreign investment company tax rules, the amount of distributions you receive on your Shares (other than certain pro rata distributions of our Shares or rights to subscribe for Shares) will generally be treated as dividend income to you if the distributions are made from our current and accumulated earnings and profits as calculated according to U.S. federal income tax principles. Because we do not intend to determine our earnings and profits on the basis of U.S. federal income tax principles, any distribution paid will generally be reputed as a “dividend” for U.S. federal income tax purposes. You will include such dividends in your gross income as ordinary income on the day you actually or constructively receive them. The amount of any distribution of property other than cash will be the fair market value of such property on the date it is distributed. For dividends received in taxable years beginning before January 1, 2013, a non-corporate recipient of dividend income will generally be subject to tax on dividend income from a “qualified foreign corporation” at a maximum U.S. federal tax rate of 15 percent rather than the marginal tax rates generally applicable to ordinary income, so long as certain holding period requirements are met. A non-U.S. corporation generally will be considered to be a qualified foreign corporation (i) if it is eligible for the benefits of a comprehensive tax treaty with the United States which the Secretary of Treasury of the United States determines is satisfactory for purposes of this provision and which includes an exchange of information program or with respect to any dividend it pays on stock which is readily tradable on an established securities market in the United States and (ii) the corporation is not a PFIC and is not treated as a PFIC with respect to you for the taxable year in which the dividend was paid and the preceding taxable year. There is currently no tax treaty in effect between the United States and Singapore. On a qualified exchange, no assurance can be given that the Shares will continue to be readily tradable on an established securities market in the United States. U.S. corporate holders will generally not be eligible for the dividends received deduction for distributions to domestic corporations with regard to distributions on Shares.
The amount of any distribution paid in a currency other than the U.S. dollar will equal the U.S. dollar value of the foreign currency you receive, calculated by reference to the exchange rate in effect on the date you actually or constructively receive the distribution, regardless of whether the foreign currency is actually converted into U.S. dollars. If you do not convert the foreign currency you receive as a dividend on the date of receipt, you will have a basis in such foreign currency equal to its U.S. dollar value on the date of receipt. Any gain or loss you realize when you subsequently sell or otherwise dispose of such foreign currency generally will be ordinary income or loss from sources within the United States for foreign tax credit limitation purposes.
Holders may generally elect to claim a credit against their U.S. federal income tax liability for Singapore tax withheld from dividends received with regard to the Shares. The rules relating to the determination of the foreign tax credit are complex, and prospective purchasers are urged to consult their personal tax advisors to determine whether and to what extent they would be entitled to such credit. Holders that do not elect or are not permitted to claim foreign tax credits may instead claim a deduction for Singapore tax withheld, but only for a year in which such holder elects to do so for all creditable foreign income taxes. You will not be eligible for a foreign tax credit for the underlying Singapore taxes on profits paid by us with respect to such dividends.
Sale or other disposition of Shares.Except as discussed below with respect to the passive foreign investment company tax rules, a holder generally will recognize capital gain or loss for U.S. federal income tax purposes upon a sale or other disposition of our Shares in an amount equal to the difference between the amount realized from the sale or disposition and the holder’s adjusted tax basis in the Shares. Such gain or loss generally will be long-term (taxable at a reduced rate for individuals) if, on the date of sale or disposition, the Shares were held by the holder for more than one year and will generally be treated as gain or loss from U.S. sources for foreign tax credit purposes. The deductibility of a capital loss may be subject to limitations.
Backup Withholding and Information Reporting
The United States tax compliance rules impose new reporting requirements on certain U.S. investors in connection with holding shares of a foreign company, including our Shares, either directly or through a “foreign financial institution”. This new legislation also imposes penalties if a holder is required to submit such information to the Internal Revenue Service and fails to do so. In addition, U.S. individual investors may be subject to information reporting to the Internal Revenue Service with respect to dividends on and proceeds from the sale or other disposition of our Shares. Dividend payments with respect to our Shares and proceeds from the sale or other disposition of our Shares are not generally subject to U.S. backup withholding (provided that certain certification requirements are satisfied). U.S. individual investors should consult their tax advisors regarding the application of the United States information reporting and backup rules to their particular circumstances.
F. Dividends and Paying Agents
Not applicable.
G. Statements by Experts
Not applicable.
116
H. Documents on Display
The SEC allows us to “incorporate by reference” the information we file with the SEC. This means that we can disclose important information to you by referring you to another document filed separately with the SEC. The information incorporated by reference in this annual report is considered to be part of this annual report. We therefore incorporate by reference in Item 19 of this annual report certain exhibits, which we filed with the SEC in prior filings. You may read and copy this annual report, including the exhibits incorporated by reference in this annual report, at the public reference room maintained by the SEC at 100 F Street, N.E., Washington, D.C. 20549. You can request copies of these documents upon payment of a duplicating fee, by writing to the SEC. Please call the SEC at 1-800-SEC-0330 for further information on the operation of the public reference rooms. Additional information may also be obtained over the Internet at the SEC’s website at www.sec.gov.
You may also request a copy of our SEC filings, at no cost, upon written request to our investor relations department at 8th Floor, 207 Tiding Boulevard, Section 2, Taipei 114, Taiwan, R.O.C., or by e-mail to: Brad.miller@GigaMedia.com.tw. A copy of each report submitted in accordance with applicable U.S. law is also available for public review at our principal executive offices.
As a foreign private issuer, we are exempt under the Securities Exchange Act from, among other things, the rules prescribing the furnishing and content of proxy statements, and our executive officers, directors and principal shareholders are exempt from the reporting and short-swing profit recovery provisions contained in Section 16 of the Securities Exchange Act. In addition, we will not be required under the Securities Exchange Act to file periodic reports and financial statements with the SEC as frequently or as promptly as U.S. companies whose securities are registered under the Securities Exchange Act.
I. Subsidiary Information
Not applicable.
ITEM 11. QUANTITATIVE AND QUALITATIVE DISCLOSURES ABOUT MARKET RISK
Market risk is the risk of loss related to adverse changes in market prices, including interest rates and foreign exchange rates, of financial instruments. We are exposed to various types of market risks in the normal course of business, including changes in interest rates and foreign currency exchange rates.
Foreign Currency Risk
Our subsidiaries conduct most of their business transactions in their own measurement currencies; therefore the foreign currency risks derived from operations are not significant. However, we hold some assets or liabilities in foreign currencies other than measurement currency and the value of these assets and liabilities are subject to foreign currency risks resulting from fluctuations in exchange rates between the foreign-denominated currency and the measurement currency. We have not used hedging transactions to reduce our exposure to exchange rate fluctuations; however, we may choose to do so in the future. For more information on foreign currency translations for our financial reporting purposes, see note 1(b) to our audited consolidated financial statements beginning on page F-1 in this annual report.
117
As of December 31, 2010, we had bank deposits of approximately US$1.8 million denominated in foreign currencies other than measurement currencies of the entities holding such assets. These assets are subject to foreign currency exchange risk. We recorded a realized foreign exchange gain of approximately US$86 thousand and unrealized foreign exchange loss of approximately US$691 thousand in the year ended December 31, 2010.
As of December 31, 2010, we had available-for-sale marketable securities and investments of approximately US$36.4 million, which denominated in foreign currencies other than measurement currencies of the entity holding such assets. Future fluctuation of the exchange rates could impact the periodic impairment assessment on other-than-temporary loss of these assets.
Based on the sensitivity analysis of our exposure to foreign currency exchange rate risk related our bank deposits and available-for-sale marketable securities which were denominated in a foreign currency other than functional currencies of the entities holding such assets, a hypothetical 10 percent change in the exchange rate between the U.S. dollar and the underlying currencies of those instruments subject to foreign currency exchange rate risk would result in a change of approximately 1.5 percent in our total equity as of December 31, 2010.
Interest Rate Risk
Our exposure to interest rates relates primarily to our short-term loans from various banks. The variations in fair value of the marketable securities that we owned as of December 31, 2010 do not have direct relationship with interest rates changes. As of December 31, 2010, we had no investment in fixed-income or money market investment funds. Declines in interest rates over time will, however, reduce our interest income from our bank deposits. Increases in interest rates of the loans will increase our interest expenses. As of December 31, 2010, we had approximately US$12.4 million of short-term loans, with a weighted average interest rate of approximately 1.84 percent. Based on our sensitivity analysis with respect to our short-term loans, we have no significant exposure to fluctuations in interest rates. We have not entered into any interest rate swaps, caps or hedge contracts to modify our exposure to interest rate fluctuations.
We did not include a quantitative tabular disclosure regarding the foreign currency risk and the interest rate risk. As noted above, we believe that the magnitude of selected hypothetical changes to such market risks on the consolidated financial statements is not significant. However, we cannot assure you that we will not be affected by these risks in the future.
Other Market Risks
We are also exposed to other market risks, which are mainly derived from our investments. Changes in the stock price, performance or net asset value of the companies that we invested and investment funds might have significant impact on our financial positions or operating results.
ITEM 12. DESCRIPTION OF SECURITIES OTHER THAN EQUITY SECURITIES
Not applicable.
PART II
ITEM 13. DEFAULTS, DIVIDEND ARREARAGES AND DELINQUENCIES
None.
118
ITEM 14. MATERIAL MODIFICATIONS TO THE RIGHTS OF SECURITY HOLDERS AND USE OF PROCEEDS
A. Material Modification to the Instruments Defining the Rights of Security Holders
None.
B. Material Modification to the Rights of Registered Securities by Issuing or Modifying or any Other Class of Securities
None.
C. Withdrawal or Substitution of a Material Amount of the Assets Securing any Registered Securities
Not applicable.
D. Change of Trustees or Paying Agents for any Registered Securities
None.
E. Use of Proceeds
Not applicable.
119
ITEM 15. CONTROLS AND PROCEDURES
Disclosure Controls and Procedures
Our management, with the participation of our chief executive officer and our chief financial officer, has evaluated the effectiveness of our disclosure controls and procedures (as defined by Rules 13a-15(e) and 15d-15(e) under the Securities Exchange Act) as of December 31, 2010. There are inherent limitations to the effectiveness of any system of disclosure controls and procedures, including the possibility of human error and the circumvention or overriding of the controls and procedures. Accordingly, in designing and evaluating the disclosure controls and procedures, management recognized that any controls and procedures, no matter how well designed and operated, can only provide reasonable, rather than absolute, assurance of achieving the desired control objectives, and management was required to apply its judgment in evaluating the cost-benefit relationship of possible controls and procedures.
Based upon that evaluation, and taking into account the foregoing, our chief executive officer and chief financial officer have concluded that, as of December 31, 2010, our disclosure controls and procedures were not effective at a reasonable assurance level in that they failed to timely detect the circumvention of our internal controls and procedures which resulted in our inability to exercise sufficient control over a majority of T2CN’s assets and its financial reporting process. This material weakness is discussed further below in Management’s Annual Report on Internal Control Over Financial Reporting.
Management’s Annual Report on Internal Control Over Financial Reporting
Management is responsible for establishing and maintaining adequate internal control over financial reporting (as defined by Rules 13a-15(f) and 15d-15(f) under the Exchange Act). Our internal control over financial reporting is designed to provide reasonable assurance regarding the reliability of financial reporting and the preparation of financial statements for external purposes in accordance with accounting principles generally accepted in the United States of America (“US GAAP”). Our internal control over financial reporting includes those policies and procedures that (i) pertain to the maintenance of records that, in reasonable detail, accurately and fairly reflect the transactions and dispositions of our assets; (ii) provide reasonable assurance that transactions are recorded as necessary to permit preparation of financial statements in accordance with US GAAP and that receipts and expenditures are being made only in accordance with authorizations of our management and directors and (iii) provide reasonable assurance regarding prevention or timely detection of unauthorized acquisition, use or disposition of our assets that could have a material effect on the financial statements.
Because of its inherent limitations, internal control over financial reporting may not prevent or detect all misstatements. Also, projections of any evaluation of the effectiveness of internal control to future periods are subject to the risk that controls may become inadequate because of changes in conditions, and that the degree of compliance with the policies or procedures may deteriorate.
Management assessed the effectiveness of the Company’s internal control over financial reporting as of December 31, 2010. We excluded from our assessment one business for which we acquired a controlling financial interest in 2010 because it was not possible to conduct an assessment of this business’ internal control over financial reporting between the consummation date and the date of management’s assessment. We have excluded IAHGames from our assessment of internal control over financial reporting as of December 31, 2010 because we acquired a controlling financial interest in the assets underlying the business of IAHGames. We began to consolidate this business on July 1, 2010, which qualified under current SEC interpretive guidance for exclusion from our assessment of internal control over financial reporting. IAHGames’s total assets, total revenues, and net income (loss) represent approximately US$42.8 million, US$5.9 million and (US$16.0 million), respectively, of our total consolidated assets, revenues and net income in 2010. Accordingly, our conclusions regarding the effectiveness of our disclosure controls and procedures and internal control over financial reporting do not extend to the disclosure controls and procedures and internal control over financial reporting of IAHGames.
In making this assessment, management used the criteria set forth by the Committee of Sponsoring Organizations of the Treadway Commission (COSO) in Internal Control-Integrated Framework. Based on our assessment using those criteria, our management has concluded that, for the reasons discussed below, our internal control over financial reporting as of December 31, 2010 was not effective.
A material weakness is a significant deficiency, or combination of significant deficiencies, in internal control over financial reporting, such that there is a reasonable possibility that a material misstatement of the annual or interim financial statements will not be prevented or detected on a timely basis. A significant deficiency is a deficiency, or a combination of deficiencies, in internal control over financial reporting that is less severe than a material weakness, yet important enough to merit attention by those responsible for oversight of our financial reporting.
120
We identified a material weakness that related to our inability to exercise sufficient control over a majority of T2CN’s assets and its financial reporting process. Since early July 2010, there have been disputes between the Company and the former chief executive officer of T2CN over his future role in the Company and T2CN. Due to these disputes, the former chief executive officer of T2CN effectively usurped control over and access to the accounts of the T2CN Operating Entities and has taken actions or directed subordinates to take actions that circumvented the existing internal control system. As a result, we determined that there were inadequate controls in place to address risks related to usurpation of established policies, procedures and control systems related to T2CN which resulted in our inability to exercise sufficient control over a majority of T2CN’s assets and its financial reporting process, which eventually resulted in a significant loss to the Company.
Our management believes that our loss of and continuing inability to maintain sufficient control over a majority of T2CN’s assets and its financial reporting process has been mainly caused by the actions of the former chief executive officer of T2CN as described above. As a result of this loss of control, in the fourth quarter of 2010, we have recorded a full impairment of $22.2 million against our remaining investment in T2CN and we have recognized a full provision against the loan of $1.4 million due from T2CN.
Remediation of Material Weaknesses
The Company began remediating these deficiencies in the second half year of 2010, and has performed and continues to take a series of remedial measures, including, among other things (1) establishment of a dedicated team under the supervision of our audit committee to reassess and strengthen the procedures for identifying the appropriate controls over the PRC business units; including a) the process of the appointment of management to the PRC business units, b) the financial reporting process used by the PRC business units, c) the treasury procedures utilized by the PRC business units, d) strengthening controls over the utilization and custody of the company chops and legal representative chops of the PRC business units, and e) strengthening the contract review and approval procedures for the PRC business units, (2) strengthening the provisions of employment contracts and the employee handbook which can effectively govern our PRC employees, (3) the establishment of policies and procedures relating to monitoring controls over the PRC business units, and (4) strengthening of information and communication and logical access of financial data between the PRC business units and the Company’s management.
In addition, in connection with preparation of the 2010 annual consolidated financial statements included in this Form 20-F, we have undertaken the additional measures described above to provide reasonable assurance regarding the reliability of financial reporting and the preparation of our 2010 annual consolidated financial statements and to ensure that material information relating to the Company and its consolidated subsidiaries was made known to management and included in this Form 20-F.
Our management does not believe that the material weakness described above has caused our consolidated financial statements as of and for the year ended December 31, 2010 to contain a material misstatement, as management completely impaired both the Company’s investment in and advances to T2CN during the fourth quarter of 2010 in order to properly reflect the Company’s financial position as of December 31, 2010.
Attestation Report of the Independent Registered Public Accounting Firm
The effectiveness of our internal control over financial reporting as of December 31, 2010 has been audited by GHP Horwath, P.C., our independent registered public accounting firm, who has also audited the consolidated financial statements included in this annual report on Form 20-F and, as part of the audit, has issued a report, which appears on pages F-1 and F-2 of this annual report, on the effectiveness of our internal control over financial reporting.
Changes in Internal Control Over Financial Reporting
Certain of the changes described in “Remediation of Material Weaknesses” occurred during the second half year of 2010. Other than as described above, during the year ended December 31, 2010, there were not any other changes in our internal control over financial reporting that have materially affected, or are reasonably likely to materially affect, our internal control over financial reporting.
121
ITEM 16. Reserved
ITEM 16A. AUDIT COMMITTEE FINANCIAL EXPERT
Our board of directors has determined that Mr. Michael Y. J. Ding, an independent director and a member of our audit committee, is an audit committee financial expert.
ITEM 16B. CODE OF ETHICS
We have adopted a code of ethics, as defined in Item 16B of Form 20-F. Our code of ethics applies to our chief executive officer, chief financial officer and persons performing similar functions, as well as to our directors, other officers, employees and consultants. The code of ethics was amended on December 19, 2005, May 10, 2006 and February 13, 2009 in order to conform certain provisions in it with our newly adopted anti-fraud policy. The code of ethics was also amended on April 30, 2010 to incorporate non-competition and non-solicitation provisions. The full text of our code of ethics is available on our website, www.gigamedia.com If we further amend any provisions of our code of ethics that apply to our chief executive officer, chief financial officer or persons performing similar functions, or if we grant any waiver of such provisions, we will disclose such amendment or waiver on our website at the same address. We will also provide any person without charge a copy of our code of ethics upon written request to our investor relations department at 8th Floor, No. 207 Tiding Boulevard, Section 2, Taipei 114, Taiwan, R.O.C., or by e-mail to: Brad.miller@GigaMedia.com.
On December 19, 2005, our board of directors adopted an anti-fraud policy for the purpose of preventing fraud schemes, including fraudulent financial reporting misappropriation of assets, any fraud committed by senior management, and information technology fraud. According to our anti-fraud policy, our audit committee is responsible for monitoring the implementation of our anti-fraud policy and procedures, and an anti-fraud taskforce is assigned by our audit committee to be responsible for the anti-fraud hotline management, risk assessment, complaint investigation and resolution, and reporting to our chief executive officer, chief financial officer and audit committee.
On May 10, 2006, our audit committee adopted a whistleblower program pursuant to our anti-fraud policy. The whistleblower program enables all employees to know how and when to use the whistleblower hotline and communicate or report, on a confidential or anonymous basis, without fear of retribution, concerns related to wrongdoings or violations, and ensures that all reported incidents are properly investigated.
On February 13, 2009, the code of ethics was amended to include the anti-fraud taskforce’s reporting obligation to our chief executive officer, chief financial officer, chief operating officer and audit committee after reviewing our anti-fraud policy, guidelines on fraud risk assessment and whistleblower program annually.
On April 30, 2010, our board of directors adopted a non-competition provision under which all of our employees, consultants, officers and directors may not participate, invest, license, employ or being employed, or cooperate with any company or entity engaged in a line of business which may be competitive with the business of the Company within three months after termination of their employment of the Company, except in cases where the local law or the contract states otherwise. The Company may take legal actions against such employees, consultants, officers or directors in the event that non-competition obligations are being violated. An amended non-solicitation provision was also adopted, under which all our employees, consultants, officers and directors may not, during their employment or within twelve months after termination of the employment, directly or indirectly, solicit, entice, or attempt to approach, solicit or entice any of the other employees of the Company or its affiliates to terminate the employment.
ITEM 16C. PRINCIPAL ACCOUNTANT FEES AND SERVICES
The following table summarizes the aggregate fees billed to us by GHP Horwath, P.C. for services performed relating to the fiscal years ended December 31, 2009 and 2010.
| | | | | | | | | |
| For the Years Ended December 31, | | 2009 | | | 2010 | |
| | | (in US$) | | | (in US$) | |
| Audit Fees | | | 994,207 | | | | 833,796 | |
| Audit-Related Fees | | | 12,746 | | | | 43,229 | |
| Tax Fees | | | 23,123 | | | | 18,676 | |
| All Other Fees | | | 0 | | | | 0 | |
122
A. Audit Fees
Audit fees consist of fees billed for the annual audit of our consolidated financial statements. Audit fees also include fees for services that are normally provided by the independent registered public accounting firm in connection with statutory and regulatory filings or engagements for 2009 and 2010.
B. Audit-Related Fees
Audit-related fees consist of fees billed for assurance and related services that are reasonably related to the performance of the audit or review of our consolidated financial statements, and are not reported under the paragraph captioned “Audit Fees” above. Audit related fees billed in 2009 and 2010 consisted of accounting consultations in connection with business acquisitions and dispositions.
C. Tax Fees
Tax fees include fees billed for tax compliance services, including the preparation of original and amended tax returns, and tax advisory services.
D. All Other Fees
All other fees are fees billed for services provided by the independent registered public accounting firm other than the services reported as audit fees, audit-related fees and tax fees above. No other fees were billed during 2009 and 2010.
E. Audit Committee Pre-Approval Policies and Procedures
In May 2005, we adopted our audit committee charter. Consistent with the SEC’s policies regarding auditor independence, our audit committee is directly responsible for the appointment, compensation, retention and oversight of the work of auditors engaged to provide us with audit, review or attest services. Our audit committee has sole discretion to review and pre-approve the appointment of auditors and to set their fees for the performance of audit and non-prohibited non-audit services in accordance with the Sarbanes-Oxley Act of 2002 and the SEC rules and regulations promulgated thereunder, subject to the appointment, replacement or removal from office of our independent public accountants as approved by our shareholders at our Annual General Meeting.
The appointment of our independent registered public accounting firm, GHP Horwath, P.C., as well as the scope of each audit, audit-related or non-prohibited, as well as any non-audit services provided pursuant to such appointment, and our auditors’ fees for all such services, were approved by our audit committee.
ITEM 16D. EXEMPTIONS FROM THE LISTING STANDARDS FOR AUDIT COMMITTEES
Not applicable.
ITEM 16E. PURCHASES OF EQUITY SECURITIES BY THE ISSUER AND AFFILIATED PURCHASERS
See ���Item 5. Operating and Financial Review and Prospects — A. Operating Results — Subsequent Events — Share Repurchase Program” in this annual report.
ITEM 16F. CHANGES IN REGISTRANT’S CERTIFYING ACCOUNTANTS
Not applicable.
123
ITEM 16G. CORPORATE GOVERNANCE
Summary of Significant Differences in Corporate Governance Practices
Our Shares are currently listed on the NASDAQ Stock Market and, for so long as our securities continue to be listed, we will remain subject to the rules and regulations established by NASDAQ as being applicable to listed companies. Under NASDAQ Rule 5615(a)(3), a foreign private issuer such as our Company may follow its home country practice in lieu of the requirements of the NASDAQ Rule 5600 Series, with certain exceptions, provided that it discloses each requirement that it does not follow and describes the home country practice followed in lieu of such requirements. In addition, NASDAQ has amended its Rule 4350(a)(1) to permit foreign private issuers to follow certain home country corporate governance practices without the need to seek an individual exemption from NASDAQ. However, a foreign private issuer must disclose in its annual report filed with the SEC each requirement it does not follow and the alternative home country practice it does follow.
We are incorporated under the laws of Singapore. We currently comply with the specifically mandated provisions of NASDAQ Rule 4350. We are currently exempt from the DRS eligibility provisions of NASDAQ Rule 4350(1) as we are not allowed to issue of non-certificated securities under Singapore law. See Item 9, “The Offer and Listing” in this annual report. We have elected to voluntarily comply with other requirements of NASDAQ Rule 4350 in all material aspects, notwithstanding that our home country does not mandate compliance; although we may in the future determine to cease voluntary compliance with those provisions of NASDAQ Rule 4350.
PART III
ITEM 17. FINANCIAL STATEMENTS
We have elected to provide financial statements pursuant to Item 18.
ITEM 18. FINANCIAL STATEMENTS
Our consolidated financial statements and the reports thereon by our independent registered public accounting firm listed below are attached hereto as follows:
| | | | | |
| | | Page | |
| | | | | |
| (a) Report of Independent Registered Public Accounting Firm | | | F-1–F-2 | |
| | | | | |
| (b) Consolidated Balance Sheets as of December 31, 2009 and 2010 | | | F-3–F-4 | |
| | | | | |
| (c) Consolidated Statements of Operations for the years ended December 31, 2008, 2009 and 2010 | | | F-5 | |
| | | | | |
| (d) Consolidated Statements of Comprehensive Income (Loss) for the years ended December 31, 2008, 2009 and 2010 | | | F-6 | |
| | | | | |
| (e) Consolidated Statements of Equity for the years ended December 31, 2008, 2009 and 2010 | | | F-7 | |
| | | | | |
| (f) Consolidated Statements of Cash Flows for the years ended December 31, 2008, 2009 and 2010 | | | F-8–F-9 | |
| | | | | |
| (g) Notes to the consolidated financial statements | | | F-10–F-101 | |
ITEM 19. EXHIBITS
| | | | | |
| EXHIBIT | | INDEX |
| | | | | |
| | 1.1 | | | Amended Memorandum and Articles of Association of our Company, incorporated by reference to Exhibit 1.3 to our annual report for the year 2006 on Form 20-F filed with the SEC on June 29, 2007 |
| | | | | |
| | 4.1 | | | End-User License Agreement between Internet Media Licensing Limited and Ultra Internet Media, S.A., dated April 1, 2004, incorporated by reference to Exhibit 4.41 to our annual report for the year 2004 on Form 20-F filed with the SEC on June 30, 2005 |
| | | | | |
| | 4.2 | | | Second Amendment to the End-User License Agreement between Internet Media Licensing Limited and Ultra Internet Media, S.A., dated March 1, 2006, incorporated by reference to Exhibit 4.41 to our annual report for the year 2005 on Form 20-F filed with the SEC on June 28, 2006 |
| | | | | |
| | 4.3 | | | Third Amendment to the End-User License Agreement between Internet Media Licensing Limited and Ultra Internet Media, S.A., dated March 1, 2007, incorporated by reference to Exhibit 4.50 to our annual report for the year 2006 on Form 20-F filed with the SEC on June 29, 2007 |
124
| | | | | |
| EXHIBIT | | INDEX |
| | | | | |
| | 4.4 | | | Fourth Amendment to the End-User License Agreement between Internet Media Licensing Limited and Ultra Internet Media, S.A., dated March 1, 2008, incorporated by reference to Exhibit 4.4 to our annual report for the year 2008 on Form 20-F filed with the SEC on June 26, 2007 |
| | | | | |
| | 4.5 | | | Exclusive Business Consultancy Service Agreement between T2 Technology and T2 Entertainment, dated November 15, 2006, incorporated by reference to Exhibit 4.55 to our annual report for the year 2007 on Form 20-F filed with the SEC on June 30, 2008 |
| | | | | |
| | 4.6 | | | Supplemental Agreement to Exclusive Business Consultancy Service Agreement between T2 Technology and T2 Entertainment, dated April 1, 2007, incorporated by reference to Exhibit 4.56 to our annual report for the year 2007 on Form 20-F filed with the SEC on June 30, 2008 |
| | | | | |
| | 4.7 | | | Exclusive Technical Service and Consultancy Agreement between T2 Entertainment and T2 Technology, dated November 15, 2006, incorporated by reference to Exhibit 4.57 to our annual report for the year 2007 on Form 20-F filed with the SEC on June 30, 2008 |
| | | | | |
| | 4.8 | | | Supplemental Agreement to Exclusive Technical Service and Consultancy Agreement between T2 Entertainment and T2 Technology, dated April 1, 2007, incorporated by reference to Exhibit 4.58 to our annual report for the year 2007 on Form 20-F filed with the SEC on June 30, 2008 |
| | | | | |
| | 4.9 | | | Agreement for Pledge of Shares in T2 Entertainment between Wang Chi, Lu Ning and T2 Technology, dated February 9, 2007, incorporated by reference to Exhibit 4.59 to our annual report for the year 2007 on Form 20-F filed with the SEC on June 30, 2008 |
| | | | | |
| | 4.10 | | | Exclusive Call Option Agreement regarding T2 Entertainment between Wang Chi, Lu Ning, T2 Entertainment and T2 Technology, dated February 9, 2007, incorporated by reference to Exhibit 4.60 to our annual report for the year 2007 on Form 20-F filed with the SEC on June 30, 2008 |
| | | | | |
| | 4.11 | | | Proxy Voting Agreement regarding T2 Entertainment between T2 Technology, T2 Entertainment, Wang Chi and Lu Ning, dated February 9, 2007, incorporated by reference to Exhibit 4.61 to our annual report for the year 2007 on Form 20-F filed with the SEC on June 30, 2008 |
| | | | | |
| | 4.12 | | | Exclusive Business Consultancy Service Agreement between T2 Technology and T2 Advertisement, dated November 15, 2006, incorporated by reference to Exhibit 4.62 to our annual report for the year 2007 on Form 20-F filed with the SEC on June 30, 2008 |
| | | | | |
| | 4.13 | | | Supplemental Agreement to Exclusive Business Consultancy Service Agreement between T2 Technology and T2 Advertisement, dated January 1, 2007, incorporated by reference to Exhibit 4.63 to our annual report for the year 2007 on Form 20-F filed with the SEC on June 30, 2008 |
| | | | | |
| | 4.14 | | | Agreement for Pledge of Shares in T2 Advertisement between Chi Min, Chang Tao and T2 Technology, dated March 20, 2008, incorporated by reference to Exhibit 4.64 to our annual report for the year 2007 on Form 20-F filed with the SEC on June 30, 2008 |
| | | | | |
| | 4.15 | | | Exclusive Call Option Agreement regarding T2 Advertisement between Chi Min, Chang Tao, T2 Advertisement and T2 Technology, dated March 20, 2008, incorporated by reference to Exhibit 4.65 to our annual report for the year 2007 on Form 20-F filed with the SEC on June 30, 2008 |
| | | | | |
| | 4.16 | | | Proxy Voting Agreement regarding T2 Advertisement between T2 Technology, T2 Advertisement, Chi Min and Chang Tao, dated March 20, 2008, incorporated by reference to Exhibit 4.66 to our annual report for the year 2007 on Form 20-F filed with the SEC on June 30, 2008 |
| | | | | |
| | 4.17 | | | Share Purchase Agreement between William Zhu and GigaMedia China Limited, dated June 3, 2007, incorporated by reference to Exhibit 4.67 to our annual report for the year 2007 on Form 20-F filed with the SEC on June 30, 2008 |
| | | | | |
| | 4.18 | | | Share Purchase Agreement between Yu-Chia Lee and GigaMedia China Limited, dated June 6, 2007, incorporated by reference to Exhibit 4.68 to our annual report for the year 2007 on Form 20-F filed with the SEC on June 30, 2008 |
125
| | | | | |
| EXHIBIT | | INDEX |
| | | | | |
| | 4.19 | | | Share Purchase Agreement between Zheng Bin and GigaMedia China Limited, dated June 10, 2007, incorporated by reference to Exhibit 4.69 to our annual report for the year 2007 on Form 20-F filed with the SEC on June 30, 2008 |
| | | | | |
| | 4.20 | | | Share Purchase Agreement between J&R Music LLC, Ya-Tsen Lin and GigaMedia China Limited, dated July 5, 2007, incorporated by reference to Exhibit 4.70 to our annual report for the year 2007 on Form 20-F filed with the SEC on June 30, 2008 |
| | | | | |
| | 4.21 | | | Share Purchase Agreement between Kingland Overseas Development Inc. and GigaMedia China Limited, dated July 6, 2007, incorporated by reference to Exhibit 4.71 to our annual report for the year 2007 on Form 20-F filed with the SEC on June 30, 2008 |
| | | | | |
| | 4.22 | | | Share Purchase Agreement between Jim Ji Wang and GigaMedia China Limited, dated July 6, 2007, incorporated by reference to Exhibit 4.72 to our annual report for the year 2007 on Form 20-F filed with the SEC on June 30, 2008 |
| | | | | |
| | 4.23 | | | Share Purchase Agreement between Marvel City Investments Limited and GigaMedia China Limited, dated May 26, 2008, incorporated by reference to Exhibit 4.73 to our annual report for the year 2007 on Form 20-F filed with the SEC on June 30, 2008 |
| | | | | |
| | 4.24 | | | Agreement for Pledge of Shares in Jinyou among Yang Zhuojun, Tan Yihui and T2 Technology, dated June 15, 2009, incorporated by reference to Exhibit 4.24 to our annual report for the year 2008 on Form 20-F filed with the SEC on June 26, 2009 |
| | | | | |
| | 4.25 | | | Exclusive Call Option Agreement regarding Jinyou among Yang Zhuojun, Tan Yihui, Jinyou and T2 Technology, dated June 15, 2009, incorporated by reference to Exhibit 4.25 to our annual report for the year 2008 on Form 20-F filed with the SEC on June 26, 2009 |
| | | | | |
| | 4.26 | | | Proxy Voting Agreement regarding Jinyou among T2 Technology, Jinyou, Yang Zhuojun and Tan Yihui, dated June 15, 2009, incorporated by reference to Exhibit 4.26 to our annual report for the year 2008 on Form 20-F filed with the SEC on June 26, 2009 |
| | | | | |
| | 4.27 | | | Exclusive Business Consultancy Service Agreement between T2 Technology and Jinyou, dated November 26, 2007, incorporated by reference to Exhibit 4.27 to our annual report for the year 2008 on Form 20-F filed with the SEC on June 26, 2009 |
| | | | | |
| | 4.28 | | | Exclusive Technical Service and Consultancy Agreement between Jinyou and T2 Technology, dated November 26, 2007, incorporated by reference to Exhibit 4.28 to our annual report for the year 2008 on Form 20-F filed with the SEC on June 26, 2009 |
| | | | | |
| | 4.29 | | | Share Sales and Purchase Agreement among Champion Limited, Gigamedia International Holdings Limited and GigaMedia, dated August 28, 2008, incorporated by reference to Exhibit 4.29 to our annual report for the year 2008 on Form 20-F filed with the SEC on June 26, 2009 |
| | | | | |
| | 4.30 | | | Share Sales and Purchase Agreement between China Network Systems Co., Ltd. and Hoshin GigaMedia, dated August 28, 2008, incorporated by reference to Exhibit 4.30 to our annual report for the year 2008 on Form 20-F filed with the SEC on June 26, 2009 |
| | | | | |
| | 4.31 | | | Asset Sale and Purchase Agreement among Ko Ying, Hoshin GigaMedia and China Network Systems Co., Ltd., dated August 28, 2008, incorporated by reference to Exhibit 4.31 to our annual report for the year 2008 on Form 20-F filed with the SEC on June 26, 2009 |
| | | | | |
| | 4.32 | | | Transitional Service Agreement among Ko Ying, Hoshin GigaMedia and KBT, dated September 3, 2008, incorporated by reference to Exhibit 4.32 to our annual report for the year 2008 on Form 20-F filed with the SEC on June 26, 2009 |
| | | | | |
| | 4.33 | | | Assignment and Assumption Agreement between Hoshin GigaMedia and Hoshin Multimedia, dated September 3, 2008, incorporated by reference to Exhibit 4.33 to our annual report for the year 2008 on Form 20-F filed with the SEC on June 26, 2009 |
126
| | | | | |
| EXHIBIT | | INDEX |
| | | | | |
| | 4.34 | | | Subscription Agreement between IAHGames and GigaMedia Asia Pacific Limited, dated April 30, 2010, incorporated by reference to Exhibit 4.34 to our annual report for the year 2009 on Form 20-F filed with the SEC on June 30, 2010 |
| | | | | |
| | 4.35 | | | The Amendment to the Subscription Agreement between IAHGames and GigaMedia Asia Pacific Limited, dated June 25, 2010, incorporated by reference to Exhibit 4.35 to our annual report for the year 2009 on Form 20-F filed with the SEC on June 30, 2010 |
| | | | | |
| | 4.36 | | | Share Purchase Agreement between Infocomm Investments Pte Ltd and GigaMedia Asia Pacific Limited, dated April 30, 2010, incorporated by reference to Exhibit 4.36 to our annual report for the year 2009 on Form 20-F filed with the SEC on June 30, 2010 |
| | | | | |
| | 4.37 | | | Share Purchase Agreement between Bodhi Investments LLC and GigaMedia Asia Pacific Limited, dated April 30, 2010, incorporated by reference to Exhibit 4.37 to our annual report for the year 2009 on Form 20-F filed with the SEC on June 30, 2010 |
| | | | | |
| | 4.38 | | | Deed of Guarantee, Undertaking and Indemnity among GigaMedia Asia Pacific Limited, Management Capital International Ltd and China Interactive Limited, dated April 30, 2010, incorporated by reference to Exhibit 4.38 to our annual report for the year 2009 on Form 20-F filed with the SEC on June 30, 2010 |
| | | | | |
| | 4.39 | | | Shareholder Loan Agreement between GigaMedia Asia Pacific Limited and IAHGames, dated April 30, 2010, incorporated by reference to Exhibit 4.39 to our annual report for the year 2009 on Form 20-F filed with the SEC on June 30, 2010 |
| | | | | |
| | 4.40 | | | Loan Assignment Agreement among GigaMedia Asia Pacific Limited, IAHGames and Spring Asia Limited, dated June 1, 2010, incorporated by reference to Exhibit 4.40 to our annual report for the year 2009 on Form 20-F filed with the SEC on June 30, 2010 |
| | | | | |
| | 4.41 | | | Loan Agreement between Spring Asia Limited and IAHGames, dated May 20, 2010, incorporated by reference to Exhibit 4.41 to our annual report for the year 2009 on Form 20-F filed with the SEC on June 30, 2010 |
| | | | | |
| | 4.42 | | | Stock and Asset Purchase Agreement among BetClic, GigaMedia Limited, UIM and the Other Parties Named Thereto dated December 15, 2009 and Amendment No.1 to Stock and Asset Purchase Agreement, dated March 31, 2010, incorporated by reference to Exhibit 4.42 to our annual report for the year 2009 on Form 20-F filed with the SEC on June 30, 2010 |
| | | | | |
| | 4.43 | | | Fifth Amendment to the End-User License Agreement between Internet Media Licensing Limited and Ultra Internet Media, S.A., dated April 1, 2009, incorporated by reference to Exhibit 4.43 to our annual report for the year 2009 on Form 20-F filed with the SEC on June 30, 2010 |
| | | | | |
| | 4.44 | | | Share Purchase Agreement between China Interactive Limited and GigaMedia Asia Pacific Limited, dated June 30, 2010, incorporated by reference to Exhibit 4.44 to our annual report for the year 2009 on Form 20-F filed with the SEC on June 30, 2010 |
| | | | | |
| | 4.45 | | | Instrument Constituting Warrants to Subscribe for Shares in IAHGames among IAHGames, Management Capital International Limited and Mr. Ong Toon Wan, dated April 30, 2010# |
| | | | | |
| | 4.46 | | | Deed of Amendment among IAHGames, Management Capital International Limited and Mr. Ong Toon Wan, dated May 20, 2010# |
| | | | | |
| | 4.47 | | | Security over Shares Agreement between IAHGames and Blizzard, dated April 30, 2010# |
| | | | | |
| | 4.48 | | | Deed of Undertaking between GigaMedia Asia Pacific Limited and Blizzard, dated April 30, 2010# |
| | | | | |
| | 4.49 | | | Prepayment Agreement between GigaMedia (HK) Limited and Mi Saiyu, dated September 18, 2010# |
| | | | | |
| | 4.50 | | | Prepayment Agreement between GigaMedia (HK) Limited and Song Yunv, dated October 12, 2010# |
| | | | | |
| | 4.51 | | | Authorization and Proxy Letter by Mi Saiyu, dated December 6, 2010# |
| | | | | |
| | 4.52 | | | Authorization and Proxy Letter by Song Yunv, dated December 6, 2010# |
| | | | | |
| | 4.53 | | | Exclusive Technical Services Agreement between JIDI and Shanghai JIDI, dated January 1, 2011# |
127
| | | | | |
| EXHIBIT | | INDEX |
| | | | | |
| | 8.1 | | | List of Subsidiaries# |
| | | | | |
| | 12.1 | | | Certification by our Chief Executive Officer pursuant to Rule 13a-14(b) of the Securities Exchange Act# |
| | | | | |
| | 12.2 | | | Certification by our Chief Financial Officer pursuant to Rule13a-14(b) of the Securities Exchange Act# |
| | | | | |
| | 13.1 | | | Certification by our Chief Executive Officer pursuant to 18 U.S.C. Section 1350 as adopted pursuant to Section 906 of the Sarbanes-Oxley Act of 2002# |
| | | | | |
| | 13.2 | | | Certification by our Chief Financial Officer pursuant to 18 U.S.C. Section 1350 as adopted pursuant to Section 906 of the Sarbanes-Oxley Act of 2002# |
| | | | | |
| | 15.1 | | | Consent of GHP Horwath, P.C., Independent Registered Public Accounting Firm# |
| | | | | |
| | 15.2 | | | Consent of Crowe Horwath First Trust LLP, Independent Auditors |
| | | | | |
| | 15.3 | | | Consent of GHP Horwath, P.C., Independent Auditors |
| | | | | |
| | 18.1 | | | Financial Statements of Monsoon Online Pte. Ltd. for the financial period from October 22, 2009 (the date of incorporation) to December 31, 2010 # |
| | | | | |
| | 18.2 | | | Consolidated financial statements of Mangas Everest S.A.S. as of and for the nine-months ended December 31, 2010 # |
128
SIGNATURE
The registrant hereby certifies that it meets all of the requirements for filing on Form 20-F and that it has duly caused and authorized the undersigned to sign this annual report on its behalf.
GIGAMEDIA LIMITED
| | | | | |
| By: | | /s/ Yichin LEE Yichin LEE | | |
| | | Chief Executive Officer | | |
| | | Date: June 30, 2011 | | |
129
GIGAMEDIA LIMITED
CONSOLIDATED FINANCIAL STATEMENTS AND
REPORT OF INDEPENDENT REGISTERED
PUBLIC ACCOUNTING FIRM
DECEMBER 31, 2009 AND 2010 AND
FOR THE YEARS ENDED DECEMBER 31, 2008, 2009 AND 2010
| | | |
| | GHP Horwath, P.C.
Member Crowe Horwath International
1670 Broadway, Suite 3000
Denver, Colorado 80202
+1 303.831.5000
+1 303.831.5032 Fax
www.GHPHorwath.com |
REPORT OF INDEPENDENT REGISTERED PUBLIC ACCOUNTING FIRM
Board of Directors and Shareholders
GigaMedia Limited
We have audited the accompanying consolidated balance sheets of GigaMedia Limited and subsidiaries (the “Company”) as of December 31, 2010 and 2009, and the related consolidated statements of operations, comprehensive income (loss), equity, and cash flows for each of the three years in the period ended December 31, 2010. We also have audited the Company’s internal control over financial reporting as of December 31, 2010, based on criteria established inInternal Control—Integrated Frameworkissued by the Committee of Sponsoring Organizations of the Treadway Commission (COSO). The Company’s management is responsible for these financial statements, for maintaining effective internal control over financial reporting, and for its assessment of the effectiveness of internal control over financial reporting, included in the accompanying Management’s Annual Report on Internal Control over Financial Reporting. Our responsibility is to express an opinion on these financial statements and an opinion on the Company’s internal control over financial reporting based on our audits.
We conducted our audits in accordance with the standards of the Public Company Accounting Oversight Board (United States). Those standards require that we plan and perform the audits to obtain reasonable assurance about whether the financial statements are free of material misstatement and whether effective internal control over financial reporting was maintained in all material respects. Our audit of the financial statements included examining, on a test basis, evidence supporting the amounts and disclosures in the financial statements, assessing the accounting principles used and significant estimates made by management, and evaluating the overall financial statement presentation. Our audit of internal control over financial reporting included obtaining an understanding of internal control over financial reporting, assessing the risk that a material weakness exists, and testing and evaluating the design and operating effectiveness of internal control based on the assessed risk. Our audits also included performing such other procedures as we considered necessary in the circumstances. We believe that our audits provide a reasonable basis for our opinions.
A company’s internal control over financial reporting is a process designed to provide reasonable assurance regarding the reliability of financial reporting and the preparation of financial statements for external purposes in accordance with generally accepted accounting principles. A company’s internal control over financial reporting includes those policies and procedures that (1) pertain to the maintenance of records that, in reasonable detail, accurately and fairly reflect the transactions and dispositions of the assets of the company; (2) provide reasonable assurance that transactions are recorded as necessary to permit preparation of financial statements in accordance with generally accepted accounting principles, and that receipts and expenditures of the company are being made only in accordance with authorizations of management and directors of the company; and (3) provide reasonable assurance regarding prevention or timely detection of unauthorized acquisition, use, or disposition of the company’s assets that could have a material effect on the financial statements.
Because of its inherent limitations, internal control over financial reporting may not prevent or detect misstatements. Also, projections of any evaluation of effectiveness to future periods are subject to the risk that controls may become inadequate because of changes in conditions, or that the degree of compliance with the policies or procedures may deteriorate.
| | | |
| | A GHP Financial Group Company
GHP Horwath, P.C. is an independent member firm of Crowe Horwath International, a Swiss verein. Each member firm of Crowe Horwath International is a separate and independent legal entity. |
F-1
As described in the accompanying Management’s Annual Report on Internal Control Over Financial Reporting, management’s assessment of and conclusion on the effectiveness of internal control over financial reporting did not include Infocomm Asia Holdings Pte. Ltd. (“IAHGames”). The Company acquired a controlling financial interest in IAHGames and began to consolidate this business in July 2010. Management determined that it was not possible to conduct an assessment of IAHGames’ internal control over financial reporting in the period between the date of consummation and the date of management’s assessment. IAHGames’ total assets, total revenues and net loss included in the consolidated financial statements of the Company as of and for the year ended December 31, 2010, were approximately $42.8 million, $5.9 million and $16.0 million, respectively. Our audit of internal control over financial reporting of the Company also did not include an evaluation of the internal control over financial reporting of IAHGames.
A material weakness is a deficiency, or a combination of deficiencies, in internal control over financial reporting, such that there is a reasonable possibility that a material misstatement of the company’s annual or interim financial statements will not be prevented or detected on a timely basis. One of the Company’s business units is an online gaming business in the Peoples Republic of China (“T2CN Holding Limited (“T2CN”) and its related entities). As discussed in Note 5 to the consolidated financial statements, as a result of a dispute with T2CN’s former chief executive officer, which arose in July 2010, the Company has been prevented from obtaining and currently does not have access to the assets and financial information of T2CN and its related entities. Therefore, the Company has effectively lost control over a majority of T2CN’s assets and its financial reporting process. As described in the accompanying Management’s Annual Report on Internal Control Over Financial Reporting, management’s assessment of and conclusion on the effectiveness of internal control over financial reporting sets forth that this matter indicates a material weakness in the Company’s internal control over financial reporting related to the monitoring of this investment and the inability to exercise sufficient control over a majority of T2CN’s assets and its financial reporting process. The Company did not have adequate controls in place to address risks related to usurpation of established policies, procedures and control systems, which resulted in a significant loss to the Company.
This material weakness was considered in determining the nature, timing, and extent of audit tests applied in our audit of the Company’s consolidated financial statements and does not affect our report on such consolidated financial statements.
In our opinion, because of the effects of the material weakness identified above on the achievement of the objectives of the control criteria, the Company did not maintain effective internal control over financial reporting as of December 31, 2010, based on criteria established inInternal Control—Integrated Frameworkissued by the COSO. Also, in our opinion, the consolidated financial statements referred to above present fairly, in all material respects, the financial position of GigaMedia Limited and subsidiaries as of December 31, 2010 and 2009, and the results of their operations and their cash flows for each of the three years in the period ended December 31, 2010, in conformity with accounting principles generally accepted in the United States of America.
As discussed in Note 1 to the consolidated financial statements, during 2009, the provisions of new accounting standards relating to business combinations and noncontrolling interests were adopted.
/s/ GHP HORWATH, P.C.
Denver, Colorado
June 30, 2011
F-2
GIGAMEDIA LIMITED
CONSOLIDATED BALANCE SHEETS
December 31, 2009 and 2010
(in thousands)
| | | | | | | | | |
| | | December 31 | |
| | | 2009 | | | 2010 | |
| ASSETS | | | | | | | | |
| |
| CURRENT ASSETS | | | | | | | | |
| Cash and cash equivalents (Note 11) | | $ | 55,566 | | | $ | 70,989 | |
| Marketable securities-current (Note 12) | | | 3,486 | | | | 3,553 | |
| Accounts receivable-net (Note 13) | | | 4,228 | | | | 9,506 | |
| Prepaid expenses | | | 1,204 | | | | 1,996 | |
| Restricted cash (Note 17) | | | 932 | | | | 5,000 | |
| Assets held for sale-current (Note 6) | | | 35,444 | | | | — | |
| Other current assets (Notes 14 and 25) | | | 3,979 | | | | 2,044 | |
| | | | | | | |
| Total Current Assets | | | 104,839 | | | | 93,088 | |
| | | | | | | |
| | | | | | | | | |
| Marketable securities-noncurrent (Note 15) | | | 18,356 | | | | 33,389 | |
| | | | | | | |
| Investments (Note 16) | | | 3,477 | | | | 66,774 | |
| | | | | | | |
| Retained ownership of gaming software and service business (Note 6) | | | 25,951 | | | | — | |
| | | | | | | |
| | | | | | | | | |
| PROPERTY, PLANT AND EQUIPMENT | | | | | | | | |
| Land and buildings | | | 1,171 | | | | 1,286 | |
| Information and communication equipment | | | 6,928 | | | | 5,892 | |
| Office furniture and fixtures | | | 915 | | | | 907 | |
| Leasehold improvements | | | 2,643 | | | | 2,133 | |
| Other | | | 148 | | | | 1,073 | |
| | | | | | | |
| | | | 11,805 | | | | 11,291 | |
| Less: Accumulated depreciation | | | ( 5,816 | ) | | | ( 5,990 | ) |
| | | | | | | |
| | | | 5,989 | | | | 5,301 | |
| | | | | | | |
| | | | | | | | | |
| GOODWILL (Note 7) | | | 44,417 | | | | 39,493 | |
| | | | | | | |
| | | | | | | | | |
| INTANGIBLE ASSETS-NET (Note 8) | | | 18,924 | | | | 19,769 | |
| | | | | | | |
| | | | | | | | | |
| ASSETS HELD FOR SALE-NONCURRENT (Note 6) | | | 31,301 | | | | — | |
| | | | | | | |
| | | | | | | | | |
| OTHER ASSETS | | | | | | | | |
| Refundable deposits | | | 1,079 | | | | 2,163 | |
| Prepaid licensing and royalty fees (Notes 9 and 27) | | | 5,557 | | | | 4,214 | |
| Other (Note 25 and 26) | | | 291 | | | | 3,398 | |
| | | | | | | |
| Total Other Assets | | | 6,927 | | | | 9,775 | |
| | | | | | | |
| | | | | | | | | |
| TOTAL ASSETS | | $ | 260,181 | | | $ | 267,589 | |
| | | | | | | |
(Continued)
F-3
GIGAMEDIA LIMITED
CONSOLIDATED BALANCE SHEETS-(Continued)
December 31, 2009 and 2010
(in thousands)
| | | | | | | | | |
| | | December 31 | |
| | | 2009 | | | 2010 | |
| LIABILITIES & EQUITY | | | | | | | | |
| |
| CURRENT LIABILITIES | | | | | | | | |
| Accounts payable | | $ | 591 | | | $ | 4,305 | |
| Accrued compensation | | | 2,814 | | | | 4,239 | |
| Accrued expenses (Note 18) | | | 6,719 | | | | 10,986 | |
| Short-term borrowings (Notes 17 and 26) | | | 22,503 | | | | 12,413 | |
| Liabilities held for sale-current (Note 6) | | | 26,458 | | | | — | |
| Other current liabilities (Notes 19 and 25) | | | 13,244 | | | | 11,350 | |
| | | | | | | |
| Total Current Liabilities | | | 72,329 | | | | 43,293 | |
| | | | | | | |
| | | | | | | | | |
| OTHER LIABILITIES | | | | | | | | |
| Accrued pension liabilities (Note 20) | | | 83 | | | | 44 | |
| Liabilities held for sale-noncurrent (Note 6) | | | 1,360 | | | | — | |
| Other (Note 21 and 25) | | | 49 | | | | 7,686 | |
| | | | | | | |
| Total Other Liabilities | | | 1,492 | | | | 7,730 | |
| | | | | | | |
| Total Liabilities | | | 73,821 | | | | 51,023 | |
| | | | | | | |
| | | | | | | | | |
| COMMITMENTS AND CONTINGENCIES (Notes 27 and 28) | | | — | | | | — | |
| | | | | | | | | |
| SUBSIDIARY PREFERRED SHARES (Note 22) | | | | | | | | |
| Par value $1, redeemable; convertible; issued and outstanding 2,018 thousand shares on December 31, 2010 | | | — | | | | 1,465 | |
| | | | | | | | | |
| EQUITY (Note 23) | | | | | | | | |
| GigaMedia Shareholders’ Equity: | | | | | | | | |
| Common shares, no par value, and additional paid-in capital; issued and outstanding 54,995 thousand and 56,263 thousand shares on December 31, 2009 and 2010 | | | 304,379 | | | | 309,332 | |
| Accumulated deficit | | | (94,389 | ) | | | (91,739 | ) |
| Accumulated other comprehensive loss | | | (25,245 | ) | | | (72 | ) |
| | | | | | | |
| Total GigaMedia shareholders’ equity | | | 184,745 | | | | 217,521 | |
| | | | | | | |
| Noncontrolling interest | | | 1,615 | | | | (2,420 | ) |
| | | | | | | |
| Total Equity | | | 186,360 | | | | 215,101 | |
| | | | | | | |
| | | | | | | | | |
| TOTAL LIABILITIES AND EQUITY | | $ | 260,181 | | | $ | 267,589 | |
| | | | | | | |
The accompanying notes are an integral part of these consolidated financial statements.
F-4
GIGAMEDIA LIMITED
CONSOLIDATED STATEMENTS OF OPERATIONS
For the Years Ended December 31, 2008, 2009 and 2010
(in thousands except for earnings per share amounts)
| | | | | | | | | | | | | |
| | | 2008 | | | 2009 | | | 2010 | |
| |
| OPERATING REVENUES | | | | | | | | | | | | |
| Gaming software and service revenues | | $ | 144,765 | | | $ | 112,694 | | | $ | 25,820 | |
| Asian online game and service revenues | | | 45,604 | | | | 46,887 | | | | 38,862 | |
| | | | | | | | | | |
| Total | | | 190,369 | | | | 159,581 | | | | 64,682 | |
| | | | | | | | | | |
| | | | | | | | | | | | | |
| OPERATING COSTS | | | | | | | | | | | | |
| Cost of gaming software and service revenues | | | (22,770 | ) | | | (20,102 | ) | | | (4,010 | ) |
| Cost of Asian online game and service revenues | | | (12,404 | ) | | | (16,785 | ) | | | (17,103 | ) |
| | | | | | | | | | |
| | | | (35,174 | ) | | | (36,887 | ) | | | (21,113 | ) |
| | | | | | | | | | |
| | | | | | | | | | | | | |
| GROSS PROFIT | | | 155,195 | | | | 122,694 | | | | 43,569 | |
| | | | | | | | | | |
| | | | | | | | | | | | | |
| OPERATING EXPENSES | | | | | | | | | | | | |
| Product development and engineering expenses | | | (13,455 | ) | | | (14,195 | ) | | | (7,301 | ) |
| Selling and marketing expenses | | | (74,173 | ) | | | (79,421 | ) | | | (21,589 | ) |
| General and administrative expenses | | | (25,035 | ) | | | (29,692 | ) | | | (31,780 | ) |
| Bad debt expenses (Notes 13 and 14) | | | (2,905 | ) | | | (1,092 | ) | | | (1,639 | ) |
| Impairment loss on property, plant and equipment (Note 10) | | | — | | | | (1,250 | ) | | | (278 | ) |
| Impairment loss on goodwill (Note 10) | | | — | | | | (14,103 | ) | | | (2,255 | ) |
| Impairment loss on prepaid licensing fees and intangible assets (Note 10) | | | (1,524 | ) | | | (23,002 | ) | | | (2,200 | ) |
| Impairment loss on deconsolidation of T2CN (Note 5 and 10) | | | — | | | | — | | | | (22,234 | ) |
| Other | | | — | | | | — | | | | (1,989 | ) |
| | | | | | | | | | |
| | | | (117,092 | ) | | | (162,755 | ) | | | (91,265 | ) |
| | | | | | | | | | |
| | | | | | | | | | | | | |
| INCOME (LOSS) FROM OPERATIONS | | | 38,103 | | | | (40,061 | ) | | | (47,696 | ) |
| | | | | | | | | | |
| | | | | | | | | | | | | |
| NON-OPERATING INCOME (EXPENSES) | | | | | | | | | | | | |
| Interest income | | | 1,460 | | | | 432 | | | | 956 | |
| Gain on sales of marketable securities | | | 373 | | | | — | | | | — | |
| Interest expense | | | (976 | ) | | | (390 | ) | | | (370 | ) |
| Foreign exchange (loss) gain | | | 240 | | | | 168 | | | | (606 | ) |
| Loss on disposal of property, plant and equipment | | | (253 | ) | | | (31 | ) | | | (125 | ) |
| Loss on equity method investments — net | | | (3,010 | ) | | | (87 | ) | | | (20,770 | ) |
| Impairment loss on marketable securities and investments (Note 10) | | | — | | | | (15,743 | ) | | | (4,677 | ) |
| Gain on deconsolidation of the gaming software and service business (Note 6) | | | — | | | | — | | | | 79,140 | |
| Gain on fair value changes of warrant derivative (Note 10) | | | — | | | | — | | | | 2,595 | |
| Other | | | 842 | | | | 127 | | | | 221 | |
| | | | | | | | | | |
| | | | (1,324 | ) | | | (15,524 | ) | | | 56,364 | |
| | | | | | | | | | |
| | | | | | | | | | | | | |
| INCOME (LOSS) FROM CONTINUING OPERATIONS BEFORE INCOME TAXES | | | 36,779 | | | | (55,585 | ) | | | 8,668 | |
| INCOME TAX EXPENSE (Note 25) | | | (1,069 | ) | | | (517 | ) | | | (7,260 | ) |
| | | | | | | | | | |
| INCOME (LOSS) FROM CONTINUING OPERATIONS | | | 35,710 | | | | (56,102 | ) | | | 1,408 | |
| INCOME (LOSS) FROM DISCONTINUED OPERATIONS — NET OF TAX (Note 6) | | | 9,435 | | | | 222 | | | | (128 | ) |
| | | | | | | | | | |
| NET INCOME (LOSS) | | | 45,145 | | | | (55,880 | ) | | | 1,280 | |
| LESS: NET (INCOME) LOSS ATTRIBUTABLE TO THE NONCONTROLLING INTEREST AND SUBSIDIARY PREFERRED SHARES | | | (757 | ) | | | 6,795 | | | | 1,370 | |
| | | | | | | | | | |
| NET INCOME (LOSS) ATTRIBUTABLE TO GIGAMEDIA | | $ | 44,388 | | | $ | (49,085 | ) | | $ | 2,650 | |
| | | | | | | | | | |
| | | | | | | | | | | | | |
| NET INCOME (LOSS) ATTRIBUTABLE TO GIGAMEDIA: | | | | | | | | | | | | |
| Income (loss) from continuing operations — net of tax | | $ | 34,953 | | | $ | (49,307 | ) | | $ | 2,778 | |
| Income (loss) from discontinued operations — net of tax | | | 9,435 | | | | 222 | | | | (128 | ) |
| | | | | | | | | | |
| | | $ | 44,388 | | | $ | (49,085 | ) | | $ | 2,650 | |
| | | | | | | | | | |
| | | | | | | | | | | | | |
| EARNINGS (LOSS) PER SHARE ATTRIBUTABLE TO GIGAMEDIA | | | | | | | | | | | | |
| Basic: | | | | | | | | | | | | |
| Income (loss) from continuing operations | | $ | 0.65 | | | $ | (0.90 | ) | | $ | 0.05 | |
| Income from discontinued operations | | | 0.17 | | | | — | | | | — | |
| | | | | | | | | | |
| Net income (loss) | | $ | 0.82 | | | $ | (0.90 | ) | | $ | 0.05 | |
| | | | | | | | | | |
| Diluted: | | | | | | | | | | | | |
| Income (loss) from continuing operations | | $ | 0.58 | | | $ | (0.90 | ) | | $ | 0.04 | |
| Income from discontinued operations | | | 0.16 | | | | — | | | | — | |
| | | | | | | | | | |
| Net income (loss) | | $ | 0.74 | | | $ | (0.90 | ) | | $ | 0.04 | |
| | | | | | | | | | |
| | | | | | | | | | | | | |
| WEIGHTED AVERAGE SHARES USED TO COMPUTE NET INCOME (LOSS) PER SHARE ATTRIBUTABLE TO GIGAMEDIA (Note 2) | | | | | | | | | | | | |
| Basic | | | 54,110 | | | | 54,524 | | | | 55,834 | |
| | | | | | | | | | |
| Diluted | | | 60,152 | | | | 54,524 | | | | 59,291 | |
| | | | | | | | | | |
The accompanying notes are an integral part of these consolidated financial statements.
F-5
GIGAMEDIA LIMITED
CONSOLIDATED STATEMENTS OF COMPREHENSIVE INCOME (LOSS)
For the Years Ended December 31, 2008, 2009 and 2010
(in thousands)
| | | | | | | | | | | | | |
| | | 2008 | | | 2009 | | | 2010 | |
| | | | | | | | | | | | | |
| NET INCOME (LOSS) | | $ | 45,145 | | | $ | (55,880 | ) | | $ | 1,280 | |
| | | | | | | | | | | | | |
| OTHER COMPREHENSIVE INCOME-NET OF TAX: | | | | | | | | | | | | |
| Unrealized gain (loss) on marketable securities | | | (282 | ) | | | 67 | | | | 21,789 | |
| Defined benefit pension plan adjustment | | | 95 | | | | (68 | ) | | | 31 | |
| Foreign currency translation adjustments | | | 893 | | | | 1,003 | | | | 4,756 | |
| Deconsolidation of T2CN | | | — | | | | — | | | | (1,311 | ) |
| | | | | | | | | | |
| | | | 706 | | | | 1,002 | | | | 25,265 | |
| | | | | | | | | | |
| COMPREHENSIVE INCOME (LOSS) | | | 45,851 | | | | (54,878 | ) | | | 26,545 | |
| COMPREHENSIVE (INCOME) LOSS ATTRIBUTABLE TO THE NONCONTROLLING INTEREST AND SUBSIDIARY PREFERRED SHARES | | | (1,288 | ) | | | 6,809 | | | | 1,278 | |
| | | | | | | | | | |
| COMPREHENSIVE INCOME (LOSS) ATTRIBUTABLE TO GIGAMEDIA | | $ | 44,563 | | | $ | (48,069 | ) | | $ | 27,823 | |
| | | | | | | | | | |
The accompanying notes are an integral part of these consolidated financial statements.
F-6
GIGAMEDIA LIMITED
CONSOLIDATED STATEMENTS OF EQUITY
For the Years Ended December 31, 2008, 2009 and 2010
(in thousands, except per share amounts)
| | | | | | | | | | | | | | | | | | | | | | | | | |
| | | GIGAMEDIA SHAREHOLDERS | | | | | | | |
| | | Common shares | | | | | | | Accumulated other | | | | | | | |
| | | and additional paid-in capital | | | Accumulated | | | comprehensive | | | Noncontrolling | | | | |
| | | Shares | | | Amount | | | deficit (Note 23) | | | income (loss) | | | interest | | | Total | |
| | | | | | | | | | | | | | | | | | | | | | | | | |
| Balance as of January 1, 2008 | | | 53,700 | | | $ | 296,793 | | | $ | (89,692 | ) | | $ | (26,436 | ) | | $ | 9,810 | | | $ | 190,475 | |
| Issuance of common shares from exercise of stock options and RSUs | | | 665 | | | | 495 | | | | — | | | | — | | | | — | | | | 495 | |
| Stock-based compensation | | | — | | | | 2,733 | | | | — | | | | — | | | | 79 | | | | 2,812 | |
| Purchase of T2CN common shares from noncontrolling interest and T2CN buy back and cancellation of its common shares | | | — | | | | — | | | | — | | | | — | | | | (2,257 | ) | | | (2,257 | ) |
| Cash dividend to noncontrolling interest shareholders of variable interest entity | | | — | | | | — | | | | — | | | | — | | | | (300 | ) | | | (300 | ) |
| Net income | | | — | | | | — | | | | 44,388 | | | | — | | | | 757 | | | | 45,145 | |
| Components of other comprehensive income (loss): | | | | | | | | | | | | | | | | | | | | | | | | |
| Change in unrealized gain (loss) on marketable securities | | | — | | | | — | | | | — | | | | (282 | ) | | | — | | | | (282 | ) |
| Defined benefit pension plan adjustment | | | — | | | | — | | | | — | | | | 95 | | | | — | | | | 95 | |
| Foreign currency translation adjustments | | | — | | | | — | | | | — | | | | 362 | | | | 531 | | | | 893 | |
| | | | | | | | | | | | | | | | | | | | | | | | |
| Total comprehensive income | | | — | | | | — | | | | — | | | | — | | | | — | | | | 45,851 | |
| | | | | | | | | | | | | | | | | | | |
| Balance as of December 31, 2008 | | | 54,365 | | | | 300,021 | | | | (45,304 | ) | | | (26,261 | ) | | | 8,620 | | | | 237,076 | |
| Issuance of common shares from exercise of stock options and RSUs | | | 630 | | | | 1,320 | | | | — | | | | — | | | | — | | | | 1,320 | |
| Stock-based compensation | | | — | | | | 3,150 | | | | — | | | | — | | | | 127 | | | | 3,277 | |
| Purchase of T2CN common shares from noncontrolling interest | | | — | | | | (112 | ) | | | — | | | | — | | | | (173 | ) | | | (285 | ) |
| Cash dividend to noncontrolling interest shareholders of variable interest entity | | | — | | | | — | | | | — | | | | — | | | | (150 | ) | | | (150 | ) |
| Net loss | | | — | | | | — | | | | (49,085 | ) | | | — | | | | (6,795 | ) | | | (55,880 | ) |
| Components of other comprehensive income (loss): | | | | | | | | | | | | | | | | | | | | | | | | |
| Change in unrealized gain (loss) on marketable securities | | | — | | | | — | | | | — | | | | 67 | | | | — | | | | 67 | |
| Defined benefit pension plan adjustment | | | — | | | | — | | | | — | | | | (68 | ) | | | — | | | | (68 | ) |
| Foreign currency translation adjustments | | | — | | | | — | | | | — | | | | 1,017 | | | | (14 | ) | | | 1,003 | |
| | | | | | | | | | | | | | | | | | | | | | | | |
| Total comprehensive loss | | | — | | | | — | | | | — | | | | — | | | | — | | | | (54,878 | ) |
| | | | | | | | | | | | | | | | | | | |
| Balance as of December 31, 2009 | | | 54,995 | | | | 304,379 | | | | (94,389 | ) | | | (25,245 | ) | | | 1,615 | | | | 186,360 | |
| Issuance of common shares from exercise of stock options and RSUs | | | 402 | | | | 174 | | | | — | | | | — | | | | — | | | | 174 | |
| Stock-based compensation | | | — | | | | 2,961 | | | | — | | | | — | | | | 53 | | | | 3,014 | |
| Acquisition of IAHGames (Note 4) | | | 866 | | | | 2,192 | | | | — | | | | — | | | | 1,192 | | | | 3,384 | |
| Acquisition of UIM (Note 3) | | | — | | | | 178 | | | | — | | | | — | | | | (578 | ) | | | (400 | ) |
| Deconsolidation of T2CN (Note 5) | | | — | | | | (552 | ) | | | — | | | | — | | | | (3,276 | ) | | | (3,828 | ) |
| Cumulative dividend to subsidiary preferred shares (Note 22) | | | — | | | | — | | | | — | | | | — | | | | (148 | ) | | | (148 | ) |
| Net income | | | — | | | | — | | | | 2,650 | | | | — | | | | (1,370 | ) | | | 1,280 | |
| Components of other comprehensive income (loss): | | | | | | | | | | | | | | | | | | | | | | | | |
| Change in unrealized gain (loss) on marketable securities | | | — | | | | — | | | | — | | | | 21,789 | | | | — | | | | 21,789 | |
| Defined benefit pension plan adjustment | | | — | | | | — | | | | — | | | | 31 | | | | — | | | | 31 | |
| Foreign currency translation adjustments | | | — | | | | — | | | | — | | | | 4,744 | | | | 12 | | | | 4,756 | |
| Deconsolidation of T2CN (Note 5) | | | — | | | | — | | | | — | | | | (1,391 | ) | | | 80 | | | | (1,311 | ) |
| | | | | | | | | | | | | | | | | | | | | | | | |
| Total comprehensive income | | | — | | | | — | | | | — | | | | — | | | | — | | | | 26,545 | |
| | | | | | | | | | | | | | | | | | | |
| Balance as of December 31, 2010 | | | 56,263 | | | $ | 309,332 | | | $ | (91,739 | ) | | $ | (72 | ) | | $ | (2,420 | ) | | $ | 215,101 | |
| | | | | | | | | | | | | | | | | | | |
The accompanying notes are an integral part of these consolidated financial statements.
F-7
GIGAMEDIA LIMITED
CONSOLIDATED STATEMENTS OF CASH FLOWS
For the Years Ended December 31, 2008, 2009 and 2010
(in thousands)
| | | | | | | | | | | | | |
| | | 2008 | | | 2009 | | | 2010 | |
| |
| CASH FLOWS FROM OPERATING ACTIVITIES: | | | | | | | | | | | | |
| Net income (loss) | | $ | 45,145 | | | $ | (55,880 | ) | | $ | 1,280 | |
| Adjustments to reconcile net income (loss) to net cash provided by (used in) operating activities: | | | | | | | | | | | | |
| Depreciation | | | 4,031 | | | | 4,358 | | | | 2,092 | |
| Amortization | | | 4,342 | | | | 5,219 | | | | 2,779 | |
| Stock-based compensation | | | 2,780 | | | | 3,277 | | | | 3,014 | |
| Gain on deconsolidation of gaming software and service business | | | — | | | | — | | | | (79,140 | ) |
| Impairment loss on property, plant and equipment | | | — | | | | 1,250 | | | | 278 | |
| Impairment loss on goodwill | | | — | | | | 14,103 | | | | 2,255 | |
| Impairment loss on prepaid licensing fees and intangible assets | | | 1,524 | | | | 23,002 | | | | 2,200 | |
| Provision for bad debt expenses | | | 2,953 | | | | 1,092 | | | | 1,639 | |
| Gain on divestiture of business | | | (11,014 | ) | | | — | | | | — | |
| Loss on disposal of property, plant and equipment | | | 282 | | | | 31 | | | | 125 | |
| Gain on sale of marketable securities | | | (400 | ) | | | — | | | | — | |
| Loss on equity method investments | | | 3,010 | | | | 87 | | | | 20,770 | |
| Impairment loss on marketable securities and investments | | | — | | | | 15,743 | | | | 4,677 | |
| Impairment loss on deconsolidation of T2CN | | | — | | | | — | | | | 22,234 | |
| Gain on fair value changes of warrant derivative | | | — | | | | — | | | | (2,595 | ) |
| Other | | | 300 | | | | 25 | | | | (125 | ) |
| Net changes in operating assets and liabilities, net of business acquisitions and divestitures: | | | | | | | | | | | | |
| Accounts receivable | | | 465 | | | | (5,015 | ) | | | 3,263 | |
| Prepaid expenses | | | (4,373 | ) | | | 1,061 | | | | (2,992 | ) |
| Other current assets | | | (2,304 | ) | | | (553 | ) | | | 2,215 | |
| Accounts payable | | | 33 | | | | (298 | ) | | | 1,867 | |
| Accrued expenses | | | 2,326 | | | | 2,243 | | | | 3,519 | |
| Accrued compensation | | | (2,057 | ) | | | 386 | | | | 1,667 | |
| Player account balances | | | 5,691 | | | | 2,187 | | | | 229 | |
| Other current liabilities | | | 336 | | | | 1,500 | | | | 4,568 | |
| Accrued pension liabilities | | | (167 | ) | | | (25 | ) | | | (39 | ) |
| Prepaid licensing and royalty fees | | | (4,685 | ) | | | (4,216 | ) | | | (3,855 | ) |
| Other | | | 2,532 | | | | (941 | ) | | | (847 | ) |
| | | | | | | | | | |
| Net cash provided by (used in) operating activities | | | 50,750 | | | | 8,636 | | | | (8,922 | ) |
| | | | | | | | | | |
| |
| CASH FLOWS FROM INVESTING ACTIVITIES: | | | | | | | | | | | | |
| Decrease (increase) in restricted cash | | | 4,122 | | | | 187 | | | | (4,068 | ) |
| Cash dividends received from equity method investees | | | — | | | | — | | | | 945 | |
| Proceeds from disposal of marketable securities | | | 25,095 | | | | — | | | | — | |
| Divestiture of business, net of cash transferred | | | 16,471 | | | | 1,006 | | | | — | |
| Purchase of property, plant and equipment | | | (8,814 | ) | | | (5,761 | ) | | | (3,784 | ) |
| Proceeds from disposal of property, plant and equipment | | | 35 | | | | 17 | | | | 119 | |
| Prodeeds from disposal of gaming software and service business, net of transaction costs | | | — | | | | — | | | | 85,669 | |
| Purchase of marketable securities | | | (24,746 | ) | | | (7,052 | ) | | | (1,500 | ) |
| Purchase of investments | | | (190 | ) | | | (2,612 | ) | | | (5,261 | ) |
| Purchase of intangible assets | | | (7,509 | ) | | | (8,807 | ) | | | (2,317 | ) |
| Acquisitions, net of cash acquired | | | (4,642 | ) | | | (285 | ) | | | (5,831 | ) |
| Advances to equity investees | | | — | | | | (637 | ) | | | (13,804 | ) |
| Decrease (increase) in refundable deposits | | | (5,862 | ) | | | 1,986 | | | | (146 | ) |
| Other | | | (380 | ) | | | (120 | ) | | | — | |
| | | | | | | | | | |
| Net cash (used in) provided by investing activities | | | (6,420 | ) | | | (22,078 | ) | | | 50,022 | |
| | | | | | | | | | |
(Continued)
F-8
GIGAMEDIA LIMITED
CONSOLIDATED STATEMENTS OF CASH FLOWS — (Continued)
For the Years Ended December 31, 2008, 2009 and 2010
(in thousands)
| | | | | | | | | | | | | |
| | | 2008 | | | 2009 | | | 2010 | |
| CASH FLOWS FROM FINANCING ACTIVITIES: | | | | | | | | | | | | |
| Proceeds from (repayment of) short-term borrowings | | | (18,058 | ) | | | 7,261 | | | | (12,543 | ) |
| Cash received from the exercise of stock options | | | 495 | | | | 1,320 | | | | 174 | |
| Cash dividend to noncontrolling shareholders of variable interest entity | | | (300 | ) | | | (150 | ) | | | — | |
| Other | | | (13 | ) | | | (5 | ) | | | 5 | |
| | | | | | | | | | |
| Net cash (used in) provided by financing activities | | | (17,876 | ) | | | 8,426 | | | | (12,364 | ) |
| | | | | | | | | | |
| | | | | | | | | | | | | |
| Exchange difference | | | 936 | | | | (356 | ) | | | (410 | ) |
| | | | | | | | | | |
| | | | | | | | | | | | | |
| Cash balance included in assets held for sale and retained ownership of gaming software and service business | | | — | | | | (35,015 | ) | | | — | |
| | | | | | | | | | |
| Deconsolidation of T2CN | | | — | | | | — | | | | (12,903 | ) |
| | | | | | | | | | |
| NET INCREASE (DECREASE) IN CASH AND CASH EQUIVALENTS | | | 27,390 | | | | (40,387 | ) | | | 15,423 | |
| CASH AND CASH EQUIVALENTS AT BEGINNING OF YEAR | | | 68,563 | | | | 95,953 | | | | 55,566 | |
| | | | | | | | | | |
| CASH AND CASH EQUIVALENTS AT END OF YEAR | | $ | 95,953 | | | $ | 55,566 | | | $ | 70,989 | |
| | | | | | | | | | |
| | | | | | | | | | | | | |
| SUPPLEMENTAL DISCLOSURES OF CASH FLOW INFORMATION: | | | | | | | | | | | | |
| Interest paid during the year | | $ | 1,008 | | | $ | 388 | | | $ | 313 | |
| | | | | | | | | | |
| Income tax paid during the year | | $ | 1,412 | | | $ | 1,230 | | | $ | 3,799 | |
| | | | | | | | | | |
| | | | | | | | | | | | | |
| NON-CASH FINANCING AND INVESTING ACTIVITIES: | | | | | | | | | | | | |
| Change in unrealized holding gain (loss) on available-for-sale securities | | $ | (282 | ) | | $ | 67 | | | $ | 21,789 | |
| | | | | | | | | | |
| Issuance of common shares for acquisition | | $ | — | | | $ | — | | | $ | 2,192 | |
| | | | | | | | | | |
| Divestiture of business — consideration receivable | | $ | 1,006 | | | $ | — | | | $ | — | |
| | | | | | | | | | |
The accompanying notes are an integral part of these consolidated financial statements.
F-9
GIGAMEDIA LIMITED
NOTES TO THE CONSOLIDATED FINANCIAL STATEMENTS
YEARS ENDED DECEMBER 31, 2008, 2009 AND 2010
| | |
| NOTE 1. | | BUSINESS OVERVIEW, BASIS OF PRESENTATION, AND SUMMARY OF SIGNIFICANT ACCOUNTING POLICIES |
(a) Business Overview
GigaMedia Limited (referred to hereinafter as GigaMedia, our Company, we, us, or our) is a provider of online entertainment software and services, with headquarters in Taipei, Taiwan.
We conduct our online entertainment business in two business segments: the gaming software and service business, which develops and licenses software for online real-money gaming solutions and applications; and the Asian online game and service business, which develops a wide range of online games for the Asian and worldwide market.
The gaming software and service business develops and licenses online poker and casino gaming software solutions and application services, primarily targeting continental European markets. As a software developer and support service provider, we offer software solutions for online gaming, which we license under a software license and support service contract. In April 2010, we sold a 60 percent interest in our online gaming software and service business to Mangas Gaming S.A.S, a French Corporation, now renamed as BetClic Everest Group (“BetClic”). (See Note 6, “Divestitures”, for additional information).
The Asian online game and service business operates a suite of play-for-fun online games and provides related services, mainly targeting online game players across Asia, including Greater China and Southeast Asia.
(b) Basis of Presentation
In September 2008, we sold the remaining portion of our legacy Internet access and service business (See Note 6, “Divestitures”, for additional information). The Internet access and service business has been accounted for as a discontinued operation under accounting principles generally accepted in the United States of America (“GAAP”) and, therefore, the results of operations of the Internet access and service business have been removed from our Company’s results of continuing operations for all periods presented.
F-10
GIGAMEDIA LIMITED
NOTES TO THE CONSOLIDATED FINANCIAL STATEMENTS —
(Continued)
YEARS ENDED DECEMBER 31, 2008, 2009 AND 2010
As a result of the definitive agreement entered into with BetClic in December 2009, 60 percent of substantially all of the operating assets of our gaming software and service business, including certain liabilities associated with these assets, are presented as held for sale as of December 31, 2009. The gaming software and service business does not qualify as a component that may be reported as discontinued operations due to our significant continuing involvement in the component after the disposal transaction. After the sale transaction was completed in April 2010, we deconsolidated the results of the gaming software and service business and began accounting for the remaining 40 percent interest under the equity method of accounting. (See Note 6, “Divestitures”, for additional information).
Principles of Consolidation
The Consolidated Financial Statements include the accounts of GigaMedia and our wholly-owned, majority-owned and majority-controlled subsidiaries after elimination of all inter-company accounts and transactions. In addition, the accounts of our Company’s variable-interest entities (“VIE”), as defined by the Financial Accounting Standards Board (“FASB”), are included in the Consolidated Financial Statements. (Please refer to Note 3, “Variable-Interest Entities”). The accounting policies for other less than majority-owned investments are described in Note 1 below within the paragraphs headed “Marketable Securities” and “Investments”.
Foreign Currency Translation
The Consolidated Financial Statements of our Company and our subsidiaries have been reported in U.S. dollars. Assets and liabilities denominated in non-U.S. currency are translated to U.S. dollars at year-end exchange rates. Income and expense items are translated at weighted-average rates of exchange prevailing during the year. Cumulative translation adjustments resulting from this process are charged or credited to other comprehensive income within equity. Gains and losses on foreign currency transactions are included in other income and expenses. Cumulative translation adjustments as of December 31, 2008, 2009 and 2010 were ($26.9) million, ($25.9) million, and ($22.6) million, respectively.
F-11
GIGAMEDIA LIMITED
NOTES TO THE CONSOLIDATED FINANCIAL STATEMENTS —
(Continued)
YEARS ENDED DECEMBER 31, 2008, 2009 AND 2010
(c) Summary of significant accounting policies
Use of Estimates
The preparation of Consolidated Financial Statements in conformity with GAAP requires management to make estimates and assumptions that affect the reported amounts of assets and liabilities and disclosures of contingent assets and liabilities at the dates of the Consolidated Financial Statements and the reported amounts of revenues and expenses during the reporting periods. Actual results could differ from those estimates.
Revenue Recognition
General
Our Company recognizes revenues when persuasive evidence of an arrangement exists, delivery occurs or services are rendered, the sales price is fixed or determinable and collectability is reasonably assured.
We present the sales taxes assessed by governmental authorities on our revenue transactions on a net basis in our Consolidated Financial Statements.
Multiple-Element Arrangements
Our Company enters into multiple-element revenue arrangements, which may include any combination of services, software, and/or products. To the extent that a deliverable in a multiple-element arrangement is subject to specific accounting guidance, whether and/or how to separate multiple deliverable arrangements into separate units of accounting (separability) and how to allocate the arrangement consideration among those separate units of accounting (allocation) for that deliverable is accounted for in accordance with such specific guidance.
In addition to the aforementioned general policies, the following are the specific revenue recognition policies for each major category of revenue.
F-12
GIGAMEDIA LIMITED
NOTES TO THE CONSOLIDATED FINANCIAL STATEMENTS —
(Continued)
YEARS ENDED DECEMBER 31, 2008, 2009 AND 2010
Gaming Software and Service Revenues
Prior to our sale of a 60 percent interest in our online gaming software and service business in April 2010, gaming software and service revenues were related to software products we developed and licensed and support services we provided for online real-money gaming solutions and applications.
The results of a software licensee of our Company, Ultra Internet Media, S.A. (“UIM”) had been incorporated into our Consolidated Financial Statements as UIM met the criteria of a VIE as defined by the FASB Accounting Standards Codification. UIM and GigaMedia were separately owned. (See Note 3, “Variable-Interest Entities”, for additional information). Our software licensing and support service revenues were based upon a percentage of gross receipts generated by UIM’s online gaming operations, and were recognized monthly. Software licensing and support service revenues we received from providing such services to UIM had been eliminated in consolidation.
UIM generated revenues by providing and promoting online games of skill and chance that were available on its free download gaming software. We considered multiple-element revenue arrangements involving UIM’s provision of software and software-related elements to customers. UIM’s online gaming service was inseparable from the software element involved and UIM did not sell each element separately. UIM’s online gaming service did not involve significant production, modification, or customization of the gaming software. Revenues derived from UIM’s online gaming software platform were recognized at the time games were played and were net of player winnings. Transaction fee revenues derived from UIM’s online multi-player poker platform were recognized as services were provided.
Asian Online Game and Service Revenues
Asian Online game and service revenues are related to our Asian online game and service business that operates play-for-fun games online to players across Asia.
F-13
GIGAMEDIA LIMITED
NOTES TO THE CONSOLIDATED FINANCIAL STATEMENTS —
(Continued)
YEARS ENDED DECEMBER 31, 2008, 2009 AND 2010
Online game revenues are earned through the sale of online game points, pre-paid cards, game packs and also through the sublicensing of certain games to distributors. Virtual online game points are sold to distributors or end-users who can make the payments through credit cards, Internet ATMs or telecommunication service operators. Physical pre-paid cards and game packs are sold through distributors and convenience stores. Proceeds from sales of physical cards and game packs, net of sales discounts, and online game points are deferred when received and revenue is recognized upon the actual usage of the playing time or in-game virtual items by the end-users; over the estimated useful life of virtual items; or when the sold game points expire and can no longer be used to access the online games or products in accordance with our published game points expiration policy. Sublicensing revenues from the distributors are recognized based on end users’ activation to the game system and when the performance obligations have been completed.
We report sales of virtual online game points on a gross basis. In the sales of virtual online game points, we act as principal and we have latitude in establishing price. Fixed percentage fees retained by service providers for payment processing related to our online game services are recognized as cost of online game revenues. We report sublicensing revenues on a net basis. In the sublicense agreements, we act as agent and the distributors are responsible for the operating and the marketing.
Online game and service revenues also include revenues derived from online advertising arrangements, sponsorship arrangements, or a combination of both. These service arrangements allow advertisers to place advertisements on particular areas of our Company’s websites and online game platforms over a stated period of time. Service revenues from online advertising arrangements are recognized ratably over the displayed period of the contract when the collectability is reasonably assured.
F-14
GIGAMEDIA LIMITED
NOTES TO THE CONSOLIDATED FINANCIAL STATEMENTS —
(Continued)
YEARS ENDED DECEMBER 31, 2008, 2009 AND 2010
Revenue Included within Discontinued Operations
For 2008, 2009 and 2010, a portion of our Company’s revenue was generated from our Internet access and service business. We disposed of the remaining portion of our Internet access and service business in September 2008, and as a result, have classified the income from these revenue-generating activities as part of discontinued operations. (See Note 6, “Divestitures”, for additional information).
Our Internet access and service business revenues were recorded net of discounts and net of fees paid to cable companies, and were recognized on a straight-line basis over the subscription period or for the period in which the service was performed. Any advanced payment receipts were recorded as deferred revenues included in other current liabilities in our Consolidated Balance Sheets and were amortized over the subscription period. The sale of other Internet access-related products and rental income from the lease of Internet access-related equipment to subscribers were recognized when products were delivered or services were provided.
Player Account Balances
Player account balances were related to player deposits from our gaming software and service business. Player account balances were presented as current liabilities, which were first accrued for in full upon the receipt of player deposits, and increased or decreased based on player activities, including player wins or losses, withdrawals and refunds. (See Note 6, “Divestitures”, for additional information).
Deferred Revenues
Deferred revenues are included in other current liabilities, and consist of the prepaid income related to our Asian online game and service business.
Operating Costs
Operating costs primarily consist of processing costs, online game royalties, bandwidth, production costs for prepaid game cards and game packs, amortization of intangible assets, customer service department costs, depreciation, maintenance and other overhead expenses directly attributable to our online games.
F-15
GIGAMEDIA LIMITED
NOTES TO THE CONSOLIDATED FINANCIAL STATEMENTS —
(Continued)
YEARS ENDED DECEMBER 31, 2008, 2009 AND 2010
Prepaid Licensing and Royalty Fees
Our Company, through our subsidiaries (including VIE subsidiaries), routinely enters into agreements with licensors to acquire licenses for using, marketing, distributing, selling and publishing of multi-player online games.
Prepaid licensing fees paid to licensors are capitalized when technological feasibility is achieved, and amortized on a straight-line basis over the shorter of the useful economic life of the relevant online game or license period, which is usually within two to five years. The annual amortization is modified if the amount computed using the ratio that current gross revenues for a game license bear to the total of current and anticipated future gross revenues for that game license is greater than the amount computed using the straight-line method.
Prepaid royalty fees and related costs are initially deferred when paid to licensors and recognized as operating costs in the period in which the related online game revenue is recognized.
Fair Value Measurements
Our Company generally determines or calculates the fair value of financial instruments using quoted market prices in active markets when such information is available or using appropriate present value or other valuation techniques, such as discounted cash flow analyses, incorporating adjusted available market discount rate information and our Company’s estimates for non-performance and liquidity risk. These techniques rely extensively on the use of a number of assumptions, including the discount rate, credit spreads, and estimates of future cash flows. (See Note 10, “Fair Value Measurements”, for additional information).
Cash Equivalents
Cash equivalents are short-term, highly liquid investments that are readily convertible to known amounts of cash and so near to their maturity that they present relatively insignificant risk from changes in interest rates. Commercial paper, negotiable certificates of deposit, time deposits and bank acceptances with original maturities of three months or less are considered to be cash equivalents.
F-16
GIGAMEDIA LIMITED
NOTES TO THE CONSOLIDATED FINANCIAL STATEMENTS —
(Continued)
YEARS ENDED DECEMBER 31, 2008, 2009 AND 2010
Marketable Securities
All of our Company’s investments in marketable securities are classified as available-for-sale. These marketable securities are stated at fair value with any unrealized gains or losses recorded in accumulated other comprehensive income (loss) within equity until realized.
Other-than-temporary impairments, if any, are charged to non-operating expense in the period in which the loss occurs. In determining whether an other-than-temporary impairment has occurred, our Company primarily considers, among other factors, the length of the time and the extent to which the fair value of an investment has been at a value less than cost. When an other-than-temporary loss is recorded, the fair value of the investment becomes the new cost basis of the investment and is not adjusted for subsequent recoveries in fair value. Realized gains and losses also are included in non-operating income and expense in the Consolidated Statements of Operations. (See Note 10, “Fair Value Measurements”, for additional information).
Investments
Equity investments in non-publicly traded securities of companies over which our Company has no ability to exercise significant influence are accounted for under the cost method.
F-17
GIGAMEDIA LIMITED
NOTES TO THE CONSOLIDATED FINANCIAL STATEMENTS —
(Continued)
YEARS ENDED DECEMBER 31, 2008, 2009 AND 2010
Equity investments in companies over which our Company has the ability to exercise significant influence but does not hold a controlling financial interest are accounted for under the equity method and our Company’s income or loss on equity method investments is recorded in non-operating income or expenses. The difference between the cost of the acquisition and our Company’s share of the fair value of the net identifiable assets is recognized as goodwill and is included in the carrying amount of the investment. When our Company’s carrying value in an equity method investee is reduced to zero, no further losses are recorded in our Consolidated Financial Statements unless our Company guaranteed obligations of the investee or has committed to additional funding. When the investee subsequently reports income, our Company will not record its share of such income until it equals the amount of its share of losses not previously recognized.
Unrealized losses that are considered other-than-temporary, if any, are charged to non-operating expenses. Realized gains and losses, measured against carrying amount, are also included in non-operating income and expenses. (See Note 10, “Fair Value Measurements”, for additional information).
Allowance for Doubtful Accounts
An allowance for doubtful accounts is provided based on an evaluation of the collectability of accounts receivable,and other receivables. An allowance for doubtful accounts is also provided, when considered necessary, for loans receivable. We review the collectability of loans receivable on an individual basis and the evaluation primarily consists of an analysis based upon current information available about the borrower.
For those accounts in which a loss is probable, we record a specific reserve. Receivable losses are charged against the allowance when the Company believes the uncollectability of the receivable is confirmed. Subsequent recoveries, if any, are credited to the allowance.
F-18
GIGAMEDIA LIMITED
NOTES TO THE CONSOLIDATED FINANCIAL STATEMENTS —
(Continued)
YEARS ENDED DECEMBER 31, 2008, 2009 AND 2010
Property, Plant and Equipment
Property, plant and equipment are stated at cost, less accumulated depreciation. Depreciation is provided on a straight-line basis over useful lives that correspond to categories as follows:
| | | |
| Categories | | Years |
| Buildings | | 50 |
| Information and communication equipment | | 2 to 5 |
| Office furniture and equipment | | 3 to 5 |
| Leasehold improvements | | 3 to 5 |
Leasehold improvements are depreciated over the life of the lease or the economic useful life of the assets, whichever is shorter. Improvements and replacements are capitalized and depreciated over their estimated useful lives, while ordinary repairs and maintenance are expensed as incurred.
In September 2008, we entered into agreements to lease certain of our Company’s land and buildings to a third party under operating leases, which were renewed in September 2010, and which expire no later than September 2013. As of December 31, 2009 and 2010, the carrying amount of the land and buildings under lease was $1.2 million and $1.3 million, respectively. The rental income under the operating lease amounted to $21 thousand, $50 thousand and $41 thousand for 2008, 2009 and 2010, respectively. The minimum rental income to be received under this operating lease is $204 thousand through September 2013.
Acquisitions
Before January 1, 2009, our Company accounted for its business acquisitions using the purchase method as required by the FASB. Under the purchase method, the acquiring company allocated the purchase price to the assets acquired and liabilities assumed based on their estimated fair values at the date of acquisition, including intangible assets that could be identified. The purchase price in excess of the fair value of the net assets and liabilities identified was recorded as goodwill. Business acquisitions that our Company enters into after January 1, 2009 are being accounted for in accordance with the new accounting guidance issued by the FASB using the acquisition method. Under the new accounting guidance, our Company recognizes and measures the identifiable assets acquired, the liabilities assumed and any noncontrolling interest at their acquisition-date fair values, with limited exceptions. Acquisition-related costs will be generally expensed as incurred.
F-19
GIGAMEDIA LIMITED
NOTES TO THE CONSOLIDATED FINANCIAL STATEMENTS —
(Continued)
YEARS ENDED DECEMBER 31, 2008, 2009 AND 2010
Intangible Assets and Goodwill
Intangible assets with finite lives are amortized by the straight-line method over their estimated useful lives, ranging from three to nine years. Intangible assets with indefinite useful lives are not amortized. Goodwill is not amortized.
Impairment of Intangible Assets, Goodwill and Long-Lived Assets
Potential impairment of intangible assets with indefinite useful lives is evaluated, at the reporting unit level, at least annually, or whenever events or changes in circumstances indicate that the carrying value of an asset might not be recoverable from its related future discounted cash flows. Impairment is measured as the difference between the carrying amounts and the fair value of the assets, and is recognized as a loss from operations.
Potential impairment of goodwill is tested annually, or sooner when circumstances indicate an impairment may exist, using a fair-value approach at the reporting unit level. A reporting unit is the operating segment, or a business, which is one level below that operating segment (the “component” level) if discrete financial information is prepared and regularly reviewed by management at the segment level. Components are aggregated as a single reporting unit if they have similar economic characteristics.
Potential impairment of long-lived assets other than goodwill and intangible assets not being amortized, is evaluated, at least annually or whenever events or changes in circumstances indicate that the carrying value of an asset might not be recoverable from its related future undiscounted cash flows. If such assets are considered to be impaired, the impairment to be recognized is measured by the extent to which the carrying amount of the assets exceeds the fair value of the assets. When impairment is identified, the carrying amount of the asset is reduced to its estimated fair value, and is recognized as a loss from operations. (See Note 10, “Fair Value Measurements”, for additional information).
F-20
GIGAMEDIA LIMITED
NOTES TO THE CONSOLIDATED FINANCIAL STATEMENTS —
(Continued)
YEARS ENDED DECEMBER 31, 2008, 2009 AND 2010
Software Cost
Costs to develop our gaming software and Asian online game products are capitalized after technological feasibility has been established, and when the product is available for general release to customers, costs are expensed. Costs incurred prior to the establishment of technological feasibility are expensed when incurred and are included in product development and engineering expenses. Capitalized amounts are amortized using the straight-line method, which is applied over the estimated useful economic life of the software, ranging from three to five years. The annual amortization is modified if the amount computed using the ratio that current gross revenues for a product bear to the total of current and anticipated future gross revenues for that product is greater than the amount computed using the straight-line method.
We capitalize certain costs incurred to purchase or to internally create and implement internal-use computer software, which includes software coding, installation, testing and certain data conversion. These capitalized costs are amortized on a straight-line basis over the shorter of the useful economic life of the software or its contractual license period, which range from three to five years.
Product Development and Engineering
Product development and engineering expenses primarily consist of research compensation, depreciation, and amortization, and are expensed as incurred.
Advertising
Direct-response advertising costs incurred related to the acquisition or origination of a customer relationship are capitalized and deferred. The deferred costs are recognized in the Consolidated Statements of Operations over the estimated lives of customer relationships. Costs of communicating advertising are recorded as expenses as advertising airtime is used. Other advertising expenditures are expensed as incurred. Subsequent to the sale of a 60 percent interest in our online gaming and software service business in April 2010, deferred costs related to advertising have not been significant.
F-21
GIGAMEDIA LIMITED
NOTES TO THE CONSOLIDATED FINANCIAL STATEMENTS —
(Continued)
YEARS ENDED DECEMBER 31, 2008, 2009 AND 2010
Advertising expenses incurred in 2008, 2009 and 2010 totaled $60.1 million, $63.6 million and $12.7 million, respectively (including $42 thousand, $0, and $0 reported in discontinued operations in 2008, 2009 and 2010, respectively). As of December 31, 2009 and 2010, prepaid advertising amounted to $6.8 million (of which $6.8 million is included in assets held for sale and retained ownership of gaming software and service business, see Note 6, “Divestiture”, for additional information) and $20 thousand, respectively.
Leases
Leases for which substantially all of the risks and rewards of ownership remain with the leasing company are accounted for as operating leases. Payments made under operating leases,net of any incentives received by our Company from the leasing company,are charged to the Consolidated Statements of Operations on a straight-line basis over the lease periods.
Leases are classified as capital leases whenever the terms of the lease transfer substantially all the risks and rewards of ownership to the lessee. Assets held under capital leases are recognized as assets of our Company at their fair value at the inception of the lease or, if lower, at the present value of the minimum lease payments. The corresponding liability to the lessor is included in the balance sheet as a lease obligation. Lease payments are apportioned between finance charges and reduction of the lease obligation so as to achieve a constant rate of interest on the remaining balance of the liability. Finance charges are charged directly to profit or loss.
F-22
GIGAMEDIA LIMITED
NOTES TO THE CONSOLIDATED FINANCIAL STATEMENTS —
(Continued)
YEARS ENDED DECEMBER 31, 2008, 2009 AND 2010
Share-Based Compensation
Share-based compensation represents the cost related to share-based awards granted to employees. We measure share-based compensation cost at the grant date, based on the estimated fair value of the award. Share-based compensation is recognized for the portion of the award that is ultimately expected to vest and the cost is amortized on a straight-line basis (net of estimated forfeitures) over the vesting period. Our Company estimates the fair value of stock options using the Black-Scholes valuation model. The cost is recorded in operating costs and operating expenses in the Consolidated Statement of Operations based on the employees’ respective function.
For shares and stock options granted to non-employees, we measure the fair value of the equity instruments granted at the earlier of the performance commitment date or when the performance is completed.
Retirement Plan and Net Periodic Pension Cost
Under our defined benefit pension plan, net periodic pension cost, which includes service cost, interest cost, expected return on plan assets, amortization of unrecognized net transition obligation and gains or losses on plan assets, is recognized based on an actuarial valuation report. We recognize the funded status of pension plans and non-pension post-retirement benefit plans (retirement-related benefit plans) as an asset or a liability in the Consolidated Balance Sheets.
Under our defined contribution pension plans, net periodic pension cost is recognized as incurred.
Comprehensive Income (Loss)
Comprehensive income (loss) is recorded as a component of equity. Our Company’s comprehensive income (loss) consists of net income or loss, foreign currency translation adjustments, changes in unrealized holding gains and losses on marketable securities, and unrecognized actuarial gains or losses related to our defined benefit pension plan.
F-23
GIGAMEDIA LIMITED
NOTES TO THE CONSOLIDATED FINANCIAL STATEMENTS —
(Continued)
YEARS ENDED DECEMBER 31, 2008, 2009 AND 2010
Accounting for Income Taxes
The asset and liability method is used in accounting for income taxes. Under this method, deferred tax assets and liabilities are determined based on the differences between financial reporting and tax bases of assets and liabilities. We recognize the tax benefit from the purchase of equipment and technology, research and development expenditures, employee training, and certain equity investments using the flow-through method. Net operating loss carryforwards and investment credits are measured using the enacted tax rate and laws that will be in effect when the differences are expected to reverse. A valuation allowance is established when necessary to reduce deferred tax assets to the amount that will more-likely-than-not be realized. In assessing the likelihood of realization, management considers estimates of future taxable income.
In addition, we recognize the financial statement impact of a tax position when it is more-likely-than-not that the position will be sustained upon examination. If the tax position meets the more-likely-than-not recognition threshold, the tax effect is recognized at the largest amount of the benefit that has greater than a 50 percent likelihood of being realized upon ultimate settlement. The interest and penalties are reflected as income taxes expenses in the Consolidated Financial Statements.
Earnings Per Share
Basic earnings per share is computed by dividing the net income available to common shareholders for the period by the weighted average number of common shares outstanding during the period. Diluted earnings per share is computed by dividing the net income for the period by the weighted average number of common shares and potential common shares outstanding during the period. Potential common shares, composed of incremental common shares issuable upon the exercise of warrants and options in all periods, are included in the computation of diluted earnings per share to the extent such shares are dilutive. Diluted EPS also takes into consideration the effect of diluted securities issued by subsidiaries. In a period in which a loss is incurred, only the weighted average number of common shares issued and outstanding is used to compute the diluted loss per share as the inclusion of potential common shares would be antidilutive. Therefore, for the year ended December 31, 2009, basic and diluted earnings per share are the same.
F-24
GIGAMEDIA LIMITED
NOTES TO THE CONSOLIDATED FINANCIAL STATEMENTS —
(Continued)
YEARS ENDED DECEMBER 31, 2008, 2009 AND 2010
Noncontrolling Interest
We adopted the new accounting guidance issued by the FASB for noncontrolling interest on January 1, 2009. This guidance requires that the noncontrolling interest in the equity of a subsidiary be accounted for and reported as equity, provides revised guidance on the treatment of net income and losses attributable to the noncontrolling interest and changes in ownership interests in a subsidiary, and requires additional disclosures that identify and distinguish between the interests of the controlling and noncontrolling owners. As a result, we have retrospectively applied the presentation and disclosure requirements of the new standard and adjusted prior periods for comparative purposes as required. Changes in our Company’s ownership interest in a subsidiary that do not result in deconsolidation are accounted for as equity transactions. Any retained noncontrolling equity investment upon the deconsolidation of a subsidiary is initially measured at fair value.
Recent Accounting Pronouncements
In December 2010, the FASB issued updated guidance that modifies the goodwill impairment test. Goodwill is tested for impairment using a two-step process. The first step is to identify potential impairments by comparing the estimated fair value of a reporting unit to its carrying value, including goodwill. If the carrying value of a reporting unit exceeds the estimated fair value, a second step is performed to measure the amount of impairment, if any. The second step is to determine the implied fair value of the reporting unit’s goodwill, measured in the same manner as goodwill is recognized in a business combination, and compare the implied fair value with the carrying amount of the goodwill. If the carrying amount exceeds the implied fair value of the reporting unit’s goodwill, an impairment loss is recognized in an amount equal to that excess.
F-25
GIGAMEDIA LIMITED
NOTES TO THE CONSOLIDATED FINANCIAL STATEMENTS —
(Continued)
YEARS ENDED DECEMBER 31, 2008, 2009 AND 2010
The updated guidance requires that, if the carrying amount of a reporting unit becomes zero or negative, the second step of the impairment test must be performed when it is more likely than not that a goodwill impairment loss exists. In considering whether it is more likely than not that an impairment loss exists, a company is required to evaluate qualitative factors, including the factors presented in existing guidance that trigger an interim impairment test of goodwill (e.g., a significant adverse change in business climate or an anticipated sale of a reporting unit). The provisions of the guidance were effective for annual reporting periods beginning after December 15, 2010. The adoption is not expected to have a material impact on our Consolidated Financial Statements.
In January 2010, the FASB issued additional disclosure requirements for fair value measurements. In accordance with the new guidance, the fair value hierarchy disclosures are to be further disaggregated by class of assets and liabilities. A class is often a subset of assets or liabilities within a line item in the statement of financial position. In addition, significant transfers between Levels 1 and 2 of the fair value hierarchy are required to be disclosed. These additional requirements became effective for our Company on January 1, 2010. These amendments did not have a material impact on our Consolidated Financial Statements;however they required additional disclosures. In addition, the guidance requires more detailed disclosures of the changes in Level 3 instruments;however, changes relating to Level 3 instruments will not be effective for our Company until reporting periods beginning after December 31, 2010. These disclosures are not expected to have a material impact on our Consolidated Financial Statements.
In October 2009, the FASB issued amended revenue recognition guidance for arrangements with multiple deliverables. The new guidance eliminates the residual method of revenue recognition and allows the use of management’s best estimate of selling price for individual elements of an arrangement when vendor-specific objective evidence (VSOE), vendor objective evidence (VOE) or third-party evidence (TPE) is unavailable. The changes will be effective for our Company on January 1, 2011. Management is in the process of determining the impact that the adoption of this guidance will have on our Consolidated Financial Statements.
F-26
GIGAMEDIA LIMITED
NOTES TO THE CONSOLIDATED FINANCIAL STATEMENTS —
(Continued)
YEARS ENDED DECEMBER 31, 2008, 2009 AND 2010
In October 2009, the FASB issued guidance which amends the scope of existing software revenue recognition accounting. Tangible products containing software components and non-software components that function together to deliver the product’s essential functionality will be scoped out of the accounting guidance on software and accounted for based on other appropriate revenue recognition guidance. This guidance must be adopted in the same period that our Company adopts the amended accounting for arrangements with multiple deliverables described in the preceding paragraph. The changes will be effective for our Company on January 1, 2011. Management is in the process of determining the impact that the adoption of this guidance will have on our Consolidated Financial Statements.
NOTE 2.EARNINGS PER SHARE
The following table provides a reconciliation of the denominators of the basic and diluted per share computations:
| | | | | | | | | | | | | |
| (in thousand shares) | | 2008 | | | 2009 | | | 2010 | |
Weighted average number of outstanding shares | | | | | | | | | | | | |
| Basic | | | 54,110 | | | | 54,524 | | | | 55,834 | |
| Effect of dilutive securities | | | | | | | | | | | | |
| Employee share-based compensation | | | 6,042 | | | | — | | | | 3,457 | |
| | | | | | | | | | |
| Diluted | | | 60,152 | | | | 54,524 | | | | 59,291 | |
| | | | | | | | | | |
Options to purchase 5,115 thousand shares of common stock were not included in dilutive securities for the year ended December 31, 2009, as the effect would be anti-dilutive.
F-27
GIGAMEDIA LIMITED
NOTES TO THE CONSOLIDATED FINANCIAL STATEMENTS —
(Continued)
YEARS ENDED DECEMBER 31, 2008, 2009 AND 2010
NOTE 3.VARIABLE-INTEREST ENTITIES
UIM
Through the date of sale to BetClic in April 2010, our Company had a software license and support service contract with UIM to provide Internet software and support services for UIM’s online gaming operations. The contract allowed us to charge UIM a percentage of its gross receipts resulting from UIM’s online gaming operations. The percentage of gross receipts varied depending upon the software and support services provided to UIM. We analyzed our contractual relationships with UIM and determined that we were the primary beneficiary of UIM. As a result of such determination, we had incorporated the results of UIM into our Consolidated Financial Statements, even though we did not own any of UIM’s equity. In connection with the sale to BetClic, we purchased 100 percent of the ownership in UIM from its shareholders for $400 thousand and adjusted additional paid in capital and noncontrolling interest by approximately $178 thousand and ($578) thousand, respectively.
The net assets (liabilities), total assets and total liabilities of UIM were approximately $(932) thousand, $82.9 million and $83.8 million, respectively, as of December 31, 2009. For the years ended December 31, 2008 and 2009, and the period from January to March 2010, total revenue and net income (loss) of UIM were as follows:
| | | | | | | | | | | | | |
| (in US$ thousands) | | 2008 | | | 2009 | | | 2010 | |
| Total revenue | | $ | 144,765 | | | $ | 112,694 | | | $ | 25,820 | |
| | | | | | | | | | |
| Net (loss) income | | $ | (206 | ) | | $ | (1,226 | ) | | $ | 1,514 | |
| | | | | | | | | | |
F-28
GIGAMEDIA LIMITED
NOTES TO THE CONSOLIDATED FINANCIAL STATEMENTS —
(Continued)
YEARS ENDED DECEMBER 31, 2008, 2009 AND 2010
T2CN Holding Limited (“T2CN”)
Pursuant to various agreements entered into among Shanghai T2 Entertainment Co., (“T2 Entertainment), T2 Information Technology (Shanghai) Co., Ltd. (“T2 Technology”) and the equity interest owners of T2 Entertainment, until June 30, 2010, T2CN, through its wholly owned subsidiary T2 Technology, had effective control over T2 Entertainment and was considered the primary beneficiary of T2 Entertainment. T2 Entertainment was established to hold the necessary licenses required for the operation of our Asian online game and services business in the PRC. Accordingly, from the date that we consolidated T2CN through July 1, 2010, the date we deconsolidated T2CN (see note 5,“Deconsolidation”, for additional information), the financial results of T2 Entertainment were included in the Consolidated Financial Statements.
Pursuant to various agreements entered into among Shanghai T2 Advertisement Co., Ltd. (“T2 Advertisement”), T2 Technology and the equity interest owners of T2 Advertisement, until June 30, 2010, T2CN, through its wholly owned subsidiary T2 Technology, had effective control over T2 Advertisement and was considered the primary beneficiary of T2 Advertisement. T2 Advertisement was established to hold the necessary licenses required for the operation of our Asian online game related advertisement services in the PRC. Accordingly, from the date that we consolidated T2CN through July 1, 2010, the date we deconsolidated T2CN (see note 5, “Deconsolidation”, for additional information), the financial results of T2 Advertisement were included in the Consolidated Financial Statements.
T2 Technology also entered into various agreements with Shanghai Jinyou Network & Technology Co., Ltd. (“Jinyou”) and the equity interest owners of Jinyou. Until June 30, 2010, T2CN, through its wholly owned subsidiary T2 Technology, had effective control over Jinyou and was considered the primary beneficiary of Jinyou. In September 2008, Jinyou acquired an Internet Content Provider (“ICP”) license required for the operation of our Asian online game and services business in the People’s Republic of China (“PRC”) and the agreements entered into by and among T2 Technology, Jinyou and the equity interest owners of Jinyou became effective. Accordingly, the financial results of Jinyou were included in the Consolidated Financial Statements starting from September 2008 through July 1, 2010.
F-29
GIGAMEDIA LIMITED
NOTES TO THE CONSOLIDATED FINANCIAL STATEMENTS —
(Continued)
YEARS ENDED DECEMBER 31, 2008, 2009 AND 2010
As a result of a dispute that arose in July 2010 with T2CN’s former Chief Executive Officer, we have been prevented from obtaining the financial information necessary to report the financial results of T2CN, and we effectively lost control over T2CN’s financial reporting process. Therefore, we deconsolidated T2CN’s results with effect from July 1, 2010. As a result, we also ceased treating T2 Entertainment, T2 Advertisement and Jinyou as our variable-interest entities. (See Note 5, “Deconsolidation”, for additional information).
The net assets, total assets and total liabilities in the aggregate of T2 Entertainment, T2 Advertisement and Jinyou were approximately $1.6 million, $18.2 million and $16.6 million, respectively, as of December 31, 2009, and $2.5 million, $20.9 million and $18.4 million, respectively, as of July 1, 2010 (the date of deconsolidation). For the years ended December 31, 2008, 2009 and the period from January to June 2010, total revenue and net income (loss) in the aggregate of T2 Entertainment, T2 Advertisement and Jinyou recorded in our consolidated financial statements were as follows:
| | | | | | | | | | | | | |
| (in US$ thousands) | | 2008 | | | 2009 | | | 2010 | |
| Total revenues | | $ | 20,312 | | | $ | 18,673 | | | $ | 10,126 | |
| | | | | | | | | | |
| Net income (loss) | | $ | 1,571 | | | $ | (2,990 | ) | | $ | 834 | |
| | | | | | | | | | |
NOTE 4. ACQUISITIONS
In July 2010, we began consolidating Infocomm Asia Holdings Pte. Ltd. (‘IAHGames”), an online game operator, publisher and distributor in Southeast Asia. We acquired IAHGames in order to enhance our position in the online game market in Southeast Asia and strengthen our online entertainment product portfolio. This primary factor among others, contributed to a purchase price in excess of the fair market value of the net tangible assets and intangible assets acquired.
F-30
GIGAMEDIA LIMITED
NOTES TO THE CONSOLIDATED FINANCIAL STATEMENTS —
(Continued)
YEARS ENDED DECEMBER 31, 2008, 2009 AND 2010
As of December 31, 2010, we owned 7,191,111 preferred shares of IAHGames, which represents a controlling financial interest of 80 percent of the total outstanding voting rights of IAHGames. The preferred shares (Series A) are convertible into ordinary shares of IAHGames at a conversion rate of 10 Series A shares for 1 ordinary share. The preferred shares (Series B) are convertible into ordinary shares of IAHGames at a conversion rate of 1 Series B share for 1 ordinary share.
The following summarizes our acquisitions of IAHGames during the period from 2006 to 2010:
(in US$ thousands)
| | | | | | | | | | | |
| | | | | | | | | Accumulated voting | |
| | | | | | | | | interest at those | |
| Date of acquisition | | Amount | | | Description | | points in time | |
| December 2006 | | $ | 5,750 | * | | Purchased 500,000 convertible voting preferred shares-Series B | | | 32.26 | % |
| May 2010 | | $ | 2,192 | ** | | Purchased 208,881 convertible voting preferred shares-Series B | | | 40.30 | % |
| July 2010 | | $ | 4,500 | | | Purchased 5,982,230 convertible voting preferred shares-Series A | | | 57.87 | % |
| July 2010 | | $ | 10,000 | | | Purchased 500,000 convertible voting preferred shares-Series B | | | 80.00 | % |
| | | |
| * | | The original investment amount of $10 million was written down to $5.8 million, resulting from an impairment charge of $4.2 million recorded in 2009. |
| |
| ** | | GigaMedia issued 866,373 common shares, valued at approximately $2.2 million as consideration. |
In connection with the step acquisitions through July 2010, we recorded goodwill of approximately $12.2 million. Such goodwill amount is non-deductible for tax purposes. Since July 1, 2010, the results of IAHGames’ operations have been included in our Consolidated Financial Statements under the Asian online game and service business.
F-31
GIGAMEDIA LIMITED
NOTES TO THE CONSOLIDATED FINANCIAL STATEMENTS —
(Continued)
YEARS ENDED DECEMBER 31, 2008, 2009 AND 2010
The purchase price allocation was determined based on management’s estimate of the fair value of IAHGames in connection with the acquisitions. The purchase price allocation of the acquisition was as follows:
| | | | | | | |
| | | Amortization life | | | |
| (in US$ thousands) | | (in years) | | Amount | |
| Cash acquired | | | | $ | 9,070 | |
| Accounts receivable | | | | | 5,715 | |
| Other current assets | | | | | 5,129 | |
| Equity method investments | | | | | 20,319 | |
| Fixed assets / non-current assets | | | | | 721 | |
| Non-Compete Contracts | | 3 | | | 387 | |
| Favorable lease right | | 13.5 | | | 2,861 | |
| Prepaid licensing and royalty fees | | 1.75 ~ 4 | | | 1,010 | |
| Goodwill | | N/A | | | 12,188 | |
| | | | | | |
| Total assets acquired | | | | | 57,400 | |
| | | | | | |
| | | | | | | |
| Current liabilities | | | | | 23,304 | |
| Noncurrent liabilities | | | | | 9,145 | |
| | | | | | |
| Total liabilities assumed | | | | | 32,449 | |
| | | | | | |
| | | | | | | |
| Preferred shares (Series A) | | | | | (1,317 | ) |
| Noncontrolling interest | | | | | (1,192 | ) |
| | | | | | |
| Total purchase price | | | | $ | 22,442 | |
| | | | | | |
The following unaudited pro-forma information presents a summary of the results of operations of our Company for the years ended December 31, 2009 and 2010 as if we controlled 80 percent of the total outstanding voting rights of IAHGames and consolidated IAHGames as of the beginning of the periods presented.
F-32
GIGAMEDIA LIMITED
NOTES TO THE CONSOLIDATED FINANCIAL STATEMENTS —
(Continued)
YEARS ENDED DECEMBER 31, 2008, 2009 AND 2010
| | | | | | | | | |
| (in US$ thousands, | | Year ended December 31 | |
| except per share figures) | | 2009 | | | 2010 | |
| | | Unaudited | | | Unaudited | |
| |
| Net revenue | | $ | 165,883 | | | $ | 69,403 | |
| Loss from operations | | | (41,812 | ) | | | (50,378 | ) |
| Net loss | | | (56,226 | ) | | | (1,570 | ) |
| Net (loss) income attributable to GigaMedia | | | (49,574 | ) | | | 255 | |
| Basic (loss) earnings per share attributable to GigaMedia | | | (0.89 | ) | | | 0.00 | |
| Diluted (loss) earnings per share attributable to GigaMedia | | | (0.89 | ) | | | 0.00 | |
The unaudited pro-forma supplemental information is based on estimates and assumptions, which we believe are reasonable; it is not necessarily indicative of the consolidated financial position or results of operations in future periods or the results that actually would have been realized had we been a combined company during all of 2009 and 2010. The above unaudited pro-forma financial information includes adjustments for the amortization of identified intangible assets with definite lives.
NOTE 5.DECONSOLIDATION
Beginning in June 2007, we consolidated T2CN. T2CN is an operator and provider of online sports games in the PRC. As of December 31, 2009 and 2010, we owned 43,633,681 common shares of T2CN, which represents an ownership interest of 67.09 percent of the total outstanding voting rights of T2CN.
F-33
GIGAMEDIA LIMITED
NOTES TO THE CONSOLIDATED FINANCIAL STATEMENTS —
(Continued)
YEARS ENDED DECEMBER 31, 2008, 2009 AND 2010
The following summarizes our acquisitions of T2CN during the period from 2006 to 2010:
(in US$ thousands)
| | | | | | | | | | | |
| | | | | | | | | Accumulated voting | |
| Date of | | | | | | | | interest at those | |
| acquisition | | Purchase Price | | | Description | | points in time | |
| 2006 | | $ | 15,000 | | | Purchased 7,500,000 convertible voting preferred shares | | | 19.02 | % |
| 2007 | | $ | 23,736 | * | | Acquired 31,113,681 common shares (including convertible voting preferred shares converted into common shares) in total. | | | 58.11 | % |
| 2008 | | $ | 3,375 | | | Purchased 4,500,000 common shares | | | 65.68 | % |
| 2009 | | $ | 285 | | | Purchased 520,000 common shares | | | 67.09 | % |
| | | |
| * | | The purchase price includes the issuance of 226,385 common shares of GigaMedia, valued at approximately $2.7 million. |
F-34
GIGAMEDIA LIMITED
NOTES TO THE CONSOLIDATED FINANCIAL STATEMENTS —
(Continued)
YEARS ENDED DECEMBER 31, 2008, 2009 AND 2010
As a result of a dispute with T2CN’s former Chief Executive Officer, which arose in July 2010, GigaMedia has been prevented from obtaining and currently does not have access to the assets and financial information of the entities held by T2CN. Since we do not have access to the operating assets of T2CN and as we have been prevented from obtaining the financial information necessary to report the financial results of T2CN, we have effectively lost control over T2CN’s financial reporting process. Therefore, although we still own 67.09 percent of T2CN’s common stock, we deconsolidated T2CN’s results with effect from July 1, 2010. The following is a breakdown of our retained investment at the date of deconsolidation:
| | | | | |
| (in US$ thousands) | | Amount | |
| Cash | | $ | 12,903 | |
| Other current assets | | | 1,266 | |
| Fixed assets / non-current assets | | | 1,679 | |
| Prepaid licensing and royalty | | | 5,339 | |
| Intangible assets | | | 1,098 | |
| | | | |
| Total assets of T2CN | | | 22,285 | |
| Total liabilities of T2CN | | | (12,331 | ) |
| | | | |
| Net equity of T2CN | | | 9,954 | |
| Noncontrolling interest | | | (3,276 | ) |
| Goodwill acquired | | | 17,500 | |
| Advances to the entities held by T2CN | | | 1,405 | |
| | | | |
| | | $ | 25,583 | |
| | | | |
In connection with our year-end financial reporting process, we were required to perform an impairment analysis for the Company’s investment in and advances to the entities held by T2CN as of December 31, 2010. Given the uncertain timeline relating to the resolution of the dispute, and primarily because the Company still cannot exercise any control over the operations of T2CN or obtain any financial data from the management of T2CN, management decided to completely write-off both the Company’s investment in and its advances to the entities held by T2CN in order to properly reflect GigaMedia’s financial position as of December 31, 2010. The impairment charges recorded for the investment and the advances in 2010 are approximately $22.2 million (after removing the other comprehensive income component of equity related to T2CN from the Company’s balance sheet) and approximately $1.4 million, respectively.
NOTE 6.DIVESTITURES
(a) Internet Access and Service Business
In September 2008, we completed the sale of our Internet access and service business, which included 100 percent of our wholly-owned subsidiaries, Koos Broadband Telecom Co., Ltd. and Hoshin Multimedia Center Inc., as well as certain assets and liabilities related to our Internet access and service business, for a total transaction price of $20.0 million.
F-35
GIGAMEDIA LIMITED
NOTES TO THE CONSOLIDATED FINANCIAL STATEMENTS —
(Continued)
YEARS ENDED DECEMBER 31, 2008, 2009 AND 2010
The transaction price, net of transaction costs, price adjustments and cash transferred, was approximately $16.5 million. The after-tax gain from the sale of the Internet access and service business was approximately $9.8 million.
In addition to the above sales price, we were entitled to receive additional cash payments of $3.0 million and $2.0 million if the Internet access and service business that we sold achieved certain earn-out targets by September 2009 and 2010. The earn-out targets were to be determined by future gross profits in accordance with a formula and timeline set forth in the agreements. As of December 31, 2009 and 2010, we did not accrue any additional receivable for the sale of the Internet access and service business since the earn-out targets for the first period and second period ended September 2009 and 2010 were not achieved.
Results for the Internet access and service operations are reported as discontinued operations in 2008, 2009 and 2010. In 2008, income from discontinued operations was $9.4 million, which included an after-tax loss from the Internet access and service business of $0.4 million and an after-tax gain on the sale of the business of $9.8 million.
Summarized selected financial information for discontinued operations is as follows:
| | | | | | | | | | | | | |
| (in US$ thousands) | | 2008 | | | 2009 | | | 2010 | |
| Revenue | | $ | 9,289 | | | $ | 159 | | | $ | 146 | |
| | | | | | | | | | |
| (Loss) income from discontinued operations before tax | | $ | (593 | ) | | $ | 222 | | | $ | (128 | ) |
| Gain on sale of the discontinued operations before tax | | | 11,014 | | | | — | | | | — | |
| Income tax expense | | | (986 | ) | | | — | | | | — | |
| | | | | | | | | | |
| Income (loss) from discontinued operations | | $ | 9,435 | | | $ | 222 | | | $ | (128 | ) |
| | | | | | | | | | |
F-36
GIGAMEDIA LIMITED
NOTES TO THE CONSOLIDATED FINANCIAL STATEMENTS —
(Continued)
YEARS ENDED DECEMBER 31, 2008, 2009 AND 2010
(b) Gaming Software and Service Business
On December 15, 2009, we entered into an agreement with BetClic to sell 60 percent of substantially all of the assets and liabilities of our gaming software and service business for approximately $100 million in cash, subject to certain adjustments. The closing of the sale occurred on April 8, 2010. The sale resulted in the recognition of a gain of $79.1 million, net of transaction costs. The sale of the remaining 40 percent is subject to a put and call mechanism in place between GigaMedia and BetClic, as defined in the agreement. GigaMedia will have the option to put all or part of its remaining 40 percent to BetClic in each of 2013, 2014, and 2015 at a value considering all relevant facts and circumstances after the end of each year. If the put option owned by GigaMedia is not fully exercised, BetClic will have the option to call the remaining interest held by GigaMedia in each of 2015 and 2016.
F-37
GIGAMEDIA LIMITED
NOTES TO THE CONSOLIDATED FINANCIAL STATEMENTS —
(Continued)
YEARS ENDED DECEMBER 31, 2008, 2009 AND 2010
As of December 31, 2009, substantially all of the assets and liabilities in our gaming software and service business were reclassified to assets and liabilities held for sale. The assets and liabilities held for sale balances were reduced by 40 percent, which represents the ownership interest that we retained in the gaming software and service business and were recorded as “Retained ownership of gaming software and service business”, which amounted $26.0 million as of December 31, 2009. Therefore, the accompanying Consolidated Balance Sheet at December 31, 2009 includes the following:
| | | | | |
| (in US$ thousands) | | Amount | |
| Assets Held for Sale-Current | | | | |
| Cash | | $ | 35,015 | |
| Accounts receivable | | | 15,817 | |
| Prepaid expenses | | | 7,609 | |
| Other current assets | | | 632 | |
| Less: retained ownership | | | (23,629 | ) |
| | | | |
| | | $ | 35,444 | |
| | | | |
| Assets Held for Sale-Noncurrent | | | | |
| Property, plant and equipment | | $ | 7,358 | |
| Goodwill | | | 29,243 | |
| Intangible assets | | | 11,368 | |
| Other assets | | | 4,199 | |
| Less: retained ownership | | | (20,867 | ) |
| | | | |
| | | $ | 31,301 | |
| | | | |
| Liabilities Held for Sale-Current | | | | |
| Accounts payable | | $ | 11 | |
| Accrued compensation | | | 1,076 | |
| Accrued expenses | | | 6,869 | |
| Player account balances | | | 35,015 | |
| Other current liabilities | | | 1,126 | |
| Less: retained ownership | | | (17,639 | ) |
| | | | |
| | | $ | 26,458 | |
| | | | |
| Liabilities Held for Sale-Noncurrent | | | | |
| Other liabilities | | $ | 2,266 | |
| Less: retained ownership | | | (906 | ) |
| | | | |
| | | $ | 1,360 | |
| | | | |
In accordance with the FASB accounting standards codification, the amount of goodwill to be included in the assets held for sale and the retained ownership as of December 31, 2009 is based on the relative fair values of the business to be sold and the portion of the business that will be retained.
F-38
GIGAMEDIA LIMITED
NOTES TO THE CONSOLIDATED FINANCIAL STATEMENTS —
(Continued)
YEARS ENDED DECEMBER 31, 2008, 2009 AND 2010
The 40 percent ownership interest that we retained in the gaming software and service business is included in our Consolidated Balance Sheet as of December 31, 2009 as follows:
| | | | | |
| (in US$ thousands) | | | | |
| Retained ownership of gaming software and service business: | | | | |
| Current assets | | $ | 23,629 | |
| Noncurrent assets | | | 20,867 | |
| Current liabilities | | | (17,639 | ) |
| Noncurrent liabilities | | | (906 | ) |
| | | | |
| | | $ | 25,951 | |
| | | | |
We deconsolidated the gaming software and service business and recognized a gain when we completed the sale of 60 percent of substantially all of the assets and liabilities to BetClic on April 8, 2010, which was the date that the Company ceased to have a controlling financial interest. The remaining 40 percent ownership interest that we retained in the gaming software and service business has been accounted for under the equity method accounting starting from April 2010.
The Company accounted for the deconsolidation of the gaming software and service business at fair value and recognized a gain of $79.1 million measured as the difference between:
| | | | | |
| (In US$ thousands) | | Amount | |
| The fair value of any consideration received, including purchase price adjustments, net of any transaction costs | | $ | 82,984 | |
| The fair value of the 40% retained noncontrolling investment in the gaming software and service business at the date the business was deconsolidated | | | 54,240 | |
| | | | | |
| Less : The carrying amount of the gaming software and service business at the date of the deconsolidation | | | (58,084 | ) |
| | | | |
| | | | | |
| Gain on deconsolidation of the gaming software and services business | | $ | 79,140 | |
| | | | |
F-39
GIGAMEDIA LIMITED
NOTES TO THE CONSOLIDATED FINANCIAL STATEMENTS —
(Continued)
YEARS ENDED DECEMBER 31, 2008, 2009 AND 2010
NOTE 7.GOODWILL
The following table summarizes the changes to our Company’s goodwill by segment:
| | | | | | | | | | | | | |
| | | Gaming
software | | | Asian online
game | | | | |
| (In US$ thousands) | | and service | | | and service | | | Total | |
| Balance as of December 31, 2008 | | $ | 29,243 | | | $ | 57,855 | | | $ | 87,098 | |
| Impairment charge — T2CN (Note 10) | | | — | | | | (14,103 | ) | | | (14,103 | ) |
| Goodwill included in assets held for sale and retained ownership of gaming software and service business (Note 6) | | | (29,243 | ) | | | — | | | | (29,243 | ) |
| Translation adjustment | | | — | | | | 665 | | | | 665 | |
| | | | | | | | | | |
| Balance as of December 31, 2009 | | | — | | | | 44,417 | | | | 44,417 | |
| Acquisition — IAHGames (Note 4) | | | — | | | | 12,188 | | | | 12,188 | |
| Impairment charge — T2CN (Note 5) | | | — | | | | (17,500 | ) | | | (17,500 | ) |
| Impairment charge — IAHGames (Note 10) | | | — | | | | (2,255 | ) | | | (2,255 | ) |
| Translation adjustment | | | — | | | | 2,643 | | | | 2,643 | |
| | | | | | | | | | |
| Balance as of December 31, 2010 | | $ | — | | | $ | 39,493 | | | $ | 39,493 | |
| | | | | | | | | | |
F-40
GIGAMEDIA LIMITED
NOTES TO THE CONSOLIDATED FINANCIAL STATEMENTS —
(Continued)
YEARS ENDED DECEMBER 31, 2008, 2009 AND 2010
NOTE 8.INTANGIBLE ASSETS — NET
The following table summarizes our Company’s intangible assets, by major asset class:
| | | | | | | | | | | | | |
| | | December 31, 2010 | |
| | | Gross carrying | | | Accumulated | | | | |
| (In US$ thousands) | | amount | | | amortization | | | Net | |
| Completed technology | | $ | 2,595 | | | $ | (1,854 | ) | | $ | 741 | |
| Trade name, trademark and non-competition agreements | | | 12,248 | | | | (40 | ) | | | 12,208 | |
| Capitalized software cost | | | 6,599 | | | | (5,388 | ) | | | 1,211 | |
| Customer relationships | | | 6,255 | | | | (3,475 | ) | | | 2,780 | |
| Favorable lease right | | | 2,861 | | | | (106 | ) | | | 2,755 | |
| Other | | | 126 | | | | (52 | ) | | | 74 | |
| | | | | | | | | | |
| Total | | $ | 30,684 | | | $ | (10,915 | ) | | $ | 19,769 | |
| | | | | | | | | | |
| | | | | | | | | | | | | |
| | | December 31, 2009 | |
| | | Gross carrying | | | Accumulated | | | | |
| (In US$ thousands) | | amount | | | amortization | | | Net | |
| Completed technology | | $ | 2,363 | | | $ | (1,350 | ) | | $ | 1,013 | |
| Trade name, trademark and non-competition agreements | | | 11,160 | | | | (15 | ) | | | 11,145 | |
| Capitalized software cost | | | 8,633 | | | | (5,137 | ) | | | 3,496 | |
| Customer relationships | | | 5,695 | | | | (2,531 | ) | | | 3,164 | |
| Other | | | 115 | | | | (9 | ) | | | 106 | |
| | | | | | | | | | |
| Total | | $ | 27,966 | | | $ | (9,042 | ) | | $ | 18,924 | |
| | | | | | | | | | |
Intangible assets include trade name assets of approximately $12.2 million which are not amortized. The remaining intangible assets are amortized over their estimated useful lives ranging from 3 to 13.5 years. The overall weighted-average life of identifiable intangible assets is 6.3 years.
F-41
GIGAMEDIA LIMITED
NOTES TO THE CONSOLIDATED FINANCIAL STATEMENTS —
(Continued)
YEARS ENDED DECEMBER 31, 2008, 2009 AND 2010
For the years ended December 31, 2008, 2009 and 2010, total amortization expense of intangible assets were $4.1 million, $5.1 million, and $2.7 million, respectively (including $20 thousand, $0 and $0 reported in discontinued operations in 2008, 2009 and 2010, respectively), which includes amortization of capitalized software costs of $3.0 million, $3.9 million, and $1.5 million. As of December 31, 2010, based on the current amount of intangibles subject to amortization, the estimated amortization expense for each of the succeeding five years is as follows:
| | | | | |
| (In US$ thousands) | | Amount | |
| 2011 | | $ | 1,770 | |
| 2012 | | | 1,717 | |
| 2013 | | | 1,295 | |
| 2014 | | | 907 | |
| 2015 | | | 212 | |
| | | | |
| Total | | $ | 5,901 | |
| | | | |
NOTE 9.PREPAID LICENSING AND ROYALTY FEES
The following table summarizes changes to our Company’s prepaid licensing and royalty fees:
| | | | | | | | | |
| (in US$ thousands) | | 2009 | | | 2010 | |
| Beginning balance | | $ | 20,540 | | | $ | 5,557 | |
| Additions | | | 5,484 | | | | 3,987 | |
| Acqusition — IAHGames (Note 4) | | | — | | | | 1,010 | |
| Amortization of licensing and royalty costs | | | (2,146 | ) | | | (573 | ) |
| Deconsolidation — T2CN (Note 5) | | | — | | | | (5,339 | ) |
| Impairment charges (Note 10) | | | (18,301 | ) | | | (870 | ) |
| Translation adjustment | | | (20 | ) | | | 442 | |
| | | | | | | |
| Balance as of December 31 | | $ | 5,557 | | | $ | 4,214 | |
| | | | | | | |
F-42
GIGAMEDIA LIMITED
NOTES TO THE CONSOLIDATED FINANCIAL STATEMENTS —
(Continued)
YEARS ENDED DECEMBER 31, 2008, 2009 AND 2010
NOTE 10.FAIR VALUE MEASUREMENTS
The accounting framework for determining fair value includes a hierarchy for ranking the quality and reliability of the information used to measure fair value, which enables the reader of the financial statements to assess the inputs used to develop those measurements. The fair value hierarchy consists of three tiers as follows: Level 1, defined as quoted market prices in active markets for identical assets or liabilities; Level 2, defined as inputs other than Level 1 that are observable, either directly or indirectly, such as quoted market prices for similar assets or liabilities, quoted prices in markets that are not active, model-based valuation techniques for which all significant assumptions are observable in the market, or other inputs that are observable or can be corroborated by observable market data for substantially the full term of the assets and liabilities; and Level 3, defined as unobservable inputs that are not corroborated by market data.
Assets and Liabilities that are Measured at Fair Value on a Recurring Basis
Our Company has segregated all financial assets and liabilities that are measured at fair value on a recurring basis (at least annually) into the most appropriate level within the fair value hierarchy based on the inputs used to determine the fair value at the measurement date in the table below.
F-43
GIGAMEDIA LIMITED
NOTES TO THE CONSOLIDATED FINANCIAL STATEMENTS —
(Continued)
YEARS ENDED DECEMBER 31, 2008, 2009 AND 2010
Assets and liabilities measured at fair value on a recurring basis are summarized as below:
| | | | | | | | | | | | | | | | | |
| | | | | | | | | | | | | | | Year Ended | |
| | | Fair Value Measurement Using | | | December | |
| (in US$ thousands) | | Level 1 | | | Level 2 | | | Level 3 | | | 31, 2010 | |
| Assets | | | | | | | | | | | | | | | | |
| Cash equivalents — time deposits | | $ | — | | | $ | 1,012 | | | $ | — | | | $ | 1,012 | |
| Marketable securities — current | | | | | | | | | | | | | | | | |
| Open-end fund | | | — | | | | 3,553 | | | | — | | | | 3,553 | |
| Marketable securities — noncurrent | | | | | | | | | | | | | | | | |
| Debt securities | | | — | | | | — | | | | 5,454 | | | | 5,454 | |
| Equity securities | | | 25,553 | | | | 2,382 | | | | — | | | | 27,935 | |
| | | | | | | | | | | | | |
| Subtotal | | | 25,553 | | | | 6,947 | | | | 5,454 | | | | 37,954 | |
| | | | | | | | | | | | | |
| | | | | | | | | | | | | | | | | |
| Liabilties | | | | | | | | | | | | | | | | |
| Other liabilities — other Warrant derivative | | | — | | | | — | | | | (665 | ) | | | (665 | ) |
| | | | | | | | | | | | | |
| Total | | $ | 25,553 | | | $ | 6,947 | | | $ | 4,789 | | | $ | 37,289 | |
| | | | | | | | | | | | | |
| | | | | | | | | | | | | | | | | |
| | | | | | | | | | | | | | | Year Ended | |
| | | Fair Value Measurement Using | | | December | |
| (in US$ thousands) | | Level 1 | | | Level 2 | | | Level 3 | | | 31, 2009 | |
| Assets | | | | | | | | | | | | | | | | |
| Marketable securities — current | | $ | — | | | $ | 3,486 | | | $ | — | | | $ | 3,486 | |
| Open-end fund | | | | | | | | | | | | | | | | |
| Marketable securities — noncurrent | | | | | | | | | | | | | | | | |
| Debt securities | | | — | | | | — | | | | 14,204 | | | | 14,204 | |
| Equity securities | | | 4,152 | | | | — | | | | — | | | | 4,152 | |
| | | | | | | | | | | | | |
| Total | | $ | 4,152 | | | $ | 3,486 | | | $ | 14,204 | | | $ | 21,842 | |
| | | | | | | | | | | | | |
Level 1 and 2 measurements:
Cash equivalents — time deposits are convertible into a known amount of cash and are subject to an insignificant risk of change in value. Certain marketable securities — are valued using a market approach based on the quoted market prices of identical instruments when available, or other observable inputs such as trading prices of identical instruments in inactive markets. The fair value of the marketable equity securities that have publicly quoted trading prices are valued using those observable prices, unless adjustments are required to available observable inputs.
F-44
GIGAMEDIA LIMITED
NOTES TO THE CONSOLIDATED FINANCIAL STATEMENTS —
(Continued)
YEARS ENDED DECEMBER 31, 2008, 2009 AND 2010
In 2008, 2009 and 2010, we recognized an unrealized gain (loss) of ($282) thousand, $67 thousand and $21.8 million, respectively, on marketable securities, which is included in other comprehensive income (loss). In 2009, we recognized an other-than-temporary impairment of $2.9 million related to marketable equity securities, which is included in non-operating expenses within “impairment loss on marketable securities and investments” in the Consolidated Statements of Operations.
Level 3 measurements:
For assets measured at fair value on a recurring basis using significant unobservable inputs (Level 3) during 2009 and 2010, a reconciliation of the beginning and ending balances are presented as follows:
| | | | | | | | | |
| | | Fair Value Measurements | |
| | | Using Significant Unobservable | |
| | | Inputs | |
| | | Marketable Securities - Debt | |
| | | Securities | |
| (in US$ thousands) | | 2009 | | | 2010 | |
| Beginning balance | | $ | 26,041 | | | $ | 14,204 | |
| Total gains or losses (realized/unrealized) | | | | | | | | |
| included in earnings | | | (11,837 | ) | | | (4,500 | ) |
| included in other comprehensive income | | | — | | | | — | |
| Purchase and settlements | | | — | | | | 1,500 | |
| Transfers in and/or out of Level 3 | | | — | | | | (5,750 | ) |
| | | | | | | |
| Ending balance | | $ | 14,204 | | | $ | 5,454 | |
| | | | | | | |
| | | | | | | | | |
| The amount of total gains or losses for the period included in earnings attributable to the change in unrealized gains or losses relating to assets still held at the reporting date | | None | | None |
| | | | | | | |
F-45
GIGAMEDIA LIMITED
NOTES TO THE CONSOLIDATED FINANCIAL STATEMENTS —
(Continued)
YEARS ENDED DECEMBER 31, 2008, 2009 AND 2010
The fair value of the marketable debt securities is derived using a discounted cash flow method using unobservable inputs. The discounted cash flow method incorporates adjusted available market discount rate information and the Company’s estimates of liquidity risk, and other cash flow model related assumptions.
In 2009 and 2010, we recognized other-than-temporary impairments of $11.8 million and $4.5 million, respectively, related to marketable debt securities, which is included in non-operating expenses within “impairment loss on marketable securities and investments” in the Consolidated Statements of Operations. In July 2010, we reclassified our debt securities held in IAHGames from “Marketable Securities — Noncurrent” upon consolidation when we increased our total controlling financial interest in IAHGames to 80 percent. The investment in IAHGames amounted to $5.8 million which was transferred out from “Marketable Securities — Noncurrent” upon consolidation.
F-46
GIGAMEDIA LIMITED
NOTES TO THE CONSOLIDATED FINANCIAL STATEMENTS —
(Continued)
YEARS ENDED DECEMBER 31, 2008, 2009 AND 2010
For liabilities measured at fair value on a recurring basis using significant unobservable inputs (level 3) during 2010, a reconciliation of the beginning and ending balances are presented as follows:
| | | | | |
| | | Fair Value Measurements | |
| | | Using Significant | |
| | | Unobservable Inputs | |
| | | (Level 3) | |
| | | Other liabilities - Warrant | |
| | | Derivative | |
| (in US$ thousands) | | 2010 | |
| Beginning balance | | $ | — | |
| Total (gains) or losses (realized/unrealized) | | | | |
| included in earnings | | | (2,595 | ) |
| included in other comprehensive income | | | — | |
| Purchase and settlements | | | 3,260 | |
| Transfers in and/or out of Level 3 | | | — | |
| | | | |
| Ending balance | | $ | 665 | |
| | | | |
| | | | | |
| The amount of total (gains) or losses for the period included in earnings attributable to the change in unrealized gains or losses relating to liabilities still held at the reporting date | | $ | (2,595 | ) |
| | | | |
IAHGames has warrants outstanding in which the holder may purchase an aggregate of 15 percent of IAHGames’ common stock, on a fully diluted basis, at an exercise price of $3.40 per warrant share, which is subject to certain adjustments in accordance with the warrant agreement. The warrants expire upon the expiration of certain game licenses or in certain circumstances in accordance with the warrant agreement. According to the terms of the warrant agreement, if IAHGames subsequently issues additional shares of its common stock, IAHGames is obligated to issue additional warrants to the warrant holder necessary for the holder to maintain its 15 percent share ownership, regardless of whether such additional shares are issued at, above, or below the market price. Because the provisions give the warrant holder a level of protection that is not afforded to the other holders of IAHGames’ common stock, and since these provisions are not based on inputs to the fair value of a “fixed-for-fixed” forward or option, the warrants are not considered to be indexed to IAHGames’ common stock. As a result, the warrants are accounted for as a derivative liability instrument. As of December 31, 2010, we valued the warrants at approximately $665 thousand using a valuation model and reported the warrants as a liability under the caption “other liabilities — other” in the Consolidated Balance Sheets. The key assumptions and related variables used in the valuation model to determine the fair value of the warrants as of December 31, 2010 included certain unobservable inputs and related variables such as risk free rate, volatility, strike price, and dividend yield. In 2010, we recognized a gain of approximately $2.6 million related to the revaluation of the warrants, which is included in non-operating income (expenses) within “gain on fair value changes of warrant derivative” in the Consolidated Statements of Operations.
F-47
GIGAMEDIA LIMITED
NOTES TO THE CONSOLIDATED FINANCIAL STATEMENTS —
(Continued)
YEARS ENDED DECEMBER 31, 2008, 2009 AND 2010
Financial instruments:
The carrying amounts of the Company’s cash, accounts receivable, restricted cash, accounts payable, and short-term debt approximate fair value due to their short-term maturities. The fair value of amounts due to and from related parties is not practicable to estimate due to the related party nature of the underlying transactions.
Assets and Liabilities that are Measured at Fair Value on a Nonrecurring Basis
Effective January 1, 2009, we adopted the fair value accounting standard for measuring the fair value of assets and liabilities on a nonrecurring basis. Assets and liabilities measured at fair value on a nonrecurring basis include measuring impairment when required for long-lived assets. For GigaMedia, long-lived assets measured at fair value on a nonrecurring basis include investments accounted for under the equity method and cost method, property, plant, and equipment, intangible assets, prepaid licensing and royalty fees and goodwill.
F-48
GIGAMEDIA LIMITED
NOTES TO THE CONSOLIDATED FINANCIAL STATEMENTS —
(Continued)
YEARS ENDED DECEMBER 31, 2008, 2009 AND 2010
Assets and liabilities measured at fair value on a nonrecurring basis which were determined to be impaired as of December 31, 2009 and 2010 are summarized as below:
| | | | | | | | | | | | | | | | | | | | | |
| | | | | | | | | | | | | | | Year Ended | | | Total | |
| | | Fair Value measurement Using | | | December | | | Impairment | |
| (in US$ thousands) | | Level 1 | | | Level 2 | | | Level 3 | | | 31, 2010 | | | Losses | |
| | | | | | | | | | | | | | | | | | | | | |
| Assets | | | | | | | | | | | | | | | | | | | | |
| (a) Investment — Equity method | | $ | — | | | $ | — | | | $ | — | | | $ | — | | | $ | 177 | |
| (b) Property, plant and equipment - Information and communication equipment | | | — | | | | — | | | | — | | | | — | | | | 278 | |
| (c) Goodwill — Resulting from acquisition of IAH | | | — | | | | — | | | | 9,933 | | | | 9,933 | | | | 2,255 | |
| (d) Intangible assets — Capitalized software cost | | | — | | | | — | | | | — | | | | — | | | | 1,007 | |
| (d) Intangible assets - Non-Compete Contracts | | | — | | | | — | | | | — | | | | — | | | | 323 | |
| (e) Prepaid licensing and royalty | | | — | | | | — | | | | 200 | | | | 200 | | | | 870 | |
| (f) Investment in T2CN | | | — | | | | — | | | | — | | | | — | | | | 22,234 | |
| | | | | | | | | | | | | | | | |
| Total | | $ | — | | | $ | — | | | $ | 10,133 | | | $ | 10,133 | | | $ | 27,144 | |
| | | | | | | | | | | | | | | | |
| | | | | | | | | | | | | | | | | | | | | |
| | | | | | | | | | | | | | | Year Ended | | | Total | |
| | | Fair Value measurement Using | | | December | | | Impairment | |
| (in US$ thousands) | | Level 1 | | | Level 2 | | | Level 3 | | | 31, 2009 | | | Losses | |
| | | | | | | | | | | | | | | | | | | | | |
| Assets | | | | | | | | | | | | | | | | | | | | |
| (a) Investment — Cost method | | $ | — | | | $ | — | | | $ | 700 | | | $ | 700 | | | $ | 1,005 | |
| (b) Property, plant and equipment - Land and Building | | | — | | | | 1,171 | | | | — | | | | 1,171 | | | | 473 | |
| (b) Property, plant and equipment - Information and communication equipment | | | — | | | | — | | | | 79 | | | | 79 | | | | 777 | |
| (c) Goodwill — Resulting from acquisition of T2CN | | | — | | | | — | | | | 17,500 | | | | 17,500 | | | | 14,103 | |
| (d) Intangible assets — Capitalized software cost | | | — | | | | — | | | | — | | | | — | | | | 4,701 | |
| (e) Prepaid licensing and royalty | | | — | | | | — | | | | — | | | | — | | | | 18,301 | |
| | | | | | | | | | | | | | | | |
| Total | | $ | — | | | $ | 1,171 | | | $ | 18,279 | | | $ | 19,450 | | | $ | 39,360 | |
| | | | | | | | | | | | | | | | |
| | | |
| (a) | | Impairment losses on certain cost method and equity method investments which were determined to be impaired: |
In 2009, cost method investments with carrying amounts of $1.7 million were written down to their fair value of $700 thousand, resulting in an impairment charge of $1 million. In 2010, equity method investments with carrying amounts of $177 thousand were fully written down, resulting in an impairment charge of $177 thousand. The impairment charges are included in non-operating expenses within “impairment loss on marketable securities and investments” in the Consolidated Statements of Operations. Cost method and equity method investments are measured at fair value on a nonrecurring basis when deemed necessary, using other observable inputs such as trading prices of similar classes of the stock or using discounted cash flows, incorporating adjusted available market discount rate information and our Company’s estimates for liquidity risk.
F-49
GIGAMEDIA LIMITED
NOTES TO THE CONSOLIDATED FINANCIAL STATEMENTS —
(Continued)
YEARS ENDED DECEMBER 31, 2008, 2009 AND 2010
(b) Impairment losses on certain property, plant, and equipment which were determined to be impaired:
In 2009, land and buildings with carrying amounts of $1.7 million were written down to their fair value of $1.2 million, resulting in an impairment charge of $473 thousand which is included in operating expenses within “impairment loss on property, plant and equipment” in the Consolidated Statements of Operations. The impairment charge for the land and building was related to assets that were used for the ISP business, which was disposed of in September 2008, and are currently idle after the disposal. The land and building were valued based on the quoted prices of similar assets in the market. In addition, information and communication equipment with carrying amounts of $856 thousand were written down to their fair value of $79 thousand, resulting in an impairment charge of $777 thousand.
In 2010, we recorded an impairment loss of $278 thousand against our information and communication equipment. The impairment charges are included in operating expenses within “impairment loss on property, plant and equipment” in the Consolidated Statements of Operations. The impairment charge for the equipment was related to servers used in certain impaired licensed games or internally developed games within our Asian online game and service business for which the carrying amount was determined not to be recoverable from its related future undiscounted cash flows. This equipment was valued using unobservable inputs such as discounted cash flows, incorporating adjusted available market discount rate information and our Company’s estimates for liquidity risk, and other cash flow model — related assumptions.
F-50
GIGAMEDIA LIMITED
NOTES TO THE CONSOLIDATED FINANCIAL STATEMENTS —
(Continued)
YEARS ENDED DECEMBER 31, 2008, 2009 AND 2010
(c) Impairment losses on goodwill which was determined to be impaired:
In 2009, goodwill from the acquisition of T2CN with a carrying amount of $31.6 million was written down to its fair value of $17.5 million, resulting in an impairment charge of $14.1 million, which is included within operating expenses in the Consolidated Statements of Operations. The impairment charge resulted as our estimates of future cash flows for T2CN’s business had been reduced due to lower than expected operating performance results in 2009, which indicated that the carrying amount of the goodwill from the acquisition of T2CN could not be fully recovered as of December 31, 2009.
In 2010, goodwill from the acquisition of IAHGames with a carrying amount of $12.2 million was written down to its fair value of $9.9 million, resulting in an impairment charge of $2.3 million, which is included within operating expenses in the Consolidated Statements of Operations. The impairment charge resulted as our estimates of future cash flows for IAHGames’ business had been reduced due to lower than expected operating performance results in 2010, which indicated that the carrying amount of the goodwill from the acquisition of IAHGames could not be fully recovered as of December 31, 2010.
Goodwill is valued on a nonrecurring basis when impairment exists, using unobservable inputs such as discounted cash flows, incorporating adjusted available market discount rate information and our Company’s estimates for liquidity risk, and other cash flow model related assumptions.
(d) Impairment losses on certain intangible assets which were determined to be impaired:
In 2009 and 2010, capitalized software costs with carrying amounts of $4.7 million and $1 million, respectively, were fully written down, resulting in impairment charges of $4.7 million and $1 million, respectively, which are included in operating expenses within “impairment loss on prepaid licensing fees and intangible assets” in the Consolidated Statements of Operations. The impairment charges for the capitalized software costs were the result of certain projects within our Asian online game and service business that we ceased further development on and as a result we recorded a full impairment of the carrying value of the assets related to these projects.
F-51
GIGAMEDIA LIMITED
NOTES TO THE CONSOLIDATED FINANCIAL STATEMENTS —
(Continued)
YEARS ENDED DECEMBER 31, 2008, 2009 AND 2010
In addition, the non-compete contracts resulting from the acquisition of IAHGames with carrying amounts of $323 thousand as of December 31, 2010 were fully written down, resulting in an impairment charge of $323 thousand which are included in operating expenses within “impairment loss on prepaid licensing fees and intangible assets” in the Consolidated Statements of Operations. The impairment charges resulted as our estimates of future cash flows related to these non-compete contracts were reduced to lower than originally expected, which indicated that the carrying amount of the non-compete contracts could not be recovered as of December 31, 2010.
(e) Impairment losses on certain prepaid licensing and royalty fees which were determined to be impaired:
In 2009, prepaid licensing and royalty fees with carrying amounts of $18.3 million were fully written down, resulting in an impairment charge of $18.3 million. In 2010, prepaid licensing and royalty fees with carrying amounts of $1.1 million were written to their fair values of $200 thousand, resulting in an impairment charge of $870 thousand. The impairment charges are included in operating expenses within “impairment loss on prepaid licensing fees and intangible assets” in the Consolidated Statements of Operations. The impairment charges for the prepaid licensing and royalty fees related to certain licensed games within our Asian online game and service business that we stopped operating or for which the carrying amounts of the related assets were determined not to be recoverable from their expected future undiscounted cash flows. The licensing fee games and related royalties are valued on a nonrecurring basis when impairment exists, using unobservable inputs such as discounted cash flows, incorporating adjusted available market discount rate information and our Company’s estimates for liquidity risk, and other cash flow model related assumptions.
F-52
GIGAMEDIA LIMITED
NOTES TO THE CONSOLIDATED FINANCIAL STATEMENTS —
(Continued)
YEARS ENDED DECEMBER 31, 2008, 2009 AND 2010
(f) Impairment loss on T2CN which was determined to be impaired:
In connection with our year-end financial reporting process, we were required to perform an impairment analysis for the Company’s investment in and advances to the entities held by T2CN as of December 31, 2010. As discussed in more detail in Note 5 “Deconsolidation”, given the uncertain timeline relating to the resolution of our dispute with T2CN’s former Chief Executive Officer, and primarily because the Company still cannot exercise any control over the operations of T2CN or obtain any financial data from the management of T2CN, management decided to completely write-off both the Company’s investment and its advances to the entities held by T2CN in order to properly reflect GigaMedia’s financial position as of December 31, 2010.
NOTE 11.CASH AND CASH EQUIVALENTS
Cash and cash equivalents consist of the following:
| | | | | | | | | |
| | | December 31 | |
| (in US$ thousands) | | 2009 | | | 2010 | |
| Cash and checking and savings accounts | | $ | 55,566 | | | $ | 69,977 | |
| Time deposits | | | — | | | | 1,012 | |
| | | | | | | |
| Total | | $ | 55,566 | | | $ | 70,989 | |
| | | | | | | |
NOTE 12.MARKETABLE SECURITIES — CURRENT
Marketable securities — current consist of the following:
| | | | | | | | | |
| | | December 31 | |
| (in US$ thousands) | | 2009 | | | 2010 | |
| Available-for-sale securities: | | | | | | | | |
| Open-end funds | | $ | 3,486 | | | $ | 3,553 | |
| | | | | | | |
F-53
GIGAMEDIA LIMITED
NOTES TO THE CONSOLIDATED FINANCIAL STATEMENTS —
(Continued)
YEARS ENDED DECEMBER 31, 2008, 2009 AND 2010
All of our Company’s marketable securities — current are classified as available-for-sale. As of December 31, 2009 and 2010, the balances of unrealized gains for marketable securities — current were $454 thousand and $521 thousand, respectively. During 2008, 2009 and 2010, realized gains from disposal of marketable securities — current amounted to $400 thousand, $0, and $0, respectively, (including $27 thousand, $0, and $0 reported in discontinued operations in 2008, 2009 and 2010, respectively). The costs for calculating gains on disposal were based on each security’s average cost.
NOTE 13.ACCOUNTS RECEIVABLE — NET
Accounts receivable consist of the following:
| | | | | | | | | |
| | | December 31 | |
| (in US$ thousands) | | 2009 | | | 2010 | |
| Accounts receivable | | $ | 4,428 | | | $ | 10,348 | |
| Less: Allowance for doubful accounts | | | (200 | ) | | | (842 | ) |
| | | | | | | |
| Net | | $ | 4,228 | | | $ | 9,506 | |
| | | | | | | |
The following is a reconciliation of changes in our Company’s allowance for doubtful accounts during the years ended December 31, 2008, 2009 and 2010:
| | | | | | | | | | | | | |
| (in US$ thousands) | | 2008 | | | 2009 | | | 2010 | |
| Balance at beginning of year | | $ | 1,362 | | | $ | 254 | | | $ | 200 | |
| Additions: Provision for bad debt expense | | | 313 | | | | 158 | | | | 156 | |
| Less: Write-offs | | | (399 | ) | | | (216 | ) | | | (219 | ) |
| Acquisiton — IAHGames | | | — | | | | — | | | | 691 | |
| Divestiture — Internet access and service business | | | (1,041 | ) | | | — | | | | — | |
| Translation adjustment | | | 19 | | | | 4 | | | | 14 | |
| | | | | | | | | | |
| Balance at end of year | | $ | 254 | | | $ | 200 | | | $ | 842 | |
| | | | | | | | | | |
F-54
GIGAMEDIA LIMITED
NOTES TO THE CONSOLIDATED FINANCIAL STATEMENTS —
(Continued)
YEARS ENDED DECEMBER 31, 2008, 2009 AND 2010
NOTE 14.OTHER CURRENT ASSETS
Other current assets consist of the following:
| | | | | | | | | |
| | | December 31 | |
| (in US$ thousands) | | 2009 | | | 2010 | |
| Loans receivable — current | | $ | 4,074 | | | $ | 5,761 | |
| Less: Allowance for loans receivable — current | | | (3,574 | ) | | | (5,057 | ) |
| Deferred income tax assets — current, net (Note 25) | | | 1,116 | | | | 581 | |
| Other | | | 2,363 | | | | 759 | |
| | | | | | | |
| Total | | $ | 3,979 | | | $ | 2,044 | |
| | | | | | | |
The following is a reconciliation of changes in our Company’s allowance for loans receivable - current during the years ended December 31, 2008, 2009 and 2010:
| | | | | | | | | | | | | |
| (in US$ thousands) | | 2008 | | | 2009 | | | 2010 | |
| Balance at beginning of year | | $ | — | | | $ | 2,640 | | | $ | 3,574 | |
| Additions: Provision for bad debt expenses | | | 2,640 | | | | 934 | | | | 1,483 | |
| | | | | | | | | | |
| Balance at end of year | | $ | 2,640 | | | $ | 3,574 | | | $ | 5,057 | |
| | | | | | | | | | |
In 2006, our Company entered into a loan agreement for $214 thousand with a third party with no interest. The outstanding principal balance of this loan was due in November 2009, and is currently past due. We do not expect to collect all principal; therefore, we recognized a full provision for the loan of $214 thousand in 2009.
In 2007, our Company entered into a loan agreement for $2.5 million with Flagship Studios, Inc. (“Flagship”), a game developer, receiving in exchange a note with an interest rate of 10 percent per annum from Flagship. The outstanding principal balance of this note, together with all accrued and unpaid interest thereon, was due on or before December 31, 2008, and is currently past due. Due to the financial status of Flagship, we do not expect to collect all principal and interest. Therefore, in 2008, we recognized a full provision for the loan and interest receivable, in the aggregate of $2.6 million in 2008, and ceased to recognize interest income.
F-55
GIGAMEDIA LIMITED
NOTES TO THE CONSOLIDATED FINANCIAL STATEMENTS —
(Continued)
YEARS ENDED DECEMBER 31, 2008, 2009 AND 2010
During the period from September 2008 to April 2009, our Company entered into loan agreements in the aggregate of $0.7 million with a company included in our available-for-sale investments and equity method investments, with interest rates ranging from 9.7 percent to 10.525 percent per annum. For 2008 and 2009, we have accrued, based on the stated interest rate, interest income of $2 thousand and $34 thousand, respectively. Due to the financial status of this available-for-sale investment, we do not expect to collect all principal and interest. Therefore, we recognized a provision for certain loans and interest receivable in the aggregate of $719 thousand in 2009, and ceased to recognize interest income.
As of the date of our deconsolidation of T2CN in July 2010, we had $1.4 million of loans receivable outstanding. As a result of the ongoing dispute, we do not expect to collect these outstanding loans due from T2CN. Therefore, we recognized a full provision for the loans of $1.4 million in 2010 (See Note 5, “Deconsolidation” for additional information).
F-56
GIGAMEDIA LIMITED
NOTES TO THE CONSOLIDATED FINANCIAL STATEMENTS —
(Continued)
YEARS ENDED DECEMBER 31, 2008, 2009 AND 2010
NOTE 15.MARKETABLE SECURITIES — NONCURRENT
Marketable securities — noncurrent consist of the following:
| | | | | | | | | |
| | | December 31 | |
| (in US$ thousands) | | 2009 | | | 2010 | |
| Available-for-sale securities | | | | | | | | |
| Debt securities | | $ | 14,204 | | | $ | 5,454 | |
| Equity securities | | | 4,152 | | | | 27,935 | |
| | | | | | | |
| Total | | $ | 18,356 | | | $ | 33,389 | |
| | | | | | | |
Our Company’s marketable securities — noncurrent are invested in convertible preferred shares and publicly — traded common shares and are classified as available-for-sale securities.
The preferred shares are convertible into common shares on 1:1 basis, subject to certain adjustments, and shall be automatically converted upon certain conditions outlined in the agreements. The convertible preferred shares are all redeemable based upon certain agreed-upon conditions.
The embedded conversion options of the convertible preferred shares do not meet the definition of derivative instruments defined in the FASB accounting standards codification and therefore are not bifurcated from the preferred share investment.
We have also considered and determined whether our investments in preferred shares are in-substance common shares which should be accounted for under the equity method. Given that our convertible preferred shares have substantive redemption rights and thus do not meet the criteria of in-substance common shares, we have accounted for them as debt securities in accordance with the guidance issued by FASB Accounting Standards Codification.
F-57
GIGAMEDIA LIMITED
NOTES TO THE CONSOLIDATED FINANCIAL STATEMENTS —
(Continued)
YEARS ENDED DECEMBER 31, 2008, 2009 AND 2010
We assessed the estimated fair values and potential impairment of these investments as of December 31, 2009 and 2010. (See Note 10 “Fair Value Measurements”, for additional information).
NOTE 16. INVESTMENTS
Investments consist of the following:
| | | | | | | | | |
| | | December 31 | |
| | | 2009 | | | 2010 | |
| | | Amount | | | Amount | |
| Investments accounted for under the equity method | | $ | 222 | | | $ | 65,395 | |
| Investments accounted for under the cost method | | | 3,255 | | | | 1,379 | |
| | | | | | | |
| | | $ | 3,477 | | | $ | 66,774 | |
| | | | | | | |
The Company’s investments in companies that are accounted for under the equity method of accounting consisted of the following as of December 31, 2010: (a) a 40 percent interest in Mangas Everest S.A.S. (“Everest Gaming”), which is engaged in the gaming software and service business (See Note 6 “Divestitures” for additional information); (b) a 100 percent interest in Monsoon Online Pte Ltd (“Monsoon”), an operator and distributor of online games in Southeast Asia; (c) a 30 percent interest in Game First International Corporation (“GFI”), an operator and distributor of online games in Taiwan; (d) an 18 percent interest in East Gate Media Contents & Technology Fund (“East Gate”), a Korean Fund that invests in online game businesses and films; (e) a 49 percent interest in OneNet Company, an operator and distributor of online games in Thailand; and (f) a 23 percent interest in Digiforce Co., Ltd, an online games service provider in Taiwan. The investments in these companies amounted to $222 thousand and $65.4 million as of December 31, 2009 and 2010, respectively.
F-58
GIGAMEDIA LIMITED
NOTES TO THE CONSOLIDATED FINANCIAL STATEMENTS —
(Continued)
YEARS ENDED DECEMBER 31, 2008, 2009 AND 2010
As of December 31, 2010, the Company’s share of the underlying net assets of Everest Gaming exceeded the carrying value of its investment by $12.4 million. The excess results from the difference between the fair value we assigned to the 40 percent retained interest in Everest Gaming at the date the business was deconsolidated, compared to 40 percent of the total fair value of Everest Gaming as determined by BetClic, the purchaser of the 60 percent interest.
As of December 31, 2010, the carrying value of the investment in GFI exceeded the Company’s share of the underlying net assets of GFI by $7.4 million. The excess, which relates to goodwill, is evaluated periodically to determine if there has been any impairment identified.
We acquired an equity investment in Monsoon in connection with our acquisition of a controlling financial interest in IAHGames. Although IAHGames owns 100 percent of the common stock of Monsoon, we determined that Monsoon cannot be consolidated by IAHGames due to the substantive participating rights that the game licensor has in Monsoon pursuant to Monsoon’s management agreement. In 2010, we recognized our share of losses under the equity method of accounting of $12.6 million, which resulted in a negative investment balance. In accordance with the FASB codification, we charged this negative investment balance against to the loan receivable that Monsoon has outstanding to us as of December 31, 2010. The remaining balance on the loan receivable from Monsoon is $3.4 million as of December 31, 2010. (See Note 26, “Related Party Transactions”, for additional information”).
The Company has an 18 percent interest in East Gate, a Korean Limited Partnership. We account for this limited partner investment under the equity method accounting in accordance with the FASB codification as our interest is not considered to be minor. We have influence over partnership operating and financial policies based on the terms of the partnership agreement.
We assessed the potential impairment of these investments as of December 31, 2009 and 2010. (See Note 10 “Fair Value Measurements”, for additional information).
F-59
GIGAMEDIA LIMITED
NOTES TO THE CONSOLIDATED FINANCIAL STATEMENTS —
(Continued)
YEARS ENDED DECEMBER 31, 2008, 2009 AND 2010
NOTE 17.SHORT-TERM BORROWINGS
As of December 31, 2009 and 2010, short-term borrowings totaled $22.5 million and $12.4 million, respectively. These amounts were borrowed from certain financial institutions. The annual interest rates on these borrowings ranged from 1.99 percent to 4.288 percent for 2009, and from 0.85 percent to 5.56 percent for 2010. The maturity dates ranged from January 2010 to June 2010 as of December 31, 2009, and from January 2011 to March 2011 as of December 31, 2010. As of December 31, 2009 and 2010, the weighted-average interest rate on total short-term borrowings was 2.24 percent and 1.835 percent, respectively.
As of December 31, 2010, the total amount of unused lines of credit available for borrowing under these agreements was approximately $28.5 million.
During the period from January 2011 to March 2011, we repaid certain short-term borrowings totaling $6.9 million, and renewed short-term borrowing agreements totaling $5.5 million.
We pledged certain time deposits, land, and buildings as collateral for borrowings from certain financial institutions. The total value of collateral amounted to $2.1 million and $6.3 million as of December 31, 2009 and 2010, respectively, in which time deposits pledged are recorded as restricted cash totaling $932 thousand and $5 million as of December 31, 2009 and 2010, respectively.
F-60
GIGAMEDIA LIMITED
NOTES TO THE CONSOLIDATED FINANCIAL STATEMENTS —
(Continued)
YEARS ENDED DECEMBER 31, 2008, 2009 AND 2010
NOTE 18.ACCRUED EXPENSES
Accrued expenses consist of the following:
| | | | | | | | | |
| | | December 31 | |
| (in US$ thousands) | | 2009 | | | 2010 | |
| Accrued advertising expenses | | $ | 2,382 | | | $ | 770 | |
| Accrued royalties | | | 52 | | | | 1,499 | |
| Accrued professional fees | | | 1,160 | | | | 3,676 | |
| Purchase price adjustment accrual to BetClic | | | — | | | | 2,326 | |
| Other | | | 3,125 | | | | 2,715 | |
| | | | | | | |
| | | $ | 6,719 | | | $ | 10,986 | |
| | | | | | | |
NOTE 19.OTHER CURRENT LIABILITIES
Other current liabilities consist of the following:
| | | | | | | | | |
| | | December 31 | |
| (in US$ thousands) | | 2009 | | | 2010 | |
| Deferred revenue | | $ | 8,295 | | | $ | 5,249 | |
| Income taxes payable | | | 1,222 | | | | 4,980 | |
| Other | | | 3,727 | | | | 1,121 | |
| | | | | | | |
| Total | | $ | 13,244 | | | $ | 11,350 | |
| | | | | | | |
F-61
GIGAMEDIA LIMITED
NOTES TO THE CONSOLIDATED FINANCIAL STATEMENTS —
(Continued)
YEARS ENDED DECEMBER 31, 2008, 2009 AND 2010
NOTE 20.PENSION BENEFITS
Our Company and our subsidiaries have defined benefit and defined contribution pension plans that cover substantially all of our employees.
Defined Benefit Pension Plan
We have a defined benefit pension plan in accordance with the Labor Standards Law of the Republic of China (R.O.C.) for our employees located in Taiwan, covering substantially all full-time employees for services provided prior to July 1, 2005, and employees who have elected to remain in the defined benefit pension plan subsequent to the enactment of the Labor Pension Act on July 1, 2005. Under the defined benefit pension plan, employees are entitled to two base points for every year of service for the first 15 years and one base point for every additional year of service, up to a maximum of 45 base points. The pension payment to employees is computed based on base point and average salaries or wages for the six months prior to approved retirement.
We use a December 31 measurement date for our defined benefit pension plan. As of December 31, 2009 and 2010, the accumulated benefit obligation amounted to $233 thousand and $246 thousand, respectively, and the funded status amounted to $83 thousand and $44 thousand, respectively. The fair value of plan assets amounted to $209 thousand and $255 thousand as of December 31, 2009 and 2010, respectively. The accumulated other comprehensive income amounted to $208 thousand and $236 thousand as of December 31, 2009 and 2010, respectively. Included in accumulated other comprehensive income, is a net pension gain of $9 thousand as of December 31, 2010 which is expected to be recognized in 2011. The net periodic benefit cost for 2008, 2009 and 2010 amounted to $101 thousand, $76 thousand and $12 thousand, respectively.
F-62
GIGAMEDIA LIMITED
NOTES TO THE CONSOLIDATED FINANCIAL STATEMENTS —
(Continued)
YEARS ENDED DECEMBER 31, 2008, 2009 AND 2010
We have contributed an amount equal to 2 percent of the salaries and wages paid to all qualified employees located in Taiwan to a pension fund (the “Fund”). The Fund is administered by a pension fund monitoring committee (the “Committee”) and deposited in the Committee’s name in the Central Trust of China in Taiwan. Our Company makes pension payments from our account in the Fund unless the Fund is insufficient, in which case we make payments from internal funds as payments become due. We seek to maintain a normal, highly liquid working capital balance to ensure payments are made timely.
We expect to make a contribution of $18 thousand to the Fund in 2011. We do not expect to make any benefit payments through 2020.
Defined Contribution Pension Plans
We have provided defined contribution plans for employees located in Taiwan, the PRC, Hong Kong and Singapore. Contributions to the plans are expensed as incurred.
Taiwan
Pursuant to the new “Labor Pension Act” enacted on July 1, 2005, our Company has a defined contribution pension plan for our employees located in Taiwan. For eligible employees who elect to participate in the defined contribution pension plan, we contribute no less than 6 percent of an employee’s monthly salary and wage and up to the maximum amount of NT$9 thousand (approximately $309), to each of the eligible employees’ individual pension accounts at the Bureau of Labor Insurance each month. Pension payments to employees are made either by monthly installments or in a lump sum from the accumulated contributions and earnings in employees’ individual accounts.
PRC
All PRC employees participate in employee social security plans, including pension and other welfare benefits, which are organized and administered by governmental authorities. We have no other substantial commitments to employees. The premiums and welfare benefit contributions that should be borne by our Company are calculated in accordance with relevant PRC regulations, and are paid to the labor and social welfare authorities.
F-63
GIGAMEDIA LIMITED
NOTES TO THE CONSOLIDATED FINANCIAL STATEMENTS —
(Continued)
YEARS ENDED DECEMBER 31, 2008, 2009 AND 2010
Hong Kong
According to the relevant Hong Kong regulations, we provide a contribution plan for the eligible employees in Hong Kong. We must contribute at least 5 percent of the employees’ total salaries. For this purpose, the monthly relevant contribution to their individual contribution accounts is subject to a cap of HK$1 thousand (approximately $129). After the termination of employment, the benefits still belong to the employees in any circumstances.
Singapore
In accordance with Singapore regulations, we make contributions to the Singapore Central Provident Fund Scheme, a defined contribution pension plan, for eligible employees. We contribute 14.5 percent of the employees’ gross salaries, subject to a cap of SGD$4.5 thousand (approximately $3,400). We have no legal or constructive obligation to pay further contributions if the fund does not hold sufficient assets to pay all employee benefits relating to employee service in the current and preceding financial years.
The total amount of defined contribution pension expenses pursuant to our defined contribution plans for the years ended December 31, 2008, 2009, and 2010 were $1.1 million, $1.3 million, and $1.0 million, respectively.
F-64
GIGAMEDIA LIMITED
NOTES TO THE CONSOLIDATED FINANCIAL STATEMENTS —
(Continued)
YEARS ENDED DECEMBER 31, 2008, 2009 AND 2010
NOTE 21. OTHER LIABILITIES — OTHER
Other current liabilities consist of the following:
| | | | | | | | | |
| | | December 31 | |
| (in US$ thousands) | | 2009 | | | 2010 | |
| Contingent payment of minimum guarantee under licensing agreement | | $ | — | | | $ | 5,885 | |
| Warrant derivative (Note 10) | | | — | | | | 665 | |
| Other | | | 49 | | | | 1,136 | |
| | | | | | | |
| Total | | $ | 49 | | | $ | 7,686 | |
| | | | | | | |
NOTE 22.SUBSIDIARY PREFERRED SHARES
In connection with our acquisition of a controlling financial interest in IAHGames, we assumed Series A preferred shares, which are owned by the noncontrolling shareholders. As of December 31, 2010, these Series A preferred shares were valued at $1.5 million and represented 8.9 percent of IAHGames’ accumulated voting interest. The holder of the Series A preferred shares is entitled to cumulative dividends at 10 percent per annum. The preferred shares are redeemable at the holder’s option at any time after the expiration of certain licensed games, and are convertible into ordinary shares at any time. However, pursuant to agreements entered into in connection with our acquisition of IAHGames in July 2010, all Series A preferred shares are to be converted to ordinary shares of IAHGames at the acquisition date. The conversion process has not yet been completed but is expected to occur in 2011.
F-65
GIGAMEDIA LIMITED
NOTES TO THE CONSOLIDATED FINANCIAL STATEMENTS —
(Continued)
YEARS ENDED DECEMBER 31, 2008, 2009 AND 2010
As the redemption feature on the Series A preferred stock is not solely within the control of IAHGames, the amount has been presented in the mezzanine section of the Consolidated Balance Sheet. Also, since the Series A preferred shares are not currently redeemable and is not probable that they will become redeemable as a result of our acquisition of IAHGames as described above, the subsequent adjustment for accretion is not required. However, the cumulative dividends for these Series A preferred shares of $148 thousand is included as a component of “net income (loss) attributable to the noncontrolling interest” in the Consolidated Statement of Operations.
NOTE 23.EQUITY
In accordance with Singapore law, our Company’s common stock does not have a par value. In addition, we are not required to have a number of authorized common shares to be issued.
In accordance with R.O.C. law, an appropriation for legal reserve amounting to 10 percent of a company’s net profit is required until the reserve equals the aggregate par value of such Taiwan company’s issued capital stock. As of December 31, 2009 and 2010, the legal reserves of Hoshin GigaMedia Center Inc. (“Hoshin GigaMedia”), which represent a component of our consolidated accumulated deficit, were $3.0 million for each period. The reserve can only be used to offset a deficit or be distributed as a stock dividend of up to 50 percent of the reserve balance when the reserve balance has reached 50 percent of the aggregate paid-in capital of Hoshin GigaMedia.
Under PRC laws and regulations, there are certain foreign exchange restrictions on our Company’s PRC subsidiaries and VIE subsidiaries with respect to transferring certain of their net assets to our Company either in the form of dividends, loans or advances.
As of December 31, 2010, our Company’s total restricted net assets, which include paid up capital of PRC subsidiaries and the net assets of VIE subsidiaries in which our Company has no legal ownership, were approximately $2.5 million.
F-66
GIGAMEDIA LIMITED
NOTES TO THE CONSOLIDATED FINANCIAL STATEMENTS —
(Continued)
YEARS ENDED DECEMBER 31, 2008, 2009 AND 2010
NOTE 24.SHARE-BASED COMPENSATION
The following table summarizes the total stock-based compensation expense recognized in our Consolidated Statements of Operations:
| | | | | | | | | | | | | |
| (in US$ thousands) | | 2008 | | | 2009 | | | 2010 | |
| Cost of online game and service revenues | | $ | 27 | | | $ | 101 | | | $ | 10 | |
| Product development & engineering expenses | | | 480 | | | | 59 | | | | 18 | |
| Selling and marketing expenses | | | 244 | | | | 231 | | | | 64 | |
| General and administrative expenses | | | 1,954 | | | | 2,886 | | | | 2,922 | |
| | | | | | | | | | |
| Pre-tax stock-based compensation expense | | | 2,705 | | | | 3,277 | | | | 3,014 | |
| Income tax benefit | | | (497 | ) | | | (382 | ) | | | (90 | ) |
| | | | | | | | | | |
| Total stock-based compensation expense reported in continuing operations | | $ | 2,208 | | | $ | 2,895 | | | $ | 2,924 | |
| | | | | | | | | | |
| Total stock-based compensation expense reported in discontinued operations, net of tax | | $ | 63 | | | $ | — | | | $ | — | |
| | | | | | | | | | |
There were no significant capitalized stock-based compensation costs at December 31, 2009 and 2010.
(a) Overview of Stock-Based Compensation Plans
2002 Employee Share Option Plan
At the June 2002 annual general meeting of shareholders, the shareholders of our Company approved the GigaMedia Limited 2002 Employee Share Option Plan (the “2002 Plan”) under which up to three million common shares of our Company have been reserved for issuance. All employees, officers, directors, supervisors, advisors, and consultants of our Company are eligible to participate in the 2002 Plan. The 2002 Plan is administered by a committee designated by the board of directors. The committee as plan administrator has complete discretion to determine the exercise price for the option grants, the eligible individuals who are to receive option grants, the time or times when options grants are to be made, the number of shares subject to grant and the vesting schedule. The maximum contractual term for the options under the 2002 Plan is 10 years.
F-67
GIGAMEDIA LIMITED
NOTES TO THE CONSOLIDATED FINANCIAL STATEMENTS —
(Continued)
YEARS ENDED DECEMBER 31, 2008, 2009 AND 2010
2004 Employee Share Option Plan
At the June 2004 annual general meeting of shareholders, the shareholders of our Company approved the GigaMedia Limited 2004 Employee Share Option Plan (the “2004 Plan”) under which up to seven million common shares of our Company have been reserved for issuance. All employees, officers, directors, supervisors, advisors, and consultants of our Company are eligible to participate in the 2004 Plan. The 2004 Plan is administered by a committee designated by the board of directors. The committee as plan administrator has complete discretion to determine the exercise price for the option grants, the eligible individuals who are to receive option grants, the time or times when options grants are to be made, the number of shares subject to grant and the vesting schedule. The maximum contractual term for the options under the 2004 Plan is 10 years.
2006 Equity Incentive Plan
At the June 2006 annual general meeting of shareholders, the shareholders of our Company approved the GigaMedia Limited 2006 Equity Incentive Plan (the “2006 Plan”) under which up to one million common shares of our Company have been reserved for issuance. The 2006 Plan is administered by a committee designated by the board of directors. The committee as plan administrator has complete discretion to determine the grant of awards under the 2006 Plan. The maximum contractual term for the options under the 2006 Plan is 10 years.
2007 Equity Incentive Plan
At the June 2007 annual general meeting of shareholders, the shareholders of our Company approved the GigaMedia Limited 2007 Equity Incentive Plan (the “2007 Plan”) under which up to two million common shares of our Company have been reserved for issuance. The 2007 Plan is administered by a committee designated by the board of directors. The committee as plan administrator has complete discretion to determine the grant of awards under the 2007 Plan. The maximum contractual term for the options under the 2007 Plan is 10 years.
F-68
GIGAMEDIA LIMITED
NOTES TO THE CONSOLIDATED FINANCIAL STATEMENTS —
(Continued)
YEARS ENDED DECEMBER 31, 2008, 2009 AND 2010
2008 Equity Incentive Plan
At the June 2008 annual general meeting of shareholders, the shareholders of our Company approved the GigaMedia Limited 2008 Equity Incentive Plan (the “2008 Plan”) under which up to one million common shares of our Company have been reserved for issuance. The 2008 Plan is administered by a committee designated by the board of directors. The committee as plan administrator has complete discretion to determine the grant of awards under the 2008 Plan. The maximum contractual term for the options under the 2008 Plan is 10 years.
2008 Employee Share Purchase Plan
At the June 2008 annual general meeting of shareholders, the shareholders of our Company approved the GigaMedia Limited 2008 Employee Share Purchase Plan (the “2008 ESPP”) under which up to two hundred thousand common shares of our Company were reserved for issuance. Any person who is regularly employed by our Company or our designated subsidiaries shall be eligible to participate in the 2008 ESPP. Pursuant to the 2008 ESPP, our Company would offer the shares to qualified employees on favorable terms. Employees are also subject to certain restrictions on the amount that may be invested to purchase the shares and to other terms and conditions of the 2008 ESPP. The 2008 ESPP is administered by a committee designated by the board of directors. As of December 31, 2010, no shares have been subscribed by qualified employees under the 2008 ESPP.
2009 Equity Incentive Plan
At the June 2009 annual general meeting of shareholders, the shareholders of our Company approved the GigaMedia Limited 2009 Equity Incentive Plan (the “2009 Plan”) under which up to one and a half million common shares of our Company have been reserved for issuance. The 2009 Plan is administered by a committee designated by the board of directors. The committee as plan administrator has complete discretion to determine the grant of awards under the 2009 Plan. The maximum contractual term for the options under the 2009 Plan is 10 years.
F-69
GIGAMEDIA LIMITED
NOTES TO THE CONSOLIDATED FINANCIAL STATEMENTS —
(Continued)
YEARS ENDED DECEMBER 31, 2008, 2009 AND 2010
2009 Employee Share Purchase Plan
At the June 2009 annual general meeting of shareholders, the shareholders of our Company approved the GigaMedia Limited 2009 Employee Share Purchase Plan (the “2009 ESPP”) under which up to two hundred thousand common shares of our Company have been reserved for issuance. To be eligible, employees must be regularly employed by us or our designated subsidiaries. Employees are also subject to certain restrictions on the amount that may be invested to purchase the shares and to other terms and conditions of the 2009 ESPP. The 2009 ESPP is administered by a committee designated by the board of directors. As of December 31, 2010, no shares have been issued to employees under the 2009 ESPP.
2010 Equity Incentive Plan
At the June 2010 annual general meeting of shareholders, the shareholders of our Company approved the GigaMedia Limited 2010 Equity Incentive Plan (the “2010 Plan”) under which up to one million common shares of our Company have been reserved for issuance. The 2010 Plan is administered by a committee designated by the board of directors. The committee as plan administrator has complete discretion to determine the grant of awards under the 2010 Plan. The maximum contractual term for the options under the 2010 Plan is 10 years. As of December 31, 2010, no awards have been granted under the 2010 Plan.
2010 Employee Share Purchase Plan
At the June 2010 annual general meeting of shareholders, the shareholders of our Company approved the GigaMedia Limited 2010 Employee Share Purchase Plan (the “2010 ESPP”) under which up to two hundred thousand common shares of our Company have been reserved for issuance. To be eligible, employees must be regularly employed by us or our designated subsidiaries. Employees are also subject to certain restrictions on the amount that may be invested to purchase the shares and to other terms and conditions of the 2010 ESPP. The 2010 ESPP is administered by a committee designated by the board of directors. As of December 31, 2010, no shares have been issued to employees under the 2010 ESPP.
F-70
GIGAMEDIA LIMITED
NOTES TO THE CONSOLIDATED FINANCIAL STATEMENTS —
(Continued)
YEARS ENDED DECEMBER 31, 2008, 2009 AND 2010
Summarized below are the general terms of our stock-based compensation plans, for which awards have been granted as of December 31, 2010.
| | | | | | | | | | | |
| Stock-Based | | Granted | | | | | Options’ exercise | | RSUs’ grant date |
| compensation plan | | awards | | | Vesting schedule | | price | | fair value |
| | | | | | | | | | | |
| 2002 Plan | | | 3,000,000 | | | immediately upon granting | | $0.79 | | — |
| | | | | | | | | | | |
| 2004 Plan | | | 7,703,185 | * | | immediately upon granting to four years | | $0.79~$2.55 | | — |
| | | | | | | | | | | |
| 2006 Plan | | | 1,117,333 | ** | | immediately upon granting to four years | | $2.47~$16.6 | | $2.91~$16.01 |
| | | | | | | | | | | |
| 2007 Plan | | | 2,431,907 | *** | | immediately upon granting to four years | | $2.47~$18.17 | | $2.47~15.35 |
| | | | | | | | | | | |
| 2008 Plan | | | 1,000,000 | | | immediately upon granting to six years | | $2.47~4.24 | | — |
| | | | | | | | | | | |
| 2009 Plan | | | 1,500,000 | | | immediately upon granting to four years | | $2.47 | | — |
| | | |
| * | | The granted awards, net of forfeited or canceled shares, were within reserved shares of seven million common shares. |
| |
| ** | | The granted awards, net of forfeited or canceled shares, were within reserved shares of one million common shares. |
| |
| *** | | The granted awards, net of forfeited or canceled shares, were within reserved shares of two million common shares. |
Options and Restricted Stock Units (“RSUs”) generally vest over the schedule described above. Certain RSUs provide for accelerated vesting if there is a change in control. All options and RSUs are expected to be settled by issuing new shares.
F-71
GIGAMEDIA LIMITED
NOTES TO THE CONSOLIDATED FINANCIAL STATEMENTS —
(Continued)
YEARS ENDED DECEMBER 31, 2008, 2009 AND 2010
(b) Options
In 2008, 2009 and 2010, 518,284, 543,049 and 200,500 options were exercised, and cash received from the exercise of stock options was $0.5 million, $1.3 million and $0.2 million, respectively, which resulted in no significant tax benefit realized on a consolidated basis.
Our Company uses the Black-Scholes option-pricing model to estimate the fair value of stock options granted to employees. There were no stock options granted in 2009. The following table summarizes the assumptions used in the model for options granted during 2008 and 2010:
| | | | | | | | | |
| | | 2008 | | | 2010 | |
| Option term (years) | | | 2.77~4.58 | | | | 6.48 | |
| Volatility | | | 58%~65 | % | | | 65 | % |
| Weighted-average volatility | | | 64 | % | | | 65 | % |
| Risk-free interest rate | | | 1.72%~2.88 | % | | | 2.77 | % |
| Dividend yield | | | 0 | % | | | 0 | % |
| Weighted-average fair value of option granted | | $ | 2.36 | | | $ | 1.55 | |
Option term. The expected term of the options granted represents the period of time that they are expected to be outstanding. Our Company estimates the expected term of options granted based on historical experience with grants and option exercises.
Expected volatility rate. An analysis of historical volatility was used to develop the estimate of expected volatility.
Risk-free interest rate. The risk-free interest rate is based on yields of U.S. Treasury bonds for the expected term of the options.
Expected dividend yield. The dividend yield is based on our Company’s current dividend yield.
F-72
GIGAMEDIA LIMITED
NOTES TO THE CONSOLIDATED FINANCIAL STATEMENTS —
(Continued)
YEARS ENDED DECEMBER 31, 2008, 2009 AND 2010
Option transactions during the last three years are summarized as follows:
| | | | | | | | | | | | | | | | | | | | | | | | | | | | | | | | | |
| | | 2008 | | | 2009 | | | | | | | | | | | 2010 | |
| | | | | | | | | | | | | | | | | Weighted- | | | | |
| | | Weighted | | | | | | | Weighted | | | | | | | Weighted | | | | | | | Average | | | Aggregate | |
| | | Avg. | | | No.of | | | Avg. | | | No.of | | | Avg. | | | No.of | | | Remaining | | | Intrinsic | |
| | | Exercise | | | Shares | | | Exercise | | | Shares | | | Exercise | | | Shares | | | Contractual | | | Value | |
| | | Price | | | (in thousands) | | | Price | | | (in thousands) | | | Price | | | (in thousands) | | | Term | | | (in thousands) | |
| | | | | | | | | | | | | | | | | | | | | | | | | | | | | | | | | |
| Balance at January 31 | | $ | 2.42 | | | | 7,912 | | | $ | 2.47 | | | | 8,287 | | | $ | 2.36 | | | | 7,689 | | | | | | | | | |
| Options granted | | | 4.69 | | | | 1,341 | | | | — | | | | — | | | | 2.47 | | | | 2,565 | | | | | | | | | |
| Options exercised | | | 0.95 | | | | (518 | ) | | | 2.42 | | | | (543 | ) | | | 0.87 | | | | (201 | ) | | | | | | | | |
| Options | | | | | | | | | | | | | | | | | | | | | | | | | | | | | | | | |
| Forfeited / canceled / expired | | | 9.97 | | | | (448 | ) | | | 17.98 | | | | (55 | ) | | | 5.66 | | | | (273 | ) | | | | | | | | |
| | | | | | | | | | | | | | | | | | | | | | | | | |
| Balance at December 31 | | $ | 2.47 | | | | 8,287 | | | $ | 2.36 | | | | 7,689 | | | $ | 2.33 | | | | 9,780 | | | | 5.60 | | | $ | 3,591 | |
| | | | | | | | | | | | | | | | | | | | | | | | | |
| Exercisable at December 31 | | $ | 1.33 | | | | 6,448 | | | $ | 1.65 | | | | 6,420 | | | $ | 2.04 | | | | 7,190 | | | | 4.46 | | | $ | 3,591 | |
| | | | | | | | | | | | | | | | | | | | | | | | | |
| Vested and expected to vest at December 31 | | $ | 2.47 | | | | 8,287 | | | $ | 2.36 | | | | 7,689 | | | $ | 2.33 | | | | 9,780 | | | | 5.60 | | | $ | 3,591 | |
| | | | | | | | | | | | | | | | | | | | | | | | | |
The aggregate intrinsic value in the table above represents the total pre-tax intrinsic value (the difference between GigaMedia’s closing stock price on the last trading day of 2010 and the fair value of the exercise price, multiplied by the number of in-the-money options) that would have been received by the option holders had they exercised their options on December 31, 2010. This amount changes based on the fair market value of GigaMedia’s stock. The total intrinsic value of options exercised for the years ended December 31, 2008, 2009, and 2010 were $7.2 million, $0.8 million, and $0.3 million, respectively.
As of December 31 2010, there was approximately $4.0 million of unrecognized compensation cost related to nonvested options. That cost is expected to be recognized over a period of 3.17 years.
F-73
GIGAMEDIA LIMITED
NOTES TO THE CONSOLIDATED FINANCIAL STATEMENTS —
(Continued)
YEARS ENDED DECEMBER 31, 2008, 2009 AND 2010
The following table sets forth information about stock options outstanding at December 31, 2010:
| | | | | | | | | | | | | | | | | |
| Options outstanding | | | Option currently exercisable | |
| | | | | | | Weighted | | | | |
| | | | | | | average | | | | |
| | | No. of Shares | | | remaining | | | | | | | No. of Shares | |
| Exercise price | | (in thousands) | | | contractual life | | | Exercise price | | | (in thousands) | |
| Under $1 | | | 5,201 | | | 3.50 years | | Under $1 | | | 5,201 | |
| $1~$10 | | | 3,950 | | | 8.19 years | | $1~$10 | | | | 1,452 | |
| $10~$20 | | | 629 | | | 6.65 years | | $10~$20 | | | | 537 | |
| | | | | | | | | | | | | | | |
| | | | 9,780 | | | | | | | | | | | | 7,190 | |
| | | | | | | | | | | | | | | |
(c) RSUs
Nonvested RSUs during 2009 and 2010 were as follows:
| | | | | | | | | | | | | | | | | |
| | | 2009 | | | 2010 | |
| | | | | | | Weighted- | | | | | | | Weighted- | |
| | | Number of | | | average | | | Number of | | | average | |
| | | units | | | grant date fair | | | units | | | grant date | |
| | | (in thousands) | | | value | | | (in thousands) | | | fair value | |
| Nonvested at January 1 | | | 641 | | | $ | 10.41 | | | | 640 | | | $ | 9.83 | |
| Granted | | | 100 | | | | 6.01 | | | | 119 | | | | 2.68 | |
| Vested | | | (86 | ) | | | 10.15 | | | | (201 | ) | | | 4.88 | |
| Forfeited | | | (15 | ) | | | 7.19 | | | | (168 | ) | | | 8.00 | |
| | | | | | | | | | | | | |
| Nonvested at December 31 | | | 640 | | | $ | 9.83 | | | | 390 | | | $ | 10.99 | |
| | | | | | | | | | | | | |
The fair value of RSUs is determined and fixed on the grant date based on our stock price. The fair value of RSUs granted during the years ended December 31, 2008, 2009 and 2010 was $6.8 million, $0.6 million and $0.3 million, respectively. The total fair value of RSUs vested during the years ended December 31, 2008, 2009 and 2010 was $1.5 million, $0.9 million and $1.0 million, respectively, which resulted in no significant tax benefit realized on a consolidated basis.
F-74
GIGAMEDIA LIMITED
NOTES TO THE CONSOLIDATED FINANCIAL STATEMENTS —
(Continued)
YEARS ENDED DECEMBER 31, 2008, 2009 AND 2010
As of December 31 2010, there was approximately $4 thousand of unrecognized compensation cost related to nonvested RSUs. That cost is expected to be recognized over a weighted-average period of 0.01 years. Our Company received no cash from employees as a result of employee stock award vesting and the forfeiture of RSUs during 2008, 2009 and 2010.
NOTE 25.INCOME TAXES
Income (loss) from continuing operations before income taxes by geographic location is as follows:
| | | | | | | | | | | | | |
| | | For the years ended December 31 | |
| (in US$ thousands) | | 2008 | | | 2009 | | | 2010 | |
| U.S. operations | | $ | 1,095 | | | $ | 1,324 | | | $ | 5,678 | |
| Non-U.S. operations | | | 35,684 | | | | (56,909 | ) | | | 2,990 | |
| | | | | | | | | | |
| | | $ | 36,779 | | | $ | (55,585 | ) | | $ | 8,668 | |
| | | | | | | | | | |
Income tax provision (benefit) from continuing operations by geographic location is as follows:
| | | | | | | | | | | | | |
| | | For the years ended December 31 | |
| (in US$ thousands) | | 2008 | | | 2009 | | | 2010 | |
| U.S. operations | | $ | 620 | | | $ | 557 | | | $ | 4,992 | |
| Non-U.S. operations | | | 449 | | | | (40 | ) | | | 2,268 | |
| | | | | | | | | | |
| | | $ | 1,069 | | | $ | 517 | | | $ | 7,260 | |
| | | | | | | | | | |
F-75
GIGAMEDIA LIMITED
NOTES TO THE CONSOLIDATED FINANCIAL STATEMENTS —
(Continued)
YEARS ENDED DECEMBER 31, 2008, 2009 AND 2010
The components of income tax provision from continuing operations by taxing jurisdiction are as follows:
| | | | | | | | | | | | | |
| | | For the years ended December 31 | |
| (in US$ thousands) | | 2008 | | | 2009 | | | 2010 | |
| U.S. Federal: | | | | | | | | | | | | |
| Current | | $ | (57 | ) | | $ | 863 | | | $ | 4,244 | |
| Deferred | | | 528 | | | | (443 | ) | | | 20 | |
| | | | | | | | | | |
| | | $ | 471 | | | $ | 420 | | | $ | 4,264 | |
| | | | | | | | | | |
| U.S. State and Local: | | | | | | | | | | | | |
| Current | | $ | 208 | | | $ | 156 | | | $ | 617 | |
| Deferred | | | (59 | ) | | | (19 | ) | | | 111 | |
| | | | | | | | | | |
| | | $ | 149 | | | $ | 137 | | | $ | 728 | |
| | | | | | | | | | |
| Non — U.S.: | | | | | | | | | | | | |
| Current | | $ | 976 | | | $ | 967 | | | $ | 2,032 | |
| Deferred | | | (527 | ) | | | (1,007 | ) | | | 236 | |
| | | | | | | | | | |
| | | $ | 449 | | | $ | (40 | ) | | $ | 2,268 | |
| | | | | | | | | | |
| Total income tax provision | | $ | 1,069 | | | $ | 517 | | | $ | 7,260 | |
| | | | | | | | | | |
A reconciliation of our effective tax rate related to continuing operations to the statutory U.S. federal tax rate is as follows:
| | | | | | | | | | | | | |
| | | For the years ended December 31 | |
| | | 2008 | | | 2009 | | | 2010 | |
| Federal statutory rate | | | 34.00 | % | | | 34.00 | % | | | 34.00 | % |
| State and local — net of federal tax benefit | | | 6.27 | % | | | 8.14 | % | | | 6.69 | % |
| Foreign tax differential | | | (32.56 | %) | | | (43.53 | %) | | | (88.75 | %) |
| Permanent differences | | | 0.76 | % | | | 2.18 | % | | | 31.58 | % |
| Change in valuation allowance | | | (4.69 | %) | | | (1.73 | %) | | | 52.73 | % |
| Tax effect of earnings for equity method investees and certain subsidiaries | | | — | | | | — | | | | 42.72 | % |
| Other | | | (0.87 | %) | | | 0.01 | % | | | 4.79 | % |
| | | | | | | | | | |
| Effective rate | | | 2.91 | % | | | (0.93 | %) | | | 83.76 | % |
| | | | | | | | | | |
F-76
GIGAMEDIA LIMITED
NOTES TO THE CONSOLIDATED FINANCIAL STATEMENTS —
(Continued)
YEARS ENDED DECEMBER 31, 2008, 2009 AND 2010
In 2010, the primary reason for the increase in the income tax provision and the effective income tax rate was due to the sale of 60 percent of our gaming software and service business (see Note 6, “Divestiture”, for additional information). The income tax provision related to the sale of the gaming software and service business was approximately $6.1 million, which represented approximately 70 percent of our income from continuing operations.
The provision for income taxes attributable to discontinued operations was $986 thousand, $0, and $0, for the years ended December 31, 2008, 2009 and 2010, respectively.
Significant components of our deferred tax assets consist of the following:
| | | | | | | | | |
| | | December 31 | |
| (in US$ thousands) | | 2009 | | | 2010 | |
| Net operating loss carryforwards | | $ | 80 | | | $ | 4,880 | |
| Deferred revenue | | | 540 | | | | 9 | |
| Loss on equity method investment | | | — | | | | 2,813 | |
| Share-based compensation | | | 230 | | | | 162 | |
| Impairment charges | | | 1,465 | | | | 16 | |
| Pension expense | | | 41 | | | | 33 | |
| Depreciation | | | 86 | | | | 52 | |
| Other | | | (15 | ) | | | 18 | |
| | | | | | | |
| | | | 2,427 | | | | 7,983 | |
| Less: valuation allowance | | | (1,068 | ) | | | (7,402 | ) |
| | | | | | | |
| Deferred tax assets — net | | $ | 1,359 | | | $ | 581 | |
| | | | | | | |
As of December 31, 2009 and 2010, $243 thousand and $0, respectively, of net deferred tax assets were reported as non-current deferred tax assets and included in other assets.
F-77
GIGAMEDIA LIMITED
NOTES TO THE CONSOLIDATED FINANCIAL STATEMENTS —
(Continued)
YEARS ENDED DECEMBER 31, 2008, 2009 AND 2010
Significant components of our deferred tax liabilities consist of the following:
| | | | | | | | | |
| | | December 31 | |
| (in US$ thousands) | | 2009 | | | 2010 | |
| Depreciation and amortization | | $ | 69 | | | $ | 117 | |
| Tax effect on undistributed earnings of equity method investees | | | — | | | | 1,010 | |
| Other | | | (37 | ) | | | — | |
| | | | | | | |
| Deferred tax liabilities — net | | $ | 32 | | | $ | 1,127 | |
| | | | | | | |
As of December 31, 2009 and 2010, $(3) thousand and $1.1 million, respectively, of net deferred tax liabilities were reported as non-current deferred tax liabilities and included in other liabilities.
A reconciliation of the beginning and ending amounts of our valuation allowance on deferred tax assets for the years ended December 31, 2008, 2009 and 2010 are as follows:
| | | | | | | | | | | | | |
| | | For the years ended December 31, | |
| (in US$ thousands) | | 2008 | | | 2009 | | | 2010 | |
| Balance at beginning of year | | $ | 3,012 | | | $ | 106 | | | $ | 1,068 | |
| Subsequent reversal/utilization of valuation allowance | | | (2,787 | ) | | | (45 | ) | | | (12 | ) |
| Additions to valuation allowance | | | — | | | | 1,006 | | | | 4,583 | |
| Divestitures | | | (219 | ) | | | — | | | | (874 | ) |
| Acquisitions | | | — | | | | — | | | | 2,624 | |
| Exchange differences | | | 100 | | | | 1 | | | | 13 | |
| | | | | | | | | | |
| Balance at end of year | | $ | 106 | | | $ | 1,068 | | | $ | 7,402 | |
| | | | | | | | | | |
As of December 31, 2008, we evaluated the available evidence and determined that it was more likely than not that we would realize the benefit of the deferred tax assets. The primary reason for the reversal of the valuation allowance in 2008 was that the sale of our Internet access and service operation was completed in September 2008. Based on weighing all available evidence, we determined that evidence existed to conclude that it was more likely than not that we could generate sufficient taxable income to utilize the majority of the deferred tax assets within the allowable carryforward periods.
F-78
GIGAMEDIA LIMITED
NOTES TO THE CONSOLIDATED FINANCIAL STATEMENTS —
(Continued)
YEARS ENDED DECEMBER 31, 2008, 2009 AND 2010
In 2009, the valuation allowance on the deferred tax assets increased by $962 thousand to $1.1 million primarily because we determined that certain subsidiaries and VIE subsidiaries of our online game and service business were not likely to be able to utilize all of the deferred tax assets based on their estimated future taxable income.
In 2010, the valuation allowance on the deferred tax assets increased by $6.3 million to $7.4 million primarily due to the acquisition of IAHGames. IAHGames had successive losses in prior years and therefore we do not believe that sufficient objective, positive evidence existed at the date of our acquisition to conclude that the realization of the deferred tax assets that we acquired from IAHGames was more likely than not. We also provided a valuation allowance against deferred tax assets related to certain of our other subsidiaries, as they are not likely to be able to utilize all of their deferred tax assets based on their estimated future taxable income.
As of December 31, 2010, the Company had net operating loss carryforwards available to offset future income, amounting to $27.9 million. Below is the breakdown of the expiration of the net operating loss carryforwards in major jurisdictions:
| | | | | | | | | |
| (in US$ thousands) | | | | | | |
| Jurisdiction | | Amount | | | Expiring year | |
| Singapore | | $ | 19,296 | | | indefinite |
| Hong Kong | | | 4,928 | | | indefinite |
| Taiwan | | | 1,871 | | | 2020 | |
| Other | | | 1,841 | | | | | |
| | | | | | | | |
| Total | | $ | 27,936 | | | | | |
| | | | | | | | |
F-79
GIGAMEDIA LIMITED
NOTES TO THE CONSOLIDATED FINANCIAL STATEMENTS —
(Continued)
YEARS ENDED DECEMBER 31, 2008, 2009 AND 2010
Under Singapore tax regulations, foreign-sourced dividend income used for capital expenditures, including investments, and repayment of borrowings, would not be deemed as remitted to Singapore and is therefore not taxable. As of December 31, 2010, the Company has not accrued deferred income taxes on $26.4 million of unremitted earnings from non-Singapore subsidiaries, as such earnings are considered to be reinvested overseas or for repayment of borrowings. Determination of the amount of unrecognized deferred tax liability related to these earnings is considered impracticable.
Uncertain Tax Positions
A reconciliation of the beginning and ending amount of unrecognized tax benefits (excluding the effects of accrued interest) for the years 2008, 2009 and 2010 are as follows:
| | | | | |
| (in US$ thousands) | | Amount | |
| Balance at January 1, 2008 | | $ | 127 | |
| Decrease due to settlement | | | (127 | ) |
| | | | |
| Balance at December 31, 2008 | | | — | |
| Increase for prior year tax positions | | | 220 | |
| Increase for current year tax positions | | | 460 | |
| Exchange differences | | | 22 | |
| | | | |
| Balance at December 31, 2009 | | | 702 | |
| Acqusition of IAHGames | | | 535 | |
| Increase for prior year tax positions | | | 194 | |
| Increase for current year tax positions | | | 323 | |
| Decrease due to settlement | | | (166 | ) |
| Exchange differences | | | 79 | |
| | | | |
| Balance at December 31, 2010 | | $ | 1,667 | |
| | | | |
As of December 31, 2008, 2009 and 2010, there were approximately $0, $0.7 million and $1.7 million of unrecognized tax benefits that if recognized would affect the effective tax rate.
Interest and penalties related to income tax liabilities are included in income tax expense. In 2008, 2009 and 2010, there were no significant interest and penalties recognized in income tax expense.
F-80
GIGAMEDIA LIMITED
NOTES TO THE CONSOLIDATED FINANCIAL STATEMENTS —
(Continued)
YEARS ENDED DECEMBER 31, 2008, 2009 AND 2010
Our major tax jurisdictions are located in Taiwan, Singapore and the United States. As of December 31, 2010, the income tax filings under tax jurisdictions located in Taiwan have been examined through 2008, but we have filed appeals for the 2006, 2007 and 2008 tax filings. The tax authority in Singapore has examined the tax filings of IAHGames through the 2008 tax filings. Our Company also files income tax returns in the United States federal and state jurisdictions. The tax authority in the U.S. is currently examining the 2008 tax filing.
In 2008, all of our unrecognized tax benefits were related to research and development credits filed in 2005 and 2006. These unrecognized tax benefits were all settled with tax authorities and as a result, there was no unrecognized tax benefit as of December 31, 2008.
In 2009 and 2010, our unrecognized tax benefits were related to research and development credits and were also related to amortization of goodwill and intangible assets resulting from the acquisition of FunTown. For research and development credits, these unrecognized tax benefits were settled with tax authorities though the 2008 tax filings. For amortization of goodwill and intangible assets resulting from the acquisition of FunTown, the income tax authority has proposed adjustments on the amortization for our 2006, 2007 and 2008 tax filings. We have filed appeals for these amortization adjustments but haven’t received a response from the tax authority.
In 2010, our unrecognized tax benefits increased by $535 thousand due to the acquisition of IAHGames. These unrecognized tax benefits primarily relate to certain related party transactions.
The amount of unrecognized tax benefits may increase or decrease in the future for various reasons such as current year tax positions, expiration of statutes of limitations, litigation, legislative activity, or other changes in facts regarding realizability. However, at this time, an estimate of the potential range of change cannot be reasonably made.
F-81
GIGAMEDIA LIMITED
NOTES TO THE CONSOLIDATED FINANCIAL STATEMENTS —
(Continued)
YEARS ENDED DECEMBER 31, 2008, 2009 AND 2010
NOTE 26.RELATED-PARTY TRANSACTIONS
In 2009 and 2010, a key manager of Waterland Financial Holdings (“Waterland”) was one of our directors. As of December 31, 2009 and 2010, we had short-term indebtedness in the amount of $1.5 million and $0, respectively, bearing interest of 3.288 percent and nil, respectively, owed to Waterland. The outstanding short-term indebtedness was utilized to support our current operations. The largest amounts of outstanding short-term indebtedness to Waterland during the years ended December 31, 2009 and 2010 were both $1.5 million.
We acquired an equity investment in Monsoon in connection with our acquisition of IAHGames with effect from July 1, 2010. In 2010, prior to our acquisition, IAHGames loaned $5.0 million to Monsoon to support Monsoon’s current operations. IAHGames has continued to support Monsoon’s operations subsequent to July 1, 2010. The loan bears interest at 7 percent per annum. The largest amount outstanding to Monsoon from July 1, 2010 through December 31, 2010 was $10.3 million. As of December 31, 2010, the balance of this loan receivable was $3.4 million, after being reduced in connection with absorbing additional losses of Monsoon as discussed in more detail in Note 16, “Investments”.
F-82
GIGAMEDIA LIMITED
NOTES TO THE CONSOLIDATED FINANCIAL STATEMENTS —
(Continued)
YEARS ENDED DECEMBER 31, 2008, 2009 AND 2010
NOTE 27.COMMITMENTS AND CONTINGENCIES
Commitments
(a) Operating Leases
We rent certain properties which are used as office premises under lease agreements that expire at various dates through 2025. The following table sets forth our future aggregate minimum lease payments required under these operating leases, as of December 31, 2010:
| | | | | |
| (in US$ thousands) | | | | |
| Year | | | | |
| 2011 | | $ | 1,151 | |
| 2012 | | | 559 | |
| 2013 | | | 124 | |
| 2014 | | | 118 | |
| 2015 | | | 121 | |
| 2016 and after | | | 1,236 | |
| | | | |
| Total | | $ | 3,309 | |
| | | | |
Rental expense for operating leases amounted to $5.0 million, $5.1 million and $3.0 million for the years ended December 31, 2008, 2009 and 2010, respectively (including rental expense amounts of $1.6 million, $0, and $0 reported in discontinued operations in 2008, 2009 and 2010, respectively).
(b) License Agreements
We have contractual obligations under various license agreements to pay the licensors license fees and minimum guarantees against future royalties. The following table summarizes the committed license fees and minimum guarantees against future royalties set forth in our significant license agreements as of December 31, 2010.
| | | | | | | | | | | | | |
| | | | | | | Minimum | | | | |
| | | | | | | guarantees | | | | |
| | | | | | | against future | | | | |
| (in US$ thousands) | | License fees | | | royalties | | | Total | |
| Minimum required payments: | | | | | | | | | | | | |
| In 2011 | | $ | 741 | | | $ | 9,633 | | | $ | 10,374 | |
| After 2011 | | | 6,200 | | | | 5,500 | | | | 11,700 | |
| | | | | | | | | | |
| | | $ | 6,941 | | | $ | 15,133 | | | $ | 22,074 | |
| | | | | | | | | | |
F-83
GIGAMEDIA LIMITED
NOTES TO THE CONSOLIDATED FINANCIAL STATEMENTS —
(Continued)
YEARS ENDED DECEMBER 31, 2008, 2009 AND 2010
The initial minimum guarantees against future royalties and license fees are not required to be paid until the licensed games are commercially released or until certain milestones are achieved, as stipulated in the individual license agreements. The remaining minimum guarantees are generally required to be paid within three years subsequent to the commercial release dates of the licensed games.
Additionally, we also have contractually committed to support related marketing, promotion, and advertising activities for certain games, and our commitments are contingent to occur based on the payment schedules set forth in the individual license agreements. As of December 31, 2010, our total commitments to these marketing expenditures amounted to not less than $11.9 million.
Contingencies
(a) World Series of Poker Litigation
We have certain contractual obligations pursuant to the sale of a 60 percent ownership interest in our online gaming software and service business to BetClic. Pursuant to the terms of the sale, we agreed to pay 40 percent of the attorney fees incurred in connection with the World Series of Poker litigation (see Note 28, “Litigation” for additional information) if Everest Gaming does not pay the attorney fees. All the attorney fees incurred to date have been paid by Everest Gaming. However, we may be liable for 40 percent of any and all future attorney fees relating to this litigation if for some reason Everest Gaming does not continue to make these payments.
(b) Other
We are subject to legal proceedings and claims that arise in the normal course of business. We believe the ultimate liabilities with respect to these actions will not have a material adverse effect on our financial condition, results of operations or cash flows. (See Note 28, “Litigation”, for additional information).
F-84
GIGAMEDIA LIMITED
NOTES TO THE CONSOLIDATED FINANCIAL STATEMENTS —
(Continued)
YEARS ENDED DECEMBER 31, 2008, 2009 AND 2010
NOTE 28.LITIGATION
(a) Class Action
In December 2001, a class action lawsuit was filed in the United States District Court for the Southern District of New York (“District Court”) against our Company in connection with the initial public offering of our stock.
The complaint alleged that we violated Section 11 and Section 15 of the Securities Exchange Act of 1933 and Section 10(b) of the Securities Exchange Act of 1934 and Rule 10b-5 promulgated thereunder. In October 2002, plaintiffs voluntarily dismissed the individual defendants without prejudice. On February 19, 2003, the court issued an opinion and order on defendants’ motions to dismiss, which granted the motions in part and denied the motions in part. As to GigaMedia, the Rule 10b-5 claims were dismissed without prejudice, while the Section 11 claims survived the motion. Discovery in the actions commenced.
In June 2004, plaintiffs and issuer defendants, including our Company, presented the executed settlement agreement (the “Issuers’ Settlement”) to the judge during a court conference. Subsequently, plaintiffs and issuer defendants made a motion for preliminary approval of the settlement agreement. The key terms of the Issuers’ Settlement included: 1) the insurers of the issuers would provide an undertaking to guarantee that the plaintiffs would recover a total of $1 billion; 2) the insurers would pay up to $15 million for the notice costs arising from the settlement; 3) the issuers would assign their interest in certain claims against the underwriters to a litigation trust, represented by plaintiffs’ counsel; and 4) the plaintiffs would release all of the settling issuer defendants. That is, if plaintiffs were successful in recovering more than $1 billion from the underwriters, the issuer defendants would not be obligated to pay any additional amounts. If plaintiffs recovered less than $1 billion from the underwriters, the insurers would pay the deficit between $1 billion and the amount received from the underwriters.
F-85
GIGAMEDIA LIMITED
NOTES TO THE CONSOLIDATED FINANCIAL STATEMENTS —
(Continued)
YEARS ENDED DECEMBER 31, 2008, 2009 AND 2010
On February 15, 2005, the judge issued an opinion and order granting preliminary approval to the settlement agreement subject to a narrowing of the proposed bar order as to only contribution claims. On April 24, 2006, the court held a fairness hearing on the proposed Issuers’ Settlement, which was subject to the court’s approval.
On December 5, 2006, the United States Court of Appeals for the Second Circuit issued an opinion vacating the District Court’s class certification in the six focus cases, which do not include the Company. Because the Second Circuit’s opinion was directed to class certification in the focus cases, the opinion’s effect on the proposed class to be certified by the District Court in connection with the Issuers’ Settlement was unclear.
On December 15, 2006, the District Court held a conference with all counsel in the IPO securities class action lawsuit to discuss the impact of the foregoing opinion. In the conference, the District Court agreed to stay all proceedings, including discovery and consideration of the Issuers’ Settlement, pending further decisions from the Second Circuit.
On January 5, 2007, plaintiffs filed a petition in the Second Circuit for rehearing and rehearing en banc regarding the decision on class certification (the “Petition”). On April 6, 2007, the Second Circuit rendered its decision which denied the Petition.
In April, May, and June 2007, the District Court held several conferences to discuss the issues regarding class certification, statute of limitations, the Issuers’ Settlement and discovery. In June 2007, a stipulation terminating the Issuers’ Settlement was submitted to the District Court.
In September 2007, discovery moved forward in the six focus cases, which do not include the Company. Plaintiffs filed amended complaints against the focus case issuer and underwriter defendants and moved for class certification in those actions. In November 2007, the underwriters and issuers filed motions to dismiss the amended complaints in the focus cases. In December 2007, plaintiffs filed their opposition to defendants’ motions to dismiss. In January 2008, defendants filed their reply briefs in further support of the motions to dismiss.
F-86
GIGAMEDIA LIMITED
NOTES TO THE CONSOLIDATED FINANCIAL STATEMENTS —
(Continued)
YEARS ENDED DECEMBER 31, 2008, 2009 AND 2010
On or about March 26, 2008, the District Court granted in part and denied in part the motion to dismiss the focus cases. The motion to dismiss was granted only as to claims brought under Section 11 of the Securities Act by plaintiffs who sold their securities for a price in excess of the initial offering price and by those plaintiffs who purchased outside the previously certified class period.
On April 9, 2008, the underwriters filed a motion for reconsideration of the holding in the March 26, 2008 opinion that the Section 11 claims against the focus case issuer was not time barred, on the basis that no Section 11 class in that case was certified in 2004. The issuers joined in that motion on behalf of the focus case issuer by letter to the District Court on April 10, 2008.
In December 2007, the issuers filed their oppositions to class certification in the focus cases. In March 2008, plaintiffs filed their reply brief in further support of class certification. The underwriters and issuers submitted sur-replies in further opposition to class certification on April 22, 2008, addressing issues related to the deposition of the plaintiffs’ expert.
As set forth in Plaintiffs’ Motion For Preliminary Approval of the Settlement and accompanying documents, which were filed on April 2, 2009, after eight years of litigation all parties to the IPO Cases have agreed to settle the actions on a global basis (the “IPO Settlement Agreement”). Pursuant to the IPO Settlement Agreement, the defendants have agreed to pay $586 million in total to settle all 309 IPO Cases, including the GigaMedia action. The agreement to settle was reached after a lengthy mediation followed by months of negotiation to reach agreement on the details. As to our Company’s portion of the settlement payment, our insurance companies are paying the entire settlement amount.
F-87
GIGAMEDIA LIMITED
NOTES TO THE CONSOLIDATED FINANCIAL STATEMENTS —
(Continued)
YEARS ENDED DECEMBER 31, 2008, 2009 AND 2010
In June 2009, the District Court granted the plaintiffs’ motion for preliminary approval of the IPO Settlement Agreement. Subsequently, in October 2009, the judge granted final approval to the settlement. Certain objectors have filed notices of appeal to the United States Circuit Court for the Second Circuit seeking to reverse or vacate the order granting final approval to the IPO Settlement Agreement. However, no briefs have been filed yet with respect to these appeals.
In January 2010, the IPO Settlement Agreement required that the IPO Securities Litigation Settlement Fund (the “Settlement Fund”) be treated as a Qualified Settlement Fund within the meaning of Treasury Regulation 1.468B-1 and that each transferor of funds to the Settlement Fund provide a statement to the administrators of the Settlement Fund pursuant to Treasury Regulation 1.468B-3(e) by January 31, 2010. Liaison counsel for the issuers has submitted a combined statement on behalf of all such issuers. Six notices of appeal and one petition to appeal the certified class have been filed and all but two of the six have been withdrawn. In October 2010, for the two appeals that were not withdrawn, plaintiffs-appellants filed their opening briefs. The opening briefs challenged the settlement on several grounds, including certification of the classes, the fees, and the expenses awarded to the plaintiffs’ counsel. On December 30, 2010, the answering briefs were filed, and on May 17, 2011, the Second Circuit issued a ruling on the two remaining appeals, granting the motion to dismiss one of the appeals, and remanding the other appeal back to the District Court to determine procedural issues relating to standing.
We had an insurance policy with American Insurance Group with $10 million of liability coverage when the class action lawsuit was made. We believe that the insurance coverage is sufficient to cover the liability arising from the settlement and claim.
F-88
GIGAMEDIA LIMITED
NOTES TO THE CONSOLIDATED FINANCIAL STATEMENTS —
(Continued)
YEARS ENDED DECEMBER 31, 2008, 2009 AND 2010
(b) World Series of Poker Litigation
On April 1, 2010, a complaint was filed on behalf of UIM against Harrah’s License Company, LLC (“Harrah’s”) in connection with the promotional agreement for the World Series of Poker dated February 24, 2008 (the “Agreement”) (the “Original Lawsuit”). UIM stated claims against Harrah’s for: 1) breach of the Agreement; 2) breach of the implied covenant of good faith and fair dealing; 3) unjust enrichment; 4) declaratory relief; and 5) injunctive relief. The complaint seeks compensatory damages, a declaration that Harrah’s materially breached the Agreement and the Agreement is therefore terminated as of April 1, 2010, an injunction precluding Harrah’s from violating the Agreement pending the outcome of the litigation, and attorney fees and costs.
A letter of termination was also sent by UIM to Harrah’s on April 1, 2010 to terminate the Agreement for multiple material breaches by Harrah’s and to demand the refund of past payments.
An application for a temporary restraining order (“TRO”) and motion for preliminary injunction was also filed. The request for the TRO was subsequently denied by the court. On April 28, 2010, UIM had a hearing on its motion asking the court to force Harrah’s to remove a certain non-Everest Poker name and logo reference from the broadcasts into France, as UIM has exclusive promotional and advertising rights pursuant to the Agreement. The motion was denied on the grounds that UIM failed to show that the broadcasts containing the other reference’s digital overlay were certain to continue into the future. The court did not rule on the merits of the underlying claims in any way. The judge has yet to issue a formal order.
Harrah’s also filed a motion to dismiss the complaint. In addition, on April 27, 2010, Harrah’s Interactive Entertainment, Inc. (“Harrah’s Interactive”) filed a separate lawsuit (the “Second Lawsuit”) against UIM for 1) breach of the Agreement; 2) breach of the implied covenant of good faith and fair dealing; and, 3) unjust enrichment, and included GigaMedia as a defendant for tortious interference with contractual relations. In May 2009, the Agreement was assigned by Harrah’s to Harrah’s Interactive.
F-89
GIGAMEDIA LIMITED
NOTES TO THE CONSOLIDATED FINANCIAL STATEMENTS —
(Continued)
YEARS ENDED DECEMBER 31, 2008, 2009 AND 2010
On May 14, 2010, UIM lodged a First Amended Complaint, asserting a new claim for fraud in the inducement and abandoning its claim for a preliminary injunction. Separately, UIM asserted compulsory counterclaims within the Second Lawsuit on June 11, 2010 which mirrored those made in the Original Lawsuit. On June 29, 2010, the Court consolidated the Original Lawsuit and the Second Lawsuit.
On June 14, 2010, Everest Gaming Limited, a subsidiary of Everest Gaming, filed a complaint for trademark infringement against Harrah’s (the “Everest Complaint”), which was consolidated with the Original Lawsuit and Second Lawsuit on June 29, 2010 as well.
Harrah’s moved to dismiss all of UIM’s claims in the First Amended Complaint, UIM’s counterclaims, and the Everest Complaint. UIM opposed the Motion in writing and at the hearing held on the matter. The Court denied Harrah’s request in its entirety on September 15, 2010.
On January 27, 2011, Harrah’s lodged a First Amended Complaint, naming Mangas Gaming S.A.S and Mangas Everest S.A.S (“Mangas”) as new co-defendants and asserting new claims for: 1) tortious interference with contractual relations; 2) tortious interference with prospective economic advantage; 3) fraudulent transfer; and (4) unjust enrichment. Harrah’s demanded a jury trial on its tort claims, whereas the remainder of the trial is set for a bench trial based upon the Court’s July 7, 2010 ruling that the jury waiver within the Agreement was valid and enforceable.
We believe UIM will be successful in pursuing and defending the lawsuits of Harrah’s. However, there is no assurance that UIM will be successful in its claims against Harrah’s, including its claim for compensatory damages and/or attorney fees and costs.
F-90
GIGAMEDIA LIMITED
NOTES TO THE CONSOLIDATED FINANCIAL STATEMENTS —
(Continued)
YEARS ENDED DECEMBER 31, 2008, 2009 AND 2010
On May 3, 2011, GigaMedia made a Motion to the Court for partial summary judgment on Harrah’s claims against it for tortious interference of contract and tortious interference with prospective economic advantage. On March 31, 2010, GigaMedia (through its subsidiary Internet Media Licensing Limited) purchased all issued and outstanding shares of common stock of UIM. Since GigaMedia enjoys a legal privilege to interfere in the contracts and actions of its wholly owned subsidiary, and since UIM has been, since March 31, 2010 a wholly owned subsidiary of GigaMedia, any interference by GigaMedia would enjoy immunity. We believe that GigaMedia is therefore entitled to summary judgment.
(c) Dispute with the former head of GigaMedia’s online games business in the PRC and former Chief Executive Officer of T2CN (“Wang Ji”)
In early 2010, GigaMedia determined that changes in the leadership of its majority owned subsidiary T2CN were necessary to improve T2CN and GigaMedia’s online games business in the PRC. As a result of this restructuring of leadership, Wang Ji was to be moved from his role as the operating head of T2 Entertainment and T2 Technology to a high-level consulting position, or be given the board chairmanship role at T2CN. Originally, Wang Ji appeared to accept this change in position and did not object to the restructuring plans. T2CN started to implement the restructuring in early July 2010. However, at that time, Wang Ji refused to step down from his operating and executive roles at T2 Technology, J-Town Information (Shanghai) Co., Ltd. (“J-Town”) and T2 Entertainment. As a result, T2CN, as the sole shareholder of T2 Technology and J-Town, removed Wang Ji as a director of T2 Technology and J-Town on July 27, 2010. Wang Ji was also duly removed as a director of T2CN on July 29, 2010. On August 7, 2010, Wang Ji was removed as the legal representative, executive director and manager of T2 Entertainment with immediate effect by way of a shareholders’ resolution passed at a shareholders’ meeting of T2 Entertainment. On August 10, 2010, the newly appointed legal representatives of T2 Technology, J-Town and T2 Entertainment, together with their PRC legal advisers, went to the office premises to request that Wang Ji return all properties of T2 Technology, J-Town and T2 Entertainment in his possession, custody or control. At that time, the newly appointed legal representatives were forcibly removed from the office premises. Also, Wang Ji’s employment contract with T2 Technology was terminated on August 12, 2010.
F-91
GIGAMEDIA LIMITED
NOTES TO THE CONSOLIDATED FINANCIAL STATEMENTS —
(Continued)
YEARS ENDED DECEMBER 31, 2008, 2009 AND 2010
GigaMedia believes that Wang Ji currently has in his possession, among other things, the company seals, financial chops and business registration certificates of T2 Technology, J-Town and all of GigaMedia’s three VIEs T2 Entertainment, T2 Advertisement, and Jinyou (collectively “T2CN Operating Entities”). We also believe that Wang Ji has in his possession all documents, records and data and tangible property, including license agreements, trademark and domain name documentation, held in the offices of T2CN Operating Entities. The company seals, financial chops and business registration certificates of T2CN Operating Entities are necessary for the respective entities to, among other things, declare dividends and approve service fee payments to GigaMedia. These documents are necessary for GigaMedia to run its online games business in the PRC. Under PRC law, the company seals, financial chops and business registration certificates are essential for entering into contracts, conducting banking business, or taking official corporate action of any sort including registering any change to the composition of the board or management with the relevant PRC authorities.
Consequently, GigaMedia has not been able to register the resolutions removing Wang Ji from his position as a director of T2 Technology and J-Town and as the legal representative, executive director and manager of T2 Entertainment. As a result, Wang Ji has effectively usurped control over T2 Technology, J-Town and T2 Entertainment’s operations and accounts.
Each of T2 Technology, J-Town and T2 Entertainment as represented by the newly appointed legal representative have filed lawsuits against Wang Ji in the courts of the PRC from August 2010 through October 2010, seeking to recover, among other things, the tangible property of T2 Technology, J-Town and T2 Entertainment, including the company seals, financial chops and business certificates. Wang Ji’s appeals on the jurisdiction of the court in respect of the lawsuits filed by T2 Technology and J-Town were dismissed. Wang Ji has subsequently filed a motion seeking to stay the proceeding on the ground that he has filed a claim against GigaMedia and T2CN in the United States. In response to such motion, we submitted a written objection to the court in May 2011. The court is now considering Wang Ji’s motion to stay and our objection but has not made any decision yet.
F-92
GIGAMEDIA LIMITED
NOTES TO THE CONSOLIDATED FINANCIAL STATEMENTS —
(Continued)
YEARS ENDED DECEMBER 31, 2008, 2009 AND 2010
Wang Ji also filed a lawsuit against T2 Entertainment in August 2010 to challenge the validity of the shareholders’ resolution approving a transfer of the shares of T2 Entertainment held by Wang Ji. The lawsuit filed by T2 Entertainment represented by the newly appointed legal representative against Wang Ji is currently stayed pending resolution of the said lawsuit instituted by Wang Ji.
T2 Technology and T2 Entertainment represented by the newly appointed legal representative also filed a lawsuit against Wang Ji in Singapore in August 2010 for breach of fiduciary duty seeking to, among other things, recover the properties of T2 Technology and T2 Entertainment including the company seals, financial chops and business certificates, and monetary damages. T2 Technology and T2 Entertainment obtained a Mareva Injunction against Wang Ji freezing his assets in Singapore up to the amount of SGD$2 million (approximately $1.6 million). Wang Ji has filed his defense. Due to Wang Ji’s failure to comply with the timeline ordered by the court in producing evidence and supporting documentation referred to in his defense, T2 Technology and T2 Entertainment obtained a default judgment against Wang Ji in April 2011. Wang Ji has applied to set aside the default judgment, and the court procedures are proceeding accordingly.
Lawsuits against Wang Ji have also been filed by T2 Technology and T2 Entertainment in Hong Kong and the British Virgin Islands by T2CN respectively. The lawsuits assert a number of claims, including, breach of fiduciary duty and conversion, seeking to recover, among other things, the properties of T2 Technology and T2 Entertainment and monetary damages.
F-93
GIGAMEDIA LIMITED
NOTES TO THE CONSOLIDATED FINANCIAL STATEMENTS —
(Continued)
YEARS ENDED DECEMBER 31, 2008, 2009 AND 2010
In November 2010, GigaMedia filed a lawsuit in the United States District Court for the Central District of California (the “California Action”) asserting a number of claims against the other shareholder of T2 Entertainment and GigaMedia’s former head of operations in the PRC, including, among others, tortious interference with contract, tortious interference with prospective economic advantage, fraud, aiding and abetting conversion and breach of oral contract. In these matters, GigaMedia is seeking to recover, among other things, monetary damages. Subsequently, Wang Ji filed a motion to intervene in the California Action in April 2011. In May 2011, Wang Ji filed anex parteapplication to shorten the time with respect to the August 22, 2011 hearing date for his motion to intervene. We are currently preparing a response to oppose Wang Ji’sex parteapplication. Hearing on the intervenors’ motion will be held in August 2011. Wang Ji also filed a complaint against GigaMedia and T2CN in the United States District Court for the Central District of California in April 2011. Wang Ji’s complaint was subsequently stricken by the court for failure to follow court rules.
While management continues to believe that its general legal position is sound, as a result of the increasing complexity of various ongoing litigations, it is now impractical for GigaMedia to estimate with any degree of certainty the timeline for the eventual resolution of the dispute or the likelihood of a successful outcome.
NOTE 29.SEGMENT INFORMATION
Segment data
Subsequent to the sale of our Internet access and service business in 2008, we realigned our reportable business segments. All income (loss) related to our Internet access and service business has been excluded from the reconciliation of our segment totals to the GigaMedia consolidated totals.
F-94
GIGAMEDIA LIMITED
NOTES TO THE CONSOLIDATED FINANCIAL STATEMENTS —
(Continued)
YEARS ENDED DECEMBER 31, 2008, 2009 AND 2010
We have identified two reportable segments: an online gaming software and service business segment and an Asian online game and service business segment. The online gaming software and service business segment mainly derives its revenues from developing and licensing online games of chance and skill. Subsequent to the sale transaction with BetClic, we have accounted for our 40 percent percentage ownership interest in our gaming software and service business under the equity method accounting, and record gains or losses from our equity method investment in one line on our Consolidated Statement of Operations. The Asian online game and service business segment mainly derives its revenues from recognizing the usage of game playing time or in-game items by the end-users.
Our management relies on an internal management reporting process that provides revenue and segment information for making financial decisions and allocating resources. The results are based on our method of internal reporting and are not necessarily in conformity with GAAP. Management measures the performance of each segment based on several metrics, including revenues and income or loss from operations.
Financial information for each reportable segment was as follows as of and for the years ended December 31, 2008, 2009, and 2010:
| | | | | | | | | | | | | |
| | | Gaming | | | Asian online | | | | |
| | | software and | | | game and | | | | |
| (in US$ thousands) | | service | | | service | | | Total | |
2008: | | | | | | | | | | | | |
Segment profit or loss: | | | | | | | | | | | | |
| Net revenue from external customers | | $ | 144,765 | | | $ | 45,604 | | | $ | 190,369 | |
| | | | | | | | | | |
| Income from operations | | $ | 36,360 | | | $ | 7,998 | | | $ | 44,358 | |
| | | | | | | | | | |
| Share-based compensation | | $ | 1,249 | | | $ | 547 | | | $ | 1,796 | |
| | | | | | | | | | |
| Impairment loss on prepaid licensing fees and intangible assets | | $ | — | | | $ | 1,524 | | | $ | 1,524 | |
| | | | | | | | | | |
| Interest income | | $ | 680 | | | $ | 367 | | | $ | 1,047 | |
| | | | | | | | | | |
| Interest expense | | $ | 7 | | | $ | — | | | $ | 7 | |
| | | | | | | | | | |
| Gains on sales of marketable securities | | $ | — | | | $ | 4 | | | $ | 4 | |
| | | | | | | | | | |
| Foreign exchange gain (loss) | | $ | 269 | | | $ | (124 | ) | | $ | 145 | |
| | | | | | | | | | |
| Loss on equity method investments | | $ | — | | | $ | 3,010 | | | $ | 3,010 | |
| | | | | | | | | | |
| Depreciation | | $ | 2,064 | | | $ | 1,080 | | | $ | 3,144 | |
| | | | | | | | | | |
| Amortization, including intangible assets | | $ | 1,704 | | | $ | 2,549 | | | $ | 4,253 | |
| | | | | | | | | | |
| Income tax expense | | $ | 743 | | | $ | 326 | | | $ | 1,069 | |
| | | | | | | | | | |
| | | | | | | | | | | | | |
Segment assets: | | | | | | | | | | | | |
| Equity method investments | | $ | — | | | $ | 75 | | | $ | 75 | |
| | | | | | | | | | |
| Additions to property, plant and equipment | | $ | 6,095 | | | $ | 1,585 | | | $ | 7,680 | |
| | | | | | | | | | |
| Additions to intangible assets | | $ | 3,953 | | | $ | 3,383 | | | $ | 7,336 | |
| | | | | | | | | | |
| Additions to goodwill | | $ | — | | | $ | 2,249 | | | $ | 2,249 | |
| | | | | | | | | | |
| Total assets | | $ | 132,631 | | | $ | 130,327 | | | $ | 262,958 | |
| | | | | | | | | | |
The reconciliation of the segment information to GigaMedia’s consolidated information was not included in the above table, as it is provided below in detail.
F-95
GIGAMEDIA LIMITED
NOTES TO THE CONSOLIDATED FINANCIAL STATEMENTS —
(Continued)
YEARS ENDED DECEMBER 31, 2008, 2009 AND 2010
| | | | | | | | | | | | | |
| | | Gaming | | | Asian online | | | | |
| | | software and | | | game and | | | | |
| (in US$ thousands) | | service | | | service | | | Total | |
2009: | | | | | | | | | | | | |
Segment profit or loss: | | | | | | | | | | | | |
| Net revenue from external customers | | $ | 112,694 | | | $ | 46,887 | | | $ | 159,581 | |
| | | | | | | | | | |
| Income (loss) from operations | | $ | 7,472 | | | $ | (34,649 | ) | | $ | (27,177 | ) |
| | | | | | | | | | |
| Share-based compensation | | $ | 501 | | | $ | 931 | | | $ | 1,432 | |
| | | | | | | | | | |
| Impairment loss on prepaid licensing fees and intangible assets | | $ | 212 | | | $ | 22,787 | | | $ | 22,999 | |
| | | | | | | | | | |
| Impairment loss on property, plant and equipment | | $ | — | | | $ | 777 | | | $ | 777 | |
| | | | | | | | | | |
| Impairment loss on goodwill | | $ | — | | | $ | 14,103 | | | $ | 14,103 | |
| | | | | | | | | | |
| Interest income | | $ | 242 | | | $ | 129 | | | $ | 371 | |
| | | | | | | | | | |
| Interest expense | | $ | — | | | $ | — | | | $ | — | |
| | | | | | | | | | |
| Foreign exchange gain (loss) | | $ | 521 | | | $ | (114 | ) | | $ | 407 | |
| | | | | | | | | | |
| Loss on equity method investments | | $ | — | | | $ | 87 | | | $ | 87 | |
| | | | | | | | | | |
| Impairment loss on marketable securities and investments | | $ | — | | | $ | 13,719 | | | $ | 13,719 | |
| | | | | | | | | | |
| Depreciation | | $ | 2,279 | | | $ | 1,500 | | | $ | 3,779 | |
| | | | | | | | | | |
| Amortization, including intangible assets | | $ | 2,027 | | | $ | 3,120 | | | $ | 5,147 | |
| | | | | | | | | | |
| Income tax expense (benefit) | | $ | 871 | | | $ | (101 | ) | | $ | 770 | |
| | | | | | | | | | |
| | | | | | | | | | | | | |
Segment assets: | | | | | | | | | | | | |
| Equity method investments | | $ | — | | | $ | 222 | | | $ | 222 | |
| | | | | | | | | | |
| Additions to property, plant and equipment | | $ | 2,731 | | | $ | 2,929 | | | $ | 5,660 | |
| | | | | | | | | | |
| Additions to intangible assets | | $ | 5,793 | | | $ | 2,307 | | | $ | 8,100 | |
| | | | | | | | | | |
| Additions to goodwill | | $ | — | | | $ | — | | | $ | — | |
| | | | | | | | | | |
| Total assets | | $ | 145,776 | | | $ | 111,354 | | | $ | 257,130 | |
| | | | | | | | | | |
The assets of our gaming software and service business segment are presented as assets held for sale and retained ownership of gaming software and service business as of December 31, 2009 in our Consolidated Balance Sheets.
F-96
GIGAMEDIA LIMITED
NOTES TO THE CONSOLIDATED FINANCIAL STATEMENTS —
(Continued)
YEARS ENDED DECEMBER 31, 2008, 2009 AND 2010
The reconciliation of the segment information to GigaMedia’s consolidated information was not included in the above table, as it is provided below in detail.
| | | | | | | | | | | | | |
| | | Gaming | | | Asian online | | | | |
| | | software and | | | game and | | | | |
| (in US$ thousands) | | service | | | service | | | Total | |
2010: | | | | | | | | | | | | |
Segment profit or loss: | | | | | | | | | | | | |
| Net revenue from external customers | | $ | 25,820 | | | $ | 38,862 | | | $ | 64,682 | |
| | | | | | | | | | |
| Income (loss) from operations | | $ | 78 | | | $ | (31,554 | ) | | $ | (31,476 | ) |
| | | | | | | | | | |
| Share-based compensation | | $ | 80 | | | $ | 342 | | | $ | 422 | |
| | | | | | | | | | |
| Impairment loss on prepaid licensing fees and intangible assets | | $ | — | | | $ | 2,200 | | | $ | 2,200 | |
| | | | | | | | | | |
| Impairment loss on property, plant and equipment | | $ | — | | | $ | 278 | | | $ | 278 | |
| | | | | | | | | | |
| Impairment loss on goodwill | | $ | — | | | $ | 2,255 | | | $ | 2,255 | |
| | | | | | | | | | |
| Impairment loss on deconsolidation of T2CN | | $ | — | | | $ | 22,234 | | | $ | 22,234 | |
| | | | | | | | | | |
| Interest income | | $ | 83 | | | $ | 438 | | | $ | 521 | |
| | | | | | | | | | |
| Interest expense | | $ | 1 | | | $ | 59 | | | $ | 60 | |
| | | | | | | | | | |
| Foreign exchange gain (loss) | | $ | (29 | ) | | $ | 91 | | | $ | 62 | |
| | | | | | | | | | |
| Loss on equity method investments — net | | $ | 9,768 | | | $ | 11,002 | | | $ | 20,770 | |
| | | | | | | | | | |
| Impairment loss on marketable securities and investments | | $ | — | | | $ | 4,677 | | | $ | 4,677 | |
| | | | | | | | | | |
| Depreciation | | $ | — | | | $ | 1,556 | | | $ | 1,556 | |
| | | | | | | | | | |
| Amortization, including intangible assets | | $ | — | | | $ | 2,696 | | | $ | 2,696 | |
| | | | | | | | | | |
| Income tax expense | | $ | 6,445 | | | $ | 1,118 | | | $ | 7,563 | |
| | | | | | | | | | |
| | | | | | | | | | | | | |
Segment assets: | | | | | | | | | | | | |
| Equity method investments | | $ | 44,472 | | | $ | 20,923 | | | $ | 65,395 | |
| | | | | | | | | | |
| Additions to property, plant and equipment | | $ | 1,209 | | | $ | 1,534 | | | $ | 2,743 | |
| | | | | | | | | | |
| Additions to intangible assets | | $ | 1,198 | | | $ | 1,114 | | | $ | 2,312 | |
| | | | | | | | | | |
| Additions to goodwill | | $ | — | | | $ | 12,188 | | | $ | 12,188 | |
| | | | | | | | | | |
| Total assets | | $ | 168,671 | | | $ | 76,679 | | | $ | 245,350 | |
| | | | | | | | | | |
The reconciliation of the segment information to GigaMedia’s consolidated information was not included in the above table, as it is provided below in detail.
F-97
| | | | | | | | | | | | | |
| | | Gaming | | | Asian online | | | | |
| | | software and | | | game and | | | | |
| (in US$ thousands) | | service | | | service | | | Total | |
| Depreciation | | $ | — | | | $ | 1,556 | | | $ | 1,556 | |
| | | | | | | | | | |
| Amortization, including intangible assets | | $ | — | | | $ | 2,696 | | | $ | 2,696 | |
| | | | | | | | | | |
| Income tax expense | | $ | 6,445 | | | $ | 1,118 | | | $ | 7,563 | |
| | | | | | | | | | |
| | | | | | | | | | | | | |
Segment assets: | | | | | | | | | | | | |
| Equity method investments | | $ | 44,472 | | | $ | 20,923 | | | $ | 65,395 | |
| | | | | | | | | | |
| Additions to property, plant and equipment | | $ | 1,209 | | | $ | 1,534 | | | $ | 2,743 | |
| | | | | | | | | | |
| Additions to intangible assets | | $ | 1,198 | | | $ | 1,114 | | | $ | 2,312 | |
| | | | | | | | | | |
| Additions to goodwill | | $ | — | | | $ | 12,188 | | | $ | 12,188 | |
| | | | | | | | | | |
| Total assets | | $ | 168,671 | | | $ | 76,679 | | | $ | 245,350 | |
| | | | | | | | | | |
The reconciliation of the segment information to GigaMedia’s consolidated information was not included in the above table, as it is provided below in detail.
F-98
GIGAMEDIA LIMITED
NOTES TO THE CONSOLIDATED FINANCIAL STATEMENTS —
(Continued)
YEARS ENDED DECEMBER 31, 2008, 2009 AND 2010
The reconciliations of segment information to GigaMedia’s consolidated totals are as follows:
| | | | | | | | | | | | | |
| (in US$ thousands) | | 2008 | | | 2009 | | | 2010 | |
Income (loss) from operations: | | | | | | | | | | | | |
| Total segments | | $ | 44,358 | | | $ | (27,177 | ) | | $ | (31,476 | ) |
| Adjustment* | | | (6,255 | ) | | | (12,884 | ) | | | (16,220 | ) |
| | | | | | | | | | |
| Total GigaMedia consolidated | | $ | 38,103 | | | $ | (40,061 | ) | | $ | (47,696 | ) |
| | | | | | | | | | |
| | | | | | | | | | | | | |
Share-based compensation | | | | | | | | | | | | |
| Total segments | | $ | 1,796 | | | $ | 1,432 | | | $ | 422 | |
| Adjustment* | | | 909 | | | | 1,845 | | | | 2,592 | |
| | | | | | | | | | |
| Total GigaMedia consolidated | | $ | 2,705 | | | $ | 3,277 | | | $ | 3,014 | |
| | | | | | | | | | |
| | | | | | | | | | | | | |
Impairment loss on prepaid licensing fees and intangible assets: | | | | | | | | | | | | |
| Total segments | | $ | 1,524 | | | $ | 22,999 | | | $ | 2,200 | |
| Adjustment* | | | — | | | | 3 | | | | — | |
| | | | | | | | | | |
| Total GigaMedia consolidated | | $ | 1,524 | | | $ | 23,002 | | | $ | 2,200 | |
| | | | | | | | | | |
| | | | | | | | | | | | | |
Impairment loss on property, plant and equipment: | | | | | | | | | | | | |
| Total segments | | $ | — | | | $ | 777 | | | $ | 278 | |
| Adjustment* | | | — | | | | 473 | | | | — | |
| | | | | | | | | | |
| Total GigaMedia consolidated | | $ | — | | | $ | 1,250 | | | $ | 278 | |
| | | | | | | | | | |
| | | | | | | | | | | | | |
Interest income: | | | | | | | | | | | | |
| Total segments | | $ | 1,047 | | | $ | 371 | | | $ | 521 | |
| Adjustment* | | | 413 | | | | 61 | | | | 435 | |
| | | | | | | | | | |
| Total GigaMedia consolidated | | $ | 1,460 | | | $ | 432 | | | $ | 956 | |
| | | | | | | | | | |
| | | | | | | | | | | | | |
Interest expense: | | | | | | | | | | | | |
| Total segments | | $ | 7 | | | $ | — | | | $ | 60 | |
| Adjustment* | | | 969 | | | | 390 | | | | 310 | |
| | | | | | | | | | |
| Total GigaMedia consolidated | | $ | 976 | | | $ | 390 | | | $ | 370 | |
| | | | | | | | | | |
| | | | | | | | | | | | | |
Gain (loss) on sales of marketable securities: | | | | | | | | | | | | |
| Total segments | | $ | 4 | | | $ | — | | | $ | — | |
| Adjustments* | | | 369 | | | | — | | | | — | |
| | | | | | | | | | |
| Total GigaMedia consolidated | | $ | 373 | | | $ | — | | | $ | — | |
| | | | | | | | | | |
| | | | | | | | | | | | | |
Foreign exchange gain (loss): | | | | | | | | | | | | |
| Total segments | | $ | 145 | | | $ | 407 | | | $ | 62 | |
| Adjustments* | | | 95 | | | | (239 | ) | | | (668 | ) |
| | | | | | | | | | |
| Total GigaMedia consolidated | | $ | 240 | | | $ | 168 | | | $ | (606 | ) |
| | | | | | | | | | |
F-98
GIGAMEDIA LIMITED
NOTES TO THE CONSOLIDATED FINANCIAL STATEMENTS —
(Continued)
YEARS ENDED DECEMBER 31, 2008, 2009 AND 2010
| | | | | | | | | | | | | |
| (in US$ thousands) | | 2008 | | | 2009 | | | 2010 | |
Impairment loss on marketable securities and investments: | | | | | | | | | | | | |
| Total segments | | $ | — | | | $ | 13,719 | | | $ | 4,677 | |
| Adjustment* | | | — | | | | 2,024 | | | | — | |
| | | | | | | | | | |
| Total GigaMedia consolidated | | $ | — | | | $ | 15,743 | | | $ | 4,677 | |
| | | | | | | | | | |
| | | | | | | | | | | | | |
Depreciation: | | | | | | | | | | | | |
| Total segments | | $ | 3,144 | | | $ | 3,779 | | | $ | 1,556 | |
| Adjustments* | | | 177 | | | | 579 | | | | 536 | |
| | | | | | | | | | |
| Total GigaMedia consolidated | | $ | 3,321 | | | $ | 4,358 | | | $ | 2,092 | |
| | | | | | | | | | |
| | | | | | | | | | | | | |
Amortization: | | | | | | | | | | | | |
| Total segments | | $ | 4,253 | | | $ | 5,147 | | | $ | 2,696 | |
| Adjustments* | | | 34 | | | | 72 | | | | 83 | |
| | | | | | | | | | |
| Total GigaMedia consolidated | | $ | 4,287 | | | $ | 5,219 | | | $ | 2,779 | |
| | | | | | | | | | |
| | | | | | | | | | | | | |
Income tax expense: | | | | | | | | | | | | |
| Total segments | | $ | 1,069 | | | $ | 770 | | | $ | 7,563 | |
| Adjustments* | | | — | | | | (253 | ) | | | (303 | ) |
| | | | | | | | | | |
| Total GigaMedia consolidated | | $ | 1,069 | | | $ | 517 | | | $ | 7,260 | |
| | | | | | | | | | |
| | | | | | | | | | | | | |
Additions to property, plant and equipment: | | | | | | | | | | | | |
| Total segments | | $ | 7,680 | | | $ | 5,660 | | | $ | 2,743 | |
| Adjustments** | | | 1,134 | | | | 101 | | | | 1,041 | |
| | | | | | | | | | |
| Total GigaMedia consolidated | | $ | 8,814 | | | $ | 5,761 | | | $ | 3,784 | |
| | | | | | | | | | |
| | | | | | | | | | | | | |
Additions to intangible assets: | | | | | | | | | | | | |
| Total segments | | $ | 7,336 | | | $ | 8,100 | | | $ | 2,312 | |
| Adjustments** | | | 309 | | | | 707 | | | | 5 | |
| | | | | | | | | | |
| Total GigaMedia consolidated | | $ | 7,645 | | | $ | 8,807 | | | $ | 2,317 | |
| | | | | | | | | | |
| | | | | | | | | | | | | |
Total assets: | | | | | | | | | | | | |
| Total segments | | $ | 262,958 | | | $ | 257,130 | | | $ | 245,350 | |
| Adjustment** | | | 53,835 | | | | 3,051 | | | | 22,239 | |
| | | | | | | | | | |
| Total GigaMedia consolidated | | $ | 316,793 | | | $ | 260,181 | | | $ | 267,589 | |
| | | | | | | | | | |
| | | |
| * | | Adjustment items include corporate and certain back-office costs and expenses not attributable to any specific segment. |
| |
| ** | | Adjustment items include total corporate assets, the Internet access and service business segment and eliminations. |
F-99
GIGAMEDIA LIMITED
NOTES TO THE CONSOLIDATED FINANCIAL STATEMENTS —
(Continued)
YEARS ENDED DECEMBER 31, 2008, 2009 AND 2010
Major Customers
No single customer represented 10 percent or more of GigaMedia’s total net revenues in any period presented.
Geographic Information
Revenues by geographic area are attributed by country of the server location. Revenue from unaffiliated customers by geographic region is as follows:
| | | | | | | | | | | | | |
| (in US$ thousands) | | | | | | | | | |
| Geographic region / country | | 2008 | | | 2009 | | | 2010 | |
| Canada | | $ | 144,765 | | | $ | 112,694 | | | $ | 25,820 | |
| Taiwan | | | 20,932 | | | | 24,869 | | | | 19,449 | |
| PRC | | | 19,652 | | | | 18,318 | | | | 9,885 | |
| Hong Kong | | | 4,964 | | | | 3,700 | | | | 4,026 | |
| Singapore | | | — | | | | — | | | | 3,702 | |
| Malaysia | | | — | | | | — | | | | 1,603 | |
| Others | | | 56 | | | | — | | | | 197 | |
| | | | | | | | | | |
| Total | | $ | 190,369 | | | $ | 159,581 | | | $ | 64,682 | |
| | | | | | | | | | |
Net long-lived assets by geographic region are as follows:
| | | | | | | | | | | | | |
| (in US$ thousands) | | December 31, | |
| Geographic region / country | | 2008 | | | 2009 | | | 2010 | |
| Taiwan | | $ | 4,118 | | | $ | 3,642 | | | $ | 3,130 | |
| Canada | | | 2,264 | | | | — | | | | — | |
| PRC | | | 1,734 | | | | 1,920 | | | | 921 | |
| United States | | | 4,642 | | | | — | | | | — | |
| Hong Kong | | | 710 | | | | 427 | | | | 213 | |
| Singapore | | | — | | | | — | | | | 902 | |
| Malaysia | | | — | | | | — | | | | 20 | |
| Other | | | — | | | | — | | | | 115 | |
| | | | | | | | | | |
| Total | | $ | 13,468 | | | $ | 5,989 | | | $ | 5,301 | |
| | | | | | | | | | |
F-100
GIGAMEDIA LIMITED
NOTES TO THE CONSOLIDATED FINANCIAL STATEMENTS —
(Continued)
YEARS ENDED DECEMBER 31, 2008, 2009 AND 2010
Long-lived assets of our gaming software and service business are presented as assets held for sale and retained ownership of gaming software and service business as of December 31, 2009 in our Consolidated Balance Sheets.
NOTE 30.SUBSEQUENT EVENTS
On May 20, 2011, our board of directors approved an $11 million share repurchase program of GigaMedia’s common stock. Under the terms of the share repurchase program, GigaMedia may repurchase up to $11 million worth of its issued and outstanding shares beginning on June 1, 2011. The repurchases will be made from time to time on the open market at prevailing market prices pursuant to a Rule 10b5-1 plan. The repurchases will be subject to restrictions relating to volume, pricing and timing. The timing and extent of any repurchases will depend upon market conditions, the trading price of GigaMedia’s shares and other factors. We expect to implement this share repurchase program in a manner consistent with market conditions, in the interests of our shareholders, and in compliance with GigaMedia’s securities trading policy and relevant Singapore and U.S. laws and regulations. GigaMedia’s board of directors will review the share repurchase program periodically, and may authorize adjustments to its terms and size. We plan to fund the repurchases made under this program from GigaMedia’s available cash balance. In addition, we plan to cancel all repurchased shares. Through June 29, 2011, repurchases under this program amounted to approximately 1.3 million shares at a cost of approximately $1.7 million.
F-101