UNITED STATES
SECURITIES AND EXCHANGE COMMISSION
Washington, D.C. 20549
Form 10-K
(Mark One)
| x | ANNUAL REPORT PURSUANT TO SECTION 13 OR 15(d) OF THE SECURITIES EXCHANGE ACT OF 1934 |
For the fiscal year ended December 31, 2012
OR
| ¨ | TRANSITION REPORT PURSUANT TO SECTION 13 OR 15(d) OF THE SECURITIES EXCHANGE ACT OF 1934 |
For the transition period from to
Commission File Number 001-33775
Nanosphere, Inc.
(Exact name of registrant as specified in its charter)
| | |
| Delaware | | 36-4339870 |
(State or other jurisdiction of incorporation or organization) | | (I.R.S. Employer Identification No.) |
| |
| 4088 Commercial Avenue | | Northbrook, Illinois 60062 |
| (Address of principal executive offices) | | (Zip Code) |
(847) 400-9000
Registrant’s telephone number, including area code:
Securities registered pursuant to Section 12(b) of the Act:
| | |
(Title of Each Class) | | (Name of Each Exchange on Which Registered) |
| Common Stock, par value $0.01 | | NASDAQ Global Market |
Securities registered pursuant to Section 12(g) of the Act:
None
Indicate by check mark whether the registrant is a well-known seasoned issuer, as defined in Rule 405 of the Securities Act. ¨ Yes x No
Indicate by check mark whether the registrant is not required to file reports pursuant to Section 13 or Section 15(d) of the Act ¨ Yes x No
Indicate by check mark whether the registrant (1) has filed all reports required to be filed by Section 13 or 15(d) of the Securities Exchange Act of 1934 during the preceding 12 months (or for such shorter period that the registrant was required to file such reports), and (2) has been subject to such filing requirements for the past 90 days. Yes x No ¨
Indicate by check mark whether the registrant has submitted electronically and posted on its corporate Web site, if any, every Interactive Data File required to be submitted and posted pursuant to Rule 405 of Regulation S-T (§232.405 of this chapter) during the preceding 12 months (or for such shorter period that the registrant was required to submit and post such files). Yes x No ¨
Indicate by check mark if disclosure of delinquent filers pursuant to Item 405 of Regulation S-K is not contained herein, and will not be contained, to the best of registrant’s knowledge, in definitive proxy or information statements incorporated by reference in Part III of this Form 10-K or any amendment to this Form 10-K. ¨
Indicate by check mark whether the registrant is a large accelerated filer, an accelerated filer, a non-accelerated filer or a smaller reporting company. See definitions of “large accelerated filer”, “accelerated filer” and “smaller reporting company” in Rule 12b-2 of the Exchange Act. (Check one):
| | | | | | |
| Large accelerated filer | | ¨ | | Accelerated filer | | ¨ |
| | | |
| Non-accelerated filer | | x | | Smaller reporting company | | ¨ |
Indicate by check mark whether the registrant is a shell company (as defined in Rule 12b-2 of the Exchange Act). Yes ¨ No x
As of June 30, 2012, the last business day of the registrant’s most recently completed second fiscal quarter, the aggregate market value of the common stock held by non-affiliates of the registrant was approximately $62.9 million based on the closing sale price for the registrant’s common stock on the NASDAQ Global Market on that date of $2.20 per share. This number is provided only for the purpose of this report on Form 10-K and does not represent an admission by either the registrant or any such person as to the status of such person.
As of February 25, 2013, there were 56,090,437 outstanding shares of common stock. The common stock is listed on the NASDAQ Global Market (trading symbol “NSPH”).
DOCUMENTS INCORPORATED BY REFERENCE
Portions of the registrant’s definitive proxy statement for fiscal year ended December 31, 2012 to be issued in conjunction with the registrant’s annual meeting of shareholders expected to be held on May 29, 2013 are incorporated by reference in Part III of this Form 10-K. The definitive proxy statement will be filed by the registrant with the SEC not later than 120 days from the end of the registrant’s fiscal year ended December 31, 2012. Except as specifically incorporated herein by reference, the above mentioned Proxy Statement is not deemed filed as part of this report.
NANOSPHERE, INC.
INDEX
Forward-Looking Statements
This Annual Report on Form 10-K contains forward-looking statements about us and our industry that involve substantial risks and uncertainties. All statements, other than statements of historical facts, included in this Annual Report on Form 10-K regarding our strategy, future operations, future financial position, future net sales, projected expenses, products’ placements, performance and acceptance, prospects and plans and management’s objectives, as well as the growth of the overall market for our products in general and certain products in particular and the relative performance of other market participants are forward-looking statements. These statements involve known and unknown risks, uncertainties and other factors that may cause our actual results, levels of activity, performance or achievement to be materially different from those expressed or implied by the forward-looking statements.
In some cases, you can identify forward-looking statements by terms such as “anticipate,” “believe,” “estimate,” “expect,” “intend,” “may,” “might,” “plan,” “project,” “will,” “would,” “should,” “could,” “can,” “predict,” “potential,” “continue,” “objective,” or the negative of these terms, and similar expressions intended to identify forward-looking statements. However, not all forward-looking statements contain these identifying words. These forward-looking statements reflect our current views about future events and are based on assumptions and subject to risks and uncertainties. Given these uncertainties, you should not place undue reliance on these forward-looking statements. Our actual results may differ materially from those anticipated in these forward-looking statements as a result of various factors, including but not limited to:
| | • | | inaccurate estimates of the potential market size for our products (including the hospital lab market in general and the blood stream infection (BSI) market in particular) or failure of the market for these products to grow as anticipated; |
| | • | | the past performance of other companies which we believe to have been in a market position analogous to where we believe we are now may not be predictive of our future results in the manner we believe them to be; |
| | • | | our analysis of who our competitors have been, who they are now and who they will be in the future (particularly in the infectious disease product markets) and our predictions of relevant future performance may be inaccurate; |
| | • | | comparisons of actual financial results for another company to what we predict will be our future financial results may be inapposite; |
| | • | | predictions of customer metrics needed to achieve profitability and their relationship to our cash flow position, needs and expenses may prove to be inaccurate; |
| | • | | entrance of other competitors or other factors causing us to lose competitive advantage in the sample-to-result MDx market; |
| | • | | a lack of commercial acceptance of the Verigene System, its array of tests, and the development of additional tests, which could negatively affect our financial results; |
| | • | | failure of third-party payors to reimburse our customers for the use of our clinical diagnostic products or reduction of reimbursement levels, which could harm our ability to sell our products; |
| | • | | failure of our products to perform as expected or to obtain certain approvals or the questioning of the reliability of the technology on which our products are based, which could cause lost revenue, delayed or reduced market acceptance of our products, increased costs and damage to our reputation; |
| | • | | our inability to manage our anticipated growth, constraints or inefficiencies caused by unanticipated acceleration and deceleration of customer demand; and |
| | • | | those set forth under “Risk Factors” in this Annual Report on Form 10-K. |
These forward-looking statements represent our estimates and assumptions only as of the date of this Annual Report on Form 10-K. Unless required by U.S. federal securities laws, we do not intend to update any of these forward-looking statements to reflect circumstances or events that occur after the statement is made or to conform these statements to actual results. The following discussion should be read in conjunction with the consolidated financial statements and notes thereto appearing elsewhere in this Annual Report on Form 10-K. Our actual results may differ materially from those anticipated in these forward-looking statements as a result of various factors, including those set forth under “Item 1A — Risk Factors” and elsewhere in this Annual Report on
Form 10-K.
PART I.
Item 1. Business.
References herein to “we,” “us,” “our” or “the Company” refer to Nanosphere, Inc. unless the context specifically requires otherwise.
Overview
We develop, manufacture and market an advanced molecular diagnostics platform, the Verigene System, that enables simple, low cost and highly sensitive genomic and protein testing on a single platform. Our proprietary nanoparticle technology provides the ability to run multiple tests simultaneously on the same sample. The Verigene System includes a bench-top molecular diagnostics workstation that is a universal platform for genomic and protein testing. While many systems currently available on the market provide a diagnostic result for one test or a few tests within a specific market niche, the Verigene System provides for multiple tests to be performed on a single platform, including both genomic and protein assays, from a single sample.
The Verigene System is differentiated by its ease of use, rapid turnaround times and ability to detect many targets on a single test, referred to as “multiplexing.” It provides lower cost for laboratories already performing molecular diagnostic testing and enables smaller laboratories and hospitals without advanced diagnostic capabilities to perform genetic testing. Our ability to detect proteins, which can be as much as 100 times more sensitive than current technologies for certain targets, may enable earlier detection of and intervention in diseases associated with known biomarkers as well as the introduction of tests for new biomarkers that exist in concentrations too low to be detected by current technologies. We are focused on the clinical diagnostics market.
2
Our test menu is designed to fulfill the following unmet hospital laboratory needs:
| | 1) | the conversion of microbiology to molecular methods to more rapidly pinpoint infectious diseases; |
| | 2) | point-of-care pharmacogenetics to ensure that appropriate therapies are prescribed; and |
| | 3) | earlier detection of life threatening disease through ultra-sensitive protein assays. |
The Verigene System is comprised of a microfluidics processor, a touchscreen reader and disposable test cartridges. Certain assays, such as the Warfarin metabolism and hyper-coagulation tests, were cleared by the U.S. Food and Drug Administration (“FDA”) for use with the original Verigene System processor (the “Original Processor”). Subsequently, we developed and launched a second generation Verigene System processor (the “ProcessorSP”) that handles the same processing steps as the Original Processor and incorporates sample preparation. Some of our current customers continue to use the Original Processor for hyper-coagulation testing and Warfarin metabolism testing. Our development plans are focused on expanding the menu of tests that will run on the ProcessorSP,and we plan to develop and seek regulatory approval of all future assays on the ProcessorSP.
During 2012, we received FDA 510(k) clearance for three tests including new Verigene tests:
| | • | | Blood Culture – Gram Positive (BC-GP) |
Our Applications
The following table summarizes the FDA and CE In-Vitro Diagnostic Mark (“CE IVD Mark”) regulatory status of our near-term genomic and protein assays on the Verigene System:
| | | | |
Assay | | FDA Status(1) | | CE IVD Mark Status(2) |
Infectious Disease Assays | | | | |
| | |
Respiratory Virus with Sub-Typing | | 510(k) cleared | | CE IVD Marked |
| | |
Blood Infection Panels | | | | |
| | |
• Blood Culture – Staphylococcus (BC-S) • Blood Culture – Gram Positive (BC-GP) • Blood Culture – Gram Negative (BC-GN) • Blood Culture – Fungal (BC-F) | | 510(k) cleared 510(k) cleared(4) In development In development | | CE IVD Marked CE IVD Marked CE IVD Pending In development |
| | |
C. difficile | | 510(k) cleared | | CE IVD Pending |
| | |
Enteric Panel | | In development | | In development |
| | |
Human and Pharmacogenetic Assays | | | | |
| | |
Warfarin Metabolism | | 510(k) cleared(3) | | CE IVD Marked |
| | |
Hyper-Coagulation | | 510(k) cleared(3) | | CE IVD Marked |
| | |
2C19 Genetic Variance | | 510(k) cleared | | CE IVD Marked |
| | |
Ultra-Sensitive Protein Assays | | | | |
| | |
Cardiac Troponin I | | In development | | In development |
| | |
Prostate-Specific Antigen (PSA) | | Research use only | | |
| (1) | For further description of our FDA regulatory requirements, please refer to the section “Regulation by the United States Food and Drug Administration” beginning on page 10 of this Annual Report on Form 10-K for the year ended December 31, 2012. |
| (2) | For further description of our CE IVD Mark regulatory requirements, please refer to the section “Foreign Government Regulation” beginning on page 13 of this Annual Report on Form 10-K for the year ended December 31, 2012. |
| (3) | Currently cleared only for use with the Original Processor. |
| (4) | Received FDA 501(k) clearance in June 2012 and subsequent 501(k) clearance expanding the test’s intended use for use with all adult blood culture bottles received September 2012. |
Infectious Disease Assays
The conversion of microbiology to molecular methods is driven by the need to identify infectious diseases more quickly, allowing a more rapid commencement of clinical intervention. Microbiology labs need tests that can rapidly detect a wide range of potential infectious agents in an automated system. The Verigene System provides the multiplexing, rapid turnaround and ease-of-use needed by these labs. Our infectious disease menu and the ProcessorSPprovide microbiology labs with a compelling solution for conversion to molecular testing.
We have received 510(k) clearance from the FDA for our respiratory panel that detects the presence of influenza A and B as well as respiratory syncytial virus (“RSV”) A and B. Influenza is commonly known as the seasonal flu and RSV is a respiratory virus that infects the lungs and breathing passages. RSV is the most common cause of bronchitis and pneumonia in children under the age of one year and has become a significant concern for older adults. Our respiratory panel provides physicians with a highly accurate and fast determination of which virus is present. This test result guides the most appropriate treatment therapy.
In the fourth quarter of 2009, we received 510(k) clearance from the FDA for our respiratory panel on the ProcessorSP. We believe that our respiratory assay on the ProcessorSPoffers a simple-to-use molecular test for diagnosing respiratory infections and the flu, while providing improved sensitivity over currently available rapid tests. We have received 501(k) clearance for a package insert change for this assay confirming that the novel H1N1 virus is detected as a positive Influenza A when using our respiratory assay and the ProcessorSP.
3
In the first quarter of 2011, we received 510(k) clearance from the FDA and obtained CE IVD Mark for our respiratory assay that includes subtyping for seasonal H1 virus, seasonal H3 virus, and the 2009 novel H1N1 virus, commonly known as swine flu, as well as the targets on our previously cleared respiratory assay. We believe this is the first sample-to-result molecular respiratory test to include all of these viruses, thus lowering the cost of molecular respiratory testing for hospitals and demonstrating the multiplexing capability of the Verigene System. The demand for this test will be highly dependent upon the seasonality and prevalence of respiratory viruses.
We developed a test to detect C. difficile,a bacterium that can cause symptoms ranging from diarrhea to life-threatening inflammation of the colon. We received 510(k) clearance from the FDA in the fourth quarter of 2012 for ourC. difficiletest.
We are developing blood stream infection panels for the earlier detection of specific bacteria and resistance markers within patients with blood stream infections. These panels include gram positive, gram negative and fungal pathogens and resistance markers. These assays are designed to enable physicians to detect bacterial strains infecting patients and thus prescribe the most appropriate antibiotic regimen within 24 hours rather than after several days. Treatment is sometimes begun before current traditional assays are complete and we believe that this early detection capability will allow patients to avoid unnecessary treatments that may expose them to serious side effects. The first blood stream infection panel developed was the gram positive that represents approximately 65% of blood stream infections. In the fourth quarter of 2011 we obtained CE IVD Mark for the BC-GP and received FDA 510(k) clearance of BC-S, a subset of the BC-GP panel. In June 2012 we received ade novo510(k) clearance to market the full BC-GP panel. In September 2012 we received a 510(k) clearance which expanded the intended use of BC-GP for use with all adult blood culture bottles. The BC-GN and BC-F panels are in development.
Our development efforts also include an enteric bacteria test. Our enteric bacteria assay identifies theEnterobacteriaceaespecies that most often result from food poisoning. The enteric assay tests for a wide spectrum of bacteria and viruses that are treated with various antibiotics and other drug therapies. This assay will require regulatory clearance from the FDA and submission to corresponding foreign regulatory bodies.
We also plan to develop an expanded respiratory infection panel that includes additional targets that are not included in our existing respiratory virus assay.
Human and Pharmacogenetic Assays
Hospitals need faster, less expensive and easier-to-use human and pharmacogenetic tests that can be run on-site for their patients. Our Verigene System and human and pharmacogenetic test menu addresses these hospital needs. Pharmacogenomics is an emerging subset of human genetic testing that correlates gene variation with a drug’s efficacy or toxicity. These tests play a key role in the advancement of personalized medicine where drug therapies and dosing are guided by each patient’s genetic makeup. There is a growing demand on laboratories to implement molecular diagnostic testing, but the cost and complexity of existing technologies and the need for specialized personnel and facilities have limited the number of laboratories with these capabilities. The ease-of-use and reduced complexity of the Verigene System enables any hospital to perform these testing needs.
We have received 510(k) clearance from the FDA for a warfarin metabolism assay performed on our Original Processor. This is a pharmacogenetic test to determine the existence of certain genetic mutations that affect the metabolism of warfarin-based drugs, including Coumadin®, the most-prescribed oral anticoagulant. This assay has been CE IVD Marked during the first quarter of 2011, and we may submit an FDA application for this assay to allow its use on the Processor SP, although we have no immediate plans to do so.
In the fourth quarter of 2012 we received 510(k) clearance from the FDA for a 2C19 genetic variance test. This assay was CE IVD Marked during the first quarter of 2011.This test detects variances in the cytochrome P-450 2C19 gene. These genetic variances are associated with deficient metabolism of clopidogrel, more commonly known by the trade name Plavix.
We also have received 510(k) clearance from the FDA for a hyper-coagulation assay on the Original Processor that determines an individual’s risk, based upon genetic information, for the development of blood clots that can lead to pulmonary embolism and deep vein thrombosis. This assay has been CE IVD Marked during the fourth quarter of 2011, and we may submit an FDA application for this assay to allow its use on the Processor SP, although we have no immediate plans to do so.
Ultra-Sensitive Protein Assays
Our ability to detect proteins at sensitivity levels that can be 100 times greater than current technologies may enable earlier detection of and intervention in diseases as well as enable the introduction of tests for new biomarkers that exist in concentrations too low to be detected by current technologies. We have developed, are currently developing or plan to develop diagnostic tests for markers that reveal the existence of a variety of medical conditions including cardiovascular, respiratory, cancer, autoimmune, neurodegenerative and other diseases.
The first ultra-sensitive protein test we plan to commercialize is for cardiac troponin I (“cTnI”), which is the gold standard biomarker for diagnosis of myocardial infarction, or heart attack, and identification of patients with acute coronary syndromes at risk for cardiovascular events. We may submit an assay for 510(k) clearance for use as a diagnostic tool for acute coronary syndromes, although we have no immediate plans to do so. Currently, we are focused on investigating the potential to sell primary functional components of this assay to commercial labs as a marker for cardiac risk. Early studies suggest that our ultra-sensitive cTnI test may also be a useful monitoring tool for chronic heart failure (“CHF”) patients. Larger studies and regulatory hurdles will need to be cleared before we market the assay for CHF monitoring purposes.
In addition to the cardiac troponin I assay, we have developed an ultra-sensitive prostate-specific antigen (“PSA”) test for early diagnosis of recurrent prostate cancer. We also may develop ultra-sensitive protein assays in the areas of immunology, allergy and cancer.
The Verigene System
The Verigene System is comprised of a microfluidics processor, a touchscreen reader and disposable test cartridges. The microfluidics processor interacts with and manipulates various functional components of the test cartridge, accomplishing a number of necessary steps including target binding to the nucleic acid or protein array, nanoparticle probe hybridization, intermediate washes and signal amplification. The reader houses the optical detection module that illuminates the test slide and automated spot recognition software that analyzes the resulting signal intensities and provides the test results. The reader also serves as the control station for the Verigene System and features a simple and intuitive touchscreen interface that allows users to track samples and test cartridges, initiate and monitor test processing, analyze results and generate reports. The reader is web-enabled to allow remote access to results and reports.
4
To perform a test, the operator adds a prepared sample to a designated port in the test cartridge, enters sample identification and test cartridge information into the reader using the touchscreen keyboard or via the barcode wand, and inserts the test cartridge into the processor. The processor assimilates information received from the reader and matches it to the inserted test cartridge and initiates the specified test protocol. Once the assay process is complete the test array is introduced into the reader for image analysis and result reporting.
Our Technology
We believe our technology will drive greater usage of ultra-sensitive and multiplexed protein and genomic diagnostics in routine clinical laboratories, much as enzyme-linked immunosorbent assay, or ELISA, accelerated the use of protein testing in the 1970s and 1980s and PCR catalyzed the emergence of nucleic acid diagnostics in the 1990s.
Our Gold Nanoparticle Molecular Probes
At the core of our technology are gold nanoparticles which offer a unique set of physical properties that can be exploited in the detection of biological molecules. In 1998, Dr. Chad Mirkin, a director of the Company, and Dr. Robert Letsinger at Northwestern University (“Northwestern”) developed a novel process to prepare stable probes by covalently attaching oligonucleotides to gold nanoparticles. This method, protected by patents, is exclusively assigned to or owned by us. We have refined the synthesis methods to enable highly reproducible production of nanoparticle probes with diameters in the 13-50 nanometer range required for highly sensitive biomedical analysis. Subsequently, we have also developed methods for attaching antibodies to gold nanoparticles, thereby producing highly stable probes for ultra-sensitive detection of proteins.
The properties of nanoparticle probes can be tailored by controlling the size of the particles, the density of recognition-oligomers or antibodies on the nanoparticles, the use of diluent oligonucleotides, the use of spacer oligonucleotides and the salt concentration. Combined, the optimization of these properties enables us to deliver superior analytical performance characteristics versus other methods, for example:
| • | High Signal-to-Noise Ratio. Our nanoparticle probes deliver significantly stronger signals than the fluorescent probes, or fluorophores, used in most diagnostic platforms today. Nanoparticles are typically 10-100 nm in diameter and therefore significantly larger than conventional fluorophores. This size difference enables nanoparticles to produce up to 10,000 times more signal via light scattering than a fluorophore. A single nanoparticle can be detected with simple optical instrumentation with very high sensitivity, thus eliminating the need to employ our amplification techniques. |
| • | Orders of Magnitude Greater Sensitivity and Lower Detection Limits. The sensitivity and limits of detection of our technology are further enhanced by a silver-staining step, which effectively amplifies the signal from each nanoparticle bound to a target molecule. In this process, silver is coated onto the gold nanoparticle surface, producing larger particles with enhanced optical properties. Whereas the leading technologies today can detect molecules at the picomolar range (10 -12 ), our technology is capable of up to a million times higher sensitivity at the attomolar (10 -18 ) range, enabling the unprecedented analysis of rarely expressed genes or low abundance proteins for early disease detection and diagnosis. |
| • | Unparalleled Specificity. A key property of the oligonucleotide-linked gold nanoparticle is an extremely sharp melting curve. The melting curve is the temperature range during which the capture oligonucleotide dissociates with the complementary target oligonucleotide in the sample. Our nanoparticles exhibit dissociation transitions of less than one degree in Celsius temperature, whereas most alternative products are based on polymerase chain reaction, or PCR, which exhibits melt transitions typically in the 15-30 degree range. The narrow band of temperature in which binding and dissociation occurs, creates a significantly higher signal to noise ratio resulting in greater specificity. These qualities eliminate errors caused by mismatched nucleotide pairs, thereby allowing genomic targets differing by a single nucleotide (base pair) to be distinguished with unprecedented selectivity. Sharp melting curves are a proprietary feature of our nanoparticles and our patent portfolio includes issued patents protecting the methods and product performance related to melt transition curves. |
| • | High Count Multiplexing. Our core technology enables high count multiplexing, or simultaneous multiple target identification in a single sample, using a simple low-density microarray. A sample and probe mixture is introduced simultaneously into a single self-contained reaction chamber pre-printed with multiple reaction spots, each containing capture strand oligonucleotides or proteins that are complementary to a specific target molecule of interest. By utilizing the sharp melt transition of the nanoparticle probes, multiple targets can be discretely identified in a single sample. This methodology eliminates the need for complex and costly means of physically isolating individual target molecules. |
5
| • | Detection of Genomic and Protein Molecules Simultaneously. We are able to synthesize our gold nanoparticle probes for the simultaneous multiplexed detection of both protein and genomic targets in the same assay. |
| • | Superior Reaction Kinetics. The sharp melt transition curves in our gold nanoparticles increase binding affinity thereby leading to improved assay kinetics and efficiency. |
| • | Long-Term Stability. The high density of oligonucleotides per nanoparticle, serves both as a protective and recognition layer on the nanoparticle surface and ensures the long-term stability of our nanoparticles. We have patented approaches using localized salt and buffer concentrations that deliver long-shelf life for our technology and reagent set. |
Assay Format
Our silver-enhanced gold nanoparticles and related optical detection technology are used for diagnostic assays which detect genomic and proteomic targets captured onto microarrays as shown in the “Schematic of Microarray Based Detection Using Nanoparticle Probes” below. The microarray format enables high count multiplexing of assay targets, facilitating the development of a broad menu of tests, including for complex diseases where multiple targets must be evaluated to provide a diagnosis, in a simple, scalable format.
Two probe types can be used in a single assay. Oligonucleotide probes are used for genomic assays and antibodies for protein assays. One probe, complementary to a specific site on the target molecule, is attached to a surface such as a glass slide and the other probe, complementary to a different site on the target molecule, is attached to the surface of gold nanoparticles. In the presence of the target molecule of interest, the probes and target form a three dimensional, cross-linked aggregate. After silver coating the gold nanoparticles, light scatter is measured on the surface of the microarray slide. The silver-enhanced gold nanoparticle probes located on the slide surface scatter light in proportion to the concentration of the target in the sample, which is detected through optical imaging and translated into clinical results via our proprietary software algorithms.
6
Schematic of Microarray Based Detection Using Nanoparticle Probes

The above graphic depicts a genomic or proteomic assay utilizing a molecule attached to a gold nanoparticle. In the case of a genomic assay, the molecule represents an oligonucleotide. In the case of a proteomic assay, the molecule represents an antibody.
Intellectual Property
As of December 31, 2012, our patent portfolio is comprised, on a worldwide basis, of 186 issued patents and 14 pending patent applications which we own directly or for which we are the exclusive licensee. Some of these patents and patent applications derive from a common parent patent application or are foreign counterpart patent applications and relate to similar or identical technological claims. The issued patents cover approximately 11 different technological claims and the pending patent applications cover approximately three additional technological claims.
Many of our issued and pending patents were exclusively licensed from the International Institute for Nanotechnology at Northwestern University (“Northwestern”) in May 2000, and they generally cover our core technology, including nanotechnology-based biodiagnostics and biobarcode technology. Our issued patents expire between 2017 and 2025. We believe our patent portfolio provides protection against other companies offering products employing the same technologies and methods as we have patented. While we believe our patent portfolio establishes a proprietary position, there are many competitive products utilizing other technologies that do not infringe on our patents.
In addition, as of December 31, 2012, we have non-exclusive licenses for at least 42 U.S. patents that cover 11 different technological claims from various third parties. Most of these license agreements require us to pay the licensor royalty fees that typically expire upon the patent expiration dates, which range from 2012 to 2027. These license agreements are non-exclusive and do not create a proprietary position. The expiration of these non-exclusive licenses will result in the termination of certain royalty payments by us to the licensors.
7
Research and Development
Our research and development efforts are focused on:
| | • | Expanding and Enhancing the Capabilities of Our Instrument Platform. Design elements and components of our current instrument platform will serve as the foundation for future generation development. The Processor SP incorporates sample preparation into our system. By adding this step, labs can now process a raw sample material, in most cases whole blood, in a single step. This feature is critical for analyzing infectious diseases and will further simplify the processing of clinical samples from swab, cerebrospinal fluid and serum. |
We have plans to develop a fully automated instrument with increased throughput and sample preparation for both infectious disease and human genetic tests for larger hospital based laboratories. By basing future generations of our instrument platform on existing design elements, each new generation of development will process assays developed for previous generations.
| | • | Developing Additional Genomic and Protein Assays. We are in various phases of developing and commercializing new assays for detecting protein biomarkers, infectious diseases and human genetic markers. Currently, we are researching additional human genetic, infectious disease and ultra-sensitive protein assays. |
| | • | Validating and Commercializing New Biomarkers. We have a dedicated team of protein scientists and assay developers who conduct assay development to support feasibility testing and new protein biomarker validation. This team is collaborating with clinical researchers in academic and private settings to apply our ultra-sensitive protein detection technology to the researchers’ efforts to create diagnostic methods with greater clinical sensitivity and specificity. We are also applying our ultra-sensitivity methods to the development of established protein biomarkers that may lead to earlier detection of medical conditions including cancer, neurodegenerative disorders including Alzheimer’s disease, sepsis and mad cow disease, as well as for blood screening and veterinary applications. |
| | • | Enhancing Performance of Established Product Systems and Developing New Applications. Our license agreement with Northwestern provided us with an exclusive license to certain patents and patent applications related to the application of nanotechnology to biodiagnostics and to biobarcode technology. This license covers all discoveries from the International Institute for Nanotechnology at Northwestern in the field of biodiagnostics through January 1, 2013. Thereafter, the license provides that we continue to have the first right to an exclusive license for all discoveries the International Institute for Nanotechnology at Northwestern develops in the field of biodiagnostics, however, the economic terms are to be negotiated in good faith by both parties. Our research team utilizes the research and patents developed at Northwestern to develop diagnostic applications including additional genomic and protein testing assays for use in the Verigene System. |
Employees
As of December 31, 2012, we had 151 full-time employees. Of these employees, 47 were in research and development, 44 were in manufacturing (in support of both product sales and the research and development function), 43 were in sales and marketing and 17 were in general and administrative functions. We have never had a work stoppage and none of our employees are covered by collective bargaining agreements or represented by a labor union. We believe our employee relations are good.
Government Grants and Contracts
Since our inception, we have received government grants that had allowed for the evaluation and development of new technologies and also allowed for development of market specific diagnostic products.
We have benefited from Small Business Innovation Research grants to prove feasibility of gold nanoparticle based detection technology as well as evaluate potential new technologies and medical diagnostic applications.
We have received government contracts for the development of automated biological agent detection systems using nanoparticle probes that are capable of rapidly detecting biological warfare agents and biological toxins. These products have potential applications for both government contractors and civilian first responders. Since inception, we have recorded revenue of approximately $9 million under these grants and contracts.
8
Manufacturing
We assemble and package all our finished products at our corporate headquarters in Northbrook, Illinois. Our manufacturing facility occupies approximately 13,000 square feet of the 41,846 square feet, which we lease at our Northbrook facility. There, we manufacture our proprietary nanoparticle probes, assay reagents, test cartridges and instrumentation. We outsource much of the disposable component molding. Reagent manufacturing and cartridge filling is performed under the current Good Manufacturing Practices — Quality System Regulation as required by the FDA for the manufacture of in vitro diagnostic products. These regulations carefully control the manufacture, testing and release of diagnostics products as well as raw material receipt and control.
We have controlled methods for the consistent manufacturing of our proprietary nanoparticles and production oligonucleotides at very high purity (greater than 95%). We also manufacture at our Northbrook facility a proprietary linker to ensure stable bonding of the oligonucleotide to the gold nanoparticle.
All quality control tests are validated to ensure product quality measurements are accurate. Manufacturing of the Verigene System, including test cartridges, is tightly controlled with the use of manufacturing batch records. These records control which product is produced and ensure that each batch of product is manufactured consistently and according to the intended design.
We plan to continue to manufacture components that we determine are highly proprietary or difficult to produce consistently while outsourcing commodity components. As we continue to execute on our sales and market plans, we have ramped-up our manufacturing operations to meet demand. We are likely to establish additional outsourcing partnerships as we manufacture additional products. While we believe our current facilities and expansion rights are adequate to meet our manufacturing needs for at least the next three years, we may need to lease additional space. Our recently revised facilities lease includes a right of first offer on additional available space in our building. While we do not need to expand our facilities to meet anticipated demand for 2013, we will likely require expanded facilities to meet anticipated demand beyond 2013.
Sales and Marketing
As a part of our business strategy, we have a direct sales and marketing organization to support the sales of the Verigene System and its initial menu of tests in the United States. This organization comprises geographically dispersed sales representatives and clinical support specialists as well as a centralized staff of market and product managers. We believe that the primary market for our diagnostic applications will be hospital-based laboratories and academic research institutions in the United States. A customer may purchase the Verigene System instruments, lease them from a third party or enter into a reagent rental agreement. Our reagent rental agreements include customer commitments to purchase a certain minimum volume of cartridges over the term of the agreement. As part of these agreements, a portion of the charge for each cartridge is a rental fee for use of the equipment.
Our sales and marketing organization provides customer service related to order fulfillment, technical service, training, product support and distribution logistics.
We believe that the primary international customers for our diagnostic applications will be hospital-based laboratories and academic research institutions. We have obtained CE IVD Mark certification for sale of the Verigene System in European Union countries and will do so for each assay we plan to market in Europe. Outside the United States, we initiate sales through marketing partners and distributors. As of the end of 2012 we have entered into 15 international distribution partnerships. A distribution strategy is being developed for each relevant international market. We support our distribution partners with specialists who train our partners’ sales forces and provide technical support.
Competition
We primarily face competition in the nucleic acid based testing market from companies that provide PCR-based technologies. We believe that, over time, the Verigene System will compete with these companies primarily on the following factors: (1) cost effectiveness; (2) ease of use; (3) multiplexing capability; (4) range of tests offered; (5) immediacy of results; and (6) reliability.
The Company is now focused primarily on molecular based infectious disease markets and therefore has identified Beckton, Dickinson and Company, BioFire Diagnostics, Cepheid, GenMark Diagnostics and Luminex as potential competitors.
We could also face competition in the protein detection market from companies that provide mass spectrometry systems. Although mass spectrometry systems offer high sensitivity, they are extremely costly, require significant time and effort by sophisticated staff and cannot detect many complex, disease-causing proteins. Due to these significant limitations we consider mass spectrometry systems to be a lower competitive threat within commercial protein diagnostics laboratories.
9
The protein detection market also includes companies that provide ELISA-based testing systems. We believe that our technology, which is at least 100 times more sensitive than ELISA-based technologies provides a significant advantage because it can detect proteins at lower concentrations equating to earlier detection of disease. This sensitivity will create new value for existing biomarkers and allow the discovery of novel biomarkers for the treatment and monitoring of disease where none exist today.
Regulation by the United States Food and Drug Administration
In the United States, the FDA regulates the sale and distribution, in interstate commerce, of medical devices, includingin vitro diagnostic test kits. Pursuant to the federal Food, Drug, and Cosmetic Act, the FDA regulates the preclinical and clinical design and development, testing, manufacture, labeling, distribution and promotion of medical devices. We will not be able to commence marketing or commercial sales in the United States of new medical devices under development that fall within the FDA’s jurisdiction until we receive 510(k) clearance or approval from the FDA.
In the United States, medical devices are classified into one of three classes (i.e., Class I, II or III) on the basis of the controls deemed necessary by the FDA to reasonably ensure their safety and effectiveness. Class I devices are subject to general controls (e.g., establishment registration, medical device listing, labeling regulations, possible premarket notification and adherence to current Good Manufacturing Practice/Quality System Regulations(QSR)). However, most Class I devices are exempt from premarket notification (510(k) clearance). Class II devices are subject to general and special controls (e.g., special labeling requirements, mandatory performance standards, premarket notification (510(k) clearance) often with guidance from an FDA special control guideline, adherence to current Good Manufacturing Practice/QSR, possible post-market surveillance). Generally, Class III devices are subject to general and special controls and must receive premarket approval, or PMA, by the FDA to ensure their safety and effectiveness (e.g., new devices for which insufficient information exists to assure safety and effectiveness through general and special controls; often such devices are life-sustaining, life-supporting and implantable). Many devices that have been approved by way of premarket approval are required to perform post-market surveillance.
510(k) Clearance
The FDA will grant 510(k) clearance if the submitted information establishes that the proposed device is “substantially equivalent” to a legally marketed Class I or Class II medical device or a pre-amendment Class III medical device for which the FDA has not sought PMA. The FDA has recently been requiring more rigorous demonstration of substantial equivalence than in the past. In some cases, such as may be the case with HFE or Cardiac Troponin I 510(k) submissions, the FDA may require additional clinical data than it would have required in the past. The FDA may determine that a proposed device is not substantially equivalent (“NSE”) to a legally marketed device or that additional information is needed before a substantial equivalence determination can be made. In the former case and when there exists no current legally marketed device to which substantial equivalence can be claimed, theDe Novo Classification Process(Evaluation of Automatic Class III Designation), regulatory process may be utilized. Under thisde Novoprocess, a device manufacturer can avoid having to seek PMA approval following an NSE determination,provided the device is considered by FDA to be a moderate to low risk device whose risks could be mitigated through the use of Special Controls. This enables the device to be “automatically” down-classified from Class III to Class II and marketing authorization sought essentially through the less burdensome 510(k) process. This process may be particularly applicable to many of our future products, in that they may utilize new or existing molecular markers and significantly different technology as compared to current marketed products or for which there is no existing like product on the market. Nonetheless, a “not substantially equivalent” determination, or a request for additional information, could prevent or delay the market introduction of new products that fall into this category. For any devices that are cleared through the 510(k) process, modifications or enhancements that could significantly affect safety or effectiveness, or constitute a major change in the intended use and/or performance of the device, require new 510(k) submissions and clearances.
Premarket Approval
A PMA application must be filed if a proposed device is a new device not substantially equivalent to a legally marketed Class I or Class II device, or if it is a pre-amendment Class III device for which the FDA has sought PMA. A PMA application must be supported by valid scientific evidence to demonstrate the safety and effectiveness of the device, typically including the results of clinical investigations, bench tests, and laboratory and animal studies. The PMA application must also contain a complete description of the device and its components and a detailed description of the method, facilities and controls used to manufacture the device. In addition, the submission must include the proposed labeling, advertising literature and any training materials. The PMA process can be expensive, uncertain and lengthy, and a number of devices for which FDA approval has been sought by other companies have never been approved for marketing.
10
Upon receipt of a PMA application, the FDA makes a threshold determination as to whether the application is sufficiently complete to permit a substantive review. If the FDA determines that the PMA application is complete, the FDA will accept the application for filing. Once the submission is accepted, the FDA begins an in-depth review of the PMA. The FDA’s review of a PMA application generally takes one to three years from the date the application is accepted, but may take significantly longer. The review time is often extended by the FDA asking for more information or clarification of information already provided in the submission. During the review period, an advisory committee, typically a panel of clinicians and subject matter experts, will likely be convened to review and evaluate the application and provide recommendations to the FDA as to whether the device should be approved. The FDA is not bound by the recommendation of the advisory panel, however often abides by it. Toward the end of the PMA review process, the FDA generally will conduct an inspection of the manufacturer’s facilities to ensure that the facilities are in compliance with applicable current Good Manufacturing Practices/QSR requirements.
If FDA evaluations of both the PMA application and the manufacturing facilities are favorable, the FDA may issue either an approval letter or an approvable letter, the latter of which contains a number of conditions that must be met in order to secure final approval of the PMA. When and if those conditions have been fulfilled to the satisfaction of the FDA, the Agency will issue an Approval Order, authorizing commercial marketing of the device for certain indications. If the FDA’s evaluation of the PMA application or manufacturing facilities is not favorable, the FDA will deny approval of the PMA application and issue a Not Approvable letter. The FDA may determine that additional clinical investigations are necessary, in which case the PMA may be delayed for one or more years while additional clinical investigations are conducted and submitted in an amendment to the PMA.
Modifications to a device that is the subject of an approved PMA, including its labeling or manufacturing process, most often require approval by the FDA of PMA supplements. Supplements to an approved PMA often require the submission of the same type of information required for an original PMA, except that the supplement is generally limited to that information needed to support the proposed change from the product covered by the original PMA. The FDA also has the authority to withdraw or temporarily suspend PMA approvals under specific circumstances.
Clinical Investigations
Before we can submit a medical device for 510(k) clearance, we may have to perform a relatively short (i.e., months) method comparison study at external clinical sites to ensure that the test performs appropriately when conducted by end users. This is a study in a clinical environment and is considered a clinical trial. However, patient-specific clinical outcome information is most often not required. Alternatively, when we submit a PMA, we generally must conduct a longer (i.e., years) clinical trial of the device which supports the clinical utility of the device, demonstrating how the device will perform when used with patients in the test’s intended use population, establish the safety and effectiveness of the device.
Although clinical investigations of most devices are subject to the investigational device exemption, or IDE requirements, clinical investigations ofin vitro diagnostic tests, including our products and products under development, are exempt from approval of an IDE application prior to initiation of the clinical study, provided the testing is non-invasive, does not require an invasive sampling procedure that presents a significant risk, does not intentionally introduce energy into the subject, and is not used as a diagnostic procedure without confirmation by another medically established test or procedure. In addition, our tests must be labeled “for research use only” or “for investigational use only,” and distribution controls must be established to assure that our tests distributed for research, method comparisons or clinical trials are used only for those purposes.
Obtaining FDA Clearance for Our Products
We received 510(k) clearance from the FDA for commercial sale of the initial tests for use on the Original Processor in the second half of 2007. The first test is a warfarin metabolism assay, which is a pharmacogenomic test to determine the existence of certain genetic information believed to affect the metabolism of warfarin based drugs, including Coumadin, the most-prescribed oral anticoagulant in North America and Europe. The second test is a hyper-coagulation assay, one of the highest volume human genetic tests currently performed, to determine an individual’s risk, based upon genetic information, for the development of blood clots, which can lead to stroke, pulmonary embolism and deep vein thrombosis.
The third test is our respiratory panel which detects the presence of influenza A and B as well as respiratory syncitial virus (“RSV”) A and B. Influenza is commonly known as the seasonal flu and RSV is a respiratory virus that infects the lungs and breathing passages. RSV is the most common cause of bronchitis and pneumonia in children under the age of one year and has become a significant concern for older adults. Our respiratory panel provides physicians with a highly accurate, fast determination of which virus is present which helps guide the most appropriate treatment therapy. Most of the respiratory tests currently on the market take days to generate a result, because they depend on culturing, or do not provide a reliable result, because they are rapid tests which lack specificity. The fourth test is our cystic fibrosis test that enables molecular laboratories to perform prenatal screening and diagnostic confirmations through identification of the number of copies of each of the 23 most common gene mutations recognized by the American College of Obstetricians and Gynecologists as markers for cystic fibrosis.
11
FDA special control guidances documents are available for most of our tests to guide the generation of the validation data required to support 510(k) clearance. Some of our future tests may be Class III devices and may also qualify for approval under theDe Novo Classification Process. We also plan to conduct method comparison studies and clinical trials of our products currently under development, which we intend to distribute in the United States. Our future developments may not be exempt from IDE application approval requirements and may require us to obtain approval from the FDA through the PMA process rather than 510(k) clearance. In addition, any failure to maintain compliance with the IDE exemption requirements could result in, among other things, the loss of the IDE exemption or the imposition of other restrictions on the distribution of our products.
Regulation After FDA Approval or Clearance
Any devices we manufacture or distribute pursuant to 510(k) clearance or approval by the FDA are subject to pervasive and continuing regulation by the FDA and certain state agencies. We are required to adhere to applicable regulations setting forth detailed current Good Manufacturing Practices/QSR requirements, which include testing, control, design and documentation requirements. Non-compliance with these standards can result in, among other things, fines, injunctions, civil penalties, recalls or seizures of products, total or partial suspension of production, failure of the government to grant 510(k) clearance or PMA approval for devices, withdrawal of marketing approvals and criminal prosecutions. We have designed and implemented our manufacturing facilities under the current Good Manufacturing Practices/QSR requirements. Our manufacturing facility has been inspected by the FDA and will continue to be periodically inspected by the FDA.
Because we are a manufacturer of medical devices, we must also comply with medical device reporting (MDR) requirements by reporting to the FDA any incident in which our product may have caused or contributed to a death or serious injury. We must also report any incident in which our product malfunctioned if that malfunction would likely cause or contribute to a death or serious injury if it were to recur. Labeling and promotional activities are subject to scrutiny by the FDA and, in certain circumstances, by the Federal Trade Commission. Current FDA enforcement policy prohibits the marketing of approved medical devices for unapproved uses.
We are also subject to numerous federal, state and local laws relating to such matters as safe working conditions, manufacturing practices, environmental protection, fire hazard control and disposal of hazardous or potentially hazardous substances. We have numerous policies and procedures in place to ensure compliance with these laws and to minimize the risk of occupational exposure to hazardous materials. In addition, we do not expect the operations of our products to produce significant quantities of hazardous or toxic waste that would require extraordinary disposal practices. Although the costs to comply with these applicable laws and regulations have not been material, we cannot predict the impact on our business of new or amended laws or regulations, or any changes in the way existing and future laws and regulations are interpreted or enforced. Moreover, as we develop toxin and pathogen detection products for the food and agriculture markets, we may be subject to the regulations of various food safety organizations, including the United States Department of Agriculture.
Export of Our Products
Export of products subject to the 510(k) notification requirements, but not yet cleared to market, are permitted with FDA authorization provided certain requirements are met. Unapproved products subject to the PMA requirements must be approved by the FDA for export. To obtain FDA export approval, we must meet certain requirements, including, with some exceptions, documentation demonstrating that the product is approved for import into the country to which it is to be imported and, in some instances, safety data for the devices.
Clinical Laboratory Improvement Amendments of 1988
The use of our products is also affected by the Clinical Laboratory Improvement Amendments of 1988, or CLIA, and related federal and state regulations, which provide for regulation of laboratory testing. These regulations mandate that clinical laboratories must be certified by the federal government, by a federally-approved accreditation agency or by a state that has been deemed exempt from the regulation’s requirements. Moreover, these laboratories must meet quality assurance, quality control and personnel standards, and they must undergo proficiency testing and inspections. The CLIA standards applicable to clinical laboratories are based on the complexity of the method of testing performed by the laboratory, which range from “waived” to “moderate complexity” to “high complexity.” Generally, the more complex the method of testing is, the higher the cost to perform the testing. We expect that most of our products will be categorized as either “moderate complexity” or “high complexity.” Both our BC-GP and the RV+ tests have been categorized as “moderate complexity” by the FDA due to the ease in which to operate our Verigene system.
12
Foreign Government Regulation
We are beginning to market our products in certain foreign markets. Obtaining a CE IVD Mark is a mandatory requirement under the In-Vitro Diagnostic Directive 98/79/EC that addresses the essential requirements that anin-vitro diagnostic device must meet before being marketed within the European Union. We have obtained CE IVD Mark approval for sale of the Verigene System in European Union countries and will do so for any assay we plan to launch in Europe. Additional regulatory requirements exist in most foreign countries including, but not limited to, product standards, packaging requirements, labeling requirements and import restrictions on devices. Each country has its own tariff regulations, duties and tax requirements.
Corporate Information
We were incorporated in Delaware in 1999 under the name Nanosphere, Inc. Our principal executive offices are located at 4088 Commercial Avenue, Northbrook, Illinois 60062, and our main telephone number is (847) 400-9000. Our website is located on the world wide web at http://www.nanosphere.us.
Other Information
Copies of the Company’s Annual Report on Form 10-K, Quarterly Reports on Form 10-Q, Current Reports on Form 8-K, and amendments to those reports filed or furnished pursuant to Section 13(a) or 15(d) of the Securities Exchange Act of 1934 are available free of charge through the investor relations section of the Company’s website (www.nanosphere.us) as soon as reasonably practicable after the Company electronically files the material with, or furnishes it to, the Securities and Exchange Commission.
13
Item 1A. Risk Factors.
Our results from operations may be affected by the risk factors set forth below. All investors should consider the following risk factors before deciding to purchase securities of the Company. If any of the following events actually occur, our business, operating results, prospects or financial condition could be materially and adversely affected. This could cause the trading price of our common stock to decline and you may lose all or part of your investment. The risks described below are not the only ones that we face. Additional risks not presently known to us or that we currently deem immaterial may also significantly impair our business operations and could result in a complete loss of your investment.
Risks Related to Our Business
We have a history of losses and we may never achieve or maintain profitability.
We have a limited operating history and have incurred significant losses in each fiscal year since our inception, including net losses of $32.9 million, $35.4 million and $40.6 million in the years ended December 31, 2012, 2011 and 2010, respectively. As of December 31, 2012, we had an accumulated deficit of approximately $348.2 million. Our losses resulted principally from costs incurred in our research and development programs and from our general and administrative expenses. In recent years, we have incurred significant costs in connection with the development of the Verigene System and its test menu. We expect our research and development expense levels to remain high for the foreseeable future as we seek to enhance our existing product and develop new products. These losses, among other things, have had and will continue to have an adverse effect on our working capital, total assets and stockholders’ equity. Because of the numerous risks and uncertainties associated with our product development and commercialization efforts, we are unable to predict when we will become profitable, and we may never become profitable. If we fail to achieve profitability in the future, the market price of our common stock could decline.
Our financial results depend on commercial acceptance of the Verigene System, its array of tests, and the development of additional tests.
Our future depends on the success of the Verigene System, which depends primarily on its acceptance by hospitals, research institutions, and independent diagnostic laboratories as a reliable, accurate and cost-effective replacement for traditional molecular diagnostic measurement methods. Many hospitals and laboratories already use expensive molecular diagnostic testing instruments in their laboratories and may be reluctant to change their current procedures for performing such analyses.
The Verigene System currently does not process a sufficiently broad menu of tests for some hospitals and laboratories to consider adopting it. Although we continue to develop additional tests to respond to hospitals’ and laboratories’ needs, we cannot guarantee that we will be able to develop enough additional tests quickly enough or in a manner that is cost-effective or at all. The development of new or enhanced products is a complex and uncertain process requiring the accurate anticipation of technological and market trends, as well as precise technological execution. We are currently not able to estimate when or if we will be able to develop, commercialize or sell additional tests or enhance existing products. If we are unable to increase sales of the Verigene System and its tests or to successfully develop and commercialize other products or tests, our revenues and our ability to achieve profitability would be impaired.
The regulatory approval process is expensive, time consuming and uncertain and the failure to obtain such approvals will prevent us from commercializing our future products.
Our products are subject to approval or clearance by the FDA or foreign governmental entities prior to their marketing for commercial use. The 510(k) clearance and premarket approval processes as well as the foreign approvals required to initiate sales outside the United States can be expensive, time consuming and uncertain. It may take as long as eighteen months or longer from submission to obtain 510(k) clearance, and from one to three years from submission to obtain premarket approval; however, it may take longer, and 510(k) clearance or premarket approval may never be obtained. Delays in receipt of, or failure to obtain, clearances or approvals for future products, including tests that are currently in development, would result in delayed, or no, realization of revenues from such products and in substantial additional costs which could decrease our profitability. Relative to larger organizations, we have limited experience in filing FDA applications for 510(k) clearance and premarket approval. There are no assurances that we will obtain any required clearance or approval. Any such failure, or any material delay in obtaining the clearance or approval, could harm our business, financial condition and results of operations.
14
We and our customers are subject to various governmental regulations, and we may incur significant expenses to comply with, and experience delays in our product commercialization as a result of, these regulations.
The products we develop, manufacture and market are subject to regulation by the FDA and numerous other federal, state and foreign governmental authorities. We generally are prohibited from marketing our products in the United States unless we obtain either 510(k) clearance or premarket approval from the FDA.
In addition, we are required to continue to comply with applicable FDA and other regulatory requirements once we have obtained 510(k) clearance or PMA approval for a product. These requirements include the Quality System Regulation, labeling requirements, the FDA’s general prohibition against promoting products for unapproved or “off-label” uses and adverse event reporting regulations. Failure to comply with applicable FDA product regulatory requirements could result in warning letters, fines, injunctions, civil penalties, repairs, replacements, refunds, recalls or seizures of products, total or partial suspension of production, the FDA’s refusal to grant future pre-market clearances or approvals, withdrawals or suspensions of current product applications and criminal prosecution. Any of these actions, in combination or alone, could prevent us from selling our products and would likely harm our business.
Our manufacturing facilities are subject to periodic regulatory inspections by the FDA and other federal and state regulatory agencies. The use of our diagnostic products by our customers is also affected by the Clinical Laboratory Improvement Amendments of 1988, or CLIA, and related federal and state regulations that provide for regulation of laboratory testing. CLIA is intended to ensure the quality and reliability of clinical laboratories in the United States by mandating specific standards in the areas of personnel qualifications, administration, participation in proficiency testing, patient test management, quality and inspections. Current or future CLIA requirements or the promulgation of additional regulations affecting laboratory testing may prevent some laboratories from using some or all of our diagnostic products.
The FDA and foreign governmental regulators have made, and may continue to make, changes in approval requirements and processes. We cannot predict what these changes will be, how or when they will occur or what effect they will have on the regulation of our products. Any new regulations, including regulations specifically related to nanotechnology, may impose additional costs or lengthen review times of our products. Delays in receipt of or failure to receive regulatory approvals or clearances for our new products would have a material adverse effect on our business, financial condition and results of operations.
If third-party payors do not reimburse our customers for the use of our clinical diagnostic products or if they reduce reimbursement levels, our ability to sell our products will be harmed.
We intend to sell our products primarily to hospital-based laboratories and academic research institutions, substantially all of which receive reimbursement for the health care services they provide to their patients from third-party payors, such as Medicare, Medicaid and other domestic and international government programs, private insurance plans and managed care programs. Most of these third-party payors may deny reimbursement if they determine that a medical product was not used in accordance with cost-effective treatment methods, as determined by the third-party payor, or was used for an unapproved indication. Third-party payors also may refuse to reimburse for procedures and devices deemed to be experimental.
In the United States, the American Medical Association assigns specific Current Procedural Terminology, or CPT, codes, which are necessary for reimbursement of diagnostic tests. Once the CPT code is established, the Centers for Medicare and Medicaid Services establish reimbursement payment levels and coverage rules under Medicaid and Medicare, and private payors establish rates and coverage rules independently. Although the tests performed by our assays in development have previously assigned CPT Codes, we cannot guarantee that our assays are covered by such CPT codes and are therefore approved for reimbursement by Medicare and Medicaid as well as most third-party payors. Additionally, certain of our future products may not be approved for reimbursement. Third-party payors may choose to reimburse our customers on a per test basis, rather than on the basis of the number of results given by the test. This may result in reference laboratories, public health institutions and hospitals electing to use separate tests to screen for each disease so that they can receive reimbursement for each test they conduct. In that event, these entities likely would purchase separate tests for each disease, rather than products that multiplex.
Third-party payors are increasingly attempting to contain health care costs by limiting both coverage and the level of reimbursement for medical products and services. Increasingly, Medicare, Medicaid and other third-party payors are challenging the prices charged for medical services, including clinical diagnostic tests. Levels of reimbursement may decrease in the future, and future legislation, regulation or reimbursement policies of third-party payors may adversely affect the demand for and price levels of our products. If our customers are not reimbursed for our products, they may reduce or discontinue purchases of our products, which would cause our revenues to decline.
15
We may fail to receive positive clinical results from the diagnostic tests currently in development that require clinical trials, and even if we receive positive clinical results, we may still fail to receive the necessary clearances or approvals to market our products.
We are investing in the research and development of new products to expand the menu of testing options for the Verigene System. In order to commercialize our products, we are required to undertake time consuming and costly development activities, sometimes including clinical trials for which the outcome is uncertain. Products that appear promising during early development and preclinical studies may, nonetheless, fail to demonstrate the results needed to support regulatory approval. Even if we receive positive clinical results, we may still fail to obtain the necessary FDA 510(k) clearance and approvals.
Our operating results may be variable and unpredictable.
The sales cycles for our products may be lengthy, which will make it difficult for us to accurately forecast revenues in a given period, and may cause revenues and operating results to vary significantly from period to period. In addition to its length, the sales cycle associated with our products is subject to a number of significant risks, including the budgetary constraints of our customers, their inventory management practices and possibly internal acceptance reviews, all of which are beyond our control. Sales of our products will also involve the purchasing decisions of large, medium and small hospitals and laboratories which can require many levels of pre-approvals, further lengthening sales time. As a result, we may expend considerable resources on unsuccessful sales efforts or we may not be able to complete transactions on the scheduled anticipated.
If we do not achieve our projected development goals in the quantities or time frames we estimate, the commercialization of our products may be delayed and our business prospects may suffer. The assumptions underlying our product placement and development goals also may prove to be materially inaccurate.
From time to time, we estimate the timing of the accomplishment of various scientific, clinical, regulatory and other product development goals. These goals may include the commencement or completion of scientific studies and clinical trials, the timing and number of product placements and the submission of regulatory filings. We also may disclose projected expenditures or other forecasts for future periods in information that we furnish to the SEC from time to time. These and other projections are based on management’s current expectations and may not contain sufficient margin of error or cushion for any specific uncertainties, or for the uncertainties inherent in all forecasting. The actual timing of our product placement and development goals and actual expenditures or other financial results can vary dramatically compared to our estimates, in some cases for reasons beyond our control. If we do not meet projections as announced from time to time, the development, placement and commercialization of our products may be delayed and our business prospects may suffer. The assumptions management has used to produce these projections may significantly change or prove to be inaccurate. Accordingly, you should not unduly rely on any of these forward-looking statements.
If we do not achieve significant product revenue, we may not be able to meet our cash requirements without obtaining additional capital from external sources, and if we are unable to do so, we may have to curtail or cease operations.
We expect capital outlays and operating expenditures to increase over the next few years as we expand our infrastructure, commercialization, manufacturing, and research and development activities. We anticipate that our current cash and cash equivalents, which include the net proceeds of our initial and secondary public offerings, will be sufficient to meet our estimated needs for at least twelve months. However, we operate in a market that makes our prospects difficult to evaluate, and we will need additional financing to execute on our current or future business strategies. The amount and the timing of the additional capital we will need to raise depends on many factors, including:
| | • | the level of research and development investment required to maintain and improve our technology; |
| | • | the amount and growth rate, if any, of our revenues; |
| | • | changes in product development plans needed to address any difficulties in manufacturing or commercializing the Verigene System and enhancements to our system; |
| | • | the costs of filing, prosecuting, defending and enforcing patent claims and other intellectual property rights; |
| | • | competing technological and market developments; |
| | • | our need or decision to acquire or license complementary technologies or acquire complementary businesses; |
| | • | the expansion of our sales force; and |
| | • | changes in regulatory policies, practices or laws that affect our operations, including clearance to market our products. |
We cannot be certain that additional capital will be available when and as needed or that our actual cash requirements will not be greater than anticipated. If we require additional capital at a time when investment in diagnostics companies or in the marketplace in general is limited due to the then prevailing market or other conditions, we may not be able to raise such funds at the time that we desire or any time thereafter. In addition, if we raise additional funds through the issuance of common stock or convertible securities, the percentage ownership of our stockholders could be significantly diluted, and these newly issued securities may have rights, preferences or privileges senior to those of existing stockholders. If we obtain additional debt financing, a substantial portion of our operating cash flow may be dedicated to the payment of principal and interest on such indebtedness, and the terms of the debt securities issued could impose significant restrictions on our operations. If we raise additional funds through collaborations and licensing arrangements, we might be required to relinquish significant rights to our technologies or products, or grant licenses on terms that are not favorable to us.
Our ability to use net operating losses to offset future taxable income may be subject to certain limitations.
We currently have significant net operating losses (NOLs) that may be used to offset future taxable income. In general, under Section 382 of the Internal Revenue Code of 1986, as amended (the “Code”), a corporation that undergoes an “ownership change” is subject to limitations on its ability to utilize its pre-change NOLs to offset future taxable income. Our recently completed underwritten public offering of common stock or future changes in our stock ownership, some of which are outside of our control, could result in an ownership change under Section 382 of the Code, which would significantly limit our ability to utilize NOLs to offset future taxable income.
16
The adverse capital and credit market conditions could affect our liquidity.
Adverse capital and credit market conditions could affect our ability to meet liquidity needs, as well as our access to capital and cost of capital. The capital and credit markets have been experiencing extreme volatility and disruption for more than 12 months. Our results of operations, financial condition, cash flows and capital position could be materially adversely affected by continued disruptions in the capital and credit markets.
If our products do not perform as expected or the reliability of the technology on which our products are based is questioned, we could experience lost revenue, delayed or reduced market acceptance of our products, increased costs and damage to our reputation.
Our success depends on the market’s confidence that we can provide reliable, high-quality diagnostics systems. We believe that customers in our target markets are likely to be particularly sensitive to product defects and errors.
Our reputation and the public image of our products or technologies may be impaired if our products fail to perform as expected or our products are perceived as difficult to use. Our products are complex and may develop or contain undetected defects or errors. Any defects or errors could lead to the filing of product liability claims, which could be costly and time-consuming to defend and result in substantial damages. If we experience a sustained material defect or error, this could result in loss or delay of revenues, delayed market acceptance, damaged reputation, diversion of development resources, legal claims, increased insurance costs or increased service and warranty costs, any of which could materially harm our business. We cannot assure you that our product liability insurance would protect our assets from the financial impact of defending a product liability claim. A product liability claim could have a serious adverse effect on our business, financial condition and results of operations.
We rely on third-party license agreements for patents and other technology related to our products, and the termination of these agreements could delay or prevent us from being able to commercialize our products.
As of December 31, 2012, our patent portfolio is comprised, on a worldwide basis, of 186 issued patents and 14 pending patent applications which we own directly or for which we are the exclusive licensee. Some of these patents and patent applications derive from a common parent patent application or are foreign counterpart patent applications and relate to similar or identical technological claims. The issued patents cover approximately 11 different technological claims and the pending patent applications cover approximately three additional technological claims.
Many of our issued and pending patents were exclusively licensed from Northwestern in May 2000 and they generally cover our core technology, including nanotechnology based biodiagnostics and biobarcode technology. Our issued patents expire between 2017 and 2025. Our patent portfolio provides protection against other companies offering products employing the same technologies and methods as we have patented. While we believe our patent portfolio establishes a proprietary position, there are many competitive products utilizing other technologies that do not infringe on our patents.
In addition, we have non-exclusive licenses for 42 patents that cover 11 different technological claims from various third parties. Most of these license agreements require us to pay the licensor royalty fees that typically expire upon the patent expiration dates which range from 2012 to 2027. These license agreements are nonexclusive and do not create a proprietary position. The expiration of these non-exclusive licenses will result in the termination of certain royalty payments by us to the licensors.
If we are unable to obtain, maintain and enforce intellectual property protection covering our products, others may be able to make, use, or sell our products, which could adversely affect our ability to compete in the market.
Our success is dependent in part on obtaining, maintaining and enforcing intellectual property rights, including patents. If we are unable to obtain, maintain and enforce intellectual property legal protection covering our products, others may be able to make, use or sell products that are substantially identical to ours without incurring the sizeable discovery, development and licensing costs that we have incurred, which would adversely affect our ability to compete in the market.
17
We seek to obtain and maintain patents and other intellectual property rights to restrict the ability of others to market products that compete with our products. As of December 31, 2012, our patent portfolio is comprised, on a worldwide basis, of 186 issued patents and 14 pending patent applications which, in either case, we own directly or for which we are the exclusive licensee. However, patents may not be issued from any pending or future patent applications owned by or licensed to us, and moreover, issued patents owned or licensed to us now or in the future may be found by a court to be invalid or otherwise unenforceable. Also, even if our patents are determined by a court to be valid and enforceable, they may not be sufficiently broad to prevent others from marketing products similar to ours or designing around our patents, despite our patent rights, nor provide us with freedom to operate unimpeded by the patent rights of others.
Furthermore, we cannot be certain that we were the first to make the invention claimed in our United States issued patents or pending patent applications, or that we were the first to file for protection of the inventions claimed in our foreign issued patents or pending patent applications. We may become subject to interference proceedings conducted in the patent and trademark offices of various countries to determine our entitlement to patents, and these proceedings may conclude that other patents or patent applications have priority over our patents or patent applications. It is also possible that a competitor may successfully challenge our patents through various proceedings and those challenges may result in the elimination or narrowing of our patents, and therefore reduce our patent protection. Accordingly, rights under any of our issued patents, patent applications or future patents may not provide us with commercially meaningful protection for our products or afford us a commercial advantage against our competitors or their competitive products or processes.
We have a number of foreign patents and applications. However, the laws of some foreign jurisdictions do not protect intellectual property rights to the same extent as laws in the United States, and many companies have encountered significant difficulties in protecting and defending such rights in foreign jurisdictions. If we encounter such difficulties or we are otherwise precluded from effectively protecting our intellectual property rights in foreign jurisdictions, our business prospects could be substantially harmed.
We may initiate litigation to enforce our patent rights, which may prompt our adversaries in such litigation to challenge the validity, scope or enforceability of our patents. Patent litigation is complex and often difficult and expensive, and would consume the time of our management and other significant resources. In addition, the outcome of patent litigation is uncertain. If a court decides that our patents are not valid, not enforceable or of a limited scope, we may not have the right to stop others from using the subject matter covered by those patents.
We also rely on trade secret protection to protect our interests in proprietary know-how and for processes for which patents are difficult to obtain or enforce. We may not be able to protect our trade secrets adequately. In addition, we rely on non-disclosure and confidentiality agreements with our employees, consultants and other parties to protect, in part, our trade secrets and other proprietary technology. These agreements may be breached and we may not have adequate remedies for any breach. Moreover, others may independently develop equivalent proprietary information, and third parties may otherwise gain access to our trade secrets and proprietary knowledge. Any disclosure of confidential data into the public domain or to third parties could allow our competitors to learn our trade secrets and use the information in competition against us.
Our products could infringe patent rights of others, which may require costly litigation and, if we are not successful, could cause us to pay substantial damages or limit our ability to commercialize our products.
Our commercial success depends on our ability to operate without infringing the patents and other proprietary rights of third parties. We are aware of third party patents that may relate to our products and technology. There may also be other patents that relate to our products and technology of which we are not aware. We may unintentionally infringe upon valid patent rights of third parties. Although we are currently not involved in any material litigation involving patents, a third party patent holder could assert a claim of patent infringement against us in the future. Alternatively, we may initiate litigation against the third party patent holder to request that a court declare that we are not infringing the third party’s patent and/or that the third party’s patent is invalid or unenforceable. If a claim of infringement is asserted against us and is successful, and therefore we are found to infringe, we could be required to pay damages for infringement, including treble damages if it is determined that we knew or became aware of such a patent and we failed to exercise due care in determining whether or not we infringed the patent. If we have supplied infringing products to third parties or have licensed third parties to manufacture, use or market infringing products, we may be obligated to indemnify these third parties for damages they may be required to pay to the patent holder and for any losses they may sustain. We can also be prevented from selling or commercializing any of our products that use the infringing technology in the future, unless we obtain a license from such third party. A license may not be available from such third party on commercially reasonable terms, or may not be available at all. Any modification to include a non-infringing technology may not be possible or if possible may be difficult or time-consuming to develop, and require revalidation, which could delay our ability to commercialize our products.
Any infringement action asserted against us, even if we are ultimately successful in defending against such action, would likely delay the regulatory approval process of our products, harm our competitive position, be expensive and require the time and attention of our key management and technical personnel.
18
We have limited experience in sales and marketing and may be unable to successfully commercialize our Verigene System, or it may be difficult to build brand loyalty.
We have limited marketing, sales and distribution experience and capabilities. Our ability to achieve profitability depends on attracting customers for the Verigene System and building brand loyalty. To successfully perform sales, marketing, distribution and customer support functions ourselves, we will face a number of risks, including:
| | • | our ability to attract and retain the skilled support team, marketing staff and sales force necessary to commercialize and gain market acceptance for our technology and our products; |
| | • | the ability of our sales and marketing team to identify and penetrate the potential customer base including hospitals, research institutions, and independent diagnostic laboratories; |
| | • | the time and cost of establishing a support team, marketing staff and sales force; and |
| | • | the difficulty of establishing brand recognition and loyalty for our products. |
In addition, we may seek to enlist one or more third parties to assist with sales, distribution and customer support globally or in certain regions of the world. If we do seek to enter into such arrangements, we may not be successful in attracting desirable sales and distribution partners, or we may not be able to enter into such arrangements on favorable terms. If our sales and marketing efforts, or those of any third-party sales and distribution partners, are not successful, our technologies and products may not gain market acceptance, which would materially impact our business operations.
We may be unsuccessful in our long-term goal of expanding our product offerings outside the United States.
To the extent we begin to offer our products broadly outside the United States, we expect that we will be dependent on third-party distribution relationships. Distributors may not commit the necessary resources to market and sell our products to the level of our expectations. If distributors do not perform adequately, or we are unable to locate distributors in particular geographic areas, our ability to realize long-term international revenue growth would be materially adversely affected.
Additionally, our products may require regulatory clearances and approvals from jurisdictions outside the United States. These products may not be sold in these jurisdictions until the required clearances and approvals are obtained. We cannot assure you that we will be able to obtain these clearances or approvals on a timely basis, or at all.
Manufacturing risks and inefficiencies may adversely affect our ability to produce products.
We must manufacture or engage third parties to manufacture components of our products in sufficient quantities and on a timely basis, while maintaining product quality and acceptable manufacturing costs and complying with regulatory requirements. In determining the required quantities of our products and the manufacturing schedule, we must make significant judgments and estimates based on historical experience, inventory levels, current market trends and other related factors. Because of the inherent nature of estimates, there could be significant differences between our estimates and the actual amounts of products we require. Additionally, some of the components of the Verigene System are custom-made by only a few outside vendors, and we do not have long-term supply contracts for the materials or components supplied by any of our vendors. If we are unable to obtain from one or more of these vendors the needed materials or components that meet our specifications on commercially reasonable terms, or at all, we may not be able to meet the demand for our products. We have not arranged for alternate suppliers, and it may be difficult to find alternate suppliers in a timely manner and on terms acceptable to us.
We manufacture in one facility. If there were to be a significant disruption in our ability to use this facility, it would take significant time to setup and validate an alternative manufacturing facility. Disruptions due to lack of power, flooding, fire and environmental controls could adversely impact our ability to manufacture. In addition, we have been steadily increasing manufacturing capacity to meet demand for our products. A disruption of our manufacturing operations resulting from scale-up related challenges such as obtaining sufficient raw materials, hiring of qualified factory personnel, installation and efficient operation of new equipment, and management of our quality controls could cause us to cease, delay, or limit our manufacturing operations and consequently adversely impact our business, our results of operations and our financial condition.
19
We may experience unforeseen technical complications in the processes we use to develop, manufacture, customize or receive orders for our products. These complications could materially delay or limit the use of products we attempt to commercialize, substantially increase the anticipated cost of our products or prevent us from implementing our processes at appropriate quality and scale levels, thereby causing our business to suffer. In addition, our manufacturing operations use highly technical processes involving unique, proprietary techniques that our manufacturing personnel must continuously monitor and update, especially as we develop more products. In order to be profitable, we must manufacture greater quantities of products than we have to date and we must do this more efficiently than we have in the past. We may not be able to do so.
We will need to develop manufacturing capacity by ourselves or with third parties.
We will need to either continue to build internal manufacturing capacity or contract with one or more manufacturing partners, or both. We currently use a combination of outsourced and internal manufacturing activities. We may encounter difficulties in manufacturing our products and, due to the complexity of our technology and our manufacturing process, we cannot be sure we fully understand all of the factors that affect our manufacturing processes or product performance. We may not be able to build manufacturing capacity internally or find one or more suitable manufacturing partners, or both, to meet the volume and quality requirements necessary to be successful in the market. If our products do not consistently meet our customers’ performance expectations, we may be unable to generate sufficient revenues to become profitable. Significant additional resources, implementation of additional manufacturing equipment and changes in our manufacturing processes and organization may be required for the scale-up of each new product prior to commercialization or to meet increasing customer demand once commercialization begins, and this work may not be successfully or efficiently completed. Any delay in establishing or inability to expand our manufacturing capacity could delay our ability to develop or sell our products, which would result in lost revenue and seriously harm our business, financial condition and results of operations.
Our business and future operating results may be adversely affected by events outside of our control.
We develop and manufacture the Verigene System instruments and assays in our facility located in Northbrook, Illinois. This facility and the manufacturing equipment we use would be costly to replace and could require substantial lead time to repair or replace. Our business and operating results may be harmed due to interruption of our manufacturing by events outside of our control, including earthquakes, tornadoes and fires. Other possible disruptions may include power loss and telecommunications failures. In the event of a disruption, we may lose customers and we may be unable to regain those customers thereafter. Our insurance may not be sufficient to cover all of our potential losses and may not continue to be available to us on acceptable terms, or at all.
We face intense competition from established and new companies in the molecular diagnostics field.
We compete with companies that design, manufacture and market already existing and new molecular diagnostics systems, and single target or low count multiplexing systems and assays are abundant. We anticipate that we will face increased competition in the future as new companies enter the market with new technologies and our competitors improve their current products. One or more of our competitors may offer technology superior to ours and render our technology obsolete or uneconomical. If a competitor were able to deliver a testing application that offers simplicity and ease of use, high count multiplexing and high throughput and fast turnaround, our ability to successfully market our products would be materially adversely affected. Most of our current competitors, as well as many of our potential competitors, have greater name recognition, more substantial intellectual property portfolios, longer operating histories, significantly greater resources to invest in new technologies and more substantial experience in new product development, regulatory expertise, manufacturing capabilities and the distribution channels to deliver products to customers. If we are not able to compete successfully, we may not generate sufficient revenue to become profitable.
Our success may depend upon how we and our competitors anticipate and adapt to market conditions.
The markets for our products are characterized by rapidly changing technology, evolving industry standards, changes in customer needs, emerging competition and new product introductions. The success of our products will depend on our ability to continue to increase their performance and decrease their price. New technologies, techniques or products could emerge with similar or better price-performance than our system and could exert pricing pressures on our products. It is critical to our success for us to anticipate changes in technology and customer requirements and to successfully introduce enhanced and competitive technology to meet our customers’ and prospective customers’ needs on a timely basis. We may not be able to maintain our technological advantages over emerging technologies in the future and we will need to respond to technological innovation in a rapidly changing industry. If we fail to keep pace with emerging technologies our system will become uncompetitive, our market share will decline and our business, revenue, financial condition and operating results could suffer materially.
20
We may not be able to manage our anticipated growth, and we may experience constraints or inefficiencies caused by unanticipated acceleration and deceleration of customer demand.
Demand for our respiratory products is directly proportionate to the size and duration of influenza and other respiratory illnesses. Unanticipated acceleration and deceleration of customer demand for our products may result in constraints or inefficiencies related to our manufacturing, sales force, implementation resources and administrative infrastructure. Such constraints or inefficiencies may adversely affect us as a result of delays, lost potential product sales or loss of current or potential customers due to their dissatisfaction. Similarly, over-expansion or investments in anticipation of growth that does not materialize, or develops more slowly than we expect, could harm our financial results and result in overcapacity.
To manage our anticipated future growth effectively, we must enhance our manufacturing capabilities and operations, information technology infrastructure, and financial and accounting systems and controls. Organizational growth and scale-up of operations could strain our existing managerial, operational, financial and other resources. Our growth could require significant capital expenditures and may divert financial resources from other projects, such as the development of new products or enhancements of existing products. If our management is unable to effectively manage our growth, our expenses may increase more than expected, our revenue could grow more slowly than expected and we may not be able to achieve our research and development and commercialization goals. Our failure to manage our anticipated growth effectively could have a material adverse effect on our business, operating results or financial condition.
We use hazardous chemicals, biological materials, and infectious diseases in our business. Any claims relating to improper handling, storage or disposal of these materials could be time consuming and costly.
Our research and development and manufacturing processes involve the controlled use of hazardous materials, including chemicals, biological materials and infectious diseases. Our operations produce hazardous waste products. We cannot eliminate the risk of accidental contamination or discharge and any resultant injury from these materials. We may be sued for any injury or contamination that results from our use or the use by third parties of these materials, and our liability may exceed our insurance coverage and our total assets. Federal, state and local laws and regulations govern the use, manufacture, storage, handling and disposal of these hazardous materials and specified waste products, as well as the discharge of pollutants into the environment and human health and safety matters. Compliance with environmental laws and regulations may be expensive, and may impair our research, development and production efforts. If we fail to comply with these requirements, we could incur substantial costs, including civil or criminal fines and penalties, clean-up costs, or capital expenditures for control equipment or operational changes necessary to achieve and maintain compliance. In addition, we cannot predict the impact on our business of new or amended environmental laws or regulations, or any changes in the way existing and future laws and regulations are interpreted and enforced.
If we are unable to recruit and retain key executives and scientists, we may be unable to achieve our goals.
Our performance is substantially dependent on the performance of our senior management and key scientific and technical personnel. The loss of the services of any member of our senior management or our scientific or technical staff could divert management’s attention to transition matters and identification of suitable replacements, if any, and have a material adverse effect on our business, operating results and financial condition. Each of our executive officers and other key employees could terminate his or her relationship with us at any time. We do not maintain key man life insurance on any of our employees.
In addition, our product development and marketing efforts could be delayed or curtailed if we are unable to attract, train and retain highly skilled employees and scientific advisors, particularly our management team, senior scientists and engineers and sales and marketing personnel. To expand our research, product development and sales efforts we need additional people skilled in areas such as protein science, information services, manufacturing, sales, marketing and technical support. Because of the complex and technical nature of our system and the dynamic market in which we compete, any failure to attract and retain a sufficient number of qualified employees could materially harm our ability to develop and commercialize our technology. We may not be successful in hiring or retaining qualified personnel and our failure to do so could have a material adverse effect on our business, financial condition and results of operations.
21
Healthcare reform and restrictions on reimbursement may adversely affect our profitability.
In the United States, healthcare providers that purchase our products and other diagnostic products generally rely on third-party payors to reimburse all or part of the cost of the procedure. In international markets, reimbursement and healthcare payment systems vary significantly by country, and include both government-sponsored healthcare and private insurance. Third-party payors can affect the pricing or the relative attractiveness of our products by regulating the maximum amount of reimbursement provided by such payors for laboratory testing services. Lower-than-expected or decreases in reimbursement amounts for tests performed using our products may decrease amounts physicians and other practitioners are able to charge patients, which in turn may adversely affect the willingness of physicians and other practitioners to purchase our products at prices we target, or at all. If we were not able to sell our products at target prices, then we will suffer a decrease in expected profitability that would likely adversely affect our business, financial condition and results of operations.
In addition, political, economic and regulatory influences are subjecting the healthcare industry to potential fundamental changes that could substantially affect our results of operations. Government and private sector initiatives to limit the growth of healthcare costs, including price regulation, competitive pricing, coverage and payment policies, comparative effectiveness of therapies, technology assessments and managed-care arrangements, are continuing. These changes are causing the marketplace to put increased emphasis on the delivery of more cost-effective treatments. In addition, uncertainty remains regarding proposed significant reforms to the U.S. healthcare system, including the potential innovation tax on medical device companies.
Security breaches and other disruptions could compromise our information and expose us to liability, which would cause our business and reputation to suffer.
In the ordinary course of our business, we collect and store sensitive data, including intellectual property, our proprietary business information and that of our tenants and business partners, including personally identifiable information of our tenants and employees, in our data centers and on our networks. Despite our security measures, our information technology and infrastructure may be vulnerable to attacks by hackers or breached due to employee error, malfeasance or other disruptions. Any such breach could compromise our networks and the information stored there could be accessed, publicly disclosed, lost or stolen. Any such access, disclosure or other loss of information could result in legal claims or proceedings, liability under laws that protect the privacy of personal information, disrupt our operations, and damage our reputation, which could adversely affect our business.
Risks Related to Our Common Stock
The market price of our common stock may be volatile and fluctuate significantly, which could result in substantial losses for investors and subject us to securities class action litigation.
Market prices of diagnostics companies have been volatile. Among the factors that may cause the market price of our common stock to fluctuate are the risks described in this “Risk Factors” section and other factors, including:
| • | fluctuations in our quarterly operating results or the operating results of our competitors; |
| • | changes in estimates of our financial results or recommendations by securities analysts; |
| • | variance in our financial performance from the expectations of securities analysts; |
| • | changes in the estimation of the future size and growth rate of our markets; |
| • | changes in accounting principles or changes in interpretations of existing principles, which could affect our financial results; |
| • | failure of our products to achieve or maintain market acceptance or commercial success; |
| • | conditions and trends in the markets we serve; |
| • | changes in general economic, industry and market conditions; |
| • | success of competitive products and services; |
22
| • | changes in market valuations or earnings of our competitors; |
| • | changes in our pricing policies or the pricing policies of our competitors; |
| • | announcements of significant new products, contracts, acquisitions or strategic alliances by us or our competitors; |
| • | changes in legislation or regulatory policies, practices, or actions; |
| • | the commencement or outcome of litigation involving our company, our general industry or both; |
| • | recruitment or departure of key personnel; |
| • | changes in our capital structure, such as future issuances of securities or the incurrence of additional debt; |
| • | actual or expected sales of our common stock by our stockholders; and |
| • | the trading volume of our common stock. |
In addition, the stock market in general, the NASDAQ Global Market and the market for diagnostics companies in particular, may experience a loss of investor confidence. Such loss of investor confidence may result in extreme price and volume fluctuations in our common stock that are unrelated or disproportionate to the operating performance of our business, financial condition or results of operations. These broad market and industry factors may materially harm the market price of our common stock and expose us to securities class action litigation. Such litigation, even if unsuccessful, could be costly to defend and divert management’s attention and resources, which could further materially harm our financial condition and results of operations.
If equity research analysts do not publish research or reports about our business or if they issue unfavorable commentary or downgrade our common stock, the price of our common stock could decline.
The liquidity of the trading market for our common stock may be affected in part by the research and reports that equity research analysts publish about us and our business. We do not control the opinions of these analysts. The price of our stock could decline if one or more equity analysts downgrade our stock or if those analysts issue other unfavorable commentary or cease publishing reports about us or our business.
Certain provisions of our corporate governing documents could make an acquisition of our company more difficult.
Certain provisions of our organizational documents could discourage potential acquisition proposals, delay or prevent a change in control of us or limit the price that investors may be willing to pay in the future for shares of our common stock. For example, our amended and restated certificate of incorporation and amended and restated by-laws:
| • | authorize the issuance of preferred stock that can be created and issued by our board of directors without prior stockholder approval, commonly referred to as “blank check” preferred stock, with rights senior to those of our common stock; |
| • | limit the persons who can call special stockholder meetings; |
| • | provide that a majority vote of our stockholders is required to amend our amended and restated certificate of incorporation and amended and restated by-laws; |
| • | establish advance notice requirements to nominate persons for election to our board of directors or to propose matters that can be acted on by stockholders at stockholder meetings; |
| • | do not provide for cumulative voting in the election of directors; and |
| • | provide for the filling of vacancies on our board of directors by action of a majority of the directors and not by the stockholders. |
23
These and other provisions in our organizational documents could allow our board of directors to affect your rights as a stockholder in a number of ways, including making it more difficult for stockholders to replace members of the board of directors. Because our board of directors is responsible for approving the appointment of members of our management team, these provisions could in turn affect any attempt to replace the current management team. These provisions could also limit the price that investors would be willing to pay in the future for shares of our common stock.
Our amended and restated articles of incorporation provide that Section 203 of the Delaware General Corporation Law, an anti-takeover law, will not apply to us. Section 203 generally prohibits an interested stockholder from engaging in certain types of business combinations with a Delaware corporation for three years after becoming an interested stockholder. An “interested stockholder” is a person who, together with affiliates and associates, owns 15% or more of the corporation.
Our 2007 Long-Term Incentive Plan includes an automatic share replenishment, or “evergreen,” provision that, unless our board of directors takes action to the contrary, will automatically increase the number of shares of our common stock reserved for issuance under this plan each year. Issuances of awards under this Plan would cause further dilution to existing stockholders.
In March 2007 our board of directors adopted and our shareholders approved our 2007 Long-Term Incentive Plan (the “2007 Plan”). The 2007 Plan authorizes the grant of stock options, share appreciation rights, restricted shares, restricted share units, unrestricted shares, incentive stock options, deferred share units and performance awards. The total awards originally authorized under the 2007 Plan was 4,106,009 shares, plus up to an additional 773,591 shares of common stock that will become available in the event that awards made under our 2000 Equity Incentive Plan expire, are forfeited or cancelled, plus an annual increase in the number of shares pursuant to the evergreen provision equal to the least of: 900,000 shares of common stock; 4.0% of our outstanding shares of common stock as of fiscal year end; and an amount determined by the board of directors.
At December 31, 2011, there were 44,070,437 outstanding shares of our common stock. In addition, there were outstanding options to purchase 4,663,760 shares of our common stock (including 963,342 shares authorized pursuant to the evergreen provision of the Plan), of which 450,000 were in-the-money based on our December 31, 2011 closing stock price. Pursuant to the evergreen provision, an additional 900,000 shares of our common stock were authorized for issuance under the 2007 Plan as of January 1, 2012.
The evergreen provision expired following the final authorization increase on January 1, 2012. Since our initial public offering , this provision has eliminated the need for us to seek stockholders approval to authorize additional shares for issuance under the 2007 Plan or a new plan. Now that the evergreen provision has expired, factors such as, a material increase in the number of our award-eligible employees, or competitive conditions to attract or keep valuable employees, may affect the likelihood that we request stockholders to authorize additional shares under this plan or a new plan. The issuance, perception that issuance may occur, or exercise of these options may have a dilutive impact on other stockholders and could have a material negative effect on the market price of our common stock.
We do not currently intend to pay dividends on our capital stock and, consequently, your ability to achieve a return on your investment will depend on appreciation in the price of our common stock.
We have never declared or paid any cash dividends on our common stock, and we currently intend to invest our future earnings, if any, to fund the development and growth of our business. Therefore, we do not anticipate declaring or paying cash dividends on our common stock in the foreseeable future. The payment of dividends will be at the discretion of our board of directors and will depend on our results of operations, capital requirements, financial condition, future prospects, contractual arrangements, restrictions imposed by applicable law, any limitations on payments of dividends present in our current and future debt agreements, and other factors our board of directors may deem relevant. If we do not pay dividends, your ability to achieve a return on your investment in our company will depend on any future appreciation in the market price of our common stock. There is no guarantee that shares of our common stock will appreciate in value or even maintain the price at which our stockholders have purchased their shares.
We will continue to incur costs and demands upon management as a result of complying with the laws and regulations affecting public companies, which may adversely affect our operating results and failure to achieve and maintain effective internal controls in accordance with Section 404 of the Sarbanes-Oxley Act could cause investors to lose confidence in our operating results and in the accuracy of our financial reports and could have a material adverse effect on our business and on the price of our common stock.
24
As a public company, we are required, pursuant to Section 404 of the Sarbanes-Oxley Act of 2002, to furnish a report by management on, among other things, the effectiveness of our internal control over financial reporting for our 2012 fiscal year. Management is responsible for implementing controls and other procedures designed to ensure that information required to be disclosed by us in the reports that we file with the SEC is disclosed accurately and is recorded, processed, summarized and reported within the time periods specified in the SEC’s rules and forms. While we have implemented the internal controls that we feel are necessary to comply with Section 404 of the Sarbanes Oxley Act, these controls may become inadequate because of changes in conditions or the degree of compliance with these policies or procedures may deteriorate.
Furthermore, as a public company, changing laws, regulations and standards relating to corporate governance and public disclosure, including regulations implemented by the Securities and Exchange Commission and the NASDAQ may increase legal and financial compliance costs and make some activities more time consuming. These laws, regulations and standards are subject to varying interpretations and, as a result, their application in practice may evolve over time as new guidance is provided by regulatory and governing bodies. We intend to invest resources to comply with evolving laws, regulations and standards, and this investment may result in increased general and administrative expenses and a diversion of management’s time and attention from revenue-generating activities to compliance activities. If, notwithstanding our efforts to comply with new laws, regulations and standards, we fail to comply, regulatory authorities may initiate legal proceedings against us and our business may be harmed.
Failure to comply with these rules might also make it more difficult for us to obtain certain types of insurance, including director and officer liability insurance, and we might be forced to accept reduced policy limits and coverage and/or incur substantially higher costs to obtain the same or similar coverage. The impact of these events could also make it more difficult for us to attract and retain qualified persons to serve on our board of directors, on committees of our board of directors, or as executive officers.
Concentration of ownership among some of our stockholders, including directors and management may limit your ability to influence corporate matters.
As of December 31, 2012, approximately 32% of our common stock including the exercise of all outstanding warrants and exercisable options to purchase our common stock will be beneficially held by our directors, our executive officers, and greater than five percent stockholders and their respective affiliates. Lurie Investment Fund, L.L.C., Lurie Investments, Inc., AOQ Trust, Alfa-Tech, L.L.C., Anda-Proquest, L.L.C. and their respective affiliates, own 25% of our common stock including the exercise of all outstanding warrants and exercisable options to purchase our common stock. Consequently, a small number of our stockholders may be able to substantially influence our management and affairs. If they choose to act together, they would be able to influence most matters requiring approval by our stockholders, including the election of directors, any merger, consolidation or sale of all or substantially all of our assets and any other transaction. The concentration of ownership may also delay or prevent a change in control of us even if such changes might otherwise be beneficial to our stockholders. In addition the significant concentration of share ownership may adversely affect the trading price of our common stock because investors often perceive disadvantages in owning shares in companies with controlling stockholders.
Item 1B. Unresolved Staff Comments.
None.
Item 2. Properties.
Our executive, research and development and manufacturing functions are all located at a 41,846 square foot leased facility in Northbrook, Illinois. The lease for our Northbrook facility expires in May 2014. Our facilities lease includes the right of first offer on additional available space in our building. While we do not need to expand our facilities to meet anticipated demand for 2013, we will likely require expanded facilities to meet anticipated demand beyond 2013.
We do not own any real property.
Item 3. Legal Proceedings.
We are from time to time subject to various claims and legal actions during the ordinary course of our business. We believe that there are currently no claims or legal actions that would, in management’s judgment based on information currently available, have a material adverse effect on our results of operations, financial condition or cash flow.
Item 4. Mine Safety Disclosures.
Not applicable.
25
PART II
Item 5. Market for Registrant’s Common Equity, Related Stockholder Matters, and Issuer Purchases of Equity Securities.
Market Information
Our common stock has been traded on the NASDAQ Global Market since November 1, 2007 under the symbol “NSPH”. The following table sets forth the high and low sale prices for our common stock for each quarter of our two most recent fiscal years, as reported on the NASDAQ Global Market for the period indicated.
| | | | | | | | |
| | | High | | | Low | |
Fiscal year ended December 31, 2012 | | | | | | | | |
First Quarter | | $ | 2.21 | | | $ | 1.42 | |
Second Quarter | | | 2.55 | | | | 1.51 | |
Third Quarter | | | 3.89 | | | | 2.24 | |
Fourth Quarter | | | 3.74 | | | | 2.39 | |
Fiscal year ended December 31, 2011 | | | | | | | | |
First Quarter | | $ | 5.54 | | | $ | 2.97 | |
Second Quarter | | | 3.60 | | | | 1.46 | |
Third Quarter | | | 2.41 | | | | 0.91 | |
Fourth Quarter | | | 1.75 | | | | 0.89 | |
Stockholders
The last reported sale price of common stock on February 25, 2013 as reported on the NASDAQ Global Market was $2.01. As of February 25, 2013, there were 77 holders of record of our common stock.
Dividend Policy
We have never declared or paid any cash dividends on our common stock and do not expect to pay any dividends for the foreseeable future. We currently intend to retain any future earnings to fund the operation, development and expansion of our business. Any future determination to pay dividends will be at the sole discretion of our board of directors and will depend upon a number of factors, including our results of operations, capital requirements, financial condition, future prospects, contractual arrangements, restrictions imposed by applicable law, any limitations on payments of dividends present in our current and future debt arrangements, and other factors our board of directors may deem relevant.
26
Stock Performance Graph
The following graph shows a comparison of cumulative total stockholder returns for our common stock, the NASDAQ Composite Index and the NASDAQ Biotechnology Index. The graph assumes the investment of $100 on November 1, 2007, the date of our initial public offering and listing of our common stock on the NASDAQ Global Market, and the reinvestment of all dividends. The performance shown is not necessarily indicative of future performance.
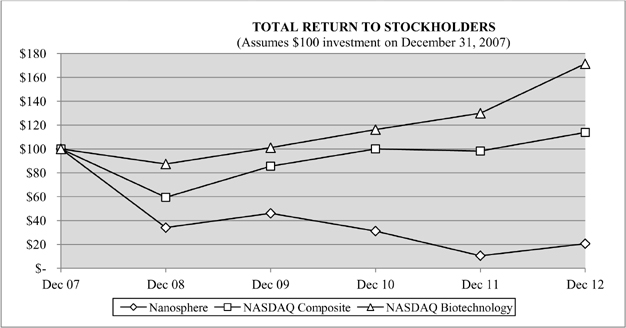
| | | | | | | | | | | | | | | | | | | | | | | | |
Investment Return Analysis | | December
2007 | | | December
2008 | | | December
2009 | | | December
2010 | | | December
2011 | | | December
2012 | |
Nanosphere | | $ | 100.00 | | | $ | 34.02 | | | $ | 46.03 | | | $ | 31.17 | | | $ | 10.51 | | | $ | 20.59 | |
NASDAQ Composite | | $ | 100.00 | | | $ | 59.46 | | | $ | 85.55 | | | $ | 100.02 | | | $ | 98.22 | | | $ | 113.85 | |
NASDAQ Biotechnology | | $ | 100.00 | | | $ | 87.37 | | | $ | 101.03 | | | $ | 116.19 | | | $ | 129.91 | | | $ | 171.36 | |
The information contained in the graph above shall not be deemed to be “soliciting material” or to be “filed” with the SEC, nor shall such information be incorporated by reference into any future filing under the Securities Act or the Exchange Act, or subject to Regulation 14A or 14C promulgated under the Exchange Act, other than as provided in Item 402 of the SEC’s Regulation S-K, or to the liabilities of Section 18 of the Exchange Act, except to the extent that Nanosphere specifically requests that the information be treated as soliciting material or specifically incorporates it by reference in such filing.
27
Equity Compensation Plan Information
The following table provides information as of December 31, 2012 with respect to shares of the Company’s common stock that may be issued under the 2007 Plan, which is the Company’s only existing equity compensation plan under which grants can be made. Stockholders approved the Company’s 2007 Plan on March 27, 2007.
Equity Compensation Plan Information
| | | | | | | | | | | | |
Plan Category | | Number of securities
to be issued upon
exercise
of outstanding awards
(a) | | | Weighted Average
exercise price of
outstanding awards
(b) | | | Number of securities
remaining available for
future issuance under
equity compensation
plans (excluding
securities reflected in
column(a))
(c) | |
Equity compensation plans approved by stockholders | | | 5,999,875 | | | $ | 4.01 | | | | 1,397,760 | |
Equity compensation plans not approved by stockholders | | | — | | | | — | | | | — | |
Total | | | 5,999,875 | | | $ | 4.01 | | | | 1,397,760 | |
Pursuant to the evergreen provision, an additional 900,000 shares of common stock were authorized for issuance under the 2007 Plan as of January 1, 2012.
Item 6. Selected Financial Data.
The following selected financial data should be read in conjunction with, and is qualified by reference to, our financial statements and related notes and “Item 7. Management’s Discussion and Analysis of Financial Condition and Results of Operations” appearing elsewhere in this report.
| | | | | | | | | | | | | | | | | | | | |
| | | As of December 31, | |
Statements of Operations Data: | | 2012 | | | 2011 | | | 2010 | | | 2009 | | | 2008 | |
| | (in thousands, except per share data) | |
Total revenue | | $ | 5,078 | | | $ | 2,533 | | | $ | 2,026 | | | $ | 2,214 | | | $ | 1,367 | |
Research and development expense | | | 17,552 | | | | 20,013 | | | | 18,821 | | | | 18,608 | | | | 23,675 | |
Sales, general and administrative expense | | | 16,890 | | | | 16,154 | | | | 22,007 | | | | 14,472 | | | | 13,616 | |
Net loss | | | (32,872 | ) | | | (35,419 | ) | | | (40,612 | ) | | | (33,949 | ) | | | (37,042 | ) |
Net loss attributable to common stock | | | (32,872 | ) | | | (35,419 | ) | | | (40,612 | ) | | | (33,949 | ) | | | (37,042 | ) |
Net loss per common share: | | | | | | | | | | | | | | | | | | | | |
basic and diluted | | | (0.67 | ) | | | (0.94 | ) | | | (1.46 | ) | | | (1.46 | ) | | | (1.67 | ) |
Weighted average number of common shares: | | | | | | | | | | | | | | | | | | | | |
basic and diluted (1)(2)(3) | | | 49,193 | | | | 37,800 | | | | 27,755 | | | | 23,302 | | | | 22,213 | |
| | | | | | | | | | | | | | | | | | | | |
| | | As of December 31, | |
Balance Sheet Data: | | 2012 | | | 2011 | | | 2010 | | | 2009 | | | 2008 | |
| | | (in thousands) | |
Cash and cash equivalents (1)(2)(3) | | $ | 33,139 | | | $ | 39,273 | | | $ | 39,628 | | | $ | 76,689 | | | $ | 75,357 | |
Working capital (1)(2)(3) | | | 36,551 | | | | 38,729 | | | | 37,426 | | | | 71,152 | | | | 69,027 | |
Total assets (1)(2)(3) | | | 47,457 | | | | 50,337 | | | | 51,375 | | | | 88,669 | | | | 86,896 | |
Long-term debt | | | — | | | | — | | | | — | | | | — | | | | 3,352 | |
Stockholders’ equity (1)(2)(3) | | | 42,232 | | | | 45,609 | | | | 44,524 | | | | 79,082 | | | | 74,541 | |
| (1) | In July 2012, we completed an underwritten public offering of 12,075,000 shares of common stock at $2.40 per share. The Company received net proceeds from the offering of approximately $27 million. |
| (2) | In May 2011, we completed an underwritten public offering of 15,686,000 shares of common stock at $2.20 per share. The Company received net proceeds from the offering of approximately $32.2 million. |
| (3) | In October 2009, we completed an underwritten public offering of 5,405,000 shares of common stock at $7.00 per share. We received approximately $35.4 million of net proceeds from the offering. |
28
Item 7. Management’s Discussion and Analysis of Financial Condition and Results of Operations.
The following discussion and analysis is based primarily on the financial statements of Nanosphere, Inc. for the years presented and should be read together with the notes thereto contained in this annual report on Form 10-K. Terms employed herein as defined terms, but without definition, have the meanings set forth in the notes to the financial statements (see “Item 8. Financial Statements and Supplementary Data”).
Business Overview
We develop, manufacture and market an advanced molecular diagnostics platform, the Verigene System, that enables simple, low cost and highly sensitive genomic and protein testing on a single platform. Our proprietary nanoparticle technology provides the ability to run multiple tests simultaneously on the same sample. The Verigene System includes a bench-top molecular diagnostics workstation that is a universal platform for genomic and protein testing. While many systems currently available on the market provide a diagnostic result for one test or a few tests within a specific market niche, the Verigene System provides for multiple tests to be performed on a single platform, including both genomic and protein assays, from a single sample.
The Verigene System is differentiated by its ease of use, rapid turnaround times and ability to detect many targets on a single test, referred to as “multiplexing.” It provides lower cost for laboratories already performing molecular diagnostic testing and enables smaller laboratories and hospitals without advanced diagnostic capabilities to perform genetic testing. Our ability to detect proteins, which can be as much as 100 times more sensitive than current technologies for certain targets, may enable earlier detection of and intervention in diseases associated with known biomarkers as well as the introduction of tests for new biomarkers that exist in concentrations too low to be detected by current technologies. We are focused on the clinical diagnostics market.
Our test menu is designed to fulfill the following unmet hospital laboratory needs:
| | 1) | the conversion of microbiology to molecular methods to more rapidly pinpoint infectious diseases; |
| | 2) | point-of-care pharmacogenetics to ensure that appropriate therapies are prescribed; and |
| | 3) | earlier detection of life threatening disease through ultra-sensitive protein assays. |
The Verigene System is comprised of a microfluidics processor, a touchscreen reader and disposable test cartridges. Certain assays, such as the Warfarin metabolism and hyper-coagulation tests, were cleared by the U.S. Food and Drug Administration (“FDA”) for use with the original Verigene System processor (the “Original Processor”). Subsequently, we developed and launched a second generation Verigene System processor (the “ProcessorSP”) that handles the same processing steps as the Original Processor and incorporates sample preparation. Some of our current customers continue to use the Original Processor for hyper-coagulation testing and Warfarin metabolism testing. Our development plans are focused on expanding the menu of tests that will run on the ProcessorSP,and we plan to develop and seek regulatory approval of all future assays on the ProcessorSP.
During 2012, we received FDA(k) clearance for tests including new verigene tests:
| | • | | Blood Culture – Gram Positive (BC-GP) |
Our Applications
The following table summarizes the FDA and CE In-Vitro Diagnostic Mark (“CE IVD Mark”) regulatory status of our near-term genomic and protein assays on the Verigene System:
| | | | |
Assay | | FDA Status(1) | | CE IVD Mark Status(2) |
Infectious Disease Assays | | | | |
| | |
Respiratory Virus with Sub-Typing | | 510(k) cleared | | CE IVD Marked |
| | |
Blood Infection Panels • Blood Culture – Staphylococcus (BC-S) • Blood Culture – Gram Positive (BC-GP) • Blood Culture – Gram Negative (BC-GN) • Blood Culture – Fungal (BC-F) | | 510(k) cleared 510(k) cleared(4) In development In development | | CE IVD Marked CE IVD Marked CE IVD Pending In development |
| | |
C. difficile | | 510(k) cleared | | CE IVD Pending |
| | |
Enteric Panel | | In development | | In development |
| | |
Human and Pharmacogenetic Assays | | | | |
| | |
Warfarin Metabolism | | 510(k) cleared(3) | | CE IVD Marked |
| | |
Hyper-Coagulation | | 510(k) cleared(3) | | CE IVD Marked |
| | |
2C19 Genetic Variance | | 510(k) cleared | | CE IVD Marked |
| | |
Ultra-Sensitive Protein Assays | | | | |
| | |
Cardiac Troponin I | | In development | | In development |
| | |
Prostate-Specific Antigen (PSA) | | Research use only | | |
29
| (1) | For further description of our FDA regulatory requirements, please refer to the section “Regulation by the United States Food and Drug Administration” beginning on page 10 of this Annual Report on Form 10-K for the year ended December 31, 2012. |
| (2) | For further description of our CE IVD Mark regulatory requirements, please refer to the section “Foreign Government Regulation” beginning on page 13 of this Annual Report on Form 10-K for the year ended December 31, 2012. |
| (3) | Currently cleared only for use with the Original Processor. |
| (4) | Received FDA 510(k) clearance in June 2012 and subsequent 510(k) clearance expanding the test’s intended use for use with all adult blood culture bottles received September 2012. |
Infectious Disease Assays
The conversion of microbiology to molecular methods is driven by the need to identify infectious diseases more quickly, allowing a more rapid commencement of clinical intervention. Microbiology labs need tests that can rapidly detect a wide range of potential infectious agents in an automated system. The Verigene System provides the multiplexing, rapid turnaround and ease-of-use needed by these labs. Our infectious disease menu and the ProcessorSPprovide microbiology labs with a compelling solution for conversion to molecular testing.
We have received 510(k) clearance from the FDA for our respiratory panel that detects the presence of influenza A and B as well as respiratory syncytial virus (“RSV”) A and B. Influenza is commonly known as the seasonal flu and RSV is a respiratory virus that infects the lungs and breathing passages. RSV is the most common cause of bronchitis and pneumonia in children under the age of one year and has become a significant concern for older adults. Our respiratory panel provides physicians with a highly accurate and fast determination of which virus is present. This test result guides the most appropriate treatment therapy.
In the fourth quarter of 2009, we received 510(k) clearance from the FDA for our respiratory panel on the ProcessorSP. We believe that our respiratory assay on the ProcessorSPoffers a simple-to-use molecular test for diagnosing respiratory infections and the flu, while providing improved sensitivity over currently available rapid tests. We have received 510(k) clearance for a package insert change for this assay confirming that the novel H1N1 virus is detected as a positive Influenza A when using our respiratory assay and the ProcessorSP.
In the first quarter of 2011, we received 510(k) clearance from the FDA and CE IVD Mark for our respiratory assay that includes subtyping for seasonal H1 virus, seasonal H3 virus, and the 2009 novel H1N1 virus, commonly known as swine flu, as well as the targets on our previously cleared respiratory assay. We believe this is the first sample-to-result molecular respiratory test to include all of these viruses, thus lowering the cost of molecular respiratory testing for hospitals and demonstrating the multiplexing capability of the Verigene System. The demand for this test will be highly dependent upon the seasonality and prevalence of respiratory viruses.
We are developing blood stream infection panels for the earlier detection of specific bacteria and resistance markers within patients with blood stream infections. These panels include gram positive, gram negative and fungal pathogens and resistance markers. These assays are designed to enable physicians to pinpoint bacterial strains infecting patients and thus prescribe the most appropriate antibiotic regimen within 24 hours rather than after several days. Treatment is sometimes begun before assays are complete and we believe that this early detection capability will allow patients to avoid unnecessary treatments that may expose them to serious side effects. The first blood stream infection panel developed was the gram positive that represents approximately 65% of blood stream infections. In the fourth quarter of 2011 we received CE IVD Mark for the BC-GP and FDA 510(k) clearance of BC-S, a subset of the BC-GP panel. In June 2012 we received ade novo510(k) clearance to market the full BC-GP panel. In September 2012 we received a 510(k) clearance which expanded the intended use of BC-GP for use with all adult blood culture bottles. The BC-GN and BC-F panels are in development.
We developed a test to detect C. difficile, a bacterium that can cause symptoms ranging from diarrhea to life-threatening inflammation of the colon. We received 510(k) clearance from the FDA in the fourth quarter of 2012 for ourC. difficile test.
Our development efforts also include an enteric bacteria test. Our enteric bacteria assay identifies theEnterobacteriaceaespecies that most often result from food poisoning. The enteric assay tests for a wide spectrum of bacteria and viruses that are treated with various antibiotics and other drug therapies. This assay will require regulatory submission to the FDA and corresponding foreign regulatory bodies.
Human and Pharmacogenetic Assays
Hospitals need faster, less expensive and easier-to-use human and pharmacogenetic tests that can be run for a single patient at the point-of-care. Our Verigene System and human and pharmacogenetic test menu addresses these hospital needs. Pharmacogenomics is an emerging subset of human genetic testing that correlates gene variation with a drug’s efficacy or toxicity. These tests play a key role in the advancement of personalized medicine where drug therapies and dosing are guided by each patient’s genetic makeup. There is a growing demand on laboratories to implement molecular diagnostic testing, but the cost and complexity of existing technologies and the need for specialized personnel and facilities have limited the number of laboratories with these capabilities. The ease-of-use and reduced complexity of the Verigene System enables any hospital to perform these testing needs.
We have received 510(k) clearance from the FDA for a warfarin metabolism assay performed on our Original Processor. This is a pharmacogenetic test to determine the existence of certain genetic mutations that affect the metabolism of warfarin-based drugs, including Coumadin®, the most-prescribed oral anticoagulant. This assay has been CE IVD Marked during the first quarter of 2011, and we plan to submit an FDA application for this assay to allow its use on the Processor SP.
In the fourth quarter of 2012 we received 510(k) clearance from the FDA for a 2C19 genetic variance test. This assay was CE IVD Marked during the first quarter of 2011.This test detects variances in the cytochrome P-450 2C19 gene. These genetic variances are associated with deficient metabolism of clopidogrel, more commonly known by the trade name Plavix.
We also have received 510(k) clearance from the FDA for a hyper-coagulation assay on the Original Processor that determines an individual’s risk, based upon genetic information, for the development of blood clots that can lead to pulmonary embolism and deep vein thrombosis. This assay has been CE IVD Marked during the fourth quarter of 2011, and we plan to submit an FDA application for this assay to allow its use on the Processor SP.
Ultra-Sensitive Protein Assays
Our ability to detect proteins at sensitivity levels that can be 100 times greater than current technologies may enable earlier detection of and intervention in diseases as well as enable the introduction of tests for new biomarkers that exist in concentrations too low to be detected by current technologies. We have developed, are currently developing or plan to develop diagnostic tests for markers that reveal the existence of a variety of medical conditions including cardiovascular, respiratory, cancer, autoimmune, neurodegenerative and other diseases.
The first ultra-sensitive protein test we plan to commercialize is for cardiac troponin I (“cTnI”), which is the gold standard biomarker for diagnosis of myocardial infarction, or heart attack, and identification of patients with acute coronary syndromes at risk for cardiovascular events. We may submit an assay for 510(k) clearance for use as a diagnostic tool for acute coronary syndromes, although we have no immediate plans to do so. Currently, we are focused on investigating the potential to sell this assay to commercial labs as a marker for cardiac risk. Early studies suggest that our ultra-sensitive cTnI test may also be a useful monitoring tool for chronic heart failure (“CHF”) patients. Larger studies and regulatory hurdles will need to be cleared before we market the assay for CHF monitoring purposes.
In addition to the cardiac troponin I assay, we have developed an ultra-sensitive prostate-specific antigen (“PSA”) test for early diagnosis of recurrent prostate cancer. We also may develop ultra-sensitive protein assays in the areas of immunology, allergy and cancer.
30
Intellectual Property
As of December 31, 2012, our patent portfolio is comprised, on a worldwide basis, of 186 issued patents and 14 pending patent applications which we own directly or for which we are the exclusive licensee. Some of these patents and patent applications derive from a common parent patent application or are foreign counterpart patent applications and relate to similar or identical technological claims. The issued patents cover approximately 11 different technological claims and the pending patent applications cover approximately three additional technological claims.
Many of our issued and pending patents were exclusively licensed from the International Institute for Nanotechnology at Northwestern in May 2000, and they generally cover our core technology, including nanotechnology-based biodiagnostics and biobarcode technology. Our issued patents expire between 2017 and 2025. We believe our patent portfolio provides protection against other companies offering products employing the same technologies and methods as we have patented. While we believe our patent portfolio establishes a proprietary position, there are many competitive products utilizing other technologies that do not infringe on our patents.
In addition, as of December 31, 2012, we have non-exclusive licenses for at least 42 U.S. patents that cover 11 different technological claims from various third parties. Most of these license agreements require us to pay the licensor royalty fees that typically expire upon the patent expiration dates, which range from 2013 to 2027. These license agreements are non-exclusive and do not create a proprietary position. The expiration of these non-exclusive licenses will result in the termination of certain royalty payments by us to the licensors.
Financial Operations Overview
Revenue
Product sales revenue is derived from the sale or rental of the Verigene System, including test instruments and cartridges and related products sold to hospitals and commercial laboratories. Grant and contract revenue consists of funds received under contracts and government grants, including funds for the reimbursement of certain research and development expenses. Our marketing efforts are primarily focused on driving product sales rather than obtaining grants and contracts.
Cost of Sales
Cost of sales represents the cost of materials, direct labor and other manufacturing overhead costs incurred to produce Verigene cartridges and instruments, as well as royalties on product sales, amortization of purchased intellectual property relevant to products available for sale and depreciation of instrument leases and rentals. Costs associated with custom assay development contracts also include labor associated with assay development, validation and testing.
31
Research and Development Expenses
Research and development expenses primarily include all costs incurred during the development of the Verigene System instruments and disposable test cartridges, and the expenses associated with fulfilling our development obligations related to the United States government contracts and grants. Such expenses include salaries and benefits for research and development personnel, consulting services, materials, patent-related costs and other expenses. We expense all research and development costs in the periods in which they are incurred. We expect research and development expenses to grow modestly as we continue to develop future generations of the Verigene System instruments, and additional genomic and protein tests.
Sales, General and Administrative Expenses
Sales, general and administrative expenses principally include compensation for employees in our sales, customer service, marketing, management and administrative functions. We also include professional services, facilities, technology, communications and administrative expenses in sales, general and administrative. Clinical trial expenses related to regulatory filings and post marketing studies are included in sales, general and administrative expenses. The professional services costs primarily consist of legal and accounting costs. We expect sales and marketing expenses will increase as additional sales and customer support are needed to drive and support customer growth.
Interest Income
Interest income principally includes interest earned on our excess cash balances. Such balances are primarily invested in money market and bank checking accounts at major financial institutions. We expect that continued low interest rates will significantly limit our interest income in the near term.
Interest Expense
Interest expense includes the interest charges related to our debt borrowings, including non-cash amortization of debt discount and issuance costs.
Fiscal 2012 Compared to 2011
Revenues
Revenues were $5.1 million for fiscal 2012 as compared to $2.5 million for fiscal 2011. Product sales more than doubled, increasing from $2.4 million for 2011 to $5.0 million for 2012, driven by unit volume increases in both cartridge and system sales. The cartridge unit volume increase was driven primarily by an increase in our infectious disease customer base. Contract development and grant revenue was less than $0.1 million in 2012 as compared to $0.1 million for 2011.
Cost of Sales
For fiscal 2012, cost of sales was $3.5 million, as compared to $1.8 million for fiscal 2011, an increase proportional to the increase in product sales revenues.
Research and Development Expenses
Research and development expenses were $17.6 million for fiscal 2012 as compared to $20.0 million for fiscal 2011. This $2.4 million decrease in research and development expenses resulted from a shift in resources from development into manufacturing, with the labor cost included as inventory and cost of sales, combined with a reduction in spending on goods and materials.
Sales, General and Administrative Expenses
Sales, general and administrative expenses increased from $16.2 million for fiscal 2011 to $16.9 million for fiscal 2012 due to increased spending for the sales and customer support expansion, partially offset by a reduction in equity compensation expense.
32
Interest Expense
Interest expense was less than $0.1 million for 2012 and for 2011.
Interest Income
Interest income was less than $0.1 million for 2012 and for 2011.
Fiscal 2011 Compared to 2010
Revenues
Revenues were $2.5 million for fiscal 2011, as compared to $2.0 million for fiscal 2010. Product sales increased from $1.4 million for fiscal 2010 to $2.4 million for fiscal 2011, driven by an increase in consumables revenue and system sales. Contract development and grant revenue was $0.1 million for 2011 as compared to $0.6 million for 2010.
Cost of Sales
For fiscal 2011, cost of sales was $1.8 million, as compared to $2.6 million for fiscal 2010. During 2010, the Company established a valuation reserve of $0.7 million for the Original Processor inventory. This reserve was taken based on the Company’s plan to submit future assay applications to the FDA for use only on the Processor SP . In addition, license amortization expense was $0.3 million lower in 2011 than 2010 due to the expiration of a licensed patent.
Research and Development Expenses
Research and development expenses were $20.0 million for fiscal 2011 as compared to $18.8 million for fiscal 2010. The $1.2 million increase was driven almost entirely by an increase in goods and materials used for assay development and pre-clinical studies.
Sales, General and Administrative Expenses
Sales, general and administrative expenses decreased from $22.0 million for fiscal 2010 to $16.2 million for fiscal 2011, a decrease resulting from a $6.1 million reduction in litigation defense and settlement expenses related to a patent dispute settled in 2010. In addition, sales, general and administrative expenses increased by $0.8 million in 2011 due to increased regulatory and customer support headcount, which was completely offset by reduced bonus expense in 2011.
33
U.S. Treasury Grant
During fiscal 2010, the United States Department of the Treasury awarded the Company a grant of $1.0 million for investments in qualifying therapeutic discovery projects under section 48D of the Internal Revenue Code. The proceeds from this grant are classified in “Other income (expense) – U.S. Treasury Grant” on the statement of operations.
Interest Expense
There was no interest expense for fiscal 2011, as compared to $0.3 million for fiscal 2010. The debt financing with Venture Lending and Leasing IV, Inc. and Venture Lending and Leasing V, Inc. matured August 2010.
Interest Income
Interest income was less than $0.1 million for 2011 and for 2010.
34
Liquidity and Capital Resources
From our inception in December 1999 through December 31, 2012, we have received net proceeds of $103.9 million from the sale of convertible preferred stock and issuance of notes payable that were exchanged for convertible preferred stock, $102.2 million from our November 2007 initial public offering, $35.4 million from our October 2009 underwritten public offering, $32.2 million from our May 2011 underwritten public offering, $27.0 million from our July 2012 underwritten public offering and $10.3 million from government grants. We have devoted substantially all of these funds to research and development and sales, general and administrative expenses. Since our inception, we have generated minimal revenues from the sale of the Verigene System, including consumables and related products, to our initial clinical customers, research laboratories and government agencies. We also incurred significant losses and, as of December 31, 2012, we had an accumulated deficit of approximately $348.2 million. While we are currently in the commercialization stage of operations, we have not yet achieved profitability and anticipate that we will continue to incur net losses in the foreseeable future.
We do not anticipate achieving positive operating cash flow in at least the next twelve months. We expect to increase investment in additional manufacturing scale-up, and to add to sales, marketing and customer support personnel during the next twelve months. Achievement of positive cash flow from operations will depend upon revenue resulting from adoption of both our current products and future products that depend upon regulatory clearance. Demand for our respiratory products is directly proportional to the size and duration of the annual season for influenza and other respiratory illnesses. Any unanticipated acceleration or deceleration of customer demand for our products relative to projections will have a material effect on our cash flows. Management believes that its cash resources should be sufficient to support currently forecasted operations through at least the next twelve months. However, the Company operates in a market that makes its prospects difficult to evaluate, and the Company will need additional debt or equity financing in the future to execute its business plans beyond the next twelve months. Management also believes that, if necessary, it can implement plans in the short term to conserve existing cash should additional financing activities be delayed. Capital outlays and operating expenditures may increase over the next twelve months as the Company expands its infrastructure, commercialization and manufacturing capacity.
A customer may purchase the Verigene System instruments, lease them from a third party or enter into a reagent rental agreement. Our reagent rental agreements include customer commitments to purchase a certain minimum volume of cartridges over the term of the agreement. As part of these agreements, a portion of the charge for each cartridge is a rental fee for use of the equipment. We may need to increase our investment in such systems rented to customers in order to support future customer growth. We have established a relationship with a third party financing company to provide our customers with lease financing for Verigene equipment. This arrangement may help mitigate the demand on our capital resources as it allows us to recover the market value of such systems immediately, instead of over three to five years.
As of December 31, 2012, we had $33.1 million in cash and cash equivalents, compared to $39.3 million at December 31, 2011. Cash used in operations of $31.7 million for the year ended December 31, 2012 was up slightly as compared to $31.5 million in the year ended December 31, 2011. Cash used in operations for the year ended December 31, 2011 decreased slightly to $31.5 million from $31.6 million for the year ended December 31, 2010.
Net cash used in investing activities increased to $0.8 million for the year ended December 31, 2012 compared to $0.6 million for the year ended December 31, 2011 due to increased spending on manufacturing equipment. Net cash used in investing activities decreased from $1.6 million for the year ended December 31, 2010 compared to the $0.6 million for the year ended December 31, 2011 predominantly driven by the reduction in license fees paid.
Net cash provided by financing activities decreased to $26.4 million for the year ended December 31, 2012 compared to $31.7 million in cash provided by financing activities for the year ended December 31, 2011. The difference in net cash provided by financing activities is because the May 2011 underwritten public offering of 15,686,000 shares at $2.20 per share provided approximately $32.2 million in net proceeds whereas the July 2012 underwritten public offering of 12,075,000 shares at $2.40 per share provided approximately $27.0 million in net proceeds. Net cash provided by financing activities increased to $31.7 million for the year ended December 31, 2011 compared to $3.9 million in cash used for financing activities for the year ended December 31, 2010. This increase in cash flow was driven by the May 2011 underwritten public offering of 15,686,000 shares at $2.20 per share that provided approximately $32.2 million in net proceeds.
35
We may need to increase our capital outlays and operating expenditures over the next several years as we expand our product offering, drive product adoption, further scale-up manufacturing and implement product cost savings. The amount and the timing of the additional capital we will need to raise, if any, depend on many factors, including:
| | • | the level of research and development investment required to maintain and improve our technology; |
| | • | the amount and growth rate of our revenues; |
| | • | changes in product development plans needed to address any difficulties in manufacturing or commercializing the Verigene System and enhancements to our system; |
| | • | the costs of filing, prosecuting, defending and enforcing patent claims and other intellectual property rights; |
| | • | competing technological and market developments; |
| | • | our need or decision to acquire or license complementary technologies or acquire complementary businesses; and |
| | • | changes in regulatory policies or laws that affect our operations. |
We cannot be certain that additional capital will be available when and as needed or that our actual cash requirements will not be greater than anticipated. If we require additional capital at a time when investment in diagnostics companies or in the marketplace in general is limited due to the then prevailing market or other conditions, we may not be able to raise such funds at the time that we desire or any time thereafter. In addition, if we raise additional funds through the issuance of equity or convertible debt securities, the percentage ownership of our stockholders could be significantly diluted, and these newly-issued securities may have rights, preferences or privileges senior to those of existing stockholders. If we obtain additional debt financing, a substantial portion of our operating cash flow may be dedicated to the payment of principal and interest on such indebtedness, and the terms of the debt securities issued could impose significant restrictions on our operations. If we raise additional funds through collaborations and licensing arrangements, we might be required to relinquish significant rights to our technologies or products, or grant licenses on terms that are not favorable to us.
Income Taxes
Since inception, we have incurred operating losses and, accordingly, have not recorded a provision for income taxes for any of the periods presented. As of December 31, 2012, we had net operating loss carryforwards for federal and state income tax purposes of $250 million. The Company also has federal research and development tax credit carryforwards of $10.3 million which will begin to expire in 2020. Section 382 of the Internal Revenue Code subjects the utilization of net operating loss and credit carryforwards to an annual limitation that is applicable if the Company experiences an ownership change. The Company believes its public offerings and/or prior equity investments may have triggered an ownership change as defined by the Internal Revenue Code. However, the Company has yet to perform the computations under Section 382 which would determine the amount of annual limitation on its utilization of its net operating loss and tax credit carryforwards. The annual limitation may result in the expiration of the Company’s net operating loss and tax credit carryforwards before they can be used.
Contractual Obligations and Commitments
As of December 31, 2012, the annual amounts of future minimum payments under certain of our contractual obligations were (in thousands):
| | | | | | | | | | | | | | | | | | | | |
| | | Payments Due by Period | |
Contractual Obligations | | Total | | | Less than 1 Year | | | 1-3 Years | | | 3-5 Years | | | More than 5 Years | |
Operating lease | | $ | 658 | | | $ | 463 | | | $ | 195 | | | $ | — | | | $ | — | |
Obligations under license agreements | | | 1,625 | | | | 920 | | | | 355 | | | | 100 | | | | 240 | |
| | | | | |
Total | | $ | 2,283 | | | $ | 1,383 | | | $ | 550 | | | $ | 100 | | | $ | 240 | |
On July 9, 2010, the Company executed a worldwide non-exclusive license agreement (the Agreement”) to utilize certain patented technology believed by the Company to be useful in the manufacture of certain of its current and future products. Under the terms of the Agreement, the Company will pay a license and technology transfer fee of $1,865,000, payable in four installments. The first installment of $165,000 was due upon the execution of the Agreement, the second installment of $350,000 was paid on July 9, 2011, the third installment of $600,000 was paid July 9, 2012 and the remaining installment of $750,000 is payable on July 9, 2013. These fees represent full payment for use of the licensed patents during the term of the Agreement, which ends on the expiration date of the last patent issued and licensed under the Agreement.
36
License Agreements
We have entered into several nonexclusive license agreements with various companies covering certain technologies which are embedded in the Company’s diagnostic instruments and diagnostic test products. Since inception, we have paid aggregate initial license fees of $3.8 million for these licenses, and have agreed to pay a percentage of net sales as royalties, in percentage amounts ranging from less than 1% to 12%. Certain of the license agreements have minimum annual royalty payments, and such minimum payments are as shown above. These licenses expire at various times, corresponding to the subject patents expirations, which currently range from 2013 to 2027.
We previously entered into a license agreement with Northwestern which provides us with an exclusive license to certain patents and patent applications related to the application of nanotechnology to biodiagnostics and to biobarcode technology. This license covers all discoveries from the International Institute for Nanotechnology at Northwestern in the field of biodiagnostics through January 1, 2013. Thereafter, the license provides that we continue to have the first right to an exclusive license for all discoveries the International Institute for Nanotechnology at Northwestern develops in the field of biodiagnostics, however, the economic terms are to be negotiated in good faith by both parties. Our research team utilizes the research and patents developed at Northwestern to develop diagnostic applications including additional genomic and protein testing assays for use in the Verigene System.
Off-Balance Sheet Arrangements
We do not have any off-balance sheet financing or unconsolidated special-purpose entities.
Critical Accounting Policies and Significant Judgments and Estimates
This discussion and analysis of our financial condition and results of operations is based on our financial statements, which have been prepared in conformity with accounting principles generally accepted in the United States of America. The preparation of these financial statements requires management to make estimates and judgments that affect the reported amounts of assets, liabilities and expenses and the disclosure of contingent assets and liabilities at the date of the financial statements, as well as revenues and expenses during the reporting periods. We evaluate our estimates and judgments on an ongoing basis. We base our estimates on historical experience and on various other factors we believe are reasonable under the circumstances, the results of which form the basis for making judgments about the carrying value of assets and liabilities that are not readily apparent from other sources. Actual results could therefore differ materially from those estimates under different assumptions or conditions.
Our significant accounting policies are described in Note 3 to our consolidated financial statements included elsewhere in this Annual Report on Form 10-K. We believe the following critical accounting policies reflect our more significant estimates and assumptions used in the preparation of our financial statements.
Revenue Recognition
Verigene System instrument units are sold outright to customers or leased to customers pursuant to operating leases. We recognize revenue from sales of the Verigene System, including cartridges and related products, when the risks and rewards of ownership are transferred to the customer. Revenue for Verigene System instrument units leased under operating lease arrangements is recognized on an installment basis over the life of the lease while the cost of the leased equipment is carried on the Company’s balance sheet and fully amortized over the life of lease arrangements.
We recognize revenue under grants and contracts and for reimbursement of related research and development expenses at the time the relevant expenses are incurred. For product sales, revenue is recognized when persuasive evidence of an arrangement exists, title and risk of loss is transferred to customers, the price to the buyer is fixed or determinable, and collectability is reasonably assured.
37
Stock-Based Compensation Expense
We have granted share-based compensation consisting of restricted stock and common stock options issued to employees, consultants and founders. Compensation expense is recognized based on the fair value of the stock-based awards granted utilizing various assumptions regarding the underlying attributes of the options and our common stock. The estimated fair value of options granted, net of forfeitures expected to occur during the vesting period, is determined using the Black-Scholes option-pricing model and then amortized as compensation expense on a straight-line basis over the vesting period of the options. All of the stock options granted prior to November 2007 have exercise prices at or above the estimated fair value of the common stock on the date of grant, as determined by our board of directors prior to our initial public offering in November 2007, who used their knowledge of us and our affairs along with third-party valuation assessments, to determine the fair value of our common stock. For option grants after our initial public offering, we use the fair value of our common stock as determined by the closing price of our common stock on NASDAQ on the date of grant. In addition to the grant date fair value of our common stock, the Black-Scholes model requires inputs for risk-free interest rate, dividend yield, volatility and expected lives of the options. Due to the Company’s limited period of trading activity as a public company from 2007 through the third quarter of 2009, the expected volatility of option grants prior to the fourth quarter of 2009 was based on historical data from various peer public companies with similar product portfolios. The expected volatility for option awards granted in the fourth quarter of 2009 and in subsequent periods was based on the Company’s actual historical volatility. The expected life of options that vest ratably over four years of service is derived from the average of the vesting period and the term of the option following the guidance in SEC Staff Accounting Bulletins No. 107 and 110. The Company estimates the expected life of options with accelerated vesting terms giving consideration to the dates that the Company expects to achieve key milestones under the option agreements and the term of the option. The risk-free rate for periods within the contractual life of the option is based on the U.S. Treasury yield curve in effect at the time of the grant.
Inventories
Inventories are carried at the lower of cost or market, using the first-in, first out method. Certain finished goods inventory is ultimately leased rather than sold, and upon the lease date is transferred to Property and equipment and subsequently depreciated to Cost of sales over their useful life.
Item 7A. Quantitative and Qualitative Disclosures About Market Risk.
Our exposure to market risk is currently confined to our cash and cash equivalents. We have not used derivative financial instruments for speculation or trading purposes. The primary objective of our investment activities is to preserve our capital for the purpose of funding operations while at the same time maximizing the income we receive from our investments without significantly increasing risk. To achieve these objectives, our investment policy allows us to maintain a portfolio of cash equivalents and short-term investments through a variety of securities, including commercial paper, money market funds and corporate debt securities. Our cash and cash equivalents through December 31, 2012 included amounts in bank checking and liquid money market accounts. As a result, we believe we have minimal interest rate risk; however, a one percentage point decrease in the average interest rate on our portfolio, if such a decrease were possible, would have reduced our interest income to $0 for the twelve month period ended December 31, 2012.
38
Item 8. Financial Statements and Supplementary Data.
The following financial statements and the related notes thereto, of Nanosphere, Inc. and the Report of Independent Registered Public Accounting Firm, Deloitte & Touche LLP, are filed as a part of this Form 10-K.
39
REPORT OF INDEPENDENT REGISTERED PUBLIC ACCOUNTING FIRM
To the Board of Directors and Stockholders of Nanosphere, Inc.
Northbrook, Illinois
We have audited the accompanying balance sheets of Nanosphere, Inc. (the “Company”) as of December 31, 2012 and 2011, and the related statements of operations, stockholders’ equity, and cash flows for each of the three years in the period ended December 31, 2012. These financial statements are the responsibility of the Company’s management. Our responsibility is to express an opinion on these financial statements based on our audits.
We conducted our audits in accordance with the standards of the Public Company Accounting Oversight Board (United States). Those standards require that we plan and perform the audit to obtain reasonable assurance about whether the financial statements are free of material misstatement. An audit includes examining, on a test basis, evidence supporting the amounts and disclosures in the financial statements. An audit also includes assessing the accounting principles used and significant estimates made by management, as well as evaluating the overall financial statement presentation. We believe that our audits provide a reasonable basis for our opinion.
In our opinion, such financial statements present fairly, in all material respects, the financial position of the Company as of December 31, 2012 and 2011, and the results of their operations and their cash flows for each of the three years in the period ended December 31, 2012, in conformity with accounting principles generally accepted in the United States of America.
We have also audited, in accordance with the standards of the Public Company Accounting Oversight Board (United States), the Company’s internal control over financial reporting as of December 31, 2012, based on the criteria established in Internal Control—Integrated Framework issued by the Committee of Sponsoring Organizations of the Treadway Commission and our report dated February 28, 2013 expressed an unqualified opinion on the Company’s internal control over financial reporting.
/s/ DELOITTE & TOUCHE LLP
Chicago, Illinois
February 28, 2013
40
REPORT OF INDEPENDENT REGISTERED PUBLIC ACCOUNTING FIRM
To the Board of Directors and Stockholders of Nanosphere, Inc.
Northbrook, Illinois
We have audited the internal control over financial reporting of Nanosphere, Inc. (the “Company”) as of December 31, 2012, based on criteria established in Internal Control — Integrated Framework issued by the Committee of Sponsoring Organizations of the Treadway Commission. The Company’s management is responsible for maintaining effective internal control over financial reporting and for its assessment of the effectiveness of internal control over financial reporting, included in the accompanying Management’s Report on Internal Control over Financial Reporting. Our responsibility is to express an opinion on the Company’s internal control over financial reporting based on our audit.
We conducted our audit in accordance with the standards of the Public Company Accounting Oversight Board (United States). Those standards require that we plan and perform the audit to obtain reasonable assurance about whether effective internal control over financial reporting was maintained in all material respects. Our audit included obtaining an understanding of internal control over financial reporting, assessing the risk that a material weakness exists, testing and evaluating the design and operating effectiveness of internal control based on the assessed risk, and performing such other procedures as we considered necessary in the circumstances. We believe that our audit provides a reasonable basis for our opinion.
A company’s internal control over financial reporting is a process designed by, or under the supervision of, the company’s principal executive and principal financial officers, or persons performing similar functions, and effected by the company’s board of directors, management, and other personnel to provide reasonable assurance regarding the reliability of financial reporting and the preparation of financial statements for external purposes in accordance with generally accepted accounting principles. A company’s internal control over financial reporting includes those policies and procedures that (1) pertain to the maintenance of records that, in reasonable detail, accurately and fairly reflect the transactions and dispositions of the assets of the company; (2) provide reasonable assurance that transactions are recorded as necessary to permit preparation of financial statements in accordance with generally accepted accounting principles, and that receipts and expenditures of the company are being made only in accordance with authorizations of management and directors of the company; and (3) provide reasonable assurance regarding prevention or timely detection of unauthorized acquisition, use, or disposition of the company’s assets that could have a material effect on the financial statements.
Because of the inherent limitations of internal control over financial reporting, including the possibility of collusion or improper management override of controls, material misstatements due to error or fraud may not be prevented or detected on a timely basis. Also, projections of any evaluation of the effectiveness of the internal control over financial reporting to future periods are subject to the risk that the controls may become inadequate because of changes in conditions, or that the degree of compliance with the policies or procedures may deteriorate.
In our opinion, the Company maintained, in all material respects, effective internal control over financial reporting as of December 31, 2012, based on the criteria established in Internal Control — Integrated Framework issued by the Committee of Sponsoring Organizations of the Treadway Commission.
We have also audited, in accordance with the standards of the Public Company Accounting Oversight Board (United States), the financial statements as of and for the year ended December 31, 2012 of the Company and our report dated February 28, 2013 expressed an unqualified opinion on those financial statements.
/s/ DELOITTE & TOUCHE LLP
Chicago, Illinois
February 28, 2013
41
Nanosphere, Inc.
Balance Sheets
(dollars in thousands, except per share data)
| | | | | | | | |
| | | As of December 31, | |
| | | 2012 | | | 2011 | |
CURRENT ASSETS: | | | | | | | | |
Cash and cash equivalents | | $ | 33,139 | | | $ | 39,273 | |
Accounts receivable | | | 1,027 | | | | 861 | |
Inventories | | | 7,326 | | | | 2,325 | |
Other current assets | | | 284 | | | | 248 | |
| | | | | | | | |
Total current assets | | | 41,776 | | | | 42,707 | |
| | |
PROPERTY AND EQUIPMENT — Net | | | 2,872 | | | | 4,522 | |
INTANGIBLE ASSETS — Net of accumulated amortization | | | 2,733 | | | | 3,033 | |
OTHER ASSETS | | | 76 | | | | 75 | |
| | | | | | | | |
TOTAL ASSETS | | $ | 47,457 | | | $ | 50,337 | |
| | | | | | | | |
CURRENT LIABILITIES: | | | | | | | | |
Accounts payable | | $ | 2,446 | | | $ | 1,794 | |
Accrued compensation | | | 899 | | | | 342 | |
Other current liabilities | | | 1,880 | | | | 1,842 | |
| | | | | | | | |
Total current liabilities | | | 5,225 | | | | 3,978 | |
LONG-TERM LIABILITIES: | | | | | | | | |
Other noncurrent liabilities | | | — | | | | 750 | |
| | | | | | | | |
Total liabilities | | | 5,225 | | | | 4,728 | |
| | |
COMMITMENTS AND CONTINGENCIES | | | | | | | | |
| | |
STOCKHOLDERS’ EQUITY: | | | | | | | | |
Common stock, $0.01 par value; 100,000,000 shares authorized; 56,090,437 shares and 44,070,437 shares issued and outstanding as of December 31, 2012 and 2011, respectively | | | 561 | | | | 441 | |
Preferred stock, $0.01 par value; 10,000,000 shares authorized; no shares issued | | | — | | | | — | |
Additional paid-in capital | | | 388,868 | | | | 359,493 | |
Warrants to acquire common stock | | | 992 | | | | 992 | |
Accumulated deficit | | | (348,189 | ) | | | (315,317 | ) |
| | | | | | | | |
Total stockholders’ equity | | | 42,232 | | | | 45,609 | |
| | | | | | | | |
TOTAL LIABILITIES AND STOCKHOLDERS’ EQUITY | | $ | 47,457 | | | $ | 50,337 | |
| | | | | | | | |
See notes to financial statements.
42
Nanosphere, Inc.
Statements of Operations
(dollars and shares in thousands, except per share data)
| | | | | | | | | | | | |
| | | Years Ended December 31, | |
| | | 2012 | | | 2011 | | | 2010 | |
REVENUE: | | | | | | | | | | | | |
| | | |
Product sales | | $ | 5,034 | | | $ | 2,433 | | | $ | 1,416 | |
Grant and contract revenue | | | 44 | | | | 100 | | | | 610 | |
| | | | | | | | | | | | |
Total revenue | | | 5,078 | | | | 2,533 | | | | 2,026 | |
COSTS AND EXPENSES: | | | | | | | | | | | | |
Cost of sales | | | 3,541 | | | | 1,820 | | | | 2,597 | |
Research and development | | | 17,552 | | | | 20,013 | | | | 18,821 | |
Sales, general, and administrative | | | 16,890 | | | | 16,154 | | | | 22,007 | |
| | | | | | | | | | | | |
Total costs and expenses | | | 37,983 | | | | 37,987 | | | | 43,425 | |
| | | | | | | | | | | | |
Loss from operations | | | (32,905 | ) | | | (35,454 | ) | | | (41,399 | ) |
OTHER INCOME (EXPENSE): | | | | | | | | | | | | |
Foreign exchange gain (loss) | | | (8 | ) | | | (13 | ) | | | 4 | |
U.S. Treasury grant | | | — | | | | — | | | | 978 | |
Interest expense | | | (13 | ) | | | — | | | | (274 | ) |
Interest income | | | 54 | | | | 48 | | | | 79 | |
| | | | | | | | | | | | |
Total other income (expense) | | | 33 | | | | 35 | | | | 787 | |
| | | | | | | | | | | | |
NET LOSS | | $ | (32,872 | ) | | $ | (35,419 | ) | | $ | (40,612 | ) |
| | | | | | | | | | | | |
Net loss per common share — basic and diluted | | $ | (0.67 | ) | | $ | (0.94 | ) | | $ | (1.46 | ) |
Weighted average number of common shares outstanding — basic and diluted | | | 49,193 | | | | 37,800 | | | | 27,755 | |
See notes to financial statements.
43
Nanosphere, Inc.
Statements of Stockholders’ Equity
(dollars and shares in thousands)
| | | | | | | | | | | | | | | | | | | | | | | | |
| | | | | | | | | | | | Warrants | | | | | | | |
| | | | | | | | | Additional | | | To Acquire | | | | | | | |
| | | Common Stock | | | Paid-In | | | Common | | | Accumulated | | | | |
| | | Shares | | | Par Value | | | Capital | | | Stock | | | Deficit | | | Total | |
BALANCE — January 1, 2010 | | | 28,422 | | | $ | 284 | | | $ | 312,660 | | | $ | 5,424 | | | $ | (239,286 | ) | | $ | 79,082 | |
| | | | | | |
Share-based compensation | | | — | | | | — | | | | 6,019 | | | | — | | | | — | | | | 6,019 | |
Exercise of stock options on common stock | | | 9 | | | | — | | | | 35 | | | | — | | | | — | | | | 35 | |
Forfeiture of restricted stock | | | (22 | ) | | | — | | | | — | | | | — | | | | — | | | | — | |
Net loss | | | | | | | | | | | | | | | | | | | (40,612 | ) | | | (40,612 | ) |
| | | | | | | | | | | | | | | | | | | | | | | | |
BALANCE — December 31, 2010 | | | 28,409 | | | | 284 | | | | 318,714 | | | | 5,424 | | | | (279,898 | ) | | | 44,524 | |
| | | | | | |
Share-based compensation | | | 29 | | | | — | | | | 4,411 | | | | — | | | | — | | | | 4,411 | |
Issuance of common stock from public offering, net of offering expenses | | | 15,686 | | | | 157 | | | | 32,021 | | | | — | | | | — | | | | 32,178 | |
Forfeiture of restricted stock | | | (54 | ) | | | — | | | | (85 | ) | | | — | | | | — | | | | (85 | ) |
| | | | | | |
Expiration of warrants to acquire common stock | | | — | | | | — | | | | 4,432 | | | | (4,432 | ) | | | | | | | — | |
Net loss | | | | | | | | | | | | | | | | | | | (35,419 | ) | | | (35,419 | ) |
| | | | | | | | | | | | | | | | | | | | | | | | |
BALANCE — December 31, 2011 | | | 44,070 | | | | 441 | | | | 359,493 | | | | 992 | | | | (315,317 | ) | | | 45,609 | |
| | | | | | |
Share-based compensation | | | — | | | | — | | | | 2,531 | | | | — | | | | — | | | | 2,531 | |
Issuance of common stock from public offering, net of offering expenses | | | 12,075 | | | | 121 | | | | 26,843 | | | | | | | | | | | | 26,964 | |
Forfeiture of restricted stock | | | (55 | ) | | | (1 | ) | | | 1 | | | | — | | | | — | | | | — | |
Net loss | | | — | | | | — | | | | — | | | | — | | | | (32,872 | ) | | | (32,872 | ) |
| | | | | | | | | | | | | | | | | | | | | | | | |
BALANCE — December 31, 2012 | | | 56,090 | | | $ | 561 | | | $ | 388,868 | | | $ | 992 | | | $ | (348,189 | ) | | $ | 42,232 | |
| | | | | | | | | | | | | | | | | | | | | | | | |
See notes to financial statements.
44
Nanosphere, Inc.
Statements of Cash Flows
(dollars in thousands)
| | | | | | | | | | | | |
| | | Years Ended December 31, | |
| | | 2012 | | | 2011 | | | 2010 | |
CASH FLOWS FROM OPERATING ACTIVITIES: | | | | | | | | | | | | |
Net loss | | $ | (32,872 | ) | | $ | (35,419 | ) | | $ | (40,612 | ) |
Adjustments to reconcile net loss to net cash used in operating activities: | | | | | | | | | | | | |
Depreciation and amortization | | | 2,503 | | | | 2,667 | | | | 3,343 | |
Amortization of financing costs and accretion of debt discount | | | — | | | | — | | | | 119 | |
Loss from write-off of intangible assets | | | — | | | | — | | | | 292 | |
Loss from disposal of fixed assets | | | — | | | | 28 | | | | 21 | |
Share-based compensation | | | 2,531 | | | | 4,411 | | | | 6,019 | |
Changes in operating assets and liabilities: | | | | | | | | | | | | |
Accounts receivable | | | (166 | ) | | | (663 | ) | | | 537 | |
Inventories | | | (4,786 | ) | | | (1,163 | ) | | | (865 | ) |
Other current assets | | | (36 | ) | | | 425 | | | | (318 | ) |
Accounts payable | | | 652 | | | | (1,547 | ) | | | 1,036 | |
Accrued and other current liabilities | | | 445 | | | | (215 | ) | | | (1,199 | ) |
| | | | | | | | | | | | |
Net cash used in operating activities | | | (31,729 | ) | | | (31,476 | ) | | | (31,627 | ) |
| | | | | | | | | | | | |
CASH FLOWS FROM INVESTING ACTIVITIES: | | | | | | | | | | | | |
Purchases of property and equipment | | | (744 | ) | | | (622 | ) | | | (710 | ) |
Investments in intangible assets | | | (25 | ) | | | — | | | | (865 | ) |
Other | | | — | | | | — | | | | 23 | |
| | | | | | | | | | | | |
Net cash used in investing activities | | | (769 | ) | | | (622 | ) | | | (1,552 | ) |
| | | | | | | | | | | | |
CASH FLOWS FROM FINANCING ACTIVITIES: | | | | | | | | | | | | |
Repayment of long-term debt | | | — | | | | — | | | | (3,917 | ) |
Proceeds from the issuance of common stock, net of offering expenses | | | 26,964 | | | | 32,178 | | | | — | |
Payments for restricted stock net settled upon vesting | | | — | | | | (85 | ) | | | — | |
Proceeds from stock option exercises | | | — | | | | — | | | | 35 | |
Payment of noncurrent liability | | | (600 | ) | | | (350 | ) | | | — | |
| | | | | | | | | | | | |
Net cash (used in) provided by financing activities | | | 26,364 | | | | 31,743 | | | | (3,882 | ) |
| | | | | | | | | | | | |
NET (DECREASE) INCREASE IN CASH AND CASH EQUIVALENTS | | | (6,134 | ) | | | (355 | ) | | | (37,061 | ) |
CASH AND CASH EQUIVALENTS — Beginning of year | | | 39,273 | | | | 39,628 | | | | 76,689 | |
| | | | | | | | | | | | |
CASH AND CASH EQUIVALENTS — End of year | | $ | 33,139 | | | $ | 39,273 | | | $ | 39,628 | |
| | | | | | | | | | | | |
NONCASH INVESTING AND FINANCING ACTIVITIES: | | | | | | | | | | | | |
License costs capitalized and included in other current liabilities | | $ | — | | | $ | — | | | $ | 350 | |
License costs capitalized and included in other noncurrent liabilities | | | — | | | | — | | | | 1,350 | |
Reclassification of inventory to (from) property and equipment | | | (215 | ) | | | 1,266 | | | | 1,378 | |
See notes to financial statements.
45
Nanosphere, Inc.
Notes to Financial Statements
As of December 31, 2012 and 2011, and
For the years ended December 31, 2012, 2011 and 2010
1. Description of Business
Nanosphere, Inc. (the “Company”) develops, manufactures and markets an advanced molecular diagnostics platform, the Verigene System, that enables simple, low cost, and highly sensitive genomic and protein testing on a single platform.
Basis of Presentation — The accompanying financial statements have been prepared on a going-concern basis, which contemplates the realization of assets and the satisfaction of liabilities in the normal course of business.
2. Liquidity and Capital Resources
The Company has incurred net losses attributable to common stock of $348.2 million since inception, and has funded those losses primarily through the sale and issuance of equity securities and secondarily through the issuance of debt. While the Company is currently in the commercialization stage of operations, the Company has not yet achieved profitability and anticipates that it will continue to incur net losses in the foreseeable future. Management believes that its cash resources should be sufficient to support currently forecasted operations through at least the next twelve months. However, the Company operates in a market that makes its prospects difficult to evaluate, and the Company will need additional debt or equity financing in the future to execute on its current or future business strategies beyond the next twelve months. Management also believes that, if necessary, it can implement plans in the short term to conserve existing cash should additional financing activities be delayed. Capital outlays and operating expenditures may increase over the next twelve months as the Company expands its infrastructure, commercialization, manufacturing, and research and development activities.
3. Summary of Significant Accounting Policies
Cash and Cash Equivalents — The Company considers all highly liquid investments with a maturity of three months or less, at date of purchase, to be cash equivalents. The majority of these funds are held in interest-bearing money market and bank checking accounts. Interest income for all investment accounts is recorded on the accrual basis as earned.
Receivables — Accounts receivable consists of amounts due to the Company for sales of the Verigene system as well as amounts due under various contracts and government grants. An allowance for doubtful accounts is not recorded because the Company has no history of uncollectible receivables and there are no specifically identified uncollectible accounts.
Inventories — Inventories are carried at the lower of cost or market, using the first-in, first-out method. Certain finished goods inventory is ultimately leased rather than sold, and upon the lease date is transferred to Property and equipment and subsequently depreciated to Cost of sales over the period indicated below.
Property and Equipment — Property and equipment are recorded at cost and generally depreciated using the straight-line method over the assets’ estimated useful lives, which are:
| | | | |
Equipment with customers | | | 3-5 years | |
Computers and office equipment | | | 3 years | |
Engineering and laboratory equipment, including tooling | | | 3-5 years | |
Furniture and fixtures | | | 7 years | |
Manufacturing equipment | | | 5-7 years | |
The economic life of the Company’s equipment with customers is based on the original term of the lease, which is typically three years. The Company believes that this is representative of the period during which the instrument is expected to be economically usable.
Assets classified as leasehold improvements are amortized over the shorter of their estimated useful lives or the lease term using the straight-line method. Maintenance and repair costs are expensed as incurred.
46
Nanosphere, Inc.
Notes to Financial Statements — (Continued)
Intangible Assets — Intangible assets are stated at cost less accumulated amortization and consist of purchased intellectual property. Purchased intellectual property represents licenses and is associated with patents owned by third-parties for technologies which are embedded in the Company’s diagnostic instruments and diagnostic test products that the Company licensed in anticipation of sales of such products. Amortization of upfront license fees begins upon the initial use of the licensed technology and is calculated using the straight-line method over the remaining expected lives of the licensed technology, which range from 2.4 years to 14.25 years. Such amortization of upfront license fees is classified in Cost of sales on the statement of operations. Purchased intellectual property also includes purchased patents and patent rights. These patents and patent rights are amortized using a straight-line method over the remaining 7.5 years of the patent, and the amortization expense is classified in research and development expense on the statement of operations.
Deferred Financing Costs — Deferred financing costs of $0.1 million incurred in connection with the Company’s issuance of debt were amortized over the life of the debt using the effective interest rate method with amortization of such costs being charged to interest expense. The deferred financing costs were fully amortized by December 31, 2010.
Impairment of Long-Lived Assets — The Company assesses the recoverability of long-lived assets, including intangible assets, by periodically evaluating the carrying value of such assets whenever events or changes in circumstances indicate that the carrying amount of such assets may not be recoverable. If impairment is indicated, the Company will value the asset at its estimated fair value.
Use of Estimates — The preparation of financial statements in conformity with accounting principles generally accepted in the United States of America requires management to make estimates and assumptions that affect the amounts reported in the financial statements and the notes thereto. The Company’s significant estimates included in the preparation of the financial statements are related to inventories, property and equipment, intangible assets, service revenue and share-based compensation. Actual results could differ from those estimates.
The December 31, 2011 cash flow statement has been corrected to present $0.7 million of cash outflows for the payment of liabilities that arose from the purchase of certain intangible assets as a financing activity rather than an investing activity as the payments were made on a long term basis.
Statement of Operations — The company has no comprehensive income or loss items other than the Net Loss for the years presented.
Revenue Recognition — The Company recognizes revenue from product sales and contract arrangements. The Company recognizes revenue from product sales when there is persuasive evidence that an arrangement exists, delivery has occurred, the price is fixed or determinable and collectability is reasonably assured. Verigene System instrument units are sold outright to customers or leased to customers pursuant to operating leases. The Company recognizes revenue from sales of the Verigene System, including cartridges and related products, when the risks and rewards of ownership are transferred to the customer. The Company evaluates the financial position and payment history for each international distribution partner and recognizes revenue from these distributors only when timely collectability can be reasonably assured. Revenue for Verigene System instrument units sold under operating lease arrangements is recognized on an installment basis over the life of the lease while the cost of the leased equipment is carried on the Company’s balance sheet in Property and equipment and depreciated over its estimated useful life to Cost of sales.
Shipping and handling costs are expensed as incurred and included in Cost of sales. In those cases where the Company bills shipping and handling costs to customers, the amounts billed are classified as product sales.
Grant and government sponsored research revenue and contract revenue related to research and development services are recognized as the related services are performed based on the performance requirements of the relevant contract. Under such agreements, the Company is required to perform specific research and development activities and is compensated either based on the costs or costs plus a mark-up associated with each specific contract over the term of the agreement or when certain milestones are achieved.
The Company’s sales contracts are considered multiple deliverable arrangements because the contract terms provide a fixed price for the sale of the Verigene System and a fixed price for the sale of cartridges over the term of the contract. Under these arrangements, the Company recognized revenue upon delivery of the products and allocates the revenue based on the relative selling price of each deliverable, which is based primarily on vendor specific objective evidence.
Research and Development Costs — Research and development costs, consisting of employee wages and benefits, development materials and equipment and facility costs, are expensed as incurred.
U.S. Treasury Grant — During 2010, the United States Department of the Treasury awarded the Company a grant of approximately $1.0 million for investments in qualifying therapeutic discovery projects under section 48D of the Internal Revenue Code. The proceeds from this grant are classified in “Other income (expense)—U.S. Treasury Grant” on the statement of operations.
Income Taxes — The Company accounts for income taxes, including uncertain tax positions, under the provisions of Financial Accounting Standards Board (“FASB”) Accounting Standards Codification (“ASC”) Topic 740 “Accounting for Income Taxes”. This Topic requires recognition of deferred tax assets and liabilities for the expected future tax consequences of events that have been included in the financial statements or tax returns. Under this method, deferred tax assets and liabilities are determined based on the differences between the financial reporting and tax bases of assets and liabilities using enacted tax rates in effect for the year in which the differences are expected to reverse. An allowance is provided to reduce net deferred tax assets to the amount management believes will, more likely than not, be recovered.
47
Nanosphere, Inc.
Notes to Financial Statements — (Continued)
Share-Based Compensation — The Company recognizes share-based compensation expense related to restricted stock and common stock options issued to employees, consultants and directors. ASC Topic 718 “Stock Compensation” provides for recognition of compensation expense based on the fair value of the stock-based compensation utilizing various assumptions regarding the underlying attributes of the options and stock. The estimated fair value of options granted, net of forfeitures expected to occur during the vesting period, is amortized as compensation expense on a straight-line basis over the service period of the options.
Fair Value of Financial Instruments — The carrying amount of the Company’s financial instruments, including cash and cash equivalents, accounts receivable and accounts payable approximate their fair values.
Net Loss Per Common Share — Basic and diluted net loss per common share have been calculated in accordance with ASC Topic 260, “Earnings Per Share” , for the years ended December 31, 2012, 2011 and 2010. As the Company had a net loss in each of the periods presented, basic and diluted net loss per common share are the same.
The computation of basic net loss per common share for the years ended December 31, 2012, 2011 and 2010 excluded 299,000 shares, 354,000 shares and 650,000 shares of restricted stock, respectively (see Note 6). While these restricted shares of stock are included in outstanding shares on the balance sheet at December 31, 2012 and 2011, these restricted shares are excluded from basic net loss per common share in accordance with ASC Topic 260 due to the forfeiture provisions associated with these shares.
The computations of diluted net loss per common share for the years ended December 31, 2012, 2011 and 2010 did not include the outstanding shares of restricted stock as well as the effects of the following options to acquire common stock and common stock warrants as the inclusion of these securities would have been antidilutive:
| | | | | | | | | | | | |
| | | Year ended December 31, | |
| | | 2012 | | | 2011 | | | 2010 | |
Restricted stock | | | 299,000 | | | | 354,000 | | | | 650,000 | |
Stock options | | | 5,999,875 | | | | 4,663,760 | | | | 4,208,830 | |
Common stock warrants | | | 164,925 | | | | 164,925 | | | | 1,300,119 | |
| | | | | | | | | | | | |
| | | 6,463,800 | | | | 5,182,685 | | | | 6,158,949 | |
| | | | | | | | | | | | |
4. Intangible Assets
Intangible assets, consisting of purchased intellectual property, as of December 31, 2012 and 2011 comprise the following (in thousands):
| | | | | | | | | | | | | | | | | | | | | | | | |
| | | December 31, 2012 | | | December 31, 2011 | |
| | | Cost | | | Accumulated
Amortization | | | Net | | | Cost | | | Accumulated
Amortization | | | Net | |
Intellectual property — licenses | | $ | 4,061 | | | $ | (1,660 | ) | | $ | 2,401 | | | $ | 4,036 | | | $ | (1,392 | ) | | $ | 2,644 | |
Patents | | | 455 | | | | (123 | ) | | | 332 | | | | 455 | | | | (66 | ) | | | 389 | |
| | | | | | | | | | | | | | | | | | | | | | | | |
| | $ | 4,516 | | | $ | (1,783 | ) | | $ | 2,733 | | | $ | 4,491 | | | $ | (1,458 | ) | | $ | 3,033 | |
| | | | | | | | | | | | | | | | | | | | | | | | |
On July 9, 2010, the Company executed a worldwide non-exclusive license agreement (“the License Agreement”) for a fee of $1,850,000 to utilize certain patented technology believed by the Company to be useful in the manufacture of certain of its current and future products. Under the terms of the License Agreement, the Company will pay a license and technology transfer fee, payable in four installments. The license fee is reflected in “Intangible Assets — Net of accumulated amortization” in the balance sheet and amounts as of December 31, 2012 and 2011 were $1,663,000 and $1,813,000, respectively. The first installment of $165,000, including a $15,000 of technology transfer fee, was paid upon the execution of the License Agreement. The second installment of $350,000 was paid on July 9, 2011. The third installment of $600,000 was paid on July 9, 2012. The final installment of $750,000 is payable July 9, 2013, and is reflected in “Current Liabilities – Other Current Liabilities” on the balance sheet as of December 31, 2012. These fees represent full payment for use of the licensed patents during the term of the License Agreement, which ends on the expiration date of the last patent issued and licensed under the License Agreement.
48
Nanosphere, Inc.
Notes to Financial Statements — (Continued)
The Company acquired patents and patent rights from Eppendorf AG on August 18, 2010. See Note 10.
Amortization expense for intangible assets was $0.3 million, $0.2 million and $0.5 million for the years ended December 31, 2012, 2011 and 2010, respectively. Estimated future amortization expense is as follows (in thousands):
| | | | |
Years Ending December 31 | | | |
2013 | | $ | 325 | |
2014 | | | 325 | |
2015 | | | 320 | |
2016 | | | 307 | |
2017 | | | 291 | |
Thereafter | | $ | 1,165 | |
Licenses are amortized from the date of initial use of the licensed technology and such amortization continues over the remaining life of the license. The future amortization expense reflected above is based on licenses for which the licensed technology is being used as of December 31, 2012. The amortization period related to $1.8 million of licenses began in the fourth quarter 2011 when the Company began using the licensed technology. During the year ended December 31, 2010, the Company wrote off capitalized license fees of $0.3 million associated with licenses which the Company did not plan to utilize in the Verigene System. There were no license costs written off in the years ended December 31, 2012 and 2011.
5. Related Party Transactions
Dr. Chad Mirkin, a co-founder of the Company, provides contracted research and development services to the Company and is reimbursed for these services based upon negotiated contract rates. The Company incurred expenses of $0.1 million for these services in each of the years ended December 31, 2012, 2011 and 2010.
Lurie Investment Fund, LLC, a 5% stockholder of the Company, purchased 1,000,000 shares of the Company’s common stock at $2.40 per share in the Company’s July 2012 underwritten public offering on the same terms and conditions as all non-affiliate investors in the offering. Mark Slezak, who was a director of the Company, was the managing member of Lurie Investment Fund, LLC in July 2012.
Alpha-Tech, LLC, a 5% stockholder of the Company, and Anda-Proquest, LLC, an affiliate of Alpha-Tech, LLC, purchased 1,350,000 shares each of the Company’s common stock at $2.20 per share in the Company’s May 2011 underwritten public offering on the same terms and conditions as all non-affiliate investors in the offering. Mark Slezak, who was a director of the Company, was the managing member of Alpha-Tech, LLC and Anda-Proquest, LLC in May 2011.
6. Equity Incentive Plans
The Company’s 2000 Equity Incentive Plan, as amended (the “2000 Plan”), permitted the grant of options to employees, founders, and consultants for up to 1,600,000 shares of common stock. Option awards are generally granted with an exercise price equal to the fair value of the Company’s common stock at the date of grant; those option awards have various vesting structures and have 10 year contractual terms. In connection with the approval of the 2007 Plan as defined below, the Company terminated the 2000 Plan and therefore, the Company may not make any further awards of options, share appreciations rights or restricted shares under the 2000 Plan.
In March 2007, the Company’s board of directors adopted and its shareholders approved the Nanosphere 2007 Long-Term Incentive Plan (the “2007 Plan”). The 2007 Plan authorizes the grant of stock options, share appreciation rights, restricted shares, restricted share units, unrestricted shares, incentive stock options, deferred share units and performance awards. The total awards originally authorized under the 2007 Plan was 4,106,009 shares, plus up to an additional 773,591 shares of common stock that will become available in the event that awards made under the 2000 Plan expire, are forfeited or cancelled, plus an annual increase in the number of shares pursuant to the evergreen provision equal to the least of: 900,000 shares of common stock; 4.0% of the Company’s outstanding shares of common stock as of fiscal year end; and an amount determined by the board of directors. Pursuant to the evergreen provision, an additional 900,000 shares of common stock were authorized for issuance under the 2007 Plan as of January 1, 2010, 2011 and 2012.
Certain options vest ratably over four years of service, while other options vest after seven years of service but provide for accelerated vesting contingent upon the achievement of various company-wide performance goals, such as decreasing time to market for new products and entering into corporate collaborations (as defined in the option grant agreements). For these “accelerated vesting” options, 20-25% of the granted option shares will vest upon the achievement of each of four or five milestones as defined in the option grant agreements, with any remaining unvested options vesting on the seven year anniversary of the option grant dates.
49
Nanosphere, Inc.
Notes to Financial Statements — (Continued)
Approximately 27% of the options granted and outstanding contain “accelerated vesting” provisions. The service period over which compensation expense is recognized for options which include the accelerated vesting provision is the shorter of the seven year cliff term or the projected timeframe for achieving the company-wide performance goals.
The weighted average grant date fair value of options in 2012, 2011 and 2010 was $1.41, $4.04 and $3.55, respectively. The fair values of the Company’s option awards were estimated at the dates of grant using the Black-Scholes option pricing model with the following assumptions:
| | | | | | | | | | | | |
| | | 2012 | | | 2011 | | | 2010 | |
Expected dividend yield | | | 0 | % | | | 0 | % | | | 0 | % |
Expected volatility | | | 92 | % | | | 90 | % | | | 100 | % |
Risk free interest rate | | | 1.06 | % | | | 1.32 | % | | | 2.46 | % |
Weighted-average expected option life | | | 6.1 years | | | | 5.3 years | | | | 6.1 years | |
Estimated weighted-average fair value on the date of grant based on the above assumptions | | $ | 1.39 | | | $ | 1.28 | | | $ | 3.99 | |
Estimated forfeiture rate for unvested options | | | 4.9 | % | | | 0.4 | % | | | 11.9 | % |
The expected volatility for option awards granted during 2010, 2011 and 2012 was based on the Company’s actual historical volatility. The risk-free rate is based on the U.S. Treasury yield curve in effect at the time of the grants for periods consistent with the expected life of the option. The expected life of options that vest ratably over four years of service is derived from the average of the vesting period and the term of the option as defined in the Plans, following the guidance in Securities and Exchange Commission (“SEC”) Staff Accounting Bulletin Nos. 107 and 110. The Company estimates the expected life of options with accelerated vesting terms giving consideration to the dates that the Company expects to achieve key milestones under the option agreements and the term of the option. Total compensation cost associated with the option awards was $2.1 million, $3.0 million and $4.5 million in 2012, 2011 and 2010, respectively.
As of December 31, 2012, the total compensation cost not yet recognized related to the nonvested awards is approximately $3.1 million, which amount is expected to be recognized over the next 1.7 years, which is a weighted average term. Certain milestone events are deemed probable of achievement prior to their seven year vesting term, and the acceleration of vesting resulting from the achievement of such milestone events has been factored into the weighted average vesting term. While the Company does not have a formally established policy, as a practice the Company has delivered newly issued shares of its common stock upon the exercise of stock options.
A summary of option activity under the Plan as of December 31, 2012, and for the year then ended is presented below:
| | | | | | | | | | | | | | | | |
Options | | Number of
Shares | | | Weighted
Average
Exercise
Price | | | Weighted
Average
Remaining
Contractual
Term | | | Aggregate
Intrinsic
Value of Options | |
Outstanding — January 1, 2012 | | | 4,663,760 | | | $ | 5.09 | | | | | | | | | |
Granted | | | 1,854,907 | | | $ | 1.84 | | | | | | | | | |
Exercised | | | — | | | $ | — | | | | | | | | | |
Expired | | | (323,635 | ) | | $ | 6.55 | | | | | | | | | |
Forfeited | | | (195,157 | ) | | $ | 5.61 | | | | | | | | | |
| | | | | | | | | | | | | | | | |
Outstanding — December 31, 2012 | | | 5,999,875 | | | $ | 3.99 | | | | 6.63 | | | $ | 2,569,117 | |
| | | | | | | | | | | | | | | | |
Exercisable — December 31, 2012 | | | 3,221,463 | | | $ | 4.82 | | | | 5.55 | | | $ | 709,113 | |
| | | | | | | | | | | | | | | | |
Vested and Expected to Vest — December 31, 2012 | | | 5,872,068 | | | $ | 4.01 | | | | 6.60 | | | $ | 2,483,557 | |
| | | | | | | | | | | | | | | | |
The intrinsic value of options exercised in 2011 and 2010 was less than $0.1 million.
Included in the number of options outstanding at December 31, 2012, are 1,610,386 options with a weighted average exercise price of $5.21 per share that have accelerated vesting provisions based on the criteria mentioned above. As of December 31, 2012, 48% of all outstanding options with accelerated vesting provisions was vested. The total fair value of option shares vested during 2012, 2011 and 2010 was $2.7 million, $2.9 million and $2.0 million, respectively.
50
Nanosphere, Inc.
Notes to Financial Statements — (Continued)
In November 2009, the Company granted 672,500 shares of restricted stock under the 2007 Plan, of which 50% vested on the two-year anniversary of the grant date and were subject to forfeiture until vested, and 50% will vest on the four-year anniversary of the grant date and are subject to forfeiture until vested. The weighted average grant-date fair value was $6.06 per share. During fiscal 2011, the Company granted 29,000 shares of restricted stock under the 2007 Plan, of which 50% vest on the two-year anniversary of the grant date and are subject to forfeiture until vested, and 50% vest on the four-year anniversary of the grant date and are subject to forfeiture until vested. The weighted average grant-date fair value was $4.02 per share. During fiscal 2011, 325,000 shares of restricted stock vested and 53,069 shares of restricted stock were forfeited. The total fair value of restricted stock shares that vested was $2.0 million during 2011 and there were no shares of restricted stock that vested in 2012 and 2010. During fiscal 2012, 55,000 shares of restricted stock were forfeited. The Company recognized $0.5 million, $1.4 million and $1.5 million in compensation expense associated with the restricted stock during 2012, 2011 and 2010, respectively. As of December 31, 2012, the total compensation cost not yet recognized related to the nonvested restricted stock awards is approximately $0.4 million, which amount is expected to be recognized over a weighted average term of approximately 1 year.
7. Income Taxes
Deferred tax assets consist primarily of net operating loss (“NOL”) carryforwards related to U.S. federal and state taxes and research and development tax credits. Realization of future tax benefits related to deferred tax assets is dependent on many factors, including the Company’s ability to generate future taxable income. Due to the Company’s history of operating losses, the Company has recorded a full valuation allowance against these assets.
NOL carryforwards of approximately $250 million for income tax purposes are available to offset future taxable income. If not used, these carryforwards will expire in varying amounts from 2020 through 2031. The Company also has federal research and development tax credit carryforwards of $10.3 million which will expire from 2020 through 2031. Section 382 of the Internal Revenue Code subjects the utilization of net operating loss and credit carryforwards to an annual limitation that is applicable if the Company experiences an ownership change. The Company believes its public offerings and/or prior equity investments may have triggered an ownership change as defined by the Internal Revenue Code. However, the Company has yet to perform the computations under Section 382 which would determine the amount of annual limitation on its utilization of its net operating loss and tax credit carryforwards. The annual limitation may result in the expiration of the Company’s net operating loss and tax credit carryforwards before they can be used.
The following is a summary of the components of the Company’s deferred tax assets and liabilities as of December 31, 2012 and 2011 (in thousands):
| | | | | | | | |
| | | 2012 | | | 2011 | |
Deferred tax assets: | | | | | | | | |
Net operating losses | | $ | 100,836 | | | $ | 88,229 | |
Research and development credits | | | 10,276 | | | | 10,276 | |
Share-based compensation | | | 2,571 | | | | 2,294 | |
Amortization of intangible assets | | | 1,145 | | | | 1,179 | |
Other | | | 405 | | | | 262 | |
| | | | | | | | |
| | | 115,233 | | | | 102,240 | |
Valuation allowance | | | (115,056 | ) | | | (101,995 | ) |
| | | | | | | | |
Net deferred tax assets after valuation allowance | | | 177 | | | | 245 | |
Deferred tax liabilities: | | | | | | | | |
Depreciation on property and equipment | | | (177 | ) | | | (245 | ) |
| | | | | | | | |
Deferred tax assets — net | | $ | — | | | $ | — | |
| | | | | | | | |
The reconciliation of the federal statutory rate to the Company’s effective tax rate of zero percent for the years ended December 31, 2012, 2011 and 2010 is as follows:
| | | | | | | | | | | | |
| | | Years Ended December 31, | |
| | | 2012 | | | 2011 | | | 2010 | |
Tax provision at the statutory federal rate | | | 34.0 | % | | | 34.0 | % | | | 34.0 | % |
State income taxes, net of federal income tax benefit | | | 6.3 | % | | | 6.3 | % | | | 4.8 | % |
Other | | | (1.4 | )% | | | (8.1 | )% | | | (6.7 | )% |
Valuation allowance | | | (38.9 | )% | | | (32.2 | )% | | | (32.1 | )% |
| | | | | | | | | | | | |
| | | 0.0 | % | | | 0.0 | % | | | 0.0 | % |
| | | | | | | | | | | | |
51
Nanosphere, Inc.
Notes to Financial Statements — (Continued)
As of December 31, 2012 and 2011, the Company had no liability recorded for unrecognized tax benefits. The Company classifies penalties and interest expense related to income tax liabilities as an income tax expense. There were no interest and penalties recognized in the statements of operations for the years ended December 31, 2012, 2011 and 2010 or accrued on the balance sheets as of December 31, 2012 and 2011.
The Company files tax returns in the U.S. and various states. All tax years since 1999 remain open to examination by the major taxing jurisdictions to which the Company is subject. The Company has not made any cash payments for income taxes since its inception.
8. License Agreements
In 2006, the Company entered into a license agreement with Northwestern University (“Northwestern”), which provides the Company with an exclusive license to certain existing patents and patent applications owned by Northwestern and future inventions developed by Northwestern that are related to (1) nanotechnology, which technology involves a particle where no single dimension is greater than 100 nanometers, or Nanotechnology, and (2) biobarcode technology, which is analysis where oligonucleotides act as surrogate targets or reporter molecules, or Biobarcode Technology. The license is limited to discoveries in the “Biodiagnostics Field” defined as qualitative or quantitative in vitro analysis, testing, measurement, or detection of various biodiagnostics field subjects and target combinations through January 1, 2013. Thereafter, the license provides that we continue to have the first right to an exclusive license for all discoveries the International Institute for Nanotechnology at Northwestern develops in the field of biodiagnostics, however, the economic terms are to be negotiated in good faith by both parties.
The Company has entered into several nonexclusive license agreements with various companies covering certain technologies which are embedded in the Company’s diagnostic instruments and diagnostic test products. As of December 31, 2012, the Company has paid aggregate initial license fees of $3.8 million for these licenses, and has agreed to pay a percentage of net sales as royalties, in percentage amounts ranging from less than 1% to 12.0%. Royalties on net sales are classified in Cost of sales. Certain of the license agreements have minimum annual royalty payments, and such minimum payments are $0.2 million in each of the fiscal years 2013, 2014 and 2015 and are $0.1 million annually thereafter through the dates the respective licenses terminate. These licenses expire at various times, corresponding to the subject patents expirations, which currently range from 2015 to 2027.
9. Stockholders’ Equity
Common Stock
During 2007, the Company closed on the sale of 8,050,000 shares related to the initial public offering at $14.00 per share, less underwriting discounts and commissions. Net proceeds from the initial public offering were approximately $102 million, net of transaction expenses. Approximately $0.8 million of the transaction expenses were paid in 2008.
The Company completed an underwritten public offering of 5,405,000 shares of common stock on October 21, 2009 at a public offering price of $7.00 per share, less underwriting discounts and commissions. Net proceeds from the public offering were approximately $35.4 million.
The Company completed an underwritten public offering of 15,686,000 shares of common stock on May 13, 2011 at a public offering price of $2.20 per share, less underwriting discounts and commissions. Net proceeds from the public offering were approximately $32.2 million.
The Company completed an underwritten public offering of 12,075,000 shares of common stock on July 19, 2012 at a public offering price of $2.40 per share, less underwriting discounts and commissions. Net proceeds from the public offering were approximately $27.0 million.
Registration Rights
Pursuant to an agreement between the Company and certain of its stockholders, the Company had granted the following demand registration rights to Mr. Mark Slezak, who is a former member of the Company’s board of directors, AOQ Trust, Alfa-Tech, LLC, Lurie Investment Fund, LLC, Lurie Investments, Inc. and their respective affiliates, and Bain Capital Venture Fund 2005, L.P., Brookside Capital Partners Fund, L.P., and their respective affiliates and other stockholders. Mr. William P. Moffitt, III, the Company’s former chief executive officer and a former member of the board of directors, and Dr. Chad Mirkin, a member of the board of directors, are parties to this agreement, but do not have the right to demand registration. At any time after the earlier to occur of (1) 120 days after the closing of an initial public offering, which occurred on November 6, 2007, or (2) April 1, 2010:
| | • | Long-Form Registrations. Stockholders holding at least 20% of the then outstanding shares of the Company’s common stock that are subject to the registration rights agreement, which are referred to as registrable securities, have the right to demand that the Company file a registration statement under the Securities Act on Form S-1 or any similar long-form registration covering their registrable securities. However, the Company is not obligated to file a long-form registration statement on more than three occasions upon the request of the stockholders. |
52
Nanosphere, Inc.
Notes to Financial Statements — (Continued)
| | • | Short-Form Registrations. Stockholders holding at least 10% of the then outstanding registrable securities have the right to demand that the Company file a registration statement on Form S-3 or any similar short-form registration covering their registrable securities, provided that such short-form registration is then available to the Company under applicable law. Such stockholders are entitled to request an unlimited number of short-form registrations. |
If the Company’s board of directors believes in its reasonable good faith that any demand registration would require premature disclosure of a proposal or plan that the Company intends to undertake, and such disclosure would have a material adverse effect on the Company, then it may delay the registration once in any twelve month period for up to 90 days. Moreover, if the demand registration is an underwritten offering, the Company may reduce the number of shares of registrable securities to be registered upon the advice of the underwriters that such offering exceeds the number of securities that can be sold in an orderly manner within an acceptable price range. If shares of the Company’s common stock requested to be included in a registration must be excluded pursuant to the underwriters’ advice, the Company will generally register a pro rata portion of the shares requested to be registered.
Under the piggyback registration provisions, if the Company proposes to register any securities under the Securities Act, other than pursuant to a demand registration, and the registration form to be used may be used for the registration of registrable securities, stockholders holding such registrable securities have the right to include their shares in the registration statement. However, if the registration is an underwritten offering, the Company may reduce the number of shares to be registered under the piggyback registration provisions upon the advice of the underwriters that such offering exceeds the number of securities that can be sold in an orderly manner within an acceptable price range. If shares of the Company’s common stock requested to be included in a registration must be excluded pursuant to the underwriters’ advice, the Company will generally register a pro rata portion of the shares requested to be registered under the piggyback registration provisions. The piggyback registration rights granted under the registration rights agreement have no expiration date.
Expenses of Registration. The Company will generally pay all registration expenses in connection with the demand and piggyback registrations described above, including all registration and filing fees, expenses and fees of compliance with securities laws, and fees and disbursements of all counsel, independent certified public accountants, underwriters (excluding discounts and commissions) and other persons retained by the Company. The Company will also pay the reasonable fees and disbursements of one counsel chosen by the selling stockholders in each demand or piggyback registration.
Transferability. The demand and piggyback registration rights described above are generally transferable to any subsequent holder of registrable securities.
Warrants
Prior to the completion of the Company’s initial public offering, the Company issued warrants to purchase shares of convertible preferred stock in connection with certain of the convertible preferred stock financings. Certain of these warrants were converted to common stock warrants upon the closing of the initial public offering. As of December 31, 2010 there were outstanding warrants to acquire shares of common stock of 1,300,119. In April 2011, 1,135,194 warrants expired. As of December 31, 2011 and 2012, there were outstanding warrants to acquire shares of common stock of 164,925. The exercise price of the warrants outstanding at December 31, 2012 is $8.75 and such warrants expire in April 2013.
10. Commitments and Contingencies
In August 2009, the Company executed a lease renewal which commenced in June 2011 and ends in May 2014. Under the terms of the lease renewal, the Company has two successive three year options to renew the lease, and the Company has the right of first refusal to lease additional space within the facility.
Rent and operating expenses associated with the office and laboratory space were $0.6 million, $0.7 million and $0.6 million in 2012, 2011 and 2010, respectively.
53
Nanosphere, Inc.
Notes to Financial Statements — (Continued)
Annual future minimum obligations for the operating lease as of December 31, 2012 are as follows (in thousands):
| | | | |
Years Ending December 31 | | Operating
Lease | |
2013 | | $ | 463 | |
2014 | | | 195 | |
| | | | |
Total minimum lease payments | | $ | 658 | |
| | | | |
In July 2009, the Company was named as a defendant in a lawsuit filed in the United States District Court for the District of Delaware by Eppendorf AG alleging infringement of a patent owned by the plaintiff. On August 18, 2010, the Company executed a Settlement Agreement and Intellectual Property Purchase Agreement (the “Settlement and Purchase Agreement”) with Eppendorf AG. The Settlement and Purchase Agreement provides for, among other things, a lump sum payment of $4 million to settle a patent litigation dispute between the companies, the Company’s acquisition from Eppendorf of certain patents and patent rights, and a limited license back to service existing Eppendorf customers and licenses previously issued that relate to the purchased patents and patent rights. Pursuant to the Settlement and Purchase Agreement, the Company paid $4 million to Eppendorf AG during the third quarter of 2010. The Company has allocated $3.5 million of the lump sum payment to settlement expense and $0.5 million to intangible assets for the fair value of the acquired patents and patent rights.
11. Long-Term Debt
In February 2007, the Company entered into two loan and security agreements, with commitments for debt financing with Venture Lending & Leasing IV, Inc., and Venture Lending & Leasing V, Inc. The Company borrowed $12.5 million under these agreements in February 2007. Interest rates under the agreements were 12.5% for the initial twelve month period and 10.0% during the following thirty month period. Notes issued pursuant to this commitment were secured by a first security lien on all of the Company’s assets including intellectual property. This debt matured and was repaid in August 2010.
The $12.5 million of proceeds received were allocated to debt and the Series D Convertible Preferred Stock based on their fair values at the borrowing date with $1.9 million allocated to Series D Convertible Preferred Stock and the remaining $10.6 million allocated to debt. The discount on the debt of $1.9 million resulted in an effective interest rate on the debt of 21% and the discount was amortized as interest expense over the term of the debt following the interest method. Interest expense on this debt for the year ended December 31, 2010 was $0.3 million which included $0.1 million of discount amortization. Cash interest paid on this debt was $0.2 million for the year ended December 31, 2010.
12. Supplemental Financial Information
| | | | | | | | |
Inventories: | | 2012 | | | 2011 | |
| | (in thousands) | |
Raw materials | | $ | 1,910 | | | $ | 1,021 | |
Work-in-process | | | 300 | | | | 64 | |
Finished goods | | | 5,116 | | | | 1,240 | |
| | | | | | | | |
Total | | $ | 7,326 | | | $ | 2,325 | |
| | | | | | | | |
During 2010, the Company established a valuation reserve of $0.7 million for most of the original Verigene System processor inventory. The valuation reserve was $0.7 million as of December 31, 2012 and 2011.
54
Nanosphere, Inc.
Notes to Financial Statements — (Continued)
| | | | | | | | |
Property and Equipment — Net: | | 2012 | | | 2011 | |
| | (in thousands) | |
Equipment with customers | | $ | 2,228 | | | $ | 2,467 | |
Computer equipment and software | | | 944 | | | | 935 | |
Laboratory equipment | | | 6,747 | | | | 6,866 | |
Furniture and fixtures | | | 269 | | | | 269 | |
Leasehold improvements | | | 2,878 | | | | 2,878 | |
Manufacturing equipment | | | 5,031 | | | | 4,561 | |
Office equipment | | | 67 | | | | 67 | |
Tooling | | | 1,462 | | | | 1,461 | |
| | | | | | | | |
Total property and equipment — at cost | | | 19,626 | | | | 19,504 | |
Less accumulated depreciation | | | (16,754 | ) | | | (14,982 | ) |
| | | | | | | | |
Property and Equipment — Net | | $ | 2,872 | | | $ | 4,522 | |
| | | | | | | | |
| | |
Other Current Liabilities: | | 2012 | | | 2011 | |
| | (in thousands) | |
Accrued clinical trial expenses | | $ | 205 | | | $ | 292 | |
Accrued license fees | | | 855 | | | | 632 | |
All other | | | 820 | | | | 918 | |
| | | | | | | | |
Total | | $ | 1,880 | | | $ | 1,842 | |
| | | | | | | | |
13. Selected Quarterly Financial Data (Unaudited)
| | | | | | | | | | | | | | | | |
| | | 2012 Quarters | |
| | | (in thousands, except per share data) | |
| | | First | | | Second | | | Third | | | Fourth | |
Total revenue | | $ | 1,299 | | | $ | 1,345 | | | $ | 865 | | | $ | 1,569 | |
Gross profit | | $ | 386 | | | $ | 461 | | | $ | 226 | | | $ | 464 | |
Loss from operations | | $ | (8,074 | ) | | $ | (8,451 | ) | | $ | (8,761 | ) | | $ | (7,619 | ) |
Net loss | | $ | (8,061 | ) | | $ | (8,439 | ) | | $ | (8,749 | ) | | $ | (7,623 | ) |
Per share data: | | | | | | | | | | | | | | | | |
Net loss per common share — basic and diluted | | $ | (0.18 | ) | | $ | (0.19 | ) | | $ | (0.16 | ) | | $ | (0.14 | ) |
| |
| | | 2011 Quarters | |
| | | (in thousands, except per share data) | |
| | | First | | | Second | | | Third | | | Fourth | |
Total revenue | | $ | 640 | | | $ | 509 | | | $ | 556 | | | $ | 828 | |
Gross profit | | $ | 149 | | | $ | 135 | | | $ | 187 | | | $ | 242 | |
Loss from operations | | $ | (8,896 | ) | | $ | (8,439 | ) | | $ | (9,481 | ) | | $ | (8,638 | ) |
Net loss | | $ | (8,889 | ) | | $ | (8,435 | ) | | $ | (9,473 | ) | | $ | (8,622 | ) |
Per share data: | | | | | | | | | | | | | | | | |
Net loss per common share — basic and diluted | | $ | (0.32 | ) | | $ | (0.23 | ) | | $ | (0.22 | ) | | $ | (0.17 | ) |
14. Subsequent Events
On February 8, 2013, Sheli Z. Rosenberg and Michael J. Ward were elected to the Board to fill the vacancies created by the resignations of Mark Slezak and William T. White. Concurrent with her election to the Board, Ms. Rosenberg also was appointed to serve as Chair of the Board. In addition, the Board terminated without cause the employment of William P. Moffitt, III as President and Chief Executive Officer of the Company. Mr. Moffitt tendered his resignation as a member of the Board on February 10, 2013 and Roy N. Davis, an independent board member, tendered his resignation on February 11, 2013.
Also on February 8, 2013, each of the “Lurie Entities” (Lurie Investment Fund, L.L.C., Alfa-Tech, L.L.C., AOQ Trust, ANDA-ProQuest, L.L.C., LFT Partnership, Ann & Robert H. Lurie Foundation, Lurie Investments, Inc. and Ann Lurie) executed a lock-up agreement pursuant to which each of the Lurie Entities has agreed that until February 8, 2014, they shall not sell any shares of the Company’s common stock or transfer ownership of the Company’s common stock.
Also on February 8, 2013, Michael K. McGarrity, the Company’s Vice President of Sales and Marketing and Chief Commercial Officer, was promoted to President and Chief Executive Officer of the Company to succeed Mr. Moffitt. Mr. McGarrity was appointed as a member of the Board on February 10, 2013.
55
Item 9. Changes in and Disagreements With Accountants on Accounting and Financial Disclosure.
We have had no disagreements with our independent registered public accounting firm on any matter of accounting principles or practices or financial statement disclosure.
Item 9A. Controls and Procedures.
(a) Evaluation of Disclosure Controls and Procedures
Management of the Company, with the participation of the Chief Executive Officer and the Chief Financial Officer, evaluated the effectiveness of the design and operation of the Company’s disclosure controls and procedures (as defined in Rules 13a-15(e) and 15d-15(e) of the Securities Exchange Act of 1934, as amended) as of December 31, 2012. The Company’s disclosure controls and procedures are designed to ensure that information required to be disclosed by the Company in the reports it files or submits under the Exchange Act is recorded, processed, summarized and reported on a timely basis and that such information is accumulated and communicated to management, including the Chief Executive Officer and Chief Financial Officer, as appropriate, to allow timely decisions regarding disclosure. Based upon this evaluation, the Chief Executive Officer and the Chief Financial Officer have concluded that the Company’s disclosure controls and procedures were effective as of December 31, 2012.
(b) Management’s Report on Internal Control Over Financial Reporting
Internal control over financial reporting, as such term is defined in Rules 13a-15(f) and 15d-15(f) under the Exchange Act, is a process designed by, or under the supervision of, the Company’s chief executive officer and chief financial officer, or persons performing similar functions, and effected by the Company’s board of directors, management and other personnel, to provide reasonable assurance regarding the reliability of financial reporting and the preparation of financial statements for external purposes in accordance with generally accepted accounting principles. The Company’s management, with the participation of the Company’s chief executive officer and chief financial officer, has established and maintained policies and procedures designed to maintain the adequacy of the Company’s internal control over financial reporting, and includes those policies and procedures that:
| | (1) | Pertain to the maintenance of records that in reasonable detail accurately and fairly reflect the transactions and dispositions of the assets of the Company; |
| | (2) | Provide reasonable assurance that transactions are recorded as necessary to permit preparation of financial statements in accordance with generally accepted accounting principles, and that receipts and expenditures of the Company are being made only in accordance with authorizations of management and directors of the Company; and |
| | (3) | Provide reasonable assurance regarding prevention or timely detection of unauthorized acquisition, use or disposition of the Company’s assets that could have a material effect on the financial statements. |
The Company’s management is responsible for establishing and maintaining adequate internal control over financial reporting, as such term is defined in Exchange Act Rules 13a-15(f). The Company’s management conducted an evaluation of the effectiveness of internal control over financial reporting based on the framework in Internal Control — Integrated Framework issued by the Committee of Sponsoring Organizations of the Treadway Commission. Based on its evaluation under the framework in Internal Control — Integrated Framework , the Company’s management concluded that internal control over financial reporting was effective as of December 31, 2012.
Because of its inherent limitations, internal control over financial reporting may not prevent or detect misstatements. Also, projections of any evaluation of effectiveness to future periods are subject to the risk that controls may become inadequate because of changes in conditions, or that the degree or compliance with the policies or procedures may deteriorate.
The Company’s independent registered public accounting firm, Deloitte & Touche LLP, has issued an attestation report on the Company’s internal control over financial reporting as of December 31, 2012. Their report is included in this Form 10-K.
56
(c) Changes in Internal Controls Over Financial Reporting
There have been no changes to the Company’s internal control over financial reporting during the most recent fiscal quarter that have materially affected, or are reasonably likely to materially affect, the Company’s internal control over financial reporting.
Item 9B. Other Information.
On February 22, 2013, the Company received notification from the NASDAQ Stock Market that the Company was not in compliance with the audit committee composition requirements under NASDAQ Stock Market Rule 5605(c)(2)(A) as a result of the vacancy on the audit committee that has existed since May 30, 2012. In accordance with NASDAQ Stock Market Rule 5605(c)(4)(B), the Company has until the earlier to occur of May 30, 2013 or the Company’s 2013 annual meeting of stockholders to fill the vacancy on the audit committee to regain compliance with Rule 5605(c)(2)(A). On February 28, 2013, at a regularly scheduled meeting of the Company’s board of directors, director Sheli Rosenberg was appointed to fill the vacancy on the audit committee. In addition, director Michael Ward was appointed to fill vacancies on the compensation committee and the corporate governance and nominating committee.
The Company promptly notified the NASDAQ Stock Market of these board committee appointments and received notice from the NASDAQ Stock Market on February 28, 2013 that the Company had regained compliance with NASDAQ Stock Market Rule 5605(c)(2)(A).
The foregoing information is being disclosed under this Item 9B in lieu of disclosure under Item 3.01 of Form 8-K.
57
PART III.
Item 10. Directors and Executive Officers of the Registrant.
The information required by Item 10 will be set forth in the Company’s definitive proxy statement for its annual meeting of shareholders expected to be held on May 29, 2013, and is incorporated herein by reference.
Item 11. Executive Compensation.
The information required by Item 11 will be set forth in the Company’s definitive proxy statement for its annual meeting of shareholders expected to be held on May 29, 2013, and is incorporated herein by reference.
Item 12. Security Ownership of Certain Beneficial Owners and Management and Related Stockholder Matters.
The information required by Item 12 will be set forth in the Company’s definitive proxy statement for its annual meeting of shareholders expected to be held on May 29, 2013, and is incorporated herein by reference.
Item 13. Certain Relationships and Related Transactions, and Director Independence.
The information required by Item 13 will be set forth in the Company’s definitive proxy statement for its annual meeting of shareholders expected to be held on May 29, 2013, and is incorporated herein by reference.
Item 14. Principal Accounting Fees and Services.
The information required by Item 14 will be set forth in the Company’s definitive proxy statement for its annual meeting of shareholders expected to be held on May 29, 2013, and is incorporated herein by reference.
58
PART IV.
Item 15. Exhibits, Financial Statement Schedules.
| (a)(1) | Financial Statements |
Reports of Independent Registered Public Accounting Firm
Balance Sheets as of December 31, 2012 and 2011
Statements of Operations for the years ended December 31, 2012, 2011 and 2010
Statements of Stockholders’ Equity for the years ended December 31, 2012, 2011 and 2010
Statements of Cash Flows for the years ended December 31, 2012, 2011 and 2010
Notes to Financial Statements
| (a)(2) | Financial Statement Schedules |
None
| (a)(3) | Exhibits required by Item 601 of Regulation S-K. |
| | |
Exhibit Number | | Exhibit Description |
| 3.1 | | Second Amended and Restated Certificate of Incorporation of Nanosphere, Inc. (3) (Exhibit 3.1) |
| |
| 3.2 | | Amended and Restated Bylaws of Nanosphere, Inc. (3) (Exhibit 3.2) |
| |
| 4.1 | | Specimen of common stock certificate (4) (Exhibit 4.3) |
| |
| 10.1 | | Nanosphere, Inc. 2000 Equity Incentive Plan (1) (Exhibit 10.1) |
| |
| 10.2 | | Form of Nanosphere, Inc. 2000 Equity Incentive Plan Non-Qualified Stock Option Award Agreement, as amended (1) (Exhibit 10.2) |
| |
| 10.3 | | Form of Nanosphere, Inc. 2000 Equity Incentive Plan Option Award Agreement (1) (Exhibit 10.3) |
| |
| 10.4 | | Nanosphere, Inc. 2007 Long-Term Incentive Plan, as amended and restated (4) (Exhibit 10.4) |
| |
| 10.5 | | Form of Nanosphere, Inc. 2007 Long-Term Incentive Plan Incentive Stock Option Award Agreement (Time Vested) (1) (Exhibit 10.5) |
| |
| 10.6 | | Form of Nanosphere, Inc. 2007 Long-Term Incentive Plan Non-Qualified Stock Option Award Agreement (Time Vested) (1) (Exhibit 10.6) |
| |
| 10.7 | | Form of Nanosphere, Inc. 2007 Long-Term Incentive Plan Option Award Agreement (Cliff-vested, performance-accelerated) (1) (Exhibit 10.7) |
| |
| 10.8 | | Employment Agreement, dated as of July 19, 2004, by and between Nanosphere, Inc. and William P. Moffitt III, as amended (1) (Exhibit 10.8) |
| |
| 10.9 | | Restricted Stock Purchase Agreement, dated as of March 16, 2006, by and between Nanosphere, Inc. and William P. Moffitt III (3) (Exhibit 10.9) |
| |
| 10.10 | | Employment Agreement, dated January 2, 2001, by and between Nanosphere, Inc. and William Cork (4) (Exhibit 10.10) |
| |
| 10.11 | | Employment Agreement, dated May 13, 2005, by and between Nanosphere, Inc. and Gregory Shipp (1) (Exhibit 10.11) |
| |
| 10.12 | | Employment Agreement, dated September 5, 2005, by and between Nanosphere, Inc. and Michael McGarrity (1) (Exhibit 10.12) |
| |
| 10.13 | | Employment Agreement, dated April 25, 2007, by and between Nanosphere, Inc. and J. Roger Moody, Jr. (1) (Exhibit 10.13) |
| |
| 10.14 | | Employment Agreement, dated May 31, 2007, by and between Nanosphere, Inc. and Winton Gibbons (1) (Exhibit 10.14) |
| |
| 10.15 | | Severance Agreement, dated as of June 4, 2007, by and between Nanosphere, Inc. and Stephen Wasko (1) (Exhibit 10.15) |
59
| | |
Exhibit Number | | Exhibit Description |
| 10.16 | | License Agreement, dated as of January 1, 2006, by and between Northwestern University and Nanosphere, Inc. (2)# (Exhibit 10.16) |
| |
| 10.17 | | Non-Exclusive License Agreement, dated as of December 20, 2002, by and between Nanosphere, Inc. and Abbott Laboratories (2)# (Exhibit 10.17) |
| |
| 10.18 | | Lease with Motorola, Inc., dated as of March 24, 2003, as amended (1) (Exhibit 10.18) |
| |
| 10.19 | | Loan and Security Agreement, dated as of February 7, 2007, by and between Nanosphere, Inc. and Venture Lending & Leasing IV, Inc. (1) (Exhibit 10.19) |
| |
| 10.20 | | Loan and Security Agreement, dated as of February 21, 2007, by and between Nanosphere, Inc. and Venture Lending & Leasing V, Inc. (1) (Exhibit 10.20) |
| |
| 10.21 | | Consulting and Non-Competition Agreement, dated as of October 31, 2002, by and between Nanosphere, Inc. and Chad A. Mirkin, as amended (1) (Exhibit 10.21) |
| |
| 10.22 | | Bonus Agreement, dated as of March 16, 2006, by and between Nanosphere, Inc. and William P. Moffitt III, as amended (2) (Exhibit 10.22) |
| |
| 10.23 | | Series D Preferred Stock and Warrant Purchase Agreement, dated as of April 12, 2006 (2) (Exhibit 10.24) |
| |
| 10.24 | | Note Purchase Agreement, dated as of March 15, 2006, by and between Nanosphere, Inc. and Lurie Investment Fund, L.L.C. (2) (Exhibit 10.28) |
| |
| 10.25 | | Form of Indemnification Agreement (3) (Exhibit 10.29) |
| |
| 10.26 | | Non-Exclusive Financial Advisory Services Engagement Letter, dated as of August 8, 2007, by and between Nanosphere, Inc. and Allen & Company LLC (4) (Exhibit 10.30) |
| |
| 10.27 | | Amended and Restated Employment Agreement dated as of January 1, 2009, between Nanosphere, Inc. and Mr. William P. Moffitt (5) (Exhibit 10.31) |
| |
| 10.28 | | Second Amended and Restated Registration Rights Agreement, dated August 19, 2009 (6) (Exhibit 10.1) |
| |
| 10.29 | | Lease Agreement, dated August 28, 2009, between Nanosphere, Inc. and Northbrook Commercial Properties, LLC (7) (Exhibit 10.1) |
| |
| 10.30 | | License Agreement, dated July 9, 2010, between Nanosphere, Inc. and Accelr8 Technology Corporation (8) (Exhibit 10.1) |
| |
| 10.31 | | Settlement Agreement and Intellectual Property Purchase Agreement, dated August 18, 2010, between Nanosphere, Inc. and Eppendorf AG (9) (Exhibit 10.1) |
| |
| 10.33 | | Second Amended and Restated Employment Agreement, dated as of December 28, 2011, by and between Nanosphere, Inc. and William P. Moffitt III, as amended (10) (Exhibit 10.1) |
| |
| 10.34 | | Stock Option Award Agreement dated, as of December 28, 2011, by and between Nanosphere, Inc. and William P. Moffitt III (11) (Exhibit 10.34) |
| |
| 10.35 23.1 | | Third Amended and Restated Employment Agreement, dated as of January 1, 2013, by and between Nanosphere, Inc. and William P. Moffitt III, as amended (12) (Exhibit 10.1) Consent of Deloitte & Touche LLP * |
| |
| 31.1 | | Certification of Chief Executive Officer pursuant to Exchange Act Rules 13a-14(a) and 15d-14(a), as adopted pursuant to Section 302 of the Sarbanes-Oxley Act of 2002 * |
| |
| 31.2 | | Certification of Chief Financial Officer pursuant to Exchange Act Rules 13a-14(a) and 15d-14(a), as adopted pursuant to Section 302 of the Sarbanes-Oxley Act of 2002 * |
| |
| 32.1 | | Certification of Chief Executive Officer pursuant to 18 U.S.C. Section 1350, as adopted pursuant to Section 906 of the Sarbanes-Oxley Act of 2002 * |
| |
| 32.2 | | Certification of Chief Financial Officer pursuant to 18 U.S.C. Section 1350, as adopted pursuant to Section 906 of the Sarbanes-Oxley Act of 2002 * |
| |
| 101.1 | | The following financial statements from Nanosphere, Inc.’s Annual Report on Form 10-K for the year ended December 31, 2012, formatted in XBRL: (i) Balance Sheets, (ii) Statements of Operations, (iii) Statements of Stockholders’ Equity, (iv) Statements of Cash Flows, and (v) Notes of Consolidated Financial Statements* |
| # | Confidential treatment has been requested with respect to certain provisions of this agreement. Omitted portions have been filed separately with the SEC. |
| (1) | Incorporated by reference from the Company’s Registration Statement on Form S-1 as filed with the Securities and Exchange Commission on August 13, 2007. The exhibit reference in parentheses indicates the corresponding exhibit number in such Registration Statement. |
| (2) | Incorporated by reference from the Company’s Amendment No. 1 to Form S-1 as filed with the Securities and Exchange Commission on September 27, 2007. The exhibit reference in parentheses indicates the corresponding exhibit number in such Amendment. |
60
| (3) | Incorporated by reference from the Company’s Amendment No. 2 to Form S-1 as filed with the Securities and Exchange Commission on October 17, 2007. The exhibit reference in parentheses indicates the corresponding exhibit number in such Amendment. |
| (4) | Incorporated by reference from the Company’s Amendment No. 3 to Form S-1 as filed with the Securities and Exchange Commission on October 29, 2007. The exhibit reference in parentheses indicates the corresponding exhibit number in such Amendment. |
| (5) | Incorporated by reference from the Company’s Current Report on Form 8-K as filed with the Securities and Exchange Commission on March 5, 2009. The exhibit reference in parentheses indicates the corresponding exhibit number in such Current Report. |
| (6) | Incorporated by reference from the Company’s Quarterly Report on Form 10-Q as filed with the Securities and Exchange Commission on November 5, 2009. The exhibit reference in parentheses indicates the corresponding exhibit number in such Quarterly Report. |
| (7) | Incorporated by reference from the Company’s Current Report on Form 8-K as filed with the Securities and Exchange Commission on September 1, 2009. The exhibit reference in parentheses indicates the corresponding exhibit number in such Current Report. |
| (8) | Incorporated by reference from the Company’s Current Report on Form 8-K as filed with the Securities and Exchange Commission on July 15, 2010. The exhibit reference in parentheses indicates the corresponding exhibit number in such Current Report. |
| (9) | Incorporated by reference from the Company’s Current Report on Form 8-K as filed with the Securities and Exchange Commission on August 24, 2010. The exhibit reference in parentheses indicates the corresponding exhibit number in such Current Report. |
| (10) | Incorporated by reference from the Company’s Current Report on Form 8-K as filed with the Securities and Exchange Commission on December 30, 2011. The exhibit reference in parentheses indicates the corresponding exhibit number in such Current Report. |
| (11) | Incorporated by reference from the Company’s Annual Report on Form 10-K as filed with the Securities and Exchange Commission on February 16, 2012. The exhibit reference in parentheses indicates the corresponding exhibit number in such Annual Report. |
| (12) | Incorporated by reference from the Company’s Current Report on Form 8-K as filed with the Securities and Exchange Commission on January 2, 2013. The exhibit reference in parentheses indicates the corresponding exhibit number in such Current Report. |
61
SIGNATURES
Pursuant to the requirements of Section 13 or 15(d) of the Securities Exchange Act of 1934, the registrant has duly caused this report to be signed on its behalf by the undersigned, thereunto duly authorized.
| | |
| NANOSPHERE, INC. |
| |
| By: | | /s/ Michael McGarrity |
| | Michael McGarrity |
| | President and Chief Executive Officer |
Date: February 28, 2013
Pursuant to the requirements of the Securities Exchange Act of 1934, this report has been signed below by the following persons on behalf of the Registrant and in the capacities and on the dates indicated:
| | | | |
Signature | | Title(s) | | Date |
| | |
| /s/ Michael K. McGarrity | | President, Chief Executive Officer, | | February 28, 2013 |
Michael K. McGarrity | | Director (principal executive officer) | | |
| | |
| /s/ Roger Moody | | Chief Financial Officer, Treasurer | | February 28, 2013 |
| Roger Moody | | (principal financial officer and principal accounting officer) | | |
| | |
| /s/ Sheli Z. Rosenberg | | Chair of the board of directors | | February 28, 2013 |
Sheli Z. Rosenberg | | | | |
| | |
| /s/ Michael J. Ward | | Director | | February 28, 2013 |
Michael J. Ward | | | | |
| | |
| /s/ André de Bruin | | Director | | February 28, 2013 |
| André de Bruin | | | | |
| | |
| /s/ Chad A. Mirkin | | Director | | February 28, 2013 |
| Chad A. Mirkin | | | | |
| | |
| /s/ Lorin J. Randall | | Director | | February 28, 2013 |
| Lorin J. Randall | | | | |