UNITED STATES
SECURITIES AND EXCHANGE COMMISSION
WASHINGTON, D.C. 20549
FORM 10-K
(Mark One)
| x | ANNUAL REPORT PURSUANT TO SECTION 13 OR 15(d) OF THE SECURITIES EXCHANGE ACT OF 1934 |
For the fiscal year ended March 31, 2007
OR
| ¨ | TRANSITION REPORT PURSUANT TO SECTION 13 OR 15(d) OF THE SECURITIES EXCHANGE ACT OF 1934 |
For the transition period from to
Commission file number 1-33312
SALARY.COM, INC.
(Exact Name of Registrant as Specified in its Charter)
| | |
| Delaware | | 04-3465241 |
| (State of Incorporation) | | (I.R.S. Employer Identification No.) |
| |
195 West Street Waltham, Massachusetts | | 02451 |
| (Address of Principal Executive Offices) | | (Zip Code) |
(781) 464-7300
(Registrant’s Telephone Number, Including Area Code)
Securities registered pursuant to Section 12(b) of the Act:
| | |
Title of Each Class | | Name of Exchange on Which Registered |
| Common Stock, $0.0001 par value | | The Nasdaq Stock Market LLC (Nasdaq Global Market) |
Securities registered pursuant to Section 12(g) of the Act: None
Indicate by check mark if the registrant is a well-known seasoned issuer, as defined in Rule 405 of the Securities Act. Yes ¨ No x
Indicate by check mark if the registrant is not required to file reports pursuant to Section 13 or Section 15(d) of the Act. Yes ¨ No x
Indicate by check mark whether the registrant: (1) has filed all reports required to be filed by Section 13 or 15(d) of the Securities Exchange Act of 1934 during the preceding 12 months (or for such shorter period that the registrant was required to file such reports), and (2) has been subject to such filing requirements for the past 90 days. Yes x No ¨
Indicate by check mark if disclosure of delinquent filers pursuant to Item 405 of Regulation S-K is not contained herein, and will not be contained, to the best of the registrant’s knowledge, in definitive proxy or information statements incorporated by reference in Part III of this Form 10-K or any amendment to this Form 10-K. ¨
Indicate by check mark whether the registrant is a large accelerated filer, an accelerated filer, or a non-accelerated filer. See definition of “accelerated filer and large accelerated filer” in Rule 12b-2 of the Exchange Act.
Large Accelerated Filer ¨ Accelerated Filer ¨ Non-Accelerated Filer x
Indicate by check mark whether the registrant is a shell company (as defined in Rule 12b-2 of the Exchange Act). Yes ¨ No x
As of March 31, 2007, there were outstanding 15,307,165 shares of common stock, $.0001 par value per share. The aggregate market value of shares of common stock held by non-affiliates of the registrant, based upon the last sale price for such stock on that date as reported by the Nasdaq Global Market, was approximately $89,607,000. The registrant has provided this information as of March 31, 2007 because its common equity was not publicly traded as of the last business day of its most recently completed second fiscal quarter. The number of the registrant’s shares of common stock, $.0001 par value per share, outstanding as of June 21, 2007 was 15,272,540.
Documents Incorporated by Reference
Portions of the registrant’s definitive proxy statement for the 2007 Annual Meeting of Stockholders, to be filed within 120 days after the end of the fiscal year covered by this Form 10-K, are incorporated by reference into Part III of this Form 10-K.
TABLE OF CONTENTS
1
PART I
Overview
Salary.com is a leading provider of on-demand compensation and performance management solutions. Our comprehensive on-demand software applications are integrated with our proprietary data sets to automate the essential elements of our customers’ compensation management processes, link pay to performance and help drive business results. As a result, our solutions can significantly improve the effectiveness of our customers’ compensation spending and help them become more productive in managing their employees. We enable employers of all sizes to replace or supplement inefficient and expensive traditional approaches to compensation management, including paper-based surveys, consultants, internally developed software applications and spreadsheets.
Our on-demand solutions, which incorporate market compensation intelligence from our proprietary data sets, enable companies to determine how much to pay new and existing employees, research executive pay and manage overall compensation programs. Our data sets contain base, bonus and incentive pay data for positions held by more than 74% of U.S. employees and similar data for the top executives in over 10,000 U.S. public companies. Our flagship offering is CompAnalyst, a suite of on-demand compensation management applications that integrates our data, third-party survey data and a customer’s own pay data with a complete analytics offering. In addition, we provide a salary qualification service called PayScore to help mortgage professionals gain efficiencies in the application process. PayScore combines data and software to enable lenders to better qualify applicants’ salary claims, improve credit decision making and provide an audit trail for compliance purposes. In May 2007, we acquired ICR Limited, L.C. and ICR International Limited (ICR) and expanded our compensation data services for the specialty consumer goods industry across four key retail sectors (apparel, footwear, luxury goods and specialty retail) and the global technology industry covering technology jobs in over 70 countries.
Our expertise in compensation and technology provides additional opportunities to help our customers become more productive in managing their most critical asset – their people. Our on-demand talent management solutions offer customers effective and measurable ways to attract and inspire outstanding employee performance. We launched TalentManager, our employee life-cycle performance management application, to help businesses automate performance reviews, streamline compensation planning and link employee pay to performance. In addition to our on-demand enterprise software offerings, we also provide a series of applications through our website, which allows us to deliver salary management comparison and analysis tools to individuals and small businesses on a cost effective, real-time basis.
We offer our solutions principally on an annual or multi-year subscription basis. Our direct sales group markets and sells our solutions primarily using the telephone and web-based demonstrations. From the introduction of our solutions in 2000 through March 31, 2007, our enterprise subscriber base has grown to more than 1,850 companies who spend from $2,000 to more than $100,000 annually, including companies such as Wal-Mart, Home Depot, Procter & Gamble, Merrill Lynch, UPS and Cisco Systems. We also sell to both individual consumers and smaller businesses through our Salary.com website. According to comScore Networks, the amount of website traffic received by Salary.com over the twelve months ended March 31, 2007 places our website in the top 10 for Career Services and Development websites and in the top 10 for Financial Information and Advice websites during the twelve months ended September 30, 2006. Salary.com’s network of sites generated an average of more than three million unique visitors in the three months ended March 31, 2007.
From April 2001 through March 31, 2007, we achieved 24 consecutive quarters of revenue growth. During the years ended March 31, 2007, 2006 and 2005, we achieved positive operating cash flows of $3.1 million, $1.8 million and $0.9 million, respectively. During these periods, we have consistently incurred operating losses, including $8.3 million for 2007, $3.0 million for 2006 and $1.9 million for 2005. As of March 31, 2007, we had an accumulated deficit of $29.4 million.
2
Initial Public Offering
On February 14, 2007, we completed our initial public offering in which we sold an aggregate of 5,248,200 shares of our common stock, including 349,757 shares sold pursuant to the underwriters’ exercise of their over-allotment option on February 27, 2007, at a price of $10.50 per share. The net proceeds to us from our initial public offering aggregated approximately $48.0 million after deducting underwriting commissions and offering expenses. We used approximately $2.5 million of the net proceeds of our initial public offering to repay all outstanding borrowings under the Company’s revolving line of credit and term loan. We used approximately $10.3 million of the net proceeds of our initial public offering for our acquisition of ICR Limited. L.C. in May 2007. We intend to use the balance of the net proceeds from our initial public offering for general corporate purposes.
Industry Background
Compensation Management
For most organizations, the primary goal of compensation management is to design a compensation program that allows the employer to effectively and efficiently attract, motivate and retain employees. According to a February 2006 survey by CFO Magazine, 91% of companies ranked the management of “human capital” as one of the most important factors in the success of their business. Optimizing pay is a priority as compensation remains one of the largest expense categories for most companies. Also, it is widely believed that compensation is one of the most important factors influencing employee performance. The best managed companies typically are analytical and deliberate in establishing and monitoring their compensation programs and seek to understand compensation practices and levels at the organizations that compete with them for talent.
To execute their pay strategies, most large organizations rely on their internal compensation functions. Whether formal or informal, the compensation group’s role is to manage the organization’s full breadth of pay practices. Analytical professionals develop the overall compensation philosophy and specific pay programs; build the organization’s salary structures and manage the overall compensation budget; typically define how to link pay to performance and often work with line managers to cascade that linkage to each individual employee. They also report and make recommendations to senior management and the board of directors. The foundation for all this work is a true understanding of the appropriate compensation practices for specific jobs, departments, groups, and entire organizations.
The predominant approach used by companies to determine appropriate compensation is “market pricing.” Market pricing is the process of comparing positions and pay in a company against aggregated, statistically significant compensation data from companies of comparable size, industry and location. To conduct a market pricing analysis for a particular position at a particular company, an internal compensation specialist or an outside consultant compares the job at that company with the closest matching “benchmark” jobs found in compensation surveys. When ample market data has been identified (generally from three or more third party sources), the compensation specialist or consultant weights, adjusts and averages the data to form an opinion of the market price for the job. Through the use of market pricing, the development of salary structures, and execution of pay programs (for example, base pay, commissions and incentives), organizations can effectively manage their compensation costs and link pay to performance.
Although most organizations are in agreement regarding the importance of market pricing in compensation management, there is wide variation regarding the processes and tools employed to make compensation decisions. Some organizations employ in-house compensation professionals who purchase surveys and use them to price the positions themselves, whereas others hire compensation consultants to market price their positions and recommend appropriate salary ranges. Many large companies will take a combination approach, using in-house resources for a majority of positions and engaging consulting firms to market price the jobs that are most critical to the success of the organization or for which data is more difficult to obtain. It is also common for large organizations to purchase data from more than one source and use one or more software packages to
3
manage different parts of the process. Smaller organizations do not typically have dedicated compensation specialists and therefore often rely on a human resource, or HR, generalist to manage the compensation analysis duties for the organization as part of a larger job.
Traditional Approaches to Compensation Management
Companies have traditionally used a variety of approaches for managing the compensation function. Many continue to use relatively simplistic internally developed software tools, often based on generic desktop programs such as Microsoft Excel. Some companies utilize broad HR and/or enterprise resource planning, or ERP, software offerings, which include some compensation management capability but typically lack the specialized functionality to adequately address compensation management. Many of these solutions must be installed on clients’ servers and maintained by their information technology, or IT, departments and do not seamlessly incorporate compensation data. Larger organizations also engage outside third parties to assist them in managing their compensation processes. Traditional third-party solution providers include HR business process outsourcers, or HR BPOs, such as Hewitt Associates, Affiliated Computer Services, and HR consultants, such as Mercer, Watson Wyatt Worldwide, Towers Perrin and Hay Group. HR consultants provide full service market pricing, comparison analysis and compensation management process assistance, but at a high cost—up to $200,000 annually for a typical company with 500 positions.
Larger organizations are faced with the challenges of compiling and managing large amounts of information, analyzing and reporting on actual and proposed compensation programs, collaborating among large or geographically dispersed teams and increasing the organizational effectiveness of their compensation plans. Although larger organizations typically have well-staffed HR departments and dedicated budgets and resources for compensation management, the need to manage information and data from multiple internal and external constituencies and integrate those inputs within a single system creates significant difficulties.
For small and mid-sized organizations, professional compensation management is often prohibitively expensive and time-consuming. These organizations are typically faced with a decision either to use external consulting firms, the cost of which often exceeds available budgets, or to commit scarce internal resources. In addition, HR responsibilities for these organizations are often assigned to only one or two dedicated staff or, in many cases, shared across non-dedicated staff who have other full-time responsibilities and may lack compensation expertise. Furthermore, these companies do not possess sophisticated interactive tools and information for making compensation decisions or administering compensation programs.
On-Demand Software and Compensation Management
Recent innovations in information technology have created opportunities to deliver software applications directly to users over the Internet in a subscription-based, on-demand business model. This model is made possible by the proliferation of high-speed, broadband Internet connectivity, open standards for application integration and advances in network availability and security. For the user, on-demand software eliminates the need for expensive hardware, software and internal IT support.
For HR personnel, who may not have large capital spending budgets, the often minimal (if any) upfront expenditure required to implement on-demand solutions and the minimal need for IT department involvement is particularly attractive. In addition, the hosted architecture helps ensure that the software and vendor-supplied content is kept current and secure, without requiring any user involvement. On-demand solutions also permit rapid deployment of and training for new applications, resulting in faster product adoption and increased productivity, especially for users who may have little or no technological background. These benefits typically result in a lower total cost of ownership and, in our belief, an increased return on investment. Finally, the on-demand model enables multiple users, including geographically dispersed executives, HR departments, departmental managers and employees, to easily coordinate and collaborate within a single application. These factors make the compensation management market well-suited for the on-demand software business model.
4
Market Opportunity
Employee compensation is one of the largest expense categories for corporations in the U.S., with total compensation expense in 2006 approximating $7.26 trillion, according to the U.S. Bureau of Labor Statistics. As a result, managing compensation expense is critically important to organizations of all sizes. The compensation management technology market, which includes software and online compensation data offerings, is estimated to grow from approximately $320 million for 2006 to approximately $460 million for 2008, according to an April 2006 study by independent market research firm Yankee Group. This projection from Yankee Group is focused on the market for software and related data offerings. However, we believe our total addressable market is larger, as our products provide a solution which replaces, in part or in full, not only software and data offerings, but also service offerings addressing the compensation management market such as those provided by compensation consulting firms and HR BPOs. Yankee Group has estimated the market for service offerings to be approximately $960 million for 2006. In sum, the markets for software, data and service offerings totaled approximately $1.28 billion for 2006, which we believe provides a better estimate of our total addressable market.
Our Solutions
Salary.com is a leading provider of on-demand compensation management solutions. Our web-based software suites help organizations of all sizes optimize compensation, manage employee performance and qualify salaries. Our integrated software applications provide extensive features and broad functionality that address the critical functions of compensation analysis and planning, goal setting and performance management. By automating and integrating essential elements of compensation management, our solutions allow our customers to reduce costs, save time and increase the effectiveness of their compensation spending.
Our unique combination of software and data addresses the various stages of the compensation management lifecycle—ranging from benchmarking positions to establish the market price of equivalent positions to managing the compensation review and goal setting process between operating managers and front-line employees. We deliver our compensation management solutions to customers through our CompAnalyst suite of on-demand software applications, which are tightly integrated with our proprietary data sets. Our PayScore product provides salary qualification services targeted to the specific needs of the mortgage lending industry. In addition to our compensation management solutions, we offer our TalentManager suite to deliver employee lifecycle performance management solutions, which help organizations establish goals throughout the organization and link employee pay to performance of those goals.
Our acquisition of ICR in May 2007 expanded our compensation product offering with the addition of two new services: IPAS®, the largest single source of international technology compensation data and software, including all relevant job titles in over 70 countries, and ICR Specialty Consumer Goods, a leading source of U.S. compensation data for apparel, footwear, luxury goods and specialty retail jobs.
Our comprehensive suite of integrated software applications provides the following key benefits:
Facilitates more effective compensation spending. Our solutions enable companies to deliver more effective and consistent compensation programs by reducing the risk of high turnover caused by underpaying employees and the risk of reduced profitability caused by overpaying employees. By making better compensation decisions, our customers are able to better attract, motivate and retain their employees, which we believe can lead to improved business execution and financial performance.
Enables Human Resource professionals to be more strategic. Our solutions incorporate features and best practices that automate compensation management to reduce or eliminate manual, paper-based and discrete business activities. As a result, our solutions help maximize the effectiveness of HR departments by enabling compensation professionals to focus on more strategic, high-value corporate-wide initiatives.
5
Provides access to proprietary market-driven compensation intelligence. Companies have traditionally made compensation decisions based on a limited number of surveys that are updated only once a year. By contrast, our proprietary data sets provide market-driven compensation information that is derived from numerous sources and which is updated monthly. We believe that the current nature, as well as the breadth and depth, of our data sets provide our customers with significant advantages as they set their compensation levels. To build and update our data sets, our compensation professionals apply proprietary comparative algorithms and sophisticated statistical analysis to the data to provide the most up-to-date, comprehensive and useful information to our customers.
Provides ability to price technology jobs around the world using the same methodology and participants. Market pricing technology jobs across countries has traditionally been a challenging process complicated by multiple surveys, different job titles, inconsistent job matching, different participants per country and no centralized source to compare across countries. Through our IPAS product, we offer a uniform set of job benchmarks in a single source of comprehensive data that enables consistent benchmarking capabilities across all countries in the survey. Customers participate in a single, web-based survey and receive access to every job from clerk to executive for over 70 countries. For example, a customer can determine what an accountant makes across all countries in the survey, with the same source, same methodology, same participants, and same currency.
Reduces compensation management costs. We believe that our solutions are more cost-effective than other available offerings. Our on-demand model significantly reduces or eliminates the installation and maintenance costs associated with on-premise solutions. Our intuitive user interfaces allow our customers to find the right data, manage its application and configure overall compensation plans with little or no technical assistance. Furthermore, by integrating our software with our proprietary data sets, we provide our customers with a significantly less expensive compensation management solution than the traditional approach of separately purchasing combinations of consulting services, surveys and software applications.
Allows for rapid deployment and scalability. Our on-demand software can be deployed rapidly and provisioned easily, without our customers having to make a large and risky upfront investment in software, hardware, implementation services or dedicated IT staff. The delivery platform for our software allows the solution to scale to suit customers’ needs. Additional users with defined privileges can be granted access with minimal implementation time, and new applications, such as analytics, can be deployed quickly and transparently to existing customers.
6
Data
Our proprietary data sets are a core differentiator of our solutions. By providing comprehensive data within our applications, we are able to assist corporate customers in achieving their compensation management objectives faster and more efficiently. The following diagram illustrates how we gather and process data and make it available to our enterprise customers through our software applications:
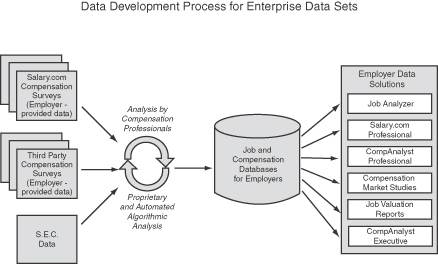
To develop our data sets, we begin with raw data we obtain from numerous sources. We purchase data directly from industry associations, compensation consulting firms, economic analysis firms and other sources. We also collect data directly from employers, partners and government agencies (for example, the U.S. Bureau of Labor Statistics, Department of Labor and SEC). Our team of certified compensation professionals also conducts proprietary compensation surveys on emerging jobs such as Corporate Ethics Officers and Six Sigma jobs. Through our acquisition of ICR in May 2007, we expanded both our custom survey capabilities to include consumer goods surveys across four main sectors—luxury goods, apparel, footwear and specialty retail—and also our data-filled software capabilities into global technology jobs with the addition of the IPAS product. Our team of compensation professionals processes data from these sources to derive our own proprietary data sets of compensation and other job-related information.
Our Market Pricing Data Processes
For our proprietary market pricing data sets, we use both standard and proprietary algorithms, which provide our customers with complete and consistent data that is representative of nearly all relevant markets and reasonable combinations of jobs, industries, locations and organization sizes. The completeness and consistency of our data sets provides our enterprise and consumer customers with market-driven compensation intelligence that we believe they could not procure or easily derive from alternate sources. In addition, our market pricing data processes and data sets also reduce the problems corporate compensation departments face from their lack of standardized processes for analyzing and combining multiple survey sources and maintaining the consistency of those sources year-over-year.
Enterprise and Consumer Data Sets
We have one proprietary data set for our enterprise customers and one for consumer customers. Our enterprise data set contains base, bonus and incentive pay data for positions held by more than 74% of U.S. employees and our consumer data set currently addresses the jobs held by more than 80% of the U.S. workforce.
7
Our enterprise solutions report data based on the most reliable sources available. Our enterprise customers may also incorporate data sources that they have independently acquired, which are then available for their exclusive use. Our enterprise data set is also augmented by compensation data from our customers, which they provide to us through surveys we conduct and which we do not include in our consumer data set. In addition, we provide a module in which an enterprise customer can store its own employee records to match to its preferred market sources and compare actual compensation, target compensation and market compensation.
Our lower priced and free consumer products report data designed to provide a reasonably accurate estimate of the compensation pay levels for thousands of jobs in various types of organizations throughout the United States and Canada. The jobs reported in our consumer tools are primarily the major benchmark jobs available from numerous public data sources. The purpose of the consumer tools is to educate the individual employee regarding the compensation decision-making process and to provide a reasonable approximation of the market for that individual’s job. We believe the best way for an employee and employer to have a productive conversation regarding compensation and pay for performance is for both to be educated about the process and current market values.
SEC Data Set
In addition to our proprietary market pricing data sets described above, we also maintain a complete data set of executive compensation and related data for more than 10,000 U.S. publicly-traded companies. All compensation data included in this data set is obtained directly from filings made by these companies with the SEC. Our SEC data set also contains data on director compensation from approximately 3,000 of the largest publicly-traded companies. Our SEC data set is updated daily to reflect new public filings and we maintain the historical data in our SEC data set to facilitate comparisons.
We also include basic financial data on public companies in our SEC data set, which we purchase from Standard & Poors. This data is used to allow our customers to place compensation data in the context of a company’s financial performance.
8
Products
We offer a suite of compensation management applications for enterprise customers that helps companies determine how much to pay new and existing employees and manage overall compensation programs. We also offer a suite of performance management applications to assist customers to establish performance goals throughout their organizations and link each employee’s pay to performance against these goals (“pay-for-performance”). Along with our application suites, we provide our customers with implementation and data configuration services as well as assistance with the application of our compensation and performance management solutions to their organization. In addition to our enterprise offerings, we also provide a series of consumer and e-commerce solutions through our website to provide compensation information and tools designed for the consumer. We provide our solutions on a subscription, transaction or ad-sponsored basis. For the years ended March 31, 2007, 2006 and 2005, our subscription revenues derived from our TalentManager products comprised less than 15% of our total revenues, with the remainder of our subscription revenues being derived from our compensation management and data products. Our solutions consist of the following products:
| | | | |
Product Category | | Product Name | | Principal Revenue Type |
Enterprise Solutions—Compensation Management Products | | CompAnalyst Suite Job Analyzer Survey Center Salary Structures Reporting & Analysis | | Subscription Subscription Subscription Subscription Subscription |
| | |
| | CompAnalyst Executive | | Subscription |
| | |
| | CompAnalyst Professional Edition | | Subscription |
| | |
| | Salary.com Professional Edition | | Subscription |
| | |
| | PayScore | | Subscription |
| | |
| | Job Valuation Reports | | Subscription |
| | |
| | Compensation Market Studies | | Transaction |
| | |
| | Salary.com Survey | | Transaction |
| | |
Enterprise Solutions—Performance Management Products | | TalentManager Suite PerformanceManager CompPlanner IncentivesManager StockOptionManager | | Subscription Subscription Subscription Subscription |
| | |
Consumer & E-Commerce Solutions | | www.salary.com | | Subscription/Ad-sponsored |
| | |
| | Salary Wizard | | Subscription/Ad-sponsored |
| | |
| | Salary Center | | Subscription/Ad-sponsored |
| | |
| | Personal Salary Report Subscription | | Subscription |
Enterprise Solutions
Compensation Management Products
CompAnalyst is a suite of on-demand compensation management solutions for use by the compensation professional in an enterprise. CompAnalyst is built around a core data set of market pricing information and includes access to several analytics applications, including the following:
Job Analyzer: Allows large enterprise customers easy access to our U.S. benchmark data set of market pricing for approximately 3,300 positions in companies of all sizes, across 20 industries and all U.S. geographies
9
(including regions, states and major metropolitan areas). Customers can also quickly find the market price for any benchmark job or create and price a “hybrid job” by mixing multiple positions together.
Survey Center: Provides customers with a centralized, online repository for managing and performing market pricing with third-party surveys that they acquire and own themselves. Easy to use tools enable customers to age, weight, adjust and combine data from multiple sources to produce market rates for use in compensation program design and analysis. Customers can use this functionality when they have specific data sources and weightings they choose to employ in determining market pricing. The Survey Center module also simplifies and speeds up the customer’s survey participation process by leveraging data typically used within the module’s core functionality—including employee pay and demographic data and company job to survey job matches—and exporting survey participation files in the specific survey vendor’s preferred format.
Salary Structures: Provides tools for analyzing current pay structures and for modeling the cost of proposed changes. The Salary Structures module enables customers to assess the alignment of pay practices with the external market and internal targets, and to perform “what if” analysis to support recommendations for changes in compensation program design.
Reporting & Analysis: Enables organizations to assess external competitiveness against internal equity by comparing actual pay practices to market data developed in Job Analyzer or Survey Center. Customers may analyze trends by year, compare pay practices across groups of employees (for example, by region, business unit, Equal Employment Opportunity Commission protected class) and create custom queries to meet their analysis needs. Customers can also store data and use it to conduct historical comparisons.
CompAnalyst Executive: This application allows CEOs, CFOs, executive compensation specialists, board members and consultants to analyze and review compensation information disclosed in filings with the SEC for more than 10,000 public companies. The data available with this product, which is updated daily, includes pay, incentive compensation, Black-Scholes values, benefits, director compensation, financial and stock performance data and more. CompAnalyst Executive’s functionality includes the ability to build and analyze peer groups by industry, size and location, as well as company financial performance measures and executive and director pay measures.
CompAnalyst Professional Edition: This application is similar to Job Analyzer, except with less data and functionality. Our sales force sells this application to smaller businesses.
PayScore: This product is a salary qualification service which helps mortgage professionals gain efficiencies in the application process. PayScore combines data and software to enable lenders to better qualify applicants’ salary claims, improve credit decision making and provide an audit trail for compliance purposes.
Salary.com Professional Edition: This data product is similar to CompAnalyst Professional Edition, but contains data only on small companies. We sell this application online through our website and our partners’ websites directly to businesses that typically have fewer than 100 employees.
Job Valuation Reports: This report is designed for use by HR departments to price a single position. It allows users to view a report on the appropriate market compensation data for that job and, if they desire, recommend adjustments to reflect the particular experience, education and other factors specific to an employee currently in the job. The job valuation report also includes basic explanations of how to use the data and how to explain market pricing practices to an employee. We sell this application to employers through our website and our partners’ websites.
Compensation Market Studies: These survey-like reports aggregate the data, generally for 50 to 200 related job titles within an industry group, typically within the same job family (for example, finance and accounting) or the same level (for example, executives). Salary.com has more than 100,000 of these reports that we update each month and sell to employers through our website and our partners’ websites.
10
Salary.com Surveys: Salary.com runs and manages compensation and benefits surveys, some of which are sponsored directly by Salary.com and others of which are sponsored in partnership with industry associations or other external sponsors. To conduct a survey, Salary.com solicits companies to submit actual pay data for their employees to us. We analyze, aggregate and anonymize their data and report the results back to participating companies. Typically, we charge participants a fee and we also may sell final reports to non-participants for a higher fee.
Performance Management Products
TalentManager is a suite of on-demand solutions that provides the essential workflow to link pay to performance across the enterprise. TalentManager enables an organization to manage goal setting, performance reviews and incentive programs, and to link those elements to relevant compensation programs within a single integrated application. Our TalentManager suite includes the following:
Performance Manager: Enables the communication and setting of goals by employees and managers and tracks performance against those goals. The system uses the goals as the basis for managing the performance review process. Performance Manager is fully integrated with CompPlanner, IncentivesManager and StockOptionManager and can link a virtually unlimited number of pay plans to an individual or to a particular goal.
CompPlanner: Enables organizations to automate and control the process of allocating salary increases, budget pools, lump sum adjustments and basic bonus plans. Within CompPlanner, HR and finance departments can set rules or guidelines that dictate the limits and the approval process for any component of the compensation decision-making process. By setting all of the rules in one system, which programmatically enforces the process, the entire organization can easily and efficiently adhere to policies and control procedures.
IncentivesManager: A configurable and customizable application capable of managing incentive plans. Incentive plans vary significantly among and within organizations and can have very complex management and payout structures. Although CompPlanner includes features to address basic incentive plans, many organizations need the additional sophisticated performance measures and calculations available in IncentivesManager.
StockOptionManager: Provides an environment and business rules for managing the allocation of stock and stock options as part of the compensation cycle. The granting of equity incentives within a company can be a simple or complex process, depending on the company’s philosophy and internal rules. Like IncentivesManager, StockOptionManager addresses the complexity necessary to accommodate an organization’s equity allocation rules and processes. The StockOptionManager module accommodates both publicly-traded and private company equity.
Professional Services
Our CompAnalyst professional services teams handle new customer implementations, training and general help desk services for the CompAnalyst product line and all data products. The TalentManager professional services team handles all new customer implementations, configurations, training, and general help desk services for the TalentManager suite of applications. For implementations that are not strictly “plug and play,” our product-specific implementation teams provide initialization, configuration, training and general help-desk services. We also train our customers so that they can be more self-sufficient for future implementations. TalentManager customers generally require more professional services than do CompAnalyst customers. Professional services in most cases are included as part of our subscription agreements and, to a lesser extent, are offered on an as-needed basis.
11
Consumer and E-Commerce Solutions
Our consumer and e-commerce family of products consists of free-to-user applications that are ad-sponsored, as well as certain premium products that are sold directly to individuals visiting our website. We also generate indirect revenue from these products through advertisers that pay for space on our website and our partners’ websites.
Our consumer and e-commerce products include:
www.salary.com: Our destination website and marketing face of the company is an advertising and online subscription sales channel. Our internet media traffic has grown to an average of more than three million unique monthly visitors over the three months ended March 31, 2007. According to comScore Networks, the amount of website traffic received by Salary.com over the twelve months ended March 31, 2007 places it in the top 10 most visited for Career Services and Development websites and in the top 10 most visited for Financial Information and Advice websites during the twelve months ended September 30, 2006. According to a search we performed using Google, more than 9,000 websites currently link directly to www.salary.com. The site includes calculators, memberships, newsletters and content around the topic of career and pay management for individuals, as well as related business content for small business and enterprise audiences. We believe that more than 90% of Salary.com’s traffic is organically generated and is not the result of substantial direct advertising and marketing on our part.
Salary Wizard: Salary Wizard is an ad-sponsored salary calculator designed to provide non-scoped, national average base pay and total annual cash compensation ranges for the positions we track. Users may adjust the national average information to their desired location by selecting a metropolitan area or zip code, and the results will be adjusted using a geographic adjustment factor to estimate the pay level for that location. Salary Wizard also attracts visitors to our website and our syndicated partner network of sites and serves as an entry point for consumers and employers to purchase a report or subscription product from us. The product is used more than 3 million times per month by both individuals and businesses.
Salary Center: Our syndicated product is a fully functional set of applications that deploy onto our partners’ websites to power the compensation section of their websites in a co-branded manner. For example, AOL Career Channel’s salary area is populated with Salary.com tools and the content is hosted and managed by Salary.com. The syndicated Salary Center product typically includes advertising inventory and e-commerce reports for which partners share revenue with Salary.com. Salary.com partners include AOL, Monster, CNN Money, Yahoo! Hotjobs, Dice, Business Week, the New York Times, ADP and 500 other companies representing more than 2,500 discrete websites.
Personal Salary Report Subscription: This application is a premium 14-page report providing individuals with an HR-quality assessment of their worth in the job market. The report also educates the subscriber about how employers determine compensation and also advises the subscriber on how to negotiate salary for a win-win outcome.
In addition to these online offerings, we also sell space for third party advertisers to deliver their messages to users of Salary.com’s website. Advertisers will pay for targeted inventory space adjacent to content that will be viewed by certain types of consumers. We believe our advertising inventory is attractive to advertisers because we provide a large volume of exposure opportunities and we can link those opportunities to a variety of consumer demographic factors, such as job title, location and income. Advertisers that purchase this inventory include job boards, recruiters, colleges and universities and financial services firms.
Compensation Team
We believe that one of the most significant differentiators between us and our software competitors is our compensation team. In addition to hiring experienced compensation professionals from industry, most of whom
12
are certified compensation professionals, we train our technology personnel about compensation and our compensation personnel about technology, so that each group possesses both the HR and the technological expertise essential to our products. We believe that this combined expertise allows us to design our software and data sets in a sophisticated and useful manner for our customers. We also try to ensure that employees with compensation experience are deployed throughout our organization. Historically, we have moved compensation professionals into roles within sales, product management, and professional services. In this way we are able to embed compensation knowledge, skills and abilities in all aspects of what we do, and we believe this allows us to position our domain expertise as a true competitive advantage.
Research & Development
Our research and development efforts are focused on improving and enhancing our existing on-demand service offerings as well as developing new products, features and functionality. Expansion of our solutions into new areas often involves a multiple year commitment to enter a new business, and we seek new product opportunities related to compensation, performance and talent management. When we extend an existing application or data set, our development costs are relatively low. When we innovate in an area requiring the development of a new data set, our development costs increase due to the high initial fixed costs of entering the new area and also building original software functionality. Once the initial investment in a new area has been made, however, the ongoing costs to maintain a data set and extend a product are often significantly less than the costs of maintaining the typical installed software product. Research and development expense for the fiscal years ended March 31, 2007, 2006 and 2005 was $4.1 million, $2.2 million and $1.4 million, respectively.
Technology
We were a pioneer in hosted, multi-tenant, on-demand software, launching our first product in 2000. Our on-demand software is a highly scalable, multi-tenant application platform written in CSS, XML, DHTML, Visual Basic, C++, Java and C# for the .NET framework and COM+ and MSMQ for the Windows operating systems. We use commercially available hardware and a combination of proprietary and commercially available software, including Microsoft SQL Server, Microsoft IIS Server and Microsoft Windows.
Our on-demand software treats our customers as separate tenants in central applications and data sets. As a result, we are able to spread the cost of delivering our service across our user base. In addition, because we do not have to manage thousands of distinct applications with their own business logic and database schemas, we believe that we can scale our business faster than traditional software vendors, even those that have modified their products to be accessible over the Internet.
Our TalentManager products are built on our proprietary, highly scalable Salary.com FlexTenant platform, which enables us to customize the business logic, data flow, workflow and user interfaces of our enterprise applications for clients and yet continue to operate in the same multi-tenant application shared by our other customers.
Operations
We serve all of our customers from a third-party network operations facility located in Watertown, Massachusetts, operated by AT&T. This facility provides around-the-clock security personnel, photo ID/access cards, biometric hand scanners and sophisticated fire systems. The overall security of each data center (inside and outside) and network operations center are monitored by digital video surveillance cameras 24 hours a day, seven days a week. Additionally, redundant bandwidth, on-site electrical generators and environmental control devices are used to keep servers up and running. We continuously monitor the performance of our service. We have a comprehensive security infrastructure, including firewalls, intrusion detection systems and encryption for transmissions over the Internet. We monitor and test this security infrastructure on a regular basis. Our site operations team provides system management, maintenance, monitoring and back-up. We run tests regularly to
13
ensure adequate response from our sites and conduct production environment reviews for hosting capacity, expansion and upgrade planning. We also monitor site availability and latency. We own or lease and operate all of the hardware on which our applications run in the network operations facility.
To facilitate high availability of our solutions and loss recovery, we operate a multi-tiered system configuration with redundant bandwidth, load balanced web server pools, replicated and clustered database servers and fault tolerant storage devices. Data sets are restored to hot standby database servers using transaction logs shipped from primary production database servers. This solution is designed to provide near real-time fail-over service in the event of a malfunction with a primary clustered database or server. Full backups of all data sets take place nightly and are archived to tapes. These tapes are rotated offsite to a separate facility managed by Iron Mountain. We also maintain a fully redundant site, located within our headquarters, which would serve as our primary site in the event that a disaster was to render the network operations facility inoperable. Our real-time backups are stored on servers in our corporate headquarters. Although we have not experienced a failure of our third-party network operations facility, we believe that if such facility became inoperable, most of our products would be available to our customers with minimal interruption in service.
Sales and Marketing
We sell our enterprise solutions primarily through our direct sales organization and to a lesser extent through indirect channels. As of March 31, 2007, our direct sales force consisted of 68 employees, including 38 account executives. We employ business development representatives to call potential enterprise customers to book initial demonstrations and to qualify customer leads. Once a lead is qualified, our account executives assess customer needs, complete demonstrations and close sales, primarily by telephone and via web-based product demonstrations. We also employ account managers who maintain on-going or post-sale relationships with subscribers, manage renewals and generate interest from existing customers to purchase additional products. Additionally, our sales engineers and compensation professionals assist with sales to customers with particularly complex needs and provide post-sales customer support. Most of our sales personnel are located in our headquarters in Waltham, Massachusetts. We also have an advertising and syndication sales team, which works much in the same way as our enterprise product sales team, but focuses its efforts on selling and marketing advertising on our website and syndication of our consumer offerings to other websites. Although we have relationships with many partners, including websites and consulting firms, these partners accounted for less than 10% in the aggregate of our total revenue in the fiscal years ended March 31, 2007 and 2006.
Our marketing program is anchored by an integrated communications strategy that supports the core of our brand and value proposition. Our marketing programs include direct mail and email campaigns, using our website to provide product and company information, advertising in both print and online media, search engine marketing, issuing press releases on a regular basis and launching events to publicize our service to existing customers and prospects. We build our brand through our website, syndication and public relations, all of which are intended to increase market awareness of Salary.com as a top-tier provider of on-demand compensation management solutions, as well as a leading website for free information about compensation. Furthermore, our spokespersons are frequently sought as expert commentators by major media, including television, radio, newspapers and mainstream and trade magazines. We believe that this is a critical component of our branding program and positions Salary.com as an expert in the compensation field. In the fiscal year ended March 31, 2007, our television and radio appearances were viewed more than 50 million times and our print appearances were viewed more than 140 million times. We also conduct seminars, participate in trade shows and industry conferences, publish white papers on HR issues and develop customer reference programs.
14
Customers
As of March 31, 2007, we had more than 1,850 enterprise subscribers, in various industries, who spend from $2,000 to more than $100,000 annually. No single customer accounted for more than 3% of our revenue in the fiscal years ended March 31, 2006 or 2007. Below is a representative list of companies who were customers as of March 31, 2007, grouped by industry category and number of employees in the business unit we serve.
| | | | |
Industry | | More than 500 Full-Time Employees | | 500 or Fewer Full-Time Employees |
Retail | | Toys R’ Us | | Dial-a-Mattress |
| | Home Depot | | Hickory Farms |
| | Abercrombie & Fitch | | Honey Baked Ham |
| | Linens ‘N Things | | Red Envelope |
| | Hallmark | | Zappos.com |
| | |
Consumer Products | | Campbell Soup | | LaCrosse Footwear |
| | Procter & Gamble | | Premier Agenda |
| | Kohler | | Birds Eye |
| | Royal Caribbean | | Waterford Wedgwood USA |
| | Avon | | Bunn-O-Matic |
| | |
Financial Products and Services | | Equifax | | American Capital Strategies |
| | Merrill Lynch | | Cole Taylor Bank |
| | PricewaterhouseCoopers | | Cascade Bancorp |
| | M&T Bank | | Ocean First Financial |
| | MasterCard | | Juniper Bank |
| | |
Manufacturing | | Raytheon | | Wagner Spray Technology |
| | Bosch | | Royal Appliance |
| | Honeywell | | Rockford Corporation |
| | BASF | | Troy Corporation |
| | Goodrich | | JSP International |
| | |
Technology | | Cisco Systems | | Sycamore Networks |
| | Thermo Fisher Scientific | | Powerwave Technologies |
| | Trimble Navigation | | DigitalGlobe |
| | Mitsubishi Electronics USA | | SiRF Technologies |
| | SRA International | | Omron Components |
Competition
The market for on-demand compensation management and performance management solutions is fragmented, competitive and rapidly evolving, and there are low barriers to entry to some segments of this market. Within our markets, the most common applications in use today are generic desktop software tools and solutions that are not specifically designed for compensation management or performance management. We also compete with software vendors that offer solutions through either traditional on-premise delivery methods or to a lesser extent, on-demand solutions, and established consulting firms that continue to offer a diversity of services and software products. We also expect to encounter new and evolving competition as the market for on-demand compensation management software and services consolidates and matures and as organizations become increasingly aware of the advantages and efficiencies that can be attained from the use of compensation management software and data solutions.
15
We believe the principal factors that generally determine a company’s competitive advantage in the compensation management and performance management markets include the following:
| | • | | a large installed customer base; |
| | • | | a well-known and respected brand; |
| | • | | breadth and depth of proprietary content; |
| | • | | the ability to offer both powerful software and technology and accurate compensation data in a single offering; |
| | • | | a suite of products (rather than individual point solutions); and |
| | • | | an integrated platform (e.g., in which pay and performance software and data are linked). |
We face competition primarily from five sources:
| | • | | generic desktop software and in-house or custom-developed solutions; |
| | • | | established software vendors offering products specifically designed for compensation management, performance management and/or talent management; |
| | • | | established compensation and HR consulting firms; |
| | • | | other websites and advertising venues; and |
| | • | | existing and future start-up companies offering software, data, and e-commerce compensation solutions. |
Generic desktop software and in-house or custom- developed solutions. Perhaps the most common applications in use today are generic desktop software tools such as Microsoft Excel and Microsoft Access, as well as other commercially available software solutions not specifically designed for compensation or performance management. Compensation professionals at organizations of all sizes routinely use these generic software tools to develop in-house or home-grown solutions. Although we believe our CompAnalyst and TalentManager offerings are superior to these home-grown, partially-automated solutions, some potential customers may be reluctant to switch both because of the cost of our solution and because of the perceived risk they face in giving up direct control over their sources of data.
Established software vendors. Established HR software vendors compete with both our CompAnalyst and TalentManager solutions. In addition, the market for our TalentManager solution is extremely competitive and includes several companies that are more established and have greater financial, technological and marketing resources than we do. As a result, we expect to face intense ongoing competition in this segment of our business, which could affect our ability to increase or maintain market share in the performance management arena.
We also expect that new competitors, such as enterprise software vendors that have traditionally focused on enterprise resource planning, or ERP, or back office applications, will enter, or greatly expand their offerings in, the on-demand compensation and performance management software market as it develops and matures. In addition, there are a number of companies that have products in the broader talent management market, which includes not only compensation and performance management, but also learning and recruitment management. We expect over time that certain of these companies may also seek to offer compensation and performance management products in competition with us. These large, traditional players in the HR space could focus their considerable financial, technical, marketing and sales resources on various segments of our business, either by developing their own products in-house or purchasing a smaller company. To the extent such efforts are successful, it is possible that these new competitors could rapidly acquire significant market share.
16
Established compensation and HR consulting firms. The market for compensation management data and services has traditionally been dominated by large consulting firms, all of which have greater financial, sales and marketing, management, service, support and other resources than we have. Such firms have traditionally offered an expensive but fully customized compensation management solution to the nation’s largest enterprises. Additionally, in recent years such firms have begun to reinvest in their software-based compensation management tools. We thus face two types of competition from established consulting firms:
| | • | | First, their customized consulting services represent a challenge to our CompAnalyst suite, particularly in larger organizations, which frequently have long-standing and well-entrenched relationships with compensation and HR consulting firms. This challenge is particularly acute for our CompAnalyst Executive product line, as HR and compensation executives are often reluctant to change the processes used to determine their bosses’ pay. |
| | • | | Second, some established HR consulting firms offer software that competes directly with certain modules of both our CompAnalyst and TalentManager product lines. While we believe that our software products compete favorably with those offered by consulting firms, these firms have far greater resources than we do and as a result may compete successfully with our CompAnalyst and TalentManager solutions. |
Other websites and advertising venues. Our advertising-sponsored offerings (Salary Wizard, www.salary.com, and Salary Center) compete with a wide variety of other websites and online media for advertising dollars. To the extent these competitors are able to offer advertisers more effective or cost-efficient means of marketing their product and services, we may be unable to grow, or face reduced revenues from some or all of our advertising-based products.
Existing and future start-up software, data, and e-commerce companies. A number of smaller, early-stage companies offer products that compete directly with one or more of our product lines. Although many of these young companies may have fewer resources than we do, to the extent they are successful in their efforts, we expect to face more effective competition from them in the future, and our financial performance may suffer as a result. In addition, because the market for compensation and performance management software and services, as well as e-commerce compensation products, is nascent and rapidly evolving, we expect additional, as yet unformed, companies to enter our markets in the future. To the extent this occurs, some or all of our product lines will face greater competition in the future, which may materially adversely affect our financial performance.
Intellectual Property and Proprietary Content
We rely on a combination of patent, trademark, copyright and trade secret laws in the United States and other jurisdictions as well as confidentiality procedures and contractual provisions to protect our proprietary technology and our brand. We have one U.S. issued patent (for our proprietary methods for calculating market pricing across our data sets) which expires in 2022 and three pending U.S. patent applications, as well as related patents and patent applications in other jurisdictions. We also enter into confidentiality and proprietary rights agreements with our employees, consultants and other third parties and control access to software, documentation, data and other proprietary information.
We pursue the registration of our trademarks in the United States. Currently, our CompPlanner and Salary Wizard marks are federally registered in the U.S. In addition, we have applied for registration of the following trademarks: Salary.com, CompAnalyst, CompAnalyst Executive, Survey Center, PayScore, TalentManager and FlexTenant.
We currently license some of the content used to build our compensation data sets from numerous providers pursuant to data reseller, data distribution, and license agreements with these providers. Our data sets are generally derived from market data as collected in salary surveys. This information is used as one of several inputs to our data set calculation methodology. Most of the licenses for this content are non-exclusive. We cannot
17
assure you that the data we require for our data sets will be available from such sources in the future or that the cost of such data will not increase. Because we have content from numerous providers, we do not believe that the loss of any one license would materially affect the quality of our data sets, however, we cannot assure you that any single data set will not be substantially reliant on a single source in the future. Additionally, if a third party successfully asserted a claim that our use of data has violated our agreement with them or infringed upon their copyright, we may be required to remove the applicable data from our data sets and regenerate our data sets without such data.
Although the protection afforded by patent, trademark, copyright and trade secret laws may provide some advantages, we believe that our ability to maintain our competitive position is largely determined by such factors as the technical skills of our personnel, the breadth and depth of our proprietary data sets, new product developments and product enhancements.
Substantial litigation regarding intellectual property rights exists in the software industry. From time to time, in the ordinary course of business, we may be subject to claims relating to our intellectual property rights or those of others, and we expect that third parties may commence legal proceedings or otherwise assert intellectual property claims against us in the future, particularly as we expand the complexity and scope of our business, the number of similar products increases and the functionality of these products further overlap. If a claim is asserted that we have infringed the intellectual property of a third party, we may be required to seek licenses to that technology. In addition, we license third party technologies, primarily from Microsoft, that are incorporated into some elements of our services. Although we do not believe that any one license is material to our operations, licenses from third parties may not continue to be available to us at a reasonable cost, or at all. Additionally, the steps we have taken to protect our intellectual property rights may not be adequate. Third parties may infringe or misappropriate our proprietary rights. Competitors may also independently develop technologies that are substantially equivalent or superior to the technologies we employ in our services.
Employees
At March 31, 2007, we had 255 full-time and part-time employees. Our employees are not represented by any collective bargaining agreement, and we have never experienced a work stoppage. We believe we have good relations with our employees.
Officers
Kent Plunkett founded Salary.com and has served as our Chairman, President and Chief Executive Officer since 1999. Prior to founding Salary.com, Mr. Plunkett was CEO of Bumblebee Technologies Inc., a career software publisher, from 1996 through 1999, held a leadership role at InfoSpace, Inc., an online content syndication company, including online white and yellow pages, private-label search and mobile entertainment, in 1996 and Director of Business Development for Pro CD, Inc., a CD-ROM electronic directory publisher of white pages, yellow pages and mapping content, from 1995 through 1996. Mr. Plunkett holds an A.B. degree from Georgetown University and an M.B.A. from the Harvard Business School and is a Certified Compensation Professional.
Yong Zhang has served as our Chief Technology Officer since April 2000 and as our Executive Vice President and Chief Operating Officer since June 2006. Mr. Zhang has been a member of our board of directors since December 2004. Prior to joining Salary.com, Mr. Zhang held various technical leadership and project management positions at privately held software and healthcare companies, including Iconomy.com, a pioneer of private-label e-commerce solutions, Smart Route System, a traveler information company, and Center for Health and Human Services, Inc., and served as consultant for Aerovox, Inc., a publicly-held capacitor manufacturer. Mr. Zhang holds a B.S. in Physics from Shanghai University of Science and Technology, an M.B.A. from Cornell University and an M.S. in Electrical Engineering as well as an M.S. in Physics from University of Massachusetts at Dartmouth. Mr. Zhang is a Certified Compensation Professional and a Global Remuneration Professional.
18
William H. Coleman has served as our Senior Vice President and Chief Compensation Officer since November 2006 and served as our Senior Vice President, Compensation from November 2002 until November 2006 and as our Vice President, Compensation from May 2000 until November 2002. Prior to joining us, Mr. Coleman held senior compensation positions with Watson Wyatt Worldwide, a global consulting company, and PricewaterhouseCoopers LLP. Mr. Coleman holds a B.S. in Mathematics from the Massachusetts Institute of Technology and is a Certified Compensation Professional.
Kenneth S. Goldman has served as our Senior Vice President, Chief Financial Officer and Treasurer since March 2006. Mr. Goldman has been a member of our board of directors since November 2006. From April 2004 to March 2006, Mr. Goldman was a Principal with Mirus Capital Advisors, an investment banking firm. From March 2002 to March 2004, Mr. Goldman was Senior Vice President and Chief Financial Officer of Lodestar Corporation, an enterprise software company. From March 2000 through March 2002, Mr. Goldman was Executive Vice President and Chief Financial Officer of Student Advantage, a NASDAQ-traded marketing services company. Prior to 2000, Mr. Goldman served as the chief financial officer of several companies, including MediaMap, a provider of software and content data, ShopLink.com, an online provider of grocery shopping and household consumables, the international division of Liberty Mutual Group, and Goldweitz & Company, a real estate investment and development firm. Mr. Goldman started his career with KPMG and has been a Certified Public Accountant since 1984. Mr. Goldman holds a B.S. in Business Administration from the Whitman School of Management at Syracuse University.
Meredith A. Hanrahan has served as our Senior Vice President and Chief Marketing Officer since September 2005. From January 2005 to September 2005, Ms. Hanrahan was a marketing consultant for Yankee Group, a technology research and consulting firm, and also for Boston Beer Company, a publicly-traded beverage company. From November 2003 until November 2004, Ms. Hanrahan was General Manager and Chief Marketing Officer for AG Interactive (the interactive division of American Greetings) and from May 2000 through November 2003, Ms. Hanrahan was Vice President and General Manager for Terra Lycos, a Spanish provider of Internet access. Prior to that, Ms. Hanrahan worked for five years as a strategy consultant for KPMG and McKinsey & Company in New York, and for ten years in senior and management positions at General Mills, Inc., Miller Brewing Company, and Lindt Chocolate USA. Ms. Hanrahan holds a B.A. from the University of New Hampshire and an M.B.A. from the Harvard Business School.
Teresa A. Shipp has served as our Senior Vice President of Sales since May 2003 and served as our Corporate Controller from November 2002 until August 2004. From November 2001 until September 2002, Ms. Shipp was International Finance Manager for LoJack Corporation, a publicly-held provider of vehicle recovery systems. Ms. Shipp holds a B.S. in Electrical Engineering from the University of Notre Dame and an M.B.A. from the Harvard Business School and is a Certified Public Accountant, a Certified Compensation Professional and a Global Remuneration Professional.
Christopher J. Fusco has served as our Vice President of Compensation and Data Operations since July 2006 and served as our Vice President, Business Analysis, from July 2005 to July 2006, our Professional Services Director from March 2004 to July 2005 and our Senior Compensation Consultant from February 2002 to March 2004. From July 1998 through May 2001, Mr. Fusco was a Senior Consultant with William M. Mercer, Inc., a global consulting company. Prior to 1998, Mr. Fusco served in various compensation management positions with companies such as KPMG, an audit, tax and advisory firm, W.R. Grace & Co., a global specialty chemicals and materials company, Towers Perrin, a professional services firm, and Interleaf, a provider of software products used for business documents. Mr. Fusco holds a B.S. from the University of Connecticut and an M.B.A. from Northeastern University. Mr. Fusco is a Certified Compensation Professional and Global Remuneration Professional and has earned lifetime achievement as a Senior Professional in Human Resources (SPHR) by the Society of Human Resource Management.
Andrew Linn has served as our Senior Vice President of Global Data Products since July 2005 and served as our Senior Vice President of Product Management from 2000 to July 2005. Prior to 2000, Mr. Linn served in
19
various capacities with One Source Information Services (and its predecessor, Lotus Development Corporation), including Group Product Manager and Product Manager from November 1988 through January 2000, an aggregator of business and company information. Mr. Linn holds a B.S. from the Wharton School at the University of Pennsylvania and is a Chartered Financial Analyst and a Certified Compensation Professional.
Elliot J. Mark has served as our Senior Vice President, General Counsel and Secretary since October 2006. From August 2003 until September 2006, Mr. Mark was Senior Vice President and General Counsel of Viisage Technology, Inc., a NASDAQ-traded identity technology company. During the period from January 2001 to March 2003, Mr. Mark was the General Counsel of eRoom Technology, Inc., an enterprise software company. Prior to that, Mr. Mark held senior legal positions at SimPlayer Sports, Inc., a developer of interactive applications for the sports market, Arthur D. Little, Inc., a global consulting firm, and Molten Metal Technology, Inc., an environmental technology company. Mr. Mark started his career with Goodwin Procter LLP. Mr. Mark holds a B.A. from Wesleyan University and a J.D. from The Georgetown University Law Center.
Mark Albrecht has served as our Vice President of Product Marketing for Talent Management Solutions since March 2006 and from February 2004 to March 2006, he served as our Vice President of Professional Services. From 2002 through 2004, Mr. Albrecht served as Managing Partner of Business Performance Partners, a performance management consulting firm. During the period from 2000 through 2002, Mr. Albrecht was Vice President of Professional Services at Commerce One, a supplier of on demand supply chain management solutions. Mr. Albrecht holds a B.S. from Florida State University, an M.B.A. in Operations Management from Boston University and an M.A. in Psychology from Montclair State College and is a Certified Compensation Professional.
Nicholas Camelio has served as our Vice President of Human Resources since June 2007. From January 2006 to March 2007, Mr. Camelio was the Vice President of Human Resources for BrassRing Inc., an enterprise application talent management solution provider. From February 2001 through January 2006, Mr. Camelio served as Senior Director of Human Resources at BrassRing Inc., and prior to that was a Regional Human Resources Director for Vignette Corporation, an enterprise software company. From 1992 through February, 2000, Mr. Camelio held a variety of positions at Lotus Development Corporation and International Business Machines (IBM), including Human Resources Director for the North American Sales and Services organization. Mr. Camelio holds a B.S. from Bentley College and is a member of the Society of Human Resource Management and a certified MBTI professional trainer.
Joseph E. Duggan joined us in May 2007 as part of the ICR acquisition, and serves as the Vice President and co-General Manager of our ICR division. Mr. Duggan was a founding partner of ICR in 1995, and served in an executive role at that firm since its founding. Prior to that, Mr. Duggan held senior management positions with Stride Rite Corporation, a publicly traded footwear company, and Data General Corporation, a computer systems manufacturer. He has a B.S. from Suffolk University and an M.B.A. from Babson College.
Dana Freeman has served as our Vice President of Product Management since March 2006. From 2003 through 2006, Mr. Freeman was Vice President of Product Management at Deploy Solutions, a human resources management software company. From 1999 through 2003, Mr. Freeman was President and CEO of HRchitect, a human capital management consulting company. Mr. Freeman holds a B.S. in Business Administration from the University of Maine.
John McCammond has served as our Vice President of Business Development since May 2005. From 2001 to 2005, Mr. McCammond was Vice President of Channel Sales at Avaki, a provider of enterprise information integration software systems. Mr. McCammond holds a B.A. from Williams College and an M.B.A. from the Harvard Business School.
Thomas A. Samalis has served as our Vice President and Corporate Controller since August 2004. From 1994 to July 2004, Mr. Samalis was Vice President and Corporate Controller for OneSource Information
20
Services, Inc., a publicly-held company and provider of business information. Prior to that, he was employed for twenty-three years by Interactive Data Corporation, a provider of business and financial data, where he served as Vice President and Corporate Controller for six years, and in various finance and accounting capacities, including Director of Accounting and Accounting Manager throughout the preceding seventeen years. Mr. Samalis holds a B.S. in Accounting from Suffolk University and an M.B.A. from Bentley College.
Roger C. Sturtevant, Jr. joined us in May 2007 as part of the ICR acquisition, and serves as the Vice President and co-General Manager of our ICR division. Mr. Sturtevant was a founding partner of ICR in 1995. Prior to that, he was the Manager of Compensation, HRIS and Staffing at Kendall Healthcare Products, a healthcare products company. Mr. Sturtevant holds a B.S. in Organizational Psychology and an M.S. in Human Resources Management from Purdue University.
Dean Vassiliou has served as our Vice President of Professional Services since October 2006. From November 2005 to October 2006, Mr. Vassiliou was the Vice President of Professional Services at 4DataLink Inc., an enterprise application integration solution provider. From June 2004 to November 2005, he was the Vice President of Product Management and Marketing at Valaran Corporation, an enterprise software company. Prior to that, Mr. Vassiliou held a variety of positions at Lodestar Corporation, an enterprise software company, from 1998 to February 2004, including Senior Vice President of Products, Services and Support from November 2001 to February 2004. Mr. Vassiliou holds a B.S. in Mechanical Engineering from the University of Hartford.
Facilities
Our corporate headquarters, including our principal administrative, marketing, technical support and research and development facilities, are located in Waltham, Massachusetts, where we lease approximately 62,000 square feet under an agreement that expires in 2009. Additionally, we lease approximately 7,500 square feet of office space in Shanghai, China, which is the headquarters of SDC China Limited, our wholly foreign owned enterprise. We primarily conduct research and development in the Shanghai office. This lease expires in 2008, but we have an option to extend it through 2010. We believe that our current facilities are suitable and adequate to meet our current needs, and that suitable additional or substitute space will be available as needed to accommodate expansion of our operations. See Note 7 to the notes to our consolidated financial statements and “Management’s Discussion and Analysis of Financial Condition and Results of Operations—Contractual Obligations” for information regarding our lease obligations.
Internet Address
The Company’s internet address is www.salary.com. The Company makes available, free of charge, on or through its website, its Annual Reports on Form 10-K, Quarterly Reports on Form 10-Q and Current Reports on Form 8-K and amendments to such reports filed or furnished pursuant to Section 13(a) or 15(d) of the Securities Exchange Act of 1934, as amended (the “Exchange Act”) as soon as reasonably practical after such reports are electronically filed with the SEC. The Company’s website is not incorporated by reference into this Annual Report on Form 10-K.
CAUTIONARY STATEMENT REGARDING FORWARD LOOKING STATEMENTS
This Annual Report on Form 10-K contains or incorporates a number of forward-looking statements within the meaning of Section 27A of the Securities Act of 1933 and Section 21E of the Securities Exchange Act of 1934. Forward-looking statements relate to future events or our future financial performance. We generally identify forward-looking statements by terminology such as “may,” “will,” “should,” “expects,” “plans,” “anticipates,” “could,” “intends,” “target,” “projects,” “contemplates,” “believes,” “estimates,” “predicts,” “potential” or “continue” or the negative of these terms or other similar words. These statements are only
21
predictions. We have based these forward-looking statements largely on our current expectations and projections about future events and financial trends that we believe may affect our business, financial condition and results of operations. The outcome of the events described in these forward-looking statements is subject to risks, uncertainties and other factors described in “Risk Factors,” “Management’s Discussion and Analysis of Financial Condition and Results of Operations” and elsewhere in this report. Accordingly, you should not rely upon forward-looking statements as predictions of future events. We cannot assure you that the events and circumstances reflected in the forward-looking statements will be achieved or occur, and actual results could differ materially from those projected in the forward-looking statements. We have identified below some important factors that could cause our forward-looking statements to differ materially from actual results, performance or financial condition:
| | • | | our ability to become profitable; |
| | • | | the ability of our solutions to achieve market acceptance; |
| | • | | a highly competitive market for compensation management; |
| | • | | failure of our customers to renew their subscriptions for our products; |
| | • | | our inability to adequately grow our operations and attain sufficient operating scale; |
| | • | | our inability to effectively protect our intellectual property and not infringe on the intellectual property of others; |
| | • | | our inability to raise sufficient capital when necessary or at satisfactory valuations; |
| | • | | the loss of key personnel; and |
| | • | | other factors discussed elsewhere in this report. |
The risks and uncertainties described in this Annual Report on Form 10-K are not the only ones we face. Additional risks and uncertainties, including those not presently known to us or that we currently deem immaterial, may also impair our business. The forward-looking statements made in this Annual Report on Form 10-K relate only to events as of the date of this report. Except as required by law, we assume no obligation to update any forward-looking statements after the date of this report.
This Annual Report on Form 10-K also contains market data related to our business and industry. This market data includes projections that are based on a number of assumptions. If these assumptions turn out to be incorrect, actual results may differ from the projections based on these assumptions. As a result, our markets may not grow at the rates projected by these data, or at all. The failure of these markets to grow at these projected rates may have a material adverse effect on our business, financial condition and results of operations and the market price of our common stock
We operate in an emerging and rapidly evolving market which makes it difficult to evaluate our business and future prospects and may increase the risk of your investment.
We derive, and expect to continue to derive for the foreseeable future, the vast majority of our revenues from on-demand compensation management solutions, which is a relatively new and emerging market, making our business and future prospects difficult to evaluate. Many companies have invested substantial personnel and financial resources in their human resource, or HR, departments or have engaged outside consulting firms or HR Business Process Outsourcers, or HR BPOs, to obtain corporate compensation data and solutions, and may be reluctant or unwilling to migrate to on-demand software designed to address their compensation management needs. The market for on-demand software solutions is at an early stage of development, and it is uncertain whether an on-demand model such as ours will achieve and sustain the high level of market acceptance that is critical to the success of our business. Our success will depend to a substantial extent on the willingness of companies to increase their use of on-demand software in general and on-demand compensation management software in particular. If businesses do not perceive the benefits of on-demand software, then the market may not
22
develop further, or it may develop more slowly than we expect, either of which would adversely affect our business, financial condition and results of operations. You must consider our business and future prospects in light of the challenges, risks and difficulties we encounter in the new and rapidly evolving market for on-demand compensation management. These challenges, risks and difficulties include the following:
| | • | | generating sufficient revenue to achieve and maintain profitability; |
| | • | | developing new products and enhancing the functionality and features of existing applications; |
| | • | | attracting and retaining new customers and expanding the revenue generated from existing customers; |
| | • | | managing growth in our operations, including the expansion of our direct sales and marketing operations; and |
| | • | | attracting and retaining key personnel. |
We may not be able to successfully address any of these challenges, risks and difficulties, including the other risks related to our business and industry described below. Failure to adequately do so could adversely affect our business, results of operations or financial condition.
Our solutions are sold pursuant to subscription agreements, and if our existing customers elect either not to renew these agreements or renew these agreements for fewer applications or at a lower price, our business, financial condition and results of operations will be adversely affected.
Our solutions are sold pursuant to annual or multi-year subscription agreements and our customers have no obligation to renew these agreements. As a result, we are not able to consistently and accurately predict future renewal rates. Our customers’ renewal rates may decline or fluctuate or our customers may renew for fewer applications or at a lower price as a result of a number of factors, including their level of satisfaction with our solutions, budgetary concerns or the availability and pricing of competing products. Additionally, we may lose customers due to the high turnover rate in their HR departments. If large numbers of existing customers do not renew these agreements, or renew these agreements on terms less favorable to us, and if we cannot replace or supplement those non-renewals with new subscription agreements generating the same or greater level of revenue, our business, financial condition and results of operations will be adversely affected.
We have incurred operating losses in the past and expect to incur operating losses in the future.
We have incurred operating losses in the past and we expect to incur operating losses in the future. As of March 31, 2007, our accumulated deficit is approximately $29.4 million. Our recent operating losses were $8.3 million for the fiscal year ended March 31, 2007, $3.0 million for the fiscal year ended March 31, 2006, and $1.9 million for the fiscal year ended March 31, 2005. We have not been profitable since our inception, and we may not become profitable. In addition, we expect our operating expenses to increase in the future as we expand our operations. If our operating expenses exceed our expectations, our financial performance could be adversely affected. If our revenue does not grow to offset these increased expenses, we may not become profitable. You should not consider recent revenue growth as indicative of our future performance. In fact, in future periods, we may not have any revenue growth, or our revenue could decline.
Our quarterly results of operations may fluctuate in the future. As a result, we may fail to meet or exceed the expectations of investors or securities analysts which could cause our stock price to decline.
Our quarterly revenue and results of operations may fluctuate as a result of a variety of factors, many of which are outside of our control. If our quarterly revenue or results of operations fall below the expectations of investors or securities analysts, the price of our common stock could decline substantially. Fluctuations in our results of operations may be due to a number of factors, including, but not limited to, those listed below and identified throughout this “Risk Factors” section in this Annual Report on Form 10-K:
| | • | | our ability to retain and increase sales to existing customers and attract new customers; |
23
| | • | | changes in the volume and mix of products sold in a particular quarter; |
| | • | | seasonality of our business cycle, given that our cash flows from operating activities are typically lower in our fiscal first and second quarters and higher in our fiscal third and fourth quarters; |
| | • | | our policy of expensing sales commissions in each year of our customer subscriptions; |
| | • | | the timing and success of new product introductions or upgrades by us or our competitors; |
| | • | | changes in our pricing policies or those of our competitors; |
| | • | | competition, including entry into the market by new competitors and new product offerings by existing competitors; |
| | • | | the amount and timing of expenditures related to expanding our operations, research and development, or introducing new products; |
| | • | | changes in the payment terms for our products and services; and |
| | • | | the purchasing and budgeting cycles of our customers. |
Because our on-demand software is sold pursuant to annual or multi-year subscription agreements and generally we recognize revenue from these subscriptions over the term of the agreement, downturns or upturns in sales may not be immediately reflected in our operating results. Most of our expenses, such as salaries and third party hosting co-location costs, are relatively fixed in the short-term, and our expense levels are based in part on our expectations regarding future revenue levels. As a result, if revenue for a particular quarter is below our expectations, we may not be able to proportionally reduce operating expenses for that quarter, causing a disproportionate effect on our expected results of operations for that quarter.
Due to the foregoing factors, and the other risks discussed in this Annual Report on Form 10-K, you should not rely on quarter-to-quarter comparisons of our results of operations as an indication of our future performance.
Because we recognize revenue over the term of the applicable subscription agreement, the lack of subscription renewals or new subscription agreements may not be immediately reflected in our operating results.
We recognize revenue from our customers over the term of their subscription agreements with us. The substantial majority of our quarterly revenue usually represents deferred revenue from subscriptions sold during previous quarters. As a result, a decline in new or renewed subscription agreements in any one quarter will not necessarily be fully reflected in the revenue for the corresponding quarter but will negatively affect our revenue in future quarters. Additionally, the effect of significant downturns in sales and market acceptance of our solutions may not be fully reflected in our results of operations until future periods. Our business model also makes it difficult for us to reflect any rapid increase in our customer base and the resulting effect of this increase in our revenue in any one period because revenue from new customers will be recognized over the applicable subscription agreement term.
If we fail to successfully migrate to our new accounting system, we may be unable to timely or accurately prepare financial reports.
Historically, our accounting systems have been operated on a platform which may not be adequate to meet our long-term needs as a public company or under the Sarbanes-Oxley Act of 2002, or Sarbanes-Oxley. As a result, we are in the process of upgrading our accounting platform to our new accounting system which we believe provides us with the ability to expand our accounting capabilities as our business grows while providing the necessary accounting controls needed for compliance with Sarbanes-Oxley. Any delay in the implementation of, or disruption in the transition to, our new and enhanced accounting platform could adversely affect our ability to accurately report financial information, including the filing of our quarterly or annual reports with the SEC on a timely and accurate basis. When we convert from prior systems and processes, data integrity problems or other issues may be discovered that if not corrected could impact our business or financial results.
24
If our efforts to attract new customers or to sell additional solutions to our existing customers are not successful, our revenue growth will be adversely affected.
To grow our revenue, we must continually add new customers and sell additional solutions to existing customers. If our existing and prospective customers do not perceive our solutions to be of sufficiently high value and quality, we may not be able to attract new customers or to increase sales to existing customers. Our ability to attract new customers and to sell new solutions to existing customers will depend in large part on the success of our sales and marketing efforts. However, our existing and prospective customers may not be familiar with some of our solutions or may have traditionally used other products and services for some of their compensation management and talent management requirements. In addition, prospective customers may have invested substantial personnel and financial resources in their HR departments or have engaged outside consulting firms or HR BPOs to obtain corporate compensation data and solutions, and may be reluctant or unwilling to migrate to our on-demand compensation management solutions to address their compensation management needs. Existing customers and prospective customers may also decline to purchase our compensation management solutions due to budgetary concerns or the availability and pricing of competing products. If we fail to generate additional business from our existing customers and new customers, our revenue could grow at a slower rate or decrease, which could adversely affect our business, financial condition and results of operations.
If we fail to successfully develop new applications, the growth of our business, our revenues and our results of operations will be materially adversely affected.
We have developed new applications over time that have contributed to the growth of our business to date. For example, we initially launched Job Analyzer in 2000 and have since added the Survey Center, Reporting & Analysis, Salary Structures and CompAnalyst Executive modules to create our CompAnalyst suite. Products in the on-demand compensation management market typically take years to develop widespread market acceptance. We expect to rely on newly introduced applications for a substantial portion of our growth for the foreseeable future. For example, in 2004, we introduced our TalentManager suite of enterprise pay-for-performance applications. We anticipate that, as with any on-demand compensation management application, it may be an extended period of time before TalentManager achieves market acceptance. If we are unable to continue to develop and launch new applications or if our new applications are not able to achieve market acceptance, our business, financial condition and results of operations will be materially adversely affected.
If the economy worsens or labor market conditions deteriorate materially, our business may be harmed.
To the extent that the economy or labor market conditions materially deteriorate, our existing and potential clients may no longer consider investment in their compensation and talent management systems a necessity, or may elect to defer purchases or reduce budgets in these areas. Either of these developments could have an adverse effect on our business, financial condition and results of operations.
If we do not continue to innovate and provide compensation management solutions that are useful to users, we may not remain competitive, and our revenues and operating results could suffer.
Our success depends on providing compensation management solutions that HR decision makers may use to make compensation decisions and individuals may use to assess their worth in the job market. Our competitors are constantly developing innovations in compensation management solutions. Additionally, the market for our on-demand software is characterized by changes in customer requirements, changes in protocols and evolving industry standards. As a result, we must continue to invest significant resources in research and development in order to improve and enhance the responsiveness, functionality and features of our existing applications and develop new applications so that we may offer a complete suite of solutions that are easy to use and effective. In particular, we will need to expand our offering to more comprehensively address our customers’ compensation management needs. If our innovations are not responsive to the needs of our users, they may become dissatisfied and move to competitors’ products and services, which would significantly impair our revenue growth, operating results and reputation. In addition, if we are unable to predict user preferences or industry changes, or if we are
25
unable to modify our offerings on a timely basis, we may lose customers. Our operating results would also suffer if our innovations are not appropriately timed with market opportunities or are not effectively brought to market.
Failure to effectively develop and expand our sales and marketing capabilities could harm our ability to increase our customer base and achieve broader market acceptance of our solutions.
Increasing our customer base and achieving broader market acceptance of our solutions will depend to a significant extent on our ability to expand our direct sales and marketing operations. We plan to continue to expand our direct sales force in our Waltham, Massachusetts office. Competition for our direct sales personnel is intense. Because the majority of our direct sales personnel will be located in our Massachusetts office, we will select candidates primarily from the Massachusetts labor market. We may have difficulty hiring qualified candidates, particularly individuals with both compensation management and sales experience, or may incur additional costs related to training new employees without a compensation or sales background. We have from time to time in the past experienced, and we expect to continue to experience in the future, difficulty in hiring and retaining highly skilled direct sales personnel with appropriate qualifications.
Our sales force currently consists primarily of direct sales personnel who sell our products over the telephone. As we expand our offerings and our customer base, it may be necessary for our sales personnel to increase the frequency of in-person meetings with our customers in order to sell our products, which will increase the costs incurred in the sales process, will require us to hire additional sales personnel and may extend the length of our typical sales cycle.
Our expansion will require us to invest significant financial and other resources in the sales and marketing functions. New sales personnel are often not profitable during their first year with us. Our business will be seriously harmed if the expansion of the direct sales force does not generate a corresponding significant increase in revenue. We may not achieve anticipated revenue growth from expanding our direct sales force if we are unable to hire and develop talented direct sales personnel, if our new direct sales personnel are unable to achieve desired productivity levels in a reasonable period of time or if we are unable to retain our existing direct sales personnel.
If we fail to develop or maintain our brand cost-effectively, our business may suffer.
We believe that developing and maintaining awareness of our brand in a cost-effective manner is critical to achieving widespread acceptance of our existing and future applications and is an important element in attracting new customers and increasing business with existing customers. Successful promotion of our brand will depend largely on the effectiveness of our marketing efforts and on our ability to provide reliable and useful solutions. Brand promotion activities may not yield increased revenue, and even if they do, any increased revenue may not offset the expenses we incur in building our brand. To date, we have developed our brand at a low cost primarily by partnering with large Internet companies who drive traffic to our web site. Our strategy of partnering with large Internet companies may not continue to build awareness of our brand at the rate we expect. If we are unable to rely on the low cost distribution strategy of partnering with these Internet companies, we would incur costs to replace this distribution which would adversely affect our results of operations. If we fail to successfully promote and maintain our brand, or incur substantial expenses in an unsuccessful attempt to promote and maintain our brand, we may fail to attract new customers or retain our existing customers to the extent necessary to realize a sufficient return on our brand-building efforts, and our business could suffer.
We are dependent on our executive officers, and the loss of any of them may prevent us from implementing our business plan in a timely manner if at all.
Our success depends largely upon the continued services of our executive officers and other key personnel, particularly Kent Plunkett, our Chairman, President and Chief Executive Officer, and Yong Zhang, our Executive Vice President, Chief Operating Officer and Chief Technology Officer. We are also substantially dependent on
26
the continued service of our existing development personnel because of the complexity of our products and technologies, as well as on our existing personnel with both compensation management and technical experience because of the difficulty we have had hiring individuals who have experience in both of these fields. Although we currently maintain a key man life insurance policy on Kent Plunkett, this insurance would not adequately compensate us for the loss of his services. The loss of one or more of our key employees could seriously harm our business.
We may not be able to attract and retain the highly skilled employees we need to support our planned growth.
To execute our business strategy, we must attract and retain highly qualified personnel. Competition for these personnel is intense, especially for senior direct sales personnel with compensation management experience and engineers with high levels of experience in designing and developing on-demand software. We have from time to time in the past experienced, and we expect to continue to experience in the future, difficulty in hiring and retaining highly skilled employees with appropriate qualifications. Many of the companies with which we compete for experienced personnel have greater resources than we do. In addition, in making employment decisions, particularly in the Internet and high-technology industries, job candidates often consider the value of the stock options or restricted stock they are to receive in connection with their employment. Significant volatility in the price of our stock may, therefore, adversely affect our ability to attract or retain key employees. If we fail to attract new personnel or fail to retain and motivate our current personnel, our business and future growth prospects could be severely harmed.
Our growth could strain our personnel and infrastructure resources, and if we are unable to implement appropriate controls and procedures to manage our growth, we may not be able to successfully implement our business plan.
Rapid growth in our headcount and operations may place a significant strain on our management, administrative, operational and financial infrastructure. Between March 31, 2004 and March 31, 2007, the number of our full time equivalent employees increased from 68 to 255. We anticipate that additional growth will be required in order to increase our customer base and handle an increase in the volume of our business.
Our success will depend in part upon the ability of our senior management to manage growth effectively. To do so, we must continue to hire, train and manage new employees as needed. To date, we have not experienced any significant problems as a result of the rapid growth in our headcount, other than occasional office space constraints. However, our anticipated future growth may place greater strains on our resources. For instance, if our new hires perform poorly, or if we are unsuccessful in hiring, training, managing and integrating these new employees as needed, or if we are not successful in retaining our existing employees, we may not be able to handle any increase in the volume of our business and our business may be harmed. As we continue to grow, we may outgrow our current space in Waltham, Massachusetts and Shanghai, China or desire to open additional offices domestically and internationally, which will require us to expend additional financial resources and make it more difficult to manage employees not located at our principal headquarters and maintain uniform standards, controls, procedures and policies across locations. If we determine that it is necessary or desirable to open additional offices, whether domestically or internationally, management resources will be allocated to integrating new offices, handling cultural and language issues arising from international operations and managing costs associated with a multi-office organization. Such focus could divert management’s attention from managing ongoing business operations.
To manage the expected growth of our operations and personnel, we will need to continue to improve our operational, financial and management controls and our reporting systems and procedures. The additional headcount and capital investments we expect to add will increase our cost base, which will make it more difficult for us to offset any future revenue shortfalls by offsetting expense reductions in the short term. If we fail to successfully manage our growth, we will be unable to execute our business plan.
27
Our data is obtained from a variety of sources, some of which may not be available to us in the future.
Our proprietary compensation data sets are comprised of extensive data. We obtain our data from a variety of sources, including major consulting firms and our partners, the SEC and other U.S. government agencies and other third party providers, and through our own research efforts. We generally obtain data on a non-exclusive basis and in a summary form. While we do not generally have an ability to resell such data in its entirety, we use such data internally in generating our proprietary data sets. We cannot assure you that the data we require for our proprietary data sets will be available from these sources in the future or that the cost of such data will not increase. From time to time in the past, third parties, including Mercer Human Resource Consulting, or Mercer, have sent us letters asserting that our use of data may have violated our agreement with them or infringed upon their copyright, and on February 1, 2007, Mercer filed a Complaint against us in the United States District Court for the Southern District of New York. The Complaint alleges copyright infringement, unfair competition, false representation, fraud, breach of contract and tortious interference with business relations. Specifically, the Complaint asserts that our use of Mercer surveys infringes upon Mercer’s copyrights, that we have breached, and have induced our customers to breach, license agreements with Mercer, that we have attempted to deceive Mercer in connection with our acquisition of Mercer surveys, and that we have misrepresented our rights to use Mercer’s surveys to our current and potential customers. The Complaint seeks injunctive relief and monetary damages. Although we believe that our purchase and use of all third party surveys (including Mercer’s) complies with copyright law and any applicable license agreements, we cannot assure you that we will prevail in this claim or other claims asserted against us and any litigation, regardless of its validity, may involve significant costs and could divert our management’s time and attention from developing our business.
If Mercer or another third party successfully asserts a claim that we have violated their copyrights or our license agreements with them, we may be required to remove the applicable data from our data sets and regenerate our data sets without such data. Additionally, we may no longer be able to obtain data from the provider or other providers on reasonable terms, if at all. Any inability to obtain data may have a material adverse effect on our business, financial condition and results of operations.
Further, as we expand our customer base to include customers outside of the United States, we may not be able to obtain sufficient international data on reasonable terms to support our data sets. We plan to obtain data which we believe is sufficient to build proprietary data sets in order to support the development of an international business. We expect to incur substantial expense to build proprietary data sets for international markets. We cannot assure you that we will be able to successfully obtain sufficient data to develop proprietary data sets for international markets.
We may expand through acquisitions of, investments in or through business relationships with other organizations, all of which may divert our management’s attention, result in additional dilution to our stockholders, consume resources that are necessary to sustain our business and may not result in the realization of the goals underlying the acquisition, investment or business relationship.
One of our business strategies is to selectively pursue the acquisition of companies that would either expand the functionality of our compensation management and talent management solutions or provide access to new customers or markets, or both. In May 2007, we acquired ICR Limited, L.C. and ICR International Ltd. (ICR), a premier provider of specialty consumer goods and global technology compensation data and software. In April 2006, we acquired the assets of the eComp division of Aon Consulting, Inc. See “Management’s Discussion and Analysis of Financial Condition and Results of Operations—Liquidity and Capital Resources.” We also may enter into business relationships with other organizations in order to expand our offerings, which could involve preferred or exclusive licenses, additional channels of distribution or discount pricing or investments in other organizations. An acquisition, investment or business relationship may result in unforeseen operating difficulties and expenditures. In particular, we may encounter difficulties assimilating or integrating the acquired organizations, technologies, products, personnel or operations of the acquired organizations, particularly if the key personnel of the acquired company choose not to work for us, and we may have difficulty retaining the customers of any acquired business due to changes in management and ownership. Acquisitions may also disrupt
28
our ongoing business, divert our resources and require significant management attention that would otherwise be available for ongoing development of our business. We also may experience lower rates of renewal from customers obtained through acquisitions than we do from existing customers. Additionally, to the extent we expand into new facilities, we may have difficulty maintaining uniform standards, controls, procedures and policies across locations. Moreover, we cannot assure you that the anticipated benefits of any acquisition, investment or business relationship would be realized or that we would not be exposed to unknown liabilities. In connection with one or more of these transactions, we may:
| | • | | issue additional equity securities that would dilute our existing stockholders’ ownership; |
| | • | | use cash that we may need in the future to operate our business; |
| | • | | incur debt on terms unfavorable to us or that we are unable to repay; |
| | • | | incur large charges or substantial liabilities; |
| | • | | encounter difficulties retaining key employees of an acquired company or integrating diverse business cultures; and |
| | • | | become subject to adverse tax and accounting consequences. |
Although we periodically engage in preliminary discussions with respect to acquisitions, we are not currently a party to any agreement or commitment, and we have no understandings with respect to any acquisition.
We face competition from a variety of sources, and our failure to compete successfully could make it difficult for us to add new customers and retain existing customers and could reduce or impede the growth of our business.
The market for on-demand compensation management and talent management solutions is fragmented, competitive and rapidly evolving, and there are low barriers to entry to some segments of this market. We expect the intensity of competition to increase in the future as existing competitors develop their capabilities and as new companies enter our market. Additionally, as we expand our suite of compensation management and talent management solutions and create new types of applications, we may face additional competition. Increased competition could result in pricing pressure, reduced sales, lower margins or the failure of our solutions to achieve or maintain broad market acceptance. If we are unable to compete effectively, it will be difficult for us to maintain our pricing rates and add and retain customers, and our business, financial condition and results of operations will be seriously harmed. We face competition primarily from:
| | • | | generic desktop software and in-house or custom-developed solutions; |
| | • | | established software vendors offering products specifically designed for compensation management or talent management; |
| | • | | established compensation and HR consulting firms; |
| | • | | other websites and advertising venues; and |
| | • | | existing and future start-up companies offering software, data and interactive compensation solutions. |
Many of our current and potential competitors have longer operating histories, a larger presence in the general corporate compensation and talent management market, access to larger customer bases and substantially greater financial, technical, sales and marketing, management, service, support and other resources than we have. As a result, our competitors may be able to respond more quickly than we can to new or changing opportunities, technologies, standards or customer requirements or devote greater resources to the promotion and sale of their products and services than we can. To the extent our competitors have an existing relationship with a potential customer, that customer may be unwilling to switch vendors due to existing commitments with such competitors.
29
We also expect that new competitors, including companies currently operating in the HR market, enterprise software vendors and online service providers that have traditionally focused on enterprise resource planning or back office applications will enter the on-demand compensation management market with competing products as this market develops and matures. Many of these potential competitors have established or may establish business, financial or strategic relationships among themselves or with existing or potential customers, alliance partners or other third parties or may combine and consolidate to become more formidable competitors with better resources. It is possible that these new competitors could rapidly acquire significant market share.
Mergers or other strategic transactions involving our competitors could weaken our competitive position or reduce our revenue.
We believe that our industry is highly fragmented and that there is likely to be consolidation, which could lead to increased price competition and other forms of competition. Increased competition may cause pricing pressure and loss of market share, either of which could have a material adverse effect on our business, financial condition and results of operations. Our competitors may establish or strengthen cooperative relationships with HR BPO vendors, systems integrators, third party consulting firms or other parties. Established companies may not only develop their own products but may also merge with or acquire our current competitors. In addition, we may face competition in the future from large established companies, as well as from emerging companies that have not previously entered the markets for compensation management and talent management solutions or that currently do not have products that directly compete with our solutions. It is also possible that new competitors or alliances among competitors may emerge and rapidly acquire significant market share. In addition, our competitors may announce new products, services or enhancements that better meet the price or performance needs of clients or changing industry standards.
If there are interruptions or delays in our on-demand services due to third-party error, our own error or the occurrence of unforeseeable events, delivery of our solutions and the use of our service could become impaired, which could harm our relationships with customers and subject us to liability.
All of our solutions reside on hardware that we own or lease and operate and which is currently located in a third party operations facility maintained and operated by AT&T in Watertown, Massachusetts. We do not maintain long-term supply contracts with AT&T, and AT&T does not guarantee that our customers’ access to our solutions will be uninterrupted, error-free or secure. Our operations depend on AT&T’s ability to protect their and our systems in their facilities against damage or interruption from natural disasters, power or telecommunications failures, computer viruses or other attempts to harm our systems, criminal acts and similar events. In the event that our operations facility arrangement with AT&T is terminated, or there is a lapse of service or damage to such facility, we could experience interruptions in our service as well as delays and additional expense in arranging new facilities and services.
Our disaster recovery computer hardware and systems located at our headquarters in Waltham, Massachusetts have not been tested under actual disaster conditions and may not have sufficient capacity to recover all data and services in the event of an outage occurring at our operations facility. In the event of a disaster in which our operations facility was irreparably damaged or destroyed, we could experience lengthy interruptions in our service. Moreover, our disaster recovery computer hardware and systems are located within five miles of our operations facility and may be equally or more affected by any disaster affecting our operations facility. Any or all of these events could cause our customers to lose access to our on-demand software.
Our on-demand compensation management and talent management solutions are accessed by a large number of customers at the same time. As we continue to expand the number of our customers and applications available to our existing clients, we may not be able to scale our technology to accommodate the increased capacity requirements, which may result in interruptions or delays in services. In addition, the failure by the AT&T facility to meet our capacity requirements could result in interruptions or delays in our service or impede our ability to scale our operations.
30
We design the system infrastructure and procure and own or lease the computer hardware used for our on-demand services. Design and mechanical errors, spikes in usage volume and failure to follow system protocols and procedures could cause our systems to fail, resulting in interruptions in our service. While we have not experienced extended system failures in the past, any interruptions or delays in our service, whether as a result of third-party error, our own error, natural disasters or security breaches, whether accidental or willful, could harm our relationships with customers and our reputation. Also, in the event of damage or interruption, our insurance policies may not adequately compensate us for any losses that we may incur. These factors in turn could damage our brand and reputation, divert our employees’ attention, reduce our revenue, subject us to liability, cause us to issue credits or cause customers to fail to renew their subscriptions, any of which could adversely affect our business, financial condition and results of operations.
Material defects or errors in our on-demand software could affect our reputation, result in significant costs to us and impair our ability to sell our solutions, which would harm our business.
The software applications forming part of our solutions may contain material defects or errors, which could materially and adversely affect our reputation, result in significant costs to us and impair our ability to sell our solutions in the future. After the release of our products, defects or errors may also be identified from time to time by our internal team and by our clients. The costs incurred in correcting any material product defects or errors may be substantial and would adversely affect our operating results. Such defects or errors may occur in the future.
Because our customers use our solutions for important aspects of their business, any errors or defects in, or other performance problems with, our solutions could hurt our reputation and may damage our customers’ businesses. If that occurs, we could lose future sales or our existing customers could elect not to renew their agreements with us. Software performance problems could result in loss of market share, failure to achieve, or a delay in achieving, market acceptance of our solutions and the diversion of development resources. If one or more of our solutions fail to perform or contain a technical defect, a customer may assert a claim against us for substantial damages, whether or not we are responsible for our solutions’ failure or defect. We do not currently maintain any warranty reserves.
Product liability claims could require us to spend significant time and money in litigation or arbitration/dispute resolution or to pay significant settlements or damages. Although we maintain general liability insurance, including coverage for errors and omissions, this coverage may be inadequate, or may not be available in the future on reasonable terms, or at all. Defending a lawsuit, regardless of its merit, could be costly and divert management’s attention and could cause our business to suffer.
We may be liable to our customers and may lose customers if we provide poor service, if our solutions do not comply with our agreements or if there is a loss of data.
The information used in our proprietary data sets may not be complete or may contain inaccuracies that our customers regard as significant. Our ability to collect and report data may be interrupted by a number of factors, including the termination of agreements with third-party data providers, our inability to access the Internet, the failure of our network or software systems or failure by our operations facility to meet our capacity requirements. In addition, computer viruses and intentional or unintentional acts of our employees may harm our systems, causing us to lose data we maintain and supply to our customers or data that our customers input and maintain on our systems, and the transmission of computer viruses could expose us to litigation. Our subscription agreements generally give our customers the right to terminate their agreements for cause if we materially breach our obligations. Any failures in the services that we supply or the loss of any of our customers’ data that we cannot rectify in a reasonable time period may give our customers the right to terminate their agreements with us and could subject us to liability. As a result, we may also be required to spend substantial amounts to defend lawsuits and pay any resulting damage awards. In addition to potential liability, if we supply inaccurate data or experience interruptions in our ability to supply data, our reputation could be harmed and we could lose customers.
31
Although we maintain general liability insurance, including coverage for errors and omissions, this coverage may be inadequate, or may not be available in the future on reasonable terms, or at all. In addition, we cannot assure you that this policy will cover any claim against us for loss of data or other indirect or consequential damages and defending a lawsuit, regardless of its merit, could be costly and divert management’s attention.
Reductions in information technology spending could limit our ability to grow our business.
Our operating results may vary based on changes in the information technology, or IT, spending of our clients. The revenue growth and profitability of our business depend on the overall demand for enterprise application software and services. We sell our solutions primarily to large organizations whose businesses fluctuate with general economic and business conditions. As a result, decreased demand for enterprise application software and services, and in particular on-demand compensation management solutions, caused by a weakening global economy or otherwise may cause a decline in our revenue. Historically, economic downturns have resulted in overall reductions in corporate IT spending. In particular, compensation management software may be viewed by some of our existing and potential clients as a lower priority and may be among the first expenditures reduced as a result of unfavorable economic conditions. In the future, potential clients may decide to reduce their IT budgets by deferring or reconsidering product purchases, which would negatively affect our operating results.
Because our products collect and analyze applicants’ and employees’ stored personal information, concerns that our products do not adequately protect the privacy of applicants and employees could result in liability to us and inhibit sales of our products.
Some of the features of our compensation management and talent management applications depend on the ability to develop and maintain profiles of applicants and employees for use by our clients. Our software applications augment these profiles over time by capturing additional data and collecting usage data. Although our applications are designed to protect user privacy, privacy concerns nevertheless may cause individuals and businesses to resist providing the personal data necessary to support our products. Any inability to adequately address privacy concerns, even if unfounded, or comply with applicable privacy laws and regulations, could result in liability to us, damage our reputation, inhibit sales of our products and seriously harm our business, financial condition and operating results.
As we extend our operations outside of the United States, we may become subject to various data protection regulations such as those adopted by the European Union related to the confidentiality of personal data.
If our security measures are breached and unauthorized access is obtained to client data, clients may curtail or stop their use of our solutions, which would harm our business, financial condition and results of operations.
Our solutions involve the storage and transmission of confidential information of clients and their existing and potential employees, and security breaches could expose us to a risk of loss of, or unauthorized access to, this information, resulting in possible litigation and possible liability. Although we have never sustained such a breach, if our security measures were ever breached as a result of third-party action, employee error, malfeasance or otherwise, and, as a result, an unauthorized party obtained access to this confidential data, our reputation could be damaged, our business could suffer and we could incur significant liability. Techniques used to obtain unauthorized access or to sabotage systems change frequently and generally are not discovered until launched against a target. As a result, we may be unable to anticipate these techniques or to implement adequate preventative measures. If an actual or perceived breach of our security occurs, the market perception of our security measures could be harmed and we could lose sales and clients.
32
We may increase our sales and marketing efforts to clients outside the United States and open offices outside the United States, which would expose us to additional risks associated with international operations.
As a part of our future business strategy, we intend to increase our operations outside the United States, including our international sales efforts. In December 2006, we established a wholly foreign owned enterprise in Shanghai, China primarily for software development. In connection with the ICR acquisition, we now have a senior business development representative in Europe. While we have no additional specific plans or commitments with respect to any further international expansion, we may open additional offices outside of the United States in the future. We may not be successful in our efforts to establish our Chinese operations or to expand our sales into international markets and open additional international offices. International operations and sales subject us to risks and challenges that we would otherwise not face if we conducted our business only in the United States including:
| | • | | legal and regulatory restrictions; |
| | • | | challenges caused by distance, language and cultural differences and in doing business with foreign agencies and governments; |
| | • | | difficulties obtaining additional data sources that cover international job markets at a reasonable cost; |
| | • | | difficulties obtaining the data necessary to support international customers on reasonable terms, if at all; |
| | • | | difficulties developing algorithms that can be used to generate and analyze data on international job markets; |
| | • | | difficulties in developing products and services in different languages and for different cultures; |
| | • | | difficulties in managing and staffing international operations; |
| | • | | challenges in protecting data and intellectual property; |
| | • | | longer payment cycles in some countries; |
| | • | | credit risk and higher levels of payment fraud; |
| | • | | currency exchange rate fluctuations; |
| | • | | political and economic instability and export restrictions; |
| | • | | potentially adverse tax consequences, including the complexities of foreign value added tax systems and restrictions on the repatriation of earnings; and |
| | • | | higher costs associated with doing business internationally. |
Our limited experience with conducting business internationally increases our risk of operating internationally and requires management to focus additional attention and resources on our international operations. These risks could harm our international expansion efforts or other aspects of our business, which would in turn harm our business, financial condition and results of operations.
Evolving regulation of the Internet may increase our expenditures related to compliance efforts, which may adversely affect our financial condition.
As Internet commerce continues to evolve, increasing regulation by federal, state or foreign agencies becomes more likely. We are particularly sensitive to these risks because the Internet is a critical component of our on-demand business model. For example, we believe that increased regulation is likely in the area of data privacy, and laws and regulations applying to the solicitation, collection, processing or use of personal or consumer information could affect our clients’ ability to use and share data, potentially reducing demand for solutions accessed via the Internet and restricting our ability to store, process and share data with our clients via
33
the Internet. In addition, taxation of services provided over the Internet or other charges imposed by government agencies or by private organizations for accessing the Internet may also be imposed. Any regulation imposing greater fees for Internet use or restricting information exchange over the Internet could result in a decline in the use of the Internet and the viability of Internet-based services, which could harm our business.
The success of our business depends on the continued growth and acceptance of the Internet as a business and communications tool, and the related expansion of the Internet infrastructure.
The future success of our business depends upon the continued and widespread adoption of the Internet as a primary medium for commerce, communication and business applications. Our business growth would be impeded if the performance or perception of the Internet was harmed by security problems such as “viruses,” “worms” and other malicious programs, reliability issues arising from outages and damage to Internet infrastructure, delays in development or adoption of new standards and protocols to handle increased demands of Internet activity, increased costs, decreased accessibility and quality of service or increased government taxation of Internet activity.
The Internet has experienced, and is expected to continue to experience, significant user and traffic growth, which has, at times, caused user frustration with slow access and download times. If Internet activity grows faster than Internet infrastructure or if the Internet infrastructure is otherwise unable to support the demands placed on it, or if hosting capacity becomes scarce, our business growth may be adversely affected.
If we are unable to protect our proprietary technology and other intellectual property rights, it will reduce our ability to compete for business and we may lose valuable assets, experience reduced revenue and incur costly litigation to protect our rights.
Our intellectual property rights are important to our business, and our success is dependent, in part, on protecting our proprietary technology and our brand, marks and domain names. In particular, the processes we use when working with the data we obtain, including the use of algorithms and other analytical tools, are critical to the accuracy of our data sets and the success of our business. We rely on a combination of patent, copyright, trademark and trade secret laws, as well as licensing agreements, third-party nondisclosure agreements and other contractual provisions and technical measures, to protect our intellectual property rights. These protections may not be adequate to prevent our competitors from copying our solutions or otherwise infringing on our intellectual property rights. Existing copyright laws afford only limited protection for our intellectual property rights and may not protect such rights in the event competitors independently develop solutions similar or superior to ours. In addition, the laws of some countries in which our solutions are or may be licensed may not protect our solutions and intellectual property rights to the same extent as do the laws of the United States.
To protect our proprietary methods, we have one U.S. issued patent and corresponding foreign equivalents, and currently have three U.S. patent applications pending and corresponding foreign equivalents. We cannot assure you that the U.S. Patent and Trademark Office (or its foreign equivalents) will grant these patents, or that the patents granted will give us the protection that we seek.
To protect our trade secrets and other proprietary information, we require employees, consultants, advisors and collaborators to enter into non-disclosure agreements. These agreements may not provide meaningful protection for our trade secrets, know-how or other proprietary information in the event of any unauthorized use, misappropriation or disclosure of such trade secrets, know-how or other proprietary information.
We will not be able to protect our intellectual property if we do not detect unauthorized use of our intellectual property. If we discover that a third party is infringing upon our intellectual property rights, we may need to undertake costly and time-consuming litigation to enforce our intellectual property rights. We cannot be sure we will prevail in any litigation filed to protect our intellectual property, and even if we are successful in protecting our intellectual property rights, we may incur significant legal costs and management’s attention may
34
be diverted from the ongoing development of our business, which could adversely affect our business. If we are unable to protect our intellectual property, our competitors could use our intellectual property to market products similar to ours, which could decrease demand for our solutions.
If a third party asserts that we are infringing its intellectual property, whether successful or not, it could subject us to costly and time-consuming litigation or expensive licenses, and our business may be harmed.
The software and Internet industries are characterized by the existence of a large number of patents, trademarks and copyrights and by frequent litigation based on allegations of infringement or other violations of intellectual property rights. Third parties may assert patent and other intellectual property infringement claims against us in the form of lawsuits, letters, or other forms of communication. If a third party successfully asserts a claim that we are infringing their proprietary rights, royalty or licensing agreements might not be available on terms we find acceptable or at all. As currently pending patent applications are not publicly available, we cannot anticipate all such claims or know with certainty whether our technology infringes the intellectual property rights of third parties.
In February 2007, Mercer filed a complaint against us alleging copyright infringement, unfair competition, false representation, fraud, breach of contract and tortious interference with business relations. See “Legal Proceedings” for more information. Any litigation, with or without merit, could be time consuming and expensive to litigate or settle and could divert management’s attention from our business. Any license agreement we enter into with the patent holder could have unfavorable terms, including royalty payments, which could adversely affect our business.
In order to obtain certain of the necessary data that serves as the backbone of our compensation management solutions, we enter into agreements with major consulting firms and other third-party providers. We generally receive data in a summary form. We do not generally have an ability to resell such data in its entirety, but we can use such data internally to generate our proprietary data sets. If a third party successfully asserts a claim that our use of its data has violated our agreement with such provider or infringed upon their copyright, we may be required to remove the applicable data from our data sets and regenerate our data sets without such data. Additionally, we may no longer be able to obtain data from the provider or other providers on reasonable terms, if at all.
We expect that the number of infringement and breach of contract claims in our market will increase as the number of solutions and competitors in our industry grows. These claims, whether or not successful, could:
| | • | | require significant management time and attention; |
| | • | | result in costly and time-consuming litigation, and the payment of substantial damages; |
| | • | | require us to enter into royalty or licensing agreements, which may not be available on terms acceptable to us, if at all; |
| | • | | require us to remove data from our compensation management data sets and regenerate our data sets without such data; |
| | • | | require us to expend additional development resources to redesign our solutions to avoid infringement or discontinue the sale of our solutions; |
| | • | | create negative publicity that adversely affects our reputation and brand and the demand for our solutions; or |
| | • | | require us to indemnify our clients. |
As a result, any third-party intellectual property infringement claims or breach of contract claims against us could increase our expenses and adversely affect our business. In addition, many of our customer agreements require us to indemnify our customers for third-party intellectual property infringement claims, which would
35
increase the cost to us resulting from an adverse ruling in any such claim. Even if we have not infringed any third parties’ intellectual property rights, we cannot be sure our legal defenses will be successful, and even if we are successful in defending against such claims, our legal defense could require significant financial resources and management’s time, which could adversely affect our business.
We might require additional capital to support business growth, and this capital might not be available.
We intend to continue to make investments to support our business growth and may require additional funds to respond to business challenges, including the need to develop new software or enhance our existing solutions, enhance our operating infrastructure and acquire complementary businesses and technologies. Accordingly, we may need to complete additional equity or debt financings to secure additional funds. We cannot assure you that further equity or debt financing will be available on acceptable terms. If we raise additional funds through further issuances of equity or convertible debt securities, our existing stockholders could suffer significant dilution, and any new equity securities we issue could have rights, preferences and privileges superior to those of holders of our common stock.
Our reported financial results may be adversely affected by changes in accounting principles generally accepted in the United States.
Generally accepted accounting principles in the United States are subject to interpretation by the Financial Accounting Standards Board, or FASB, the American Institute of Certified Public Accountants, the Securities and Exchange Commission, or SEC, and various bodies formed to promulgate and interpret appropriate accounting principles. A change in these principles or interpretations could have a significant effect on our reported financial results, and could affect the reporting of transactions completed before the announcement of a change.
Our ability to use net operating loss carryforwards in the United States may be limited.
As of March 31, 2007, we had net operating loss carryforwards of approximately $16.4 million for federal tax purposes. These loss carryforwards expire at various dates through 2027. To the extent available, we intend to use these net operating loss carryforwards to reduce the U.S. corporate income tax liability associated with our operations. Section 382 of the U.S. Internal Revenue Code of 1986 generally imposes an annual limitation on the amount of net operating loss carryforwards that may be used to offset taxable income when a corporation has undergone significant changes in stock ownership. Our ability to utilize net operating loss carryforwards may be limited by the issuance of common stock in our initial public offering. To the extent our use of net operating loss carryforwards is significantly limited, our income could be subject to U.S. corporate income tax earlier than it would if we were able to use net operating loss carryforwards, which could result in lower profits.
Being a public company will increase our administrative costs.
As a public company, we have incurred and will continue to incur significant legal, accounting and other expenses that we did not incur as a private company. Sarbanes-Oxley, as well as new rules subsequently implemented by the SEC and the Nasdaq Global Market, have required changes in corporate governance practices of public companies. These new rules and regulations have increased our legal and financial compliance costs, and have made some activities more time consuming and/or costly. For example, we are migrating our core financial systems to our new accounting system and adopting additional internal controls and disclosure controls and procedures. We have also retained a transfer agent and a financial printer and adopted corporate governance policies. In addition, as a public company we have all of the internal and external costs of preparing and distributing periodic public reports in compliance with our obligations under the securities laws. These new rules and regulations could also make it more difficult for us to attract and retain qualified members of our board of directors, particularly to serve on our audit committee, and qualified executive officers.
Beginning with our annual report for the year ending March 31, 2008, Section 404 of Sarbanes-Oxley requires us to include an internal control report with our annual report on Form 10-K. That report must include
36
management’s assessment of the effectiveness of our internal control over financial reporting as of the end of the fiscal year. Additionally, beginning with our annual report on Form 10-K for the year ending March 31, 2009, our independent registered public accounting firm will be required to issue a report on its evaluation of the operating effectiveness of our internal control over financial reporting. The significant deficiencies and any other deficiencies in internal control that we currently have identified and that we may identify in the future will need to be addressed as part of the evaluation of our internal control over financial reporting and may impair our ability to comply with Section 404. If we are not able to successfully implement internal control over financial reporting, we may not be able to accurately and timely report on our financial position, results of operations or cash flows, which could adversely affect our business and investor confidence in us.
See Item 9A, “Controls and Procedures,” for a description of the significant deficiencies in our internal control over financial reporting identified by our independent registered public accounting firm and the status of our remediation efforts.
An active trading market for our common stock may not be available on a consistent basis to provide stockholders with adequate liquidity. Our stock price may be extremely volatile, and our stockholders could lose a significant part of their investment.
Prior to February 15, 2007, there was no public market for our common stock. An active trading market for shares of our common stock may not be sustained on a consistent basis. The public trading price for our common stock will be affected by a number of factors, including:
| | • | | quarterly variations in our operating results; |
| | • | | seasonality of our business cycle; |
| | • | | changes in the market’s expectations about our operating results; |
| | • | | our operating results failing to meet the expectation of securities analysts or investors in a particular period or failure of securities analysts to publish reports about us or our business; |
| | • | | changes in financial estimates and recommendations by securities analysts concerning our company or the on-demand software industry in general; |
| | • | | operating and stock price performance of other companies that investors deem comparable to us; |
| | • | | news reports relating to trends in our markets; |
| | • | | announcements by us or our competitors of acquisitions, new offerings or improvements, significant contracts, commercial relationships or capital commitments; |
| | • | | our ability to market new and enhanced offerings on a timely basis; |
| | • | | changes in laws and regulations affecting our business; |
| | • | | commencement of, or involvement in, litigation; |
| | • | | the volume of shares of our common stock available for public sale; |
| | • | | any major change in our board or management; |
| | • | | sales of substantial amounts of common stock by our directors, executive officers or significant stockholders or the perception that such sales could occur; |
| | • | | general economic and political conditions such as recessions and acts of war or terrorism; and |
| | • | | the other factors described elsewhere in these “Risk Factors.” |
As a result of these factors, our stockholders may not be able to resell their shares at, or above, their purchase price.
37
In addition, prior to our public offering, we received very limited analyst coverage. The trading market for our common stock will rely in part on the research and reports that industry or financial analysts publish about us or our business. We do not control these analysts. There are many large, well-established publicly-traded companies active in our industry and market, which may mean it will be less likely that we receive widespread analyst coverage. Furthermore, if one or more of the analysts who do cover us downgrade our stock, our stock price would likely decline rapidly. If one or more of these analysts cease coverage of us, we could lose visibility in the market, which in turn could cause our stock price to decline and may also impair our ability to expand our business with existing customers and attract new customers.
The concentration of our capital stock ownership with insiders will likely limit your ability to influence corporate matters.
Our employees, current 5% or greater stockholders and affiliated entities together beneficially own approximately 40% of our common stock. As a result, these stockholders, acting together, will have control over most matters that require approval by our stockholders, including the election of directors and approval of significant corporate transactions. Corporate action might be taken even if other stockholders oppose them. This concentration of ownership might also have the effect of delaying or preventing a change of control of our company that other stockholders may view as beneficial. In addition, Kent Plunkett, our Chairman, President and Chief Executive Officer, beneficially owns approximately 24% of our common stock. Mr. Plunkett’s significant ownership interest could adversely affect investors’ perception of our corporate governance or delay, prevent or cause a change in control of our company, any of which could adversely affect the market price of our common stock.
Future sales, or the availability for sale, of our common stock may cause our stock price to decline.
A total of approximately 6.9 million shares of common stock may be sold in the public market by existing stockholders on or about August 16, 2007, subject to applicable volume and other limitations imposed under federal securities law. Sales of substantial amounts of our common stock in the public market on or after such date, or the perception that such sales could occur, could adversely affect the market price of our common stock and could materially impair our future ability to raise capital through offerings of our common stock.
Provisions in our amended and restated certificate of incorporation and bylaws or Delaware law might discourage, delay or prevent a change of control of our company or changes in our management and, therefore, depress the trading price of our stock.
Our amended and restated certificate of incorporation and bylaws contain provisions that could depress the trading price of our common stock by acting to discourage, delay or prevent a change in control of our company or changes in our management that the stockholders of our company may deem advantageous. These provisions include:
| | • | | our board of directors is divided into three classes serving staggered three-year terms; |
| | • | | only our board of directors may call special meetings of our stockholders; |
| | • | | our stockholders may take action only at a meeting of our stockholders and not by written consent; |
| | • | | we have authorized undesignated “blank check” preferred stock, the terms of which may be established and shares of which may be issued without stockholder approval; |
| | • | | stockholder approval of amendments of our certificate of incorporation requires a vote of a majority of our outstanding shares and, in some cases, a vote of 75% of our outstanding shares; |
| | • | | stockholder approval of amendments of our by-laws requires a vote of a majority of our outstanding shares or, if the amendment is not recommended by our board of directors, a vote of 75% of our outstanding shares; |
38
| | • | | vacancies on the board of directors may be filled only by the directors; |
| | • | | stockholders may remove our directors only for cause and with the affirmative vote of the holders of 75% of the votes that all stockholders would be entitled to cast in the election of directors; and |
| | • | | we require advance notice for stockholder proposals. |
In addition, Section 203 of the Delaware General Corporation Law may discourage, delay or prevent a change in control of our company.
We do not intend to pay dividends on our common stock in the foreseeable future.
We have not declared or paid any cash dividends on our common stock. We currently intend to retain any future earnings and do not expect to pay any dividend in the foreseeable future. As a result, you may only receive a return on your investment in our common stock if the market price of our common stock increases.
| ITEM 1B. | UNRESOLVED STAFF COMMENTS |
None.
Information regarding our principal properties at March 31, 2007 is set forth below:
| | | | | | |
Location | | Principal Use | | Sq. Footage | | Ownership |
Waltham, MA | | Corporate Headquarters | | 62,000 | | Leased |
Shanghai, China | | Research and development | | 7,500 | | Leased |
39
On February 1, 2007, Mercer filed a Complaint against us in the United States District Court for the Southern District of New York. The Complaint alleges copyright infringement, unfair competition, false representation, fraud, breach of contract and tortious interference with business relations. Specifically, the Complaint asserts that our use of Mercer surveys infringes upon Mercer’s copyrights, that we have breached, and induced our customers to breach, license agreements with Mercer, that we have attempted to deceive Mercer in connection with our acquisition of Mercer surveys, and that we have misrepresented our rights to use Mercer’s surveys to our current and potential customers. The Complaint seeks injunctive relief and monetary damages. We believe that our purchase and use of all third party surveys (including Mercer’s) complies with copyright law and any applicable license agreements and we intend to vigorously defend the claims by Mercer. We have filed several counterclaims against Mercer in the New York action, including claims for tortious interference with business relations, breach of contract and misrepresentation. Although Mercer has made similar assertions to us in the past, we have not received any correspondence from Mercer since 2004 on these issues and we have not purchased any Mercer data since that time. This previously acquired data comprises a very small portion of the data we use to generate our proprietary data sets. Our proprietary data sets are not reliant on any one data source and we could remove the data we have historically purchased from Mercer from our data sets and regenerate them without materially affecting the quality of our data sets. In a separate action, we filed a Complaint against Mercer in the United States District Court for the District of Massachusetts on May 15, 2007. That Complaint alleges copyright infringement, unfair competition, breach of contract and antitrust violations by Mercer based on the unlawful spidering of our proprietary database and the repeated unauthorized use of our proprietary data sets by Mercer employees.
On December 29, 2006, we commenced a declaratory judgment action in the Superior Court of Suffolk County, Massachusetts against one of our former independent consultants. The former consultant was under contract to us and assisted us in completing a strategic partnership in 2000. The contract expired by its terms in November 2000. Pursuant to that contract, the former consultant was entitled to a success fee consisting of a right to purchase 33,600 shares of our common stock at a price of thirty-six cents per share, which at the time represented approximately three percent of our capital stock. In November 2006, after we commenced our initial public offering, the former consultant informed us that he was in possession of a version of a contract that allegedly gave him the right to purchase three percent of our equity as of an unspecified date at a price of thirty-six cents per share. The basis for this claim appears to be certain hand-written changes to the expired contract that we did not make or authorize, and had never seen until the former consultant sent us a copy of a contract containing these changes in November 2006. In the court action, we are seeking to have the court declare that the consultant is not entitled to anything other than the 33,600 options described in the expired contract. In addition, we are seeking damages due to the former consultant’s attempt to defraud us and our stockholders by making these hand-written changes subsequent to the contract’s execution and without our knowledge or consent. We also are seeking damages for tortious interference with business relations as well as for unfair and deceptive business acts and practices. To the extent we are required to issue additional shares of our common stock or options to purchase common stock as a result of this action, we would recognize an expense equal to the difference between the fair value of the common stock on the date of issuance and the price paid for such stock or the exercise price of any such options, as the case may be. If such stock were issued or such options were to be exercised, this could have a material adverse effect on our results of operations and could be dilutive to existing stockholders.
We are not currently, nor have been in the past, subject to any other material legal proceedings. From time to time, however, we may be named as a defendant in legal actions arising from our normal business activities. These claims, even those that lack merit, could result in the expenditure of significant financial and managerial resources.
40
| ITEM 4. | SUBMISSION OF MATTERS TO A VOTE OF SECURITY HOLDERS |
On January 17, 2007, our stockholders approved by written consent:
| | • | | an amended and restated certificate of incorporation that was filed prior to the pricing of our initial public offering to implement provisions appropriate for a public company, including creating three classes of directors that are elected for staggered three-year terms; |
| | • | | an amended and restated certificate of incorporation that was filed after the closing of the our initial public offering to eliminate all references to the Series A-1, Series A-2, Series A-3, Series A-4 and Series B preferred stock and establish our authorized capitalization at 100,000,000 shares of common stock, $0.0001 par value per share, and 5,000,000 shares of undesignated preferred stock, $0.0001 par value per share; |
| | • | | the adoption of the 2007 Stock Option and Incentive Plan under which the maximum number of shares of common stock that may be issued is the sum total of 3,000,000 shares plus all stock option awards or grants returned to the 2000 Stock Option and Incentive Plan and the 2004 Stock Option and Incentive Plan as a result of expiration or cancellation or termination of such stock option awards; and |
| | • | | the adoption of the 2007 Employee Stock Purchase Plan under which an aggregate amount of 500,000 shares of common stock may be issued. |
41
PART II
| ITEM 5. | MARKET FOR REGISTRANT’S COMMON EQUITY, RELATED COMMON STOCKHOLDER MATTERS AND ISSUER PURCHASES OF EQUITY SECURITIES |
Market Price of Common Stock
Our common stock has been traded on the Nasdaq Global Market under the symbol “SLRY” since February 15, 2007. Prior to that time, there was no established public trading market for our common stock. The following table presents the high and low sale prices of our common stock as reported by the Nasdaq Global Market, for the period indicated.
| | | | | | |
Fiscal year ended March 31, 2007 | | High | | Low |
Fourth quarter (from February 15, 2007) | | $ | 14.00 | | $ | 10.50 |
The last sale price of the common stock on June 21, 2007, as reported by Nasdaq Global Market, was $11.50 per share. As of June 21, 2007, there were 300 holders of record of the common stock.
We have never declared or paid any cash dividends on our common stock and currently expect to retain future earnings for use in our business for the foreseeable future.
42
Performance Graph
The following line graph compares cumulative total stockholder returns for the period from February 15, 2007, the date of our initial public offering, through March 31, 2007 for (1) our common stock; (2) the Nasdaq Composite Index; and (3) the Nasdaq Computers Index. The graph assumes an investment of $100 on February 15, 2007, which was the first day on which our stock was listed on the Nasdaq Global Market. The calculations of cumulative stockholder return on the Nasdaq Composite Index and the Nasdaq Computers Index include reinvestment of dividends, but the calculation of cumulative stockholder return on our common stock does not include reinvestment of dividends because we did not pay dividends during the measurement period. The performance shown is not necessarily indicative of future performance.
| | | | | | |
| | | 2/15/2007 | | 3/31/07 |
Salary.com, Inc. | | $ | 100 | | $ | 89.04 |
Nasdaq Composite | | | 100 | | | 96.98 |
Nasdaq Computers Index | | | 100 | | | 97.21 |
43
Equity Compensation Plan Information
The following table sets forth certain information as of March 31, 2007 with respect to compensation plans under which our equity securities are authorized for issuance:
| | | | | | | | |
| | | Number of securities
to be issued upon
exercise of
outstanding options,
warrants and rights
(a) | | Weighted-average
exercise price of
outstanding options,
warrants and rights
(b) | | Number of securities
remaining available for
future issuance under
equity compensation
plans (excluding
securities reflected in
column (a)) (c) | |
Equity compensation plans approved by security holders (1): | | 2,088,971 | | $ | 5.9125 | | 5,488,840 | (2) |
Equity compensation plans not approved by security holders: | | None | | | None | | None | |
Total | | 2,088,971 | | $ | 5.9125 | | 5,488,840 | |
| (1) | Please see Note 9 of our Notes to Consolidated Financial Statements for description of our equity compensation plans. |
| (2) | Includes 500,000 shares that remain available for purchase under the Salary.com Employee Stock Purchase Plan and 1,991,585 shares for stock options that have been exercised but have not vested as of March 31, 2007. |
Unregistered Sales of Securities
In connection with our initial public offering, all outstanding shares of our convertible preferred stock were converted into an aggregate of 1,758,599 shares of common stock.
During the fiscal year 2007, the Company issued stock options for the purchase of an aggregate of 1,559,145 shares to employees under the 2004 Stock Option and Incentive Plan. All such stock options had exercise prices ranging from of $6.607 to $11.133 per share, which was the fair market value of the Company’s common stock on the date of issuance.
In November 2006, we issued a warrant to purchase 44,800 shares of our common stock at an exercise price of $6.61 per share to Lyric Ventures, L.P., an entity that is affiliated with Terry Temescu, one of our directors.
In December 2006, we issued 30,270 and 7,567 shares of common stock to Kent Plunkett, our Chairman, President and Chief Executive Officer, and Yong Zhang, our Executive Vice President, Chief Operating Officer and Chief Technology Officer, respectively, as payment of bonuses earned in respect of fiscal 2006. The number of shares issued to Mr. Plunkett and Mr. Zhang was based on a per share value of our common stock of $6.61.
No underwriters were involved in these transactions, and there were no underwriting discounts or commissions. The issuance of securities described above were deemed to be exempt from registration under the Securities Act of 1933 in reliance on Section 4(2) or Rule 701 of the Securities Act of 1933. The recipients of securities in each such transaction represented their intention to acquire the securities for investment only and not with a view to or for sale in connection with any distribution thereof and appropriate legends were affixed to the share certificates and other instruments issued in such transactions. The sales of these securities were made without general solicitation or advertising.
Use of Proceeds from Registered Securities
On February 21, 2007, we issued and sold 4,898,443 shares of our common stock that we registered under a Registration Statement on Form S-1 (File No. 333-138646), which was declared effective by the SEC on February 14, 2007, in an initial public offering at an offering price of $10.50 per share, less underwriting discounts and commissions. On February 27, 2007, the underwriters exercised the option to purchase an additional 349,757 shares of common stock from us at the offering price of $10.50 per share less underwriting discounts and commissions. The offering of the common stock (including the exercise by the underwriters of their over-allotment option) resulted in gross proceeds of $55.1 million and net proceeds of approximately $48.0
44
million to us after deducting underwriting discounts and commissions of approximately $3.9 million and related offering costs of an estimated $3.2 million. The foregoing proceeds do not include proceeds to selling stockholders from their sale of an aggregate of 1,306,800 shares of our common stock. The book-running manager for the offering was Thomas Weisel Partners LLC, the co-lead manager was William Blair & Company, L.L.C. and Needham & Company, LLC, Wachovia Capital Markets, LLC and Pacific Crest Securities Inc. acted as representatives of the underwriters. No payments were made to directors, officers or persons owning ten percent or more of our common stock or to their associates, or to our affiliates, other than proceeds from the offering to those selling stockholders who are officers of the company in respect of their shares sold in the offering, and payments in the ordinary course of business to officers for salaries and to non-employee directors as compensation for board or board committee service.
As of June 21, 2007, $38.2 million of the net proceeds remained available and were primarily invested in money market accounts or marketable securities. Pending any use, as described below, we have invested the net proceeds in investment-grade, short-term, interest-bearing securities.
There has been no material change in the planned use of proceeds from our initial public offering as described in our final prospectus filed with the Securities and Exchange Commission pursuant to Rule 424(b).
Issuer Purchases of Equity Securities
Pursuant to the terms of our 2000 Stock Option Plan and our 2004 Stock Option Plan (collectively referred to as our “Stock Plans”), options may typically be exercised prior to vesting. We have the right to repurchase unvested shares from employees upon their termination, and it is generally our policy to do so. The following table provides information with respect to purchases made by us of shares of our common stock during the three month period ended March 31, 2007:
| | | | | | | | | |
Period | | Total Number of Shares
Purchased (1) | | Average Price
Paid per
Share | | Total Number of Shares
Purchased as Part of
Publicly Announced
Plans or Programs | | Maximum Number (or
Approximate Dollar
Value) of Shares that
May Yet Be Purchased
Under the Plans or
Programs |
January 1 – 31 | | 15,650 | | $ | 0.223 | | — | | — |
February 1 – 28 | | 12,162 | | $ | 0.223 | | — | | — |
March 1 – 31 | | 25,328 | | $ | 0.223 | | — | | — |
Total | | 53,140 | | $ | 0.223 | | — | | — |
| (1) | All shares were originally purchased from us by employees pursuant to exercises of unvested stock options. During the months listed above, we routinely repurchased the shares from our employees upon their termination of employment pursuant to our right to repurchase unvested shares at the original exercise price under the terms of our Stock Plans and the related stock option agreements. |
| ITEM 6. | SELECTED FINANCIAL DATA |
The following table summarizes the financial data for our business and is derived from the Company’s historical consolidated financial statements. You should read the selected financial data in conjunction with our historical consolidated financial statements and related notes and the section of this Annual Report on Form 10-K entitled “Management’s Discussion and Analysis of Financial Condition and Results of Operations.”
The selected statement of operations data for the three years ended March 31, 2007, and balance sheet data as of March 31, 2007 and 2006 have been derived from our audited financial statements appearing in this annual report on From 10-K. The selected statement of operations data for the year ended March 31, 2004, and balance sheet data as of March 31, 2005 and 2004 have been derived from our audited financial statements not appearing in this annual report on Form 10-K. The selected statement of operations data for the year ended March 31, 2003 and balance sheet data as of March 31, 2003 have been derived from our unaudited financial statements for the
45
fiscal year ended March 31, 2003. These unaudited financial statements include, in the opinion of management, all adjustments (consisting of normal recurring adjustments) that management considers necessary for the fair presentation of the financial information set forth in these statements. The selected financial data set forth below should be read in conjunction with “Management’s Discussion and Analysis of Financial Condition and Results of Operations” set forth below and our financial statements and related notes included elsewhere in this Annual Report on Form 10-K. The historical results are not necessarily indicative of the results to be expected in any future period.
| | | | | | | | | | | | | | | | | | | | |
| | | Years ended March 31, | |
| | | (in thousands, except per share data) | |
| | | 2007 | | | 2006 | | | 2005 | | | 2004 | | | 2003 | |
| | | | | | | | | | | | | | | (unaudited) | |
Statement of Operations: | | | | | | | | | | | | | | | | | | | | |
Revenue: | | | | | | | | | | | | | | | | | | | | |
Subscription revenues | | $ | 20,503 | | | $ | 13,037 | | | $ | 8,565 | | | $ | 5,150 | | | $ | 2,699 | |
Advertising revenues | | | 2,531 | | | | 2,262 | | | | 1,411 | | | | 1,250 | | | | 785 | |
| | | | | | | | | | | | | | | | | | | | |
Total revenues | | | 23,034 | | | | 15,299 | | | | 9,976 | | | | 6,400 | | | | 3,484 | |
Cost of revenues (1) | | | 5,334 | | | | 3,108 | | | | 1,831 | | | | 901 | | | | 690 | |
| | | | | | | | | | | | | | | | | | | | |
Gross profit | | | 17,700 | | | | 12,191 | | | | 8,145 | | | | 5,499 | | | | 2,794 | |
Operating expenses: | | | | | | | | | | | | | | | | | | | | |
Research and development (1) | | | 4,116 | | | | 2,238 | | | | 1,410 | | | | 846 | | | | 671 | |
Sales and marketing (1) | | | 12,792 | | | | 8,573 | | | | 5,855 | | | | 3,477 | | | | 2,438 | |
General and administrative (1) | | | 8,922 | | | | 4,337 | | | | 2,798 | | | | 2,002 | | | | 1,959 | |
Amortization of intangible assets | | | 126 | | | | — | | | | — | | | | — | | | | — | |
| | | | | | | | | | | | | | | | | | | | |
Total operating expenses | | | 25,956 | | | | 15,148 | | | | 10,063 | | | | 6,325 | | | | 5,068 | |
Loss from operations | | | (8,256 | ) | | | (2,957 | ) | | | (1,918 | ) | | | (826 | ) | | | (2,274 | ) |
Other income (expense) | | | 174 | | | | (173 | ) | | | (372 | ) | | | (368 | ) | | | 64 | |
| | | | | | | | | | | | | | | | | | | | |
Net loss | | | (8,082 | ) | | | (3,130 | ) | | | (2,290 | ) | | | (1,194 | ) | | | (2,210 | ) |
Accretion of preferred stock | | | (471 | ) | | | (515 | ) | | | (513 | ) | | | (473 | ) | | | (514 | ) |
| | | | | | | | | | | | | | | | | | | | |
Net loss attributable to common stockholders | | $ | (8,553 | ) | | $ | (3,645 | ) | | $ | (2,803 | ) | | $ | (1,667 | ) | | $ | (2,724 | ) |
| | | | | | | | | | | | | | | | | | | | |
Net loss attributable to common stockholders per share—basic and diluted | | $ | (1.42 | ) | | $ | (0.89 | ) | | $ | (0.81 | ) | | $ | (0.68 | ) | | $ | (3.47 | ) |
| (1) | Net loss includes stock-based compensation expense, as follows: |
| | | | | | | | | | | | | | | | | | | |
| | | 2007 | | 2006 | | | 2005 | | | 2004 | | | 2003 | |
| | | | | | | | | | | | | | (unaudited) | |
Stock-based compensation: | | | | | | | | | | | | | | | | | | | |
Cost of revenues | | $ | 437 | | $ | 186 | | | $ | 41 | | | $ | — | | | $ | — | |
Research and development | | | 505 | | | 180 | | | �� | 57 | | | | — | | | | — | |
Sales and marketing | | | 986 | | | 401 | | | | 162 | | | | — | | | | — | |
General and administrative | | | 2,437 | | | 311 | | | | 252 | | | | 1 | | | | — | |
| | | | | | | | | | | | | | | | | | | |
| | $ | 4,365 | | $ | 1,078 | | | $ | 512 | | | $ | 1 | | | $ | — | |
| | | | | | | | | | | | | | | | | | | |
| |
| | | As of March 31, | |
| | | 2007 | | 2006 | | | (in thousands)
2005 | | | 2004 | | | 2003 | |
| | | | | | | | | | | | | | (unaudited) | |
Balance Sheet Data: | | | | | | | | | | | | | | | | | | | |
Cash | | $ | 49,016 | | $ | 1,814 | | | $ | 392 | | | $ | 1,423 | | | $ | 156 | |
Total assets | | | 58,675 | | | 7,028 | | | | 3,428 | | | | 3,401 | | | | 1,177 | |
Total debt | | | — | | | 800 | | | | 1,100 | | | | 2,654 | | | | 2,264 | |
Total deferred revenue | | | 16,388 | | | 10,548 | | | | 6,384 | | | | 3,863 | | | | 1,682 | |
Redeemable convertible preferred stock | | | — | | | 10,538 | | | | 9,973 | | | | 9,185 | | | | 8,104 | |
Total stockholders’ equity (deficit) | | | 37,983 | | | (17,914 | ) | | | (15,240 | ) | | | (13,070 | ) | | | (11,961 | ) |
46
| ITEM 7. | MANAGEMENT’S DISCUSSION AND ANALYSIS OF FINANCIAL CONDITION AND RESULTS OF OPERATIONS |
The following discussion and analysis of our financial condition and results of operations should be read in conjunction with our consolidated financial statements and related notes that appear elsewhere in this report. In addition to historical consolidated financial information, the following discussion contains forward-looking statements that reflect our plans, estimates and beliefs. Our actual results could differ materially from those discussed in the forward-looking statements. Factors that could cause or contribute to these differences include those discussed below and elsewhere in this report, particularly in “Risk Factors” in Item 1A.
Overview
Salary.com is a leading provider of on-demand compensation management solutions. Our comprehensive on-demand software applications are integrated with our proprietary data sets to automate the essential elements of our customers’ compensation management processes. As a result, our solutions can significantly improve the effectiveness of our customers’ compensation spending. We enable employers of all sizes to replace or supplement inefficient and expensive traditional approaches to compensation management, including the use of paper-based surveys, consultants, internally developed software applications and spreadsheets.
Our on-demand solutions, which incorporate market compensation intelligence from our proprietary data sets, enable companies to determine how much to pay new and existing employees and to manage overall compensation programs. Our data sets contain base, bonus and incentive pay data for positions held by more than 74% of U.S. employees and similar data for the top executives in over 10,000 U.S. public companies. Our flagship offering is CompAnalyst, a suite of compensation management applications that integrates our data, third party survey data and a customer’s own pay data in a complete analytics offering. We have also introduced TalentManager, an employee life-cycle performance management application that links employee pay to performance. We offer these solutions principally on an annual or multi-year subscription basis. In addition to our on-demand enterprise software offerings, we also provide a series of applications through our website, which allows us to deliver salary management comparison and analysis tools to individuals and small businesses on a cost-effective, real-time basis.
We were organized as a Delaware corporation in 1999. As of March 31, 2007, our enterprise subscriber base has grown to more than 1,850 companies who spend from $2,000 to more than $100,000 annually. We have achieved 24 consecutive quarters of revenue growth since April 2001. During the years ended March 31, 2007, 2006 and 2005, we achieved positive operating cash flows of $3.1 million, $1.8 million and $0.9 million, respectively. During these periods, we have consistently incurred operating losses, including $8.3 million for 2007, $3.0 million for 2006 and $1.9 million for 2005. As of March 31, 2007, we had an accumulated deficit of $29.4 million.
Acquisition of Business
On May 15, 2007, the Company acquired the membership interests of ICR Limited, L.C. and the outstanding share capital of ICR International Ltd., (collectively, referred to as ICR), a leading provider of industry-specific market intelligence for employee pay and benefits for the global technology and specialty consumer goods markets. Pursuant to the terms of the purchase agreements, we paid $10.3 million to the owners of ICR, of which $1 million has been placed in escrow for 12 months. The escrow fund will be available to compensate us for any losses we may incur as a result of any breach of the representations or warranties of the owners of ICR contained in the purchase agreements, and certain liabilities arising out of the ownership or operation of ICR prior to the acquisition.
On April 3, 2006, the Company acquired certain assets of the eComp Data Services Division (“eComp”) from Aon Consulting, Inc., a global human capital consulting firm located in New York City. eComp Data Services is a leading provider of executive compensation data. The assets acquired included the eComp database
47
and certain software and proprietary assets, including all intellectual property rights. Pursuant to the terms of the agreement, the Company paid $585,000 with $292,500 due at the closing date of April 3, 2006, and the remaining balance due no later than September 30, 2006. Included in the acquisition was $75,000 which was paid by the Company to a former principal of eComp for a noncompete agreement. Accordingly, the purchase price was allocated based upon the fair value of assets acquired and liabilities assumed. The Company allocated $266,000 of the purchase price to goodwill based upon the estimated fair value of the assets acquired in the acquisition. The results of operations for the fiscal year ended March 31, 2007 include the impact of this acquisition since April 3, 2006.
The Company has allocated the purchase price based upon the estimated fair value of the net assets acquired, as follows:
| | | | |
| | | Amount | |
Non-compete (amortization period 5 years) | | $ | 365,000 | |
Customer relationships (amortization period 5 years) | | | 120,000 | |
Hosting and servicing (amortization period 2 months) | | | 29,000 | |
Assumed liabilities | | | (120,000 | ) |
Goodwill | | | 266,000 | |
| | | | |
Total purchase price | | $ | 660,000 | |
| | | | |
Sources of Revenues
We derive our revenues primarily from subscription fees and, to a lesser extent, through advertising on our website. For the years ended March 31, 2007, 2006 and 2005, subscription revenues accounted for 89%, 85% and 86%, respectively, of our total revenues and for the years ended March 31, 2007, 2006 and 2005, advertising revenues accounted for 11%, 15% and 14%, respectively, of our total revenues. For the years ended March 31, 2007, 2006 and 2005, our subscription revenues derived from our TalentManager products comprised less than 15% of our total revenues, with the remainder of our subscription revenues being derived from our compensation management and data products.
Subscription revenues are comprised primarily of subscription fees from enterprise and small business customers who pay a bundled fee for our on-demand software applications and data products and implementation services related to our subscription products, as well as syndication fees from our website partners and premium membership subscriptions sold primarily to individuals. Subscription revenues are primarily recognized ratably over the contract period as they are earned. Our subscription agreements for our enterprise subscription customer base are typically one to five years in length, and as of March 31, 2007, approximately 39% of our contracts were more than one year in length. We generally invoice our customers annually in advance of their subscription (for both new products and renewals), with payment due upon receipt of invoice. Deferred revenue consists primarily of billings or payments received in advance of revenue recognition from our subscription agreements and is recognized over time as the revenue recognition criteria are met. Changes in deferred revenue generally indicate the trend for subscription revenues over the following year as the current portion of deferred revenue is expected to be recognized as revenue within 12 months. To a lesser extent, subscription revenues also include fees for professional services which are not bundled with our subscription products and revenue from the sale of our Compensation Market Study and Salary.com Survey products, which are not sold on a subscription basis.
Advertising revenues are comprised of revenues that we generate through agreements to display third party advertising on our website for a fixed period of time or fixed number of impressions. Advertising revenues are recognized as the advertising is displayed on the website.
Cost of Revenues and Operating Expenses
Cost of Revenues. Cost of revenues consists primarily of costs for data acquisition and data development, fees paid to our network provider for the hosting and managing of our servers, related bandwidth costs,
48
compensation costs for the support and implementation of our products and amortization of capitalized software costs. As we continue to implement and support our new and existing products and expand our data sets, we expect that over the next few years cost of revenues will continue to increase as a percentage of revenue and on an absolute dollar basis. Over the longer term, we expect our cost of revenues to decrease as a percentage of revenue as our business grows and our new data products gain market acceptance.
Research and Development. Research and development expenses consist primarily of compensation for our software and data application development personnel. We have historically focused our research and development efforts on improving and enhancing our existing on-demand software and data offerings as well as developing new features, functionality and products. We expect that in the future, research and development expenses will increase on an absolute dollar basis as we upgrade and extend our service offerings and develop new technologies.
Sales and Marketing. Sales and marketing expenses consist primarily of compensation for our sales and marketing personnel, including sales commissions, as well as the costs of our marketing programs. We capitalize our sales commissions at the time a subscription agreement is executed by a customer and we recognize the initial year sales commission expense ratably over one year. In the case of multi-year agreements, upon billing the customer for each additional year, we incur a subsequent sales commission and recognize the expense for such commission over the applicable year. Typically, a majority of the sales commission is recognized in the initial year of the subscription term. In order to add new customers and increase sales to our existing customers, we plan to continue to invest heavily in our sales efforts by increasing the number of direct sales personnel. We also plan to expand our marketing activities in order to extend brand awareness and generate additional leads for our sales staff. As a result, we expect that our sales and marketing expenses will increase on an absolute dollar basis as we grow our business.
General and Administrative. General and administrative expenses consist of compensation expenses for executive, finance, accounting, administrative and management information systems personnel, professional fees and other corporate expenses.
Critical Accounting Policies
Our financial statements are prepared in accordance with accounting principles generally accepted in the United States (GAAP). The preparation of these financial statements requires us to make estimates and assumptions that affect the reported amounts of assets, liabilities, revenues, costs and expenses and related disclosures. On an ongoing basis, we evaluate our estimates and assumptions. Our actual results may differ from these estimates under different assumptions or conditions.
We believe that of our significant accounting policies, which are described in the notes to our financial statements, the following accounting policies involve a greater degree of judgment, complexity and effect on materiality. A critical accounting policy is one that is both material to the presentation of our financial statements and requires us to make difficult, subjective or complex judgments for uncertain matters that could have a material effect on our financial condition and results of operations. Accordingly, these are the policies we believe are the most critical to aid in fully understanding and evaluating our financial condition and results of operations.
Revenue Recognition. In accordance with SEC Staff Accounting Bulletin No. 101, “Revenue Recognition in Financial Statements,” as amended by Staff Accounting Bulletin No. 104, “Revenue Recognition,” we recognize revenues from subscription agreements for our on-demand software and related services when there is persuasive evidence of an arrangement, the service has been provided to the customer, the collection of the fee is probable and the amount of the fees to be paid by the customer is fixed or determinable. Amounts that have been invoiced are recorded in accounts receivable and deferred revenue. Our subscription agreements generally contain multiple service elements and deliverables. These elements include access to our software and often specify initial services including implementation and training. Except under limited circumstances, our subscription agreements do not provide customers the right to take possession of the software at any time.
49
In accordance with Emerging Issues Task Force Issue No. 00-21, Revenue Arrangements with Multiple Deliverables, or EITF 00-21, issued by the Emerging Issues Task Force of the Financial Accounting Standards Board, or FASB, in May 2003, we define all elements in our multiple element subscription agreements as a single unit of accounting, and accordingly, recognize all associated revenue over the subscription period, which is typically one to five years in length. In the event professional services relating to implementation are required, we generally do not recognize revenue until such implementation is complete. In applying the guidance in EITF 00-21, we determined that we do not have objective and reliable evidence of the fair value of the subscription to our on-demand software after delivery of specified initial services. We therefore account for our subscription arrangements and our related service fees as a single unit.
Income Taxes. We account for income taxes in accordance with FASB Statement No. 109, “Accounting for Income Taxes,” or SFAS 109, which requires that deferred tax assets and liabilities be recognized using enacted tax rates for the effect of temporary differences between the book and tax basis of recorded assets and liabilities. SFAS 109 also requires that deferred tax assets be reduced by a valuation allowance if it is more likely than not that some portion of all of the deferred tax asset will not be realized. The realization of the deferred tax assets is evaluated quarterly by assessing the valuation allowance and by adjusting the amount of the allowance, if necessary. As of March 31, 2007, the Company has a full valuation allowance against its deferred tax assets.
Software Capitalization Costs. We capitalize certain internal software development costs under the provisions of Statement of Position No. 98-1, Accounting for the Costs of Computer Software Developed or Obtained for Internal Use (“SOP 98-1”). SOP 98-1 requires computer software costs associated with internal use software to be charged to operations as incurred until certain capitalization criteria are met.Costs incurred during the preliminary project stage and the post-implementation stages are expensed as incurred. Certain qualifying costs incurred during the application development stage are capitalized as property, equipment and software. These costs generally consist of internal labor during configuration, coding, and testing activities. Capitalization begins when the preliminary project stage is complete, management with the relevant authority authorizes and commits to the funding of the software project, and it is probable that the project will be completed and the software will be used to perform the function intended. These costs are amortized using the straight-line method over the estimated useful life of the software, generally three years.
Allowance for Doubtful Accounts. We maintain an allowance for doubtful accounts for estimated losses resulting from our customers’ inability to pay us. The provision is based on our historical experience and for specific customers that, in our opinion, are likely to default on our receivables from them. In order to identify these customers, we perform ongoing reviews of all customers that have breached their payment terms, as well as those that have filed for bankruptcy or for whom information has become available indicating a significant risk of non-recoverability. In addition, we have experienced significant growth in the number of our customers, and we have less payment history to rely upon with these customers. We rely on historical trends of bad debt as a percentage of total revenue and apply these percentages to the accounts receivable associated with new customers and evaluate these customers over time. To the extent that our future collections differ from our assumptions based on historical experience, the amount of our bad debt and allowance recorded may be different.
Stock-Based Compensation. Effective April 1, 2005, we adopted FASB Statement No. 123-revised, “Share-Based Payment” or SFAS 123R, which revises SFAS No. 123, “Accounting for Stock-Based Compensation” or SFAS 123 and supersedes Accounting Principles Board or APB Opinion No. 25, “Accounting for Stock Issued to Employees” or APB 25. SFAS 123R requires that all stock-based compensation be recognized as an expense in the financial statements over the vesting period and that such expense be measured at the fair value of the award.
We adopted SFAS 123R using the prospective method of application, which requires us to recognize compensation expense on a prospective basis; therefore, prior period financial statements have not been restated. Compensation expense recognized includes the expense of stock options granted on and subsequent to April 1, 2005. Stock options granted by us prior to that time are specifically excluded from SFAS 123R and will continue to be accounted for in accordance with APB 25. These options were valued using the minimum value method.
50
Determining the appropriate fair value model and calculating the fair value of stock-based payment awards require the use of highly subjective assumptions, including the expected life of the stock-based payment awards and stock price volatility. In the fiscal years ended March 31, 2007 and 2006, respectively, we used the Black-Scholes option-pricing model to value our option grants and determine the related compensation expense. The assumptions used in calculating the fair value of stock-based payment awards represent management’s best estimates, but the estimates involve inherent uncertainties and the application of management judgment. As a result, if factors change and we use different assumptions, our stock-based compensation expense could be materially different in the future. Prior to the adoption of SFAS 123R, we had adopted SFAS 123, but in accordance with SFAS 123, we had elected not to apply fair value-based accounting for awards under our employee stock incentive plan through March 31, 2005. Instead, we measured compensation expense for our stock plans using the intrinsic value method prescribed by APB 25 and related interpretations and provided pro forma disclosures as permitted under SFAS No. 148, “Accounting for Stock-Based Compensation—Transition and Disclosure an amendment of SFAS 123”.
In fiscal years 2007 and 2006, we have employed the following key assumptions to determine fair values of option grants pursuant to the Black-Scholes option pricing model:
| | | | | | |
| | | March 31, | |
| | | 2007 | | | 2006 | |
Expected dividend yield | | 0 | % | | 0 | % |
Risk-free interest rate | | 4.45-4.80 | % | | 3.72-4.82 | % |
Expected option term (in years) | | 5 | | | 5 | |
Volatility | | 62-65 | % | | 60-75 | % |
We estimate our expected volatility based on that of our publicly traded peer companies and expect to continue to do so until such time as we have adequate historical data from our traded share price. Management believes that the historical volatility of the Company’s stock price does not best represent the expected volatility of the stock price. Until February 2007, we were a private company and therefore lack sufficient company-specific historical and implied volatility information. We intend to continue to consistently use the same group of publicly-traded peer companies to determine volatility in the future until such time that sufficient information regarding the volatility of our share price becomes available or that the selected companies are no longer suitable for this purpose.
The risk-free interest rate used for each grant is equal to the U.S. Treasury yield curve in effect at the time of grant for instruments with a similar expected life.
The expected term of the options granted was determined based upon review of the period that our share-based awards are expected to be outstanding and is estimated based on historical experience of similar awards, giving consideration to the contractual term of the awards, vesting schedules, employee turnover and expectations of employee exercise behavior.
The stock price volatility and expected terms utilized in the calculation of fair values involve management’s best estimates at that time, both of which impact the fair value of the option calculated under the Black-Scholes methodology and, ultimately, the expense that will be recognized over the vesting period of the option. SFAS 123R also requires that we recognize compensation expense for only the portion of options that are expected to vest. Therefore, we have estimated expected forfeitures of stock options with the adoption of SFAS 123R. In developing a forfeiture rate estimate, we have considered our historical experience, our growing employee base and the historical limited liquidity of our common stock. If the actual number of forfeitures differs from those estimated by management, additional adjustments to compensation expense may be required in future periods.
Prior to our initial public offering in February 2007, we historically granted stock options at exercise prices equivalent to the fair value of our common stock as estimated by our board of directors, with input from
51
management, as of the date of grant. Because there was no public market for our common stock, our board of directors determined the fair value of our common stock by considering a number of objective and subjective factors, including our operating and financial performance and corporate milestones, the prices at which we sold shares of redeemable convertible preferred stock, the superior rights and preferences of securities senior to our common stock at the time of each grant and the risk and non-liquid nature of our common stock. In years prior to fiscal 2006, we had not historically obtained contemporaneous valuations by an unrelated valuation specialist because, at the time of the issuances of stock options, we believed our estimates of the fair value of our common stock to be reasonable based on the foregoing factors.
In anticipation of our public offering and solely for the purposes of accounting for stock-based compensation for financial statement purposes, during 2006 we reassessed the valuation of our common stock at various selected dates from April 1, 2004 through March 31, 2006. The difference between the original estimated fair value and the reassessed valuation of the underlying common stock related to the grants made during those timeframes has been booked as additional compensation expense in our financial statements. Reassessed values are inherently uncertain and highly subjective. We made retrospective adjustments to our financial statements for the year ended March 31, 2005 related to these valuations. Prior to April 1, 2004, no expense was recorded as we determined that the estimated fair value of our stock at the date of grant did not exceed the exercise price.
Additionally, for fiscal 2005, prior to adoption of SFAS 123R, we have revised the Black-Scholes fair value of the stock option grants to reflect the reassessed fair value of our common stock, which is included in the pro forma compensation expense per our financial statement footnote. Upon adoption of SFAS 123R during fiscal 2006, the Black-Scholes calculations reflect the reassessed fair value of our common stock and the fair value of these grants will be recognized as compensation expense on a straight line basis over the vesting period of the options. The compensation expense on unvested options at March 31, 2007 that will be recognized in future periods net of forfeitures is as follows:
| | | | | | | | | | | | | | | |
| | | 2008 | | 2009 | | 2010 | | 2011 | | 2012 |
123R Stock-based compensation charge | | $ | 2,157,000 | | $ | 2,102,000 | | $ | 2,004,000 | | $ | 1,593,000 | | $ | 546,000 |
We account for stock compensation arrangements with non-employees in accordance with Emerging Issues Task Force No. 96-18, or EITF No. 96-18, “Accounting for Equity Instruments That Are Issued to Other Than Employees for Acquiring, or in Conjunction with Selling, Goods or Services,”using a fair value approach. For stock options granted to non-employees, the fair value of the stock options is estimated using the Black-Scholes valuation model. Stock-based compensation expense is recognized over the period of expected service by the non-employee. As the service is performed, we are required to update these assumptions and periodically revalue unvested options and make adjustments to the stock-based compensation expense using the new valuation. These adjustments may result in additional or lesser stock-based compensation expense than originally estimated or recorded, with a corresponding increase or decrease in compensation expense in the statement of operations.
Significant Factors, Assumptions, and Methodologies Used in Determining Fair Value. Determining the fair value of our stock prior to the Company’s initial public offering in February 2007 required making complex and subjective judgments. Prior to our initial public offering in February 2007, our approach to the valuation of our company was based on a weighted average of the guideline public company method and the discounted future cash flow method.
We estimated our enterprise value under the guideline public company method by comparing our company to publicly-traded companies in our industry group. The companies used for comparison under the guideline public company method were selected based on a number of factors, including but not limited to, the similarity of their industry, business model, and financial risk to those of ours. We used those companies that we believed were closely comparable to ours, based on the above factors. In determining our enterprise value under this method, we utilized a risk adjusted enterprise value multiple to sales ratio, which ranged from 1.9 to 3.5 during
52
the period from September 30, 2004 through November 6, 2006, based on the median of the guideline companies and applied the ratio to the sales of our company.
We also estimated our enterprise value under the discounted future cash flow method, which involves applying appropriate discount rates to estimated cash flows that are based on forecasts of revenue and costs. Our revenue forecasts are based on expected market growth rates ranging from 25% to 58% over the next five years as well as assumptions about our future costs during the next five years. There is inherent uncertainty in making these estimates. These assumptions underlying the estimates are consistent with the plans and estimates that we use to manage the business. The risks associated with achieving our forecasts were assessed in selecting the appropriate discount rates, which ranged from 22.31% to 33.33% during the period from September 30, 2004 through November 6, 2006. If different discount rates had been used, the valuations would have been different.
In order to allocate the enterprise value determined under the guideline public company method and the discounted future cash flow method to our common stock, we used the probability-weighted expected return method. Under the probability-weighted expected return method, the fair market value of the common stock is estimated based upon an analysis of future values for our company assuming various future outcomes. The anticipated timing of these future outcomes is based on the plans of our board and management. Stock value is based on the probability-weighted present value of expected future investment returns, considering each of the possible outcomes available to us as well as the rights of each class of stock.
The fair market value of our common stock was estimated using a probability-weighted analysis of the present value of the returns afforded to our stockholders under each of four possible future scenarios. Three of the scenarios assume a stockholder exit, through our initial public offering, sale or dissolution. The fourth scenario assumes operations continue as a private company and no exit transaction occurs.
For each of the first three scenarios, estimated future and present values for our common stock were calculated using assumptions including: the expected pre-money valuation (pre-offering or pre-sale); the expected dates of the future expected initial public offering or sale; and an appropriate risk-adjusted discount rate. An estimated present value for our common stock was calculated for the fourth scenario (private company with no exit scenario) using a weighted average of the discounted cash flow method and the guideline public company method. Finally, the present values calculated for our common stock under each scenario were weighted based our management’s estimates of the probability of occurrence of each of the scenarios. The resulting value indications represent the estimated fair market value of our common stock at each valuation date.
Valuation of Goodwill and Intangible Assets. We follow the guidance of SFAS No. 142, “Goodwill and Other Intangible Assets” or SFAS 142. In accordance with SFAS No. 142, goodwill and certain intangible assets are no longer amortized, but instead we assess the impairment of goodwill and identifiable intangible assets on at least an annual basis and whenever events or changes in circumstances indicate that the carrying value of the goodwill or intangible asset is greater than its fair value. Factors we consider important that could trigger an impairment review include significant underperformance relative to historically or projected future operating results, identification of other impaired assets within a reporting unit, the disposition of a significant portion of a reporting unit, significant adverse changes in business climate or regulations, significant changes in senior management, significant changes in the manner of our use of the acquired assets or the strategy for our overall business, significant negative industry or economic trends, a significant decline in our stock price for a sustained period, a decline in our credit rating, or a reduction of our market capitalization relative to net book value. Determining whether a triggering event has occurred includes significant judgment from management.
The estimation of the fair values of goodwill and the reporting units to which it pertains requires the use of discounted cash flow valuation models. Those models require estimates of future revenue, profits, capital expenditures and working capital for each unit. These estimates will be determined by evaluating historical trends, current budgets, operating plans and industry data. Determining the fair value of reporting units and goodwill includes significant judgment by management and different judgments could yield different results.
53
Results of Operations
The following tables set forth selected statements of operations data for each of the periods indicated as a percentage of total revenues.
| | | | | | | | | |
| | | Year Ended March 31, | |
| | | 2007 | | | 2006 | | | 2005 | |
Revenues: | | | | | | | | | |
Subscription Revenues | | 89 | % | | 85 | % | | 86 | % |
Advertising Revenues | | 11 | | | 15 | | | 14 | |
| | | | | | | | | |
Total Revenues | | 100 | | | 100 | | | 100 | |
Cost of Revenues | | 23 | | | 20 | | | 18 | |
| | | | | | | | | |
Gross Profit | | 77 | | | 80 | | | 82 | |
Operating Expenses: | | | | | | | | | |
Research and Development | | 18 | | | 15 | | | 14 | |
Sales and Marketing | | 55 | | | 56 | | | 59 | |
General and Administrative | | 39 | | | 28 | | | 28 | |
Amortization of Intangible Assets | | 1 | | | — | | | — | |
| | | | | | | | | |
Total Operating Expenses | | 113 | | | 99 | | | 101 | |
Loss from Operations | | (36 | ) | | (19 | ) | | (19 | ) |
Other Income (Expense), Net | | (1 | ) | | (1 | ) | | (4 | ) |
| | | | | | | | | |
Net Loss | | (37 | )% | | (20 | )% | | (23 | )% |
| | | | | | | | | |
The following table sets forth our total deferred revenue and net cash (used in) provided by operating activities for each of the periods indicated as well as our active enterprise subscribers. We define our active enterprise subscribers as those companies that had an active enterprise subscription license for one or more years at an annual rate of more than $2,000 at the end of the periods indicated.
| | | | | | | | | |
| | | Year Ended March 31, |
| (in thousands, except for active subscribers) | | 2007 | | 2006 | | 2005 |
Total deferred revenue | | $ | 16,388 | | $ | 10,548 | | $ | 6,384 |
Net cash provided by operating activities | | | 3,067 | | | 1,791 | | | 939 |
Active enterprise subscribers | | | 1,865 | | | 1,270 | | | 907 |
Fiscal Year Ended March 31, 2007 Compared to Fiscal Year Ended March 31, 2006
Revenues. Revenues for fiscal 2007 were $23.0 million, an increase of $7.7 million, or 51%, compared to revenues of $15.3 million for fiscal 2006. Subscription revenues were $20.5 million for fiscal 2007, an increase of $7.5 million, or 57%, compared to subscription revenues of $13.0 million for fiscal 2006. The growth in subscription revenues was due principally to an increase of $2.6 million in renewal revenues to existing subscription customers, an increase of $2.8 million in revenues to new subscription customers and an increase of $1.4 million in revenues from additional products sold to existing customers in fiscal 2007 compared to fiscal 2006. A contributing factor in the increase in total revenues was the result of our hiring of additional sales personnel focused on retaining existing customers, adding new customers and selling additional products to existing customers. Advertising revenues were $2.5 million for fiscal 2007, an increase of $0.2 million, or 12%, compared to advertising revenues of $2.3 million for fiscal 2006. The growth in advertising revenues was primarily due to increased advertising volume. Total deferred revenue as of March 31, 2007 was $16.4 million, representing an increase of $5.9 million, or 55%, compared to total deferred revenue of $10.5 million as of March 31, 2006.
Cost of Revenues. Cost of revenues for fiscal 2007 was $5.3 million, an increase of $2.2 million, or 72%, compared to cost of revenues of $3.1 million for fiscal 2006. The increase in cost of revenues was primarily due
54
to a $1.5 million increase in payroll and benefit related costs due to the addition of 18 personnel during fiscal 2007 for our compensation and professional service teams, a $0.3 million increase in stock-based compensation expense as well as $0.3 million of costs associated with sales of our CompAnalyst Executive Product which was not available during fiscal 2006. As a percent of total revenues, cost of revenues increased from 20% in fiscal 2006 to 23% in fiscal 2007. The increase was primarily the result of an increase in the number of professional service personnel in order to provide implementation services to our increasing number of customers.
Research and Development Expenses. Research and development expenses for fiscal 2007 were $4.1 million, an increase of $1.9 million, or 84%, compared to research and development expenses of $2.2 million for fiscal 2006. The increase in research and development expenses was primarily due to a $1.1 million increase in payroll and benefit related costs due to the addition of 49 personnel, 38 of which were added in our newly created China subsidiary, during fiscal 2007, an increase of $0.3 million in stock-based compensation expense and an increase of $0.3 million in computer and software related expenses. Research and development expenses increased to 18% of net total revenues in fiscal 2007 compared to 15% of total revenues in fiscal 2006. Our research and development headcount increased as we hired additional personnel to upgrade and expand our on-demand software product suite.
Sales and Marketing Expenses. Sales and marketing expenses for fiscal 2007 were $12.8 million, an increase of $4.2 million, or 49%, compared to sales and marketing expenses of $8.6 million for fiscal 2006. The increase was primarily due to a $2.3 million increase in payroll and benefit related costs due to the addition of 26 sales and marketing personnel during fiscal 2007, a $0.5 million increase in sales commissions as a result of increased sales, and a $0.6 million increase in stock-based compensation expense. Sales and marketing expenses was 55% of total revenues in both fiscal 2007 and fiscal 2006. Our sales and marketing headcount increased as we hired additional personnel to focus on adding new customers and increasing revenues from existing customers.
General and Administrative Expenses. General and administrative expenses for fiscal 2007 were $8.9 million, an increase of $4.6 million, or 106%, compared to general and administrative expenses of $4.3 million for fiscal 2006. The increase in general and administrative expenses was due to an increase of $0.5 million in rent expense related to taking on additional space to support the Company’s continued growth, a $2.1 increase in stock-based compensation expense, which includes $1.3 million of expense related to the acceleration of certain of the Company’s Chief Executive Officer’s stock options in February 2007, a $0.7 million increase in payroll and benefit related costs due to the addition of 7 IT, accounting and legal personnel, a $0.5 million in legal and accounting expenses and a $0.2 million increase in depreciation expense during fiscal 2007 compared to fiscal 2006. The increase in our general and administrative expenses, other than stock compensation expense and rent expense, is primarily the result of additional expenses that the Company has incurred which are related to being a publicly traded company that we did not incur as a privately owned company in fiscal 2006. General and administrative expenses were 39% of total revenues in fiscal 2007 compared to 28% in fiscal 2006.
Amortization of Intangible Assets. Amortization of intangible assets for fiscal 2007 was $0.1 million. The amortization was the result of the acquisition of certain assets of the eComp Data Services Division from Aon Consulting in April 2006.
Interest Income. Interest income for fiscal 2007 was $0.3 million compared to $3,000 in fiscal 2006. The increase in interest income was due to interest earned on higher invested cash resulting from the proceeds from the Company’s initial public offering in February 2007.
Interest Expense. Interest expense was $116,000 in fiscal 2007 compared to $159,000 in fiscal 2006. The decrease in interest expense was due to both the refinancing of the Company’s existing line of credit in August 2006 to a line of credit with a lower interest rate and the repayment of all outstanding borrowings in February 2007.
55
Fiscal Year Ended March 31, 2006 Compared to Fiscal Year Ended March 31, 2005
Revenues. Revenues for fiscal 2006 were $15.3 million, an increase of $5.3 million, or 53%, compared to revenues of $10.0 million for fiscal 2005. Subscription revenues were $13.0 million in fiscal 2006, an increase of $4.4 million, or 52%, over subscription revenues of $8.6 million in fiscal 2005. The growth in subscription revenues was due principally to an increase of $1.8 million in renewal revenues to existing subscription customers, an increase of $1.5 million in revenues to new subscription customers and due to an increase of $0.6 million in revenues from additional products sold to existing customers in fiscal 2006 compared to fiscal 2005. The increase in total revenues was due to our hiring of additional sales personnel focused on retaining existing customers, adding new customers and upselling to existing customers. Although we introduced TalentManager in 2004, we have not yet recognized a material amount of revenues from this solution partly due to the requirement to recognize revenue over the subscription period. Advertising revenues for fiscal 2006 were $2.3 million, an increase of $0.9 million, or 60%, compared to advertising revenues of $1.4 million in fiscal 2005. The growth in advertising revenues was primarily due to increased advertising volume. Total deferred revenue as of March 31, 2006 was $10.5 million, representing an increase of $4.1 million, or 65%, compared to total deferred revenue of the $6.4 million as of March 31, 2005.
Cost of Revenues. Cost of revenues for fiscal 2006 was $3.1 million, an increase of $1.3 million, or 70%, over cost of revenues of $1.8 million for fiscal 2005. The increase was primarily due to a $1.0 million increase in employee related costs due to the addition of 8 personnel during fiscal 2006 to our compensation and professional services teams and a $0.1 million increase in stock-based compensation expense. As a percent of total revenues, cost of revenues increased slightly to 20% in fiscal 2006 as compared to 18% in fiscal 2005. We increased the number of professional service personnel in order to provide implementation services to our increasing number of customers.
Research and Development Expenses. Research and development expenses for fiscal 2006 were $2.2 million, an increase of $0.8 million, or 59%, over research and development expenses of $1.4 million for fiscal 2005. The increase in research and development expenses was primarily due to a $0.6 million increase in employee related costs due to the addition of 5 personnel during fiscal 2006, and a $123,000 increase in stock-based compensation expense. Our research and development headcount increased as we hired additional personnel to upgrade and expand our on-demand software.
Sales and Marketing Expenses. Sales and marketing expenses for fiscal 2006 were $8.6 million, an increase of $2.7 million, or 46%, compared to sales and marketing expenses of $5.9 million for fiscal 2005. The increase was primarily due to a $1.7 million increase in employee related costs due to the addition of 20 personnel during fiscal 2006 to our sales and marketing teams, a $0.5 million increase in sales commissions as a result of increased sales, and a $0.2 million increase in stock-based compensation expense. Our sales and marketing headcount increased as we hired additional personnel to focus on adding new customers and increasing revenues from existing customers.
General and Administrative Expenses. General and administrative expenses for fiscal 2006 were $4.3 million, an increase of $1.5 million, or 55%, compared to general and administrative expenses of $2.8 million for fiscal 2005. The increase in general and administrative expenses was primarily due to a $0.9 million increase in employee related costs due to the addition of 5 personnel during fiscal 2006, a $0.3 million increase in rent expense related to taking on additional space to support continued growth, and to a lesser extent, a $60,000 increase in stock-based compensation expense. Our general and administrative headcount increased as we hired additional personnel to support our growth.
Other Income (Expense). Other income (expense) for fiscal 2006 was an expense of $0.2 million, a decrease of $0.2 million from other expense of $0.4 million in fiscal 2005. This decrease in other expense was primarily due to decreased interest expense attributable to a lower average outstanding balance on our line of credit.
56
Selected Consolidated Quarterly Operating Results
The following table presents consolidated statement of operations data for each of the eight quarters in the period beginning April 1, 2005 and ending March 31, 2007. This information is derived from our unaudited financial statements, which in the opinion of management contain all adjustments necessary for a fair presentation of such financial data. Operating results for these periods are not necessarily indicative of the operating results for a full year. Historical results are not necessarily indicative of the results to be expected in future periods. You should read this data together with our financial statements and the related notes to these financial statements included elsewhere in this annual report.
| | | | | | | | | | | | | | | | | | | | | | | | | | | | | | | | |
| | | Three months ended | |
| (in thousands, except per share data) | | June 30
2005 | | | Sept. 30
2005 | | | Dec. 31
2005 | | | March 31
2006 | | | June 30
2006 | | | Sept. 30
2006 | | | Dec. 31
2006 | | | March 31
2007 | |
| | | (Unaudited) | |
Statements of Operations Data: | | | | | | | | | | | | | | | | | | | | | | | | | | | | | | | | |
Revenue: | | | | | | | | | | | | | | | | | | | | | | | | | | | | | | | | |
Subscription revenues | | $ | 2,672 | | | $ | 3,101 | | | $ | 3,488 | | | $ | 3,776 | | | $ | 4,441 | | | $ | 4,840 | | | $ | 5,484 | | | $ | 5,738 | |
Advertising revenues | | | 464 | | | | 502 | | | | 560 | | | | 736 | | | | 715 | | | | 602 | | | | 553 | | | | 661 | |
| | | | | | | | | | | | | | | | | | | | | | | | | | | | | | | | |
Total revenues | | | 3,136 | | | | 3,603 | | | | 4,048 | | | | 4,512 | | | | 5,156 | | | | 5,442 | | | | 6,037 | | | | 6,399 | |
Cost of revenues (1) | | | 688 | | | | 679 | | | | 797 | | | | 944 | | | | 1,052 | | | | 1,122 | | | | 1,483 | | | | 1,677 | |
| | | | | | | | | | | | | | | | | | | | | | | | | | | | | | | | |
Gross profit | | | 2,448 | | | | 2,924 | | | | 3,251 | | | | 3,568 | | | | 4,104 | | | | 4,320 | | | | 4,554 | | | | 4,722 | |
Operating Expenses: | | | | | | | | | | | | | | | | | | | | | | | | | | | | | | | | |
Research and development (1) | | | 416 | | | | 502 | | | | 567 | | | | 753 | | | | 728 | | | | 899 | | | | 1,180 | | | | 1,309 | |
Sales and marketing (1) | | | 1,670 | | | | 1,915 | | | | 2,222 | | | | 2,766 | | | | 2,687 | | | | 2,965 | | | | 3,396 | | | | 3,744 | |
General and administrative (1) | | | 964 | | | | 1,001 | | | | 1,166 | | | | 1,206 | | | | 1,448 | | | | 1,553 | | | | 1,974 | | | | 3,947 | |
Amortization of intangible assets | | | — | | | | — | | | | — | | | | — | | | | 53 | | | | 24 | | | | 25 | | | | 24 | |
| | | | | | | | | | | | | | | | | | | | | | | | | | | | | | | | |
Total operating expenses | | | 3,050 | | | | 3,418 | | | | 3,955 | | | | 4,725 | | | | 4,916 | | | | 5,441 | | | | 6,575 | | | | 9,024 | |
Loss from operations | | | (602 | ) | | | (494 | ) | | | (704 | ) | | | (1,157 | ) | | | (812 | ) | | | (1,121 | ) | | | (2,021 | ) | | | (4,302 | ) |
Other income (expense) | | | (52 | ) | | | (44 | ) | | | (37 | ) | | | (40 | ) | | | (22 | ) | | | (25 | ) | | | (27 | ) | | | 248 | |
| | | | | | | | | | | | | | | | | | | | | | | | | | | | | | | | |
Net loss | | | (654 | ) | | | (538 | ) | | | (741 | ) | | | (1,197 | ) | | | (834 | ) | | | (1,146 | ) | | | (2,048 | ) | | | (4,054 | ) |
Accretion of preferred stock | | | (129 | ) | | | (129 | ) | | | (129 | ) | | | (129 | ) | | | (129 | ) | | | (129 | ) | | | (129 | ) | | | (84 | ) |
| | | | | | | | | | | | | | | | | | | | | | | | | | | | | | | | |
Net loss attributable to common stockholders per share | | $ | (783 | ) | | $ | (667 | ) | | $ | (870 | ) | | $ | (1,326 | ) | | $ | (963 | ) | | $ | (1,275 | ) | | $ | (2,177 | ) | | $ | (4,138 | ) |
| | | | | | | | | | | | | | | | | | | | | | | | | | | | | | | | |
Net loss attributable to common stockholders per share—basic and diluted | | $ | (0.21 | ) | | $ | (0.17 | ) | | $ | (0.20 | ) | | $ | (0.31 | ) | | $ | (0.20 | ) | | $ | (0.26 | ) | | $ | (0.43 | ) | | $ | (0.44 | ) |
| (1) | Amounts include stock-based compensation, as follows: |
| | | | | | | | | | | | | | | | | | | | | | | | |
| | | Three months ended |
| (in thousands) | | June 30
2005 | | Sept. 30
2005 | | Dec. 31
2005 | | March 31
2006 | | June 30
2006 | | Sept. 30
2006 | | Dec. 31
2006 | | March 31
2007 |
| | | (Unaudited) |
Stock-based compensation: | | | | | | | | | | | | | | | | | | | | | | | | |
Cost of revenues | | $ | 10 | | $ | 8 | | $ | 53 | | $ | 115 | | $ | 28 | | $ | 27 | | $ | 178 | | $ | 204 |
Research and development | | | 7 | | | 6 | | | 65 | | | 102 | | | 19 | | | 18 | | | 170 | | | 298 |
Sales and marketing | | | 30 | | | 25 | | | 141 | | | 205 | | | 69 | | | 67 | | | 378 | | | 472 |
General and administrative | | | 50 | | | 36 | | | 103 | | | 122 | | | 127 | | | 132 | | | 274 | | | 1,904 |
| | | | | | | | | | | | | | | | | | | | | | | | |
| | $ | 97 | | $ | 75 | | $ | 362 | | $ | 544 | | $ | 243 | | $ | 244 | | $ | 1,000 | | $ | 2,878 |
| | | | | | | | | | | | | | | | | | | | | | | | |
57
As percentage of revenues:
| | | | | | | | | | | | | | | | | | | | | | | | |
| | | Three months ended | |
| | | June 30
2005 | | | Sept. 30
2005 | | | Dec. 31
2005 | | | March 31
2006 | | | June 30
2006 | | | Sept. 30
2006 | | | Dec. 31
2006 | | | March 31
2007 | |
| | | (Unaudited) | |
Statements of Operations Data: | | | | | | | | | | | | | | | | | | | | | | | | |
Revenue: | | | | | | | | | | | | | | | | | | | | | | | | |
Subscription revenues | | 85 | % | | 86 | % | | 86 | % | | 84 | % | | 86 | % | | 89 | % | | 91 | % | | 90 | % |
Advertising revenues | | 15 | | | 14 | | | 14 | | | 16 | | | 14 | | | 11 | | | 9 | | | 10 | |
| | | | | | | | | | | | | | | | | | | | | | | | |
Total revenues | | 100 | | | 100 | | | 100 | | | 100 | | | 100 | | | 100 | | | 100 | | | 100 | |
Cost of revenues | | 22 | | | 19 | | | 20 | | | 21 | | | 20 | | | 21 | | | 25 | | | 26 | |
| | | | | | | | | | | | | | | | | | | | | | | | |
Gross profit | | 78 | | | 81 | | | 80 | | | 79 | | | 80 | | | 79 | | | 75 | | | 74 | |
Operating Expenses: | | | | | | | | | | | | | | | | | | | | | | | | |
Research and development | | 13 | | | 14 | | | 14 | | | 17 | | | 14 | | | 17 | | | 20 | | | 20 | |
Sales and marketing | | 53 | | | 53 | | | 55 | | | 61 | | | 53 | | | 54 | | | 56 | | | 59 | |
General and administrative | | 31 | | | 28 | | | 28 | | | 27 | | | 28 | | | 29 | | | 33 | | | 62 | |
Amortization of intangible assets | | — | | | — | | | — | | | — | | | 1 | | | — | | | — | | | — | |
| | | | | | | | | | | | | | | | | | | | | | | | |
Total operating expenses | | 97 | | | 95 | | | 97 | | | 105 | | | 96 | | | 100 | | | 109 | | | 141 | |
Loss from operations | | (19 | ) | | (14 | ) | | (17 | ) | | (26 | ) | | (16 | ) | | (21 | ) | | (34 | ) | | (67 | ) |
Other income (expense) | | (2 | ) | | (1 | ) | | (1 | ) | | (1 | ) | | — | | | — | | | — | | | 4 | |
| | | | | | | | | | | | | | | | | | | | | | | | |
Net loss | | (21 | )% | | (15 | )% | | (18 | )% | | (27 | )% | | (16 | )% | | (21 | )% | | (34 | )% | | (63 | )% |
| | | | | | | | | | | | | | | | | | | | | | | | |
Revenues increased sequentially in each of the quarters presented primarily due to increases in the number of total active customers and revenue recognized from deferred revenue.
Gross profit in absolute dollars also increased sequentially for the quarters presented primarily due to revenue growth. As a percentage of revenues, gross profit has decreased from 80% for the quarter ended December 31, 2005 to 74% for the quarter ended March 31, 2007 due to an increase in cost of revenues as a result of increases in the number of compensation and professional services personnel, and to a lesser extent, increased stock-based compensation expense.
Operating expenses in absolute dollars and as a percentage of revenues have increased sequentially for the past four quarters presented primarily due to increased sales and marketing expenses in absolute dollars resulting from increases in the number of sales personnel and to a lesser extent, increased stock-based compensation expense and increased sales commissions. Increased research and development expenses have also contributed to the overall increase in operating expenses due primarily to increased headcount we have continued to hire additional personnel to upgrade and expand our on-demand software product suite. General and administrative expenses have increased due to a number of factors including increased headcount and rent expense to support the Company’s growth as well as an increase in stock-based compensation expense and a general increase in expenses as a result of being a publicly traded company.
Liquidity and Capital Resources
At March 31, 2007, our principal sources of liquidity were cash and cash equivalents totaling $49.0 million and accounts receivable, net of allowance for doubtful accounts of $3.4 million compared to cash and cash equivalents of $1.8 million and accounts receivable, net of allowance for doubtful accounts of $2.9 million at March 31, 2006. The Company’s working capital as of March 31, 2007 was $34.3 million compared to a working capital deficit of $8.5 million as of March 31, 2006.
58
Cash provided by operating activities for the year ended March 31, 2007 was $3.1 million. This amount resulted from a net loss of $8.1 million, adjusted for net non-cash charges of $5.6 million and a $5.5 million net increase in working capital accounts. Non-cash items primarily consisted of $0.8 million of depreciation and amortization of property, equipment and software, $0.1 million of amortization of intangible assets, $4.4 million of stock-based compensation and $0.3 million of bonuses paid in common stock. The net increase in working capital of $5.5 million was comprised of increases in accounts receivable of $0.5 million, prepaid expense and other current assets of $0.7 million, deferred customer acquisition costs of $0.4 million, accounts payable of $0.3 million, accrued expenses and other current liabilities of $1.0 million and deferred revenue of $5.7 million. The increase in accounts receivable is primarily due to an overall increase in invoicing during fiscal 2007 compared to fiscal 2006. The increase in prepaid expense and other current assets is due primarily to an increased level of expenses related to both higher headcount levels in fiscal 2007 compared to fiscal 2006 and additional prepaid expenses that relate to being a publicly traded company. The increase in deferred customer acquisition costs is due primarily to increased invoicing and revenue in fiscal 2007 compared to fiscal 2006. The increase in accounts payable is due primarily to the company’s growth in fiscal 2007. The increase in accrued expenses is primarily due to an increase in accrued incentive compensation. The increase in deferred revenue is primarily due to increased invoicing less revenue recognition from our subscription customers in fiscal 2007 compared to fiscal 2006. The growth in the invoiced amounts was primarily due to sales to new customers, increased sales to existing customers, the introduction of new products, and the enhancement of existing products. Currently, payment for the majority of our subscription agreements is due upon invoicing. Because revenue is generally recognized ratably over the subscription period, payments received at the beginning of the subscription period result in an increase to accounts receivable and deferred revenue. Changes in deferred revenue generally indicate the trend for subscription revenues over the following year as the current portion of deferred revenue is expected to be recognized within 12 months.
Cash used in investing activities was $3.8 million and consisted primarily of $0.7 million paid for the acquisition of the e-Comp Data Services Division from Aon Consulting, Inc. in April 2006, $1.5 million paid for the acquisition of data underlying certain of our products, $1.3 million paid for purchases of property and equipment for new offices, network infrastructure and computer equipment to support our growth in employee headcount and $0.3 million of payments capitalized for the payment of software development costs. We intend to continue to invest in our content data sets, software development and network infrastructure to ensure our continued ability to enhance our existing software, expand our data sets, introduce new products, and maintain the reliability of our network.
Cash provided by financing activities was $47.9 million, which consisted primarily of $48.0 million in net proceeds from the Company’s initial public offering in February 2007, $0.4 million of proceeds from subscription payable resulting from the early exercise of employee stock options and $0.3 million of proceeds from subscription receivable resulting from loans granted to employees to exercise stock options. Offsetting these financing inflows was a $0.8 million repayment of the revolving credit line from a related party.
In August 2006, the company entered into a $5,000,000 credit facility with Silicon Valley Bank. The line, which expires in August 2008, provides for a term loan up to $1,000,000 and a $4,000,000 revolving working capital line of credit. Borrowings on the term loan bear interest at the bank’s prime rate plus 1.00% and interest is payable on a monthly basis. Borrowings on the revolving line bear interest at the bank’s prime rate plus 0.25%. The credit facility is collateralized by substantially all of the Company’s assets. In addition, the facility carries an unused revolving line facility fee of 0.375% of the balance available, but not drawn down. As of March 31, 2007, there were no outstanding borrowings under this credit facility.
On December 30, 2006, the Company entered into an agreement with a vendor to obtain additional data sets that runs for an initial one year term following the date of the initial delivery. The fee for the initial term is $1.5 million. At the end of the initial term, the agreement shall automatically renew for up to six subsequent one year terms unless terminated by the Company. The annual fees due to the vendor related to years two through
59
seven of the agreement are $0.5 million, $0.6 million, $0.6 million, $0.7 million, $0.8 million, and $0.9 million, respectively.
As of March 31, 2007, we had net operating loss carryforwards of $16.4 million which may be available to offset potential payments of future federal income tax liabilities which expire at various dates through 2027 and $6.1 million available to offset potential payments of future state income tax liabilities which expire at various dates through 2012. In the future, we may use our net operating loss carryforwards and would begin making cash tax payments once they are fully utilized. In addition, the limitations on utilizing net operating loss carryforwards and other state-level minimum tax requirements may also increase our overall tax obligations.
On May 15, 2007, the Company acquired the membership interests of ICR, a leading provider of industry-specific market intelligence for employee pay and benefits for the global technology and specialty consumer goods markets. Pursuant to the terms of the purchase agreements, we paid $10.3 million to the owners of ICR, of which $1 million has been placed in escrow for 12 months.
Given our current cash, accounts receivable and available borrowings under our credit facility, we believe that we will have sufficient liquidity to fund our business and meet our contractual obligations for the foreseeable future. However, we may need to raise additional funds in the future in the event that we pursue acquisitions or investments in complementary businesses or technologies or experience operating losses that exceed our expectations. If we raise additional funds through the issuance of equity or convertible securities, our stockholders may experience dilution. In the event that additional financing is required, we may not be able to obtain it on acceptable terms or at all.
During the last three fiscal years, inflation and changing prices have not had a material effect on our business and we do not expect that inflation or changing prices will materially affect our business in the foreseeable future.
Off-Balance-Sheet Arrangements
Under Generally Accepted Accounting Principles in the United States, certain obligations and commitments are not required to be included in the consolidated balance sheet. These obligations and commitments, while entered into in the normal course of business, may have a material impact on liquidity. The Company does not have any relationships with unconsolidated entities or financial partnerships, such as entities often referred to as structured finance or special purpose entities, which would have been established for the purpose of facilitating off-balance sheet arrangements or other contractually narrow or limited purposes. As such, the Company is not exposed to any financing, liquidity, market, or credit risk that could arise if the Company had engaged in such relationships. The following table discloses the Company’s contractual payment obligations as of March 31, 2007. As of March 31, 2007, we did not have any material purchase obligations, capital leases, or other material long-term commitments reflected on our balance sheet.
The following table summarizes our contractual cash obligations at March 31, 2007 and the effect such obligations are expected to have on our liquidity and cash flow in future periods:
| | | | | | | | | | | | | | | |
| | | Payments Due by Period |
Contractual obligations | | Total | | Less than
1 Year | | 1-3
Years | | 3-5
Years | | More than
5 Years |
| | | (in thousands) |
Operating leases | | $ | 3,375 | | $ | 1,724 | | $ | 1,651 | | $ | — | | $ | — |
Contractual commitments | | | 1,366 | | | 1,254 | | | 106 | | | 6 | | | |
| | | | | | | | | | | | | | | |
Total | | $ | 4,741 | | $ | 2,978 | | $ | 1,757 | | $ | 6 | | $ | — |
| | | | | | | | | | | | | | | |
60
The contractual commitment amounts in the table above are associated with agreements that are enforceable and legally binding and that specify all significant terms, including: fixed or minimum services to be used; fixed, minimum or variable price provisions; and the approximate timing of the transaction. Obligations under agreements that we can cancel without a significant penalty are not included in the table above.
New Accounting Pronouncements
In February 2007, the FASB issued SFAS 159,The Fair Value Option for Financial Assets and Financial Liabilities—Including an amendment of FASB Statement No. 115(“SFAS 159”), which permits entities to choose to measure many financial instruments and certain other items at fair value. The provisions of SFAS 159 are effective for fiscal years beginning after November 15, 2007. The Company has not yet determined the impact of adopting SFAS 159 on its financial statements.
In September 2006, the FASB issued SFAS 157,Fair Value Measurements (“SFAS 157”), which defines fair value, establishes a framework for measuring fair value, and expands disclosures about fair value measurements. The provisions of SFAS 157 are effective for fiscal years beginning after November 15, 2007. The Company has not yet determined the impact of adopting SFAS 157 on its financial statements.
In July 2006, the FASB issued Interpretation No. 48,Accounting for Uncertainty in Income Taxes—an interpretation of FASB Statement No. 109 (“FIN 48”), which clarifies the accounting for uncertainty in tax positions. This Interpretation requires that the Company recognize in its financial statements the impact of a tax position, if that position is more likely than not of being sustained on audit, based on the technical merits of the position. FIN 48 will be effective for fiscal years beginning after December 15, 2006. The Company is currently evaluating what impact, if any, the adoption of FIN 48 will have on its financial position and results of operations.
61
| ITEM 7A. | QUANTITATIVE AND QUALITATIVE DISCLOSURES ABOUT MARKET RISK |
Foreign Currency Exchange Risk. Our results of operations and cash flows are not subject to fluctuations due to changes in foreign currency exchange rates in any material respect.
Interest Rate Sensitivity. Interest income and expense are sensitive to changes in the general level of U.S. interest rates. However, based on the nature and current level of our investments, which are primarily cash and debt obligations, we believe that there is no material risk of exposure.
| ITEM 8. | FINANCIAL STATEMENTS AND SUPPLEMENTARY DATA |
The information required by Item 8 is contained on pages F-1 through F-27 of this report.
| ITEM 9. | CHANGES IN AND DISAGREEMENTS WITH ACCOUNTANTS ON ACCOUNTING AND FINANCIAL DISCLOSURE |
None.
| ITEM 9A. | CONTROLS AND PROCEDURES |
Evaluation of the Effectiveness of Disclosure Controls and Procedures
Our management evaluated, with the participation of the chief executive officer and chief financial officer, the effectiveness of our disclosure controls and procedures, as such term is defined under Rule 13a-15(f) of the Securities Exchange Act of 1934, as of the end of the period covered by this Annual Report on Form 10-K. Based on this evaluation, the chief executive officer and chief financial officer have concluded that our disclosure controls and procedures were effective as of the end of the period covered by this Report.
Our Board of Directors, acting through its Audit Committee, is responsible for the oversight of our accounting policies, financial reporting and internal control. The Audit Committee of the Board of Directors is comprised entirely of outside directors who are independent of management. The independent registered public accounting firm has full and unlimited access to the Audit Committee, with and without management, to discuss the adequacy of internal control over financial reporting, and any other matters that they believe should be brought to the attention of the Audit Committee.
Remediation of Prior Year Material Weaknesses
In connection with the audit of our financial statements as of and for the year ended March 31, 2006, our independent registered public accounting firm identified three material weaknesses in our internal control over financial reporting. A material weakness is a significant deficiency, or a combination of significant deficiencies, that results in more than a remote likelihood that a material misstatement of the annual or interim financial statements will not be prevented or detected. The material weaknesses identified during the year ended March 31, 2006 and the status of the remediation of each is as follows:
| | • | | We did not have sufficient number of accounting personnel who possessed an appropriate level of experience in SEC reporting requirements. This lack of enough experienced accounting personnel increased the risk of our preparing inaccurate financial statements. As a result, the financial statement drafts we prepared were missing or contained incomplete material footnotes (such as those related to earnings per share, stock-based compensation under SFAS 123R and income taxes) and disclosures required for a public company and certain adjustments for compensation expense relating to the adoption of SFAS 123R “Share Based Payments.” |
62
During the fiscal year ended March 31, 2007 we have expanded our internal accounting and legal teams to add additional skills and experience, specifically experience in public company reporting, including complex financial transaction accounting and reporting, as well as the use of qualified outside professionals as necessary to supplement our accounting expertise and enhance our internal accounting controls over financial reporting. We have hired a new Chief Financial Officer, a new General Counsel, a new Director of Finance and a Director of Accounting and Financial Reporting, each with a significant amount of public company reporting experience. As of March 31, 2007, we have successfully remediated this material weakness except for the portion that relates to the calculation of stock compensation expense under SFAS 123R. We have hired personnel resources with knowledge and experience dealing with SFAS 123R including outside consultants with expertise in GAAP, including SFAS 123R. Furthermore, the Company has instituted a control in which the work performed by outside consultants is reviewed by the Director of Accounting and Financial Reporting and/or the Director of Finance for reasonableness and consistency. However this deficiency will not be completely remediated until we have implemented a new software system and related controls to track stock option activity and calculate stock compensation expense in accordance with SFAS 123R. During the fiscal year ended March 31, 2007, we began the implementation of new on-demand stock option management software. This automated software will significantly reduce the potential for errors inherent in a spreadsheet based process. Although the implementation of this system began in fiscal year 2007, it has not been completed as of the date of this report. Based on our remediation efforts as of the date of this report, specifically the hiring of knowledgeable and experienced personnel, this material weakness has now been classified as a significant deficiency pending the completion of the implementation of our new stock option accounting system and the implementation of related controls.
| | • | | In prior years, we entered into sophisticated and high dollar value equity and debt financing transactions to finance our business, but did not have a formal policy regarding the policies and procedures for the recording and reporting of these types of transactions (specifically related to the beneficial conversion feature of our preferred stock issuance). In addition, we did not have a sufficient number of accounting personnel who possessed an appropriate level of experience in the selection and application of GAAP with respect to redeemable preferred stock. |
As indicated above we have expanded our internal accounting and legal teams to add additional skills and experience, specifically experience in public company reporting, including complex financial transaction accounting and reporting, as well as the use of qualified outside professionals as necessary to supplement our accounting expertise and enhance our internal accounting controls over financial reporting. However, not all of the enhanced review procedures had been implemented as of March 31, 2007. As a result the material weakness identified above has been classified as a significant deficiency as of March 31, 2007.
| | • | | We also had material weaknesses in the design and operation of our internal controls relating to revenue accounting. In particular, because of system limitations, we did not have a process or policy to maintain a detailed deferred revenue listing by customer to support our deferred revenue balances. As a result of the identified deficiency, we recorded a material adjustment to reclassify from short-term to long-term deferred revenue within the liability section of our balance sheet. In some instances, we also did not maintain sufficient evidence of our customers’ completion of implementation of our products or subscription renewals. Lastly, the documentation of our revenue recognition policy lacked sufficient detail to support how we recognize revenue in accordance with GAAP. |
During the fiscal year ended March 31, 2007, we began the implementation of our new accounting system and related controls, which we believe will alleviate the revenue accounting issues identified during the fiscal year ended March 31, 2006. This new accounting system will fully integrate our revenue accounting and general ledger systems (as compared to our current accounting system which is not integrated with the three other systems we use to record customer transactions and activities and the calculation of amounts recognized as revenue) and is more sophisticated in the manner in which it handles complex revenue transactions. Although the implementation of this system began in fiscal year 2007, it has not been completed as of the date of this report. Subsequent to March 31, 2007, but prior to the date of this report, we have enhanced the documentation of our
63
revenue recognition policy to support how we recognize revenue in accordance with GAAP to encompass a broader range of transactions. As of March 31, 2007, we had established new processes and controls relating to the retention of evidence of our customers’ product implementations and subscription renewals. Also, as of March 31, 2007 we had established a policy and process to maintain a detailed deferred revenue listing by customer to support our deferred revenue balances. As a result of these ongoing remediation efforts, this material weakness has been classified as a significant deficiency as of March 31, 2007.
While we expect to complete the remediation of the significant deficiencies above, we cannot assure you that we will be able to do so, which could impair our ability to accurately and timely report our financial position, results of operations or cash flows.
Changes to Internal Control Over Financial Reporting
Our management has not identified any changes in our internal controls over financial reporting during our Fourth Quarter 2007 that have materially affected, or are reasonably likely to materially affect, our internal controls over financial reporting, except as discussed above.
Because of the inherent limitations in all control systems, no evaluation of controls can provide absolute assurance that all control issues within our company have been or will be detected. Even effective internal control over financial reporting can only provide reasonable assurance with respect to financial statement preparation. Furthermore, because of changes in conditions, the effectiveness of internal control over financial reporting may vary over time. Our management, including our President and Chief Executive Officer and Chief Financial Officer, does not expect that our controls and procedures will prevent all errors.
| ITEM 9B. | OTHER INFORMATION. |
None.
64
PART III
| ITEM 10. | DIRECTORS AND EXECUTIVE OFFICERS AND CORPORATE GOVERNANCE |
Except as set forth under the heading “Executive Officers” in Part I of this Annual Report on Form 10-K, the information required by this item is incorporated by reference to our Proxy Statement for the 2007 Annual Meeting of Stockholders to be filed with the SEC within 120 days after the end of our fiscal year ended March 31, 2007.
| ITEM 11. | EXECUTIVE COMPENSATION |
The information required by this item is incorporated by reference to our Proxy Statement for the 2007 Annual Meeting of Stockholders to be filed with the SEC within 120 days after the end of our fiscal year ended March 31, 2007.
| ITEM 12. | SECURITY OWNERSHIP OF CERTAIN BENEFICIAL OWNERS AND MANAGEMENT AND RELATED STOCKHOLDER MATTERS |
The information required by this item is incorporated by reference to our Proxy Statement for the 2007 Annual Meeting of Stockholders to be filed with the SEC within 120 days after the end of our fiscal year ended March 31, 2007.
| ITEM 13. | CERTAIN RELATIONSHIPS AND RELATED TRANSACTIONS AND DIRECTOR INDEPENDENCE |
The information required by this item is incorporated by reference to our Proxy Statement for the 2007 Annual Meeting of Stockholders to be filed with the SEC within 120 days after the end of our fiscal year ended March 31, 2007.
| ITEM 14. | PRINCIPAL ACCOUNTANT FEES AND SERVICES |
The information required by this item is incorporated by reference to our Proxy Statement for the 2007 Annual Meeting of Stockholders to be filed with the SEC within 120 days after the end of our fiscal year ended March 31, 2007.
65
PART IV
| ITEM 15. | EXHIBITS AND FINANCIAL STATEMENT SCHEDULES |
All other schedules are omitted because they are either not applicable or the required information is included in the consolidated financial statements or related notes.
(a)(3) Exhibits.
| | |
Exhibit
Number | | Description |
| 2.1 | | Membership Interest Purchase Agreement dated as of May 15, 2007 by and among Salary.com, Inc., ICR Limited, L.C., Joseph Duggan and Roger Sturtevant, Jr. (incorporated by reference to Exhibit 2.1 filed with the Company’s Current Report on Form 8-K dated May 15, 2007). |
| |
| 2.2 | | Share Purchase Agreement dated as of May 15, 2007, by and among Salary.com, Inc., John Cunnell and Valerie Cunnell (incorporated by reference to Exhibit 2.2 filed with the Company’s Current Report on Form 8-K dated May 15, 2007). |
| |
| 3.1 | | Amended and Restated Certificate of Incorporation of the Registrant Agreement (incorporated by reference to Exhibit 3.1 filed with Amendment No. 2 to the Company’s Registration Statement on Form S-1, dated January 19, 2007, Registration No. 333-138646). |
| |
| 3.2 | | Form of Second Amended and Restated Certificate of Incorporation (incorporated by reference to Exhibit 3.2 filed with Amendment No. 2 to the Company’s Registration Statement on Form S-1, dated January 19, 2007, Registration No. 333-138646). |
| |
| 3.3 | | Amended and Restated By-Laws (incorporated by reference to Exhibit 3.3 filed with Amendment No. 2 to the Company’s Registration Statement on Form S-1, dated January 19, 2007, Registration No. 333-138646). |
| |
| 4.1 | | Specimen Common Stock Certificate (incorporated by reference to Exhibit 4.1 filed with Amendment No. 2 to the Company’s Registration Statement on Form S-1, dated January 19, 2007, Registration No. 333-138646). |
| |
| 10.1 | | Second Amended and Restated 2000 Stock Option Incentive Plan (incorporated by reference to Exhibit 10.1 filed with the Company’s Registration Statement on Form S-1, dated November 13, 2006, Registration No. 333-138646). * |
66
| | |
Exhibit
Number | | Description |
| 10.1.1 | | 2000 Stock Option and Incentive Plan, Form of Incentive Stock Option Agreement (incorporated by reference to Exhibit 10.1.1 filed with the Company’s Registration Statement on Form S-1, dated November 13, 2006, Registration No. 333-138646). * |
| |
| 10.2 | | First Amended and Restated 2004 Stock Option and Incentive Plan (incorporated by reference to Exhibit 10.2 filed with the Company’s Registration Statement on Form S-1, dated November 13, 2006, Registration No. 333-138646). * |
| |
| 10.2.1 | | 2004 Stock Option and Incentive Plan, Form of Stock Option Agreement (incorporated by reference to Exhibit 10.2.1 filed with the Company’s Registration Statement on Form S-1, dated November 13, 2006, Registration No. 333-138646).* |
| |
| 10.3 | | 2007 Stock Option and Incentive Plan (incorporated by reference to Exhibit 10.3 filed with Amendment No. 3 to the Company’s Registration Statement on Form S-1, dated February 9, 2007, Registration No. 333-138646). * |
| |
| 10.3.1 | | 2007 Stock Option and Incentive Plan, Form of Incentive Stock Option Agreement (incorporated by reference to Exhibit 10.3.1 filed with Amendment No. 2 to the Company’s Registration Statement on Form S-1, dated January 19, 2007, Registration No. 333-138646). * |
| |
| 10.3.2 | | 2007 Stock Option and Incentive Plan, Form of Non-Qualified Stock Option Agreement (incorporated by reference to Exhibit 10.3.2 filed with Amendment No. 2 to the Company’s Registration Statement on Form S-1, dated January 19, 2007, Registration No. 333-138646). * |
| |
| 10.3.3 | | 2007 Stock Option and Incentive Plan, Form of Non-Qualified Stock Option Non-Employee Agreement (incorporated by reference to Exhibit 10.3.3 filed with Amendment No. 2 to the Company’s Registration Statement on Form S-1, dated January 19, 2007, Registration No. 333-138646). * |
| |
| 10.4 | | 2007 Employee Stock Purchase Plan (incorporated by reference to Exhibit 10.4 filed with Amendment No. 2 to the Company’s Registration Statement on Form S-1, dated January 19, 2007, Registration No. 333-138646). * |
| |
| 10.5 | | Second Amended and Restated Stockholders Agreement (incorporated by reference to Exhibit 10.5 filed with the Company’s Registration Statement on Form S-1, dated November 13, 2006, Registration No. 333-138646). |
| |
| 10.5.1 | | Amendment to Second Amended and Restated Stockholders Agreement (incorporated by reference to Exhibit 10.5.1 filed with Amendment No. 1 to the Company’s Registration Statement on Form S-1, dated December 21, 2006, Registration No. 333-138646). |
| |
| 10.6 | | Second Amended and Restated Registration Rights Agreement (incorporated by reference to Exhibit 10.6 filed with the Company’s Registration Statement on Form S-1, dated November 13, 2006, Registration No. 333-138646). |
| |
| 10.7 | | Form of Common Stock Purchase Warrant (incorporated by reference to Exhibit 10.7 filed with the Company’s Registration Statement on Form S-1, dated November 13, 2006, Registration No. 333-138646). |
| |
| 10.8 | | Agreement for Extension of Credit (incorporated by reference to Exhibit 10.8 filed with the Company’s Registration Statement on Form S-1, dated November 13, 2006, Registration No. 333-138646). |
| |
| 10.8.1 | | Amendment to No. 1 Agreement for Extension of Credit (incorporated by reference to Exhibit 10.8.1 filed with the Company’s Registration Statement on Form S-1, dated November 13, 2006, Registration No. 333-138646). |
67
| | |
Exhibit
Number | | Description |
| 10.8.2 | | Assignment Agreement for Agreement of Extension of Credit (incorporated by reference to Exhibit 10.8.2 filed with the Company’s Registration Statement on Form S-1, dated November 13, 2006, Registration No. 333-138646). |
| |
| 10.9 | | Loan and Security Agreement (incorporated by reference to Exhibit 10.9 filed with the Company’s Registration Statement on Form S-1, dated November 13, 2006, Registration No. 333-138646). |
| |
| 10.10 | | Sublease (incorporated by reference to Exhibit 10.10 filed with the Company’s Registration Statement on Form S-1, dated November 13, 2006, Registration No. 333-138646). |
| |
| 10.10.1 | | Amendment No. 1 to Sublease (incorporated by reference to Exhibit 10.10 filed with the Company’s Registration Statement on Form S-1, dated November 13, 2006, Registration No. 333-138646). |
| |
| 10.12 | | Form of Indemnification Agreement (incorporated by reference to Exhibit 10.12 filed with Amendment No. 2 to the Company’s Registration Statement on Form S-1, dated January 19, 2007, Registration No. 333-138646). |
| |
| 10.13 | | Form of Employment Agreement with G. Kent Plunkett (incorporated by reference to Exhibit 10.13 filed with Amendment No. 3 to the Company’s Registration Statement on Form S-1, dated February 9, 2007, Registration No. 333-138646).* |
| |
| 10.14 | | Letter Agreement Re: Employment and Compensation with Kenneth S. Goldman (incorporated by reference to Exhibit 10.12 filed with the Company’s Registration Statement on Form S-1, dated November 13, 2006, Registration No. 333-138646).* |
| |
| 21.1 | | Subsidiaries of the Company (filed herewith). |
| |
| 23.1 | | Consent of Grant Thornton LLP (filed herewith). |
| |
| 23.2 | | Consent of Vitale Caturano & Company, Ltd. (filed herewith). |
| |
| 24.1 | | Power of Attorney (filed herewith as part of the signature page hereto). |
| |
| 31.1 | | Rule 13a-14(a) Certification of Chief Executive Officer (filed herewith). |
| |
| 31.2 | | Rule 13a-14(a) Certification of Chief Financial Officer (filed herewith). |
| |
| 32.1 | | Certification of Chief Executive Officer and Chief Financial Officer pursuant to 18 U.S.C. Section 1350, as adopted pursuant to Section 906 of the Sarbanes-Oxley Act of 2002 (furnished herewith). |
| * | Compensatory plan or arrangement applicable to management. |
68
SIGNATURES
Pursuant to the requirements of Section 13 or 15(d) of the Securities Exchange Act of 1934, the registrant has duly caused this report to be signed on its behalf by the undersigned, thereunto duly authorized on June 28, 2007.
| | |
| SALARY.COM, INC. |
| |
| By: | | /s/ G. KENT PLUNKETT |
| | G. Kent Plunkett |
| | Chairman of the Board, President and Chief Executive Officer |
Power of Attorney
Each person whose signature appears below constitutes and appoints G. Kent Plunkett, Kenneth S. Goldman and Elliot J. Mark, and each of them, his true and lawful attorneys-in-fact and agents, with full power of substitution in each of them, for him and in his name, place, and stead, and in any and all capacities, to sign this Annual Report on Form 10-K of Salary.com, Inc. and any amendments thereto, and to file the same, with all exhibits thereto and any other documents in connection therewith, with the Securities and Exchange Commission, granting unto said attorneys-in-fact and agents, and each of them, full power and authority to do and perform each and every act and thing requisite or necessary to be done in and about the premises, as fully and to all intents and purposes as he might or could do in person, hereby ratifying and confirming all that said attorneys-in-fact and agents or any of them or their or his substitute or substitutes may lawfully do or cause to be done by virtue hereof.
Pursuant to the requirements of the Securities Exchange Act of 1934, this report has been signed below by the following persons on behalf of the registrant and in the capacities and on the dates indicated.
| | | | |
Signature | | Title | | Date |
| | |
/s/ G. KENT PLUNKETT G. Kent Plunkett | | Chairman of the Board, President and Chief Executive Officer (Principal Executive Officer) | | June 28, 2007 |
| | |
/s/ KENNETH S. GOLDMAN Kenneth S. Goldman | | Senior Vice President, Chief Financial Officer, Treasurer and Director (Principal Financial and Accounting Officer) | | June 28, 2007 |
| | |
/s/ YONG ZHANG Yong Zhang | | Executive Vice President, Chief Operating Officer and Director | | June 28, 2007 |
| | |
/s/ PAUL R. DAOUST Paul R. Daoust | | Director | | June 28, 2007 |
| | |
/s/ JOHN F. GREGG John F. Gregg | | Director | | June 28, 2007 |
| | |
/s/ EDWARD F. MCCAULEY Edward F. McCauley | | Director | | June 28, 2007 |
69
| | | | |
Signature | | Title | | Date |
| | |
/s/ JOHN R. SUMSER John R. Sumser | | Director | | June 28, 2007 |
| | |
/s/ TERRY TEMESCU Terry Temescu | | Director | | June 28, 2007 |
| | |
/s/ ROBERT A. TREVISANI Robert A. Trevisani | | Director | | June 28, 2007 |
70
Report of Independent Registered Public Accounting Firm
Board of Directors and Shareholders
Salary.com, Inc.
We have audited the accompanying balance sheets of Salary.com, Inc. (a Delaware corporation) as of March 31, 2007 and 2006, and the related statements of operations,stockholders’ equity (deficit), and cash flows for the years then ended.These financial statements are the responsibility of the Company’s management.Our responsibility is to express an opinion on these financial statements based on our audits.
We conducted our audits in accordance with the standards of the Public Company Accounting Oversight Board (United States).Those standards require that we plan and perform the audit to obtain reasonable assurance about whether the financial statements are free of material misstatement.The Company is not required to have, nor were we engaged to perform an audit of its internal control over financial reporting.Our audit included consideration of internal control over financial reporting as a basis for designing audit procedures that are appropriate in the circumstances, but not for the purpose of expressing an opinion on the effectiveness of the Company’s internal control over financial reporting.Accordingly, we express no such opinion.An audit also includes examining, on a test basis, evidence supporting the amounts and disclosures in the financial statements, assessing the accounting principles used and significant estimates made by management, as well as evaluating the overall financial statement presentation.We believe that our audits provide a reasonable basis for our opinion.
In our opinion, the financial statements referred to above present fairly, in all material respects, the financial position of Salary.com, Inc. as of March 31, 2007 and 2006, and the results of its operations and its cash flows for the years then ended, in conformity with accounting principles generally accepted in the United States of America.
Our audit was conducted for the purpose of forming an opinion on the basic financial statements taken as a whole. The Schedule II —Valuation and Qualifying Accounts as of March 31, 2007 and 2006 and for the years then ended is presented for purposes of additional analysis and is not a required part of the basic financial statements. This schedule has been subjected to the auditing procedures applied in the audit of the basic financial statements and, in our opinion, is fairly stated in all material respects in relation to the basic financial statements taken as a whole.
/s/ GRANT THORNTON LLP
Boston, Massachusetts
June 22, 2007
F-1
Report of Independent Registered Public Accounting Firm
To the Board of Directors and
Stockholders of Salary.com, Inc.
Waltham, Massachusetts
We have audited the accompanying statements of operations, stockholders’ equity, and cash flows of Salary.com, Inc. (The Company), a Delaware corporation, for the year ended March 31, 2005. Our audit also included the financial statement schedule — Valuation and Qualifying Accounts (Schedule II) for the year ended March 31, 2005. These financial statements and schedule are the responsibility of the Company’s management. Our responsibility is to express an opinion on these financial statements and schedule based on our audit.
We conducted our audit in accordance with the standards of the Public Company Accounting Oversight Board (United States). Those standards require that we plan and perform the audit to obtain reasonable assurance about whether the financial statements are free of material misstatement. The Company is not required to have, nor were we engaged to perform, an audit of its internal control over financial reporting. Our audit included consideration of internal control over financial reporting as a basis for designing audit procedures that are appropriate in the circumstances, but not for the purpose of expressing an opinion on the effectiveness of the company’s internal control over financial reporting. Accordingly, we express no such opinion. An audit also includes examining, on a test basis, evidence supporting the amounts and disclosures in the financial statements and schedule, assessing the accounting principles used and significant estimates made by management, as well as evaluating the overall financial statement presentation. We believe that our audit provides a reasonable basis for our opinion.
In our opinion, the financial statements referred to above present fairly, in all material respects, the results of Salary.com, Inc.’s operations and cash flows for the year ended March 31, 2005 in conformity with accounting principles generally accepted in the United States of America. Also, in our opinion, the related financial statement schedule, when considered in relation to the basic financial statements taken as a whole, presents fairly in all material respects the information set forth therein.
/s/ VITALE, CATURANO & COMPANY, LTD.
Boston, Massachusetts
December 23, 2005, except for the 19th and 20th paragraphs of
Note 9 as to which the date is November 4, 2006 and the 2nd paragraph of Note 9 as to which the date is January 17, 2007
F-2
SALARY.COM, INC.
CONSOLIDATED BALANCE SHEETS
| | | | | | | | |
| | | March 31,
2007 | | | March 31,
2006 | |
Assets | | | | | | | | |
Current assets: | | | | | | | | |
Cash and cash equivalents | | $ | 49,016,389 | | | $ | 1,813,715 | |
Accounts receivable, less allowance for doubtful accounts of $179,712 and $166,316, at March 31, 2007 and 2006, respectively | | | 3,364,931 | | | | 2,900,941 | |
Prepaid expenses and other current assets | | | 891,483 | | | | 152,201 | |
Deferred customer acquisition costs, current portion | | | 870,224 | | | | 494,110 | |
| | | | | | | | |
Total current assets | | | 54,143,027 | | | | 5,360,967 | |
| | | | | | | | |
Property, equipment and software, net | | | 1,937,250 | | �� | | 1,208,686 | |
Intangible assets, net | | | | | | | | |
Non-compete agreements, net | | | 292,002 | | | | — | |
Customer relationships, net | | | 96,000 | | | | — | |
Patents, net | | | 35,630 | | | | — | |
Data acquisition costs, net | | | 1,500,000 | | | | — | |
| | | | | | | | |
Total intangible assets, net | | | 1,923,632 | | | | — | |
Goodwill | | | 266,000 | | | | — | |
Deferred customer acquisition costs, net of current portion | | | 48,856 | | | | 28,856 | |
Security deposits | | | 341,708 | | | | 414,533 | |
Other assets | | | 15,000 | | | | 15,000 | |
| | | | | | | | |
| | | 4,532,446 | | | | 1,667,075 | |
| | | | | | | | |
Total assets | | $ | 58,675,473 | | | $ | 7,028,042 | |
| | | | | | | | |
Liabilities, Redeemable Convertible Preferred Stock and Stockholders’ Deficit | | | | | | | | |
Current liabilities: | | | | | | | | |
Accounts payable | | $ | 607,782 | | | $ | 290,062 | |
Accrued compensation | | | 1,898,529 | | | | 1,287,238 | |
Accrued expenses and other current liabilities | | | 1,104,714 | | | | 667,703 | |
Subscription payable | | | 693,638 | | | | 811,069 | |
Revolving line of credit, related party | | | — | | | | 800,000 | |
Deferred revenue, current portion | | | 15,506,966 | | | | 9,966,057 | |
| | | | | | | | |
Total current liabilities | | | 19,811,629 | | | | 13,822,129 | |
| | | | | | | | |
Deferred revenue, net of current portion | | | 880,688 | | | | 582,027 | |
| | | | | | | | |
Total liabilities | | | 20,692,317 | | | | 14,404,156 | |
| | | | | | | | |
Redeemable convertible preferred stock: | | | | | | | | |
Series A-1, $0001 par value, 808,251 shares authorized; 808,251 shares issued and outstanding, liquidation preference of $120,780 at March 31, 2006 | | | — | | | | 120,780 | |
Series A-2, $0001 par value, 1,350,000 shares authorized; 1,350,000 shares issued and outstanding, liquidation preference of $308,813 at March 31, 2006 | | | — | | | | 308,813 | |
Series A-3, $0001 par value, 6,000,000 shares authorized; 3,568,720 shares issued and outstanding, liquidation preference of $1,632,687 at March 31, 2006 | | | — | | | | 1,632,687 | |
Series A-4, $0001 par value, 6,000,000 shares authorized; 3,730,500 shares issued and outstanding, liquidation preference of $1,054,369 at March 31, 2006 | | | — | | | | 1,054,369 | |
Series B, $0001 par value, 10,000,000 shares authorized; 5,805,719 shares issued and outstanding, liquidation preference of $7,460,114 at March 31, 2006 | | | — | | | | 7,421,458 | |
Commitments and contingencies (Note 7) | | | — | | | | — | |
Stockholders’ deficit: | | | | | | | | |
Preferred stock, $.0001 par value; 5,000,000 shares authorized; none issued or outstanding | | | — | | | | — | |
Common stock, $.0001 par value; 100,000,000 and 80,000,000 shares authorized at March 31, 2007 and 2006, respectively; 13,315,580 issued and outstanding at March 31, 2007; 4,658,312 issued and 4,653,832 outstanding at March 31, 2006 | | | 1,331 | | | | 466 | |
Additional paid-in capital | | | 67,378,802 | | | | 3,209,141 | |
Treasury stock, 4,480 shares at cost at March 31, 2006 | | | — | | | | (1,000 | ) |
Subscription receivable | | | — | | | | (279,139 | ) |
Accumulated other comprehensive loss | | | (666 | ) | | | — | |
Accumulated deficit | | | (29,396,311 | ) | | | (20,843,689 | ) |
| | | | | | | | |
Total stockholders’ equity (deficit) | | | 37,983,156 | | | | (17,914,221 | ) |
| | | | | | | | |
Total liabilities, redeemable convertible preferred stock and stockholders’ deficit | | $ | 58,675,473 | | | $ | 7,028,042 | |
| | | | | | | | |
The accompanying notes are an integral part of the consolidated financial statements.
F-3
SALARY.COM, INC.
CONSOLIDATED STATEMENTS OF OPERATIONS
| | | | | | | | | | | | |
| | | Years ended March 31, | |
| | | 2007 | | | 2006 | | | 2005 | |
Revenue: | | | | | | | | | | | | |
Subscription revenues | | $ | 20,502,788 | | | $ | 13,037,339 | | | $ | 8,565,055 | |
Advertising revenues | | | 2,531,259 | | | | 2,262,031 | | | | 1,410,523 | |
| | | | | | | | | | | | |
Total revenues | | | 23,034,047 | | | | 15,299,370 | | | | 9,975,578 | |
Cost of revenues (1) | | | 5,334,018 | | | | 3,107,889 | | | | 1,830,872 | |
| | | | | | | | | | | | |
Gross profit | | | 17,700,029 | | | | 12,191,481 | | | | 8,144,706 | |
| | | | | | | | | | | | |
Operating expenses: | | | | | | | | | | | | |
Research and development (1) | | | 4,115,635 | | | | 2,238,095 | | | | 1,410,183 | |
Marketing and sales (1) | | | 12,792,121 | | | | 8,573,582 | | | | 5,854,492 | |
General and administrative (1) | | | 8,922,186 | | | | 4,336,859 | | | | 2,798,430 | |
Amortization of intangible assets | | | 125,998 | | | | — | | | | — | |
| | | | | | | | | | | | |
Total operating expenses | | | 25,955,940 | | | | 15,148,536 | | | | 10,063,105 | |
| | | | | | | | | | | | |
Loss from operations | | | (8,255,911 | ) | | | (2,957,055 | ) | | | (1,918,399 | ) |
Other income (expense): | | | | | | | | | | | | |
Interest income | | | 297,690 | | | | 2,979 | | | | 2,662 | |
Interest expense | | | (115,595 | ) | | | (159,140 | ) | | | (357,168 | ) |
Other expense | | | (8,010 | ) | | | (16,515 | ) | | | (17,015 | ) |
| | | | | | | | | | | | |
Total other income (expense) | | | 174,085 | | | | (172,676 | ) | | | (371,521 | ) |
| | | | | | | | | | | | |
Net loss | | | (8,081,826 | ) | | | (3,129,731 | ) | | | (2,289,920 | ) |
Accretion of preferred stock | | | (470,796 | ) | | | (515,586 | ) | | | (512,997 | ) |
| | | | | | | | | | | | |
Net loss attributable to common stockholders | | $ | (8,552,622 | ) | | $ | (3,645,317 | ) | | $ | (2,802,917 | ) |
| | | | | | | | | | | | |
Net loss attributable to common stockholders per share—basic and diluted | | $ | (1.42 | ) | | $ | (0.89 | ) | | $ | (0.81 | ) |
| | | | | | | | | | | | |
Weighted average shares outstanding—basic and diluted | | | 6,022,792 | | | | 4,079,224 | | | | 3,467,985 | |
(1) Amounts include stock-based compensation expense, as follows: | |
| |
| | | Years ended March 31, | |
| | | 2007 | | | 2006 | | | 2005 | |
Cost of revenues | | $ | 437,177 | | | $ | 185,537 | | | $ | 41,500 | |
Research and development | | | 504,609 | | | | 180,015 | | | | 57,311 | |
Marketing and sales | | | 986,090 | | | | 401,322 | | | | 162,143 | |
General and administrative | | | 2,437,435 | | | | 311,420 | | | | 251,536 | |
| | | | | | | | | | | | |
| | $ | 4,365,311 | | | $ | 1,078,294 | | | $ | 512,490 | |
| | | | | | | | | | | | |
The accompanying notes are an integral part of the consolidated financial statements.
F-4
SALARY.COM, INC.
CONSOLIDATED STATEMENTS OF STOCKHOLDERS’ EQUITY (DEFICIT)
| | | | | | | | | | | | | | | | | | | | | | | | | | | | | | | | | |
| | | Common Stock | | Additional Paid-In Capital | | | Treasury Stock | | | Subscription Receivable | | | Accumulated Deficit | | | Accumulated Other Comprehensive Loss | | | Total Stockholders’ Equity
(Deficit) | |
| | | Shares | | | Amount | | | Shares | | | Amount | | | | | |
Balance at March 31, 2004 | | 3,359,534 | | | $ | 336 | | $ | 1,325,602 | | | — | | | $ | — | | | $ | — | | | $ | (14,395,455 | ) | | $ | — | | | $ | (13,069,517 | ) |
Issuance of common stock for warrant and options exercises | | 532,559 | | | | 53 | | | 119,777 | | | — | | | | — | | | | — | | | | — | | | | — | | | | 119,830 | |
Accretion of preferred stock to redemption value | | — | | | | — | | | — | | | — | | | | — | | | | — | | | | (512,997 | ) | | | — | | | | (512,997 | ) |
Stock-based compensation expense | | — | | | | — | | | 512,490 | | | — | | | | — | | | | — | | | | — | | | | — | | | | 512,490 | |
Net loss | | — | | | | — | | | — | | | — | | | | — | | | | — | | | | (2,289,920 | ) | | | | | | | (2,289,920 | ) |
| | | | | | | | | | | | | | | | | | | | | | | | | | | | | | | | | |
Balance at March 31, 2005 | | 3,892,093 | | | $ | 389 | | $ | 1,957,869 | | | — | | | $ | — | | | $ | — | | | $ | (17,198,372 | ) | | $ | — | | | $ | (15,240,114 | ) |
Issuance of common stock for warrant and options exercises | | 766,219 | | | | 77 | | | 172,978 | | | — | | | | — | | | | — | | | | — | | | | — | | | | 173,055 | |
Purchase of treasury stock | | — | | | | — | | | — | | | 4,480 | | | | (1,000 | ) | | | — | | | | — | | | | — | | | | (1,000 | ) |
Subscription receivable | | — | | | | — | | | — | | | — | | | | — | | | | (279,139 | ) | | | — | | | | — | | | | (279,139 | ) |
Accretion of preferred stock to redemption value | | — | | | | — | | | — | | | — | | | | — | | | | — | | | | (515,586 | ) | | | — | | | | (515,586 | ) |
Stock-based compensation expense | | — | | | | — | | | 1,078,294 | | | — | | | | — | | | | — | | | | — | | | | — | | | | 1,078,294 | |
Net loss | | — | | | | — | | | — | | | — | | | | — | | | | — | | | | (3,129,731 | ) | | | | | | | (3,129,731 | ) |
| | | | | | | | | | | | | | | | | | | | | | | | | | | | | | | | | |
Balance at March 31, 2006 | | 4,658,312 | | | $ | 466 | | $ | 3,209,141 | | | 4,480 | | | $ | (1,000 | ) | | $ | (279,139 | ) | | $ | (20,843,689 | ) | | $ | — | | | $ | (17,914,221 | ) |
Issuance of common stock for warrant and options exercises and bonuses | | 100,929 | | | | 10 | | | 276,536 | | | — | | | | — | | | | — | | | | — | | | | — | | | | 276,546 | |
Vesting of restricted stock | | 1,554,020 | | | | 155 | | | 497,293 | | | — | | | | — | | | | — | | | | — | | | | — | | | | 497,448 | |
Subscription receivable | | — | | | | — | | | — | | | — | | | | — | | | | 279,139 | | | | — | | | | — | | | | 279,139 | |
Initial public offering, net of offering costs | | 5,248,200 | | | | 525 | | | 48,022,793 | | | — | | | | — | | | | — | | | | — | | | | — | | | | 48,023,318 | |
Conversion of preferred stock | | 1,758,599 | | | | 175 | | | 11,008,728 | | | — | | | | — | | | | — | | | | — | | | | — | | | | 11,008,903 | |
Accretion of preferred stock to redemption value | | — | | | | — | | | — | | | — | | | | — | | | | — | | | | (470,796 | ) | | | | | | | (470,796 | ) |
Retirement of treasury stock | | (4,480 | ) | | | — | | | (1,000 | ) | | (4,480 | ) | | | 1,000 | | | | — | | | | — | | | | — | | | | — | |
Stock-based compensation expense | | | | | | | | | 4,365,311 | | | | | | | | | | | | | | | | | | | | | | | 4,365,311 | |
Comprehensive loss: | | | | | | | | | | | | | | | | | | | | | | | | | | | | | | | | | |
Cumulative translation adjustment | | — | | | | — | | | — | | | — | | | | — | | | | — | | | | — | | | | (666 | ) | | | (666 | ) |
Net loss | | — | | | | — | | | — | | | — | | | | — | | | | — | | | | (8,081,826 | ) | | | — | | | | (8,081,826 | ) |
| | | | | | | | | | | | | | | | | | | | | | | | | | | | | | | | | |
Comprehensive loss | | | | | | | | | | | | | | | | | | | | | | | | | | | | | | | | (8,082,492 | ) |
| | | | | | | | | | | | | | | | | | | | | | | | | | | | | | | | | |
Balance at March 31, 2007 | | 13,315,580 | | | $ | 1,331 | | $ | 67,378,802 | | | — | | | $ | — | | | $ | — | | | $ | (29,396,311 | ) | | $ | (666 | ) | | $ | 37,983,156 | |
| | | | | | | | | | | | | | | | | | | | | | | | | | | | | | | | | |
The accompanying notes are an integral part of the consolidated financial statements.
F-5
SALARY.COM, INC.
CONSOLIDATED STATEMENTS OF CASH FLOWS
| | | | | | | | | | | | |
| | | Years ended March 31, | |
| | | 2007 | | | 2006 | | | 2005 | |
Cash flows from operating activities: | | | | | | | | | | | | |
Net loss | | $ | (8,081,826 | ) | | $ | (3,129,731 | ) | | $ | (2,289,920 | ) |
Adjustments to reconcile net loss to net cash provided by operating activities: | | | | | | | | | | | | |
Depreciation and amortization of property, equipment and software | | | 841,678 | | | | 495,571 | | | | 330,921 | |
Amortization of intangible assets | | | 133,144 | | | | — | | | | — | |
Noncash interest expense | | | — | | | | — | | | | 127,400 | |
Stock-based compensation | | | 4,365,311 | | | | 1,078,294 | | | | 512,490 | |
Bonus paid in common stock | | | 250,000 | | | | — | | | | — | |
Provision (credit) for doubtful accounts | | | 13,397 | | | | (123,185 | ) | | | 104,754 | |
Changes in operating assets and liabilities, net of acquisition: | | | | | | | | | | | | |
(Increase) decrease in: | | | | | | | | | | | | |
Accounts receivable | | | (477,386 | ) | | | (1,293,899 | ) | | | (558,500 | ) |
Prepaid expenses and other current assets | | | (739,283 | ) | | | (111,818 | ) | | | (40,383 | ) |
Deferred customer acquisition costs | | | (396,114 | ) | | | (105,117 | ) | | | (104,131 | ) |
Security deposits | | | 72,825 | | | | (293,813 | ) | | | (120,720 | ) |
Other assets | | | — | | | | 76,799 | | | | 14,009 | |
Increase (decrease) in: | | | | | | | | | | | | |
Accounts payable | | | 317,720 | | | | 79,491 | | | | 64,436 | |
Accrued expense and other current liabilities | | | 1,048,302 | | | | 959,053 | | | | 606,472 | |
Other long-term liabilities | | | — | | | | (5,581 | ) | | | (228,795 | ) |
Deferred revenue | | | 5,719,570 | | | | 4,164,524 | | | | 2,520,678 | |
| | | | | | | | | | | | |
Net cash provided by operating activities | | | 3,067,338 | | | | 1,790,588 | | | | 938,711 | |
| | | | | | | | | | | | |
Cash flows from investing activities: | | | | | | | | | | | | |
Cash paid for acquisition of business | | | (660,000 | ) | | | — | | | | — | |
Cash paid for acquisition of data | | | (1,500,000 | ) | | | — | | | | — | |
Cash paid for patents | | | (42,776 | ) | | | — | | | | — | |
Purchases of property and equipment | | | (1,301,342 | ) | | | (655,126 | ) | | | (581,922 | ) |
Capitalization of software development costs | | | (268,900 | ) | | | (167,998 | ) | | | (100,941 | ) |
| | | | | | | | | | | | |
Net cash used in investing activities | | | (3,773,018 | ) | | | (823,124 | ) | | | (682,863 | ) |
| | | | | | | | | | | | |
Cash flows from financing activities: | | | | | | | | | | | | |
Proceeds from initial public offering, net of stock issuance costs | | | 48,023,318 | | | | — | | | | — | |
Proceeds from revolving line of credit, related party | | | — | | | | 100,000 | | | | — | |
Repayments of revolving line of credit, related party | | | (800,000 | ) | | | (400,000 | ) | | | (930,935 | ) |
Proceeds from issuance of Series A-4 preferred stock | | | — | | | | 125,000 | | | | — | |
Proceeds from Series A-4 preferred stock subscription receivable | | | — | | | | — | | | | 275,000 | |
Proceeds from exercise of common stock options and warrants | | | 26,551 | | | | 173,055 | | | | 119,830 | |
Repurchase of unvested exercised stock options | | | (35,835 | ) | | | — | | | | — | |
Repurchase of common stock | | | — | | | | (1,000 | ) | | | — | |
Proceeds from subscription payable | | | 415,847 | | | | 811,069 | | | | — | |
Payments for subscription receivable | | | — | | | | (279,139 | ) | | | — | |
Proceeds from subscription receivable | | | 279,139 | | | | — | | | | — | |
Repurchase of Series A-4 preferred stock | | | — | | | | (75,000 | ) | | | — | |
Repayments of subordinated notes payable to stockholders | | | — | | | | — | | | | (750,000 | ) |
Proceeds from revolving line of credit and term loan | | | 7,400,000 | | | | — | | | | — | |
Repayments of borrowings under line of credit and term loan | | | (7,400,000 | ) | | | — | | | | — | |
| | | | | | | | | | | | |
Net cash provided by (used in) financing activities | | | 47,909,020 | | | | 453,985 | | | | (1,286,105 | ) |
| | | | | | | | | | | | |
Effect of exchange rate changes on cash and cash equivalents | | | (666 | ) | | | — | | | | — | |
| | | | | | | | | | | | |
Net increase (decrease) in cash and cash equivalents | | | 47,202,674 | | | | 1,421,449 | | | | (1,030,257 | ) |
Cash and cash equivalents, beginning of year | | | 1,813,715 | | | | 392,266 | | | | 1,422,523 | |
| | | | | | | | | | | | |
Cash and cash equivalents, end of year | | $ | 49,016,389 | | | $ | 1,813,715 | | | $ | 392,266 | |
| | | | | | | | | | | | |
Supplemental disclosure of cash flow information: | | | | | | | | | | | | |
Cash paid for interest | | $ | 118,959 | | | $ | 159,462 | | | $ | 164,130 | |
| | | | | | | | | | | | |
Supplemental disclosure of noncash investing activities: | | | | | | | | | | | | |
Liabilities assumed on acquisition of business | | $ | 120,000 | | | $ | — | | | $ | — | |
| | | | | | | | | | | | |
Supplemental disclosure of noncash financing activities: | | | | | | | | | | | | |
Accretion and dividends on redeemable preferred stock | | $ | 470,796 | | | $ | 515,586 | | | $ | 512,997 | |
| | | | | | | | | | | | |
Conversion of convertible preferred stock to common stock | | $ | 11,008,899 | | | $ | — | | | $ | — | |
| | | | | | | | | | | | |
The accompanying notes are an integral part of the consolidated financial statements.
F-6
SALARY.COM, INC.
NOTES TO THE CONSOLIDATED FINANCIAL STATEMENTS
Salary.com (the “Company”) is a leading provider of on-demand compensation management solutions. The Company’s comprehensive on-demand software applications are integrated with its proprietary data sets to automate the essential elements of its customers’ compensation management processes. As a result, the Company’s solutions can significantly improve the effectiveness of its customers’ compensation spending. The Company enables employers of all sizes to replace or supplement inefficient and expensive traditional approaches to compensation management, including paper-based surveys, consultants, internally developed software applications and spreadsheets. The Company was incorporated in Delaware in 1999 and its principal operations are located in Waltham, Massachusetts. Since December of 2006, the Company has operated a facility in Shanghai, China, primarily for research and development activities. The Company conducts its business primarily in the United States.
| 2. | SUMMARY OF SIGNIFICANT ACCOUNTING POLICIES |
Principles of Consolidation
The consolidated financial statements include the accounts of the Company and its wholly owned subsidiaries, SDC China, Ltd., established December 18, 2006, and Salary.com Securities Corporation, established March 26, 2007. All significant intercompany transactions and balances have been eliminated.
For the non-U.S. subsidiary, which operates in a local currency environment, assets and liabilities are translated at period-end exchange rates, and income statement items are translated at the average exchange rates for the period. The local currency for all foreign subsidiaries is considered to be the functional currency and, accordingly, translation adjustments are reported as a separate component of stockholders’ equity under the caption “accumulated other comprehensive loss.”
Cash and Cash Equivalents
The Company considers all highly liquid investments purchased with an original maturity of three months or less to be cash equivalents. The Company invests its excess cash in money market accounts and overnight repurchase agreements. These investments are subject to minimal credit and market risks. At March 31, 2007 and 2006, the Company has classified as cash equivalents, investments totaling approximately $48,018,000 and $0, respectively. The carrying amount of these investments approximates fair market value.
Accounts Receivable
Accounts receivable are stated at the amount management expects to collect from outstanding balances. Management reviews accounts receivable on a periodic basis to determine if any receivables will potentially be uncollectible. Estimates are used to determine the amount of the allowance for doubtful accounts necessary to reduce accounts receivable to its estimated net realizable value. These estimates are made by analyzing the status of significant past due receivables and by establishing general provisions for estimated losses by analyzing current and historical bad debt trends. Actual collection experience has not varied significantly from estimates, due primarily to credit and collection policies and the financial strength of the Company’s customers. Receivables that are ultimately deemed uncollectible are charged off as a reduction of receivables and the allowance for doubtful accounts. Accounts receivable balances are not collateralized.
F-7
SALARY.COM, INC.
NOTES TO THE CONSOLIDATED FINANCIAL STATEMENTS—(Continued)
Concentration of Credit Risk
Financial instruments that potentially subject the Company to significant concentration of credit risk consist primarily of cash and cash equivalents and accounts receivable. The company may invest in high-quality money market instruments, securities of the U.S. government and high quality corporate issues. At March 31, 2007 and 2006, the Company had cash balances at certain financial institutions in excess of federally insured limits. However, the Company does not believe that it is subject to unusual credit risk beyond the normal credit risk associated with commercial banking relationships.
Accounts receivable are typically uncollateralized and are derived from revenues earned from customers primarily located in the United States
Security Deposits
Security deposits consist of certificates of deposit totaling approximately $342,000 and $415,000 as of March 31, 2007 and 2006, respectively. The security deposits are held in the Company’s name with a major financial institution to collateralize the Company’s office leases.
Property and Equipment
Property and equipment are carried at cost and are depreciated over the estimated useful life, generally three years, using the straight-line method. The Company’s policy is to generally capitalize any item with an acquisition cost of $1,000 or more. Depreciation of leasehold improvements is recorded over the shorter of the estimated useful life of the leasehold improvement or the remaining lease term. Expenditures for maintenance and repairs are charged to operations when incurred, while additions and betterments are capitalized. When assets are retired or disposed, the asset’s original cost and related accumulated depreciation are eliminated from the accounts and any gain or loss is reflected in the statement of operations.
Deferred Customer Acquisition Costs
Deferred customer acquisition costs are the direct incremental costs associated with establishing noncancelable subscription contracts with customers and consist of sales commissions paid to the Company’s sales force. The commissions are deferred and amortized over the related contract period of generally one year. Amortization of deferred commissions is included in sales and marketing expense in the accompanying consolidated statements of operations.
Goodwill and Intangible Assets
The Company accounts for goodwill and other intangible assets in accordance with Statement of Financial Accounting Standards No. 142,Goodwill and Other Intangible Assets (“SFAS 142”). Under SFAS No. 142, goodwill and certain other intangible assets with indefinite lives are no longer amortized, but instead are reviewed for impairment annually or more frequently if impairment indicators arise. The Company reviews the carrying value of its goodwill by comparing the carrying value of the related business component to its estimated fair value. The fair value is based on management’s estimate of the future discounted cash flows to be generated by the respective business component. Changes in the underlying business could affect these estimates, which in turn could affect the recoverability of goodwill. If goodwill becomes impaired, some or all of the goodwill could be written off as a charge to operations. During the fourth quarter of fiscal year ended March 31, 2007, the Company performed its annual impairment test in accordance with SFAS 142 and determined that the carrying value of its goodwill was not impaired. Intangible assets subject to amortization are amortized on a straight-line basis over their estimated useful lives or contract periods, as applicable.
F-8
SALARY.COM, INC.
NOTES TO THE CONSOLIDATED FINANCIAL STATEMENTS—(Continued)
Software Development Costs
The Company capitalizes certain internal software development costs under the provisions of Statement of Position No. 98-1,Accounting for the Costs of Computer Software Developed or Obtained for Internal Use (“SOP 98-1”). SOP 98-1 requires computer software costs associated with internal use software to be charged to operations as incurred until certain capitalization criteria are met.
The Company incurs software development costs related to its applications developed for subscription services and for management information systems. Costs are incurred in three stages of development: the preliminary project stage, the application development stage, and the post-implementation stage. Costs incurred during the preliminary project stage and the post-implementation stage are expensed as incurred. Certain qualifying costs incurred during the application development stage are capitalized as property, equipment and software. These costs generally consist of internal labor during configuration, coding, and testing activities. Capitalization begins when the preliminary project stage is complete, management with the relevant authority authorizes and commits to the funding of the software project, it is probable that the project will be completed, the software will be used to perform the function intended and technical feasibility has been determined. These costs are amortized using the straight-line method over the estimated useful life of the software, which is generally three years. All other development costs are expensed as incurred.
Impairment of Long-Lived Assets
Long-lived assets to be held and used are reviewed for impairment whenever events or changes in circumstances indicate that the carrying amount may not be recoverable. When required, impairment losses on assets to be held and used are recognized based on the excess of the asset’s carrying amount over the fair value of the asset, while long-lived assets to be disposed of are reported at the lower of carrying amount or fair value less cost to sell.
Revenue
The Company derives its revenues from subscription fees and, to a lesser extent, through advertising on its website and syndication fees. Subscription revenues are comprised primarily of subscription fees from enterprise and small business customers who pay a bundled fee for the Company’s on-demand software applications and data products and implementation services related to the Company’s subscription products, as well as syndication fees from the Company’s website partners and premium membership subscriptions sold primarily to individuals. To a lesser extent, subscription revenues also include fees for discrete professional services which are not bundled with the Company’s subscription products and revenue from the sale of the Company’s Compensation Market Study and Salary.com Survey products, which are not sold on a subscription basis. These discrete professional services generally represent stand-alone compensation related to consulting and benchmarking of specific jobs. Because the Company provides its application as a service, the Company follows the provisions of SEC Staff Accounting Bulletin (“SAB”) No. 101 “Revenue Recognition in the Financial Statements”, as amended by No. 104, Revenue Recognition. Revenue is recognized ratably over the contractual period and amounts are earned when all of the following conditions are satisfied: (1) there is persuasive evidence of an arrangement; (2) the service has been provided to the customer; (3) the amount of fees to be paid by the customer is fixed or determinable; and (4) the collection of fees from the customer is probable.
Subscription revenue is recognized ratably over the contract period. Customers are generally billed for the subscription on an annual basis. For all customers, regardless of their billing method, subscription revenue is
F-9
SALARY.COM, INC.
NOTES TO THE CONSOLIDATED FINANCIAL STATEMENTS—(Continued)
initially recorded as deferred revenue in the accompanying balance sheets. As services are performed, the Company recognizes subscription revenue over the applicable service period. For selected products where an implementation process occurs prior to the on-demand applications becoming useful to customers, revenue recognition is deferred until after the product has been implemented and then recognized as revenue ratably over the remaining applicable subscription period.
Subscription agreements that are related to the Company’s TalentManager suite of products may contain multiple service elements and deliverables. These elements include access to the Company’s on-demand software and often specify initial services including configuration and training. Except where the Company becomes the subject of a bankruptcy proceeding which is not dismissed within 60 days of filing or the Company makes an assignment for the benefit of its creditors, these particular subscription agreements do not provide customers the right to take possession of the software at any time. In May 2003, the Financial Accounting Standards Board issued Emerging Issues Task Force Issue No. 00-21,Revenue Arrangements with Multiple Deliverables (EITF 00-21). EITF 00-21 was issued to address how companies should determine whether an arrangement involving multiple deliverables contains more than one unit of accounting. In applying the guidance in EITF 00-21, the Company determined that it does not have objective and reliable evidence for the fair value of the TalentManager subscription fees after delivery of specified initial services, consisting of configuration and training. The Company cannot establish the fair value of the TalentManager subscription element of the contract due to the variability of the sales price between different customers for the subscription element of the contract. Furthermore, the initial services do not have stand-alone value to the customer without being bundled with the subscription element of the contract because the Company does not sell the initial services separately and because such services are not provided by a third party. The Company therefore accounts for these subscriptions arrangements and its related service fees as a single unit of accounting.
Discrete professional services represent a separate earnings process and revenue is recognized as services are performed. Professional services engagements are generally priced on a fixed-fee basis. Revenue under fixed-fee arrangements is recognized proportionally to the performance of the services utilizing milestones if present in the arrangement, or at the completion of the project.
Revenues for the Company’s Compensation Market Study and Survey products, which are not sold on a subscription basis, are recognized only when persuasive evidence of an arrangement exists, delivery of the study or survey has occurred, risk of ownership has passed to the customer, the price is fixed and determinable, and collection is reasonably assured.
Advertising revenues are comprised of revenues that the Company generates through agreements to display third party advertising on the Company’s website for a fixed period of time or fixed number of impressions. Advertising revenues are recognized as the advertising is displayed on the website.
Deferred Revenue
Deferred revenue primarily consists of billings to customers in advance of revenue recognition from the Company’s subscription service described above and is recognized as the revenue recognition criteria are met. Deferred revenue to be recognized in the succeeding 12-month period is included in current deferred revenue with the remaining amounts included in non-current deferred revenue.
F-10
SALARY.COM, INC.
NOTES TO THE CONSOLIDATED FINANCIAL STATEMENTS—(Continued)
Cost of Revenues
Cost of revenues consists primarily of costs for data development and data acquisition, fees paid to the Company’s network provider for the hosting and managing of its servers, related bandwidth costs, compensation and related personnel costs for the support and implementation of the Company’s products and amortization of capitalized software costs.
Redeemable Stock
The Company accounts for stock subject to provisions for redemption outside of its control as mezzanine equity. These securities are recorded at fair value at the date of issue and are accreted to the redemption amount at each balance sheet date. The resulting increases in the carrying amount of the redeemable stock are reflected through decreases in additional paid-in capital or, in the absence of additional paid-in capital, through accumulated deficit. The Company’s redeemable convertible preferred stock was converted to common stock immediately prior to the closing of the Company’s initial public offering in February 2007.
Fair Value of Financial Instruments
The carrying value of the Company’s financial instruments, including cash, accounts receivable, accounts payable and accrued liabilities approximate their fair value because of their short-term nature.
Comprehensive Income (Loss)
SFAS No. 130, “Reporting Comprehensive Income,” requires that changes in comprehensive income (loss) be shown in a financial statement that is displayed with the same prominence as other financial statements. The Company has presented other comprehensive income (loss) in the Consolidated Statements of Stockholders’ Equity (Deficit). Other comprehensive loss consists of the cumulative translation adjustment.
Advertising Expenses
The Company expenses advertising as incurred. Advertising expense for the years ended March 31, 2007, 2006 and 2005 was approximately $68,000, $85,000 and $10,000, respectively.
Segment Data
The Company manages its operations on a consolidated, single segment basis for purposes of assessing performance and making operating decisions. Accordingly, the Company does not have reportable segments of its business.
Income Taxes
The Company recognizes deferred tax liabilities and assets for the expected future tax consequences of events that have been included in the financial statements or tax returns. Under this method, deferred tax liabilities and assets are determined based upon the temporary differences between the financial reporting and tax bases of liabilities and assets, using enacted tax rates in effect in the years in which the differences are expected to reverse. Realization of the Company’s net deferred tax assets is contingent upon generation of future taxable income. Due to the uncertainty of realization of the tax benefits, the Company has provided a valuation allowance for the full amount of its net deferred tax assets.
F-11
SALARY.COM, INC.
NOTES TO THE CONSOLIDATED FINANCIAL STATEMENTS—(Continued)
Other Taxes
Non-income taxes such as sales tax are presented on a net basis.
Net Loss Attributable to Common Stockholders per Share
Net loss attributable to common stockholders per share is presented in accordance with SFAS No. 128, “Earnings per Share,” which requires the presentation of “basic” earnings (loss) per share and “diluted” earnings (loss) per share. Basic net loss attributable to common stockholders per share is computed by dividing net loss attributable to common stockholders by the weighted average number of common shares outstanding for the period. Diluted net loss attributable to common stockholders per share includes the potential dilution that could occur if securities or other contracts to issue common stock were exercised or converted into common stock.
The following summarizes the potential outstanding common stock of the Company as of the end of each period:
| | | | | | |
| | | March 31, |
| | | 2007 | | 2006 | | 2005 |
Options to purchase common stock | | 1,941,103 | | 640,341 | | 2,331,092 |
Warrants to purchase common or preferred stock | | 147,868 | | 108,666 | | 194,770 |
Shares of common stock into which outstanding preferred stock is convertible | | — | | 1,758,599 | | 1,736,199 |
Restricted shares (1) | | 1,991,585 | | 3,630,488 | | — |
| | | | | | |
Total options, warrants, restricted shares and preferred stock exercisable or convertible into common stock | | 4,080,556 | | 6,138,094 | | 4,262,061 |
| | | | | | |
| (1) | Represents stock options that have been exercised, but unvested as of the reporting date. |
If the outstanding options, warrants and preferred stock were exercised or converted into common stock, the result would be anti-dilutive. Therefore, basic and diluted net loss attributable to common stockholders per share is the same for all periods presented in the accompanying consolidated statements of operations.
Accounting for Stock-Based Compensation
Prior to April 1, 2005, stock options issued to employees under the Company’s stock option plan were accounted for using the intrinsic value method in accordance with Accounting Principles Board Opinion No. 25,Accounting for Stock Issued to Employees (“APB 25”) and related interpretations. The Company has applied the disclosure only provisions of SFAS No. 123,Accounting for Stock-Based Compensation (“SFAS 123”). All stock-based awards to nonemployees are accounted for at their fair value in accordance with SFAS 123 and EITF 96-18,Accounting for Equity Instruments that Are Issued to Other than Employees for Acquiring, or in Conjunction with Selling, Goods or Services (“EITF 96-18”).
F-12
SALARY.COM, INC.
NOTES TO THE CONSOLIDATED FINANCIAL STATEMENTS—(Continued)
In accordance with SFAS 123, the fair value of each stock option grant has been estimated on the date of the grant using the minimum value method of the Black-Scholes option pricing model. The following table summarizes the weighted average assumptions used in calculating pro forma stock-based compensation expense:
| | | |
| | | March 31,
2005 | |
Risk-free rate | | 3.49 – 3.89 | % |
Expected life | | 5 years | |
Expected volatility | | 0 | % |
Expected dividend yield | | 0 | % |
Had the fair value method prescribed in SFAS 123 been applied to the Company’s outstanding stock options in the financial statements, the net loss for the year ended March 31, 2005 would have been:
| | | | |
| | | March 31,
2005 | |
Reported net loss attributable to common stockholders | | $ | (2,802,917 | ) |
Add: stock-based compensation expense included in the determination of reported net loss | | | 512,490 | |
Deduct: total stock-based compensation expense determined under the fair value based methods for all awards | | | (151,098 | ) |
| | | | |
Pro forma loss attributable to common stockholders | | $ | (2,441,525 | ) |
| | | | |
Pro forma loss per share attributable to common stockholders | | $ | (0.70 | ) |
| | | | |
On April 1, 2005, the Company elected to adopt the provisions of SFAS No. 123(R),Share-Based Payments (“SFAS 123R”) and has applied the prospective method application which requires stock-based compensation to be recognized on awards granted after April 1, 2005. Additionally, the Company followed the provisions of the SEC Staff Accounting Bulletin No. 107Share-Based Payment (“SAB 107”) in its adoption of SFAS 123R. SAB 107 provides the SEC staff’s interpretation of SFAS 123R and provides further guidance on the valuation of share-based payments. The Company has also elected to adopt the alternative method of calculating the historical pool of tax benefits as permitted by FASB Staff Position No. SFAS 123R-3,Transition Election Related to Accounting for the Tax Effects of Share-Based Payment Awards. Under the prospective method, the Company will continue to account for stock-based compensation awards granted before April 1, 2005 using the intrinsic value method as prescribed by APB 25. Stock-based compensation expense for all stock-based compensation awards granted after April 1, 2005 is based on the grant date fair value, estimated in accordance with the provisions of SFAS 123R. The Company recognizes compensation expense for stock-based compensation awards on a straight-line basis over the requisite service period of the award. All stock-based awards to non-employees granted after April 1, 2005 will be accounted for at their fair value, in accordance with SFAS 123R and EITF 96-18.
SFAS 123R requires companies to estimate the fair value of share-based payment awards on the date of grant using an option-pricing model. The fair value of each grant was estimated using the Black-Scholes valuation model. The risk free rate was determined by reference to the U.S. Treasury yield curve in effect at or near the time of grant for the expected term of the award. The expected life was determined based upon review of the period that the Company’s share-based awards are expected to be outstanding and is estimated based on historical experience of similar awards, giving consideration to the contractual term of the awards, vesting schedules, employee turnover and expectations of employee exercise behavior. The expected volatility is based upon an average of the historical volatilities of similar entities’ common stock. The expected dividend yield
F-13
SALARY.COM, INC.
NOTES TO THE CONSOLIDATED FINANCIAL STATEMENTS—(Continued)
assumption is based on the Company’s history and expectation of dividend payouts. The estimated forfeiture rate was based upon an analysis of the Company’s historical data.
Use of Estimates
The preparation of financial statements in conformity with accounting principles generally accepted in the United States of America requires management to make estimates and assumptions that affect the reported amount of assets and liabilities and disclosure of contingent liabilities at the date of the financial statements and the reported amounts of revenues and expenses during the reporting period. Actual results could differ from those estimates.
Recent Accounting Pronouncements
In February 2007, the FASB issued SFAS 159,The Fair Value Option for Financial Assets and Financial Liabilities—Including an amendment of FASB Statement No. 115(“SFAS 159”), which permits entities to choose to measure many financial instruments and certain other items at fair value. The provisions of SFAS 159 are effective for fiscal years beginning after November 15, 2007. The Company has not yet determined the impact of adopting SFAS 159 on its financial statements.
In September 2006, the FASB issued SFAS 157,Fair Value Measurements (“SFAS 157”), which defines fair value, establishes a framework for measuring fair value, and expands disclosures about fair value measurements. The provisions of SFAS 157 are effective for fiscal years beginning after November 15, 2007. The Company has not yet determined the impact of adopting SFAS 157 on its financial statements.
In July 2006, the FASB issued Interpretation No. 48,Accounting for Uncertainty in Income Taxes —an interpretation of FASB Statement No. 109 (“FIN 48”), which clarifies the accounting for uncertainty in tax positions. This Interpretation requires that the Company recognize in its financial statements the impact of a tax position, if that position is more likely than not of being sustained on audit, based on the technical merits of the position. FIN 48 will be effective for fiscal years beginning after December 15, 2006. The Company is currently evaluating what impact, if any, the adoption of FIN 48 will have on its financial position and results of operations.
| 3. | ACQUISITION OF BUSINESS |
On April 3, 2006, the Company acquired certain assets of the eComp Data Services Division (“eComp”) from Aon Consulting, Inc., a global human capital consulting firm located in New York City. eComp Data Services is a leading provider of executive compensation data. The assets acquired included the eComp database and certain software and proprietary assets, including all intellectual property rights. Pursuant to the terms of the agreement, the Company paid $585,000 with $292,500 due at the closing date of April 3, 2006, and the remaining balance was paid in September 2006. Included in the acquisition was $75,000 which was paid by the Company to a former principal of eComp for a non-compete agreement. Accordingly, the purchase price was allocated based upon the fair value of assets acquired and liabilities assumed. The Company allocated $266,000 of the purchase price to goodwill based upon the estimated fair value of the assets acquired in the acquisition. The results of operations for the fiscal year ended March 31, 2007 include the impact of this acquisition since April 3, 2006.
F-14
SALARY.COM, INC.
NOTES TO THE CONSOLIDATED FINANCIAL STATEMENTS—(Continued)
The Company has allocated the purchase price based upon the estimated fair value of the net assets acquired, as follows:
| | | | |
| | | Amount | |
Non-compete (amortization period 5 years) | | $ | 365,000 | |
Customer relationships (amortization period 5 years) | | | 120,000 | |
Hosting and servicing (amortization period 2 months) | | | 29,000 | |
Assumed liabilities | | | (120,000 | ) |
Goodwill | | | 266,000 | |
| | | | |
Total purchase price | | $ | 660,000 | |
| | | | |
| 4. | PROPERTY, EQUIPMENT AND SOFTWARE |
Property, equipment and software at March 31, 2007 and 2006 consisted of the following:
| | | | | | |
| | | 2007 | | 2006 |
Computer equipment and software | | $ | 2,596,855 | | $ | 1,619,890 |
Office equipment | | | 249,902 | | | 194,718 |
Furniture and fixtures | | | 280,100 | | | 255,950 |
Capitalized software development costs | | | 792,814 | | | 523,914 |
Leasehold Improvements | | | 319,638 | | | 74,594 |
| | | | | | |
| | | 4,239,309 | | | 2,669,066 |
Less: accumulated depreciation | | | 2,302,059 | | | 1,460,380 |
| | | | | | |
Property and equipment, net | | $ | 1,937,250 | | $ | 1,208,686 |
| | | | | | |
Depreciation expense for the years ended March 31, 2007, 2006 and 2005 was approximately $716,000, $430,000 and $270,000, respectively.
During the years ended March 31, 2007 and 2006, the Company capitalized approximately $269,000 and $168,000, respectively, of costs of computer software developed or obtained for internal use. These costs are being amortized to cost of revenues on a straight-line basis over their estimated useful life of three years. Amortization expense related to capitalized software development costs amounted to approximately $126,000, $66,000 and $61,000 during the years ended March 31, 2007, 2006 and 2005, respectively.
Intangible assets as of March 31, 2007, consist of the following:
| | | | | | | | | | | |
| | | Cost | | Accumulated
Amortization | | Carrying
Amount | | Useful Life |
Non-compete agreements | | $ | 365,000 | | $ | 72,998 | | $ | 292,002 | | 5 years |
Customer relationships | | | 120,000 | | | 24,000 | | | 96,000 | | 5 years |
Patents | | | 42,776 | | | 7,146 | | | 35,630 | | 16 – 18 years |
Data acquisition costs | | | 1,500,000 | | | — | | | 1,500,000 | | 1 – 3 years |
| | | | | | | | | | | |
| | $ | 2,027,776 | | $ | 104,144 | | $ | 1,923,632 | | |
| | | | | | | | | | | |
F-15
SALARY.COM, INC.
NOTES TO THE CONSOLIDATED FINANCIAL STATEMENTS—(Continued)
On December 30, 2006, the Company entered into an agreement with a vendor to obtain additional data sets that runs for an initial one year term following the date of the initial delivery. The fee for the initial term is $1.5 million. At the end of the initial term, the agreement shall automatically renew for up to six subsequent one year terms unless terminated by the Company. The annual fees due to the vendor related to years two through seven of the agreement are $0.5 million, $0.6 million, $0.6 million, $0.7 million, $0.8 million, and $0.9 million, respectively. The fees for years two through seven will be recorded as intangible assets as the data is delivered and payments are made in accordance with the agreement.
All of the Company’s finite-lived acquired intangible assets are subject to amortization over their estimated useful lives. No residual value is estimated for these intangible assets. Acquired intangible asset amortization for the fiscal year ended March 31, 2007 was approximately $133,000. Amortization for the data acquisition costs will begin once the acquired data is integrated into the related product and that product is available to our customers.
Estimated annual amortization expense for the next five years related to intangible assets is as follows:
| | | |
| | | Year ending March 31, |
2008 | | $ | 624,472 |
2009 | | | 574,472 |
2010 | | | 499,472 |
2011 | | | 199,474 |
2012 | | | 2,472 |
| | | |
| | $ | 1,900,362 |
| | | |
Revolving Line of Credit, Related Party
On April 11, 2003, the Company entered into a $2,171,000 revolving line of credit with an entity owned by a stockholder of the Company (the “2003 Line”). Principal amounts outstanding under the 2003 Line accrued interest at a per annum rate equal to the prime rate plus 4.25% (11.75% at March 31, 2006), payable semi-monthly. The 2003 Line was collateralized by substantially all of the assets of the Company. In addition, the 2003 Line carried a commitment fee equal to 6.00% of the balance available, but not drawn down. On January 1, 2006, the 2003 Line was assigned to a stockholder, and was extended indefinitely. Availability under the 2003 Line totaled $0 and $700,000 as of March 31, 2007 and 2006, respectively. In September 2006, the 2003 Line was repaid in full and was terminated. Interest expense incurred on this line of credit for the years ended March 31, 2007, 2006 and 2005 was approximately $48,000, $159,000 and $164,000, respectively.
Revolving Line of Credit and Term Loan
On August 10, 2006, the Company entered into a $5,000,000 Working Capital Line of Credit with Silicon Valley Bank. Up to $1,000,000 of the line may be used to secure letters of credit and cash management services. In addition, up to $1,000,000 may be borrowed as a 36-month term loan to refinance shareholder debt and general corporate purposes. The Working Capital Line of credit expires two years from the closing date. Borrowings on the term loan bear interest at the bank’s prime rate plus 1.00%, and interest is payable on a monthly basis. Borrowings on the revolving line bear interest at the bank’s prime rate plus 0.25% interest. The line of credit was collateralized by substantially all of the Company’s assets. In addition, the line carries an unused revolving line facility fee of 0.375% of the balance available, but not drawn down. The agreement
F-16
SALARY.COM, INC.
NOTES TO THE CONSOLIDATED FINANCIAL STATEMENTS—(Continued)
contains financial covenants that require the Company to maintain an unrestricted cash balance at the Bank plus the committed availability of at least $750,000 and certain Adjusted Net Income levels across the period of time the line is available. As of March 31, 2007, the Company is in compliance with all debt covenants. Also, as part of the agreement, the Company is required to maintain its primary depository, and operating accounts with Silicon Valley Bank. As of March 31, 2007, there were no outstanding borrowings under either the term loan or the line of credit.
Subordinated Notes Payable to Stockholders
On June 16, 2002 and December 1, 2002, the Company entered into $500,000 and $250,000 Subordinated Notes Payable with certain stockholders, respectively. The notes provided for annual interest at the rate of 12% per annum, payable monthly, and matured three years from the date of their respective issuance.
In conjunction with the subordinated notes, the Company issued the holders warrants to purchase 28,000 shares of common stock at $0.89 per share and 750,000 shares of Series B preferred stock at $1.00 per share. The proceeds from the subordinated notes were allocated to the loans and the warrants based on their relative values, resulting in approximately $283,000 being ascribed to the warrants (see Note 9).
The resulting discount on the subordinated notes was being amortized to interest expense over the life of the Subordinated Notes resulting in approximately $95,000 of additional non-cash interest expense during the year ended March 31, 2004. The subordinated notes were paid in full during fiscal 2005 and the remaining discount was amortized in full, resulting in approximately $127,000 of additional interest expense during the year ended March 31, 2005.
| 7. | COMMITMENTS AND CONTINGENCIES |
The Company has various noncancelable operating leases, primarily related to real estate, that expire through 2009. Total rent expense charged to operations was approximately $1,245,000, $647,000 and $392,000 for the years ended March 31, 2007, 2006 and 2005, respectively.
Future minimum lease payments under noncancelable operating leases at March 31, 2007 are as follows:
| | | |
2008 | | $ | 1,724,000 |
2009 | | | 1,535,000 |
2010 | | | 117,000 |
Thereafter | | | — |
| | | |
Total future minimum lease payments | | $ | 3,376,000 |
| | | |
Employment Agreements
Certain members of the Company’s management have employment agreements that provide for the continuation of salary and benefits, for a period of time, upon ceasing to be an employee as a result of either termination from or a change in ownership of the Company.
F-17
SALARY.COM, INC.
NOTES TO THE CONSOLIDATED FINANCIAL STATEMENTS—(Continued)
Litigation and Claims
On December 29, 2006, the Company commenced a declaratory judgment action in the Superior Court of Suffolk County, Massachusetts against a former independent consultant to the Company. The former consultant was under contract to Salary.com and assisted the Company in completing a strategic partnership in 2000. The contract expired by its terms in November 2000. Pursuant to that contract, the former consultant was entitled to a success fee consisting of a right to purchase 33,600 shares of the Company’s common stock at a price of thirty-six cents per share, which at the time represented approximately three percent of the Company’s capital stock. In November 2006, after the Company commenced its initial public offering, the former consultant informed the Company that he was in possession of a version of a contract that allegedly gave him the right to purchase three percent of the Company’s equity as of an unspecified date at a price of thirty-six cents per share. The basis for this claim appears to be certain hand-written changes to the expired contract that the Company did not make or authorize, and had never seen until the former consultant sent the Company a copy of a contract containing these changes in November 2006. In the court action, the Company is seeking to have the court declare that the consultant is not entitled to anything other than the 33,600 options described in the expired contract. In addition, the Company is seeking damages due to the former consultant’s attempt to defraud the Company and its stockholders by making these hand-written changes subsequent to the contract’s execution and without the Company’s knowledge or consent. The Company also is seeking damages for tortious interference with business relations as well as for unfair and deceptive business acts and practices. At this time, the Company cannot predict the outcome or the amount of gain or loss, if any, from these proceedings.
On February 1, 2007, Mercer filed a Complaint against the Company in the United States District Court for the Southern District of New York. The Complaint alleges copyright infringement, unfair competition, false representation, fraud, breach of contract and tortious interference with business relations. Specifically, the Complaint asserts that the Company’s use of Mercer surveys infringes upon Mercer’s copyrights, that the Company has breached, and induced its customers to breach, license agreements with Mercer, that the Company has attempted to deceive Mercer in connection with the Company’s acquisition of Mercer surveys, and that the Company has misrepresented its rights to use Mercer’s surveys to the Company’s current and potential customers. The Complaint seeks injunctive relief and monetary damages. The Company believes that its purchase and use of all third party surveys (including Mercer’s) complies with copyright law and any applicable license agreements and the Company intends to vigorously defend the claims by Mercer. The Company has filed several counterclaims against Mercer in the New York action, including claims for tortious interference with business relations, breach of contract and misrepresentation. Although Mercer has made similar assertions to the Company in the past, the Company has not received any correspondence from Mercer since 2004 on these issues and the Company has not purchased any Mercer data since that time. This previously acquired data comprises a very small portion of the data used to generate the Company’s proprietary data sets. Those proprietary data sets are not reliant on any one data source and the Company could remove the data it historically purchased from Mercer from such data sets and regenerate them without materially affecting the quality of the data sets. In a separate action, the Company filed a Complaint against Mercer in the United States District Court for the District of Massachusetts on May 15, 2007. That Complaint alleges copyright infringement, unfair competition, breach of contract and antitrust violations by Mercer based on the unlawful spidering of the Company’s proprietary database and the repeated unauthorized use of the Company’s proprietary data sets by Mercer employees.
In addition to the matters noted above, from time to time the Company is subject to legal proceedings and claims in the ordinary course of business. In the opinion of management, the amount of ultimate expense with respect to any other current legal proceedings and claims will not have a material adverse effect on the Company’s financial position or results of operations.
F-18
SALARY.COM, INC.
NOTES TO THE CONSOLIDATED FINANCIAL STATEMENTS—(Continued)
| 8. | REDEEMABLE CONVERTIBLE PREFERRED STOCK |
During fiscal year 2006, the Company issued 500,000 shares of Series A-4 preferred stock at a price of $0.25 per share. The issuance resulted in cash proceeds of $125,000. The Company also repurchased 300,000 shares of Series A-4 preferred stock at a price of $0.25 per share. The repurchase resulted in repayments of $75,000.
The changes in Series A-1, Series A-2, Series A-3, Series A-4 and Series B are as follows:
| | | | | | | | | | | | | | | | | | | | | | | | | | | | | | | | | | | | | | | |
| | | Series A-1 | | | Series A-2 | | | Series A-3 | | | Series A-4 | | | Series A-4
Subscription
Receivable | | | Series B | |
| | | Shares | | | Amount | | | Shares | | | Amount | | | Shares | | | Amount | | | Shares | | | Amount | | | | Shares | | | Amount | |
Balance, March 31, 2004 | | 808,251 | | | $ | 110,220 | | | 1,350,000 | | | $ | 281,813 | | | 3,568,720 | | | $ | 1,489,939 | | | 3,530,500 | | | $ | 895,864 | | | $ | (275,000 | ) | | 5,805,719 | | | $ | 6,681,688 | |
Series A-4 subscription receivable | | — | | | | — | | | — | | | | — | | | — | | | | — | | | — | | | | — | | | | 275,000 | | | — | | | | — | |
Accretion of preferred stock to redemption value | | — | | | | 5,280 | | | — | | | | 13,500 | | | — | | | | 71,374 | | | — | | | | 52,958 | | | | — | | | — | | | | 369,885 | |
| | | | | | | | | | | | | | | | | | | | | | | | | | | | | | | | | | | | | | | |
Balance, March 31, 2005 | | 808,251 | | | | 115,500 | | | 1,350,000 | | | | 295,313 | | | 3,568,720 | | | | 1,561,313 | | | 3,530,500 | | | | 948,822 | | | | — | | | 5,805,719 | | | | 7,051,573 | |
Issuance of Series A-4 redeemable convertible preferred stock | | — | | | | — | | | — | | | | — | | | — | | | | — | | | 500,000 | | | | 125,000 | | | | — | | | — | | | | — | |
Repurchase of Series A-4 redeemable convertible preferred stock | | — | | | | — | | | — | | | | — | | | — | | | | — | | | (300,000 | ) | | | (75,000 | ) | | | — | | | — | | | | — | |
Accretion of preferred stock to redemption value | | — | | | | 5,280 | | | — | | | | 13,500 | | | — | | | | 71,374 | | | — | | | | 55,547 | | | | — | | | — | | | | 369,885 | |
| | | | | | | | | | | | | | | | | | | | | | | | | | | | | | | | | | | | | | | |
Balance, March 31, 2006 | | 808,251 | | | | 120,780 | | | 1,350,000 | | | | 308,813 | | | 3,568,720 | | | | 1,632,687 | | | 3,730,500 | | | | 1,054,369 | | | | — | | | 5,805,719 | | | | 7,421,458 | |
Accretion of preferred stock to redemption value | | — | | | | 4,615 | | | — | | | | 11,799 | | | — | | | | 62,378 | | | — | | | | 48,905 | | | | — | | | — | | | | 343,099 | |
Mandatory conversion to common stock | | (808,251 | ) | | | (125,395 | ) | | (1,350,000 | ) | | | (320,612 | ) | | (3,568,720 | ) | | | (1,695,065 | ) | | (3,730,500 | ) | | | (1,103,274 | ) | | | — | | | (5,805,719 | ) | | | (7,764,557 | ) |
| | | | | | | | | | | | | | | | | | | | | | | | | | | | | | | | | | | | | | | |
Balance, March 31, 2007 | | — | | | $ | — | | | — | | | $ | — | | | — | | | $ | — | | | — | | | $ | — | | | $ | — | | | — | | | $ | — | |
| | | | | | | | | | | | | | | | | | | | | | | | | | | | | | | | | | | | | | | |
Voting
The holders of each series of the preferred stock have voting rights equivalent to the number of shares of common stock into which their shares are convertible.
Dividends
The holders of Series A-1, Series A-2, Series A-3, Series A-4, and Series B preferred stock are entitled to receive 6% cumulative dividends. No dividend may be declared or paid on common stock until such time as all dividends have been paid on the preferred stock. As of March 31, 2005, accrued but unpaid dividends on the Series A-1, Series A-2, Series A-3, Series A-4, and Series B preferred stock were approximately $28,000, $70,000, $372,000, $66,000 and $1,306,000, respectively. As of March 31, 2006, accrued and unpaid dividends on the Series A-1, Series A-2, Series A-3, Series A-4, and Series B were approximately $33,000, $84,000, $443,000, $122,000 and $1,654,000, respectively.
Liquidation
In the event of liquidation, dissolution or winding up of the Company, distributions shall be made to the holders of the preferred stock, prior and in preference to any distribution of assets, a per share amount equal to $0.10877 for Series A-1, $0.166667 for Series A-2, $0.333333 for Series A-3, $0.25 for Series A-4 and $1.00 for Series B plus the amount of cumulative unpaid dividends. The liquidation amount is subject to adjustment to reflect stock dividends, stock splits, and recapitalizations.
F-19
SALARY.COM, INC.
NOTES TO THE CONSOLIDATED FINANCIAL STATEMENTS—(Continued)
After payment to the preferred stockholders, the preferred stock and common stock share ratably in the remaining assets of the Company. If the assets of the Company legally available for distribution shall be insufficient to permit the payment in full to holders of the Preferred Stock, then the entire assets of the Company legally available for distribution shall be distributed ratably among the holders of the preferred stock in accordance with the aggregate liquidation preference of each class of preferred stock.
Redemption
Unless as otherwise requested by the holders of the preferred stock and subject to certain other conditions, the Company shall redeem the preferred stock outstanding on January 15, 2008 (the “Redemption Date”) for $0.108877, $0.166667, $0.333333, $0.25 and $1.00 per share for Series A-1, A-2, A-3, A-4, and B preferred stock, respectively, plus accrued dividends. In the event that any holder of preferred stock shall request that the shares of Preferred Stock held by such holder not be redeemed by the Company, each share of preferred stock held shall automatically be converted into shares of Common Stock utilizing the then effective conversion ratio.
Conversion to Common Stock
In accordance with the terms of the preferred stock agreements, upon consummation of the Company’s initial public offering on February 14, 2007, each share of Series A-1, Series A-2, and Series A-4 preferred stock was converted into .112 shares of common stock. Each share of Series A-3 and Series B preferred stock was converted into .11426 and .11908 shares of common stock, respectively.
Authorized Shares and Activity
At March 31, 2007, the Company had authorized 100,000,000 shares of common stock and 5,000,000 of preferred stock. An aggregate of 7,577,811 shares of common stock were reserved for restricted shares, the employee stock purchase plan and the exercise of options and warrants at March 31, 2007.
On January 17, 2007, the Company amended its certificate of incorporation to:
| | • | | effect a 1 for 8.93 reverse stock split of the outstanding common stock; |
| | • | | adjust the conversion prices applicable to each series of preferred stock to reflect the reverse stock split; and |
| | • | | set the authorized capital stock of the Company at 105,000,000 shares. |
The stock split was approved by the Board of Directors on January 12, 2007 and was effective as of January 17, 2007. All common stock, option and warrant share and per share data have been retroactively adjusted to reflect the 1 for 8.93 stock split.
Stock Options
On January 12, 2007, the Company’s Board of Directors and stockholders approved the adoption of the 2007 Stock Option and Incentive Plan under (the “2007 Plan”) which the maximum number of shares of common stock that may be issued is the sum total of 3,000,000 shares plus all stock option awards or grants returned to the “2000 Plan” and the “2004 Plan” as a result of expiration or cancellation or termination of such stock option awards. The maximum contractual term of stock options granted under the “2007 Plan” may range from five to ten years from the date of grant.
F-20
SALARY.COM, INC.
NOTES TO THE CONSOLIDATED FINANCIAL STATEMENTS—(Continued)
Under the 2000 Stock Option and Incentive Plan (the “2000 Plan”), the Company may grant up to 672,000 incentive stock options and nonqualified stock options. In April 2002, the Company’s Board of Directors approved an increase in the number of options available for grant under the 2000 Plan to the higher of 1,344,000 or 30% of the fully diluted outstanding common shares. Under the 2004 Stock Option and Incentive Plan (the “2004 Plan”), the Company may grant stock options for up to 37.5% of the fully diluted outstanding common shares to a maximum of 2,800,000 options.
At March 31, 2007, the number of shares reserved for future grants was 2,997,255.
Stock option activity, under all plans, during the years ended March 31, 2007, 2006 and 2005 was as follows:
| | | | | | | | | | |
| | | Year Ended March 31, 2005 |
| | | Restricted
Shares (1) | | Weighted
Average
Exercise
Price | | Number of
Options | | | Weighted Average
Exercise Price |
Outstanding—beginning of period | | — | | | | 1,324,145 | | | $ | 0.4813 |
Granted | | — | | | | 1,616,798 | | | | 0.2232 |
Exercised | | — | | | | (523,242 | ) | | | 0.2255 |
Canceled | | — | | | | (86,609 | ) | | | 0.3339 |
| | | | | | | | | | |
Outstanding—end of period | | — | | | | 2,331,092 | | | $ | 0.3098 |
| | | | | | | | | | |
Exercisable—end of period | | — | | | | 387,419 | | | $ | 0.4228 |
| | | | | | | | | | |
| | | | | | | | | | | |
| | | Year Ended March 31, 2006 |
| | | Restricted
Shares (1) | | Weighted
Average
Exercise
Price | | Number of
Options | | | Weighted Average
Exercise Price |
Outstanding—beginning of period | | — | | | | | 2,331,092 | | | $ | 0.3098 |
Granted | | — | | | | | 3,079,811 | | | | 0.2232 |
Exercised | | 3,630,488 | | $ | 0.2232 | | (4,475,298 | ) | | | 0.2355 |
Canceled | | — | | | | | (295,264 | ) | | | 0.3528 |
| | | | | | | | | | | |
Outstanding—end of period | | 3,630,488 | | $ | 0.2232 | | 640,341 | | | $ | 0.2679 |
| | | | | | | | | | | |
Exercisable—end of period | | | | | | | 187,072 | | | $ | 0.3732 |
| | | | | | | | | | | |
| |
| | | Year Ended March 31, 2007 |
| | | Restricted
Shares (1) | | Weighted
Average
Exercise
Price | | Number of
Options | | | Weighted Average
Exercise Price |
Outstanding—beginning of period | | — | | | | | 640,341 | | | $ | 0.2679 |
Granted | | — | | | | | 1,559,145 | | | | 8.2903 |
Exercised | | 1,991,585 | | $ | 0.3483 | | (119,860 | ) | | | 3.6417 |
Canceled | | — | | | | | (138,523 | ) | | | 2.4653 |
| | | | | | | | | | | |
Outstanding—end of period | | 1,991,585 | | $ | 0.3483 | | 1,941,103 | | | $ | 6.3465 |
| | | | | | | | | | | |
Exercisable—end of period | | | | | | | 279,605 | | | $ | 3.8500 |
| | | | | | | | | | | |
| (1) | Represents stock options that have been exercised, but unvested as of the reporting date. |
F-21
SALARY.COM, INC.
NOTES TO THE CONSOLIDATED FINANCIAL STATEMENTS—(Continued)
The weighted average grant date fair value of options granted during fiscal years 2007, 2006 and 2005 was $4.8218, $2.3223 and $0.7518, respectively. The total intrinsic value of options exercised during the years ended March 31, 2007, 2006 and 2005, was approximately $322,000, $15,239,000 and $181,000, respectively.
The following table summarizes information about stock options outstanding at March 31, 2007:
| | | | | | | | | | | | |
| | | Options Outstanding | | Options Vested and Currently Exercisable |
Exercise Price | | Number of
Options | | Weighted Average
Remaining
Contractual Life
(Years) | | Weighted Average
Exercise Price
(Per Share) | | Number of
Options | | Weighted Average
Exercise Price
(Per Share) |
$0.223 – $ 0.892 | | 492,769 | | 7.5 | | $ | 0.2547 | | 162,938 | | $ | 0.3188 |
$6.607 – $ 8.214 | | 857,858 | | 9.7 | | $ | 6.9833 | | 55,264 | | $ | 6.8489 |
$10.50 – $11.133 | | 590,476 | | 9.8 | | $ | 10.5354 | | 61,403 | | $ | 10.5215 |
| | | | | | | | | | | | |
| | 1,941,103 | | 9.2 | | $ | 6.3465 | | 279,605 | | $ | 3.8500 |
| | | | | | | | | | | | |
Under the 2000 Plan and 2004 Plan, option recipients (“Option Holders”) are permitted to exercise options in advance of vesting. Any options exercised in advance of vesting result in the Option Holder receiving Restricted Stock, which is then subject to vesting under the respective option’s vesting schedule. Restricted Stock is subject to a right of repurchase by the Company from any Option Holder who is an employee who leaves the Company (either voluntarily or involuntarily), the Company has the right (but not the obligation) to repurchase the Restricted Stock at the original price paid by the Option Holder at the time the options were exercised. Because the Company has the right to repurchase the Restricted Stock upon the cessation of employment, the Company has recognized this potential liability for repurchase on the balance sheet as “Subscription Payable.” Upon vesting of the restricted shares, the Subscription Payable is relieved and recorded in equity.
A summary of the Company’s unvested shares, included unvested stock options and shares of unvested restricted stock, as of March 31, 2007, and changes during the years ended March 31, 2007 and 2006, is presented below:
| | | | | | | | | | | | | | | | | | | | | | | | | | | | | | |
| | | APB 25 | | | SFAS 123R | | | Total | |
| | | Unvested
Options
And
Restricted
Shares | | | Weighted
Average
Grant
Date
Intrinsic
Value | | Amount | | | Unvested
Options
And
Restricted
Shares | | | Weighted
Average
Grant
Date
Intrinsic
Value | | Amount | | | Unvested
Options
And
Restricted
Shares | | | Weighted
Average
Grant
Date
Intrinsic
Value | | Amount | |
Unvested Options and Restricted Shares Outstanding at March 31, 2005 | | 1,943,722 | | | $ | 0.384 | | $ | 744,952 | | | — | | | $ | — | | $ | — | | | 1,943,722 | | | $ | 0.384 | | $ | 744,952 | |
Granted | | — | | | | — | | | — | | | 3,032,580 | | | | 2.348 | | | 7,108,764 | | | 3,032,580 | | | | 2.348 | | | 7,108,764 | |
Vested | | (516,070 | ) | | | 0.313 | | | (159,500 | ) | | (124,114 | ) | | | 1.455 | | | (180,508 | ) | | (640,184 | ) | | | 0.527 | | | (340,008 | ) |
Canceled | | (223,183 | ) | | | 0.339 | | | (75,541 | ) | | (29,078 | ) | | | 1.643 | | | (47,879 | ) | | (252,261 | ) | | | 0.491 | | | (123,420 | ) |
| | | | | | | | | | | | | | | | | | | | | | | | | | | | | | |
Unvested Options and Restricted Shares outstanding at March 31, 2006 | | 1,204,469 | | | | 0.420 | | | 509,911 | | | 2,879,388 | | | | 2.393 | | | 6,880,377 | | | 4,083,857 | | | | 1.813 | | | 7,390,288 | |
Granted | | — | | | | — | | | — | | | 1,512,392 | | | | 4.841 | | | 7,321,288 | | | 1,512,392 | | | | 4.841 | | | 7,321,288 | |
Vested | | (711,653 | ) | | | 0.423 | | | (301,132 | ) | | (932,363 | ) | | | 1.812 | | | (1,689,207 | ) | | (1,644,016 | ) | | | 1.211 | | | (1,990,339 | ) |
Canceled | | (59,197 | ) | | | 0.239 | | | (14,121 | ) | | (239,953 | ) | | | 2.663 | | | (639,065 | ) | | (299,150 | ) | | | 2.183 | | | (653,186 | ) |
| | | | | | | | | | | | | | | | | | | | | | | | | | | | | | |
Unvested Options and Restricted Shares outstanding at March 31, 2007 | | 433,619 | | | $ | 0.449 | | $ | 194,658 | | | 3,219,464 | | | $ | 3.688 | | $ | 11,873,393 | | | 3,653,083 | | | $ | 3.304 | | $ | 12,068,051 | |
| | | | | | | | | | | | | | | | | | | | | | | | | | | | | | |
As of March 31, 2007 and 2006, there were 1,991,585 and 3,630,488 shares of unvested restricted stock outstanding.
F-22
SALARY.COM, INC.
NOTES TO THE CONSOLIDATED FINANCIAL STATEMENTS—(Continued)
As of March 31, 2007, there was approximately $9.7 million of total unrecognized compensation expense related to unvested share-based compensation arrangements granted under the Company’s Stock Option Plans (relating to the effect of SFAS 123R and APB 25). That cost is expected to be recognized over a weighted average period of 3.3 years. The total fair value of shares vested during the year ended March 31, 2007 was approximately $3,144,000.
Effective April 1, 2005, the Company adopted SFAS 123R using the prospective method of application, which requires the Company to recognize compensation expense on a prospective basis; therefore, prior period financial statements have not been restated. Compensation expense recognized includes the expense of stock options granted on and subsequent to April 1, 2005. Stock options granted by the Company prior to that time are specifically excluded from SFAS 123R and will continue to be accounted for in accordance with APB 25. These options were valued using the minimum value method.
In fiscal 2006, the Company used the Black-Scholes option-pricing model to value option grants and determine the related compensation expense. The assumptions used in calculating the fair value of stock-based payment awards represent management’s best estimates.
The Company estimates expected volatility based on that of the Company’s publicly-traded peer companies and expects to continue to do so until such time as the Company has adequate historical data from our traded share price. Management believes that the historical volatility of the Company’s stock price does not best represent the expected volatility of the stock price. Prior to the Company’s initial public offering in February 2007, the Company was a private company and therefore lacked company-specific historical and implied volatility information. The Company intends to continue to consistently use the same group of publicly-traded peer companies to determine volatility in the future until such time that we have accumulated sufficient historical information regarding the volatility of our now publicly traded share price.
The risk-free interest rate used for each grant is equal to the U.S. Treasury yield curve in effect at the time of grant for instruments with a similar expected life.
The expected term of the options granted was determined based upon review of the period that the Company’s share-based awards are expected to be outstanding and is estimated based on historical experience of similar awards, giving consideration to the contractual term of the awards, vesting schedules and expectations of employee exercise behavior.
SFAS 123R also requires that the Company recognize compensation expense for only the portion of options that are expected to vest. Therefore, the Company has estimated expected forfeitures of stock options with the adoption of SFAS 123R. In developing a forfeiture rate estimate, the Company considered its historical experience, its growing employee base and the limited liquidity of its common stock. If the actual number of forfeitures differs from those estimated by management, additional adjustments to compensation expense may be required in future periods.
The following table provides the assumptions used in determining the fair value of the share-based awards for the years ended March 31, 2007 and 2006, respectively:
| | | | | | |
| | | Year Ended
March 31, 2007 | | | Year Ended
March 31, 2006 | |
Risk-Free Rate | | 4.45 – 4.80 | % | | 3.72 – 4.82 | % |
Expected Life | | 5 years | | | 5 years | |
Expected Volatility | | 62 – 65 | % | | 60 – 75 | % |
Expected Dividend Yield | | 0 | % | | 0 | % |
F-23
SALARY.COM, INC.
NOTES TO THE CONSOLIDATED FINANCIAL STATEMENTS—(Continued)
Compensation expense related to the adoption of SFAS 123R amounted to approximately $3,144,000 and $281,000, which is included in the statement of operations for the years ended March 31, 2007 and 2006, respectively, and is based on awards ultimately expected to vest and reflects an estimate of awards that will be forfeited. SFAS 123R requires forfeitures to be estimated at the time of grant and revised, if necessary, in subsequent periods if actual forfeitures differ from those estimates. Prior to the adoption of SFAS 123R, forfeitures were recorded as they occurred.
In connection with the preparation of the financial statements for the Company’s initial public offering and solely for the purposes of accounting for stock-based compensation for financial statement purposes, the Company’s management reassessed the fair value of the Company’s common stock for the equity awards granted on or after April 1, 2004 through March 31, 2006. Based upon this reassessment of the fair value of the Company’s common stock, the Company recorded stock-based compensation expense to the extent that the reassessed value of the Company’s common stock at the date of the grant exceeded the exercise price of the equity awards. Reassessed values are inherently uncertain and highly subjective. For stock options granted prior to March 31, 2004, no expense was recorded as management determined that the estimated fair value of the Company’s stock at the date of grant did not exceed the exercise price. The stock-based compensation is being amortized on a straight-line basis over the stock option vesting period of generally five years. During each of the years ended March 31, 2006 and 2005, the Company recognized approximately $132,000 of stock-based compensation expense related to options granted to employees during fiscal 2006 and 2005, respectively based on the reassessed values of the underlying common stock.
During fiscal 2006 and 2005, the Company offered certain holders of stock options the limited opportunity to exercise their options at a price equal to the deemed fair value of the Company’s stock at the time of the offer. To the extent that the offer was not accepted, the affected options retained their original exercise price. However, because of the Company’s offer, these options became subject to variable accounting as prescribed in FASB Interpretation No. 44,Accounting for Certain Transactions Involving Stock Compensation (an Interpretation of APB Opinion No. 25)(“FIN 44”). The majority of these awards became fixed upon exercise under the bonus offer during March 2006, as described in the following paragraph, which was accounted for as a modification under SFAS 123R. Compensation expense related to these options has been recognized during fiscal 2007, 2006 and 2005, since the modified option exercise prices were below the reassessed per share fair value of the Company’s common stock at that time. The Company recorded compensation expense amounting to approximately $912,000, $632,000 and $380,000 for the years ended March 31, 2007, 2006 and 2005, respectively.
During March 2006, the Company offered certain holders of stock options, totaling 143 employees, the limited opportunity to receive a cash bonus to exercise all of their outstanding stock options. As part of this offer, unvested stock options could be exercised into restricted stock. This offer was accounted for as a modification under SFAS 123R. The additional compensation expense for the modification was deemed immaterial to the Company’s financial statements. There are 1,991,585 shares of common stock subject to restriction as of March 31, 2007 related to this offer.
On February 7, 2007, in connection with the negotiation of a new employment agreement with the Company’s President and Chief Executive Officer, the Compensation Committee accelerated the vesting of 854,449 shares of restricted stock held by the Company’s President and Chief Executive Officer. These shares had been issued to the Company’s President and Chief Executive Officer in March 2006 upon the exercise of stock options granted to him between June 2003 and March 2006 under the 2000 Plan and the 2004 Plan. The Company recognized a non-cash compensation charge of approximately $1.3 million to general and administrative expenses in the quarter ending March 31, 2007 as a result of this acceleration.
F-24
SALARY.COM, INC.
NOTES TO THE CONSOLIDATED FINANCIAL STATEMENTS—(Continued)
Employee Stock Purchase Plan
On January 17, 2007, the Company’s Board of Directors and stockholders approved the adoption of the 2007 Employee Stock Purchase Plan (the “Purchase Plan”) under which an aggregate amount of 500,000 shares of common stock may be issued. The Purchase Plan provides full-time employees, nearly all of whom are eligible to participate, the opportunity to purchase common shares, on a semi-annual basis, at 90% of the fair market value of the shares on either the first or last day of the applicable semi-annual offering period, whichever is lower. The Company has authorized 500,000 shares of the Company’s common stock for issuance under the Purchase Plan. The first purchase of shares under the Purchase Plan will be on September 30, 2007.
Subscription Notes Receivable
The Company extended loans to a number of employees in March 2006. The notes require that the proceeds of the loans be used by the employees solely to exercise stock options. The loans earn interest at 7% per annum, and interest is payable at the loan maturity date. If a default occurs, the outstanding loan balance becomes immediately due. The loans mature in either six months or ten months. All loans had been repaid by March 31, 2007.
Warrants
In conjunction with the subordinated notes payable to stockholders in 2002, the Company issued warrants to the holders to purchase 28,000 shares of common stock at $0.89 per share and 750,000 shares of Series B preferred stock at $1.00 per share. The Series B preferred stock warrants were replaced with 750,000 warrants to purchase Series A-4 preferred stock at $0.25 per share in November 2003. In November 2006, the Company issued a warrant to acquire 44,800 shares of its common stock at an exercise price of $6.61 per share to an existing stockholder that is affiliated with a director of the Company. The Company recorded stock-based compensation expense of approximately $114,000 related to this warrant.
As of March 31, 2007, the Company had outstanding warrants to purchase 147,868 shares of common stock at exercise prices ranging from $0.09 to $6.61 per share.
| | | | | | | | | | | | | | | | | |
| | | Year Ended March 31, 2007 | | Year Ended March 31, 2006 | | Year Ended March 31, 2005 |
| | | Number of
Warrants | | | Weighted Average
Exercise Price | | Number of
Warrants | | | Weighted Average
Exercise Price | | Number of
Warrants | | Weighted Average
Exercise Price |
Outstanding—beginning of year | | 108,666 | | | $ | 0.214 | | 194,770 | | | $ | 1.080 | | 194,770 | | $ | 1.080 |
Granted | | 44,800 | | | $ | 6.607 | | — | | | | | | — | | | |
Exercised | | (5,598 | ) | | $ | 0.357 | | (58,104 | ) | | $ | 2.188 | | — | | | |
Canceled | | — | | | | | | (28,000 | ) | | $ | 2.230 | | — | | | |
| | | | | | | | | | | | | | | | | |
Outstanding—end of year | | 147,868 | | | $ | 0.215 | | 108,666 | | | $ | 0.214 | | 194,770 | | $ | 1.080 |
| | | | | | | | | | | | | | | | | |
Exercisable—end of year | | 147,868 | | | $ | 0.215 | | 108,666 | | | $ | 0.214 | | 194,770 | | $ | 1.080 |
| | | | | | | | | | | | | | | | | |
F-25
SALARY.COM, INC.
NOTES TO THE CONSOLIDATED FINANCIAL STATEMENTS—(Continued)
A reconciliation of the Company’s effective income tax rate to the statutory federal income tax rate of 34% for the years ended March 31, 2007, 2006 and 2005 is as follows:
| | | | | | | | | |
| | | Years Ended March 31, | |
| | | 2007 | | | 2006 | | | 2005 | |
Statutory rate | | (34.0 | )% | | (34.0 | )% | | (34.0 | )% |
State taxes, net of federal benefit | | (7.6 | ) | | 10.0 | | | (4.2 | ) |
Stock-based compensation | | 0.0 | | | 15.0 | | | 7.6 | |
Officer’s life insurance | | 0.0 | | | 0.1 | | | 0.0 | |
Other | | (4.5 | ) | | (2.2 | ) | | 1.1 | |
Expiration of state net operating losses | | 1.8 | | | 12.9 | | | 0.0 | |
Change in valuation allowance | | 44.3 | | | (1.8 | ) | | 29.5 | |
| | | | | | | | | |
| | 0.0 | % | | 0.0 | % | | 0.0 | % |
| | | | | | | | | |
Deferred income taxes reflect the net tax effect of temporary differences between the carrying amount of assets and liabilities for financial reporting purposes and the amounts used for income tax purposes. Significant components of the Company’s deferred tax assets for the years ended March 31, 2007 and 2006 are as follows:
| | | | | | | | |
| | | March 31, | |
| | | 2007 | | | 2006 | |
Deferred tax assets: | | | | | | | | |
Net operating loss carryforwards | | $ | 5,978,047 | | | $ | 5,435,422 | |
Accrued expenses | | | 854,848 | | | | 283,433 | |
Property and equipment | | | 83,921 | | | | 57,399 | |
Intangibles | | | 12,731 | | | | — | |
Deferred revenue | | | 83,872 | | | | 59,342 | |
Stock-based compensation | | | 1,654,002 | | | | — | |
Reserves | | | 67,135 | | | | 66,975 | |
Tax credits | | | 509,487 | | | | — | |
Foreign NOL | | | 67,368 | | | | — | |
| | | | | | | | |
Total gross deferred tax assets | | | 9,311,411 | | | | 5,902,571 | |
Valuation allowance | | | (9,311,411 | ) | | | (5,902,571 | ) |
| | | | | | | | |
Total deferred tax assets | | $ | — | | | $ | — | |
| | | | | | | | |
As of March 31, 2007, the Company had net operating loss carryforwards of approximately $16,428,000 for federal income tax purposes and $6,146,000 for state income tax purposes. Federal and state net operating losses may be available to offset future federal income tax liabilities. The net operating losses for federal income tax purposes expire at various dates through 2027 and state net operating losses expire at various dates through 2012. As required by SFAS No. 109,Accounting for Income Taxes,management has determined that is more likely than not that the Company will not recognize the benefit of federal and state deferred tax assets, and as a result, a valuation allowance of $9,311,411 and $5,902,571 has been established at March 31, 2007 and 2006, respectively. The increase in the valuation allowance was $3,408,840 for the year ended March 31, 2007.
Ownership changes, as defined by the Internal Revenue Code, may substantially limit the amount of net operating loss carryforwards that can be utilized annually to offset future taxable income. Subsequent ownership changes could further affect the limitation in future years. Such annual limitations could result in the expiration of net operating loss carryforwards before utilization.
F-26
SALARY.COM, INC.
NOTES TO THE CONSOLIDATED FINANCIAL STATEMENTS—(Continued)
The Company has a retirement savings plan under Section 401(k) of the Internal Revenue Code (the 401(k) Plan). Participants may contribute up to a maximum percentage of their annual compensation to the plan as determined by the Company, limited to a maximum annual amount set by the Internal Revenue Service. The Company has not made any matching contributions to the 401(k) Plan during the years ended March 31, 2007, 2006 and 2005.
| 12. | RELATED PARTY TRANSACTIONS |
In April 2003, the Company entered into the 2003 Line with an entity owned by a stockholder of the Company and affiliated with the Company’s Chief Executive Officer. On January 1, 2006, the 2003 Line was assigned to the Company’s Chief Executive Officer and was repaid in full and terminated in September 2006.
On May 15, 2007, the Company acquired the membership interests of ICR Limited, L.C. and the outstanding share capital of ICR International Ltd. (collectively, “ICR”), a leading provider of industry-specific market intelligence for employee pay and benefits for the global technology and specialty consumer goods markets. Pursuant to the terms of the purchase agreements, the Company paid $10 million to the owners of ICR, of which $1 million has been placed in escrow for 12 months. The escrow fund will be available to compensate us for any losses we may incur as a result of any breach of the representations or warranties of the owners of ICR contained in the purchase agreements, and certain liabilities arising out of the ownership or operation of ICR prior to the acquisition.
F-27
SALARY.COM, INC.
SCHEDULE II—VALUATION AND QUALIFYING ACCOUNTS
| | | | | | | | | | | | | | |
| | | Balance at
Beginning
of Period | | Charged to
Expense | | | Deductions | | | Balance at
End
of Period |
Allowance for doubtful accounts (deducted from accounts receivable) | | | | | | | | | | | | | | |
Year ended March 31, 2005 | | $ | 184,747 | | $ | 104,754 | | | $ | — | | | $ | 289,501 |
Year ended March 31, 2006 | | | 289,501 | | | (86,923 | ) | | | (36,262 | ) | | | 166,316 |
Year ended March 31, 2007 | | | 166,316 | | | 13,396 | | | | — | | | | 179,712 |
| | | | |
Deferred tax valuation allowance (deducted from net deferred taxes) | | | | | | | | | | | | | | |
Year ended March 31, 2005 | | $ | 5,295,426 | | $ | 674,280 | | | $ | — | | | $ | 5,969,706 |
Year ended March 31, 2006 | | | 5,969,706 | | | (67,135 | ) | | | — | | | | 5,902,571 |
Year ended March 31, 2007 | | | 5,902,571 | | | 3,408,840 | | | | — | | | | 9,311,411 |
S-1