UNITED STATES
SECURITIES AND EXCHANGE COMMISSION
Washington, D.C. 20549
Form N-CSR
CERTIFIED SHAREHOLDER REPORT OF REGISTERED
MANAGEMENT INVESTMENT COMPANIES
Investment Company Act File Number: 811-09877
CALVERT RESPONSIBLE INDEX SERIES, INC.
(Exact Name of Registrant as Specified in Charter)
2050 M Street NW, Washington, DC 20036
(Address of Principal Executive Offices)
Deidre E. Walsh
Two International Place, Boston, Massachusetts 02110
(Name and Address of Agent for Services)
(202) 238-2200
(Registrant’s Telephone Number)
September 30
Date of Fiscal Year End
September 30, 2023
Date of Reporting Period
Item 1. Reports to Stockholders
Calvert
US Large-Cap Growth Responsible Index Fund
Annual Report
September 30, 2023
Commodity Futures Trading Commission Registration. The Commodity Futures Trading Commission (“CFTC”) has adopted regulations that subject registered investment companies and advisers to regulation by the CFTC if a fund invests more than a prescribed level of its assets in certain CFTC-regulated instruments (including futures, certain options and swap agreements) or markets itself as providing investment exposure to such instruments. The adviser has claimed an exclusion from the definition of “commodity pool operator” under the Commodity Exchange Act with respect to its management of the Fund and the other funds it manages. Accordingly, neither the Fund nor the adviser is subject to CFTC regulation.
Fund shares are not insured by the FDIC and are not deposits or other obligations of, or guaranteed by, any depository institution. Shares are subject to investment risks, including possible loss of principal invested.
This report must be preceded or accompanied by a current summary prospectus or prospectus. Before investing, investors should consider carefully the investment objective, risks, and charges and expenses of a mutual fund. This and other important information is contained in the summary prospectus and prospectus, which can be obtained from a financial intermediary. Prospective investors should read the prospectus carefully before investing. For further information, please call 1-800-368-2745.
Choose Planet-friendly E-delivery!
Sign up now for on-line statements, prospectuses, and fund reports. In less than five minutes you can help reduce paper mail and lower fund costs.
Just go to www.calvert.com. If you already have an online account with the Calvert funds, click on Login to access your Account and select the documents you would like to receive via e-mail.
If you’re new to online account access, click on Login, then Register to create your user name and password. Once you’re in, click on the E-delivery sign-up on the Account Portfolio page and follow the quick, easy steps.
Note: If your shares are not held directly with the Calvert funds but through a brokerage firm, you must contact your broker for electronic delivery options available through their firm.
Annual Report September 30, 2023
Calvert
US Large-Cap Growth Responsible Index Fund
Calvert
US Large-Cap Growth Responsible Index Fund
September 30, 2023
Management's Discussion of Fund Performance†
Economic and Market Conditions
For U.S. equity investors, the 12-month period ended September 30, 2023, was a roller-coaster ride, driven largely by shifting perceptions of whether the U.S. Federal Reserve (the Fed) could bring the world’s largest economy in for a soft landing, and changing expectations of how long interest rates might remain high.
During the opening two months of the period, stocks rallied on strong corporate earnings, attractive valuations, and hope the Fed might slow the pace of its interest rate hikes. But in December 2022, equities lost ground as “higher for longer” interest rate fears returned. A continuing irony throughout the period was that good economic news -- record low unemployment, strong job creation, and robust consumer spending -- was viewed as bad news for inflation and fuel for further rate hikes that would weigh on stock prices.
In January 2023, however, U.S. equities began a rally that lasted through July. The initial tailwind was ChatGPT, an artificial intelligence (AI) application that led investors to perceive AI might become the next big innovation to drive the information technology (IT) sector. As a result, IT -- one of the worst-performing sectors in 2022 -- became the standout sector of the first half of 2023. Earlier recession fears that had weighed on stock prices receded as many investors came around to the view that the U.S. economy was doing surprisingly well.
But in the final two months of the period, the bond market halted the stock market’s momentum. As it became clear the Fed would keep rates higher for longer than investors had anticipated just a few months earlier, longer term bond interest rates rose sharply. Given the potential for relatively attractive returns with lower risk than stocks, many investors shifted from equity assets to bonds. Stock prices ended on a down note as the period came to a close.
For the period as a whole, however, U.S. equity performance was strong. The S&P 500® Index, a broad measure of U.S. stocks, returned 21.62%; the blue-chip Dow Jones Industrial Average® returned 19.18%; and the tech-heavy Nasdaq Composite Index returned 26.11%.
Fund Performance
For the 12-month period ended September 30, 2023, Calvert US Large-Cap Growth Responsible Index Fund (the Fund) returned 24.73% for Class A shares at net asset value (NAV). The Fund underperformed its primary benchmark, the Russell 1000® Growth Index (the Index), which returned 27.72%; and underperformed its secondary benchmark, the Calvert US Large-Cap Growth Responsible Index (the Calvert Index), which returned 25.34% during the period.
The Fund’s underperformance versus the Calvert Index was due to Fund expenses and fees, which the Calvert Index does not incur.
Of the 11 market sectors held by the Fund, all except the utilities sector delivered positive returns during the period. The strongest-performing sectors were energy, information technology (IT), and communication services. The weakest-performing sectors were utilities, consumer staples, and health care.
Detractors from Fund performance versus the Index included stock selections and an overweight position in the health care sector; stock selections and an underweight position in the communication services sector; and stock selections and an underweight position in IT, the best-performing sector within the Index during the period.
In the health care sector, the Fund’s out-of-Index position in pharmaceutical firm Bristol-Myers Squibb Co. (Bristol-Myers) detracted from performance versus the Index during the period. Bristol-Myers’ stock price fell after it reported lower-than-expected second-quarter 2023 earnings and reduced future earnings projections, as two of its top-selling drugs -- blood-cancer treatment Revlimid and blood thinner Eliquis -- lost sales to generic competitors.
In the communication services sector, not owning Index component Meta Platforms, Inc. (Meta) -- the social media company behind Facebook, Instagram, and Messenger -- hurt returns relative to the Index during the period. Meta’s stock price doubled as advertising revenues rebounded on improved ad targeting, while profit margins exceeded expectations due to more rational spending on longer-term initiatives.
In the IT sector, the Fund’s underweight position in semiconductor firm NVIDIA Corp. (NVIDIA) detracted from Index-relative performance. NVIDIA’s share price more than doubled during the period, driven by increased demand for its high-end graphics processing units in the burgeoning artificial intelligence, or AI, industry.
In contrast, contributors to Fund performance versus the Index included stock selections and an underweight position in the real estate sector, which delivered negative returns in the Index as property sales were hampered by rising mortgage rates during the period and companies cut back on office space after the pandemic. Stock selections and underweight positions in the energy and consumer discretionary sectors helped returns relative to the Index as well.
In the real estate sector, not owning Index component American Tower Corp. (American Tower), which owns and operates cellular communication towers, helped performance relative to the Index during the period. American Tower’s stock price declined in the face of rising interest rates that increased the cost of its floating-rate debt; exchange-rate fluctuations that reduced the income from its international operations; and the loss of some tower leases after T-Mobile acquired competitor Sprint and consolidated its cellular tower usage.
See Endnotes and Additional Disclosures in this report.
Past performance is no guarantee of future results. Returns are historical and are calculated by determining the percentage change in net asset value (NAV) or offering price (as applicable) with all distributions reinvested. Furthermore, returns do not reflect the deduction of taxes that shareholders may have to pay on Fund distributions or upon the redemption of Fund shares. Investment return and principal value will fluctuate so that shares, when redeemed, may be worth more or less than their original cost. Performance for periods less than or equal to one year is cumulative. Performance is for the stated time period only; due to market volatility, current Fund performance may be lower or higher than the quoted return. For performance as of the most recent month-end, please refer to www.calvert.com.
Calvert
US Large-Cap Growth Responsible Index Fund
September 30, 2023
Performance
Portfolio Manager(s) Thomas C. Seto of Calvert Research and Management
| % Average Annual Total Returns1,2 | Class
Inception Date | Performance
Inception Date | One Year | Five Years | Since
Inception |
| Class A at NAV | 06/19/2015 | 06/19/2015 | 24.73% | 11.98% | 12.78% |
| Class A with 4.75% Maximum Sales Charge | — | — | 18.82 | 10.90 | 12.11 |
| Class I at NAV | 06/19/2015 | 06/19/2015 | 25.05 | 12.28 | 13.11 |
| Class R6 at NAV | 02/01/2022 | 06/19/2015 | 25.09 | 12.28 | 13.12 |
|
| Russell 1000® Growth Index | — | — | 27.72% | 12.41% | 13.77% |
| Calvert US Large-Cap Growth Responsible Index | — | — | 25.34 | 12.59 | 13.41 |
| % Total Annual Operating Expense Ratios3 | Class A | Class I | Class R6 |
| Gross | 0.65% | 0.40% | 0.37% |
| Net | 0.49 | 0.24 | 0.21 |
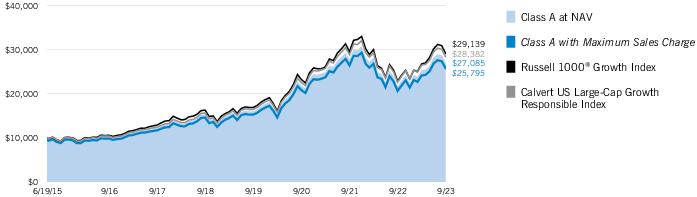
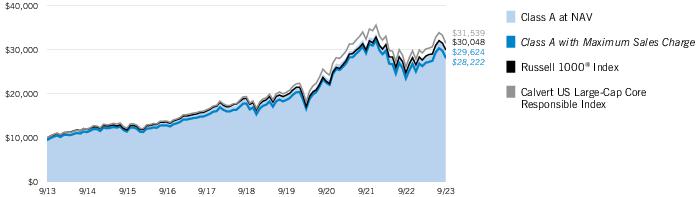
Growth of $10,000
This graph shows the change in value of a hypothetical investment of $10,000 in Class A of the Fund for the period indicated. For comparison, the same investment is shown in the indicated index.
| Growth of Investment2 | Amount Invested | Period Beginning | At NAV | With Maximum Sales Charge |
| Class I, at minimum investment | $1,000,000 | 06/19/2015 | $2,776,117 | N.A. |
| Class R6, at minimum investment | $5,000,000 | 06/19/2015 | $13,884,941 | N.A. |
See Endnotes and Additional Disclosures in this report.
Past performance is no guarantee of future results. Returns are historical and are calculated by determining the percentage change in net asset value (NAV) or offering price (as applicable) with all distributions reinvested. Furthermore, returns do not reflect the deduction of taxes that shareholders may have to pay on Fund distributions or upon the redemption of Fund shares. Investment return and principal value will fluctuate so that shares, when redeemed, may be worth more or less than their original cost. Performance for periods less than or equal to one year is cumulative. Performance is for the stated time period only; due to market volatility, current Fund performance may be lower or higher than the quoted return. For performance as of the most recent month-end, please refer to www.calvert.com.
Calvert
US Large-Cap Growth Responsible Index Fund
September 30, 2023
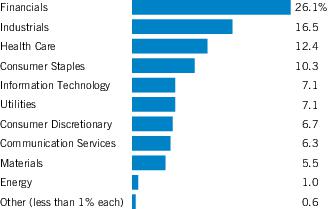
| Sector Allocation (% of net assets)1 |
| Top 10 Holdings (% of net assets)1 | |
| Apple, Inc. | 10.1% |
| Microsoft Corp. | 8.8 |
| Alphabet, Inc., Class A | 5.5 |
| Amazon.com, Inc. | 4.4 |
| NVIDIA Corp. | 4.0 |
| Tesla, Inc. | 2.7 |
| Eli Lilly & Co. | 1.8 |
| Visa, Inc., Class A | 1.5 |
| Broadcom, Inc. | 1.4 |
| Mastercard, Inc., Class A | 1.4 |
| Total | 41.6% |
Footnotes:
| 1 | Excludes cash and cash equivalents. |
Calvert
US Large-Cap Growth Responsible Index Fund
September 30, 2023
Endnotes and Additional Disclosures
| † | The views expressed in this report are those of the portfolio manager(s) and are current only through the date stated at the top of this page. These views are subject to change at any time based upon market or other conditions, and Calvert and the Fund(s) disclaim any responsibility to update such views. These views may not be relied upon as investment advice and, because investment decisions are based on many factors, may not be relied upon as an indication of trading intent on behalf of any Calvert fund. This commentary may contain statements that are not historical facts, referred to as “forward-looking statements.” The Fund’s actual future results may differ significantly from those stated in any forward-looking statement, depending on factors such as changes in securities or financial markets or general economic conditions, the volume of sales and purchases of Fund shares, the continuation of investment advisory, administrative and service contracts, and other risks discussed from time to time in the Fund’s filings with the Securities and Exchange Commission. |
| | |
| 1 | Russell 1000® Growth Index is an unmanaged index of U.S. large-cap growth stocks. Calvert US Large-Cap Growth Responsible Index (the “Calvert Index”) is composed of common stocks of large growth companies that operate their businesses in a manner that is consistent with the Calvert Principles for Responsible Investment. Large growth companies are selected from the 1,000 largest publicly traded U.S. companies based on market capitalization and growth style factors, excluding real estate investment trusts and business development companies. The Calvert Principles for Responsible Investment serve as a framework for considering environmental, social and governance factors that may affect investment performance. Stocks are weighted in the Calvert Index based on their float-adjusted market capitalization within the relevant sector, subject to certain prescribed limits. Unless otherwise stated, index returns do not reflect the effect of any applicable sales charges, commissions, expenses, taxes or leverage, as applicable. It is not possible to invest directly in an index. |
| 2 | Total Returns at NAV do not include applicable sales charges. If sales charges were deducted, the returns would be lower. Total Returns shown with maximum sales charge reflect the stated maximum sales charge. Unless otherwise stated, performance does not reflect the deduction of taxes on Fund distributions or redemptions of Fund shares. |
| | Performance prior to the inception date of a class may be linked to the performance of an older class of the Fund. This linked performance is adjusted for any applicable sales charge, but is not adjusted for class expense differences. If adjusted for such differences, the performance would be different. The performance of Class R6 is linked to Class I. Performance since inception for an index, if presented, is the performance since the Fund's or oldest share class's inception, as applicable. Performance presented in the Financial Highlights included in the financial statements is not linked.Calvert Research and Management became the investment adviser to the Fund on December 31, 2016. Performance reflected prior to such date is that of the Fund’s former investment adviser. |
| 3 | Source: Fund prospectus. Net expense ratios reflect a contractual expense reimbursement that continues through 1/31/24. The expense ratios for the current reporting period can be found in the Financial Highlights section of this report. Performance reflects expenses waived and/or reimbursed, if applicable. Without such waivers and/or reimbursements, performance would have been lower. |
| Additional Information |
| | S&P 500® Index is an unmanaged index of large-cap stocks commonly used as a measure of U.S. stock market performance. Dow Jones Industrial Average® is a price-weighted average of 30 blue-chip stocks that are generally the leaders in their industry. S&P Dow Jones Indices are a product of S&P Dow Jones Indices LLC (“S&P DJI”) and have been licensed for use. S&P® and S&P 500® are registered trademarks of S&P DJI; Dow Jones® is a registered trademark of Dow Jones Trademark Holdings LLC (“Dow Jones”); S&P DJI, Dow Jones and their respective affiliates do not sponsor, endorse, sell or promote the Fund, will not have any liability with respect thereto and do not have any liability for any errors, omissions, or interruptions of the S&P Dow Jones Indices. Nasdaq Composite Index is a market capitalization-weighted index of all domestic and international securities listed on Nasdaq. Source: Nasdaq, Inc. The information is provided by Nasdaq (with its affiliates, are referred to as the “Corporations”) and Nasdaq’s third party licensors on an “as is” basis and the Corporations make no guarantees and bear no liability of any kind with respect to the information or the Fund. |
Calvert
US Large-Cap Growth Responsible Index Fund
September 30, 2023
Example
As a Fund shareholder, you incur two types of costs: (1) transaction costs, including sales charges (loads) on purchases; and (2) ongoing costs, including management fees; distribution and/or service fees; and other Fund expenses. This Example is intended to help you understand your ongoing costs (in dollars) of Fund investing and to compare these costs with the ongoing costs of investing in other mutual funds. The Example is based on an investment of $1,000 invested at the beginning of the period and held for the entire period (April 1, 2023 to September 30, 2023).
Actual Expenses
The first section of the table below provides information about actual account values and actual expenses. You may use the information in this section, together with the amount you invested, to estimate the expenses that you paid over the period. Simply divide your account value by $1,000 (for example, an $8,600 account value divided by $1,000 = 8.6), then multiply the result by the number in the first section under the heading entitled “Expenses Paid During Period” to estimate the expenses you paid on your account during this period.
Hypothetical Example for Comparison Purposes
The second section of the table below provides information about hypothetical account values and hypothetical expenses based on the actual Fund expense ratio and an assumed rate of return of 5% per year (before expenses), which is not the actual Fund return. The hypothetical account values and expenses may not be used to estimate the actual ending account balance or expenses you paid for the period. You may use this information to compare the ongoing costs of investing in the Fund and other funds. To do so, compare this 5% hypothetical example with the 5% hypothetical examples that appear in the shareholder reports of the other funds.
Please note that the expenses shown in the table are meant to highlight your ongoing costs only and do not reflect any transactional costs, such as sales charges (loads). Therefore, the second section of the table is useful in comparing ongoing costs only, and will not help you determine the relative total costs of owning different funds. In addition, if these transactional costs were included, your costs would be higher.
| | Beginning
Account Value
(4/1/23) | Ending
Account Value
(9/30/23) | Expenses Paid
During Period*
(4/1/23 – 9/30/23) | Annualized
Expense
Ratio |
| Actual | | | | |
| Class A | $1,000.00 | $1,067.50 | $2.54 ** | 0.49% |
| Class I | $1,000.00 | $1,068.90 | $1.24 ** | 0.24% |
| Class R6 | $1,000.00 | $1,069.20 | $1.09 ** | 0.21% |
| Hypothetical | | | | |
| (5% return per year before expenses) | | | | |
| Class A | $1,000.00 | $1,022.61 | $2.48 ** | 0.49% |
| Class I | $1,000.00 | $1,023.87 | $1.22 ** | 0.24% |
| Class R6 | $1,000.00 | $1,024.02 | $1.07 ** | 0.21% |
| * | Expenses are equal to the Fund’s annualized expense ratio for the indicated Class, multiplied by the average account value over the period, multiplied by 183/365 (to reflect the one-half year period). The Example assumes that the $1,000 was invested at the net asset value per share determined at the close of business on March 31, 2023. |
| ** | Absent a waiver and/or reimbursement of expenses by affiliate(s), expenses would be higher. |
Calvert
US Large-Cap Growth Responsible Index Fund
September 30, 2023
| Security | Shares | Value |
| Aerospace & Defense — 0.2% | |
| Axon Enterprise, Inc.(1) | | 1,887 | $ 375,494 |
| Curtiss-Wright Corp. | | 435 | 85,099 |
| HEICO Corp. | | 1,166 | 188,811 |
| Hexcel Corp. | | 824 | 53,675 |
| Woodward, Inc. | | 807 | 100,278 |
| | | | $ 803,357 |
| Air Freight & Logistics — 0.3% | |
| C.H. Robinson Worldwide, Inc. | | 287 | $ 24,719 |
| Expeditors International of Washington, Inc. | | 3,055 | 350,195 |
| FedEx Corp. | | 371 | 98,285 |
| GXO Logistics, Inc.(1) | | 1,152 | 67,565 |
| United Parcel Service, Inc., Class B | | 5,057 | 788,235 |
| | | | $ 1,328,999 |
| Automobile Components — 0.1% | |
| Aptiv PLC(1) | | 4,450 | $ 438,726 |
| Visteon Corp.(1) | | 576 | 79,528 |
| | | | $ 518,254 |
| Automobiles — 2.7% | |
| Tesla, Inc.(1) | | 53,442 | $ 13,372,257 |
| | | | $ 13,372,257 |
| Banks — 0.0%(2) | |
| First Financial Bankshares, Inc. | | 1,241 | $ 31,174 |
| | | | $ 31,174 |
| Beverages — 1.9% | |
| Celsius Holdings, Inc.(1) | | 1,217 | $ 208,837 |
| Coca-Cola Co. (The) | | 53,638 | 3,002,655 |
| Coca-Cola Consolidated, Inc. | | 111 | 70,632 |
| Keurig Dr Pepper, Inc. | | 10,707 | 338,020 |
| Monster Beverage Corp.(1) | | 19,811 | 1,048,992 |
| PepsiCo, Inc. | | 26,825 | 4,545,228 |
| | | | $ 9,214,364 |
| Biotechnology — 3.3% | |
| AbbVie, Inc. | | 37,567 | $ 5,599,737 |
| Alkermes PLC(1) | | 838 | 23,472 |
| Alnylam Pharmaceuticals, Inc.(1) | | 2,868 | 507,923 |
| Amgen, Inc. | | 5,555 | 1,492,962 |
| Biogen, Inc.(1) | | 1,343 | 345,164 |
| BioMarin Pharmaceutical, Inc.(1) | | 4,320 | 382,234 |
| Blueprint Medicines Corp.(1) | | 1,080 | 54,238 |
| Denali Therapeutics, Inc.(1) | | 2,500 | 51,575 |
| Exact Sciences Corp.(1) | | 2,486 | 169,595 |
| Exelixis, Inc.(1) | | 8,005 | 174,909 |
| Security | Shares | Value |
| Biotechnology (continued) | |
| Gilead Sciences, Inc. | | 7,868 | $ 589,628 |
| Halozyme Therapeutics, Inc.(1) | | 3,520 | 134,464 |
| Horizon Therapeutics PLC(1) | | 5,392 | 623,801 |
| Incyte Corp.(1) | | 4,377 | 252,859 |
| Ionis Pharmaceuticals, Inc.(1) | | 361 | 16,375 |
| Moderna, Inc.(1) | | 8,051 | 831,588 |
| Neurocrine Biosciences, Inc.(1) | | 2,457 | 276,413 |
| Regeneron Pharmaceuticals, Inc.(1) | | 2,423 | 1,994,032 |
| Sarepta Therapeutics, Inc.(1) | | 1,492 | 180,860 |
| Seagen, Inc.(1) | | 2,068 | 438,726 |
| United Therapeutics Corp.(1) | | 723 | 163,304 |
| Vertex Pharmaceuticals, Inc.(1) | | 6,049 | 2,103,479 |
| | | | $ 16,407,338 |
| Broadline Retail — 4.5% | |
| Amazon.com, Inc.(1) | | 169,790 | $ 21,583,705 |
| eBay, Inc. | | 10,461 | 461,226 |
| Etsy, Inc.(1) | | 2,461 | 158,931 |
| | | | $ 22,203,862 |
| Building Products — 0.8% | |
| A.O. Smith Corp. | | 3,163 | $ 209,169 |
| AAON, Inc. | | 1,710 | 97,248 |
| Advanced Drainage Systems, Inc. | | 1,665 | 189,527 |
| Allegion PLC | | 2,115 | 220,383 |
| AZEK Co., Inc. (The)(1) | | 2,377 | 70,692 |
| Carlisle Cos., Inc. | | 1,487 | 385,520 |
| Carrier Global Corp. | | 7,330 | 404,616 |
| Fortune Brands Innovations, Inc. | | 417 | 25,921 |
| Johnson Controls International PLC | | 17,995 | 957,514 |
| Lennox International, Inc. | | 876 | 328,009 |
| Masco Corp. | | 2,743 | 146,613 |
| Simpson Manufacturing Co., Inc. | | 1,052 | 157,600 |
| Trane Technologies PLC | | 3,114 | 631,862 |
| Trex Co., Inc.(1) | | 2,398 | 147,789 |
| UFP Industries, Inc. | | 250 | 25,600 |
| Zurn Elkay Water Solutions Corp., Class C | | 2,528 | 70,834 |
| | | | $ 4,068,897 |
| Capital Markets — 3.3% | |
| Ameriprise Financial, Inc. | | 1,406 | $ 463,530 |
| Ares Management Corp., Class A | | 5,864 | 603,230 |
| BlackRock, Inc. | | 998 | 645,197 |
| Blackstone, Inc. | | 20,103 | 2,153,836 |
| Blue Owl Capital, Inc. | | 16,216 | 210,159 |
| Cboe Global Markets, Inc. | | 3,933 | 614,374 |
| Charles Schwab Corp. (The) | | 11,519 | 632,393 |
| Coinbase Global, Inc., Class A(1) | | 6,403 | 480,737 |
| Evercore, Inc., Class A | | 475 | 65,493 |
| FactSet Research Systems, Inc. | | 796 | 348,059 |
| Hamilton Lane, Inc., Class A | | 720 | 65,117 |
7
See Notes to Financial Statements.
Calvert
US Large-Cap Growth Responsible Index Fund
September 30, 2023
Schedule of Investments — continued
| Security | Shares | Value |
| Capital Markets (continued) | |
| Houlihan Lokey, Inc. | | 1,418 | $ 151,896 |
| Interactive Brokers Group, Inc., Class A | | 1,107 | 95,822 |
| Intercontinental Exchange, Inc. | | 15,618 | 1,718,292 |
| KKR & Co., Inc. | | 24,207 | 1,491,151 |
| LPL Financial Holdings, Inc. | | 2,520 | 598,878 |
| MarketAxess Holdings, Inc. | | 782 | 167,067 |
| Moody's Corp. | | 3,426 | 1,083,198 |
| Morningstar, Inc. | | 576 | 134,922 |
| MSCI, Inc. | | 1,645 | 844,017 |
| Nasdaq, Inc. | | 8,745 | 424,920 |
| S&P Global, Inc. | | 6,859 | 2,506,347 |
| SEI Investments Co. | | 4,109 | 247,485 |
| T. Rowe Price Group, Inc. | | 1,820 | 190,863 |
| Tradeweb Markets, Inc., Class A | | 3,708 | 297,382 |
| | | | $ 16,234,365 |
| Chemicals — 0.9% | |
| Air Products & Chemicals, Inc. | | 3,956 | $ 1,121,130 |
| Ashland, Inc. | | 653 | 53,337 |
| Axalta Coating Systems, Ltd.(1) | | 3,331 | 89,604 |
| Balchem Corp. | | 815 | 101,093 |
| Ecolab, Inc. | | 4,062 | 688,103 |
| Element Solutions, Inc. | | 4,100 | 80,401 |
| FMC Corp. | | 1,272 | 85,186 |
| International Flavors & Fragrances, Inc. | | 1,078 | 73,487 |
| Livent Corp.(1) | | 4,824 | 88,810 |
| PPG Industries, Inc. | | 2,559 | 332,158 |
| Sherwin-Williams Co. (The) | | 5,798 | 1,478,780 |
| | | | $ 4,192,089 |
| Commercial Services & Supplies — 0.8% | |
| Casella Waste Systems, Inc., Class A(1) | | 1,063 | $ 81,107 |
| Cintas Corp. | | 1,668 | 802,325 |
| Clean Harbors, Inc.(1) | | 724 | 121,169 |
| Copart, Inc.(1) | | 18,120 | 780,791 |
| MSA Safety, Inc. | | 1,082 | 170,577 |
| Republic Services, Inc. | | 3,138 | 447,196 |
| Rollins, Inc. | | 5,163 | 192,735 |
| Stericycle, Inc.(1) | | 435 | 19,449 |
| Tetra Tech, Inc. | | 815 | 123,904 |
| Waste Management, Inc. | | 6,541 | 997,110 |
| | | | $ 3,736,363 |
| Communications Equipment — 0.9% | |
| Arista Networks, Inc.(1) | | 5,119 | $ 941,538 |
| Ciena Corp.(1) | | 2,975 | 140,598 |
| Cisco Systems, Inc. | | 40,780 | 2,192,333 |
| F5, Inc.(1) | | 1,213 | 195,463 |
| Juniper Networks, Inc. | | 1,587 | 44,103 |
| Lumentum Holdings, Inc.(1) | | 1,397 | 63,116 |
| Motorola Solutions, Inc. | | 3,354 | 913,093 |
| Security | Shares | Value |
| Communications Equipment (continued) | |
| Viasat, Inc.(1) | | 171 | $ 3,157 |
| | | | $ 4,493,401 |
| Construction & Engineering — 0.2% | |
| AECOM | | 671 | $ 55,720 |
| Comfort Systems USA, Inc. | | 696 | 118,605 |
| EMCOR Group, Inc. | | 284 | 59,751 |
| MasTec, Inc.(1) | | 680 | 48,940 |
| Quanta Services, Inc. | | 3,033 | 567,383 |
| Valmont Industries, Inc. | | 276 | 66,298 |
| WillScot Mobile Mini Holdings Corp.(1) | | 3,816 | 158,707 |
| | | | $ 1,075,404 |
| Construction Materials — 0.2% | |
| Summit Materials, Inc., Class A(1) | | 745 | $ 23,199 |
| Vulcan Materials Co. | | 5,932 | 1,198,383 |
| | | | $ 1,221,582 |
| Consumer Finance — 0.3% | |
| American Express Co. | | 8,543 | $ 1,274,530 |
| Credit Acceptance Corp.(1) | | 194 | 89,263 |
| FirstCash Holdings, Inc. | | 565 | 56,715 |
| SoFi Technologies, Inc.(1)(3) | | 8,773 | 70,096 |
| | | | $ 1,490,604 |
| Consumer Staples Distribution & Retail — 1.2% | |
| BJ's Wholesale Club Holdings, Inc.(1) | | 250 | $ 17,842 |
| Casey's General Stores, Inc. | | 121 | 32,854 |
| Costco Wholesale Corp. | | 7,386 | 4,172,795 |
| Dollar General Corp. | | 2,459 | 260,162 |
| Dollar Tree, Inc.(1) | | 1,948 | 207,365 |
| Sprouts Farmers Market, Inc.(1) | | 955 | 40,874 |
| Target Corp. | | 951 | 105,152 |
| Walmart, Inc. | | 7,471 | 1,194,837 |
| | | | $ 6,031,881 |
| Containers & Packaging — 0.2% | |
| AptarGroup, Inc. | | 1,062 | $ 132,793 |
| Avery Dennison Corp. | | 1,038 | 189,611 |
| Ball Corp. | | 6,436 | 320,384 |
| Crown Holdings, Inc. | | 137 | 12,122 |
| Graphic Packaging Holding Co. | | 1,323 | 29,476 |
| Sealed Air Corp. | | 1,599 | 52,543 |
| Silgan Holdings, Inc. | | 725 | 31,255 |
| | | | $ 768,184 |
| Distributors — 0.1% | |
| Genuine Parts Co. | | 464 | $ 66,992 |
| Pool Corp. | | 731 | 260,309 |
| | | | $ 327,301 |
8
See Notes to Financial Statements.
Calvert
US Large-Cap Growth Responsible Index Fund
September 30, 2023
Schedule of Investments — continued
| Security | Shares | Value |
| Diversified Consumer Services — 0.1% | |
| Bright Horizons Family Solutions, Inc.(1) | | 1,078 | $ 87,814 |
| Duolingo, Inc.(1) | | 501 | 83,101 |
| H&R Block, Inc. | | 3,168 | 136,414 |
| Service Corp. International | | 2,132 | 121,822 |
| | | | $ 429,151 |
| Diversified Telecommunication Services — 0.0%(2) | |
| Iridium Communications, Inc. | | 2,577 | $ 117,228 |
| | | | $ 117,228 |
| Electric Utilities — 0.3% | |
| Constellation Energy Corp. | | 2,576 | $ 280,990 |
| NextEra Energy, Inc. | | 14,556 | 833,913 |
| NRG Energy, Inc. | | 4,702 | 181,121 |
| PNM Resources, Inc. | | 745 | 33,234 |
| Xcel Energy, Inc. | | 294 | 16,823 |
| | | | $ 1,346,081 |
| Electrical Equipment — 0.9% | |
| Acuity Brands, Inc. | | 158 | $ 26,909 |
| AMETEK, Inc. | | 5,282 | 780,468 |
| Atkore, Inc.(1) | | 1,102 | 164,407 |
| Eaton Corp. PLC | | 5,388 | 1,149,153 |
| Emerson Electric Co. | | 6,620 | 639,294 |
| EnerSys | | 580 | 54,909 |
| Generac Holdings, Inc.(1) | | 1,574 | 171,503 |
| Hubbell, Inc. | | 1,008 | 315,917 |
| nVent Electric PLC | | 1,782 | 94,428 |
| Plug Power, Inc.(1)(3) | | 2,000 | 15,200 |
| Regal Rexnord Corp. | | 548 | 78,298 |
| Rockwell Automation, Inc. | | 2,315 | 661,789 |
| Sensata Technologies Holding PLC | | 956 | 36,156 |
| | | | $ 4,188,431 |
| Electronic Equipment, Instruments & Components — 0.9% | |
| Advanced Energy Industries, Inc. | | 947 | $ 97,655 |
| Amphenol Corp., Class A | | 15,115 | 1,269,509 |
| Badger Meter, Inc. | | 744 | 107,039 |
| Belden, Inc. | | 520 | 50,206 |
| CDW Corp. | | 1,689 | 340,773 |
| Cognex Corp. | | 4,833 | 205,112 |
| Coherent Corp.(1) | | 1,798 | 58,687 |
| Corning, Inc. | | 6,269 | 191,016 |
| Insight Enterprises, Inc.(1) | | 170 | 24,735 |
| IPG Photonics Corp.(1) | | 584 | 59,299 |
| Jabil, Inc. | | 420 | 53,294 |
| Keysight Technologies, Inc.(1) | | 4,441 | 587,589 |
| Littelfuse, Inc. | | 572 | 141,467 |
| National Instruments Corp. | | 2,197 | 130,985 |
| Novanta, Inc.(1) | | 956 | 137,129 |
| Security | Shares | Value |
| Electronic Equipment, Instruments & Components (continued) | |
| Teledyne Technologies, Inc.(1) | | 770 | $ 314,607 |
| Trimble, Inc.(1) | | 4,285 | 230,790 |
| Zebra Technologies Corp., Class A(1) | | 1,018 | 240,787 |
| | | | $ 4,240,679 |
| Entertainment — 1.3% | |
| AMC Entertainment Holdings, Inc., Class A(1)(3) | | 358 | $ 2,860 |
| Atlanta Braves Holdings, Inc., Class C(1) | | 63 | 2,251 |
| Electronic Arts, Inc. | | 4,822 | 580,569 |
| Liberty Media Corp.-Liberty Formula One, Class A(1) | | 2,195 | 124,105 |
| Liberty Media Corp.-Liberty Live, Class A(1) | | 93 | 2,969 |
| Live Nation Entertainment, Inc.(1) | | 2,663 | 221,136 |
| Madison Square Garden Sports Corp. | | 265 | 46,720 |
| Netflix, Inc.(1) | | 8,832 | 3,334,963 |
| ROBLOX Corp., Class A(1)(3) | | 8,648 | 250,446 |
| Roku, Inc.(1) | | 2,458 | 173,510 |
| Take-Two Interactive Software, Inc.(1) | | 1,669 | 234,311 |
| Walt Disney Co. (The)(1) | | 18,746 | 1,519,363 |
| Warner Music Group Corp., Class A | | 1,813 | 56,928 |
| | | | $ 6,550,131 |
| Financial Services — 3.7% | |
| Affirm Holdings, Inc.(1) | | 4,214 | $ 89,632 |
| Block, Inc., Class A(1) | | 10,743 | 475,485 |
| Euronet Worldwide, Inc.(1) | | 500 | 39,690 |
| Fiserv, Inc.(1) | | 11,560 | 1,305,818 |
| Jack Henry & Associates, Inc. | | 1,405 | 212,352 |
| Mastercard, Inc., Class A | | 17,037 | 6,745,119 |
| PayPal Holdings, Inc.(1) | | 22,320 | 1,304,827 |
| Shift4 Payments, Inc., Class A(1) | | 1,117 | 61,848 |
| Toast, Inc., Class A(1)(3) | | 6,377 | 119,441 |
| Visa, Inc., Class A | | 32,316 | 7,433,003 |
| WEX, Inc.(1) | | 972 | 182,823 |
| | | | $ 17,970,038 |
| Food Products — 0.7% | |
| Campbell Soup Co. | | 1,425 | $ 58,539 |
| Darling Ingredients, Inc.(1) | | 3,552 | 185,415 |
| Flowers Foods, Inc. | | 1,300 | 28,834 |
| General Mills, Inc. | | 4,684 | 299,729 |
| Hershey Co. (The) | | 3,964 | 793,117 |
| Hormel Foods Corp. | | 1,507 | 57,311 |
| JM Smucker Co. (The) | | 340 | 41,789 |
| Kellogg Co. | | 2,458 | 146,276 |
| Lamb Weston Holdings, Inc. | | 3,043 | 281,356 |
| Lancaster Colony Corp. | | 423 | 69,808 |
| McCormick & Co., Inc. | | 3,730 | 282,137 |
| Mondelez International, Inc., Class A | | 14,650 | 1,016,710 |
| Simply Good Foods Co. (The)(1) | | 2,462 | 84,988 |
| | | | $ 3,346,009 |
9
See Notes to Financial Statements.
Calvert
US Large-Cap Growth Responsible Index Fund
September 30, 2023
Schedule of Investments — continued
| Security | Shares | Value |
| Gas Utilities — 0.0%(2) | |
| Southwest Gas Holdings, Inc. | | 615 | $ 37,152 |
| UGI Corp. | | 3,344 | 76,912 |
| | | | $ 114,064 |
| Ground Transportation — 0.6% | |
| J.B. Hunt Transport Services, Inc. | | 1,386 | $ 261,289 |
| Landstar System, Inc. | | 809 | 143,144 |
| Old Dominion Freight Line, Inc. | | 1,898 | 776,548 |
| Saia, Inc.(1) | | 587 | 234,007 |
| Union Pacific Corp. | | 7,165 | 1,459,009 |
| | | | $ 2,873,997 |
| Health Care Equipment & Supplies — 4.1% | |
| Abbott Laboratories | | 34,381 | $ 3,329,800 |
| Align Technology, Inc.(1) | | 1,712 | 522,708 |
| Baxter International, Inc. | | 11,095 | 418,725 |
| Becton Dickinson and Co. | | 5,747 | 1,485,772 |
| Boston Scientific Corp.(1) | | 34,136 | 1,802,381 |
| CONMED Corp. | | 461 | 46,492 |
| Cooper Cos., Inc. (The) | | 1,182 | 375,888 |
| DENTSPLY SIRONA, Inc. | | 2,845 | 97,185 |
| DexCom, Inc.(1) | | 8,887 | 829,157 |
| Edwards Lifesciences Corp.(1) | | 13,940 | 965,763 |
| Envista Holdings Corp.(1) | | 233 | 6,496 |
| GE HealthCare Technologies, Inc. | | 9,175 | 624,267 |
| Globus Medical, Inc., Class A(1) | | 1,635 | 81,178 |
| Haemonetics Corp.(1) | | 1,167 | 104,540 |
| Hologic, Inc.(1) | | 5,741 | 398,425 |
| ICU Medical, Inc.(1) | | 253 | 30,110 |
| IDEXX Laboratories, Inc.(1) | | 1,971 | 861,859 |
| Inari Medical, Inc.(1) | | 1,128 | 73,771 |
| Inspire Medical Systems, Inc.(1) | | 699 | 138,710 |
| Insulet Corp.(1) | | 1,642 | 261,883 |
| Intuitive Surgical, Inc.(1) | | 8,136 | 2,378,071 |
| Lantheus Holdings, Inc.(1) | | 1,549 | 107,625 |
| Masimo Corp.(1) | | 1,127 | 98,815 |
| Medtronic PLC | | 7,708 | 603,999 |
| Merit Medical Systems, Inc.(1) | | 1,308 | 90,278 |
| Neogen Corp.(1) | | 2,495 | 46,257 |
| Novocure, Ltd.(1) | | 1,190 | 19,218 |
| Penumbra, Inc.(1) | | 762 | 184,335 |
| QuidelOrtho Corp.(1) | | 1,125 | 82,170 |
| ResMed, Inc. | | 3,424 | 506,307 |
| Shockwave Medical, Inc.(1) | | 879 | 175,009 |
| STERIS PLC | | 2,330 | 511,249 |
| Stryker Corp. | | 7,976 | 2,179,602 |
| Teleflex, Inc. | | 891 | 175,001 |
| Zimmer Biomet Holdings, Inc. | | 4,950 | 555,489 |
| | | | $ 20,168,535 |
| Security | Shares | Value |
| Health Care Providers & Services — 0.5% | |
| AMN Healthcare Services, Inc.(1) | | 892 | $ 75,980 |
| Chemed Corp. | | 371 | 192,809 |
| DaVita, Inc.(1) | | 535 | 50,573 |
| Elevance Health, Inc. | | 1,045 | 455,014 |
| Encompass Health Corp. | | 400 | 26,864 |
| Ensign Group, Inc. (The) | | 949 | 88,190 |
| HealthEquity, Inc.(1) | | 1,556 | 113,666 |
| Henry Schein, Inc.(1) | | 1,040 | 77,220 |
| Humana, Inc. | | 953 | 463,653 |
| Laboratory Corp. of America Holdings | | 955 | 192,003 |
| Molina Healthcare, Inc.(1) | | 694 | 227,556 |
| Option Care Health, Inc.(1) | | 2,779 | 89,901 |
| Progyny, Inc.(1) | | 1,785 | 60,726 |
| Quest Diagnostics, Inc. | | 1,058 | 128,928 |
| R1 RCM, Inc.(1) | | 3,198 | 48,194 |
| | | | $ 2,291,277 |
| Health Care Technology — 0.1% | |
| Doximity, Inc., Class A(1) | | 2,138 | $ 45,368 |
| Veeva Systems, Inc., Class A(1) | | 2,946 | 599,364 |
| | | | $ 644,732 |
| Hotels, Restaurants & Leisure — 2.3% | |
| Airbnb, Inc., Class A(1) | | 8,254 | $ 1,132,531 |
| Aramark | | 2,112 | 73,286 |
| Booking Holdings, Inc.(1) | | 719 | 2,217,360 |
| Chipotle Mexican Grill, Inc.(1) | | 726 | 1,329,909 |
| Choice Hotels International, Inc.(3) | | 632 | 77,426 |
| Darden Restaurants, Inc. | | 1,031 | 147,660 |
| Domino's Pizza, Inc. | | 891 | 337,502 |
| Expedia Group, Inc.(1) | | 2,926 | 301,583 |
| Hilton Grand Vacations, Inc.(1) | | 600 | 24,420 |
| Hilton Worldwide Holdings, Inc. | | 5,599 | 840,858 |
| Hyatt Hotels Corp., Class A | | 134 | 14,215 |
| Marriott International, Inc., Class A | | 4,474 | 879,409 |
| Marriott Vacations Worldwide Corp. | | 193 | 19,422 |
| Planet Fitness, Inc., Class A(1) | | 1,831 | 90,049 |
| Starbucks Corp. | | 26,092 | 2,381,417 |
| Texas Roadhouse, Inc. | | 1,282 | 123,200 |
| Vail Resorts, Inc. | | 324 | 71,892 |
| Wendy's Co. (The) | | 2,270 | 46,331 |
| Wingstop, Inc. | | 750 | 134,880 |
| Wyndham Hotels & Resorts, Inc. | | 992 | 68,984 |
| Yum! Brands, Inc. | | 7,526 | 940,298 |
| | | | $ 11,252,632 |
| Household Durables — 0.2% | |
| D.R. Horton, Inc. | | 1,811 | $ 194,628 |
| NVR, Inc.(1) | | 69 | 411,468 |
| Tempur Sealy International, Inc. | | 2,854 | 123,692 |
10
See Notes to Financial Statements.
Calvert
US Large-Cap Growth Responsible Index Fund
September 30, 2023
Schedule of Investments — continued
| Security | Shares | Value |
| Household Durables (continued) | |
| TopBuild Corp.(1) | | 491 | $ 123,536 |
| Whirlpool Corp. | | 265 | 35,430 |
| | | | $ 888,754 |
| Household Products — 1.5% | |
| Church & Dwight Co., Inc. | | 4,561 | $ 417,925 |
| Clorox Co. (The) | | 2,311 | 302,880 |
| Colgate-Palmolive Co. | | 15,322 | 1,089,547 |
| Kimberly-Clark Corp. | | 2,892 | 349,498 |
| Procter & Gamble Co. (The) | | 36,307 | 5,295,739 |
| | | | $ 7,455,589 |
| Independent Power and Renewable Electricity Producers — 0.0%(2) | |
| AES Corp. (The) | | 8,622 | $ 131,054 |
| Ormat Technologies, Inc.(3) | | 888 | 62,089 |
| | | | $ 193,143 |
| Insurance — 2.2% | |
| Allstate Corp. (The) | | 5,292 | $ 589,582 |
| Arch Capital Group, Ltd.(1) | | 5,499 | 438,325 |
| Assurant, Inc. | | 150 | 21,537 |
| Brown & Brown, Inc. | | 3,780 | 263,995 |
| Cincinnati Financial Corp. | | 5,765 | 589,702 |
| Erie Indemnity Co., Class A | | 718 | 210,941 |
| Everest Group, Ltd. | | 695 | 258,311 |
| Globe Life, Inc. | | 600 | 65,238 |
| Kinsale Capital Group, Inc. | | 822 | 340,415 |
| Markel Group, Inc.(1) | | 489 | 720,048 |
| Marsh & McLennan Cos., Inc. | | 11,963 | 2,276,559 |
| Primerica, Inc. | | 612 | 118,734 |
| Progressive Corp. (The) | | 16,591 | 2,311,126 |
| Prudential Financial, Inc. | | 13,620 | 1,292,402 |
| RenaissanceRe Holdings, Ltd. | | 655 | 129,638 |
| RLI Corp. | | 1,197 | 162,660 |
| Ryan Specialty Holdings, Inc.(1) | | 3,471 | 167,996 |
| Selective Insurance Group, Inc. | | 778 | 80,266 |
| W.R. Berkley Corp. | | 1,801 | 114,345 |
| White Mountains Insurance Group, Ltd. | | 94 | 140,595 |
| Willis Towers Watson PLC | | 1,287 | 268,932 |
| | | | $ 10,561,347 |
| Interactive Media & Services — 5.6% | |
| Alphabet, Inc., Class A(1) | | 205,932 | $ 26,948,262 |
| Pinterest, Inc., Class A(1) | | 11,300 | 305,439 |
| Snap, Inc., Class A(1) | | 15,984 | 142,417 |
| ZoomInfo Technologies, Inc.(1) | | 6,036 | 98,990 |
| | | | $ 27,495,108 |
| IT Services — 2.2% | |
| Accenture PLC, Class A | | 13,466 | $ 4,135,543 |
| Security | Shares | Value |
| IT Services (continued) | |
| Akamai Technologies, Inc.(1) | | 3,049 | $ 324,841 |
| Amdocs, Ltd. | | 1,312 | 110,851 |
| Cloudflare, Inc., Class A(1) | | 5,574 | 351,385 |
| Cognizant Technology Solutions Corp., Class A | | 2,334 | 158,105 |
| EPAM Systems, Inc.(1) | | 1,095 | 279,981 |
| Gartner, Inc.(1) | | 1,675 | 575,547 |
| International Business Machines Corp. | | 18,645 | 2,615,894 |
| MongoDB, Inc.(1) | | 1,204 | 416,415 |
| Okta, Inc.(1) | | 2,859 | 233,037 |
| Snowflake, Inc., Class A(1) | | 6,031 | 921,356 |
| Twilio, Inc., Class A(1) | | 3,329 | 194,846 |
| VeriSign, Inc.(1) | | 1,908 | 386,427 |
| | | | $ 10,704,228 |
| Leisure Products — 0.1% | |
| Brunswick Corp. | | 1,515 | $ 119,685 |
| Hasbro, Inc. | | 2,401 | 158,802 |
| Mattel, Inc.(1) | | 4,942 | 108,872 |
| | | | $ 387,359 |
| Life Sciences Tools & Services — 2.5% | |
| Agilent Technologies, Inc. | | 6,858 | $ 766,861 |
| Avantor, Inc.(1) | | 7,382 | 155,613 |
| Bio-Techne Corp. | | 3,820 | 260,027 |
| Bruker Corp. | | 2,462 | 153,383 |
| Charles River Laboratories International, Inc.(1) | | 846 | 165,799 |
| Danaher Corp. | | 14,895 | 3,695,449 |
| Fortrea Holdings, Inc.(1) | | 955 | 27,303 |
| Illumina, Inc.(1) | | 733 | 100,626 |
| IQVIA Holdings, Inc.(1) | | 4,265 | 839,139 |
| Medpace Holdings, Inc.(1) | | 574 | 138,983 |
| Mettler-Toledo International, Inc.(1) | | 515 | 570,656 |
| Repligen Corp.(1) | | 1,210 | 192,402 |
| Revvity, Inc. | | 424 | 46,937 |
| Thermo Fisher Scientific, Inc. | | 8,402 | 4,252,840 |
| Waters Corp.(1) | | 1,403 | 384,717 |
| West Pharmaceutical Services, Inc. | | 1,722 | 646,112 |
| | | | $ 12,396,847 |
| Machinery — 2.2% | |
| AGCO Corp. | | 245 | $ 28,979 |
| Allison Transmission Holdings, Inc. | | 485 | 28,644 |
| Caterpillar, Inc. | | 5,085 | 1,388,205 |
| Chart Industries, Inc.(1)(3) | | 615 | 104,009 |
| Deere & Co. | | 3,761 | 1,419,326 |
| Donaldson Co., Inc. | | 2,255 | 134,488 |
| Dover Corp. | | 1,928 | 268,975 |
| Esab Corp. | | 1,000 | 70,220 |
| Fortive Corp. | | 4,714 | 349,590 |
| Franklin Electric Co., Inc. | | 919 | 82,002 |
| Graco, Inc. | | 4,337 | 316,081 |
11
See Notes to Financial Statements.
Calvert
US Large-Cap Growth Responsible Index Fund
September 30, 2023
Schedule of Investments — continued
| Security | Shares | Value |
| Machinery (continued) | |
| IDEX Corp. | | 1,703 | $ 354,258 |
| Illinois Tool Works, Inc. | | 7,127 | 1,641,419 |
| Ingersoll Rand, Inc. | | 9,881 | 629,617 |
| ITT, Inc. | | 822 | 80,482 |
| Lincoln Electric Holdings, Inc. | | 1,346 | 244,689 |
| Middleby Corp. (The)(1) | | 458 | 58,624 |
| Mueller Industries, Inc. | | 213 | 16,009 |
| Nordson Corp. | | 1,194 | 266,465 |
| Otis Worldwide Corp. | | 9,021 | 724,477 |
| PACCAR, Inc. | | 775 | 65,891 |
| Parker-Hannifin Corp. | | 2,683 | 1,045,082 |
| Pentair PLC | | 2,784 | 180,264 |
| Snap-on, Inc. | | 475 | 121,154 |
| SPX Technologies, Inc.(1) | | 1,118 | 91,005 |
| Timken Co. (The) | | 340 | 24,987 |
| Toro Co. (The) | | 2,775 | 230,602 |
| Watts Water Technologies, Inc., Class A | | 407 | 70,338 |
| Westinghouse Air Brake Technologies Corp. | | 1,234 | 131,137 |
| Xylem, Inc. | | 4,817 | 438,492 |
| | | | $ 10,605,511 |
| Media — 0.6% | |
| Cable One, Inc. | | 57 | $ 35,092 |
| Charter Communications, Inc., Class A(1) | | 537 | 236,183 |
| Comcast Corp., Class A | | 41,056 | 1,820,423 |
| Interpublic Group of Cos., Inc. (The) | | 705 | 20,205 |
| Liberty Broadband Corp., Class C(1) | | 2,862 | 261,358 |
| New York Times Co. (The), Class A | | 2,068 | 85,202 |
| Sirius XM Holdings, Inc.(3) | | 5,224 | 23,612 |
| Trade Desk, Inc. (The), Class A(1) | | 8,594 | 671,621 |
| | | | $ 3,153,696 |
| Metals & Mining — 0.2% | |
| ATI, Inc.(1) | | 3,159 | $ 129,993 |
| Nucor Corp. | | 3,178 | 496,880 |
| Reliance Steel & Aluminum Co. | | 300 | 78,669 |
| Steel Dynamics, Inc. | | 1,694 | 181,631 |
| | | | $ 887,173 |
| Multi-Utilities — 0.0%(2) | |
| Ameren Corp. | | 250 | $ 18,708 |
| CMS Energy Corp. | | 939 | 49,870 |
| Dominion Energy, Inc. | | 2,693 | 120,296 |
| WEC Energy Group, Inc. | | 306 | 24,648 |
| | | | $ 213,522 |
| Oil, Gas & Consumable Fuels — 0.1% | |
| Denbury, Inc.(1) | | 2,708 | $ 265,411 |
| | | | $ 265,411 |
| Security | Shares | Value |
| Paper & Forest Products — 0.0%(2) | |
| Louisiana-Pacific Corp. | | 1,281 | $ 70,801 |
| | | | $ 70,801 |
| Passenger Airlines — 0.0%(2) | |
| Alaska Air Group, Inc.(1) | | 2,600 | $ 96,408 |
| Southwest Airlines Co. | | 3,260 | 88,248 |
| | | | $ 184,656 |
| Personal Care Products — 0.2% | |
| BellRing Brands, Inc.(1) | | 2,380 | $ 98,127 |
| Coty, Inc., Class A(1) | | 3,419 | 37,507 |
| e.l.f. Beauty, Inc.(1) | | 965 | 105,986 |
| Estee Lauder Cos., Inc. (The), Class A | | 4,455 | 643,970 |
| | | | $ 885,590 |
| Pharmaceuticals — 3.7% | |
| Bristol-Myers Squibb Co. | | 37,597 | $ 2,182,130 |
| Catalent, Inc.(1) | | 162 | 7,376 |
| Eli Lilly & Co. | | 16,818 | 9,033,452 |
| Jazz Pharmaceuticals PLC(1) | | 1,393 | 180,310 |
| Merck & Co., Inc. | | 43,430 | 4,471,119 |
| Royalty Pharma PLC, Class A | | 8,582 | 232,915 |
| Zoetis, Inc. | | 10,892 | 1,894,990 |
| | | | $ 18,002,292 |
| Professional Services — 1.2% | |
| Alight, Inc., Class A(1) | | 2,650 | $ 18,788 |
| Automatic Data Processing, Inc. | | 5,679 | 1,366,254 |
| Booz Allen Hamilton Holding Corp. | | 2,651 | 289,675 |
| Broadridge Financial Solutions, Inc. | | 1,985 | 355,414 |
| Ceridian HCM Holding, Inc.(1) | | 2,634 | 178,717 |
| CoStar Group, Inc.(1) | | 8,857 | 681,015 |
| Dun & Bradstreet Holdings, Inc. | | 644 | 6,434 |
| Equifax, Inc. | | 2,566 | 470,040 |
| Exlservice Holdings, Inc.(1) | | 2,950 | 82,718 |
| Exponent, Inc. | | 782 | 66,939 |
| FTI Consulting, Inc.(1) | | 538 | 95,985 |
| Genpact, Ltd. | | 1,702 | 61,612 |
| Insperity, Inc. | | 510 | 49,776 |
| Maximus, Inc. | | 640 | 47,795 |
| Paychex, Inc. | | 4,486 | 517,370 |
| Paycom Software, Inc. | | 1,071 | 277,678 |
| Paylocity Holding Corp.(1) | | 886 | 160,986 |
| Robert Half, Inc. | | 652 | 47,779 |
| Science Applications International Corp. | | 290 | 30,607 |
| SS&C Technologies Holdings, Inc. | | 2,502 | 131,455 |
| TransUnion | | 3,919 | 281,345 |
| TriNet Group, Inc.(1) | | 407 | 47,407 |
| Verisk Analytics, Inc. | | 2,996 | 707,775 |
| | | | $ 5,973,564 |
12
See Notes to Financial Statements.
Calvert
US Large-Cap Growth Responsible Index Fund
September 30, 2023
Schedule of Investments — continued
| Security | Shares | Value |
| Real Estate Management & Development — 0.0%(2) | |
| CBRE Group, Inc., Class A(1) | | 2,767 | $ 204,371 |
| Zillow Group, Inc., Class C(1) | | 496 | 22,895 |
| | | | $ 227,266 |
| Semiconductors & Semiconductor Equipment — 10.1% | |
| Advanced Micro Devices, Inc.(1) | | 32,722 | $ 3,364,476 |
| Allegro MicroSystems, Inc.(1) | | 1,799 | 57,460 |
| Analog Devices, Inc. | | 7,803 | 1,366,227 |
| Applied Materials, Inc. | | 16,790 | 2,324,575 |
| Broadcom, Inc. | | 8,201 | 6,811,587 |
| Cirrus Logic, Inc.(1) | | 1,246 | 92,154 |
| Diodes, Inc.(1) | | 753 | 59,367 |
| Enphase Energy, Inc.(1) | | 2,598 | 312,150 |
| Entegris, Inc. | | 2,984 | 280,227 |
| First Solar, Inc.(1) | | 1,968 | 318,009 |
| Intel Corp. | | 6,830 | 242,806 |
| KLA Corp. | | 2,777 | 1,273,699 |
| Lam Research Corp. | | 2,690 | 1,686,011 |
| Lattice Semiconductor Corp.(1) | | 2,826 | 242,838 |
| Marvell Technology, Inc. | | 17,597 | 952,526 |
| Microchip Technology, Inc. | | 11,068 | 863,857 |
| Micron Technology, Inc. | | 21,259 | 1,446,250 |
| MKS Instruments, Inc. | | 934 | 80,828 |
| Monolithic Power Systems, Inc. | | 874 | 403,788 |
| NVIDIA Corp. | | 44,860 | 19,513,651 |
| ON Semiconductor Corp.(1) | | 8,495 | 789,610 |
| Onto Innovation, Inc.(1) | | 1,003 | 127,903 |
| Power Integrations, Inc. | | 1,263 | 96,380 |
| Qorvo, Inc.(1) | | 2,161 | 206,311 |
| QUALCOMM, Inc. | | 22,669 | 2,517,619 |
| Rambus, Inc.(1) | | 2,137 | 119,223 |
| Silicon Laboratories, Inc.(1) | | 721 | 83,557 |
| Skyworks Solutions, Inc. | | 2,567 | 253,081 |
| SolarEdge Technologies, Inc.(1) | | 1,048 | 135,726 |
| Teradyne, Inc. | | 3,089 | 310,321 |
| Texas Instruments, Inc. | | 18,361 | 2,919,583 |
| Universal Display Corp. | | 1,049 | 164,683 |
| Wolfspeed, Inc.(1)(3) | | 600 | 22,860 |
| | | | $ 49,439,343 |
| Software — 15.3% | |
| Adobe, Inc.(1) | | 9,201 | $ 4,691,590 |
| Altair Engineering, Inc., Class A(1) | | 850 | 53,176 |
| ANSYS, Inc.(1) | | 1,655 | 492,445 |
| AppFolio, Inc., Class A(1) | | 332 | 60,633 |
| AppLovin Corp., Class A(1) | | 2,467 | 98,581 |
| Atlassian Corp., Class A(1) | | 981 | 197,681 |
| Autodesk, Inc.(1) | | 4,442 | 919,094 |
| Bill Holdings, Inc.(1) | | 1,997 | 216,814 |
| Box, Inc., Class A(1) | | 2,766 | 66,965 |
| Security | Shares | Value |
| Software (continued) | |
| Cadence Design Systems, Inc.(1) | | 5,503 | $ 1,289,353 |
| Confluent, Inc., Class A(1) | | 4,075 | 120,661 |
| CrowdStrike Holdings, Inc., Class A(1) | | 4,339 | 726,262 |
| Datadog, Inc., Class A(1) | | 5,123 | 466,654 |
| DocuSign, Inc.(1) | | 3,812 | 160,104 |
| Dolby Laboratories, Inc., Class A | | 915 | 72,523 |
| Dropbox, Inc., Class A(1) | | 6,106 | 166,266 |
| Dynatrace, Inc.(1) | | 4,701 | 219,678 |
| Elastic NV(1) | | 1,166 | 94,726 |
| Fair Isaac Corp.(1) | | 530 | 460,321 |
| Five9, Inc.(1) | | 1,549 | 99,601 |
| Fortinet, Inc.(1) | | 12,707 | 745,647 |
| Guidewire Software, Inc.(1) | | 1,090 | 98,100 |
| HashiCorp, Inc., Class A(1) | | 2,220 | 50,683 |
| HubSpot, Inc.(1) | | 915 | 450,637 |
| Intuit, Inc. | | 5,516 | 2,818,345 |
| Manhattan Associates, Inc.(1) | | 1,353 | 267,434 |
| Microsoft Corp. | | 135,981 | 42,936,001 |
| New Relic, Inc.(1) | | 640 | 54,797 |
| Oracle Corp. | | 31,949 | 3,384,038 |
| Palo Alto Networks, Inc.(1) | | 6,193 | 1,451,887 |
| PTC, Inc.(1) | | 2,356 | 333,798 |
| Qualys, Inc.(1) | | 765 | 116,701 |
| Roper Technologies, Inc. | | 1,457 | 705,596 |
| Salesforce, Inc.(1) | | 19,243 | 3,902,096 |
| ServiceNow, Inc.(1) | | 4,165 | 2,328,068 |
| Smartsheet, Inc., Class A(1) | | 1,600 | 64,736 |
| Splunk, Inc.(1) | | 1,781 | 260,471 |
| SPS Commerce, Inc.(1) | | 717 | 122,327 |
| Synopsys, Inc.(1) | | 3,069 | 1,408,579 |
| Tenable Holdings, Inc.(1) | | 2,200 | 98,560 |
| Teradata Corp.(1) | | 1,973 | 88,824 |
| Tyler Technologies, Inc.(1) | | 883 | 340,962 |
| VMware, Inc., Class A(1) | | 4,318 | 718,861 |
| Workday, Inc., Class A(1) | | 3,922 | 842,642 |
| Workiva, Inc.(1) | | 619 | 62,729 |
| Zoom Video Communications, Inc., Class A(1) | | 4,367 | 305,428 |
| Zscaler, Inc.(1) | | 1,648 | 256,412 |
| | | | $ 74,887,487 |
| Specialty Retail — 2.9% | |
| AutoZone, Inc.(1) | | 363 | $ 922,016 |
| Bath & Body Works, Inc. | | 1,230 | 41,574 |
| Burlington Stores, Inc.(1) | | 1,216 | 164,525 |
| Chewy, Inc., Class A(1) | | 1,490 | 27,207 |
| Dick's Sporting Goods, Inc. | | 891 | 96,745 |
| Five Below, Inc.(1) | | 1,054 | 169,589 |
| Floor & Decor Holdings, Inc., Class A(1) | | 1,963 | 177,652 |
| GameStop Corp., Class A(1) | | 592 | 9,744 |
| Home Depot, Inc. (The) | | 19,122 | 5,777,904 |
| Lowe's Cos., Inc. | | 11,017 | 2,289,773 |
13
See Notes to Financial Statements.
Calvert
US Large-Cap Growth Responsible Index Fund
September 30, 2023
Schedule of Investments — continued
| Security | Shares | Value |
| Specialty Retail (continued) | |
| O'Reilly Automotive, Inc.(1) | | 1,176 | $ 1,068,819 |
| RH (1)(3) | | 305 | 80,630 |
| Ross Stores, Inc. | | 5,089 | 574,803 |
| TJX Cos., Inc. (The) | | 19,440 | 1,727,827 |
| Tractor Supply Co. | | 2,110 | 428,435 |
| Ulta Beauty, Inc.(1) | | 989 | 395,056 |
| Williams-Sonoma, Inc.(3) | | 664 | 103,186 |
| | | | $ 14,055,485 |
| Technology Hardware, Storage & Peripherals — 10.2% | |
| Apple, Inc. | | 289,316 | $ 49,533,792 |
| Pure Storage, Inc., Class A(1) | | 5,654 | 201,396 |
| Seagate Technology Holdings PLC | | 4,037 | 266,240 |
| Western Digital Corp.(1) | | 2,279 | 103,991 |
| | | | $ 50,105,419 |
| Textiles, Apparel & Luxury Goods — 0.7% | |
| Columbia Sportswear Co. | | 88 | $ 6,521 |
| Crocs, Inc.(1) | | 1,131 | 99,788 |
| Deckers Outdoor Corp.(1) | | 486 | 249,848 |
| lululemon Athletica, Inc.(1) | | 2,126 | 819,807 |
| NIKE, Inc., Class B | | 22,820 | 2,182,048 |
| PVH Corp. | | 43 | 3,290 |
| Skechers USA, Inc., Class A(1) | | 997 | 48,803 |
| Tapestry, Inc. | | 708 | 20,355 |
| VF Corp. | | 6,937 | 122,577 |
| | | | $ 3,553,037 |
| Trading Companies & Distributors — 0.4% | |
| Applied Industrial Technologies, Inc. | | 718 | $ 111,010 |
| Core & Main, Inc., Class A(1) | | 1,000 | 28,850 |
| Fastenal Co. | | 11,069 | 604,810 |
| GATX Corp. | | 340 | 37,002 |
| MSC Industrial Direct Co., Inc., Class A | | 275 | 26,991 |
| SiteOne Landscape Supply, Inc.(1) | | 999 | 163,287 |
| United Rentals, Inc. | | 757 | 336,539 |
| W.W. Grainger, Inc. | | 833 | 576,303 |
| | | | $ 1,884,792 |
| Water Utilities — 0.1% | |
| American Water Works Co., Inc. | | 1,398 | $ 173,115 |
| Essential Utilities, Inc. | | 2,925 | 100,415 |
| | | | $ 273,530 |
| Wireless Telecommunication Services — 0.3% | |
| T-Mobile US, Inc.(1) | | 10,597 | $ 1,484,110 |
| | | | $ 1,484,110 |
Total Common Stocks
(identified cost $359,369,375) | | | $489,287,721 |
| Security | Shares | Value |
| Health Care Equipment & Supplies — 0.0%(2) | |
| Abiomed, Inc., CVR(1)(4)(5) | | 1,143 | $ 1,166 |
Total Rights
(identified cost $1,166) | | | $ 1,166 |
| Short-Term Investments — 0.3% | | | |
| Affiliated Fund — 0.3% |
| Security | Shares | Value |
| Morgan Stanley Institutional Liquidity Funds - Government Portfolio, Institutional Class, 5.27%(6) | | 1,417,922 | $ 1,417,922 |
Total Affiliated Fund
(identified cost $1,417,922) | | | $ 1,417,922 |
| Securities Lending Collateral — 0.0%(2) |
| Security | Shares | Value |
| State Street Navigator Securities Lending Government Money Market Portfolio, 5.36%(7) | | 115,114 | $ 115,114 |
Total Securities Lending Collateral
(identified cost $115,114) | | | $ 115,114 |
Total Short-Term Investments
(identified cost $1,533,036) | | | $ 1,533,036 |
Total Investments — 100.2%
(identified cost $360,903,577) | | | $490,821,923 |
| Other Assets, Less Liabilities — (0.2)% | | | $ (877,843) |
| Net Assets — 100.0% | | | $ 489,944,080 |
| The percentage shown for each investment category in the Schedule of Investments is based on net assets. |
| (1) | Non-income producing security. |
| (2) | Amount is less than 0.05%. |
| (3) | All or a portion of this security was on loan at September 30, 2023. The aggregate market value of securities on loan at September 30, 2023 was $821,026. |
| (4) | For fair value measurement disclosure purposes, security is categorized as Level 3 (see Note 1A). |
| (5) | Restricted security. Total market value of restricted securities amounts to $1,166, which represents less than 0.05% of the net assets of the Fund as of September 30, 2023. |
| (6) | May be deemed to be an affiliated investment company. The rate shown is the annualized seven-day yield as of September 30, 2023. |
| (7) | Represents investment of cash collateral received in connection with securities lending. |
14
See Notes to Financial Statements.
Calvert
US Large-Cap Growth Responsible Index Fund
September 30, 2023
Schedule of Investments — continued
Restricted Securities
| Description | Acquisition Date | Cost |
| Abiomed, Inc., CVR | 12/28/22 | $1,166 |
| Abbreviations: |
| CVR | – Contingent Value Rights |
15
See Notes to Financial Statements.
Calvert
US Large-Cap Growth Responsible Index Fund
September 30, 2023
Statement of Assets and Liabilities
| | September 30, 2023 |
| Assets | |
Investments in securities of unaffiliated issuers, at value (identified cost $359,485,655) - including
$821,026 of securities on loan | $ 489,404,001 |
| Investments in securities of affiliated issuers, at value (identified cost $1,417,922) | 1,417,922 |
| Cash | 24,205 |
| Cash denominated in foreign currency, at value (cost $1,088) | 1,162 |
| Receivable for capital shares sold | 1,291,753 |
| Dividends and interest receivable | 173,877 |
| Dividends receivable - affiliated | 3,113 |
| Securities lending income receivable | 271 |
| Receivable from affiliates | 79,533 |
| Directors' deferred compensation plan | 46,867 |
| Total assets | $492,442,704 |
| Liabilities | |
| Payable for investments purchased | $ 1,478,232 |
| Payable for capital shares redeemed | 587,738 |
| Deposits for securities loaned | 115,114 |
| Payable to affiliates: | |
| Investment advisory fee | 49,872 |
| Administrative fee | 49,961 |
| Distribution and service fees | 16,527 |
| Sub-transfer agency fee | 4,194 |
| Directors' deferred compensation plan | 46,867 |
| Accrued expenses | 150,119 |
| Total liabilities | $ 2,498,624 |
| Net Assets | $489,944,080 |
| Sources of Net Assets | |
| Paid-in capital | $ 378,647,369 |
| Distributable earnings | 111,296,711 |
| Net Assets | $489,944,080 |
| Class A Shares | |
| Net Assets | $ 77,895,399 |
| Shares Outstanding | 1,640,792 |
Net Asset Value and Redemption Price Per Share
(net assets ÷ shares of beneficial interest outstanding) | $ 47.47 |
Maximum Offering Price Per Share
(100 ÷ 95.25 of net asset value per share) | $ 49.84 |
| Class I Shares | |
| Net Assets | $ 354,002,523 |
| Shares Outstanding | 7,380,102 |
Net Asset Value, Offering Price and Redemption Price Per Share
(net assets ÷ shares of beneficial interest outstanding) | $ 47.97 |
16
See Notes to Financial Statements.
Calvert
US Large-Cap Growth Responsible Index Fund
September 30, 2023
Statement of Assets and Liabilities — continued
| | September 30, 2023 |
| Class R6 Shares | |
| Net Assets | $ 58,046,158 |
| Shares Outstanding | 1,211,621 |
Net Asset Value, Offering Price and Redemption Price Per Share
(net assets ÷ shares of beneficial interest outstanding) | $ 47.91 |
| On sales of $50,000 or more, the offering price of Class A shares is reduced. |
17
See Notes to Financial Statements.
Calvert
US Large-Cap Growth Responsible Index Fund
September 30, 2023
| | Year Ended |
| | September 30, 2023 |
| Investment Income | |
| Dividend income (net of foreign taxes withheld of $166) | $ 4,285,382 |
| Dividend income - affiliated issuers | 42,736 |
| Interest income | 453 |
| Securities lending income, net | 18,368 |
| Total investment income | $ 4,346,939 |
| Expenses | |
| Investment advisory fee | $ 531,287 |
| Administrative fee | 531,287 |
| Distribution and service fees: | |
| Class A | 170,792 |
| Directors' fees and expenses | 30,696 |
| Custodian fees | 12,323 |
| Transfer agency fees and expenses | 370,651 |
| Accounting fees | 102,898 |
| Professional fees | 51,569 |
| Registration fees | 78,839 |
| Reports to shareholders | 28,536 |
| Miscellaneous | 43,333 |
| Total expenses | $ 1,952,211 |
| Waiver and/or reimbursement of expenses by affiliates | $ (720,490) |
| Net expenses | $ 1,231,721 |
| Net investment income | $ 3,115,218 |
| Realized and Unrealized Gain (Loss) | |
| Net realized gain (loss): | |
| Investment securities | $ (8,289,940) |
| Foreign currency transactions | 18 |
| Net realized loss | $ (8,289,922) |
| Change in unrealized appreciation (depreciation): | |
| Investment securities | $ 97,688,097 |
| Foreign currency | 74 |
| Net change in unrealized appreciation (depreciation) | $97,688,171 |
| Net realized and unrealized gain | $89,398,249 |
| Net increase in net assets from operations | $92,513,467 |
18
See Notes to Financial Statements.
Calvert
US Large-Cap Growth Responsible Index Fund
September 30, 2023
Statements of Changes in Net Assets
| | Year Ended September 30, |
| | 2023 | 2022 |
| Increase (Decrease) in Net Assets | | |
| From operations: | | |
| Net investment income | $ 3,115,218 | $ 1,743,352 |
| Net realized loss | (8,289,922) | (10,497,557) |
| Net change in unrealized appreciation (depreciation) | 97,688,171 | (65,483,237) |
| Net increase (decrease) in net assets from operations | $ 92,513,467 | $ (74,237,442) |
| Distributions to shareholders: | | |
| Class A | $ (224,890) | $ (970,439) |
| Class I | (1,493,216) | (4,433,200) |
| Class R6 | (316,925) | — |
| Total distributions to shareholders | $ (2,035,031) | $ (5,403,639) |
| Capital share transactions: | | |
| Class A | $ 17,440,106 | $ 10,436,610 |
| Class I | (9,640,339) | 153,430,921 |
| Class R6 | 45,649,488 | 962,024 (1) |
| Net increase in net assets from capital share transactions | $ 53,449,255 | $164,829,555 |
| Net increase in net assets | $143,927,691 | $ 85,188,474 |
| Net Assets | | |
| At beginning of year | $ 346,016,389 | $ 260,827,915 |
| At end of year | $489,944,080 | $346,016,389 |
| (1) | For the period from the commencement of operations, February 1, 2022, to September 30, 2022. |
19
See Notes to Financial Statements.
Calvert
US Large-Cap Growth Responsible Index Fund
September 30, 2023
| | Class A |
| | Year Ended September 30, |
| | 2023 | 2022 | 2021 | 2020 | 2019 |
| Net asset value — Beginning of year | $ 38.18 | $ 49.71 | $ 39.77 | $ 29.65 | $ 29.83 |
| Income (Loss) From Operations | | | | | |
| Net investment income(1) | $ 0.22 | $ 0.16 | $ 0.15 | $ 0.19 | $ 0.20 |
| Net realized and unrealized gain (loss) | 9.20 | (10.79) | 10.49 | 10.39 | 0.96 |
| Total income (loss) from operations | $ 9.42 | $ (10.63) | $ 10.64 | $ 10.58 | $ 1.16 |
| Less Distributions | | | | | |
| From net investment income | $ (0.13) | $ (0.11) | $ (0.15) | $ (0.17) | $ (0.20) |
| From net realized gain | — | (0.79) | (0.55) | (0.29) | (1.14) |
| Total distributions | $ (0.13) | $ (0.90) | $ (0.70) | $ (0.46) | $ (1.34) |
| Net asset value — End of year | $ 47.47 | $ 38.18 | $ 49.71 | $ 39.77 | $ 29.65 |
| Total Return(2) | 24.73% | (21.87)% | 27.06% | 36.14% | 4.51% |
| Ratios/Supplemental Data | | | | | |
| Net assets, end of year (000’s omitted) | $77,895 | $47,248 | $50,963 | $29,021 | $16,361 |
| Ratios (as a percentage of average daily net assets):(3) | | | | | |
| Total expenses | 0.66% | 0.65% | 0.66% | 0.67% | 0.77% |
| Net expenses | 0.49% (4) | 0.49% (4) | 0.49% | 0.49% | 0.51% |
| Net investment income | 0.49% | 0.35% | 0.32% | 0.56% | 0.72% |
| Portfolio Turnover | 23% | 19% | 25% | 53% | 34% |
| (1) | Computed using average shares outstanding. |
| (2) | Returns are historical and are calculated by determining the percentage change in net asset value with all distributions reinvested and do not reflect the effect of sales charges, if any. |
| (3) | Total expenses do not reflect amounts reimbursed and/or waived by the adviser and certain of its affiliates, if applicable. Net expenses are net of all reductions and represent the net expenses paid by the Fund. |
| (4) | Includes a reduction by the investment adviser of a portion of its advisory fee due to the Fund’s investment in the Liquidity Fund (equal to less than 0.005% of average daily net assets for the years ended September 30, 2023 and 2022). |
20
See Notes to Financial Statements.
Calvert
US Large-Cap Growth Responsible Index Fund
September 30, 2023
Financial Highlights — continued
| | Class I |
| | Year Ended September 30, |
| | 2023 | 2022 | 2021 | 2020 | 2019 |
| Net asset value — Beginning of year | $ 38.55 | $ 50.15 | $ 40.08 | $ 29.88 | $ 30.02 |
| Income (Loss) From Operations | | | | | |
| Net investment income(1) | $ 0.33 | $ 0.28 | $ 0.27 | $ 0.27 | $ 0.28 |
| Net realized and unrealized gain (loss) | 9.29 | (10.87) | 10.57 | 10.46 | 0.97 |
| Total income (loss) from operations | $ 9.62 | $ (10.59) | $ 10.84 | $ 10.73 | $ 1.25 |
| Less Distributions | | | | | |
| From net investment income | $ (0.20) | $ (0.22) | $ (0.22) | $ (0.24) | $ (0.25) |
| From net realized gain | — | (0.79) | (0.55) | (0.29) | (1.14) |
| Total distributions | $ (0.20) | $ (1.01) | $ (0.77) | $ (0.53) | $ (1.39) |
| Net asset value — End of year | $ 47.97 | $ 38.55 | $ 50.15 | $ 40.08 | $ 29.88 |
| Total Return(2) | 25.05% | (21.66)% | 27.40% | 36.42% | 4.82% |
| Ratios/Supplemental Data | | | | | |
| Net assets, end of year (000’s omitted) | $354,003 | $297,905 | $209,865 | $112,304 | $74,948 |
| Ratios (as a percentage of average daily net assets):(3) | | | | | |
| Total expenses | 0.41% | 0.40% | 0.41% | 0.42% | 0.52% |
| Net expenses | 0.24% (4) | 0.24% (4) | 0.24% | 0.24% | 0.24% |
| Net investment income | 0.74% | 0.61% | 0.57% | 0.81% | 1.00% |
| Portfolio Turnover | 23% | 19% | 25% | 53% | 34% |
| (1) | Computed using average shares outstanding. |
| (2) | Returns are historical and are calculated by determining the percentage change in net asset value with all distributions reinvested and do not reflect the effect of sales charges, if any. |
| (3) | Total expenses do not reflect amounts reimbursed and/or waived by the adviser and certain of its affiliates, if applicable. Net expenses are net of all reductions and represent the net expenses paid by the Fund. |
| (4) | Includes a reduction by the investment adviser of a portion of its advisory fee due to the Fund’s investment in the Liquidity Fund (equal to less than 0.005% of average daily net assets for the years ended September 30, 2023 and 2022). |
21
See Notes to Financial Statements.
Calvert
US Large-Cap Growth Responsible Index Fund
September 30, 2023
Financial Highlights — continued
| | Class R6 |
| | Year Ended
September 30,
2023 | Period Ended
September 30,
2022(1) |
| |
| Net asset value — Beginning of period | $ 38.55 | $ 50.25 |
| Income (Loss) From Operations | | |
| Net investment income(2) | $ 0.35 | $ 0.19 |
| Net realized and unrealized gain (loss) | 9.28 | (11.89) |
| Total income (loss) from operations | $ 9.63 | $(11.70) |
| Less Distributions | | |
| From net investment income | $ (0.27) | $ — |
| Total distributions | $ (0.27) | $ — |
| Net asset value — End of period | $ 47.91 | $ 38.55 |
| Total Return(3) | 25.09% | (23.28)% (4) |
| Ratios/Supplemental Data | | |
| Net assets, end of period (000’s omitted) | $58,046 | $ 864 |
| Ratios (as a percentage of average daily net assets):(5) | | |
| Total expenses | 0.37% | 0.40% (6) |
| Net expenses | 0.21% (7) | 0.21% (6)(7) |
| Net investment income | 0.76% | 0.68% (6) |
| Portfolio Turnover | 23% | 19% (4)(8) |
| (1) | For the period from the commencement of operations, February 1, 2022, to September 30, 2022. |
| (2) | Computed using average shares outstanding. |
| (3) | Returns are historical and are calculated by determining the percentage change in net asset value with all distributions reinvested and do not reflect the effect of sales charges, if any. |
| (4) | Not annualized. |
| (5) | Total expenses do not reflect amounts reimbursed and/or waived by the adviser and certain of its affiliates, if applicable. Net expenses are net of all reductions and represent the net expenses paid by the Fund. |
| (6) | Annualized. |
| (7) | Includes a reduction by the investment adviser of a portion of its advisory fee due to the Fund’s investment in the Liquidity Fund (equal to less than 0.005% of average daily net assets for the years ended September 30, 2023 and 2022). |
| (8) | For the year ended September 30, 2022. |
22
See Notes to Financial Statements.
Calvert
US Large-Cap Growth Responsible Index Fund
September 30, 2023
Notes to Financial Statements
1 Significant Accounting Policies
Calvert US Large-Cap Growth Responsible Index Fund (the Fund) is a diversified series of Calvert Responsible Index Series, Inc. (the Corporation). The Corporation is a Maryland corporation registered under the Investment Company Act of 1940, as amended (the 1940 Act), as an open-end management investment company. The investment objective of the Fund is to seek to track the performance of the Calvert US Large-Cap Growth Responsible Index, which measures the investment return of large-capitalization stocks.
The Fund offers three classes of shares. Class A shares are generally sold subject to a sales charge imposed at time of purchase. A contingent deferred sales charge of 0.25% may apply to certain redemptions of Class A shares for accounts for which no sales charge was paid, if redeemed within 12 months of purchase. Class I and Class R6 shares are sold at net asset value, are not subject to a sales charge and are sold only to certain eligible investors. Each class represents a pro rata interest in the Fund, but votes separately on class-specific matters and is subject to different expenses.
The Fund applies the accounting and reporting guidance in the Financial Accounting Standards Board (FASB) Accounting Standards Codification Topic 946, Financial Services – Investment Companies (ASC 946). Subsequent events, if any, through the date that the financial statements were issued have been evaluated in the preparation of the financial statements.
A Investment Valuation— Net asset value per share is determined every business day as of the close of the regular session of the New York Stock Exchange (generally 4:00 p.m. Eastern time). The Fund uses independent pricing services approved by the Board of Directors (the Board) to value its investments wherever possible. Investments for which market quotations are not available or deemed not reliable are fair valued in good faith by the Board’s valuation designee.
U.S. generally accepted accounting principles (U.S. GAAP) establishes a disclosure hierarchy that categorizes the inputs to valuation techniques used to value assets and liabilities at measurement date. These inputs are summarized in the three broad levels listed below:
Level 1 - quoted prices in active markets for identical securities
Level 2 - other significant observable inputs (including quoted prices for similar securities, interest rates, prepayment speeds, credit risk, etc.)
Level 3 - significant unobservable inputs (including the Fund’s own assumptions in determining the fair value of investments)
The inputs or methodologies used for valuing securities are not necessarily an indication of the risk associated with investing in those securities.
Valuation techniques used to value the Fund’s investments by major category are as follows:
Equity Securities. Equity securities (including warrants and rights) listed on a U.S. securities exchange generally are valued at the last sale or closing price as reported by an independent pricing service on the primary market or exchange on which they are traded and are categorized as Level 1 in the hierarchy. Equity securities listed on the NASDAQ National Market System are valued at the NASDAQ official closing price and are categorized as Level 1 in the hierarchy. Unlisted or listed securities for which closing sales prices or closing quotations are not available are valued at the mean between the latest available bid and ask prices and are categorized as Level 2 in the hierarchy.
Other Securities. Investments in management investment companies (including money market funds) that do not trade on an exchange are valued at the net asset value as of the close of each business day and are categorized as Level 1 in the hierarchy.
Fair Valuation. In connection with Rule 2a-5 of the 1940 Act, the Board has designated the Fund’s investment adviser as its valuation designee. Investments for which valuations or market quotations are not readily available or are deemed unreliable are valued by the investment adviser, as valuation designee, at fair value using methods that most fairly reflect the security’s “fair value”, which is the amount that the Fund might reasonably expect to receive for the security upon its current sale in the ordinary course. Each such determination is based on a consideration of relevant factors, which are likely to vary from one pricing context to another. These factors may include, but are not limited to, the type of security, the existence of any contractual restrictions on the security’s disposition, the price and extent of public trading in similar securities of the issuer or of comparable companies or entities, quotations or relevant information obtained from broker/dealers or other market participants, information obtained from the issuer, analysts, and/or the appropriate stock exchange (for exchange-traded securities), an analysis of the company’s or entity’s financial statements, and an evaluation of the forces that influence the issuer and the market(s) in which the security is purchased and sold.
The values assigned to fair value investments are based on available information and do not necessarily represent amounts that might ultimately be realized. Further, due to the inherent uncertainty of valuations of such investments, the fair values may differ significantly from the values that would have been used had an active market existed, and the differences could be material.
Calvert
US Large-Cap Growth Responsible Index Fund
September 30, 2023
Notes to Financial Statements — continued
The following table summarizes the market value of the Fund's holdings as of September 30, 2023, based on the inputs used to value them:
| Asset Description | Level 1 | Level 2 | Level 3(1) | Total |
| Common Stocks | $ 489,287,721(2) | $ — | $ — | $ 489,287,721 |
| Rights | — | — | 1,166 | 1,166 |
| Short-Term Investments: | | | | |
| Affiliated Fund | 1,417,922 | — | — | 1,417,922 |
| Securities Lending Collateral | 115,114 | — | — | 115,114 |
| Total Investments | $490,820,757 | $ — | $1,166 | $490,821,923 |
| (1) | None of the unobservable inputs for Level 3 assets, individually or collectively, had a material impact on the Fund. |
| (2) | The level classification by major category of investments is the same as the category presentation in the Schedule of Investments. |
Level 3 assets at the beginning and/or end of the period in relation to net assets were not significant and accordingly, a reconciliation of Level 3 assets for the year ended September 30, 2023 is not presented.
B Investment Transactions and Income— Investment transactions for financial statement purposes are accounted for on trade date. Realized gains and losses are recorded on an identified cost basis and may include proceeds from litigation. Dividend income is recorded on the ex-dividend date for dividends received in cash and/or securities or, in the case of dividends on certain foreign securities, as soon as the Fund is informed of the ex-dividend date. Non-cash dividends are recorded at the fair value of the securities received. Withholding taxes on foreign dividends, if any, have been provided for in accordance with the Fund’s understanding of the applicable country’s tax rules and rates. Distributions received that represent a return of capital are recorded as a reduction of cost of investments. Distributions received that represent a capital gain are recorded as a realized gain. Interest income is accrued as earned.
C Foreign Currency Transactions— The Fund’s accounting records are maintained in U.S. dollars. For valuation of assets and liabilities on each date of net asset value determination, foreign denominations are converted into U.S. dollars using the current exchange rate. Security transactions, income and expenses are translated at the prevailing rate of exchange on the date of the event. Recognized gains or losses on investment transactions attributable to changes in foreign currency exchange rates are recorded for financial statement purposes as net realized gains and losses on investments. That portion of unrealized gains and losses on investments that results from fluctuations in foreign currency exchange rates is not separately disclosed.
D Share Class Accounting— Realized and unrealized gains and losses and net investment income and losses, other than class-specific expenses, are allocated daily to each class of shares based upon the relative net assets of each class to the total net assets of the Fund. Expenses arising in connection with a specific class are charged directly to that class. Sub-accounting, recordkeeping and similar administrative fees payable to financial intermediaries, which are a component of transfer agency fees and expenses on the Statement of Operations, are not allocated to Class R6 shares.
E Restricted Securities— The Fund may invest in securities that are subject to legal or contractual restrictions on resale. Generally, these securities may only be sold publicly upon registration under the Securities Act of 1933 or in transactions exempt from such registration. Information regarding restricted securities (excluding Rule 144A securities) is included at the end of the Schedule of Investments.
F Distributions to Shareholders— Distributions to shareholders are recorded by the Fund on ex-dividend date. Distributions from net investment income and distributions from net realized capital gains, if any, are paid at least annually. Distributions are declared separately for each class of shares. Distributions are determined in accordance with income tax regulations, which may differ from U.S. GAAP; accordingly, periodic reclassifications are made within the Fund's capital accounts to reflect income and gains available for distribution under income tax regulations.
G Estimates— The preparation of financial statements in conformity with U.S. GAAP requires management to make estimates and assumptions that affect the reported amounts of assets and liabilities and disclosure of contingent assets and liabilities at the date of the financial statements and the reported amounts of increases and decreases in net assets from operations during the reporting period. Actual results could differ from those estimates.
H Indemnifications— The Corporation’s By-Laws provide for indemnification for Directors or officers of the Corporation and certain other parties, to the fullest extent permitted by Maryland law and the 1940 Act, provided certain conditions are met. Additionally, in the normal course of business, the Fund enters into agreements with service providers that may contain indemnification clauses. The Fund’s maximum exposure under these arrangements is unknown as this would involve future claims that may be made against the Fund that have not yet occurred.
I Federal Income Taxes— No provision for federal income or excise tax is required since the Fund intends to continue to qualify as a regulated investment company under the Internal Revenue Code and to distribute substantially all of its taxable earnings.
Management has analyzed the Fund's tax positions taken for all open federal income tax years and has concluded that no provision for federal income tax is required in the Fund's financial statements. A Fund's federal tax return is subject to examination by the Internal Revenue Service for a period of three years from the date of filing.
Calvert
US Large-Cap Growth Responsible Index Fund
September 30, 2023
Notes to Financial Statements — continued
2 Related Party Transactions
The investment advisory fee is earned by Calvert Research and Management (CRM), an indirect, wholly-owned subsidiary of Morgan Stanley, as compensation for investment advisory services rendered to the Fund. The investment advisory fee is computed at the annual rate of 0.12% of the Fund’s average daily net assets and is payable monthly. For the year ended September 30, 2023, the investment advisory fee amounted to $531,287.
The Fund may invest in a money market fund, the Institutional Class of the Morgan Stanley Institutional Liquidity Funds - Government Portfolio (the “Liquidity Fund”), an open-end management investment company managed by Morgan Stanley Investment Management Inc., a wholly-owned subsidiary of Morgan Stanley. The investment advisory fee paid by the Fund is reduced by an amount equal to its pro rata share of the advisory and administration fees paid by the Fund due to its investment in the Liquidity Fund. For the year ended September 30, 2023, the investment advisory fee paid was reduced by $1,505 relating to the Fund’s investment in the Liquidity Fund.
CRM has agreed to reimburse the Fund’s operating expenses to the extent that total annual operating expenses (relating to ordinary operating expenses only and excluding expenses such as brokerage commissions, acquired fund fees and expenses of unaffiliated funds, borrowing costs, taxes or litigation expenses) exceed 0.49%, 0.24% and 0.21% for Class A, Class I and Class R6, respectively, of such class’s average daily net assets. The expense reimbursement agreement with CRM may be changed or terminated after January 31, 2024. For the year ended September 30, 2023, CRM waived or reimbursed expenses of $718,985.
The administrative fee is earned by CRM as compensation for administrative services rendered to the Fund. The fee is computed at an annual rate of 0.12% of the Fund’s average daily net assets attributable to Class A, Class I and Class R6 and is payable monthly. For the year ended September 30, 2023, CRM was paid administrative fees of $531,287.
The Fund has in effect a distribution plan for Class A shares (Class A Plan) pursuant to Rule 12b-1 under the 1940 Act. Pursuant to the Class A Plan, the Fund pays Eaton Vance Distributors, Inc. (EVD), an affiliate of CRM and the Fund’s principal underwriter, a distribution and service fee of 0.25% per annum of its average daily net assets attributable to Class A shares for distribution services and facilities provided to the Fund by EVD, as well as for personal services and/or the maintenance of shareholder accounts. Distribution and service fees paid or accrued for the year ended September 30, 2023 amounted to $170,792 for Class A shares.
The Fund was informed that EVD received $22,237 as its portion of the sales charge on sales of Class A shares for the year ended September 30, 2023.
Eaton Vance Management (EVM), an affiliate of CRM, provides sub-transfer agency and related services to the Fund pursuant to a Sub-Transfer Agency Support Services Agreement. For the year ended September 30, 2023, sub-transfer agency fees and expenses incurred to EVM amounted to $14,465 and are included in transfer agency fees and expenses on the Statement of Operations.
Each Director of the Fund who is not an employee of CRM or its affiliates receives an annual fee of $214,000, an annual Committee fee ranging from $8,500 to $16,500 depending on the Committee, and may receive a fee of $10,000 for special meetings. The Board chair receives an additional $40,000 ($30,000 prior to January 1, 2023) annual fee, Committee chairs receive an additional $15,000 ($6,000 prior to January 1, 2023) annual fee and the special equities liaison receives an additional $2,500 annual fee. Eligible Directors may participate in a Deferred Compensation Plan (the Plan). Amounts deferred under the Plan are treated as though equal dollar amounts had been invested in shares of the Fund or other Calvert funds selected by the Directors. The Fund purchases shares of the funds selected equal to the dollar amounts deferred under the Plan, resulting in an asset equal to the deferred compensation liability. Obligations of the Plan are paid solely from the Fund's assets. Directors’ fees are allocated to each of the Calvert funds served. Salaries and fees of officers and Directors of the Fund who are employees of CRM or its affiliates are paid by CRM.
3 Investment Activity
During the year ended September 30, 2023, the cost of purchases and proceeds from sales of investments, other than short-term securities, were $157,705,464 and $102,870,996, respectively.
4 Distributions to Shareholders and Income Tax Information
The tax character of distributions declared for the years ended September 30, 2023 and September 30, 2022 was as follows:
| | Year Ended September 30, |
| | 2023 | 2022 |
| Ordinary income | $2,035,031 | $3,029,416 |
| Long-term capital gains | $ — | $2,374,223 |
Calvert
US Large-Cap Growth Responsible Index Fund
September 30, 2023
Notes to Financial Statements — continued
During the year ended September 30, 2023, distributable earnings was decreased by $254,143 and paid-in capital was increased by $254,143 due to the Fund's use of equalization accounting. Tax equalization accounting allows the Fund to treat as a distribution that portion of redemption proceeds representing a redeeming shareholder’s portion of undistributed taxable income and net capital gains. These reclassifications had no effect on the net assets or net asset value per share of the Fund.
As of September 30, 2023, the components of distributable earnings (accumulated loss) on a tax basis were as follows:
| Undistributed ordinary income | $ 2,084,726 |
| Deferred capital losses | (9,163,602) |
| Net unrealized appreciation | 118,375,587 |
| Distributable earnings | $111,296,711 |
At September 30, 2023, the Fund, for federal income tax purposes, had deferred capital losses of $9,163,602 which would reduce the Fund's taxable income arising from future net realized gains on investment transactions, if any, to the extent permitted by the Internal Revenue Code, and thus would reduce the amount of distributions to shareholders, which would otherwise be necessary to relieve the Fund of any liability for federal income or excise tax. The deferred capital losses are treated as arising on the first day of the Fund's next taxable year, can be carried forward for an unlimited period, and retain the same short-term or long-term character as when originally deferred. Of the deferred capital losses at September 30, 2023, $5,888,514 are short-term and $3,275,088 are long-term.
The cost and unrealized appreciation (depreciation) of investments of the Fund at September 30, 2023, as determined on a federal income tax basis, were as follows:
| Aggregate cost | $372,446,411 |
| Gross unrealized appreciation | $ 129,346,514 |
| Gross unrealized depreciation | (10,971,002) |
| Net unrealized appreciation | $118,375,512 |
5 Securities Lending
To generate additional income, the Fund may lend its securities pursuant to a securities lending agency agreement with State Street Bank and Trust Company (SSBT), the securities lending agent. Security loans are subject to termination by the Fund at any time and, therefore, are not considered illiquid investments. The Fund requires that the loan be continuously collateralized by either cash or securities in an amount at least equal to the market value of the securities on loan. The market value of securities loaned is determined daily and any additional required collateral is delivered to the Fund on the next business day. Cash collateral is generally invested in a money market fund registered under the 1940 Act that is managed by an affiliate of SSBT. Any gain or loss in the market price of the loaned securities that might occur and any interest earned or dividends declared during the term of the loan would accrue to the account of the Fund. Income earned on the investment of collateral, net of broker rebates and other expenses incurred by the securities lending agent, is split between the Fund and the securities lending agent based on agreed upon contractual terms. Non-cash collateral, if any, is held by the lending agent on behalf of the Fund and cannot be sold or re-pledged by the Fund; accordingly, such collateral is not reflected in the Statement of Assets and Liabilities.
The risks associated with lending portfolio securities include, but are not limited to, possible delays in receiving additional collateral or in the recovery of the loaned securities, possible loss of rights to the collateral should the borrower fail financially, as well as risk of loss in the value of the collateral or the value of the investments made with the collateral. The securities lending agent shall indemnify the Fund in the case of default of any securities borrower.
At September 30, 2023, the total value of securities on loan was $821,026 and the total value of collateral received was $835,086, comprised of cash of $115,114 and U.S. government and/or agencies securities of $719,972.
Calvert
US Large-Cap Growth Responsible Index Fund
September 30, 2023
Notes to Financial Statements — continued
The following table provides a breakdown of securities lending transactions accounted for as secured borrowings, the obligations by class of collateral pledged, and the remaining contractual maturity of those transactions as of September 30, 2023.
| | Remaining Contractual Maturity of the Transactions |
| | Overnight and
Continuous | <30 days | 30 to 90 days | >90 days | Total |
| Common Stocks | $115,114 | $ — | $ — | $ — | $115,114 |
The carrying amount of the liability for deposits for securities loaned at September 30, 2023 approximated its fair value. If measured at fair value, such liability would have been considered as Level 2 in the fair value hierarchy (see Note 1A) at September 30, 2023.
6 Line of Credit
The Fund participates with other portfolios and funds managed by EVM and its affiliates, including CRM, in a $725 million unsecured revolving line of credit agreement with a group of banks, which is in effect through October 24, 2023. Borrowings are made by the Fund solely for temporary purposes related to redemptions and other short-term cash needs. Interest is charged to the Fund based on its borrowings at an amount above either the Secured Overnight Financing Rate (SOFR) or Federal Funds rate. In addition, a fee computed at an annual rate of 0.15% on the daily unused portion of the line of credit is allocated among the participating portfolios and funds at the end of each quarter. In connection with the renewal of the agreement in October 2022, an arrangement fee of $150,000 was incurred that was allocated to the participating portfolios and funds. Because the line of credit is not available exclusively to the Fund, it may be unable to borrow some or all of its requested amounts at any particular time.
The Fund had no borrowings outstanding pursuant to its line of credit at September 30, 2023. The Fund did not have any significant borrowings or allocated fees during the year ended September 30, 2023. Effective October 24, 2023, the Fund renewed its line of credit agreement, which expires October 22, 2024. In connection with the renewal, the borrowing limit was decreased to $650 million.
7 Affiliated Investments
At September 30, 2023, the value of the Fund’s investment in funds that may be deemed to be affiliated was $1,417,922, which represents 0.3% of the Fund’s net assets. Transactions in such investments by the Fund for the year ended September 30, 2023 were as follows:
| Name | Value,
beginning
of period | Purchases | Sales
proceeds | Net
realized
gain
(loss) | Change in
unrealized
appreciation
(depreciation) | Value,
end of
period | Dividend
income | Shares,
end of
period |
| Short-Term Investments | | | | | | |
| Liquidity Fund | $1,086,317 | $86,570,173 | $(86,238,568) | $ — | $ — | $1,417,922 | $42,736 | 1,417,922 |
8 Capital Shares
The Corporation may issue its shares in one or more series (such as the Fund). The authorized shares of the Fund consist of 75,000,000 common shares, $0.01 par value, for each Class.
Transactions in capital shares were as follows:
| | Year Ended
September 30, 2023 | | Year Ended
September 30, 2022(1) |
| | Shares | Amount | | Shares | Amount |
| Class A | | | | | |
| Shares sold | 1,119,019 | $ 47,507,706 | | 391,567 | $ 18,624,018 |
| Reinvestment of distributions | 4,071 | 164,856 | | 18,125 | 947,927 |
| Shares redeemed | (719,813) | (30,232,456) | | (197,409) | (9,135,335) |
| Net increase | 403,277 | $ 17,440,106 | | 212,283 | $ 10,436,610 |
Calvert
US Large-Cap Growth Responsible Index Fund
September 30, 2023
Notes to Financial Statements — continued
| | Year Ended
September 30, 2023 | | Year Ended
September 30, 2022(1) |
| | Shares | Amount | | Shares | Amount |
| Class I | | | | | |
| Shares sold | 2,580,713 | $ 113,456,358 | | 4,412,350 | $ 193,442,806 |
| Reinvestment of distributions | 36,046 | 1,472,104 | | 83,068 | 4,376,828 |
| Shares redeemed | (2,964,897) | (124,568,801) | | (951,510) | (44,388,713) |
| Net increase (decrease) | (348,138) | $ (9,640,339) | | 3,543,908 | $153,430,921 |
| Class R6 | | | | | |
| Shares sold | 1,406,930 | $ 56,179,471 | | 22,493 | $ 965,202 |
| Reinvestment of distributions | 7,772 | 316,925 | | — | — |
| Shares redeemed | (225,496) | (10,846,908) | | (78) | (3,178) |
| Net increase | 1,189,206 | $ 45,649,488 | | 22,415 | $ 962,024 |
| (1) | For Class R6, for the period from the commencement of operations, February 1, 2022, to September 30, 2022. |
Calvert
US Large-Cap Growth Responsible Index Fund
September 30, 2023
Report of Independent Registered Public Accounting Firm
To the Board of Directors of Calvert Responsible Index Series, Inc. and Shareholders of Calvert US Large-Cap Growth Responsible Index Fund:
Opinion on the Financial Statements and Financial Highlights
We have audited the accompanying statement of assets and liabilities of Calvert US Large-Cap Growth Responsible Index Fund (the "Fund") (one of the funds constituting Calvert Responsible Index Series, Inc.), including the schedule of investments, as of September 30, 2023, the related statement of operations for the year then ended, the statements of changes in net assets for each of the two years in the period then ended, the financial highlights for each of the three years in the period then ended, and the related notes. In our opinion, the financial statements and financial highlights present fairly, in all material respects, the financial position of the Fund as of September 30, 2023, and the results of its operations for the year then ended, the changes in its net assets for each of the two years in the period then ended, and the financial highlights for each of the three years in the period then ended, in conformity with accounting principles generally accepted in the United States of America. The financial highlights for the years ended September 30, 2020 and 2019 were audited by other auditors whose report, dated November 20, 2020, expressed an unqualified opinion on those financial highlights.
Basis for Opinion
These financial statements and financial highlights are the responsibility of the Fund's management. Our responsibility is to express an opinion on the Fund's financial statements and financial highlights based on our audits. We are a public accounting firm registered with the Public Company Accounting Oversight Board (United States) (PCAOB) and are required to be independent with respect to the Fund in accordance with the U.S. federal securities laws and the applicable rules and regulations of the Securities and Exchange Commission and the PCAOB.
We conducted our audits in accordance with the standards of the PCAOB. Those standards require that we plan and perform the audit to obtain reasonable assurance about whether the financial statements and financial highlights are free of material misstatement, whether due to error or fraud. The Fund is not required to have, nor were we engaged to perform, an audit of its internal control over financial reporting. As part of our audits, we are required to obtain an understanding of internal control over financial reporting but not for the purpose of expressing an opinion on the effectiveness of the Fund’s internal control over financial reporting. Accordingly, we express no such opinion.
Our audits included performing procedures to assess the risks of material misstatement of the financial statements and financial highlights, whether due to error or fraud, and performing procedures that respond to those risks. Such procedures included examining, on a test basis, evidence regarding the amounts and disclosures in the financial statements and financial highlights. Our audits also included evaluating the accounting principles used and significant estimates made by management, as well as evaluating the overall presentation of the financial statements and financial highlights. Our procedures included confirmation of securities owned as of September 30, 2023, by correspondence with the custodian and brokers; when replies were not received from brokers, we performed other auditing procedures. We believe that our audits provide a reasonable basis for our opinion.
/s/ Deloitte & Touche LLP
Boston, Massachusetts
November 22, 2023
We have served as the auditor of one or more Calvert investment companies since 2021.
Calvert
US Large-Cap Growth Responsible Index Fund
September 30, 2023
Federal Tax Information (Unaudited)
The Form 1099-DIV you receive in February 2024 will show the tax status of all distributions paid to your account in calendar year 2023. Shareholders are advised to consult their own tax adviser with respect to the tax consequences of their investment in the Fund. As required by the Internal Revenue Code and/or regulations, shareholders must be notified regarding the status of qualified dividend income for individuals and the dividends received deduction for corporations.
Qualified Dividend Income. For the fiscal year ended September 30, 2023, the Fund designates approximately $4,238,233, or up to the maximum amount of such dividends allowable pursuant to the Internal Revenue Code, as qualified dividend income eligible for the reduced tax rate of 15%.
Dividends Received Deduction. Corporate shareholders are generally entitled to take the dividends received deduction on the portion of the Fund's dividend distribution that qualifies under tax law. For the Fund's fiscal 2023 ordinary income dividends, 100% qualifies for the corporate dividends received deduction.
Calvert
US Large-Cap Growth Responsible Index Fund
September 30, 2023
Board of Directors' Contract Approval
Overview of the Contract Review Process
The Investment Company Act of 1940, as amended, provides, in substance, that each investment advisory agreement between a fund and its investment adviser will continue in effect from year to year only if its continuation is approved at least annually by the fund’s board of directors, including by a vote of a majority of the directors who are not “interested persons” of the fund (“Independent Directors”), cast in person at a meeting called for the purpose of considering such approval.
At an in-person meeting of the Boards of Trustees/Directors (each a “Board”) of the registered investment companies advised by Calvert Research and Management (“CRM” or the “Adviser”) (the “Calvert Funds”) held on June 12-13, 2023, the Board, including a majority of the Independent Directors, voted to approve continuation of existing investment advisory and investment sub-advisory agreements for the Calvert Funds for an additional one-year period.
In evaluating the investment advisory and investment sub-advisory agreements for the Calvert Funds, the Board considered a variety of information relating to the Calvert Funds and various service providers, including the Adviser. The Independent Directors reviewed a report prepared by the Adviser regarding various services provided to the Calvert Funds by the Adviser and its affiliates. Such report included, among other data, information regarding the Adviser’s personnel and the Adviser’s revenue and cost of providing services to the Calvert Funds, and a separate report prepared by an independent data provider, which compared each fund’s investment performance, fees and expenses to those of comparable funds as identified by such independent data provider (“comparable funds”).
The Independent Directors were separately represented by independent legal counsel with respect to their consideration of the continuation of the investment advisory and investment sub-advisory agreements for the Calvert Funds. Prior to voting, the Independent Directors reviewed the proposed continuation of the Calvert Funds’ investment advisory and investment sub-advisory agreements with management and also met in private sessions with their counsel at which time no representatives of management were present.
The information that the Board considered included, among other things, the following (for funds that invest through one or more affiliated underlying fund(s), references to “each fund” in this section may include information that was considered at the underlying fund-level):
Information about Fees, Performance and Expenses
| • | A report from an independent data provider comparing the advisory and related fees paid by each fund with fees paid by comparable funds; |
| • | A report from an independent data provider comparing each fund’s total expense ratio and its components to comparable funds; |
| • | A report from an independent data provider comparing the investment performance of each fund to the investment performance of comparable funds over various time periods; |
| • | Data regarding investment performance in comparison to benchmark indices; |
| • | For each fund, comparative information concerning the fees charged and the services provided by the Adviser in managing other accounts (including mutual funds, other collective investment funds and institutional accounts) using investment strategies and techniques similar to those used in managing such fund; |
| • | Profitability analyses for the Adviser with respect to each fund; |
Information about Portfolio Management and Trading
| • | Descriptions of the investment management services provided to each fund, including investment strategies and processes it employs; |
| • | Information about the Adviser’s policies and practices with respect to trading, including the Adviser’s processes for monitoring best execution of portfolio transactions; |
| • | Information about the allocation of brokerage transactions and the benefits received by the Adviser as a result of brokerage allocation, including information concerning the acquisition of research through client commission arrangements and policies with respect to “soft dollars”; |
Information about the Adviser
| • | Reports detailing the financial results and condition of CRM; |
| • | Descriptions of the qualifications, education and experience of the individual investment professionals whose responsibilities include portfolio management and investment research for the funds, and information relating to their compensation and responsibilities with respect to managing other mutual funds and investment accounts; |
| • | Policies and procedures relating to proxy voting and the handling of corporate actions and class actions; |
| • | A description of CRM’s procedures for overseeing sub-advisers, including with respect to regulatory and compliance issues, investment management and other matters; |
Calvert
US Large-Cap Growth Responsible Index Fund
September 30, 2023
Board of Directors' Contract Approval — continued
Other Relevant Information
| • | Information concerning the nature, cost and character of the administrative and other non-investment advisory services provided by CRM and its affiliates; and |
| • | The terms of each investment advisory agreement. |
Over the course of the year, the Board and its committees held regular quarterly meetings. During these meetings, the Directors participated in investment and performance reviews with the portfolio managers and other investment professionals of the Adviser relating to each fund and considered various investment and trading strategies used in pursuing each fund’s investment objective(s), such as the use of derivative instruments, as well as risk management techniques. The Board and its committees also evaluated issues pertaining to industry and regulatory developments, compliance procedures, corporate governance and other issues with respect to the funds and received and participated in reports and presentations provided by CRM and its affiliates with respect to such matters. In addition to the formal meetings of the Board and its committees, the Independent Directors held regular video conferences in between meetings to discuss, among other topics, matters relating to the continuation of the Calvert Funds’ investment advisory and investment sub-advisory agreements.
For funds that invest through one or more affiliated underlying funds, the Board considered similar information about the underlying fund(s) when considering the approval of investment advisory agreements. In addition, in cases where the Adviser has engaged a sub-adviser, the Board considered similar information about the sub-adviser when considering the approval of any investment sub-advisory agreement.
The Independent Directors were assisted throughout the contract review process by their independent legal counsel. The Independent Directors relied upon the advice of such counsel and their own business judgment in determining the material factors to be considered in evaluating each investment advisory and investment sub-advisory agreement and the weight to be given to each such factor. The Board, including the Independent Directors, did not identify any single factor as controlling, and each Director may have attributed different weight to various factors.
Results of the Contract Review Process
Based on its consideration of the foregoing, and such other information as it deemed relevant, including the factors and conclusions described below, the Board, including the Independent Directors, concluded that the continuation of the investment advisory agreement of Calvert US Large-Cap Growth Responsible Index Fund (the “Fund”), including the fee payable under the agreement, is in the best interests of the Fund’s shareholders. Accordingly, the Board, including a majority of the Independent Directors, voted to approve the continuation of the investment advisory agreement of the Fund.
Nature, Extent and Quality of Services
In considering the nature, extent and quality of the services provided by the Adviser under the investment advisory agreement, the Board reviewed information provided by the Adviser relating to its operations and personnel, including, among other information, biographical information on the Adviser’s investment personnel and descriptions of its organizational and management structure. The Board also took into account similar information provided periodically throughout the previous year by the Adviser as well as the Board’s familiarity with management through Board meetings, discussions and other reports. The Board considered the Adviser’s management style and its performance in employing its investment strategies as well as its current level of staffing and overall resources. The Board also noted that it reviewed on a quarterly basis information regarding the Adviser’s compliance with applicable policies and procedures, including those related to personal investing. The Board took into account, among other items, periodic reports received from the Adviser over the past year concerning the Adviser’s ongoing review and enhancement of certain processes, policies and procedures of the Calvert Funds and the Adviser. The Board concluded that it was satisfied with the nature, extent and quality of services provided to the Fund by the Adviser under the investment advisory agreement.
Fund Performance
In considering the Fund’s performance, the Board noted that it reviewed on a quarterly basis detailed information about the Fund’s performance results, portfolio composition and investment strategies. The Board compared the Fund’s investment performance to that of the Fund’s peer universe and the index it is designed to track. The Board’s review included comparative performance data for the one-, three- and five-year periods ended December 31, 2022. This performance data indicated that the Fund had outperformed the median of the Fund’s peer universe and the index it is designed to track for the one-, three- and five-year periods ended December 31, 2022. Based upon its review, the Board concluded that the Fund’s performance was satisfactory relative to the performance of its peer universe and the index it is designed to track.
Management Fees and Expenses
In considering the Fund’s fees and expenses, the Board compared the Fund’s fees and total expense ratio with those of comparable funds in its expense universe. Among other findings, the data indicated that the Fund’s advisory and administrative fees (after taking into account waivers and/or reimbursements) (referred to collectively as “management fees”) and the Fund’s total expenses (net of waivers and/or reimbursements) were each below the
Calvert
US Large-Cap Growth Responsible Index Fund
September 30, 2023
Board of Directors' Contract Approval — continued
respective median of the Fund’s expense universe. The Board took into account the Adviser’s current undertaking to maintain expense limitations for the Fund and that the Adviser was waiving and/or reimbursing a portion of the Fund’s expenses. Based upon its review, the Board concluded that the management fees were reasonable in view of the nature, extent and quality of services provided by the Adviser.
Profitability and Other “Fall-Out” Benefits
The Board reviewed the Adviser’s profitability in regard to the Fund and the Calvert Funds in the aggregate. In reviewing the overall profitability of the Fund to the Adviser, the Board also considered the fact that the Adviser and its affiliates provided sub-transfer agency support, administrative and distribution services to the Fund for which they received compensation. The information considered by the Board included the profitability of the Fund to the Adviser and its affiliates without regard to any marketing support or other payments by the Adviser and its affiliates to third parties in respect of distribution services. The Board also considered that the Adviser and its affiliates derived benefits to their reputation and other indirect benefits from their relationships with the Fund. Based upon its review, the Board concluded that the Adviser’s and its affiliates’ level of profitability from their relationships with the Fund was reasonable.
Economies of Scale
The Board considered the effect of the Fund’s current size and its potential growth on its performance and fees. The Board concluded that adding breakpoints to the advisory fee at specified asset levels would not be appropriate at this time. The Board noted that if the Fund’s assets increased over time, the Fund might realize other economies of scale if assets increased proportionally more than certain other expenses.
Calvert
US Large-Cap Growth Responsible Index Fund
September 30, 2023
Liquidity Risk Management Program
The Fund has implemented a written liquidity risk management program (Program) and related procedures to manage its liquidity in accordance with Rule 22e-4 under the Investment Company Act of 1940, as amended (Liquidity Rule). The Liquidity Rule defines “liquidity risk” as the risk that a fund could not meet requests to redeem shares issued by the fund without significant dilution of the remaining investors’ interests in the fund. The Fund’s Board of Trustees/Directors has designated the investment adviser to serve as the administrator of the Program and the related procedures. The administrator has established a Liquidity Risk Management Oversight Committee (Committee) to perform the functions necessary to administer the Program. As part of the Program, the administrator is responsible for identifying illiquid investments and categorizing the relative liquidity of the Fund’s investments in accordance with the Liquidity Rule. Under the Program, the administrator assesses, manages, and periodically reviews the Fund’s liquidity risk, and is responsible for making certain reports to the Fund’s Board of Trustees/Directors and the Securities and Exchange Commission (SEC) regarding the liquidity of the Fund’s investments, and to notify the Board of Trustees/Directors and the SEC of certain liquidity events specified in the Liquidity Rule. The liquidity of the Fund’s portfolio investments is determined based on a number of factors including, but not limited to, relevant market, trading and investment-specific considerations under the Program.
At a meeting of the Fund’s Board of Trustees/Directors on June 13, 2023, the Committee provided a written report to the Fund’s Board of Trustees/ Directors pertaining to the operation, adequacy, and effectiveness of implementation of the Program, as well as the operation of the highly liquid investment minimum (if applicable) for the period January 1, 2022 through December 31, 2022 (Review Period). The Program operated effectively during the Review Period, supporting the administrator’s ability to assess, manage and monitor Fund liquidity risk, including during periods of market volatility and net redemptions. During the Review Period, the Fund met redemption requests on a timely basis.
There can be no assurance that the Program will achieve its objectives in the future. Please refer to the Fund’s prospectus for more information regarding the Fund’s exposure to liquidity risk and other principal risks to which an investment in the Fund may be subject.
Calvert
US Large-Cap Growth Responsible Index Fund
September 30, 2023
Management and Organization
Fund Management. The Directors of Calvert Responsible Index Series, Inc. (the Corporation) are responsible for the overall management and supervision of the affairs of the Corporation. The Board members and officers of the Corporation are listed below. Except as indicated, each individual has held the office shown or other offices in the same company for the last five years. Board members hold indefinite terms of office. Each Board member holds office until his or her successor is elected and qualified, or until his or her earlier death, resignation, retirement, removal or disqualification. Under the terms of the Fund's current Board member retirement policy, an Independent Board member must retire at the end of the calendar year in which he or she turns 75. However, if such retirement would cause the Fund to be out of compliance with Section 16 of the 1940 Act or any other regulations or guidance of the SEC, then such retirement will not become effective until such time as action has been taken for the Fund to be in compliance therewith. The “noninterested Directors” consist of those Directors who are not “interested persons” of the Corporation, as that term is defined under the 1940 Act. The business address of each Board member and the Chief Compliance Officer is 2050 M Street NW, Washington, DC 20036 and the business address of the Secretary, Vice President and Chief Legal Officer and the Treasurer is Two International Place, Boston, Massachusetts 02110. As used below, “CRM” refers to Calvert Research and Management and “Eaton Vance” refers to Eaton Vance Management. Each Director oversees 46 funds in the Calvert fund complex. Each of Eaton Vance and CRM are indirect, wholly owned subsidiaries of Morgan Stanley. Each officer affiliated with CRM may hold a position with other CRM affiliates that is comparable to his or her position with CRM listed below.
| Name and Year of Birth | Corporation
Position(s) | Length of
Service | Principal Occupation(s) and Other Directorships
During Past Five Years and Other Relevant Experience |
| Interested Director | | | |
Theodore H. Eliopoulos(1)
1964 | Director and
President | Since 2022 | President and Chief Executive Officer of CRM and senior sponsor of Morgan Stanley Investment Management’s (MSIM) Diversity Council. Formerly, Vice Chairman & Head of Strategic Partnerships at MSIM (2019-2022). Former Chief Investment Officer and interim Chief Investment Officer (2014-2018) and Senior Investment Officer of Real Estate and Real Assets at California Public Employees’ Retirement System (CalPERS) (2007-2014). Former Chief Deputy Treasurer and Deputy Treasurer at the California State Treasurer's Office (2002-2006). Mr. Eliopoulos is an interested person because of his positions with CRM and certain affiliates.
Other Directorships. The Robert Toigo Foundation; Pacific Pension & Investment Institute (PPI). |
| Noninterested Directors |
Richard L. Baird, Jr.(2)
1948 | Director | Since 2000 | Regional Disaster Recovery Lead, American Red Cross of Greater
Pennsylvania (since 2017). Volunteer, American Red Cross (since 2015).
Former President and CEO of Adagio Health Inc. (retired in 2014) in
Pittsburgh, PA.
Other Directorships. None. |
Alice Gresham Bullock
1950 | Chair and
Director | Since 2016 | Professor Emerita at Howard University School of Law. Dean Emerita of
Howard University School of Law and Deputy Director of the Association
of American Law Schools (1992-1994).
Other Directorships. None. |
Cari M. Dominguez
1949 | Director | Since 2016 | Former Chair of the U.S. Equal Employment Opportunity Commission.
Other Directorships. ManpowerGroup Inc. (workforce solutions company);
Triple S Management Corporation (managed care); National Association of Corporate Directors. |
Karen Fang(3)
1958 | Director | Since 2023 | Formerly, Managing Director, Wealth Management at GAMCO Asset Management (asset management firm) (2020-2023). Formerly, Managing Director, Senior Portfolio Manager of Fiduciary Trust Company International (wealth management firm) (1993-2019).
Other Directorships. None. |
John G. Guffey, Jr.(2)
1948 | Director | Since 2000 | President of Aurora Press Inc., a privately held publisher of trade paperbacks
(since January 1997).
Other Directorships. Calvert Impact Capital, Inc. (through December 31, 2018); Calvert Ventures, LLC. |
Miles D. Harper, III
1962 | Director | Since 2005 | Partner, Carr Riggs & Ingram (public accounting firm) since October 2014.
Partner, Gainer Donnelly & Desroches (public accounting firm) (now Carr
Riggs & Ingram) (November 1999 - September 2014).
Other Directorships. Bridgeway Funds (9) (asset management). |
Joy V. Jones
1950 | Director | Since 2000 | Attorney.
Other Directorships. Palm Management Corporation. |
Calvert
US Large-Cap Growth Responsible Index Fund
September 30, 2023
Management and Organization — continued
| Name and Year of Birth | Corporation
Position(s) | Length of
Service | Principal Occupation(s) and Other Directorships
During Past Five Years and Other Relevant Experience |
| Noninterested Directors (continued) |
Eddie Ramos(3)
1967 | Director | Since 2023 | Private investor (2022-present). Formerly, Head of External Advisors/Diversity Portfolio Management at the New Jersey Division of Investment (2020-2022). Formerly, Chief Investment Officer and Lead Portfolio Manager – Global Fundamental Equities at Cornerstone Capital Management (asset management firm) (2011-2017).
Other Directorships. Macquarie Optimum Funds (6) (asset management). |
Anthony A. Williams
1951 | Director | Since 2016 | CEO and Executive Director of the Federal City Council (July 2012 to
present); Senior Adviser and Independent Consultant for King and
Spalding LLP (September 2015 to present); Executive Director of Global
Government Practice at the Corporate Executive Board (January 2010 to
January 2012).
Other Directorships. Freddie Mac; Evoq Properties/Meruelo Maddux
Properties, Inc. (real estate management); Weston Solutions, Inc.
(environmental services); Bipartisan Policy Center’s Debt Reduction Task Force;
Chesapeake Bay Foundation; Catholic University of America; Urban Institute (research organization); The Howard Hughes Corporation (real estate development); Old Dominion National Bank. |
| Name and Year of Birth | Corporation
Position(s) | Length of
Service | Principal Occupation(s)
During Past Five Years |
| Principal Officers who are not Directors |
Hope L. Brown
1973 | Chief
Compliance
Officer | Since 2014 | Chief Compliance Officer of 46 registered investment companies advised
by CRM (since 2014). Vice President and Chief Compliance Officer,
Wilmington Funds (2012-2014). |
Deidre E. Walsh
1971 | Secretary,
Vice President
and Chief
Legal Officer | Since 2021 | Vice President of CRM and officer of 46 registered investment companies
advised by CRM (since 2021). Also Vice President of Eaton Vance and
certain of its affiliates and officer of 127 registered investment companies
advised or administered by Eaton Vance. |
James F. Kirchner
1967 | Treasurer | Since 2016 | Vice President of CRM and officer of 46 registered investment companies
advised by CRM (since 2016). Also Vice President of Eaton Vance and
certain of its affiliates and officer of 127 registered investment companies
advised or administered by Eaton Vance. |
| | | | |
| (1) Mr. Eliopoulos is an interested person of the Fund because of his positions with the Fund’s adviser and certain affiliates. |
| (2) Effective December 31, 2023, Richard L. Baird, Jr. and John G. Guffey, Jr. will retire from the Board of Directors. |
| (3) Ms. Fang and Mr. Ramos began serving as Directors effective October 30, 2023. |
The SAI for the Fund includes additional information about the Directors and officers of the Fund and can be obtained without charge on Calvert’s website at www.calvert.com or by calling 1-800-368-2745.
| FACTS | WHAT DOES EATON VANCE DO WITH YOUR
PERSONAL INFORMATION? |
| Why? | Financial companies choose how they share your personal information. Federal law gives consumers the right to limit some but not all sharing. Federal law also requires us to tell you how we collect, share, and protect your personal information. Please read this notice carefully to understand what we do. |
| |
| What? | The types of personal information we collect and share depend on the product or service you have with us. This information can include:■ Social Security number and income
■
investment experience and risk tolerance
■
checking account number and wire transfer instructions |
| |
| How? | All financial companies need to share customers’ personal information to run their everyday business. In the section below, we list the reasons financial companies can share their customers’ personal information; the reasons Eaton Vance chooses to share; and whether you can limit this sharing. |
Reasons we can share your
personal information | Does Eaton Vance
share? | Can you limit
this sharing? |
| For our everyday business purposes — such as to process your transactions, maintain your account(s), respond to court orders and legal investigations, or report to credit bureaus | Yes | No |
| For our marketing purposes — to offer our products and services to you | Yes | No |
| For joint marketing with other financial companies | No | We don’t share |
| For our investment management affiliates’ everyday business purposes — information about your transactions, experiences, and creditworthiness | Yes | Yes |
| For our affiliates’ everyday business purposes — information about your transactions and experiences | Yes | No |
| For our affiliates’ everyday business purposes — information about your creditworthiness | No | We don’t share |
| For our investment management affiliates to market to you | Yes | Yes |
| For our affiliates to market to you | No | We don’t share |
| For nonaffiliates to market to you | No | We don’t share |
To limit our
sharing | Call toll-free 1-800-368-2745 or email: CRMPrivacy@calvert.comPlease note:If you are a new customer, we can begin sharing your information 30 days from the date we sent this notice. When you are no longer our customer, we continue to share your information as described in this notice. However, you can contact us at any time to limit our sharing. |
| Questions? | Call toll-free 1-800-368-2745 or email: CRMPrivacy@calvert.com |
| Privacy Notice — continued | April 2021 |
| Who we are |
| Who is providing this notice? | Eaton Vance Management, Eaton Vance Distributors, Inc., Eaton Vance Trust Company, Eaton Vance Management (International) Limited, Eaton Vance Advisers International Ltd., Eaton Vance Global Advisors Limited, Eaton Vance Management’s Real Estate Investment Group, Boston Management and Research, Calvert Research and Management, Eaton Vance and Calvert Fund Families and our investment advisory affiliates (“Eaton Vance”) (see Investment Management Affiliates definition below) |
| What we do |
How does Eaton Vance
protect my personal
information? | To protect your personal information from unauthorized access and use, we use security measures that comply with federal law. These measures include computer safeguards and secured files and buildings. We have policies governing the proper handling of customer information by personnel and requiring third parties that provide support to adhere to appropriate security standards with respect to such information. |
How does Eaton Vance
collect my personal
information? | We collect your personal information, for example, when you■ open an account or make deposits or withdrawals from your account
■
buy securities from us or make a wire transfer
■
give us your contact informationWe also collect your personal information from others, such as credit bureaus, affiliates, or other companies. |
| Why can’t I limit all sharing? | Federal law gives you the right to limit only■ sharing for affiliates’ everyday business purposes — information about your creditworthiness
■
affiliates from using your information to market to you
■
sharing for nonaffiliates to market to youState laws and individual companies may give you additional rights to limit sharing. See below for more on your rights under state law. |
| Definitions |
Investment Management
Affiliates | Eaton Vance Investment Management Affiliates include registered investment advisers, registered broker- dealers, and registered and unregistered funds. Investment Management Affiliates does not include entities associated with Morgan Stanley Wealth Management, such as Morgan Stanley Smith Barney LLC and Morgan Stanley & Co. |
| Affiliates | Companies related by common ownership or control. They can be financial and nonfinancial companies.■ Our affiliates include companies with a Morgan Stanley name and financial companies such as Morgan Stanley Smith Barney LLC and Morgan Stanley & Co. |
| Nonaffiliates | Companies not related by common ownership or control. They can be financial and nonfinancial companies.■ Eaton Vance does not share with nonaffiliates so they can market to you. |
| Joint marketing | A formal agreement between nonaffiliated financial companies that together market financial products or services to you.■ Eaton Vance doesn’t jointly market. |
| Other important information |
| Vermont: Except as permitted by law, we will not share personal information we collect about Vermont residents with Nonaffiliates unless you provide us with your written consent to share such information.California: Except as permitted by law, we will not share personal information we collect about California residents with Nonaffiliates and we will limit sharing such personal information with our Affiliates to comply with California privacy laws that apply to us. |
Delivery of Shareholder Documents. The Securities and Exchange Commission (SEC) permits funds to deliver only one copy of shareholder documents, including prospectuses, proxy statements and shareholder reports, to fund investors with multiple accounts at the same residential or post office box address. This practice is often called “householding” and it helps eliminate duplicate mailings to shareholders. Calvert funds, or your financial intermediary, may household the mailing of your documents indefinitely unless you instruct Calvert funds, or your financial intermediary, otherwise. If you would prefer that your Calvert fund documents not be householded, please contact Calvert funds at 1-800-368-2745, or contact your financial intermediary. Your instructions that householding not apply to delivery of your Calvert fund documents will typically be effective within 30 days of receipt by Calvert funds or your financial intermediary.
Portfolio Holdings. Each Calvert fund files a schedule of portfolio holdings on Part F to Form N-PORT with the SEC. Certain information filed on Form N-PORT may be viewed on the Calvert website at www.calvert.com, by calling Calvert at 1-800-368-2745 or in the EDGAR database on the SEC’s website at www.sec.gov.
Proxy Voting. The Proxy Voting Guidelines that each Calvert fund uses to determine how to vote proxies relating to portfolio securities is provided as an Appendix to the fund’s Statement of Additional Information. The Statement of Additional Information can be obtained free of charge by calling the Calvert funds at 1-800-368-2745, by visiting the Calvert funds’ website at www.calvert.com or visiting the SEC’s website at www.sec.gov. Information regarding how a Calvert fund voted proxies relating to portfolio securities during the most recent 12-month period ended June 30 is available by calling Calvert funds, by visiting the Calvert funds’ website at www.calvert.com or by visiting the SEC’s website at www.sec.gov.
Tailored Shareholder Reports. Effective January 24, 2023, the SEC adopted rule and form amendments to require open-end mutual funds and ETFs to transmit concise and visually engaging streamlined annual and semiannual reports to shareholders that highlight key information. Other information, including financial statements, will no longer appear in a streamlined shareholder report but must be available online, delivered free of charge upon request, and filed on a semiannual basis on Form N-CSR. The rule and form amendments have a compliance date of July 24, 2024. At this time, management is evaluating the impact of these amendments on the shareholder reports for the Calvert Funds.
This Page Intentionally Left Blank
Investment Adviser and Administrator
Calvert Research and Management
2050 M Street NW
Washington, DC 20036
Principal Underwriter*
Eaton Vance Distributors, Inc.
Two International Place
Boston, MA 02110
(617) 482-8260
Custodian
State Street Bank and Trust Company
One Congress Street, Suite 1
Boston, MA 02114-2016
Transfer Agent
SS&C Global Investor & Distribution Solutions, Inc.
2000 Crown Colony Drive
Quincy, MA 02169
Independent Registered Public Accounting Firm
Deloitte & Touche LLP
200 Berkeley Street
Boston, MA 02116-5022
Fund Offices
2050 M Street NW
Washington, DC 20036
* FINRA BrokerCheck. Investors may check the background of their Investment Professional by contacting the Financial Industry Regulatory Authority (FINRA). FINRA BrokerCheck is a free tool to help investors check the professional background of current and former FINRA-registered securities firms and brokers. FINRA BrokerCheck is available by calling 1-800-289-9999 and at www.FINRA.org. The FINRA BrokerCheck brochure describing this program is available to investors at www.FINRA.org.
Printed on recycled paper.
24189 9.30.23
Calvert
US Large-Cap Value Responsible Index Fund
Annual Report
September 30, 2023
Commodity Futures Trading Commission Registration. The Commodity Futures Trading Commission (“CFTC”) has adopted regulations that subject registered investment companies and advisers to regulation by the CFTC if a fund invests more than a prescribed level of its assets in certain CFTC-regulated instruments (including futures, certain options and swap agreements) or markets itself as providing investment exposure to such instruments. The adviser has claimed an exclusion from the definition of “commodity pool operator” under the Commodity Exchange Act with respect to its management of the Fund and the other funds it manages. Accordingly, neither the Fund nor the adviser is subject to CFTC regulation.
Fund shares are not insured by the FDIC and are not deposits or other obligations of, or guaranteed by, any depository institution. Shares are subject to investment risks, including possible loss of principal invested.
This report must be preceded or accompanied by a current summary prospectus or prospectus. Before investing, investors should consider carefully the investment objective, risks, and charges and expenses of a mutual fund. This and other important information is contained in the summary prospectus and prospectus, which can be obtained from a financial intermediary. Prospective investors should read the prospectus carefully before investing. For further information, please call 1-800-368-2745.
Choose Planet-friendly E-delivery!
Sign up now for on-line statements, prospectuses, and fund reports. In less than five minutes you can help reduce paper mail and lower fund costs.
Just go to www.calvert.com. If you already have an online account with the Calvert funds, click on Login to access your Account and select the documents you would like to receive via e-mail.
If you’re new to online account access, click on Login, then Register to create your user name and password. Once you’re in, click on the E-delivery sign-up on the Account Portfolio page and follow the quick, easy steps.
Note: If your shares are not held directly with the Calvert funds but through a brokerage firm, you must contact your broker for electronic delivery options available through their firm.
Annual Report September 30, 2023
Calvert
US Large-Cap Value Responsible Index Fund
Calvert
US Large-Cap Value Responsible Index Fund
September 30, 2023
Management's Discussion of Fund Performance†
Economic and Market Conditions
For U.S. equity investors, the 12-month period ended September 30, 2023, was a roller-coaster ride, driven largely by shifting perceptions of whether the U.S. Federal Reserve (the Fed) could bring the world’s largest economy in for a soft landing, and changing expectations of how long interest rates might remain high.
During the opening two months of the period, stocks rallied on strong corporate earnings, attractive valuations, and hope the Fed might slow the pace of its interest rate hikes. But in December 2022, equities lost ground as “higher for longer” interest rate fears returned. A continuing irony throughout the period was that good economic news -- record low unemployment, strong job creation, and robust consumer spending -- was viewed as bad news for inflation and fuel for further rate hikes that would weigh on stock prices.
In January 2023, however, U.S. equities began a rally that lasted through July. The initial tailwind was ChatGPT, an artificial intelligence (AI) application that led investors to perceive AI might become the next big innovation to drive the information technology (IT) sector. As a result, IT -- one of the worst-performing sectors in 2022 -- became the standout sector of the first half of 2023. Earlier recession fears that had weighed on stock prices receded as many investors came around to the view that the U.S. economy was doing surprisingly well.
But in the final two months of the period, the bond market halted the stock market’s momentum. As it became clear the Fed would keep rates higher for longer than investors had anticipated just a few months earlier, longer term bond interest rates rose sharply. Given the potential for relatively attractive returns with lower risk than stocks, many investors shifted from equity assets to bonds. Stock prices ended on a down note as the period came to a close.
For the period as a whole, however, U.S. equity performance was strong. The S&P 500®, a broad measure of U.S. stocks, returned 21.62%; the blue-chip Dow Jones Industrial Average® returned 19.18%; and the tech-heavy Nasdaq Composite Index® returned 26.11%.
Fund Performance
For the 12-month period ended September 30, 2023, Calvert US Large-Cap Value Responsible Index Fund (the Fund) returned 10.13% for Class A shares at net asset value (NAV). The Fund underperformed its primary benchmark, the Russell 1000® Value Index (the Index), which returned 14.44%; and underperformed its secondary benchmark, the Calvert US Large-Cap Value Responsible Index (the Calvert Index), which returned 10.64% during the period.
The Fund’s underperformance versus the Calvert Index was due to Fund expenses and fees, which the Calvert Index does not incur.
Of the 11 market sectors held by the Fund, all except the utilities and health care sectors delivered positive returns during the period. The strongest-performing sectors were industrials, information technology (IT), and materials. The weakest-performing sectors were utilities, health care, and energy.
Detractors from Fund performance versus the Index included stock selections and an overweight position in the financials sector, which struggled under the weight of three of the largest bank failures in U.S. history during the period; stock selections and an underweight position in the communication services sector, the best-performing sector within the Index during the period; and an underweight position in the energy sector.
In the financials sector, not owning Index component Berkshire Hathaway, Inc. (Berkshire Hathaway) detracted from Index-relative returns during the period. Berkshire Hathaway, Warren Buffett’s Nebraska-based multinational conglomerate, posted an all-time high for its stock price in September 2023, as its core insurance businesses -- including wholly-owned subsidiary GEICO -- performed strongly, and many of its diversified holdings delivered robust earnings during the period as well.
In the communication services sector, not owning Index component Meta Platforms, Inc. (Meta) -- the social media company behind Facebook, Instagram, and Messenger -- hurt returns relative to the Index during the period. Meta’s stock price doubled as advertising revenues rebounded on improved ad targeting, while profit margins exceeded expectations due to more rational spending on longer-term initiatives.
In contrast, contributors to Fund performance versus the Index included stock selections and an overweight position in the industrials sector; an underweight position in the health care sector; and an underweight position in the real estate sector, which delivered weak returns during the period as property sales were hampered by rising mortgage rates and companies cut back on office space after the pandemic.
In the industrials sector, an overweight position in construction and mining equipment maker Caterpillar, Inc. (Caterpillar) helped performance relative to the Index during the period. Caterpillar’s stock price reached an all-time high in September 2023 in response to the company’s cost-control efforts and increasing demand for its products, due in part to government stimulus from the Infrastructure Investment and Jobs Act, and the Inflation Reduction Act.
See Endnotes and Additional Disclosures in this report.
Past performance is no guarantee of future results. Returns are historical and are calculated by determining the percentage change in net asset value (NAV) or offering price (as applicable) with all distributions reinvested. Furthermore, returns do not reflect the deduction of taxes that shareholders may have to pay on Fund distributions or upon the redemption of Fund shares. Investment return and principal value will fluctuate so that shares, when redeemed, may be worth more or less than their original cost. Performance for periods less than or equal to one year is cumulative. Performance is for the stated time period only; due to market volatility, current Fund performance may be lower or higher than the quoted return. For performance as of the most recent month-end, please refer to www.calvert.com.
Calvert
US Large-Cap Value Responsible Index Fund
September 30, 2023
Performance
Portfolio Manager(s) Thomas C. Seto of Calvert Research and Management
| % Average Annual Total Returns1,2 | Class
Inception Date | Performance
Inception Date | One Year | Five Years | Since
Inception |
| Class A at NAV | 06/19/2015 | 06/19/2015 | 10.13% | 5.45% | 6.47% |
| Class A with 4.75% Maximum Sales Charge | — | — | 4.90 | 4.43 | 5.85 |
| Class I at NAV | 06/19/2015 | 06/19/2015 | 10.41 | 5.72 | 6.78 |
| Class R6 at NAV | 02/01/2022 | 06/19/2015 | 10.44 | 5.74 | 6.79 |
|
| Russell 1000® Value Index | — | — | 14.44% | 6.22% | 7.16% |
| Calvert US Large-Cap Value Responsible Index | — | — | 10.64 | 5.95 | 7.04 |
| % Total Annual Operating Expense Ratios3 | Class A | Class I | Class R6 |
| Gross | 0.61% | 0.36% | 0.31% |
| Net | 0.49 | 0.24 | 0.19 |
Growth of $10,000
This graph shows the change in value of a hypothetical investment of $10,000 in Class A of the Fund for the period indicated. For comparison, the same investment is shown in the indicated index.
| Growth of Investment2 | Amount Invested | Period Beginning | At NAV | With Maximum Sales Charge |
| Class I, at minimum investment | $1,000,000 | 06/19/2015 | $1,722,520 | N.A. |
| Class R6, at minimum investment | $5,000,000 | 06/19/2015 | $8,618,815 | N.A. |
See Endnotes and Additional Disclosures in this report.
Past performance is no guarantee of future results. Returns are historical and are calculated by determining the percentage change in net asset value (NAV) or offering price (as applicable) with all distributions reinvested. Furthermore, returns do not reflect the deduction of taxes that shareholders may have to pay on Fund distributions or upon the redemption of Fund shares. Investment return and principal value will fluctuate so that shares, when redeemed, may be worth more or less than their original cost. Performance for periods less than or equal to one year is cumulative. Performance is for the stated time period only; due to market volatility, current Fund performance may be lower or higher than the quoted return. For performance as of the most recent month-end, please refer to www.calvert.com.
Calvert
US Large-Cap Value Responsible Index Fund
September 30, 2023
| Sector Allocation (% of net assets)1 |
| Top 10 Holdings (% of net assets)1 | |
| JPMorgan Chase & Co. | 3.8% |
| Bank of America Corp. | 1.8 |
| Pfizer, Inc. | 1.8 |
| Walmart, Inc. | 1.6 |
| Wells Fargo & Co. | 1.4 |
| Intel Corp. | 1.3 |
| Verizon Communications, Inc. | 1.3 |
| Cisco Systems, Inc. | 1.1 |
| AT&T, Inc. | 1.1 |
| Goldman Sachs Group, Inc. (The) | 1.1 |
| Total | 16.3% |
Footnotes:
| 1 | Excludes cash and cash equivalents. |
Calvert
US Large-Cap Value Responsible Index Fund
September 30, 2023
Endnotes and Additional Disclosures
| † | The views expressed in this report are those of the portfolio manager(s) and are current only through the date stated at the top of this page. These views are subject to change at any time based upon market or other conditions, and Calvert and the Fund(s) disclaim any responsibility to update such views. These views may not be relied upon as investment advice and, because investment decisions are based on many factors, may not be relied upon as an indication of trading intent on behalf of any Calvert fund. This commentary may contain statements that are not historical facts, referred to as “forward-looking statements.” The Fund’s actual future results may differ significantly from those stated in any forward-looking statement, depending on factors such as changes in securities or financial markets or general economic conditions, the volume of sales and purchases of Fund shares, the continuation of investment advisory, administrative and service contracts, and other risks discussed from time to time in the Fund’s filings with the Securities and Exchange Commission. |
| | |
| 1 | Russell 1000® Value Index is an unmanaged index of U.S. large-cap value stocks. Calvert US Large-Cap Value Responsible Index (the “Calvert Index”) is composed of common stocks of large value companies that operate their businesses in a manner that is consistent with the Calvert Principles for Responsible Investment. Large value companies are selected from the 1,000 largest publicly traded U.S. companies based on market capitalization and value style factors, excluding real estate investment trusts and business development companies. The Calvert Principles for Responsible Investment serve as a framework for considering environmental, social and governance factors that may affect investment performance. Stocks are weighted in the Calvert Index based on their float-adjusted market capitalization within the relevant sector, subject to certain prescribed limits. Unless otherwise stated, index returns do not reflect the effect of any applicable sales charges, commissions, expenses, taxes or leverage, as applicable. It is not possible to invest directly in an index. |
| 2 | Total Returns at NAV do not include applicable sales charges. If sales charges were deducted, the returns would be lower. Total Returns shown with maximum sales charge reflect the stated maximum sales charge. Unless otherwise stated, performance does not reflect the deduction of taxes on Fund distributions or redemptions of Fund shares. |
| | Performance prior to the inception date of a class may be linked to the performance of an older class of the Fund. This linked performance is adjusted for any applicable sales charge, but is not adjusted for class expense differences. If adjusted for such differences, the performance would be different. The performance of Class R6 is linked to Class I. Performance since inception for an index, if presented, is the performance since the Fund's or oldest share class's inception, as applicable. Performance presented in the Financial Highlights included in the financial statements is not linked.Calvert Research and Management became the investment adviser to the Fund on December 31, 2016. Performance reflected prior to such date is that of the Fund’s former investment adviser. |
| 3 | Source: Fund prospectus. Net expense ratios reflect a contractual expense reimbursement that continues through 1/31/24. The expense ratios for the current reporting period can be found in the Financial Highlights section of this report. Performance reflects expenses waived and/or reimbursed, if applicable. Without such waivers and/or reimbursements, performance would have been lower. |
| | Additional Information |
| | S&P 500® Index is an unmanaged index of large-cap stocks
commonly used as a measure of U.S. stock market performance. Dow Jones Industrial Average® is a price-weighted average of 30 blue-chip stocks that are generally the leaders in their industry. S&P Dow Jones Indices are a product of S&P Dow Jones Indices LLC (“S&P DJI”) and have been licensed for use. S&P® and S&P 500® are registered trademarks of S&P DJI; Dow Jones® is a registered trademark of Dow Jones Trademark Holdings LLC (“Dow Jones”); S&P DJI, Dow Jones and their respective affiliates do not sponsor, endorse, sell or promote the Fund, will not have any liability with respect thereto and do not have any liability for any errors, omissions, or interruptions of the S&P Dow Jones Indices. Nasdaq Composite Index is a market capitalization-weighted index of all domestic and international securities listed on Nasdaq. Source: Nasdaq, Inc. The information is provided by Nasdaq (with its affiliates, are referred to as the “Corporations”) and Nasdaq’s third party licensors on an “as is” basis and the Corporations make no guarantees and bear no liability of any kind with respect to the information or the Fund. |
Calvert
US Large-Cap Value Responsible Index Fund
September 30, 2023
Example
As a Fund shareholder, you incur two types of costs: (1) transaction costs, including sales charges (loads) on purchases; and (2) ongoing costs, including management fees; distribution and/or service fees; and other Fund expenses. This Example is intended to help you understand your ongoing costs (in dollars) of Fund investing and to compare these costs with the ongoing costs of investing in other mutual funds. The Example is based on an investment of $1,000 invested at the beginning of the period and held for the entire period (April 1, 2023 to September 30, 2023).
Actual Expenses
The first section of the table below provides information about actual account values and actual expenses. You may use the information in this section, together with the amount you invested, to estimate the expenses that you paid over the period. Simply divide your account value by $1,000 (for example, an $8,600 account value divided by $1,000 = 8.6), then multiply the result by the number in the first section under the heading entitled “Expenses Paid During Period” to estimate the expenses you paid on your account during this period.
Hypothetical Example for Comparison Purposes
The second section of the table below provides information about hypothetical account values and hypothetical expenses based on the actual Fund expense ratio and an assumed rate of return of 5% per year (before expenses), which is not the actual Fund return. The hypothetical account values and expenses may not be used to estimate the actual ending account balance or expenses you paid for the period. You may use this information to compare the ongoing costs of investing in the Fund and other funds. To do so, compare this 5% hypothetical example with the 5% hypothetical examples that appear in the shareholder reports of the other funds.
Please note that the expenses shown in the table are meant to highlight your ongoing costs only and do not reflect any transactional costs, such as sales charges (loads). Therefore, the second section of the table is useful in comparing ongoing costs only, and will not help you determine the relative total costs of owning different funds. In addition, if these transactional costs were included, your costs would be higher.
| | Beginning
Account Value
(4/1/23) | Ending
Account Value
(9/30/23) | Expenses Paid
During Period*
(4/1/23 – 9/30/23) | Annualized
Expense
Ratio |
| Actual | | | | |
| Class A | $1,000.00 | $ 986.80 | $2.44 ** | 0.49% |
| Class I | $1,000.00 | $ 987.60 | $1.20 ** | 0.24% |
| Class R6 | $1,000.00 | $ 988.00 | $0.95 ** | 0.19% |
| Hypothetical | | | | |
| (5% return per year before expenses) | | | | |
| Class A | $1,000.00 | $1,022.61 | $2.48 ** | 0.49% |
| Class I | $1,000.00 | $1,023.87 | $1.22 ** | 0.24% |
| Class R6 | $1,000.00 | $1,024.12 | $0.96 ** | 0.19% |
| * | Expenses are equal to the Fund's annualized expense ratio for the indicated Class, multiplied by the average account value over the period, multiplied by 183/365 (to reflect the one-half year period). The Example assumes that the $1,000 was invested at the net asset value per share determined at the close of business on March 31, 2023. |
| ** | Absent a waiver and/or reimbursement of expenses by affiliate(s), expenses would be higher. |
Calvert
US Large-Cap Value Responsible Index Fund
September 30, 2023
| Security | Shares | Value |
| Aerospace & Defense — 0.3% | |
| Curtiss-Wright Corp. | | 8,106 | $ 1,585,777 |
| Hexcel Corp. | | 21,680 | 1,412,235 |
| Woodward, Inc. | | 10,151 | 1,261,363 |
| | | | $ 4,259,375 |
| Air Freight & Logistics — 1.6% | |
| C.H. Robinson Worldwide, Inc. | | 26,278 | $ 2,263,324 |
| FedEx Corp. | | 39,532 | 10,472,817 |
| GXO Logistics, Inc.(1) | | 17,473 | 1,024,792 |
| United Parcel Service, Inc., Class B | | 83,039 | 12,943,289 |
| | | | $ 26,704,222 |
| Automobile Components — 0.5% | |
| Aptiv PLC(1) | | 12,845 | $ 1,266,388 |
| Autoliv, Inc. | | 22,941 | 2,213,348 |
| BorgWarner, Inc. | | 61,932 | 2,500,195 |
| Lear Corp. | | 15,752 | 2,113,918 |
| | | | $ 8,093,849 |
| Automobiles — 1.5% | |
| Ford Motor Co. | | 749,362 | $ 9,307,076 |
| General Motors Co. | | 269,966 | 8,900,779 |
| Harley-Davidson, Inc. | | 38,598 | 1,276,050 |
| Rivian Automotive, Inc., Class A(1)(2) | | 172,594 | 4,190,582 |
| Thor Industries, Inc. | | 13,880 | 1,320,405 |
| | | | $ 24,994,892 |
| Banks — 12.3% | |
| Bank of America Corp. | | 1,066,266 | $ 29,194,363 |
| Bank OZK | | 21,968 | 814,354 |
| BOK Financial Corp. | | 5,835 | 466,683 |
| Citigroup, Inc. | | 327,320 | 13,462,672 |
| Citizens Financial Group, Inc. | | 102,949 | 2,759,033 |
| Columbia Banking System, Inc. | | 43,610 | 885,283 |
| Comerica, Inc. | | 29,230 | 1,214,506 |
| Commerce Bancshares, Inc. | | 25,266 | 1,212,263 |
| Cullen/Frost Bankers, Inc. | | 12,572 | 1,146,692 |
| East West Bancorp, Inc. | | 29,719 | 1,566,488 |
| F.N.B. Corp. | | 78,979 | 852,183 |
| Fifth Third Bancorp | | 144,854 | 3,669,152 |
| First Citizens Bancshares, Inc., Class A | | 2,230 | 3,077,623 |
| First Financial Bankshares, Inc. | | 27,824 | 698,939 |
| First Horizon Corp. | | 112,700 | 1,241,954 |
| Home BancShares, Inc. | | 35,935 | 752,479 |
| Huntington Bancshares, Inc. | | 305,402 | 3,176,181 |
| JPMorgan Chase & Co. | | 421,926 | 61,187,708 |
| KeyCorp | | 199,506 | 2,146,685 |
| M&T Bank Corp. | | 35,313 | 4,465,329 |
| Security | Shares | Value |
| Banks (continued) | |
| New York Community Bancorp, Inc. | | 149,102 | $ 1,690,817 |
| Old National Bancorp | | 54,865 | 797,737 |
| Pinnacle Financial Partners, Inc. | | 16,044 | 1,075,590 |
| PNC Financial Services Group, Inc. (The) | | 76,871 | 9,437,453 |
| Popular, Inc. | | 15,010 | 945,780 |
| Prosperity Bancshares, Inc. | | 17,534 | 957,006 |
| Regions Financial Corp. | | 200,316 | 3,445,435 |
| SouthState Corp. | | 14,519 | 978,000 |
| Synovus Financial Corp. | | 27,396 | 761,609 |
| Truist Financial Corp. | | 266,614 | 7,627,827 |
| U.S. Bancorp | | 284,433 | 9,403,355 |
| United Bankshares, Inc. | | 28,248 | 779,362 |
| Valley National Bancorp | | 90,441 | 774,175 |
| Webster Financial Corp. | | 36,459 | 1,469,662 |
| Wells Fargo & Co. | | 575,101 | 23,498,627 |
| Western Alliance Bancorp | | 19,775 | 909,057 |
| Wintrust Financial Corp. | | 12,546 | 947,223 |
| Zions Bancorp N.A. | | 32,841 | 1,145,822 |
| | | | $ 200,635,107 |
| Beverages — 1.6% | |
| Coca-Cola Co. (The) | | 275,391 | $ 15,416,388 |
| Keurig Dr Pepper, Inc. | | 158,456 | 5,002,456 |
| PepsiCo, Inc. | | 32,768 | 5,552,210 |
| | | | $ 25,971,054 |
| Biotechnology — 2.6% | |
| ACADIA Pharmaceuticals, Inc.(1) | | 34,985 | $ 729,087 |
| Alkermes PLC(1) | | 37,354 | 1,046,286 |
| Amgen, Inc. | | 51,995 | 13,974,176 |
| Apellis Pharmaceuticals, Inc.(1) | | 27,717 | 1,054,355 |
| Arrowhead Pharmaceuticals, Inc.(1) | | 30,145 | 809,996 |
| Biogen, Inc.(1) | | 21,448 | 5,512,350 |
| Blueprint Medicines Corp.(1) | | 3,876 | 194,653 |
| Exact Sciences Corp.(1) | | 20,491 | 1,397,896 |
| Gilead Sciences, Inc. | | 158,198 | 11,855,358 |
| Ionis Pharmaceuticals, Inc.(1) | | 36,207 | 1,642,349 |
| Sarepta Therapeutics, Inc.(1) | | 7,422 | 899,695 |
| Seagen, Inc.(1) | | 13,280 | 2,817,352 |
| United Therapeutics Corp.(1) | | 4,679 | 1,056,846 |
| | | | $ 42,990,399 |
| Broadline Retail — 0.0%(3) | |
| Macy's, Inc. | | 58,581 | $ 680,125 |
| | | | $ 680,125 |
| Building Products — 1.4% | |
| Allegion PLC | | 4,497 | $ 468,587 |
| Carlisle Cos., Inc. | | 9,473 | 2,455,970 |
| Carrier Global Corp. | | 120,633 | 6,658,942 |
7
See Notes to Financial Statements.
Calvert
US Large-Cap Value Responsible Index Fund
September 30, 2023
Schedule of Investments — continued
| Security | Shares | Value |
| Building Products (continued) | |
| Fortune Brands Innovations, Inc. | | 23,674 | $ 1,471,576 |
| Masco Corp. | | 15,650 | 836,493 |
| Owens Corning | | 30,140 | 4,111,397 |
| Trane Technologies PLC | | 26,957 | 5,469,845 |
| UFP Industries, Inc. | | 12,131 | 1,242,214 |
| Zurn Elkay Water Solutions Corp., Class C | | 9,865 | 276,417 |
| | | | $ 22,991,441 |
| Capital Markets — 6.0% | |
| Affiliated Managers Group, Inc. | | 7,546 | $ 983,546 |
| Ameriprise Financial, Inc. | | 14,212 | 4,685,412 |
| Bank of New York Mellon Corp. (The) | | 164,881 | 7,032,175 |
| BlackRock, Inc. | | 20,638 | 13,342,261 |
| Carlyle Group, Inc. (The) | | 39,887 | 1,202,992 |
| Charles Schwab Corp. (The) | | 212,237 | 11,651,811 |
| CME Group, Inc. | | 62,838 | 12,581,424 |
| Evercore, Inc., Class A | | 5,840 | 805,219 |
| Franklin Resources, Inc. | | 62,181 | 1,528,409 |
| Goldman Sachs Group, Inc. (The) | | 53,591 | 17,340,440 |
| Hamilton Lane, Inc., Class A | | 3,666 | 331,553 |
| Houlihan Lokey, Inc. | | 3,676 | 393,773 |
| Interactive Brokers Group, Inc., Class A | | 14,973 | 1,296,063 |
| Intercontinental Exchange, Inc. | | 17,467 | 1,921,719 |
| Invesco, Ltd. | | 96,033 | 1,394,399 |
| Jefferies Financial Group, Inc. | | 57,320 | 2,099,632 |
| LPL Financial Holdings, Inc. | | 2,075 | 493,124 |
| Nasdaq, Inc. | | 22,559 | 1,096,142 |
| Northern Trust Corp. | | 43,681 | 3,034,956 |
| Raymond James Financial, Inc. | | 39,792 | 3,996,311 |
| State Street Corp. | | 67,272 | 4,504,533 |
| Stifel Financial Corp. | | 21,255 | 1,305,907 |
| T. Rowe Price Group, Inc. | | 37,813 | 3,965,449 |
| Tradeweb Markets, Inc., Class A | | 2,500 | 200,500 |
| | | | $ 97,187,750 |
| Chemicals — 2.5% | |
| Air Products & Chemicals, Inc. | | 18,605 | $ 5,272,657 |
| Ashland, Inc. | | 14,027 | 1,145,725 |
| Axalta Coating Systems, Ltd.(1) | | 30,767 | 827,632 |
| Cabot Corp. | | 23,504 | 1,628,122 |
| Celanese Corp. | | 35,305 | 4,431,484 |
| Eastman Chemical Co. | | 47,870 | 3,672,586 |
| Ecolab, Inc. | | 26,780 | 4,536,532 |
| Element Solutions, Inc. | | 46,592 | 913,669 |
| FMC Corp. | | 27,503 | 1,841,876 |
| Huntsman Corp. | | 69,676 | 1,700,094 |
| International Flavors & Fragrances, Inc. | | 65,793 | 4,485,109 |
| Mosaic Co. (The) | | 111,660 | 3,975,096 |
| PPG Industries, Inc. | | 37,096 | 4,815,061 |
| Security | Shares | Value |
| Chemicals (continued) | |
| Sherwin-Williams Co. (The) | | 6,130 | $ 1,563,457 |
| | | | $ 40,809,100 |
| Commercial Services & Supplies — 0.6% | |
| Clean Harbors, Inc.(1) | | 4,277 | $ 715,799 |
| Republic Services, Inc. | | 20,250 | 2,885,828 |
| Stericycle, Inc.(1) | | 15,226 | 680,754 |
| Tetra Tech, Inc. | | 3,270 | 497,138 |
| Waste Management, Inc. | | 27,114 | 4,133,258 |
| | | | $ 8,912,777 |
| Communications Equipment — 1.2% | |
| Ciena Corp.(1) | | 745 | $ 35,209 |
| Cisco Systems, Inc. | | 332,949 | 17,899,338 |
| Juniper Networks, Inc. | | 54,371 | 1,510,970 |
| Viasat, Inc.(1)(2) | | 7,736 | 142,807 |
| | | | $ 19,588,324 |
| Construction & Engineering — 0.4% | |
| AECOM | | 31,979 | $ 2,655,536 |
| Comfort Systems USA, Inc. | | 66 | 11,247 |
| EMCOR Group, Inc. | | 10,147 | 2,134,827 |
| MasTec, Inc.(1) | | 6,580 | 473,562 |
| Valmont Industries, Inc. | | 2,427 | 582,990 |
| WillScot Mobile Mini Holdings Corp.(1) | | 8,235 | 342,494 |
| | | | $ 6,200,656 |
| Construction Materials — 0.1% | |
| Summit Materials, Inc., Class A(1) | | 49,281 | $ 1,534,610 |
| Vulcan Materials Co. | | 4,275 | 863,636 |
| | | | $ 2,398,246 |
| Consumer Finance — 1.9% | |
| Ally Financial, Inc. | | 63,854 | $ 1,703,625 |
| American Express Co. | | 68,279 | 10,186,544 |
| Capital One Financial Corp. | | 76,142 | 7,389,581 |
| Credit Acceptance Corp.(1) | | 397 | 182,668 |
| Discover Financial Services | | 52,724 | 4,567,480 |
| FirstCash Holdings, Inc. | | 6,226 | 624,966 |
| OneMain Holdings, Inc. | | 23,240 | 931,691 |
| SLM Corp. | | 50,401 | 686,462 |
| SoFi Technologies, Inc.(1) | | 143,972 | 1,150,336 |
| Synchrony Financial | | 91,125 | 2,785,691 |
| | | | $ 30,209,044 |
| Consumer Staples Distribution & Retail — 4.6% | |
| Albertsons Cos., Inc., Class A | | 129,130 | $ 2,937,708 |
| BJ's Wholesale Club Holdings, Inc.(1) | | 22,483 | 1,604,612 |
| Casey's General Stores, Inc. | | 9,959 | 2,704,068 |
| Costco Wholesale Corp. | | 12,632 | 7,136,575 |
8
See Notes to Financial Statements.
Calvert
US Large-Cap Value Responsible Index Fund
September 30, 2023
Schedule of Investments — continued
| Security | Shares | Value |
| Consumer Staples Distribution & Retail (continued) | |
| Dollar General Corp. | | 17,585 | $ 1,860,493 |
| Dollar Tree, Inc.(1) | | 23,356 | 2,486,246 |
| Kroger Co. (The) | | 151,983 | 6,801,239 |
| Performance Food Group Co.(1) | | 46,444 | 2,733,694 |
| Sprouts Farmers Market, Inc.(1) | | 28,371 | 1,214,279 |
| Sysco Corp. | | 105,890 | 6,994,034 |
| Target Corp. | | 77,557 | 8,575,477 |
| US Foods Holding Corp.(1) | | 76,073 | 3,020,098 |
| Walmart, Inc. | | 161,969 | 25,903,702 |
| | | | $ 73,972,225 |
| Containers & Packaging — 1.7% | |
| AptarGroup, Inc. | | 12,778 | $ 1,597,761 |
| Avery Dennison Corp. | | 15,059 | 2,750,827 |
| Ball Corp. | | 24,296 | 1,209,455 |
| Berry Global Group, Inc. | | 46,772 | 2,895,654 |
| Crown Holdings, Inc. | | 43,404 | 3,840,386 |
| Graphic Packaging Holding Co. | | 99,228 | 2,210,800 |
| Packaging Corp. of America | | 29,373 | 4,510,224 |
| Sealed Air Corp. | | 43,017 | 1,413,539 |
| Silgan Holdings, Inc. | | 30,764 | 1,326,236 |
| Sonoco Products Co. | | 41,213 | 2,239,927 |
| WestRock Co. | | 101,204 | 3,623,103 |
| | | | $ 27,617,912 |
| Distributors — 0.4% | |
| Genuine Parts Co. | | 24,580 | $ 3,548,860 |
| LKQ Corp. | | 53,939 | 2,670,520 |
| | | | $ 6,219,380 |
| Diversified Consumer Services — 0.1% | |
| Service Corp. International | | 18,469 | $ 1,055,319 |
| | | | $ 1,055,319 |
| Diversified Telecommunication Services — 2.4% | |
| AT&T, Inc. | | 1,175,448 | $ 17,655,229 |
| Verizon Communications, Inc. | | 663,219 | 21,494,928 |
| | | | $ 39,150,157 |
| Electric Utilities — 3.0% | |
| Alliant Energy Corp. | | 75,649 | $ 3,665,194 |
| Avangrid, Inc. | | 21,037 | 634,686 |
| Constellation Energy Corp. | | 52,290 | 5,703,793 |
| Evergy, Inc. | | 67,264 | 3,410,285 |
| Eversource Energy | | 88,601 | 5,152,148 |
| Exelon Corp. | | 198,864 | 7,515,071 |
| IDACORP, Inc. | | 14,927 | 1,397,913 |
| NextEra Energy, Inc. | | 228,027 | 13,063,667 |
| PNM Resources, Inc. | | 20,211 | 901,613 |
| Portland General Electric Co. | | 30,248 | 1,224,439 |
| Security | Shares | Value |
| Electric Utilities (continued) | |
| Xcel Energy, Inc. | | 119,809 | $ 6,855,471 |
| | | | $ 49,524,280 |
| Electrical Equipment — 1.9% | |
| Acuity Brands, Inc. | | 8,436 | $ 1,436,735 |
| AMETEK, Inc. | | 8,360 | 1,235,274 |
| Atkore, Inc.(1) | | 250 | 37,297 |
| Eaton Corp. PLC | | 38,169 | 8,140,684 |
| Emerson Electric Co. | | 68,935 | 6,657,053 |
| EnerSys | | 4,521 | 428,003 |
| Hubbell, Inc. | | 5,748 | 1,801,481 |
| nVent Electric PLC | | 39,401 | 2,087,859 |
| Plug Power, Inc.(1)(2) | | 79,727 | 605,925 |
| Regal Rexnord Corp. | | 19,352 | 2,765,014 |
| Rockwell Automation, Inc. | | 8,900 | 2,544,243 |
| Sensata Technologies Holding PLC | | 48,195 | 1,822,735 |
| Sunrun, Inc.(1)(2) | | 37,757 | 474,228 |
| | | | $ 30,036,531 |
| Electronic Equipment, Instruments & Components — 1.2% | |
| Arrow Electronics, Inc.(1) | | 11,255 | $ 1,409,576 |
| Avnet, Inc. | | 16,955 | 817,061 |
| Belden, Inc. | | 13,026 | 1,257,660 |
| CDW Corp. | | 10,425 | 2,103,348 |
| Coherent Corp.(1) | | 18,710 | 610,694 |
| Corning, Inc. | | 93,521 | 2,849,585 |
| Insight Enterprises, Inc.(1) | | 5,443 | 791,957 |
| Jabil, Inc. | | 26,127 | 3,315,255 |
| Littelfuse, Inc. | | 1,925 | 476,091 |
| National Instruments Corp. | | 877 | 52,287 |
| TD SYNNEX Corp. | | 7,960 | 794,886 |
| Teledyne Technologies, Inc.(1) | | 6,287 | 2,568,743 |
| Trimble, Inc.(1) | | 32,300 | 1,739,678 |
| Vishay Intertechnology, Inc. | | 27,213 | 672,705 |
| | | | $ 19,459,526 |
| Energy Equipment & Services — 0.5% | |
| Baker Hughes Co. | | 211,793 | $ 7,480,529 |
| | | | $ 7,480,529 |
| Entertainment — 1.5% | |
| AMC Entertainment Holdings, Inc., Class A(1) | | 35,698 | $ 285,227 |
| Atlanta Braves Holdings, Inc., Class C(1) | | 8,407 | 300,382 |
| Liberty Media Corp.-Liberty Formula One, Class A(1) | | 37,462 | 2,118,102 |
| Liberty Media Corp.-Liberty Live, Class A(1) | | 10,256 | 327,372 |
| Live Nation Entertainment, Inc.(1) | | 4,285 | 355,826 |
| Madison Square Garden Sports Corp. | | 2,721 | 479,712 |
| Take-Two Interactive Software, Inc.(1) | | 15,314 | 2,149,932 |
| Walt Disney Co. (The)(1) | | 162,830 | 13,197,372 |
| Warner Bros. Discovery, Inc.(1) | | 519,729 | 5,644,257 |
9
See Notes to Financial Statements.
Calvert
US Large-Cap Value Responsible Index Fund
September 30, 2023
Schedule of Investments — continued
| Security | Shares | Value |
| Entertainment (continued) | |
| Warner Music Group Corp., Class A | | 9,351 | $ 293,621 |
| | | | $ 25,151,803 |
| Financial Services — 1.0% | |
| Equitable Holdings, Inc. | | 75,873 | $ 2,154,034 |
| Essent Group, Ltd. | | 21,959 | 1,038,441 |
| Euronet Worldwide, Inc.(1) | | 4,639 | 368,244 |
| Fidelity National Information Services, Inc. | | 127,440 | 7,043,609 |
| Fiserv, Inc.(1) | | 8,770 | 990,659 |
| MGIC Investment Corp. | | 54,232 | 905,132 |
| Radian Group, Inc. | | 33,126 | 831,794 |
| Voya Financial, Inc. | | 22,244 | 1,478,114 |
| Western Union Co. (The) | | 81,098 | 1,068,872 |
| | | | $ 15,878,899 |
| Food Products — 3.0% | |
| Bunge, Ltd. | | 43,072 | $ 4,662,544 |
| Campbell Soup Co. | | 47,679 | 1,958,653 |
| Conagra Brands, Inc. | | 147,707 | 4,050,126 |
| Darling Ingredients, Inc.(1) | | 5,366 | 280,105 |
| Flowers Foods, Inc. | | 51,974 | 1,152,783 |
| General Mills, Inc. | | 93,356 | 5,973,851 |
| Hormel Foods Corp. | | 70,413 | 2,677,806 |
| Ingredion, Inc. | | 19,544 | 1,923,130 |
| JM Smucker Co. (The) | | 29,655 | 3,644,896 |
| Kellogg Co. | | 48,829 | 2,905,814 |
| Kraft Heinz Co. (The) | | 189,349 | 6,369,700 |
| Lamb Weston Holdings, Inc. | | 6,940 | 641,673 |
| Lancaster Colony Corp. | | 924 | 152,488 |
| McCormick & Co., Inc. | | 36,039 | 2,725,990 |
| Mondelez International, Inc., Class A | | 149,903 | 10,403,268 |
| | | | $ 49,522,827 |
| Gas Utilities — 0.3% | |
| National Fuel Gas Co. | | 26,410 | $ 1,370,943 |
| New Jersey Resources Corp. | | 29,062 | 1,180,789 |
| ONE Gas, Inc. | | 16,146 | 1,102,449 |
| Southwest Gas Holdings, Inc. | | 16,188 | 977,917 |
| UGI Corp. | | 15,109 | 347,507 |
| | | | $ 4,979,605 |
| Ground Transportation — 2.0% | |
| Avis Budget Group, Inc.(1) | | 6,818 | $ 1,225,126 |
| J.B. Hunt Transport Services, Inc. | | 4,965 | 936,002 |
| Knight-Swift Transportation Holdings, Inc. | | 40,747 | 2,043,462 |
| Ryder System, Inc. | | 10,999 | 1,176,343 |
| Uber Technologies, Inc.(1) | | 327,843 | 15,077,500 |
| Union Pacific Corp. | | 49,030 | 9,983,979 |
| XPO, Inc.(1) | | 30,918 | 2,308,338 |
| | | | $ 32,750,750 |
| Security | Shares | Value |
| Health Care Equipment & Supplies — 1.8% | |
| Abbott Laboratories | | 60,379 | $ 5,847,706 |
| Baxter International, Inc. | | 7,121 | 268,747 |
| Becton Dickinson and Co. | | 11,927 | 3,083,487 |
| CONMED Corp. | | 3,143 | 316,972 |
| DENTSPLY SIRONA, Inc. | | 25,846 | 882,899 |
| Envista Holdings Corp.(1) | | 43,226 | 1,205,141 |
| Globus Medical, Inc., Class A(1) | | 2,885 | 143,240 |
| ICU Medical, Inc.(1) | | 1,026 | 122,104 |
| iRhythm Technologies, Inc.(1) | | 8,736 | 823,455 |
| Medtronic PLC | | 170,674 | 13,374,015 |
| Neogen Corp.(1) | | 32,562 | 603,700 |
| Novocure, Ltd.(1) | | 8,128 | 131,267 |
| Stryker Corp. | | 4,767 | 1,302,678 |
| Teleflex, Inc. | | 3,691 | 724,949 |
| | | | $ 28,830,360 |
| Health Care Providers & Services — 3.8% | |
| agilon health, Inc.(1)(2) | | 90,556 | $ 1,608,275 |
| AMN Healthcare Services, Inc.(1) | | 835 | 71,125 |
| Centene Corp.(1) | | 116,714 | 8,039,260 |
| CVS Health Corp. | | 218,967 | 15,288,276 |
| DaVita, Inc.(1) | | 9,426 | 891,040 |
| Elevance Health, Inc. | | 32,143 | 13,995,705 |
| Encompass Health Corp. | | 21,747 | 1,460,529 |
| Ensign Group, Inc. (The) | | 4,858 | 451,454 |
| HealthEquity, Inc.(1) | | 5,102 | 372,701 |
| Henry Schein, Inc.(1) | | 21,639 | 1,606,696 |
| Humana, Inc. | | 17,349 | 8,440,636 |
| Laboratory Corp. of America Holdings | | 13,768 | 2,768,056 |
| Molina Healthcare, Inc.(1) | | 8,013 | 2,627,383 |
| Option Care Health, Inc.(1) | | 20,784 | 672,362 |
| Quest Diagnostics, Inc. | | 19,183 | 2,337,640 |
| R1 RCM, Inc.(1) | | 31,568 | 475,730 |
| Select Medical Holdings Corp. | | 30,664 | 774,879 |
| | | | $ 61,881,747 |
| Hotels, Restaurants & Leisure — 1.1% | |
| Aramark | | 54,098 | $ 1,877,201 |
| Darden Restaurants, Inc. | | 24,692 | 3,536,388 |
| Hilton Grand Vacations, Inc.(1) | | 17,116 | 696,621 |
| Hilton Worldwide Holdings, Inc. | | 175 | 26,282 |
| Hyatt Hotels Corp., Class A | | 11,275 | 1,196,052 |
| Marriott International, Inc., Class A | | 14,915 | 2,931,692 |
| Marriott Vacations Worldwide Corp. | | 7,031 | 707,530 |
| Starbucks Corp. | | 37,205 | 3,395,700 |
| Texas Roadhouse, Inc. | | 3,423 | 328,950 |
| Vail Resorts, Inc. | | 6,952 | 1,542,579 |
| Wendy's Co. (The) | | 25,843 | 527,456 |
| Wyndham Hotels & Resorts, Inc. | | 13,409 | 932,462 |
| | | | $ 17,698,913 |
10
See Notes to Financial Statements.
Calvert
US Large-Cap Value Responsible Index Fund
September 30, 2023
Schedule of Investments — continued
| Security | Shares | Value |
| Household Durables — 1.5% | |
| D.R. Horton, Inc. | | 50,865 | $ 5,466,461 |
| KB Home | | 23,599 | 1,092,162 |
| Leggett & Platt, Inc. | | 24,259 | 616,421 |
| Lennar Corp., Class A | | 57,826 | 6,489,812 |
| Meritage Homes Corp. | | 10,636 | 1,301,740 |
| Mohawk Industries, Inc.(1) | | 9,944 | 853,295 |
| Newell Brands, Inc. | | 77,962 | 703,997 |
| PulteGroup, Inc. | | 61,535 | 4,556,667 |
| Taylor Morrison Home Corp.(1) | | 31,503 | 1,342,343 |
| TopBuild Corp.(1) | | 2,341 | 588,995 |
| Whirlpool Corp. | | 9,694 | 1,296,088 |
| | | | $ 24,307,981 |
| Household Products — 1.1% | |
| Colgate-Palmolive Co. | | 4,339 | $ 308,546 |
| Kimberly-Clark Corp. | | 39,230 | 4,740,946 |
| Procter & Gamble Co. (The) | | 85,164 | 12,422,021 |
| | | | $ 17,471,513 |
| Independent Power and Renewable Electricity Producers — 0.2% | |
| AES Corp. (The) | | 77,115 | $ 1,172,148 |
| Brookfield Renewable Corp., Class A | | 40,490 | 969,331 |
| Clearway Energy, Inc., Class C | | 33,727 | 713,663 |
| Ormat Technologies, Inc. | | 5,695 | 398,194 |
| | | | $ 3,253,336 |
| Insurance — 5.0% | |
| Aflac, Inc. | | 109,297 | $ 8,388,544 |
| Allstate Corp. (The) | | 25,646 | 2,857,221 |
| American Financial Group, Inc. | | 16,529 | 1,845,793 |
| American International Group, Inc. | | 143,237 | 8,680,162 |
| Arch Capital Group, Ltd.(1) | | 45,900 | 3,658,689 |
| Assurant, Inc. | | 11,223 | 1,611,398 |
| Axis Capital Holdings, Ltd. | | 14,658 | 826,271 |
| Brown & Brown, Inc. | | 14,497 | 1,012,470 |
| Enstar Group, Ltd.(1) | | 2,890 | 699,380 |
| Erie Indemnity Co., Class A | | 1,310 | 384,865 |
| Everest Group, Ltd. | | 5,114 | 1,900,720 |
| Fidelity National Financial, Inc. | | 55,130 | 2,276,869 |
| First American Financial Corp. | | 28,644 | 1,618,100 |
| Globe Life, Inc. | | 17,834 | 1,939,091 |
| Hanover Insurance Group, Inc. (The) | | 6,607 | 733,245 |
| Hartford Financial Services Group, Inc. (The) | | 66,113 | 4,688,073 |
| Lincoln National Corp. | | 31,969 | 789,315 |
| Marsh & McLennan Cos., Inc. | | 12,505 | 2,379,701 |
| MetLife, Inc. | | 129,633 | 8,155,212 |
| Old Republic International Corp. | | 58,045 | 1,563,732 |
| Primerica, Inc. | | 4,247 | 823,960 |
| Principal Financial Group, Inc. | | 51,679 | 3,724,506 |
| Prudential Financial, Inc. | | 3,181 | 301,845 |
| Security | Shares | Value |
| Insurance (continued) | |
| Reinsurance Group of America, Inc. | | 14,168 | $ 2,057,052 |
| RenaissanceRe Holdings, Ltd. | | 6,790 | 1,343,877 |
| RLI Corp. | | 1,813 | 246,369 |
| Selective Insurance Group, Inc. | | 8,231 | 849,192 |
| Travelers Cos., Inc. (The) | | 47,783 | 7,803,442 |
| Unum Group | | 41,850 | 2,058,602 |
| W.R. Berkley Corp. | | 33,787 | 2,145,137 |
| Willis Towers Watson PLC | | 15,342 | 3,205,864 |
| | | | $ 80,568,697 |
| Interactive Media & Services — 0.1% | |
| IAC, Inc.(1) | | 16,358 | $ 824,280 |
| Snap, Inc., Class A(1) | | 34,852 | 310,531 |
| | | | $ 1,134,811 |
| IT Services — 0.5% | |
| Amdocs, Ltd. | | 10,822 | $ 914,351 |
| Cognizant Technology Solutions Corp., Class A | | 84,354 | 5,714,140 |
| DXC Technology Co.(1) | | 44,839 | 933,996 |
| MongoDB, Inc.(1) | | 1,182 | 408,807 |
| | | | $ 7,971,294 |
| Leisure Products — 0.0%(3) | |
| Brunswick Corp. | | 4,310 | $ 340,490 |
| Mattel, Inc.(1) | | 18,399 | 405,330 |
| | | | $ 745,820 |
| Life Sciences Tools & Services — 1.0% | |
| 10X Genomics, Inc., Class A(1) | | 25,004 | $ 1,031,415 |
| Avantor, Inc.(1) | | 98,080 | 2,067,526 |
| Bio-Rad Laboratories, Inc., Class A(1) | | 6,199 | 2,222,032 |
| Charles River Laboratories International, Inc.(1) | | 3,883 | 760,990 |
| Danaher Corp. | | 6,570 | 1,630,017 |
| Fortrea Holdings, Inc.(1) | | 13,768 | 393,627 |
| Illumina, Inc.(1) | | 32,995 | 4,529,554 |
| Revvity, Inc. | | 31,224 | 3,456,497 |
| | | | $ 16,091,658 |
| Machinery — 5.9% | |
| AGCO Corp. | | 23,737 | $ 2,807,612 |
| Allison Transmission Holdings, Inc. | | 34,576 | 2,042,059 |
| Caterpillar, Inc. | | 53,507 | 14,607,411 |
| Chart Industries, Inc.(1)(2) | | 7,332 | 1,239,988 |
| CNH Industrial NV | | 320,506 | 3,878,123 |
| Cummins, Inc. | | 30,591 | 6,988,820 |
| Deere & Co. | | 23,869 | 9,007,683 |
| Donaldson Co., Inc. | | 13,092 | 780,807 |
| Dover Corp. | | 23,748 | 3,313,083 |
| Esab Corp. | | 13,308 | 934,488 |
| Flowserve Corp. | | 55,337 | 2,200,752 |
11
See Notes to Financial Statements.
Calvert
US Large-Cap Value Responsible Index Fund
September 30, 2023
Schedule of Investments — continued
| Security | Shares | Value |
| Machinery (continued) | |
| Fortive Corp. | | 57,002 | $ 4,227,268 |
| Franklin Electric Co., Inc. | | 717 | 63,978 |
| IDEX Corp. | | 2,828 | 588,281 |
| Illinois Tool Works, Inc. | | 11,152 | 2,568,417 |
| Ingersoll Rand, Inc. | | 4,844 | 308,660 |
| ITT, Inc. | | 24,999 | 2,447,652 |
| Middleby Corp. (The)(1) | | 12,033 | 1,540,224 |
| Mueller Industries, Inc. | | 15,500 | 1,164,980 |
| Nordson Corp. | | 1,749 | 390,324 |
| Oshkosh Corp. | | 25,685 | 2,451,119 |
| Otis Worldwide Corp. | | 22,948 | 1,842,954 |
| PACCAR, Inc. | | 98,778 | 8,398,106 |
| Parker-Hannifin Corp. | | 9,734 | 3,791,588 |
| Pentair PLC | | 26,264 | 1,700,594 |
| Snap-on, Inc. | | 13,850 | 3,532,581 |
| Stanley Black & Decker, Inc. | | 48,033 | 4,014,598 |
| Timken Co. (The) | | 26,233 | 1,927,863 |
| Toro Co. (The) | | 1,680 | 139,608 |
| Watts Water Technologies, Inc., Class A | | 2,617 | 452,270 |
| Westinghouse Air Brake Technologies Corp. | | 41,392 | 4,398,728 |
| Xylem, Inc. | | 20,077 | 1,827,609 |
| | | | $ 95,578,228 |
| Media — 2.2% | |
| Cable One, Inc. | | 151 | $ 92,962 |
| Charter Communications, Inc., Class A(1) | | 15,159 | 6,667,231 |
| Comcast Corp., Class A | | 344,799 | 15,288,388 |
| Interpublic Group of Cos., Inc. (The) | | 109,317 | 3,133,025 |
| New York Times Co. (The), Class A | | 16,394 | 675,433 |
| Nexstar Media Group, Inc., Class A | | 9,791 | 1,403,736 |
| Omnicom Group, Inc. | | 57,182 | 4,258,915 |
| Paramount Global, Class B | | 169,332 | 2,184,383 |
| Sirius XM Holdings, Inc.(2) | | 118,955 | 537,676 |
| TEGNA, Inc. | | 63,407 | 923,840 |
| | | | $ 35,165,589 |
| Metals & Mining — 1.2% | |
| ATI, Inc.(1) | | 28,753 | $ 1,183,186 |
| Commercial Metals Co. | | 49,917 | 2,466,399 |
| Nucor Corp. | | 41,089 | 6,424,265 |
| Reliance Steel & Aluminum Co. | | 16,287 | 4,270,940 |
| Steel Dynamics, Inc. | | 41,227 | 4,420,359 |
| | | | $ 18,765,149 |
| Multi-Utilities — 3.2% | |
| Ameren Corp. | | 67,961 | $ 5,085,522 |
| Black Hills Corp. | | 19,533 | 988,175 |
| CMS Energy Corp. | | 74,266 | 3,944,267 |
| Consolidated Edison, Inc. | | 76,908 | 6,577,941 |
| Dominion Energy, Inc. | | 151,652 | 6,774,295 |
| DTE Energy Co. | | 53,401 | 5,301,651 |
| Security | Shares | Value |
| Multi-Utilities (continued) | |
| NiSource, Inc. | | 120,240 | $ 2,967,523 |
| Public Service Enterprise Group, Inc. | | 110,582 | 6,293,222 |
| Sempra | | 122,380 | 8,325,511 |
| WEC Energy Group, Inc. | | 70,615 | 5,688,038 |
| | | | $ 51,946,145 |
| Oil, Gas & Consumable Fuels — 0.6% | |
| Occidental Petroleum Corp. | | 138,279 | $ 8,971,542 |
| | | | $ 8,971,542 |
| Passenger Airlines — 0.7% | |
| American Airlines Group, Inc.(1) | | 172,251 | $ 2,206,535 |
| Delta Air Lines, Inc. | | 148,983 | 5,512,371 |
| Southwest Airlines Co. | | 115,076 | 3,115,108 |
| | | | $ 10,834,014 |
| Personal Care Products — 0.0%(3) | |
| BellRing Brands, Inc.(1) | | 3,705 | $ 152,757 |
| Coty, Inc., Class A(1) | | 22,393 | 245,651 |
| | | | $ 398,408 |
| Pharmaceuticals — 3.2% | |
| Bristol-Myers Squibb Co. | | 111,062 | $ 6,446,039 |
| Catalent, Inc.(1) | | 48,949 | 2,228,648 |
| Elanco Animal Health, Inc.(1) | | 143,535 | 1,613,333 |
| Jazz Pharmaceuticals PLC(1) | | 2,928 | 379,000 |
| Merck & Co., Inc. | | 99,332 | 10,226,229 |
| Organon & Co. | | 74,748 | 1,297,625 |
| Perrigo Co. PLC | | 39,171 | 1,251,514 |
| Pfizer, Inc. | | 864,926 | 28,689,596 |
| | | | $ 52,131,984 |
| Professional Services — 1.1% | |
| Alight, Inc., Class A(1) | | 62,528 | $ 443,323 |
| Automatic Data Processing, Inc. | | 28,521 | 6,861,582 |
| Broadridge Financial Solutions, Inc. | | 3,048 | 545,744 |
| Ceridian HCM Holding, Inc.(1) | | 24 | 1,628 |
| Concentrix Corp. | | 9,344 | 748,548 |
| Dun & Bradstreet Holdings, Inc. | | 52,841 | 527,882 |
| FTI Consulting, Inc.(1) | | 604 | 107,760 |
| Genpact, Ltd. | | 17,802 | 644,432 |
| Insperity, Inc. | | 6,085 | 593,896 |
| ManpowerGroup, Inc. | | 13,133 | 962,912 |
| Maximus, Inc. | | 8,660 | 646,729 |
| Paychex, Inc. | | 20,063 | 2,313,866 |
| Robert Half, Inc. | | 21,042 | 1,541,958 |
| Science Applications International Corp. | | 10,839 | 1,143,948 |
| SS&C Technologies Holdings, Inc. | | 19,301 | 1,014,074 |
| TriNet Group, Inc.(1) | | 2,985 | 347,693 |
| | | | $ 18,445,975 |
12
See Notes to Financial Statements.
Calvert
US Large-Cap Value Responsible Index Fund
September 30, 2023
Schedule of Investments — continued
| Security | Shares | Value |
| Real Estate Management & Development — 0.5% | |
| CBRE Group, Inc., Class A(1) | | 54,227 | $ 4,005,206 |
| Howard Hughes Holdings, Inc.(1) | | 10,868 | 805,645 |
| Jones Lang LaSalle, Inc.(1) | | 14,007 | 1,977,509 |
| Zillow Group, Inc., Class C(1) | | 40,264 | 1,858,586 |
| | | | $ 8,646,946 |
| Semiconductors & Semiconductor Equipment — 1.8% | |
| Amkor Technology, Inc. | | 17,032 | $ 384,923 |
| Analog Devices, Inc. | | 25,616 | 4,485,106 |
| Diodes, Inc.(1) | | 302 | 23,810 |
| Intel Corp. | | 610,368 | 21,698,582 |
| Micron Technology, Inc. | | 8,480 | 576,894 |
| MKS Instruments, Inc. | | 10,752 | 930,478 |
| Skyworks Solutions, Inc. | | 5,908 | 582,470 |
| Wolfspeed, Inc.(1)(2) | | 23,394 | 891,311 |
| | | | $ 29,573,574 |
| Software — 1.2% | |
| Altair Engineering, Inc., Class A(1) | | 3,434 | $ 214,831 |
| AppFolio, Inc., Class A(1) | | 910 | 166,193 |
| Aspen Technology, Inc.(1) | | 6,156 | 1,257,425 |
| Atlassian Corp., Class A(1) | | 21,890 | 4,411,054 |
| Dolby Laboratories, Inc., Class A | | 5,954 | 471,914 |
| Elastic NV(1) | | 4,186 | 340,071 |
| Gen Digital, Inc. | | 126,385 | 2,234,487 |
| Guidewire Software, Inc.(1) | | 8,966 | 806,940 |
| New Relic, Inc.(1) | | 10,742 | 919,730 |
| Nutanix, Inc., Class A(1) | | 51,047 | 1,780,519 |
| Roper Technologies, Inc. | | 6,841 | 3,312,959 |
| SentinelOne, Inc., Class A(1) | | 40,909 | 689,726 |
| Smartsheet, Inc., Class A(1) | | 9,666 | 391,086 |
| Splunk, Inc.(1) | | 13,195 | 1,929,769 |
| Tenable Holdings, Inc.(1) | | 2,000 | 89,600 |
| Workday, Inc., Class A(1) | | 3,024 | 649,706 |
| Workiva, Inc.(1) | | 3,435 | 348,103 |
| | | | $ 20,014,113 |
| Specialty Retail — 1.2% | |
| Academy Sports & Outdoors, Inc. | | 15,389 | $ 727,438 |
| Advance Auto Parts, Inc. | | 11,965 | 669,203 |
| Asbury Automotive Group, Inc.(1) | | 4,357 | 1,002,415 |
| AutoNation, Inc.(1) | | 6,366 | 963,813 |
| Bath & Body Works, Inc. | | 38,775 | 1,310,595 |
| Best Buy Co., Inc. | | 40,135 | 2,788,179 |
| CarMax, Inc.(1) | | 32,188 | 2,276,657 |
| Chewy, Inc., Class A(1) | | 593 | 10,828 |
| Dick's Sporting Goods, Inc. | | 2,673 | 290,234 |
| GameStop Corp., Class A(1) | | 48,596 | 799,890 |
| Home Depot, Inc. (The) | | 1,683 | 508,535 |
| Lithia Motors, Inc., Class A | | 5,099 | 1,505,888 |
| Security | Shares | Value |
| Specialty Retail (continued) | |
| Lowe's Cos., Inc. | | 1,606 | $ 333,791 |
| Penske Automotive Group, Inc. | | 3,518 | 587,717 |
| RH (1)(2) | | 1,087 | 287,359 |
| Ross Stores, Inc. | | 12,835 | 1,449,713 |
| TJX Cos., Inc. (The) | | 28,174 | 2,504,105 |
| Wayfair, Inc., Class A(1)(2) | | 15,607 | 945,316 |
| Williams-Sonoma, Inc.(2) | | 7,714 | 1,198,756 |
| | | | $ 20,160,432 |
| Technology Hardware, Storage & Peripherals — 1.2% | |
| Dell Technologies, Inc., Class C | | 53,897 | $ 3,713,503 |
| Hewlett Packard Enterprise Co. | | 281,246 | 4,885,243 |
| HP, Inc. | | 187,481 | 4,818,262 |
| NetApp, Inc. | | 46,400 | 3,520,832 |
| Western Digital Corp.(1) | | 43,648 | 1,991,658 |
| | | | $ 18,929,498 |
| Textiles, Apparel & Luxury Goods — 0.3% | |
| Capri Holdings, Ltd.(1) | | 23,625 | $ 1,242,911 |
| Columbia Sportswear Co. | | 5,937 | 439,932 |
| PVH Corp. | | 9,407 | 719,730 |
| Ralph Lauren Corp. | | 8,206 | 952,634 |
| Skechers USA, Inc., Class A(1) | | 16,503 | 807,822 |
| Tapestry, Inc. | | 43,072 | 1,238,320 |
| | | | $ 5,401,349 |
| Trading Companies & Distributors — 0.7% | |
| Air Lease Corp. | | 43,886 | $ 1,729,547 |
| Applied Industrial Technologies, Inc. | | 4,205 | 650,135 |
| Beacon Roofing Supply, Inc.(1) | | 9,823 | 758,041 |
| Core & Main, Inc., Class A(1) | | 19,620 | 566,037 |
| GATX Corp. | | 12,277 | 1,336,106 |
| MSC Industrial Direct Co., Inc., Class A | | 8,993 | 882,663 |
| United Rentals, Inc. | | 10,655 | 4,736,893 |
| WESCO International, Inc. | | 8,575 | 1,233,257 |
| | | | $ 11,892,679 |
| Water Utilities — 0.4% | |
| American Water Works Co., Inc. | | 36,196 | $ 4,482,151 |
| Essential Utilities, Inc. | | 38,194 | 1,311,200 |
| | | | $ 5,793,351 |
| Wireless Telecommunication Services — 0.0%(3) | |
| T-Mobile US, Inc.(1) | | 4,887 | $ 684,424 |
| | | | $ 684,424 |
Total Common Stocks
(identified cost $1,515,285,502) | | | $1,618,715,634 |
13
See Notes to Financial Statements.
Calvert
US Large-Cap Value Responsible Index Fund
September 30, 2023
Schedule of Investments — continued
| Short-Term Investments — 0.3% | | | |
| Affiliated Fund — 0.2% |
| Security | Shares | Value |
| Morgan Stanley Institutional Liquidity Funds - Government Portfolio, Institutional Class, 5.27%(4) | | 3,306,483 | $ 3,306,483 |
Total Affiliated Fund
(identified cost $3,306,483) | | | $ 3,306,483 |
| Securities Lending Collateral — 0.1% |
| Security | Shares | Value |
| State Street Navigator Securities Lending Government Money Market Portfolio, 5.36%(5) | | 1,675,456 | $ 1,675,456 |
Total Securities Lending Collateral
(identified cost $1,675,456) | | | $ 1,675,456 |
Total Short-Term Investments
(identified cost $4,981,939) | | | $ 4,981,939 |
Total Investments — 99.9%
(identified cost $1,520,267,441) | | | $1,623,697,573 |
| Other Assets, Less Liabilities — 0.1% | | | $ 1,981,924 |
| Net Assets — 100.0% | | | $1,625,679,497 |
| The percentage shown for each investment category in the Schedule of Investments is based on net assets. |
| (1) | Non-income producing security. |
| (2) | All or a portion of this security was on loan at September 30, 2023. The aggregate market value of securities on loan at September 30, 2023 was $7,441,913. |
| (3) | Amount is less than 0.05%. |
| (4) | May be deemed to be an affiliated investment company. The rate shown is the annualized seven-day yield as of September 30, 2023. |
| (5) | Represents investment of cash collateral received in connection with securities lending. |
14
See Notes to Financial Statements.
Calvert
US Large-Cap Value Responsible Index Fund
September 30, 2023
Statement of Assets and Liabilities
| | September 30, 2023 |
| Assets | |
Investments in securities of unaffiliated issuers, at value (identified cost $1,516,960,958) - including
$7,441,913 of securities on loan | $ 1,620,391,090 |
| Investments in securities of affiliated issuers, at value (identified cost $3,306,483) | 3,306,483 |
| Cash | 980,513 |
| Cash denominated in foreign currency, at value (cost $1,001) | 1,069 |
| Receivable for capital shares sold | 3,188,951 |
| Dividends receivable | 2,020,129 |
| Dividends receivable - affiliated | 5,700 |
| Securities lending income receivable | 3,783 |
| Receivable from affiliates | 175,321 |
| Directors' deferred compensation plan | 197,217 |
| Total assets | $1,630,270,256 |
| Liabilities | |
| Payable for capital shares redeemed | $ 1,952,118 |
| Deposits for securities loaned | 1,675,456 |
| Payable to affiliates: | |
| Investment advisory fee | 164,563 |
| Administrative fee | 164,709 |
| Distribution and service fees | 19,254 |
| Sub-transfer agency fee | 4,798 |
| Directors' deferred compensation plan | 197,217 |
| Accrued expenses | 412,644 |
| Total liabilities | $ 4,590,759 |
| Net Assets | $1,625,679,497 |
| Sources of Net Assets | |
| Paid-in capital | $ 1,552,834,132 |
| Distributable earnings | 72,845,365 |
| Net Assets | $1,625,679,497 |
| Class A Shares | |
| Net Assets | $ 91,071,220 |
| Shares Outstanding | 3,387,446 |
Net Asset Value and Redemption Price Per Share
(net assets ÷ shares of beneficial interest outstanding) | $ 26.88 |
Maximum Offering Price Per Share
(100 ÷ 95.25 of net asset value per share) | $ 28.22 |
| Class I Shares | |
| Net Assets | $ 1,412,586,975 |
| Shares Outstanding | 52,128,388 |
Net Asset Value, Offering Price and Redemption Price Per Share
(net assets ÷ shares of beneficial interest outstanding) | $ 27.10 |
15
See Notes to Financial Statements.
Calvert
US Large-Cap Value Responsible Index Fund
September 30, 2023
Statement of Assets and Liabilities — continued
| | September 30, 2023 |
| Class R6 Shares | |
| Net Assets | $ 122,021,302 |
| Shares Outstanding | 4,507,796 |
Net Asset Value, Offering Price and Redemption Price Per Share
(net assets ÷ shares of beneficial interest outstanding) | $ 27.07 |
| On sales of $50,000 or more, the offering price of Class A shares is reduced. |
16
See Notes to Financial Statements.
Calvert
US Large-Cap Value Responsible Index Fund
September 30, 2023
| | Year Ended |
| | September 30, 2023 |
| Investment Income | |
| Dividend income (net of foreign taxes withheld of $8,726) | $ 44,342,316 |
| Dividend income - affiliated issuers | 76,658 |
| Securities lending income, net | 407,464 |
| Total investment income | $ 44,826,438 |
| Expenses | |
| Investment advisory fee | $ 2,071,448 |
| Administrative fee | 2,071,448 |
| Distribution and service fees: | |
| Class A | 253,022 |
| Directors' fees and expenses | 115,368 |
| Custodian fees | 31,457 |
| Transfer agency fees and expenses | 1,386,818 |
| Accounting fees | 355,066 |
| Professional fees | 99,271 |
| Registration fees | 118,348 |
| Reports to shareholders | 87,106 |
| Miscellaneous | 116,104 |
| Total expenses | $ 6,705,456 |
| Waiver and/or reimbursement of expenses by affiliates | $ (2,329,903) |
| Net expenses | $ 4,375,553 |
| Net investment income | $ 40,450,885 |
| Realized and Unrealized Gain (Loss) | |
| Net realized gain (loss): | |
| Investment securities | $ 14,260,484 |
| Foreign currency transactions | 25 |
| Net realized gain | $ 14,260,509 |
| Change in unrealized appreciation (depreciation): | |
| Investment securities | $ 114,814,434 |
| Foreign currency | 60 |
| Net change in unrealized appreciation (depreciation) | $114,814,494 |
| Net realized and unrealized gain | $129,075,003 |
| Net increase in net assets from operations | $169,525,888 |
17
See Notes to Financial Statements.
Calvert
US Large-Cap Value Responsible Index Fund
September 30, 2023
Statements of Changes in Net Assets
| | Year Ended September 30, |
| | 2023 | 2022 |
| Increase (Decrease) in Net Assets | | |
| From operations: | | |
| Net investment income | $ 40,450,885 | $ 34,873,055 |
| Net realized gain (loss) | 14,260,509 | (52,596,082) |
| Net change in unrealized appreciation (depreciation) | 114,814,494 | (282,772,556) |
| Net increase (decrease) in net assets from operations | $ 169,525,888 | $ (300,495,583) |
| Distributions to shareholders: | | |
| Class A | $ (1,933,069) | $ (3,757,516) |
| Class I | (29,784,811) | (70,362,679) |
| Class R6 | (3,115,913) | — (1) |
| Total distributions to shareholders | $ (34,833,793) | $ (74,120,195) |
| Capital share transactions: | | |
| Class A | $ (6,786,933) | $ 24,073,755 |
| Class I | (204,862,567) | 315,558,015 |
| Class R6 | 91,776,104 | 34,715,643 (1) |
| Net increase (decrease) in net assets from capital share transactions | $ (119,873,396) | $ 374,347,413 |
| Net increase (decrease) in net assets | $ 14,818,699 | $ (268,365) |
| Net Assets | | |
| At beginning of year | $ 1,610,860,798 | $ 1,611,129,163 |
| At end of year | $1,625,679,497 | $1,610,860,798 |
| (1) | For the period from the commencement of operations, February 1, 2022, to September 30, 2022. |
18
See Notes to Financial Statements.
Calvert
US Large-Cap Value Responsible Index Fund
September 30, 2023
| | Class A |
| | Year Ended September 30, |
| | 2023 | 2022 | 2021 | 2020 | 2019 |
| Net asset value — Beginning of year | $ 24.86 | $ 30.72 | $ 23.00 | $ 23.38 | $ 23.60 |
| Income (Loss) From Operations | | | | | |
| Net investment income(1) | $ 0.58 | $ 0.51 | $ 0.46 | $ 0.46 | $ 0.43 |
| Net realized and unrealized gain (loss) | 1.94 | (5.11) | 7.69 | (0.35) | 0.25 |
| Total income (loss) from operations | $ 2.52 | $ (4.60) | $ 8.15 | $ 0.11 | $ 0.68 |
| Less Distributions | | | | | |
| From net investment income | $ (0.50) | $ (0.38) | $ (0.33) | $ (0.34) | $ (0.34) |
| From net realized gain | — | (0.88) | (0.10) | (0.15) | (0.56) |
| Total distributions | $ (0.50) | $ (1.26) | $ (0.43) | $ (0.49) | $ (0.90) |
| Net asset value — End of year | $ 26.88 | $ 24.86 | $ 30.72 | $ 23.00 | $ 23.38 |
| Total Return(2) | 10.13% | (15.75)% | 35.76% | 0.35% | 3.18% |
| Ratios/Supplemental Data | | | | | |
| Net assets, end of year (000’s omitted) | $91,071 | $90,131 | $87,085 | $47,993 | $52,888 |
| Ratios (as a percentage of average daily net assets):(3) | | | | | |
| Total expenses | 0.63% | 0.61% | 0.61% | 0.63% | 0.68% |
| Net expenses | 0.49% (4) | 0.49% (4) | 0.49% | 0.49% | 0.51% |
| Net investment income | 2.10% | 1.73% | 1.59% | 2.07% | 1.95% |
| Portfolio Turnover | 31% | 34% | 34% | 32% | 39% |
| (1) | Computed using average shares outstanding. |
| (2) | Returns are historical and are calculated by determining the percentage change in net asset value with all distributions reinvested and do not reflect the effect of sales charges, if any. |
| (3) | Total expenses do not reflect amounts reimbursed and/or waived by the adviser and certain of its affiliates, if applicable. Net expenses are net of all reductions and represent the net expenses paid by the Fund. |
| (4) | Includes a reduction by the investment adviser of a portion of its advisory fee due to the Fund’s investment in the Liquidity Fund (equal to less than 0.005% of average daily net assets for the years ended September 30, 2023 and 2022). |
19
See Notes to Financial Statements.
Calvert
US Large-Cap Value Responsible Index Fund
September 30, 2023
Financial Highlights — continued
| | Class I |
| | Year Ended September 30, |
| | 2023 | 2022 | 2021 | 2020 | 2019 |
| Net asset value — Beginning of year | $ 25.04 | $ 30.92 | $ 23.16 | $ 23.53 | $ 23.74 |
| Income (Loss) From Operations | | | | | |
| Net investment income(1) | $ 0.66 | $ 0.59 | $ 0.54 | $ 0.52 | $ 0.50 |
| Net realized and unrealized gain (loss) | 1.96 | (5.14) | 7.72 | (0.35) | 0.25 |
| Total income (loss) from operations | $ 2.62 | $ (4.55) | $ 8.26 | $ 0.17 | $ 0.75 |
| Less Distributions | | | | | |
| From net investment income | $ (0.56) | $ (0.45) | $ (0.40) | $ (0.39) | $ (0.40) |
| From net realized gain | — | (0.88) | (0.10) | (0.15) | (0.56) |
| Total distributions | $ (0.56) | $ (1.33) | $ (0.50) | $ (0.54) | $ (0.96) |
| Net asset value — End of year | $ 27.10 | $ 25.04 | $ 30.92 | $ 23.16 | $ 23.53 |
| Total Return(2) | 10.41% | (15.52)% | 36.03% | 0.63% | 3.46% |
| Ratios/Supplemental Data | | | | | |
| Net assets, end of year (000’s omitted) | $1,412,587 | $1,492,096 | $1,524,045 | $668,670 | $368,993 |
| Ratios (as a percentage of average daily net assets):(3) | | | | | |
| Total expenses | 0.38% | 0.36% | 0.36% | 0.38% | 0.43% |
| Net expenses | 0.24% (4) | 0.24% (4) | 0.24% | 0.24% | 0.23% |
| Net investment income | 2.36% | 1.98% | 1.83% | 2.31% | 2.22% |
| Portfolio Turnover | 31% | 34% | 34% | 32% | 39% |
| (1) | Computed using average shares outstanding. |
| (2) | Returns are historical and are calculated by determining the percentage change in net asset value with all distributions reinvested and do not reflect the effect of sales charges, if any. |
| (3) | Total expenses do not reflect amounts reimbursed and/or waived by the adviser and certain of its affiliates, if applicable. Net expenses are net of all reductions and represent the net expenses paid by the Fund. |
| (4) | Includes a reduction by the investment adviser of a portion of its advisory fee due to the Fund’s investment in the Liquidity Fund (equal to less than 0.005% of average daily net assets for the years ended September 30, 2023 and 2022). |
20
See Notes to Financial Statements.
Calvert
US Large-Cap Value Responsible Index Fund
September 30, 2023
Financial Highlights — continued
| | Class R6 |
| | Year Ended
September 30,
2023 | Period Ended
September 30,
2022(1) |
| |
| Net asset value — Beginning of period | $ 25.05 | $ 31.03 |
| Income (Loss) From Operations | | |
| Net investment income(2) | $ 0.66 | $ 0.41 |
| Net realized and unrealized gain (loss) | 1.97 | (6.39) |
| Total income (loss) from operations | $ 2.63 | $ (5.98) |
| Less Distributions | | |
| From net investment income | $ (0.61) | $ — |
| Total distributions | $ (0.61) | $ — |
| Net asset value — End of period | $ 27.07 | $ 25.05 |
| Total Return(3) | 10.44% | (19.27)% (4) |
| Ratios/Supplemental Data | | |
| Net assets, end of period (000’s omitted) | $122,021 | $28,633 |
| Ratios (as a percentage of average daily net assets):(5) | | |
| Total expenses | 0.33% | 0.31% (6) |
| Net expenses | 0.19% (7) | 0.19% (6)(7) |
| Net investment income | 2.37% | 2.21% (6) |
| Portfolio Turnover | 31% | 34% (8) |
| (1) | For the period from the commencement of operations, February 1, 2022, to September 30, 2022. |
| (2) | Computed using average shares outstanding. |
| (3) | Returns are historical and are calculated by determining the percentage change in net asset value with all distributions reinvested and do not reflect the effect of sales charges, if any. |
| (4) | Not annualized. |
| (5) | Total expenses do not reflect amounts reimbursed and/or waived by the adviser and certain of its affiliates, if applicable. Net expenses are net of all reductions and represent the net expenses paid by the Fund. |
| (6) | Annualized. |
| (7) | Includes a reduction by the investment adviser of a portion of its advisory fee due to the Fund’s investment in the Liquidity Fund (equal to less than 0.005% of average daily net assets for the year ended September 30, 2023 and the period ended September 30, 2022). |
| (8) | For the year ended September 30, 2022. |
21
See Notes to Financial Statements.
Calvert
US Large-Cap Value Responsible Index Fund
September 30, 2023
Notes to Financial Statements
1 Significant Accounting Policies
Calvert US Large-Cap Value Responsible Index Fund (the Fund) is a diversified series of Calvert Responsible Index Series, Inc. (the Corporation). The Corporation is a Maryland corporation registered under the Investment Company Act of 1940, as amended (the 1940 Act), as an open-end management investment company. The investment objective of the Fund is to seek to track the performance of the Calvert US Large-Cap Value Responsible Index, which measures the investment return of large-capitalization stocks.
The Fund offers three classes of shares. Class A shares are generally sold subject to a sales charge imposed at time of purchase. A contingent deferred sales charge of 0.25% may apply to certain redemptions of Class A shares for accounts for which no sales charge was paid, if redeemed within 12 months of purchase. Class I and Class R6 shares are sold at net asset value, are not subject to a sales charge and are sold only to certain eligible investors. Each class represents a pro rata interest in the Fund, but votes separately on class-specific matters and is subject to different expenses.
The Fund applies the accounting and reporting guidance in the Financial Accounting Standards Board (FASB) Accounting Standards Codification Topic 946, Financial Services – Investment Companies (ASC 946). Subsequent events, if any, through the date that the financial statements were issued have been evaluated in the preparation of the financial statements.
A Investment Valuation— Net asset value per share is determined every business day as of the close of the regular session of the New York Stock Exchange (generally 4:00 p.m. Eastern time). The Fund uses independent pricing services approved by the Board of Directors (the Board) to value its investments wherever possible. Investments for which market quotations are not available or deemed not reliable are fair valued in good faith by the Board’s valuation designee.
U.S. generally accepted accounting principles (U.S. GAAP) establishes a disclosure hierarchy that categorizes the inputs to valuation techniques used to value assets and liabilities at measurement date. These inputs are summarized in the three broad levels listed below:
Level 1 - quoted prices in active markets for identical securities
Level 2 - other significant observable inputs (including quoted prices for similar securities, interest rates, prepayment speeds, credit risk, etc.)
Level 3 - significant unobservable inputs (including the Fund’s own assumptions in determining the fair value of investments)
The inputs or methodologies used for valuing securities are not necessarily an indication of the risk associated with investing in those securities.
Valuation techniques used to value the Fund’s investments by major category are as follows:
Equity Securities. Equity securities (including warrants and rights) listed on a U.S. securities exchange generally are valued at the last sale or closing price as reported by an independent pricing service on the primary market or exchange on which they are traded and are categorized as Level 1 in the hierarchy. Equity securities listed on the NASDAQ National Market System are valued at the NASDAQ official closing price and are categorized as Level 1 in the hierarchy. Unlisted or listed securities for which closing sales prices or closing quotations are not available are valued at the mean between the latest available bid and ask prices and are categorized as Level 2 in the hierarchy.
Other Securities. Investments in management investment companies (including money market funds) that do not trade on an exchange are valued at the net asset value as of the close of each business day and are categorized as Level 1 in the hierarchy.
Fair Valuation. In connection with Rule 2a-5 of the 1940 Act, the Board has designated the Fund’s investment adviser as its valuation designee. Investments for which valuations or market quotations are not readily available or are deemed unreliable are valued by the investment adviser, as valuation designee, at fair value using methods that most fairly reflect the security’s “fair value”, which is the amount that the Fund might reasonably expect to receive for the security upon its current sale in the ordinary course. Each such determination is based on a consideration of relevant factors, which are likely to vary from one pricing context to another. These factors may include, but are not limited to, the type of security, the existence of any contractual restrictions on the security’s disposition, the price and extent of public trading in similar securities of the issuer or of comparable companies or entities, quotations or relevant information obtained from broker/dealers or other market participants, information obtained from the issuer, analysts, and/or the appropriate stock exchange (for exchange-traded securities), an analysis of the company’s or entity’s financial statements, and an evaluation of the forces that influence the issuer and the market(s) in which the security is purchased and sold.
The values assigned to fair value investments are based on available information and do not necessarily represent amounts that might ultimately be realized. Further, due to the inherent uncertainty of valuations of such investments, the fair values may differ significantly from the values that would have been used had an active market existed, and the differences could be material.
Calvert
US Large-Cap Value Responsible Index Fund
September 30, 2023
Notes to Financial Statements — continued
The following table summarizes the market value of the Fund's holdings as of September 30, 2023, based on the inputs used to value them:
| Asset Description | Level 1 | Level 2 | Level 3 | Total |
| Common Stocks | $ 1,618,715,634(1) | $ — | $ — | $ 1,618,715,634 |
| Short-Term Investments: | | | | |
| Affiliated Fund | 3,306,483 | — | — | 3,306,483 |
| Securities Lending Collateral | 1,675,456 | — | — | 1,675,456 |
| Total Investments | $1,623,697,573 | $ — | $ — | $1,623,697,573 |
| (1) | The level classification by major category of investments is the same as the category presentation in the Schedule of Investments. |
B Investment Transactions and Income— Investment transactions for financial statement purposes are accounted for on trade date. Realized gains and losses are recorded on an identified cost basis and may include proceeds from litigation. Dividend income is recorded on the ex-dividend date for dividends received in cash and/or securities or, in the case of dividends on certain foreign securities, as soon as the Fund is informed of the ex-dividend date. Non-cash dividends are recorded at the fair value of the securities received. Withholding taxes on foreign dividends, if any, have been provided for in accordance with the Fund’s understanding of the applicable country’s tax rules and rates. Distributions received that represent a return of capital are recorded as a reduction of cost of investments. Distributions received that represent a capital gain are recorded as a realized gain.
C Share Class Accounting— Realized and unrealized gains and losses and net investment income and losses, other than class-specific expenses, are allocated daily to each class of shares based upon the relative net assets of each class to the total net assets of the Fund. Expenses arising in connection with a specific class are charged directly to that class. Sub-accounting, recordkeeping and similar administrative fees payable to financial intermediaries, which are a component of transfer agency fees and expenses on the Statement of Operations, are not allocated to Class R6 shares.
D Distributions to Shareholders— Distributions to shareholders are recorded by the Fund on ex-dividend date. Distributions from net investment income and distributions from net realized capital gains, if any, are paid at least annually. Distributions are declared separately for each class of shares. Distributions are determined in accordance with income tax regulations, which may differ from U.S. GAAP; accordingly, periodic reclassifications are made within the Fund's capital accounts to reflect income and gains available for distribution under income tax regulations.
E Estimates— The preparation of financial statements in conformity with U.S. GAAP requires management to make estimates and assumptions that affect the reported amounts of assets and liabilities and disclosure of contingent assets and liabilities at the date of the financial statements and the reported amounts of increases and decreases in net assets from operations during the reporting period. Actual results could differ from those estimates.
F Indemnifications— The Corporation’s By-Laws provide for indemnification for Directors or officers of the Corporation and certain other parties, to the fullest extent permitted by Maryland law and the 1940 Act, provided certain conditions are met. Additionally, in the normal course of business, the Fund enters into agreements with service providers that may contain indemnification clauses. The Fund’s maximum exposure under these arrangements is unknown as this would involve future claims that may be made against the Fund that have not yet occurred.
G Federal Income Taxes— No provision for federal income or excise tax is required since the Fund intends to continue to qualify as a regulated investment company under the Internal Revenue Code and to distribute substantially all of its taxable earnings.
Management has analyzed the Fund's tax positions taken for all open federal income tax years and has concluded that no provision for federal income tax is required in the Fund's financial statements. A Fund's federal tax return is subject to examination by the Internal Revenue Service for a period of three years from the date of filing.
2 Related Party Transactions
The investment advisory fee is earned by Calvert Research and Management (CRM), an indirect, wholly-owned subsidiary of Morgan Stanley, as compensation for investment advisory services rendered to the Fund. The investment advisory fee is computed at the annual rate of 0.12% of the Fund’s average daily net assets and is payable monthly. For the year ended September 30, 2023, the investment advisory fee amounted to $2,071,448.
The Fund may invest in a money market fund, the Institutional Class of the Morgan Stanley Institutional Liquidity Funds - Government Portfolio (the “Liquidity Fund”), an open-end management investment company managed by Morgan Stanley Investment Management Inc., a wholly-owned subsidiary of Morgan Stanley. The investment advisory fee paid by the Fund is reduced by an amount equal to its pro rata share of the advisory and administration fees paid by the Fund due to its investment in the Liquidity Fund. For the year ended September 30, 2023, the investment advisory fee paid was reduced by $2,805 relating to the Fund’s investment in the Liquidity Fund.
Calvert
US Large-Cap Value Responsible Index Fund
September 30, 2023
Notes to Financial Statements — continued
CRM has agreed to reimburse the Fund’s operating expenses to the extent that total annual operating expenses (relating to ordinary operating expenses only and excluding expenses such as brokerage commissions, acquired fund fees and expenses of unaffiliated funds, borrowing costs, taxes or litigation expenses) exceed 0.49%, 0.24% and 0.19% for Class A, Class I and Class R6, respectively, of such class’s average daily net assets. The expense reimbursement agreement with CRM may be changed or terminated after January 31, 2024. For the year ended September 30, 2023, CRM waived or reimbursed expenses of $2,327,098.
The administrative fee is earned by CRM as compensation for administrative services rendered to the Fund. The fee is computed at an annual rate of 0.12% of the Fund’s average daily net assets attributable to Class A, Class I and Class R6 and is payable monthly. For the year ended September 30, 2023, CRM was paid administrative fees of $2,071,448.
The Fund has in effect a distribution plan for Class A shares (Class A Plan) pursuant to Rule 12b-1 under the 1940 Act. Pursuant to the Class A Plan, the Fund pays Eaton Vance Distributors, Inc. (EVD), an affiliate of CRM and the Fund’s principal underwriter, a distribution and service fee of 0.25% per annum of its average daily net assets attributable to Class A shares for distribution services and facilities provided to the Fund by EVD, as well as for personal services and/or the maintenance of shareholder accounts. Distribution and service fees paid or accrued for the year ended September 30, 2023 amounted to $253,022 for Class A shares.
The Fund was informed that EVD received $20,742 as its portion of the sales charge on sales of Class A shares for the year ended September 30, 2023. The Fund was also informed that EVD received less than $100 of contingent deferred sales charges paid by Class A shareholders for the same period.
Eaton Vance Management (EVM), an affiliate of CRM, provides sub-transfer agency and related services to the Fund pursuant to a Sub-Transfer Agency Support Services Agreement. For the year ended September 30, 2023, sub-transfer agency fees and expenses incurred to EVM amounted to $19,903 and are included in transfer agency fees and expenses on the Statement of Operations.
Each Director of the Fund who is not an employee of CRM or its affiliates receives an annual fee of $214,000, an annual Committee fee ranging from $8,500 to $16,500 depending on the Committee, and may receive a fee of $10,000 for special meetings. The Board chair receives an additional $40,000 ($30,000 prior to January 1, 2023) annual fee, Committee chairs receive an additional $15,000 ($6,000 prior to January 1, 2023) annual fee and the special equities liaison receives an additional $2,500 annual fee. Eligible Directors may participate in a Deferred Compensation Plan (the Plan). Amounts deferred under the Plan are treated as though equal dollar amounts had been invested in shares of the Fund or other Calvert funds selected by the Directors. The Fund purchases shares of the funds selected equal to the dollar amounts deferred under the Plan, resulting in an asset equal to the deferred compensation liability. Obligations of the Plan are paid solely from the Fund's assets. Directors’ fees are allocated to each of the Calvert funds served. Salaries and fees of officers and Directors of the Fund who are employees of CRM or its affiliates are paid by CRM.
3 Investment Activity
During the year ended September 30, 2023, the cost of purchases and proceeds from sales of investments, other than short-term securities, were $536,296,440 and $650,066,201, respectively.
4 Distributions to Shareholders and Income Tax Information
The tax character of distributions declared for the years ended September 30, 2023 and September 30, 2022 was as follows:
| | Year Ended September 30, |
| | 2023 | 2022 |
| Ordinary income | $34,833,793 | $54,476,500 |
| Long-term capital gains | $ — | $19,643,695 |
During the year ended September 30, 2023, distributable earnings was decreased by $4,196,321 and paid-in capital was increased by $4,196,321
primarily due to the Fund's use of equalization accounting. Tax equalization accounting allows the Fund to treat as a distribution that portion of redemption proceeds representing a redeeming shareholder’s portion of undistributed taxable income and net capital gains. These reclassifications had no effect on the net assets or net asset value per share of the Fund.
As of September 30, 2023, the components of distributable earnings (accumulated loss) on a tax basis were as follows:
Calvert
US Large-Cap Value Responsible Index Fund
September 30, 2023
Notes to Financial Statements — continued
| Undistributed ordinary income | $ 25,815,041 |
| Deferred capital losses | (24,065,313) |
| Net unrealized appreciation | 71,095,637 |
| Distributable earnings | $ 72,845,365 |
At September 30, 2023, the Fund, for federal income tax purposes, had deferred capital losses of $24,065,313 which would reduce the Fund’s taxable income arising from future net realized gains on investment transactions, if any, to the extent permitted by the Internal Revenue Code, and thus would reduce the amount of distributions to shareholders, which would otherwise be necessary to relieve the Fund of any liability for federal income or excise tax. The deferred capital losses are treated as arising on the first day of the Fund’s next taxable year, can be carried forward for an unlimited period, and retain the same short-term or long-term character as when originally deferred. Of the deferred capital losses at September 30, 2023, $24,065,313 are short-term.
The cost and unrealized appreciation (depreciation) of investments of the Fund at September 30, 2023, as determined on a federal income tax basis, were as follows:
| Aggregate cost | $1,552,602,004 |
| Gross unrealized appreciation | $ 202,060,218 |
| Gross unrealized depreciation | (130,964,649) |
| Net unrealized appreciation | $ 71,095,569 |
5 Securities Lending
To generate additional income, the Fund may lend its securities pursuant to a securities lending agency agreement with State Street Bank and Trust Company (SSBT), the securities lending agent. Security loans are subject to termination by the Fund at any time and, therefore, are not considered illiquid investments. The Fund requires that the loan be continuously collateralized by either cash or securities in an amount at least equal to the market value of the securities on loan. The market value of securities loaned is determined daily and any additional required collateral is delivered to the Fund on the next business day. Cash collateral is generally invested in a money market fund registered under the 1940 Act that is managed by an affiliate of SSBT. Any gain or loss in the market price of the loaned securities that might occur and any interest earned or dividends declared during the term of the loan would accrue to the account of the Fund. Income earned on the investment of collateral, net of broker rebates and other expenses incurred by the securities lending agent, is split between the Fund and the securities lending agent based on agreed upon contractual terms. Non-cash collateral, if any, is held by the lending agent on behalf of the Fund and cannot be sold or re-pledged by the Fund; accordingly, such collateral is not reflected in the Statement of Assets and Liabilities.
The risks associated with lending portfolio securities include, but are not limited to, possible delays in receiving additional collateral or in the recovery of the loaned securities, possible loss of rights to the collateral should the borrower fail financially, as well as risk of loss in the value of the collateral or the value of the investments made with the collateral. The securities lending agent shall indemnify the Fund in the case of default of any securities borrower.
At September 30, 2023, the total value of securities on loan was $7,441,913 and the total value of collateral received was $7,664,742, comprised of cash of $1,675,456 and U.S. government and/or agencies securities of $5,989,286.
The following table provides a breakdown of securities lending transactions accounted for as secured borrowings, the obligations by class of collateral pledged, and the remaining contractual maturity of those transactions as of September 30, 2023.
| | Remaining Contractual Maturity of the Transactions |
| | Overnight and
Continuous | <30 days | 30 to 90 days | >90 days | Total |
| Common Stocks | $1,675,456 | $ — | $ — | $ — | $1,675,456 |
The carrying amount of the liability for deposits for securities loaned at September 30, 2023 approximated its fair value. If measured at fair value, such liability would have been considered as Level 2 in the fair value hierarchy (see Note 1A) at September 30, 2023.
Calvert
US Large-Cap Value Responsible Index Fund
September 30, 2023
Notes to Financial Statements — continued
6 Line of Credit
The Fund participates with other portfolios and funds managed by EVM and its affiliates, including CRM, in a $725 million unsecured revolving line of credit agreement with a group of banks, which is in effect through October 24, 2023. Borrowings are made by the Fund solely for temporary purposes related to redemptions and other short-term cash needs. Interest is charged to the Fund based on its borrowings at an amount above either the Secured Overnight Financing Rate (SOFR) or Federal Funds rate. In addition, a fee computed at an annual rate of 0.15% on the daily unused portion of the line of credit is allocated among the participating portfolios and funds at the end of each quarter. In connection with the renewal of the agreement in October 2022, an arrangement fee of $150,000 was incurred that was allocated to the participating portfolios and funds. Because the line of credit is not available exclusively to the Fund, it may be unable to borrow some or all of its requested amounts at any particular time.
The Fund had no borrowings outstanding pursuant to its line of credit at September 30, 2023. The Fund did not have any significant borrowings or allocated fees during the year ended September 30, 2023. Effective October 24, 2023, the Fund renewed its line of credit agreement, which expires October 22, 2024. In connection with the renewal, the borrowing limit was decreased to $650 million.
7 Affiliated Investments
At September 30, 2023, the value of the Fund’s investment in funds that may be deemed to be affiliated was $3,306,483, which represents 0.2% of the Fund’s net assets. Transactions in such investments by the Fund for the year ended September 30, 2023 were as follows:
| Name | Value,
beginning
of period | Purchases | Sales
proceeds | Net
realized
gain
(loss) | Change in
unrealized
appreciation
(depreciation) | Value,
end of
period | Dividend
income | Shares,
end of
period |
| Short-Term Investments | | | | | | |
| Liquidity Fund | $2,436,597 | $117,182,592 | $(116,312,706) | $ — | $ — | $3,306,483 | $76,658 | 3,306,483 |
8 Capital Shares
The Corporation may issue its shares in one or more series (such as the Fund). The authorized shares of the Fund consist of 75,000,000 common shares, $0.01 par value, for each Class.
Transactions in capital shares were as follows:
| | Year Ended
September 30, 2023 | | Year Ended
September 30, 2022(1) |
| | Shares | Amount | | Shares | Amount |
| Class A | | | | | |
| Shares sold | 960,015 | $ 26,434,198 | | 1,352,711 | $ 40,245,039 |
| Reinvestment of distributions | 60,938 | 1,673,370 | | 108,692 | 3,332,502 |
| Shares redeemed | (1,259,504) | (34,894,501) | | (670,635) | (19,503,786) |
| Net increase (decrease) | (238,551) | $ (6,786,933) | | 790,768 | $ 24,073,755 |
| Class I | | | | | |
| Shares sold | 13,761,297 | $ 383,701,067 | | 25,266,829 | $ 752,758,394 |
| Reinvestment of distributions | 819,411 | 22,632,121 | | 1,789,057 | 55,156,619 |
| Shares redeemed | (22,040,180) | (611,195,755) | | (16,750,251) | (492,356,998) |
| Net increase (decrease) | (7,459,472) | $(204,862,567) | | 10,305,635 | $ 315,558,015 |
Calvert
US Large-Cap Value Responsible Index Fund
September 30, 2023
Notes to Financial Statements — continued
| | Year Ended
September 30, 2023 | | Year Ended
September 30, 2022(1) |
| | Shares | Amount | | Shares | Amount |
| Class R6 | | | | | |
| Shares sold | 4,668,666 | $ 128,134,046 | | 1,235,427 | $ 37,282,272 |
| Reinvestment of distributions | 112,977 | 3,115,913 | | — | — |
| Shares redeemed | (1,416,954) | (39,473,855) | | (92,320) | (2,566,629) |
| Net increase | 3,364,689 | $ 91,776,104 | | 1,143,107 | $ 34,715,643 |
| (1) | For Class R6, for the period from the commencement of operations, February 1, 2022, to September 30, 2022. |
Calvert
US Large-Cap Value Responsible Index Fund
September 30, 2023
Report of Independent Registered Public Accounting Firm
To the Board of Directors of Calvert Responsible Index Series, Inc. and Shareholders of Calvert US Large-Cap Value Responsible Index Fund:
Opinion on the Financial Statements and Financial Highlights
We have audited the accompanying statement of assets and liabilities of Calvert US Large-Cap Value Responsible Index Fund (the “Fund”) (one of the funds constituting Calvert Responsible Index Series, Inc.), including the schedule of investments, as of September 30, 2023, the related statement of operations for the year then ended, the statements of changes in net assets for each of the two years in the period then ended, the financial highlights for each of the three years in the period then ended, and the related notes. In our opinion, the financial statements and financial highlights present fairly, in all material respects, the financial position of the Fund as of September 30, 2023, and the results of its operations for the year then ended, the changes in its net assets for each of the two years in the period then ended, and the financial highlights for each of the three years in the period then ended, in conformity with accounting principles generally accepted in the United States of America. The financial highlights for the years ended September 30, 2020 and 2019 were audited by other auditors whose report, dated November 20, 2020, expressed an unqualified opinion on those financial highlights.
Basis for Opinion
These financial statements and financial highlights are the responsibility of the Fund's management. Our responsibility is to express an opinion on the Fund's financial statements and financial highlights based on our audits. We are a public accounting firm registered with the Public Company Accounting Oversight Board (United States) (PCAOB) and are required to be independent with respect to the Fund in accordance with the U.S. federal securities laws and the applicable rules and regulations of the Securities and Exchange Commission and the PCAOB.
We conducted our audits in accordance with the standards of the PCAOB. Those standards require that we plan and perform the audit to obtain reasonable assurance about whether the financial statements and financial highlights are free of material misstatement, whether due to error or fraud. The Fund is not required to have, nor were we engaged to perform, an audit of its internal control over financial reporting. As part of our audits, we are required to obtain an understanding of internal control over financial reporting but not for the purpose of expressing an opinion on the effectiveness of the Fund’s internal control over financial reporting. Accordingly, we express no such opinion.
Our audits included performing procedures to assess the risks of material misstatement of the financial statements and financial highlights, whether due to error or fraud, and performing procedures that respond to those risks. Such procedures included examining, on a test basis, evidence regarding the amounts and disclosures in the financial statements and financial highlights. Our audits also included evaluating the accounting principles used and significant estimates made by management, as well as evaluating the overall presentation of the financial statements and financial highlights. Our procedures included confirmation of securities owned as of September 30, 2023, by correspondence with the custodian and brokers; when replies were not received from brokers, we performed other auditing procedures. We believe that our audits provide a reasonable basis for our opinion.
/s/ Deloitte & Touche LLP
Boston, Massachusetts
November 22, 2023
We have served as the auditor of one or more Calvert investment companies since 2021.
Calvert
US Large-Cap Value Responsible Index Fund
September 30, 2023
Federal Tax Information (Unaudited)
The Form 1099-DIV you receive in February 2024 will show the tax status of all distributions paid to your account in calendar year 2023. Shareholders are advised to consult their own tax adviser with respect to the tax consequences of their investment in the Fund. As required by the Internal Revenue Code and/or regulations, shareholders must be notified regarding the status of qualified dividend income for individuals and the dividends received deduction for corporations.
Qualified Dividend Income. For the fiscal year ended September 30, 2023, the Fund designates approximately $43,764,019, or up to the maximum amount of such dividends allowable pursuant to the Internal Revenue Code, as qualified dividend income eligible for the reduced tax rate of 15%.
Dividends Received Deduction. Corporate shareholders are generally entitled to take the dividends received deduction on the portion of the Fund's dividend distribution that qualifies under tax law. For the Fund's fiscal 2023 ordinary income dividends, 100% qualifies for the corporate dividends received deduction.
Calvert
US Large-Cap Value Responsible Index Fund
September 30, 2023
Board of Directors' Contract Approval
Overview of the Contract Review Process
The Investment Company Act of 1940, as amended, provides, in substance, that each investment advisory agreement between a fund and its investment adviser will continue in effect from year to year only if its continuation is approved at least annually by the fund’s board of directors, including by a vote of a majority of the directors who are not “interested persons” of the fund (“Independent Directors”), cast in person at a meeting called for the purpose of considering such approval.
At an in-person meeting of the Boards of Trustees/Directors (each a “Board”) of the registered investment companies advised by Calvert Research and Management (“CRM” or the “Adviser”) (the “Calvert Funds”) held on June 12-13, 2023, the Board, including a majority of the Independent Directors, voted to approve continuation of existing investment advisory and investment sub-advisory agreements for the Calvert Funds for an additional one-year period.
In evaluating the investment advisory and investment sub-advisory agreements for the Calvert Funds, the Board considered a variety of information relating to the Calvert Funds and various service providers, including the Adviser. The Independent Directors reviewed a report prepared by the Adviser regarding various services provided to the Calvert Funds by the Adviser and its affiliates. Such report included, among other data, information regarding the Adviser’s personnel and the Adviser’s revenue and cost of providing services to the Calvert Funds, and a separate report prepared by an independent data provider, which compared each fund’s investment performance, fees and expenses to those of comparable funds as identified by such independent data provider (“comparable funds”).
The Independent Directors were separately represented by independent legal counsel with respect to their consideration of the continuation of the investment advisory and investment sub-advisory agreements for the Calvert Funds. Prior to voting, the Independent Directors reviewed the proposed continuation of the Calvert Funds’ investment advisory and investment sub-advisory agreements with management and also met in private sessions with their counsel at which time no representatives of management were present.
The information that the Board considered included, among other things, the following (for funds that invest through one or more affiliated underlying fund(s), references to “each fund” in this section may include information that was considered at the underlying fund-level):
Information about Fees, Performance and Expenses
| • | A report from an independent data provider comparing the advisory and related fees paid by each fund with fees paid by comparable funds; |
| • | A report from an independent data provider comparing each fund’s total expense ratio and its components to comparable funds; |
| • | A report from an independent data provider comparing the investment performance of each fund to the investment performance of comparable funds over various time periods; |
| • | Data regarding investment performance in comparison to benchmark indices; |
| • | For each fund, comparative information concerning the fees charged and the services provided by the Adviser in managing other accounts (including mutual funds, other collective investment funds and institutional accounts) using investment strategies and techniques similar to those used in managing such fund; |
| • | Profitability analyses for the Adviser with respect to each fund; |
Information about Portfolio Management and Trading
| • | Descriptions of the investment management services provided to each fund, including investment strategies and processes it employs; |
| • | Information about the Adviser’s policies and practices with respect to trading, including the Adviser’s processes for monitoring best execution of portfolio transactions; |
| • | Information about the allocation of brokerage transactions and the benefits received by the Adviser as a result of brokerage allocation, including information concerning the acquisition of research through client commission arrangements and policies with respect to “soft dollars”; |
Information about the Adviser
| • | Reports detailing the financial results and condition of CRM; |
| • | Descriptions of the qualifications, education and experience of the individual investment professionals whose responsibilities include portfolio management and investment research for the funds, and information relating to their compensation and responsibilities with respect to managing other mutual funds and investment accounts; |
| • | Policies and procedures relating to proxy voting and the handling of corporate actions and class actions; |
| • | A description of CRM’s procedures for overseeing sub-advisers, including with respect to regulatory and compliance issues, investment management and other matters; |
Calvert
US Large-Cap Value Responsible Index Fund
September 30, 2023
Board of Directors' Contract Approval — continued
Other Relevant Information
| • | Information concerning the nature, cost and character of the administrative and other non-investment advisory services provided by CRM and its affiliates; and |
| • | The terms of each investment advisory agreement. |
Over the course of the year, the Board and its committees held regular quarterly meetings. During these meetings, the Directors participated in investment and performance reviews with the portfolio managers and other investment professionals of the Adviser relating to each fund and considered various investment and trading strategies used in pursuing each fund’s investment objective(s), such as the use of derivative instruments, as well as risk management techniques. The Board and its committees also evaluated issues pertaining to industry and regulatory developments, compliance procedures, corporate governance and other issues with respect to the funds and received and participated in reports and presentations provided by CRM and its affiliates with respect to such matters. In addition to the formal meetings of the Board and its committees, the Independent Directors held regular video conferences in between meetings to discuss, among other topics, matters relating to the continuation of the Calvert Funds’ investment advisory and investment sub-advisory agreements.
For funds that invest through one or more affiliated underlying funds, the Board considered similar information about the underlying fund(s) when considering the approval of investment advisory agreements. In addition, in cases where the Adviser has engaged a sub-adviser, the Board considered similar information about the sub-adviser when considering the approval of any investment sub-advisory agreement.
The Independent Directors were assisted throughout the contract review process by their independent legal counsel. The Independent Directors relied upon the advice of such counsel and their own business judgment in determining the material factors to be considered in evaluating each investment advisory and investment sub-advisory agreement and the weight to be given to each such factor. The Board, including the Independent Directors, did not identify any single factor as controlling, and each Director may have attributed different weight to various factors.
Results of the Contract Review Process
Based on its consideration of the foregoing, and such other information as it deemed relevant, including the factors and conclusions described below, the Board, including the Independent Directors, concluded that the continuation of the investment advisory agreement of Calvert US Large-Cap Value Responsible Index Fund (the “Fund”), including the fee payable under the agreement, is in the best interests of the Fund’s shareholders. Accordingly, the Board, including a majority of the Independent Directors, voted to approve the continuation of the investment advisory agreement of the Fund.
Nature, Extent and Quality of Services
In considering the nature, extent and quality of the services provided by the Adviser under the investment advisory agreement, the Board reviewed information provided by the Adviser relating to its operations and personnel, including, among other information, biographical information on the Adviser’s investment personnel and descriptions of its organizational and management structure. The Board also took into account similar information provided periodically throughout the previous year by the Adviser as well as the Board’s familiarity with management through Board meetings, discussions and other reports. The Board considered the Adviser’s management style and its performance in employing its investment strategies as well as its current level of staffing and overall resources. The Board also noted that it reviewed on a quarterly basis information regarding the Adviser’s compliance with applicable policies and procedures, including those related to personal investing. The Board took into account, among other items, periodic reports received from the Adviser over the past year concerning the Adviser’s ongoing review and enhancement of certain processes, policies and procedures of the Calvert Funds and the Adviser. The Board concluded that it was satisfied with the nature, extent and quality of services provided to the Fund by the Adviser under the investment advisory agreement.
Fund Performance
In considering the Fund’s performance, the Board noted that it reviewed on a quarterly basis detailed information about the Fund’s performance results, portfolio composition and investment strategies. The Board compared the Fund’s investment performance to that of the Fund’s peer universe and the index it is designed to track. The Board’s review included comparative performance data for the one-, three- and five-year periods ended December 31, 2022. This performance data indicated that the Fund had underperformed the median of its peer universe and the index it is designed to track for the one-, three- and five-year periods ended December 31, 2022. The Board took into account management’s discussion of the Fund’s recent performance. Based upon its review, the Board concluded that the Fund’s performance was satisfactory relative to the performance of its peer universe and the index it is designed to track.
Management Fees and Expenses
In considering the Fund’s fees and expenses, the Board compared the Fund’s fees and total expense ratio with those of comparable funds in its expense universe. Among other findings, the data indicated that the Fund’s advisory and administrative fees (after taking into account waivers and/or reimbursements) (referred to collectively as “management fees”) and the Fund’s total expenses (net of waivers and/or reimbursements) were each below the
Calvert
US Large-Cap Value Responsible Index Fund
September 30, 2023
Board of Directors' Contract Approval — continued
respective median of the Fund’s expense universe. The Board took into account the Adviser’s current undertaking to maintain expense limitations for the Fund and that the Adviser was waiving and/or reimbursing a portion of the Fund’s expenses. Based upon its review, the Board concluded that the management fees were reasonable in view of the nature, extent and quality of services provided by the Adviser.
Profitability and Other “Fall-Out” Benefits
The Board reviewed the Adviser’s profitability in regard to the Fund and the Calvert Funds in the aggregate. In reviewing the overall profitability of the Fund to the Adviser, the Board also considered the fact that the Adviser and its affiliates provided sub-transfer agency support, administrative and distribution services to the Fund for which they received compensation. The information considered by the Board included the profitability of the Fund to the Adviser and its affiliates without regard to any marketing support or other payments by the Adviser and its affiliates to third parties in respect of distribution services. The Board also considered that the Adviser and its affiliates derived benefits to their reputation and other indirect benefits from their relationships with the Fund. Based upon its review, the Board concluded that the Adviser’s and its affiliates’ level of profitability from their relationships with the Fund was reasonable.
Economies of Scale
The Board considered the effect of the Fund’s current size and its potential growth on its performance and fees. The Board concluded that adding breakpoints to the advisory fee at specified asset levels would not be appropriate at this time. The Board noted that if the Fund’s assets increased over time, the Fund might realize other economies of scale if assets increased proportionally more than certain other expenses.
Calvert
US Large-Cap Value Responsible Index Fund
September 30, 2023
Liquidity Risk Management Program
The Fund has implemented a written liquidity risk management program (Program) and related procedures to manage its liquidity in accordance with Rule 22e-4 under the Investment Company Act of 1940, as amended (Liquidity Rule). The Liquidity Rule defines “liquidity risk” as the risk that a fund could not meet requests to redeem shares issued by the fund without significant dilution of the remaining investors’ interests in the fund. The Fund’s Board of Trustees/Directors has designated the investment adviser to serve as the administrator of the Program and the related procedures. The administrator has established a Liquidity Risk Management Oversight Committee (Committee) to perform the functions necessary to administer the Program. As part of the Program, the administrator is responsible for identifying illiquid investments and categorizing the relative liquidity of the Fund’s investments in accordance with the Liquidity Rule. Under the Program, the administrator assesses, manages, and periodically reviews the Fund’s liquidity risk, and is responsible for making certain reports to the Fund’s Board of Trustees/Directors and the Securities and Exchange Commission (SEC) regarding the liquidity of the Fund’s investments, and to notify the Board of Trustees/Directors and the SEC of certain liquidity events specified in the Liquidity Rule. The liquidity of the Fund’s portfolio investments is determined based on a number of factors including, but not limited to, relevant market, trading and investment-specific considerations under the Program.
At a meeting of the Fund’s Board of Trustees/Directors on June 13, 2023, the Committee provided a written report to the Fund’s Board of Trustees/ Directors pertaining to the operation, adequacy, and effectiveness of implementation of the Program, as well as the operation of the highly liquid investment minimum (if applicable) for the period January 1, 2022 through December 31, 2022 (Review Period). The Program operated effectively during the Review Period, supporting the administrator’s ability to assess, manage and monitor Fund liquidity risk, including during periods of market volatility and net redemptions. During the Review Period, the Fund met redemption requests on a timely basis.
There can be no assurance that the Program will achieve its objectives in the future. Please refer to the Fund’s prospectus for more information regarding the Fund’s exposure to liquidity risk and other principal risks to which an investment in the Fund may be subject.
Calvert
US Large-Cap Value Responsible Index Fund
September 30, 2023
Management and Organization
Fund Management. The Directors of Calvert Responsible Index Series, Inc. (the Corporation) are responsible for the overall management and supervision of the affairs of the Corporation. The Board members and officers of the Corporation are listed below. Except as indicated, each individual has held the office shown or other offices in the same company for the last five years. Board members hold indefinite terms of office. Each Board member holds office until his or her successor is elected and qualified, or until his or her earlier death, resignation, retirement, removal or disqualification. Under the terms of the Fund's current Board member retirement policy, an Independent Board member must retire at the end of the calendar year in which he or she turns 75. However, if such retirement would cause the Fund to be out of compliance with Section 16 of the 1940 Act or any other regulations or guidance of the SEC, then such retirement will not become effective until such time as action has been taken for the Fund to be in compliance therewith. The “noninterested Directors” consist of those Directors who are not “interested persons” of the Corporation, as that term is defined under the 1940 Act. The business address of each Board member and the Chief Compliance Officer is 2050 M Street NW, Washington, DC 20036 and the business address of the Secretary, Vice President and Chief Legal Officer and the Treasurer is Two International Place, Boston, Massachusetts 02110. As used below, “CRM” refers to Calvert Research and Management and “Eaton Vance” refers to Eaton Vance Management. Each Director oversees 46 funds in the Calvert fund complex. Each of Eaton Vance and CRM are indirect, wholly owned subsidiaries of Morgan Stanley. Each officer affiliated with CRM may hold a position with other CRM affiliates that is comparable to his or her position with CRM listed below.
| Name and Year of Birth | Corporation
Position(s) | Length of
Service | Principal Occupation(s) and Other Directorships
During Past Five Years and Other Relevant Experience |
| Interested Director | | | |
Theodore H. Eliopoulos(1)
1964 | Director and
President | Since 2022 | President and Chief Executive Officer of CRM and senior sponsor of Morgan Stanley Investment Management’s (MSIM) Diversity Council. Formerly, Vice Chairman & Head of Strategic Partnerships at MSIM (2019-2022). Former Chief Investment Officer and interim Chief Investment Officer (2014-2018) and Senior Investment Officer of Real Estate and Real Assets at California Public Employees’ Retirement System (CalPERS) (2007-2014). Former Chief Deputy Treasurer and Deputy Treasurer at the California State Treasurer's Office (2002-2006). Mr. Eliopoulos is an interested person because of his positions with CRM and certain affiliates.
Other Directorships. The Robert Toigo Foundation; Pacific Pension & Investment Institute (PPI). |
| Noninterested Directors |
Richard L. Baird, Jr.(2)
1948 | Director | Since 2000 | Regional Disaster Recovery Lead, American Red Cross of Greater
Pennsylvania (since 2017). Volunteer, American Red Cross (since 2015).
Former President and CEO of Adagio Health Inc. (retired in 2014) in
Pittsburgh, PA.
Other Directorships. None. |
Alice Gresham Bullock
1950 | Chair and
Director | Since 2016 | Professor Emerita at Howard University School of Law. Dean Emerita of
Howard University School of Law and Deputy Director of the Association
of American Law Schools (1992-1994).
Other Directorships. None. |
Cari M. Dominguez
1949 | Director | Since 2016 | Former Chair of the U.S. Equal Employment Opportunity Commission.
Other Directorships. ManpowerGroup Inc. (workforce solutions company);
Triple S Management Corporation (managed care); National Association of Corporate Directors. |
Karen Fang(3)
1958 | Director | Since 2023 | Formerly, Managing Director, Wealth Management at GAMCO Asset Management (asset management firm) (2020-2023). Formerly, Managing Director, Senior Portfolio Manager of Fiduciary Trust Company International (wealth management firm) (1993-2019).
Other Directorships. None. |
John G. Guffey, Jr.(2)
1948 | Director | Since 2000 | President of Aurora Press Inc., a privately held publisher of trade
paperbacks (since January 1997).
Other Directorships. Calvert Impact Capital, Inc. (through December 31, 2018); Calvert Ventures, LLC. |
Miles D. Harper, III
1962 | Director | Since 2005 | Partner, Carr Riggs & Ingram (public accounting firm) since October 2014.
Partner, Gainer Donnelly & Desroches (public accounting firm) (now Carr
Riggs & Ingram) (November 1999 - September 2014).
Other Directorships. Bridgeway Funds (9) (asset management). |
Joy V. Jones
1950 | Director | Since 2000 | Attorney.
Other Directorships. Palm Management Corporation. |
Calvert
US Large-Cap Value Responsible Index Fund
September 30, 2023
Management and Organization — continued
| Name and Year of Birth | Corporation
Position(s) | Length of
Service | Principal Occupation(s) and Other Directorships
During Past Five Years and Other Relevant Experience |
| Noninterested Directors (continued) |
Eddie Ramos(3)
1967 | Director | Since 2023 | Private investor (2022-present). Formerly, Head of External Advisors/Diversity Portfolio Management at the New Jersey Division of Investment (2020-2022). Formerly, Chief Investment Officer and Lead Portfolio Manager – Global Fundamental Equities at Cornerstone Capital Management (asset management firm) (2011-2017).
Other Directorships. Macquarie Optimum Funds (6) (asset management). |
Anthony A. Williams
1951 | Director | Since 2016 | CEO and Executive Director of the Federal City Council (July 2012 to
present); Senior Adviser and Independent Consultant for King and
Spalding LLP (September 2015 to present); Executive Director of Global
Government Practice at the Corporate Executive Board (January 2010 to
January 2012).
Other Directorships. Freddie Mac; Evoq Properties/Meruelo Maddux
Properties, Inc. (real estate management); Weston Solutions, Inc.
(environmental services); Bipartisan Policy Center’s Debt Reduction Task Force;
Chesapeake Bay Foundation; Catholic University of America; Urban Institute (research organization); The Howard Hughes Corporation (real estate development); Old Dominion National Bank. |
| Name and Year of Birth | Corporation
Position(s) | Length of
Service | Principal Occupation(s)
During Past Five Years |
| Principal Officers who are not Directors |
Hope L. Brown
1973 | Chief
Compliance
Officer | Since 2014 | Chief Compliance Officer of 46 registered investment companies advised
by CRM (since 2014). Vice President and Chief Compliance Officer,
Wilmington Funds (2012-2014). |
Deidre E. Walsh
1971 | Secretary,
Vice President
and Chief
Legal Officer | Since 2021 | Vice President of CRM and officer of 46 registered investment companies
advised by CRM (since 2021). Also Vice President of Eaton Vance and
certain of its affiliates and officer of 127 registered investment companies
advised or administered by Eaton Vance. |
James F. Kirchner
1967 | Treasurer | Since 2016 | Vice President of CRM and officer of 46 registered investment companies
advised by CRM (since 2016). Also Vice President of Eaton Vance and
certain of its affiliates and officer of 127 registered investment companies
advised or administered by Eaton Vance. |
| | | | |
| (1) Mr. Eliopoulos is an interested person of the Fund because of his positions with the Fund’s adviser and certain affiliates. |
| (2) Effective December 31, 2023, Richard L. Baird, Jr. and John G. Guffey, Jr. will retire from the Board of Directors. |
| (3) Ms. Fang and Mr. Ramos began serving as Directors effective October 30, 2023. |
The SAI for the Fund includes additional information about the Directors and officers of the Fund and can be obtained without charge on Calvert’s website at www.calvert.com or by calling 1-800-368-2745.
| FACTS | WHAT DOES EATON VANCE DO WITH YOUR
PERSONAL INFORMATION? |
| Why? | Financial companies choose how they share your personal information. Federal law gives consumers the right to limit some but not all sharing. Federal law also requires us to tell you how we collect, share, and protect your personal information. Please read this notice carefully to understand what we do. |
| |
| What? | The types of personal information we collect and share depend on the product or service you have with us. This information can include:■ Social Security number and income
■
investment experience and risk tolerance
■
checking account number and wire transfer instructions |
| |
| How? | All financial companies need to share customers’ personal information to run their everyday business. In the section below, we list the reasons financial companies can share their customers’ personal information; the reasons Eaton Vance chooses to share; and whether you can limit this sharing. |
Reasons we can share your
personal information | Does Eaton Vance
share? | Can you limit
this sharing? |
| For our everyday business purposes — such as to process your transactions, maintain your account(s), respond to court orders and legal investigations, or report to credit bureaus | Yes | No |
| For our marketing purposes — to offer our products and services to you | Yes | No |
| For joint marketing with other financial companies | No | We don’t share |
| For our investment management affiliates’ everyday business purposes — information about your transactions, experiences, and creditworthiness | Yes | Yes |
| For our affiliates’ everyday business purposes — information about your transactions and experiences | Yes | No |
| For our affiliates’ everyday business purposes — information about your creditworthiness | No | We don’t share |
| For our investment management affiliates to market to you | Yes | Yes |
| For our affiliates to market to you | No | We don’t share |
| For nonaffiliates to market to you | No | We don’t share |
To limit our
sharing | Call toll-free 1-800-368-2745 or email: CRMPrivacy@calvert.comPlease note:If you are a new customer, we can begin sharing your information 30 days from the date we sent this notice. When you are no longer our customer, we continue to share your information as described in this notice. However, you can contact us at any time to limit our sharing. |
| Questions? | Call toll-free 1-800-368-2745 or email: CRMPrivacy@calvert.com |
| Privacy Notice — continued | April 2021 |
| Who we are |
| Who is providing this notice? | Eaton Vance Management, Eaton Vance Distributors, Inc., Eaton Vance Trust Company, Eaton Vance Management (International) Limited, Eaton Vance Advisers International Ltd., Eaton Vance Global Advisors Limited, Eaton Vance Management’s Real Estate Investment Group, Boston Management and Research, Calvert Research and Management, Eaton Vance and Calvert Fund Families and our investment advisory affiliates (“Eaton Vance”) (see Investment Management Affiliates definition below) |
| What we do |
How does Eaton Vance
protect my personal
information? | To protect your personal information from unauthorized access and use, we use security measures that comply with federal law. These measures include computer safeguards and secured files and buildings. We have policies governing the proper handling of customer information by personnel and requiring third parties that provide support to adhere to appropriate security standards with respect to such information. |
How does Eaton Vance
collect my personal
information? | We collect your personal information, for example, when you■ open an account or make deposits or withdrawals from your account
■
buy securities from us or make a wire transfer
■
give us your contact informationWe also collect your personal information from others, such as credit bureaus, affiliates, or other companies. |
| Why can’t I limit all sharing? | Federal law gives you the right to limit only■ sharing for affiliates’ everyday business purposes — information about your creditworthiness
■
affiliates from using your information to market to you
■
sharing for nonaffiliates to market to youState laws and individual companies may give you additional rights to limit sharing. See below for more on your rights under state law. |
| Definitions |
Investment Management
Affiliates | Eaton Vance Investment Management Affiliates include registered investment advisers, registered broker- dealers, and registered and unregistered funds. Investment Management Affiliates does not include entities associated with Morgan Stanley Wealth Management, such as Morgan Stanley Smith Barney LLC and Morgan Stanley & Co. |
| Affiliates | Companies related by common ownership or control. They can be financial and nonfinancial companies.■ Our affiliates include companies with a Morgan Stanley name and financial companies such as Morgan Stanley Smith Barney LLC and Morgan Stanley & Co. |
| Nonaffiliates | Companies not related by common ownership or control. They can be financial and nonfinancial companies.■ Eaton Vance does not share with nonaffiliates so they can market to you. |
| Joint marketing | A formal agreement between nonaffiliated financial companies that together market financial products or services to you.■ Eaton Vance doesn’t jointly market. |
| Other important information |
| Vermont: Except as permitted by law, we will not share personal information we collect about Vermont residents with Nonaffiliates unless you provide us with your written consent to share such information.California: Except as permitted by law, we will not share personal information we collect about California residents with Nonaffiliates and we will limit sharing such personal information with our Affiliates to comply with California privacy laws that apply to us. |
Delivery of Shareholder Documents. The Securities and Exchange Commission (SEC) permits funds to deliver only one copy of shareholder documents, including prospectuses, proxy statements and shareholder reports, to fund investors with multiple accounts at the same residential or post office box address. This practice is often called “householding” and it helps eliminate duplicate mailings to shareholders. Calvert funds, or your financial intermediary, may household the mailing of your documents indefinitely unless you instruct Calvert funds, or your financial intermediary, otherwise. If you would prefer that your Calvert fund documents not be householded, please contact Calvert funds at 1-800-368-2745, or contact your financial intermediary. Your instructions that householding not apply to delivery of your Calvert fund documents will typically be effective within 30 days of receipt by Calvert funds or your financial intermediary.
Portfolio Holdings. Each Calvert fund files a schedule of portfolio holdings on Part F to Form N-PORT with the SEC. Certain information filed on Form N-PORT may be viewed on the Calvert website at www.calvert.com, by calling Calvert at 1-800-368-2745 or in the EDGAR database on the SEC’s website at www.sec.gov.
Proxy Voting. The Proxy Voting Guidelines that each Calvert fund uses to determine how to vote proxies relating to portfolio securities is provided as an Appendix to the fund’s Statement of Additional Information. The Statement of Additional Information can be obtained free of charge by calling the Calvert funds at 1-800-368-2745, by visiting the Calvert funds’ website at www.calvert.com or visiting the SEC’s website at www.sec.gov. Information regarding how a Calvert fund voted proxies relating to portfolio securities during the most recent 12-month period ended June 30 is available by calling Calvert funds, by visiting the Calvert funds’ website at www.calvert.com or by visiting the SEC’s website at www.sec.gov.
Tailored Shareholder Reports. Effective January 24, 2023, the SEC adopted rule and form amendments to require open-end mutual funds and ETFs to transmit concise and visually engaging streamlined annual and semiannual reports to shareholders that highlight key information. Other information, including financial statements, will no longer appear in a streamlined shareholder report but must be available online, delivered free of charge upon request, and filed on a semiannual basis on Form N-CSR. The rule and form amendments have a compliance date of July 24, 2024. At this time, management is evaluating the impact of these amendments on the shareholder reports for the Calvert Funds.
This Page Intentionally Left Blank
This Page Intentionally Left Blank
Investment Adviser and Administrator
Calvert Research and Management
2050 M Street NW
Washington, DC 20036
Principal Underwriter*
Eaton Vance Distributors, Inc.
Two International Place
Boston, MA 02110
(617) 482-8260
Custodian
State Street Bank and Trust Company
One Congress Street, Suite 1
Boston, MA 02114-2016
Transfer Agent
SS&C Global Investor & Distribution Solutions, Inc.
2000 Crown Colony Drive
Quincy, MA 02169
Independent Registered Public Accounting Firm
Deloitte & Touche LLP
200 Berkeley Street
Boston, MA 02116-5022
Fund Offices
2050 M Street NW
Washington, DC 20036
* FINRA BrokerCheck. Investors may check the background of their Investment Professional by contacting the Financial Industry Regulatory Authority (FINRA). FINRA BrokerCheck is a free tool to help investors check the professional background of current and former FINRA-registered securities firms and brokers. FINRA BrokerCheck is available by calling 1-800-289-9999 and at www.FINRA.org. The FINRA BrokerCheck brochure describing this program is available to investors at www.FINRA.org.
Printed on recycled paper.
24191 9.30.23
Calvert
International Responsible Index Fund
Annual Report
September 30, 2023
Commodity Futures Trading Commission Registration. The Commodity Futures Trading Commission (“CFTC”) has adopted regulations that subject registered investment companies and advisers to regulation by the CFTC if a fund invests more than a prescribed level of its assets in certain CFTC-regulated instruments (including futures, certain options and swap agreements) or markets itself as providing investment exposure to such instruments. The adviser has claimed an exclusion from the definition of “commodity pool operator” under the Commodity Exchange Act with respect to its management of the Fund and the other funds it manages. Accordingly, neither the Fund nor the adviser is subject to CFTC regulation.
Fund shares are not insured by the FDIC and are not deposits or other obligations of, or guaranteed by, any depository institution. Shares are subject to investment risks, including possible loss of principal invested.
This report must be preceded or accompanied by a current summary prospectus or prospectus. Before investing, investors should consider carefully the investment objective, risks, and charges and expenses of a mutual fund. This and other important information is contained in the summary prospectus and prospectus, which can be obtained from a financial intermediary. Prospective investors should read the prospectus carefully before investing. For further information, please call 1-800-368-2745.
Choose Planet-friendly E-delivery!
Sign up now for on-line statements, prospectuses, and fund reports. In less than five minutes you can help reduce paper mail and lower fund costs.
Just go to www.calvert.com. If you already have an online account with the Calvert funds, click on Login to access your Account and select the documents you would like to receive via e-mail.
If you’re new to online account access, click on Login, then Register to create your user name and password. Once you’re in, click on the E-delivery sign-up on the Account Portfolio page and follow the quick, easy steps.
Note: If your shares are not held directly with the Calvert funds but through a brokerage firm, you must contact your broker for electronic delivery options available through their firm.
Annual Report September 30, 2023
Calvert
International Responsible Index Fund
Calvert
International Responsible Index Fund
September 30, 2023
Management's Discussion of Fund Performance†
Economic and Market Conditions
For global equity investors, the 12-month period ended September 30, 2023, was a roller-coaster ride, driven largely by shifting perceptions of whether the U.S. Federal Reserve (the Fed) could bring the world’s largest economy in for a soft landing, and changing expectations of how long interest rates might remain high.
During the opening two months of the period, stocks rallied on strong corporate earnings, attractive valuations, and hope the Fed might slow the pace of its interest rate hikes. But in December 2022, equities lost ground as “higher for longer” interest rate fears returned. A continuing irony throughout the period was that good economic news -- record low unemployment, strong job creation, and robust consumer spending -- was viewed as bad news for inflation and fuel for further rate hikes that would weigh on stock prices.
In January 2023, however, global equities began a rally that lasted through July. The initial tailwind was ChatGPT, an artificial intelligence (AI) application that led investors to perceive AI might become the next big innovation to drive the information technology (IT) sector. As a result, IT -- one of the worst-performing sectors in 2022 -- became the standout sector of the first half of 2023.
Earlier recession fears that had weighed on stock prices receded as many investors came around to the view that the U.S. and global economies were doing surprisingly well. European equities received an additional boost as feared continent-wide energy shortages failed to materialize during the winter.
But in the final two months of the period, the bond market halted the stock market’s momentum. As it became clear the Fed would keep rates higher for longer than investors had anticipated just a few months earlier, longer term bond interest rates rose sharply. Given the potential for relatively attractive returns with lower risk than stocks, many investors shifted from equity assets to bonds. Stock prices ended on a down note as the period came to a close.
For the period as a whole, however, global equity performance was strong. The MSCI ACWI Index®, a broad measure of global equities, returned 20.80%; the MSCI EAFE Index® of developed-market international equities returned 25.65%; and the S&P 500®, a broad measure of U.S. stocks, returned 21.62%.
Meanwhile, in the world’s second-largest economy, performance was not as strong. The MSCI Golden Dragon Index®, a measure of Chinese large-cap and mid-cap stocks, was one of the weakest performing major global indexes, returning 8.80% during the period. The Chinese equity market was dogged by an ailing real estate sector -- the major investment area for millions of Chinese citizens -- and a failure of many Chinese industries to bounce back after onerous COVID restrictions were lifted.
Fund Performance
For the 12-month period ended September 30, 2023, Calvert International Responsible Index Fund (the Fund) returned 24.06% for Class A shares at net asset value (NAV). The Fund outperformed its primary benchmark, the MSCI World ex-USA Index (the Index), which returned 24.00%; and underperformed its secondary benchmark, the Calvert International Responsible Index (the Calvert Index), which returned 24.22% during the period.
The Fund’s underperformance versus the Calvert Index was due to Fund expenses and fees, which the Calvert Index does not incur.
All of the 11 market sectors held by the Fund delivered positive performance, with nearly all sectors posting double-digit returns during the period. The strongest-performing sectors were information technology (IT), consumer discretionary, and financials. The weakest-performing sectors were consumer staples, communication services, and real estate -- with real estate being the only sector to post single-digit returns, as property sales were hampered by rising mortgage rates and post-COVID office space cutbacks.
The Fund’s outperformance versus the Index was due in part to an overweight position in the IT sector. Fueled by excitement about new artificial intelligence (AI) programs and applications, IT was the strongest-performing sector within the Index and the Fund during the period.
In the IT sector, the Fund’s out-of-Index position in Samsung Electronics Co. Ltd. (Samsung) was the largest individual stock contributor to Index-relative returns. Samsung, one of the world’s biggest producers of semiconductors, saw its stock price rise dramatically as memory chip prices rebounded during the period and demand for powerful computing chips rose with the boom in AI.
Stock selections in the materials sector helped performance versus the Index as well. Significant contributors to relative returns included the Fund’s out-of-Index positions in South Korean steel maker POSCO Holdings, Inc. -- whose battery materials business benefited from strong demand for lithium -- and U.K.-headquartered Linde Plc. -- one of the world’s largest suppliers of industrial gases.
Stock selections and an underweight position in the consumer staples sector, which underperformed the Index, also contributed to Index-relative returns during the period.
See Endnotes and Additional Disclosures in this report.
Past performance is no guarantee of future results. Returns are historical and are calculated by determining the percentage change in net asset value (NAV) or offering price (as applicable) with all distributions reinvested. Furthermore, returns do not reflect the deduction of taxes that shareholders may have to pay on Fund distributions or upon the redemption of Fund shares. Investment return and principal value will fluctuate so that shares, when redeemed, may be worth more or less than their original cost. Performance for periods less than or equal to one year is cumulative. Performance is for the stated time period only; due to market volatility, current Fund performance may be lower or higher than the quoted return. For performance as of the most recent month-end, please refer to www.calvert.com.
Calvert
International Responsible Index Fund
September 30, 2023
Management's Discussion of Fund Performance† — continued
In contrast, security selections in the industrials sector detracted from Fund performance versus the Index. Not owning Japanese industrial conglomerate Mitsubishi Corp. and European aerospace firm Airbus SE -- two Index positions that performed well during the period -- hampered Index-relative returns.
An underweight position in the energy sector also detracted from performance versus the Index. As rising oil prices during the period boosted stock returns in the energy sector, not owning strong-performing Index positions -- including France-based TotalEnergies SE, U.K.-headquartered Shell Plc., and Canadian Natural Resources Ltd. -- dragged on Index-relative returns during the period.
See Endnotes and Additional Disclosures in this report.
Past performance is no guarantee of future results. Returns are historical and are calculated by determining the percentage change in net asset value (NAV) or offering price (as applicable) with all distributions reinvested. Furthermore, returns do not reflect the deduction of taxes that shareholders may have to pay on Fund distributions or upon the redemption of Fund shares. Investment return and principal value will fluctuate so that shares, when redeemed, may be worth more or less than their original cost. Performance for periods less than or equal to one year is cumulative. Performance is for the stated time period only; due to market volatility, current Fund performance may be lower or higher than the quoted return. For performance as of the most recent month-end, please refer to www.calvert.com.
Calvert
International Responsible Index Fund
September 30, 2023
Performance
Portfolio Manager(s) Thomas C. Seto of Calvert Research and Management
| % Average Annual Total Returns1,2 | Class
Inception Date | Performance
Inception Date | One Year | Five Years | Since
Inception |
| Class A at NAV | 10/30/2015 | 10/30/2015 | 24.06% | 3.85% | 4.83% |
| Class A with 4.75% Maximum Sales Charge | — | — | 18.16 | 2.84 | 4.18 |
| Class I at NAV | 10/30/2015 | 10/30/2015 | 24.35 | 4.11 | 5.13 |
| Class R6 at NAV | 02/01/2019 | 10/30/2015 | 24.44 | 4.14 | 5.15 |
|
| MSCI World ex USA Index | — | — | 24.00% | 3.44% | 4.70% |
| Calvert International Responsible Index | — | — | 24.22 | 4.30 | 5.20 |
| % Total Annual Operating Expense Ratios3 | Class A | Class I | Class R6 |
| Gross | 0.65% | 0.40% | 0.37% |
| Net | 0.54 | 0.29 | 0.26 |
Growth of $10,000
This graph shows the change in value of a hypothetical investment of $10,000 in Class A of the Fund for the period indicated. For comparison, the same investment is shown in the indicated index.
| Growth of Investment2 | Amount Invested | Period Beginning | At NAV | With Maximum Sales Charge |
| Class I, at minimum investment | $1,000,000 | 10/30/2015 | $1,486,317 | N.A. |
| Class R6, at minimum investment | $5,000,000 | 10/30/2015 | $7,441,648 | N.A. |
See Endnotes and Additional Disclosures in this report.
Past performance is no guarantee of future results. Returns are historical and are calculated by determining the percentage change in net asset value (NAV) or offering price (as applicable) with all distributions reinvested. Furthermore, returns do not reflect the deduction of taxes that shareholders may have to pay on Fund distributions or upon the redemption of Fund shares. Investment return and principal value will fluctuate so that shares, when redeemed, may be worth more or less than their original cost. Performance for periods less than or equal to one year is cumulative. Performance is for the stated time period only; due to market volatility, current Fund performance may be lower or higher than the quoted return. For performance as of the most recent month-end, please refer to www.calvert.com.
Calvert
International Responsible Index Fund
September 30, 2023
| Sector Allocation (% of net assets)1 |
| Top 10 Holdings (% of net assets)1 | |
| Taiwan Semiconductor Manufacturing Co., Ltd. | 2.2% |
| Nestle S.A. | 1.8 |
| Novo Nordisk A/S, Class B | 1.6 |
| Samsung Electronics Co., Ltd. | 1.6 |
| Toyota Motor Corp. | 1.4 |
| ASML Holding NV | 1.3 |
| AstraZeneca PLC | 1.2 |
| LVMH Moet Hennessy Louis Vuitton SE | 1.1 |
| Linde PLC | 1.1 |
| Novartis AG | 1.1 |
| Total | 14.4% |
Footnotes:
| 1 | Excludes cash and cash equivalents. |
Calvert
International Responsible Index Fund
September 30, 2023
Endnotes and Additional Disclosures
| † | The views expressed in this report are those of the portfolio manager(s) and are current only through the date stated at the top of this page. These views are subject to change at any time based upon market or other conditions, and Calvert and the Fund(s) disclaim any responsibility to update such views. These views may not be relied upon as investment advice and, because investment decisions are based on many factors, may not be relied upon as an indication of trading intent on behalf of any Calvert fund. This commentary may contain statements that are not historical facts, referred to as “forward-looking statements.” The Fund’s actual future results may differ significantly from those stated in any forward-looking statement, depending on factors such as changes in securities or financial markets or general economic conditions, the volume of sales and purchases of Fund shares, the continuation of investment advisory, administrative and service contracts, and other risks discussed from time to time in the Fund’s filings with the Securities and Exchange Commission. |
| | |
| 1 | MSCI World ex USA Index is an unmanaged index of equity securities in the developed markets, excluding the United States. MSCI indexes are net of foreign withholding taxes. Source: MSCI. MSCI data may not be reproduced or used for any other purpose. MSCI provides no warranties, has not prepared or approved this report, and has no liability hereunder. Calvert International Responsible Index (the “Calvert Index”) is composed of common stocks of large companies in developed markets, excluding the U.S. Large companies in developed markets are the 1,000 largest publicly traded companies, excluding real estate investment trusts and business development companies, in markets that Calvert Research and Management determines to be developed markets based on a set of criteria including level of economic development, existence of capital controls, openness to foreign direct investment, market trading and liquidity conditions, regulatory environment, treatment of minority shareholders, and investor expectations. The Calvert Principles for Responsible Investment serve as a framework for considering environmental, social and governance factors that may affect investment performance. Stocks are weighted in the Calvert Index based on their float-adjusted market capitalization, by country and by sector, subject to certain prescribed limits. Unless otherwise stated, index returns do not reflect the effect of any applicable sales charges, commissions, expenses, taxes or leverage, as applicable. It is not possible to invest directly in an index. |
| 2 | Total Returns at NAV do not include applicable sales charges. If sales charges were deducted, the returns would be lower. Total Returns shown with maximum sales charge reflect the stated maximum sales charge. Unless otherwise stated, performance does not reflect the deduction of taxes on Fund distributions or redemptions of Fund shares. |
| | Performance prior to the inception date of a class may be linked to the performance of an older class of the Fund. This linked performance is adjusted for any applicable sales charge, but is not adjusted for class expense differences. If adjusted for such differences, the performance would be different. The performance of Class R6 is linked to Class I. Performance since inception for an index, if presented, is the performance since the Fund’s or oldest share class’s inception, as applicable. Performance presented in the Financial Highlights included in the financial statements is not linked.Calvert Research and Management became the investment adviser to the Fund on December 31, 2016. Performance reflected prior to such date is that of the Fund’s former investment adviser. |
| 3 | Source: Fund prospectus. Net expense ratios reflect a contractual expense reimbursement that continues through 1/31/24. The expense ratios for the current reporting period can be found in the Financial Highlights section of this report. Performance reflects expenses waived and/or reimbursed, if applicable. Without such waivers and/or reimbursements, performance would have been lower. |
| Additional Information |
| | S&P 500® Index is an unmanaged index of large-cap stocks commonly used as a measure of U.S. stock market performance. S&P Dow Jones Indices are a product of S&P Dow Jones Indices LLC (“S&P DJI”) and have been licensed for use. S&P® and S&P 500® are registered trademarks of S&P DJI; Dow Jones® is a registered trademark of Dow Jones Trademark Holdings LLC (“Dow Jones”); S&P DJI, Dow Jones and their respective affiliates do not sponsor, endorse, sell or promote the Fund, will not have any liability with respect thereto and do not have any liability for any errors, omissions, or interruptions of the S&P Dow Jones Indices. MSCI Golden Dragon Index is an unmanaged index of common stocks traded in China, Hong Kong and Taiwan. MSCI ACWI Index is an unmanaged free-float-adjusted, market-capitalization-weighted index designed to measure the equity market performance of developed and emerging markets. MSCI EAFE Index is an unmanaged index of equities in the developed markets, excluding the U.S. and Canada. |
Calvert
International Responsible Index Fund
September 30, 2023
Example
As a Fund shareholder, you incur two types of costs: (1) transaction costs, including sales charges (loads) on purchases; and (2) ongoing costs, including management fees; distribution and/or service fees; and other Fund expenses. This Example is intended to help you understand your ongoing costs (in dollars) of Fund investing and to compare these costs with the ongoing costs of investing in other mutual funds. The Example is based on an investment of $1,000 invested at the beginning of the period and held for the entire period (April 1, 2023 to September 30, 2023).
Actual Expenses
The first section of the table below provides information about actual account values and actual expenses. You may use the information in this section, together with the amount you invested, to estimate the expenses that you paid over the period. Simply divide your account value by $1,000 (for example, an $8,600 account value divided by $1,000 = 8.6), then multiply the result by the number in the first section under the heading entitled “Expenses Paid During Period” to estimate the expenses you paid on your account during this period.
Hypothetical Example for Comparison Purposes
The second section of the table below provides information about hypothetical account values and hypothetical expenses based on the actual Fund expense ratio and an assumed rate of return of 5% per year (before expenses), which is not the actual Fund return. The hypothetical account values and expenses may not be used to estimate the actual ending account balance or expenses you paid for the period. You may use this information to compare the ongoing costs of investing in the Fund and other funds. To do so, compare this 5% hypothetical example with the 5% hypothetical examples that appear in the shareholder reports of the other funds.
Please note that the expenses shown in the table are meant to highlight your ongoing costs only and do not reflect any transactional costs, such as sales charges (loads). Therefore, the second section of the table is useful in comparing ongoing costs only, and will not help you determine the relative total costs of owning different funds. In addition, if these transactional costs were included, your costs would be higher.
| | Beginning
Account Value
(4/1/23) | Ending
Account Value
(9/30/23) | Expenses Paid
During Period*
(4/1/23 – 9/30/23) | Annualized
Expense
Ratio |
| Actual | | | | |
| Class A | $1,000.00 | $ 976.20 | $2.68 ** | 0.54% |
| Class I | $1,000.00 | $ 977.60 | $1.44 ** | 0.29% |
| Class R6 | $1,000.00 | $ 978.00 | $1.29 ** | 0.26% |
| Hypothetical | | | | |
| (5% return per year before expenses) | | | | |
| Class A | $1,000.00 | $1,022.36 | $2.74 ** | 0.54% |
| Class I | $1,000.00 | $1,023.61 | $1.47 ** | 0.29% |
| Class R6 | $1,000.00 | $1,023.76 | $1.32 ** | 0.26% |
| * | Expenses are equal to the Fund's annualized expense ratio for the indicated Class, multiplied by the average account value over the period, multiplied by 183/365 (to reflect the one-half year period). The Example assumes that the $1,000 was invested at the net asset value per share determined at the close of business on March 31, 2023. |
| ** | Absent a waiver and/or reimbursement of expenses by affiliate(s), expenses would be higher. |
Calvert
International Responsible Index Fund
September 30, 2023
| Security | Shares | Value |
| Australia — 5.4% | |
| Allkem, Ltd.(1) | | 77,024 | $ 575,941 |
| ANZ Group Holdings, Ltd. | | 172,399 | 2,827,631 |
| APA Group | | 83,617 | 444,828 |
| ASX, Ltd. | | 9,943 | 363,695 |
| Atlas Arteria, Ltd. | | 62,471 | 221,197 |
| BlueScope Steel, Ltd. | | 64,170 | 794,649 |
| Brambles, Ltd. | | 91,951 | 844,711 |
| carsales.com, Ltd. | | 24,284 | 435,033 |
| Cochlear, Ltd. | | 4,040 | 661,684 |
| Coles Group, Ltd. | | 90,232 | 900,592 |
| Commonwealth Bank of Australia | | 83,999 | 5,365,523 |
| Computershare, Ltd. | | 28,258 | 470,906 |
| CSL, Ltd. | | 28,340 | 4,565,659 |
| Endeavour Group, Ltd. | | 92,526 | 312,393 |
| Fortescue Metals Group, Ltd. | | 159,464 | 2,119,763 |
| IGO, Ltd. | | 88,273 | 708,393 |
| Insurance Australia Group, Ltd. | | 135,051 | 489,904 |
| Macquarie Group, Ltd. | | 22,210 | 2,378,426 |
| Medibank Private, Ltd. | | 169,618 | 374,369 |
| National Australia Bank, Ltd. | | 176,937 | 3,284,718 |
| Pilbara Minerals, Ltd. | | 347,760 | 948,755 |
| Qantas Airways, Ltd.(1) | | 56,530 | 187,142 |
| QBE Insurance Group, Ltd. | | 82,275 | 824,168 |
| Ramsay Health Care, Ltd. | | 12,004 | 398,418 |
| REA Group, Ltd. | | 3,413 | 337,076 |
| Reece, Ltd. | | 13,514 | 160,862 |
| SEEK, Ltd. | | 17,700 | 250,049 |
| Sonic Healthcare, Ltd. | | 28,021 | 535,059 |
| South32, Ltd. | | 606,166 | 1,308,837 |
| Suncorp Group, Ltd. | | 74,479 | 663,581 |
| Telstra Group, Ltd. | | 254,495 | 628,766 |
| Transurban Group | | 189,037 | 1,536,050 |
| Wesfarmers, Ltd. | | 68,098 | 2,304,706 |
| Westpac Banking Corp. | | 201,177 | 2,719,420 |
| WiseTech Global, Ltd. | | 8,984 | 372,929 |
| Woolworths Group, Ltd. | | 84,597 | 2,025,353 |
| Worley, Ltd. | | 21,105 | 234,326 |
| | | | $ 43,575,512 |
| Austria — 0.3% | |
| ANDRITZ AG | | 4,246 | $ 213,967 |
| Erste Group Bank AG | | 13,368 | 461,689 |
| OMV AG | | 18,592 | 888,038 |
| Verbund AG | | 3,096 | 251,865 |
| voestalpine AG | | 14,344 | 390,520 |
| | | | $ 2,206,079 |
| Belgium — 0.6% | |
| Ackermans & van Haaren NV | | 754 | $ 113,937 |
| Security | Shares | Value |
| Belgium (continued) | |
| Ageas S.A./NV | | 5,466 | $ 225,125 |
| Anheuser-Busch InBev S.A./NV | | 42,252 | 2,342,288 |
| Azelis Group NV | | 3,839 | 75,782 |
| D'Ieteren Group | | 906 | 152,746 |
| Elia Group S.A./NV | | 1,495 | 146,302 |
| Groupe Bruxelles Lambert NV | | 3,629 | 270,035 |
| KBC Group NV | | 10,646 | 662,784 |
| Sofina S.A. | | 788 | 159,266 |
| Solvay S.A. | | 3,282 | 362,691 |
| UCB S.A. | | 5,719 | 468,439 |
| Umicore S.A. | | 10,753 | 254,594 |
| | | | $ 5,233,989 |
| Canada — 9.5% | |
| Agnico Eagle Mines, Ltd. | | 48,743 | $ 2,214,922 |
| Air Canada(1)(2) | | 18,211 | 259,841 |
| Algonquin Power & Utilities Corp.(2) | | 35,497 | 210,120 |
| Alimentation Couche-Tard, Inc. | | 48,686 | 2,472,564 |
| Bank of Montreal(2) | | 38,317 | 3,232,367 |
| Bank of Nova Scotia (The)(2) | | 64,757 | 2,902,563 |
| BCE, Inc.(2) | | 17,557 | 670,223 |
| Brookfield Asset Management, Ltd., Class A | | 21,515 | 716,929 |
| Brookfield Corp.(2) | | 80,109 | 2,504,862 |
| BRP, Inc.(2) | | 2,389 | 180,831 |
| CAE, Inc.(1) | | 19,361 | 452,006 |
| Cameco Corp. | | 52,838 | 2,096,403 |
| Canadian Imperial Bank of Commerce | | 50,147 | 1,935,731 |
| Canadian National Railway Co. | | 39,009 | 4,224,431 |
| Canadian Pacific Kansas City, Ltd.(2) | | 57,167 | 4,249,277 |
| Canadian Tire Corp., Ltd., Class A | | 3,361 | 361,402 |
| Canadian Utilities, Ltd., Class A | | 7,374 | 155,814 |
| CCL Industries, Inc., Class B | | 8,848 | 371,378 |
| CGI, Inc.(1) | | 12,014 | 1,184,196 |
| Constellation Software, Inc.(2) | | 1,141 | 2,355,563 |
| Descartes Systems Group, Inc. (The)(1) | | 4,574 | 335,713 |
| Dollarama, Inc. | | 16,031 | 1,104,496 |
| Element Fleet Management Corp.(2) | | 21,788 | 312,644 |
| Emera, Inc.(2) | | 16,062 | 560,766 |
| Empire Co., Ltd., Class A | | 11,152 | 303,380 |
| FirstService Corp.(2) | | 2,111 | 307,049 |
| Fortis, Inc.(2) | | 26,952 | 1,023,710 |
| George Weston, Ltd. | | 3,990 | 442,491 |
| GFL Environmental, Inc.(2) | | 13,205 | 419,313 |
| Great-West Lifeco, Inc. | | 14,798 | 423,376 |
| Hydro One, Ltd.(3) | | 19,532 | 497,270 |
| iA Financial Corp., Inc. | | 5,199 | 326,122 |
| IGM Financial, Inc.(2) | | 4,844 | 122,861 |
| Intact Financial Corp. | | 9,370 | 1,366,057 |
| Loblaw Cos., Ltd. | | 10,125 | 860,243 |
| Lundin Mining Corp. | | 89,343 | 666,331 |
| Magna International, Inc.(2) | | 16,972 | 909,869 |
8
See Notes to Financial Statements.
Calvert
International Responsible Index Fund
September 30, 2023
Schedule of Investments — continued
| Security | Shares | Value |
| Canada (continued) | |
| Manulife Financial Corp. | | 98,491 | $ 1,799,777 |
| Metro, Inc. | | 15,494 | 804,673 |
| National Bank of Canada(2) | | 18,528 | 1,230,835 |
| Northland Power, Inc.(2) | | 14,233 | 231,794 |
| Nutrien, Ltd.(2) | | 30,298 | 1,871,081 |
| Open Text Corp.(2) | | 14,800 | 519,430 |
| Power Corp. of Canada(2) | | 31,599 | 804,486 |
| Quebecor, Inc., Class B | | 8,692 | 186,287 |
| RB Global, Inc.(2) | | 11,772 | 737,045 |
| Rogers Communications, Inc., Class B | | 22,049 | 846,571 |
| Royal Bank of Canada(2) | | 67,519 | 5,900,611 |
| Saputo, Inc. | | 17,192 | 359,472 |
| Shopify, Inc., Class A(1) | | 65,155 | 3,555,508 |
| Stantec, Inc.(2) | | 5,952 | 386,195 |
| Sun Life Financial, Inc. | | 31,779 | 1,550,520 |
| Teck Resources, Ltd., Class B | | 54,058 | 2,326,693 |
| TELUS Corp. | | 26,536 | 433,329 |
| TFI International, Inc.(2) | | 4,940 | 634,444 |
| Thomson Reuters Corp. | | 10,768 | 1,317,291 |
| TMX Group, Ltd. | | 13,450 | 289,052 |
| Toromont Industries, Ltd. | | 5,188 | 422,527 |
| Toronto-Dominion Bank (The) | | 91,621 | 5,519,858 |
| Waste Connections, Inc. | | 14,571 | 1,956,424 |
| West Fraser Timber Co., Ltd. | | 3,117 | 226,297 |
| WSP Global, Inc.(2) | | 7,087 | 1,000,241 |
| | | | $ 77,643,555 |
| Denmark — 2.6% | |
| AP Moller - Maersk A/S, Class B | | 243 | $ 437,131 |
| Carlsberg A/S, Class B | | 4,617 | 582,134 |
| Chr. Hansen Holding A/S | | 4,934 | 301,828 |
| Coloplast A/S, Class B | | 5,433 | 574,904 |
| Danske Bank A/S | | 26,170 | 607,301 |
| Demant A/S(1) | | 4,371 | 180,484 |
| DSV A/S | | 8,360 | 1,557,808 |
| Genmab A/S(1) | | 3,017 | 1,068,171 |
| Jyske Bank A/S(1) | | 1,791 | 130,643 |
| Novo Nordisk A/S, Class B | | 145,118 | 13,213,165 |
| Novozymes A/S, Class B | | 10,546 | 424,317 |
| Orsted A/S(3) | | 7,861 | 427,663 |
| Pandora A/S | | 4,112 | 424,322 |
| ROCKWOOL International A/S, Class B | | 541 | 130,752 |
| Topdanmark A/S | | 1,703 | 73,935 |
| Tryg A/S | | 13,664 | 250,043 |
| Vestas Wind Systems A/S(1) | | 50,198 | 1,073,930 |
| | | | $ 21,458,531 |
| Finland — 1.0% | |
| Elisa Oyj | | 6,281 | $ 291,270 |
| Fortum Oyj(2) | | 17,211 | 199,597 |
| Kesko Oyj, Class B | | 12,395 | 222,072 |
| Security | Shares | Value |
| Finland (continued) | |
| Kone Oyj, Class B | | 14,903 | $ 628,013 |
| Metso Oyj | | 34,987 | 366,904 |
| Neste Oyj(2) | | 53,471 | 1,810,989 |
| Nokia Oyj | | 216,041 | 812,330 |
| Nordea Bank Abp | | 127,022 | 1,392,634 |
| Orion Oyj, Class B | | 4,150 | 163,036 |
| Sampo Oyj, Class A | | 18,363 | 793,860 |
| Stora Enso Oyj, Class R | | 33,759 | 423,114 |
| UPM-Kymmene Oyj | | 26,706 | 914,436 |
| Valmet Oyj(2) | | 7,840 | 178,991 |
| Wartsila Oyj Abp | | 24,526 | 277,976 |
| | | | $ 8,475,222 |
| France — 9.5% | |
| Accor S.A. | | 10,180 | $ 342,398 |
| Air France-KLM(1)(2) | | 4,794 | 59,998 |
| Air Liquide S.A. | | 28,256 | 4,759,200 |
| Alstom S.A. | | 16,577 | 393,989 |
| Alten S.A. | | 1,634 | 214,416 |
| Amundi S.A.(3) | | 2,563 | 143,955 |
| Arkema S.A. | | 3,086 | 303,788 |
| AXA S.A. | | 95,794 | 2,842,099 |
| BioMerieux | | 2,430 | 235,080 |
| BNP Paribas S.A. | | 51,048 | 3,245,952 |
| Bouygues S.A. | | 9,333 | 326,325 |
| Bureau Veritas S.A. | | 16,442 | 407,697 |
| Capgemini SE | | 8,361 | 1,458,943 |
| Carrefour S.A. | | 33,800 | 580,518 |
| Cie de Saint-Gobain S.A. | | 39,796 | 2,381,806 |
| Cie Generale des Etablissements Michelin SCA | | 35,880 | 1,098,178 |
| Credit Agricole S.A. | | 50,102 | 615,994 |
| Danone S.A. | | 35,670 | 1,967,477 |
| Dassault Systemes SE | | 33,330 | 1,237,957 |
| Edenred SE | | 15,482 | 968,492 |
| Eiffage S.A. | | 3,806 | 361,256 |
| Elis S.A. | | 12,454 | 218,733 |
| Engie S.A. | | 88,817 | 1,362,112 |
| EssilorLuxottica S.A. | | 15,656 | 2,723,292 |
| Eurazeo SE | | 1,825 | 108,597 |
| Eurofins Scientific SE | | 8,492 | 478,585 |
| Forvia SE(1) | | 7,528 | 154,877 |
| Getlink SE | | 19,320 | 307,997 |
| Hermes International SCA | | 1,730 | 3,153,491 |
| Ipsen S.A. | | 1,880 | 246,321 |
| Kering S.A. | | 3,566 | 1,620,258 |
| Legrand S.A. | | 14,405 | 1,323,622 |
| L'Oreal S.A. | | 12,551 | 5,201,286 |
| LVMH Moet Hennessy Louis Vuitton SE | | 12,298 | 9,282,905 |
| Neoen S.A.(3) | | 3,811 | 110,827 |
| Orange S.A. | | 85,485 | 980,536 |
| Pernod Ricard S.A. | | 11,026 | 1,835,718 |
9
See Notes to Financial Statements.
Calvert
International Responsible Index Fund
September 30, 2023
Schedule of Investments — continued
| Security | Shares | Value |
| France (continued) | |
| Publicis Groupe S.A. | | 13,862 | $ 1,049,251 |
| Renault S.A. | | 9,743 | 398,649 |
| Rexel S.A. | | 14,220 | 318,613 |
| Safran S.A. | | 19,281 | 3,021,509 |
| Sanofi | | 57,306 | 6,153,246 |
| Sartorius Stedim Biotech | | 1,134 | 269,782 |
| Schneider Electric SE | | 29,420 | 4,848,183 |
| SCOR SE | | 7,381 | 229,157 |
| SEB S.A. | | 1,385 | 129,203 |
| Societe Generale S.A. | | 37,057 | 896,691 |
| Sodexo S.A. | | 4,875 | 501,869 |
| SOITEC (1) | | 1,467 | 243,458 |
| SPIE S.A. | | 6,201 | 179,964 |
| Teleperformance SE | | 3,016 | 378,678 |
| Thales S.A. | | 5,980 | 840,448 |
| Valeo SE | | 12,712 | 218,137 |
| Veolia Environnement S.A. | | 34,994 | 1,011,542 |
| Verallia S.A.(3) | | 4,023 | 158,241 |
| Vinci S.A. | | 24,548 | 2,715,770 |
| Vivendi SE | | 51,179 | 448,231 |
| Wendel SE | | 1,441 | 113,903 |
| Worldline S.A.(1)(3) | | 10,607 | 297,752 |
| | | | $ 77,476,952 |
| Germany — 6.4% | |
| adidas AG | | 7,931 | $ 1,391,165 |
| Allianz SE | | 18,921 | 4,502,746 |
| Bayerische Motoren Werke AG | | 17,739 | 1,801,699 |
| Bechtle AG | | 4,581 | 213,338 |
| Beiersdorf AG | | 4,879 | 629,337 |
| BioNTech SE ADR(1) | | 3,242 | 352,211 |
| Brenntag SE | | 8,067 | 624,198 |
| Carl Zeiss Meditec AG | | 1,767 | 154,034 |
| Commerzbank AG | | 48,184 | 546,857 |
| Continental AG | | 6,015 | 422,626 |
| Covestro AG(1)(3) | | 9,816 | 527,855 |
| CTS Eventim AG & Co. KGaA | | 3,411 | 193,620 |
| Daimler Truck Holding AG | | 25,360 | 878,071 |
| Delivery Hero SE(1)(3) | | 8,407 | 240,049 |
| Deutsche Boerse AG | | 8,648 | 1,493,482 |
| Deutsche Lufthansa AG(1) | | 32,660 | 258,452 |
| Deutsche Post AG | | 51,542 | 2,091,343 |
| Deutsche Telekom AG | | 159,081 | 3,337,009 |
| E.ON SE | | 109,490 | 1,294,830 |
| Evonik Industries AG | | 9,044 | 164,964 |
| Fresenius Medical Care AG & Co. KGaA | | 10,164 | 436,970 |
| Fresenius SE & Co. KGaA | | 21,361 | 663,477 |
| GEA Group AG | | 9,201 | 339,097 |
| Hannover Rueck SE | | 2,833 | 621,613 |
| Heidelberg Materials AG | | 17,478 | 1,353,678 |
| HelloFresh SE(1) | | 6,986 | 207,585 |
| Security | Shares | Value |
| Germany (continued) | |
| Henkel AG & Co. KGaA | | 4,827 | $ 304,350 |
| HOCHTIEF AG | | 1,176 | 118,581 |
| Hugo Boss AG | | 2,656 | 167,888 |
| Infineon Technologies AG | | 64,279 | 2,128,968 |
| KION Group AG | | 3,562 | 136,244 |
| Knorr-Bremse AG | | 3,492 | 221,383 |
| Mercedes-Benz Group AG | | 46,580 | 3,241,816 |
| Merck KGaA | | 6,823 | 1,137,444 |
| MTU Aero Engines AG | | 2,806 | 508,193 |
| Muenchener Rueckversicherungs-Gesellschaft AG | | 6,302 | 2,454,330 |
| Nemetschek SE | | 2,636 | 160,423 |
| Puma SE | | 4,756 | 294,075 |
| SAP SE | | 51,173 | 6,623,937 |
| Scout24 SE(3) | | 4,026 | 279,157 |
| Siemens AG | | 37,485 | 5,356,930 |
| Siemens Energy AG(1) | | 30,267 | 394,461 |
| Siemens Healthineers AG(3) | | 13,760 | 696,006 |
| Symrise AG | | 7,323 | 697,141 |
| Talanx AG | | 3,112 | 196,958 |
| Telefonica Deutschland Holding AG | | 48,603 | 86,930 |
| thyssenkrupp AG | | 63,377 | 481,812 |
| Volkswagen AG | | 1,566 | 205,659 |
| Vonovia SE | | 40,984 | 981,907 |
| Wacker Chemie AG | | 866 | 123,664 |
| Zalando SE(1)(3) | | 11,463 | 254,689 |
| | | | $ 51,993,252 |
| Hong Kong — 1.7% | |
| AIA Group, Ltd. | | 588,183 | $ 4,756,720 |
| BOC Hong Kong Holdings, Ltd. | | 191,350 | 522,361 |
| Chow Tai Fook Jewellery Group, Ltd. | | 128,000 | 192,179 |
| CK Infrastructure Holdings, Ltd. | | 31,500 | 148,628 |
| CLP Holdings, Ltd. | | 100,000 | 738,388 |
| ESR Group, Ltd.(3) | | 133,400 | 186,489 |
| Hang Lung Properties, Ltd. | | 98,000 | 134,079 |
| Hang Seng Bank, Ltd. | | 41,079 | 509,687 |
| Henderson Land Development Co., Ltd. | | 71,355 | 187,375 |
| HKT Trust & HKT, Ltd. | | 172,000 | 179,356 |
| Hong Kong Exchanges & Clearing, Ltd. | | 64,399 | 2,390,025 |
| Hongkong Land Holdings, Ltd. | | 62,000 | 221,111 |
| MTR Corp., Ltd. | | 103,876 | 410,353 |
| New World Development Co., Ltd. | | 61,250 | 118,757 |
| Sino Land Co., Ltd. | | 178,000 | 200,185 |
| Sun Hung Kai Properties, Ltd. | | 85,301 | 910,158 |
| Swire Pacific, Ltd., Class A | | 24,393 | 164,299 |
| Swire Properties, Ltd. | | 51,000 | 106,066 |
| Techtronic Industries Co., Ltd. | | 71,993 | 694,991 |
| WH Group, Ltd.(3) | | 535,041 | 280,050 |
| Wharf Holdings, Ltd. (The)(2) | | 63,779 | 159,631 |
| Wharf Real Estate Investment Co., Ltd. | | 88,000 | 339,146 |
10
See Notes to Financial Statements.
Calvert
International Responsible Index Fund
September 30, 2023
Schedule of Investments — continued
| Security | Shares | Value |
| Hong Kong (continued) | |
| Xinyi Glass Holdings, Ltd. | | 198,000 | $ 255,138 |
| | | | $ 13,805,172 |
| Ireland — 1.7% | |
| AIB Group PLC | | 66,726 | $ 299,080 |
| Aon PLC, Class A | | 10,223 | 3,314,501 |
| Bank of Ireland Group PLC | | 50,024 | 489,015 |
| CRH PLC | | 59,796 | 3,296,801 |
| DCC PLC | | 13,726 | 768,513 |
| ICON PLC ADR(1) | | 4,422 | 1,088,918 |
| James Hardie Industries PLC CDI(1) | | 59,365 | 1,552,587 |
| Kerry Group PLC, Class A | | 9,995 | 835,126 |
| Kingspan Group PLC | | 20,065 | 1,498,519 |
| Smurfit Kappa Group PLC | | 14,546 | 481,672 |
| | | | $ 13,624,732 |
| Israel — 0.5% | |
| Bank Hapoalim B.M. | | 79,259 | $ 706,166 |
| Bank Leumi Le-Israel B.M. | | 91,761 | 760,318 |
| Check Point Software Technologies, Ltd.(1) | | 6,501 | 866,453 |
| CyberArk Software, Ltd.(1) | | 2,529 | 414,174 |
| Mizrahi Tefahot Bank, Ltd. | | 8,226 | 298,725 |
| Nice, Ltd.(1) | | 4,102 | 699,633 |
| | | | $ 3,745,469 |
| Italy — 1.8% | |
| A2A SpA | | 77,405 | $ 137,572 |
| Amplifon SpA | | 4,167 | 123,348 |
| Assicurazioni Generali SpA | | 52,160 | 1,064,710 |
| Banco BPM SpA | | 68,551 | 326,474 |
| Brembo SpA | | 8,435 | 104,570 |
| Brunello Cucinelli SpA | | 1,844 | 139,865 |
| DiaSorin SpA | | 1,327 | 120,840 |
| Enel SpA | | 450,146 | 2,760,629 |
| FinecoBank Banca Fineco SpA | | 35,236 | 425,484 |
| Hera SpA | | 48,247 | 131,747 |
| Infrastrutture Wireless Italiane SpA(3) | | 17,407 | 206,836 |
| Interpump Group SpA | | 4,690 | 214,541 |
| Intesa Sanpaolo SpA | | 807,574 | 2,068,372 |
| Italgas SpA | | 25,167 | 128,760 |
| Mediobanca Banca di Credito Finanziario SpA | | 38,504 | 507,641 |
| Moncler SpA | | 11,254 | 652,225 |
| Nexi SpA(1)(3) | | 27,214 | 165,817 |
| Poste Italiane SpA(3) | | 24,116 | 253,250 |
| PRADA SpA | | 34,400 | 201,603 |
| Prysmian SpA | | 17,601 | 706,474 |
| Recordati Industria Chimica e Farmaceutica SpA | | 5,927 | 279,312 |
| Reply SpA | | 1,162 | 109,033 |
| Snam SpA | | 122,821 | 576,309 |
| Telecom Italia SpA(1)(2) | | 498,725 | 155,535 |
| Terna - Rete Elettrica Nazionale | | 82,770 | 622,549 |
| Security | Shares | Value |
| Italy (continued) | |
| UniCredit SpA | | 98,619 | $ 2,349,734 |
| | | | $ 14,533,230 |
| Japan — 17.3% | |
| Advantest Corp.(2) | | 39,200 | $ 1,093,426 |
| Aeon Co., Ltd. | | 33,379 | 661,174 |
| AGC, Inc. | | 30,055 | 1,053,349 |
| Aisin Corp. | | 8,600 | 324,951 |
| Ajinomoto Co., Inc. | | 26,008 | 1,002,833 |
| ANA Holdings, Inc.(1) | | 9,256 | 193,802 |
| Asahi Group Holdings, Ltd. | | 26,900 | 1,004,837 |
| Astellas Pharma, Inc. | | 98,171 | 1,358,846 |
| Bandai Namco Holdings, Inc. | | 27,225 | 553,770 |
| BayCurrent Consulting, Inc. | | 7,900 | 263,250 |
| Bridgestone Corp. | | 30,300 | 1,180,729 |
| Canon, Inc.(2) | | 49,768 | 1,198,843 |
| Central Japan Railway Co. | | 60,335 | 1,467,226 |
| Chugai Pharmaceutical Co., Ltd. | | 33,156 | 1,022,333 |
| Dai Nippon Printing Co., Ltd. | | 16,429 | 427,452 |
| Daifuku Co., Ltd. | | 18,100 | 341,667 |
| Dai-ichi Life Insurance Co., Ltd. | | 45,494 | 939,192 |
| Daiichi Sankyo Co., Ltd. | | 106,839 | 2,924,963 |
| Daikin Industries, Ltd. | | 17,000 | 2,665,118 |
| Daito Trust Construction Co., Ltd. | | 2,800 | 294,934 |
| Daiwa House Industry Co., Ltd. | | 37,192 | 998,210 |
| Daiwa Securities Group, Inc.(2) | | 62,800 | 362,140 |
| Denso Corp. | | 114,988 | 1,845,083 |
| Dentsu Group, Inc. | | 13,500 | 397,057 |
| Disco Corp. | | 5,200 | 960,732 |
| East Japan Railway Co. | | 16,026 | 917,118 |
| Eisai Co., Ltd. | | 12,825 | 710,810 |
| FANUC Corp. | | 56,455 | 1,468,249 |
| Fast Retailing Co., Ltd. | | 9,326 | 2,031,345 |
| Fuji Electric Co., Ltd. | | 6,600 | 297,235 |
| FUJIFILM Holdings Corp. | | 18,400 | 1,064,450 |
| Fujitsu, Ltd.(2) | | 9,748 | 1,146,473 |
| GMO Payment Gateway, Inc. | | 1,600 | 87,302 |
| Hamamatsu Photonics K.K. | | 8,221 | 345,724 |
| Hankyu Hanshin Holdings, Inc. | | 11,600 | 395,799 |
| Hikari Tsushin, Inc. | | 900 | 137,066 |
| Hitachi Construction Machinery Co., Ltd. | | 5,500 | 166,902 |
| Hoshizaki Corp. | | 5,600 | 194,400 |
| HOYA Corp. | | 19,687 | 2,016,292 |
| Hulic Co., Ltd. | | 30,000 | 269,005 |
| Ibiden Co., Ltd. | | 5,100 | 270,506 |
| Isuzu Motors, Ltd. | | 31,300 | 393,491 |
| Japan Airlines Co., Ltd. | | 7,300 | 141,833 |
| Japan Exchange Group, Inc. | | 24,200 | 448,336 |
| Japan Post Bank Co., Ltd. | | 73,800 | 642,196 |
| Kao Corp. | | 23,863 | 884,482 |
| KDDI Corp. | | 79,518 | 2,434,083 |
11
See Notes to Financial Statements.
Calvert
International Responsible Index Fund
September 30, 2023
Schedule of Investments — continued
| Security | Shares | Value |
| Japan (continued) | |
| Keisei Electric Railway Co., Ltd. | | 6,500 | $ 225,149 |
| Keyence Corp. | | 11,100 | 4,105,064 |
| Kikkoman Corp. | | 8,209 | 430,256 |
| Kintetsu Group Holdings Co., Ltd. | | 8,700 | 246,668 |
| Kirin Holdings Co., Ltd. | | 49,900 | 698,622 |
| Komatsu, Ltd. | | 50,046 | 1,349,797 |
| Kose Corp. | | 1,600 | 115,971 |
| Kubota Corp. | | 54,194 | 797,238 |
| Kyocera Corp. | | 16,000 | 811,163 |
| Kyowa Kirin Co., Ltd. | | 12,806 | 222,656 |
| M3, Inc. | | 20,100 | 364,589 |
| Makita Corp. | | 11,792 | 290,781 |
| MatsukiyoCocokara & Co. | | 17,100 | 306,313 |
| McDonald's Holdings Co. (Japan), Ltd. | | 4,700 | 179,534 |
| MEIJI Holdings Co., Ltd. | | 13,142 | 326,632 |
| MINEBEA MITSUMI, Inc. | | 16,800 | 273,723 |
| MISUMI Group, Inc. | | 13,900 | 216,457 |
| Mitsubishi Chemical Group Corp. | | 72,560 | 457,133 |
| Mitsubishi Electric Corp. | | 128,107 | 1,582,693 |
| Mitsubishi Estate Co., Ltd. | | 58,308 | 760,687 |
| Mitsubishi HC Capital, Inc. | | 43,000 | 286,512 |
| Mitsubishi Heavy Industries, Ltd. | | 17,600 | 981,673 |
| Mitsubishi UFJ Financial Group, Inc.(2)(4) | | 527,857 | 4,473,142 |
| Mitsui Fudosan Co., Ltd. | | 43,400 | 955,841 |
| Mizuho Financial Group, Inc. | | 117,458 | 1,994,195 |
| MS&AD Insurance Group Holdings, Inc.(2) | | 20,800 | 761,161 |
| Murata Manufacturing Co., Ltd. | | 91,059 | 1,661,112 |
| Nidec Corp. | | 21,380 | 987,188 |
| Nintendo Co., Ltd. | | 57,690 | 2,397,189 |
| Nippon Paint Holdings Co., Ltd. | | 54,745 | 367,674 |
| Nippon Telegraph & Telephone Corp. | | 1,624,400 | 1,922,696 |
| Nissan Chemical Corp. | | 9,100 | 386,836 |
| Nissin Foods Holdings Co., Ltd. | | 3,499 | 290,742 |
| Nitori Holdings Co., Ltd. | | 3,768 | 420,115 |
| Nitto Denko Corp.(2) | | 8,086 | 530,243 |
| Nomura Holdings, Inc. | | 151,000 | 604,669 |
| Nomura Research Institute, Ltd. | | 21,400 | 556,223 |
| NTT Data Group Corp. | | 31,135 | 416,628 |
| Obayashi Corp. | | 31,000 | 272,796 |
| Odakyu Electric Railway Co., Ltd. | | 18,600 | 277,917 |
| Olympus Corp. | | 63,600 | 825,749 |
| Omron Corp. | | 9,582 | 426,413 |
| Ono Pharmaceutical Co., Ltd. | | 18,122 | 347,550 |
| Oracle Corp. Japan | | 2,126 | 157,484 |
| Oriental Land Co., Ltd. | | 74,885 | 2,456,801 |
| ORIX Corp. | | 58,367 | 1,089,852 |
| Osaka Gas Co., Ltd. | | 16,900 | 278,088 |
| Otsuka Corp. | | 6,588 | 278,728 |
| Otsuka Holdings Co., Ltd. | | 23,420 | 831,529 |
| Pan Pacific International Holdings Corp. | | 18,668 | 391,784 |
| Panasonic Corp. | | 115,700 | 1,305,995 |
| Security | Shares | Value |
| Japan (continued) | |
| Rakuten Group, Inc. | | 80,400 | $ 330,347 |
| Recruit Holdings Co., Ltd. | | 90,679 | 2,774,325 |
| Renesas Electronics Corp.(1) | | 64,600 | 986,762 |
| Resona Holdings, Inc. | | 108,233 | 598,440 |
| Rohm Co., Ltd. | | 17,904 | 336,582 |
| SCREEN Holdings Co., Ltd. | | 3,800 | 184,665 |
| Secom Co., Ltd. | | 13,700 | 929,418 |
| Seiko Epson Corp.(2) | | 16,200 | 254,414 |
| Sekisui Chemical Co., Ltd. | | 19,172 | 275,827 |
| Sekisui House, Ltd. | | 31,170 | 620,328 |
| SG Holdings Co., Ltd. | | 15,600 | 199,709 |
| Shimadzu Corp. | | 11,526 | 305,730 |
| Shin-Etsu Chemical Co., Ltd. | | 98,885 | 2,872,178 |
| Shionogi & Co., Ltd. | | 13,054 | 582,266 |
| Shiseido Co., Ltd. | | 19,297 | 676,247 |
| SMC Corp. | | 3,232 | 1,448,783 |
| SoftBank Corp. | | 151,500 | 1,714,722 |
| SoftBank Group Corp. | | 51,390 | 2,164,830 |
| Sompo Holdings, Inc. | | 13,837 | 593,009 |
| Sony Group Corp. | | 66,400 | 5,429,897 |
| Square Enix Holdings Co., Ltd. | | 3,700 | 126,782 |
| Sumitomo Electric Industries, Ltd. | | 40,273 | 485,165 |
| Sumitomo Mitsui Financial Group, Inc. | | 63,653 | 3,127,019 |
| Sumitomo Mitsui Trust Holdings, Inc.(2) | | 14,616 | 550,249 |
| Suntory Beverage & Food, Ltd. | | 8,300 | 252,593 |
| Sysmex Corp. | | 8,726 | 414,635 |
| T&D Holdings, Inc. | | 26,419 | 434,460 |
| Takeda Pharmaceutical Co., Ltd. | | 83,452 | 2,586,720 |
| TDK Corp. | | 21,142 | 781,625 |
| Terumo Corp. | | 35,146 | 930,344 |
| TIS, Inc. | | 12,100 | 266,069 |
| Tobu Railway Co., Ltd. | | 9,600 | 246,735 |
| Toho Co., Ltd. | | 5,900 | 201,282 |
| Tokio Marine Holdings, Inc. | | 87,900 | 2,035,209 |
| Tokyo Electron, Ltd. | | 23,778 | 3,247,890 |
| Tokyo Gas Co., Ltd. | | 20,100 | 455,720 |
| Tokyu Corp. | | 34,132 | 393,527 |
| TOPPAN, Inc. | | 14,500 | 346,860 |
| Toray Industries, Inc. | | 71,850 | 373,840 |
| TOTO, Ltd. | | 7,864 | 202,929 |
| Toyota Industries Corp. | | 7,975 | 627,756 |
| Toyota Motor Corp. | | 635,115 | 11,394,170 |
| Trend Micro, Inc. | | 6,493 | 245,782 |
| Unicharm Corp. | | 24,402 | 862,799 |
| West Japan Railway Co. | | 12,610 | 521,812 |
| Yakult Honsha Co., Ltd. | | 14,572 | 353,909 |
| Yamaha Corp. | | 5,944 | 162,340 |
| Yamaha Motor Co., Ltd. | | 16,725 | 439,650 |
| Yamato Holdings Co., Ltd. | | 18,100 | 294,600 |
| Yaskawa Electric Corp. | | 15,300 | 550,969 |
| Z Holdings Corp. | | 151,700 | 420,833 |
12
See Notes to Financial Statements.
Calvert
International Responsible Index Fund
September 30, 2023
Schedule of Investments — continued
| Security | Shares | Value |
| Japan (continued) | |
| Zensho Holdings Co., Ltd.(2) | | 4,700 | $ 204,096 |
| ZOZO, Inc.(2) | | 6,400 | 117,192 |
| | | | $140,628,705 |
| Netherlands — 4.3% | |
| Aalberts NV | | 5,731 | $ 209,115 |
| ABN AMRO Bank NV GDR(3) | | 16,992 | 240,140 |
| Adyen NV(1)(2)(3) | | 1,398 | 1,036,524 |
| Aegon NV | | 65,405 | 315,233 |
| AerCap Holdings NV(1) | | 10,343 | 648,196 |
| Akzo Nobel NV | | 8,978 | 647,300 |
| Argenx SE(1)(5) | | 1,842 | 900,420 |
| Argenx SE(1)(5) | | 862 | 421,369 |
| ASM International NV | | 2,149 | 897,406 |
| ASML Holding NV | | 18,562 | 10,928,378 |
| ASR Nederland NV | | 6,938 | 259,600 |
| BE Semiconductor Industries NV | | 3,494 | 341,736 |
| Euronext NV(3) | | 3,924 | 272,950 |
| Ferrovial SE | | 23,363 | 713,903 |
| IMCD NV | | 2,903 | 367,040 |
| ING Groep NV | | 150,480 | 1,983,337 |
| JDE Peet's NV | | 6,901 | 192,688 |
| Koninklijke Ahold Delhaize NV | | 51,546 | 1,553,580 |
| Koninklijke KPN NV | | 158,106 | 520,906 |
| Koninklijke Philips NV | | 43,300 | 863,932 |
| Koninklijke Vopak NV | | 8,165 | 279,292 |
| NN Group NV | | 10,986 | 352,191 |
| NXP Semiconductors NV | | 11,785 | 2,356,057 |
| Prosus NV | | 68,639 | 2,022,519 |
| QIAGEN NV(1) | | 11,055 | 447,728 |
| Randstad NV | | 6,100 | 337,001 |
| Stellantis NV | | 106,925 | 2,047,445 |
| STMicroelectronics NV(5) | | 13,134 | 566,378 |
| STMicroelectronics NV(5) | | 15,559 | 670,650 |
| Universal Music Group NV(2) | | 42,510 | 1,109,348 |
| Wolters Kluwer NV | | 13,966 | 1,690,939 |
| | | | $ 35,193,301 |
| New Zealand — 0.2% | |
| Auckland International Airport, Ltd. | | 60,932 | $ 288,771 |
| Fisher & Paykel Healthcare Corp., Ltd. | | 26,716 | 344,451 |
| Mercury NZ, Ltd. | | 27,073 | 98,922 |
| Meridian Energy, Ltd. | | 60,330 | 185,537 |
| Spark New Zealand, Ltd. | | 67,979 | 195,701 |
| Xero, Ltd.(1) | | 5,226 | 375,843 |
| | | | $ 1,489,225 |
| Norway — 0.7% | |
| AutoStore Holdings, Ltd.(1)(3) | | 63,947 | $ 89,883 |
| DNB Bank ASA | | 58,469 | 1,174,746 |
| Gjensidige Forsikring ASA | | 12,137 | 178,092 |
| Security | Shares | Value |
| Norway (continued) | |
| Kongsberg Gruppen ASA | | 7,242 | $ 298,469 |
| Mowi ASA | | 34,904 | 616,938 |
| Norsk Hydro ASA | | 171,197 | 1,071,323 |
| Orkla ASA | | 62,474 | 466,614 |
| Salmar ASA | | 5,001 | 253,293 |
| Schibsted ASA, Class A | | 6,109 | 137,087 |
| Telenor ASA | | 45,605 | 517,190 |
| TOMRA Systems ASA | | 13,330 | 151,481 |
| Yara International ASA | | 11,885 | 448,773 |
| | | | $ 5,403,889 |
| Portugal — 0.1% | |
| EDP - Energias de Portugal S.A. | | 180,224 | $ 749,362 |
| Jeronimo Martins SGPS S.A. | | 19,321 | 433,915 |
| | | | $ 1,183,277 |
| Singapore — 1.0% | |
| CapitaLand Investment, Ltd. | | 128,100 | $ 289,449 |
| DBS Group Holdings, Ltd. | | 94,529 | 2,321,598 |
| Flex, Ltd.(1) | | 26,175 | 706,201 |
| Oversea-Chinese Banking Corp., Ltd. | | 168,871 | 1,579,290 |
| Singapore Airlines, Ltd. | | 89,956 | 424,342 |
| Singapore Exchange, Ltd. | | 50,000 | 355,700 |
| Singapore Technologies Engineering, Ltd. | | 94,000 | 268,262 |
| Singapore Telecommunications, Ltd. | | 387,412 | 685,756 |
| United Overseas Bank, Ltd. | | 68,559 | 1,427,954 |
| | | | $ 8,058,552 |
| South Korea — 3.5% | |
| Doosan Enerbility Co., Ltd.(1) | | 24,719 | $ 300,589 |
| Hana Financial Group, Inc. | | 15,371 | 481,550 |
| HMM Co., Ltd. | | 18,169 | 219,158 |
| HYBE Co., Ltd.(1) | | 1,234 | 217,185 |
| Hyundai Mobis Co., Ltd. | | 3,385 | 602,457 |
| Hyundai Motor Co. | | 8,338 | 1,179,026 |
| Kakao Corp. | | 15,420 | 503,256 |
| KB Financial Group, Inc. | | 18,235 | 743,749 |
| Kia Corp. | | 14,137 | 850,910 |
| Krafton, Inc.(1) | | 1,357 | 151,468 |
| KT Corp. | | 7,272 | 179,065 |
| L&F Co., Ltd. | | 1,636 | 208,790 |
| LG Chem, Ltd. | | 3,068 | 1,123,306 |
| LG Electronics, Inc. | | 6,427 | 479,566 |
| LG H&H Co., Ltd. | | 531 | 175,182 |
| LG Innotek Co., Ltd. | | 636 | 115,241 |
| Meritz Financial Group, Inc. | | 4,993 | 204,339 |
| NAVER Corp. | | 7,777 | 1,162,776 |
| NCSoft Corp. | | 845 | 138,927 |
| POSCO Holdings, Inc. | | 5,992 | 2,360,661 |
| Samsung C&T Corp. | | 4,647 | 370,507 |
| Samsung Electro-Mechanics Co., Ltd. | | 3,347 | 340,103 |
13
See Notes to Financial Statements.
Calvert
International Responsible Index Fund
September 30, 2023
Schedule of Investments — continued
| Security | Shares | Value |
| South Korea (continued) | |
| Samsung Electronics Co., Ltd. | | 252,565 | $ 12,768,198 |
| Samsung SDS Co., Ltd. | | 2,354 | 235,758 |
| Shinhan Financial Group Co., Ltd. | | 20,170 | 530,837 |
| SK Hynix, Inc. | | 29,084 | 2,462,387 |
| Woori Financial Group, Inc. | | 32,388 | 293,600 |
| | | | $ 28,398,591 |
| Spain — 2.0% | |
| Acciona S.A. | | 865 | $ 110,162 |
| Aena SME S.A.(3) | | 4,206 | 632,909 |
| Amadeus IT Group S.A. | | 20,756 | 1,253,718 |
| Banco Bilbao Vizcaya Argentaria S.A. | | 257,133 | 2,080,959 |
| Banco de Sabadell S.A. | | 276,934 | 320,377 |
| Banco Santander S.A. | | 689,022 | 2,623,843 |
| Bankinter S.A.(2) | | 23,595 | 150,111 |
| CaixaBank S.A. | | 177,333 | 706,493 |
| Cellnex Telecom S.A.(1)(3) | | 24,290 | 844,855 |
| EDP Renovaveis S.A. | | 12,245 | 200,541 |
| Enagas S.A. | | 29,407 | 486,965 |
| Endesa S.A. | | 13,380 | 272,302 |
| Grifols S.A.(1) | | 12,573 | 162,844 |
| Iberdrola S.A. | | 288,735 | 3,229,342 |
| Industria de Diseno Textil S.A. | | 51,351 | 1,910,876 |
| International Consolidated Airlines Group S.A.(1) | | 140,926 | 253,045 |
| Naturgy Energy Group S.A.(2) | | 5,676 | 154,416 |
| Redeia Corp. S.A. | | 17,781 | 279,719 |
| Telefonica S.A. | | 246,260 | 1,006,056 |
| | | | $ 16,679,533 |
| Sweden — 2.6% | |
| AAK AB | | 8,764 | $ 157,693 |
| AddTech AB, Class B | | 11,587 | 184,920 |
| Alfa Laval AB | | 14,396 | 493,176 |
| Assa Abloy AB, Class B | | 50,378 | 1,094,642 |
| Atlas Copco AB, Class A | | 129,638 | 1,741,125 |
| Axfood AB | | 5,804 | 132,918 |
| Beijer Ref AB(2) | | 17,537 | 184,511 |
| Boliden AB | | 37,192 | 1,067,291 |
| Castellum AB | | 19,997 | 202,700 |
| Epiroc AB, Class A | | 30,351 | 576,282 |
| EQT AB | | 16,376 | 322,656 |
| Essity AB, Class B | | 31,088 | 670,482 |
| Fortnox AB | | 21,804 | 116,062 |
| Getinge AB, Class B | | 10,883 | 191,240 |
| H & M Hennes & Mauritz AB, Class B | | 34,654 | 491,400 |
| Hexagon AB, Class B | | 95,777 | 815,132 |
| Holmen AB, Class B | | 4,339 | 168,658 |
| Husqvarna AB, Class B(2) | | 19,098 | 145,740 |
| Industrivarden AB, Class A | | 6,092 | 160,641 |
| Indutrade AB | | 14,507 | 267,928 |
| Investment AB Latour, Class B | | 5,932 | 104,260 |
| Security | Shares | Value |
| Sweden (continued) | |
| Investor AB, Class B | | 81,152 | $ 1,553,615 |
| Kinnevik AB, Class B(1) | | 9,659 | 95,923 |
| L E Lundbergforetagen AB, Class B | | 2,595 | 108,202 |
| Lifco AB, Class B | | 12,322 | 215,553 |
| Nibe Industrier AB, Class B | | 84,300 | 551,132 |
| Saab AB, Class B | | 3,993 | 203,226 |
| Sagax AB, Class B | | 10,955 | 208,095 |
| Sandvik AB | | 55,204 | 1,015,773 |
| Skandinaviska Enskilda Banken AB, Class A | | 67,195 | 801,089 |
| Skanska AB, Class B | | 17,772 | 291,826 |
| SKF AB, Class B | | 19,064 | 316,492 |
| Spotify Technology S.A.(1) | | 5,978 | 924,438 |
| SSAB AB, Class A | | 116,016 | 653,748 |
| Svenska Cellulosa AB SCA, Class B | | 37,124 | 508,306 |
| Svenska Handelsbanken AB, Class A | | 62,520 | 556,296 |
| Sweco AB, Class B | | 8,161 | 76,111 |
| Swedbank AB, Class A | | 43,748 | 804,150 |
| Swedish Orphan Biovitrum AB(1) | | 12,779 | 261,110 |
| Tele2 AB, Class B | | 26,729 | 204,409 |
| Telia Co. AB | | 108,966 | 224,764 |
| Trelleborg AB, Class B | | 9,534 | 236,880 |
| Volvo AB, Class B | | 84,996 | 1,750,717 |
| | | | $ 20,851,312 |
| Switzerland — 9.2% | |
| ABB, Ltd. | | 74,552 | $ 2,660,998 |
| Adecco Group AG | | 9,536 | 391,673 |
| Alcon, Inc. | | 21,751 | 1,678,468 |
| Bachem Holding AG | | 1,448 | 106,803 |
| Baloise Holding AG | | 2,120 | 306,926 |
| Banque Cantonale Vaudoise | | 1,552 | 162,405 |
| Barry Callebaut AG | | 180 | 286,244 |
| Belimo Holding AG | | 389 | 184,617 |
| BKW AG | | 797 | 140,305 |
| Chocoladefabriken Lindt & Spruengli AG PC | | 53 | 588,965 |
| Chubb, Ltd. | | 16,816 | 3,500,755 |
| Cie Financiere Richemont S.A., Class A | | 21,836 | 2,659,258 |
| Clariant AG | | 7,779 | 122,649 |
| Coca-Cola HBC AG | | 11,049 | 302,121 |
| DKSH Holding AG | | 1,524 | 103,087 |
| DSM-Firmenich AG | | 8,501 | 718,359 |
| Dufry AG(1) | | 4,955 | 188,121 |
| Emmi AG | | 100 | 94,281 |
| Flughafen Zurich AG | | 769 | 146,415 |
| Galenica AG(3) | | 2,120 | 156,616 |
| Garmin, Ltd. | | 6,627 | 697,160 |
| Geberit AG | | 3,962 | 1,975,760 |
| Georg Fischer AG | | 3,626 | 203,630 |
| Givaudan S.A. | | 424 | 1,380,472 |
| Helvetia Holding AG | | 1,201 | 167,766 |
| Holcim AG | | 44,577 | 2,853,325 |
14
See Notes to Financial Statements.
Calvert
International Responsible Index Fund
September 30, 2023
Schedule of Investments — continued
| Security | Shares | Value |
| Switzerland (continued) | |
| Julius Baer Group, Ltd. | | 7,482 | $ 478,907 |
| Kuehne + Nagel International AG | | 2,285 | 649,238 |
| Logitech International S.A. | | 6,707 | 461,431 |
| Lonza Group AG | | 3,308 | 1,530,106 |
| Nestle S.A. | | 126,030 | 14,266,091 |
| Novartis AG | | 88,002 | 8,987,524 |
| On Holding AG, Class A(1)(2) | | 7,568 | 210,542 |
| Partners Group Holding AG | | 898 | 1,008,090 |
| PSP Swiss Property AG | | 1,851 | 218,384 |
| Roche Holding AG PC | | 32,303 | 8,818,752 |
| Schindler Holding AG | | 3,040 | 584,922 |
| SFS Group AG | | 841 | 91,748 |
| SGS S.A. | | 8,187 | 687,099 |
| SIG Group AG | | 13,847 | 341,126 |
| Sika AG | | 6,976 | 1,767,445 |
| Sonova Holding AG | | 2,244 | 531,102 |
| Straumann Holding AG | | 4,612 | 587,010 |
| Swatch Group AG (The) | | 1,344 | 344,228 |
| Swiss Life Holding AG | | 1,169 | 727,326 |
| Swiss Prime Site AG | | 3,251 | 297,625 |
| Swiss Re AG | | 11,961 | 1,228,399 |
| Swisscom AG | | 1,049 | 622,886 |
| TE Connectivity, Ltd. | | 14,761 | 1,823,426 |
| Tecan Group AG | | 543 | 182,514 |
| Temenos AG | | 2,695 | 188,489 |
| UBS Group AG | | 122,215 | 3,010,423 |
| VAT Group AG(3) | | 1,296 | 462,469 |
| Zurich Insurance Group AG | | 5,889 | 2,694,544 |
| | | | $ 74,579,025 |
| Taiwan — 4.4% | |
| Accton Technology Corp. | | 23,000 | $ 352,870 |
| Advantech Co., Ltd. | | 19,246 | 206,079 |
| Airtac International Group | | 8,000 | 243,061 |
| ASE Technology Holding Co., Ltd. | | 163,904 | 559,480 |
| Cathay Financial Holding Co., Ltd. | | 421,973 | 582,655 |
| Chailease Holding Co., Ltd. | | 70,824 | 397,693 |
| Chang Hwa Commercial Bank, Ltd. | | 231,896 | 124,001 |
| Chunghwa Telecom Co., Ltd. | | 198,055 | 711,884 |
| CTBC Financial Holding Co., Ltd. | | 895,000 | 679,998 |
| Delta Electronics, Inc. | | 103,319 | 1,040,621 |
| E Ink Holdings, Inc. | | 46,000 | 256,495 |
| E.Sun Financial Holding Co., Ltd. | | 617,822 | 464,447 |
| Eva Airways Corp. | | 107,000 | 98,712 |
| Evergreen Marine Corp. Taiwan, Ltd. | | 43,200 | 155,360 |
| Far Eastern New Century Corp. | | 149,000 | 132,887 |
| Far EasTone Telecommunications Co., Ltd. | | 78,073 | 175,851 |
| Feng TAY Enterprise Co., Ltd. | | 21,280 | 120,778 |
| First Financial Holding Co., Ltd. | | 456,936 | 376,015 |
| Fubon Financial Holding Co., Ltd. | | 392,227 | 738,457 |
| Global Unichip Corp. | | 4,000 | 170,328 |
| Security | Shares | Value |
| Taiwan (continued) | |
| Globalwafers Co., Ltd. | | 8,000 | $ 112,791 |
| Hotai Motor Co., Ltd. | | 16,320 | 331,669 |
| Hua Nan Financial Holdings Co., Ltd. | | 389,937 | 247,783 |
| Largan Precision Co., Ltd. | | 5,000 | 331,242 |
| Lite-On Technology Corp. ADR | | 102,000 | 385,091 |
| MediaTek, Inc. | | 72,883 | 1,666,314 |
| Mega Financial Holding Co., Ltd. | | 523,123 | 611,518 |
| Nan Ya Printed Circuit Board Corp. | | 9,000 | 74,590 |
| Nanya Technology Corp. | | 53,000 | 108,010 |
| Novatek Microelectronics Corp. | | 28,000 | 367,685 |
| President Chain Store Corp. | | 29,828 | 242,482 |
| Quanta Computer, Inc. | | 138,398 | 1,035,786 |
| Realtek Semiconductor Corp. | | 21,000 | 257,846 |
| Shanghai Commercial & Savings Bank, Ltd. (The) | | 180,081 | 241,443 |
| SinoPac Financial Holdings Co., Ltd. | | 581,721 | 313,780 |
| Taishin Financial Holding Co., Ltd. | | 666,403 | 369,807 |
| Taiwan Cement Corp. | | 794,000 | 818,244 |
| Taiwan Mobile Co., Ltd. | | 90,748 | 266,036 |
| Taiwan Semiconductor Manufacturing Co., Ltd. | | 1,079,240 | 17,598,339 |
| Unimicron Technology Corp. | | 62,000 | 334,506 |
| Uni-President Enterprises Corp. | | 270,000 | 586,834 |
| United Microelectronics Corp. | | 598,000 | 839,691 |
| Voltronic Power Technology Corp. | | 4,000 | 196,988 |
| Walsin Lihwa Corp. | | 128,000 | 146,163 |
| Wan Hai Lines, Ltd. | | 57,270 | 85,804 |
| Wiwynn Corp. | | 4,000 | 186,523 |
| Yageo Corp. | | 14,326 | 233,282 |
| Yang Ming Marine Transport Corp. | | 71,000 | 100,041 |
| Yuanta Financial Holding Co., Ltd. | | 490,973 | 381,395 |
| | | | $ 36,059,355 |
| United Kingdom — 13.0% | |
| 3i Group PLC | | 46,345 | $ 1,166,533 |
| abrdn PLC | | 92,079 | 173,973 |
| Admiral Group PLC | | 9,851 | 284,690 |
| Amcor PLC | | 80,712 | 739,322 |
| Anglo American PLC | | 102,084 | 2,803,185 |
| Antofagasta PLC | | 46,769 | 811,898 |
| Ashtead Group PLC | | 25,807 | 1,565,003 |
| Associated British Foods PLC | | 21,710 | 545,438 |
| AstraZeneca PLC | | 73,503 | 9,914,409 |
| Auto Trader Group PLC(3) | | 51,638 | 388,006 |
| Aviva PLC | | 138,035 | 653,341 |
| B&M European Value Retail S.A. | | 48,687 | 347,276 |
| BAE Systems PLC | | 174,047 | 2,114,992 |
| Barratt Developments PLC | | 56,017 | 300,342 |
| Beazley PLC | | 33,360 | 224,322 |
| Berkeley Group Holdings PLC | | 6,369 | 318,065 |
| BP PLC | | 945,174 | 6,092,529 |
| BT Group PLC | | 373,220 | 529,995 |
| Bunzl PLC | | 18,292 | 651,447 |
15
See Notes to Financial Statements.
Calvert
International Responsible Index Fund
September 30, 2023
Schedule of Investments — continued
| Security | Shares | Value |
| United Kingdom (continued) | |
| Burberry Group PLC | | 18,236 | $ 422,618 |
| Centrica PLC | | 305,679 | 574,955 |
| Clarivate PLC(1)(2) | | 20,945 | 140,541 |
| Coca-Cola Europacific Partners PLC | | 13,307 | 831,421 |
| Compass Group PLC | | 105,488 | 2,567,744 |
| ConvaTec Group PLC(3) | | 78,991 | 209,332 |
| Croda International PLC | | 8,092 | 483,348 |
| Dechra Pharmaceuticals PLC | | 6,518 | 300,609 |
| Diageo PLC | | 129,035 | 4,757,274 |
| Diploma PLC | | 7,669 | 279,977 |
| DS Smith PLC | | 75,730 | 264,125 |
| Ferguson PLC | | 10,700 | 1,759,829 |
| GSK PLC | | 220,488 | 3,989,464 |
| Haleon PLC | | 289,366 | 1,199,447 |
| Halma PLC | | 22,785 | 536,831 |
| Hargreaves Lansdown PLC | | 17,001 | 159,894 |
| Hikma Pharmaceuticals PLC | | 8,655 | 219,778 |
| Hiscox, Ltd. | | 17,115 | 209,259 |
| Howden Joinery Group PLC | | 25,321 | 226,561 |
| HSBC Holdings PLC | | 922,505 | 7,218,955 |
| IMI PLC | | 14,841 | 282,416 |
| Inchcape PLC | | 18,821 | 173,350 |
| Informa PLC | | 95,118 | 868,567 |
| InterContinental Hotels Group PLC | | 10,049 | 743,167 |
| Intermediate Capital Group PLC | | 13,780 | 231,303 |
| Intertek Group PLC | | 10,313 | 515,743 |
| Investec PLC | | 30,875 | 180,336 |
| J Sainsbury PLC | | 106,705 | 328,601 |
| JD Sports Fashion PLC | | 156,919 | 285,048 |
| Johnson Matthey PLC | | 10,438 | 206,644 |
| Kingfisher PLC | | 100,207 | 272,023 |
| Legal & General Group PLC | | 284,779 | 768,428 |
| Liberty Global PLC, Class A(1) | | 9,236 | 158,120 |
| Linde PLC | | 24,763 | 9,220,503 |
| Lloyds Banking Group PLC | | 3,106,097 | 1,669,199 |
| London Stock Exchange Group PLC | | 18,890 | 1,893,266 |
| M&G PLC | | 133,855 | 320,705 |
| Marks & Spencer Group PLC(1) | | 102,570 | 295,013 |
| Melrose Industries PLC | | 76,505 | 436,109 |
| Mondi PLC | | 27,417 | 457,366 |
| National Grid PLC | | 192,977 | 2,307,879 |
| Next PLC | | 5,848 | 518,669 |
| Pearson PLC | | 45,751 | 482,707 |
| Persimmon PLC | | 18,827 | 246,568 |
| Phoenix Group Holdings PLC | | 45,305 | 265,513 |
| Prudential PLC | | 136,513 | 1,467,423 |
| Reckitt Benckiser Group PLC | | 36,715 | 2,589,169 |
| RELX PLC | | 122,167 | 4,121,904 |
| Rentokil Initial PLC | | 156,392 | 1,161,150 |
| Rightmove PLC | | 38,760 | 264,510 |
| RS Group PLC | | 26,415 | 235,917 |
| Security | Shares | Value |
| United Kingdom (continued) | |
| Sage Group PLC (The) | | 58,604 | $ 705,235 |
| Schroders PLC | | 52,561 | 259,718 |
| Severn Trent PLC | | 13,938 | 401,883 |
| Smith & Nephew PLC | | 49,984 | 620,330 |
| Smiths Group PLC | | 22,692 | 446,759 |
| Spectris PLC | | 5,934 | 245,321 |
| Spirax-Sarco Engineering PLC | | 4,253 | 492,298 |
| SSE PLC | | 55,267 | 1,083,030 |
| St. James's Place PLC | | 29,428 | 296,898 |
| Standard Chartered PLC | | 108,712 | 999,882 |
| Tate & Lyle PLC | | 22,950 | 191,468 |
| Taylor Wimpey PLC | | 220,021 | 313,789 |
| Tesco PLC | | 441,244 | 1,419,254 |
| Unilever PLC | | 127,623 | 6,313,100 |
| United Utilities Group PLC | | 39,725 | 459,022 |
| Vodafone Group PLC | | 1,106,412 | 1,037,150 |
| Weir Group PLC (The) | | 16,294 | 376,473 |
| Whitbread PLC | | 12,863 | 541,441 |
| Wise PLC, Class A(1) | | 25,324 | 211,186 |
| WPP PLC | | 69,876 | 622,547 |
| | | | $105,980,828 |
| United States — 0.0%(6) | |
| Janus Henderson Group PLC | | 6,797 | $ 175,499 |
| | | | $ 175,499 |
Total Common Stocks
(identified cost $782,259,298) | | | $808,452,787 |
| Security | Shares | Value |
| Italy — 0.0% | |
| Brembo SpA, Exp. 10/3/23(1) | | 8,435 | $ 0 |
Total Rights
(identified cost $0) | | | $ 0 |
| Security | Shares | Value |
| Canada — 0.0%(6) | |
| Constellation Software, Inc., Exp. 3/31/40(1)(2) | | 1,141 | $ 5,830 |
Total Warrants
(identified cost $0) | | | $ 5,830 |
16
See Notes to Financial Statements.
Calvert
International Responsible Index Fund
September 30, 2023
Schedule of Investments — continued
| Short-Term Investments — 3.0% |
| Affiliated Fund — 0.7% |
| Security | Shares | Value |
| Morgan Stanley Institutional Liquidity Funds - Government Portfolio, Institutional Class, 5.27%(7) | | 5,693,673 | $ 5,693,673 |
Total Affiliated Fund
(identified cost $5,693,673) | | | $ 5,693,673 |
| Securities Lending Collateral — 2.3% |
| Security | Shares | Value |
| State Street Navigator Securities Lending Government Money Market Portfolio, 5.36%(8) | | 18,656,507 | $ 18,656,507 |
Total Securities Lending Collateral
(identified cost $18,656,507) | | | $ 18,656,507 |
Total Short-Term Investments
(identified cost $24,350,180) | | | $ 24,350,180 |
| | | |
Total Investments — 102.3%
(identified cost $806,609,478) | | $ 832,808,797 |
| Other Assets, Less Liabilities — (2.3)% | | $ (18,987,147) |
| Net Assets — 100.0% | | $ 813,821,650 |
| The percentage shown for each investment category in the Schedule of Investments is based on net assets.The country classifications used for financial reporting purposes may differ from the classifications determined by Calvert Research and Management (CRM). |
| (1) | Non-income producing security. |
| (2) | All or a portion of this security was on loan at September 30, 2023. The aggregate market value of securities on loan at September 30, 2023 was $39,016,910. |
| (3) | Security exempt from registration under Rule 144A of the Securities Act of 1933, as amended. These securities may be sold in certain transactions in reliance on an exemption from registration (normally to qualified institutional buyers). At September 30, 2023, the aggregate value of these securities is $9,059,590 or 1.1% of the Fund's net assets. |
| (4) | Represents an investment in an issuer that may be deemed to be an affiliate (see Note 7). |
| (5) | Securities are traded on separate exchanges for the same entity. |
| (6) | Amount is less than 0.05%. |
| (7) | May be deemed to be an affiliated investment company. The rate shown is the annualized seven-day yield as of September 30, 2023. |
| (8) | Represents investment of cash collateral received in connection with securities lending. |
At September 30, 2023, the concentration of the Fund’s investments in the various sectors, determined as a percentage of net assets, was as follows:
| Economic Sectors | % of Net Assets |
| Financials | 21.7% |
| Industrials | 15.4 |
| Information Technology | 13.3 |
| Health Care | 11.5 |
| Consumer Discretionary | 10.5 |
| Consumer Staples | 8.7 |
| Materials | 8.2 |
| Communication Services | 4.6 |
| Utilities | 3.0 |
| Energy | 1.4 |
| Real Estate | 1.0 |
| Total | 99.3% |
| Abbreviations: |
| ADR | – American Depositary Receipt |
| CDI | – CHESS Depositary Interest |
| GDR | – Global Depositary Receipt |
| PC | – Participation Certificate |
17
See Notes to Financial Statements.
Calvert
International Responsible Index Fund
September 30, 2023
Statement of Assets and Liabilities
| | September 30, 2023 |
| Assets | |
Investments in securities of unaffiliated issuers, at value (identified cost $798,234,011) - including
$39,016,910 of securities on loan | $ 822,641,982 |
| Investments in securities of affiliated issuers, at value (identified cost $8,375,467) | 10,166,815 |
| Cash denominated in foreign currency, at value (cost $1,542,368) | 1,540,323 |
| Receivable for capital shares sold | 1,517,459 |
| Dividends receivable | 1,756,779 |
| Dividends receivable - affiliated | 73,075 |
| Securities lending income receivable | 6,954 |
| Tax reclaims receivable | 1,314,993 |
| Receivable from affiliates | 83,242 |
| Directors' deferred compensation plan | 68,753 |
| Total assets | $839,170,375 |
| Liabilities | |
| Payable for investments purchased | $ 5,600,124 |
| Payable for capital shares redeemed | 602,007 |
| Deposits for securities loaned | 18,656,507 |
| Payable to affiliates: | |
| Investment advisory fee | 81,620 |
| Administrative fee | 81,843 |
| Distribution and service fees | 15,216 |
| Sub-transfer agency fee | 5,182 |
| Directors' deferred compensation plan | 68,753 |
| Accrued expenses | 237,473 |
| Total liabilities | $ 25,348,725 |
| Net Assets | $813,821,650 |
| Sources of Net Assets | |
| Paid-in capital | $ 829,573,762 |
| Accumulated loss | (15,752,112) |
| Net Assets | $813,821,650 |
| Class A Shares | |
| Net Assets | $ 72,919,474 |
| Shares Outstanding | 2,821,610 |
Net Asset Value and Redemption Price Per Share
(net assets ÷ shares of beneficial interest outstanding) | $ 25.84 |
Maximum Offering Price Per Share
(100 ÷ 95.25 of net asset value per share) | $ 27.13 |
| Class I Shares | |
| Net Assets | $ 621,739,566 |
| Shares Outstanding | 23,709,704 |
Net Asset Value, Offering Price and Redemption Price Per Share
(net assets ÷ shares of beneficial interest outstanding) | $ 26.22 |
18
See Notes to Financial Statements.
Calvert
International Responsible Index Fund
September 30, 2023
Statement of Assets and Liabilities — continued
| | September 30, 2023 |
| Class R6 Shares | |
| Net Assets | $ 119,162,610 |
| Shares Outstanding | 4,548,675 |
Net Asset Value, Offering Price and Redemption Price Per Share
(net assets ÷ shares of beneficial interest outstanding) | $ 26.20 |
| On sales of $50,000 or more, the offering price of Class A shares is reduced. |
19
See Notes to Financial Statements.
Calvert
International Responsible Index Fund
September 30, 2023
| | Year Ended |
| | September 30, 2023 |
| Investment Income | |
| Dividend income (net of foreign taxes withheld of $2,514,359) | $ 20,398,216 |
| Dividend income - affiliated issuers (net of foreign taxes withheld of $13,675) | 210,180 |
| Securities lending income, net | 158,491 |
| Other income | 269 |
| Total investment income | $ 20,767,156 |
| Expenses | |
| Investment advisory fee | $ 912,104 |
| Administrative fee | 912,104 |
| Distribution and service fees: | |
| Class A | 176,482 |
| Directors' fees and expenses | 52,642 |
| Custodian fees | 122,655 |
| Transfer agency fees and expenses | 523,417 |
| Accounting fees | 192,135 |
| Professional fees | 63,312 |
| Registration fees | 109,539 |
| Reports to shareholders | 35,941 |
| Miscellaneous | 64,194 |
| Total expenses | $ 3,164,525 |
| Waiver and/or reimbursement of expenses by affiliates | $ (786,501) |
| Net expenses | $ 2,378,024 |
| Net investment income | $ 18,389,132 |
| Realized and Unrealized Gain (Loss) | |
| Net realized gain (loss): | |
| Investment securities | $ (22,197,875) |
| Investment securities - affiliated issuers | 224,163 |
| Foreign currency transactions | (29,490) |
| Net realized loss | $ (22,003,202) |
| Change in unrealized appreciation (depreciation): | |
| Investment securities | $ 144,575,647 |
| Investment securities - affiliated issuers | 2,097,425 |
| Foreign currency | 357,848 |
| Net change in unrealized appreciation (depreciation) | $147,030,920 |
| Net realized and unrealized gain | $125,027,718 |
| Net increase in net assets from operations | $143,416,850 |
20
See Notes to Financial Statements.
Calvert
International Responsible Index Fund
September 30, 2023
Statements of Changes in Net Assets
| | Year Ended September 30, |
| | 2023 | 2022 |
| Increase (Decrease) in Net Assets | | |
| From operations: | | |
| Net investment income | $ 18,389,132 | $ 16,815,200 |
| Net realized loss | (22,003,202) | (25,157,181) |
| Net change in unrealized appreciation (depreciation) | 147,030,920 | (204,505,146) |
| Net increase (decrease) in net assets from operations | $143,416,850 | $(212,847,127) |
| Distributions to shareholders: | | |
| Class A | $ (1,253,239) | $ (835,991) |
| Class I | (9,691,079) | (10,622,020) |
| Class R6 | (2,227,475) | (2,024,813) |
| Total distributions to shareholders | $ (13,171,793) | $ (13,482,824) |
| Capital share transactions: | | |
| Class A | $ 21,038,406 | $ 12,448,423 |
| Class I | 55,506,379 | 164,598,671 |
| Class R6 | 4,535,080 | 34,325,572 |
| Net increase in net assets from capital share transactions | $ 81,079,865 | $ 211,372,666 |
| Net increase (decrease) in net assets | $211,324,922 | $ (14,957,285) |
| Net Assets | | |
| At beginning of year | $ 602,496,728 | $ 617,454,013 |
| At end of year | $813,821,650 | $ 602,496,728 |
21
See Notes to Financial Statements.
Calvert
International Responsible Index Fund
September 30, 2023
| | Class A |
| | Year Ended September 30, |
| | 2023 | 2022 | 2021 | 2020 | 2019 |
| Net asset value — Beginning of year | $ 21.21 | $ 29.79 | $ 24.08 | $ 22.81 | $ 23.18 |
| Income (Loss) From Operations | | | | | |
| Net investment income(1) | $ 0.57 | $ 0.61 | $ 0.61 | $ 0.40 | $ 0.56 |
| Net realized and unrealized gain (loss) | 4.50 | (8.64) | 5.33 | 1.26 | (0.51) |
| Total income (loss) from operations | $ 5.07 | $ (8.03) | $ 5.94 | $ 1.66 | $ 0.05 |
| Less Distributions | | | | | |
| From net investment income | $ (0.44) | $ (0.55) | $ (0.23) | $ (0.39) | $ (0.42) |
| Total distributions | $ (0.44) | $ (0.55) | $ (0.23) | $ (0.39) | $ (0.42) |
| Net asset value — End of year | $ 25.84 | $ 21.21 | $ 29.79 | $ 24.08 | $ 22.81 |
| Total Return(2) | 24.06% | (27.50)% | 24.74% | 7.31% | 0.34% |
| Ratios/Supplemental Data | | | | | |
| Net assets, end of year (000’s omitted) | $72,919 | $40,139 | $43,359 | $25,497 | $34,344 |
| Ratios (as a percentage of average daily net assets):(3) | | | | | |
| Total expenses | 0.65% | 0.65% | 0.67% | 0.74% | 0.89% |
| Net expenses | 0.54% (4) | 0.54% (4) | 0.54% | 0.54% | 0.57% |
| Net investment income | 2.21% | 2.27% | 2.11% | 1.77% | 2.56% |
| Portfolio Turnover | 20% | 14% | 13% | 18% | 51% |
| (1) | Computed using average shares outstanding. |
| (2) | Returns are historical and are calculated by determining the percentage change in net asset value with all distributions reinvested and do not reflect the effect of sales charges, if any. |
| (3) | Total expenses do not reflect amounts reimbursed and/or waived by the adviser and certain of its affiliates, if applicable. Net expenses are net of all reductions and represent the net expenses paid by the Fund. |
| (4) | Includes a reduction by the investment adviser of a portion of its advisory fee due to the Fund’s investment in the Liquidity Fund (equal to less than 0.005% of average daily net assets for the years ended September 30, 2023 and 2022). |
22
See Notes to Financial Statements.
Calvert
International Responsible Index Fund
September 30, 2023
Financial Highlights — continued
| | Class I |
| | Year Ended September 30, |
| | 2023 | 2022 | 2021 | 2020 | 2019 |
| Net asset value — Beginning of year | $ 21.49 | $ 30.17 | $ 24.43 | $ 23.12 | $ 23.47 |
| Income (Loss) From Operations | | | | | |
| Net investment income(1) | $ 0.64 | $ 0.69 | $ 0.72 | $ 0.51 | $ 0.60 |
| Net realized and unrealized gain (loss) | 4.56 | (8.75) | 5.37 | 1.22 | (0.50) |
| Total income (loss) from operations | $ 5.20 | $ (8.06) | $ 6.09 | $ 1.73 | $ 0.10 |
| Less Distributions | | | | | |
| From net investment income | $ (0.47) | $ (0.62) | $ (0.35) | $ (0.42) | $ (0.45) |
| Total distributions | $ (0.47) | $ (0.62) | $ (0.35) | $ (0.42) | $ (0.45) |
| Net asset value — End of year | $ 26.22 | $ 21.49 | $ 30.17 | $ 24.43 | $ 23.12 |
| Total Return(2) | 24.35% | (27.32)% | 25.07% | 7.55% | 0.60% |
| Ratios/Supplemental Data | | | | | |
| Net assets, end of year (000’s omitted) | $621,740 | $468,639 | $481,361 | $197,395 | $67,854 |
| Ratios (as a percentage of average daily net assets):(3) | | | | | |
| Total expenses | 0.40% | 0.40% | 0.42% | 0.49% | 0.64% |
| Net expenses | 0.29% (4) | 0.29% (4) | 0.29% | 0.29% | 0.29% |
| Net investment income | 2.43% | 2.52% | 2.43% | 2.22% | 2.73% |
| Portfolio Turnover | 20% | 14% | 13% | 18% | 51% |
| (1) | Computed using average shares outstanding. |
| (2) | Returns are historical and are calculated by determining the percentage change in net asset value with all distributions reinvested and do not reflect the effect of sales charges, if any. |
| (3) | Total expenses do not reflect amounts reimbursed and/or waived by the adviser and certain of its affiliates, if applicable. Net expenses are net of all reductions and represent the net expenses paid by the Fund. |
| (4) | Includes a reduction by the investment adviser of a portion of its advisory fee due to the Fund’s investment in the Liquidity Fund (equal to less than 0.005% of average daily net assets for the years ended September 30, 2023 and 2022). |
23
See Notes to Financial Statements.
Calvert
International Responsible Index Fund
September 30, 2023
Financial Highlights — continued
| | Class R6 |
| | Year Ended September 30, | Period Ended
September 30,
2019(1) |
| | 2023 | 2022 | 2021 | 2020 |
| Net asset value — Beginning of period | $ 21.48 | $ 30.16 | $ 24.43 | $ 23.12 | $ 21.50 |
| Income (Loss) From Operations | | | | | |
| Net investment income(2) | $ 0.65 | $ 0.69 | $ 0.75 | $ 0.49 | $ 0.51 |
| Net realized and unrealized gain (loss) | 4.56 | (8.74) | 5.34 | 1.25 | 1.11 |
| Total income (loss) from operations | $ 5.21 | $ (8.05) | $ 6.09 | $ 1.74 | $ 1.62 |
| Less Distributions | | | | | |
| From net investment income | $ (0.49) | $ (0.63) | $ (0.36) | $ (0.43) | $ — |
| Total distributions | $ (0.49) | $ (0.63) | $ (0.36) | $ (0.43) | $ — |
| Net asset value — End of period | $ 26.20 | $ 21.48 | $ 30.16 | $ 24.43 | $ 23.12 |
| Total Return(3) | 24.44% | (27.30)% | 25.08% | 7.59% | 7.54% (4) |
| Ratios/Supplemental Data | | | | | |
| Net assets, end of period (000’s omitted) | $119,163 | $93,719 | $92,734 | $29,215 | $16,867 |
| Ratios (as a percentage of average daily net assets):(5) | | | | | |
| Total expenses | 0.37% | 0.37% | 0.39% | 0.46% | 0.56% (6) |
| Net expenses | 0.26% (7) | 0.26% (7) | 0.26% | 0.26% | 0.26% (6) |
| Net investment income | 2.47% | 2.52% | 2.52% | 2.13% | 3.40% (6) |
| Portfolio Turnover | 20% | 14% | 13% | 18% | 51% (8) |
| (1) | For the period from the commencement of operations, February 1, 2019, to September 30, 2019. |
| (2) | Computed using average shares outstanding. |
| (3) | Returns are historical and are calculated by determining the percentage change in net asset value with all distributions reinvested and do not reflect the effect of sales charges, if any. |
| (4) | Not annualized. |
| (5) | Total expenses do not reflect amounts reimbursed and/or waived by the adviser and certain of its affiliates, if applicable. Net expenses are net of all reductions and represent the net expenses paid by the Fund. |
| (6) | Annualized. |
| (7) | Includes a reduction by the investment adviser of a portion of its advisory fee due to the Fund’s investment in the Liquidity Fund (equal to less than 0.005% of average daily net assets for the years ended September 30, 2023 and 2022). |
| (8) | For the year ended September 30, 2019. |
24
See Notes to Financial Statements.
Calvert
International Responsible Index Fund
September 30, 2023
Notes to Financial Statements
1 Significant Accounting Policies
Calvert International Responsible Index Fund (the Fund) is a diversified series of Calvert Responsible Index Series, Inc. (the Corporation). The Corporation is a Maryland corporation registered under the Investment Company Act of 1940, as amended (the 1940 Act), as an open-end management investment company. The investment objective of the Fund is to seek to track the performance of the Calvert International Responsible Index, which measures the investment return of stocks issued by companies that are located in countries (other than the U.S.) with developed markets.
The Fund offers three classes of shares. Class A shares are generally sold subject to a sales charge imposed at time of purchase. A contingent deferred sales charge of 0.25% may apply to certain redemptions of Class A shares for accounts for which no sales charge was paid, if redeemed within 12 months of purchase. Class I and Class R6 shares are sold at net asset value, are not subject to a sales charge and are sold only to certain eligible investors. Each class represents a pro rata interest in the Fund, but votes separately on class-specific matters and is subject to different expenses.
The Fund applies the accounting and reporting guidance in the Financial Accounting Standards Board (FASB) Accounting Standards Codification Topic 946, Financial Services – Investment Companies (ASC 946). Subsequent events, if any, through the date that the financial statements were issued have been evaluated in the preparation of the financial statements.
A Investment Valuation— Net asset value per share is determined every business day as of the close of the regular session of the New York Stock Exchange (generally 4:00 p.m. Eastern time). The Fund uses independent pricing services approved by the Board of Directors (the Board) to value its investments wherever possible. Investments for which market quotations are not available or deemed not reliable are fair valued in good faith by the Board’s valuation designee.
U.S. generally accepted accounting principles (U.S. GAAP) establishes a disclosure hierarchy that categorizes the inputs to valuation techniques used to value assets and liabilities at measurement date. These inputs are summarized in the three broad levels listed below:
Level 1 - quoted prices in active markets for identical securities
Level 2 - other significant observable inputs (including quoted prices for similar securities, interest rates, prepayment speeds, credit risk, etc.)
Level 3 - significant unobservable inputs (including the Fund’s own assumptions in determining the fair value of investments)
The inputs or methodologies used for valuing securities are not necessarily an indication of the risk associated with investing in those securities.
Valuation techniques used to value the Fund’s investments by major category are as follows:
Equity Securities. Equity securities (including warrants and rights) listed on a U.S. securities exchange generally are valued at the last sale or closing price as reported by an independent pricing service on the primary market or exchange on which they are traded and are categorized as Level 1 in the hierarchy. Equity securities listed on the NASDAQ National Market System are valued at the NASDAQ official closing price and are categorized as Level 1 in the hierarchy. Unlisted or listed securities for which closing sales prices or closing quotations are not available are valued at the mean between the latest available bid and ask prices and are categorized as Level 2 in the hierarchy. The daily valuation of exchange-traded foreign securities generally is determined as of the close of trading on the principal exchange on which such securities trade. Events occurring after the close of trading on foreign exchanges may result in adjustments to the valuation of foreign securities to more accurately reflect their fair value as of the close of regular trading on the New York Stock Exchange. When valuing foreign equity securities that meet certain criteria, the Fund’s Board has approved the use of a fair value service that values such securities to reflect market trading that occurs after the close of the applicable foreign markets of comparable securities or other instruments that have a strong correlation to the fair-valued securities. Such securities are categorized as Level 2 in the hierarchy.
Other Securities. Investments in management investment companies (including money market funds) that do not trade on an exchange are valued at the net asset value as of the close of each business day and are categorized as Level 1 in the hierarchy.
Fair Valuation. In connection with Rule 2a-5 of the 1940 Act, the Board has designated the Fund’s investment adviser as its valuation designee. Investments for which valuations or market quotations are not readily available or are deemed unreliable are valued by the investment adviser, as valuation designee, at fair value using methods that most fairly reflect the security’s “fair value”, which is the amount that the Fund might reasonably expect to receive for the security upon its current sale in the ordinary course. Each such determination is based on a consideration of relevant factors, which are likely to vary from one pricing context to another. These factors may include, but are not limited to, the type of security, the existence of any contractual restrictions on the security’s disposition, the price and extent of public trading in similar securities of the issuer or of comparable companies or entities, quotations or relevant information obtained from broker/dealers or other market participants, information obtained from the issuer, analysts, and/or the appropriate stock exchange (for exchange-traded securities), an analysis of the company’s or entity’s financial statements, and an evaluation of the forces that influence the issuer and the market(s) in which the security is purchased and sold.
The values assigned to fair value investments are based on available information and do not necessarily represent amounts that might ultimately be realized. Further, due to the inherent uncertainty of valuations of such investments, the fair values may differ significantly from the values that would have been used had an active market existed, and the differences could be material.
Calvert
International Responsible Index Fund
September 30, 2023
Notes to Financial Statements — continued
The following table summarizes the market value of the Fund's holdings as of September 30, 2023, based on the inputs used to value them:
| Asset Description | Level 1 | Level 2 | Level 3 | Total |
| Common Stocks: | | | | |
| Australia | $ — | $ 43,575,512 | $ — | $ 43,575,512 |
| Austria | — | 2,206,079 | — | 2,206,079 |
| Belgium | — | 5,233,989 | — | 5,233,989 |
| Canada | 77,643,555 | — | — | 77,643,555 |
| Denmark | — | 21,458,531 | — | 21,458,531 |
| Finland | — | 8,475,222 | — | 8,475,222 |
| France | — | 77,476,952 | — | 77,476,952 |
| Germany | 352,211 | 51,641,041 | — | 51,993,252 |
| Hong Kong | — | 13,805,172 | — | 13,805,172 |
| Ireland | 4,403,419 | 9,221,313 | — | 13,624,732 |
| Israel | 1,280,627 | 2,464,842 | — | 3,745,469 |
| Italy | — | 14,533,230 | — | 14,533,230 |
| Japan | — | 140,628,705 | — | 140,628,705 |
| Netherlands | 3,451,981 | 31,741,320 | — | 35,193,301 |
| New Zealand | — | 1,489,225 | — | 1,489,225 |
| Norway | — | 5,403,889 | — | 5,403,889 |
| Portugal | — | 1,183,277 | — | 1,183,277 |
| Singapore | 706,201 | 7,352,351 | — | 8,058,552 |
| South Korea | — | 28,398,591 | — | 28,398,591 |
| Spain | — | 16,679,533 | — | 16,679,533 |
| Sweden | 924,438 | 19,926,874 | — | 20,851,312 |
| Switzerland | 6,231,883 | 68,347,142 | — | 74,579,025 |
| Taiwan | — | 36,059,355 | — | 36,059,355 |
| United Kingdom | 12,849,736 | 93,131,092 | — | 105,980,828 |
| United States | 175,499 | — | — | 175,499 |
| Total Common Stocks | $108,019,550 | $700,433,237 (1) | $ — | $808,452,787 |
| Rights | $ 0 | $ — | $ — | $ 0 |
| Warrants | — | 5,830 | — | 5,830 |
| Short-Term Investments: | | | | |
| Affiliated Fund | 5,693,673 | — | — | 5,693,673 |
| Securities Lending Collateral | 18,656,507 | — | — | 18,656,507 |
| Total Investments | $132,369,730 | $700,439,067 | $ — | $832,808,797 |
| (1) | Includes foreign equity securities whose values were adjusted to reflect market trading of comparable securities or other correlated instruments that occurred after the close of trading in their applicable foreign markets. |
Calvert
International Responsible Index Fund
September 30, 2023
Notes to Financial Statements — continued
B Investment Transactions and Income— Investment transactions for financial statement purposes are accounted for on trade date. Realized gains and losses are recorded on an identified cost basis and may include proceeds from litigation. Dividend income is recorded on the ex-dividend date for dividends received in cash and/or securities or, in the case of dividends on certain foreign securities, as soon as the Fund is informed of the ex-dividend date. Non-cash dividends are recorded at the fair value of the securities received. Withholding taxes on foreign dividends, if any, have been provided for in accordance with the Fund’s understanding of the applicable country’s tax rules and rates. Distributions received that represent a return of capital are recorded as a reduction of cost of investments. Distributions received that represent a capital gain are recorded as a realized gain.
C Share Class Accounting— Realized and unrealized gains and losses and net investment income and losses, other than class-specific expenses, are allocated daily to each class of shares based upon the relative net assets of each class to the total net assets of the Fund. Expenses arising in connection with a specific class are charged directly to that class. Sub-accounting, recordkeeping and similar administrative fees payable to financial intermediaries, which are a component of transfer agency fees and expenses on the Statement of Operations, are not allocated to Class R6 shares.
D Foreign Currency Transactions— The Fund’s accounting records are maintained in U.S. dollars. For valuation of assets and liabilities on each date of net asset value determination, foreign denominations are converted into U.S. dollars using the current exchange rate. Security transactions, income and expenses are translated at the prevailing rate of exchange on the date of the event. Recognized gains or losses on investment transactions attributable to changes in foreign currency exchange rates are recorded for financial statement purposes as net realized gains and losses on investments. That portion of unrealized gains and losses on investments that results from fluctuations in foreign currency exchange rates is not separately disclosed.
E Distributions to Shareholders— Distributions to shareholders are recorded by the Fund on ex-dividend date. Distributions from net investment income and distributions from net realized capital gains, if any, are paid at least annually. Distributions are declared separately for each class of shares. Distributions are determined in accordance with income tax regulations, which may differ from U.S. GAAP; accordingly, periodic reclassifications are made within the Fund's capital accounts to reflect income and gains available for distribution under income tax regulations.
F Estimates— The preparation of financial statements in conformity with U.S. GAAP requires management to make estimates and assumptions that affect the reported amounts of assets and liabilities and disclosure of contingent assets and liabilities at the date of the financial statements and the reported amounts of increases and decreases in net assets from operations during the reporting period. Actual results could differ from those estimates.
G Indemnifications— The Corporation’s By-Laws provide for indemnification for Directors or officers of the Corporation and certain other parties, to the fullest extent permitted by Maryland law and the 1940 Act, provided certain conditions are met. Additionally, in the normal course of business, the Fund enters into agreements with service providers that may contain indemnification clauses. The Fund’s maximum exposure under these arrangements is unknown as this would involve future claims that may be made against the Fund that have not yet occurred.
H Federal Income Taxes— No provision for federal income or excise tax is required since the Fund intends to continue to qualify as a regulated investment company under the Internal Revenue Code and to distribute substantially all of its taxable earnings.
Management has analyzed the Fund's tax positions taken for all open federal income tax years and has concluded that no provision for federal income tax is required in the Fund's financial statements. A Fund's federal tax return is subject to examination by the Internal Revenue Service for a period of three years from the date of filing.
2 Related Party Transactions
The investment advisory fee is earned by Calvert Research and Management (CRM), an indirect, wholly-owned subsidiary of Morgan Stanley, as compensation for investment advisory services rendered to the Fund. The investment advisory fee is computed at the annual rate of 0.12% of the Fund’s average daily net assets and is payable monthly. For the year ended September 30, 2023, the investment advisory fee amounted to $912,104.
The Fund may invest in a money market fund, the Institutional Class of the Morgan Stanley Institutional Liquidity Funds - Government Portfolio (the “Liquidity Fund”), an open-end management investment company managed by Morgan Stanley Investment Management Inc., a wholly-owned subsidiary of Morgan Stanley. The investment advisory fee paid by the Fund is reduced by an amount equal to its pro rata share of the advisory and administration fees paid by the Fund due to its investment in the Liquidity Fund. For the year ended September 30, 2023, the investment advisory fee paid was reduced by $2,691 relating to the Fund's investment in the Liquidity Fund.
CRM has agreed to reimburse the Fund’s operating expenses to the extent that total annual operating expenses (relating to ordinary operating expenses only and excluding expenses such as brokerage commissions, acquired fund fees and expenses of unaffiliated funds, borrowing costs, taxes or litigation expenses) exceed 0.54%, 0.29% and 0.26% for Class A, Class I and Class R6, respectively, of such class’s average daily net assets. The expense reimbursement agreement with CRM may be changed or terminated after January 31, 2024. For the year ended September 30, 2023, CRM waived or reimbursed expenses of $783,810.
The administrative fee is earned by CRM as compensation for administrative services rendered to the Fund. The fee is computed at an annual rate of 0.12% of the Fund’s average daily net assets attributable to Class A, Class I and Class R6 and is payable monthly. For the year ended September 30, 2023, CRM was paid administrative fees of $912,104.
Calvert
International Responsible Index Fund
September 30, 2023
Notes to Financial Statements — continued
The Fund has in effect a distribution plan for Class A shares (Class A Plan) pursuant to Rule 12b-1 under the 1940 Act. Pursuant to the Class A Plan, the Fund pays Eaton Vance Distributors, Inc. (EVD), an affiliate of CRM and the Fund’s principal underwriter, a distribution and service fee of 0.25% per annum of its average daily net assets attributable to Class A shares for distribution services and facilities provided to the Fund by EVD, as well as for personal services and/or the maintenance of shareholder accounts. Distribution and service fees paid or accrued for the year ended September 30, 2023 amounted to $176,482 for Class A shares.
The Fund was informed that EVD received $4,358 as its portion of the sales charge on sales of Class A shares and $8 of contingent deferred sales charges paid by Fund shareholders for the year ended September 30, 2023.
Eaton Vance Management (EVM), an affiliate of CRM, provides sub-transfer agency and related services to the Fund pursuant to a Sub-Transfer Agency Support Services Agreement. For the year ended September 30, 2023, sub-transfer agency fees and expenses incurred to EVM amounted to $18,013 and are included in transfer agency fees and expenses on the Statement of Operations.
Each Director of the Fund who is not an employee of CRM or its affiliates receives an annual fee of $214,000, an annual Committee fee ranging from $8,500 to $16,500 depending on the Committee, and may receive a fee of $10,000 for special meetings. The Board chair receives an additional $40,000 ($30,000 prior to January 1, 2023) annual fee, Committee chairs receive an additional $15,000 ($6,000 prior to January 1, 2023) annual fee and the special equities liaison receives an additional $2,500 annual fee. Eligible Directors may participate in a Deferred Compensation Plan (the Plan). Amounts deferred under the Plan are treated as though equal dollar amounts had been invested in shares of the Fund or other Calvert funds selected by the Directors. The Fund purchases shares of the funds selected equal to the dollar amounts deferred under the Plan, resulting in an asset equal to the deferred compensation liability. Obligations of the Plan are paid solely from the Fund's assets. Directors’ fees are allocated to each of the Calvert funds served. Salaries and fees of officers and Directors of the Fund who are employees of CRM or its affiliates are paid by CRM.
3 Investment Activity
During the year ended September 30, 2023, the cost of purchases and proceeds from sales of investments, other than short-term securities, were $234,633,201 and $151,742,337, respectively.
4 Distributions to Shareholders and Income Tax Information
The tax character of distributions declared for the years ended September 30, 2023 and September 30, 2022 was as follows:
| | Year Ended September 30, |
| | 2023 | 2022 |
| Ordinary income | $13,171,793 | $13,482,824 |
During the year ended September 30, 2023, accumulated loss was increased by $2,163,215 and paid-in capital was increased by $2,163,215 due to the Fund's use of equalization accounting. Tax equalization accounting allows the Fund to treat as a distribution that portion of redemption proceeds representing a redeeming shareholder’s portion of undistributed taxable income and net capital gains. These reclassifications had no effect on the net assets or net asset value per share of the Fund.
As of September 30, 2023, the components of distributable earnings (accumulated loss) on a tax basis were as follows:
| Undistributed ordinary income | $ 16,221,276 |
| Deferred capital losses | (28,602,878) |
| Net unrealized depreciation | (3,370,510) |
| Accumulated loss | $(15,752,112) |
At September 30, 2023, the Fund, for federal income tax purposes, had deferred capital losses of $28,602,878 which would reduce the Fund's taxable income arising from future net realized gains on investment transactions, if any, to the extent permitted by the Internal Revenue Code, and thus would reduce the amount of distributions to shareholders, which would otherwise be necessary to relieve the Fund of any liability for federal income or excise tax. The deferred capital losses are treated as arising on the first day of the Fund's next taxable year, can be carried forward for an unlimited period, and retain the same short-term or long-term character as when originally deferred. Of the deferred capital losses at September 30, 2023, $14,441,206 are short-term and $14,161,672 are long-term.
Calvert
International Responsible Index Fund
September 30, 2023
Notes to Financial Statements — continued
The cost and unrealized appreciation (depreciation) of investments of the Fund at September 30, 2023, as determined on a federal income tax basis, were as follows:
| Aggregate cost | $836,144,478 |
| Gross unrealized appreciation | $ 57,230,277 |
| Gross unrealized depreciation | (60,565,958) |
| Net unrealized depreciation | $ (3,335,681) |
5 Securities Lending
To generate additional income, the Fund may lend its securities pursuant to a securities lending agency agreement with State Street Bank and Trust Company (SSBT), the securities lending agent. Security loans are subject to termination by the Fund at any time and, therefore, are not considered illiquid investments. The Fund requires that the loan be continuously collateralized by either cash or securities in an amount at least equal to the market value of the securities on loan. The market value of securities loaned is determined daily and any additional required collateral is delivered to the Fund on the next business day. Cash collateral is generally invested in a money market fund registered under the 1940 Act that is managed by an affiliate of SSBT. Any gain or loss in the market price of the loaned securities that might occur and any interest earned or dividends declared during the term of the loan would accrue to the account of the Fund. Income earned on the investment of collateral, net of broker rebates and other expenses incurred by the securities lending agent, is split between the Fund and the securities lending agent based on agreed upon contractual terms. Non-cash collateral, if any, is held by the lending agent on behalf of the Fund and cannot be sold or re-pledged by the Fund; accordingly, such collateral is not reflected in the Statement of Assets and Liabilities.
The risks associated with lending portfolio securities include, but are not limited to, possible delays in receiving additional collateral or in the recovery of the loaned securities, possible loss of rights to the collateral should the borrower fail financially, as well as risk of loss in the value of the collateral or the value of the investments made with the collateral. The securities lending agent shall indemnify the Fund in the case of default of any securities borrower.
At September 30, 2023, the total value of securities on loan was $39,016,910 and the total value of collateral received was $41,039,551, comprised of cash of $18,656,507 and U.S. government and/or agencies securities of $22,383,044.
The following table provides a breakdown of securities lending transactions accounted for as secured borrowings, the obligations by class of collateral pledged, and the remaining contractual maturity of those transactions as of September 30, 2023.
| | Remaining Contractual Maturity of the Transactions |
| | Overnight and
Continuous | <30 days | 30 to 90 days | >90 days | Total |
| Common Stocks | $18,656,507 | $ — | $ — | $ — | $18,656,507 |
The carrying amount of the liability for deposits for securities loaned at September 30, 2023 approximated its fair value. If measured at fair value, such liability would have been considered as Level 2 in the fair value hierarchy (see Note 1A) at September 30, 2023.
6 Line of Credit
The Fund participates with other portfolios and funds managed by EVM and its affiliates, including CRM, in a $725 million unsecured revolving line of credit agreement with a group of banks, which is in effect through October 24, 2023. Borrowings are made by the Fund solely for temporary purposes related to redemptions and other short-term cash needs. Interest is charged to the Fund based on its borrowings at an amount above either the Secured Overnight Financing Rate (SOFR) or Federal Funds rate. In addition, a fee computed at an annual rate of 0.15% on the daily unused portion of the line of credit is allocated among the participating portfolios and funds at the end of each quarter. In connection with the renewal of the agreement in October 2022, an arrangement fee of $150,000 was incurred that was allocated to the participating portfolios and funds. Because the line of credit is not available exclusively to the Fund, it may be unable to borrow some or all of its requested amounts at any particular time.
The Fund had no borrowings outstanding pursuant to its line of credit at September 30, 2023. The Fund did not have any significant borrowings or allocated fees during the year ended September 30, 2023. Effective October 24, 2023, the Fund renewed its line of credit agreement, which expires October 22, 2024. In connection with the renewal, the borrowing limit was decreased to $650 million.
Calvert
International Responsible Index Fund
September 30, 2023
Notes to Financial Statements — continued
7 Affiliated Investments
At September 30, 2023, the value of the Fund’s investment in issuers and funds that may be deemed to be affiliated was $10,166,815, which represents 1.2% of the Fund’s net assets. Transactions in such investments by the Fund for the year ended September 30, 2023 were as follows:
| Name | Value,
beginning
of period | Purchases | Sales
proceeds | Net
realized
gain
(loss) | Change in
unrealized
appreciation
(depreciation) | Value,
end of
period | Dividend
income | Shares,
end of
period |
| Common Stocks | | | | | | |
| Mitsubishi UFJ Financial Group, Inc. | $2,568,839 | $ 934,920 | $ (1,352,205) | $ 224,163 | $ 2,097,425 | $ 4,473,142 | $ 124,395 | 527,857 |
| Short-Term Investments | | | | | | |
| Liquidity Fund | 612 | 123,541,502 | (117,848,441) | — | — | 5,693,673 | 85,785 | 5,693,673 |
| Total | | | | $224,163 | $2,097,425 | $10,166,815 | $210,180 | |
8 Capital Shares
The Corporation may issue its shares in one or more series (such as the Fund). The authorized shares of the Fund consist of 75,000,000 common shares, $0.01 par value, for each Class.
Transactions in capital shares were as follows:
| | Year Ended
September 30, 2023 | | Year Ended
September 30, 2022 |
| | Shares | Amount | | Shares | Amount |
| Class A | | | | | |
| Shares sold | 1,675,822 | $ 40,209,100 | | 806,018 | $ 22,595,079 |
| Reinvestment of distributions | 32,365 | 782,256 | | 27,103 | 808,758 |
| Shares redeemed | (778,671) | (19,952,950) | | (396,281) | (10,955,414) |
| Net increase | 929,516 | $ 21,038,406 | | 436,840 | $ 12,448,423 |
| Class I | | | | | |
| Shares sold | 8,917,762 | $ 232,117,274 | | 10,633,616 | $ 286,200,830 |
| Reinvestment of distributions | 373,831 | 9,151,390 | | 331,902 | 10,013,478 |
| Shares redeemed | (7,388,558) | (185,762,285) | | (5,113,555) | (131,615,637) |
| Net increase | 1,903,035 | $ 55,506,379 | | 5,851,963 | $ 164,598,671 |
| Class R6 | | | | | |
| Shares sold | 894,776 | $ 23,011,517 | | 2,182,164 | $ 56,577,967 |
| Reinvestment of distributions | 86,724 | 2,120,397 | | 60,894 | 1,836,567 |
| Shares redeemed | (795,154) | (20,596,834) | | (955,137) | (24,088,962) |
| Net increase | 186,346 | $ 4,535,080 | | 1,287,921 | $ 34,325,572 |
9 Risks and Uncertainties
Risks Associated with Foreign Investments
Foreign investments can be adversely affected by political, economic and market developments abroad, including the imposition of economic and other sanctions by the United States or another country. There may be less publicly available information about foreign issuers because they may not be subject to reporting practices, requirements or regulations comparable to those to which United States companies are subject. Foreign markets may be smaller, less liquid and more volatile than the major markets in the United States. Trading in foreign markets typically involves higher expense than trading in the United States. The Fund may have difficulties enforcing its legal or contractual rights in a foreign country. Securities that trade or are denominated in currencies other than the U.S. dollar may be adversely affected by fluctuations in currency exchange rates.
Calvert
International Responsible Index Fund
September 30, 2023
Report of Independent Registered Public Accounting Firm
To the Board of Directors of Calvert Responsible Index Series, Inc. and Shareholders of Calvert International Responsible Index Fund:
Opinion on the Financial Statements and Financial Highlights
We have audited the accompanying statement of assets and liabilities of Calvert International Responsible Index Fund (the "Fund") (one of the funds constituting Calvert Responsible Index Series, Inc.), including the schedule of investments, as of September 30, 2023, the related statement of operations for the year then ended, the statements of changes in net assets for each of the two years in the period then ended, the financial highlights for each of the three years in the period then ended, and the related notes. In our opinion, the financial statements and financial highlights present fairly, in all material respects, the financial position of the Fund as of September 30, 2023, and the results of its operations for the year then ended, the changes in its net assets for each of the two years in the period then ended, and the financial highlights for each of the three years in the period then ended, in conformity with accounting principles generally accepted in the United States of America. The financial highlights for the years ended September 30, 2020 and 2019 were audited by other auditors whose report, dated November 20, 2020, expressed an unqualified opinion on those financial highlights.
Basis for Opinion
These financial statements and financial highlights are the responsibility of the Fund's management. Our responsibility is to express an opinion on the Fund's financial statements and financial highlights based on our audits. We are a public accounting firm registered with the Public Company Accounting Oversight Board (United States) (PCAOB) and are required to be independent with respect to the Fund in accordance with the U.S. federal securities laws and the applicable rules and regulations of the Securities and Exchange Commission and the PCAOB.
We conducted our audits in accordance with the standards of the PCAOB. Those standards require that we plan and perform the audit to obtain reasonable assurance about whether the financial statements and financial highlights are free of material misstatement, whether due to error or fraud. The Fund is not required to have, nor were we engaged to perform, an audit of its internal control over financial reporting. As part of our audits, we are required to obtain an understanding of internal control over financial reporting but not for the purpose of expressing an opinion on the effectiveness of the Fund’s internal control over financial reporting. Accordingly, we express no such opinion.
Our audits included performing procedures to assess the risks of material misstatement of the financial statements and financial highlights, whether due to error or fraud, and performing procedures that respond to those risks. Such procedures included examining, on a test basis, evidence regarding the amounts and disclosures in the financial statements and financial highlights. Our audits also included evaluating the accounting principles used and significant estimates made by management, as well as evaluating the overall presentation of the financial statements and financial highlights. Our procedures included confirmation of securities owned as of September 30, 2023, by correspondence with the custodian and brokers; when replies were not received from brokers, we performed other auditing procedures. We believe that our audits provide a reasonable basis for our opinion.
/s/ Deloitte & Touche LLP
Boston, Massachusetts
November 22, 2023
We have served as the auditor of one or more Calvert investment companies since 2021.
Calvert
International Responsible Index Fund
September 30, 2023
Federal Tax Information (Unaudited)
The Form 1099-DIV you receive in February 2024 will show the tax status of all distributions paid to your account in calendar year 2023. Shareholders are advised to consult their own tax adviser with respect to the tax consequences of their investment in the Fund. As required by the Internal Revenue Code and/or regulations, shareholders must be notified regarding the status of qualified dividend income for individuals and the foreign tax credit.
Qualified Dividend Income. For the fiscal year ended September 30, 2023, the Fund designates approximately $20,340,262, or up to the maximum amount of such dividends allowable pursuant to the Internal Revenue Code, as qualified dividend income eligible for the reduced tax rate of 15%.
Foreign Tax Credit. For the fiscal year ended September 30, 2023, the Fund paid foreign taxes of $2,162,898 and recognized foreign source income of $23,050,260.
Calvert
International Responsible Index Fund
September 30, 2023
Board of Directors' Contract Approval
Overview of the Contract Review Process
The Investment Company Act of 1940, as amended, provides, in substance, that each investment advisory agreement between a fund and its investment adviser will continue in effect from year to year only if its continuation is approved at least annually by the fund’s board of directors, including by a vote of a majority of the directors who are not “interested persons” of the fund (“Independent Directors”), cast in person at a meeting called for the purpose of considering such approval.
At an in-person meeting of the Boards of Trustees/Directors (each a “Board”) of the registered investment companies advised by Calvert Research and Management (“CRM” or the “Adviser”) (the “Calvert Funds”) held on June 12-13, 2023, the Board, including a majority of the Independent Directors, voted to approve continuation of existing investment advisory and investment sub-advisory agreements for the Calvert Funds for an additional one-year period.
In evaluating the investment advisory and investment sub-advisory agreements for the Calvert Funds, the Board considered a variety of information relating to the Calvert Funds and various service providers, including the Adviser. The Independent Directors reviewed a report prepared by the Adviser regarding various services provided to the Calvert Funds by the Adviser and its affiliates. Such report included, among other data, information regarding the Adviser’s personnel and the Adviser’s revenue and cost of providing services to the Calvert Funds, and a separate report prepared by an independent data provider, which compared each fund’s investment performance, fees and expenses to those of comparable funds as identified by such independent data provider (“comparable funds”).
The Independent Directors were separately represented by independent legal counsel with respect to their consideration of the continuation of the investment advisory and investment sub-advisory agreements for the Calvert Funds. Prior to voting, the Independent Directors reviewed the proposed continuation of the Calvert Funds’ investment advisory and investment sub-advisory agreements with management and also met in private sessions with their counsel at which time no representatives of management were present.
The information that the Board considered included, among other things, the following (for funds that invest through one or more affiliated underlying fund(s), references to “each fund” in this section may include information that was considered at the underlying fund-level):
Information about Fees, Performance and Expenses
| • | A report from an independent data provider comparing the advisory and related fees paid by each fund with fees paid by comparable funds; |
| • | A report from an independent data provider comparing each fund’s total expense ratio and its components to comparable funds; |
| • | A report from an independent data provider comparing the investment performance of each fund to the investment performance of comparable funds over various time periods; |
| • | Data regarding investment performance in comparison to benchmark indices; |
| • | For each fund, comparative information concerning the fees charged and the services provided by the Adviser in managing other accounts (including mutual funds, other collective investment funds and institutional accounts) using investment strategies and techniques similar to those used in managing such fund; |
| • | Profitability analyses for the Adviser with respect to each fund; |
Information about Portfolio Management and Trading
| • | Descriptions of the investment management services provided to each fund, including investment strategies and processes it employs; |
| • | Information about the Adviser’s policies and practices with respect to trading, including the Adviser’s processes for monitoring best execution of portfolio transactions; |
| • | Information about the allocation of brokerage transactions and the benefits received by the Adviser as a result of brokerage allocation, including information concerning the acquisition of research through client commission arrangements and policies with respect to “soft dollars”; |
Information about the Adviser
| • | Reports detailing the financial results and condition of CRM; |
| • | Descriptions of the qualifications, education and experience of the individual investment professionals whose responsibilities include portfolio management and investment research for the funds, and information relating to their compensation and responsibilities with respect to managing other mutual funds and investment accounts; |
| • | Policies and procedures relating to proxy voting and the handling of corporate actions and class actions; |
| • | A description of CRM’s procedures for overseeing sub-advisers, including with respect to regulatory and compliance issues, investment management and other matters; |
Calvert
International Responsible Index Fund
September 30, 2023
Board of Directors' Contract Approval — continued
Other Relevant Information
| • | Information concerning the nature, cost and character of the administrative and other non-investment advisory services provided by CRM and its affiliates; and |
| • | The terms of each investment advisory agreement. |
Over the course of the year, the Board and its committees held regular quarterly meetings. During these meetings, the Directors participated in investment and performance reviews with the portfolio managers and other investment professionals of the Adviser relating to each fund and considered various investment and trading strategies used in pursuing each fund’s investment objective(s), such as the use of derivative instruments, as well as risk management techniques. The Board and its committees also evaluated issues pertaining to industry and regulatory developments, compliance procedures, corporate governance and other issues with respect to the funds and received and participated in reports and presentations provided by CRM and its affiliates with respect to such matters. In addition to the formal meetings of the Board and its committees, the Independent Directors held regular video conferences in between meetings to discuss, among other topics, matters relating to the continuation of the Calvert Funds’ investment advisory and investment sub-advisory agreements.
For funds that invest through one or more affiliated underlying funds, the Board considered similar information about the underlying fund(s) when considering the approval of investment advisory agreements. In addition, in cases where the Adviser has engaged a sub-adviser, the Board considered similar information about the sub-adviser when considering the approval of any investment sub-advisory agreement.
The Independent Directors were assisted throughout the contract review process by their independent legal counsel. The Independent Directors relied upon the advice of such counsel and their own business judgment in determining the material factors to be considered in evaluating each investment advisory and investment sub-advisory agreement and the weight to be given to each such factor. The Board, including the Independent Directors, did not identify any single factor as controlling, and each Director may have attributed different weight to various factors.
Results of the Contract Review Process
Based on its consideration of the foregoing, and such other information as it deemed relevant, including the factors and conclusions described below, the Board, including the Independent Directors, concluded that the continuation of the investment advisory agreement of Calvert International Responsible Index Fund (the “Fund”), including the fee payable under the agreement, is in the best interests of the Fund’s shareholders. Accordingly, the Board, including a majority of the Independent Directors, voted to approve the continuation of the investment advisory agreement of the Fund.
Nature, Extent and Quality of Services
In considering the nature, extent and quality of the services provided by the Adviser under the investment advisory agreement, the Board reviewed information provided by the Adviser relating to its operations and personnel, including, among other information, biographical information on the Adviser’s investment personnel and descriptions of its organizational and management structure. The Board also took into account similar information provided periodically throughout the previous year by the Adviser as well as the Board’s familiarity with management through Board meetings, discussions and other reports. The Board considered the Adviser’s management style and its performance in employing its investment strategies as well as its current level of staffing and overall resources. The Board also noted that it reviewed on a quarterly basis information regarding the Adviser’s compliance with applicable policies and procedures, including those related to personal investing. The Board took into account, among other items, periodic reports received from the Adviser over the past year concerning the Adviser’s ongoing review and enhancement of certain processes, policies and procedures of the Calvert Funds and the Adviser. The Board concluded that it was satisfied with the nature, extent and quality of services provided to the Fund by the Adviser under the investment advisory agreement.
Fund Performance
In considering the Fund’s performance, the Board noted that it reviewed on a quarterly basis detailed information about the Fund’s performance results, portfolio composition and investment strategies. The Board compared the Fund’s investment performance to that of the Fund’s peer universe and the index it is designed to track. The Board’s review included comparative performance data for the one-, three- and five-year periods ended December 31, 2022. This performance data indicated that the Fund had underperformed the median of its peer universe and the index it is designed to track for the one-year period ended December 31, 2022, while it had outperformed the median of its peer universe and the index it is designed to track for the three- and five-year periods ended December 31, 2022. The Board took into account management’s discussion of the Fund’s performance. Based upon its review, the Board concluded that the Fund’s performance was satisfactory relative to the performance of its peer universe and the index it is designed to track.
Management Fees and Expenses
In considering the Fund’s fees and expenses, the Board compared the Fund’s fees and total expense ratio with those of comparable funds in its expense universe. Among other findings, the data indicated that the Fund’s advisory and administrative fees (after taking into account waivers and/or reimbursements) (referred to collectively as “management fees”) and the Fund’s total expenses (net of waivers and/or reimbursements) were each at the
Calvert
International Responsible Index Fund
September 30, 2023
Board of Directors' Contract Approval — continued
respective median of the Fund’s expense universe. The Board took into account the Adviser’s current undertaking to maintain expense limitations for the Fund and that the Adviser was waiving and/or reimbursing a portion of the Fund’s expenses. Based upon its review, the Board concluded that the management fees were reasonable in view of the nature, extent and quality of services provided by the Adviser.
Profitability and Other “Fall-Out” Benefits
The Board reviewed the Adviser’s profitability in regard to the Fund and the Calvert Funds in the aggregate. In reviewing the overall profitability of the Fund to the Adviser, the Board also considered the fact that the Adviser and its affiliates provided sub-transfer agency support, administrative and distribution services to the Fund for which they received compensation. The information considered by the Board included the profitability of the Fund to the Adviser and its affiliates without regard to any marketing support or other payments by the Adviser and its affiliates to third parties in respect of distribution services. The Board also considered that the Adviser and its affiliates derived benefits to their reputation and other indirect benefits from their relationships with the Fund. Based upon its review, the Board concluded that the Adviser’s and its affiliates’ level of profitability from their relationships with the Fund was reasonable.
Economies of Scale
The Board considered the effect of the Fund’s current size and its potential growth on its performance and fees. The Board concluded that adding breakpoints to the advisory fee at specified asset levels would not be appropriate at this time. The Board noted that if the Fund’s assets increased over time, the Fund might realize other economies of scale if assets increased proportionally more than certain other expenses.
Calvert
International Responsible Index Fund
September 30, 2023
Liquidity Risk Management Program
The Fund has implemented a written liquidity risk management program (Program) and related procedures to manage its liquidity in accordance with Rule 22e-4 under the Investment Company Act of 1940, as amended (Liquidity Rule). The Liquidity Rule defines “liquidity risk” as the risk that a fund could not meet requests to redeem shares issued by the fund without significant dilution of the remaining investors’ interests in the fund. The Fund’s Board of Trustees/Directors has designated the investment adviser to serve as the administrator of the Program and the related procedures. The administrator has established a Liquidity Risk Management Oversight Committee (Committee) to perform the functions necessary to administer the Program. As part of the Program, the administrator is responsible for identifying illiquid investments and categorizing the relative liquidity of the Fund’s investments in accordance with the Liquidity Rule. Under the Program, the administrator assesses, manages, and periodically reviews the Fund’s liquidity risk, and is responsible for making certain reports to the Fund’s Board of Trustees/Directors and the Securities and Exchange Commission (SEC) regarding the liquidity of the Fund’s investments, and to notify the Board of Trustees/Directors and the SEC of certain liquidity events specified in the Liquidity Rule. The liquidity of the Fund’s portfolio investments is determined based on a number of factors including, but not limited to, relevant market, trading and investment-specific considerations under the Program.
At a meeting of the Fund’s Board of Trustees/Directors on June 13, 2023, the Committee provided a written report to the Fund’s Board of Trustees/ Directors pertaining to the operation, adequacy, and effectiveness of implementation of the Program, as well as the operation of the highly liquid investment minimum (if applicable) for the period January 1, 2022 through December 31, 2022 (Review Period). The Program operated effectively during the Review Period, supporting the administrator’s ability to assess, manage and monitor Fund liquidity risk, including during periods of market volatility and net redemptions. During the Review Period, the Fund met redemption requests on a timely basis.
There can be no assurance that the Program will achieve its objectives in the future. Please refer to the Fund’s prospectus for more information regarding the Fund’s exposure to liquidity risk and other principal risks to which an investment in the Fund may be subject.
Calvert
International Responsible Index Fund
September 30, 2023
Management and Organization
Fund Management. The Directors of Calvert Responsible Index Series, Inc. (the Corporation) are responsible for the overall management and supervision of the affairs of the Corporation. The Board members and officers of the Corporation are listed below. Except as indicated, each individual has held the office shown or other offices in the same company for the last five years. Board members hold indefinite terms of office. Each Board member holds office until his or her successor is elected and qualified, or until his or her earlier death, resignation, retirement, removal or disqualification. Under the terms of the Fund's current Board member retirement policy, an Independent Board member must retire at the end of the calendar year in which he or she turns 75. However, if such retirement would cause the Fund to be out of compliance with Section 16 of the 1940 Act or any other regulations or guidance of the SEC, then such retirement will not become effective until such time as action has been taken for the Fund to be in compliance therewith. The “noninterested Directors” consist of those Directors who are not “interested persons” of the Corporation, as that term is defined under the 1940 Act. The business address of each Board member and the Chief Compliance Officer is 2050 M Street NW, Washington, DC 20036 and the business address of the Secretary, Vice President and Chief Legal Officer and the Treasurer is Two International Place, Boston, Massachusetts 02110. As used below, “CRM” refers to Calvert Research and Management and “Eaton Vance” refers to Eaton Vance Management. Each Director oversees 46 funds in the Calvert fund complex. Each of Eaton Vance and CRM are indirect, wholly owned subsidiaries of Morgan Stanley. Each officer affiliated with CRM may hold a position with other CRM affiliates that is comparable to his or her position with CRM listed below.
| Name and Year of Birth | Corporation
Position(s) | Length of
Service | Principal Occupation(s) and Other Directorships
During Past Five Years and Other Relevant Experience |
| Interested Director | | | |
Theodore H. Eliopoulos(1)
1964 | Director and
President | Since 2022 | President and Chief Executive Officer of CRM and senior sponsor of Morgan Stanley Investment Management’s (MSIM) Diversity Council. Formerly, Vice Chairman & Head of Strategic Partnerships at MSIM (2019-2022). Former Chief Investment Officer and interim Chief Investment Officer (2014-2018) and Senior Investment Officer of Real Estate and Real Assets at California Public Employees’ Retirement System (CalPERS) (2007-2014). Former Chief Deputy Treasurer and Deputy Treasurer at the California State Treasurer's Office (2002-2006). Mr. Eliopoulos is an interested person because of his positions with CRM and certain affiliates.
Other Directorships. The Robert Toigo Foundation; Pacific Pension & Investment Institute (PPI). |
| Noninterested Directors |
Richard L. Baird, Jr.(2)
1948 | Director | Since 2000 | Regional Disaster Recovery Lead, American Red Cross of Greater
Pennsylvania (since 2017). Volunteer, American Red Cross (since 2015).
Former President and CEO of Adagio Health Inc. (retired in 2014) in
Pittsburgh, PA.
Other Directorships. None. |
Alice Gresham Bullock
1950 | Chair and
Director | Since 2016 | Professor Emerita at Howard University School of Law. Dean Emerita of
Howard University School of Law and Deputy Director of the Association
of American Law Schools (1992-1994).
Other Directorships. None. |
Cari M. Dominguez
1949 | Director | Since 2016 | Former Chair of the U.S. Equal Employment Opportunity Commission.
Other Directorships. ManpowerGroup Inc. (workforce solutions company);
Triple S Management Corporation (managed care); National Association of Corporate Directors. |
Karen Fang(3)
1958 | Director | Since 2023 | Formerly, Managing Director, Wealth Management at GAMCO Asset Management (asset management firm) (2020-2023). Formerly, Managing Director, Senior Portfolio Manager of Fiduciary Trust Company International (wealth management firm) (1993-2019).
Other Directorships. None. |
John G. Guffey, Jr.(2)
1948 | Director | Since 2000 | President of Aurora Press Inc., a privately held publisher of trade paperbacks
(since January 1997).
Other Directorships. Calvert Impact Capital, Inc. (through December 31, 2018); Calvert Ventures, LLC. |
Miles D. Harper, III
1962 | Director | Since 2005 | Partner, Carr Riggs & Ingram (public accounting firm) since October 2014.
Partner, Gainer Donnelly & Desroches (public accounting firm) (now Carr
Riggs & Ingram) (November 1999 - September 2014).
Other Directorships. Bridgeway Funds (9) (asset management). |
Joy V. Jones
1950 | Director | Since 2000 | Attorney.
Other Directorships. Palm Management Corporation. |
Calvert
International Responsible Index Fund
September 30, 2023
Management and Organization — continued
| Name and Year of Birth | Corporation
Position(s) | Length of
Service | Principal Occupation(s) and Other Directorships
During Past Five Years and Other Relevant Experience |
| Noninterested Directors (continued) |
Eddie Ramos(3)
1967 | Director | Since 2023 | Private investor (2022-present). Formerly, Head of External Advisors/Diversity Portfolio Management at the New Jersey Division of Investment (2020-2022). Formerly, Chief Investment Officer and Lead Portfolio Manager – Global Fundamental Equities at Cornerstone Capital Management (asset management firm) (2011-2017).
Other Directorships. Macquarie Optimum Funds (6) (asset management). |
Anthony A. Williams
1951 | Director | Since 2016 | CEO and Executive Director of the Federal City Council (July 2012 to
present); Senior Adviser and Independent Consultant for King and
Spalding LLP (September 2015 to present); Executive Director of Global
Government Practice at the Corporate Executive Board (January 2010 to
January 2012).
Other Directorships. Freddie Mac; Evoq Properties/Meruelo Maddux
Properties, Inc. (real estate management); Weston Solutions, Inc.
(environmental services); Bipartisan Policy Center’s Debt Reduction Task Force;
Chesapeake Bay Foundation; Catholic University of America; Urban Institute (research organization); The Howard Hughes Corporation (real estate development); Old Dominion National Bank. |
| Name and Year of Birth | Corporation
Position(s) | Length of
Service | Principal Occupation(s)
During Past Five Years |
| Principal Officers who are not Directors |
Hope L. Brown
1973 | Chief
Compliance
Officer | Since 2014 | Chief Compliance Officer of 46 registered investment companies advised
by CRM (since 2014). Vice President and Chief Compliance Officer,
Wilmington Funds (2012-2014). |
Deidre E. Walsh
1971 | Secretary,
Vice President
and Chief
Legal Officer | Since 2021 | Vice President of CRM and officer of 46 registered investment companies
advised by CRM (since 2021). Also Vice President of Eaton Vance and
certain of its affiliates and officer of 127 registered investment companies
advised or administered by Eaton Vance. |
James F. Kirchner
1967 | Treasurer | Since 2016 | Vice President of CRM and officer of 46 registered investment companies
advised by CRM (since 2016). Also Vice President of Eaton Vance and
certain of its affiliates and officer of 127 registered investment companies
advised or administered by Eaton Vance. |
| | | | |
| (1) Mr. Eliopoulos is an interested person of the Fund because of his positions with the Fund’s adviser and certain affiliates. |
| (2) Effective December 31, 2023, Richard L. Baird, Jr. and John G. Guffey, Jr. will retire from the Board of Directors. |
| (3) Ms. Fang and Mr. Ramos began serving as Directors effective October 30, 2023. |
The SAI for the Fund includes additional information about the Directors and officers of the Fund and can be obtained without charge on Calvert’s website at www.calvert.com or by calling 1-800-368-2745.
| FACTS | WHAT DOES EATON VANCE DO WITH YOUR
PERSONAL INFORMATION? |
| Why? | Financial companies choose how they share your personal information. Federal law gives consumers the right to limit some but not all sharing. Federal law also requires us to tell you how we collect, share, and protect your personal information. Please read this notice carefully to understand what we do. |
| |
| What? | The types of personal information we collect and share depend on the product or service you have with us. This information can include:■ Social Security number and income
■
investment experience and risk tolerance
■
checking account number and wire transfer instructions |
| |
| How? | All financial companies need to share customers’ personal information to run their everyday business. In the section below, we list the reasons financial companies can share their customers’ personal information; the reasons Eaton Vance chooses to share; and whether you can limit this sharing. |
Reasons we can share your
personal information | Does Eaton Vance
share? | Can you limit
this sharing? |
| For our everyday business purposes — such as to process your transactions, maintain your account(s), respond to court orders and legal investigations, or report to credit bureaus | Yes | No |
| For our marketing purposes — to offer our products and services to you | Yes | No |
| For joint marketing with other financial companies | No | We don’t share |
| For our investment management affiliates’ everyday business purposes — information about your transactions, experiences, and creditworthiness | Yes | Yes |
| For our affiliates’ everyday business purposes — information about your transactions and experiences | Yes | No |
| For our affiliates’ everyday business purposes — information about your creditworthiness | No | We don’t share |
| For our investment management affiliates to market to you | Yes | Yes |
| For our affiliates to market to you | No | We don’t share |
| For nonaffiliates to market to you | No | We don’t share |
To limit our
sharing | Call toll-free 1-800-368-2745 or email: CRMPrivacy@calvert.comPlease note:If you are a new customer, we can begin sharing your information 30 days from the date we sent this notice. When you are no longer our customer, we continue to share your information as described in this notice. However, you can contact us at any time to limit our sharing. |
| Questions? | Call toll-free 1-800-368-2745 or email: CRMPrivacy@calvert.com |
| Privacy Notice — continued | April 2021 |
| Who we are |
| Who is providing this notice? | Eaton Vance Management, Eaton Vance Distributors, Inc., Eaton Vance Trust Company, Eaton Vance Management (International) Limited, Eaton Vance Advisers International Ltd., Eaton Vance Global Advisors Limited, Eaton Vance Management’s Real Estate Investment Group, Boston Management and Research, Calvert Research and Management, Eaton Vance and Calvert Fund Families and our investment advisory affiliates (“Eaton Vance”) (see Investment Management Affiliates definition below) |
| What we do |
How does Eaton Vance
protect my personal
information? | To protect your personal information from unauthorized access and use, we use security measures that comply with federal law. These measures include computer safeguards and secured files and buildings. We have policies governing the proper handling of customer information by personnel and requiring third parties that provide support to adhere to appropriate security standards with respect to such information. |
How does Eaton Vance
collect my personal
information? | We collect your personal information, for example, when you■ open an account or make deposits or withdrawals from your account
■
buy securities from us or make a wire transfer
■
give us your contact informationWe also collect your personal information from others, such as credit bureaus, affiliates, or other companies. |
| Why can’t I limit all sharing? | Federal law gives you the right to limit only■ sharing for affiliates’ everyday business purposes — information about your creditworthiness
■
affiliates from using your information to market to you
■
sharing for nonaffiliates to market to youState laws and individual companies may give you additional rights to limit sharing. See below for more on your rights under state law. |
| Definitions |
Investment Management
Affiliates | Eaton Vance Investment Management Affiliates include registered investment advisers, registered broker- dealers, and registered and unregistered funds. Investment Management Affiliates does not include entities associated with Morgan Stanley Wealth Management, such as Morgan Stanley Smith Barney LLC and Morgan Stanley & Co. |
| Affiliates | Companies related by common ownership or control. They can be financial and nonfinancial companies.■ Our affiliates include companies with a Morgan Stanley name and financial companies such as Morgan Stanley Smith Barney LLC and Morgan Stanley & Co. |
| Nonaffiliates | Companies not related by common ownership or control. They can be financial and nonfinancial companies.■ Eaton Vance does not share with nonaffiliates so they can market to you. |
| Joint marketing | A formal agreement between nonaffiliated financial companies that together market financial products or services to you.■ Eaton Vance doesn’t jointly market. |
| Other important information |
| Vermont: Except as permitted by law, we will not share personal information we collect about Vermont residents with Nonaffiliates unless you provide us with your written consent to share such information.California: Except as permitted by law, we will not share personal information we collect about California residents with Nonaffiliates and we will limit sharing such personal information with our Affiliates to comply with California privacy laws that apply to us. |
Delivery of Shareholder Documents. The Securities and Exchange Commission (SEC) permits funds to deliver only one copy of shareholder documents, including prospectuses, proxy statements and shareholder reports, to fund investors with multiple accounts at the same residential or post office box address. This practice is often called “householding” and it helps eliminate duplicate mailings to shareholders. Calvert funds, or your financial intermediary, may household the mailing of your documents indefinitely unless you instruct Calvert funds, or your financial intermediary, otherwise. If you would prefer that your Calvert fund documents not be householded, please contact Calvert funds at 1-800-368-2745, or contact your financial intermediary. Your instructions that householding not apply to delivery of your Calvert fund documents will typically be effective within 30 days of receipt by Calvert funds or your financial intermediary.
Portfolio Holdings. Each Calvert fund files a schedule of portfolio holdings on Part F to Form N-PORT with the SEC. Certain information filed on Form N-PORT may be viewed on the Calvert website at www.calvert.com, by calling Calvert at 1-800-368-2745 or in the EDGAR database on the SEC’s website at www.sec.gov.
Proxy Voting. The Proxy Voting Guidelines that each Calvert fund uses to determine how to vote proxies relating to portfolio securities is provided as an Appendix to the fund’s Statement of Additional Information. The Statement of Additional Information can be obtained free of charge by calling the Calvert funds at 1-800-368-2745, by visiting the Calvert funds’ website at www.calvert.com or visiting the SEC’s website at www.sec.gov. Information regarding how a Calvert fund voted proxies relating to portfolio securities during the most recent 12-month period ended June 30 is available by calling Calvert funds, by visiting the Calvert funds’ website at www.calvert.com or by visiting the SEC’s website at www.sec.gov.
Tailored Shareholder Reports. Effective January 24, 2023, the SEC adopted rule and form amendments to require open-end mutual funds and ETFs to transmit concise and visually engaging streamlined annual and semiannual reports to shareholders that highlight key information. Other information, including financial statements, will no longer appear in a streamlined shareholder report but must be available online, delivered free of charge upon request, and filed on a semiannual basis on Form N-CSR. The rule and form amendments have a compliance date of July 24, 2024. At this time, management is evaluating the impact of these amendments on the shareholder reports for the Calvert Funds.
This Page Intentionally Left Blank
This Page Intentionally Left Blank
This Page Intentionally Left Blank
Investment Adviser and Administrator
Calvert Research and Management
2050 M Street NW
Washington, DC 20036
Principal Underwriter*
Eaton Vance Distributors, Inc.
Two International Place
Boston, MA 02110
(617) 482-8260
Custodian
State Street Bank and Trust Company
One Congress Street, Suite 1
Boston, MA 02114-2016
Transfer Agent
SS&C Global Investor & Distribution Solutions, Inc.
2000 Crown Colony Drive
Quincy, MA 02169
Independent Registered Public Accounting Firm
Deloitte & Touche LLP
200 Berkeley Street
Boston, MA 02116-5022
Fund Offices
2050 M Street NW
Washington, DC 20036
* FINRA BrokerCheck. Investors may check the background of their Investment Professional by contacting the Financial Industry Regulatory Authority (FINRA). FINRA BrokerCheck is a free tool to help investors check the professional background of current and former FINRA-registered securities firms and brokers. FINRA BrokerCheck is available by calling 1-800-289-9999 and at www.FINRA.org. The FINRA BrokerCheck brochure describing this program is available to investors at www.FINRA.org.
Printed on recycled paper.
24195 9.30.23
Calvert
US Mid-Cap Core Responsible Index Fund
Annual Report
September 30, 2023
Commodity Futures Trading Commission Registration. The Commodity Futures Trading Commission (“CFTC”) has adopted regulations that subject registered investment companies and advisers to regulation by the CFTC if a fund invests more than a prescribed level of its assets in certain CFTC-regulated instruments (including futures, certain options and swap agreements) or markets itself as providing investment exposure to such instruments. The adviser has claimed an exclusion from the definition of “commodity pool operator” under the Commodity Exchange Act with respect to its management of the Fund and the other funds it manages. Accordingly, neither the Fund nor the adviser is subject to CFTC regulation.
Fund shares are not insured by the FDIC and are not deposits or other obligations of, or guaranteed by, any depository institution. Shares are subject to investment risks, including possible loss of principal invested.
This report must be preceded or accompanied by a current summary prospectus or prospectus. Before investing, investors should consider carefully the investment objective, risks, and charges and expenses of a mutual fund. This and other important information is contained in the summary prospectus and prospectus, which can be obtained from a financial intermediary. Prospective investors should read the prospectus carefully before investing. For further information, please call 1-800-368-2745.
Choose Planet-friendly E-delivery!
Sign up now for on-line statements, prospectuses, and fund reports. In less than five minutes you can help reduce paper mail and lower fund costs.
Just go to www.calvert.com. If you already have an online account with the Calvert funds, click on Login to access your Account and select the documents you would like to receive via e-mail.
If you’re new to online account access, click on Login, then Register to create your user name and password. Once you’re in, click on the E-delivery sign-up on the Account Portfolio page and follow the quick, easy steps.
Note: If your shares are not held directly with the Calvert funds but through a brokerage firm, you must contact your broker for electronic delivery options available through their firm.
Annual Report September 30, 2023
Calvert
US Mid-Cap Core Responsible Index Fund
Calvert
US Mid-Cap Core Responsible Index Fund
September 30, 2023
Management's Discussion of Fund Performance†
Economic and Market Conditions
For U.S. equity investors, the 12-month period ended September 30, 2023, was a roller-coaster ride, driven largely by shifting perceptions of whether the U.S. Federal Reserve (the Fed) could bring the world’s largest economy in for a soft landing, and changing expectations of how long interest rates might remain high.
During the opening two months of the period, stocks rallied on strong corporate earnings, attractive valuations, and hope the Fed might slow the pace of its interest rate hikes. But in December 2022, equities lost ground as “higher for longer” interest rate fears returned. A continuing irony throughout the period was that good economic news -- record low unemployment, strong job creation, and robust consumer spending -- was viewed as bad news for inflation and fuel for further rate hikes that would weigh on stock prices.
In January 2023, however, U.S. equities began a rally that lasted through July. The initial tailwind was ChatGPT, an artificial intelligence (AI) application that led investors to perceive AI might become the next big innovation to drive the information technology (IT) sector. As a result, IT -- one of the worst-performing sectors in 2022 -- became the standout sector of the first half of 2023. Earlier recession fears that had weighed on stock prices receded as many investors came around to the view that the U.S. economy was doing surprisingly well.
But in the final two months of the period, the bond market halted the stock market’s momentum. As it became clear the Fed would keep rates higher for longer than investors had anticipated just a few months earlier, longer term bond interest rates rose sharply. Given the potential for relatively attractive returns with lower risk than stocks, many investors shifted from equity assets to bonds. Stock prices ended on a down note as the period came to a close.
For the period as a whole, however, U.S. equity performance was strong. The S&P 500®, a broad measure of U.S. stocks, returned 21.62%; the blue-chip Dow Jones Industrial Average® returned 19.18%; and the tech-heavy Nasdaq Composite Index® returned 26.11%.
Fund Performance
For the 12-month period ended September 30, 2023, Calvert US Mid-Cap Core Responsible Index Fund (the Fund) returned 11.63% for Class A shares at net asset value (NAV). The Fund underperformed its primary benchmark, the Russell Midcap® Index (the Index), which returned 13.45%; and underperformed its secondary benchmark, the Calvert US Mid-Cap Core Responsible Index (the Calvert Index), which returned 12.01% during the period.
The Fund’s underperformance versus the Calvert Index was due to Fund expenses and fees, which the Calvert Index does not incur.
Of the 11 market sectors held by the Fund, all except the utilities and communication services sectors delivered positive returns during the period. The strongest-performing sectors were energy, industrials, and consumer discretionary. The weakest-performing sectors were utilities, communication services, and financials.
Detractors from Fund performance versus the Index included stock selections and an overweight position in the financials sector, which struggled under the weight of three of the largest bank failures in U.S. history during the period; stock selections in the information technology (IT) sector; and an underweight position in the energy sector.
In the financials sector, not owning Index component Apollo Global Management, Inc. (Apollo) detracted from returns relative to the Index during the period. New York-based private equity firm Apollo outperformed most of its peers in the financials sector during the period, with its stock price reaching an all-time high in September 2023.
In the IT sector, not owning Index component Palantir Technologies, Inc. (Palantir) detracted from Index-relative performance during the period. Software firm Palantir, which specializes in big data analytics, saw its stock price nearly double during the period, boosted by investor enthusiasm for artificial intelligence, or AI, that drove a technology stock rally during the first half of 2023.
In contrast, contributors to Fund performance versus the Index included stock selections and an underweight position in the real estate sector, which delivered negative returns in the Index during the period as property sales were hampered by rising mortgage rates and companies cut back on office space after the pandemic. An overweight position in the industrials sector and stock selections in the materials sector helped returns relative to the Index as well.
In the materials sector, not owning Index component Albemarle Corp. (Albemarle), a North Carolina-headquartered specialty chemicals firm that is one of the world’s largest producers of lithium, helped performance versus the Index. Albemarle’s stock price sank as the price of lithium, a key component of electric vehicle batteries, declined during the period.
See Endnotes and Additional Disclosures in this report.
Past performance is no guarantee of future results. Returns are historical and are calculated by determining the percentage change in net asset value (NAV) or offering price (as applicable) with all distributions reinvested. Furthermore, returns do not reflect the deduction of taxes that shareholders may have to pay on Fund distributions or upon the redemption of Fund shares. Investment return and principal value will fluctuate so that shares, when redeemed, may be worth more or less than their original cost. Performance for periods less than or equal to one year is cumulative. Performance is for the stated time period only; due to market volatility, current Fund performance may be lower or higher than the quoted return. For performance as of the most recent month-end, please refer to www.calvert.com.
Calvert
US Mid-Cap Core Responsible Index Fund
September 30, 2023
Performance
Portfolio Manager(s) Thomas C. Seto of Calvert Research and Management
| % Average Annual Total Returns1,2 | Class
Inception Date | Performance
Inception Date | One Year | Five Years | Since
Inception |
| Class A at NAV | 10/30/2015 | 10/30/2015 | 11.63% | 6.16% | 8.64% |
| Class A with 4.75% Maximum Sales Charge | — | — | 6.34 | 5.13 | 7.97 |
| Class I at NAV | 10/30/2015 | 10/30/2015 | 11.92 | 6.44 | 8.96 |
| Class R6 at NAV | 02/01/2022 | 10/30/2015 | 11.91 | 6.44 | 8.96 |
|
| Russell Midcap® Index | — | — | 13.45% | 6.38% | 8.63% |
| Calvert US Mid-Cap Core Responsible Index | — | — | 12.01 | 6.61 | 9.22 |
| % Total Annual Operating Expense Ratios3 | Class A | Class I | Class R6 |
| Gross | 0.66% | 0.41% | 0.37% |
| Net | 0.49 | 0.24 | 0.20 |
Growth of $10,000
This graph shows the change in value of a hypothetical investment of $10,000 in Class A of the Fund for the period indicated. For comparison, the same investment is shown in the indicated index.
| Growth of Investment2 | Amount Invested | Period Beginning | At NAV | With Maximum Sales Charge |
| Class I, at minimum investment | $1,000,000 | 10/30/2015 | $1,973,346 | N.A. |
| Class R6, at minimum investment | $5,000,000 | 10/30/2015 | $9,869,185 | N.A. |
See Endnotes and Additional Disclosures in this report.
Past performance is no guarantee of future results. Returns are historical and are calculated by determining the percentage change in net asset value (NAV) or offering price (as applicable) with all distributions reinvested. Furthermore, returns do not reflect the deduction of taxes that shareholders may have to pay on Fund distributions or upon the redemption of Fund shares. Investment return and principal value will fluctuate so that shares, when redeemed, may be worth more or less than their original cost. Performance for periods less than or equal to one year is cumulative. Performance is for the stated time period only; due to market volatility, current Fund performance may be lower or higher than the quoted return. For performance as of the most recent month-end, please refer to www.calvert.com.
Calvert
US Mid-Cap Core Responsible Index Fund
September 30, 2023
| Sector Allocation (% of net assets)1 |
| Top 10 Holdings (% of net assets)1 | |
| Trane Technologies PLC | 0.6% |
| Carrier Global Corp. | 0.6 |
| PACCAR, Inc. | 0.6 |
| ON Semiconductor Corp. | 0.6 |
| Hilton Worldwide Holdings, Inc. | 0.5 |
| Old Dominion Freight Line, Inc. | 0.5 |
| Nucor Corp. | 0.5 |
| Centene Corp. | 0.5 |
| Ross Stores, Inc. | 0.5 |
| Baker Hughes Co. | 0.5 |
| Total | 5.4% |
Footnotes:
| 1 | Excludes cash and cash equivalents. |
Calvert
US Mid-Cap Core Responsible Index Fund
September 30, 2023
Endnotes and Additional Disclosures
| † | The views expressed in this report are those of the portfolio manager(s) and are current only through the date stated at the top of this page. These views are subject to change at any time based upon market or other conditions, and Calvert and the Fund(s) disclaim any responsibility to update such views. These views may not be relied upon as investment advice and, because investment decisions are based on many factors, may not be relied upon as an indication of trading intent on behalf of any Calvert fund. This commentary may contain statements that are not historical facts, referred to as “forward-looking statements.” The Fund’s actual future results may differ significantly from those stated in any forward-looking statement, depending on factors such as changes in securities or financial markets or general economic conditions, the volume of sales and purchases of Fund shares, the continuation of investment advisory, administrative and service contracts, and other risks discussed from time to time in the Fund’s filings with the Securities and Exchange Commission. |
| | |
| 1 | Russell Midcap® Index is an unmanaged index of U.S. mid-cap stocks. Calvert US Mid-Cap Core Responsible Index (the “Calvert Index”) is composed of the common stocks of mid-size companies that operate their businesses in a manner that is consistent with the Calvert Principles for Responsible Investment. Mid-size companies are selected from the 1,000 largest publicly traded U.S. companies based on market capitalization, excluding real estate investment trusts, business development companies and approximately the 200 largest publicly traded U.S. companies. The Calvert Principles for Responsible Investment serve as a framework for considering environmental, social and governance factors that may affect investment performance. Stocks are weighted in the Calvert Index based on their float-adjusted market capitalization within the relevant sector, subject to certain prescribed limits. Unless otherwise stated, index returns do not reflect the effect of any applicable sales charges, commissions, expenses, taxes or leverage, as applicable. It is not possible to invest directly in an index. |
| 2 | Total Returns at NAV do not include applicable sales charges. If sales charges were deducted, the returns would be lower. Total Returns shown with maximum sales charge reflect the stated maximum sales charge. Unless otherwise stated, performance does not reflect the deduction of taxes on Fund distributions or redemptions of Fund shares. |
| | Performance prior to the inception date of a class may be linked to the performance of an older class of the Fund. This linked performance is adjusted for any applicable sales charge, but is not adjusted for class expense differences. If adjusted for such differences, the performance would be different. The performance of Class R6 is linked to Class I. Performance since inception for an index, if presented, is the performance since the Fund's or oldest share class's inception, as applicable. Performance presented in the Financial Highlights included in the financial statements is not linked.Calvert Research and Management became the investment adviser to the Fund on December 31, 2016. Performance reflected prior to such date is that of the Fund’s former investment adviser. |
| 3 | Source: Fund prospectus. Net expense ratios reflect a contractual expense reimbursement that continues through 1/31/24. The expense ratios for the current reporting period can be found in the Financial Highlights section of this report. Performance reflects expenses waived and/or reimbursed, if applicable. Without such waivers and/or reimbursements, performance would have been lower. |
| Additional Information |
| | S&P 500® Index is an unmanaged index of large-cap stocks commonly used as a measure of U.S. stock market performance. Dow Jones Industrial Average® is a price-weighted average of 30 blue-chip stocks that are generally the leaders in their industry. S&P Dow Jones Indices are a product of S&P Dow Jones Indices LLC (“S&P DJI”) and have been licensed for use. S&P® and S&P 500® are registered trademarks of S&P DJI; Dow Jones® is a registered trademark of Dow Jones Trademark Holdings LLC (“Dow Jones”); S&P DJI, Dow Jones and their respective affiliates do not sponsor, endorse, sell or promote the Fund, will not have any liability with respect thereto and do not have any liability for any errors, omissions, or interruptions of the S&P Dow Jones Indices. Nasdaq Composite Index is a market capitalization-weighted index of all domestic and international securities listed on Nasdaq. Source: Nasdaq, Inc. The information is provided by Nasdaq (with its affiliates, are referred to as the “Corporations”) and Nasdaq’s third party licensors on an “as is” basis and the Corporations make no guarantees and bear no liability of any kind with respect to the information or the Fund. |
Calvert
US Mid-Cap Core Responsible Index Fund
September 30, 2023
Example
As a Fund shareholder, you incur two types of costs: (1) transaction costs, including sales charges (loads) on purchases; and (2) ongoing costs, including management fees; distribution and/or service fees; and other Fund expenses. This Example is intended to help you understand your ongoing costs (in dollars) of Fund investing and to compare these costs with the ongoing costs of investing in other mutual funds. The Example is based on an investment of $1,000 invested at the beginning of the period and held for the entire period (April 1, 2023 to September 30, 2023).
Actual Expenses
The first section of the table below provides information about actual account values and actual expenses. You may use the information in this section, together with the amount you invested, to estimate the expenses that you paid over the period. Simply divide your account value by $1,000 (for example, an $8,600 account value divided by $1,000 = 8.6), then multiply the result by the number in the first section under the heading entitled “Expenses Paid During Period” to estimate the expenses you paid on your account during this period.
Hypothetical Example for Comparison Purposes
The second section of the table below provides information about hypothetical account values and hypothetical expenses based on the actual Fund expense ratio and an assumed rate of return of 5% per year (before expenses), which is not the actual Fund return. The hypothetical account values and expenses may not be used to estimate the actual ending account balance or expenses you paid for the period. You may use this information to compare the ongoing costs of investing in the Fund and other funds. To do so, compare this 5% hypothetical example with the 5% hypothetical examples that appear in the shareholder reports of the other funds.
Please note that the expenses shown in the table are meant to highlight your ongoing costs only and do not reflect any transactional costs, such as sales charges (loads). Therefore, the second section of the table is useful in comparing ongoing costs only, and will not help you determine the relative total costs of owning different funds. In addition, if these transactional costs were included, your costs would be higher.
| | Beginning
Account Value
(4/1/23) | Ending
Account Value
(9/30/23) | Expenses Paid
During Period*
(4/1/23 – 9/30/23) | Annualized
Expense
Ratio |
| Actual | | | | |
| Class A | $1,000.00 | $ 979.00 | $2.43 ** | 0.49% |
| Class I | $1,000.00 | $ 980.40 | $1.19 ** | 0.24% |
| Class R6 | $1,000.00 | $ 980.40 | $0.99 ** | 0.20% |
| Hypothetical | | | | |
| (5% return per year before expenses) | | | | |
| Class A | $1,000.00 | $1,022.61 | $2.48 ** | 0.49% |
| Class I | $1,000.00 | $1,023.87 | $1.22 ** | 0.24% |
| Class R6 | $1,000.00 | $1,024.07 | $1.01 ** | 0.20% |
| * | Expenses are equal to the Fund's annualized expense ratio for the indicated Class, multiplied by the average account value over the period, multiplied by 183/365 (to reflect the one-half year period). The Example assumes that the $1,000 was invested at the net asset value per share determined at the close of business on March 31, 2023. |
| ** | Absent a waiver and/or reimbursement of expenses by an affiliate(s), expenses would be higher. |
Calvert
US Mid-Cap Core Responsible Index Fund
September 30, 2023
| Security | Shares | Value |
| Aerospace & Defense — 0.7% | |
| Axon Enterprise, Inc.(1) | | 4,830 | $ 961,122 |
| Curtiss-Wright Corp. | | 2,651 | 518,615 |
| HEICO Corp. | | 2,811 | 455,185 |
| Hexcel Corp. | | 5,771 | 375,923 |
| Woodward, Inc. | | 4,102 | 509,715 |
| | | | $ 2,820,560 |
| Air Freight & Logistics — 0.6% | |
| C.H. Robinson Worldwide, Inc. | | 8,735 | $ 752,346 |
| Expeditors International of Washington, Inc. | | 10,064 | 1,153,636 |
| GXO Logistics, Inc.(1) | | 7,989 | 468,555 |
| | | | $ 2,374,537 |
| Automobile Components — 0.9% | |
| Aptiv PLC(1) | | 17,037 | $ 1,679,678 |
| Autoliv, Inc. | | 6,510 | 628,085 |
| BorgWarner, Inc. | | 17,691 | 714,186 |
| Lear Corp. | | 4,257 | 571,289 |
| Visteon Corp.(1) | | 2,136 | 294,917 |
| | | | $ 3,888,155 |
| Automobiles — 0.4% | |
| Harley-Davidson, Inc. | | 10,602 | $ 350,502 |
| Rivian Automotive, Inc., Class A(1)(2) | | 46,951 | 1,139,971 |
| Thor Industries, Inc. | | 3,793 | 360,828 |
| | | | $ 1,851,301 |
| Banks — 2.9% | |
| Bank OZK | | 6,536 | $ 242,290 |
| BOK Financial Corp. | | 1,626 | 130,047 |
| Citizens Financial Group, Inc. | | 25,786 | 691,065 |
| Columbia Banking System, Inc. | | 11,473 | 232,902 |
| Comerica, Inc. | | 7,425 | 308,509 |
| Commerce Bancshares, Inc. | | 6,202 | 297,572 |
| Cullen/Frost Bankers, Inc. | | 3,386 | 308,837 |
| East West Bancorp, Inc. | | 7,950 | 419,045 |
| F.N.B. Corp. | | 19,707 | 212,639 |
| Fifth Third Bancorp | | 36,586 | 926,723 |
| First Citizens Bancshares, Inc., Class A | | 583 | 804,598 |
| First Financial Bankshares, Inc. | | 7,537 | 189,329 |
| First Horizon Corp. | | 27,131 | 298,984 |
| Home BancShares, Inc. | | 11,222 | 234,989 |
| Huntington Bancshares, Inc. | | 76,922 | 799,989 |
| KeyCorp | | 51,782 | 557,174 |
| M&T Bank Corp. | | 9,226 | 1,166,628 |
| New York Community Bancorp, Inc. | | 37,701 | 427,529 |
| Old National Bancorp | | 15,924 | 231,535 |
| Pinnacle Financial Partners, Inc. | | 4,407 | 295,445 |
| Security | Shares | Value |
| Banks (continued) | |
| Popular, Inc. | | 3,520 | $ 221,795 |
| Prosperity Bancshares, Inc. | | 4,554 | 248,557 |
| Regions Financial Corp. | | 50,570 | 869,804 |
| SouthState Corp. | | 3,818 | 257,181 |
| Synovus Financial Corp. | | 8,441 | 234,660 |
| United Bankshares, Inc. | | 7,277 | 200,772 |
| Valley National Bancorp | | 20,771 | 177,800 |
| Webster Financial Corp. | | 9,837 | 396,529 |
| Western Alliance Bancorp | | 5,186 | 238,400 |
| Wintrust Financial Corp. | | 3,411 | 257,531 |
| Zions Bancorp N.A. | | 8,037 | 280,411 |
| | | | $ 12,159,269 |
| Beverages — 0.2% | |
| Celsius Holdings, Inc.(1) | | 2,645 | $ 453,882 |
| Coca-Cola Consolidated, Inc. | | 323 | 205,531 |
| | | | $ 659,413 |
| Biotechnology — 2.7% | |
| ACADIA Pharmaceuticals, Inc.(1) | | 7,795 | $ 162,448 |
| Alkermes PLC(1) | | 10,299 | 288,475 |
| Alnylam Pharmaceuticals, Inc.(1) | | 7,738 | 1,370,400 |
| Apellis Pharmaceuticals, Inc.(1) | | 6,017 | 228,887 |
| Arrowhead Pharmaceuticals, Inc.(1) | | 6,703 | 180,110 |
| BioMarin Pharmaceutical, Inc.(1) | | 11,917 | 1,054,416 |
| Blueprint Medicines Corp.(1) | | 3,857 | 193,698 |
| Denali Therapeutics, Inc.(1) | | 6,972 | 143,832 |
| Exact Sciences Corp.(1) | | 11,136 | 759,698 |
| Exelixis, Inc.(1) | | 19,779 | 432,171 |
| Halozyme Therapeutics, Inc.(1) | | 7,893 | 301,513 |
| Horizon Therapeutics PLC(1) | | 13,249 | 1,532,777 |
| Incyte Corp.(1) | | 11,320 | 653,956 |
| Ionis Pharmaceuticals, Inc.(1) | | 8,633 | 391,593 |
| Neurocrine Biosciences, Inc.(1) | | 5,932 | 667,350 |
| Sarepta Therapeutics, Inc.(1) | | 5,642 | 683,923 |
| Seagen, Inc.(1) | | 8,356 | 1,772,725 |
| United Therapeutics Corp.(1) | | 2,855 | 644,859 |
| | | | $ 11,462,831 |
| Broadline Retail — 0.5% | |
| eBay, Inc. | | 30,122 | $ 1,328,079 |
| Etsy, Inc.(1) | | 7,101 | 458,583 |
| Macy's, Inc. | | 15,009 | 174,254 |
| | | | $ 1,960,916 |
| Building Products — 3.0% | |
| A.O. Smith Corp. | | 8,753 | $ 578,836 |
| AAON, Inc. | | 4,707 | 267,687 |
| Advanced Drainage Systems, Inc. | | 4,401 | 500,966 |
| Allegion PLC | | 5,935 | 618,427 |
7
See Notes to Financial Statements.
Calvert
US Mid-Cap Core Responsible Index Fund
September 30, 2023
Schedule of Investments — continued
| Security | Shares | Value |
| Building Products (continued) | |
| AZEK Co., Inc. (The)(1) | | 7,284 | $ 216,626 |
| Carlisle Cos., Inc. | | 3,696 | 958,225 |
| Carrier Global Corp. | | 46,868 | 2,587,113 |
| Fortune Brands Innovations, Inc. | | 7,425 | 461,538 |
| Lennox International, Inc. | | 2,195 | 821,896 |
| Masco Corp. | | 12,537 | 670,103 |
| Owens Corning | | 6,682 | 911,492 |
| Simpson Manufacturing Co., Inc. | | 2,969 | 444,786 |
| Trane Technologies PLC | | 12,818 | 2,600,900 |
| Trex Co., Inc.(1) | | 5,909 | 364,172 |
| UFP Industries, Inc. | | 3,249 | 332,697 |
| Zurn Elkay Water Solutions Corp., Class C | | 8,188 | 229,428 |
| | | | $ 12,564,892 |
| Capital Markets — 4.5% | |
| Affiliated Managers Group, Inc. | | 2,012 | $ 262,244 |
| Ameriprise Financial, Inc. | | 5,677 | 1,871,593 |
| Ares Management Corp., Class A | | 7,718 | 793,951 |
| Bank of New York Mellon Corp. (The) | | 43,002 | 1,834,035 |
| Blue Owl Capital, Inc. | | 23,715 | 307,346 |
| Carlyle Group, Inc. (The) | | 10,454 | 315,293 |
| Cboe Global Markets, Inc. | | 5,668 | 885,398 |
| Coinbase Global, Inc., Class A(1) | | 9,578 | 719,116 |
| Evercore, Inc., Class A | | 1,948 | 268,590 |
| FactSet Research Systems, Inc. | | 2,619 | 1,145,184 |
| Franklin Resources, Inc. | | 15,197 | 373,542 |
| Hamilton Lane, Inc., Class A | | 2,260 | 204,394 |
| Houlihan Lokey, Inc. | | 2,820 | 302,078 |
| Interactive Brokers Group, Inc., Class A | | 5,214 | 451,324 |
| Invesco, Ltd. | | 23,272 | 337,910 |
| Jefferies Financial Group, Inc. | | 11,623 | 425,751 |
| LPL Financial Holdings, Inc. | | 4,098 | 973,890 |
| MarketAxess Holdings, Inc. | | 2,515 | 537,305 |
| Morningstar, Inc. | | 1,823 | 427,020 |
| Nasdaq, Inc. | | 18,334 | 890,849 |
| Northern Trust Corp. | | 11,511 | 799,784 |
| Raymond James Financial, Inc. | | 10,242 | 1,028,604 |
| SEI Investments Co. | | 5,980 | 360,175 |
| State Street Corp. | | 17,379 | 1,163,698 |
| Stifel Financial Corp. | | 5,611 | 344,740 |
| T. Rowe Price Group, Inc. | | 12,294 | 1,289,272 |
| Tradeweb Markets, Inc., Class A | | 6,300 | 505,260 |
| | | | $ 18,818,346 |
| Chemicals — 1.9% | |
| Ashland, Inc. | | 3,701 | $ 302,298 |
| Axalta Coating Systems, Ltd.(1) | | 15,330 | 412,377 |
| Balchem Corp. | | 2,244 | 278,346 |
| Cabot Corp. | | 3,842 | 266,135 |
| Celanese Corp. | | 7,441 | 933,994 |
| Eastman Chemical Co. | | 8,377 | 642,684 |
| Security | Shares | Value |
| Chemicals (continued) | |
| Element Solutions, Inc. | | 14,382 | $ 282,031 |
| FMC Corp. | | 8,644 | 578,889 |
| Huntsman Corp. | | 11,838 | 288,847 |
| International Flavors & Fragrances, Inc. | | 17,242 | 1,175,387 |
| Livent Corp.(1) | | 12,517 | 230,438 |
| Mosaic Co. (The) | | 23,075 | 821,470 |
| PPG Industries, Inc. | | 13,923 | 1,807,205 |
| | | | $ 8,020,101 |
| Commercial Services & Supplies — 0.7% | |
| Casella Waste Systems, Inc., Class A(1) | | 3,620 | $ 276,206 |
| Clean Harbors, Inc.(1) | | 3,589 | 600,655 |
| MSA Safety, Inc. | | 2,436 | 384,035 |
| Rollins, Inc. | | 17,379 | 648,758 |
| Stericycle, Inc.(1) | | 6,564 | 293,476 |
| Tetra Tech, Inc. | | 3,749 | 569,961 |
| | | | $ 2,773,091 |
| Communications Equipment — 0.4% | |
| Ciena Corp.(1) | | 9,391 | $ 443,819 |
| F5, Inc.(1) | | 3,651 | 588,322 |
| Juniper Networks, Inc. | | 19,233 | 534,485 |
| Lumentum Holdings, Inc.(1) | | 3,840 | 173,491 |
| Viasat, Inc.(1)(2) | | 4,657 | 85,968 |
| | | | $ 1,826,085 |
| Construction & Engineering — 1.1% | |
| AECOM | | 9,844 | $ 817,446 |
| Comfort Systems USA, Inc. | | 2,523 | 429,944 |
| EMCOR Group, Inc. | | 3,330 | 700,599 |
| MasTec, Inc.(1) | | 4,274 | 307,600 |
| Quanta Services, Inc. | | 8,574 | 1,603,938 |
| Valmont Industries, Inc. | | 1,414 | 339,657 |
| WillScot Mobile Mini Holdings Corp.(1) | | 14,169 | 589,289 |
| | | | $ 4,788,473 |
| Construction Materials — 0.5% | |
| Summit Materials, Inc., Class A(1) | | 14,299 | $ 445,271 |
| Vulcan Materials Co. | | 8,096 | 1,635,554 |
| | | | $ 2,080,825 |
| Consumer Finance — 0.9% | |
| Ally Financial, Inc. | | 17,130 | $ 457,028 |
| Credit Acceptance Corp.(1) | | 386 | 177,606 |
| Discover Financial Services | | 13,617 | 1,179,641 |
| FirstCash Holdings, Inc. | | 2,107 | 211,501 |
| OneMain Holdings, Inc. | | 6,476 | 259,623 |
| SLM Corp. | | 12,832 | 174,772 |
| SoFi Technologies, Inc.(1)(2) | | 52,094 | 416,231 |
8
See Notes to Financial Statements.
Calvert
US Mid-Cap Core Responsible Index Fund
September 30, 2023
Schedule of Investments — continued
| Security | Shares | Value |
| Consumer Finance (continued) | |
| Synchrony Financial | | 23,594 | $ 721,268 |
| | | | $ 3,597,670 |
| Consumer Staples Distribution & Retail — 2.0% | |
| Albertsons Cos., Inc., Class A | | 25,792 | $ 586,768 |
| BJ's Wholesale Club Holdings, Inc.(1) | | 7,646 | 545,695 |
| Casey's General Stores, Inc. | | 2,303 | 625,311 |
| Dollar Tree, Inc.(1) | | 12,677 | 1,349,467 |
| Kroger Co. (The) | | 41,882 | 1,874,219 |
| Performance Food Group Co.(1) | | 9,328 | 549,046 |
| Sprouts Farmers Market, Inc.(1) | | 6,509 | 278,585 |
| Sysco Corp. | | 29,417 | 1,942,993 |
| US Foods Holding Corp.(1) | | 15,194 | 603,202 |
| | | | $ 8,355,286 |
| Containers & Packaging — 1.6% | |
| AptarGroup, Inc. | | 4,496 | $ 562,180 |
| Avery Dennison Corp. | | 5,419 | 989,889 |
| Ball Corp. | | 21,567 | 1,073,605 |
| Berry Global Group, Inc. | | 8,276 | 512,367 |
| Crown Holdings, Inc. | | 8,357 | 739,427 |
| Graphic Packaging Holding Co. | | 21,161 | 471,467 |
| Packaging Corp. of America | | 6,079 | 933,431 |
| Sealed Air Corp. | | 9,477 | 311,414 |
| Silgan Holdings, Inc. | | 5,980 | 257,798 |
| Sonoco Products Co. | | 6,715 | 364,960 |
| WestRock Co. | | 16,864 | 603,731 |
| | | | $ 6,820,269 |
| Distributors — 0.6% | |
| Genuine Parts Co. | | 8,038 | $ 1,160,527 |
| LKQ Corp. | | 15,212 | 753,146 |
| Pool Corp. | | 2,124 | 756,356 |
| | | | $ 2,670,029 |
| Diversified Consumer Services — 0.4% | |
| Bright Horizons Family Solutions, Inc.(1) | | 3,630 | $ 295,700 |
| Duolingo, Inc.(1) | | 1,645 | 272,856 |
| H&R Block, Inc. | | 9,669 | 416,347 |
| Service Corp. International | | 10,044 | 573,914 |
| | | | $ 1,558,817 |
| Diversified Telecommunication Services — 0.1% | |
| Iridium Communications, Inc. | | 7,871 | $ 358,052 |
| | | | $ 358,052 |
| Electric Utilities — 2.0% | |
| Alliant Energy Corp. | | 17,850 | $ 864,833 |
| Avangrid, Inc. | | 5,056 | 152,540 |
| Constellation Energy Corp. | | 18,985 | 2,070,884 |
| Security | Shares | Value |
| Electric Utilities (continued) | |
| Evergy, Inc. | | 16,102 | $ 816,371 |
| Eversource Energy | | 21,882 | 1,272,438 |
| IDACORP, Inc. | | 3,588 | 336,016 |
| NRG Energy, Inc. | | 15,935 | 613,816 |
| PNM Resources, Inc. | | 6,048 | 269,801 |
| Portland General Electric Co. | | 6,296 | 254,862 |
| Xcel Energy, Inc. | | 32,894 | 1,882,195 |
| | | | $ 8,533,756 |
| Electrical Equipment — 2.1% | |
| Acuity Brands, Inc. | | 2,176 | $ 370,595 |
| AMETEK, Inc. | | 13,447 | 1,986,929 |
| Atkore, Inc.(1) | | 2,624 | 391,474 |
| EnerSys | | 2,345 | 222,001 |
| Generac Holdings, Inc.(1) | | 4,201 | 457,741 |
| Hubbell, Inc. | | 3,707 | 1,161,811 |
| nVent Electric PLC | | 11,422 | 605,252 |
| Plug Power, Inc.(1)(2) | | 31,087 | 236,261 |
| Regal Rexnord Corp. | | 4,618 | 659,820 |
| Rockwell Automation, Inc. | | 6,760 | 1,932,481 |
| Sensata Technologies Holding PLC | | 10,261 | 388,071 |
| Sunrun, Inc.(1) | | 10,890 | 136,778 |
| | | | $ 8,549,214 |
| Electronic Equipment, Instruments & Components — 3.1% | |
| Advanced Energy Industries, Inc. | | 2,604 | $ 268,524 |
| Arrow Electronics, Inc.(1) | | 3,078 | 385,489 |
| Avnet, Inc. | | 4,977 | 239,842 |
| Badger Meter, Inc. | | 2,049 | 294,790 |
| Belden, Inc. | | 2,903 | 280,285 |
| CDW Corp. | | 8,146 | 1,643,537 |
| Cognex Corp. | | 11,626 | 493,407 |
| Coherent Corp.(1) | | 7,960 | 259,814 |
| Corning, Inc. | | 47,557 | 1,449,062 |
| Insight Enterprises, Inc.(1) | | 1,629 | 237,019 |
| IPG Photonics Corp.(1) | | 1,997 | 202,775 |
| Jabil, Inc. | | 7,808 | 990,757 |
| Keysight Technologies, Inc.(1) | | 11,155 | 1,475,918 |
| Littelfuse, Inc. | | 1,682 | 415,992 |
| National Instruments Corp. | | 8,306 | 495,204 |
| Novanta, Inc.(1) | | 2,521 | 361,612 |
| TD SYNNEX Corp. | | 2,378 | 237,467 |
| Teledyne Technologies, Inc.(1) | | 3,070 | 1,254,341 |
| Trimble, Inc.(1) | | 17,241 | 928,600 |
| Vishay Intertechnology, Inc. | | 8,036 | 198,650 |
| Zebra Technologies Corp., Class A(1) | | 3,267 | 772,744 |
| | | | $ 12,885,829 |
9
See Notes to Financial Statements.
Calvert
US Mid-Cap Core Responsible Index Fund
September 30, 2023
Schedule of Investments — continued
| Security | Shares | Value |
| Energy Equipment & Services — 0.5% | |
| Baker Hughes Co. | | 58,757 | $ 2,075,297 |
| | | | $ 2,075,297 |
| Entertainment — 2.1% | |
| AMC Entertainment Holdings, Inc., Class A(1) | | 10,671 | $ 85,261 |
| Atlanta Braves Holdings, Inc., Class C(1) | | 3,685 | 131,665 |
| Electronic Arts, Inc. | | 14,569 | 1,754,108 |
| Liberty Media Corp.-Liberty Formula One, Class A(1) | | 16,419 | 928,330 |
| Liberty Media Corp.-Liberty Live, Class A(1) | | 4,495 | 143,480 |
| Live Nation Entertainment, Inc.(1) | | 9,836 | 816,781 |
| Madison Square Garden Sports Corp. | | 1,120 | 197,456 |
| ROBLOX Corp., Class A(1)(2) | | 29,178 | 844,995 |
| Roku, Inc.(1) | | 7,867 | 555,332 |
| Take-Two Interactive Software, Inc.(1) | | 9,685 | 1,359,677 |
| Warner Bros. Discovery, Inc.(1) | | 141,875 | 1,540,763 |
| Warner Music Group Corp., Class A | | 8,815 | 276,791 |
| | | | $ 8,634,639 |
| Financial Services — 1.8% | |
| Affirm Holdings, Inc.(1) | | 14,097 | $ 299,843 |
| Block, Inc., Class A(1) | | 31,449 | 1,391,933 |
| Equitable Holdings, Inc. | | 18,805 | 533,874 |
| Essent Group, Ltd. | | 5,226 | 247,137 |
| Euronet Worldwide, Inc.(1) | | 3,005 | 238,537 |
| Fidelity National Information Services, Inc. | | 34,694 | 1,917,537 |
| Jack Henry & Associates, Inc. | | 4,523 | 683,606 |
| MGIC Investment Corp. | | 14,352 | 239,535 |
| Radian Group, Inc. | | 8,727 | 219,135 |
| Shift4 Payments, Inc., Class A(1) | | 3,586 | 198,557 |
| Toast, Inc., Class A(1)(2) | | 23,001 | 430,809 |
| Voya Financial, Inc. | | 5,522 | 366,937 |
| Western Union Co. (The) | | 23,174 | 305,433 |
| WEX, Inc.(1) | | 2,708 | 509,348 |
| | | | $ 7,582,221 |
| Food Products — 2.0% | |
| Bunge, Ltd. | | 9,412 | $ 1,018,849 |
| Campbell Soup Co. | | 12,411 | 509,844 |
| Conagra Brands, Inc. | | 29,245 | 801,898 |
| Darling Ingredients, Inc.(1) | | 9,843 | 513,805 |
| Flowers Foods, Inc. | | 12,739 | 282,551 |
| Hormel Foods Corp. | | 17,319 | 658,641 |
| Ingredion, Inc. | | 3,889 | 382,678 |
| JM Smucker Co. (The) | | 6,079 | 747,170 |
| Kellogg Co. | | 15,914 | 947,042 |
| Lamb Weston Holdings, Inc. | | 8,909 | 823,726 |
| Lancaster Colony Corp. | | 1,226 | 202,327 |
| McCormick & Co., Inc. | | 16,408 | 1,241,101 |
| Simply Good Foods Co. (The)(1) | | 6,044 | 208,639 |
| | | | $ 8,338,271 |
| Security | Shares | Value |
| Gas Utilities — 0.4% | |
| National Fuel Gas Co. | | 6,263 | $ 325,112 |
| New Jersey Resources Corp. | | 6,884 | 279,697 |
| ONE Gas, Inc. | | 3,881 | 264,995 |
| Southwest Gas Holdings, Inc. | | 4,743 | 286,525 |
| UGI Corp. | | 14,881 | 342,263 |
| | | | $ 1,498,592 |
| Ground Transportation — 1.5% | |
| Avis Budget Group, Inc.(1) | | 1,873 | $ 336,559 |
| J.B. Hunt Transport Services, Inc. | | 5,785 | 1,090,588 |
| Knight-Swift Transportation Holdings, Inc. | | 10,854 | 544,328 |
| Landstar System, Inc. | | 2,708 | 479,154 |
| Old Dominion Freight Line, Inc. | | 5,397 | 2,208,129 |
| Ryder System, Inc. | | 3,387 | 362,240 |
| Saia, Inc.(1) | | 2,004 | 798,895 |
| XPO, Inc.(1) | | 8,175 | 610,345 |
| | | | $ 6,430,238 |
| Health Care Equipment & Supplies — 4.0% | |
| Align Technology, Inc.(1) | | 4,509 | $ 1,376,688 |
| Baxter International, Inc. | | 31,205 | 1,177,677 |
| CONMED Corp. | | 1,975 | 199,179 |
| Cooper Cos., Inc. (The) | | 3,061 | 973,429 |
| DENTSPLY SIRONA, Inc. | | 13,168 | 449,819 |
| Envista Holdings Corp.(1) | | 9,825 | 273,921 |
| GE HealthCare Technologies, Inc. | | 23,987 | 1,632,075 |
| Globus Medical, Inc., Class A(1) | | 5,301 | 263,195 |
| Haemonetics Corp.(1) | | 3,264 | 292,389 |
| Hologic, Inc.(1) | | 15,041 | 1,043,845 |
| ICU Medical, Inc.(1) | | 1,302 | 154,951 |
| Inari Medical, Inc.(1) | | 3,134 | 204,964 |
| Inspire Medical Systems, Inc.(1) | | 1,813 | 359,772 |
| Insulet Corp.(1) | | 4,499 | 717,545 |
| iRhythm Technologies, Inc.(1) | | 1,941 | 182,959 |
| Lantheus Holdings, Inc.(1) | | 4,530 | 314,744 |
| Masimo Corp.(1) | | 3,010 | 263,917 |
| Merit Medical Systems, Inc.(1) | | 3,661 | 252,682 |
| Neogen Corp.(1) | | 14,078 | 261,006 |
| Novocure, Ltd.(1) | | 6,175 | 99,726 |
| Penumbra, Inc.(1) | | 2,374 | 574,294 |
| QuidelOrtho Corp.(1) | | 3,145 | 229,711 |
| ResMed, Inc. | | 9,172 | 1,356,264 |
| Shockwave Medical, Inc.(1) | | 2,245 | 446,979 |
| STERIS PLC | | 6,185 | 1,357,113 |
| Teleflex, Inc. | | 2,997 | 588,641 |
| Zimmer Biomet Holdings, Inc. | | 12,866 | 1,443,822 |
| | | | $ 16,491,307 |
| Health Care Providers & Services — 2.2% | |
| agilon health, Inc.(1)(2) | | 20,080 | $ 356,621 |
10
See Notes to Financial Statements.
Calvert
US Mid-Cap Core Responsible Index Fund
September 30, 2023
Schedule of Investments — continued
| Security | Shares | Value |
| Health Care Providers & Services (continued) | |
| AMN Healthcare Services, Inc.(1) | | 2,702 | $ 230,156 |
| Centene Corp.(1) | | 31,799 | 2,190,315 |
| Chemed Corp. | | 912 | 473,966 |
| DaVita, Inc.(1) | | 3,380 | 319,511 |
| Encompass Health Corp. | | 6,172 | 414,512 |
| Ensign Group, Inc. (The) | | 3,217 | 298,956 |
| HealthEquity, Inc.(1) | | 5,312 | 388,042 |
| Henry Schein, Inc.(1) | | 8,095 | 601,054 |
| Laboratory Corp. of America Holdings | | 5,497 | 1,105,172 |
| Molina Healthcare, Inc.(1) | | 3,626 | 1,188,929 |
| Option Care Health, Inc.(1) | | 10,127 | 327,609 |
| Progyny, Inc.(1) | | 4,969 | 169,045 |
| Quest Diagnostics, Inc. | | 6,948 | 846,683 |
| R1 RCM, Inc.(1) | | 8,876 | 133,761 |
| Select Medical Holdings Corp. | | 6,829 | 172,569 |
| | | | $ 9,216,901 |
| Health Care Technology — 0.5% | |
| Doximity, Inc., Class A(1) | | 8,070 | $ 171,245 |
| Veeva Systems, Inc., Class A(1) | | 8,709 | 1,771,846 |
| | | | $ 1,943,091 |
| Hotels, Restaurants & Leisure — 2.6% | |
| Aramark | | 15,941 | $ 553,153 |
| Choice Hotels International, Inc.(2) | | 2,103 | 257,638 |
| Darden Restaurants, Inc. | | 7,577 | 1,085,178 |
| Domino's Pizza, Inc. | | 2,155 | 816,292 |
| Expedia Group, Inc.(1) | | 8,959 | 923,404 |
| Hilton Grand Vacations, Inc.(1) | | 5,325 | 216,727 |
| Hilton Worldwide Holdings, Inc. | | 14,766 | 2,217,558 |
| Hyatt Hotels Corp., Class A | | 3,122 | 331,182 |
| Marriott Vacations Worldwide Corp. | | 2,312 | 232,657 |
| Planet Fitness, Inc., Class A(1) | | 5,387 | 264,933 |
| Texas Roadhouse, Inc. | | 4,259 | 409,290 |
| Vail Resorts, Inc. | | 2,526 | 560,494 |
| Wendy's Co. (The) | | 10,822 | 220,877 |
| Wingstop, Inc. | | 1,849 | 332,524 |
| Wyndham Hotels & Resorts, Inc. | | 5,750 | 399,855 |
| Yum! Brands, Inc. | | 16,202 | 2,024,278 |
| | | | $ 10,846,040 |
| Household Durables — 2.1% | |
| D.R. Horton, Inc. | | 17,220 | $ 1,850,633 |
| KB Home | | 5,655 | 261,713 |
| Leggett & Platt, Inc. | | 6,998 | 177,819 |
| Lennar Corp., Class A | | 15,607 | 1,751,574 |
| Meritage Homes Corp. | | 2,546 | 311,605 |
| Mohawk Industries, Inc.(1) | | 3,008 | 258,117 |
| Newell Brands, Inc. | | 23,981 | 216,549 |
| NVR, Inc.(1) | | 204 | 1,216,513 |
| PulteGroup, Inc. | | 14,757 | 1,092,756 |
| Security | Shares | Value |
| Household Durables (continued) | |
| Taylor Morrison Home Corp.(1) | | 7,539 | $ 321,237 |
| Tempur Sealy International, Inc. | | 9,533 | 413,160 |
| TopBuild Corp.(1) | | 2,265 | 569,874 |
| Whirlpool Corp. | | 3,196 | 427,305 |
| | | | $ 8,868,855 |
| Household Products — 0.5% | |
| Church & Dwight Co., Inc. | | 14,162 | $ 1,297,664 |
| Clorox Co. (The) | | 6,972 | 913,750 |
| | | | $ 2,211,414 |
| Independent Power and Renewable Electricity Producers — 0.3% | |
| AES Corp. (The) | | 47,294 | $ 718,869 |
| Brookfield Renewable Corp., Class A | | 9,145 | 218,931 |
| Clearway Energy, Inc., Class C | | 8,091 | 171,206 |
| Ormat Technologies, Inc. | | 3,484 | 243,601 |
| | | | $ 1,352,607 |
| Insurance — 4.9% | |
| Allstate Corp. (The) | | 14,476 | $ 1,612,771 |
| American Financial Group, Inc. | | 4,270 | 476,831 |
| Arch Capital Group, Ltd.(1) | | 20,161 | 1,607,033 |
| Assurant, Inc. | | 2,902 | 416,669 |
| Axis Capital Holdings, Ltd. | | 4,475 | 252,256 |
| Brown & Brown, Inc. | | 16,192 | 1,130,849 |
| Cincinnati Financial Corp. | | 8,287 | 847,677 |
| Enstar Group, Ltd.(1) | | 741 | 179,322 |
| Erie Indemnity Co., Class A | | 1,369 | 402,199 |
| Everest Group, Ltd. | | 2,282 | 848,151 |
| Fidelity National Financial, Inc. | | 13,691 | 565,438 |
| First American Financial Corp. | | 6,289 | 355,266 |
| Globe Life, Inc. | | 5,336 | 580,183 |
| Hanover Insurance Group, Inc. (The) | | 2,094 | 232,392 |
| Hartford Financial Services Group, Inc. (The) | | 16,532 | 1,172,284 |
| Kinsale Capital Group, Inc. | | 1,152 | 477,078 |
| Lincoln National Corp. | | 8,383 | 206,976 |
| Markel Group, Inc.(1) | | 709 | 1,043,995 |
| Old Republic International Corp. | | 13,999 | 377,133 |
| Primerica, Inc. | | 2,052 | 398,109 |
| Principal Financial Group, Inc. | | 13,381 | 964,369 |
| Prudential Financial, Inc. | | 19,898 | 1,888,121 |
| Reinsurance Group of America, Inc. | | 3,668 | 532,557 |
| RenaissanceRe Holdings, Ltd. | | 2,765 | 547,249 |
| RLI Corp. | | 2,157 | 293,115 |
| Ryan Specialty Holdings, Inc.(1) | | 5,110 | 247,324 |
| Selective Insurance Group, Inc. | | 3,276 | 337,985 |
| Unum Group | | 10,360 | 509,608 |
| W.R. Berkley Corp. | | 10,993 | 697,946 |
| White Mountains Insurance Group, Ltd. | | 140 | 209,397 |
11
See Notes to Financial Statements.
Calvert
US Mid-Cap Core Responsible Index Fund
September 30, 2023
Schedule of Investments — continued
| Security | Shares | Value |
| Insurance (continued) | |
| Willis Towers Watson PLC | | 5,665 | $ 1,183,758 |
| | | | $ 20,594,041 |
| Interactive Media & Services — 0.5% | |
| IAC, Inc.(1) | | 4,419 | $ 222,673 |
| Pinterest, Inc., Class A(1) | | 36,114 | 976,162 |
| Snap, Inc., Class A(1) | | 62,954 | 560,920 |
| ZoomInfo Technologies, Inc.(1) | | 17,961 | 294,560 |
| | | | $ 2,054,315 |
| IT Services — 2.8% | |
| Akamai Technologies, Inc.(1) | | 9,224 | $ 982,725 |
| Amdocs, Ltd. | | 7,619 | 643,729 |
| Cloudflare, Inc., Class A(1) | | 18,165 | 1,145,122 |
| Cognizant Technology Solutions Corp., Class A | | 29,266 | 1,982,479 |
| DXC Technology Co.(1) | | 12,323 | 256,688 |
| EPAM Systems, Inc.(1) | | 3,568 | 912,302 |
| Gartner, Inc.(1) | | 4,700 | 1,614,967 |
| MongoDB, Inc.(1) | | 4,225 | 1,461,259 |
| Okta, Inc.(1) | | 9,699 | 790,565 |
| Twilio, Inc., Class A(1) | | 10,912 | 638,679 |
| VeriSign, Inc.(1) | | 5,829 | 1,180,547 |
| | | | $ 11,609,062 |
| Leisure Products — 0.3% | |
| Brunswick Corp. | | 4,669 | $ 368,851 |
| Hasbro, Inc. | | 7,012 | 463,774 |
| Mattel, Inc.(1) | | 20,173 | 444,411 |
| | | | $ 1,277,036 |
| Life Sciences Tools & Services — 3.5% | |
| 10X Genomics, Inc., Class A(1) | | 5,473 | $ 225,761 |
| Agilent Technologies, Inc. | | 17,221 | 1,925,652 |
| Avantor, Inc.(1) | | 42,633 | 898,704 |
| Bio-Rad Laboratories, Inc., Class A(1) | | 1,295 | 464,193 |
| Bio-Techne Corp. | | 9,800 | 667,086 |
| Bruker Corp. | | 6,113 | 380,840 |
| Charles River Laboratories International, Inc.(1) | | 3,106 | 608,714 |
| Fortrea Holdings, Inc.(1) | | 5,726 | 163,706 |
| Illumina, Inc.(1) | | 9,758 | 1,339,578 |
| IQVIA Holdings, Inc.(1) | | 10,411 | 2,048,364 |
| Medpace Holdings, Inc.(1) | | 1,478 | 357,868 |
| Mettler-Toledo International, Inc.(1) | | 1,321 | 1,463,761 |
| Repligen Corp.(1) | | 3,261 | 518,532 |
| Revvity, Inc. | | 7,946 | 879,622 |
| Waters Corp.(1) | | 3,811 | 1,045,014 |
| West Pharmaceutical Services, Inc. | | 4,424 | 1,659,929 |
| | | | $ 14,647,324 |
| Security | Shares | Value |
| Machinery — 6.2% | |
| AGCO Corp. | | 4,113 | $ 486,486 |
| Allison Transmission Holdings, Inc. | | 6,336 | 374,204 |
| Chart Industries, Inc.(1)(2) | | 2,977 | 503,470 |
| CNH Industrial NV | | 63,463 | 767,902 |
| Cummins, Inc. | | 8,384 | 1,915,409 |
| Donaldson Co., Inc. | | 8,351 | 498,054 |
| Dover Corp. | | 9,294 | 1,296,606 |
| Esab Corp. | | 3,968 | 278,633 |
| Flowserve Corp. | | 8,787 | 349,459 |
| Fortive Corp. | | 21,461 | 1,591,548 |
| Franklin Electric Co., Inc. | | 2,790 | 248,952 |
| Graco, Inc. | | 11,611 | 846,210 |
| IDEX Corp. | | 5,242 | 1,090,441 |
| Ingersoll Rand, Inc. | | 24,430 | 1,556,680 |
| ITT, Inc. | | 5,672 | 555,345 |
| Lincoln Electric Holdings, Inc. | | 3,846 | 699,164 |
| Middleby Corp. (The)(1) | | 3,496 | 447,488 |
| Mueller Industries, Inc. | | 3,897 | 292,898 |
| Nordson Corp. | | 3,421 | 763,464 |
| Oshkosh Corp. | | 4,574 | 436,497 |
| Otis Worldwide Corp. | | 24,251 | 1,947,598 |
| PACCAR, Inc. | | 29,286 | 2,489,896 |
| Pentair PLC | | 11,405 | 738,474 |
| Snap-on, Inc. | | 3,687 | 940,406 |
| SPX Technologies, Inc.(1) | | 3,070 | 249,898 |
| Stanley Black & Decker, Inc. | | 10,163 | 849,423 |
| Timken Co. (The) | | 4,197 | 308,437 |
| Toro Co. (The) | | 7,326 | 608,791 |
| Watts Water Technologies, Inc., Class A | | 1,782 | 307,965 |
| Westinghouse Air Brake Technologies Corp. | | 11,554 | 1,227,844 |
| Xylem, Inc. | | 14,711 | 1,339,142 |
| | | | $ 26,006,784 |
| Media — 1.6% | |
| Cable One, Inc. | | 288 | $ 177,304 |
| Interpublic Group of Cos., Inc. (The) | | 26,279 | 753,156 |
| Liberty Broadband Corp., Class C(1) | | 8,435 | 770,284 |
| New York Times Co. (The), Class A | | 10,955 | 451,346 |
| Nexstar Media Group, Inc., Class A | | 2,333 | 334,482 |
| Omnicom Group, Inc. | | 13,500 | 1,005,480 |
| Paramount Global, Class B | | 40,461 | 521,947 |
| Sirius XM Holdings, Inc.(2) | | 45,740 | 206,745 |
| TEGNA, Inc. | | 15,839 | 230,774 |
| Trade Desk, Inc. (The), Class A(1) | | 26,110 | 2,040,497 |
| | | | $ 6,492,015 |
| Metals & Mining — 1.3% | |
| ATI, Inc.(1) | | 13,547 | $ 557,459 |
| Commercial Metals Co. | | 11,564 | 571,377 |
| Nucor Corp. | | 14,078 | 2,201,095 |
12
See Notes to Financial Statements.
Calvert
US Mid-Cap Core Responsible Index Fund
September 30, 2023
Schedule of Investments — continued
| Security | Shares | Value |
| Metals & Mining (continued) | |
| Reliance Steel & Aluminum Co. | | 3,976 | $ 1,042,627 |
| Steel Dynamics, Inc. | | 10,744 | 1,151,972 |
| | | | $ 5,524,530 |
| Multi-Utilities — 2.3% | |
| Ameren Corp. | | 17,065 | $ 1,276,974 |
| Black Hills Corp. | | 4,695 | 237,520 |
| CMS Energy Corp. | | 19,477 | 1,034,424 |
| Consolidated Edison, Inc. | | 20,318 | 1,737,799 |
| DTE Energy Co. | | 13,137 | 1,304,241 |
| NiSource, Inc. | | 28,373 | 700,246 |
| Public Service Enterprise Group, Inc. | | 29,695 | 1,689,942 |
| WEC Energy Group, Inc. | | 18,971 | 1,528,114 |
| | | | $ 9,509,260 |
| Oil, Gas & Consumable Fuels — 0.1% | |
| Denbury, Inc.(1) | | 6,035 | $ 591,490 |
| | | | $ 591,490 |
| Paper & Forest Products — 0.1% | |
| Louisiana-Pacific Corp. | | 3,842 | $ 212,347 |
| | | | $ 212,347 |
| Passenger Airlines — 0.9% | |
| Alaska Air Group, Inc.(1) | | 9,950 | $ 368,946 |
| American Airlines Group, Inc.(1) | | 48,914 | 626,589 |
| Delta Air Lines, Inc. | | 39,886 | 1,475,782 |
| Southwest Airlines Co. | | 40,046 | 1,084,045 |
| | | | $ 3,555,362 |
| Personal Care Products — 0.2% | |
| BellRing Brands, Inc.(1) | | 7,725 | $ 318,502 |
| Coty, Inc., Class A(1) | | 20,673 | 226,783 |
| e.l.f. Beauty, Inc.(1) | | 2,981 | 327,403 |
| | | | $ 872,688 |
| Pharmaceuticals — 0.6% | |
| Catalent, Inc.(1) | | 11,345 | $ 516,538 |
| Elanco Animal Health, Inc.(1) | | 29,425 | 330,737 |
| Jazz Pharmaceuticals PLC(1) | | 3,844 | 497,567 |
| Organon & Co. | | 15,282 | 265,296 |
| Perrigo Co. PLC | | 8,111 | 259,146 |
| Royalty Pharma PLC, Class A | | 24,409 | 662,460 |
| | | | $ 2,531,744 |
| Professional Services — 3.6% | |
| Alight, Inc., Class A(1) | | 17,236 | $ 122,203 |
| Booz Allen Hamilton Holding Corp. | | 8,789 | 960,374 |
| Broadridge Financial Solutions, Inc. | | 7,387 | 1,322,642 |
| Ceridian HCM Holding, Inc.(1) | | 9,078 | 615,942 |
| Security | Shares | Value |
| Professional Services (continued) | |
| Concentrix Corp. | | 2,636 | $ 211,170 |
| CoStar Group, Inc.(1) | | 23,786 | 1,828,906 |
| Dun & Bradstreet Holdings, Inc. | | 17,016 | 169,990 |
| Equifax, Inc. | | 7,444 | 1,363,592 |
| ExlService Holdings, Inc.(1) | | 10,435 | 292,597 |
| Exponent, Inc. | | 3,167 | 271,095 |
| FTI Consulting, Inc.(1) | | 2,273 | 405,526 |
| Genpact, Ltd. | | 10,696 | 387,195 |
| Insperity, Inc. | | 2,477 | 241,755 |
| ManpowerGroup, Inc. | | 3,109 | 227,952 |
| Maximus, Inc. | | 4,140 | 309,175 |
| Paycom Software, Inc. | | 3,264 | 846,257 |
| Paylocity Holding Corp.(1) | | 2,536 | 460,791 |
| Robert Half, Inc. | | 7,167 | 525,198 |
| Science Applications International Corp. | | 3,282 | 346,382 |
| SS&C Technologies Holdings, Inc. | | 13,290 | 698,257 |
| TransUnion | | 13,174 | 945,762 |
| TriNet Group, Inc.(1) | | 2,630 | 306,343 |
| Verisk Analytics, Inc. | | 8,478 | 2,002,843 |
| | | | $ 14,861,947 |
| Real Estate Management & Development — 0.7% | |
| CBRE Group, Inc., Class A(1) | | 19,216 | $ 1,419,294 |
| Howard Hughes Holdings, Inc.(1) | | 2,612 | 193,628 |
| Jones Lang LaSalle, Inc.(1) | | 3,367 | 475,353 |
| Zillow Group, Inc., Class C(1) | | 13,451 | 620,898 |
| | | | $ 2,709,173 |
| Semiconductors & Semiconductor Equipment — 3.2% | |
| Allegro MicroSystems, Inc.(1) | | 4,112 | $ 131,337 |
| Amkor Technology, Inc. | | 6,095 | 137,747 |
| Cirrus Logic, Inc.(1) | | 3,188 | 235,785 |
| Diodes, Inc.(1) | | 2,793 | 220,200 |
| Enphase Energy, Inc.(1) | | 7,725 | 928,159 |
| Entegris, Inc. | | 9,483 | 890,549 |
| First Solar, Inc.(1) | | 5,814 | 939,484 |
| Lattice Semiconductor Corp.(1) | | 8,773 | 753,864 |
| MKS Instruments, Inc. | | 4,072 | 352,391 |
| Monolithic Power Systems, Inc. | | 2,785 | 1,286,670 |
| ON Semiconductor Corp.(1) | | 24,467 | 2,274,208 |
| Onto Innovation, Inc.(1) | | 3,075 | 392,124 |
| Power Integrations, Inc. | | 3,455 | 263,651 |
| Qorvo, Inc.(1) | | 6,319 | 603,275 |
| Rambus, Inc.(1) | | 6,918 | 385,955 |
| Silicon Laboratories, Inc.(1) | | 2,099 | 243,253 |
| Skyworks Solutions, Inc. | | 10,051 | 990,928 |
| SolarEdge Technologies, Inc.(1) | | 3,149 | 407,827 |
| Teradyne, Inc. | | 9,897 | 994,253 |
| Universal Display Corp. | | 2,854 | 448,049 |
13
See Notes to Financial Statements.
Calvert
US Mid-Cap Core Responsible Index Fund
September 30, 2023
Schedule of Investments — continued
| Security | Shares | Value |
| Semiconductors & Semiconductor Equipment (continued) | |
| Wolfspeed, Inc.(1)(2) | | 7,492 | $ 285,445 |
| | | | $ 13,165,154 |
| Software — 5.1% | |
| Altair Engineering, Inc., Class A(1) | | 3,186 | $ 199,316 |
| ANSYS, Inc.(1) | | 5,296 | 1,575,825 |
| AppFolio, Inc., Class A(1) | | 1,187 | 216,782 |
| AppLovin Corp., Class A(1) | | 10,452 | 417,662 |
| Aspen Technology, Inc.(1) | | 1,693 | 345,812 |
| BILL Holdings, Inc.(1) | | 6,374 | 692,025 |
| Box, Inc., Class A(1) | | 8,902 | 215,517 |
| Confluent, Inc., Class A(1) | | 12,496 | 370,007 |
| Datadog, Inc., Class A(1) | | 16,284 | 1,483,310 |
| DocuSign, Inc.(1) | | 12,844 | 539,448 |
| Dolby Laboratories, Inc., Class A | | 3,612 | 286,287 |
| Dropbox, Inc., Class A(1) | | 16,754 | 456,211 |
| Dynatrace, Inc.(1) | | 14,982 | 700,109 |
| Elastic NV(1) | | 4,871 | 395,720 |
| Fair Isaac Corp.(1) | | 1,558 | 1,353,170 |
| Five9, Inc.(1) | | 4,512 | 290,122 |
| Gen Digital, Inc. | | 36,826 | 651,084 |
| Guidewire Software, Inc.(1) | | 5,110 | 459,900 |
| HashiCorp, Inc., Class A(1) | | 4,655 | 106,274 |
| HubSpot, Inc.(1) | | 2,957 | 1,456,322 |
| Manhattan Associates, Inc.(1) | | 3,879 | 766,723 |
| New Relic, Inc.(1) | | 4,091 | 350,271 |
| Nutanix, Inc., Class A(1) | | 15,011 | 523,584 |
| PTC, Inc.(1) | | 7,429 | 1,052,541 |
| Qualys, Inc.(1) | | 2,369 | 361,391 |
| SentinelOne, Inc., Class A(1) | | 13,560 | 228,622 |
| Smartsheet, Inc., Class A(1) | | 8,043 | 325,420 |
| Splunk, Inc.(1) | | 9,538 | 1,394,933 |
| SPS Commerce, Inc.(1) | | 2,319 | 395,645 |
| Tenable Holdings, Inc.(1) | | 7,268 | 325,606 |
| Teradata Corp.(1) | | 6,369 | 286,732 |
| Tyler Technologies, Inc.(1) | | 2,588 | 999,330 |
| Workiva, Inc.(1) | | 2,989 | 302,905 |
| Zoom Video Communications, Inc., Class A(1) | | 14,015 | 980,209 |
| Zscaler, Inc.(1) | | 5,416 | 842,675 |
| | | | $ 21,347,490 |
| Specialty Retail — 2.7% | |
| Academy Sports & Outdoors, Inc. | | 4,451 | $ 210,399 |
| Advance Auto Parts, Inc. | | 3,394 | 189,827 |
| Asbury Automotive Group, Inc.(1) | | 1,258 | 289,428 |
| AutoNation, Inc.(1) | | 1,574 | 238,304 |
| Bath & Body Works, Inc. | | 13,518 | 456,908 |
| Best Buy Co., Inc. | | 10,890 | 756,528 |
| Burlington Stores, Inc.(1) | | 3,793 | 513,193 |
| CarMax, Inc.(1) | | 8,973 | 634,660 |
| Chewy, Inc., Class A(1) | | 5,235 | 95,591 |
| Security | Shares | Value |
| Specialty Retail (continued) | |
| Dick's Sporting Goods, Inc. | | 3,342 | $ 362,874 |
| Five Below, Inc.(1) | | 3,077 | 495,089 |
| Floor & Decor Holdings, Inc., Class A(1) | | 6,025 | 545,263 |
| GameStop Corp., Class A(1) | | 15,037 | 247,509 |
| Lithia Motors, Inc., Class A | | 1,489 | 439,746 |
| Penske Automotive Group, Inc. | | 1,069 | 178,587 |
| RH (1)(2) | | 1,003 | 265,153 |
| Ross Stores, Inc. | | 19,362 | 2,186,938 |
| Tractor Supply Co. | | 6,163 | 1,251,397 |
| Ulta Beauty, Inc.(1) | | 2,801 | 1,118,860 |
| Wayfair, Inc., Class A(1)(2) | | 4,177 | 253,001 |
| Williams-Sonoma, Inc.(2) | | 3,751 | 582,905 |
| | | | $ 11,312,160 |
| Technology Hardware, Storage & Peripherals — 1.7% | |
| Dell Technologies, Inc., Class C | | 15,839 | $ 1,091,307 |
| Hewlett Packard Enterprise Co. | | 80,218 | 1,393,387 |
| HP, Inc. | | 53,575 | 1,376,877 |
| NetApp, Inc. | | 13,145 | 997,442 |
| Pure Storage, Inc., Class A(1) | | 18,506 | 659,184 |
| Seagate Technology Holdings PLC | | 13,143 | 866,781 |
| Western Digital Corp.(1) | | 19,649 | 896,584 |
| | | | $ 7,281,562 |
| Textiles, Apparel & Luxury Goods — 0.8% | |
| Capri Holdings, Ltd.(1) | | 6,984 | $ 367,428 |
| Columbia Sportswear Co. | | 1,821 | 134,936 |
| Crocs, Inc.(1) | | 3,502 | 308,982 |
| Deckers Outdoor Corp.(1) | | 1,519 | 780,903 |
| PVH Corp. | | 3,789 | 289,896 |
| Ralph Lauren Corp. | | 2,229 | 258,765 |
| Skechers USA, Inc., Class A(1) | | 7,779 | 380,782 |
| Tapestry, Inc. | | 12,552 | 360,870 |
| VF Corp. | | 20,718 | 366,087 |
| | | | $ 3,248,649 |
| Trading Companies & Distributors — 1.8% | |
| Air Lease Corp. | | 7,519 | $ 296,324 |
| Applied Industrial Technologies, Inc. | | 2,667 | 412,345 |
| Beacon Roofing Supply, Inc.(1) | | 2,779 | 214,455 |
| Core & Main, Inc., Class A(1) | | 5,671 | 163,608 |
| Fastenal Co. | | 32,917 | 1,798,585 |
| GATX Corp. | | 2,453 | 266,960 |
| MSC Industrial Direct Co., Inc., Class A | | 2,645 | 259,607 |
| SiteOne Landscape Supply, Inc.(1) | | 2,411 | 394,078 |
| United Rentals, Inc. | | 4,036 | 1,794,285 |
| W.W. Grainger, Inc. | | 2,536 | 1,754,506 |
| WESCO International, Inc. | | 2,482 | 356,961 |
| | | | $ 7,711,714 |
14
See Notes to Financial Statements.
Calvert
US Mid-Cap Core Responsible Index Fund
September 30, 2023
Schedule of Investments — continued
| Security | Shares | Value |
| Water Utilities — 0.5% | |
| American Water Works Co., Inc. | | 11,842 | $ 1,466,395 |
| Essential Utilities, Inc. | | 18,633 | 639,671 |
| | | | $ 2,106,066 |
Total Common Stocks
(identified cost $398,463,698) | | | $416,089,103 |
| Security | Shares | Value |
| Health Care Equipment & Supplies — 0.0%(3) | |
| Abiomed, Inc., CVR(1)(4)(5) | | 2,600 | $ 2,652 |
Total Rights
(identified cost $2,652) | | | $ 2,652 |
| Short-Term Investments — 0.3% | | | |
| Affiliated Fund — 0.1% |
| Security | Shares | Value |
| Morgan Stanley Institutional Liquidity Funds - Government Portfolio, Institutional Class, 5.27%(6) | | 469,965 | $ 469,965 |
Total Affiliated Fund
(identified cost $469,965) | | | $ 469,965 |
| Securities Lending Collateral — 0.2% |
| Security | Shares | Value |
| State Street Navigator Securities Lending Government Money Market Portfolio, 5.36%(7) | | 727,130 | $ 727,130 |
Total Securities Lending Collateral
(identified cost $727,130) | | | $ 727,130 |
Total Short-Term Investments
(identified cost $1,197,095) | | | $ 1,197,095 |
Total Investments — 100.0%
(identified cost $399,663,445) | | | $417,288,850 |
| Other Assets, Less Liabilities — (0.0)%(3) | | | $ (109,351) |
| Net Assets — 100.0% | | | $ 417,179,499 |
| The percentage shown for each investment category in the Schedule of Investments is based on net assets. |
| (1) | Non-income producing security. |
| (2) | All or a portion of this security was on loan at September 30, 2023. The aggregate market value of securities on loan at September 30, 2023 was $4,271,071. |
| (3) | Amount is less than 0.05% or (0.05)%, as applicable. |
| (4) | For fair value measurement disclosure purposes, security is categorized as Level 3 (see Note 1A). |
| (5) | Restricted security. Total market value of restricted securities amounts to $2,652, which represents less than 0.05% of the net assets of the Fund as of September 30, 2023. |
| (6) | May be deemed to be an affiliated investment company. The rate shown is the annualized seven-day yield as of September 30, 2023. |
| (7) | Represents investment of cash collateral received in connection with securities lending. |
Restricted Securities
| Description | Acquisition Date | Cost |
| Abiomed, Inc., CVR | 12/28/22 | $2,652 |
15
See Notes to Financial Statements.
Calvert
US Mid-Cap Core Responsible Index Fund
September 30, 2023
Schedule of Investments — continued
| Abbreviations: |
| CVR | – Contingent Value Rights |
16
See Notes to Financial Statements.
Calvert
US Mid-Cap Core Responsible Index Fund
September 30, 2023
Statement of Assets and Liabilities
| | September 30, 2023 |
| Assets | |
Investments in securities of unaffiliated issuers, at value (identified cost $399,193,480) - including
$4,271,071 of securities on loan | $ 416,818,885 |
| Investments in securities of affiliated issuers, at value (identified cost $469,965) | 469,965 |
| Cash | 290,401 |
| Cash denominated in foreign currency, at value (cost $1,071) | 1,144 |
| Receivable for capital shares sold | 963,874 |
| Dividends receivable | 353,492 |
| Dividends receivable - affiliated | 1,408 |
| Securities lending income receivable | 1,475 |
| Receivable from affiliates | 87,314 |
| Directors' deferred compensation plan | 44,991 |
| Total assets | $419,032,949 |
| Liabilities | |
| Payable for capital shares redeemed | $ 812,133 |
| Deposits for securities loaned | 727,130 |
| Payable to affiliates: | |
| Investment advisory fee | 42,390 |
| Administrative fee | 42,425 |
| Distribution and service fees | 12,960 |
| Sub-transfer agency fee | 13,039 |
| Directors' deferred compensation plan | 44,991 |
| Accrued expenses | 158,382 |
| Total liabilities | $ 1,853,450 |
| Net Assets | $417,179,499 |
| Sources of Net Assets | |
| Paid-in capital | $ 418,656,765 |
| Accumulated loss | (1,477,266) |
| Net Assets | $417,179,499 |
| Class A Shares | |
| Net Assets | $ 61,387,674 |
| Shares Outstanding | 1,850,435 |
Net Asset Value and Redemption Price Per Share
(net assets ÷ shares of beneficial interest outstanding) | $ 33.17 |
Maximum Offering Price Per Share
(100 ÷ 95.25 of net asset value per share) | $ 34.82 |
| Class I Shares | |
| Net Assets | $ 325,322,293 |
| Shares Outstanding | 9,697,946 |
Net Asset Value, Offering Price and Redemption Price Per Share
(net assets ÷ shares of beneficial interest outstanding) | $ 33.55 |
17
See Notes to Financial Statements.
Calvert
US Mid-Cap Core Responsible Index Fund
September 30, 2023
Statement of Assets and Liabilities — continued
| | September 30, 2023 |
| Class R6 Shares | |
| Net Assets | $ 30,469,532 |
| Shares Outstanding | 909,441 |
Net Asset Value, Offering Price and Redemption Price Per Share
(net assets ÷ shares of beneficial interest outstanding) | $ 33.50 |
| On sales of $50,000 or more, the offering price of Class A shares is reduced. |
18
See Notes to Financial Statements.
Calvert
US Mid-Cap Core Responsible Index Fund
September 30, 2023
| | Year Ended |
| | September 30, 2023 |
| Investment Income | |
| Dividend income (net of foreign taxes withheld of $2,970) | $ 5,792,080 |
| Dividend income - affiliated issuers | 46,705 |
| Securities lending income, net | 164,622 |
| Total investment income | $ 6,003,407 |
| Expenses | |
| Investment advisory fee | $ 494,948 |
| Administrative fee | 494,948 |
| Distribution and service fees: | |
| Class A | 157,457 |
| Directors' fees and expenses | 28,233 |
| Custodian fees | 13,854 |
| Transfer agency fees and expenses | 394,368 |
| Accounting fees | 95,843 |
| Professional fees | 49,865 |
| Registration fees | 79,436 |
| Reports to shareholders | 34,031 |
| Miscellaneous | 37,306 |
| Total expenses | $ 1,880,289 |
| Waiver and/or reimbursement of expenses by affiliates | $ (738,488) |
| Net expenses | $ 1,141,801 |
| Net investment income | $ 4,861,606 |
| Realized and Unrealized Gain (Loss) | |
| Net realized gain (loss): | |
| Investment securities | $ (8,313,031) |
| Foreign currency transactions | 20 |
| Net realized loss | $ (8,313,011) |
| Change in unrealized appreciation (depreciation): | |
| Investment securities | $ 43,244,346 |
| Foreign currency | 71 |
| Net change in unrealized appreciation (depreciation) | $43,244,417 |
| Net realized and unrealized gain | $34,931,406 |
| Net increase in net assets from operations | $39,793,012 |
19
See Notes to Financial Statements.
Calvert
US Mid-Cap Core Responsible Index Fund
September 30, 2023
Statements of Changes in Net Assets
| | Year Ended September 30, |
| | 2023 | 2022 |
| Increase (Decrease) in Net Assets | | |
| From operations: | | |
| Net investment income | $ 4,861,606 | $ 3,277,557 |
| Net realized loss | (8,313,011) | (11,747,114) |
| Net change in unrealized appreciation (depreciation) | 43,244,417 | (77,130,229) |
| Net increase (decrease) in net assets from operations | $ 39,793,012 | $ (85,599,786) |
| Distributions to shareholders: | | |
| Class A | $ (496,609) | $ (1,543,340) |
| Class I | (2,821,761) | (8,114,381) |
| Class R6 | (367,107) | — (1) |
| Total distributions to shareholders | $ (3,685,477) | $ (9,657,721) |
| Capital share transactions: | | |
| Class A | $ 6,925,518 | $ 13,051,483 |
| Class I | 19,500,947 | 94,258,432 |
| Class R6 | 28,748,441 | 244,218 (1) |
| Net increase in net assets from capital share transactions | $ 55,174,906 | $107,554,133 |
| Net increase in net assets | $ 91,282,441 | $ 12,296,626 |
| Net Assets | | |
| At beginning of year | $ 325,897,058 | $ 313,600,432 |
| At end of year | $417,179,499 | $325,897,058 |
| (1) | For the period from the commencement of operations, February 1, 2022, to September 30, 2022. |
20
See Notes to Financial Statements.
Calvert
US Mid-Cap Core Responsible Index Fund
September 30, 2023
| | Class A |
| | Year Ended September 30, |
| | 2023 | 2022 | 2021 | 2020 | 2019 |
| Net asset value — Beginning of year | $ 29.95 | $ 39.02 | $ 29.17 | $ 26.80 | $ 27.23 |
| Income (Loss) From Operations | | | | | |
| Net investment income(1) | $ 0.33 | $ 0.25 | $ 0.22 | $ 0.28 | $ 0.24 |
| Net realized and unrealized gain (loss) | 3.15 | (8.25) | 10.47 | 2.54 | (0.02) |
| Total income (loss) from operations | $ 3.48 | $ (8.00) | $ 10.69 | $ 2.82 | $ 0.22 |
| Less Distributions | | | | | |
| From net investment income | $ (0.26) | $ (0.14) | $ (0.19) | $ (0.18) | $ (0.24) |
| From net realized gain | — | (0.93) | (0.65) | (0.27) | (0.41) |
| Total distributions | $ (0.26) | $ (1.07) | $ (0.84) | $ (0.45) | $ (0.65) |
| Net asset value — End of year | $ 33.17 | $ 29.95 | $ 39.02 | $ 29.17 | $ 26.80 |
| Total Return(2) | 11.63% | (21.17)% | 37.14% | 10.60% | 1.05% |
| Ratios/Supplemental Data | | | | | |
| Net assets, end of year (000’s omitted) | $61,388 | $48,932 | $50,682 | $14,803 | $12,385 |
| Ratios (as a percentage of average daily net assets):(3) | | | | | |
| Total expenses | 0.67% | 0.66% | 0.68% | 0.77% | 0.90% |
| Net expenses | 0.49% (4) | 0.49% (4) | 0.49% | 0.49% | 0.53% |
| Net investment income | 0.97% | 0.70% | 0.57% | 1.03% | 0.93% |
| Portfolio Turnover | 25% | 26% | 26% | 31% | 57% |
| (1) | Computed using average shares outstanding. |
| (2) | Returns are historical and are calculated by determining the percentage change in net asset value with all distributions reinvested and do not reflect the effect of sales charges, if any. |
| (3) | Total expenses do not reflect amounts reimbursed and/or waived by the adviser and certain of its affiliates, if applicable. Net expenses are net of all reductions and represent the net expenses paid by the Fund. |
| (4) | Includes a reduction by the investment adviser of a portion of its advisory fee due to the Fund’s investment in the Liquidity Fund (equal to less than 0.005% of average daily net assets for the years ended September 30, 2023 and 2022). |
21
See Notes to Financial Statements.
Calvert
US Mid-Cap Core Responsible Index Fund
September 30, 2023
Financial Highlights — continued
| | Class I |
| | Year Ended September 30, |
| | 2023 | 2022 | 2021 | 2020 | 2019 |
| Net asset value — Beginning of year | $ 30.27 | $ 39.39 | $ 29.42 | $ 27.04 | $ 27.45 |
| Income (Loss) From Operations | | | | | |
| Net investment income(1) | $ 0.41 | $ 0.35 | $ 0.31 | $ 0.34 | $ 0.32 |
| Net realized and unrealized gain (loss) | 3.19 | (8.34) | 10.57 | 2.57 | (0.02) |
| Total income (loss) from operations | $ 3.60 | $ (7.99) | $ 10.88 | $ 2.91 | $ 0.30 |
| Less Distributions | | | | | |
| From net investment income | $ (0.32) | $ (0.20) | $ (0.26) | $ (0.26) | $ (0.30) |
| From net realized gain | — | (0.93) | (0.65) | (0.27) | (0.41) |
| Total distributions | $ (0.32) | $ (1.13) | $ (0.91) | $ (0.53) | $ (0.71) |
| Net asset value — End of year | $ 33.55 | $ 30.27 | $ 39.39 | $ 29.42 | $ 27.04 |
| Total Return(2) | 11.92% | (20.97)% | 37.49% | 10.91% | 1.30% |
| Ratios/Supplemental Data | | | | | |
| Net assets, end of year (000’s omitted) | $325,322 | $276,747 | $262,918 | $83,065 | $49,221 |
| Ratios (as a percentage of average daily net assets):(3) | | | | | |
| Total expenses | 0.42% | 0.42% | 0.43% | 0.52% | 0.64% |
| Net expenses | 0.24% (4) | 0.24% (4) | 0.24% | 0.24% | 0.24% |
| Net investment income | 1.21% | 0.96% | 0.83% | 1.27% | 1.23% |
| Portfolio Turnover | 25% | 26% | 26% | 31% | 57% |
| (1) | Computed using average shares outstanding. |
| (2) | Returns are historical and are calculated by determining the percentage change in net asset value with all distributions reinvested and do not reflect the effect of sales charges, if any. |
| (3) | Total expenses do not reflect amounts reimbursed and/or waived by the adviser and certain of its affiliates, if applicable. Net expenses are net of all reductions and represent the net expenses paid by the Fund. |
| (4) | Includes a reduction by the investment adviser of a portion of its advisory fee due to the Fund’s investment in the Liquidity Fund (equal to less than 0.005% of average daily net assets for the years ended September 30, 2023 and 2022). |
22
See Notes to Financial Statements.
Calvert
US Mid-Cap Core Responsible Index Fund
September 30, 2023
Financial Highlights — continued
| | Class R6 |
| | Year Ended
September 30,
2023 | Period Ended
September 30,
2022(1) |
| |
| Net asset value — Beginning of period | $ 30.27 | $ 37.87 |
| Income (Loss) From Operations | | |
| Net investment income(2) | $ 0.44 | $ 0.31 |
| Net realized and unrealized gain (loss) | 3.17 | (7.91) |
| Total income (loss) from operations | $ 3.61 | $ (7.60) |
| Less Distributions | | |
| From net investment income | $ (0.38) | $ — |
| Total distributions | $ (0.38) | $ — |
| Net asset value — End of period | $ 33.50 | $ 30.27 |
| Total Return(3) | 11.91% | (20.04)% (4) |
| Ratios/Supplemental Data | | |
| Net assets, end of period (000’s omitted) | $30,470 | $ 218 |
| Ratios (as a percentage of average daily net assets):(5) | | |
| Total expenses | 0.38% | 0.38% (6) |
| Net expenses | 0.20% (7) | 0.20% (6)(7) |
| Net investment income | 1.29% | 1.40% (6) |
| Portfolio Turnover | 25% | 26% (4)(8) |
| (1) | For the period from the commencement of operations, February 1, 2022, to September 30, 2022. |
| (2) | Computed using average shares outstanding. |
| (3) | Returns are historical and are calculated by determining the percentage change in net asset value with all distributions reinvested and do not reflect the effect of sales charges, if any. |
| (4) | Not annualized. |
| (5) | Total expenses do not reflect amounts reimbursed and/or waived by the adviser and certain of its affiliates, if applicable. Net expenses are net of all reductions and represent the net expenses paid by the Fund. |
| (6) | Annualized. |
| (7) | Includes a reduction by the investment adviser of a portion of its advisory fee due to the Fund's investment in the Liquidity Fund (equal to less than 0.005% of average daily net assets for the year ended September 30, 2023 and the period ended September 30, 2022). |
| (8) | For the year ended September 30, 2022. |
23
See Notes to Financial Statements.
Calvert
US Mid-Cap Core Responsible Index Fund
September 30, 2023
Notes to Financial Statements
1 Significant Accounting Policies
Calvert US Mid-Cap Core Responsible Index Fund (the Fund) is a diversified series of Calvert Responsible Index Series, Inc. (the Corporation). The Corporation is a Maryland corporation registered under the Investment Company Act of 1940, as amended (the 1940 Act), as an open-end management investment company. The investment objective of the Fund is to seek to track the performance of the Calvert US Mid-Cap Core Responsible Index, which measures the investment return of mid-capitalization stocks.
The Fund offers three classes of shares. Class A shares are generally sold subject to a sales charge imposed at time of purchase. A contingent deferred sales charge of 0.25% may apply to certain redemptions of Class A shares for accounts for which no sales charge was paid, if redeemed within 12 months of purchase. Class I and Class R6 shares are sold at net asset value, are not subject to a sales charge and are sold only to certain eligible investors. Each class represents a pro rata interest in the Fund, but votes separately on class-specific matters and is subject to different expenses.
The Fund applies the accounting and reporting guidance in the Financial Accounting Standards Board (FASB) Accounting Standards Codification Topic 946, Financial Services – Investment Companies (ASC 946). Subsequent events, if any, through the date that the financial statements were issued have been evaluated in the preparation of the financial statements.
A Investment Valuation— Net asset value per share is determined every business day as of the close of the regular session of the New York Stock Exchange (generally 4:00 p.m. Eastern time). The Fund uses independent pricing services approved by the Board of Directors (the Board) to value its investments wherever possible. Investments for which market quotations are not available or deemed not reliable are fair valued in good faith by the Board’s valuation designee.
U.S. generally accepted accounting principles (U.S. GAAP) establishes a disclosure hierarchy that categorizes the inputs to valuation techniques used to value assets and liabilities at measurement date. These inputs are summarized in the three broad levels listed below:
Level 1 - quoted prices in active markets for identical securities
Level 2 - other significant observable inputs (including quoted prices for similar securities, interest rates, prepayment speeds, credit risk, etc.)
Level 3 - significant unobservable inputs (including the Fund’s own assumptions in determining the fair value of investments)
The inputs or methodologies used for valuing securities are not necessarily an indication of the risk associated with investing in those securities.
Valuation techniques used to value the Fund’s investments by major category are as follows:
Equity Securities. Equity securities (including warrants and rights) listed on a U.S. securities exchange generally are valued at the last sale or closing price as reported by an independent pricing service on the primary market or exchange on which they are traded and are categorized as Level 1 in the hierarchy. Equity securities listed on the NASDAQ National Market System are valued at the NASDAQ official closing price and are categorized as Level 1 in the hierarchy. Unlisted or listed securities for which closing sales prices or closing quotations are not available are valued at the mean between the latest available bid and ask prices and are categorized as Level 2 in the hierarchy.
Other Securities. Investments in management investment companies (including money market funds) that do not trade on an exchange are valued at the net asset value as of the close of each business day and are categorized as Level 1 in the hierarchy.
Fair Valuation. In connection with Rule 2a-5 of the 1940 Act, the Board has designated the Fund’s investment adviser as its valuation designee. Investments for which valuations or market quotations are not readily available or are deemed unreliable are valued by the investment adviser, as valuation designee, at fair value using methods that most fairly reflect the security’s “fair value”, which is the amount that the Fund might reasonably expect to receive for the security upon its current sale in the ordinary course. Each such determination is based on a consideration of relevant factors, which are likely to vary from one pricing context to another. These factors may include, but are not limited to, the type of security, the existence of any contractual restrictions on the security’s disposition, the price and extent of public trading in similar securities of the issuer or of comparable companies or entities, quotations or relevant information obtained from broker/dealers or other market participants, information obtained from the issuer, analysts, and/or the appropriate stock exchange (for exchange-traded securities), an analysis of the company’s or entity’s financial statements, and an evaluation of the forces that influence the issuer and the market(s) in which the security is purchased and sold.
The values assigned to fair value investments are based on available information and do not necessarily represent amounts that might ultimately be realized. Further, due to the inherent uncertainty of valuations of such investments, the fair values may differ significantly from the values that would have been used had an active market existed, and the differences could be material.
Calvert
US Mid-Cap Core Responsible Index Fund
September 30, 2023
Notes to Financial Statements — continued
The following table summarizes the market value of the Fund's holdings as of September 30, 2023, based on the inputs used to value them:
| Asset Description | Level 1 | Level 2 | Level 3(1) | Total |
| Common Stocks | $ 416,089,103(2) | $ — | $ — | $ 416,089,103 |
| Rights | — | — | 2,652 | 2,652 |
| Short-Term Investments: | | | | |
| Affiliated Fund | 469,965 | — | — | 469,965 |
| Securities Lending Collateral | 727,130 | — | — | 727,130 |
| Total Investments | $417,286,198 | $ — | $2,652 | $417,288,850 |
| (1) | None of the unobservable inputs for Level 3 assets, individually or collectively, had a material impact on the Fund. |
| (2) | The level classification by major category of investments is the same as the category presentation in the Schedule of Investments. |
Level 3 assets at the beginning and/or end of the period in relation to net assets were not significant and accordingly, a reconciliation of Level 3 assets for the year ended September 30, 2023 is not presented.
B Investment Transactions and Income— Investment transactions for financial statement purposes are accounted for on trade date. Realized gains and losses are recorded on an identified cost basis and may include proceeds from litigation. Dividend income is recorded on the ex-dividend date for dividends received in cash and/or securities or, in the case of dividends on certain foreign securities, as soon as the Fund is informed of the ex-dividend date. Non-cash dividends are recorded at the fair value of the securities received. Withholding taxes on foreign dividends, if any, have been provided for in accordance with the Fund’s understanding of the applicable country’s tax rules and rates. Distributions received that represent a return of capital are recorded as a reduction of cost of investments. Distributions received that represent a capital gain are recorded as a realized gain.
C Share Class Accounting— Realized and unrealized gains and losses and net investment income and losses, other than class-specific expenses, are allocated daily to each class of shares based upon the relative net assets of each class to the total net assets of the Fund. Expenses arising in connection with a specific class are charged directly to that class. Sub-accounting, recordkeeping and similar administrative fees payable to financial intermediaries, which are a component of transfer agency fees and expenses on the Statement of Operations, are not allocated to Class R6 shares.
D Restricted Securities— The Fund may invest in securities that are subject to legal or contractual restrictions on resale. Generally, these securities may only be sold publicly upon registration under the Securities Act of 1933 or in transactions exempt from such registration. Information regarding restricted securities (excluding Rule 144A securities) is included at the end of the Schedule of Investments.
E Distributions to Shareholders— Distributions to shareholders are recorded by the Fund on ex-dividend date. Distributions from net investment income and distributions from net realized capital gains, if any, are paid at least annually. Distributions are declared separately for each class of shares. Distributions are determined in accordance with income tax regulations, which may differ from U.S. GAAP; accordingly, periodic reclassifications are made within the Fund's capital accounts to reflect income and gains available for distribution under income tax regulations.
F Estimates— The preparation of financial statements in conformity with U.S. GAAP requires management to make estimates and assumptions that affect the reported amounts of assets and liabilities and disclosure of contingent assets and liabilities at the date of the financial statements and the reported amounts of increases and decreases in net assets from operations during the reporting period. Actual results could differ from those estimates.
G Indemnifications— The Corporation’s By-Laws provide for indemnification for Directors or officers of the Corporation and certain other parties, to the fullest extent permitted by Maryland law and the 1940 Act, provided certain conditions are met. Additionally, in the normal course of business, the Fund enters into agreements with service providers that may contain indemnification clauses. The Fund’s maximum exposure under these arrangements is unknown as this would involve future claims that may be made against the Fund that have not yet occurred.
H Federal Income Taxes— No provision for federal income or excise tax is required since the Fund intends to continue to qualify as a regulated investment company under the Internal Revenue Code and to distribute substantially all of its taxable earnings.
Management has analyzed the Fund's tax positions taken for all open federal income tax years and has concluded that no provision for federal income tax is required in the Fund's financial statements. A Fund's federal tax return is subject to examination by the Internal Revenue Service for a period of three years from the date of filing.
2 Related Party Transactions
The investment advisory fee is earned by Calvert Research and Management (CRM), an indirect, wholly-owned subsidiary of Morgan Stanley, as compensation for investment advisory services rendered to the Fund. The investment advisory fee is computed at the annual rate of 0.12% of the Fund's average daily net assets and is payable monthly. For the year ended September 30, 2023, the investment advisory fee amounted to $494,948.
Calvert
US Mid-Cap Core Responsible Index Fund
September 30, 2023
Notes to Financial Statements — continued
The Fund may invest in a money market fund, the Institutional Class of the Morgan Stanley Institutional Liquidity Funds - Government Portfolio (the “Liquidity Fund”), an open-end management investment company managed by Morgan Stanley Investment Management Inc., a wholly-owned subsidiary of Morgan Stanley. The investment advisory fee paid by the Fund is reduced by an amount equal to its pro rata share of the advisory and administration fees paid by the Fund due to its investment in the Liquidity Fund. For the year ended September 30, 2023, the investment advisory fee paid was reduced by $1,685 relating to the Fund’s investment in the Liquidity Fund.
CRM has agreed to reimburse the Fund’s operating expenses to the extent that total annual operating expenses (relating to ordinary operating expenses only and excluding expenses such as brokerage commissions, acquired fund fees and expenses of unaffiliated funds, borrowing costs, taxes or litigation expenses) exceed 0.49%, 0.24% and 0.20% for Class A, Class I and Class R6, respectively, of such class’s average daily net assets. The expense reimbursement agreement with CRM may be changed or terminated after January 31, 2024. For the year ended September 30, 2023, CRM waived or reimbursed expenses of $736,803.
The administrative fee is earned by CRM as compensation for administrative services rendered to the Fund. The fee is computed at an annual rate of 0.12% of the Fund’s average daily net assets attributable to Class A, Class I and Class R6 and is payable monthly. For the year ended September 30, 2023, CRM was paid administrative fees of $494,948.
The Fund has in effect a distribution plan for Class A shares (Class A Plan) pursuant to Rule 12b-1 under the 1940 Act. Pursuant to the Class A Plan, the Fund pays Eaton Vance Distributors, Inc. (EVD), an affiliate of CRM and the Fund’s principal underwriter, a distribution and service fee of 0.25% per annum of its average daily net assets attributable to Class A shares for distribution services and facilities provided to the Fund by EVD, as well as for personal services and/or the maintenance of shareholder accounts. Distribution and service fees paid or accrued for the year ended September 30, 2023 amounted to $157,457 for Class A shares.
The Fund was informed that EVD received $4,903 as its portion of the sales charge on sales of Class A shares and no contingent deferred sales charges paid by Fund shareholders for the year ended September 30, 2023.
Eaton Vance Management (EVM), an affiliate of CRM, provides sub-transfer agency and related services to the Fund pursuant to a Sub-Transfer Agency Support Services Agreement. For the year ended September 30, 2023, sub-transfer agency fees and expenses incurred to EVM amounted to $53,436 and are included in transfer agency fees and expenses on the Statement of Operations.
Each Director of the Fund who is not an employee of CRM or its affiliates receives an annual fee of $214,000, an annual Committee fee ranging from $8,500 to $16,500 depending on the Committee, and may receive a fee of $10,000 for special meetings. The Board chair receives an additional $40,000 ($30,000 prior to January 1, 2023) annual fee, Committee chairs receive an additional $15,000 ($6,000 prior to January 1, 2023) annual fee and the special equities liaison receives an additional $2,500 annual fee. Eligible Directors may participate in a Deferred Compensation Plan (the Plan). Amounts deferred under the Plan are treated as though equal dollar amounts had been invested in shares of the Fund or other Calvert funds selected by the Directors. The Fund purchases shares of the funds selected equal to the dollar amounts deferred under the Plan, resulting in an asset equal to the deferred compensation liability. Obligations of the Plan are paid solely from the Fund's assets. Directors’ fees are allocated to each of the Calvert funds served. Salaries and fees of officers and Directors of the Fund who are employees of CRM or its affiliates are paid by CRM.
3 Investment Activity
During the year ended September 30, 2023, the cost of purchases and proceeds from sales of investments, other than short-term securities, were $160,873,481 and $103,975,035, respectively.
4 Distributions to Shareholders and Income Tax Information
The tax character of distributions declared for the years ended September 30, 2023 and September 30, 2022 was as follows:
| | Year Ended September 30, |
| | 2023 | 2022 |
| Ordinary income | $3,685,477 | $6,043,599 |
| Long-term capital gains | $ — | $3,614,122 |
During the year ended September 30, 2023, accumulated loss was increased by $469,047 and paid-in capital was increased by $469,047 due to the Fund's use of equalization accounting. Tax equalization accounting allows the Fund to treat as a distribution that portion of redemption proceeds representing a redeeming shareholder’s portion of undistributed taxable income and net capital gains. These reclassifications had no effect on the net assets or net asset value per share of the Fund.
Calvert
US Mid-Cap Core Responsible Index Fund
September 30, 2023
Notes to Financial Statements — continued
As of September 30, 2023, the components of distributable earnings (accumulated loss) on a tax basis were as follows:
| Undistributed ordinary income | $ 3,206,289 |
| Deferred capital losses | (13,247,275) |
| Net unrealized appreciation | 8,563,720 |
| Accumulated loss | $ (1,477,266) |
At September 30, 2023, the Fund, for federal income tax purposes, had deferred capital losses of $13,247,275 which would reduce the Fund's taxable income arising from future net realized gains on investment transactions, if any, to the extent permitted by the Internal Revenue Code, and thus would reduce the amount of distributions to shareholders, which would otherwise be necessary to relieve the Fund of any liability for federal income or excise tax. The deferred capital losses are treated as arising on the first day of the Fund's next taxable year and retain the same short-term or long-term character as when originally deferred. Of the deferred capital losses at September 30, 2023, $8,002,144 are short-term and $5,245,131 are long-term.
The cost and unrealized appreciation (depreciation) of investments of the Fund at September 30, 2023, as determined on a federal income tax basis, were as follows:
| Aggregate cost | $408,725,204 |
| Gross unrealized appreciation | $ 49,152,972 |
| Gross unrealized depreciation | (40,589,326) |
| Net unrealized appreciation | $ 8,563,646 |
5 Securities Lending
To generate additional income, the Fund may lend its securities pursuant to a securities lending agency agreement with State Street Bank and Trust Company (SSBT), the securities lending agent. Security loans are subject to termination by the Fund at any time and, therefore, are not considered illiquid investments. The Fund requires that the loan be continuously collateralized by either cash or securities in an amount at least equal to the market value of the securities on loan. The market value of securities loaned is determined daily and any additional required collateral is delivered to the Fund on the next business day. Cash collateral is generally invested in a money market fund registered under the 1940 Act that is managed by an affiliate of SSBT. Any gain or loss in the market price of the loaned securities that might occur and any interest earned or dividends declared during the term of the loan would accrue to the account of the Fund. Income earned on the investment of collateral, net of broker rebates and other expenses incurred by the securities lending agent, is split between the Fund and the securities lending agent based on agreed upon contractual terms. Non-cash collateral, if any, is held by the lending agent on behalf of the Fund and cannot be sold or re-pledged by the Fund; accordingly, such collateral is not reflected in the Statement of Assets and Liabilities.
The risks associated with lending portfolio securities include, but are not limited to, possible delays in receiving additional collateral or in the recovery of the loaned securities, possible loss of rights to the collateral should the borrower fail financially, as well as risk of loss in the value of the collateral or the value of the investments made with the collateral. The securities lending agent shall indemnify the Fund in the case of default of any securities borrower.
At September 30, 2023, the total value of securities on loan was $4,271,071 and the total value of collateral received was $4,360,307, comprised of cash of $727,130 and U.S. government and/or agencies securities of $3,633,177.
The following table provides a breakdown of securities lending transactions accounted for as secured borrowings, the obligations by class of collateral pledged, and the remaining contractual maturity of those transactions as of September 30, 2023.
| | Remaining Contractual Maturity of the Transactions |
| | Overnight and
Continuous | <30 days | 30 to 90 days | >90 days | Total |
| Common Stocks | $727,130 | $ — | $ — | $ — | $727,130 |
The carrying amount of the liability for deposits for securities loaned at September 30, 2023 approximated its fair value. If measured at fair value, such liability would have been considered as Level 2 in the fair value hierarchy (see Note 1A) at September 30, 2023.
Calvert
US Mid-Cap Core Responsible Index Fund
September 30, 2023
Notes to Financial Statements — continued
6 Line of Credit
The Fund participates with other portfolios and funds managed by EVM and its affiliates, including CRM, in a $725 million unsecured revolving line of credit agreement with a group of banks, which is in effect through October 24, 2023. Borrowings are made by the Fund solely for temporary purposes related to redemptions and other short-term cash needs. Interest is charged to the Fund based on its borrowings at an amount above either the Secured Overnight Financing Rate (SOFR) or Federal Funds rate. In addition, a fee computed at an annual rate of 0.15% on the daily unused portion of the line of credit is allocated among the participating portfolios and funds at the end of each quarter. In connection with the renewal of the agreement in October 2022, an arrangement fee of $150,000 was incurred that was allocated to the participating portfolios and funds. Because the line of credit is not available exclusively to the Fund, it may be unable to borrow some or all of its requested amounts at any particular time.
The Fund had no borrowings outstanding pursuant to its line of credit at September 30, 2023. The Fund did not have any significant borrowings or allocated fees during the year ended September 30, 2023. Effective October 24, 2023, the Fund renewed its line of credit agreement, which expires October 22, 2024. In connection with the renewal, the borrowing limit was decreased to $650 million.
7 Affiliated Investments
At September 30, 2023, the value of the Fund’s investment in funds that may be deemed to be affiliated was $469,965, which represents 0.1% of the Fund’s net assets. Transactions in such investments by the Fund for the year ended September 30, 2023 were as follows:
| Name | Value,
beginning
of period | Purchases | Sales
proceeds | Net
realized
gain
(loss) | Change in
unrealized
appreciation
(depreciation) | Value,
end of
period | Dividend
income | Shares,
end of
period |
| Short-Term Investments | | | | | | |
| Liquidity Fund | $1,165,477 | $87,351,338 | $(88,046,850) | $ — | $ — | $469,965 | $46,705 | 469,965 |
8 Capital Shares
The Corporation may issue its shares in one or more series (such as the Fund). The authorized shares of the Fund consist of 75,000,000 common shares, $0.01 par value, for each Class.
Transactions in capital shares were as follows:
| | Year Ended
September 30, 2023 | | Year Ended
September 30, 2022(1) |
| | Shares | Amount | | Shares | Amount |
| Class A | | | | | |
| Shares sold | 819,922 | $ 27,105,188 | | 607,564 | $ 22,952,188 |
| Reinvestment of distributions | 12,333 | 404,284 | | 37,337 | 1,463,597 |
| Shares redeemed | (615,394) | (20,583,954) | | (310,072) | (11,364,302) |
| Net increase | 216,861 | $ 6,925,518 | | 334,829 | $ 13,051,483 |
| Class I | | | | | |
| Shares sold | 3,907,417 | $ 132,196,691 | | 4,712,747 | $172,052,965 |
| Reinvestment of distributions | 62,187 | 2,057,156 | | 150,149 | 5,936,888 |
| Shares redeemed | (3,414,268) | (114,752,900) | | (2,394,505) | (83,731,421) |
| Net increase | 555,336 | $ 19,500,947 | | 2,468,391 | $ 94,258,432 |
Calvert
US Mid-Cap Core Responsible Index Fund
September 30, 2023
Notes to Financial Statements — continued
| | Year Ended
September 30, 2023 | | Year Ended
September 30, 2022(1) |
| | Shares | Amount | | Shares | Amount |
| Class R6 | | | | | |
| Shares sold | 1,112,589 | $ 36,078,998 | | 7,371 | $ 249,850 |
| Reinvestment of distributions | 11,114 | 367,107 | | — | — |
| Shares redeemed | (221,467) | (7,697,664) | | (166) | (5,632) |
| Net increase | 902,236 | $ 28,748,441 | | 7,205 | $ 244,218 |
| (1) | For Class R6, for the period from the commencement of operations, February 1, 2022, to September 30, 2022. |
Calvert
US Mid-Cap Core Responsible Index Fund
September 30, 2023
Report of Independent Registered Public Accounting Firm
To the Board of Directors of Calvert Responsible Index Series, Inc. and Shareholders of Calvert US Mid-Cap Core Responsible Index Fund:
Opinion on the Financial Statements and Financial Highlights
We have audited the accompanying statement of assets and liabilities of Calvert US Mid-Cap Core Responsible Index Fund (the "Fund") (one of the funds constituting Calvert Responsible Index Series, Inc.), including the schedule of investments, as of September 30, 2023, the related statement of operations for the year then ended, the statements of changes in net assets for each of the two years in the period then ended, the financial highlights for each of the three years in the period then ended, and the related notes. In our opinion, the financial statements and financial highlights present fairly, in all material respects, the financial position of the Fund as of September 30, 2023, and the results of its operations for the year then ended, the changes in its net assets for each of the two years in the period then ended, and the financial highlights for each of the three years in the period then ended, in conformity with accounting principles generally accepted in the United States of America. The financial highlights for the years ended September 30, 2020 and 2019 were audited by other auditors whose report, dated November 20, 2020, expressed an unqualified opinion on those financial highlights.
Basis for Opinion
These financial statements and financial highlights are the responsibility of the Fund's management. Our responsibility is to express an opinion on the Fund's financial statements and financial highlights based on our audits. We are a public accounting firm registered with the Public Company Accounting Oversight Board (United States) (PCAOB) and are required to be independent with respect to the Fund in accordance with the U.S. federal securities laws and the applicable rules and regulations of the Securities and Exchange Commission and the PCAOB.
We conducted our audits in accordance with the standards of the PCAOB. Those standards require that we plan and perform the audit to obtain reasonable assurance about whether the financial statements and financial highlights are free of material misstatement, whether due to error or fraud. The Fund is not required to have, nor were we engaged to perform, an audit of its internal control over financial reporting. As part of our audits, we are required to obtain an understanding of internal control over financial reporting but not for the purpose of expressing an opinion on the effectiveness of the Fund’s internal control over financial reporting. Accordingly, we express no such opinion.
Our audits included performing procedures to assess the risks of material misstatement of the financial statements and financial highlights, whether due to error or fraud, and performing procedures that respond to those risks. Such procedures included examining, on a test basis, evidence regarding the amounts and disclosures in the financial statements and financial highlights. Our audits also included evaluating the accounting principles used and significant estimates made by management, as well as evaluating the overall presentation of the financial statements and financial highlights. Our procedures included confirmation of securities owned as of September 30, 2023, by correspondence with the custodian and brokers; when replies were not received from brokers, we performed other auditing procedures. We believe that our audits provide a reasonable basis for our opinion.
/s/ Deloitte & Touche LLP
Boston, Massachusetts
November 22, 2023
We have served as the auditor of one or more Calvert investment companies since 2021.
Calvert
US Mid-Cap Core Responsible Index Fund
September 30, 2023
Federal Tax Information (Unaudited)
The Form 1099-DIV you receive in February 2024 will show the tax status of all distributions paid to your account in calendar year 2023. Shareholders are advised to consult their own tax adviser with respect to the tax consequences of their investment in the Fund. As required by the Internal Revenue Code and/or regulations, shareholders must be notified regarding the status of qualified dividend income for individuals and the dividends received deduction for corporations.
Qualified Dividend Income. For the fiscal year ended September 30, 2023, the Fund designates approximately $5,630,976, or up to the maximum amount of such dividends allowable pursuant to the Internal Revenue Code, as qualified dividend income eligible for the reduced tax rate of 15%.
Dividends Received Deduction. Corporate shareholders are generally entitled to take the dividends received deduction on the portion of the Fund's dividend distribution that qualifies under tax law. For the Fund's fiscal 2023 ordinary income dividends, 100% qualifies for the corporate dividends received deduction.
Calvert
US Mid-Cap Core Responsible Index Fund
September 30, 2023
Board of Directors' Contract Approval
Overview of the Contract Review Process
The Investment Company Act of 1940, as amended, provides, in substance, that each investment advisory agreement between a fund and its investment adviser will continue in effect from year to year only if its continuation is approved at least annually by the fund’s board of directors, including by a vote of a majority of the directors who are not “interested persons” of the fund (“Independent Directors”), cast in person at a meeting called for the purpose of considering such approval.
At an in-person meeting of the Boards of Trustees/Directors (each a “Board”) of the registered investment companies advised by Calvert Research and Management (“CRM” or the “Adviser”) (the “Calvert Funds”) held on June 12-13, 2023, the Board, including a majority of the Independent Directors, voted to approve continuation of existing investment advisory and investment sub-advisory agreements for the Calvert Funds for an additional one-year period.
In evaluating the investment advisory and investment sub-advisory agreements for the Calvert Funds, the Board considered a variety of information relating to the Calvert Funds and various service providers, including the Adviser. The Independent Directors reviewed a report prepared by the Adviser regarding various services provided to the Calvert Funds by the Adviser and its affiliates. Such report included, among other data, information regarding the Adviser’s personnel and the Adviser’s revenue and cost of providing services to the Calvert Funds, and a separate report prepared by an independent data provider, which compared each fund’s investment performance, fees and expenses to those of comparable funds as identified by such independent data provider (“comparable funds”).
The Independent Directors were separately represented by independent legal counsel with respect to their consideration of the continuation of the investment advisory and investment sub-advisory agreements for the Calvert Funds. Prior to voting, the Independent Directors reviewed the proposed continuation of the Calvert Funds’ investment advisory and investment sub-advisory agreements with management and also met in private sessions with their counsel at which time no representatives of management were present.
The information that the Board considered included, among other things, the following (for funds that invest through one or more affiliated underlying fund(s), references to “each fund” in this section may include information that was considered at the underlying fund-level):
Information about Fees, Performance and Expenses
| • | A report from an independent data provider comparing the advisory and related fees paid by each fund with fees paid by comparable funds; |
| • | A report from an independent data provider comparing each fund’s total expense ratio and its components to comparable funds; |
| • | A report from an independent data provider comparing the investment performance of each fund to the investment performance of comparable funds over various time periods; |
| • | Data regarding investment performance in comparison to benchmark indices; |
| • | For each fund, comparative information concerning the fees charged and the services provided by the Adviser in managing other accounts (including mutual funds, other collective investment funds and institutional accounts) using investment strategies and techniques similar to those used in managing such fund; |
| • | Profitability analyses for the Adviser with respect to each fund; |
Information about Portfolio Management and Trading
| • | Descriptions of the investment management services provided to each fund, including investment strategies and processes it employs; |
| • | Information about the Adviser’s policies and practices with respect to trading, including the Adviser’s processes for monitoring best execution of portfolio transactions; |
| • | Information about the allocation of brokerage transactions and the benefits received by the Adviser as a result of brokerage allocation, including information concerning the acquisition of research through client commission arrangements and policies with respect to “soft dollars”; |
Information about the Adviser
| • | Reports detailing the financial results and condition of CRM; |
| • | Descriptions of the qualifications, education and experience of the individual investment professionals whose responsibilities include portfolio management and investment research for the funds, and information relating to their compensation and responsibilities with respect to managing other mutual funds and investment accounts; |
| • | Policies and procedures relating to proxy voting and the handling of corporate actions and class actions; |
| • | A description of CRM’s procedures for overseeing sub-advisers, including with respect to regulatory and compliance issues, investment management and other matters; |
Calvert
US Mid-Cap Core Responsible Index Fund
September 30, 2023
Board of Directors' Contract Approval — continued
Other Relevant Information
| • | Information concerning the nature, cost and character of the administrative and other non-investment advisory services provided by CRM and its affiliates; and |
| • | The terms of each investment advisory agreement. |
Over the course of the year, the Board and its committees held regular quarterly meetings. During these meetings, the Directors participated in investment and performance reviews with the portfolio managers and other investment professionals of the Adviser relating to each fund and considered various investment and trading strategies used in pursuing each fund’s investment objective(s), such as the use of derivative instruments, as well as risk management techniques. The Board and its committees also evaluated issues pertaining to industry and regulatory developments, compliance procedures, corporate governance and other issues with respect to the funds and received and participated in reports and presentations provided by CRM and its affiliates with respect to such matters. In addition to the formal meetings of the Board and its committees, the Independent Directors held regular video conferences in between meetings to discuss, among other topics, matters relating to the continuation of the Calvert Funds’ investment advisory and investment sub-advisory agreements.
For funds that invest through one or more affiliated underlying funds, the Board considered similar information about the underlying fund(s) when considering the approval of investment advisory agreements. In addition, in cases where the Adviser has engaged a sub-adviser, the Board considered similar information about the sub-adviser when considering the approval of any investment sub-advisory agreement.
The Independent Directors were assisted throughout the contract review process by their independent legal counsel. The Independent Directors relied upon the advice of such counsel and their own business judgment in determining the material factors to be considered in evaluating each investment advisory and investment sub-advisory agreement and the weight to be given to each such factor. The Board, including the Independent Directors, did not identify any single factor as controlling, and each Director may have attributed different weight to various factors.
Results of the Contract Review Process
Based on its consideration of the foregoing, and such other information as it deemed relevant, including the factors and conclusions described below, the Board, including the Independent Directors, concluded that the continuation of the investment advisory agreement of Calvert US Mid-Cap Core Responsible Index Fund (the “Fund”), including the fee payable under the agreement, is in the best interests of the Fund’s shareholders. Accordingly, the Board, including a majority of the Independent Directors, voted to approve the continuation of the investment advisory agreement of the Fund.
Nature, Extent and Quality of Services
In considering the nature, extent and quality of the services provided by the Adviser under the investment advisory agreement, the Board reviewed information provided by the Adviser relating to its operations and personnel, including, among other information, biographical information on the Adviser’s investment personnel and descriptions of its organizational and management structure. The Board also took into account similar information provided periodically throughout the previous year by the Adviser as well as the Board’s familiarity with management through Board meetings, discussions and other reports. The Board considered the Adviser’s management style and its performance in employing its investment strategies as well as its current level of staffing and overall resources. The Board also noted that it reviewed on a quarterly basis information regarding the Adviser’s compliance with applicable policies and procedures, including those related to personal investing. The Board took into account, among other items, periodic reports received from the Adviser over the past year concerning the Adviser’s ongoing review and enhancement of certain processes, policies and procedures of the Calvert Funds and the Adviser. The Board concluded that it was satisfied with the nature, extent and quality of services provided to the Fund by the Adviser under the investment advisory agreement.
Fund Performance
In considering the Fund’s performance, the Board noted that it reviewed on a quarterly basis detailed information about the Fund’s performance results, portfolio composition and investment strategies. The Board compared the Fund’s investment performance to that of the Fund’s peer universe and the index it is designed to track. The Board’s review included comparative performance data for the one-, three- and five-year periods ended December 31, 2022. This performance data indicated that the Fund had underperformed the median of its peer universe for the one-year period ended December 31, 2022, while it had outperformed the median of its peer universe for the three- and five-year periods ended December 31, 2022. This performance data also indicated that the Fund had underperformed the index it is designed to track for the one-, three- and five-year periods ended December 31, 2022. The Board took into account management’s discussion of the Fund’s performance. Based upon its review, the Board concluded that the Fund’s performance was satisfactory relative to the performance of its peer universe and the index it is designed to track.
Calvert
US Mid-Cap Core Responsible Index Fund
September 30, 2023
Board of Directors' Contract Approval
Management Fees and Expenses
In considering the Fund’s fees and expenses, the Board compared the Fund’s fees and total expense ratio with those of comparable funds in its expense universe. Among other findings, the data indicated that the Fund’s advisory and administrative fees (after taking into account waivers and/or reimbursements) (referred to collectively as “management fees”) were above the median of the Fund’s expense universe and the Fund’s total expenses (net of waivers and/or reimbursements) were below the median of the Fund’s expense universe. The Board took into account the Adviser’s current undertaking to maintain expense limitations for the Fund and that the Adviser was waiving and/or reimbursing a portion of the Fund’s expenses. Based upon its review, the Board concluded that the management fees were reasonable in view of the nature, extent and quality of services provided by the Adviser.
Profitability and Other “Fall-Out” Benefits
The Board reviewed the Adviser’s profitability in regard to the Fund and the Calvert Funds in the aggregate. In reviewing the overall profitability of the Fund to the Adviser, the Board also considered the fact that the Adviser and its affiliates provided sub-transfer agency support, administrative and distribution services to the Fund for which they received compensation. The information considered by the Board included the profitability of the Fund to the Adviser and its affiliates without regard to any marketing support or other payments by the Adviser and its affiliates to third parties in respect of distribution services. The Board also considered that the Adviser and its affiliates derived benefits to their reputation and other indirect benefits from their relationships with the Fund. Based upon its review, the Board concluded that the Adviser’s and its affiliates’ level of profitability from their relationships with the Fund was reasonable.
Economies of Scale
The Board considered the effect of the Fund’s current size and its potential growth on its performance and fees. The Board concluded that adding breakpoints to the advisory fee at specified asset levels would not be appropriate at this time. The Board noted that if the Fund’s assets increased over time, the Fund might realize other economies of scale if assets increased proportionally more than certain other expenses.
Calvert
US Mid-Cap Core Responsible Index Fund
September 30, 2023
Liquidity Risk Management Program
The Fund has implemented a written liquidity risk management program (Program) and related procedures to manage its liquidity in accordance with Rule 22e-4 under the Investment Company Act of 1940, as amended (Liquidity Rule). The Liquidity Rule defines “liquidity risk” as the risk that a fund could not meet requests to redeem shares issued by the fund without significant dilution of the remaining investors’ interests in the fund. The Fund’s Board of Trustees/Directors has designated the investment adviser to serve as the administrator of the Program and the related procedures. The administrator has established a Liquidity Risk Management Oversight Committee (Committee) to perform the functions necessary to administer the Program. As part of the Program, the administrator is responsible for identifying illiquid investments and categorizing the relative liquidity of the Fund’s investments in accordance with the Liquidity Rule. Under the Program, the administrator assesses, manages, and periodically reviews the Fund’s liquidity risk, and is responsible for making certain reports to the Fund’s Board of Trustees/Directors and the Securities and Exchange Commission (SEC) regarding the liquidity of the Fund’s investments, and to notify the Board of Trustees/Directors and the SEC of certain liquidity events specified in the Liquidity Rule. The liquidity of the Fund’s portfolio investments is determined based on a number of factors including, but not limited to, relevant market, trading and investment-specific considerations under the Program.
At a meeting of the Fund’s Board of Trustees/Directors on June 13, 2023, the Committee provided a written report to the Fund’s Board of Trustees/ Directors pertaining to the operation, adequacy, and effectiveness of implementation of the Program, as well as the operation of the highly liquid investment minimum (if applicable) for the period January 1, 2022 through December 31, 2022 (Review Period). The Program operated effectively during the Review Period, supporting the administrator’s ability to assess, manage and monitor Fund liquidity risk, including during periods of market volatility and net redemptions. During the Review Period, the Fund met redemption requests on a timely basis.
There can be no assurance that the Program will achieve its objectives in the future. Please refer to the Fund’s prospectus for more information regarding the Fund’s exposure to liquidity risk and other principal risks to which an investment in the Fund may be subject.
Calvert
US Mid-Cap Core Responsible Index Fund
September 30, 2023
Management and Organization
Fund Management. The Directors of Calvert Responsible Index Series, Inc. (the Corporation) are responsible for the overall management and supervision of the affairs of the Corporation. The Board members and officers of the Corporation are listed below. Except as indicated, each individual has held the office shown or other offices in the same company for the last five years. Board members hold indefinite terms of office. Each Board member holds office until his or her successor is elected and qualified, or until his or her earlier death, resignation, retirement, removal or disqualification. Under the terms of the Fund's current Board member retirement policy, an Independent Board member must retire at the end of the calendar year in which he or she turns 75. However, if such retirement would cause the Fund to be out of compliance with Section 16 of the 1940 Act or any other regulations or guidance of the SEC, then such retirement will not become effective until such time as action has been taken for the Fund to be in compliance therewith. The “noninterested Directors” consist of those Directors who are not “interested persons” of the Corporation, as that term is defined under the 1940 Act. The business address of each Board member and the Chief Compliance Officer is 2050 M Street NW, Washington, DC 20036 and the business address of the Secretary, Vice President and Chief Legal Officer and the Treasurer is Two International Place, Boston, Massachusetts 02110. As used below, “CRM” refers to Calvert Research and Management and “Eaton Vance” refers to Eaton Vance Management. Each Director oversees 46 funds in the Calvert fund complex. Each of Eaton Vance and CRM are indirect, wholly owned subsidiaries of Morgan Stanley. Each officer affiliated with CRM may hold a position with other CRM affiliates that is comparable to his or her position with CRM listed below.
| Name and Year of Birth | Corporation
Position(s) | Length of
Service | Principal Occupation(s) and Other Directorships
During Past Five Years and Other Relevant Experience |
| Interested Director | | | |
Theodore H. Eliopoulos(1)
1964 | Director and
President | Since 2022 | President and Chief Executive Officer of CRM and senior sponsor of Morgan Stanley Investment Management’s (MSIM) Diversity Council. Formerly, Vice Chairman & Head of Strategic Partnerships at MSIM (2019-2022). Former Chief Investment Officer and interim Chief Investment Officer (2014-2018) and Senior Investment Officer of Real Estate and Real Assets at California Public Employees’ Retirement System (CalPERS) (2007-2014). Former Chief Deputy Treasurer and Deputy Treasurer at the California State Treasurer's Office (2002-2006). Mr. Eliopoulos is an interested person because of his positions with CRM and certain affiliates.
Other Directorships. The Robert Toigo Foundation; Pacific Pension & Investment Institute (PPI). |
| Noninterested Directors |
Richard L. Baird, Jr.(2)
1948 | Director | Since 2000 | Regional Disaster Recovery Lead, American Red Cross of Greater
Pennsylvania (since 2017). Volunteer, American Red Cross (since 2015).
Former President and CEO of Adagio Health Inc. (retired in 2014) in
Pittsburgh, PA.
Other Directorships. None. |
Alice Gresham Bullock
1950 | Chair and
Director | Since 2016 | Professor Emerita at Howard University School of Law. Dean Emerita of
Howard University School of Law and Deputy Director of the Association
of American Law Schools (1992-1994).
Other Directorships. None. |
Cari M. Dominguez
1949 | Director | Since 2016 | Former Chair of the U.S. Equal Employment Opportunity Commission.
Other Directorships. ManpowerGroup Inc. (workforce solutions company);
Triple S Management Corporation (managed care); National Association of Corporate Directors. |
Karen Fang(3)
1958 | Director | Since 2023 | Formerly, Managing Director, Wealth Management at GAMCO Asset Management (asset management firm) (2020-2023). Formerly, Managing Director, Senior Portfolio Manager of Fiduciary Trust Company International (wealth management firm) (1993-2019).
Other Directorships. None. |
John G. Guffey, Jr.(2)
1948 | Director | Since 2000 | President of Aurora Press Inc., a privately held publisher of trade
paperbacks (since January 1997).
Other Directorships. Calvert Impact Capital, Inc. (through December 31, 2018); Calvert Ventures, LLC. |
Miles D. Harper, III
1962 | Director | Since 2005 | Partner, Carr Riggs & Ingram (public accounting firm) since October 2014.
Partner, Gainer Donnelly & Desroches (public accounting firm) (now Carr
Riggs & Ingram) (November 1999 - September 2014).
Other Directorships. Bridgeway Funds (9) (asset management). |
Joy V. Jones
1950 | Director | Since 2000 | Attorney.
Other Directorships. Palm Management Corporation. |
Calvert
US Mid-Cap Core Responsible Index Fund
September 30, 2023
Management and Organization — continued
| Name and Year of Birth | Corporation
Position(s) | Length of
Service | Principal Occupation(s) and Other Directorships
During Past Five Years and Other Relevant Experience |
| Noninterested Directors (continued) |
Eddie Ramos(3)
1967 | Director | Since 2023 | Private investor (2022-present). Formerly, Head of External Advisors/Diversity Portfolio Management at the New Jersey Division of Investment (2020-2022). Formerly, Chief Investment Officer and Lead Portfolio Manager – Global Fundamental Equities at Cornerstone Capital Management (asset management firm) (2011-2017).
Other Directorships. Macquarie Optimum Funds (6) (asset management). |
Anthony A. Williams
1951 | Director | Since 2016 | CEO and Executive Director of the Federal City Council (July 2012 to
present); Senior Adviser and Independent Consultant for King and
Spalding LLP (September 2015 to present); Executive Director of Global
Government Practice at the Corporate Executive Board (January 2010 to
January 2012).
Other Directorships. Freddie Mac; Evoq Properties/Meruelo Maddux
Properties, Inc. (real estate management); Weston Solutions, Inc.
(environmental services); Bipartisan Policy Center’s Debt Reduction Task Force;
Chesapeake Bay Foundation; Catholic University of America; Urban Institute (research organization); The Howard Hughes Corporation (real estate development); Old Dominion National Bank. |
| Name and Year of Birth | Corporation
Position(s) | Length of
Service | Principal Occupation(s)
During Past Five Years |
| Principal Officers who are not Directors |
Hope L. Brown
1973 | Chief
Compliance
Officer | Since 2014 | Chief Compliance Officer of 46 registered investment companies advised
by CRM (since 2014). Vice President and Chief Compliance Officer,
Wilmington Funds (2012-2014). |
Deidre E. Walsh
1971 | Secretary,
Vice President
and Chief
Legal Officer | Since 2021 | Vice President of CRM and officer of 46 registered investment companies
advised by CRM (since 2021). Also Vice President of Eaton Vance and
certain of its affiliates and officer of 127 registered investment companies
advised or administered by Eaton Vance. |
James F. Kirchner
1967 | Treasurer | Since 2016 | Vice President of CRM and officer of 46 registered investment companies
advised by CRM (since 2016). Also Vice President of Eaton Vance and
certain of its affiliates and officer of 127 registered investment companies
advised or administered by Eaton Vance. |
| | | | |
| (1) Mr. Eliopoulos is an interested person of the Fund because of his positions with the Fund’s adviser and certain affiliates. |
| (2) Effective December 31, 2023, Richard L. Baird, Jr. and John G. Guffey, Jr. will retire from the Board of Directors. |
| (3) Ms. Fang and Mr. Ramos began serving as Directors effective October 30, 2023. |
The SAI for the Fund includes additional information about the Directors and officers of the Fund and can be obtained without charge on Calvert’s website at www.calvert.com or by calling 1-800-368-2745.
| FACTS | WHAT DOES EATON VANCE DO WITH YOUR
PERSONAL INFORMATION? |
| Why? | Financial companies choose how they share your personal information. Federal law gives consumers the right to limit some but not all sharing. Federal law also requires us to tell you how we collect, share, and protect your personal information. Please read this notice carefully to understand what we do. |
| |
| What? | The types of personal information we collect and share depend on the product or service you have with us. This information can include:■ Social Security number and income
■
investment experience and risk tolerance
■
checking account number and wire transfer instructions |
| |
| How? | All financial companies need to share customers’ personal information to run their everyday business. In the section below, we list the reasons financial companies can share their customers’ personal information; the reasons Eaton Vance chooses to share; and whether you can limit this sharing. |
Reasons we can share your
personal information | Does Eaton Vance
share? | Can you limit
this sharing? |
| For our everyday business purposes — such as to process your transactions, maintain your account(s), respond to court orders and legal investigations, or report to credit bureaus | Yes | No |
| For our marketing purposes — to offer our products and services to you | Yes | No |
| For joint marketing with other financial companies | No | We don’t share |
| For our investment management affiliates’ everyday business purposes — information about your transactions, experiences, and creditworthiness | Yes | Yes |
| For our affiliates’ everyday business purposes — information about your transactions and experiences | Yes | No |
| For our affiliates’ everyday business purposes — information about your creditworthiness | No | We don’t share |
| For our investment management affiliates to market to you | Yes | Yes |
| For our affiliates to market to you | No | We don’t share |
| For nonaffiliates to market to you | No | We don’t share |
To limit our
sharing | Call toll-free 1-800-368-2745 or email: CRMPrivacy@calvert.comPlease note:If you are a new customer, we can begin sharing your information 30 days from the date we sent this notice. When you are no longer our customer, we continue to share your information as described in this notice. However, you can contact us at any time to limit our sharing. |
| Questions? | Call toll-free 1-800-368-2745 or email: CRMPrivacy@calvert.com |
| Privacy Notice — continued | April 2021 |
| Who we are |
| Who is providing this notice? | Eaton Vance Management, Eaton Vance Distributors, Inc., Eaton Vance Trust Company, Eaton Vance Management (International) Limited, Eaton Vance Advisers International Ltd., Eaton Vance Global Advisors Limited, Eaton Vance Management’s Real Estate Investment Group, Boston Management and Research, Calvert Research and Management, Eaton Vance and Calvert Fund Families and our investment advisory affiliates (“Eaton Vance”) (see Investment Management Affiliates definition below) |
| What we do |
How does Eaton Vance
protect my personal
information? | To protect your personal information from unauthorized access and use, we use security measures that comply with federal law. These measures include computer safeguards and secured files and buildings. We have policies governing the proper handling of customer information by personnel and requiring third parties that provide support to adhere to appropriate security standards with respect to such information. |
How does Eaton Vance
collect my personal
information? | We collect your personal information, for example, when you■ open an account or make deposits or withdrawals from your account
■
buy securities from us or make a wire transfer
■
give us your contact informationWe also collect your personal information from others, such as credit bureaus, affiliates, or other companies. |
| Why can’t I limit all sharing? | Federal law gives you the right to limit only■ sharing for affiliates’ everyday business purposes — information about your creditworthiness
■
affiliates from using your information to market to you
■
sharing for nonaffiliates to market to youState laws and individual companies may give you additional rights to limit sharing. See below for more on your rights under state law. |
| Definitions |
Investment Management
Affiliates | Eaton Vance Investment Management Affiliates include registered investment advisers, registered broker- dealers, and registered and unregistered funds. Investment Management Affiliates does not include entities associated with Morgan Stanley Wealth Management, such as Morgan Stanley Smith Barney LLC and Morgan Stanley & Co. |
| Affiliates | Companies related by common ownership or control. They can be financial and nonfinancial companies.■ Our affiliates include companies with a Morgan Stanley name and financial companies such as Morgan Stanley Smith Barney LLC and Morgan Stanley & Co. |
| Nonaffiliates | Companies not related by common ownership or control. They can be financial and nonfinancial companies.■ Eaton Vance does not share with nonaffiliates so they can market to you. |
| Joint marketing | A formal agreement between nonaffiliated financial companies that together market financial products or services to you.■ Eaton Vance doesn’t jointly market. |
| Other important information |
| Vermont: Except as permitted by law, we will not share personal information we collect about Vermont residents with Nonaffiliates unless you provide us with your written consent to share such information.California: Except as permitted by law, we will not share personal information we collect about California residents with Nonaffiliates and we will limit sharing such personal information with our Affiliates to comply with California privacy laws that apply to us. |
Delivery of Shareholder Documents. The Securities and Exchange Commission (SEC) permits funds to deliver only one copy of shareholder documents, including prospectuses, proxy statements and shareholder reports, to fund investors with multiple accounts at the same residential or post office box address. This practice is often called “householding” and it helps eliminate duplicate mailings to shareholders. Calvert funds, or your financial intermediary, may household the mailing of your documents indefinitely unless you instruct Calvert funds, or your financial intermediary, otherwise. If you would prefer that your Calvert fund documents not be householded, please contact Calvert funds at 1-800-368-2745, or contact your financial intermediary. Your instructions that householding not apply to delivery of your Calvert fund documents will typically be effective within 30 days of receipt by Calvert funds or your financial intermediary.
Portfolio Holdings. Each Calvert fund files a schedule of portfolio holdings on Part F to Form N-PORT with the SEC. Certain information filed on Form N-PORT may be viewed on the Calvert website at www.calvert.com, by calling Calvert at 1-800-368-2745 or in the EDGAR database on the SEC’s website at www.sec.gov.
Proxy Voting. The Proxy Voting Guidelines that each Calvert fund uses to determine how to vote proxies relating to portfolio securities is provided as an Appendix to the fund’s Statement of Additional Information. The Statement of Additional Information can be obtained free of charge by calling the Calvert funds at 1-800-368-2745, by visiting the Calvert funds’ website at www.calvert.com or visiting the SEC’s website at www.sec.gov. Information regarding how a Calvert fund voted proxies relating to portfolio securities during the most recent 12-month period ended June 30 is available by calling Calvert funds, by visiting the Calvert funds’ website at www.calvert.com or by visiting the SEC’s website at www.sec.gov.
Tailored Shareholder Reports. Effective January 24, 2023, the SEC adopted rule and form amendments to require open-end mutual funds and ETFs to transmit concise and visually engaging streamlined annual and semiannual reports to shareholders that highlight key information. Other information, including financial statements, will no longer appear in a streamlined shareholder report but must be available online, delivered free of charge upon request, and filed on a semiannual basis on Form N-CSR. The rule and form amendments have a compliance date of July 24, 2024. At this time, management is evaluating the impact of these amendments on the shareholder reports for the Calvert Funds.
Investment Adviser and Administrator
Calvert Research and Management
2050 M Street NW
Washington, DC 20036
Principal Underwriter*
Eaton Vance Distributors, Inc.
Two International Place
Boston, MA 02110
(617) 482-8260
Custodian
State Street Bank and Trust Company
One Congress Street, Suite 1
Boston, MA 02114-2016
Transfer Agent
SS&C Global Investor & Distribution Solutions, Inc.
2000 Crown Colony Drive
Quincy, MA 02169
Independent Registered Public Accounting Firm
Deloitte & Touche LLP
200 Berkeley Street
Boston, MA 02116-5022
Fund Offices
2050 M Street NW
Washington, DC 20036
* FINRA BrokerCheck. Investors may check the background of their Investment Professional by contacting the Financial Industry Regulatory Authority (FINRA). FINRA BrokerCheck is a free tool to help investors check the professional background of current and former FINRA-registered securities firms and brokers. FINRA BrokerCheck is available by calling 1-800-289-9999 and at www.FINRA.org. The FINRA BrokerCheck brochure describing this program is available to investors at www.FINRA.org.
Printed on recycled paper.
24193 9.30.23
Calvert
US Large-Cap Core Responsible Index Fund
Annual Report
September 30, 2023
Commodity Futures Trading Commission Registration. The Commodity Futures Trading Commission (“CFTC”) has adopted regulations that subject registered investment companies and advisers to regulation by the CFTC if a fund invests more than a prescribed level of its assets in certain CFTC-regulated instruments (including futures, certain options and swap agreements) or markets itself as providing investment exposure to such instruments. The adviser has claimed an exclusion from the definition of “commodity pool operator” under the Commodity Exchange Act with respect to its management of the Fund and the other funds it manages. Accordingly, neither the Fund nor the adviser is subject to CFTC regulation.
Fund shares are not insured by the FDIC and are not deposits or other obligations of, or guaranteed by, any depository institution. Shares are subject to investment risks, including possible loss of principal invested.
This report must be preceded or accompanied by a current summary prospectus or prospectus. Before investing, investors should consider carefully the investment objective, risks, and charges and expenses of a mutual fund. This and other important information is contained in the summary prospectus and prospectus, which can be obtained from a financial intermediary. Prospective investors should read the prospectus carefully before investing. For further information, please call 1-800-368-2745.
Choose Planet-friendly E-delivery!
Sign up now for on-line statements, prospectuses, and fund reports. In less than five minutes you can help reduce paper mail and lower fund costs.
Just go to www.calvert.com. If you already have an online account with the Calvert funds, click on Login to access your Account and select the documents you would like to receive via e-mail.
If you’re new to online account access, click on Login, then Register to create your user name and password. Once you’re in, click on the E-delivery sign-up on the Account Portfolio page and follow the quick, easy steps.
Note: If your shares are not held directly with the Calvert funds but through a brokerage firm, you must contact your broker for electronic delivery options available through their firm.
Annual Report September 30, 2023
Calvert
US Large-Cap Core Responsible Index Fund
Calvert
US Large-Cap Core Responsible Index Fund
September 30, 2023
Management's Discussion of Fund Performance†
Economic and Market Conditions
For U.S. equity investors, the 12-month period ended September 30, 2023, was a roller-coaster ride, driven largely by shifting perceptions of whether the U.S. Federal Reserve (the Fed) could bring the world’s largest economy in for a soft landing, and changing expectations of how long interest rates might remain high.
During the opening two months of the period, stocks rallied on strong corporate earnings, attractive valuations, and hope the Fed might slow the pace of its interest rate hikes. But in December 2022, equities lost ground as “higher for longer” interest rate fears returned. A continuing irony throughout the period was that good economic news -- record low unemployment, strong job creation, and robust consumer spending -- was viewed as bad news for inflation and fuel for further rate hikes that would weigh on stock prices.
In January 2023, however, U.S. equities began a rally that lasted through July. The initial tailwind was ChatGPT, an artificial intelligence (AI) application that led investors to perceive AI might become the next big innovation to drive the information technology (IT) sector. As a result, IT -- one of the worst-performing sectors in 2022 -- became the standout sector of the first half of 2023. Earlier recession fears that had weighed on stock prices receded as many investors came around to the view that the U.S. economy was doing surprisingly well.
But in the final two months of the period, the bond market halted the stock market’s momentum. As it became clear the Fed would keep rates higher for longer than investors had anticipated just a few months earlier, longer term bond interest rates rose sharply. Given the potential for relatively attractive returns with lower risk than stocks, many investors shifted from equity assets to bonds. Stock prices ended on a down note as the period came to a close.
For the period as a whole, however, U.S. equity performance was strong. The S&P 500® Index, a broad measure of U.S. stocks, returned 21.62%; the blue-chip Dow Jones Industrial Average® returned 19.18%; and the tech-heavy Nasdaq Composite Index returned 26.11%.
Fund Performance
For the 12-month period ended September 30, 2023, Calvert US Large-Cap Core Responsible Index Fund (the Fund) returned 20.08% for Class A shares at net asset value (NAV). The Fund underperformed its primary benchmark, the Russell 1000® Index (the Index), which returned 21.19%; and underperformed its secondary benchmark, the Calvert US Large-Cap Core Responsible Index (the Calvert Index), which returned 20.72% during the period.
The Fund’s underperformance versus the Calvert Index was due to Fund expenses and fees, which the Calvert Index does not incur.
Of the 11 market sectors held by the Fund, all sectors except utilities delivered positive returns during the period. The strongest-performing sectors were energy, information technology (IT), and industrials. The weakest-performing sectors were utilities, consumer staples, and health care.
Detractors from Fund performance versus the Index included stock selections and an underweight position in the communication services sector; stock selections and an overweight position in the financials sector, which struggled under the weight of three of the largest bank failures in U.S. history; and an underweight position in the energy sector, which benefited from rising oil prices during the period.
In the communication services sector, not owning Index component Meta Platforms, Inc. (Meta) -- the social media giant behind Facebook, Instagram, and Messenger -- detracted from returns relative to the Index during the period. Meta’s stock price doubled during the period as advertising revenues rebounded on improved ad targeting, while profit margins exceeded expectations due to more rational spending on longer-term initiatives.
In the financials sector, not owning Index component Berkshire Hathaway, Inc. (Berkshire Hathaway) detracted from Index-relative returns during the period. Berkshire Hathaway, Warren Buffett’s Nebraska-based multinational conglomerate, posted an all-time high for its stock price in September 2023, as its core insurance businesses -- including wholly-owned subsidiary GEICO -- performed strongly, and many of its diversified holdings delivered robust earnings during the period as well.
In contrast, contributors to Fund performance versus the Index included an overweight position in the IT sector, the best-performing sector within the Index during the period; an underweight position in the real estate sector, which delivered negative returns as property sales were hampered by rising mortgage rates and companies cut back on office space after the pandemic; and stock selections in the industrials sector.
In the IT sector, Index-relative performance benefited from the Fund’s overweight position in semiconductor firm NVIDIA Corp. (NVIDIA), whose share price more than doubled during the period. NVIDIA’s strong stock performance was driven by increased demand for its high-end graphics processing units in the burgeoning artificial intelligence, or AI, industry.
See Endnotes and Additional Disclosures in this report.
Past performance is no guarantee of future results. Returns are historical and are calculated by determining the percentage change in net asset value (NAV) or offering price (as applicable) with all distributions reinvested. Furthermore, returns do not reflect the deduction of taxes that shareholders may have to pay on Fund distributions or upon the redemption of Fund shares. Investment return and principal value will fluctuate so that shares, when redeemed, may be worth more or less than their original cost. Performance for periods less than or equal to one year is cumulative. Performance is for the stated time period only; due to market volatility, current Fund performance may be lower or higher than the quoted return. For performance as of the most recent month-end, please refer to www.calvert.com.
Calvert
US Large-Cap Core Responsible Index Fund
September 30, 2023
Performance
Portfolio Manager(s) Thomas C. Seto of Calvert Research and Management
| % Average Annual Total Returns1,2 | Class
Inception Date | Performance
Inception Date | One Year | Five Years | Ten Years |
| Class A at NAV | 06/30/2000 | 06/30/2000 | 20.08% | 9.62% | 11.46% |
| Class A with 4.75% Maximum Sales Charge | — | — | 14.38 | 8.55 | 10.93 |
| Class C at NAV | 06/30/2000 | 06/30/2000 | 19.22 | 8.80 | 10.79 |
| Class C with 1% Maximum Deferred Sales Charge | — | — | 18.22 | 8.80 | 10.79 |
| Class I at NAV | 06/30/2000 | 06/30/2000 | 20.42 | 9.90 | 11.84 |
| Class R6 at NAV | 10/03/2017 | 06/30/2000 | 20.46 | 9.95 | 11.86 |
|
| Russell 1000® Index | — | — | 21.19% | 9.62% | 11.62% |
| Calvert US Large-Cap Core Responsible Index | — | — | 20.72 | 10.22 | 12.16 |
| % Total Annual Operating Expense Ratios3 | Class A | Class C | Class I | Class R6 |
| Gross | 0.59% | 1.34% | 0.34% | 0.29% |
| Net | 0.49 | 1.24 | 0.24 | 0.19 |
Growth of $10,000
This graph shows the change in value of a hypothetical investment of $10,000 in Class A of the Fund for the period indicated. For comparison, the same investment is shown in the indicated index.
| Growth of Investment2 | Amount Invested | Period Beginning | At NAV | With Maximum Sales Charge |
| Class C | $10,000 | 09/30/2013 | $27,878 | N.A. |
| Class I, at minimum investment | $1,000,000 | 09/30/2013 | $3,063,435 | N.A. |
| Class R6, at minimum investment | $5,000,000 | 09/30/2013 | $15,343,972 | N.A. |
See Endnotes and Additional Disclosures in this report.
Past performance is no guarantee of future results. Returns are historical and are calculated by determining the percentage change in net asset value (NAV) or offering price (as applicable) with all distributions reinvested. Furthermore, returns do not reflect the deduction of taxes that shareholders may have to pay on Fund distributions or upon the redemption of Fund shares. Investment return and principal value will fluctuate so that shares, when redeemed, may be worth more or less than their original cost. Performance for periods less than or equal to one year is cumulative. Performance is for the stated time period only; due to market volatility, current Fund performance may be lower or higher than the quoted return. For performance as of the most recent month-end, please refer to www.calvert.com.
Calvert
US Large-Cap Core Responsible Index Fund
September 30, 2023
| Sector Allocation (% of net assets)1 |
| Top 10 Holdings (% of net assets)1 | |
| Apple, Inc. | 7.1% |
| Microsoft Corp. | 6.2 |
| Alphabet, Inc., Class A | 3.9 |
| Amazon.com, Inc. | 3.1 |
| NVIDIA Corp. | 2.8 |
| Tesla, Inc. | 1.9 |
| Eli Lilly & Co. | 1.3 |
| JPMorgan Chase & Co. | 1.2 |
| Visa, Inc., Class A | 1.1 |
| Broadcom, Inc. | 1.0 |
| Total | 29.6% |
Footnotes:
| 1 | Excludes cash and cash equivalents. |
Calvert
US Large-Cap Core Responsible Index Fund
September 30, 2023
Endnotes and Additional Disclosures
| † | The views expressed in this report are those of the portfolio manager(s) and are current only through the date stated at the top of this page. These views are subject to change at any time based upon market or other conditions, and Calvert and the Fund(s) disclaim any responsibility to update such views. These views may not be relied upon as investment advice and, because investment decisions are based on many factors, may not be relied upon as an indication of trading intent on behalf of any Calvert fund. This commentary may contain statements that are not historical facts, referred to as “forward-looking statements.” The Fund’s actual future results may differ significantly from those stated in any forward-looking statement, depending on factors such as changes in securities or financial markets or general economic conditions, the volume of sales and purchases of Fund shares, the continuation of investment advisory, administrative and service contracts, and other risks discussed from time to time in the Fund’s filings with the Securities and Exchange Commission. |
| | |
| 1 | Russell 1000® Index is an unmanaged index of U.S. large-cap stocks. Calvert US Large-Cap Core Responsible Index (the “Calvert Index”) is composed of common stocks of large companies that operate their businesses in a manner consistent with the Calvert Principles for Responsible Investment. Large companies are the 1,000 largest publicly traded U.S. companies based on market capitalization, excluding real estate investment trusts and business development companies. The Calvert Principles for Responsible Investment serve as a framework for considering environmental, social and governance factors that may affect investment performance. Stocks are weighted in the Calvert Index based on their float-adjusted market capitalization within the relevant sector, subject to certain prescribed limits. Unless otherwise stated, index returns do not reflect the effect of any applicable sales charges, commissions, expenses, taxes or leverage, as applicable. It is not possible to invest directly in an index. |
| 2 | Total Returns at NAV do not include applicable sales charges. If sales charges were deducted, the returns would be lower. Total Returns shown with maximum sales charge reflect the stated maximum sales charge. Unless otherwise stated, performance does not reflect the deduction of taxes on Fund distributions or redemptions of Fund shares.Performance prior to the inception date of a class may be linked to the performance of an older class of the Fund. This linked performance is adjusted for any applicable sales charge, but is not adjusted for class expense differences. If adjusted for such differences, the performance would be different. The performance of Class R6 is linked to Class I. Performance presented in the Financial Highlights included in the financial statements is not linked. |
| | Effective November 5, 2020, Class C shares automatically convert to Class A shares eight years after purchase. The average annual total returns listed for Class C reflect conversion to Class A shares after eight years. Prior to November 5, 2020, Class C shares automatically converted to Class A shares ten years after purchase.Calvert Research and Management became the investment adviser to the Fund on December 31, 2016. Performance reflected prior to such date is that of the Fund’s former investment adviser. |
| 3 | Source: Fund prospectus. Net expense ratios reflect a contractual expense reimbursement that continues through 1/31/24. The expense ratios for the current reporting period can be found in the Financial Highlights section of this report. Performance reflects expenses waived and/or reimbursed, if applicable. Without such waivers and/or reimbursements, performance would have been lower. |
| Additional Information |
| | S&P 500® Index is an unmanaged index of large-cap stocks commonly used as a measure of U.S. stock market performance. Dow Jones Industrial Average® is a price-weighted average of 30 blue-chip stocks that are generally the leaders in their industry. S&P Dow Jones Indices are a product of S&P Dow Jones Indices LLC (“S&P DJI”) and have been licensed for use. S&P® and S&P 500® are registered trademarks of S&P DJI; Dow Jones® is a registered trademark of Dow Jones Trademark Holdings LLC (“Dow Jones”); S&P DJI, Dow Jones and their respective affiliates do not sponsor, endorse, sell or promote the Fund, will not have any liability with respect thereto and do not have any liability for any errors, omissions, or interruptions of the S&P Dow Jones Indices. Nasdaq Composite Index is a market capitalization-weighted index of all domestic and international securities listed on Nasdaq. Source: Nasdaq, Inc. The information is provided by Nasdaq (with its affiliates, are referred to as the “Corporations”) and Nasdaq’s third party licensors on an “as is” basis and the Corporations make no guarantees and bear no liability of any kind with respect to the information or the Fund. |
Calvert
US Large-Cap Core Responsible Index Fund
September 30, 2023
Example
As a Fund shareholder, you incur two types of costs: (1) transaction costs, including sales charges (loads) on purchases; and (2) ongoing costs, including management fees; distribution and/or service fees; and other Fund expenses. This Example is intended to help you understand your ongoing costs (in dollars) of Fund investing and to compare these costs with the ongoing costs of investing in other mutual funds. The Example is based on an investment of $1,000 invested at the beginning of the period and held for the entire period (April 1, 2023 to September 30, 2023).
Actual Expenses
The first section of the table below provides information about actual account values and actual expenses. You may use the information in this section, together with the amount you invested, to estimate the expenses that you paid over the period. Simply divide your account value by $1,000 (for example, an $8,600 account value divided by $1,000 = 8.6), then multiply the result by the number in the first section under the heading entitled “Expenses Paid During Period” to estimate the expenses you paid on your account during this period.
Hypothetical Example for Comparison Purposes
The second section of the table below provides information about hypothetical account values and hypothetical expenses based on the actual Fund expense ratio and an assumed rate of return of 5% per year (before expenses), which is not the actual Fund return. The hypothetical account values and expenses may not be used to estimate the actual ending account balance or expenses you paid for the period. You may use this information to compare the ongoing costs of investing in the Fund and other funds. To do so, compare this 5% hypothetical example with the 5% hypothetical examples that appear in the shareholder reports of the other funds.
Please note that the expenses shown in the table are meant to highlight your ongoing costs only and do not reflect any transactional costs, such as sales charges (loads). Therefore, the second section of the table is useful in comparing ongoing costs only, and will not help you determine the relative total costs of owning different funds. In addition, if these transactional costs were included, your costs would be higher.
| | Beginning
Account Value
(4/1/23) | Ending
Account Value
(9/30/23) | Expenses Paid
During Period*
(4/1/23 – 9/30/23) | Annualized
Expense
Ratio |
| Actual | | | | |
| Class A | $1,000.00 | $1,041.60 | $2.51 ** | 0.49% |
| Class C | $1,000.00 | $1,038.00 | $6.34 ** | 1.24% |
| Class I | $1,000.00 | $1,043.00 | $1.23 ** | 0.24% |
| Class R6 | $1,000.00 | $1,043.30 | $0.97 ** | 0.19% |
| Hypothetical | | | | |
| (5% return per year before expenses) | | | | |
| Class A | $1,000.00 | $1,022.61 | $2.48 ** | 0.49% |
| Class C | $1,000.00 | $1,018.85 | $6.28 ** | 1.24% |
| Class I | $1,000.00 | $1,023.87 | $1.22 ** | 0.24% |
| Class R6 | $1,000.00 | $1,024.12 | $0.96 ** | 0.19% |
| * | Expenses are equal to the Fund's annualized expense ratio for the indicated Class, multiplied by the average account value over the period, multiplied by 183/365 (to reflect the one-half year period). The Example assumes that the $1,000 was invested at the net asset value per share determined at the close of business on March 31, 2023. |
| ** | Absent a waiver and/or reimbursement of expenses by affiliate(s), expenses would be higher. |
Calvert
US Large-Cap Core Responsible Index Fund
September 30, 2023
| Security | Shares | Value |
| Aerospace & Defense — 0.2% | |
| Axon Enterprise, Inc.(1) | | 13,683 | $ 2,722,780 |
| Curtiss-Wright Corp. | | 6,678 | 1,306,417 |
| HEICO Corp. | | 7,303 | 1,182,575 |
| Hexcel Corp. | | 14,542 | 947,266 |
| Woodward, Inc. | | 11,468 | 1,425,014 |
| | | | $ 7,584,052 |
| Air Freight & Logistics — 0.7% | |
| C.H. Robinson Worldwide, Inc. | | 18,195 | $ 1,567,135 |
| Expeditors International of Washington, Inc. | | 23,113 | 2,649,443 |
| FedEx Corp. | | 32,067 | 8,495,190 |
| GXO Logistics, Inc.(1) | | 14,264 | 836,584 |
| United Parcel Service, Inc., Class B | | 102,344 | 15,952,359 |
| | | | $ 29,500,711 |
| Automobile Components — 0.2% | |
| Aptiv PLC(1) | | 37,983 | $ 3,744,744 |
| Autoliv, Inc. | | 10,909 | 1,052,500 |
| BorgWarner, Inc. | | 34,215 | 1,381,260 |
| Lear Corp. | | 8,990 | 1,206,458 |
| Visteon Corp.(1) | | 3,913 | 540,268 |
| | | | $ 7,925,230 |
| Automobiles — 2.3% | |
| Ford Motor Co. | | 557,753 | $ 6,927,292 |
| General Motors Co. | | 193,749 | 6,387,905 |
| Harley-Davidson, Inc. | | 17,804 | 588,600 |
| Rivian Automotive, Inc., Class A(1)(2) | | 90,919 | 2,207,513 |
| Tesla, Inc.(1) | | 331,017 | 82,827,074 |
| Thor Industries, Inc. | | 6,696 | 636,990 |
| | | | $ 99,575,374 |
| Banks — 4.0% | |
| Bank of America Corp. | | 994,300 | $ 27,223,934 |
| Bank OZK | | 23,188 | 859,579 |
| BOK Financial Corp. | | 2,833 | 226,583 |
| Citigroup, Inc. | | 291,090 | 11,972,532 |
| Citizens Financial Group, Inc. | | 74,149 | 1,987,193 |
| Columbia Banking System, Inc. | | 30,723 | 623,677 |
| Comerica, Inc. | | 21,543 | 895,112 |
| Commerce Bancshares, Inc. | | 19,902 | 954,898 |
| Cullen/Frost Bankers, Inc. | | 10,212 | 931,436 |
| East West Bancorp, Inc. | | 19,690 | 1,037,860 |
| F.N.B. Corp. | | 52,079 | 561,932 |
| Fifth Third Bancorp | | 108,172 | 2,739,997 |
| First Citizens Bancshares, Inc., Class A | | 1,638 | 2,260,604 |
| First Financial Bankshares, Inc. | | 16,059 | 403,402 |
| First Horizon Corp. | | 80,133 | 883,066 |
| Security | Shares | Value |
| Banks (continued) | |
| Home BancShares, Inc. | | 22,755 | $ 476,490 |
| Huntington Bancshares, Inc. | | 219,142 | 2,279,077 |
| JPMorgan Chase & Co. | | 367,381 | 53,277,593 |
| KeyCorp | | 139,902 | 1,505,345 |
| M&T Bank Corp. | | 25,239 | 3,191,472 |
| New York Community Bancorp, Inc. | | 101,364 | 1,149,468 |
| Old National Bancorp | | 43,636 | 634,467 |
| Pinnacle Financial Partners, Inc. | | 9,343 | 626,355 |
| PNC Financial Services Group, Inc. (The) | | 60,971 | 7,485,410 |
| Popular, Inc. | | 9,320 | 587,253 |
| Prosperity Bancshares, Inc. | | 12,231 | 667,568 |
| Regions Financial Corp. | | 142,291 | 2,447,405 |
| SouthState Corp. | | 12,620 | 850,083 |
| Synovus Financial Corp. | | 25,700 | 714,460 |
| Truist Financial Corp. | | 200,620 | 5,739,738 |
| U.S. Bancorp | | 230,655 | 7,625,454 |
| United Bankshares, Inc. | | 15,496 | 427,535 |
| Valley National Bancorp | | 80,051 | 685,237 |
| Webster Financial Corp. | | 24,164 | 974,051 |
| Wells Fargo & Co. | | 561,261 | 22,933,124 |
| Western Alliance Bancorp | | 14,818 | 681,183 |
| Wintrust Financial Corp. | | 10,651 | 804,150 |
| Zions Bancorp N.A. | | 19,408 | 677,145 |
| | | | $ 170,001,868 |
| Beverages — 1.8% | |
| Celsius Holdings, Inc.(1) | | 7,929 | $ 1,360,616 |
| Coca-Cola Co. (The) | | 538,838 | 30,164,151 |
| Coca-Cola Consolidated, Inc. | | 885 | 563,143 |
| Keurig Dr Pepper, Inc. | | 173,213 | 5,468,335 |
| Monster Beverage Corp.(1) | | 132,173 | 6,998,560 |
| PepsiCo, Inc. | | 189,942 | 32,183,773 |
| | | | $ 76,738,578 |
| Biotechnology — 3.3% | |
| AbbVie, Inc. | | 241,392 | $ 35,981,892 |
| ACADIA Pharmaceuticals, Inc.(1) | | 18,430 | 384,081 |
| Alkermes PLC(1) | | 25,933 | 726,383 |
| Alnylam Pharmaceuticals, Inc.(1) | | 19,078 | 3,378,714 |
| Amgen, Inc. | | 82,077 | 22,059,015 |
| Apellis Pharmaceuticals, Inc.(1) | | 14,184 | 539,559 |
| Arrowhead Pharmaceuticals, Inc.(1) | | 15,880 | 426,696 |
| Biogen, Inc.(1) | | 21,622 | 5,557,070 |
| BioMarin Pharmaceutical, Inc.(1) | | 30,109 | 2,664,044 |
| Blueprint Medicines Corp.(1) | | 9,135 | 458,760 |
| Denali Therapeutics, Inc.(1) | | 16,510 | 340,601 |
| Exact Sciences Corp.(1) | | 25,895 | 1,766,557 |
| Exelixis, Inc.(1) | | 40,744 | 890,256 |
| Gilead Sciences, Inc. | | 196,514 | 14,726,759 |
| Halozyme Therapeutics, Inc.(1) | | 25,431 | 971,464 |
| Horizon Therapeutics PLC(1) | | 38,524 | 4,456,842 |
7
See Notes to Financial Statements.
Calvert
US Large-Cap Core Responsible Index Fund
September 30, 2023
Schedule of Investments — continued
| Security | Shares | Value |
| Biotechnology (continued) | |
| Incyte Corp.(1) | | 31,597 | $ 1,825,359 |
| Ionis Pharmaceuticals, Inc.(1) | | 19,122 | 867,374 |
| Moderna, Inc.(1) | | 49,941 | 5,158,406 |
| Neurocrine Biosciences, Inc.(1) | | 16,355 | 1,839,937 |
| Regeneron Pharmaceuticals, Inc.(1) | | 16,428 | 13,519,587 |
| Sarepta Therapeutics, Inc.(1) | | 12,073 | 1,463,489 |
| Seagen, Inc.(1) | | 20,074 | 4,258,699 |
| United Therapeutics Corp.(1) | | 7,777 | 1,756,591 |
| Vertex Pharmaceuticals, Inc.(1) | | 40,046 | 13,925,596 |
| | | | $ 139,943,731 |
| Broadline Retail — 3.2% | |
| Amazon.com, Inc.(1) | | 1,046,745 | $ 133,062,224 |
| eBay, Inc. | | 68,222 | 3,007,908 |
| Etsy, Inc.(1) | | 16,765 | 1,082,684 |
| Macy's, Inc. | | 31,445 | 365,076 |
| | | | $ 137,517,892 |
| Building Products — 1.1% | |
| A.O. Smith Corp. | | 24,812 | $ 1,640,817 |
| AAON, Inc. | | 13,299 | 756,314 |
| Advanced Drainage Systems, Inc. | | 13,343 | 1,518,834 |
| Allegion PLC | | 18,093 | 1,885,291 |
| AZEK Co., Inc. (The)(1) | | 17,500 | 520,450 |
| Carlisle Cos., Inc. | | 17,468 | 4,528,754 |
| Carrier Global Corp. | | 169,410 | 9,351,432 |
| Fortune Brands Innovations, Inc. | | 17,279 | 1,074,063 |
| Johnson Controls International PLC | | 131,013 | 6,971,202 |
| Lennox International, Inc. | | 6,566 | 2,458,573 |
| Masco Corp. | | 23,519 | 1,257,090 |
| Owens Corning | | 30,677 | 4,184,649 |
| Simpson Manufacturing Co., Inc. | | 8,648 | 1,295,557 |
| Trane Technologies PLC | | 44,165 | 8,961,520 |
| Trex Co., Inc.(1) | | 14,931 | 920,197 |
| UFP Industries, Inc. | | 5,762 | 590,029 |
| Zurn Elkay Water Solutions Corp., Class C | | 20,000 | 560,400 |
| | | | $ 48,475,172 |
| Capital Markets — 3.8% | |
| Affiliated Managers Group, Inc. | | 5,309 | $ 691,975 |
| Ameriprise Financial, Inc. | | 15,386 | 5,072,456 |
| Ares Management Corp., Class A | | 21,755 | 2,237,937 |
| Bank of New York Mellon Corp. (The) | | 114,758 | 4,894,429 |
| BlackRock, Inc. | | 22,187 | 14,343,674 |
| Blackstone, Inc. | | 105,633 | 11,317,520 |
| Blue Owl Capital, Inc. | | 64,997 | 842,361 |
| Carlyle Group, Inc. (The) | | 24,373 | 735,090 |
| Cboe Global Markets, Inc. | | 16,484 | 2,574,966 |
| Charles Schwab Corp. (The) | | 227,320 | 12,479,868 |
| CME Group, Inc. | | 54,362 | 10,884,360 |
| Coinbase Global, Inc., Class A(1) | | 23,976 | 1,800,118 |
| Security | Shares | Value |
| Capital Markets (continued) | |
| Evercore, Inc., Class A | | 3,812 | $ 525,599 |
| FactSet Research Systems, Inc. | | 5,632 | 2,462,648 |
| Franklin Resources, Inc. | | 47,893 | 1,177,210 |
| Goldman Sachs Group, Inc. (The) | | 49,651 | 16,065,574 |
| Hamilton Lane, Inc., Class A | | 6,000 | 542,640 |
| Houlihan Lokey, Inc. | | 5,612 | 601,157 |
| Interactive Brokers Group, Inc., Class A | | 14,226 | 1,231,402 |
| Intercontinental Exchange, Inc. | | 87,684 | 9,646,994 |
| Invesco, Ltd. | | 58,955 | 856,027 |
| Jefferies Financial Group, Inc. | | 29,880 | 1,094,504 |
| KKR & Co., Inc. | | 99,580 | 6,134,128 |
| LPL Financial Holdings, Inc. | | 10,812 | 2,569,472 |
| MarketAxess Holdings, Inc. | | 4,905 | 1,047,904 |
| Moody's Corp. | | 23,533 | 7,440,429 |
| Morningstar, Inc. | | 3,966 | 928,996 |
| MSCI, Inc. | | 10,686 | 5,482,773 |
| Nasdaq, Inc. | | 48,816 | 2,371,969 |
| Northern Trust Corp. | | 33,282 | 2,312,433 |
| Raymond James Financial, Inc. | | 29,392 | 2,951,838 |
| S&P Global, Inc. | | 45,631 | 16,674,024 |
| SEI Investments Co. | | 14,768 | 889,477 |
| State Street Corp. | | 49,937 | 3,343,781 |
| Stifel Financial Corp. | | 17,068 | 1,048,658 |
| T. Rowe Price Group, Inc. | | 35,101 | 3,681,042 |
| Tradeweb Markets, Inc., Class A | | 17,457 | 1,400,051 |
| | | | $ 160,355,484 |
| Chemicals — 1.3% | |
| Air Products & Chemicals, Inc. | | 42,371 | $ 12,007,941 |
| Ashland, Inc. | | 9,807 | 801,036 |
| Axalta Coating Systems, Ltd.(1) | | 50,541 | 1,359,553 |
| Balchem Corp. | | 6,341 | 786,538 |
| Cabot Corp. | | 11,242 | 778,733 |
| Celanese Corp. | | 20,318 | 2,550,315 |
| Eastman Chemical Co. | | 24,642 | 1,890,534 |
| Ecolab, Inc. | | 50,318 | 8,523,869 |
| Element Solutions, Inc. | | 46,654 | 914,885 |
| FMC Corp. | | 23,761 | 1,591,274 |
| Huntsman Corp. | | 31,548 | 769,771 |
| International Flavors & Fragrances, Inc. | | 51,188 | 3,489,486 |
| Livent Corp.(1) | | 32,336 | 595,306 |
| Mosaic Co. (The) | | 60,550 | 2,155,580 |
| PPG Industries, Inc. | | 47,521 | 6,168,226 |
| Sherwin-Williams Co. (The) | | 45,910 | 11,709,346 |
| | | | $ 56,092,393 |
| Commercial Services & Supplies — 0.8% | |
| Casella Waste Systems, Inc., Class A(1) | | 8,277 | $ 631,535 |
| Cintas Corp. | | 10,956 | 5,269,946 |
| Clean Harbors, Inc.(1) | | 8,722 | 1,459,714 |
| Copart, Inc.(1) | | 123,120 | 5,305,241 |
8
See Notes to Financial Statements.
Calvert
US Large-Cap Core Responsible Index Fund
September 30, 2023
Schedule of Investments — continued
| Security | Shares | Value |
| Commercial Services & Supplies (continued) | |
| MSA Safety, Inc. | | 8,207 | $ 1,293,834 |
| Republic Services, Inc. | | 35,740 | 5,093,307 |
| Rollins, Inc. | | 36,225 | 1,352,279 |
| Stericycle, Inc.(1) | | 12,085 | 540,320 |
| Tetra Tech, Inc. | | 7,984 | 1,213,808 |
| Waste Management, Inc. | | 67,378 | 10,271,102 |
| | | | $ 32,431,086 |
| Communications Equipment — 1.0% | |
| Arista Networks, Inc.(1) | | 29,864 | $ 5,492,886 |
| Ciena Corp.(1) | | 16,458 | 777,805 |
| Cisco Systems, Inc. | | 515,589 | 27,718,065 |
| F5, Inc.(1) | | 8,244 | 1,328,438 |
| Juniper Networks, Inc. | | 37,122 | 1,031,620 |
| Lumentum Holdings, Inc.(1) | | 9,562 | 432,011 |
| Motorola Solutions, Inc. | | 20,924 | 5,696,350 |
| Viasat, Inc.(1)(2) | | 12,500 | 230,750 |
| | | | $ 42,707,925 |
| Construction & Engineering — 0.3% | |
| AECOM | | 24,033 | $ 1,995,700 |
| Comfort Systems USA, Inc. | | 5,777 | 984,459 |
| EMCOR Group, Inc. | | 7,120 | 1,497,977 |
| MasTec, Inc.(1) | | 10,386 | 747,480 |
| Quanta Services, Inc. | | 24,700 | 4,620,629 |
| Valmont Industries, Inc. | | 3,406 | 818,155 |
| WillScot Mobile Mini Holdings Corp.(1) | | 34,896 | 1,451,325 |
| | | | $ 12,115,725 |
| Construction Materials — 0.2% | |
| Summit Materials, Inc., Class A(1) | | 38,461 | $ 1,197,676 |
| Vulcan Materials Co. | | 44,876 | 9,065,849 |
| | | | $ 10,263,525 |
| Consumer Finance — 0.7% | |
| Ally Financial, Inc. | | 42,829 | $ 1,142,678 |
| American Express Co. | | 90,426 | 13,490,655 |
| Capital One Financial Corp. | | 57,446 | 5,575,134 |
| Credit Acceptance Corp.(1) | | 584 | 268,710 |
| Discover Financial Services | | 37,889 | 3,282,324 |
| FirstCash Holdings, Inc. | | 5,630 | 565,139 |
| OneMain Holdings, Inc. | | 16,018 | 642,162 |
| SLM Corp. | | 22,631 | 308,234 |
| SoFi Technologies, Inc.(1) | | 118,404 | 946,048 |
| Synchrony Financial | | 58,171 | 1,778,288 |
| | | | $ 27,999,372 |
| Consumer Staples Distribution & Retail — 2.1% | |
| Albertsons Cos., Inc., Class A | | 72,610 | $ 1,651,877 |
| BJ's Wholesale Club Holdings, Inc.(1) | | 16,609 | 1,185,384 |
| Security | Shares | Value |
| Consumer Staples Distribution & Retail (continued) | |
| Casey's General Stores, Inc. | | 6,806 | $ 1,847,965 |
| Costco Wholesale Corp. | | 53,359 | 30,145,701 |
| Dollar General Corp. | | 27,931 | 2,955,100 |
| Dollar Tree, Inc.(1) | | 27,373 | 2,913,856 |
| Kroger Co. (The) | | 117,787 | 5,270,968 |
| Performance Food Group Co.(1) | | 25,075 | 1,475,915 |
| Sprouts Farmers Market, Inc.(1) | | 17,485 | 748,358 |
| Sysco Corp. | | 87,603 | 5,786,178 |
| Target Corp. | | 55,974 | 6,189,045 |
| US Foods Holding Corp.(1) | | 40,557 | 1,610,113 |
| Walmart, Inc. | | 172,587 | 27,601,839 |
| | | | $ 89,382,299 |
| Containers & Packaging — 0.5% | |
| AptarGroup, Inc. | | 13,340 | $ 1,668,034 |
| Avery Dennison Corp. | | 15,107 | 2,759,596 |
| Ball Corp. | | 65,196 | 3,245,457 |
| Berry Global Group, Inc. | | 22,280 | 1,379,355 |
| Crown Holdings, Inc. | | 23,626 | 2,090,428 |
| Graphic Packaging Holding Co. | | 54,728 | 1,219,340 |
| Packaging Corp. of America | | 17,531 | 2,691,885 |
| Sealed Air Corp. | | 29,677 | 975,186 |
| Silgan Holdings, Inc. | | 20,778 | 895,739 |
| Sonoco Products Co. | | 16,517 | 897,699 |
| WestRock Co. | | 51,235 | 1,834,213 |
| | | | $ 19,656,932 |
| Distributors — 0.1% | |
| Genuine Parts Co. | | 18,010 | $ 2,600,284 |
| LKQ Corp. | | 29,890 | 1,479,854 |
| Pool Corp. | | 4,776 | 1,700,733 |
| | | | $ 5,780,871 |
| Diversified Consumer Services — 0.1% | |
| Bright Horizons Family Solutions, Inc.(1) | | 8,169 | $ 665,447 |
| Duolingo, Inc.(1) | | 3,399 | 563,792 |
| H&R Block, Inc. | | 23,553 | 1,014,192 |
| Service Corp. International | | 19,420 | 1,109,659 |
| | | | $ 3,353,090 |
| Diversified Telecommunication Services — 0.7% | |
| AT&T, Inc. | | 923,111 | $ 13,865,127 |
| Iridium Communications, Inc. | | 16,712 | 760,229 |
| Verizon Communications, Inc. | | 532,488 | 17,257,936 |
| | | | $ 31,883,292 |
| Electric Utilities — 1.1% | |
| Alliant Energy Corp. | | 43,511 | $ 2,108,108 |
| Avangrid, Inc. | | 8,163 | 246,278 |
| Constellation Energy Corp. | | 51,397 | 5,606,385 |
9
See Notes to Financial Statements.
Calvert
US Large-Cap Core Responsible Index Fund
September 30, 2023
Schedule of Investments — continued
| Security | Shares | Value |
| Electric Utilities (continued) | |
| Evergy, Inc. | | 39,292 | $ 1,992,104 |
| Eversource Energy | | 60,266 | 3,504,468 |
| Exelon Corp. | | 159,392 | 6,023,424 |
| IDACORP, Inc. | | 8,719 | 816,534 |
| NextEra Energy, Inc. | | 324,089 | 18,567,059 |
| NRG Energy, Inc. | | 38,729 | 1,491,841 |
| PNM Resources, Inc. | | 14,699 | 655,722 |
| Portland General Electric Co. | | 12,060 | 488,189 |
| Xcel Energy, Inc. | | 87,933 | 5,031,526 |
| | | | $ 46,531,638 |
| Electrical Equipment — 1.2% | |
| Acuity Brands, Inc. | | 6,339 | $ 1,079,595 |
| AMETEK, Inc. | | 46,434 | 6,861,088 |
| Atkore, Inc.(1) | | 8,944 | 1,334,355 |
| Eaton Corp. PLC | | 73,294 | 15,632,144 |
| Emerson Electric Co. | | 113,177 | 10,929,503 |
| EnerSys | | 5,057 | 478,746 |
| Generac Holdings, Inc.(1) | | 12,162 | 1,325,172 |
| Hubbell, Inc. | | 10,910 | 3,419,303 |
| nVent Electric PLC | | 28,691 | 1,520,336 |
| Plug Power, Inc.(1)(2) | | 64,158 | 487,601 |
| Regal Rexnord Corp. | | 12,312 | 1,759,139 |
| Rockwell Automation, Inc. | | 23,241 | 6,643,905 |
| Sensata Technologies Holding PLC | | 31,243 | 1,181,610 |
| Sunrun, Inc.(1)(2) | | 29,423 | 369,553 |
| | | | $ 53,022,050 |
| Electronic Equipment, Instruments & Components — 1.0% | |
| Advanced Energy Industries, Inc. | | 7,355 | $ 758,448 |
| Amphenol Corp., Class A | | 114,983 | 9,657,422 |
| Arrow Electronics, Inc.(1) | | 6,623 | 829,465 |
| Avnet, Inc. | | 12,127 | 584,400 |
| Badger Meter, Inc. | | 5,790 | 833,007 |
| Belden, Inc. | | 8,198 | 791,517 |
| CDW Corp. | | 17,531 | 3,537,055 |
| Cognex Corp. | | 35,063 | 1,488,074 |
| Coherent Corp.(1) | | 25,014 | 816,457 |
| Corning, Inc. | | 93,221 | 2,840,444 |
| Insight Enterprises, Inc.(1) | | 3,940 | 573,270 |
| IPG Photonics Corp.(1) | | 3,804 | 386,258 |
| Jabil, Inc. | | 15,935 | 2,021,992 |
| Keysight Technologies, Inc.(1) | | 35,745 | 4,729,421 |
| Littelfuse, Inc. | | 4,405 | 1,089,445 |
| National Instruments Corp. | | 13,065 | 778,935 |
| Novanta, Inc.(1) | | 7,626 | 1,093,873 |
| TD SYNNEX Corp. | | 3,656 | 365,088 |
| Teledyne Technologies, Inc.(1) | | 9,519 | 3,889,273 |
| Trimble, Inc.(1) | | 51,466 | 2,771,959 |
| Vishay Intertechnology, Inc. | | 17,500 | 432,600 |
| Security | Shares | Value |
| Electronic Equipment, Instruments & Components (continued) | |
| Zebra Technologies Corp., Class A(1) | | 6,550 | $ 1,549,271 |
| | | | $ 41,817,674 |
| Energy Equipment & Services — 0.2% | |
| Baker Hughes Co. | | 297,906 | $ 10,522,040 |
| | | | $ 10,522,040 |
| Entertainment — 1.4% | |
| AMC Entertainment Holdings, Inc., Class A(1) | | 8,427 | $ 67,332 |
| Atlanta Braves Holdings, Inc., Class C(1) | | 920 | 32,872 |
| Electronic Arts, Inc. | | 29,931 | 3,603,692 |
| Liberty Media Corp.-Liberty Formula One, Class A(1) | | 31,799 | 1,797,915 |
| Liberty Media Corp.-Liberty Live, Class A(1) | | 1,360 | 43,411 |
| Live Nation Entertainment, Inc.(1) | | 21,315 | 1,769,998 |
| Madison Square Garden Sports Corp. | | 3,500 | 617,050 |
| Netflix, Inc.(1) | | 55,486 | 20,951,514 |
| ROBLOX Corp., Class A(1)(2) | | 53,154 | 1,539,340 |
| Roku, Inc.(1) | | 15,348 | 1,083,415 |
| Take-Two Interactive Software, Inc.(1) | | 20,124 | 2,825,208 |
| Walt Disney Co. (The)(1) | | 262,712 | 21,292,808 |
| Warner Bros. Discovery, Inc.(1) | | 319,939 | 3,474,537 |
| Warner Music Group Corp., Class A | | 19,984 | 627,498 |
| | | | $ 59,726,590 |
| Financial Services — 2.9% | |
| Affirm Holdings, Inc.(1) | | 25,669 | $ 545,980 |
| Block, Inc., Class A(1) | | 68,304 | 3,023,135 |
| Equitable Holdings, Inc. | | 50,312 | 1,428,358 |
| Essent Group, Ltd. | | 16,779 | 793,479 |
| Euronet Worldwide, Inc.(1) | | 7,279 | 577,807 |
| Fidelity National Information Services, Inc. | | 74,819 | 4,135,246 |
| Fiserv, Inc.(1) | | 79,606 | 8,992,294 |
| Jack Henry & Associates, Inc. | | 8,677 | 1,311,442 |
| Mastercard, Inc., Class A | | 107,599 | 42,599,520 |
| MGIC Investment Corp. | | 43,154 | 720,240 |
| PayPal Holdings, Inc.(1) | | 140,100 | 8,190,246 |
| Radian Group, Inc. | | 23,336 | 585,967 |
| Shift4 Payments, Inc., Class A(1) | | 7,065 | 391,189 |
| Toast, Inc., Class A(1)(2) | | 31,241 | 585,144 |
| Visa, Inc., Class A | | 206,733 | 47,550,657 |
| Voya Financial, Inc. | | 12,965 | 861,524 |
| Western Union Co. (The) | | 50,371 | 663,890 |
| WEX, Inc.(1) | | 6,147 | 1,156,189 |
| | | | $ 124,112,307 |
| Food Products — 1.3% | |
| Bunge, Ltd. | | 24,521 | $ 2,654,398 |
| Campbell Soup Co. | | 35,599 | 1,462,407 |
| Conagra Brands, Inc. | | 87,883 | 2,409,752 |
| Darling Ingredients, Inc.(1) | | 28,014 | 1,462,331 |
10
See Notes to Financial Statements.
Calvert
US Large-Cap Core Responsible Index Fund
September 30, 2023
Schedule of Investments — continued
| Security | Shares | Value |
| Food Products (continued) | |
| Flowers Foods, Inc. | | 28,590 | $ 634,126 |
| General Mills, Inc. | | 103,615 | 6,630,324 |
| Hershey Co. (The) | | 24,425 | 4,886,954 |
| Hormel Foods Corp. | | 49,662 | 1,888,646 |
| Ingredion, Inc. | | 9,520 | 936,768 |
| JM Smucker Co. (The) | | 17,585 | 2,161,372 |
| Kellogg Co. | | 46,588 | 2,772,452 |
| Kraft Heinz Co. (The) | | 137,207 | 4,615,643 |
| Lamb Weston Holdings, Inc. | | 23,745 | 2,195,463 |
| Lancaster Colony Corp. | | 3,293 | 543,444 |
| McCormick & Co., Inc. | | 44,925 | 3,398,127 |
| Mondelez International, Inc., Class A | | 232,372 | 16,126,617 |
| Simply Good Foods Co. (The)(1) | | 16,230 | 560,259 |
| | | | $ 55,339,083 |
| Gas Utilities — 0.1% | |
| National Fuel Gas Co. | | 15,220 | $ 790,070 |
| New Jersey Resources Corp. | | 13,596 | 552,405 |
| ONE Gas, Inc. | | 7,344 | 501,448 |
| Southwest Gas Holdings, Inc. | | 11,528 | 696,407 |
| UGI Corp. | | 36,167 | 831,841 |
| | | | $ 3,372,171 |
| Ground Transportation — 1.0% | |
| Avis Budget Group, Inc.(1) | | 3,306 | $ 594,055 |
| J.B. Hunt Transport Services, Inc. | | 12,319 | 2,322,378 |
| Knight-Swift Transportation Holdings, Inc. | | 24,186 | 1,212,928 |
| Landstar System, Inc. | | 4,999 | 884,523 |
| Old Dominion Freight Line, Inc. | | 13,684 | 5,598,672 |
| Ryder System, Inc. | | 6,757 | 722,661 |
| Saia, Inc.(1) | | 3,021 | 1,204,322 |
| Uber Technologies, Inc.(1) | | 244,482 | 11,243,727 |
| Union Pacific Corp. | | 83,887 | 17,081,910 |
| XPO, Inc.(1) | | 14,264 | 1,064,950 |
| | | | $ 41,930,126 |
| Health Care Equipment & Supplies — 3.6% | |
| Abbott Laboratories | | 252,668 | $ 24,470,896 |
| Align Technology, Inc.(1) | | 10,527 | 3,214,104 |
| Baxter International, Inc. | | 82,273 | 3,104,983 |
| Becton Dickinson and Co. | | 44,739 | 11,566,374 |
| Boston Scientific Corp.(1) | | 224,657 | 11,861,890 |
| CONMED Corp. | | 4,682 | 472,180 |
| Cooper Cos., Inc. (The) | | 8,098 | 2,575,245 |
| DENTSPLY SIRONA, Inc. | | 35,033 | 1,196,727 |
| DexCom, Inc.(1) | | 59,576 | 5,558,441 |
| Edwards Lifesciences Corp.(1) | | 95,711 | 6,630,858 |
| Envista Holdings Corp.(1) | | 21,529 | 600,228 |
| GE HealthCare Technologies, Inc. | | 56,126 | 3,818,813 |
| Globus Medical, Inc., Class A(1) | | 12,421 | 616,703 |
| Haemonetics Corp.(1) | | 7,739 | 693,260 |
| Security | Shares | Value |
| Health Care Equipment & Supplies (continued) | |
| Hologic, Inc.(1) | | 39,658 | $ 2,752,265 |
| ICU Medical, Inc.(1) | | 3,229 | 384,283 |
| IDEXX Laboratories, Inc.(1) | | 13,164 | 5,756,222 |
| Inari Medical, Inc.(1) | | 10,000 | 654,000 |
| Inspire Medical Systems, Inc.(1) | | 4,579 | 908,657 |
| Insulet Corp.(1) | | 11,231 | 1,791,232 |
| Intuitive Surgical, Inc.(1) | | 54,456 | 15,916,944 |
| iRhythm Technologies, Inc.(1) | | 4,710 | 443,965 |
| Lantheus Holdings, Inc.(1) | | 10,604 | 736,766 |
| Masimo Corp.(1) | | 8,514 | 746,507 |
| Medtronic PLC | | 205,472 | 16,100,786 |
| Merit Medical Systems, Inc.(1) | | 8,686 | 599,508 |
| Neogen Corp.(1) | | 33,388 | 619,013 |
| Novocure, Ltd.(1) | | 18,792 | 303,491 |
| Penumbra, Inc.(1) | | 5,177 | 1,252,368 |
| QuidelOrtho Corp.(1) | | 7,458 | 544,732 |
| ResMed, Inc. | | 21,700 | 3,208,779 |
| Shockwave Medical, Inc.(1) | | 5,758 | 1,146,418 |
| STERIS PLC | | 14,875 | 3,263,872 |
| Stryker Corp. | | 55,867 | 15,266,775 |
| Teleflex, Inc. | | 7,790 | 1,530,034 |
| Zimmer Biomet Holdings, Inc. | | 32,844 | 3,685,754 |
| | | | $ 153,993,073 |
| Health Care Providers & Services — 1.5% | |
| agilon health, Inc.(1)(2) | | 59,210 | $ 1,051,570 |
| AMN Healthcare Services, Inc.(1) | | 6,399 | 545,067 |
| Centene Corp.(1) | | 81,275 | 5,598,222 |
| Chemed Corp. | | 2,008 | 1,043,558 |
| CVS Health Corp. | | 201,670 | 14,080,599 |
| DaVita, Inc.(1) | | 10,074 | 952,295 |
| Elevance Health, Inc. | | 36,491 | 15,888,911 |
| Encompass Health Corp. | | 12,962 | 870,528 |
| Ensign Group, Inc. (The) | | 8,432 | 783,586 |
| HealthEquity, Inc.(1) | | 11,570 | 845,188 |
| Henry Schein, Inc.(1) | | 23,039 | 1,710,646 |
| Humana, Inc. | | 19,612 | 9,541,630 |
| Laboratory Corp. of America Holdings | | 13,356 | 2,685,224 |
| Molina Healthcare, Inc.(1) | | 8,844 | 2,899,859 |
| Option Care Health, Inc.(1) | | 22,841 | 738,906 |
| Progyny, Inc.(1) | | 11,753 | 399,837 |
| Quest Diagnostics, Inc. | | 18,791 | 2,289,871 |
| R1 RCM, Inc.(1) | | 26,713 | 402,565 |
| Select Medical Holdings Corp. | | 16,154 | 408,212 |
| | | | $ 62,736,274 |
| Health Care Technology — 0.1% | |
| Doximity, Inc., Class A(1) | | 11,619 | $ 246,555 |
| Veeva Systems, Inc., Class A(1) | | 18,981 | 3,861,685 |
| | | | $ 4,108,240 |
11
See Notes to Financial Statements.
Calvert
US Large-Cap Core Responsible Index Fund
September 30, 2023
Schedule of Investments — continued
| Security | Shares | Value |
| Hotels, Restaurants & Leisure — 1.9% | |
| Airbnb, Inc., Class A(1) | | 51,316 | $ 7,041,069 |
| Aramark | | 39,856 | 1,383,003 |
| Booking Holdings, Inc.(1) | | 4,638 | 14,303,360 |
| Chipotle Mexican Grill, Inc.(1) | | 4,822 | 8,833,084 |
| Choice Hotels International, Inc.(2) | | 3,713 | 454,880 |
| Darden Restaurants, Inc. | | 21,645 | 3,099,997 |
| Domino's Pizza, Inc. | | 6,084 | 2,304,558 |
| Expedia Group, Inc.(1) | | 18,923 | 1,950,394 |
| Hilton Grand Vacations, Inc.(1) | | 12,459 | 507,081 |
| Hilton Worldwide Holdings, Inc. | | 37,474 | 5,627,845 |
| Hyatt Hotels Corp., Class A | | 5,006 | 531,037 |
| Marriott International, Inc., Class A | | 35,636 | 7,004,612 |
| Marriott Vacations Worldwide Corp. | | 4,891 | 492,181 |
| Planet Fitness, Inc., Class A(1) | | 12,440 | 611,799 |
| Starbucks Corp. | | 192,760 | 17,593,205 |
| Texas Roadhouse, Inc. | | 13,421 | 1,289,758 |
| Vail Resorts, Inc. | | 6,182 | 1,371,724 |
| Wendy's Co. (The) | | 29,085 | 593,625 |
| Wingstop, Inc. | | 4,983 | 896,143 |
| Wyndham Hotels & Resorts, Inc. | | 11,818 | 821,824 |
| Yum! Brands, Inc. | | 48,350 | 6,040,849 |
| | | | $ 82,752,028 |
| Household Durables — 0.5% | |
| D.R. Horton, Inc. | | 51,518 | $ 5,536,639 |
| KB Home | | 12,921 | 597,984 |
| Leggett & Platt, Inc. | | 15,713 | 399,267 |
| Lennar Corp., Class A | | 41,203 | 4,624,213 |
| Meritage Homes Corp. | | 5,824 | 712,799 |
| Mohawk Industries, Inc.(1) | | 7,595 | 651,727 |
| Newell Brands, Inc. | | 43,520 | 392,986 |
| NVR, Inc.(1) | | 520 | 3,100,916 |
| PulteGroup, Inc. | | 38,852 | 2,876,991 |
| Taylor Morrison Home Corp.(1) | | 17,249 | 734,980 |
| Tempur Sealy International, Inc. | | 15,618 | 676,884 |
| TopBuild Corp.(1) | | 4,652 | 1,170,443 |
| Whirlpool Corp. | | 7,454 | 996,600 |
| | | | $ 22,472,429 |
| Household Products — 1.4% | |
| Church & Dwight Co., Inc. | | 28,787 | $ 2,637,753 |
| Clorox Co. (The) | | 15,502 | 2,031,692 |
| Colgate-Palmolive Co. | | 103,531 | 7,362,089 |
| Kimberly-Clark Corp. | | 40,577 | 4,903,731 |
| Procter & Gamble Co. (The) | | 287,536 | 41,940,001 |
| | | | $ 58,875,266 |
| Independent Power and Renewable Electricity Producers — 0.1% | |
| AES Corp. (The) | | 115,587 | $ 1,756,922 |
| Brookfield Renewable Corp., Class A | | 15,670 | 375,140 |
| Security | Shares | Value |
| Independent Power and Renewable Electricity Producers (continued) | |
| Clearway Energy, Inc., Class C | | 25,206 | $ 533,359 |
| Ormat Technologies, Inc. | | 10,753 | 751,850 |
| | | | $ 3,417,271 |
| Insurance — 2.5% | |
| Aflac, Inc. | | 85,800 | $ 6,585,150 |
| Allstate Corp. (The) | | 40,309 | 4,490,826 |
| American Financial Group, Inc. | | 8,904 | 994,310 |
| American International Group, Inc. | | 113,264 | 6,863,798 |
| Arch Capital Group, Ltd.(1) | | 52,036 | 4,147,790 |
| Assurant, Inc. | | 7,237 | 1,039,088 |
| Axis Capital Holdings, Ltd. | | 11,680 | 658,402 |
| Brown & Brown, Inc. | | 31,972 | 2,232,924 |
| Cincinnati Financial Corp. | | 23,625 | 2,416,601 |
| Enstar Group, Ltd.(1) | | 2,089 | 505,538 |
| Erie Indemnity Co., Class A | | 3,679 | 1,080,853 |
| Everest Group, Ltd. | | 6,034 | 2,242,657 |
| Fidelity National Financial, Inc. | | 39,896 | 1,647,705 |
| First American Financial Corp. | | 12,153 | 686,523 |
| Globe Life, Inc. | | 13,850 | 1,505,911 |
| Hanover Insurance Group, Inc. (The) | | 4,418 | 490,310 |
| Hartford Financial Services Group, Inc. (The) | | 46,087 | 3,268,029 |
| Kinsale Capital Group, Inc. | | 3,254 | 1,347,579 |
| Lincoln National Corp. | | 20,704 | 511,182 |
| Markel Group, Inc.(1) | | 2,001 | 2,946,453 |
| Marsh & McLennan Cos., Inc. | | 75,988 | 14,460,516 |
| MetLife, Inc. | | 96,967 | 6,100,194 |
| Old Republic International Corp. | | 42,947 | 1,156,992 |
| Primerica, Inc. | | 5,736 | 1,112,841 |
| Principal Financial Group, Inc. | | 36,178 | 2,607,348 |
| Progressive Corp. (The) | | 87,630 | 12,206,859 |
| Prudential Financial, Inc. | | 57,523 | 5,458,357 |
| Reinsurance Group of America, Inc. | | 11,341 | 1,646,600 |
| RenaissanceRe Holdings, Ltd. | | 7,066 | 1,398,503 |
| RLI Corp. | | 4,743 | 644,526 |
| Ryan Specialty Holdings, Inc.(1) | | 10,000 | 484,000 |
| Selective Insurance Group, Inc. | | 8,916 | 919,864 |
| Travelers Cos., Inc. (The) | | 35,348 | 5,772,682 |
| Unum Group | | 26,123 | 1,284,990 |
| W.R. Berkley Corp. | | 31,841 | 2,021,585 |
| White Mountains Insurance Group, Ltd. | | 375 | 560,884 |
| Willis Towers Watson PLC | | 16,915 | 3,534,558 |
| | | | $ 107,032,928 |
| Interactive Media & Services — 4.0% | |
| Alphabet, Inc., Class A(1) | | 1,264,795 | $ 165,511,074 |
| IAC, Inc.(1) | | 12,541 | 631,941 |
| Pinterest, Inc., Class A(1) | | 74,626 | 2,017,141 |
| Snap, Inc., Class A(1) | | 139,856 | 1,246,117 |
12
See Notes to Financial Statements.
Calvert
US Large-Cap Core Responsible Index Fund
September 30, 2023
Schedule of Investments — continued
| Security | Shares | Value |
| Interactive Media & Services (continued) | |
| ZoomInfo Technologies, Inc.(1) | | 36,468 | $ 598,075 |
| | | | $ 170,004,348 |
| IT Services — 1.7% | |
| Accenture PLC, Class A | | 84,968 | $ 26,094,522 |
| Akamai Technologies, Inc.(1) | | 21,008 | 2,238,192 |
| Amdocs, Ltd. | | 14,063 | 1,188,183 |
| Cloudflare, Inc., Class A(1) | | 36,158 | 2,279,400 |
| Cognizant Technology Solutions Corp., Class A | | 63,212 | 4,281,981 |
| DXC Technology Co.(1) | | 27,082 | 564,118 |
| EPAM Systems, Inc.(1) | | 7,499 | 1,917,419 |
| Gartner, Inc.(1) | | 10,259 | 3,525,095 |
| International Business Machines Corp. | | 116,315 | 16,318,995 |
| MongoDB, Inc.(1) | | 8,773 | 3,034,230 |
| Okta, Inc.(1) | | 19,582 | 1,596,129 |
| Snowflake, Inc., Class A(1) | | 35,444 | 5,414,780 |
| Twilio, Inc., Class A(1) | | 23,304 | 1,363,983 |
| VeriSign, Inc.(1) | | 12,043 | 2,439,069 |
| | | | $ 72,256,096 |
| Leisure Products — 0.1% | |
| Brunswick Corp. | | 13,999 | $ 1,105,921 |
| Hasbro, Inc. | | 15,358 | 1,015,778 |
| Mattel, Inc.(1) | | 49,315 | 1,086,410 |
| | | | $ 3,208,109 |
| Life Sciences Tools & Services — 2.1% | |
| 10X Genomics, Inc., Class A(1) | | 11,756 | $ 484,935 |
| Agilent Technologies, Inc. | | 46,088 | 5,153,560 |
| Avantor, Inc.(1) | | 94,362 | 1,989,151 |
| Bio-Rad Laboratories, Inc., Class A(1) | | 3,262 | 1,169,264 |
| Bio-Techne Corp. | | 25,248 | 1,718,631 |
| Bruker Corp. | | 18,228 | 1,135,604 |
| Charles River Laboratories International, Inc.(1) | | 7,469 | 1,463,775 |
| Danaher Corp. | | 100,797 | 25,007,736 |
| Fortrea Holdings, Inc.(1) | | 13,356 | 381,848 |
| Illumina, Inc.(1) | | 24,639 | 3,382,442 |
| IQVIA Holdings, Inc.(1) | | 28,656 | 5,638,068 |
| Medpace Holdings, Inc.(1) | | 3,135 | 759,078 |
| Mettler-Toledo International, Inc.(1) | | 3,346 | 3,707,602 |
| Repligen Corp.(1) | | 8,424 | 1,339,500 |
| Revvity, Inc. | | 17,808 | 1,971,346 |
| Thermo Fisher Scientific, Inc. | | 54,513 | 27,592,845 |
| Waters Corp.(1) | | 8,775 | 2,406,193 |
| West Pharmaceutical Services, Inc. | | 11,343 | 4,256,007 |
| | | | $ 89,557,585 |
| Machinery — 3.3% | |
| AGCO Corp. | | 14,149 | $ 1,673,544 |
| Allison Transmission Holdings, Inc. | | 17,917 | 1,058,178 |
| Security | Shares | Value |
| Machinery (continued) | |
| Caterpillar, Inc. | | 80,424 | $ 21,955,752 |
| Chart Industries, Inc.(1)(2) | | 8,366 | 1,414,858 |
| CNH Industrial NV | | 186,891 | 2,261,381 |
| Cummins, Inc. | | 28,197 | 6,441,887 |
| Deere & Co. | | 46,654 | 17,606,287 |
| Donaldson Co., Inc. | | 24,605 | 1,467,442 |
| Dover Corp. | | 27,739 | 3,869,868 |
| Esab Corp. | | 11,201 | 786,534 |
| Flowserve Corp. | | 21,203 | 843,243 |
| Fortive Corp. | | 72,508 | 5,377,193 |
| Franklin Electric Co., Inc. | | 7,879 | 703,043 |
| Graco, Inc. | | 31,923 | 2,326,548 |
| IDEX Corp. | | 16,025 | 3,333,521 |
| Illinois Tool Works, Inc. | | 58,446 | 13,460,698 |
| Ingersoll Rand, Inc. | | 80,343 | 5,119,456 |
| ITT, Inc. | | 14,708 | 1,440,060 |
| Lincoln Electric Holdings, Inc. | | 10,521 | 1,912,613 |
| Middleby Corp. (The)(1) | | 11,897 | 1,522,816 |
| Mueller Industries, Inc. | | 11,014 | 827,812 |
| Nordson Corp. | | 9,681 | 2,160,509 |
| Oshkosh Corp. | | 14,015 | 1,337,451 |
| Otis Worldwide Corp. | | 79,661 | 6,397,575 |
| PACCAR, Inc. | | 104,229 | 8,861,550 |
| Parker-Hannifin Corp. | | 24,765 | 9,646,463 |
| Pentair PLC | | 32,829 | 2,125,678 |
| Snap-on, Inc. | | 10,690 | 2,726,591 |
| SPX Technologies, Inc.(1) | | 8,666 | 705,412 |
| Stanley Black & Decker, Inc. | | 30,319 | 2,534,062 |
| Timken Co. (The) | | 10,680 | 784,873 |
| Toro Co. (The) | | 21,586 | 1,793,797 |
| Watts Water Technologies, Inc., Class A | | 4,503 | 778,208 |
| Westinghouse Air Brake Technologies Corp. | | 33,599 | 3,570,566 |
| Xylem, Inc. | | 46,816 | 4,261,661 |
| | | | $ 143,087,130 |
| Media — 1.0% | |
| Cable One, Inc. | | 504 | $ 310,283 |
| Charter Communications, Inc., Class A(1) | | 11,777 | 5,179,760 |
| Comcast Corp., Class A | | 522,910 | 23,185,829 |
| Interpublic Group of Cos., Inc. (The) | | 55,503 | 1,590,716 |
| Liberty Broadband Corp., Class C(1) | | 18,039 | 1,647,322 |
| New York Times Co. (The), Class A | | 18,406 | 758,327 |
| Nexstar Media Group, Inc., Class A | | 4,833 | 692,907 |
| Omnicom Group, Inc. | | 27,459 | 2,045,146 |
| Paramount Global, Class B | | 91,715 | 1,183,124 |
| Sirius XM Holdings, Inc.(2) | | 77,170 | 348,808 |
| TEGNA, Inc. | | 31,824 | 463,676 |
| Trade Desk, Inc. (The), Class A(1) | | 55,116 | 4,307,315 |
| | | | $ 41,713,213 |
13
See Notes to Financial Statements.
Calvert
US Large-Cap Core Responsible Index Fund
September 30, 2023
Schedule of Investments — continued
| Security | Shares | Value |
| Metals & Mining — 0.6% | |
| ATI, Inc.(1) | | 41,797 | $ 1,719,947 |
| Commercial Metals Co. | | 39,906 | 1,971,755 |
| Nucor Corp. | | 66,526 | 10,401,340 |
| Reliance Steel & Aluminum Co. | | 19,125 | 5,015,149 |
| Steel Dynamics, Inc. | | 52,226 | ��� 5,599,672 |
| | | | $ 24,707,863 |
| Multi-Utilities — 0.9% | |
| Ameren Corp. | | 45,220 | $ 3,383,813 |
| Black Hills Corp. | | 11,410 | 577,232 |
| CMS Energy Corp. | | 50,324 | 2,672,708 |
| Consolidated Edison, Inc. | | 55,114 | 4,713,900 |
| Dominion Energy, Inc. | | 134,374 | 6,002,487 |
| DTE Energy Co. | | 35,458 | 3,520,270 |
| NiSource, Inc. | | 70,238 | 1,733,474 |
| Public Service Enterprise Group, Inc. | | 79,394 | 4,518,312 |
| Sempra | | 107,510 | 7,313,905 |
| WEC Energy Group, Inc. | | 54,708 | 4,406,729 |
| | | | $ 38,842,830 |
| Oil, Gas & Consumable Fuels — 0.3% | |
| Denbury, Inc.(1) | | 16,366 | $ 1,604,031 |
| Occidental Petroleum Corp. | | 184,485 | 11,969,387 |
| | | | $ 13,573,418 |
| Paper & Forest Products — 0.0%(3) | |
| Louisiana-Pacific Corp. | | 8,248 | $ 455,867 |
| | | | $ 455,867 |
| Passenger Airlines — 0.2% | |
| Alaska Air Group, Inc.(1) | | 19,298 | $ 715,570 |
| American Airlines Group, Inc.(1) | | 88,283 | 1,130,905 |
| Delta Air Lines, Inc. | | 93,279 | 3,451,323 |
| Southwest Airlines Co. | | 83,589 | 2,262,754 |
| | | | $ 7,560,552 |
| Personal Care Products — 0.1% | |
| BellRing Brands, Inc.(1) | | 15,888 | $ 655,062 |
| Coty, Inc., Class A(1) | | 59,093 | 648,250 |
| e.l.f. Beauty, Inc.(1) | | 6,136 | 673,917 |
| Estee Lauder Cos., Inc. (The), Class A | | 28,678 | 4,145,405 |
| | | | $ 6,122,634 |
| Pharmaceuticals — 3.7% | |
| Bristol-Myers Squibb Co. | | 320,862 | $ 18,622,830 |
| Catalent, Inc.(1) | | 26,317 | 1,198,213 |
| Elanco Animal Health, Inc.(1) | | 74,870 | 841,539 |
| Eli Lilly & Co. | | 106,079 | 56,978,213 |
| Jazz Pharmaceuticals PLC(1) | | 10,110 | 1,308,638 |
| Merck & Co., Inc. | | 342,827 | 35,294,040 |
| Security | Shares | Value |
| Pharmaceuticals (continued) | |
| Organon & Co. | | 37,716 | $ 654,750 |
| Perrigo Co. PLC | | 17,537 | 560,307 |
| Pfizer, Inc. | | 815,982 | 27,066,123 |
| Royalty Pharma PLC, Class A | | 62,154 | 1,686,860 |
| Zoetis, Inc. | | 71,723 | 12,478,367 |
| | | | $ 156,689,880 |
| Professional Services — 1.2% | |
| Alight, Inc., Class A(1) | | 50,000 | $ 354,500 |
| Automatic Data Processing, Inc. | | 52,080 | 12,529,407 |
| Booz Allen Hamilton Holding Corp. | | 20,158 | 2,202,665 |
| Broadridge Financial Solutions, Inc. | | 16,128 | 2,887,719 |
| Ceridian HCM Holding, Inc.(1) | | 19,247 | 1,305,909 |
| Concentrix Corp. | | 7,077 | 566,939 |
| CoStar Group, Inc.(1) | | 58,315 | 4,483,840 |
| Dun & Bradstreet Holdings, Inc. | | 29,876 | 298,461 |
| Equifax, Inc. | | 17,539 | 3,212,794 |
| Exlservice Holdings, Inc.(1) | | 21,250 | 595,850 |
| Exponent, Inc. | | 5,782 | 494,939 |
| FTI Consulting, Inc.(1) | | 3,808 | 679,385 |
| Genpact, Ltd. | | 18,622 | 674,116 |
| Insperity, Inc. | | 5,123 | 500,005 |
| ManpowerGroup, Inc. | | 8,973 | 657,900 |
| Maximus, Inc. | | 8,571 | 640,082 |
| Paychex, Inc. | | 39,471 | 4,552,191 |
| Paycom Software, Inc. | | 7,048 | 1,827,335 |
| Paylocity Holding Corp.(1) | | 5,269 | 957,377 |
| Robert Half, Inc. | | 16,715 | 1,224,875 |
| Science Applications International Corp. | | 8,747 | 923,158 |
| SS&C Technologies Holdings, Inc. | | 27,152 | 1,426,566 |
| TransUnion | | 28,510 | 2,046,733 |
| TriNet Group, Inc.(1) | | 6,210 | 723,341 |
| Verisk Analytics, Inc. | | 19,638 | 4,639,281 |
| | | | $ 50,405,368 |
| Real Estate Management & Development — 0.1% | |
| CBRE Group, Inc., Class A(1) | | 48,602 | $ 3,589,744 |
| Howard Hughes Holdings, Inc.(1) | | 8,109 | 601,120 |
| Jones Lang LaSalle, Inc.(1) | | 7,080 | 999,555 |
| Zillow Group, Inc., Class C(1) | | 30,533 | 1,409,403 |
| | | | $ 6,599,822 |
| Semiconductors & Semiconductor Equipment — 7.7% | |
| Advanced Micro Devices, Inc.(1) | | 202,285 | $ 20,798,944 |
| Allegro MicroSystems, Inc.(1) | | 3,950 | 126,163 |
| Amkor Technology, Inc. | | 7,055 | 159,443 |
| Analog Devices, Inc. | | 63,807 | 11,171,968 |
| Applied Materials, Inc. | | 105,962 | 14,670,439 |
| Broadcom, Inc. | | 51,726 | 42,962,581 |
| Cirrus Logic, Inc.(1) | | 7,380 | 545,825 |
| Diodes, Inc.(1) | | 5,508 | 434,251 |
14
See Notes to Financial Statements.
Calvert
US Large-Cap Core Responsible Index Fund
September 30, 2023
Schedule of Investments — continued
| Security | Shares | Value |
| Semiconductors & Semiconductor Equipment (continued) | |
| Enphase Energy, Inc.(1) | | 16,417 | $ 1,972,502 |
| Entegris, Inc. | | 17,978 | 1,688,314 |
| First Solar, Inc.(1) | | 12,403 | 2,004,201 |
| Intel Corp. | | 528,138 | 18,775,306 |
| KLA Corp. | | 17,482 | 8,018,294 |
| Lam Research Corp. | | 17,328 | 10,860,670 |
| Lattice Semiconductor Corp.(1) | | 15,108 | 1,298,230 |
| Marvell Technology, Inc. | | 106,151 | 5,745,954 |
| Microchip Technology, Inc. | | 67,302 | 5,252,921 |
| Micron Technology, Inc. | | 142,090 | 9,666,383 |
| MKS Instruments, Inc. | | 11,984 | 1,037,095 |
| Monolithic Power Systems, Inc. | | 5,347 | 2,470,314 |
| NVIDIA Corp. | | 276,319 | 120,196,002 |
| ON Semiconductor Corp.(1) | | 52,437 | 4,874,019 |
| Onto Innovation, Inc.(1) | | 6,230 | 794,450 |
| Power Integrations, Inc. | | 6,062 | 462,591 |
| Qorvo, Inc.(1) | | 11,584 | 1,105,924 |
| QUALCOMM, Inc. | | 143,516 | 15,938,887 |
| Rambus, Inc.(1) | | 13,679 | 763,151 |
| Silicon Laboratories, Inc.(1) | | 4,402 | 510,148 |
| Skyworks Solutions, Inc. | | 20,197 | 1,991,222 |
| SolarEdge Technologies, Inc.(1) | | 6,827 | 884,165 |
| Teradyne, Inc. | | 21,147 | 2,124,428 |
| Texas Instruments, Inc. | | 116,734 | 18,561,873 |
| Universal Display Corp. | | 6,342 | 995,631 |
| Wolfspeed, Inc.(1)(2) | | 14,678 | 559,232 |
| | | | $ 329,421,521 |
| Software — 11.1% | |
| Adobe, Inc.(1) | | 57,776 | $ 29,459,982 |
| Altair Engineering, Inc., Class A(1) | | 4,845 | 303,103 |
| ANSYS, Inc.(1) | | 10,737 | 3,194,794 |
| AppFolio, Inc., Class A(1) | | 3,500 | 639,205 |
| AppLovin Corp., Class A(1) | | 14,676 | 586,453 |
| Aspen Technology, Inc.(1) | | 3,986 | 814,180 |
| Atlassian Corp., Class A(1) | | 19,033 | 3,835,340 |
| Autodesk, Inc.(1) | | 27,405 | 5,670,369 |
| Bill Holdings, Inc.(1) | | 14,150 | 1,536,266 |
| Box, Inc., Class A(1) | | 17,559 | 425,103 |
| Cadence Design Systems, Inc.(1) | | 35,389 | 8,291,643 |
| Confluent, Inc., Class A(1) | | 18,851 | 558,178 |
| CrowdStrike Holdings, Inc., Class A(1) | | 26,655 | 4,461,514 |
| Datadog, Inc., Class A(1) | | 33,156 | 3,020,180 |
| DocuSign, Inc.(1) | | 26,144 | 1,098,048 |
| Dolby Laboratories, Inc., Class A | | 6,538 | 518,202 |
| Dropbox, Inc., Class A(1) | | 37,922 | 1,032,616 |
| Dynatrace, Inc.(1) | | 28,054 | 1,310,963 |
| Elastic NV(1) | | 8,376 | 680,466 |
| Fair Isaac Corp.(1) | | 3,330 | 2,892,205 |
| Five9, Inc.(1) | | 8,046 | 517,358 |
| Fortinet, Inc.(1) | | 82,496 | 4,840,865 |
| Security | Shares | Value |
| Software (continued) | |
| Gen Digital, Inc. | | 83,482 | $ 1,475,962 |
| Guidewire Software, Inc.(1) | | 8,032 | 722,880 |
| HashiCorp, Inc., Class A(1) | | 15,000 | 342,450 |
| HubSpot, Inc.(1) | | 6,360 | 3,132,300 |
| Intuit, Inc. | | 34,474 | 17,614,146 |
| Manhattan Associates, Inc.(1) | | 6,811 | 1,346,262 |
| Microsoft Corp. | | 831,717 | 262,614,643 |
| New Relic, Inc.(1) | | 8,072 | 691,125 |
| Nutanix, Inc., Class A(1) | | 29,688 | 1,035,517 |
| Oracle Corp. | | 200,222 | 21,207,514 |
| Palo Alto Networks, Inc.(1) | | 38,607 | 9,051,025 |
| PTC, Inc.(1) | | 15,079 | 2,136,393 |
| Qualys, Inc.(1) | | 4,602 | 702,035 |
| Roper Technologies, Inc. | | 13,056 | 6,322,760 |
| Salesforce, Inc.(1) | | 119,204 | 24,172,187 |
| SentinelOne, Inc., Class A(1) | | 22,483 | 379,063 |
| ServiceNow, Inc.(1) | | 26,203 | 14,646,429 |
| Smartsheet, Inc., Class A(1) | | 15,781 | 638,499 |
| Splunk, Inc.(1) | | 19,469 | 2,847,341 |
| SPS Commerce, Inc.(1) | | 4,586 | 782,417 |
| Synopsys, Inc.(1) | | 19,218 | 8,820,486 |
| Tenable Holdings, Inc.(1) | | 12,123 | 543,110 |
| Teradata Corp.(1) | | 12,578 | 566,262 |
| Tyler Technologies, Inc.(1) | | 4,951 | 1,911,779 |
| VMware, Inc., Class A(1) | | 26,024 | 4,332,476 |
| Workday, Inc., Class A(1) | | 24,941 | 5,358,574 |
| Workiva, Inc.(1) | | 5,900 | 597,906 |
| Zoom Video Communications, Inc., Class A(1) | | 26,522 | 1,854,949 |
| Zscaler, Inc.(1) | | 11,669 | 1,815,580 |
| | | | $ 473,349,103 |
| Specialty Retail — 2.4% | |
| Academy Sports & Outdoors, Inc. | | 9,139 | $ 432,001 |
| Advance Auto Parts, Inc. | | 8,266 | 462,317 |
| Asbury Automotive Group, Inc.(1) | | 2,587 | 595,191 |
| AutoNation, Inc.(1) | | 4,563 | 690,838 |
| AutoZone, Inc.(1) | | 2,212 | 5,618,458 |
| Bath & Body Works, Inc. | | 29,800 | 1,007,240 |
| Best Buy Co., Inc. | | 21,455 | 1,490,479 |
| Burlington Stores, Inc.(1) | | 8,582 | 1,161,145 |
| CarMax, Inc.(1) | | 19,883 | 1,406,325 |
| Chewy, Inc., Class A(1) | | 9,570 | 174,748 |
| Dick's Sporting Goods, Inc. | | 7,829 | 850,073 |
| Five Below, Inc.(1) | | 6,997 | 1,125,817 |
| Floor & Decor Holdings, Inc., Class A(1) | | 12,454 | 1,127,087 |
| GameStop Corp., Class A(1) | | 31,480 | 518,161 |
| Home Depot, Inc. (The) | | 122,508 | 37,017,017 |
| Lithia Motors, Inc., Class A | | 3,411 | 1,007,371 |
| Lowe's Cos., Inc. | | 71,896 | 14,942,865 |
| O'Reilly Automotive, Inc.(1) | | 7,550 | 6,861,893 |
| Penske Automotive Group, Inc. | | 1,776 | 296,699 |
15
See Notes to Financial Statements.
Calvert
US Large-Cap Core Responsible Index Fund
September 30, 2023
Schedule of Investments — continued
| Security | Shares | Value |
| Specialty Retail (continued) | |
| RH (1)(2) | | 2,425 | $ 641,073 |
| Ross Stores, Inc. | | 38,806 | 4,383,138 |
| TJX Cos., Inc. (The) | | 141,304 | 12,559,099 |
| Tractor Supply Co. | | 13,044 | 2,648,584 |
| Ulta Beauty, Inc.(1) | | 5,923 | 2,365,942 |
| Wayfair, Inc., Class A(1)(2) | | 8,757 | 530,411 |
| Williams-Sonoma, Inc.(2) | | 6,578 | 1,022,221 |
| | | | $ 100,936,193 |
| Technology Hardware, Storage & Peripherals — 7.5% | |
| Apple, Inc. | | 1,767,323 | $ 302,583,371 |
| Dell Technologies, Inc., Class C | | 35,257 | 2,429,207 |
| Hewlett Packard Enterprise Co. | | 173,474 | 3,013,243 |
| HP, Inc. | | 123,530 | 3,174,721 |
| NetApp, Inc. | | 29,320 | 2,224,802 |
| Pure Storage, Inc., Class A(1) | | 33,965 | 1,209,833 |
| Seagate Technology Holdings PLC | | 25,712 | 1,695,707 |
| Western Digital Corp.(1) | | 43,838 | 2,000,328 |
| | | | $ 318,331,212 |
| Textiles, Apparel & Luxury Goods — 0.6% | |
| Capri Holdings, Ltd.(1) | | 13,279 | $ 698,608 |
| Columbia Sportswear Co. | | 2,145 | 158,945 |
| Crocs, Inc.(1) | | 7,218 | 636,844 |
| Deckers Outdoor Corp.(1) | | 2,825 | 1,452,304 |
| lululemon Athletica, Inc.(1) | | 13,184 | 5,083,882 |
| NIKE, Inc., Class B | | 143,566 | 13,727,781 |
| PVH Corp. | | 9,809 | 750,487 |
| Ralph Lauren Corp. | | 4,524 | 525,191 |
| Skechers USA, Inc., Class A(1) | | 20,147 | 986,196 |
| Tapestry, Inc. | | 30,789 | 885,184 |
| VF Corp. | | 41,223 | 728,410 |
| | | | $ 25,633,832 |
| Trading Companies & Distributors — 0.5% | |
| Air Lease Corp. | | 17,419 | $ 686,483 |
| Applied Industrial Technologies, Inc. | | 7,543 | 1,166,223 |
| Beacon Roofing Supply, Inc.(1) | | 3,873 | 298,880 |
| Core & Main, Inc., Class A(1) | | 12,500 | 360,625 |
| Fastenal Co. | | 71,936 | 3,930,583 |
| GATX Corp. | | 6,934 | 754,627 |
| MSC Industrial Direct Co., Inc., Class A | | 7,733 | 758,994 |
| SiteOne Landscape Supply, Inc.(1) | | 6,263 | 1,023,687 |
| United Rentals, Inc. | | 13,924 | 6,190,193 |
| W.W. Grainger, Inc. | | 5,410 | 3,742,854 |
| WESCO International, Inc. | | 4,024 | 578,732 |
| | | | $ 19,491,881 |
| Water Utilities — 0.1% | |
| American Water Works Co., Inc. | | 31,519 | $ 3,902,997 |
| Security | Shares | Value |
| Water Utilities (continued) | |
| Essential Utilities, Inc. | | 41,643 | $ 1,429,604 |
| | | | $ 5,332,601 |
| Wireless Telecommunication Services — 0.2% | |
| T-Mobile US, Inc.(1) | | 69,546 | $ 9,739,917 |
| | | | $ 9,739,917 |
Total Common Stocks
(identified cost $2,639,576,236) | | | $4,248,066,765 |
| Security | Shares | Value |
| Health Care Equipment & Supplies — 0.0%(3) | |
| Abiomed, Inc., CVR(1)(4)(5) | | 7,614 | $ 7,766 |
Total Rights
(identified cost $7,766) | | | $ 7,766 |
| Short-Term Investments — 0.3% | | | |
| Affiliated Fund — 0.3% |
| Security | Shares | Value |
| Morgan Stanley Institutional Liquidity Funds - Government Portfolio, Institutional Class, 5.27%(6) | | 12,339,221 | $ 12,339,221 |
Total Affiliated Fund
(identified cost $12,339,221) | | | $ 12,339,221 |
| Securities Lending Collateral — 0.0%(3) |
| Security | Shares | Value |
| State Street Navigator Securities Lending Government Money Market Portfolio, 5.36%(7) | | 965,433 | $ 965,433 |
Total Securities Lending Collateral
(identified cost $965,433) | | | $ 965,433 |
Total Short-Term Investments
(identified cost $13,304,654) | | | $ 13,304,654 |
Total Investments — 99.9%
(identified cost $2,652,888,656) | | | $4,261,379,185 |
| Other Assets, Less Liabilities — 0.1% | | | $ 3,802,557 |
| Net Assets — 100.0% | | | $4,265,181,742 |
16
See Notes to Financial Statements.
Calvert
US Large-Cap Core Responsible Index Fund
September 30, 2023
Schedule of Investments — continued
| The percentage shown for each investment category in the Schedule of Investments is based on net assets. |
| (1) | Non-income producing security. |
| (2) | All or a portion of this security was on loan at September 30, 2023. The aggregate market value of securities on loan at September 30, 2023 was $8,687,811. |
| (3) | Amount is less than 0.05%. |
| (4) | For fair value measurement disclosure purposes, security is categorized as Level 3 (see Note 1A). |
| (5) | Restricted security. Total market value of restricted securities amounts to $7,766, which represents less than 0.05% of the net assets of the Fund as of September 30, 2023. |
| (6) | May be deemed to be an affiliated investment company. The rate shown is the annualized seven-day yield as of September 30, 2023. |
| (7) | Represents investment of cash collateral received in connection with securities lending. |
Restricted Securities
| Description | Acquisition Date | Cost |
| Abiomed, Inc., CVR | 12/28/22 | $7,766 |
| Abbreviations: |
| CVR | – Contingent Value Rights |
17
See Notes to Financial Statements.
Calvert
US Large-Cap Core Responsible Index Fund
September 30, 2023
Statement of Assets and Liabilities
| | September 30, 2023 |
| Assets | |
Investments in securities of unaffiliated issuers, at value (identified cost $2,640,549,435) - including
$8,687,811 of securities on loan | $ 4,249,039,964 |
| Investments in securities of affiliated issuers, at value (identified cost $12,339,221) | 12,339,221 |
| Cash | 630,501 |
| Receivable for capital shares sold | 6,958,945 |
| Dividends receivable | 2,551,247 |
| Dividends receivable - affiliated | 31,131 |
| Securities lending income receivable | 3,246 |
| Receivable from affiliates | 417,854 |
| Directors' deferred compensation plan | 827,433 |
| Total assets | $4,272,799,542 |
| Liabilities | |
| Payable for capital shares redeemed | $ 3,967,253 |
| Deposits for securities loaned | 965,433 |
| Payable to affiliates: | |
| Investment advisory fee | 433,310 |
| Administrative fee | 434,082 |
| Distribution and service fees | 195,023 |
| Sub-transfer agency fee | 33,816 |
| Directors' deferred compensation plan | 827,433 |
| Accrued expenses | 761,450 |
| Total liabilities | $ 7,617,800 |
| Net Assets | $4,265,181,742 |
| Sources of Net Assets | |
| Paid-in capital | $ 2,705,213,948 |
| Distributable earnings | 1,559,967,794 |
| Net Assets | $4,265,181,742 |
| Class A Shares | |
| Net Assets | $ 658,227,181 |
| Shares Outstanding | 18,131,441 |
Net Asset Value and Redemption Price Per Share
(net assets ÷ shares of beneficial interest outstanding) | $ 36.30 |
Maximum Offering Price Per Share
(100 ÷ 95.25 of net asset value per share) | $ 38.11 |
| Class C Shares | |
| Net Assets | $ 64,695,107 |
| Shares Outstanding | 1,909,222 |
Net Asset Value and Offering Price Per Share*
(net assets ÷ shares of beneficial interest outstanding) | $ 33.89 |
| Class I Shares | |
| Net Assets | $ 2,251,092,100 |
| Shares Outstanding | 60,258,375 |
Net Asset Value, Offering Price and Redemption Price Per Share
(net assets ÷ shares of beneficial interest outstanding) | $ 37.36 |
18
See Notes to Financial Statements.
Calvert
US Large-Cap Core Responsible Index Fund
September 30, 2023
Statement of Assets and Liabilities — continued
| | September 30, 2023 |
| Class R6 Shares | |
| Net Assets | $ 1,291,167,354 |
| Shares Outstanding | 34,596,339 |
Net Asset Value, Offering Price and Redemption Price Per Share
(net assets ÷ shares of beneficial interest outstanding) | $ 37.32 |
| On sales of $50,000 or more, the offering price of Class A shares is reduced. |
| * | Redemption price per share is equal to the net asset value less any applicable contingent deferred sales charge. |
19
See Notes to Financial Statements.
Calvert
US Large-Cap Core Responsible Index Fund
September 30, 2023
| | Year Ended |
| | September 30, 2023 |
| Investment Income | |
| Dividend income (net of foreign taxes withheld of $6,458) | $ 61,175,847 |
| Dividend income - affiliated issuers | 214,849 |
| Interest income | 4,894 |
| Securities lending income, net | 342,989 |
| Total investment income | $ 61,738,579 |
| Expenses | |
| Investment advisory fee | $ 4,967,262 |
| Administrative fee | 4,967,262 |
| Distribution and service fees: | |
| Class A | 1,629,910 |
| Class C | 673,385 |
| Directors' fees and expenses | 282,728 |
| Custodian fees | 64,852 |
| Transfer agency fees and expenses | 2,262,386 |
| Accounting fees | 670,289 |
| Professional fees | 179,820 |
| Registration fees | 115,831 |
| Reports to shareholders | 137,107 |
| Miscellaneous | 222,901 |
| Total expenses | $ 16,173,733 |
| Waiver and/or reimbursement of expenses by affiliates | $ (4,480,062) |
| Net expenses | $ 11,693,671 |
| Net investment income | $ 50,044,908 |
| Realized and Unrealized Gain (Loss) | |
| Net realized gain (loss): | |
| Investment securities | $ (1,554,224) |
| Net realized loss | $ (1,554,224) |
| Change in unrealized appreciation (depreciation): | |
| Investment securities | $ 682,498,550 |
| Net change in unrealized appreciation (depreciation) | $682,498,550 |
| Net realized and unrealized gain | $680,944,326 |
| Net increase in net assets from operations | $730,989,234 |
20
See Notes to Financial Statements.
Calvert
US Large-Cap Core Responsible Index Fund
September 30, 2023
Statements of Changes in Net Assets
| | Year Ended September 30, |
| | 2023 | 2022 |
| Increase (Decrease) in Net Assets | | |
| From operations: | | |
| Net investment income | $ 50,044,908 | $ 46,270,594 |
| Net realized loss | (1,554,224) | (49,030,028) |
| Net change in unrealized appreciation (depreciation) | 682,498,550 | (901,328,012) |
| Net increase (decrease) in net assets from operations | $ 730,989,234 | $ (904,087,446) |
| Distributions to shareholders: | | |
| Class A | $ (5,755,550) | $ (6,521,368) |
| Class C | (77,603) | (250,662) |
| Class I | (23,911,504) | (32,895,988) |
| Class R6 | (13,728,521) | (11,820,048) |
| Total distributions to shareholders | $ (43,473,178) | $ (51,488,066) |
| Capital share transactions: | | |
| Class A | $ (23,210,990) | $ 37,307,207 |
| Class C | (10,997,513) | (2,919,441) |
| Class I | (149,810,381) | (357,483,926) |
| Class R6 | 156,207,787 | 190,149,405 |
| Net decrease in net assets from capital share transactions | $ (27,811,097) | $ (132,946,755) |
| Net increase (decrease) in net assets | $ 659,704,959 | $(1,088,522,267) |
| Net Assets | | |
| At beginning of year | $ 3,605,476,783 | $ 4,693,999,050 |
| At end of year | $4,265,181,742 | $ 3,605,476,783 |
21
See Notes to Financial Statements.
Calvert
US Large-Cap Core Responsible Index Fund
September 30, 2023
| | Class A |
| | Year Ended September 30, |
| | 2023 | 2022 | 2021 | 2020 | 2019 |
| Net asset value — Beginning of year | $ 30.51 | $ 38.30 | $ 29.75 | $ 24.79 | $ 24.66 |
| Income (Loss) From Operations | | | | | |
| Net investment income(1) | $ 0.35 | $ 0.30 | $ 0.28 | $ 0.30 | $ 0.29 |
| Net realized and unrealized gain (loss) | 5.74 | (7.74) | 8.53 | 4.91 | 0.69 |
| Total income (loss) from operations | $ 6.09 | $ (7.44) | $ 8.81 | $ 5.21 | $ 0.98 |
| Less Distributions | | | | | |
| From net investment income | $ (0.30) | $ (0.25) | $ (0.26) | $ (0.25) | $ (0.22) |
| From net realized gain | — | (0.10) | — | — | (0.63) |
| Total distributions | $ (0.30) | $ (0.35) | $ (0.26) | $ (0.25) | $ (0.85) |
| Net asset value — End of year | $ 36.30 | $ 30.51 | $ 38.30 | $ 29.75 | $ 24.79 |
| Total Return(2) | 20.08% | (19.64)% | 29.75% | 21.18% | 4.33% |
| Ratios/Supplemental Data | | | | | |
| Net assets, end of year (000’s omitted) | $658,227 | $572,693 | $686,373 | $424,771 | $321,690 |
| Ratios (as a percentage of average daily net assets):(3) | | | | | |
| Total expenses | 0.60% | 0.59% | 0.59% | 0.60% | 0.62% |
| Net expenses | 0.49% (4) | 0.49% (4) | 0.49% | 0.49% | 0.51% |
| Net investment income | 1.00% | 0.82% | 0.77% | 1.14% | 1.24% |
| Portfolio Turnover | 8% | 13% | 10% | 10% | 17% |
| (1) | Computed using average shares outstanding. |
| (2) | Returns are historical and are calculated by determining the percentage change in net asset value with all distributions reinvested and do not reflect the effect of sales charges, if any. |
| (3) | Total expenses do not reflect amounts reimbursed and/or waived by the adviser and certain of its affiliates, if applicable. Net expenses are net of all reductions and represent the net expenses paid by the Fund. |
| (4) | Includes a reduction by the investment adviser of a portion of its advisory fee due to the Fund’s investment in the Liquidity Fund (equal to less than 0.005% of average daily net assets for the years ended September 30, 2023 and 2022). |
22
See Notes to Financial Statements.
Calvert
US Large-Cap Core Responsible Index Fund
September 30, 2023
Financial Highlights — continued
| | Class C |
| | Year Ended September 30, |
| | 2023 | 2022 | 2021 | 2020 | 2019 |
| Net asset value — Beginning of year | $ 28.46 | $ 35.78 | $ 27.82 | $ 23.21 | $ 23.16 |
| Income (Loss) From Operations | | | | | |
| Net investment income(1) | $ 0.08 | $ 0.02 | $ 0.01 | $ 0.10 | $ 0.11 |
| Net realized and unrealized gain (loss) | 5.39 | (7.24) | 7.98 | 4.60 | 0.64 |
| Total income (loss) from operations | $ 5.47 | $ (7.22) | $ 7.99 | $ 4.70 | $ 0.75 |
| Less Distributions | | | | | |
| From net investment income | $ (0.04) | $ (0.00)(2) | $ (0.03) | $ (0.09) | $ (0.07) |
| From net realized gain | — | (0.10) | — | — | (0.63) |
| Total distributions | $ (0.04) | $ (0.10) | $ (0.03) | $ (0.09) | $ (0.70) |
| Net asset value — End of year | $ 33.89 | $ 28.46 | $ 35.78 | $ 27.82 | $ 23.21 |
| Total Return(3) | 19.22% | (20.24)% | 28.73% | 20.30% | 3.55% |
| Ratios/Supplemental Data | | | | | |
| Net assets, end of year (000’s omitted) | $64,695 | $63,985 | $84,005 | $61,503 | $57,167 |
| Ratios (as a percentage of average daily net assets):(4) | | | | | |
| Total expenses | 1.35% | 1.35% | 1.34% | 1.35% | 1.38% |
| Net expenses | 1.24% (5) | 1.24% (5) | 1.24% | 1.24% | 1.26% |
| Net investment income | 0.25% | 0.07% | 0.03% | 0.40% | 0.49% |
| Portfolio Turnover | 8% | 13% | 10% | 10% | 17% |
| (1) | Computed using average shares outstanding. |
| (2) | Amount is less than $(0.005). |
| (3) | Returns are historical and are calculated by determining the percentage change in net asset value with all distributions reinvested and do not reflect the effect of sales charges, if any. |
| (4) | Total expenses do not reflect amounts reimbursed and/or waived by the adviser and certain of its affiliates, if applicable. Net expenses are net of all reductions and represent the net expenses paid by the Fund. |
| (5) | Includes a reduction by the investment adviser of a portion of its advisory fee due to the Fund’s investment in the Liquidity Fund (equal to less than 0.005% of average daily net assets for the years ended September 30, 2023 and 2022). |
23
See Notes to Financial Statements.
Calvert
US Large-Cap Core Responsible Index Fund
September 30, 2023
Financial Highlights — continued
| | Class I |
| | Year Ended September 30, |
| | 2023 | 2022 | 2021 | 2020 | 2019 |
| Net asset value — Beginning of year | $ 31.38 | $ 39.37 | $ 30.56 | $ 25.46 | $ 25.29 |
| Income (Loss) From Operations | | | | | |
| Net investment income(1) | $ 0.45 | $ 0.40 | $ 0.38 | $ 0.38 | $ 0.36 |
| Net realized and unrealized gain (loss) | 5.92 | (7.95) | 8.75 | 5.03 | 0.72 |
| Total income (loss) from operations | $ 6.37 | $ (7.55) | $ 9.13 | $ 5.41 | $ 1.08 |
| Less Distributions | | | | | |
| From net investment income | $ (0.39) | $ (0.34) | $ (0.32) | $ (0.31) | $ (0.28) |
| From net realized gain | — | (0.10) | — | — | (0.63) |
| Total distributions | $ (0.39) | $ (0.44) | $ (0.32) | $ (0.31) | $ (0.91) |
| Net asset value — End of year | $ 37.36 | $ 31.38 | $ 39.37 | $ 30.56 | $ 25.46 |
| Total Return(2) | 20.42% | (19.45)% | 30.07% | 21.45% | 4.68% |
| Ratios/Supplemental Data | | | | | |
| Net assets, end of year (000’s omitted) | $2,251,092 | $2,021,486 | $2,916,731 | $1,831,859 | $1,143,304 |
| Ratios (as a percentage of average daily net assets):(3) | | | | | |
| Total expenses | 0.35% | 0.34% | 0.34% | 0.35% | 0.37% |
| Net expenses | 0.24% (4) | 0.24% (4) | 0.24% | 0.24% | 0.22% |
| Net investment income | 1.25% | 1.06% | 1.02% | 1.38% | 1.52% |
| Portfolio Turnover | 8% | 13% | 10% | 10% | 17% |
| (1) | Computed using average shares outstanding. |
| (2) | Returns are historical and are calculated by determining the percentage change in net asset value with all distributions reinvested and do not reflect the effect of sales charges, if any. |
| (3) | Total expenses do not reflect amounts reimbursed and/or waived by the adviser and certain of its affiliates, if applicable. Net expenses are net of all reductions and represent the net expenses paid by the Fund. |
| (4) | Includes a reduction by the investment adviser of a portion of its advisory fee due to the Fund’s investment in the Liquidity Fund (equal to less than 0.005% of average daily net assets for the years ended September 30, 2023 and 2022). |
24
See Notes to Financial Statements.
Calvert
US Large-Cap Core Responsible Index Fund
September 30, 2023
Financial Highlights — continued
| | Class R6 |
| | Year Ended September 30, |
| | 2023 | 2022 | 2021 | 2020 | 2019 |
| Net asset value — Beginning of year | $ 31.37 | $ 39.35 | $ 30.55 | $ 25.44 | $ 25.28 |
| Income (Loss) From Operations | | | | | |
| Net investment income(1) | $ 0.47 | $ 0.43 | $ 0.39 | $ 0.39 | $ 0.37 |
| Net realized and unrealized gain (loss) | 5.90 | (7.96) | 8.74 | 5.04 | 0.72 |
| Total income (loss) from operations | $ 6.37 | $ (7.53) | $ 9.13 | $ 5.43 | $ 1.09 |
| Less Distributions | | | | | |
| From net investment income | $ (0.42) | $ (0.35) | $ (0.33) | $ (0.32) | $ (0.30) |
| From net realized gain | — | (0.10) | — | — | (0.63) |
| Total distributions | $ (0.42) | $ (0.45) | $ (0.33) | $ (0.32) | $ (0.93) |
| Net asset value — End of year | $ 37.32 | $ 31.37 | $ 39.35 | $ 30.55 | $ 25.44 |
| Total Return(2) | 20.46% | (19.42)% | 30.12% | 21.55% | 4.70% |
| Ratios/Supplemental Data | | | | | |
| Net assets, end of year (000’s omitted) | $1,291,167 | $947,313 | $1,006,890 | $630,116 | $409,341 |
| Ratios (as a percentage of average daily net assets):(3) | | | | | |
| Total expenses | 0.30% | 0.29% | 0.29% | 0.30% | 0.32% |
| Net expenses | 0.19% (4) | 0.19% (4) | 0.19% | 0.19% | 0.19% |
| Net investment income | 1.30% | 1.13% | 1.07% | 1.43% | 1.55% |
| Portfolio Turnover | 8% | 13% | 10% | 10% | 17% |
| (1) | Computed using average shares outstanding. |
| (2) | Returns are historical and are calculated by determining the percentage change in net asset value with all distributions reinvested and do not reflect the effect of sales charges, if any. |
| (3) | Total expenses do not reflect amounts reimbursed and/or waived by the adviser and certain of its affiliates, if applicable. Net expenses are net of all reductions and represent the net expenses paid by the Fund. |
| (4) | Includes a reduction by the investment adviser of a portion of its advisory fee due to the Fund’s investment in the Liquidity Fund (equal to less than 0.005% of average daily net assets for the years ended September 30, 2023 and 2022). |
25
See Notes to Financial Statements.
Calvert
US Large-Cap Core Responsible Index Fund
September 30, 2023
Notes to Financial Statements
1 Significant Accounting Policies
Calvert US Large-Cap Core Responsible Index Fund (the Fund) is a diversified series of Calvert Responsible Index Series, Inc. (the Corporation). The Corporation is a Maryland corporation registered under the Investment Company Act of 1940, as amended (the 1940 Act), as an open-end management investment company. The investment objective of the Fund is to seek to track the performance of the Calvert US Large-Cap Core Responsible Index, which measures the investment return of large-capitalization stocks.
The Fund offers four classes of shares. Class A shares are generally sold subject to a sales charge imposed at time of purchase. A contingent deferred sales charge of 0.25% may apply to certain redemptions of Class A shares for accounts for which no sales charge was paid, if redeemed within 12 months of purchase. Class C shares are sold without a front-end sales charge, and with certain exceptions, are charged a contingent deferred sales charge of 1% on shares redeemed within 12 months of purchase. Class C shares are only available for purchase through a financial intermediary. Effective November 5, 2020, Class C shares automatically convert to Class A shares eight years after their purchase as described in the Fund's prospectus. Class I and Class R6 shares are sold at net asset value, are not subject to a sales charge and are sold only to certain eligible investors. Each class represents a pro rata interest in the Fund, but votes separately on class-specific matters and is subject to different expenses.
The Fund applies the accounting and reporting guidance in the Financial Accounting Standards Board (FASB) Accounting Standards Codification Topic 946, Financial Services – Investment Companies (ASC 946). Subsequent events, if any, through the date that the financial statements were issued have been evaluated in the preparation of the financial statements.
A Investment Valuation— Net asset value per share is determined every business day as of the close of the regular session of the New York Stock Exchange (generally 4:00 p.m. Eastern time). The Fund uses independent pricing services approved by the Board of Directors (the Board) to value its investments wherever possible. Investments for which market quotations are not available or deemed not reliable are fair valued in good faith by the Board’s valuation designee.
U.S. generally accepted accounting principles (U.S. GAAP) establishes a disclosure hierarchy that categorizes the inputs to valuation techniques used to value assets and liabilities at measurement date. These inputs are summarized in the three broad levels listed below:
Level 1 - quoted prices in active markets for identical securities
Level 2 - other significant observable inputs (including quoted prices for similar securities, interest rates, prepayment speeds, credit risk, etc.)
Level 3 - significant unobservable inputs (including the Fund’s own assumptions in determining the fair value of investments)
The inputs or methodologies used for valuing securities are not necessarily an indication of the risk associated with investing in those securities.
Valuation techniques used to value the Fund’s investments by major category are as follows:
Equity Securities. Equity securities (including warrants and rights) listed on a U.S. securities exchange generally are valued at the last sale or closing price as reported by an independent pricing service on the primary market or exchange on which they are traded and are categorized as Level 1 in the hierarchy. Equity securities listed on the NASDAQ National Market System are valued at the NASDAQ official closing price and are categorized as Level 1 in the hierarchy. Unlisted or listed securities for which closing sales prices or closing quotations are not available are valued at the mean between the latest available bid and ask prices and are categorized as Level 2 in the hierarchy.
Other Securities. Investments in management investment companies (including money market funds) that do not trade on an exchange are valued at the net asset value as of the close of each business day and are categorized as Level 1 in the hierarchy.
Fair Valuation. In connection with Rule 2a-5 of the 1940 Act, the Board has designated the Fund’s investment adviser as its valuation designee. Investments for which valuations or market quotations are not readily available or are deemed unreliable are valued by the investment adviser, as valuation designee, at fair value using methods that most fairly reflect the security’s “fair value”, which is the amount that the Fund might reasonably expect to receive for the security upon its current sale in the ordinary course. Each such determination is based on a consideration of relevant factors, which are likely to vary from one pricing context to another. These factors may include, but are not limited to, the type of security, the existence of any contractual restrictions on the security’s disposition, the price and extent of public trading in similar securities of the issuer or of comparable companies or entities, quotations or relevant information obtained from broker/dealers or other market participants, information obtained from the issuer, analysts, and/or the appropriate stock exchange (for exchange-traded securities), an analysis of the company’s or entity’s financial statements, and an evaluation of the forces that influence the issuer and the market(s) in which the security is purchased and sold.
The values assigned to fair value investments are based on available information and do not necessarily represent amounts that might ultimately be realized. Further, due to the inherent uncertainty of valuations of such investments, the fair values may differ significantly from the values that would have been used had an active market existed, and the differences could be material.
Calvert
US Large-Cap Core Responsible Index Fund
September 30, 2023
Notes to Financial Statements — continued
The following table summarizes the market value of the Fund's holdings as of September 30, 2023, based on the inputs used to value them:
| Asset Description | Level 1 | Level 2 | Level 3(1) | Total |
| Common Stocks | $ 4,248,066,765(2) | $ — | $ — | $ 4,248,066,765 |
| Rights | — | — | 7,766 | 7,766 |
| Short-Term Investments: | | | | |
| Affiliated Fund | 12,339,221 | — | — | 12,339,221 |
| Securities Lending Collateral | 965,433 | — | — | 965,433 |
| Total Investments | $4,261,371,419 | $ — | $7,766 | $4,261,379,185 |
| (1) | None of the unobservable inputs for Level 3 assets, individually or collectively, had a material impact on the Fund. |
| (2) | The level classification by major category of investments is the same as the category presentation in the Schedule of Investments. |
Level 3 assets at the beginning and/or end of the period in relation to net assets were not significant and accordingly, a reconciliation of Level 3 assets for the year ended September 30, 2023 is not presented.
B Investment Transactions and Income— Investment transactions for financial statement purposes are accounted for on trade date. Realized gains and losses are recorded on an identified cost basis and may include proceeds from litigation. Dividend income is recorded on the ex-dividend date for dividends received in cash and/or securities or, in the case of dividends on certain foreign securities, as soon as the Fund is informed of the ex-dividend date. Non-cash dividends are recorded at the fair value of the securities received. Withholding taxes on foreign dividends, if any, have been provided for in accordance with the Fund’s understanding of the applicable country’s tax rules and rates. Distributions received that represent a return of capital are recorded as a reduction of cost of investments. Distributions received that represent a capital gain are recorded as a realized gain. Interest income is accrued as earned.
C Share Class Accounting— Realized and unrealized gains and losses and net investment income and losses, other than class-specific expenses, are allocated daily to each class of shares based upon the relative net assets of each class to the total net assets of the Fund. Expenses arising in connection with a specific class are charged directly to that class. Sub-accounting, recordkeeping and similar administrative fees payable to financial intermediaries, which are a component of transfer agency fees and expenses on the Statement of Operations, are not allocated to Class R6 shares.
D Restricted Securities— The Fund may invest in securities that are subject to legal or contractual restrictions on resale. Generally, these securities may only be sold publicly upon registration under the Securities Act of 1933 or in transactions exempt from such registration. Information regarding restricted securities (excluding Rule 144A securities) is included at the end of the Schedule of Investments.
E Distributions to Shareholders— Distributions to shareholders are recorded by the Fund on ex-dividend date. Distributions from net investment income and distributions from net realized capital gains, if any, are paid at least annually. Distributions are declared separately for each class of shares. Distributions are determined in accordance with income tax regulations, which may differ from U.S. GAAP; accordingly, periodic reclassifications are made within the Fund's capital accounts to reflect income and gains available for distribution under income tax regulations.
F Estimates— The preparation of financial statements in conformity with U.S. GAAP requires management to make estimates and assumptions that affect the reported amounts of assets and liabilities and disclosure of contingent assets and liabilities at the date of the financial statements and the reported amounts of increases and decreases in net assets from operations during the reporting period. Actual results could differ from those estimates.
G Indemnifications— The Corporation’s By-Laws provide for indemnification for Directors or officers of the Corporation and certain other parties, to the fullest extent permitted by Maryland law and the 1940 Act, provided certain conditions are met. Additionally, in the normal course of business, the Fund enters into agreements with service providers that may contain indemnification clauses. The Fund’s maximum exposure under these arrangements is unknown as this would involve future claims that may be made against the Fund that have not yet occurred.
H Federal Income Taxes— No provision for federal income or excise tax is required since the Fund intends to continue to qualify as a regulated investment company under the Internal Revenue Code and to distribute substantially all of its taxable earnings.
Management has analyzed the Fund's tax positions taken for all open federal income tax years and has concluded that no provision for federal income tax is required in the Fund's financial statements. A Fund's federal tax return is subject to examination by the Internal Revenue Service for a period of three years from the date of filing.
2 Related Party Transactions
The investment advisory fee is earned by Calvert Research and Management (CRM), an indirect, wholly-owned subsidiary of Morgan Stanley, as compensation for investment advisory services rendered to the Fund. The investment advisory fee is computed at the annual rate of 0.12% of the Fund's average daily net assets and is payable monthly. For the year ended September 30, 2023, the investment advisory fee amounted to $4,967,262.
Calvert
US Large-Cap Core Responsible Index Fund
September 30, 2023
Notes to Financial Statements — continued
The Fund may invest in a money market fund, the Institutional Class of the Morgan Stanley Institutional Liquidity Funds - Government Portfolio (the “Liquidity Fund”), an open-end management investment company managed by Morgan Stanley Investment Management Inc., a wholly-owned subsidiary of Morgan Stanley. The investment advisory fee paid by the Fund is reduced by an amount equal to its pro rata share of the advisory and administration fees paid by the Fund due to its investment in the Liquidity Fund. For the year ended September 30, 2023, the investment advisory fee paid was reduced by $7,694 relating to the Fund’s investment in the Liquidity Fund.
CRM has agreed to reimburse the Fund’s operating expenses to the extent that total annual operating expenses (relating to ordinary operating expenses only and excluding expenses such as brokerage commissions, acquired fund fees and expenses of unaffiliated funds, borrowing costs, taxes or litigation expenses) exceed 0.49%, 1.24%, 0.24% and 0.19% for Class A, Class C, Class I and Class R6, respectively, of such class’s average daily net assets. The expense reimbursement agreement with CRM may be changed or terminated after January 31, 2024. For the year ended September 30, 2023, CRM waived or reimbursed expenses of $4,472,368.
The administrative fee is earned by CRM as compensation for administrative services rendered to the Fund. The fee is computed at an annual rate of 0.12% of the Fund’s average daily net assets attributable to Class A, Class C, Class I and Class R6 and is payable monthly. For the year ended September 30, 2023, CRM was paid administrative fees of $4,967,262.
The Fund has in effect a distribution plan for Class A shares (Class A Plan) pursuant to Rule 12b-1 under the 1940 Act. Pursuant to the Class A Plan, the Fund pays Eaton Vance Distributors, Inc. (EVD), an affiliate of CRM and the Fund’s principal underwriter, a distribution and service fee of 0.25% per annum of its average daily net assets attributable to Class A shares for distribution services and facilities provided to the Fund by EVD, as well as for personal services and/or the maintenance of shareholder accounts. The Fund also has in effect a distribution plan for Class C shares (Class C Plan) pursuant to Rule 12b-1 under the 1940 Act. Pursuant to the Class C Plan, the Fund pays EVD amounts equal to 0.75% per annum of its average daily net assets attributable to Class C shares for providing ongoing distribution services and facilities to the Fund. In addition, pursuant to the Class C Plan, the Fund also makes payments of service fees to EVD, financial intermediaries and other persons in amounts equal to 0.25% per annum of its average daily net assets attributable to that class. Service fees paid or accrued are for personal services and/or the maintenance of shareholder accounts. Distribution and service fees paid or accrued for the year ended September 30, 2023 amounted to $1,629,910 and $673,385 for Class A shares and Class C shares, respectively.
The Fund was informed that EVD received $61,448 as its portion of the sales charge on sales of Class A shares for the year ended September 30, 2023. The Fund was also informed that EVD received $5,423 of contingent deferred sales charges (CDSC) paid by Class C shareholders and no CDSC paid by Class A shareholders for the same period. The Fund was informed that Morgan Stanley affiliated broker-dealers, which may be deemed to be affiliates of CRM and EVD, also received a portion of the sales charge on sales of Class A shares for the year ended September 30, 2023 in the amount of $23,372.
Eaton Vance Management (EVM), an affiliate of CRM, provides sub-transfer agency and related services to the Fund pursuant to a Sub-Transfer Agency Support Services Agreement. For the year ended September 30, 2023, sub-transfer agency fees and expenses incurred to EVM amounted to $134,694 and are included in transfer agency fees and expenses on the Statement of Operations.
Each Director of the Fund who is not an employee of CRM or its affiliates receives an annual fee of $214,000, an annual Committee fee ranging from $8,500 to $16,500 depending on the Committee, and may receive a fee of $10,000 for special meetings. The Board chair receives an additional $40,000 ($30,000 prior to January 1, 2023) annual fee, Committee chairs receive an additional $15,000 ($6,000 prior to January 1, 2023) annual fee and the special equities liaison receives an additional $2,500 annual fee. Eligible Directors may participate in a Deferred Compensation Plan (the Plan). Amounts deferred under the Plan are treated as though equal dollar amounts had been invested in shares of the Fund or other Calvert funds selected by the Directors. The Fund purchases shares of the funds selected equal to the dollar amounts deferred under the Plan, resulting in an asset equal to the deferred compensation liability. Obligations of the Plan are paid solely from the Fund's assets. Directors’ fees are allocated to each of the Calvert funds served. Salaries and fees of officers and Directors of the Fund who are employees of CRM or its affiliates are paid by CRM.
3 Investment Activity
During the year ended September 30, 2023, the cost of purchases and proceeds from sales of investments, other than short-term securities, were $351,669,046 and $387,707,185, respectively.
Calvert
US Large-Cap Core Responsible Index Fund
September 30, 2023
Notes to Financial Statements — continued
4 Distributions to Shareholders and Income Tax Information
The tax character of distributions declared for the years ended September 30, 2023 and September 30, 2022 was as follows:
| | Year Ended September 30, |
| | 2023 | 2022 |
| Ordinary income | $43,473,178 | $39,184,831 |
| Long-term capital gains | $ — | $12,303,235 |
During the year ended September 30, 2023, distributable earnings was decreased by $3,506,171 and paid-in capital was increased by $3,506,171 due to the Fund's use of equalization accounting. Tax equalization accounting allows the Fund to treat as a distribution that portion of redemption proceeds representing a redeeming shareholder’s portion of undistributed taxable income and net capital gains. These reclassifications had no effect on the net assets or net asset value per share of the Fund.
As of September 30, 2023, the components of distributable earnings (accumulated loss) on a tax basis were as follows:
| Undistributed ordinary income | $ 34,040,896 |
| Deferred capital losses | (44,614,901) |
| Net unrealized appreciation | 1,570,541,799 |
| Distributable earnings | $1,559,967,794 |
At September 30, 2023, the Fund, for federal income tax purposes, had deferred capital losses of $44,614,901 which would reduce the Fund’s taxable income arising from future net realized gains on investment transactions, if any, to the extent permitted by the Internal Revenue Code, and thus would reduce the amount of distributions to shareholders, which would otherwise be necessary to relieve the Fund of any liability for federal income or excise tax. The deferred capital losses are treated as arising on the first day of the Fund’s next taxable year, can be carried forward for an unlimited period, and retain the same short-term or long-term character as when originally deferred. Of the deferred capital losses at September 30, 2023, $44,614,901 are short-term.
The cost and unrealized appreciation (depreciation) of investments of the Fund at September 30, 2023, as determined on a federal income tax basis, were as follows:
| Aggregate cost | $2,690,837,386 |
| Gross unrealized appreciation | $ 1,735,251,608 |
| Gross unrealized depreciation | (164,709,809) |
| Net unrealized appreciation | $1,570,541,799 |
5 Securities Lending
To generate additional income, the Fund may lend its securities pursuant to a securities lending agency agreement with State Street Bank and Trust Company (SSBT), the securities lending agent. Security loans are subject to termination by the Fund at any time and, therefore, are not considered illiquid investments. The Fund requires that the loan be continuously collateralized by either cash or securities in an amount at least equal to the market value of the securities on loan. The market value of securities loaned is determined daily and any additional required collateral is delivered to the Fund on the next business day. Cash collateral is generally invested in a money market fund registered under the 1940 Act that is managed by an affiliate of SSBT. Any gain or loss in the market price of the loaned securities that might occur and any interest earned or dividends declared during the term of the loan would accrue to the account of the Fund. Income earned on the investment of collateral, net of broker rebates and other expenses incurred by the securities lending agent, is split between the Fund and the securities lending agent based on agreed upon contractual terms. Non-cash collateral, if any, is held by the lending agent on behalf of the Fund and cannot be sold or re-pledged by the Fund; accordingly, such collateral is not reflected in the Statement of Assets and Liabilities.
Calvert
US Large-Cap Core Responsible Index Fund
September 30, 2023
Notes to Financial Statements — continued
The risks associated with lending portfolio securities include, but are not limited to, possible delays in receiving additional collateral or in the recovery of the loaned securities, possible loss of rights to the collateral should the borrower fail financially, as well as risk of loss in the value of the collateral or the value of the investments made with the collateral. The securities lending agent shall indemnify the Fund in the case of default of any securities borrower.
At September 30, 2023, the total value of securities on loan was $8,687,811 and the total value of collateral received was $8,858,671, comprised of cash of $965,433 and U.S. government and/or agencies securities of $7,893,238.
The following table provides a breakdown of securities lending transactions accounted for as secured borrowings, the obligations by class of collateral pledged, and the remaining contractual maturity of those transactions as of September 30, 2023.
| | Remaining Contractual Maturity of the Transactions |
| | Overnight and
Continuous | <30 days | 30 to 90 days | >90 days | Total |
| Common Stocks | $965,433 | $ — | $ — | $ — | $965,433 |
The carrying amount of the liability for deposits for securities loaned at September 30, 2023 approximated its fair value. If measured at fair value, such liability would have been considered as Level 2 in the fair value hierarchy (see Note 1A) at September 30, 2023.
6 Line of Credit
The Fund participates with other portfolios and funds managed by EVM and its affiliates, including CRM, in a $725 million unsecured revolving line of credit agreement with a group of banks, which is in effect through October 24, 2023. Borrowings are made by the Fund solely for temporary purposes related to redemptions and other short-term cash needs. Interest is charged to the Fund based on its borrowings at an amount above either the Secured Overnight Financing Rate (SOFR) or Federal Funds rate. In addition, a fee computed at an annual rate of 0.15% on the daily unused portion of the line of credit is allocated among the participating portfolios and funds at the end of each quarter. In connection with the renewal of the agreement in October 2022, an arrangement fee of $150,000 was incurred that was allocated to the participating portfolios and funds. Because the line of credit is not available exclusively to the Fund, it may be unable to borrow some or all of its requested amounts at any particular time.
The Fund had no borrowings outstanding pursuant to its line of credit at September 30, 2023. The Fund did not have any significant borrowings or allocated fees during the year ended September 30, 2023. Effective October 24, 2023, the Fund renewed its line of credit agreement, which expires October 22, 2024. In connection with the renewal, the borrowing limit was decreased to $650 million.
7 Affiliated Investments
At September 30, 2023, the value of the Fund’s investment in funds that may be deemed to be affiliated was $12,339,221, which represents 0.3% of the Fund’s net assets. Transactions in such investments by the Fund for the year ended September 30, 2023 were as follows:
| Name | Value,
beginning
of period | Purchases | Sales
proceeds | Net
realized
gain
(loss) | Change in
unrealized
appreciation
(depreciation) | Value,
end of
period | Dividend
income | Shares,
end of
period |
| Short-Term Investments | | | | | | |
| Liquidity Fund | $3,102,248 | $295,549,138 | $(286,312,165) | $ — | $ — | $12,339,221 | $214,849 | 12,339,221 |
8 Capital Shares
The Corporation may issue its shares in one or more series (such as the Fund). The authorized shares of the Fund consist of 75,000,000 common shares, $0.01 par value, for each Class.
Calvert
US Large-Cap Core Responsible Index Fund
September 30, 2023
Notes to Financial Statements — continued
Transactions in capital shares, including direct exchanges pursuant to share class conversions for all periods presented, were as follows:
| | Year Ended
September 30, 2023 | | Year Ended
September 30, 2022 |
| | Shares | Amount | | Shares | Amount |
| Class A | | | | | |
| Shares sold | 2,602,392 | $ 90,271,988 | | 4,602,796 | $ 172,196,089 |
| Reinvestment of distributions | 162,212 | 5,325,430 | | 149,851 | 6,030,031 |
| Shares redeemed | (3,406,742) | (118,808,408) | | (3,899,745) | (140,918,913) |
| Net increase (decrease) | (642,138) | $ (23,210,990) | | 852,902 | $ 37,307,207 |
| Class C | | | | | |
| Shares sold | 177,578 | $ 5,819,850 | | 365,749 | $ 13,120,780 |
| Reinvestment of distributions | 2,431 | 74,955 | | 6,448 | 243,522 |
| Shares redeemed | (519,247) | (16,892,318) | | (471,318) | (16,283,743) |
| Net decrease | (339,238) | $ (10,997,513) | | (99,121) | $ (2,919,441) |
| Class I | | | | | |
| Shares sold | 14,940,711 | $ 532,342,043 | | 20,898,948 | $ 794,358,751 |
| Reinvestment of distributions | 671,490 | 22,642,643 | | 762,717 | 31,507,827 |
| Shares redeemed | (19,773,168) | (704,795,067) | | (31,324,553) | (1,183,350,504) |
| Net decrease | (4,160,967) | $(149,810,381) | | (9,662,888) | $ (357,483,926) |
| Class R6 | | | | | |
| Shares sold | 9,658,543 | $ 347,630,439 | | 11,519,418 | $ 439,156,672 |
| Reinvestment of distributions | 368,142 | 12,395,325 | | 254,065 | 10,487,823 |
| Shares redeemed | (5,629,973) | (203,817,977) | | (7,159,165) | (259,495,090) |
| Net increase | 4,396,712 | $ 156,207,787 | | 4,614,318 | $ 190,149,405 |
Calvert
US Large-Cap Core Responsible Index Fund
September 30, 2023
Report of Independent Registered Public Accounting Firm
To the Board of Directors of Calvert Responsible Index Series, Inc. and Shareholders of Calvert US Large-Cap Core Responsible Index Fund:
Opinion on the Financial Statements and Financial Highlights
We have audited the accompanying statement of assets and liabilities of Calvert US Large-Cap Core Responsible Index Fund (the "Fund") (one of the funds constituting Calvert Responsible Index Series, Inc.), including the schedule of investments, as of September 30, 2023, the related statement of operations for the year then ended, the statements of changes in net assets for each of the two years in the period then ended, the financial highlights for each of the three years in the period then ended, and the related notes. In our opinion, the financial statements and financial highlights present fairly, in all material respects, the financial position of the Fund as of September 30, 2023, and the results of its operations for the year then ended, the changes in its net assets for each of the two years in the period then ended, and the financial highlights for each of the three years in the period then ended, in conformity with accounting principles generally accepted in the United States of America. The financial highlights for the years ended September 30, 2020 and 2019 were audited by other auditors whose report, dated November 20, 2020, expressed an unqualified opinion on those financial highlights.
Basis for Opinion
These financial statements and financial highlights are the responsibility of the Fund's management. Our responsibility is to express an opinion on the Fund's financial statements and financial highlights based on our audits. We are a public accounting firm registered with the Public Company Accounting Oversight Board (United States) (PCAOB) and are required to be independent with respect to the Fund in accordance with the U.S. federal securities laws and the applicable rules and regulations of the Securities and Exchange Commission and the PCAOB.
We conducted our audits in accordance with the standards of the PCAOB. Those standards require that we plan and perform the audit to obtain reasonable assurance about whether the financial statements and financial highlights are free of material misstatement, whether due to error or fraud. The Fund is not required to have, nor were we engaged to perform, an audit of its internal control over financial reporting. As part of our audits, we are required to obtain an understanding of internal control over financial reporting but not for the purpose of expressing an opinion on the effectiveness of the Fund’s internal control over financial reporting. Accordingly, we express no such opinion.
Our audits included performing procedures to assess the risks of material misstatement of the financial statements and financial highlights, whether due to error or fraud, and performing procedures that respond to those risks. Such procedures included examining, on a test basis, evidence regarding the amounts and disclosures in the financial statements and financial highlights. Our audits also included evaluating the accounting principles used and significant estimates made by management, as well as evaluating the overall presentation of the financial statements and financial highlights. Our procedures included confirmation of securities owned as of September 30, 2023, by correspondence with the custodian and brokers; when replies were not received from brokers, we performed other auditing procedures. We believe that our audits provide a reasonable basis for our opinion.
/s/ Deloitte & Touche LLP
Boston, Massachusetts
November 22, 2023
We have served as the auditor of one or more Calvert investment companies since 2021.
Calvert
US Large-Cap Core Responsible Index Fund
September 30, 2023
Federal Tax Information (Unaudited)
The Form 1099-DIV you receive in February 2024 will show the tax status of all distributions paid to your account in calendar year 2023. Shareholders are advised to consult their own tax adviser with respect to the tax consequences of their investment in the Fund. As required by the Internal Revenue Code and/or regulations, shareholders must be notified regarding the status of qualified dividend income for individuals and the dividends received deduction for corporations.
Qualified Dividend Income. For the fiscal year ended September 30, 2023, the Fund designates approximately $60,794,183, or up to the maximum amount of such dividends allowable pursuant to the Internal Revenue Code, as qualified dividend income eligible for the reduced tax rate of 15%.
Dividends Received Deduction. Corporate shareholders are generally entitled to take the dividends received deduction on the portion of the Fund's dividend distribution that qualifies under tax law. For the Fund's fiscal 2023 ordinary income dividends, 100% qualifies for the corporate dividends received deduction.
Calvert
US Large-Cap Core Responsible Index Fund
September 30, 2023
Board of Directors' Contract Approval
Overview of the Contract Review Process
The Investment Company Act of 1940, as amended, provides, in substance, that each investment advisory agreement between a fund and its investment adviser will continue in effect from year to year only if its continuation is approved at least annually by the fund’s board of directors, including by a vote of a majority of the directors who are not “interested persons” of the fund (“Independent Directors”), cast in person at a meeting called for the purpose of considering such approval.
At an in-person meeting of the Boards of Trustees/Directors (each a “Board”) of the registered investment companies advised by Calvert Research and Management (“CRM” or the “Adviser”) (the “Calvert Funds”) held on June 12-13, 2023, the Board, including a majority of the Independent Directors, voted to approve continuation of existing investment advisory and investment sub-advisory agreements for the Calvert Funds for an additional one-year period.
In evaluating the investment advisory and investment sub-advisory agreements for the Calvert Funds, the Board considered a variety of information relating to the Calvert Funds and various service providers, including the Adviser. The Independent Directors reviewed a report prepared by the Adviser regarding various services provided to the Calvert Funds by the Adviser and its affiliates. Such report included, among other data, information regarding the Adviser’s personnel and the Adviser’s revenue and cost of providing services to the Calvert Funds, and a separate report prepared by an independent data provider, which compared each fund’s investment performance, fees and expenses to those of comparable funds as identified by such independent data provider (“comparable funds”).
The Independent Directors were separately represented by independent legal counsel with respect to their consideration of the continuation of the investment advisory and investment sub-advisory agreements for the Calvert Funds. Prior to voting, the Independent Directors reviewed the proposed continuation of the Calvert Funds’ investment advisory and investment sub-advisory agreements with management and also met in private sessions with their counsel at which time no representatives of management were present.
The information that the Board considered included, among other things, the following (for funds that invest through one or more affiliated underlying fund(s), references to “each fund” in this section may include information that was considered at the underlying fund-level):
Information about Fees, Performance and Expenses
| • | A report from an independent data provider comparing the advisory and related fees paid by each fund with fees paid by comparable funds; |
| • | A report from an independent data provider comparing each fund’s total expense ratio and its components to comparable funds; |
| • | A report from an independent data provider comparing the investment performance of each fund to the investment performance of comparable funds over various time periods; |
| • | Data regarding investment performance in comparison to benchmark indices; |
| • | For each fund, comparative information concerning the fees charged and the services provided by the Adviser in managing other accounts (including mutual funds, other collective investment funds and institutional accounts) using investment strategies and techniques similar to those used in managing such fund; |
| • | Profitability analyses for the Adviser with respect to each fund; |
Information about Portfolio Management and Trading
| • | Descriptions of the investment management services provided to each fund, including investment strategies and processes it employs; |
| • | Information about the Adviser’s policies and practices with respect to trading, including the Adviser’s processes for monitoring best execution of portfolio transactions; |
| • | Information about the allocation of brokerage transactions and the benefits received by the Adviser as a result of brokerage allocation, including information concerning the acquisition of research through client commission arrangements and policies with respect to “soft dollars”; |
Information about the Adviser
| • | Reports detailing the financial results and condition of CRM; |
| • | Descriptions of the qualifications, education and experience of the individual investment professionals whose responsibilities include portfolio management and investment research for the funds, and information relating to their compensation and responsibilities with respect to managing other mutual funds and investment accounts; |
| • | Policies and procedures relating to proxy voting and the handling of corporate actions and class actions; |
| • | A description of CRM’s procedures for overseeing sub-advisers, including with respect to regulatory and compliance issues, investment management and other matters; |
Calvert
US Large-Cap Core Responsible Index Fund
September 30, 2023
Board of Directors' Contract Approval — continued
Other Relevant Information
| • | Information concerning the nature, cost and character of the administrative and other non-investment advisory services provided by CRM and its affiliates; and |
| • | The terms of each investment advisory agreement. |
Over the course of the year, the Board and its committees held regular quarterly meetings. During these meetings, the Directors participated in investment and performance reviews with the portfolio managers and other investment professionals of the Adviser relating to each fund and considered various investment and trading strategies used in pursuing each fund’s investment objective(s), such as the use of derivative instruments, as well as risk management techniques. The Board and its committees also evaluated issues pertaining to industry and regulatory developments, compliance procedures, corporate governance and other issues with respect to the funds and received and participated in reports and presentations provided by CRM and its affiliates with respect to such matters. In addition to the formal meetings of the Board and its committees, the Independent Directors held regular video conferences in between meetings to discuss, among other topics, matters relating to the continuation of the Calvert Funds’ investment advisory and investment sub-advisory agreements.
For funds that invest through one or more affiliated underlying funds, the Board considered similar information about the underlying fund(s) when considering the approval of investment advisory agreements. In addition, in cases where the Adviser has engaged a sub-adviser, the Board considered similar information about the sub-adviser when considering the approval of any investment sub-advisory agreement.
The Independent Directors were assisted throughout the contract review process by their independent legal counsel. The Independent Directors relied upon the advice of such counsel and their own business judgment in determining the material factors to be considered in evaluating each investment advisory and investment sub-advisory agreement and the weight to be given to each such factor. The Board, including the Independent Directors, did not identify any single factor as controlling, and each Director may have attributed different weight to various factors.
Results of the Contract Review Process
Based on its consideration of the foregoing, and such other information as it deemed relevant, including the factors and conclusions described below, the Board, including the Independent Directors, concluded that the continuation of the investment advisory agreement of Calvert US Large-Cap Core Responsible Index Fund (the “Fund”), including the fee payable under the agreement, is in the best interests of the Fund’s shareholders. Accordingly, the Board, including a majority of the Independent Directors, voted to approve the continuation of the investment advisory agreement of the Fund.
Nature, Extent and Quality of Services
In considering the nature, extent and quality of the services provided by the Adviser under the investment advisory agreement, the Board reviewed information provided by the Adviser relating to its operations and personnel, including, among other information, biographical information on the Adviser’s investment personnel and descriptions of its organizational and management structure. The Board also took into account similar information provided periodically throughout the previous year by the Adviser as well as the Board’s familiarity with management through Board meetings, discussions and other reports. The Board considered the Adviser’s management style and its performance in employing its investment strategies as well as its current level of staffing and overall resources. The Board also noted that it reviewed on a quarterly basis information regarding the Adviser’s compliance with applicable policies and procedures, including those related to personal investing. The Board took into account, among other items, periodic reports received from the Adviser over the past year concerning the Adviser’s ongoing review and enhancement of certain processes, policies and procedures of the Calvert Funds and the Adviser. The Board concluded that it was satisfied with the nature, extent and quality of services provided to the Fund by the Adviser under the investment advisory agreement.
Fund Performance
In considering the Fund’s performance, the Board noted that it reviewed on a quarterly basis detailed information about the Fund’s performance results, portfolio composition and investment strategies. The Board compared the Fund’s investment performance to that of the Fund’s performance universe and the index it is designed to track. The Board’s review included comparative performance data for the one-, three- and five-year periods ended December 31, 2022. This performance data indicated that the Fund had underperformed the median of its peer universe for the one-year period ended December 31, 2022, while it had outperformed the median of its peer universe for the three- and five-year periods ended December 31, 2022. This data also indicated that the Fund had underperformed the index it is designed to track for the one-, three- and five-year periods ended December 31, 2022. The Board took into account management’s discussion of the Fund’s performance. Based upon its review, the Board concluded that the Fund’s performance was satisfactory relative to the performance of its peer universe and the index it is designed to track.
Calvert
US Large-Cap Core Responsible Index Fund
September 30, 2023
Board of Directors' Contract Approval — continued
Management Fees and Expenses
In considering the Fund’s fees and expenses, the Board compared the Fund’s fees and total expense ratio with those of comparable funds in its expense group. Among other findings, the data indicated that the Fund’s advisory and administrative fees (after taking into account waivers and/or reimbursements) (referred to collectively as “management fees”) and the Fund’s total expenses (net of waivers and/or reimbursements) were each below the respective median of the Fund’s expense group. The Board took into account the Adviser’s current undertaking to maintain expense limitations for the Fund and that the Adviser was waiving and/or reimbursing a portion of the Fund’s expenses. Based upon its review, the Board concluded that the management fees were reasonable in view of the nature, extent and quality of services provided by the Adviser.
Profitability and Other “Fall-Out” Benefits
The Board reviewed the Adviser’s profitability in regard to the Fund and the Calvert Funds in the aggregate. In reviewing the overall profitability of the Fund to the Adviser, the Board also considered the fact that the Adviser and its affiliates provided sub-transfer agency support, administrative and distribution services to the Fund for which they received compensation. The information considered by the Board included the profitability of the Fund to the Adviser and its affiliates without regard to any marketing support or other payments by the Adviser and its affiliates to third parties in respect of distribution services. The Board also considered that the Adviser and its affiliates derived benefits to their reputation and other indirect benefits from their relationships with the Fund. Based upon its review, the Board concluded that the Adviser’s and its affiliates’ level of profitability from their relationships with the Fund was reasonable.
Economies of Scale
The Board considered the effect of the Fund’s current size and its potential growth on its performance and fees. The Board concluded that adding breakpoints to the advisory fee at specified asset levels would not be appropriate at this time. The Board noted that if the Fund’s assets increased over time, the Fund might realize other economies of scale if assets increased proportionally more than certain other expenses.
Calvert
US Large-Cap Core Responsible Index Fund
September 30, 2023
Liquidity Risk Management Program
The Fund has implemented a written liquidity risk management program (Program) and related procedures to manage its liquidity in accordance with Rule 22e-4 under the Investment Company Act of 1940, as amended (Liquidity Rule). The Liquidity Rule defines “liquidity risk” as the risk that a fund could not meet requests to redeem shares issued by the fund without significant dilution of the remaining investors’ interests in the fund. The Fund’s Board of Trustees/Directors has designated the investment adviser to serve as the administrator of the Program and the related procedures. The administrator has established a Liquidity Risk Management Oversight Committee (Committee) to perform the functions necessary to administer the Program. As part of the Program, the administrator is responsible for identifying illiquid investments and categorizing the relative liquidity of the Fund’s investments in accordance with the Liquidity Rule. Under the Program, the administrator assesses, manages, and periodically reviews the Fund’s liquidity risk, and is responsible for making certain reports to the Fund’s Board of Trustees/Directors and the Securities and Exchange Commission (SEC) regarding the liquidity of the Fund’s investments, and to notify the Board of Trustees/Directors and the SEC of certain liquidity events specified in the Liquidity Rule. The liquidity of the Fund’s portfolio investments is determined based on a number of factors including, but not limited to, relevant market, trading and investment-specific considerations under the Program.
At a meeting of the Fund’s Board of Trustees/Directors on June 13, 2023, the Committee provided a written report to the Fund’s Board of Trustees/ Directors pertaining to the operation, adequacy, and effectiveness of implementation of the Program, as well as the operation of the highly liquid investment minimum (if applicable) for the period January 1, 2022 through December 31, 2022 (Review Period). The Program operated effectively during the Review Period, supporting the administrator’s ability to assess, manage and monitor Fund liquidity risk, including during periods of market volatility and net redemptions. During the Review Period, the Fund met redemption requests on a timely basis.
There can be no assurance that the Program will achieve its objectives in the future. Please refer to the Fund’s prospectus for more information regarding the Fund’s exposure to liquidity risk and other principal risks to which an investment in the Fund may be subject.
Calvert
US Large-Cap Core Responsible Index Fund
September 30, 2023
Management and Organization
Fund Management. The Directors of Calvert Responsible Index Series, Inc. (the Corporation) are responsible for the overall management and supervision of the affairs of the Corporation. The Board members and officers of the Corporation are listed below. Except as indicated, each individual has held the office shown or other offices in the same company for the last five years. Board members hold indefinite terms of office. Each Board member holds office until his or her successor is elected and qualified, or until his or her earlier death, resignation, retirement, removal or disqualification. Under the terms of the Fund's current Board member retirement policy, an Independent Board member must retire at the end of the calendar year in which he or she turns 75. However, if such retirement would cause the Fund to be out of compliance with Section 16 of the 1940 Act or any other regulations or guidance of the SEC, then such retirement will not become effective until such time as action has been taken for the Fund to be in compliance therewith. The “noninterested Directors” consist of those Directors who are not “interested persons” of the Corporation, as that term is defined under the 1940 Act. The business address of each Board member and the Chief Compliance Officer is 2050 M Street NW, Washington, DC 20036 and the business address of the Secretary, Vice President and Chief Legal Officer and the Treasurer is Two International Place, Boston, Massachusetts 02110. As used below, “CRM” refers to Calvert Research and Management and “Eaton Vance” refers to Eaton Vance Management. Each Director oversees 46 funds in the Calvert fund complex. Each of Eaton Vance and CRM are indirect, wholly owned subsidiaries of Morgan Stanley. Each officer affiliated with CRM may hold a position with other CRM affiliates that is comparable to his or her position with CRM listed below.
| Name and Year of Birth | Corporation
Position(s) | Length of
Service | Principal Occupation(s) and Other Directorships
During Past Five Years and Other Relevant Experience |
| Interested Director | | | |
Theodore H. Eliopoulos(1)
1964 | Director and
President | Since 2022 | President and Chief Executive Officer of CRM and senior sponsor of Morgan Stanley Investment Management’s (MSIM) Diversity Council. Formerly, Vice Chairman & Head of Strategic Partnerships at MSIM (2019-2022). Former Chief Investment Officer and interim Chief Investment Officer (2014-2018) and Senior Investment Officer of Real Estate and Real Assets at California Public Employees’ Retirement System (CalPERS) (2007-2014). Former Chief Deputy Treasurer and Deputy Treasurer at the California State Treasurer's Office (2002-2006). Mr. Eliopoulos is an interested person because of his positions with CRM and certain affiliates.
Other Directorships. The Robert Toigo Foundation; Pacific Pension & Investment Institute (PPI). |
| Noninterested Directors |
Richard L. Baird, Jr.(2)
1948 | Director | Since 2000 | Regional Disaster Recovery Lead, American Red Cross of Greater
Pennsylvania (since 2017). Volunteer, American Red Cross (since 2015).
Former President and CEO of Adagio Health Inc. (retired in 2014) in
Pittsburgh, PA.
Other Directorships. None. |
Alice Gresham Bullock
1950 | Chair and
Director | Since 2016 | Professor Emerita at Howard University School of Law. Dean Emerita of
Howard University School of Law and Deputy Director of the Association
of American Law Schools (1992-1994).
Other Directorships. None. |
Cari M. Dominguez
1949 | Director | Since 2016 | Former Chair of the U.S. Equal Employment Opportunity Commission.
Other Directorships. ManpowerGroup Inc. (workforce solutions company);
Triple S Management Corporation (managed care); National Association of Corporate Directors. |
Karen Fang(3)
1958 | Director | Since 2023 | Formerly, Managing Director, Wealth Management at GAMCO Asset Management (asset management firm) (2020-2023). Formerly, Managing Director, Senior Portfolio Manager of Fiduciary Trust Company International (wealth management firm) (1993-2019).
Other Directorships. None. |
John G. Guffey, Jr.(2)
1948 | Director | Since 2000 | President of Aurora Press Inc., a privately held publisher of trade paperbacks
(since January 1997).
Other Directorships. Calvert Impact Capital, Inc. (through December 31, 2018); Calvert Ventures, LLC. |
Miles D. Harper, III
1962 | Director | Since 2005 | Partner, Carr Riggs & Ingram (public accounting firm) since October 2014.
Partner, Gainer Donnelly & Desroches (public accounting firm) (now Carr
Riggs & Ingram) (November 1999 - September 2014).
Other Directorships. Bridgeway Funds (9) (asset management). |
Joy V. Jones
1950 | Director | Since 2000 | Attorney.
Other Directorships. Palm Management Corporation. |
Calvert
US Large-Cap Core Responsible Index Fund
September 30, 2023
Management and Organization — continued
| Name and Year of Birth | Corporation
Position(s) | Length of
Service | Principal Occupation(s) and Other Directorships
During Past Five Years and Other Relevant Experience |
| Noninterested Directors (continued) |
Eddie Ramos(3)
1967 | Director | Since 2023 | Private investor (2022-present). Formerly, Head of External Advisors/Diversity Portfolio Management at the New Jersey Division of Investment (2020-2022). Formerly, Chief Investment Officer and Lead Portfolio Manager – Global Fundamental Equities at Cornerstone Capital Management (asset management firm) (2011-2017).
Other Directorships. Macquarie Optimum Funds (6) (asset management). |
Anthony A. Williams
1951 | Director | Since 2016 | CEO and Executive Director of the Federal City Council (July 2012 to
present); Senior Adviser and Independent Consultant for King and
Spalding LLP (September 2015 to present); Executive Director of Global
Government Practice at the Corporate Executive Board (January 2010 to
January 2012).
Other Directorships. Freddie Mac; Evoq Properties/Meruelo Maddux
Properties, Inc. (real estate management); Weston Solutions, Inc.
(environmental services); Bipartisan Policy Center’s Debt Reduction Task Force;
Chesapeake Bay Foundation; Catholic University of America; Urban Institute (research organization); The Howard Hughes Corporation (real estate development); Old Dominion National Bank. |
| Name and Year of Birth | Corporation
Position(s) | Length of
Service | Principal Occupation(s)
During Past Five Years |
| Principal Officers who are not Directors |
Hope L. Brown
1973 | Chief
Compliance
Officer | Since 2014 | Chief Compliance Officer of 46 registered investment companies advised
by CRM (since 2014). Vice President and Chief Compliance Officer,
Wilmington Funds (2012-2014). |
Deidre E. Walsh
1971 | Secretary,
Vice President
and Chief
Legal Officer | Since 2021 | Vice President of CRM and officer of 46 registered investment companies
advised by CRM (since 2021). Also Vice President of Eaton Vance and
certain of its affiliates and officer of 127 registered investment companies
advised or administered by Eaton Vance. |
James F. Kirchner
1967 | Treasurer | Since 2016 | Vice President of CRM and officer of 46 registered investment companies
advised by CRM (since 2016). Also Vice President of Eaton Vance and
certain of its affiliates and officer of 127 registered investment companies
advised or administered by Eaton Vance. |
| | | | |
| (1) Mr. Eliopoulos is an interested person of the Fund because of his positions with the Fund’s adviser and certain affiliates. |
| (2) Effective December 31, 2023, Richard L. Baird, Jr. and John G. Guffey, Jr. will retire from the Board of Directors. |
| (3) Ms. Fang and Mr. Ramos began serving as Directors effective October 30, 2023. |
The SAI for the Fund includes additional information about the Directors and officers of the Fund and can be obtained without charge on Calvert’s website at www.calvert.com or by calling 1-800-368-2745.
| FACTS | WHAT DOES EATON VANCE DO WITH YOUR
PERSONAL INFORMATION? |
| Why? | Financial companies choose how they share your personal information. Federal law gives consumers the right to limit some but not all sharing. Federal law also requires us to tell you how we collect, share, and protect your personal information. Please read this notice carefully to understand what we do. |
| |
| What? | The types of personal information we collect and share depend on the product or service you have with us. This information can include:■ Social Security number and income
■
investment experience and risk tolerance
■
checking account number and wire transfer instructions |
| |
| How? | All financial companies need to share customers’ personal information to run their everyday business. In the section below, we list the reasons financial companies can share their customers’ personal information; the reasons Eaton Vance chooses to share; and whether you can limit this sharing. |
Reasons we can share your
personal information | Does Eaton Vance
share? | Can you limit
this sharing? |
| For our everyday business purposes — such as to process your transactions, maintain your account(s), respond to court orders and legal investigations, or report to credit bureaus | Yes | No |
| For our marketing purposes — to offer our products and services to you | Yes | No |
| For joint marketing with other financial companies | No | We don’t share |
| For our investment management affiliates’ everyday business purposes — information about your transactions, experiences, and creditworthiness | Yes | Yes |
| For our affiliates’ everyday business purposes — information about your transactions and experiences | Yes | No |
| For our affiliates’ everyday business purposes — information about your creditworthiness | No | We don’t share |
| For our investment management affiliates to market to you | Yes | Yes |
| For our affiliates to market to you | No | We don’t share |
| For nonaffiliates to market to you | No | We don’t share |
To limit our
sharing | Call toll-free 1-800-368-2745 or email: CRMPrivacy@calvert.comPlease note:If you are a new customer, we can begin sharing your information 30 days from the date we sent this notice. When you are no longer our customer, we continue to share your information as described in this notice. However, you can contact us at any time to limit our sharing. |
| Questions? | Call toll-free 1-800-368-2745 or email: CRMPrivacy@calvert.com |
| Privacy Notice — continued | April 2021 |
| Who we are |
| Who is providing this notice? | Eaton Vance Management, Eaton Vance Distributors, Inc., Eaton Vance Trust Company, Eaton Vance Management (International) Limited, Eaton Vance Advisers International Ltd., Eaton Vance Global Advisors Limited, Eaton Vance Management’s Real Estate Investment Group, Boston Management and Research, Calvert Research and Management, Eaton Vance and Calvert Fund Families and our investment advisory affiliates (“Eaton Vance”) (see Investment Management Affiliates definition below) |
| What we do |
How does Eaton Vance
protect my personal
information? | To protect your personal information from unauthorized access and use, we use security measures that comply with federal law. These measures include computer safeguards and secured files and buildings. We have policies governing the proper handling of customer information by personnel and requiring third parties that provide support to adhere to appropriate security standards with respect to such information. |
How does Eaton Vance
collect my personal
information? | We collect your personal information, for example, when you■ open an account or make deposits or withdrawals from your account
■
buy securities from us or make a wire transfer
■
give us your contact informationWe also collect your personal information from others, such as credit bureaus, affiliates, or other companies. |
| Why can’t I limit all sharing? | Federal law gives you the right to limit only■ sharing for affiliates’ everyday business purposes — information about your creditworthiness
■
affiliates from using your information to market to you
■
sharing for nonaffiliates to market to youState laws and individual companies may give you additional rights to limit sharing. See below for more on your rights under state law. |
| Definitions |
Investment Management
Affiliates | Eaton Vance Investment Management Affiliates include registered investment advisers, registered broker- dealers, and registered and unregistered funds. Investment Management Affiliates does not include entities associated with Morgan Stanley Wealth Management, such as Morgan Stanley Smith Barney LLC and Morgan Stanley & Co. |
| Affiliates | Companies related by common ownership or control. They can be financial and nonfinancial companies.■ Our affiliates include companies with a Morgan Stanley name and financial companies such as Morgan Stanley Smith Barney LLC and Morgan Stanley & Co. |
| Nonaffiliates | Companies not related by common ownership or control. They can be financial and nonfinancial companies.■ Eaton Vance does not share with nonaffiliates so they can market to you. |
| Joint marketing | A formal agreement between nonaffiliated financial companies that together market financial products or services to you.■ Eaton Vance doesn’t jointly market. |
| Other important information |
| Vermont: Except as permitted by law, we will not share personal information we collect about Vermont residents with Nonaffiliates unless you provide us with your written consent to share such information.California: Except as permitted by law, we will not share personal information we collect about California residents with Nonaffiliates and we will limit sharing such personal information with our Affiliates to comply with California privacy laws that apply to us. |
Delivery of Shareholder Documents. The Securities and Exchange Commission (SEC) permits funds to deliver only one copy of shareholder documents, including prospectuses, proxy statements and shareholder reports, to fund investors with multiple accounts at the same residential or post office box address. This practice is often called “householding” and it helps eliminate duplicate mailings to shareholders. Calvert funds, or your financial intermediary, may household the mailing of your documents indefinitely unless you instruct Calvert funds, or your financial intermediary, otherwise. If you would prefer that your Calvert fund documents not be householded, please contact Calvert funds at 1-800-368-2745, or contact your financial intermediary. Your instructions that householding not apply to delivery of your Calvert fund documents will typically be effective within 30 days of receipt by Calvert funds or your financial intermediary.
Portfolio Holdings. Each Calvert fund files a schedule of portfolio holdings on Part F to Form N-PORT with the SEC. Certain information filed on Form N-PORT may be viewed on the Calvert website at www.calvert.com, by calling Calvert at 1-800-368-2745 or in the EDGAR database on the SEC’s website at www.sec.gov.
Proxy Voting. The Proxy Voting Guidelines that each Calvert fund uses to determine how to vote proxies relating to portfolio securities is provided as an Appendix to the fund’s Statement of Additional Information. The Statement of Additional Information can be obtained free of charge by calling the Calvert funds at 1-800-368-2745, by visiting the Calvert funds’ website at www.calvert.com or visiting the SEC’s website at www.sec.gov. Information regarding how a Calvert fund voted proxies relating to portfolio securities during the most recent 12-month period ended June 30 is available by calling Calvert funds, by visiting the Calvert funds’ website at www.calvert.com or by visiting the SEC’s website at www.sec.gov.
Tailored Shareholder Reports. Effective January 24, 2023, the SEC adopted rule and form amendments to require open-end mutual funds and ETFs to transmit concise and visually engaging streamlined annual and semiannual reports to shareholders that highlight key information. Other information, including financial statements, will no longer appear in a streamlined shareholder report but must be available online, delivered free of charge upon request, and filed on a semiannual basis on Form N-CSR. The rule and form amendments have a compliance date of July 24, 2024. At this time, management is evaluating the impact of these amendments on the shareholder reports for the Calvert Funds.
This Page Intentionally Left Blank
This Page Intentionally Left Blank
Investment Adviser and Administrator
Calvert Research and Management
2050 M Street NW
Washington, DC 20036
Principal Underwriter*
Eaton Vance Distributors, Inc.
Two International Place
Boston, MA 02110
(617) 482-8260
Custodian
State Street Bank and Trust Company
One Congress Street, Suite 1
Boston, MA 02114-2016
Transfer Agent
SS&C Global Investor & Distribution Solutions, Inc.
2000 Crown Colony Drive
Quincy, MA 02169
Independent Registered Public Accounting Firm
Deloitte & Touche LLP
200 Berkeley Street
Boston, MA 02116-5022
Fund Offices
2050 M Street NW
Washington, DC 20036
* FINRA BrokerCheck. Investors may check the background of their Investment Professional by contacting the Financial Industry Regulatory Authority (FINRA). FINRA BrokerCheck is a free tool to help investors check the professional background of current and former FINRA-registered securities firms and brokers. FINRA BrokerCheck is available by calling 1-800-289-9999 and at www.FINRA.org. The FINRA BrokerCheck brochure describing this program is available to investors at www.FINRA.org.
Printed on recycled paper.
24187 9.30.23
Item 2. Code of Ethics
The registrant has adopted a code of ethics applicable to its Principal Executive Officer, Principal Financial Officer and Principal Accounting Officer. The registrant undertakes to provide a copy of such code of ethics to any person upon request, without charge, by calling 1-800-368-2745. The registrant has not amended the code of ethics as described in Form N-CSR during the period covered by this report. The registrant has not granted any waiver, including an implicit waiver, from a provision of the code of ethics as described in Form N-CSR during the period covered by this report.
Item 3. Audit Committee Financial Expert
The registrant’s Board of Directors has determined that Miles D. Harper III, an “independent” Director serving on the registrant’s audit committee, is an “audit committee financial expert,” as defined in Item 3 of Form N-CSR. Under applicable securities laws, a person who is determined to be an audit committee financial expert will not be deemed an “expert” for any purpose, including without limitation for the purposes of Section 11 of the Securities Act of 1933, as a result of being designated or identified as an audit committee financial expert.
The designation or identification of a person as an audit committee financial expert does not impose on such person any duties, obligations, or liabilities that are greater than the duties, obligations, and liabilities imposed on such person as a member of the audit committee and Board of Directors in the absence of such designation or identification.
Item 4. Principal Accountant Fees and Services
(a) –(d)
The following table presents the aggregate fees billed to the registrant for the registrant’s fiscal years ended September 30, 2022 and September 30, 2023 by its principal accountant for professional services rendered for the audit of the registrant’s annual financial statements and fees billed for other services rendered by its principal accountant during such periods.
| | | | | | | | | | | | | | | | |
Fiscal Years Ended | | 9/30/22 | | | %* | | | 9/30/23 | | | %* | |
Audit Fees | | $ | 111,000 | | | | 0 | % | | $ | 122,600 | | | | 0 | % |
Audit-Related Fees(1) | | $ | 0 | | | | 0 | % | | $ | 0 | | | | 0 | % |
Tax Fees(2) | | $ | 0 | | | | 0 | % | | $ | 0 | | | | 0 | % |
All Other Fees(3) | | $ | 0 | | | | 0 | % | | $ | 0 | | | | 0 | % |
| | | | | | | | | | | | | | | | |
Total | | $ | 111,000 | | | | 0 | % | | $ | 122,600 | | | | 0 | % |
| | | | | | | | | | | | | | | | |
| * | Percentage of fees approved by the Audit Committee pursuant to (c)(7)(i)(C) of Rule 2-01 of Reg. S-X (statutory de minimus waiver of Committee’s requirement to pre-approve). |
| (1) | Audit-related fees consist of the aggregate fees billed for assurance and related services that are reasonably related to the performance of the audit of the registrant’s financial statements and are not reported under the category of audit fees. |
| (2) | Tax fees consist of the aggregate fees billed for professional services rendered by the principal accountant relating to tax compliance, tax advice, and tax planning and specifically include fees for tax return preparation and other related tax compliance/planning matters. |
| (3) | All other fees consist of the aggregate fees billed for products and services provided by the principal accountant other than audit, audit-related, and tax services. |
(e) The Audit Committee is required to pre-approve all audit and non-audit services provided to the registrant by the auditors, and to the registrant’s investment adviser, and any entity controlling, controlled by, or under common control with the adviser that provides ongoing services to the registrant. In determining whether to pre-approve non-audit services, the Audit Committee considers whether the services are consistent with maintaining the independence of the auditors. The Committee may delegate its authority to pre-approve certain matters to one or more of its members. In this regard, the Committee has delegated authority jointly to the Audit Committee Chair together with another Committee member with respect to non-audit services not exceeding $25,000 in each instance. In addition, the Committee has pre-approved the retention of the auditors to provide tax-related services related to the tax treatment and tax accounting of newly acquired securities, upon request by the investment adviser in each instance.
(f) Not applicable.
(g) Aggregate non-audit fees billed by the registrant’s principal accountant for services rendered to the registrant, and rendered to the registrant’s investment adviser, and any entity controlling, controlled by, or under common control with the adviser that provides ongoing services to the registrant for each of the last two fiscal years of the registrant:
| | | | | | |
Fiscal Year ended 9/30/22 | | Fiscal Year ended 9/30/23 |
$ | | %* | | $ | | %* |
$0 | | 0% | | $0 | | 0% |
| * | Percentage of fees approved by the Audit Committee pursuant to (c)(7)(i)(C) of Rule 2-01 of Reg. S-X (statutory de minimus waiver of Committee’s requirement to pre-approve). |
(h) The registrant’s audit committee has considered whether the provision by the registrant’s principal accountant of non-audit services to the registrant’s investment adviser and any entity controlling, controlled by, or under common control with the adviser that provides ongoing services to the registrant that were not pre-approved pursuant to Rule 2-01(c)(7)(ii) of Regulation S-X is compatible with maintaining the principal accountant’s independence.
(i) Not applicable.
(j) Not applicable.
Item 5. Audit Committee of Listed Registrants
Not applicable.
Item 6. Schedule of Investments
Please see schedule of investments contained in the Report to Stockholders included under Item 1 of this Form N-CSR.
Item 7. Disclosure of Proxy Voting Policies and Procedures for Closed-End Management Investment Companies
Not applicable.
Item 8. Portfolio Managers of Closed-End Management Investment Companies
Not applicable.
Item 9. Purchases of Equity Securities by Closed-End Management Investment Company and Affiliated Purchasers
Not applicable.
Item 10. Submission of Matters to a Vote of Security Holders
No material changes.
Item 11. Controls and Procedures
(a) The registrant’s principal executive and principal financial officers have concluded that the registrant’s disclosure controls and procedures (as defined in Rule 30a-3(c) under the Investment Company Act of 1940 Act, as amended (the “1940 Act”) are effective, based on the evaluation of these controls and procedures required by Rule 30a-3(b) under the 1940 Act and Rules 13a-15(b) or 15d-15(b) under the Securities Exchange Act of 1934 (“Exchange Act”), as of a date within 90 days of the filing date of this report.
(b) There was no change in the registrant’s internal control over financial reporting (as defined in Rule 30a-3(d) under the 1940 Act) that occurred during the period covered by this report that has materially affected, or is reasonably likely to materially affect, the registrant’s internal control over financial reporting.
Item 12. Disclosure of Securities Lending Activities for Closed-End Management Investment Companies
Not applicable.
Item 13. Exhibits
Signatures
Pursuant to the requirements of the Securities Exchange Act of 1934 and the Investment Company Act of 1940, the registrant has duly caused this report to be signed on its behalf by the undersigned, thereunto duly authorized.
| | |
CALVERT RESPONSIBLE INDEX SERIES, INC. |
| |
| By: | | /s/ Theodore H. Eliopoulos |
| | Theodore H. Eliopoulos |
| | President |
| |
| Date: | | November 22, 2023 |
Pursuant to the requirements of the Securities Exchange Act of 1934 and the Investment Company Act of 1940, this report has been signed below by the following persons on behalf of the registrant and in the capacities and on the dates indicated.
| | |
| By: | | /s/ James F. Kirchner |
| | James F. Kirchner |
| | Treasurer |
| |
Date: | | November 22, 2023 |
| |
| By: | | /s/ Theodore H. Eliopoulos |
| | Theodore H. Eliopoulos |
| | President |
| |
Date: | | November 22, 2023 |