UNITED STATES
SECURITIES AND EXCHANGE COMMISSION
Washington, D.C. 20549
FORM N-CSR
CERTIFIED SHAREHOLDER REPORT OF REGISTERED
MANAGEMENT INVESTMENT COMPANIES
Investment Company Act file number 811-09821
Allied Asset Advisors Funds
(Exact name of Registrant as specified in charter)
721 Enterprise Drive, Suite 100
Oak Brook, IL 60523
(Address of principal executive offices) (Zip code)
Bassam Osman
Allied Asset Advisors Funds
721 Enterprise Drive, Suite 100
Oak Brook, IL 60523
(Name and address of agent for service)
(877) 417-6161
Registrant's telephone number, including area code
Date of fiscal year end: May 31, 2012
Date of reporting period: May 31, 2012
Item 1. Reports to Stockholders.
Annual Report
May 31, 2012
Iman Fund
IMAN FUND
July 20, 2012
Dear Shareholders,
Assalumu Alaykum (greetings of peace),
The fiscal year ending on May 31, 2012 was challenging to stock investors as global equity markets experienced one of the most volatile market conditions since the 1930s. This can be attributed to concerns about eurozone and U.S. government debt, lackluster growth in the U.S., no growth in Europe, slowing growth in China, and tension in the Middle East. The downturn began in July and early August, 2011, with the U.S. Congress fiasco on raising the debt ceiling and the Standard & Poor’s downgrading of the credit rating of the United States. Better corporate earnings in 2011 were lost among macroeconomic market concerns. The slowing of the global economy especially affected international stocks. Comparing broad U.S. stock indexes with global and international stock indexes highlights the greater damage to these international stocks. Gold and gold mining stocks were not immune and they went down as well. These factors affected the Iman Fund’s performance as it owned a sizable percentage of international and gold mining stocks for a significant period of this fiscal year. Though international stocks hurt the Fund in this reporting period, we believe that including them is beneficial in the long run as historical data has shown.
U.S. stock markets rode a wave of optimism during the first quarter of 2012, encouraged by better domestic economic news and initial signs of moving towards resolution to the sovereign debt crises in Europe. The U.S. stocks were lifted in the first quarter by a healthy corporate sector, strong consumer activity and better unemployment news. This helped major equity benchmarks deliver their best first-quarter performance in a calendar year since 1998. However the party did not last long and the following months witnessed a correction, eroding most of the gains. Concern increased again among conflicting signs that Europe was hesitantly moving towards a solution to its fiscal imbalances, and the weakening of the subpar growth in the U.S. economy and employment numbers.
As we look to the next fiscal year, we are optimistic but also realistic. The financial community is obsessed with the European financial crisis. Most believe that Europe is not going to be growing at all or might even go into a recession. However, European stocks already reflect this expectation and some are currently underpriced. The U.S. economy will probably continue to grow slowly. The improvement in manufacturing is encouraging but the market nowadays is more influenced by consumer sentiment. We are now five years past the peak in the housing market. Housing prices appear to have stabilized and employment is improving, though sluggishly. The U.S. is a very large and dynamic market with many entrepreneurial companies that are continuing to grow. In short, we believe the United States stock markets will improve modestly in the coming year.
We are confident that the Fund’s portfolio is very well positioned. The Fund is acquiring shares in carefully selected companies including consumer-based cyclical stocks which are trading at attractive valuations, as well as defensive stocks, including stocks in sectors like healthcare. However technology will remain the Fund’s largest sector holding. We are emphasizing companies with significant cash flow, dominant market share, and the ability to increase prices in low-inflation environment.
We believe that a basic tenet of successful investing is to invest for the long run; riding out the markets’ inevitable ups and downs, rather than selling into panic or chasing the hottest fad. Patience could also afford the benefits of compounding, lower transaction cost, and reduced taxes. Another tenet is investing regularly, which can help lower the average cost of your purchases. Investing a fixed sum of money each month or quarter ensures that you won’t purchase all your shares at market highs. This strategy — known as dollar cost averaging — also takes out “emotion” from investing, and helps shareholders avoid irrational panics. No strategy can eliminate risk, but prudent strategies could considerably decrease the impact of short-term declines.
We will continue to be vigilant in following market changes and look carefully for investment opportunities. We thank you for entrusting your hard-earned money with us. We promise to continue to work hard to prove worthy of your trust.
Bassam Osman
President, Iman Fund
IMAN FUND
Past performance is not a guarantee of future results.
The above discussion and analysis of the Fund reflect the opinions of the Advisor as of January 2012, are subject to change, and any forecasts made cannot be guaranteed and should not be considered investment advice.
Mutual Fund investing involves risk; principal loss is possible. The Fund invests in foreign securities which involve greater volatility and political, economic and currency risks and differences in accounting methods. Historically, the Advisor believes that the Islamic restrictions placed on the Fund have not adversely affected the Fund; however, it is possible that these restrictions may result in the Fund not performing as well as mutual funds not subject to such restrictions. Investments in smaller companies involve additional risk, such as limited liquidity and greater volatility.
Diversification does not assure a profit or protect against loss in a declining market.
Cash flow measures the cash generating capability of a company by adding non cash charges (e.g. depreciation) and interest expenses to pretax income.
Dollar Cost Averaging involves continuous investment in securities regardless of fluctuating price levels of such securities. The investor should consider his/her financial ability to continue purchases through periods of low price levels. Such a plan does not assure a profit and does not protect against loss in declining markets.
Fund holdings and sector allocations are subject to change and should not be considered a recommendation to buy or sell any security. For a complete list of fund holdings please refer to the Schedule of Investments included in this report.
2
IMAN FUND
EXPENSE EXAMPLE
May 31, 2012 (Unaudited)
As a shareholder of the Fund, you incur two types of costs: (1) transaction costs and (2) ongoing costs, including management fees and other Fund expenses. This Example is intended to help you understand your ongoing costs (in dollars) of investing in the Fund and to compare these costs with the ongoing costs of investing in other mutual funds. The Example is based on an investment of $1,000 invested at the beginning of the period and held for the entire period (12/1/11 - 5/31/12).
Actual Expenses
The first line of the table below provides information about actual account values and actual expenses. Although the Fund charges no sales load or transaction fees, you will be assessed fees for outgoing wire transfers, returned checks and stop payment orders at prevailing rates charged by U.S. Bancorp Fund Services, LLC, the Fund’s transfer agent. If you request a redemption be made by wire transfer, currently a $15.00 fee is charged by the Fund’s transfer agent. IRA accounts will be charged a $15.00 annual maintenance fee. The example below includes, but is not limited to, management fees, fund accounting, custody and transfer agent fees. However, the example below does not include portfolio trading commissions and related expenses, and other extraordinary expenses as determined under generally accepted accounting principles. You may use the information in this line, together with the amount you invested, to estimate the expenses that you paid over the period. Simply divide your account value by $1,000 (for example, an $8,600 account value divided by $1,000 = 8.6), then multiply the result by the number in the first line under the heading entitled “Expenses Paid During Period” to estimate the expenses you paid on your account during this period.
Hypothetical Example for Comparison Purposes
The second line of the table below provides information about hypothetical account values and hypothetical expenses based on the Fund’s actual expense ratio and an assumed rate of return of 5% per year before expenses, which is not the Fund’s actual return. The hypothetical account values and expenses may not be used to estimate the actual ending account balance or expenses you paid for the period. You may use this information to compare the ongoing costs of investing in the Fund and other funds. To do so, compare this 5% hypothetical example with the 5% hypothetical examples that appear in the shareholder reports of the other funds. Please note that the expenses shown in the table are meant to highlight your ongoing costs only and do not reflect any transactional costs, such as sales charges (loads), redemption fees, or exchange fees. Therefore, the second line of the table is useful in comparing ongoing costs only, and will not help you determine the relative total costs of owning different funds. In addition, if these transactional costs were included, your costs would have been higher. Please note that Iman Fund does not have any sales charge (loads), redemption fees, or exchange fees.
| Beginning | Ending | Expenses Paid | |
| Account Value | Account Value | During Period | |
| 12/1/11 | 5/31/12 | 12/1/11 - 5/31/12* | |
| Actual | $1,000.00 | $1,024.50 | $8.60 |
| Hypothetical (5% return before expenses) | 1,000.00 | 1,016.50 | 8.57 |
| * | Expenses are equal to the Fund’s annualized expense ratio of 1.70% multiplied by the average account value over the period multiplied by 183/366 (to reflect the one-half year period). |
3
IMAN FUND
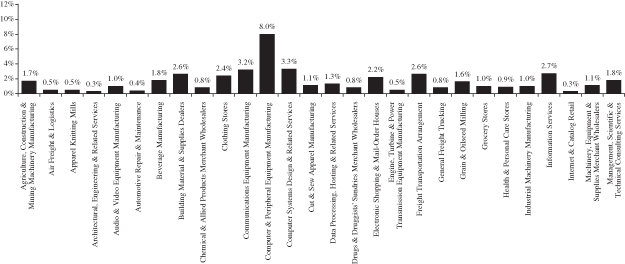
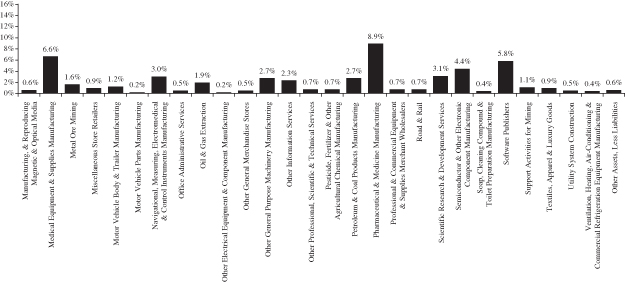
ALLOCATION OF PORTFOLIO ASSETS
(Calculated as a percentage of net assets)
May 31, 2012 (Unaudited)
4
IMAN FUND
Total Rate of Return
For the Period May 31, 2002 to May 31, 2012
(Unaudited)
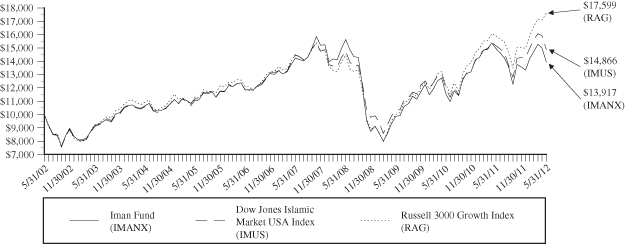
This chart assumes an initial investment of $10,000 made on May 31, 2002 and held through May 31, 2012.
Performance data quoted represents past performance and does not guarantee future results. The investment return and principal value of an investment will fluctuate so that an investor’s shares, when redeemed, may be worth more or less than their original cost. Current performance of the Fund may be lower or higher than the performance quoted. Performance data current to the recent month end may be obtained by visiting www.investaaa.com.
Indices mentioned are unmanaged and used to measure U.S. markets. You cannot invest directly in an index.
The graph and table do not reflect the deduction of taxes that a shareholder would pay on fund distributions or redemptions of fund shares.
| Six | One | Five | Ten | |
| Average Annual Total Return as of May 31, 2012 | Months | Year | Years | Years |
| Iman Fund | 2.45% | (6.91)% | (0.43)% | 3.37% |
| Dow Jones Islamic Market USA Index* | 0.08% | (2.37)% | 0.48% | 4.00% |
| Russell 3000 Growth Index** | 6.55% | 0.56% | 1.92% | 4.81% |
| * | The Dow Jones Islamic Market USA Index is a diversified compilation of U.S. equity securities considered by Dow Jones to be in compliance with Islamic principles. The index is constructed from stocks in the Dow Jones Indexes (DJGI) family. Dow Jones believes that these stocks are accessible to investors and are well traded. The DJGI methodology removes issues that are not suitable for global investing. The performance of the Dow Jones Islamic Market USA Index does not include the reinvestment of dividends. |
| ** | The Russell 3000 Growth Index takes the largest 3,000 U.S. companies based on market capitalization and measures the performance of those with higher price-to-book ratios and higher forecasted growth values. |
5
IMAN FUND
SCHEDULE OF INVESTMENTS
May 31, 2012
(Classifications are based on the North American Industry Classification System)
| Number of | |||||||
| Shares | Value | ||||||
| COMMON STOCKS - 99.4% | |||||||
| AGRICULTURE, CONSTRUCTION | |||||||
| & MINING MACHINERY | |||||||
| MANUFACTURING - 1.7% | |||||||
| 3,600 | Dril-quip, Inc. (a) | $ | 218,124 | ||||
| 5,100 | FMC Technologies, Inc. (a) | 205,224 | |||||
| 2,600 | The Toro Co. | 193,726 | |||||
| 617,074 | |||||||
| AIR FREIGHT & LOGISTICS - 0.5% | |||||||
| 2,456 | United Parcel Service, Inc. - Class B | 184,053 | |||||
| APPAREL KNITTING MILLS - 0.5% | |||||||
| 4,900 | Zumiez Inc. (a) | 180,271 | |||||
| Architectural, Engineering | |||||||
| & RELATED SERVICES - 0.3% | |||||||
| 10,500 | McDermott International, Inc. (a)(b) | 106,575 | |||||
| AUDIO & VIDEO EQUIPMENT | |||||||
| MANUFACTURING - 1.0% | |||||||
| 9,500 | Harman International Industries, Inc. | 372,590 | |||||
| AUTOMOTIVE REPAIR & | |||||||
| MAINTENANCE - 0.4% | |||||||
| 4,000 | Monro Muffler Brake, Inc. | 135,160 | |||||
| BEVERAGE MANUFACTURING - 1.8% | |||||||
| 8,500 | The Coca Cola Co. | 635,205 | |||||
| BUILDING MATERIAL & | |||||||
| SUPPLIES DEALERS - 2.6% | |||||||
| 7,700 | Fastenal Co. | 340,571 | |||||
| 4,600 | The Sherwin-Williams Co. | 596,344 | |||||
| 936,915 | |||||||
| CHEMICAL & ALLIED PRODUCTS | |||||||
| MERCHANT WHOLESALERS - 0.8% | |||||||
| 5,100 | Acuity Brands, Inc. | 277,950 | |||||
| CLOTHING STORES - 2.4% | |||||||
| 8,400 | ANN, INC. (a) | 225,876 | |||||
| 15,300 | The TJX Companies, Inc. | 649,638 | |||||
| 875,514 | |||||||
| COMMUNICATIONS EQUIPMENT | |||||||
| MANUFACTURING - 3.2% | |||||||
| 6,000 | Motorola Solutions, Inc. | 288,480 | |||||
| 9,000 | QUALCOMM, Inc. | 515,790 | |||||
| 7,800 | Trimble Navigation Ltd. (a) | 367,887 | |||||
| 1,172,157 | |||||||
| COMPUTER & PERIPHERAL | |||||||
| EQUIPMENT MANUFACTURING - 8.0% | |||||||
| 3,500 | Apple Inc. (a) | 2,022,055 | |||||
| 3,900 | Aruba Networks, Inc. (a) | 51,246 | |||||
| 11,200 | EMC Corp. (a) | 267,120 | |||||
| 3,000 | International Business | ||||||
| Machines Corp. (IBM) | 578,700 | ||||||
| 2,919,121 | |||||||
| COMPUTER SYSTEMS DESIGN | |||||||
| & RELATED SERVICES - 3.3% | |||||||
| 6,400 | Constant Contact, Inc. (a) | 129,600 | |||||
| 700 | Priceline.com Inc. (a) | 437,843 | |||||
| 15,300 | Riverbed Technology, Inc. (a) | 250,920 | |||||
| 9,737 | Verisign (a) | 372,245 | |||||
| 1,190,608 | |||||||
| CUT & SEW APPAREL | |||||||
| MANUFACTURING - 1.1% | |||||||
| 5,500 | Lululemon Athletica Inc. (a) | 399,520 | |||||
| DATA PROCESSING, HOSTING | |||||||
| & RELATED SERVICES - 1.3% | |||||||
| 8,800 | Red Hat, Inc. (a) | 452,144 | |||||
| DRUGS & DRUGGISTS’ SUNDRIES | |||||||
| MERCHANT WHOLESALERS - 0.8% | |||||||
| 6,700 | Herbalife Ltd. (b) | 300,093 | |||||
| ELECTRONIC SHOPPING & | |||||||
| MAIL-ORDER HOUSES - 2.2% | |||||||
| 3,700 | Amazon.com, Inc. (a) | 787,767 | |||||
| ENGINE, TURBINE & POWER | |||||||
| TRANSMISSION EQUIPMENT | |||||||
| MANUFACTURING - 0.5% | |||||||
| 1,700 | Cummins, Inc. | 164,815 | |||||
The accompanying notes are an integral part of these financial statements.
6
IMAN FUND
SCHEDULE OF INVESTMENTS (Continued)
May 31, 2012
(Classifications are based on the North American Industry Classification System)
| Number of | |||||||
| Shares | Value | ||||||
| COMMON STOCKS (CONTINUED) | |||||||
| FREIGHT TRANSPORTATION | |||||||
| ARRANGEMENT - 2.6% | |||||||
| 3,600 | C.H. Robinson Worldwide, Inc. | $ | 209,736 | ||||
| 3,800 | Expeditors International of | ||||||
| Washington, Inc. | 145,350 | ||||||
| 6,600 | FedEx Corp. | 588,324 | |||||
| 943,410 | |||||||
| GENERAL FREIGHT | |||||||
| TRUCKING - 0.8% | |||||||
| 16,400 | Knight Transportation, Inc. | 274,864 | |||||
| GRAIN & OILSEED MILLING - 1.6% | |||||||
| 18,600 | Unilever NV - | ||||||
| NY Reg. Shares - ADR (b) | 583,296 | ||||||
| GROCERY STORES - 1.0% | |||||||
| 6,800 | United Natural Foods, Inc. (a) | 344,760 | |||||
| HEALTH & PERSONAL CARE | |||||||
| STORES - 0.9% | |||||||
| 3,600 | Ulta Salon, Cosmetics & | ||||||
| Fragrance, Inc. (a) | 321,732 | ||||||
| INDUSTRIAL MACHINERY | |||||||
| MANUFACTURING - 1.0% | |||||||
| 9,700 | Lam Research Corp. (a) | 361,810 | |||||
| INFORMATION SERVICES - 2.7% | |||||||
| 1,660 | Google Inc. (a) | 964,228 | |||||
| INTERNET & CATALOG RETAIL - 0.3% | |||||||
| 3,000 | eBay Inc. (a) | 117,570 | |||||
| MACHINERY, EQUIPMENT & | |||||||
| SUPPLIES MERCHANT | |||||||
| WHOLESALERS - 1.1% | |||||||
| 10,500 | Applied Industrial Technologies, Inc. | 395,955 | |||||
| MANAGEMENT, SCIENTIFIC & | |||||||
| TECHNICAL CONSULTING | |||||||
| SERVICES - 1.8% | |||||||
| 4,800 | Salesforce.com, Inc. (a) | 665,376 | |||||
| MANUFACTURING & | |||||||
| REPRODUCING MAGNETIC | |||||||
| & OPTICAL MEDIA - 0.6% | |||||||
| 10,100 | Gentex Corp. | 225,230 | |||||
| MEDICAL EQUIPMENT & SUPPLIES | |||||||
| MANUFACTURING - 6.6% | |||||||
| 2,400 | C.R. Bard, Inc. | 233,256 | |||||
| 10,100 | The Estee Lauder Co. Inc. | 546,915 | |||||
| 550 | Intuitive Surgical, Inc. (a) | 287,705 | |||||
| 18,200 | STERIS Corp. | 543,452 | |||||
| 4,700 | Stryker Corp. | 241,815 | |||||
| 9,200 | Varian Medical Systems, Inc. (a) | 539,672 | |||||
| 2,392,815 | |||||||
| METAL ORE MINING - 1.6% | |||||||
| 2,800 | Agnico-Eagle Mines Ltd. (b) | 104,552 | |||||
| 6,500 | Franco-Nevada Corp. (b) | 272,610 | |||||
| 6,300 | Freeport-McMoRan Copper | ||||||
| & Gold, Inc. | 201,852 | ||||||
| 579,014 | |||||||
| MISCELLANEOUS STORE | |||||||
| RETAILERS - 0.9% | |||||||
| 5,000 | PetSmart, Inc. | 322,200 | |||||
| MOTOR VEHICLE BODY & | |||||||
| TRAILER MANUFACTURING - 1.2% | |||||||
| 9,200 | CLARCOR Inc. | 448,960 | |||||
| MOTOR VEHICLE PARTS | |||||||
| MANUFACTURING - 0.2% | |||||||
| 1,100 | WABCO Holdings, Inc. (a) | 56,936 | |||||
| NAVIGATIONAL, MEASURING, | |||||||
| ELECTROMEDICAL & | |||||||
| CONTROL INSTRUMENTS | |||||||
| MANUFACTURING - 3.0% | |||||||
| 6,700 | Agilent Technologies, Inc. | 272,422 | |||||
| 5,200 | Danaher Corp. | 270,244 | |||||
| 2,600 | Fossil, Inc. (a) | 190,216 | |||||
| 18,000 | Ion Geophysical Corp. (a) | 109,080 | |||||
| 11,600 | Rofin-Sinar Technologies, Inc (a) | 230,260 | |||||
| 1,072,222 | |||||||
The accompanying notes are an integral part of these financial statements.
7
IMAN FUND
SCHEDULE OF INVESTMENTS (Continued)
May 31, 2012
(Classifications are based on the North American Industry Classification System)
| Number of | |||||||
| Shares | Value | ||||||
| COMMON STOCKS (CONTINUED) | |||||||
| OFFICE ADMINISTRATIVE | |||||||
| SERVICES - 0.5% | |||||||
| 4,300 | Gartner, Inc. (a) | $ | 174,924 | ||||
| OIL & GAS EXTRACTION - 1.9% | |||||||
| 3,800 | Cimarex Energy Co. | 202,426 | |||||
| 1,300 | Continental Resources, Inc. (a) | 94,718 | |||||
| 4,700 | Helmerich & Payne, Inc. | 212,910 | |||||
| 2,400 | Occidental Petroleum Corp. | 190,248 | |||||
| 700,302 | |||||||
| OTHER ELECTRICAL | |||||||
| EQUIPMENT & COMPONENT | |||||||
| MANUFACTURING - 0.2% | |||||||
| 1,200 | Emerson Electric Co. | 56,124 | |||||
| OTHER GENERAL | |||||||
| MERCHANDISE STORES - 0.5% | |||||||
| 13,800 | Fred’s, Inc. - Class A | 189,750 | |||||
| OTHER GENERAL PURPOSE | |||||||
| MACHINERY MANUFACTURING - 2.7% | |||||||
| 1,200 | Flowserve Corp. | 123,336 | |||||
| 2,300 | Gardner Denver Inc. | 124,384 | |||||
| 7,000 | The Gorman-Rupp Co. | 196,070 | |||||
| 5,200 | Roper Industries, Inc. | 526,344 | |||||
| 970,134 | |||||||
| OTHER INFORMATION SERVICES - 2.3% | |||||||
| 4,500 | Baidu, Inc. - ADR (a)(b) | 529,965 | |||||
| 3,000 | LinkedIn Corp. - Class A (a) | 288,300 | |||||
| 818,265 | |||||||
| OTHER PROFESSIONAL, SCIENTIFIC | |||||||
| & TECHNICAL SERVICES - 0.7% | |||||||
| 2,600 | IHS, Inc. - Class A (a) | 257,374 | |||||
| PESTICIDE, FERTILIZER & OTHER | |||||||
| AGRICULTURAL CHEMICAL | |||||||
| MANUFACTURING - 0.7% | |||||||
| 3,200 | Monsanto Co. | 247,040 | |||||
| PETROLEUM & COAL PRODUCTS | |||||||
| MANUFACTURING - 2.7% | |||||||
| 3,200 | Chevron Corp. | 314,592 | |||||
| 8,200 | Exxon Mobil Corp. | 644,766 | |||||
| 959,358 | |||||||
| PHARMACEUTICAL & MEDICINE | |||||||
| MANUFACTURING - 8.9% | |||||||
| 19,400 | Amarin Corp. PLC - ADR (a)(b) | 229,890 | |||||
| 10,500 | Ariad Pharmaceuticals, Inc. (a) | 173,985 | |||||
| 6,200 | BioMarin Pharmaceutical Inc. (a) | 220,968 | |||||
| 25,800 | Elan Corp. plc - ADR (a)(b) | 360,168 | |||||
| 2,400 | Gen-Prob Inc. (a) | 194,184 | |||||
| 3,400 | IDEXX Laboratories, Inc. (a) | 288,456 | |||||
| 5,900 | Impax Laboratories, Inc. (a) | 122,307 | |||||
| 4,200 | Johnson & Johnson | 262,206 | |||||
| 4,000 | MAP Pharmaceuticals, Inc. (a) | 47,080 | |||||
| 3,000 | Mead Johnson Nutrition Co. | 242,220 | |||||
| 900 | Medivation, Inc. (a) | 75,807 | |||||
| 2,600 | Merck & Co., Inc. | 97,708 | |||||
| 3,900 | Novo Nordisk A/S - ADR (b) | 521,781 | |||||
| 2,700 | Regeneron Pharmaceuticals, Inc. (a) | 366,255 | |||||
| 3,203,015 | |||||||
| PROFESSIONAL & COMMERCIAL | |||||||
| EQUIPMENT & SUPPLIES | |||||||
| MERCHANT WHOLESALERS - 0.7% | |||||||
| 3,600 | Henry Schein, Inc. (a) | 267,516 | |||||
| ROAD & RAIL - 0.7% | |||||||
| 11,000 | Werner Enterprises, Inc. | 267,740 | |||||
| SCIENTIFIC RESEARCH & | |||||||
| DEVELOPMENT SERVICES - 3.1% | |||||||
| 5,500 | Alexion Pharmaceuticals, Inc. (a) | 498,135 | |||||
| 5,300 | Babcock & Wilcox Co. (a) | 130,645 | |||||
| 2,200 | Celgene Corp. (a) | 150,150 | |||||
| 3,200 | Covance, Inc. (a) | 148,480 | |||||
| 9,800 | Incyte Corp. (a) | 208,838 | |||||
| 1,136,248 | |||||||
The accompanying notes are an integral part of these financial statements.
8
IMAN FUND
SCHEDULE OF INVESTMENTS (Continued)
May 31, 2012
(Classifications are based on the North American Industry Classification System)
| Number of | |||||||
| Shares | Value | ||||||
| COMMON STOCKS (CONTINUED) | |||||||
| SEMICONDUCTOR & OTHER | |||||||
| ELECTRONIC COMPONENT | |||||||
| MANUFACTURING - 4.4% | |||||||
| 7,900 | ARM Holdings plc - ADR (b) | $ | 185,571 | ||||
| 5,400 | Cavium, Inc. (a) | 130,734 | |||||
| 1,700 | Cree, Inc. (a) | 42,619 | |||||
| 7,500 | Intel Corp. | 193,800 | |||||
| 15,600 | JDS Uniphase Corp. (a) | 158,340 | |||||
| 13,300 | Microchip Technology Inc. | 412,566 | |||||
| 18,500 | NVIDIA Corp. (a) | 229,955 | |||||
| 3,900 | Texas Instruments Inc. | 111,072 | |||||
| 3,600 | Xilinx, Inc. | 115,092 | |||||
| 1,579,749 | |||||||
| SOAP, CLEANING COMPOUND | |||||||
| & TOILET PREPARATION | |||||||
| MANUFACTURING - 0.4% | |||||||
| 1,600 | Colgate-Palmolive Co. | 157,280 | |||||
| SOFTWARE PUBLISHERS - 5.8% | |||||||
| 8,300 | ANSYS, Inc. (a) | 513,562 | |||||
| 2,900 | Concur Technologies, Inc. (a) | 179,365 | |||||
| 6,700 | Intuit Inc. | 376,741 | |||||
| 3,700 | MICROS Systems, Inc. (a) | 195,212 | |||||
| 15,200 | Microsoft Corp. | 443,688 | |||||
| 5,400 | SAP AG - ADR (b) | 309,528 | |||||
| 900 | Teradata Corp. (a) | 59,832 | |||||
| 2,077,928 | |||||||
| SUPPORT ACTIVITIES | |||||||
| FOR MINING - 1.1% | |||||||
| 10,200 | Patterson-UTI Energy, Inc. | 154,224 | |||||
| 3,600 | Schlumberger Ltd. (b) | 227,700 | |||||
| 381,924 | |||||||
| TEXTILES, APPAREL & LUXURY | |||||||
| GOODS - 0.9% | |||||||
| 3,000 | Nike, Inc. - Class B | 324,540 | |||||
| UTILITY SYSTEM | |||||||
| CONSTRUCTION - 0.5% | |||||||
| 4,200 | Fluor Corp. | 196,896 | |||||
| AIR-CONDITIONING & | |||||||
| COMMERCIAL REFRIGERATION | |||||||
| EQUIPMENT MANUFACTURING - 0.4% | |||||||
| 4,200 | Donaldson Company, Inc. | 150,234 | |||||
| TOTAL COMMON STOCKS | |||||||
| (Cost $34,913,626) | 35,894,251 | ||||||
| Total Investments | |||||||
| (Cost ($34,913,626) - 99.4% | 35,894,251 | ||||||
| Other Assets in Excess | |||||||
| of Liabilities - 0.6% | 228,709 | ||||||
| TOTAL NET ASSETS - 100.0% | $ | 36,122,960 | |||||
ADR - American Depositary Receipt
PLC - Public Limited Company
| (a) | Non-Income Producing Security |
| (b) | Foreign Issued Securities. See note 2 to the Notes to the Financial Statements. |
The accompanying notes are an integral part of these financial statements.
9
IMAN FUND
STATEMENT OF ASSETS AND LIABILITIES
May 31, 2012
| Assets: | ||||
| Investments, at value (cost $34,913,626) | $ | 35,894,251 | ||
| Cash | 243,477 | |||
| Receivable for investments sold | 1,114,705 | |||
| Receivable for capital shares sold | 43,777 | |||
| Dividends receivable | 44,661 | |||
| Other assets | 22,208 | |||
| Total Assets | 37,363,079 | |||
| Liabilities: | ||||
| Payable for investments purchased | 1,113,652 | |||
| Payable to Advisor (Note 3) | 30,714 | |||
| Payable for professional fees | 32,587 | |||
| Payable to Trustees | 5,999 | |||
| Accrued expenses and other liabilities | 57,167 | |||
| Total Liabilities | 1,240,119 | |||
| Net Assets | $ | 36,122,960 | ||
| Net assets consist of: | ||||
| Paid-in capital | $ | 37,788,055 | ||
| Accumulated net investment loss | (110,761 | ) | ||
| Accumulated net realized loss on investments | (2,534,959 | ) | ||
| Net unrealized appreciation on investments | 980,625 | |||
| Net Assets | $ | 36,122,960 | ||
| Shares of beneficial interest outstanding | ||||
| (unlimited number of shares authorized, no par value) | 4,324,859 | |||
| Net asset value, redemption price and offering price per share | $ | 8.35 | ||
The accompanying notes are an integral part of these financial statements.
10
IMAN FUND
STATEMENT OF OPERATIONS
For the Year Ended May 31, 2012
| Investment income: | ||||
| Dividend income (Net of foreign withholding tax of $5,629) | $ | 370,657 | ||
| Total investment income | 370,657 | |||
| Expenses: | ||||
| Advisory fees (Note 3) | 339,832 | |||
| Administration fees | 51,108 | |||
| Legal fees | 46,640 | |||
| Transfer agent fees and expenses | 46,496 | |||
| Fund accounting fees | 35,321 | |||
| Federal and state registration fees | 23,396 | |||
| Audit fees | 13,248 | |||
| Trustees’ fees and related expenses | 16,999 | |||
| Reports to shareholders | 7,973 | |||
| Custody fees | 7,344 | |||
| Other expenses | 1,853 | |||
| Total expenses | 590,210 | |||
| Net investment loss | (219,553 | ) | ||
| Realized and unrealized loss on investments: | ||||
| Net realized loss from security transactions | (731,025 | ) | ||
| Change in net unrealized appreciation/depreciation on investments | (1,257,535 | ) | ||
| Realized and unrealized loss on investments | (1,988,560 | ) | ||
| Net decrease in net assets from operations | $ | (2,208,113 | ) | |
The accompanying notes are an integral part of these financial statements.
11
IMAN FUND
STATEMENTS OF CHANGES IN NET ASSETS
| Year Ended | Year Ended | |||||||
| May 31, 2012 | May 31, 2011 | |||||||
| From operations: | ||||||||
| Net investment loss | $ | (219,553 | ) | $ | (208,146 | ) | ||
| Net realized gain (loss) on investments | (731,025 | ) | 6,307,017 | |||||
| Change in net unrealized appreciation/depreciation on investments | (1,257,535 | ) | 2,224,758 | |||||
| Net increase (decrease) in net assets from operations | (2,208,113 | ) | 8,323,629 | |||||
| From capital share transactions: | ||||||||
| Proceeds from sale of shares | 5,450,983 | 2,273,237 | ||||||
| Payments for shares redeemed | (2,031,725 | ) | (3,398,318 | ) | ||||
| Net increase (decrease) in net assets | ||||||||
| from capital share transactions | 3,419,258 | (1,125,081 | ) | |||||
| Total increase in net assets | 1,211,145 | 7,198,548 | ||||||
| Net assets: | ||||||||
| Beginning of period | 34,911,815 | 27,713,267 | ||||||
| End of period (includes accumulated net investment loss of $110,761 | ||||||||
| and undistributed net investment income of $0, respectively) | $ | 36,122,960 | $ | 34,911,815 | ||||
The accompanying notes are an integral part of these financial statements.
12
IMAN FUND
FINANCIAL HIGHLIGHTS
Per Share Data for a Share Outstanding Throughout each Period
| Year Ended May 31, | ||||||||||||||||||||
| 2012 | 2011 | 2010 | 2009 | 2008 | ||||||||||||||||
| Net asset value, beginning of period | $ | 8.97 | $ | 6.91 | $ | 5.92 | $ | 9.70 | $ | 8.84 | ||||||||||
| Income (loss) from investment operations: | ||||||||||||||||||||
Net investment loss(1) | (0.05 | ) | (0.05 | ) | (0.02 | ) | (0.02 | ) | (0.03 | ) | ||||||||||
| Net realized and unrealized gains (losses) | ||||||||||||||||||||
| on investments | (0.57 | ) | 2.11 | 1.01 | (3.57 | ) | 0.90 | |||||||||||||
| Total from investment operations | (0.62 | ) | 2.06 | 0.99 | (3.59 | ) | 0.87 | |||||||||||||
| Less distributions paid: | ||||||||||||||||||||
| From net realized gain on investments | — | — | — | (0.19 | ) | (0.01 | ) | |||||||||||||
| Total distributions paid | — | — | — | (0.19 | ) | (0.01 | ) | |||||||||||||
| Net asset value, end of period | $ | 8.35 | $ | 8.97 | $ | 6.91 | $ | 5.92 | $ | 9.70 | ||||||||||
| Total Return | (6.91 | )% | 29.81 | % | 16.72 | % | (36.86 | )% | 9.91 | % | ||||||||||
| Net assets at end of period (000’s) | $ | 36,123 | $ | 34,912 | $ | 27,713 | $ | 24,717 | $ | 43,137 | ||||||||||
| Ratio of expenses to average net assets: | ||||||||||||||||||||
| Before waiver and expense reimbursement | 1.74 | % | 1.75 | % | 1.71 | % | 1.72 | % | 1.36 | % | ||||||||||
| After waiver and expense reimbursement | 1.74 | %(2) | 1.75 | %(2) | 1.71 | %(2) | 1.72 | %(2) | 1.42 | % | ||||||||||
| Ratio of net investment loss to average net assets: | ||||||||||||||||||||
| Before expense reimbursement | (0.65 | )% | (0.65 | )% | (0.23 | )% | (0.33 | )% | (0.25 | )% | ||||||||||
| After expense reimbursement | (0.65 | )%(2) | (0.65 | )%(2) | (0.23 | )%(2) | (0.33 | )%(2) | (0.31 | )% | ||||||||||
| Portfolio turnover rate | 96.9 | % | 169.3 | % | 177.5 | % | 108.7 | % | 138.7 | % | ||||||||||
| (1) | Net investment loss per share is calculated using ending balances prior to consideration of adjustments for permanent book and tax differences. |
| (2) | Effective October 1, 2008, the Fund no longer has an Expense Waiver Agreement in place. |
The accompanying notes are an integral part of these financial statements.
13
IMAN FUND
NOTES TO THE FINANCIAL STATEMENTS
May 31, 2012
| 1. | Organization |
Allied Asset Advisors Funds (the “Trust”), an open-end management investment company, was organized as a Delaware statutory trust on January 14, 2000. The Trust currently offers one series of shares to investors, the Iman Fund (the “Fund”), a diversified series of the Trust. Allied Asset Advisors, Inc. (“AAA” or the “Advisor”), a Delaware corporation, serves as investment advisor to the Fund.
The Trust is authorized to issue an unlimited number of shares without par value, of each series. The Trust currently offers one class of shares of the Fund.
The investment objective of the Fund is to seek growth of capital while adhering to Islamic principles. To achieve its investment objective, the Fund seeks investments that meet Islamic principles whose prices the Fund’s Advisor anticipates will increase over the long term. Under normal circumstances, the Fund invests its net assets in domestic and foreign securities chosen by the Advisor in accordance with Islamic principles. Islamic principles generally preclude investments in certain businesses (e.g., alcohol, pornography and gambling) and investments in interest bearing debt obligations. Any uninvested cash will be held in non-interest bearing deposits or invested in a manner following Islamic principles.
| 2. | Significant Accounting Policies |
The following is a summary of significant accounting policies consistently followed by the Fund in the preparation of its financial statements. These policies are in conformity with accounting principles generally accepted in the United States of America (“GAAP”).
Use of Estimates: In preparing the financial statements in conformity with accounting principles generally accepted in the United States of America, management is required to make estimates and assumptions that affect the reported amounts of assets and liabilities and disclosure of contingent assets and liabilities as of the date of the financial statements and the reported amounts of increases and decreases in net assets from operations during the reporting period. Actual results could differ from these estimates.
Security Valuation: Investment securities are carried at fair value determined using the following valuation methods:
| • | Equity securities listed on a U.S. securities exchange or NASDAQ for which market quotations are readily available are valued at the last quoted sale price on the valuation date. |
| • | Options, futures, unlisted U.S. securities and listed U.S. securities not traded on the valuation date for which market quotations are readily available are valued at the most recent quoted bid price. The Fund did not hold any such securities during the year ended May 31, 2012. |
| • | Securities or other assets for which market quotations are not readily available are valued at fair value as determined in good faith by the Advisor under direction of the Board of Trustees. |
The Fund has adopted fair valuation accounting standards which establish an authoritative definition of fair value and a three-tier hierarchy to distinguish between (1) inputs that reflect the assumptions market participants would use in pricing an asset or liability developed based on market data obtained from sources independent of the reporting entity (observable inputs) and (2) inputs that reflect the reporting entity’s own assumptions about the assumptions market participants would use in pricing an asset or liability developed based on the best information available in the circumstances (unobservable inputs) and to establish classification of fair value measurements for disclosure purposes.
Summary of Fair Value Exposure at May 31, 2012
The Trust has performed an analysis of all existing investments to determine the significance and character of all inputs to their fair value determination. Various inputs are used in determining the value of the Fund’s investments. These inputs are summarized in the three broad levels listed below:
| Level 1 - | Quoted prices in active markets for identical securities. |
| Level 2 - | Other significant observable inputs (including quoted prices for similar securities in active markets, quoted prices for identical or similar instruments in |
14
IMAN FUND
NOTES TO THE FINANCIAL STATEMENTS (Continued)
May 31, 2012
| markets that are not active, model-derived valuations in which all significant inputs and significant value drivers are observable in active markets, interest rates, prepayment speeds, credit risk, etc.) |
| Level 3 - | Significant unobservable inputs (including the Fund’s own assumptions in determining the fair value of investments) |
Inputs that are used in determining fair value an investment may include price information, credit data, volatility statistics, and other factors. These inputs can be either observable or unobservable. The availability of observable inputs can vary between investments, and is affected by various factors such as the type of investment or similar investments in the marketplace. The inputs will be considered by the Advisor, along with any other relevant factors in the calculation of an investment’s fair value. The Fund uses prices and inputs that are current as of the measurement date, which may include periods of market dislocations. During these periods, the availability of prices and inputs may be reduced for many investments. This condition could cause an investment to be reclassified between the various levels within the hierarchy.
The inputs or methodology used for valuing securities are not an indication of the risk associated with investing in those securities.
The following is a summary of the inputs used to value the Fund’s net assets as of May 31, 2012:
| Level 1 | Level 2 | Level 3 | Total | |||||||||||||
| Common Stocks | $ | 35,894,251 | $ | — | $ | — | $ | 35,894,251 | ||||||||
| Total* | $ | 35,894,251 | $ | — | $ | — | $ | 35,894,251 | ||||||||
| * | Additional information regarding the industry and/or geographical classification of these investments is disclosed in the Schedule of Investments. |
There were no transfers into or out of Level 1, Level 2 or Level 3 fair value measurements during the reporting period for the Fund, as compared to their classification from the most recent annual report. It is the Fund’s policy to consider transfers into or out of Level 1, Level 2 or Level 3 as of the end of the reporting period.
In May 2011, the FASB issued ASU No. 2011.04 “Amendments to Achieve Common Fair Value Measurement and Disclosure Requirements” in GAAP and the International Financial Reporting Standards (“IFRSs”). ASU No. 2011-04 amends FASB ASC Topic 820, Fair Value Measurements and Disclosures, to establish common requirements for measuring fair value and for disclosing information about fair value measurements in accordance with GAAP and IFRSs. ASU No. 2011-04 is effective for fiscal years beginning after December 15, 2011 and for interim periods within those fiscal years. Management is currently evaluating the impact of these amendments and does not believe they will have a material impact on the Trust’s financial statements.
Foreign Securities: Investing in securities of foreign companies and foreign governments involves special risks and consideration not typically associated with investing in U.S. companies and the U.S. government. These risks include revaluation of currencies and future adverse political and economic developments. Moreover, securities of many foreign companies and foreign governments and their markets may be less liquid and their prices more volatile than those of securities of comparable U.S. companies and the U.S. government. The Fund does not invest in securities of U.S. or foreign governments.
Federal Income Taxes: It is the Fund’s policy to comply with the requirements of the Internal Revenue Code applicable to regulated investment companies and the Fund intends to distribute all of its taxable income and net capital gains to shareholders. Therefore, no federal income tax provision is required.
As of and during the year ended May 31, 2012, the Fund did not have a liability for any unrecognized tax benefits. The Fund recognizes interest and penalties, if any, related to unrecognized tax benefits as other expenses in the Statement of Operations. During the year, the Fund did not incur any interest or penalties. The statute of limitations on the Fund’s tax returns remains open for the years ended May 31, 2009 through May 31, 2012.
Under the recently enacted Regulated Investment Company Modernization Act of 2010, the Fund will be permitted to carry forward capital losses incurred in taxable years beginning after December 22, 2010 for an unlimited period.
15
IMAN FUND
NOTES TO THE FINANCIAL STATEMENTS (Continued)
May 31, 2012
However, any losses incurred during those future taxable years will be required to be utilized prior to the losses incurred in pre-enactment taxable years. As a result of this, pre-enactment capital loss carryforwards may be more likely to expire unused. Additionally, post-enactment capital losses that are carried forward will retain their character as either short-term or long-term capital losses rather than being considered all short-term as under previous law. At May 31, 2012, the Fund had accumulated net realized capital loss carryforwards of $2,017,271. Of the total capital loss carryforward amount, $1,797,877 will expire on May 31, 2018. The remaining balance of short-term capital loss carryforwards of $219,394 has an indefinite expiration. To the extent these loss carryforwards are used to offset future capital gains, it is probable that the amount, which is offset, will not be distributed to shareholders.
As of May 31, 2012, the components of distributable earnings on a tax basis were as follows:
| Cost of investments | $ | 34,951,412 | ||
| Gross tax unrealized appreciation | $ | 3,219,511 | ||
| Gross tax unrealized depreciation | (2,276,672 | ) | ||
| Net tax unrealized appreciation | $ | 942,839 | ||
| Undistributed ordinary income | — | |||
| Undistributed long-term capital gain | — | |||
| Total distributable earnings | $ | — | ||
| Other accumulated losses | (2,607,934 | ) | ||
| Total accumulated gain | $ | (1,665,095 | ) |
The difference between book basis and tax basis unrealized and realized gains and losses is attributable primarily to the tax deferral of losses relating to wash sale transactions.
Under current tax laws, losses realized after October 31 may be deferred and treated as occurring on the first business day of the following fiscal year. The Fund deferred, on a tax basis, a post-October loss of $508,140 and a post-December late-year loss of $82,523, for the fiscal year ended May 31, 2012.
Distributions to Shareholders: The Fund will distribute substantially all of the net investment income and net realized gains that it has realized on the sale of securities. These income and gains distributions will generally be paid once each year, on or before December 31. The character of distributions made during the year from net investment income or net realized gains may differ from the characterization for federal income tax purposes due to differences in the recognition of income, expense or gain items for financial reporting and tax reporting purposes.
No distributions were paid for the years ended May 31, 2012 and May 31, 2011.
Dividend income and distributions to shareholders are recorded on the ex-dividend date. The Fund may periodically make reclassifications among certain of its capital accounts to reflect the tax character of permanent book/tax differences related to the components of the Fund’s net assets. These reclassifications have no impact on the net assets or net asset value of the Fund. For the fiscal year ended May 31, 2012, undistributed net investment income was increased by $108,792, accumulated net realized loss was decreased by $342 and paid in capital was decreased by $108,450.
Other: Investment transactions and shareholder transactions are accounted for on the trade date. Net realized gains and losses on securities are computed on the basis of specific security lot identification. Withholding taxes on foreign dividends have been provided for in accordance with the Fund’s understanding of the applicable country’s tax rules and rates.
Subsequent Events: In preparing these financial statements, management has performed an evaluation of subsequent events after May 31, 2012 and determined that there were no significant subsequent events that would require adjustment to or additional disclosure in the financial statements.
| 3. | Investment Advisory and Other Agreements |
The Trust has an Investment Advisory Agreement (the “Agreement”) with the Advisor, with whom certain officers and Trustees of the Trust are affiliated, to furnish investment advisory services to the Fund. Under the terms of the Agreement, the Trust, on behalf of the Fund, compensates the Advisor for its management services at the annual rate of 1.00% of the Fund’s daily average net assets.
Effective October 1, 2006 through September 30, 2008, the Advisor contractually agreed to waive or reimburse the Fund if the aggregate annual operating expenses exceeded 1.70%
16
IMAN FUND
NOTES TO THE FINANCIAL STATEMENTS (Continued)
May 31, 2012
of average net assets. Effective October 1, 2008, the Expense Waiver Agreement is no longer in place.
For the year ended May 31, 2012, the Fund had advisory expenses of $339,832 and at May 31, 2012, the Fund had $30,714 payable to the Advisor.
The Trust has a distribution agreement and a servicing agreement with Quasar Distributors, LLC (the “Distributor”). Fees for such distribution services are paid to the Distributor by the Advisor.
| 4. | Capital Share Transactions |
Capital Share Transactions of the Fund for the year ended May 31, 2012, were as follows:
| Amount | Shares | |||||||
| Shares sold | $ | 5,450,983 | 675,326 | |||||
| Shares redeemed | (2,031,725 | ) | (240,750 | ) | ||||
| Net increase | $ | 3,419,258 | 434,576 | |||||
| Shares Outstanding | ||||||||
| Beginning of period | 3,890,283 | |||||||
| End of period | 4,324,859 | |||||||
Capital Share Transactions of the Fund for the year ended May 31, 2011, were as follows:
| Amount | Shares | |||||||
| Shares sold | $ | 2,273,237 | 297,315 | |||||
| Shares redeemed | (3,398,318 | ) | (415,387 | ) | ||||
| Net decrease | $ | (1,125,081 | ) | (118,072 | ) | |||
| Shares Outstanding | ||||||||
| Beginning of period | 4,008,355 | |||||||
| End of period | 3,890,283 | |||||||
| 5. | Securities Transactions |
During the year ended May 31, 2012, the cost of purchases and proceeds from sales of investment securities, other than short-term investments were $36,714,770 and $33,118,368, respectively. There were no purchases or sales of U.S. government securities for the Fund.
| 6. | Beneficial Ownership |
The beneficial ownership, either directly or indirectly, of more than 25% of the voting securities of a fund creates a presumption of control of the fund, under Section 2(a)(9) of the Investment Company Act of 1940. As of May 31, 2012, the North American Islamic Trust (“NAIT”) held 66% of the Fund. NAIT is the parent company of the Advisor.
17
IMAN FUND
REPORT OF INDEPENDENT REGISTERED PUBLIC ACCOUNTING FIRM
To the Shareholders and
Board of Trustees
Iman Fund
We have audited the accompanying statement of assets and liabilities, including the schedule of investments, of Iman Fund (the “Fund”) as of May 31, 2012, and the related statement of operations for the year then ended, the statements of changes in net assets for each of the two years in the period then ended, and the financial highlights for each of the five years in the period then ended. These financial statements and financial highlights are the responsibility of Fund management. Our responsibility is to express an opinion on these financial statements and financial highlights based on our audits.
We conducted our audits in accordance with the standards of the Public Company Accounting Oversight Board (United States). Those standards require that we plan and perform the audit to obtain reasonable assurance about whether the financial statements and financial highlights are free of material misstatement. An audit includes examining, on a test basis, evidence supporting the amounts and disclosures in the financial statements. Our procedures included confirmation of securities owned as of May 31, 2012 by correspondence with the custodian and broker. An audit also includes assessing the accounting principles used and significant estimates made by management, as well as evaluating the overall financial statement presentation. We believe that our audits provide a reasonable basis for our opinion.
In our opinion, the financial statements and financial highlights referred to above present fairly, in all material respects, the financial position of Iman Fund as of May 31, 2012, the results of its operations for the year then ended, the changes in its net assets for each of the two years in the period then ended, and the financial highlights for each of the five years in the period then ended, in conformity with accounting principles generally accepted in the United States of America.
COHEN FUND AUDIT SERVICES, LTD.
Westlake, Ohio
July 27, 2012
18
IMAN FUND
DISCLOSURE REGARDING THE BOARD OF TRUSTEES
APPROVAL OF THE INVESTMENT ADVISORY AGREEMENT (Unaudited)
In approving the continuance of the investment advisory contract between Allied Asset Advisors Inc. (the “Advisor”) and the Iman Fund (the “Fund”), the Board of Trustees of the Fund (the “Board”) including the Trustees who were not affiliated with the Advisor (the “Independent Trustees”) were advised by and met in executive session with, independent legal counsel to discuss the duties of the Trustees in consideration of the continuance of the agreement. The Board received and reviewed a substantial amount of information provided by the Advisor and third parties in response to the Board’s requests. At a meeting held May 7, 2012, the Board, including all of the Independent Trustees, approved continuation of the investment advisory contract for a period through June 29, 2013.
The Board reviewed and analyzed various factors in considering the contract and reaching its conclusions, including each of the factors described below.
1. Nature, Quality and Extent of Services
The Board’s analysis of the nature, quality and extent of the Advisor’s service to the Fund took into account the knowledge gained from the Board’s regular meetings with the Advisor throughout the prior year. In addition, the Board reviewed information on the key personnel involved in providing investment management services to the Fund and the Advisor’s performance of services for the Fund, such as stock selection, adherence to the Fund’s investment restrictions, and monitoring compliance with applicable Fund policies and procedures. The Board concluded that the nature, quality and extent of the services provided by the Advisor to the Fund were appropriate and the Fund was likely to continue to benefit from services provided under its contract with the Advisor.
2. Investment Performance of the Fund and the Advisor
In considering the performance of the Fund and the Advisor, the Board compared the Fund’s performance with that of a universe of more than 1,000 U.S. large cap mutual funds, as determined by Morningstar, an independent data service provider. The performance data was for one, five and ten year periods ended March 31, 2012. The Board also compared the Fund’s performance for the three month, calendar year to date, and one, five and ten year periods then ended with that of (a) three other mutual funds that follow Islamic principles and (b) three benchmark indices: the Dow Jones Islamic Market USA Index (the “DJI”), the S&P 500 Index (the “S&P”) and the Russell 3000 Growth Index (the “Russell”).
The Board first considered that the Fund had outperformed the DJI and the S&P for the three months ended March 31, 2012 and had outperformed the S&P for the five year period then ended. However, the Fund had underperformed the DJI and the Russell for the one, five and ten year periods and the S&P for the one and ten year periods. The Board also reviewed the Fund’s performance against its peer universe, noting that the Fund underperformed its peer universe median for the one, five and ten year periods. The Board then discussed the principal reasons for the Fund’s underperformance in various periods.
After considering all the information, the Board concluded that, although past performance cannot be a guarantee of future performance, in light of the Fund’s most recent and longer term performance, the Fund and its shareholders were benefiting from the Advisor’s investment management of the Fund.
3. Costs of Services and Profits Realized by the Advisor
The Board examined the fee and expense information for the Fund as compared to that of other comparable funds and noted that the Advisor’s management fees, as a percentage of net assets, were at the breakpoint between the third and fourth quartiles of comparable funds, significantly higher than the peer group median reported by Morningstar. The Board noted, however, that the Fund’s special nature makes it distinct from most of the funds in its Morningstar peer group, which included many funds that are part of much larger families of funds and, therefore, may be able to realize economies of scale that are not available to the Fund.
In addition, the Board considered the Advisor’s costs in serving as the Fund’s investment adviser and manager. The costs include those associated with the personnel and systems necessary to manage the Fund. The Board also considered the financial condition of the Advisor and the losses incurred by the Advisor. The Board expressed concern regarding the
19
IMAN FUND
DISCLOSURE REGARDING THE BOARD OF TRUSTEES
APPROVAL OF THE INVESTMENT ADVISORY AGREEMENT (Unaudited), (Continued)
ability of the Advisor to repay its parent company for a promissory note agreed upon on December 31, 2003. The Board asked the Advisor to provide a representation from the parent company indicating that it would give at least one year’s notice prior to calling the note. An officer of the Trust stated that he was an officer of the parent company and that a majority of the board of trustees of each of the Advisor and of the parent company are the same individuals. He assured the Board that the parent company understood the long timetable for the Advisor to be profitable and there was no reason to believe that the parent company would call the note in the near future. The president of the Trust stated that the marketing efforts of the Advisor were intended to grow the Fund and that the Fund would be in a position to pay on the note if the Fund reached $50 - 100 million in assets. The Board concluded that the management fee and the total expenses of the Fund were reasonable in light of the services provided and the performance of the Fund achieved over various time periods, and that the other expenses of the Fund also were reasonable.
4. Economies of Scale
The Board considered the extent to which the Fund’s management fee reflected economies of scale for the benefit of Fund shareholders. The Board noted the fact that, because the Advisor was operating at a loss and had a cumulative deficit, a discussion of economies of scale was not applicable with respect to the management fee charged by the Advisor.
5. Other Benefits to the Advisor
The Board considered benefits that accrue to the Advisor from its relationship with the Fund. The Board noted that the Advisor did not employ soft-dollars and therefore did not derive research products or services from brokerage commissions paid by the Fund on its brokerage transactions. The Board also noted that the Fund is the sole client of the Advisor.
After full consideration of the above factors as well as other factors, the Board, including all Independent Trustees, unanimously concluded that approval of the Fund’s advisory contract was in the best interest of the Fund and its shareholders.
20
IMAN FUND
ADDITIONAL INFORMATION (Unaudited)
May 31, 2012
Proxy Voting Policies and Procedures (Unaudited)
A description of the policies and procedures that the Fund uses to determine how to vote proxies relating to portfolio securities is available without charge, upon request, by calling (877) 417-6161 or by accessing the Fund’s website at http://www.investaaa.com. Furthermore, you can obtain the description on the SEC’s website at http://www.sec.gov.
Proxy Voting Record (Unaudited)
Information regarding how the Fund voted proxies relating to portfolio securities during the most recent 12-month period ended June 30 is available without charge, upon request, by calling (877) 417-6161. Furthermore, you can obtain the Fund’s proxy voting records on the SEC’s website at http://www.sec.gov.
Availability of Quarterly Portfolio Schedule (Unaudited)
The Fund files its complete schedule of portfolio holdings with the SEC for the first and third quarters of each fiscal year on Form N-Q. The filing will be available, upon request, by calling (877) 417-6161. Furthermore, you will be able to obtain a copy of the filing on the SEC’s website at http://www.sec.gov. The Fund’s Forms N-Q may also be reviewed and copied at the SEC’s Public Reference Room in Washington, DC, and information on the operation of the Public Reference Room may be obtained by calling (800) SEC-0330.
21
IMAN FUND
SUPPLEMENTAL INFORMATION (Unaudited)
Information pertaining to the Trustees and Officers of the Fund is set forth below. Each Trustee will serve until the termination of the Trust or his earlier death, resignation, retirement, incapacity or removal. The statement of additional information (SAI) includes additional information about the Trustees and is available without charge, upon request by calling (877) 417-6161 or writing to Iman Fund, c/o Allied Asset Advisors, Inc., 721 Enterprise Drive, Suite 100, Oak Brook, IL 60523.
| No. of | Principal | Other | ||
| Funds in | Occupation(s) | Trusteeships / | ||
| Name, Age, Address | Date First | Complex | during the past | Directorships |
| Position with Trust | Elected | Overseen | 5 years | by Trustee |
| Bassam Osman*, 61 | 2000 | 1 | Medical Doctor and | None |
| 721 Enterprise Drive, Suite 100 | Portfolio Manager | |||
| Oak Brook, IL 60523 | to the Fund | |||
| Trustee and President | ||||
| Abdalla Idris Ali, 63 | 2000 | 1 | Director, the Center | None |
| 721 Enterprise Drive, Suite 100 | of Islamic Studies, | |||
| Oak Brook, IL 60523 | Kansas City, MO | |||
| Independent Trustee | ||||
| Mohammed Kaiseruddin, 68 | Chairperson | 1 | Nuclear Engineer, | None |
| 721 Enterprise Drive, Suite 100 | since 2006 and | Sargent & Lundy | ||
| Oak Brook, IL 60523 | Independent | |||
| Chairperson and | Trustee | |||
| Independent Trustee | since 2000 | |||
| Muhammad Kudaimi, 56 | 2009 | 1 | Medical Doctor | None |
| 721 Enterprise Drive, Suite 100 | ||||
| Oak Brook, IL 60523 | ||||
| Independent Trustee | ||||
| Mohammad Basheeruddin, 62 | Treasurer | 1 | Accounting Manager, | N/A |
| 721 Enterprise Drive, Suite 100 | since 2003 and | North American | ||
| Oak Brook, IL 60523 | Chief Compliance | Islamic Trust | ||
| Treasurer and | Officer | |||
| Chief Compliance Officer | since 2008 | |||
| Mujeeb Cheema, 64 | 2003 | 1 | Executive Director, | N/A |
| 721 Enterprise Drive, Suite 100 | North American | |||
| Oak Brook, IL 60523 | Islamic Trust | |||
| Secretary |
| * | This trustee is deemed to be an “interested person” of the Trust as that term is defined in Section 2(a)(19) of the Investment Company Act of 1940, as amended, because he is an officer of the Trust and is a director and officer of Allied Asset Advisors, Inc. |
22
PRIVACY POLICY
In the course of servicing your account, we collect the following nonpublic personal information about you:
| • | Information we receive from you on or in applications or other forms, correspondence, or conversations, including, but not limited to, your name, address, phone number, social security number, assets, income and date of birth; and |
| • | Information about your transactions with us, our affiliates, or others, including, but not limited to, your account number and balance, parties to transactions, cost basis information, and other financial information. |
| • | Information collected from our website (including from the use of “cookies”) |
We do not disclose any nonpublic personal information about our current or former shareholders to nonaffiliated third parties, except as permitted by law. For example, we are permitted by law to disclose all of the information we collect, as described above, to our transfer agent to process your transactions. Furthermore, we restrict access to your nonpublic personal information to those persons who require such information to provide products or services to you. We maintain physical, electronic, and procedural safeguards that comply with industry standards to guard your nonpublic personal information.
In the event that you hold shares of the Fund through a financial intermediary, including, but not limited to, a broker-dealer, bank, or trust company, the privacy policy of your financial intermediary would govern how your financial intermediary shares nonpublic personal information with nonaffiliated third parties.
INVESTMENT ADVISOR
Allied Asset Advisors, Inc.
Oak Brook, Illinois
DISTRIBUTOR
Quasar Distributors, LLC
Milwaukee, Wisconsin
INDEPENDENT REGISTERED
PUBLIC ACCOUNTING FIRM
Cohen Fund Audit Services, Ltd.
Westlake, Ohio
ADMINISTRATOR, TRANSFER AGENT,
AND FUND ACCOUNTANT
U.S. Bancorp Fund Services, LLC
Milwaukee, Wisconsin
CUSTODIAN
U.S. Bank, N.A.
Milwaukee, Wisconsin
LEGAL COUNSEL
K&L Gates LLP
Chicago, Illinois
This report has been prepared for shareholders and may be distributed to others only if preceded or accompanied by a current prospectus. Read the Prospectus carefully before you invest or send money. The Prospectus contains important information about the Fund, including charges and expenses. The principal value of your investment will fluctuate and your shares may be worth less than your original cost. Quasar Distributors, LLC is the Distributor for the Fund.
Item 2. Code of Ethics.
The Registrant has adopted a code of ethics that applies to the Registrant’s principal executive officer and principal financial officer. The Registrant has not made any amendments to its code of ethics during the period covered by this report. The Registrant has not granted any waivers from any provisions of the code of ethics during the period covered by this report. The Registrant’s code of ethics is incorporated herein by reference to its form N-CSR filed on August 9, 2007.
Item 3. Audit Committee Financial Expert.
The Registrant’s board of trustees has determined that it does not have an audit committee financial expert serving on its audit committee. At this time, the Registrant believes that the experience provided by each member of the audit committee together offers the Registrant adequate oversight for the Registrant’s level of financial complexity.
Item 4. Principal Accountant Fees and Services.
The Registrant has engaged its principal accountant to perform audit services, audit-related services, tax services and other services during the past two fiscal years. “Audit services” refer to performing an audit of the Registrant's annual financial statements or services that are normally provided by the accountant in connection with statutory and regulatory filings or engagements for those fiscal years. “Audit-related services” refer to the assurance and related services by the principal accountant that are reasonably related to the performance of the audit. “Tax services” refer to professional services rendered by the principal accountant for tax compliance, tax advice, and tax planning. The following table details the aggregate fees billed or expected to be billed for each of the last two fiscal years for audit fees, audit-related fees, tax fees and other fees by the principal accountant.
| FYE 05/31/2012 | FYE 05/31/2011 | |
| Audit Fees | 13,250 | 13,250 |
| Audit-Related Fees | - | - |
| Tax Fees | - | - |
| All Other Fees | - | - |
The audit committee has adopted pre-approval policies and procedures that require the audit committee to pre-approve all audit and non-audit services of the Registrant, including services provided to any entity affiliated with the Registrant.
The percentage of fees billed by Cohen Fund Audit Services, Ltd. applicable to non-audit services pursuant to waiver of pre-approval requirement were as follows:
| FYE 05/31/2012 | FYE 05/31/2011 | |
| Audit-Related Fees | 0% | 0% |
| Tax Fees | 0% | 0% |
| All Other Fees | 0% | 0% |
All of the principal accountant’s hours spent on auditing the Registrant’s financial statements were attributed to work performed by full-time permanent employees of the principal accountant.
The following table indicates the non-audit fees billed or expected to be billed by the Registrant’s accountant for services to the Registrant and to the Registrant’s investment adviser (and any other controlling entity, etc.—not sub-adviser) for the last two years. The audit committee of the board of trustees/directors has considered whether the provision of non-audit services that were rendered to the Registrant's investment adviser is compatible with maintaining the principal accountant's independence and has concluded that the provision of such non-audit services by the accountant has not compromised the accountant’s independence.
| Non-Audit Related Fees | FYE 05/31/2012 | FYE 05/31/2011 |
| Registrant | - | - |
| Registrant’s Investment Adviser | - | - |
Item 5. Audit Committee of Listed Registrants.
Not applicable to registrants who are not listed issuers (as defined in Rule 10A-3 under the Securities Exchange Act of 1934).
Item 6. Investments.
Schedule of Investments is included as part of the report to shareholders filed under Item 1 of this Form.
Item 7. Disclosure of Proxy Voting Policies and Procedures for Closed-End Management Investment Companies.
Not applicable to open-end investment companies.
Item 8. Portfolio Managers of Closed-End Management Investment Companies.
Not applicable to open-end investment companies.
Item 10. Submission of Matters to a Vote of Security Holders.
There have been no material changes to the procedures by which shareholders may recommend nominees to the Registrant’s board of trustees.
Item 11. Controls and Procedures.
| (a) | The Registrant’s President/Chief Executive Officer and Treasurer/Chief Financial Officer have reviewed the Registrant's disclosure controls and procedures (as defined in Rule 30a-3(c) under the Investment Company Act of 1940 (the “Act”)) as of a date within 90 days of the filing of this report, as required by Rule 30a-3(b) under the Act and Rules 13a-15(b) or 15d-15(b) under the Securities Exchange Act of 1934. Based on their review, such officers have concluded that the disclosure controls and procedures are effective in ensuring that information required to be disclosed in this report is appropriately recorded, processed, summarized and reported and made known to them by others within the Registrant and by the Registrant’s service provider. |
| (b) | There were no changes in the Registrant's internal control over financial reporting (as defined in Rule 30a-3(d) under the Act) that occurred during the second fiscal quarter of the period covered by this report that has materially affected, or is reasonably likely to materially affect, the Registrant's internal control over financial reporting. |
Item 12. Exhibits.
| (a) | (1) Any code of ethics or amendment thereto, that is the subject of the disclosure required by Item 2, to the extent that the Registrant intends to satisfy Item 2 requirements through filing an exhibit. Incorporated by reference to the Registrant’s Form N-CSR filed August 9, 2007. |
(2) A separate certification for each principal executive and principal financial officer pursuant to Section 302 of the Sarbanes-Oxley Act of 2002. Filed herewith.
(3) Any written solicitation to purchase securities under Rule 23c-1 under the Act sent or given during the period covered by the report by or on behalf of the Registrant to 10 or more persons. Not applicable to open-end investment companies.
| (b) | Certifications pursuant to Section 906 of the Sarbanes-Oxley Act of 2002. Furnished herewith. |
SIGNATURES
Pursuant to the requirements of the Securities Exchange Act of 1934 and the Investment Company Act of 1940, the Registrant has duly caused this report to be signed on its behalf by the undersigned, thereunto duly authorized.
Allied Asset Advisors Funds
By /s/Bassam Osman
Bassam Osman, President
Date August 8, 2012
Pursuant to the requirements of the Securities Exchange Act of 1934 and the Investment Company Act of 1940, this report has been signed below by the following persons on behalf of the Registrant and in the capacities and on the dates indicated.
By /s/Bassam Osman
Bassam Osman, President
Date August 8, 2012
By /s/Mohammad Basheeruddin
Mohammad Basheeruddin, Treasurer
Date August 9, 2012