UNITED STATES
SECURITIES AND EXCHANGE COMMISSION
Washington, D.C. 20549
FORM N-CSR
CERTIFIED SHAREHOLDER REPORT OF REGISTERED
MANAGEMENT INVESTMENT COMPANIES
Investment Company Act file number 811-09821
Allied Asset Advisors Funds
(Exact name of Registrant as specified in charter)
721 Enterprise Drive, Suite 100
Oak Brook, IL 60523
(Address of principal executive offices) (Zip code)
Bassam Osman
Allied Asset Advisors Funds
721 Enterprise Drive, Suite 100
Oak Brook, IL 60523
(Name and address of agent for service)
(877)-417-6161
Registrant's telephone number, including area code
Date of fiscal year end: May 31, 2014
Date of reporting period: May 31, 2014
Item 1. Reports to Stockholders.
Annual Report
May 31, 2014
Iman Fund
IMAN FUND
July 22, 2014
Dear Shareholder,
Assalamu Alaykum (Greetings of Peace).
We are pleased to report that Iman Fund (“the Fund”) did well in the fiscal year ending May 31, 2014 gaining 20.30%. The Fund outperformed the S&P 500 Index and the Dow Jones Industrial Average, which increased 18.71% and 13.27%, respectively, during the same period. The Dow Jones Islamic Market USA Index and the Russell 3000 Growth Index went up 20.70% and 21.73%, respectively. However, we believe that with Iman Fund’s current and historical sizable holdings in overseas and small cap stocks, the Fund is best compared to the Dow Jones Islamic World Index (which has overseas stocks) and Wilshire 5000 Total Market Index (which has small cap stocks) which rose 18.45% and 18.22%, respectively. Your Fund outperformed both of these indexes.
U.S. stocks overcame fears of higher interest rates and slower economic growth and finished near their all-time high. U.S. Federal Reserve (Fed) policies (balancing stimulus reductions with low interest rates) contributed to the broad advance. The Iman Fund performance was helped by its overweighting of health and industrial stocks, which performed well, and its underweighting of telecommunication and utilities stocks, which lagged. The robust performance of the underweighted aerospace and defense sector detracted from the Fund’s performance. Despite the dismal (weather-influenced) first-quarter gross domestic product (GDP) figures, tensions in the Ukraine, fear of a slowing Chinese economy and a decline in early 2014 of biotechnology and momentum stocks, the U.S. stock market finished the period up. This positive performance was aided by higher consumer spending, economic optimism and the lowest unemployment since the great recession (2008.)
We believe that the Fund’s excellent performance can be attributed to the research, diligence, discipline and our risk-managed and historically-informed investment approach. This involved both stock selection and sector weighting. This achievement was reached without concentrating the Fund in a few stocks; rather the Fund owned about 120 stocks (higher than its average peers). This approach tends to cause less volatility than more concentrated portfolios and helps better navigate through turbulent markets. Our stock selection process focuses on earnings growth, return on equity, solid cash flows and strong balance sheets. We believe that over time this process will generate attractive risk adjusted returns.
Due to Islamic considerations, the Iman Fund avoids highly leveraged companies. This detracted from the Fund’s performance in the last five plus years. However, this trend is likely to reverse and the Fund is likely to benefit in the future from avoiding these companies. The highly leveraged companies have performed well since the financial crises of 2008. The extraordinarily unpredictable Fed quantitative easing helped them tremendously as these companies had an easy time borrowing at low interest rates. These highly leveraged companies were not initially priced with such anticipation of Fed easing. But this favorable factor is likely to change. We believe that as the Fed continues to wind down its bond-buying programs, the risk of rising interest rates could disproportionally impact highly leveraged companies that rely on the easy access to liquidity that has been the norm since the financial crisis. We anticipate the future economic environment will put a premium on cash flows and strong balance sheets (low, or no debt, stocks) and we anticipate these companies will be better able to weather a storm of tighter liquidity and higher cost of capital.
We strive to balance the risk/return equation by not relying on a single quarter or year of earnings. Equities are a claim not to one quarter or year of earnings, but to a very long-term stream of future earnings. This approach helps the Fund better navigate through market declines.
Market Outlook
In brief, we believe next year will still be rewarding to stock investors, but the high return of the last two years is unlikely to repeat. We believe that, considering current interest rates, stock valuations are justified. They are only mildly above long-term averages and they are supported by corporate profits that more than doubled in the past five years. On the other hand, investor sentiment appears too optimistic and the current cyclical bull is aged. At the same time, the trend remains supportive as does the accommodative Fed. The age old adage, “don’t fight the Fed, don’t fight the tape” continues to prove to be good advice.
IMAN FUND
Price-Earnings Valuation (P/E ratio) measures reflect a somewhat richly priced market; and so do most other important valuation measures such as dividends, cash flow and sales, relative to their historic norms. Record profit margins aside, it is helpful to remember that historical profit margins are mean reverting.
On the other hand, where would investors fearing mature equity markets go? In spite of money moving from bonds to stocks in the recent past, bonds continue to be the far larger capital market than equities. Bonds constitute over $100 trillion globally versus slightly less than half that value for equities. Capital flows dictated by the relative risk and reward potential in bonds can, therefore, have a potent effect on equity returns. With government bond yields still quite low in the 0% to 2% range for most developed nations (at up to 10 years of maturity), mathematically there is not a lot of return potential in these bonds under most conceivable scenarios, even if global inflation and GDP growth remain low. Consequently, it is quite plausible that there would be an ample supply of capital discouraged by the low bond yields seeking better returns elsewhere, including equities.
Final Word
A basic tenet of successful investing is to invest for the long run; riding out the markets’ inevitable ups and downs rather than selling into panic or chasing the hottest fad. Patience also affords the benefits of compounding, lower transaction cost, and reduced taxes. Diversification and most importantly geographic diversification are of utmost importance (your Fund’s holdings include more than 16% of non-U.S. stocks). Another tenet is investing regularly, which can help lower the average cost of your purchases. Investing a fixed sum of money each month or quarter ensures that you won’t purchase all your shares at market highs. This strategy — known as dollar cost averaging — also takes out the “emotion” from investing, and helps shareholders avoid irrational panics. No method can eliminate risk totally, but prudent strategies can considerably decrease the impact of short-term declines.
We thank you for entrusting your hard-earned money with us. We promise to continue to work hard to maintain your worthy trust. We welcome your questions and comments and look forward to serving your investment needs in the years ahead.
Bassam Osman
President, Iman Fund
Past performance is not a guarantee of future results.
The above discussion and analysis of the Fund reflect the opinions of the Advisor as of July 2014, are subject to change and any forecasts made cannot be guaranteed and should not be considered investment advice.
Mutual Fund investing involves risk; principal loss is possible. The Fund invests in foreign securities which involve greater volatility and political, economic and currency risks and differences in accounting methods. Historically, the Advisor believes that the Islamic restrictions placed on the Fund have not adversely affected the Fund; however, it is possible that these restrictions may result in the Fund not performing as well as mutual funds not subject to such restrictions. Investments in smaller companies involve additional risk, such as limited liquidity and greater volatility.
The Dow Jones Islamic Market USA Index is a diversified compilation of U.S. equity securities considered by Dow Jones to be in compliance with Islamic principles. The Dow Jones Islamic Market World Index measures the global universe of investable equities considered by Dow Jones to be in compliance with Islamic principles. The Russell 3000 Growth Index measures the performance of the broad growth segment of the U.S. equity universe. It includes those Russell 3000 Index companies with higher price-to-book ratios and higher forecasted growth values. The S&P 500 Index is a capitalization weighted index of 500 large capitalization stocks which is designed to measure broad domestic securities markets. The Dow Jones Industrial Average is a measurement of general market price movement for 30 widely-held stocks primarily listed on the New York Stock Exchange. The Wilshire 5000 Total Market Index is a market capitalization-weighted index composed of more than 6,700 publicly-traded companies that are headquartered in the United States, are actively traded on an American stock exchange and have pricing information that is widely available to the public. You cannot invest directly in an index.
Diversification does not assure a profit or protect against loss in a declining market.
Price-Earnings Valuation (P/E ratio) is a valuation ratio of a company’s current share price compared to its per-share earnings. Dollar Cost Averaging involves continuous investment in securities regardless of fluctuating price levels of such securities. The investor should consider his/her financial ability to continue purchases through periods of low price levels. Such a plan does not assure a profit and does not protect against loss in declining markets.
Fund holdings and sector allocations are subject to change and should not be considered a recommendation to buy or sell any security. For a complete list of Fund holdings, please refer to the Schedule of Investments included in this report.
2
IMAN FUND
EXPENSE EXAMPLE
May 31, 2014 (Unaudited)
As a shareholder of the Fund, you incur two types of costs: (1) transaction costs and (2) ongoing costs, including management fees and other Fund expenses. This Example is intended to help you understand your ongoing costs (in dollars) of investing in the Fund and to compare these costs with the ongoing costs of investing in other mutual funds. The Example is based on an investment of $1,000 invested at the beginning of the period and held for the entire period (12/1/13 - 5/31/14).
Actual Expenses
The first line of the table below provides information about actual account values and actual expenses. Although the Fund charges no sales load or transaction fees, you will be assessed fees for outgoing wire transfers, returned checks and stop payment orders at prevailing rates charged by U.S. Bancorp Fund Services, LLC, the Fund’s transfer agent. If you request a redemption be made by wire transfer, currently a $15.00 fee is charged by the Fund’s transfer agent. IRA accounts will be charged a $15.00 annual maintenance fee. The example below includes, but is not limited to, management fees, fund accounting, custody and transfer agent fees. However, the example below does not include portfolio trading commissions and related expenses, and other extraordinary expenses as determined under generally accepted accounting principles. You may use the information in this line, together with the amount you invested, to estimate the expenses that you paid over the period. Simply divide your account value by $1,000 (for example, an $8,600 account value divided by $1,000 = 8.6), then multiply the result by the number in the first line under the heading entitled “Expenses Paid During Period” to estimate the expenses you paid on your account during this period.
Hypothetical Example for Comparison Purposes
The second line of the table below provides information about hypothetical account values and hypothetical expenses based on the Fund’s actual expense ratio and an assumed rate of return of 5% per year before expenses, which is not the Fund’s actual return. The hypothetical account values and expenses may not be used to estimate the actual ending account balance or expenses you paid for the period. You may use this information to compare the ongoing costs of investing in the Fund and other funds. To do so, compare this 5% hypothetical example with the 5% hypothetical examples that appear in the shareholder reports of the other funds. Please note that the expenses shown in the table are meant to highlight your ongoing costs only and do not reflect any transactional costs, such as sales charges (loads), redemption fees, or exchange fees. Therefore, the second line of the table is useful in comparing ongoing costs only, and will not help you determine the relative total costs of owning different funds. In addition, if these transactional costs were included, your costs would have been higher. Please note that Iman Fund does not have any sales charge (loads), redemption fees, or exchange fees.
| Beginning | Ending | Expenses Paid | |
| Account Value | Account Value | During Period | |
| 12/1/13 | 5/31/14 | 12/1/13 - 5/31/14* | |
| Actual | $1,000.00 | $1,058.32 | $7.39 |
| Hypothetical (5% return before expenses) | 1,000.00 | 1,017.75 | 7.24 |
| * | Expenses are equal to the Fund’s annualized expense ratio of 1.44% multiplied by the average account value over the period multiplied by 182/365 (to reflect the one-half year period). |
3
IMAN FUND
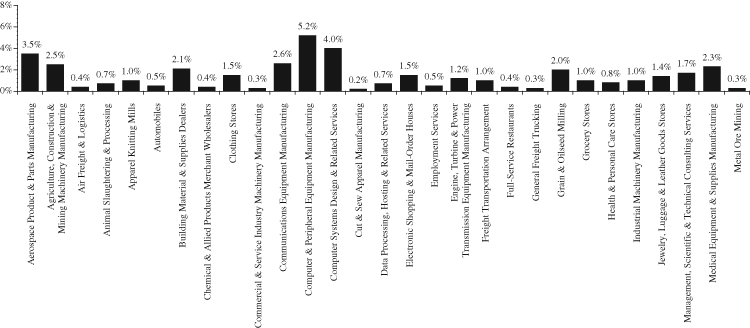
ALLOCATION OF PORTFOLIO ASSETS
(Calculated as a percentage of net assets)
May 31, 2014 (Unaudited)

4
IMAN FUND
Total Rate of Return
For the Period May 31, 2004 to May 31, 2014
(Unaudited)
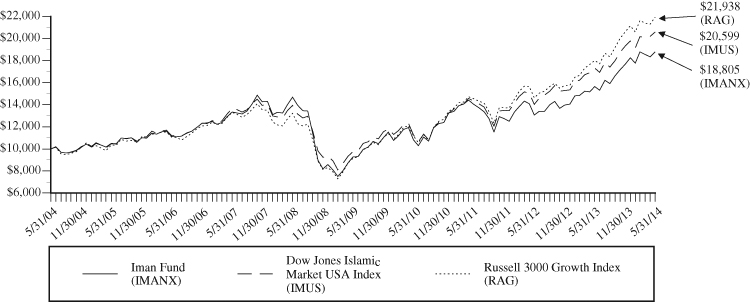
This chart assumes an initial investment of $10,000 made on May 31, 2004 and held through May 31, 2014.
Performance data quoted represents past performance and does not guarantee future results. The investment return and principal value of an investment will fluctuate so that an investor’s shares, when redeemed, may be worth more or less than their original cost. Current performance of the Fund may be lower or higher than the performance quoted. Performance data current to the recent month end may be obtained by visiting www.investaaa.com.
Indices mentioned are unmanaged and used to measure U.S. markets. You cannot invest directly in an index.
The graph and table do not reflect the deduction of taxes that a shareholder would pay on Fund distributions or redemptions of Fund shares.
| Six | One | Five | Ten | |
| Average Annual Total Return as of May 31, 2014 | Months | Year | Years | Years |
| Iman Fund | 6.55% | 20.30% | 15.21% | 6.52% |
| Dow Jones Islamic Market USA Index* | 6.74% | 20.70% | 15.58% | 7.23% |
| Russell 3000 Growth Index** | 6.52% | 21.73% | 19.10% | 8.17% |
| * | The Dow Jones Islamic Market USA Index is a diversified compilation of U.S. equity securities considered by Dow Jones to be in compliance with Islamic principles. The index is constructed from stocks in the Dow Jones Indexes (DJGI) family. Dow Jones believes that these stocks are accessible to investors and are well traded. The DJGI methodology removes issues that are not suitable for global investing. The performance of the Dow Jones Islamic Market USA Index does not include the reinvestment of dividends. |
| ** | The Russell 3000 Growth Index takes the largest 3,000 U.S. companies based on market capitalization and measures the performance of those with higher price-to-book ratios and higher forecasted growth values. |
5
IMAN FUND
SCHEDULE OF INVESTMENTS
May 31, 2014
(Classifications are based on the North American Industry Classification System)
| Number of | |||||||
| Shares | Value | ||||||
| COMMON STOCKS - 99.2% | |||||||
| AEROSPACE PRODUCT & PARTS | |||||||
| MANUFACTURING - 3.5% | |||||||
| 6,900 | Honeywell International, Inc. | $ | 642,735 | ||||
| 23,800 | TE Connectivity Ltd. (b) | 1,415,148 | |||||
| 2,057,883 | |||||||
| AGRICULTURE, | |||||||
| CONSTRUCTION & | |||||||
| MINING MACHINERY | |||||||
| MANUFACTURING - 2.5% | |||||||
| 4,800 | Alamo Group Inc. | 248,832 | |||||
| 8,400 | National Oilwell Varco Inc. | 687,708 | |||||
| 8,400 | The Toro Co. | 542,472 | |||||
| 1,479,012 | |||||||
| AIR FREIGHT & | |||||||
| LOGISTICS - 0.4% | |||||||
| 2,200 | United Parcel Service, Inc. (UPS) - | ||||||
| Class B | 228,536 | ||||||
| ANIMAL SLAUGHTERING & | |||||||
| PROCESSING - 0.7% | |||||||
| 4,700 | Sanderson Farms, Inc. | 434,797 | |||||
| APPAREL KNITTING MILLS - 1.0% | |||||||
| 8,800 | Gildan Activewear Inc. (b) | 479,424 | |||||
| 4,900 | Zumiez, Inc. (a) | 134,603 | |||||
| 614,027 | |||||||
| AUTOMOBILES - 0.5% | |||||||
| 13,400 | Winnebago Industries, Inc. (a) | 331,784 | |||||
| BUILDING MATERIAL & | |||||||
| SUPPLIES DEALERS - 2.1% | |||||||
| 13,400 | Fastenal Co. | 653,250 | |||||
| 7,400 | The Home Depot, Inc. | 593,702 | |||||
| 1,246,952 | |||||||
| CHEMICAL & ALLIED | |||||||
| PRODUCTS MERCHANT | |||||||
| WHOLESALERS - 0.4% | |||||||
| 2,100 | Acuity Brands, Inc. | 263,571 | |||||
| CLOTHING STORES - 1.5% | |||||||
| 5,500 | ANN INC. (a) | 213,785 | |||||
| 24,200 | Ascena Retail Group, Inc. (a) | 404,019 | |||||
| 6,000 | The Children’s Place | ||||||
| Retail Stores, Inc. | 290,280 | ||||||
| 908,084 | |||||||
| COMMERCIAL & SERVICE | |||||||
| INDUSTRY MACHINERY | |||||||
| MANUFACTURING - 0.3% | |||||||
| 5,900 | Copart, Inc. (a) | 209,863 | |||||
| COMMUNICATIONS | |||||||
| EQUIPMENT | |||||||
| MANUFACTURING - 2.6% | |||||||
| 8,100 | Cisco Systems, Inc. | 199,422 | |||||
| 3,400 | Motorola Solutions, Inc. | 229,228 | |||||
| 8,900 | Plantronics, Inc. | 403,526 | |||||
| 9,100 | QUALCOMM, Inc. | 732,095 | |||||
| 1,564,271 | |||||||
| COMPUTER & | |||||||
| PERIPHERAL EQUIPMENT | |||||||
| MANUFACTURING - 5.2% | |||||||
| 4,140 | Apple Inc. | 2,620,620 | |||||
| 5,900 | Zebra Technologies Corp. (a) | 438,370 | |||||
| 3,058,990 | |||||||
| COMPUTER SYSTEMS | |||||||
| DESIGN & RELATED | |||||||
| SERVICES - 4.0% | |||||||
| 5,000 | Accenture PLC - Class A (b) | 407,250 | |||||
| 3,700 | athenahealth Inc. (a) | 469,567 | |||||
| 5,800 | Cerner Corp. (a) | 313,490 | |||||
| 31,100 | Convergys Corp. | 678,602 | |||||
| 11,000 | Perficient, Inc. (a) | 194,040 | |||||
| 7,600 | Virtusa Corp. (a) | 259,996 | |||||
| 2,322,945 | |||||||
| CUT & SEW APPAREL | |||||||
| MANUFACTURING - 0.2% | |||||||
| 1,800 | Carter’s, Inc. | 129,834 | |||||
The accompanying notes are an integral part of these financial statements.
6
IMAN FUND
SCHEDULE OF INVESTMENTS (Continued)
May 31, 2014
(Classifications are based on the North American Industry Classification System)
| Number of | |||||||
| Shares | Value | ||||||
| COMMON STOCKS - 99.2% (Continued) | |||||||
| DATA PROCESSING, HOSTING | |||||||
| & RELATED SERVICES - 0.7% | |||||||
| 1,480 | CoStar Group Inc. (a) | $ | 234,654 | ||||
| 4,100 | Red Hat, Inc. (a) | 205,492 | |||||
| 440,146 | |||||||
| ELECTRONIC SHOPPING & | |||||||
| MAIL-ORDER HOUSES - 1.5% | |||||||
| 2,740 | Amazon.com, Inc. (a) | 856,387 | |||||
EMPLOYMENT SERVICES - 0.5% | |||||||
| 3,400 | Manpowergroup Inc. | 278,732 | |||||
ENGINE, TURBINE & POWER | |||||||
| TRANSMISSION EQUIPMENT | |||||||
| MANUFACTURING - 1.2% | |||||||
| 12,600 | Brunswick Corp. | 543,060 | |||||
| 1,300 | Cummins, Inc. | 198,809 | |||||
| 741,869 | |||||||
| FREIGHT TRANSPORTATION | |||||||
| ARRANGEMENT - 1.0% | |||||||
| 4,000 | FedEx Corp. | 576,640 | |||||
FULL-SERVICE | |||||||
| RESTAURANTS - 0.4% | |||||||
| 5,200 | Popeyes Louisiana Kitchen, Inc. (a) | 23,184 | |||||
GENERAL FREIGHT | |||||||
| TRUCKING - 0.3% | |||||||
| 7,100 | Knight Transportation, Inc. | 173,027 | |||||
GRAIN & OILSEED | |||||||
| MILLING - 2.0% | |||||||
| 5,000 | Unilever NV - | ||||||
| NY Reg. Shares - ADR (b) | 217,050 | ||||||
| 21,300 | Unilever PLC - ADR (b) | 957,861 | |||||
| 1,174,911 | |||||||
| GROCERY STORES - 1.0% | |||||||
| 8,700 | United Natural Foods, Inc. (a) | 586,467 | |||||
HEALTH & PERSONAL | |||||||
| CARE STORES - 0.8% | |||||||
| 5,800 | CVS Caremark Corp. | 454,256 | |||||
INDUSTRIAL MACHINERY | |||||||
| MANUFACTURING - 1.0% | |||||||
| 28,200 | Applied Materials, Inc. | 569,358 | |||||
JEWELRY, LUGGAGE & | |||||||
| LEATHER GOODS STORES - 1.4% | |||||||
| 7,600 | Signet Jewelers Ltd. (b) | 806,284 | |||||
MANAGEMENT, SCIENTIFIC & | |||||||
| TECHNICAL CONSULTING | |||||||
| SERVICES - 1.7% | |||||||
| 11,100 | Korn/Ferry International (a) | 337,107 | |||||
| 13,100 | Salesforce.com, Inc. (a) | 689,453 | |||||
| 1,026,560 | |||||||
| MEDICAL EQUIPMENT | |||||||
| & SUPPLIES | |||||||
| MANUFACTURING - 2.3% | |||||||
| 5,900 | 3M Co. | 841,045 | |||||
| 1,600 | Stryker Corp. | 135,184 | |||||
| 3,400 | Zimmer Holdings, Inc. | 354,790 | |||||
| 1,331,019 | |||||||
| METAL ORE MINING - 0.3% | |||||||
| 4,000 | Franco-Nevada Corp. (b) | 186,160 | |||||
MOTOR VEHICLE | |||||||
| BODY & TRAILER | |||||||
| MANUFACTURING - 0.8% | |||||||
| 5,200 | Lear Corp. | 457,860 | |||||
MOTOR VEHICLE | |||||||
| MANUFACTURING - 1.0% | |||||||
| 2,860 | Tesla Motors, Inc. (a) | 594,222 | |||||
MOTOR VEHICLE PARTS | |||||||
| MANUFACTURING - 2.3% | |||||||
| 16,600 | Delphi Automotive PLC (b) | 1,146,396 | |||||
| 5,200 | Sun Hydraulics Corp. | 191,984 | |||||
| 1,338,380 | |||||||
The accompanying notes are an integral part of these financial statements.
7
IMAN FUND
SCHEDULE OF INVESTMENTS (Continued)
May 31, 2014
(Classifications are based on the North American Industry Classification System)
| Number of | |||||||
| Shares | Value | ||||||
| COMMON STOCKS - 99.2% (Continued) | |||||||
| NAVIGATIONAL, MEASURING, | |||||||
| ELECTROMEDICAL & | |||||||
| CONTROL INSTRUMENTS | |||||||
| MANUFACTURING - 1.5% | |||||||
| 4,700 | Cyberonics, Inc. (a) | $ | 285,760 | ||||
| 1,000 | Danaher Corp. | 78,430 | |||||
| 5,100 | Masimo Corp. (a) | 125,664 | |||||
| 5,800 | MTS Systems Corp. | 383,960 | |||||
| 873,814 | |||||||
| NEWSPAPER, PERIODICAL, | |||||||
| BOOK & DIRECTORY | |||||||
| PUBLISHERS - 2.6% | |||||||
| 24,200 | Reed Elsevier PLC - ADR (b) | 1,547,590 | |||||
OFFICE ADMINISTRATIVE | |||||||
| SERVICES - 0.5% | |||||||
| 4,300 | Gartner, Inc. (a) | 305,687 | |||||
OFFICE FURNITURE | |||||||
| (INCLUDING FIXTURES) | |||||||
| MANUFACTURING - 1.5% | |||||||
| 15,600 | La-Z-Boy Inc. | 380,952 | |||||
| 31,400 | Steelcase Inc. - Class A | 514,646 | |||||
| 895,598 | |||||||
| OIL & GAS | |||||||
| EXTRACTION - 4.5% | |||||||
| 4,900 | Diamondback Energy, Inc. (a) | 369,852 | |||||
| 2,080 | EOG Resources, Inc. | 220,064 | |||||
| 2,200 | Helmerich & Payne, Inc. | 241,890 | |||||
| 15,600 | Imperial Oil Ltd. (b) | 767,988 | |||||
| 10,600 | Occidental Petroleum Corp. | 1,056,714 | |||||
| 2,656,508 | |||||||
| OTHER ELECTRICAL | |||||||
| EQUIPMENT & COMPONENT | |||||||
| MANUFACTURING - 0.5% | |||||||
| 4,400 | Emerson Electric Co. | 293,612 | |||||
OTHER GENERAL | |||||||
| PURPOSE MACHINERY | |||||||
| MANUFACTURING - 1.0% | |||||||
| 3,600 | Flowserve Corp. | 265,464 | |||||
| 4,800 | Graco, Inc. | 350,304 | |||||
| 615,768 | |||||||
| OTHER INFORMATION | |||||||
| SERVICES - 6.0% | |||||||
| 5,200 | Baidu, Inc. - ADR (a)(b) | 863,200 | |||||
| 11,500 | Facebook Inc. - Class A (a) | 727,950 | |||||
| 1,550 | Google Inc. - Class A (a) | 886,058 | |||||
| 1,950 | Google Inc. - Class C (a) | 1,093,911 | |||||
| 3,571,119 | |||||||
| OTHER MISCELLANEOUS | |||||||
| MANUFACTURING - 0.2% | |||||||
| 2,200 | Pool Corp. | 127,006 | |||||
OTHER TRANSPORTATION | |||||||
| EQUIPMENT | |||||||
| MANUFACTURING - 0.2% | |||||||
| 4,100 | Arctic Cat Inc. | 152,930 | |||||
OUTPATIENT CARE | |||||||
| CENTERS - 0.4% | |||||||
| 6,700 | U.S. Physical Therapy, Inc. | 224,651 | |||||
PESTICIDE, | |||||||
| FERTILIZER & OTHER | |||||||
| AGRICULTURAL CHEMICAL | |||||||
| MANUFACTURING - 0.8% | |||||||
| 4,000 | Monsanto Co. | 487,400 | |||||
PETROLEUM & | |||||||
| COAL PRODUCTS | |||||||
| MANUFACTURING - 5.6% | |||||||
| 10,100 | Chevron Corp. | 1,240,179 | |||||
| 20,500 | Exxon Mobil Corp. | 2,060,865 | |||||
| 3,301,044 | |||||||
The accompanying notes are an integral part of these financial statements.
8
IMAN FUND
SCHEDULE OF INVESTMENTS (Continued)
May 31, 2014
(Classifications are based on the North American Industry Classification System)
| Number of | |||||||
| Shares | Value | ||||||
| COMMON STOCKS - 99.2% (Continued) | |||||||
| PHARMACEUTICAL | |||||||
| & MEDICINE | |||||||
| MANUFACTURING - 9.5% | |||||||
| 8,100 | Alkermes PLC (a)(b) | $ | 371,061 | ||||
| 5,400 | Bristol-Myers Squibb Co. | 268,596 | |||||
| 1,000 | Forest Laboratories, Inc. (a) | 94,780 | |||||
| 7,300 | Gilead Sciences, Inc. (a) | 592,833 | |||||
| 2,000 | IDEXX Laboratories, Inc. (a) | 256,960 | |||||
| 9,800 | Johnson & Johnson | 994,308 | |||||
| 20,500 | Novartis AG - ADR (b) | 1,846,230 | |||||
| 11,100 | Sanofi - ADR - (b) | 591,630 | |||||
| 3,800 | Techne Corp. | 333,602 | |||||
| 3,600 | Vertex Pharmaceuticals Inc. (a) | 260,136 | |||||
| 5,610,136 | |||||||
| POULTRY & EGG | |||||||
| PRODUCTION - 0.7% | |||||||
| 6,300 | Cal-Maine Foods, Inc. | 439,488 | |||||
PROFESSIONAL & | |||||||
| COMMERCIAL EQUIPMENT | |||||||
| & SUPPLIES MERCHANT | |||||||
| WHOLESALERS - 0.3% | |||||||
| 1,700 | Henry Schein, Inc. (a) | 203,405 | |||||
RAIL TRANSPORTATION - 0.5% | |||||||
| 1,500 | Union Pacific Corp. | 298,905 | |||||
SCIENTIFIC RESEARCH | |||||||
| & DEVELOPMENT | |||||||
| SERVICES - 2.5% | |||||||
| 2,500 | Alexion Pharmaceuticals, Inc. (a) | 415,800 | |||||
| 5,300 | Babcock & Wilcox Co. | 171,296 | |||||
| 1,230 | Biogen Idec Inc. (a) | 392,825 | |||||
| 3,200 | Covance, Inc. (a) | 268,352 | |||||
| 4,200 | Incyte Corp. (a) | 208,110 | |||||
| 1,456,383 | |||||||
| SEMICONDUCTOR & OTHER | |||||||
| ELECTRONIC COMPONENT | |||||||
| MANUFACTURING - 4.4% | |||||||
| 22,700 | Benchmark Electronics, Inc. (a) | 526,413 | |||||
| 3,400 | Cavium, Inc. (a) | 166,532 | |||||
| 9,700 | Cree, Inc. (a) | 466,764 | |||||
| 10,800 | International Rectifier Corp. (a) | 289,656 | |||||
| 13,400 | Texas Instruments Inc. | 629,532 | |||||
| 9,900 | Tyco International Ltd. (b) | 432,036 | |||||
| 2,000 | Xilinx, Inc. | 93,920 | |||||
| 2,604,853 | |||||||
| SEMICONDUCTOR & | |||||||
| SEMICONDUCTOR | |||||||
| EQUIPMENT - 1.4% | |||||||
| 30,000 | Intel Corp. | 819,600 | |||||
SOFTWARE | |||||||
| PUBLISHERS - 5.2% | |||||||
| 11,000 | Aspen Technology, Inc. (a) | 472,890 | |||||
| 9,800 | Manhattan Associates, Inc. (a) | 318,108 | |||||
| 23,900 | Microsoft Corp. | 978,466 | |||||
| 22,500 | Oracle Corp. | 945,450 | |||||
| 3,000 | Ultimate Software Group, Inc. (a) | 381,390 | |||||
| 3,096,304 | |||||||
| SPORTING GOODS, HOBBY | |||||||
| & MUSICAL INSTRUMENT | |||||||
| STORES - 1.0% | |||||||
| 8,900 | Dicks Sporting Goods, Inc. | 395,605 | |||||
| 3,800 | Hibbett Sports, Inc. (a) | 199,842 | |||||
| 595,447 | |||||||
| SUPPORT ACTIVITIES | |||||||
| FOR MINING - 2.3% | |||||||
| 6,100 | Halliburton Co. | 394,304 | |||||
| 18,700 | RPC, Inc. | 413,083 | |||||
| 5,300 | Schlumberger Ltd. (b) | 551,412 | |||||
| 1,358,799 | |||||||
| TEXTILE, APPAREL & | |||||||
| LUXURY GOODS - 0.2% | |||||||
| 1,200 | NIKE, Inc. - Class B | 92,292 | |||||
The accompanying notes are an integral part of these financial statements.
9
IMAN FUND
SCHEDULE OF INVESTMENTS (Continued)
May 31, 2014
(Classifications are based on the North American Industry Classification System)
| Number of | |||||||
| Shares | Value | ||||||
| COMMON STOCKS - 99.2% (Continued) | |||||||
| VENTILATION, HEATING, | |||||||
| AIR-CONDITIONING & | |||||||
| COMMERCIAL | |||||||
| REFRIGERATION EQUIPMENT | |||||||
| MANUFACTURING - 0.8% | |||||||
| 10,900 | Donaldson Co., Inc. | $ | 443,957 | ||||
| TOTAL COMMON STOCKS | |||||||
| (Cost $49,468,916) | 58,738,307 | ||||||
| Total Investments | |||||||
| (Cost $49,468,916) - 99.2% | 58,738,307 | ||||||
| Other Assets in Excess | |||||||
| of Liabilities - 0.8% | 482,990 | ||||||
| TOTAL NET ASSETS - 100.0% | $ | 59,221,297 | |||||
ADR - American Depositary Receipt
(a)Non Income Producing
(b)Foreign Issued Securities
The accompanying notes are an integral part of these financial statements.
10
IMAN FUND
STATEMENT OF ASSETS AND LIABILITIES
May 31, 2014
| Assets: | ||||
| Investments, at value (cost $49,468,916) | $ | 58,738,307 | ||
| Cash | 484,307 | |||
| Receivable for investments sold | 183,741 | |||
| Receivable for capital shares sold | 17,669 | |||
| Dividends receivable | 113,027 | |||
| Other assets | 22,552 | |||
| Total Assets | 59,559,603 | |||
| Liabilities: | ||||
| Payable for investments purchased | 204,488 | |||
| Payable for capital shares redeemed | 2,000 | |||
| Payable to Advisor (Note 3) | 49,384 | |||
| Payable for professional fees | 33,224 | |||
| Payable to Trustees | 9,506 | |||
| Accrued expenses and other liabilities | 39,704 | |||
| Total Liabilities | 338,306 | |||
| Net Assets | $ | 59,221,297 | ||
| Net assets consist of: | ||||
| Paid-in capital | $ | 45,983,221 | ||
| Accumulated net investment loss | (15,049 | ) | ||
| Accumulated undistributed net realized gain on investments | 3,983,734 | |||
| Net unrealized appreciation on investments | 9,269,391 | |||
| Net Assets | $ | 59,221,297 | ||
| Shares of beneficial interest outstanding | ||||
| (unlimited number of shares authorized, no par value) | 5,111,002 | |||
| Net asset value, redemption price and offering price per share | $ | 11.59 | ||
The accompanying notes are an integral part of these financial statements.
11
IMAN FUND
STATEMENT OF OPERATIONS
For the Year Ended May 31, 2014
| Investment income: | ||||
| Dividend income (Net of foreign withholding tax of $16,898) | $ | 721,943 | ||
| Total investment income | 721,943 | |||
| Expenses: | ||||
| Advisory fees (Note 3) | 519,966 | |||
| Administration fees | 55,543 | |||
| Transfer agent fees and expenses | 50,869 | |||
| Legal fees | 41,588 | |||
| Fund accounting fees | 34,188 | |||
| Trustees’ fees and related expenses | 18,941 | |||
| Federal and state registration fees | 18,777 | |||
| Audit fees | 13,250 | |||
| Custody fees | 7,604 | |||
| Reports to shareholders | 5,696 | |||
| Other expenses | 2,450 | |||
| Total expenses | 768,872 | |||
| Net investment loss | (46,929 | ) | ||
| Realized and unrealized gain on investments: | ||||
| Net realized gain from security transactions | 5,621,806 | |||
| Change in net unrealized appreciation/depreciation on investments | 3,917,696 | |||
| Realized and unrealized gain on investments | 9,539,502 | |||
| Net increase in net assets from operations | $ | 9,492,573 | ||
The accompanying notes are an integral part of these financial statements.
12
IMAN FUND
STATEMENTS OF CHANGES IN NET ASSETS
| Year Ended | Year Ended | |||||||
| May 31, 2014 | May 31, 2013 | |||||||
| From operations: | ||||||||
| Net investment loss | $ | (46,929 | ) | $ | (144,211 | ) | ||
| Net realized gain on investments | 5,621,806 | 2,994,853 | ||||||
| Change in net unrealized appreciation/depreciation on investments | 3,917,696 | 4,371,070 | ||||||
| Net increase in net assets from operations | 9,492,573 | 7,221,712 | ||||||
| From distributions paid: | ||||||||
| Net realized gain on investments | (1,918,859 | ) | — | |||||
| Net decrease in net assets resulting from distributions paid | (1,918,859 | ) | — | |||||
| From capital share transactions: | ||||||||
| Proceeds from sale of shares | 8,560,104 | 5,293,558 | ||||||
| Net asset value of shares issued in reinvestment | ||||||||
| of distributions to shareholders | 1,906,543 | — | ||||||
| Payments for shares redeemed | (4,025,734 | ) | (3,431,560 | ) | ||||
| Net increase in net assets from capital share transactions | 6,440,913 | 1,861,998 | ||||||
| Total increase in net assets | 14,014,627 | 9,083,710 | ||||||
| Net assets: | ||||||||
| Beginning of period | 45,206,670 | 36,122,960 | ||||||
| End of period (includes accumulated net investment loss of $15,049 | ||||||||
| and $147,227, respectively) | $ | 59,221,297 | $ | 45,206,670 | ||||
The accompanying notes are an integral part of these financial statements.
13
IMAN FUND
FINANCIAL HIGHLIGHTS
Per Share Data for a Share Outstanding Throughout Each Period
| Year Ended May 31, | ||||||||||||||||||||
| 2014 | 2013 | 2012 | 2011 | 2010 | ||||||||||||||||
| Net asset value, beginning of period | $ | 9.99 | $ | 8.35 | $ | 8.97 | $ | 6.91 | $ | 5.92 | ||||||||||
| Income (loss) from investment operations: | ||||||||||||||||||||
Net investment loss(1) | (0.01 | ) | (0.03 | ) | (0.05 | ) | (0.05 | ) | (0.02 | ) | ||||||||||
| Net realized and unrealized gains (losses) | ||||||||||||||||||||
| on investments | 2.02 | 1.67 | (0.57 | ) | 2.11 | 1.01 | ||||||||||||||
| Total from investment operations | 2.01 | 1.64 | (0.62 | ) | 2.06 | 0.99 | ||||||||||||||
| Less distributions paid: | ||||||||||||||||||||
| From net realized gain on investments | (0.41 | ) | — | — | — | — | ||||||||||||||
| Total distributions paid | (0.41 | ) | — | — | — | — | ||||||||||||||
| Net asset value, end of period | $ | 11.59 | $ | 9.99 | $ | 8.35 | $ | 8.97 | $ | 6.91 | ||||||||||
| Total return | 20.30 | % | 19.64 | % | (6.91 | )% | 29.81 | % | 16.72 | % | ||||||||||
| Net assets at end of period (000’s) | $ | 59,221 | $ | 45,207 | $ | 36,123 | $ | 34,912 | $ | 27,713 | ||||||||||
| Ratio of expenses to average net assets | 1.48 | % | 1.59 | % | 1.74 | % | 1.75 | % | 1.71 | % | ||||||||||
| Ratio of net investment loss to average net assets | (0.09 | )% | (0.36 | )% | (0.65 | )% | (0.65 | )% | (0.23 | )% | ||||||||||
| Portfolio turnover rate | 71.7 | % | 109.5 | % | 96.9 | % | 169.3 | % | 177.5 | % | ||||||||||
| (1) | Net investment loss per share is calculated using ending balances prior to consideration of adjustments for permanent book and tax differences. |
The accompanying notes are an integral part of these financial statements.
14
IMAN FUND
NOTES TO THE FINANCIAL STATEMENTS
May 31, 2014
1.Organization
Allied Asset Advisors Funds (the “Trust”), an open-end management investment company, was organized as a Delaware statutory trust on January 14, 2000. The Trust currently offers one series of shares to investors, the Iman Fund (the “Fund”), a diversified series of the Trust. Allied Asset Advisors, Inc. (“AAA” or the “Advisor”), a Delaware corporation, serves as investment advisor to the Fund.
The Trust is authorized to issue an unlimited number of shares without par value, of each series. The Trust currently offers one class of shares of the Fund.
The investment objective of the Fund is to seek growth of capital while adhering to Islamic principles. To achieve its investment objective, the Fund seeks investments that meet Islamic principles whose prices the Fund’s Advisor anticipates will increase over the long term. Under normal circumstances, the Fund invests its net assets in domestic and foreign securities chosen by the Advisor in accordance with Islamic principles. Islamic principles generally preclude investments in certain businesses (e.g., alcohol, pornography and gambling) and investments in interest bearing debt obligations. Any uninvested cash will be held in non-interest bearing deposits or invested in a manner following Islamic principles.
2.Significant Accounting Policies
The following is a summary of significant accounting policies consistently followed by the Fund in the preparation of its financial statements. These policies are in conformity with accounting principles generally accepted in the United States of America (“GAAP”).
Use of Estimates: In preparing the financial statements in conformity with GAAP, management is required to make estimates and assumptions that affect the reported amounts of assets and liabilities and disclosure of contingent assets and liabilities as of the date of the financial statements and the reported amounts of increases and decreases in net assets from operations during the reporting period. Actual results could differ from these estimates.
Security Valuation: Investment securities are carried at fair value determined using the following valuation methods:
| • | Equity securities listed on a U.S. securities exchange or NASDAQ for which market quotations are readily available are valued at the last quoted sale price on the valuation date. |
| • | Options, futures, unlisted U.S. securities and listed U.S. securities not traded on the valuation date for which market quotations are readily available are valued at the most recent quoted bid price. The Fund did not hold any such securities during the year ended May 31, 2014. |
| • | Securities or other assets for which market quotations are not readily available are valued at fair value as determined in good faith by the Advisor under direction of the Board of Trustees. |
The Fund has adopted fair valuation accounting standards which establish an authoritative definition of fair value and a three-tier hierarchy to distinguish between (1) inputs that reflect the assumptions market participants would use in pricing an asset or liability developed based on market data obtained from sources independent of the reporting entity (observable inputs) and (2) inputs that reflect the reporting entity’s own assumptions about the assumptions market participants would use in pricing an asset or liability developed based on the best information available in the circumstances (unobservable inputs) and to establish classification of fair value measurements for disclosure purposes.
Summary of Fair Value Exposure at May 31, 2014
The Trust has performed an analysis of all existing investments to determine the significance and character of all inputs to their fair value determination. Various inputs are used in determining the value of the Fund’s investments. These inputs are summarized in the three broad levels listed below:
| Level 1 - | Quoted prices in active markets for identical securities. |
| Level 2 - | Other significant observable inputs (including quoted prices for similar securities in active markets, quoted prices for identical or similar instruments in |
15
IMAN FUND
NOTES TO THE FINANCIAL STATEMENTS (Continued)
May 31, 2014
| markets that are not active, model-derived valuations in which all significant inputs and significant value drivers are observable in active markets, interest rates, prepayment speeds, credit risk, etc.) |
| Level 3 - | Significant unobservable inputs (including the Fund’s own assumptions in determining the fair value of investments) |
Inputs that are used in determining a fair value of an investment may include price information, credit data, volatility statistics, and other factors. These inputs can be either observable or unobservable. The availability of observable inputs can vary between investments, and is affected by various factors such as the type of investment or similar investments in the marketplace. The inputs will be considered by the Advisor, along with any other relevant factors in the calculation of an investment’s fair value. The Fund uses prices and inputs that are current as of the measurement date, which may include periods of market dislocations. During these periods, the availability of prices and inputs may be reduced for many investments. This condition could cause an investment to be reclassified between the various levels within the hierarchy.
Investments falling into the Level 3 category are primarily supported by quoted prices from brokers and dealers participating in the market for those investments. However, these may be classified as Level 3 investments due to lack of market transparency and corroboration to support these quoted prices. Additionally, valuation models may be used as the pricing source for any remaining investments classified as Level 3. These models rely on one or more significant unobservable inputs and/or significant assumptions by the Advisor. Inputs used in valuations may include, but are not limited to, financial statement analysis, capital account balances, discount rates and estimated cash flows, and comparable company data.
The inputs or methodology used for valuing securities are not an indication of the risk associated with investing in those securities.
The following is a summary of the inputs used to value the Fund’s net assets as of May 31, 2014:
| Level 1 | Level 2 | Level 3 | Total | |||||||||||||
| Common Stocks | $ | 58,738,307 | $ | — | $ | — | $ | 58,738,307 | ||||||||
| Total* | $ | 58,738,307 | $ | — | $ | — | $ | 58,738,307 | ||||||||
| * | Additional information regarding the industry and/or geographical classification of these investments is disclosed in the Schedule of Investments. |
There were no transfers into or out of Level 1, Level 2 or Level 3 fair value measurements during the reporting period for the Fund, as compared to their classification from the most recent annual report. It is the Fund’s policy to consider transfers into or out of Level 1, Level 2 or Level 3 as of the end of the reporting period.
Foreign Securities: Investing in securities of foreign companies and foreign governments involves special risks and consideration not typically associated with investing in U.S. companies and the U.S. government. These risks include revaluation of currencies and future adverse political and economic developments. Moreover, securities of many foreign companies and foreign governments and their markets may be less liquid and their prices more volatile than those of securities of comparable U.S. companies and the U.S. government. The Fund does not invest in securities of U.S. or foreign governments.
Federal Income Taxes: It is the Fund’s policy to comply with the requirements of the Internal Revenue Code applicable to regulated investment companies and the Fund intends to distribute all of its taxable income and net capital gains to shareholders. Therefore, no federal income tax provision is required.
As of and during the year ended May 31, 2014, the Fund did not have a liability for any unrecognized tax benefits. The Fund recognizes interest and penalties, if any, related to unrecognized tax benefits as other expenses in the Statement of Operations. During the year, the Fund did not incur any interest or penalties. The statute of limitations on the Fund’s tax returns remains open for the years ended May 31, 2011 through May 31, 2014.
16
IMAN FUND
NOTES TO THE FINANCIAL STATEMENTS (Continued)
May 31, 2014
As of May 31, 2014, the components of distributable earnings on a tax basis were as follows:
| Cost of investments | $ | 49,498,219 | ||
| Gross tax unrealized appreciation | $ | 10,269,183 | ||
| Gross tax unrealized depreciation | (1,029,095 | ) | ||
| Net tax unrealized appreciation | $ | 9,240,088 | ||
| Undistributed ordinary income | 1,525,493 | |||
| Undistributed long-term capital gain | 2,472,495 | |||
| Total distributable earnings | $ | 3,997,988 | ||
| Other accumulated losses | — | |||
| Total accumulated gain | $ | 13,238,076 |
The difference between book basis and tax basis unrealized and realized gains and losses is attributable primarily to the tax deferral of losses relating to wash sale transactions and mark-to-market on PFICs.
Under current tax laws, losses realized after October 31 may be deferred and treated as occurring on the first business day of the following fiscal year. For the fiscal year ended May 31, 2014, the Fund did not defer, on a tax basis, any post-December late-year losses.
Distributions to Shareholders: The Fund will distribute substantially all of the net investment income and net realized gains that it has realized on the sale of securities. These income and gains distributions will generally be paid once each year, on or before December 31. The character of distributions made during the year from net investment income or net realized gains may differ from the characterization for federal income tax purposes due to differences in the recognition of income, expense or gain items for financial reporting and tax reporting purposes.
The tax character of distributions paid were as follows:
| Year Ended | Year Ended | |
| May 31, 2014 | May 31, 2013 | |
| Ordinary Income | $ 747,674 | $ — |
| Long-term capital gains | $1,171,185 | $ — |
Dividend income and distributions to shareholders are recorded on the ex-dividend date. The Fund may periodically make reclassifications among certain of its capital accounts to reflect the tax character of permanent book/tax differences related to the components of the Fund’s net assets. These reclassifications have no impact on the net assets or net asset value of the Fund. For the fiscal year ended May 31, 2014, undistributed net investment income was increased by $179,107; and accumulated net realized gain was decreased by $179,107.
Other: Investment transactions and shareholder transactions are accounted for on the trade date. Net realized gains and losses on securities are computed on the basis of specific security lot identification. Withholding taxes on foreign dividends have been provided for in accordance with the Fund’s understanding of the applicable country’s tax rules and rates.
Subsequent Events: In preparing these financial statements, management has performed an evaluation of subsequent events after May 31, 2014 and determined that there were no significant subsequent events that would require adjustment to or additional disclosure in the financial statements.
3.Investment Advisory and Other Agreements
The Trust has an Investment Advisory Agreement (the “Agreement”) with the Advisor, with whom certain officers and a Trustee of the Trust are affiliated, to furnish investment advisory services to the Fund. Under the terms of the Agreement, the Trust, on behalf of the Fund, compensates the Advisor for its management services at the annual rate of 1.00% of the Fund’s daily average net assets.
For the year ended May 31, 2014, the Fund had advisory expenses of $519,966 and as of May 31, 2014, the Fund had $49,384 payable to the Advisor.
The Trust has a distribution agreement and a servicing agreement with Quasar Distributors, LLC (the “Distributor”). Fees for such distribution services are paid to the Distributor by the Advisor.
17
IMAN FUND
NOTES TO THE FINANCIAL STATEMENTS (Continued)
May 31, 2014
4.Capital Share Transactions
Capital Share Transactions of the Fund for the year ended May 31, 2014, were as follows:
| Amount | Shares | |||||||
| Shares sold | $ | 8,560,104 | 780,479 | |||||
| Shares reinvested | 1,906,543 | 170,379 | ||||||
| Shares redeemed | (4,025,734 | ) | (366,088 | ) | ||||
| Net increase | $ | 6,440,913 | 584,770 | |||||
Shares Outstanding | ||||||||
| Beginning of period | 4,526,232 | |||||||
| End of period | 5,111,002 | |||||||
Capital Share Transactions of the Fund for the year ended May 31, 2013, were as follows:
| Amount | Shares | |||||||
| Shares sold | $ | 5,293,558 | 576,444 | |||||
| Shares redeemed | (3,431,560 | ) | (375,071 | ) | ||||
| Net increase | $ | 1,861,998 | 201,373 | |||||
Shares Outstanding | ||||||||
| Beginning of period | 4,324,859 | |||||||
| End of period | 4,526,232 | |||||||
5.Securities Transactions
During the year ended May 31, 2014, the cost of purchases and proceeds from sales of investment securities, other than short-term investments were $41,486,300 and $36,820,435, respectively. There were no purchases or sales of U.S. government securities for the Fund.
6.Beneficial Ownership
The beneficial ownership, either directly or indirectly, of more than 25% of the voting securities of a fund creates a presumption of control of the fund, under Section 2(a)(9) of the Investment Company Act of 1940. As of May 31, 2014, the North American Islamic Trust (“NAIT”) held 66.3% of the Fund. NAIT is the parent company of the Advisor.
18
IMAN FUND
REPORT OF INDEPENDENT REGISTERED PUBLIC ACCOUNTING FIRM
To the Shareholders and
Board of Trustees of
Iman Fund
We have audited the accompanying statement of assets and liabilities, including the schedule of investments, of Iman Fund (the “Fund”) as of May 31, 2014, and the related statement of operations for the year then ended, the statements of changes in net assets for each of the two years in the period then ended, and the financial highlights for each of the five years in the period then ended. These financial statements and financial highlights are the responsibility of the Fund’s management. Our responsibility is to express an opinion on these financial statements and financial highlights based on our audits.
We conducted our audits in accordance with the standards of the Public Company Accounting Oversight Board (United States). Those standards require that we plan and perform the audit to obtain reasonable assurance about whether the financial statements and financial highlights are free of material misstatement. An audit includes examining, on a test basis, evidence supporting the amounts and disclosures in the financial statements. Our procedures included confirmation of securities owned as of May 31, 2014, by correspondence with the custodian and brokers. An audit also includes assessing the accounting principles used and significant estimates made by management, as well as evaluating the overall financial statement presentation. We believe that our audits provide a reasonable basis for our opinion.
In our opinion, the financial statements and financial highlights referred to above present fairly, in all material respects, the financial position of Iman Fund as of May 31, 2014, the results of its operations for the year then ended, the changes in its net assets for each of the two years in the period then ended, and the financial highlights for each of the five years in the period then ended, in conformity with accounting principles generally accepted in the United States of America.
COHEN FUND AUDIT SERVICES, LTD.
Cleveland, Ohio
July 30, 2014
19
IMAN FUND
DISCLOSURE REGARDING THE BOARD OF TRUSTEES
APPROVAL OF THE INVESTMENT ADVISORY AGREEMENT (Unaudited)
In approving the continuance of the investment advisory contract between Allied Asset Advisors Inc. (the “Advisor”) and the Iman Fund (the “Fund”), the Board of Trustees of the Fund (the “Board”) was advised by, and the independent Trustees of the Board met in executive session with, independent legal counsel to discuss the duties of the Trustees in consideration of the continuance of the agreement. The Board received and reviewed a substantial amount of information provided by the Advisor and third parties in response to the Board’s requests. Based on its evaluation of the information provided, the Board, at a meeting held April 21, 2014, approved continuation of the investment advisory contract for a period through June 29, 2015.
The Board reviewed and analyzed various factors in considering the contract and reaching its conclusions, including each of the factors described below.
1. Nature, Quality, and Extent of Services
The Board’s analysis of the nature, quality, and extent of the Advisor’s service to the Fund took into account the knowledge gained from the Board’s regular meetings with the Advisor throughout the prior year. In addition, the Board reviewed information on the key personnel involved in providing investment management services to the Fund and the Advisor’s performance of services for the Fund, such as stock selection, adherence to the Fund’s investment restrictions, and monitoring compliance with applicable Fund policies and procedures. The Board concluded that the nature, quality, and extent of the services provided by the Advisor to the Fund were appropriate and the Fund was likely to continue to benefit from services provided under its contract with the Advisor.
2. Investment Performance of the Fund and the Advisor
In considering the performance of the Fund and the Advisor, the Board compared the Fund’s performance with that of a universe of greater than 1,000 U.S. large cap mutual funds, as determined by Morningstar, an independent data service provider. The performance data was for one-, five- and ten-year periods ended March 31, 2014. The Board also compared the Fund’s performance for the three-month and one-, three-, five- and ten-year periods ended March 31, 2014 with that of three benchmark indices: the Dow Jones Islamic Market USA Index (the “DJI”), the S&P 500 Index (the “S&P”) and the Russell 3000 Growth Index (the “Russell”). In addition, the Board also compared the Fund’s performance for the three-month, six-month and one-year periods ended March 31, 2014 with three other mutual funds that follow Islamic principles.
The Board considered that the Fund had outperformed the DJI for the one- and five-year periods and had underperformed the DJI for the three-month and ten-year periods ended March 31, 2014. Next, the Board considered that the Fund had underperformed the S&P for the three-month, one-, five- and ten-year periods ended March 31, 2014. The Board also considered that the Fund had outperformed the Russell for the three-month period and had underperformed the Russell for the one-, five- and ten-year periods ended March 31, 2014.
The Board considered that the Fund had outperformed two of Islamic principles peer funds for the three-month, six-month and, with the exception of one of the funds, one-year periods ended March 31, 2014, underperformed another of the Islamic peer funds for the three-month and six-month periods but outperformed for the one-year period ended March 31, 2014. The Board also reviewed the Fund’s performance against its peer universe, noting that the Fund underperformed its peer universe median for the one-, five- and ten-year periods. The Board then discussed the principal reasons for the Fund’s underperformance in various periods. During this discussion it was noted that, unlike other funds in the peer universe, the Fund does not invest solely in large capitalization securities, but also in other capitalizations, which is unlike a majority of the funds in the comparison.
After considering all the information, the Board concluded that, although past performance cannot be a guarantee of future performance, the Fund and its shareholders were benefiting from the Advisor’s investment management of the Fund.
20
IMAN FUND
DISCLOSURE REGARDING THE BOARD OF TRUSTEES
APPROVAL OF THE INVESTMENT ADVISORY AGREEMENT (Unaudited), (Continued)
3. Costs of Services and Profits Realized by the Advisor
The Board examined the fee and expense information for the Fund as compared to that of other comparable funds and noted that the Advisor’s management fees, as a percentage of net assets, were at the breakpoint between the third and fourth quartiles of comparable funds and were higher than the peer group median reported by Morningstar. The Board noted, however, that the Fund’s special nature makes it distinct from most of the funds in its Morningstar peer group, which included many funds that are part of much larger families of funds and, therefore, realize economies of scale that the Fund does not.
In addition, the Board considered the Advisor’s costs in serving as the Fund’s investment adviser and manager. The costs include those associated with the personnel and systems necessary to manage the Fund. The Board also considered the financial condition of the Advisor and the losses incurred by the Advisor. The Board also considered the Advisor’s ability to repay its parent company for a promissory note agreed upon on December 31, 2003. The Board asked the Advisor whether the representation from the parent company indicating that the parent company would not call the note in the near future was still in effect. An officer of the Advisor affirmed that this was still the case. The Board concluded that the management fee and the total expenses of the Fund were reasonable in light of the services provided and the performance the Fund achieved over various time periods, and that the other expenses of the Fund also were reasonable.
4. Economies of Scale
The Board considered the extent to which the Fund’s management fee reflected economies of scale for the benefit of Fund shareholders. The Board noted that because the Advisor was operating at a loss and had a cumulative deficit, a discussion of economies of scale was not applicable with respect to the management fee received by the Advisor.
5. Other Benefits to the Advisor
The Board considered benefits that accrue to the Advisor from its relationship with the Fund. The Board noted that the Advisor did not employ soft-dollars and therefore did not derive research products or services from brokerage commissions paid by the Fund on its brokerage transactions.
After full consideration of the above factors as well as other factors, the Board, including all independent Trustees, unanimously concluded that approval of the Fund’s advisory contract was in the best interest of the Fund and its shareholders.
21
IMAN FUND
SUPPLEMENTAL INFORMATION (Unaudited)
Information pertaining to the Trustees and Officers of the Fund is set forth below. Each Trustee will serve until the termination of the Trust or his earlier death, resignation, retirement, incapacity or removal. The statement of additional information (SAI) includes additional information about the Trustees and is available without charge, upon request by calling (877) 417-6161 or writing to Iman Fund, c/o Allied Asset Advisors, Inc., 721 Enterprise Drive, Suite 100, Oak Brook, IL 60523.
| No. of | Principal | Other | ||
| Funds in | Occupation(s) | Trusteeships / | ||
| Name, Age, Address | Date First | Complex | during the past | Directorships |
| Position with Trust | Elected | Overseen | 5 years | by Trustee |
| Bassam Osman*, 63 | 2000 | 1 | 1980 to present – Medical | None |
| 721 Enterprise Drive, Suite 100 | Doctor; 2000 to present – | |||
| Oak Brook, IL 60523 | Portfolio Manager | |||
| Trustee and President | to the Fund | |||
| Abdalla Idris Ali, 65 | 2000 | 1 | 2011 to present – | None |
| 721 Enterprise Drive, Suite 100 | Secretary General of | |||
| Oak Brook, IL 60523 | “ISNA Canada”; 2009 to | |||
| Independent Trustee | 2011 – Deputy Secretary | |||
| General of ISNA Canada; | ||||
| 2007 to 2009 – Director, | ||||
| Center for Islamic Education | ||||
| in North America (CIENA) | ||||
| Mohammed Kaiseruddin, 70 | Chairperson | 1 | 1973 to present – | None |
| 721 Enterprise Drive, Suite 100 | since 2006 and | Nuclear Engineer, | ||
| Oak Brook, IL 60523 | Independent | Sargent & Lundy | ||
| Chairperson and | Trustee | |||
| Independent Trustee | since 2000 | |||
| Muhammad Kudaimi, 58 | 2009 | 1 | 1988 to present – | None |
| 721 Enterprise Drive, Suite 100 | Medical Doctor | |||
| Oak Brook, IL 60523 | ||||
| Independent Trustee | ||||
| Mohammad Basheeruddin, 64 | Treasurer | 1 | 2001 to present – | N/A |
| 721 Enterprise Drive, Suite 100 | since 2003 and | Accounting Manager, | ||
| Oak Brook, IL 60523 | Chief Compliance | North American | ||
| Treasurer and | Officer | Islamic Trust | ||
| Chief Compliance Officer | since 2008 | |||
| Mujeeb Cheema, 66 | 2003 | 1 | 2003 to present – | N/A |
| 721 Enterprise Drive, Suite 100 | Executive Director, | |||
| Oak Brook, IL 60523 | North American | |||
| Secretary | Islamic Trust |
| * | This trustee is deemed to be an “interested person” of the Trust as that term is defined in Section 2(a)(19) of the Investment Company Act of 1940, as amended, because he is an officer of the Trust and is a director and officer of Allied Asset Advisors, Inc. |
Tax Information
The Fund designates 32.4% of its ordinary income distribution for the year ended May 31, 2014 as qualified dividend income under the Jobs and Growth Tax Relief Reconciliation Act of 2003.
For the year ended May 31, 2014, 23.6% of the dividends paid from net ordinary income for the Fund qualifies for the dividends received deduction available to corporate shareholders.
For the year ended May 31, 2014, 100% of the Percentage of taxable ordinary income distributions that are designated as short-term capital gain distributions under Internal Revenue Section 871(k)(2)(C).
22
IMAN FUND
ADDITIONAL INFORMATION
May 31, 2014
Proxy Voting Policies and Procedures (Unaudited)
A description of the policies and procedures that the Fund uses to determine how to vote proxies relating to portfolio securities is available without charge, upon request, by calling (877) 417-6161 or by accessing the Fund’s website at http://www.investaaa.com. Furthermore, you can obtain the description on the SEC’s website at http://www.sec.gov.
Proxy Voting Record (Unaudited)
Information regarding how the Fund voted proxies relating to portfolio securities during the most recent 12-month period ended June 30 is available without charge, upon request, by calling (877) 417-6161. Furthermore, you can obtain the Fund’s proxy voting records on the SEC’s website at http://www.sec.gov.
Availability of Quarterly Portfolio Schedule (Unaudited)
The Fund files its complete schedule of portfolio holdings with the SEC for the first and third quarters of each fiscal year on Form N-Q. The filing will be available, upon request, by calling (877) 417-6161. Furthermore, you will be able to obtain a copy of the filing on the SEC’s website at http://www.sec.gov. The Fund’s Forms N-Q may also be reviewed and copied at the SEC’s Public Reference Room in Washington, DC, and information on the operation of the Public Reference Room may be obtained by calling (800) SEC-0330.
PRIVACY POLICY
In the course of servicing your account, we collect the following nonpublic personal information about you:
| • | Information we receive from you on or in applications or other forms, correspondence, or conversations, including, but not limited to, your name, address, phone number, social security number, assets, income and date of birth; and |
| • | Information about your transactions with us, our affiliates, or others, including, but not limited to, your account number and balance, parties to transactions, cost basis information, and other financial information. |
| • | Information collected from our website (including from the use of “cookies”) |
We do not disclose any nonpublic personal information about our current or former shareholders to nonaffiliated third parties, except as permitted by law. For example, we are permitted by law to disclose all of the information we collect, as described above, to our transfer agent to process your transactions. Furthermore, we restrict access to your nonpublic personal information to those persons who require such information to provide products or services to you. We maintain physical, electronic, and procedural safeguards that comply with industry standards to guard your nonpublic personal information.
In the event that you hold shares of the Fund through a financial intermediary, including, but not limited to, a broker-dealer, bank, or trust company, the privacy policy of your financial intermediary would govern how your financial intermediary shares nonpublic personal information with nonaffiliated third parties.
23
INVESTMENT ADVISOR
Allied Asset Advisors, Inc.
Oak Brook, Illinois
DISTRIBUTOR
Quasar Distributors, LLC
Milwaukee, Wisconsin
INDEPENDENT REGISTERED
PUBLIC ACCOUNTING FIRM
Cohen Fund Audit Services, Ltd.
Cleveland, Ohio
ADMINISTRATOR, TRANSFER AGENT,
AND FUND ACCOUNTANT
U.S. Bancorp Fund Services, LLC
Milwaukee, Wisconsin
CUSTODIAN
U.S. Bank, N.A.
Milwaukee, Wisconsin
LEGAL COUNSEL
Latham & Watkins
Chicago, Illinois
This report has been prepared for shareholders and may be distributed to others only if preceded or accompanied by a current prospectus. Read the Prospectus carefully before you invest or send money. The Prospectus contains important information about the Fund, including charges and expenses. The principal value of your investment will fluctuate and your shares may be worth less than your original cost. Quasar Distributors, LLC is the Distributor for the Fund.
Item 2. Code of Ethics.
The Registrant has adopted a code of ethics that applies to the Registrant’s principal executive officer and principal financial officer. The Registrant has not made any amendments to its code of ethics during the period covered by this report. The Registrant has not granted any waivers from any provisions of the code of ethics during the period covered by this report. The Registrant’s code of ethics is incorporated herein by reference to its form N-CSR filed on August 9, 2007.
Item 3. Audit Committee Financial Expert.
The Registrant’s board of trustees has determined that it does not have an audit committee financial expert serving on its audit committee. At this time, the Registrant believes that the experience provided by each member of the audit committee together offers the Registrant adequate oversight for the Registrant’s level of financial complexity.
Item 4. Principal Accountant Fees and Services.
The Registrant has engaged its principal accountant to perform audit services, audit-related services, tax services and other services during the past two fiscal years. “Audit services” refer to performing an audit of the Registrant's annual financial statements or services that are normally provided by the accountant in connection with statutory and regulatory filings or engagements for those fiscal years. “Audit-related services” refer to the assurance and related services by the principal accountant that are reasonably related to the performance of the audit. “Tax services” refer to professional services rendered by the principal accountant for tax compliance, tax advice, and tax planning. The following table details the aggregate fees billed or expected to be billed for each of the last two fiscal years for audit fees, audit-related fees, tax fees and other fees by the principal accountant.
| FYE 5/31/2014 | FYE 5/31/2013 | |
| Audit Fees | 13,250 | 13,250 |
| Audit-Related Fees | - | - |
| Tax Fees | - | - |
| All Other Fees | - | - |
The audit committee has adopted pre-approval policies and procedures that require the audit committee to pre-approve all audit and non-audit services of the Registrant, including services provided to any entity affiliated with the Registrant.
The percentage of fees billed by Cohen Fund Audit Services, Ltd. applicable to non-audit services pursuant to waiver of pre-approval requirement were as follows:
| FYE 5/31/2014 | FYE 5/31/2013 | |
| Audit-Related Fees | 0% | 0% |
| Tax Fees | 0% | 0% |
| All Other Fees | 0% | 0% |
All of the principal accountant’s hours spent on auditing the Registrant’s financial statements were attributed to work performed by full-time permanent employees of the principal accountant.
The following table indicates the non-audit fees billed or expected to be billed by the Registrant’s accountant for services to the Registrant and to the Registrant’s investment adviser (and any other controlling entity, etc.—not sub-adviser) for the last two years. The audit committee of the board of trustees/directors has considered whether the provision of non-audit services that were rendered to the Registrant's investment adviser is compatible with maintaining the principal accountant's independence and has concluded that the provision of such non-audit services by the accountant has not compromised the accountant’s independence.
| Non-Audit Related Fees | FYE 5/31/2014 | FYE 5/31/2013 |
| Registrant | - | - |
| Registrant’s Investment Adviser | - | - |
Item 5. Audit Committee of Listed Registrants.
Not applicable to Registrants who are not listed issuers (as defined in Rule 10A-3 under the Securities Exchange Act of 1934).
Item 6. Investments.
Schedule of Investments is included as part of the report to shareholders filed under Item 1 of this Form.
Item 7. Disclosure of Proxy Voting Policies and Procedures for Closed-End Management Investment Companies.
Not applicable to open-end investment companies.
Item 8. Portfolio Managers of Closed-End Management Investment Companies.
Not applicable to open-end investment companies.
Item 9. Purchases of Equity Securities by Closed-End Management Investment Company and Affiliated Purchasers.
Not applicable to open-end investment companies.
Item 10. Submission of Matters to a Vote of Security Holders.
There have been no material changes to the procedures by which shareholders may recommend nominees to the Registrant’s board of trustees.
Item 11. Controls and Procedures.
| (a) | The Registrant’s President/Chief Executive Officer and Treasurer/Chief Financial Officer have reviewed the Registrant's disclosure controls and procedures (as defined in Rule 30a-3(c) under the Investment Company Act of 1940 (the “Act”)) as of a date within 90 days of the filing of this report, as required by Rule 30a-3(b) under the Act and Rules 13a-15(b) or 15d-15(b) under the Securities Exchange Act of 1934. Based on their review, such officers have concluded that the disclosure controls and procedures are effective in ensuring that information required to be disclosed in this report is appropriately recorded, processed, summarized and reported and made known to them by others within the Registrant and by the Registrant’s service provider. |
| (b) | There were no changes in the Registrant's internal control over financial reporting (as defined in Rule 30a-3(d) under the Act) that occurred during the second fiscal quarter of the period covered by this report that has materially affected, or is reasonably likely to materially affect, the Registrant's internal control over financial reporting. |
Item 12. Exhibits.
| (a) | (1) Any code of ethics or amendment thereto, that is the subject of the disclosure required by Item 2, to the extent that the Registrant intends to satisfy Item 2 requirements through filing an exhibit. Incorporated by reference to the Registrant’s Form N-CSR filed August 9, 2007. |
(2) A separate certification for each principal executive and principal financial officer pursuant to Section 302 of the Sarbanes-Oxley Act of 2002. Filed herewith.
(3) Any written solicitation to purchase securities under Rule 23c-1 under the Act sent or given during the period covered by the report by or on behalf of the Registrant to 10 or more persons. Not applicable to open-end investment companies.
| (b) | Certifications pursuant to Section 906 of the Sarbanes-Oxley Act of 2002. Furnished herewith. |
SIGNATURES
Pursuant to the requirements of the Securities Exchange Act of 1934 and the Investment Company Act of 1940, the Registrant has duly caused this report to be signed on its behalf by the undersigned, thereunto duly authorized.
Allied Asset Advisors Funds
By /s/Bassam Osman
Bassam Osman, President
Date August 1, 2014
Pursuant to the requirements of the Securities Exchange Act of 1934 and the Investment Company Act of 1940, this report has been signed below by the following persons on behalf of the Registrant and in the capacities and on the dates indicated.
By /s/Bassam Osman
Bassam Osman, President
Date August 1, 2014
By /s/Mohammad Basheeruddin
Mohammad Basheeruddin, Treasurer
Date August 8, 2014