Table of Contents
UNITED STATES
SECURITIES AND EXCHANGE COMMISSION
Washington, D.C. 20549
FORM N-CSR
CERTIFIED SHAREHOLDER REPORT OF REGISTERED
MANAGEMENT INVESTMENT COMPANIES
Investment Company Act file number: 811-09819
STATE STREET INSTITUTIONAL INVESTMENT TRUST
(Exact name of registrant as specified in charter)
P.O. Box 5501
Boston, Massachusetts 02206
(Address of principal executive offices)(Zip code)
| (Name and Address of Agent for Service) | Copy to: | |
David James, Vice President and Managing Director and Managing Counsel State Street Bank and Trust Company 100 Huntington Avenue, 3rd Floor Boston, Massachusetts 02116 | Timothy W. Diggins, Esq. Ropes & Gray 800 Boylston Street Boston, Massachusetts 02110-2624 | |
Registrant’s telephone number, including area code: (617) 662-1742
Date of fiscal year end: December 31
Date of reporting period: December 31, 2014
Table of Contents
| Item 1. | Shareholder Report. |
Table of Contents
Annual Report
31 December 2014
State Street Institutional Investment Trust
State Street Institutional Liquid Reserves Fund
State Street Institutional Tax Free Money Market Fund
State Street Institutional U.S. Government Money Market Fund
State Street Institutional Treasury Money Market Fund
State Street Institutional Treasury Plus Money Market Fund

Table of Contents
State Street Institutional Investment Trust
Statements of Assets and Liabilities
December 31, 2014
| Liquid Reserves Fund | Tax Free Money Market Fund | U.S. Government Money Market Fund | Treasury Money Market Fund | Treasury Plus Money Market Fund | ||||||||||||||||
Assets | ||||||||||||||||||||
Investments in corresponding Portfolio, at market value and cost (Note 1) | $ | 40,290,056,052 | $ | 253,194,259 | $ | 12,451,155,292 | $ | 9,079,338,638 | $ | 2,765,528,948 | ||||||||||
Receivable from Adviser and Distributor (Note 3) | 205,127 | 135,116 | 1,218,951 | 1,854,300 | 487,140 | |||||||||||||||
Prepaid expenses and other assets | 17,174 | 4,398 | 8,351 | 7,524 | 5,133 | |||||||||||||||
|
|
|
|
|
|
|
|
|
| |||||||||||
Total assets | 40,290,278,353 | 253,333,773 | 12,452,382,594 | 9,081,200,462 | 2,766,021,221 | |||||||||||||||
|
|
|
|
|
|
|
|
|
| |||||||||||
Liabilities | ||||||||||||||||||||
Administration and custody fees payable (Note 3) | 3,050,968 | 20,650 | 970,410 | 856,588 | 217,038 | |||||||||||||||
Registration and filing fees payable | 556,738 | 794 | 365,799 | 4,329 | 9,573 | |||||||||||||||
Shareholder servicing fee payable (Note 3) | 148,680 | 31,970 | 126,000 | 155,720 | 15,574 | |||||||||||||||
Distribution fees payable (Note 3) | 59,470 | 12,788 | 50,397 | 62,288 | 6,438 | |||||||||||||||
Professional fees payable | 18,393 | 18,393 | 18,393 | 18,393 | 18,393 | |||||||||||||||
Dividends payable | 415,769 | – | – | 30,704 | – | |||||||||||||||
Transfer agent fees payable | 14,688 | 1,878 | 3,007 | 4,190 | 2,298 | |||||||||||||||
Accrued expenses and other liabilities | 7,166 | 2,447 | 6,843 | 2,612 | 12,077 | |||||||||||||||
|
|
|
|
|
|
|
|
|
| |||||||||||
Total liabilities | 4,271,872 | 88,920 | 1,540,849 | 1,134,824 | 281,391 | |||||||||||||||
|
|
|
|
|
|
|
|
|
| |||||||||||
Net Assets | $ | 40,286,006,481 | $ | 253,244,853 | $ | 12,450,841,745 | $ | 9,080,065,638 | $ | 2,765,739,830 | ||||||||||
|
|
|
|
|
|
|
|
|
| |||||||||||
Net Assets Consist of: | ||||||||||||||||||||
Paid-in capital | $ | 40,285,807,013 | $ | 253,244,853 | $ | 12,450,994,279 | $ | 9,080,056,168 | $ | 2,765,741,327 | ||||||||||
Undistributed net investment income | 807 | – | – | – | 38 | |||||||||||||||
Accumulated net realized gain (loss) | 198,661 | – | (152,534 | ) | 9,470 | (1,535 | ) | |||||||||||||
|
|
|
|
|
|
|
|
|
| |||||||||||
Net Assets | $ | 40,286,006,481 | $ | 253,244,853 | $ | 12,450,841,745 | $ | 9,080,065,638 | $ | 2,765,739,830 | ||||||||||
|
|
|
|
|
|
|
|
|
| |||||||||||
Net Assets | ||||||||||||||||||||
Premier Class | $ | 37,932,780,822 | $ | 85,165,763 | $ | 10,962,800,426 | $ | 8,338,817,905 | $ | 2,690,959,105 | ||||||||||
|
|
|
|
|
|
|
|
|
| |||||||||||
Investment Class | $ | 726,910,199 | $ | 168,079,090 | $ | 615,706,454 | $ | 741,247,733 | $ | 74,780,725 | ||||||||||
|
|
|
|
|
|
|
|
|
| |||||||||||
Class M Shares | $ | 1,626,315,460 | $ | – | $ | – | $ | – | $ | – | ||||||||||
|
|
|
|
|
|
|
|
|
| |||||||||||
Class G Shares | $ | – | $ | – | $ | 872,334,865 | $ | – | $ | – | ||||||||||
|
|
|
|
|
|
|
|
|
| |||||||||||
Shares of Beneficial Interest Outstanding | ||||||||||||||||||||
Premier Class | 37,932,608,336 | 85,159,919 | 10,963,153,547 | 8,338,918,217 | 2,691,084,372 | |||||||||||||||
|
|
|
|
|
|
|
|
|
| |||||||||||
Investment Class | 726,890,905 | 168,089,227 | 615,777,040 | 741,238,714 | 74,804,915 | |||||||||||||||
|
|
|
|
|
|
|
|
|
| |||||||||||
Class M Shares | 1,626,305,443 | – | – | – | – | |||||||||||||||
|
|
|
|
|
|
|
|
|
| |||||||||||
Class G Shares | – | – | 872,334,012 | – | – | |||||||||||||||
|
|
|
|
|
|
|
|
|
| |||||||||||
Offering, Net Asset Value, and Redemption Price Per Share | ||||||||||||||||||||
Premier Class | $ | 1.00 | $ | 1.00 | $ | 1.00 | $ | 1.00 | $ | 1.00 | ||||||||||
|
|
|
|
|
|
|
|
|
| |||||||||||
Investment Class | $ | 1.00 | $ | 1.00 | $ | 1.00 | $ | 1.00 | $ | 1.00 | ||||||||||
|
|
|
|
|
|
|
|
|
| |||||||||||
Class M Shares | $ | 1.00 | $ | – | $ | – | $ | – | $ | – | ||||||||||
|
|
|
|
|
|
|
|
|
| |||||||||||
Class G Shares | $ | – | $ | – | $ | 1.00 | $ | – | $ | – | ||||||||||
|
|
|
|
|
|
|
|
|
| |||||||||||
See Notes to Financial Statements and Financial Statements of the Master Funds.
3
Table of Contents
State Street Institutional Investment Trust
Statements of Operations
Year Ended December 31, 2014
| Liquid Reserves Fund | Tax Free Money Market Fund | U.S. Government Money Market Fund | Treasury Money Market Fund | Treasury Plus Money Market Fund | ||||||||||||||||
Income and Expenses Allocated from Portfolio | ||||||||||||||||||||
Interest income allocated from Portfolio (Note 2) | $ | 75,910,142 | $ | 111,959 | $ | 7,512,794 | $ | 4,754,063 | $ | 1,338,375 | ||||||||||
Expenses allocated from Portfolio (Note 2) | (25,848,763 | ) | (310,684 | ) | (6,686,898 | ) | (7,011,497 | ) | (1,845,773 | ) | ||||||||||
|
|
|
|
|
|
|
|
|
| |||||||||||
| 50,061,379 | (198,725 | ) | 825,896 | (2,257,434 | ) | (507,398 | ) | |||||||||||||
|
|
|
|
|
|
|
|
|
| |||||||||||
Expenses | ||||||||||||||||||||
Administration and custody fees (Note 3) | 19,312,085 | 155,318 | 4,988,672 | 5,289,288 | 1,321,137 | |||||||||||||||
Shareholder servicing fee – Investment Class (Note 3) | 2,236,106 | 481,442 | 1,588,804 | 2,641,065 | 214,309 | |||||||||||||||
Distribution fees – Investment Class (Note 3) | 894,442 | 192,577 | 635,522 | 1,056,426 | 85,724 | |||||||||||||||
Transfer agent fees (Note 3) | 201,489 | 23,259 | 66,580 | 53,579 | 28,600 | |||||||||||||||
Registration and filing fees | 91,302 | 33,785 | 76,335 | 62,663 | 61,921 | |||||||||||||||
Printing fees | 62,452 | 27,406 | 51,374 | 33,028 | 53,712 | |||||||||||||||
Professional fees | 27,796 | 27,774 | 27,774 | 27,774 | 27,786 | |||||||||||||||
Trustees’ fees and expenses | 15,000 | 15,000 | 15,000 | 15,000 | 15,000 | |||||||||||||||
Other expenses | 909,600 | 9,011 | 370,740 | 178,402 | 50,600 | |||||||||||||||
|
|
|
|
|
|
|
|
|
| |||||||||||
Total expenses | 23,750,272 | 965,572 | 7,820,801 | 9,357,225 | 1,858,789 | |||||||||||||||
Less: Expenses reimbursed by the Adviser (Note 3) | – | (490,278 | ) | (4,770,536 | ) | (7,917,168 | ) | (2,066,158 | ) | |||||||||||
Shareholder servicing fees waived – Investment Class (Note 3) | (1,581,187 | ) | (481,442 | ) | (1,588,804 | ) | (2,641,065 | ) | (214,309 | ) | ||||||||||
Distribution fees waived – Investment Class (Note 3) | (894,442 | ) | (192,577 | ) | (635,522 | ) | (1,056,426 | ) | (85,724 | ) | ||||||||||
|
|
|
|
|
|
|
|
|
| |||||||||||
Net expenses | 21,274,643 | (198,725 | ) | 825,939 | (2,257,434 | ) | (507,402 | ) | ||||||||||||
|
|
|
|
|
|
|
|
|
| |||||||||||
Net Investment Income (Loss) | 28,786,736 | – | (43 | ) | – | 4 | ||||||||||||||
|
|
|
|
|
|
|
|
|
| |||||||||||
Net realized gain (loss) on investments allocated from Portfolio | 198,661 | – | 13,046 | 117,085 | – | |||||||||||||||
|
|
|
|
|
|
|
|
|
| |||||||||||
Net Increase (Decrease) in Net Assets Resulting from Operations | $ | 28,985,397 | $ | – | $ | 13,003 | $ | 117,085 | $ | 4 | ||||||||||
|
|
|
|
|
|
|
|
|
| |||||||||||
See Notes to Financial Statements and Financial Statements of the Master Funds.
4
Table of Contents
State Street Institutional Investment Trust
Statements of Changes in Net Assets
| Liquid Reserves Fund | Tax Free Money Market Fund | |||||||||||||||
| Year Ended December 31, 2014 | Year Ended December 31, 2013 | Year Ended December 31, 2014 | Year Ended December 31, 2013 | |||||||||||||
Increase (Decrease) in Net Assets Resulting from: | ||||||||||||||||
Operations: | ||||||||||||||||
Net investment income (loss) | $ | 28,786,736 | $ | 32,033,463 | $ | – | $ | – | ||||||||
Net realized gain (loss) on investments allocated from Portfolio | 198,661 | 177,461 | – | – | ||||||||||||
|
|
|
|
|
|
|
| |||||||||
Net increase in net assets from operations | 28,985,397 | 32,210,924 | – | – | ||||||||||||
|
|
|
|
|
|
|
| |||||||||
Distributions to Shareholders from: | ||||||||||||||||
Net investment income | ||||||||||||||||
Premier Class | (26,599,363 | ) | (29,184,932 | ) | – | – | ||||||||||
Investment Class | – | (5,330 | ) | – | – | |||||||||||
Class M Shares | (2,186,566 | ) | (3,020,682 | ) | – | – | ||||||||||
|
|
|
|
|
|
|
| |||||||||
Net realized gain on investments | ||||||||||||||||
Premier Class | – | (251,002 | ) | – | – | |||||||||||
Investment Class | – | (8,467 | ) | – | – | |||||||||||
Class M Shares | – | (22,446 | ) | – | – | |||||||||||
|
|
|
|
|
|
|
| |||||||||
Total distributions | (28,785,929 | ) | (32,492,859 | ) | – | – | ||||||||||
|
|
|
|
|
|
|
| |||||||||
Net Increase (Decrease) from Capital Share Transactions: | ||||||||||||||||
Premier Class | ||||||||||||||||
Shares sold | 353,923,706,878 | 336,083,274,055 | 865,899,893 | 1,016,054,183 | ||||||||||||
Reinvestment of distributions | 21,491,940 | 24,430,932 | – | – | ||||||||||||
Shares redeemed | (345,862,628,800 | ) | (330,666,228,512 | ) | (899,893,422 | ) | (1,037,149,920 | ) | ||||||||
|
|
|
|
|
|
|
| |||||||||
Net increase (decrease) from capital share transactions | 8,082,570,018 | 5,441,476,475 | (33,993,529 | ) | (21,095,737 | ) | ||||||||||
|
|
|
|
|
|
|
| |||||||||
Investment Class | ||||||||||||||||
Shares sold | 4,696,526,177 | 4,754,323,242 | 400,229,896 | 333,396,430 | ||||||||||||
Reinvestment of distribution | – | 757 | – | – | ||||||||||||
Shares redeemed | (4,982,772,495 | ) | (4,702,331,212 | ) | (421,014,069 | ) | (512,778,308 | ) | ||||||||
|
|
|
|
|
|
|
| |||||||||
Net increase (decrease) from capital share transactions | (286,246,318 | ) | 51,992,787 | (20,784,173 | ) | (179,381,878 | ) | |||||||||
|
|
|
|
|
|
|
| |||||||||
Class M Shares | ||||||||||||||||
Shares sold | 17,170,761,953 | 15,835,425,740 | – | – | ||||||||||||
Reinvestment of distributions | 2,186,586 | 3,043,106 | – | – | ||||||||||||
Shares redeemed | (18,371,959,020 | ) | (14,910,742,956 | ) | – | – | ||||||||||
|
|
|
|
|
|
|
| |||||||||
Net increase (decrease) from capital share transactions | (1,199,010,481 | ) | 927,725,890 | – | – | |||||||||||
|
|
|
|
|
|
|
| |||||||||
Net Increase (Decrease) in Net Assets | 6,597,512,687 | 6,420,913,217 | (54,777,702 | ) | (200,477,615 | ) | ||||||||||
Net Assets | ||||||||||||||||
Beginning of year | 33,688,493,794 | 27,267,580,577 | 308,022,555 | 508,500,170 | ||||||||||||
|
|
|
|
|
|
|
| |||||||||
End of year | $ | 40,286,006,481 | $ | 33,688,493,794 | $ | 253,244,853 | $ | 308,022,555 | ||||||||
|
|
|
|
|
|
|
| |||||||||
Undistributed net investment income | $ | 807 | $ | – | $ | – | $ | – | ||||||||
|
|
|
|
|
|
|
| |||||||||
Changes in Shares: | ||||||||||||||||
Premier Class | ||||||||||||||||
Shares sold | 353,923,706,878 | 336,083,274,055 | 865,899,893 | 1,016,054,183 | ||||||||||||
Reinvestment of distributions | 21,491,940 | 24,430,932 | – | – | ||||||||||||
Shares redeemed | (345,862,628,800 | ) | (330,666,228,512 | ) | (899,893,422 | ) | (1,037,149,920 | ) | ||||||||
|
|
|
|
|
|
|
| |||||||||
Net increase (decrease) in shares | 8,082,570,018 | 5,441,476,475 | (33,993,529 | ) | (21,095,737 | ) | ||||||||||
|
|
|
|
|
|
|
| |||||||||
Investment Class | ||||||||||||||||
Shares sold | 4,696,526,177 | 4,754,323,242 | 400,229,896 | 333,396,430 | ||||||||||||
Reinvestment of distributions | – | 757 | – | – | ||||||||||||
Shares redeemed | (4,982,772,495 | ) | (4,702,331,212 | ) | (421,014,069 | ) | (512,778,308 | ) | ||||||||
|
|
|
|
|
|
|
| |||||||||
Net increase (decrease) in shares | (286,246,318 | ) | 51,992,787 | (20,784,173 | ) | (179,381,878 | ) | |||||||||
|
|
|
|
|
|
|
| |||||||||
Class M Shares | ||||||||||||||||
Shares sold | 17,170,761,953 | 15,835,425,740 | – | – | ||||||||||||
Reinvestment of distributions | 2,186,586 | 3,043,106 | – | – | ||||||||||||
Shares redeemed | (18,371,959,020 | ) | (14,910,742,956 | ) | – | – | ||||||||||
|
|
|
|
|
|
|
| |||||||||
Net increase (decrease) in shares | (1,199,010,481 | ) | 927,725,890 | – | – | |||||||||||
|
|
|
|
|
|
|
| |||||||||
See Notes to Financial Statements and Financial Statements of the Master Funds.
5
Table of Contents
State Street Institutional Investment Trust
Statements of Changes in Net Assets
| U.S. Government Money Market Fund | Treasury Money Market Fund | |||||||||||||||
| Year Ended December 31, 2014 | Year Ended December 31, 2013 | Year Ended December 31, 2014 | Year Ended December 31, 2013 | |||||||||||||
Increase (Decrease) in Net Assets Resulting from: | ||||||||||||||||
Operations: | ||||||||||||||||
Net investment income (loss) | $ | (43 | ) | $ | 367,253 | $ | – | $ | – | |||||||
Net realized gain (loss) on investments allocated from Portfolio | 13,046 | – | 117,085 | 31,186 | ||||||||||||
|
|
|
|
|
|
|
| |||||||||
Net increase in net assets from operations | 13,003 | 367,253 | 117,085 | 31,186 | ||||||||||||
|
|
|
|
|
|
|
| |||||||||
Distributions to Shareholders from: | ||||||||||||||||
Net investment income | ||||||||||||||||
Premier Class | – | (367,253 | ) | – | (4,791 | ) | ||||||||||
Investment Class | – | – | – | (507 | ) | |||||||||||
Class G | (43 | ) | – | – | – | |||||||||||
|
|
|
|
|
|
|
| |||||||||
Net realized gain on investments | ||||||||||||||||
Premier Class | – | – | (115,556 | ) | (11,156 | ) | ||||||||||
Investment Class | – | – | (10,904 | ) | (1,182 | ) | ||||||||||
|
|
|
|
|
|
|
| |||||||||
Total distributions | (43 | ) | (367,253 | ) | (126,460 | ) | (17,636 | ) | ||||||||
|
|
|
|
|
|
|
| |||||||||
Net Increase (Decrease) from Capital Share Transactions: | ||||||||||||||||
Premier Class | ||||||||||||||||
Shares sold | 35,021,325,932 | 29,289,928,667 | 31,975,975,514 | 33,038,519,477 | ||||||||||||
Reinvestment of distributions | – | 300,395 | 95,741 | 11,000 | ||||||||||||
Shares redeemed | (31,247,787,167 | ) | (29,215,192,015 | ) | (35,586,824,951 | ) | (31,240,037,368 | ) | ||||||||
|
|
|
|
|
|
|
| |||||||||
Net increase (decrease) from capital share transactions | 3,773,538,765 | 75,037,047 | (3,610,753,696 | ) | 1,798,493,109 | |||||||||||
|
|
|
|
|
|
|
| |||||||||
Investment Class | ||||||||||||||||
Shares sold | 3,966,547,545 | 3,561,968,939 | 1,670,573,898 | 2,944,776,957 | ||||||||||||
Reinvestment of distribution | – | – | 19 | – | ||||||||||||
Shares redeemed | (4,042,310,684 | ) | (3,525,478,044 | ) | (2,336,534,788 | ) | (3,013,504,193 | ) | ||||||||
|
|
|
|
|
|
|
| |||||||||
Net increase (decrease) from capital share transactions | (75,763,139 | ) | 36,490,895 | (665,960,871 | ) | (68,727,236 | ) | |||||||||
|
|
|
|
|
|
|
| |||||||||
Class G Shares* | ||||||||||||||||
Shares sold | 1,626,172,411 | – | – | – | ||||||||||||
Reinvestment of distributions | 43 | – | – | – | ||||||||||||
Shares redeemed | (753,838,442 | ) | – | – | – | |||||||||||
|
|
|
|
|
|
|
| |||||||||
Net increase (decrease) from capital share transactions | 872,334,012 | – | – | – | ||||||||||||
|
|
|
|
|
|
|
| |||||||||
Net Increase (Decrease) in Net Assets | 4,570,122,598 | 111,527,942 | (4,276,723,942 | ) | 1,729,779,423 | |||||||||||
Net Assets | ||||||||||||||||
Beginning of year | 7,880,719,147 | 7,769,191,205 | 13,356,789,580 | 11,627,010,157 | ||||||||||||
|
|
|
|
|
|
|
| |||||||||
End of year | $ | 12,450,841,745 | $ | 7,880,719,147 | $ | 9,080,065,638 | $ | 13,356,789,580 | ||||||||
|
|
|
|
|
|
|
| |||||||||
Undistributed net investment income | $ | – | $ | – | $ | – | $ | – | ||||||||
|
|
|
|
|
|
|
| |||||||||
Changes in Shares: | ||||||||||||||||
Premier Class | ||||||||||||||||
Shares sold | 35,021,325,932 | 29,289,928,667 | 31,975,975,514 | 33,038,519,477 | ||||||||||||
Reinvestment of distributions | – | 300,395 | 95,741 | 11,000 | ||||||||||||
Shares redeemed | (31,247,787,167 | ) | (29,215,192,015 | ) | (35,586,824,951 | ) | (31,240,037,368 | ) | ||||||||
|
|
|
|
|
|
|
| |||||||||
Net increase (decrease) in shares | 3,773,538,765 | 75,037,047 | (3,610,753,696 | ) | 1,798,493,109 | |||||||||||
|
|
|
|
|
|
|
| |||||||||
Investment Class | ||||||||||||||||
Shares sold | 3,966,547,545 | 3,561,968,939 | 1,670,573,898 | 2,944,776,957 | ||||||||||||
Reinvestment of distributions | – | – | 19 | – | ||||||||||||
Shares redeemed | (4,042,310,684 | ) | (3,525,478,044 | ) | (2,336,534,788 | ) | (3,013,504,193 | ) | ||||||||
|
|
|
|
|
|
|
| |||||||||
Net increase (decrease) in shares | (75,763,139 | ) | 36,490,895 | (665,960,871 | ) | (68,727,236 | ) | |||||||||
|
|
|
|
|
|
|
| |||||||||
Class G Shares* | ||||||||||||||||
Shares sold | 1,626,172,411 | – | – | – | ||||||||||||
Reinvestment of distributions | 43 | – | – | – | ||||||||||||
Shares redeemed | (753,838,442 | ) | – | – | – | |||||||||||
|
|
|
|
|
|
|
| |||||||||
Net increase (decrease) in shares | 872,334,012 | – | – | – | ||||||||||||
|
|
|
|
|
|
|
| |||||||||
| * | The Fund’s Class G Shares commenced operations on October 5, 2014. |
See Notes to Financial Statements and Financial Statements of the Master Funds.
6
Table of Contents
State Street Institutional Investment Trust
Statements of Changes in Net Assets
| Treasury Plus Money Market Fund | ||||||||
| Year Ended December 31, 2014 | Year Ended December 31, 2013 | |||||||
Increase (Decrease) in Net Assets Resulting from: | ||||||||
Operations: | ||||||||
Net investment income (loss) | $ | 4 | $ | 17,770 | ||||
Net realized gain (loss) on investments allocated from Portfolio | – | (1,535 | ) | |||||
|
|
|
| |||||
Net increase in net assets from operations | 4 | 16,235 | ||||||
|
|
|
| |||||
Distributions to Shareholders from: | ||||||||
Net investment income | ||||||||
Premier Class | – | (17,770 | ) | |||||
Investment Class | – | – | ||||||
|
|
|
| |||||
Net realized gain on investments | ||||||||
Premier Class | – | (183 | ) | |||||
Investment Class | – | (7 | ) | |||||
|
|
|
| |||||
Total distributions | – | (17,960 | ) | |||||
|
|
|
| |||||
Net Increase (Decrease) from Capital Share Transactions: | ||||||||
Premier Class | ||||||||
Shares sold | 13,323,353,168 | 10,855,859,490 | ||||||
Reinvestment of distributions | – | 16,684 | ||||||
Shares redeemed | (13,311,990,338 | ) | (10,379,419,190 | ) | ||||
|
|
|
| |||||
Net increase (decrease) from capital share transactions | 11,362,830 | 476,456,984 | ||||||
|
|
|
| |||||
Investment Class | ||||||||
Shares sold | 412,002,624 | 490,118,416 | ||||||
Reinvestment of distribution | – | 1 | ||||||
Shares redeemed | (410,670,896 | ) | (511,891,549 | ) | ||||
|
|
|
| |||||
Net increase (decrease) from capital share transactions | 1,331,728 | (21,773,132 | ) | |||||
|
|
|
| |||||
Net Increase (Decrease) in Net Assets | 12,694,562 | 454,682,127 | ||||||
Net Assets | ||||||||
Beginning of year | 2,753,045,268 | 2,298,363,141 | ||||||
|
|
|
| |||||
End of year | $ | 2,765,739,830 | $ | 2,753,045,268 | ||||
|
|
|
| |||||
Undistributed net investment income | $ | 38 | $ | 222 | ||||
|
|
|
| |||||
Changes in Shares: | ||||||||
Premier Class | ||||||||
Shares sold | 13,323,353,168 | 10,855,859,490 | ||||||
Reinvestment of distributions | – | 16,684 | ||||||
Shares redeemed | (13,311,990,338 | ) | (10,379,419,190 | ) | ||||
|
|
|
| |||||
Net increase (decrease) in shares | 11,362,830 | 476,456,984 | ||||||
|
|
|
| |||||
Investment Class | ||||||||
Shares sold | 412,002,624 | 490,118,416 | ||||||
Reinvestment of distributions | – | 1 | ||||||
Shares redeemed | (410,670,896 | ) | (511,891,549 | ) | ||||
|
|
|
| |||||
Net increase (decrease) in shares | 1,331,728 | (21,773,132 | ) | |||||
|
|
|
| |||||
See Notes to Financial Statements and Financial Statements of the Master Funds.
7
Table of Contents
State Street Institutional Investment Trust
Financial Highlights
Selected data for a share of beneficial interest outstanding throughout each year is presented below(a):
Period Ended December 31, | Net Asset Value Beginning of Period | Net Investment Income/(Loss) | Gain (Loss) on Investments | Total from Investment Operations | Distributions from Net Investment Income | Distributions from Capital Gains | Total Distributions | |||||||||||||||||||||
Liquid Reserves Fund | ||||||||||||||||||||||||||||
Premier Class | ||||||||||||||||||||||||||||
2014 | $ | 1.0000 | $ | 0.0008 | $ | (0.0001 | ) | $ | 0.0007 | $ | (0.0007 | ) | $ | – | $ | (0.0007 | ) | |||||||||||
2013 | $ | 1.0000 | $ | 0.0010 | $ | 0.0000 | (d) | $ | 0.0010 | $ | (0.0010 | ) | $ | (0.0000 | )(d) | $ | (0.0010 | ) | ||||||||||
2012 | $ | 1.0000 | $ | 0.0020 | $ | 0.0000 | (d) | $ | 0.0020 | $ | (0.0020 | ) | $ | (0.0000 | )(d) | $ | (0.0020 | ) | ||||||||||
2011 | $ | 1.0000 | $ | 0.0015 | $ | 0.0000 | (d) | $ | 0.0015 | $ | (0.0015 | ) | $ | – | $ | (0.0015 | ) | |||||||||||
2010 | $ | 1.0000 | $ | 0.0019 | $ | 0.0000 | (d) | $ | 0.0019 | $ | (0.0019 | ) | $ | – | $ | (0.0019 | ) | |||||||||||
Investment Class | ||||||||||||||||||||||||||||
2014 | $ | 1.0000 | $ | 0.0000 | (d) | $ | 0.0000 | (d) | $ | 0.0000 | (d) | $ | – | $ | – | $ | – | |||||||||||
2013 | $ | 1.0000 | $ | 0.0000 | (d) | $ | 0.0000 | (d) | $ | 0.0000 | (d) | $ | (0.0000 | )(d) | $ | (0.0000 | )(d) | $ | (0.0000 | )(d) | ||||||||
2012 | $ | 1.0000 | $ | 0.0000 | (d) | $ | 0.0000 | (d) | $ | 0.0000 | (d) | $ | (0.0000 | )(d) | $ | (0.0000 | )(d) | $ | (0.0000 | )(d) | ||||||||
2011 | $ | 1.0000 | $ | 0.0000 | (d) | $ | 0.0000 | (d) | $ | 0.0000 | (d) | $ | – | $ | – | $ | – | |||||||||||
2010 | $ | 1.0000 | $ | 0.0000 | (d) | $ | 0.0000 | (d) | $ | 0.0000 | (d) | $ | (0.0000 | )(d) | $ | – | $ | (0.0000 | )(d) | |||||||||
Class M | ||||||||||||||||||||||||||||
2014 | $ | 1.0000 | $ | 0.0009 | $ | 0.0000 | (d) | $ | 0.0009 | $ | (0.0009 | ) | $ | – | $ | (0.0009 | ) | |||||||||||
2013 | $ | 1.0000 | $ | 0.0012 | $ | 0.0000 | (d) | $ | 0.0012 | $ | (0.0012 | ) | $ | (0.0000 | )(d) | $ | (0.0012 | ) | ||||||||||
2012 | $ | 1.0000 | $ | 0.0022 | $ | 0.0000 | (d) | $ | 0.0022 | $ | (0.0022 | ) | $ | (0.0000 | )(d) | $ | (0.0022 | ) | ||||||||||
2011(f) | $ | 1.0000 | $ | 0.0001 | $ | 0.0000 | (d) | $ | 0.0001 | $ | (0.0001 | ) | $ | – | $ | (0.0001 | ) | |||||||||||
Tax Free Money Market Fund |
| |||||||||||||||||||||||||||
Premier Class | ||||||||||||||||||||||||||||
2014 | $ | 1.0000 | $ | 0.0000 | (d) | $ | – | $ | 0.0000 | (d) | $ | – | $ | – | $ | – | ||||||||||||
2013 | $ | 1.0000 | $ | 0.0000 | (d) | $ | – | $ | 0.0000 | (d) | $ | – | $ | – | $ | – | ||||||||||||
2012 | $ | 1.0000 | $ | 0.0000 | (d) | $ | – | $ | 0.0000 | (d) | $ | (0.0000 | )(d) | $ | – | $ | (0.0000 | )(d) | ||||||||||
2011 | $ | 1.0000 | $ | 0.0002 | $ | (0.0000 | )(d) | $ | 0.0002 | $ | (0.0002 | ) | $ | – | $ | (0.0002 | ) | |||||||||||
2010 | $ | 1.0000 | $ | 0.0007 | $ | 0.0003 | $ | 0.0010 | $ | (0.0008 | ) | $ | (0.0002 | ) | $ | (0.0010 | ) | |||||||||||
Investment Class | ||||||||||||||||||||||||||||
2014 | $ | 1.0000 | $ | 0.0000 | (d) | $ | – | $ | 0.0000 | (d) | $ | – | $ | – | $ | – | ||||||||||||
2013 | $ | 1.0000 | $ | 0.0000 | (d) | $ | – | $ | 0.0000 | (d) | $ | – | $ | – | $ | – | ||||||||||||
2012 | $ | 1.0000 | $ | 0.0000 | (d) | $ | – | $ | 0.0000 | (d) | $ | – | $ | – | $ | – | ||||||||||||
2011 | $ | 1.0000 | $ | 0.0000 | (d) | $ | 0.0000 | (d) | $ | 0.0000 | (d) | $ | – | $ | – | $ | – | |||||||||||
2010 | $ | 1.0000 | $ | 0.0001 | $ | 0.0002 | $ | 0.0003 | $ | (0.0001 | ) | $ | (0.0002 | ) | $ | (0.0003 | ) | |||||||||||
U.S. Government Money Market Fund |
| |||||||||||||||||||||||||||
Premier Class | ||||||||||||||||||||||||||||
2014 | $ | 1.0000 | $ | (0.0000 | )(d) | $ | – | $ | (0.0000 | )(d) | $ | – | $ | – | $ | – | ||||||||||||
2013 | $ | 1.0000 | $ | 0.0001 | $ | – | $ | 0.0001 | $ | (0.0001 | ) | $ | – | $ | (0.0001 | ) | ||||||||||||
2012 | $ | 1.0000 | $ | 0.0003 | $ | 0.0000 | (d) | $ | 0.0003 | $ | (0.0003 | ) | $ | – | $ | (0.0003 | ) | |||||||||||
2011 | $ | 1.0000 | $ | 0.0002 | $ | (0.0000 | )(d) | $ | 0.0002 | $ | (0.0002 | ) | $ | – | $ | (0.0002 | ) | |||||||||||
2010 | $ | 1.0000 | $ | 0.0007 | $ | 0.0000 | (d) | $ | 0.0007 | $ | (0.0007 | ) | $ | – | $ | (0.0007 | ) | |||||||||||
Investment Class | ||||||||||||||||||||||||||||
2014 | $ | 1.0000 | $ | (0.0000 | )(d) | $ | – | $ | 0.0000 | (d) | $ | – | $ | – | $ | – | ||||||||||||
2013 | $ | 1.0000 | $ | 0.0000 | (d) | $ | – | $ | 0.0000 | (d) | $ | – | $ | – | $ | – | ||||||||||||
2012 | $ | 1.0000 | $ | 0.0000 | (d) | $ | 0.0000 | (d) | $ | 0.0000 | (d) | $ | – | $ | – | $ | – | |||||||||||
2011 | $ | 1.0000 | $ | (0.0001 | ) | $ | 0.0001 | $ | 0.0000 | (d) | $ | – | $ | – | $ | – | ||||||||||||
2010 | $ | 1.0000 | $ | 0.0001 | $ | (0.0001 | ) | $ | (0.0000 | )(d) | $ | (0.0000 | )(d) | $ | – | $ | (0.0000 | )(d) | ||||||||||
Class G | ||||||||||||||||||||||||||||
2014(g) | $ | 1.0000 | $ | 0.0000 | $ | 0.0000 | $ | 0.0000 | $ | (0.0000 | )(d) | $ | – | $ | (0.0000 | )(d) | ||||||||||||
| (a) | The per share amounts and percentages include the Fund’s proportionate share of income and expenses of their corresponding Portfolio. |
| (b) | Total return is calculated assuming a purchase of shares at net asset value on the first day and a sale at net asset value on the last day of each period reported. Distributions are assumed, for the purpose of this calculation, to be reinvested at net asset value per share on the respective payment dates. Total returns for periods of less than one year are not annualized. Results represent past performance and are not indicative of future results. |
| (c) | This expense waiver is reflected in both the net operating expense and the net investment income ratios shown above. Without these waivers, net investment income would have been lower. |
| (d) | Amount is less than $0.00005 per share. |
| (e) | Amount is less than 0.005%. |
| (f) | The Fund’s Class M Shares commenced operations on December 15, 2011. |
| (g) | The Fund’s Class G Shares commenced operations on October 5, 2014. |
| ** | Annualized. |
See Notes to Financial Statements and Financial Statements of the Master Funds.
8
Table of Contents
Period Ended December 31, | Net Asset Value End of Period | Ratios to Average Net Assets/Supplemental Data(a) | Net Assets End of Period (000s omitted) | |||||||||||||||||||||||||
| Total Return(b) | Gross Expenses | Net Expenses | Net Investment Income | Expense Waiver(c) | ||||||||||||||||||||||||
Liquid Reserves Fund | ||||||||||||||||||||||||||||
Premier Class | ||||||||||||||||||||||||||||
2014 | $ | 1.0000 | 0.07 | % | 0.12 | % | 0.12 | % | 0.07 | % | – | $ | 37,932,781 | |||||||||||||||
2013 | $ | 1.0000 | 0.10 | % | 0.12 | % | 0.12 | % | 0.10 | % | – | $ | 29,850,029 | |||||||||||||||
2012 | $ | 1.0000 | 0.20 | % | 0.12 | % | 0.12 | % | 0.20 | % | – | $ | 24,408,802 | |||||||||||||||
2011 | $ | 1.0000 | 0.15 | % | 0.12 | % | 0.12 | % | 0.15 | % | – | $ | 19,597,264 | |||||||||||||||
2010 | $ | 1.0000 | 0.19 | % | 0.12 | % | 0.12 | % | 0.20 | % | 0.00 | %(e) | $ | 25,211,488 | ||||||||||||||
Investment Class | ||||||||||||||||||||||||||||
2014 | $ | 1.0000 | 0.00 | % | 0.47 | % | 0.19 | % | 0.00 | % | 0.28 | % | $ | 726,910 | ||||||||||||||
2013 | $ | 1.0000 | 0.00 | %(e) | 0.47 | % | 0.22 | % | 0.00 | %(e) | 0.25 | % | $ | 1,013,152 | ||||||||||||||
2012 | $ | 1.0000 | 0.00 | %(e) | 0.47 | % | 0.32 | % | 0.00 | %(e) | 0.15 | % | $ | 961,168 | ||||||||||||||
2011 | $ | 1.0000 | 0.00 | %(e) | 0.46 | % | 0.27 | % | 0.00 | %(e) | 0.19 | % | $ | 992,736 | ||||||||||||||
2010 | $ | 1.0000 | 0.00 | %(e) | 0.47 | % | 0.31 | % | 0.00 | %(e) | 0.16 | % | $ | 905,604 | ||||||||||||||
Class M | ||||||||||||||||||||||||||||
2014 | $ | 1.0000 | 0.09 | % | 0.10 | % | 0.10 | % | 0.09 | % | – | $ | 1,626,315 | |||||||||||||||
2013 | $ | 1.0000 | 0.12 | % | 0.10 | % | 0.10 | % | 0.12 | % | – | $ | 2,825,313 | |||||||||||||||
2012 | $ | 1.0000 | 0.22 | % | 0.10 | % | 0.10 | % | 0.22 | % | – | $ | 1,897,611 | |||||||||||||||
2011(f) | $ | 1.0000 | 0.01 | % | 0.10 | %** | 0.10 | %** | 0.17 | %** | – | $ | 2,012,117 | |||||||||||||||
Tax Free Money Market Fund | ||||||||||||||||||||||||||||
Premier Class | ||||||||||||||||||||||||||||
2014 | $ | 1.0000 | 0.00 | %(e) | 0.21 | % | 0.04 | % | 0.00 | % | 0.17 | % | $ | 85,166 | ||||||||||||||
2013 | $ | 1.0000 | 0.00 | %(e) | 0.20 | % | 0.07 | % | 0.00 | % | 0.13 | % | $ | 119,159 | ||||||||||||||
2012 | $ | 1.0000 | 0.00 | %(e) | 0.20 | % | 0.12 | % | 0.00 | %(e) | 0.08 | % | $ | 140,255 | ||||||||||||||
2011 | $ | 1.0000 | 0.02 | % | 0.19 | % | 0.12 | % | 0.02 | % | 0.07 | % | $ | 87,135 | ||||||||||||||
2010 | $ | 1.0000 | 0.10 | % | 0.17 | % | 0.17 | % | 0.07 | % | 0.00 | %(e) | $ | 114,404 | ||||||||||||||
Investment Class | ||||||||||||||||||||||||||||
2014 | $ | 1.0000 | 0.00 | %(e) | 0.56 | % | 0.04 | % | 0.00 | % | 0.52 | % | $ | 168,079 | ||||||||||||||
2013 | $ | 1.0000 | 0.00 | %(e) | 0.55 | % | 0.07 | % | 0.00 | % | 0.48 | % | $ | 188,863 | ||||||||||||||
2012 | $ | 1.0000 | 0.00 | %(e) | 0.56 | % | 0.12 | % | 0.00 | %(e) | 0.44 | % | $ | 368,245 | ||||||||||||||
2011 | $ | 1.0000 | 0.00 | %(e) | 0.54 | % | 0.15 | % | 0.00 | %(e) | 0.39 | % | $ | 244,087 | ||||||||||||||
2010 | $ | 1.0000 | 0.02 | % | 0.52 | % | 0.24 | % | 0.00 | %(e) | 0.28 | % | $ | 290,874 | ||||||||||||||
U.S. Government Money Market Fund | ||||||||||||||||||||||||||||
Premier Class | ||||||||||||||||||||||||||||
2014 | $ | 1.0000 | 0.00 | %(e) | 0.12 | % | 0.07 | % | 0.00 | %(e) | 0.05 | % | $ | 10,962,800 | ||||||||||||||
2013 | $ | 1.0000 | 0.01 | % | 0.12 | % | 0.09 | % | 0.01 | % | 0.03 | % | $ | 7,189,250 | ||||||||||||||
2012 | $ | 1.0000 | 0.03 | % | 0.13 | % | 0.12 | % | 0.03 | % | 0.01 | % | $ | 7,114,213 | ||||||||||||||
2011 | $ | 1.0000 | 0.02 | % | 0.12 | % | 0.10 | % | 0.02 | % | 0.02 | % | $ | 5,139,795 | ||||||||||||||
2010 | $ | 1.0000 | 0.07 | % | 0.13 | % | 0.12 | % | 0.07 | % | 0.01 | % | $ | 4,430,327 | ||||||||||||||
Investment Class | ||||||||||||||||||||||||||||
2014 | $ | 1.0000 | 0.00 | %(e) | 0.47 | % | 0.07 | % | 0.00 | %(e) | 0.40 | % | $ | 615,706 | ||||||||||||||
2013 | $ | 1.0000 | 0.00 | %(e) | 0.47 | % | 0.10 | % | 0.00 | % | 0.37 | % | $ | 691,469 | ||||||||||||||
2012 | $ | 1.0000 | 0.00 | %(e) | 0.47 | % | 0.14 | % | 0.00 | %(e) | 0.33 | % | $ | 654,978 | ||||||||||||||
2011 | $ | 1.0000 | 0.00 | %(e) | 0.47 | % | 0.11 | % | 0.00 | %(e) | 0.36 | % | $ | 638,101 | ||||||||||||||
2010 | $ | 1.0000 | 0.00 | %(e) | 0.48 | % | 0.19 | % | 0.00 | %(e) | 0.29 | % | $ | 479,133 | ||||||||||||||
Class G | ||||||||||||||||||||||||||||
2014(g) | $ | 1.0000 | 0.00 | %(e) | 0.09 | %** | 0.08 | %** | 0.00 | %(e)** | 0.01 | % | $ | 872,335 | ||||||||||||||
See Notes to Financial Statements and Financial Statements of the Master Funds.
9
Table of Contents
State Street Institutional Investment Trust
Financial Highlights
Selected data for a share of beneficial interest outstanding throughout each year is presented below(a):
Period Ended December 31, | Net Asset Value Beginning of Period | Net Investment Income/(Loss) | Gain (Loss) on Investments | Total from Investment Operations | Distributions from Net Investment Income | Distributions from Capital Gains | Total Distributions | |||||||||||||||||||||
Treasury Money Market Fund |
| |||||||||||||||||||||||||||
Premier Class | ||||||||||||||||||||||||||||
2014 | $ | 1.0000 | $ | 0.0000 | $ | 0.0000 | (d) | $ | 0.0000 | (d) | $ | – | $ | (0.0000 | )(d) | $ | (0.0000 | )(d) | ||||||||||
2013 | $ | 1.0000 | $ | 0.0000 | (d) | $ | 0.0000 | (d) | $ | 0.0000 | (d) | $ | (0.0000 | )(d) | $ | (0.0000 | )(d) | $ | (0.0000 | )(d) | ||||||||
2012 | $ | 1.0000 | $ | 0.0000 | (d) | $ | 0.0000 | (d) | $ | 0.0000 | (d) | $ | – | $ | (0.0000 | )(d) | $ | (0.0000 | )(d) | |||||||||
2011 | $ | 1.0000 | $ | 0.0001 | $ | 0.0000 | (d) | $ | 0.0001 | $ | (0.0001 | ) | $ | – | $ | (0.0001 | ) | |||||||||||
2010 | $ | 1.0000 | $ | 0.0002 | $ | (0.0001 | ) | $ | 0.0001 | $ | (0.0001 | ) | $ | – | $ | (0.0001 | ) | |||||||||||
Investment Class | ||||||||||||||||||||||||||||
2014 | $ | 1.0000 | $ | (0.0010 | ) | $ | 0.0010 | $ | 0.0000 | $ | – | $ | (0.0000 | )(d) | $ | (0.0000 | )(d) | |||||||||||
2013 | $ | 1.0000 | $ | 0.0000 | (d) | $ | 0.0000 | (d) | $ | 0.0000 | (d) | $ | (0.0000 | )(d) | $ | (0.0000 | )(d) | $ | (0.0000 | )(d) | ||||||||
2012 | $ | 1.0000 | $ | 0.0000 | (d) | $ | 0.0000 | (d) | $ | 0.0000 | (d) | $ | – | $ | (0.0000 | )(d) | $ | (0.0000 | )(d) | |||||||||
2011 | $ | 1.0000 | $ | 0.0000 | (d) | $ | 0.0000 | (d) | $ | 0.0000 | (d) | $ | (0.0000 | )(d) | $ | – | $ | (0.0000 | )(d) | |||||||||
2010 | $ | 1.0000 | $ | 0.0000 | (d) | $ | 0.0000 | (d) | $ | 0.0000 | (d) | $ | (0.0000 | )(d) | $ | – | $ | (0.0000 | )(d) | |||||||||
Treasury Plus Money Market Fund |
| |||||||||||||||||||||||||||
Premier Class | ||||||||||||||||||||||||||||
2014 | $ | 1.0000 | $ | 0.0000 | (d) | $ | 0.0000 | (d) | $ | 0.0000 | (d) | $ | – | $ | – | $ | – | |||||||||||
2013 | $ | 1.0000 | $ | (0.0001 | ) | $ | 0.0001 | $ | 0.0000 | (d) | $ | (0.0000 | )(d) | $ | (0.0000 | )(d) | $ | (0.0000 | )(d) | |||||||||
2012 | $ | 1.0000 | $ | 0.0002 | $ | 0.0000 | (d) | $ | 0.0002 | $ | (0.0002 | ) | $ | – | $ | (0.0002 | ) | |||||||||||
2011 | $ | 1.0000 | $ | 0.0001 | $ | 0.0000 | (d) | $ | 0.0001 | $ | (0.0001 | ) | $ | – | $ | (0.0001 | ) | |||||||||||
2010 | $ | 1.0000 | $ | 0.0004 | $ | 0.0000 | (d) | $ | 0.0004 | $ | (0.0004 | ) | $ | – | $ | (0.0004 | ) | |||||||||||
Investment Class | ||||||||||||||||||||||||||||
2014 | $ | 1.0000 | $ | 0.0000 | (d) | $ | 0.0000 | (d) | $ | 0.0000 | (d) | $ | – | $ | – | $ | – | |||||||||||
2013 | $ | 1.0000 | $ | (0.0001 | ) | $ | 0.0001 | $ | 0.0000 | (d) | $ | – | $ | (0.0000 | )(d) | $ | (0.0000 | )(d) | ||||||||||
2012 | $ | 1.0000 | $ | 0.0000 | (d) | $ | 0.0000 | (d) | $ | 0.0000 | (d) | $ | – | $ | – | $ | – | |||||||||||
2011 | $ | 1.0000 | $ | 0.0000 | (d) | $ | 0.0000 | (d) | $ | 0.0000 | (d) | $ | – | $ | – | $ | – | |||||||||||
2010 | $ | 1.0000 | $ | 0.0000 | (d) | $ | 0.0000 | (d) | $ | 0.0000 | (d) | $ | – | $ | – | $ | – | |||||||||||
| (a) | The per share amounts and percentages include the Fund’s proportionate share of income and expenses of their corresponding Portfolio. |
| (b) | Total return is calculated assuming a purchase of shares at net asset value on the first day and a sale at net asset value on the last day of each period reported. Distributions are assumed, for the purpose of this calculation, to be reinvested at net asset value per share on the respective payment dates. Total returns for periods of less than one year are not annualized. Results represent past performance and are not indicative of future results. |
| (c) | This expense waiver is reflected in both the net operating expense and the net investment income ratios shown above. Without these waivers, net investment income would have been lower. |
| (d) | Amount is less than $0.00005 per share. |
| (e) | Amount is less than 0.005%. |
See Notes to Financial Statements and Financial Statements of the Master Funds.
10
Table of Contents
Period Ended December 31, | Net Asset Value End of Period | Ratios to Average Net Assets/Supplemental Data(a) | Net Assets End of Period (000s omitted) | |||||||||||||||||||||||||
| Total Return(b) | Gross Expenses | Net Expenses | Net Investment Income | Expense Waiver(c) | ||||||||||||||||||||||||
Treasury Money Market Fund | ||||||||||||||||||||||||||||
Premier Class | ||||||||||||||||||||||||||||
2014 | $ | 1.0000 | 0.00 | %(e) | 0.12 | % | 0.04 | % | 0.00 | %(e) | 0.08 | % | $ | 8,338,818 | ||||||||||||||
2013 | $ | 1.0000 | 0.00 | %(e) | 0.12 | % | 0.07 | % | 0.00 | %(e) | 0.05 | % | $ | 11,949,583 | ||||||||||||||
2012 | $ | 1.0000 | 0.00 | %(e) | 0.12 | % | 0.08 | % | 0.00 | %(e) | 0.04 | % | $ | 10,151,078 | ||||||||||||||
2011 | $ | 1.0000 | 0.01 | % | 0.13 | % | 0.03 | % | 0.00 | %(e) | 0.10 | % | $ | 9,426,334 | ||||||||||||||
2010 | $ | 1.0000 | 0.01 | % | 0.13 | % | 0.11 | % | 0.01 | % | 0.02 | % | $ | 2,790,267 | ||||||||||||||
Investment Class | ||||||||||||||||||||||||||||
2014 | $ | 1.0000 | 0.00 | % | 0.47 | % | 0.05 | % | 0.00 | % | 0.42 | % | $ | 741,248 | ||||||||||||||
2013 | $ | 1.0000 | 0.00 | %(e) | 0.47 | % | 0.07 | % | 0.00 | %(e) | 0.40 | % | $ | 1,407,207 | ||||||||||||||
2012 | $ | 1.0000 | 0.00 | %(e) | 0.47 | % | 0.08 | % | 0.00 | %(e) | 0.39 | % | $ | 1,475,932 | ||||||||||||||
2011 | $ | 1.0000 | 0.00 | %(e) | 0.48 | % | 0.05 | % | 0.00 | %(e) | 0.43 | % | $ | 1,381,305 | ||||||||||||||
2010 | $ | 1.0000 | 0.00 | %(e) | 0.48 | % | 0.13 | % | 0.00 | %(e) | 0.35 | % | $ | 866,341 | ||||||||||||||
Treasury Plus Money Market Fund | ||||||||||||||||||||||||||||
Premier Class | ||||||||||||||||||||||||||||
2014 | $ | 1.0000 | 0.00 | %(e) | 0.13 | % | 0.05 | % | 0.00 | %(e) | 0.08 | % | $ | 2,690,959 | ||||||||||||||
2013 | $ | 1.0000 | 0.00 | %(e) | 0.13 | % | 0.08 | % | 0.00 | %(e) | 0.05 | % | $ | 2,679,596 | ||||||||||||||
2012 | $ | 1.0000 | 0.02 | % | 0.14 | % | 0.11 | % | 0.02 | % | 0.03 | % | $ | 2,203,141 | ||||||||||||||
2011 | $ | 1.0000 | 0.01 | % | 0.14 | % | 0.06 | % | 0.01 | % | 0.08 | % | $ | 1,220,159 | ||||||||||||||
2010 | $ | 1.0000 | 0.04 | % | 0.15 | % | 0.11 | % | 0.04 | % | 0.04 | % | $ | 811,144 | ||||||||||||||
Investment Class | ||||||||||||||||||||||||||||
2014 | $ | 1.0000 | 0.00 | %(e) | 0.48 | % | 0.05 | % | 0.00 | % | 0.43 | % | $ | 74,781 | ||||||||||||||
2013 | $ | 1.0000 | 0.00 | %(e) | 0.48 | % | 0.08 | % | 0.00 | % | 0.40 | % | $ | 73,449 | ||||||||||||||
2012 | $ | 1.0000 | 0.00 | %(e) | 0.49 | % | 0.13 | % | 0.00 | %(e) | 0.36 | % | $ | 95,222 | ||||||||||||||
2011 | $ | 1.0000 | 0.00 | %(e) | 0.49 | % | 0.08 | % | 0.00 | %(e) | 0.41 | % | $ | 141,023 | ||||||||||||||
2010 | $ | 1.0000 | 0.00 | %(e) | 0.50 | % | 0.15 | % | 0.00 | %(e) | 0.35 | % | $ | 122,577 | ||||||||||||||
See Notes to Financial Statements and Financial Statements of the Master Funds.
11
Table of Contents
State Street Institutional Investment Trust
Notes to Financial Statements
December 31, 2014
| 1. | Organization |
State Street Institutional Investment Trust (the “Trust”) is registered under the Investment Company Act of 1940, as amended (the “1940 Act”), as an open-end management investment company, and was organized as a business trust under the laws of the Commonwealth of Massachusetts on February 16, 2000. The Trust consists of thirty-five (35) series (the “Funds”) and corresponding classes, each of which have the same rights and privileges, including the same voting rights. The Funds are authorized to issue an unlimited number of shares, with no par value. The financial statements herein relate to the following Funds:
| Fund | Classes | Commencement of Operations: | ||
State Street Institutional Liquid Reserves Fund | Administration Class Class M Shares Premier Class (formerly Institutional Class)* Service Class Institutional Class Investment Class Investor Class | Not commenced December 15, 2011 August 12, 2004 Not commenced Not commenced October 15, 2007 Not commenced | ||
State Street Institutional Tax Free Money Market Fund | Administration Class Institutional Class Investment Class Investor Class Premier Class (formerly Institutional Class)* Service Class | Not commenced Not commenced October 12, 2007 Not commenced February 7, 2007 Not commenced | ||
State Street Institutional U.S. Government Money Market Fund | Administration Class Class G Institutional Class Investment Class Investor Class Premier Class (formerly Institutional Class)* Service Class | Not commenced October 5, 201 4 Not commenced October 17, 2007 Not commenced October 25, 2007 Not commenced | ||
State Street Institutional Treasury Money Market Fund | Administration Class Institutional Class Investment Class Investor Class Premier Class (formerly Institutional Class)* Service Class | Not commenced Not commenced October 25, 2007 Not commenced October 25, 2007 Not commenced | ||
State Street Institutional Treasury Plus Money Market Fund | Service Class Investment Class Premier Class (formerly Institutional Class)* Institutional Class Investor Class Administration Class | Not commenced October 24, 2007 October 24, 2007 Not commenced Not commenced Not commenced |
| * | During the period, the Board of Trustees approved the name change of Institutional Class shares to Premier Class shares. All references to Institutional Class shall be replaced by references to Premier Class. The change in share class name does not have any impact on shareholders. |
12
Table of Contents
State Street Institutional Investment Trust
Notes to Financial Statements — (continued)
December 31, 2014
Certain Funds are part of a master-feeder investment structure (“Feeder Fund”) and invest all of their investable assets in interests of their respective master portfolio (“Master Fund”) as reflected in the table below. The investment objective and policies of each Master Fund are substantially similar to those of its respective Feeder Fund. The value of each Feeder Fund’s investment in its respective Master Fund reflects the Feeder Fund’s proportionate interest in the net assets of that Master Fund. The performance of each Feeder Fund is directly affected by the performance of its respective Master Fund. The financial statements of the Master Funds, including their Portfolios of Investments, are attached to this report and should be read in conjunction with the Feeder Funds’ financial statements.
| Feeder Fund | % Investment in Master | Master Fund | ||
State Street Institutional Liquid Reserves Fund | 98.98% | State Street Money Market Portfolio* | ||
State Street Institutional Tax Free Money Market Fund | 100.00% | State Street Tax Free Money Market Portfolio* | ||
State Street Institutional U.S. Government Money Market Fund | 94.27% | State Street U.S. Government Money Market Portfolio* | ||
State Street Institutional Treasury Money Market Fund | 88.60% | State Street Treasury Money Market Portfolio* | ||
State Street Institutional Treasury Plus Money Market Fund | 100.00% | State Street Treasury Plus Money Market Portfolio* |
| * | A series of the State Street Master Funds |
The State Street Institutional Liquid Reserves Fund, State Street Institutional Tax Free Money Market Fund, State Street Institutional U.S. Government Money Market Fund, State Street Institutional Treasury Money Market Fund and State Street Institutional Treasury Plus Money Market Fund are each considered to be money market funds pursuant to Rule 2a-7 under the Investment Company Act of 1940, as amended (the “1940 Act”) (the “Money Market Funds”). It is the policy of the Money Market Funds to maintain a stable net asset value per share of $1.00. However, there is no assurance the Money Market Funds will be able to maintain a stable net asset value per share.
An investment in the Money Market Funds is not insured or guaranteed by the Federal Deposit Insurance Corporation or any other government agency. Although the Money Market Funds seek to preserve the value of shareholders’ investment at $1.00 per share, it is possible to lose money by investing in the Money Market Funds.
The Funds are investment companies and accordingly follow the investment company accounting and reporting guidance of the Financial Accounting Standards Board (“FASB”) Accounting Standards Codification Topic 946 Financial Services – Investment Companies.
Recent Regulatory Action
On July 23, 2014, the SEC adopted amendments to the governing rules for money market funds. The amendments require that, following a two-year implementation timeframe, institutional prime and institutional tax exempt money market funds adopt a floating net asset value. The rule changes also allow for certain liquidity-based redemption fees and gate, and include enhanced requirements for disclosure and stress testing. The degree to which a money market fund will be impacted by the rule
13
Table of Contents
State Street Institutional Investment Trust
Notes to Financial Statements — (continued)
December 31, 2014
amendments will depend upon the type of fund and type of investors (retail or institutional). At this time, management is evaluating the implications of these amendments and their impact to the Funds’ financial statements and accompanying notes.
| 2. | Significant Accounting Policies |
The following is a summary of the significant accounting policies consistently followed by the Funds in the preparation of their financial statements.
Security valuation – Each Fund records its investment in its respective Portfolio at value. The valuation policies of the Portfolios are discussed in Note 2 of the Portfolios’ Notes to Financial Statements, which are attached to this report.
The Portfolios adopted provisions surrounding fair value measurements and disclosures that defines fair value, establishes a framework for measuring fair value in generally accepted accounting principles and expands disclosures about fair value measurements. This applies to fair value measurements that are already required or permitted by other accounting standards and is intended to increase consistency of those measurements and applies broadly to securities and other types of assets and liabilities. The summary of the inputs used for each Portfolio, as of December 31, 2014, in valuing each Portfolio’s assets carried at fair value are discussed in Note 2 of the Portfolio’s Notes to Financial Statements, which are attached to this report.
Security transactions, investment income and expenses – Securities transactions are recorded on a trade date basis. Net investment income consists of a Fund’s pro-rata share of the net investment income of its respective Portfolio, less all expenses of the Fund. Realized gains and losses from security transactions consist of the Fund’s pro-rata share of its respective Portfolio’s realized gains and losses. Realized gains and losses from security transactions are recorded on the basis of identified cost. Class specific distribution and shareholder servicing fees are borne by each class. Income, non-class specific expenses, and realized gains and losses are allocated to the respective classes daily on the basis of relative net assets.
Dividends and distributions – Dividends from net investment income are declared daily and are payable as of the last business day of each month. Net realized capital gains, if any, are distributed annually, unless additional distributions are required for compliance with applicable tax regulations.
Federal income taxes – Each Fund intends to continue to qualify for and elect treatment as a regulated investment company under Subchapter M of the Internal Revenue Code of 1986, as amended. By so qualifying and electing, the Funds will not be subject to federal income taxes to the extent they distribute their taxable income, including any net realized capital gains, for each fiscal year. In addition, by distributing during each calendar year substantially all of their net taxable income and capital gains, if any, the Funds will not be subject to federal excise tax.
At December 31, 2014, State Street Institutional U.S. Government Money Market Fund utilized capital loss carryovers in the amount of $13,046 and had remaining capital loss carryovers of $152,534 expiring December 31, 2015. State Street Institutional Treasury Plus Money Market Fund had capital loss carryover in the amount of $1,535 which has no expiration date. Each Fund may use all of its capital loss carryover amount to offset future net realized capital gains.
At December 31, 2014, the cost of investments for federal income tax purposes was substantially the same as the cost for financial reporting purposes.
14
Table of Contents
State Street Institutional Investment Trust
Notes to Financial Statements — (continued)
December 31, 2014
The Funds have reviewed the tax positions for open years as of December 31, 2014, and determined they did not have a liability for any unrecognized tax expenses. The Funds recognize interest and penalties, if any, related to tax liabilities as income tax expense in the Statements of Operations. As of December 31, 2014, tax years 2012 through 2014 remain subject to examination by the Funds’ major tax jurisdictions, which include the United States of America and the Commonwealth of Massachusetts.
For the year ended December 31, 2014, permanent differences identified and reclassified among the components of net assets were as follows:
| Fund | Paid-In Capital | Accumulated Gain (Loss) | Undistributed Net Investment Income (Loss) | |||||||||
State Street Institutional Liquid Reserves Fund | $ | – | $ | – | $ | – | ||||||
State Street Institutional Tax Free Money Market Fund | $ | – | $ | – | $ | – | ||||||
State Street Institutional U.S. Government Money Market Fund | $ | (86 | ) | $ | – | $ | 86 | |||||
State Street Institutional Treasury Money Market Fund | $ | – | $ | – | $ | – | ||||||
State Street Institutional Treasury Plus Money Market Fund | $ | 188 | $ | – | $ | (188 | ) | |||||
These differences were primarily attributable to distribution redesignations, net operating loss, non-deductible tax paid and distributions in excess of current earnings. Net investment income (loss), net realized gains (losses), and net assets were not affected by these reclassifications.
The tax character of distributions paid to shareholders during the years ended December 31, 2014 and December 31, 2013 was as follows:
| December 31, 2014 | December 31, 2013 | |||||||||||||||||||||||
| Fund | Ordinary Income | Tax Exempt Income | Long Term Capital Gain | Ordinary Income | Tax Exempt Income | Long Term Capital Gain | ||||||||||||||||||
State Street Institutional Liquid Reserves Fund | $ | 28,785,929 | $ | – | $ | – | $ | 32,492,859 | $ | – | $ | – | ||||||||||||
State Street Institutional Tax Free Money Market Fund | $ | – | $ | – | $ | – | $ | – | $ | – | $ | – | ||||||||||||
State Street Institutional U.S. Government Money Market Fund | $ | 43 | $ | – | $ | – | $ | 367,253 | $ | – | $ | – | ||||||||||||
State Street Institutional Treasury Money Market Fund | $ | 126,460 | $ | – | $ | – | $ | 17,636 | $ | – | $ | – | ||||||||||||
State Street Institutional Treasury Plus Money Market Fund | $ | – | $ | – | $ | – | $ | 17,960 | $ | – | $ | – | ||||||||||||
15
Table of Contents
State Street Institutional Investment Trust
Notes to Financial Statements — (continued)
December 31, 2014
At December 31, 2014, the components of distributable earnings on a tax basis were as follows:
| Fund | Undistributed Ordinary Income | Undistributed Tax Exempt Income | Capital Loss Carryover | Total | ||||||||||||
State Street Institutional Liquid Reserves Fund | $ | 199,468 | $ | – | $ | – | $ | 199,468 | ||||||||
State Street Institutional Tax Free Money Market Fund | $ | – | $ | – | $ | – | $ | – | ||||||||
State Street Institutional U.S. Government Money Market Fund | $ | – | $ | – | $ | (152,534 | ) | $ | (152,534 | ) | ||||||
State Street Institutional Treasury Money Market Fund | $ | 9,470 | $ | – | $ | – | $ | 9,470 | ||||||||
State Street Institutional Treasury Plus Money Market Fund | $ | 38 | $ | – | $ | (1,535 | ) | $ | (1,497 | ) | ||||||
Expense allocation – Certain expenses are applicable to multiple Funds within the Trust. Expenses directly attributable to a Fund are charged to that Fund. Expenses of the Trust that are not directly attributed to a Fund are allocated among the Funds, on the basis of relative net assets, except where a more appropriate allocation of expenses to each of the Funds can otherwise be made.
Use of estimates – The Funds’ financial statements are prepared in accordance with U.S. generally accepted accounting principles, which require the use of management estimates. Actual results could differ from those estimates. It is reasonably possible that these differences could be material.
| 3. | Related Party and Other Fees |
The Portfolios retained SSGA Funds Management, Inc. (“SSGA FM” or the “Adviser”), a subsidiary of State Street Corporation and an affiliate of State Street Bank and Trust Company (“State Street”), as their investment adviser. Each Portfolio has entered into an investment advisory agreement with the Adviser, under which the Adviser directs the investments of the Portfolios in accordance with their investment objectives, policies, and limitations. In compensation for the Adviser’s services as investment adviser, each Portfolio pays the Adviser a management fee at an annual rate of 0.05% of its average daily net assets.
SSGA FM has contractually agreed to waive a portion of its management fee allocated from its respective Master Fund or to reimburse certain expenses to the extent necessary such that the total combined annual operating expenses of each class of the State Street Institutional Liquid Reserves Fund (“ILR”), State Street Institutional U.S. Government Money Market Fund and State Street Institutional Treasury Plus Fund (exclusive of interest, taxes and extraordinary expenses) do not exceed a rate of 0.12% of net assets attributable to the Funds’ Premier Class Shares and 0.47% of net assets attributable to the Fund’s Investment Class Shares through April 30, 2015. For the year ended December 31, 2014, SSGA FM reimbursed or waived the following:
| Fund | Amount Waived | |||
State Street Institutional Liquid Reserves Fund | $ | – | ||
State Street Institutional U.S. Government Money Market Fund | 44,243 | |||
State Street Institutional Treasury Plus Money Market Fund | 263,547 | |||
16
Table of Contents
State Street Institutional Investment Trust
Notes to Financial Statements — (continued)
December 31, 2014
Additionally, the Adviser may reimburse expenses or waive fees in order to avoid a negative yield. Any such waiver or reimbursement would be voluntary and may be revised or cancelled at any time without notice. For the year ended December 31, 2014, SSGA FM voluntarily waived the following:
| Fund | Amount Waived | |||
State Street Institutional Liquid Reserves Fund | $ | – | ||
State Street Institutional Tax Free Money Market Fund | 490,278 | |||
State Street Institutional U.S. Government Money Market Fund | 4,726,293 | |||
State Street Institutional Treasury Money Market Fund | 7,917,168 | |||
State Street Institutional Treasury Plus Money Market Fund | 1,802,611 | |||
Effective October 1, 2012, the Trust implemented the terms of its Reimbursement Agreement with SSGA FM, dated September 20, 2012. Under the terms of the Reimbursement Agreement, an applicable Fund agrees to repay SSGA FM up to the amount of fees waived or expenses reduced under the agreement provided that a Fund is not obligated to reimburse SSGA FM (1) more than three years after the end of the fiscal year of the Fund in which SSGA FM provided a voluntary reduction; (2) in respect of any business day for which the net annualized one-day yield of such Fund is less than 0.00%; (3) to the extent that the amount of the reimbursement to SSGA FM on any day exceeds fifty percent of the yield (net of all expenses, exclusive of the reimbursement) of the Fund on that day; (4) to the extent that the amount of the reimbursement would cause the Fund’s net yield to fall below a certain minimum net yield; or (5) in respect of any such fee waivers and/or expense reimbursements that are necessary to maintain a limit on a Fund’s expenses per contractual fee waivers and/or reimbursements by SSGA FM which are effective at the time of such fee waivers and/or expense reimbursements. As of December 31, 2014, SSGA FM has not recouped any expenses from the Funds. Waived/reduced fees subject to potential recovery by year of expiration are as follows:
| Expiration | Liquid Reserves Fund | Tax Free Money Market Fund | U.S. Government Money Market Fund | Treasury Money Market Fund | Treasury Plus Money Market Fund | |||||||||||||||
12/31/2015 | $ | – | $ | 83,658 | $ | – | $ | 269,793 | $ | – | ||||||||||
12/31/2016 | $ | – | $ | 418,224 | $ | 1,976,248 | $ | 6,058,938 | $ | 1,004,830 | ||||||||||
12/31/2017 | $ | – | $ | 490,278 | $ | 4,726,293 | $ | 7,917,168 | $ | 1,802,611 | ||||||||||
Pursuant to the administration agreement, each Fund, except ILR Class M Shares and U.S. Government Money Market Fund Class G Shares, pays a fee at an annual rate of 0.05% of the respective Fund’s net assets accrued daily to SSGA FM. ILR Class M Shares and U.S. Government Money Market Fund Class G Shares pay at an annual rate of 0.03% and 0.01% of its net assets accrued daily to SSGA FM. During the year ended December 31, 2014, ILR and U.S. Government Money Market Fund incurred the following administration fees:
| Fund | Liquid Reserves Fund | U.S. Government Money Market Fund | ||||||
Premier Class | $ | 18,145,861 | $ | 4,648,486 | ||||
Investment Class | $ | 447,221 | $ | 318,688 | ||||
Class M | $ | 706,402 | – | |||||
Class G | $ | – | $ | 21,498 | ||||
17
Table of Contents
State Street Institutional Investment Trust
Notes to Financial Statements — (continued)
December 31, 2014
The Funds pay State Street an annual fee of $12,600 for custody and accounting services. Pursuant to the sub-administration agreement, SSGA FM pays State Street an annual fee for each Fund serviced by State Street.
The Funds’ Investment Class has adopted a plan of distribution pursuant to Rule 12b-1 under the 1940 Act (the “Rule 12b-1 Plan”). Under the Rule 12b-1 Plan, the Funds compensate financial intermediaries in connection with the distribution of Fund shares and for services provided to the Funds’ shareholders. The Funds’ Investment Class Shares may make payments under the Rule 12b-1 Plan at an annual rate up to 0.10% of eligible average daily net assets of the Investment Class Shares. State Street Global Markets LLC (“SSGM” or the “Distributor”), a subsidiary of State Street Corporation, is the Funds’ Distributor.
During the year ended December 31, 2014, the Funds did not make any payments to SSGM under the Rule 12b-1 Plan.
During the year ended December 31, 2014, SSGM voluntarily agreed to waive Rule 12b-1 fees in the following amounts:
| Fund | Amount Waived | |||
State Street Institutional Liquid Reserves Fund | $ | 894,442 | ||
State Street Institutional Tax Free Money Market Fund | 192,577 | |||
State Street Institutional U.S. Government Money Market Fund | 635,522 | |||
State Street Institutional Treasury Money Market Fund | 1,056,426 | |||
State Street Institutional Treasury Plus Money Market Fund | 85,724 | |||
Wealth Management Services (“WMS”), a division of State Street, is among the financial intermediaries who may receive fees under the Rule 12b-1 Plan. During the year ended December 31, 2014, SSGM did not make any payments to WMS.
Under the Funds’ Shareholder Servicing Plan, the Funds compensate financial intermediaries for providing certain services to shareholders and for maintaining shareholder accounts. The Funds’ Investment Class Shares made payments under the Shareholder Servicing Plan at an annual rate up to 0.25% of the eligible average daily net assets of the Investment Class Shares. During the year ended December 31, 2014, the Funds paid SSGM the following fees under the shareholder servicing agreement which SSGM subsequently paid to financial intermediaries:
| Fund | Amount | |||
State Street Institutional Liquid Reserves Fund | $ | 654,919 | ||
State Street Institutional Tax Free Money Market Fund | – | |||
State Street Institutional U.S. Government Money Market Fund | – | |||
State Street Institutional Treasury Money Market Fund | – | |||
State Street Institutional Treasury Plus Money Market Fund | – | |||
18
Table of Contents
State Street Institutional Investment Trust
Notes to Financial Statements — (continued)
December 31, 2014
During the year ended December 31, 2014, SSGM voluntarily agreed to waive shareholder services fees in the following amounts:
| Fund | Amount Waived | |||
State Street Institutional Liquid Reserves Fund | $ | 1,581,187 | ||
State Street Institutional Tax Free Money Market Fund | 481,422 | |||
State Street Institutional U.S. Government Money Market Fund | 1,588,804 | |||
State Street Institutional Treasury Money Market Fund | 2,641,065 | |||
State Street Institutional Treasury Plus Money Market Fund | 214,309 | |||
WMS is among the financial intermediaries who may receive fees under the shareholder serving agreement. For the year ended December 31, 2014, WMS received the following payments:
| Fund | Amount | |||
State Street Institutional Liquid Reserves Fund | $ | 1,104,979 | ||
State Street Institutional Tax Free Money Market Fund | 0 | |||
State Street Institutional U.S. Government Money Market Fund | 249,188 | |||
State Street Institutional Treasury Money Market Fund | 234,033 | |||
State Street Institutional Treasury Plus Money Market Fund | 9,821 | |||
Boston Financial Data Services (“BFDS”), a joint venture of DST Systems, Inc. and State Street Corporation, serves as transfer agent and dividend disbursing agent to the Funds. For these services, the Funds pay annual account services fees, activity-based fees, charges related to compliance and regulatory services, and a minimum fee of $400 for each Fund.
| 4. | Trustees’ Fees |
Independent Trustees are compensated on a calendar year basis. Any Trustee who is deemed to be an “interested person” (as defined in the 1940 Act) of the Funds does not receive compensation from the Funds for his or her service as a Trustee.
As of January 24, 2014, each Independent Trustee receives for his or her services to the State Street Master Funds, State Street Institutional Investment Trust and SSGA Funds, a $141,500 annual base retainer in addition to $18,000 for each in-person meeting and $2,000 for each telephonic meeting from the Trust. The Trust pays a fixed allocation of $15,000 per Fund. Each Fund is also impacted by Trustees’ Fees accrued by its respective Master Fund. The Co-Chairmen receive an additional $44,000 annual retainer. The Independent Trustees are reimbursed for travel and other out-of-pocket expenses in connection with meeting attendance. As of the date of this Statement, the Trustees were not paid pension or retirement benefits as part of the Trust’s expenses.
Prior to January 24, 2014, the Feeder Funds did not pay the Trustees directly.
The Trust’s officers are compensated by the Adviser and its affiliates.
19
Table of Contents
State Street Institutional Investment Trust
Notes to Financial Statements — (continued)
December 31, 2014
| 5. | Indemnifications |
The Trust’s organizational documents provide that its officers and trustees are indemnified against certain liabilities arising out of the performance of their duties to the Trust. In addition, both in some of its principal service contracts and in the normal course of its business, the Trust enters into contracts that provide indemnifications to other parties for certain types of losses or liabilities. The Trust’s maximum exposure under these arrangements is unknown as this could involve future claims against the Trust. However, based on experience, the Trust expects the risk of loss to be remote.
20
Table of Contents
Report of Independent Registered Public Accounting Firm
To the Board of Trustees and Shareholders of
State Street Institutional Investment Trust:
We have audited the accompanying statements of assets and liabilities of State Street Institutional Liquid Reserves Fund, State Street Institutional Tax Free Money Market Fund, State Street Institutional U.S. Government Money Market Fund, State Street Institutional Treasury Money Market Fund and State Street Institutional Treasury Plus Money Market Fund (five of the funds constituting State Street Institutional Investment Trust) (the “Funds”) as of December 31, 2014, and the related statements of operations for the year then ended, the statements of changes in net assets for each of the two years in the period then ended, and the financial highlights for each of the years or periods indicated therein. These financial statements and financial highlights are the responsibility of the Funds’ management. Our responsibility is to express an opinion on these financial statements and financial highlights based on our audits.
We conducted our audits in accordance with the standards of the Public Company Accounting Oversight Board (United States). Those standards require that we plan and perform the audit to obtain reasonable assurance about whether the financial statements and financial highlights are free of material misstatement. We were not engaged to perform an audit of the Funds’ internal control over financial reporting. Our audits included consideration of internal control over financial reporting as a basis for designing audit procedures that are appropriate in the circumstances, but not for the purpose of expressing an opinion on the effectiveness of the Funds’ internal control over financial reporting. Accordingly, we express no such opinion. An audit also includes examining, on a test basis, evidence supporting the amounts and disclosures in the financial statements and financial highlights, assessing the accounting principles used and significant estimates made by management, and evaluating the overall financial statement presentation. We believe that our audits provide a reasonable basis for our opinion.
In our opinion, the financial statements and financial highlights referred to above present fairly, in all material respects, the financial position of State Street Institutional Liquid Reserves Fund, State Street Institutional Tax Free Money Market Fund, State Street Institutional U.S. Government Money Market Fund, State Street Institutional Treasury Money Market Fund and State Street Institutional Treasury Plus Money Market Fund (five of the funds constituting State Street Institutional Investment Trust) at December 31, 2014, the results of their operations for the year then ended, the changes in their net assets for each of the two years in the period then ended, and the financial highlights for each of the years or periods indicated therein, in conformity with U.S. generally accepted accounting principles.

Boston, Massachusetts
February 27, 2015
21
Table of Contents
State Street Institutional Investment Trust
General Information
December 31, 2014 (Unaudited)
EXPENSE EXAMPLE
As a shareholder of a fund (the “Funds”), you incur ongoing costs, which include costs for administrative services and to the extent applicable, distribution (12b-1) fees, among others. This example is intended to help you understand your ongoing costs (in dollars) of investing in the Funds and to compare these costs with the ongoing costs of investing in other mutual funds. It is based on an investment of $1,000 made at the beginning of the period shown and held for the entire period from July 1, 2014 to December 31, 2014.
The table below illustrates your Fund’s costs in two ways:
| • | Based on actual fund return – This section helps you to estimate the actual expenses that you paid over the period. The “Ending Account Value” shown is derived from the Fund’s actual return, and the third column shows the dollar amount that would have been paid by an investor who started with $1,000 in the Fund. You may use the information here, together with the amount you invested, to estimate the expenses that you paid over the period. To do so, simply divide your account value by $1,000 (for example, an $8,600 account value divided by $1,000 = 8.6), then multiply the result by the number given for the Fund under the heading “Expenses Paid During Period”. |
| • | Based on hypothetical 5% return – This section is intended to help you compare your Fund’s costs with those of other mutual funds. It assumes that the Fund had a yearly return of 5% before expenses, but that the expense ratio is unchanged. In this case, because the return used is not the Fund’s actual return, the results do not apply to your investment. The example is useful in making comparisons because the Securities and Exchange Commission requires all mutual funds to calculate expenses based on a 5% return. You can assess your Fund’s costs by comparing this hypothetical example with the hypothetical examples that appear in shareholder reports of other funds. |
Six Months Ended December 31, 2014
| Premier Class Shares | Beginning Account Value July 1, 2014 | Ending Account Value December 31, 2014 | Expenses Paid During Period * | |||||||||
Based on Actual Fund Return | ||||||||||||
State Street Institutional Liquid Reserves Fund | $ | 1,000.00 | $ | 1,000.40 | $ | 0.61 | ||||||
State Street Institutional Tax Free Money Market Fund | $ | 1,000.00 | $ | 1,000.00 | $ | 0.20 | ||||||
State Street Institutional U.S. Government Money Market Fund | $ | 1,000.00 | $ | 1,000.00 | $ | 0.35 | ||||||
State Street Institutional Treasury Money Market Fund | $ | 1,000.00 | $ | 1,000.00 | $ | 0.15 | ||||||
State Street Institutional Treasury Plus Money Market Fund | $ | 1,000.00 | $ | 1,000.00 | $ | 0.25 | ||||||
22
Table of Contents
State Street Institutional Investment Trust
General Information — (continued)
December 31, 2014 (Unaudited)
EXPENSE EXAMPLE — (continued)
| Premier Class Shares | Beginning Account Value July 1, 2014 | Ending Account Value December 31, 2014 | Expenses Paid During Period * | |||||||||
Based on Hypothetical (5% return before expenses) | ||||||||||||
State Street Institutional Liquid Reserves Fund | $ | 1,000.00 | $ | 1,024.60 | $ | 0.61 | ||||||
State Street Institutional Tax Free Money Market Fund | $ | 1,000.00 | $ | 1,025.00 | $ | 0.20 | ||||||
State Street Institutional U.S. Government Money Market Fund | $ | 1,000.00 | $ | 1,024.85 | $ | 0.36 | ||||||
State Street Institutional Treasury Money Market Fund | $ | 1,000.00 | $ | 1,025.05 | $ | 0.15 | ||||||
State Street Institutional Treasury Plus Money Market Fund | $ | 1,000.00 | $ | 1,024.95 | $ | 0.26 | ||||||
| * | The calculations are based on expenses incurred in the most recent six month period of each Fund. Each Fund’s Premier Class Shares’ annualized expense ratio as of December 31, 2014, which includes each Fund’s proportionate share of the expenses of its respective Portfolio, was as follows: |
State Street Institutional Liquid Reserves Fund | 0.12% | |||
State Street Institutional Tax Free Money Market Fund | 0.04% | |||
State Street Institutional U.S. Government Money Market Fund | 0.07% | |||
State Street Institutional Treasury Money Market Fund | 0.03% | |||
State Street Institutional Treasury Plus Money Market Fund | 0.05% |
| The dollar amount show as “Expenses Paid” are equal to the annualized expense ratio multiplied by the average account value over the period, multiplied by 184/365 (the most recent six month period). |
Six Months Ended December 31, 2014
| Investment Class Shares | Beginning Account Value July 1, 2014 | Ending Account Value December 31, 2014 | Expenses Paid During Period * | |||||||||
Based on Actual Fund Return | ||||||||||||
State Street Institutional Liquid Reserves Fund | $ | 1,000.00 | $ | 1,000.00 | $ | 1.01 | ||||||
State Street Institutional Tax Free Money Market Fund | $ | 1,000.00 | $ | 1,000.00 | $ | 0.20 | ||||||
State Street Institutional U.S. Government Money Market Fund | $ | 1,000.00 | $ | 1,000.00 | $ | 0.35 | ||||||
State Street Institutional Treasury Money Market Fund | $ | 1,000.00 | $ | 1,000.00 | $ | 0.15 | ||||||
State Street Institutional Treasury Plus Money Market Fund | $ | 1,000.00 | $ | 1,000.00 | $ | 0.25 | ||||||
23
Table of Contents
State Street Institutional Investment Trust
General Information — (continued)
December 31, 2014 (Unaudited)
EXPENSE EXAMPLE — (continued)
| Investment Class Shares | Beginning Account Value July 1, 2014 | Ending Account Value December 31, 2014 | Expenses Paid During Period * | |||||||||
Based on Hypothetical (5% return before expenses) | ||||||||||||
State Street Institutional Liquid Reserves Fund | $ | 1,000.00 | $ | 1,024.20 | $ | 1.02 | ||||||
State Street Institutional Tax Free Money Market Fund | $ | 1,000.00 | $ | 1,025.00 | $ | 0.20 | ||||||
State Street Institutional U.S. Government Money Market Fund | $ | 1,000.00 | $ | 1,024.85 | $ | 0.36 | ||||||
State Street Institutional Treasury Money Market Fund | $ | 1,000.00 | $ | 1,025.05 | $ | 0.15 | ||||||
State Street Institutional Treasury Plus Money Market Fund | $ | 1,000.00 | $ | 1,024.95 | $ | 0.26 | ||||||
| * | The calculations are based on expenses incurred in the most recent six month period of each Fund. Each Fund’s Investment Class Shares’ annualized expense ratio as of December 31, 2014, which includes each Fund’s proportionate share of the expenses of its respective Portfolio, was as follows: |
State Street Institutional Liquid Reserves Fund | 0.20% | |||
State Street Institutional Tax Free Money Market Fund | 0.04% | |||
State Street Institutional U.S. Government Money Market Fund | 0.07% | |||
State Street Institutional Treasury Money Market Fund | 0.03% | |||
State Street Institutional Treasury Plus Money Market Fund | 0.05% |
| The dollar amount show as “Expenses Paid” are equal to the annualized expense ratio multiplied by the average account value over the period, multiplied by 184/365 (the most recent six month period). |
Six Months Ended December 31, 2014
| State Street Institutional Liquid Reserves Fund Class M Shares | Beginning Account Value July 1, 2014 | Ending Account Value December 31, 2014 | Expenses Paid During Period * | |||||||||
Based on Actual Fund Return | $ | 1,000.00 | $ | 1,000.50 | $ | 0.50 | ||||||
Based on Hypothetical (5% return before expenses) | $ | 1,000.00 | $ | 1,024.70 | $ | 0.51 | ||||||
| * | The calculation is based on expenses incurred in the most recent six month period of the Fund. The annualized expense ratio for the six month period ended December 31, 2014 was 0.10%. The dollar amount shown as “Expenses Paid” is equal to the annualized expense ratio multiplied by the average account value over the period, multiplied by 184/365 (the most recent six month period). |
24
Table of Contents
State Street Institutional Investment Trust
General Information — (continued)
December 31, 2014 (Unaudited)
EXPENSE EXAMPLE — (continued)
Six Months Ended December 31, 2014
| State Street Institutional U.S. Government Money Market Fund Class G Shares** | Beginning Account Value July 1, 2014 | Ending Account Value December 31, 2014 | Expenses Paid During Period * | |||||||||
Based on Actual Fund Return | $ | 1,000.00 | $ | 1,000.00 | $ | 0.19 | ||||||
Based on Hypothetical (5% return before expenses) | $ | 1,000.00 | $ | 1,024.80 | $ | 0.41 | ||||||
| * | The calculation is based on expenses incurred in the most recent six month period of the Fund. The annualized expense ratio for the six month period ended December 31, 2014 was 0.08%. The dollar amount shown as “Expenses Paid” is equal to the annualized expense ratio multiplied by the average account value over the period, multiplied by 184/365 (the most recent six month period). |
| ** | Actual period is from commencement of operations 10/5/14. Hypothetical period is from 7/1/14. |
Proxy Voting Policies and Procedures and Record
Information regarding the Fund’s proxy voting policies and procedures, as well as information regarding how the Fund voted proxies, if any, during the most recent 12-month period ended June 30 is available without charge (1) by calling 1-877-521-4083 (toll free), or (2) on the website of the Securities and Exchange Commission (“SEC”) at www.sec.gov.
Quarterly Portfolio Schedule
The Fund files a complete schedule of portfolio holdings with the SEC for the first and third quarters of each fiscal year on Form N-Q. The Fund’s Forms N-Q are available on the SEC’s website at www.sec.gov and may be reviewed and copied at the SEC’s Public Reference Room in Washington, DC. Information on the operation of the Public Reference Room may be obtained by calling 1-800-SEC-0330. The information on Form N-Q is available upon request, without charge, by calling 1-877-521-4083 (toll-free).
25
Table of Contents
State Street Institutional Investment Trust
Trustees and Officers Information
December 31, 2014
Name, Address, | Position(s) Held | Term of Office | Principal Occupation | Number of Funds in Fund Complex Overseen by Trustee | Other Directorships | |||||
Independent Trustees | ||||||||||
Michael F. Holland State Street Financial Center One Lincoln Street Boston, MA 02111-2900 YOB: 1944 | Trustee and Co-Chairman of the Board | Term: Indefinite Elected: 7/99 | Chairman, Holland & Company L.L.C. (investment adviser) (1995 – present). | 59 | Trustee, State Street Master Funds; Trustee SSGA Funds; Director, the Holland Series Fund, Inc.; Director, The China Fund, Inc.; Director, The Taiwan Fund, Inc.; Director, Reaves Utility Income Fund, Inc.; and Director, Blackstone/GSO Loan Funds. | |||||
Patrick J. Riley State Street Financial Center One Lincoln Street Boston, MA 02111-2900 YOB: 1948 | Trustee and Co-Chairman of the Board | Term: Indefinite Elected: 1/14 | 2002 to May 2010, Associate Justice of the Superior Court, Commonwealth of Massachusetts; 1985 to 2002, Partner, Riley, Burke & Donahue, L.L.P. (law firm); 1998 to Present, Independent Director, State Street Global Advisers Ireland, Ltd. (investment company); 1998 to Present, Independent Director, SSGA Liquidity plc (formerly, SSGA Cash Management Fund plc); January 2009 to Present, Independent Director, SSGA Fixed Income plc; and January 2009 to Present, Independent Director, SSGA Qualified Funds PLC. | 59 | Trustee, State Street Master Funds; Trustee SSGA Funds; Board Director and Chairman, SPDR Europe 1PLC (2011 – Present); Board Director and Chairman, SPDR Europe II, PLC (2013 – Present). | |||||
William L. Boyan State Street Financial Center One Lincoln Street Boston, MA 02111-2900 YOB: 1937 | Trustee and Co-Chairman of the Valuation Committee | Term: Indefinite Elected: 7/99 | President and Chief Operations Officer, John Hancock Financial Services (1959 – 1999). Mr. Boyan retired in 1999. Chairman Emeritus, Children’s Hospital, Boston, MA (1984 –2011); Former Chairman, Boston Plan For Excellence, Boston Public Schools (1995 – 2010); Member of Advisory Board of Florida Atlantic University Lifelong Learning Society. | 59 | Trustee, State Street Master Funds; Trustee SSGA Funds; Former Trustee of Old Mutual South Africa Master Trust; Trustee, Children’s Hospital, Boston, MA. |
26
Table of Contents
Name, Address, | Position(s) Held | Term of Office | Principal Occupation | Number of Funds in Fund Complex Overseen by Trustee | Other Directorships | |||||
Independent Trustees (continued) | ||||||||||
William L. Marshall State Street Financial Center One Lincoln Street Boston, MA 02111-2900 YOB: 1942 | Trustee and Co-Chairman of the Audit Committee | Term: Indefinite Elected: 1/14 | April 2011 to Present, Chairman (until April 2011, Chief Executive Officer and President), Wm. L. Marshall Associates, Inc., Wm. L. Marshall Companies, Inc. and the Marshall Financial Group, Inc. (a registered investment adviser and provider of financial and related consulting services); Certified Financial Planner; Member, Financial Planners Association; Director, (2008 – 2014) Doylestown Health Foundation Board; and the Ann Silverman Community Clinic of Doylestown, PA. | 59 | Trustee, State Street Master Funds; Trustee SSGA Funds; Director, Marshall Financial Group, Inc. | |||||
Richard D. Shirk State Street Financial Center One Lincoln Street Boston, MA 02111-2900 YOB: 1945 | Trustee and Co-Chairman of the Qualified Legal and Compliance Committee | Term: Indefinite Elected: 1/14 | March 2001 to April 2002, Chairman (1996 to March 2001, President and Chief Executive Officer), Cerulean Companies, Inc. (holding company) (Retired); 1992 to March 2001, President and Chief Executive Officer, Blue Cross Blue Shield of Georgia (health insurer, managed healthcare); 1998 to December 2008, Chairman, Board Member and December 2008 to Present, Investment Committee Member, Healthcare Georgia Foundation (private foundation); September 2002 to Present, Lead Director and Board Member, Amerigroup Corp. (managed health care); 1999 to Present, Board Member and (since 2001) Investment Committee Member, Woodruff Arts Center; and 2003 to 2009, Trustee, Gettysburg College. | 59 | Trustee, State Street Master Funds; Trustee SSGA Funds; Board member, AeroCare Holdings (privately held healthcare services company) (February 2003 – Present); Board member, Regenesis Biomedical (health care services) (April 2012 – Present). | |||||
Rina K. Spence State Street Financial Center One Lincoln Street Boston, MA 02111-2900 YOB: 1948 | Trustee and Co-Chairman of the Qualified Legal and Compliance Committee and Co-Chairman of the Governance Committee | Term: Indefinite Elected: 7/99 | President of SpenceCare International LLC (international healthcare consulting) (1999 – present); Chief Executive Officer, IEmily.com (health internet company) (2000 – 2001); Chief Executive Officer of Consensus Pharmaceutical, Inc. (1998 – 1999); Founder, President and Chief Executive Officer of Spence Center for Women’s Health (1994 – 1998); President and CEO Emerson Hospital (1984 – 1994); Trustee, Eastern Enterprise (utilities) (1988 – 2000). | 59 | Trustee, State Street Master Funds; Trustee SSGA Funds; Director, Berkshire Life Insurance Company of America (1993 – 2009); Director, IEmily.com, Inc. (2000 – 2010); and Trustee, National Osteoporosis Foundation (2005 – 2008). | |||||
27
Table of Contents
Name, Address, | Position(s) Held | Term of Office | Principal Occupation | Number of Funds in Fund Complex Overseen by Trustee | Other Directorships | |||||
Independent Trustees (continued) | ||||||||||
Bruce D. Taber State Street Financial Center One Lincoln Street Boston, MA 02111-2900 YOB: 1943 | Trustee and Co-Chairman of the Valuation Committee and Co-Chairman of the Governance Committee | Term: Indefinite Elected: 1/14 | 1999 to Present, Partner, Zenergy LLC (a technology company providing Computer Modeling and System Analysis to the General Electric Power Generation Division); Until December 2008, Independent Director, SSGA Cash Management Fund plc; Until December 2008, Independent Director, State Street Global Advisers Ireland, Ltd. (investment companies); and Until August 1994, President, Alonzo B. Reed, Inc., (a Boston architect-engineering firm). | 59 | Trustee, State Street Master Funds; Trustee SSGA Funds | |||||
Douglas T. Williams State Street Financial Center One Lincoln Street Boston, MA 02111-2900 YOB: 1940 | Trustee and Co-Chairman of the Audit Committee | Term: Indefinite Elected: 7/99 | President, Oakmont Homeowners Association (2012 – 2013); President, Mariner Sands Chapel; Executive Vice President and member of Executive Committee, Chase Manhattan Bank (1987 – 1999); President, Boston Stock Exchange Depository Trust Company, 1981 – 1982. | 59 | Trustee, State Street Master Funds; Trustee SSGA Funds; Treasurer, Nantucket Educational Trust, (2002 – 2007). | |||||
Interested Trustees(1) | ||||||||||
Scott F. Powers State Street Financial Center One Lincoln Street Boston, MA 02111-2900 YOB: 1959 | Trustee | Term: Indefinite Elected Trustee: 1/14 | May 2008 to Present, President and Chief Executive Officer of State Street Global Advisors; 2001 – 2008, Chief Executive Officer of Old Mutual Asset Management; Board of Directors, United Way of Massachusetts Bay; Board of Directors of Middlesex School; Incorporator, Cardigan Mountain School | 59 | ||||||
James E. Ross SSGA Funds Management, Inc. State Street Financial Center One Lincoln Street Boston, MA 02111-2900 YOB: 1965 | Trustee | Term: Indefinite Elected Trustee: 2/07 | Chairman and Director, SSGA Funds Management, Inc. (2012 – present); President, SSGA Funds Management, Inc. (2005 – 2012); Executive Vice President and Senior Managing Director, State Street Global Advisors (2006 – present); and Principal, State Street Global Advisors (2006 – present). | 254 | ||||||
| (1) | Mr. Powers and Mr. Ross are Interested Trustees because of their employment by SSGA Funds Management, Inc., an affiliate of the Trust. |
28
Table of Contents
Name, Address, | Position(s) Held | Term of Office | Principal Occupation | |||
Officers: | ||||||
Ellen M. Needham SSGA Funds Management, Inc. State Street Financial Center One Lincoln Street Boston, MA 02111-2900 YOB: 1967 | President | Term: Indefinite Elected: 10/12 | President and Director, SSGA Funds Management, Inc. (June 2012 – present); Chief Operating Officer, SSGA Funds Management, Inc. (May 2010 – June 2012); Senior Managing Director, SSGA Funds Management, Inc. (1992 – 2012) and Senior Managing Director, State Street Global Advisors (1992 – present).* | |||
Ann M. Carpenter SSGA Funds Management, Inc. State Street Financial Center One Lincoln Street Boston, MA 02111-2900 YOB: 1966 | Vice President | Term: Indefinite Elected: 10/12 | Chief Operating Officer, SSGA Funds Management, Inc. (April 2014 – present); Vice President, SSGA Funds Management, Inc. (2008 – present); Principal, State Street Global Advisors (2005 – 2008 – present).* | |||
Laura F. Dell State Street Bank and Trust Company 100 Huntington Avenue Boston, MA 02116 YOB: 1964 | Treasurer | Term: Indefinite Elected: 11/10 | Vice President, State Street Bank and Trust Company (2002 – present).* | |||
Chad C. Hallett SSGA Funds Management, Inc. State Street Financial Center One Lincoln Street Boston, MA 02111-2900 YOB: 1969 | Assistant Treasurer | Term: Indefinite Elected: 09/11 | Vice President, State Street Global Advisors and SSGA Funds Management, Inc. (November 2014 – present); Vice President, State Street Bank and Trust Company (2001 – November 2014).* | |||
Caroline M. Connolly State Street Bank and Trust Company 100 Huntington Avenue Boston, MA 02116 YOB: 1975 | Assistant Treasurer | Term: Indefinite Elected: 09/11 | Assistant Vice President, State Street Bank and Trust Company (2007 – present). | |||
Brian Harris State Street Financial Center One Lincoln Street Boston, MA 02111 YOB: 1973 | Chief Compliance Officer | Term: Indefinite Elected: 11/13 | Vice President, State Street Global Advisors and SSGA Funds Management, Inc.( June 2013 – Present); Senior Vice President and Global Head of Investment Compliance, BofA Global Capital Management (September 2010 to May 2013); Director of Compliance, AARP Financial Inc. (July 2008 to August 2010). | |||
David K. James State Street Bank and Trust Company 100 Huntington Avenue Boston, MA 02116 YOB: 1970 | Secretary | Term: Indefinite Elected: 4/13 | Managing Director and Managing Counsel, State Street Bank and Trust Company (2009 – present); Vice President and Counsel, PNC Global Investment Servicing (US), Inc. (2006 – 2009). | |||
Kristin Schantz State Street Bank and Trust Company 100 Huntington Avenue Boston, MA 02116 YOB: 1979 | Assistant Secretary | Term: Indefinite Elected: 2/14 | Vice President and Counsel, State Street Bank and Trust Company (2013 – present); Vice President, Citi Fund Services Ohio, Inc. (2008 – 2013). | |||
| * | Served in various capacities and/or with various affiliated entities during noted time period. |
The Statement of Additional Information includes additional information about the Trustees and is available, without charge, upon request, by calling (toll free) 877-521-4083.
29
Table of Contents
Trustees
William L. Boyan
Michael F. Holland
William L. Marshall
Scott F. Powers
Patrick J. Riley
James E. Ross
Richard D. Shirk
Rina K. Spence
Bruce D. Taber
Douglas T. Williams
Investment Adviser and Administrator
SSGA Funds Management, Inc.
State Street Financial Center
One Lincoln Street
Boston, MA 02111
Custodian and Sub-Administrator
State Street Bank and Trust Company
State Street Financial Center
One Lincoln Street
Boston, MA 02111
Independent Public Registered Accounting Firm
Ernst & Young LLP
200 Clarendon Street
Boston, MA 02116
Legal Counsel
Ropes & Gray LLP
800 Boylston Street
Boston, MA 02199
Transfer Agent
Boston Financial Data Services
Two Heritage Drive
North Quincy, MA 02171
Distributor
State Street Global Markets LLC
State Street Financial Center
One Lincoln Street
Boston, MA 02111
This report is for shareholder information. This is not a prospectus intended for use in the purchase or sale of shares of beneficial interest.
State Street Institutional Investment Trust
State Street Bank and Trust Company
P.O. Box 5049
Boston, MA 02206
Table of Contents
Annual Report
31 December 2014
State Street Master Funds
State Street Money Market Portfolio
State Street Tax Free Money Market Portfolio
State Street U.S. Government Money Market Portfolio
State Street Treasury Money Market Portfolio
State Street Treasury Plus Money Market Portfolio
Table of Contents
State Street Money Market Portfolio
Portfolio Statistics (Unaudited)
Portfolio Composition* | December 31, 2014 | |||
Certificates of Deposit | 38.2 | % | ||
Treasury Repurchase Agreements | 34.1 | |||
Financial Company Commercial Paper | 19.0 | |||
Other Notes | 3.9 | |||
Other Repurchase Agreements | 3.3 | |||
Government Agency Repurchase Agreements | 1.6 | |||
Asset Backed Commercial Paper | 0.7 | |||
Liabilities in Excess of Other Assets | (0.8 | ) | ||
Total | 100.0 | % |
Maturity Ladder* | December 31, 2014 | |||
Overnight (1 Day) | 22.1 | % | ||
2-30 Days | 30.7 | |||
31-60 Days | 17.9 | |||
61-90 Days | 11.2 | |||
Over 90 Days | 18.9 | |||
Total | 100.8 | % | ||
Average days to maturity | 26 | |||
Weighted average life | 55 |
| * | As a percentage of net assets as of the date indicated. The Portfolio’s composition will vary over time. |
See Notes to Financial Statements.
32
Table of Contents
State Street Money Market Portfolio
Portfolio of Investments
December 31, 2014
Name of Issuer | Interest Rate | Next Rate Reset Date | Maturity Date | Principal Amount | Value | |||||||||||||||
| ASSET BACKED COMMERCIAL PAPER – 0.7% | ||||||||||||||||||||
Collateralized Commercial Paper Co. LLC(a) | 0.200 | % | 02/11/2015 | 02/11/2015 | $ | 300,000,000 | $ | 299,931,666 | ||||||||||||
|
| |||||||||||||||||||
| FINANCIAL COMPANY COMMERCIAL PAPER – 19.0% | ||||||||||||||||||||
Australia & New Zealand Banking Group Ltd.(b)(c) | 0.241 | % | 01/13/2015 | 04/13/2015 | 85,000,000 | 85,000,000 | ||||||||||||||
BNP Paribas(a) | 0.300 | % | 01/06/2015 | 01/06/2015 | 200,000,000 | 199,991,667 | ||||||||||||||
BNP Paribas(a) | 0.260 | % | 01/22/2015 | 01/22/2015 | 300,000,000 | 299,954,500 | ||||||||||||||
Caisse des Depots et Consignations(a)(d) | 0.230 | % | 02/03/2015 | 02/03/2015 | 50,000,000 | 49,989,458 | ||||||||||||||
Caisse des Depots et Consignations(a)(d) | 0.200 | % | 02/20/2015 | 02/20/2015 | 450,000,000 | 449,875,000 | ||||||||||||||
Caisse des Depots et Consignations(a)(d) | 0.215 | % | 04/02/2015 | 04/02/2015 | 150,000,000 | 149,918,479 | ||||||||||||||
Caisse des Depots et Consignations(a)(d) | 0.215 | % | 04/07/2015 | 04/07/2015 | 175,000,000 | 174,899,667 | ||||||||||||||
DnB Bank ASA(a)(c) | 0.210 | % | 01/13/2015 | 01/13/2015 | 300,000,000 | 299,979,000 | ||||||||||||||
DnB Bank ASA(a)(c) | 0.225 | % | 01/20/2015 | 01/20/2015 | 250,000,000 | 249,971,632 | ||||||||||||||
DnB Bank ASA(a)(c) | 0.225 | % | 01/20/2015 | 01/20/2015 | 110,000,000 | 109,986,938 | ||||||||||||||
DnB Bank ASA(a)(c) | 0.190 | % | 01/26/2015 | 01/26/2015 | 350,000,000 | 349,953,819 | ||||||||||||||
DnB Bank ASA(a)(c) | 0.215 | % | 03/06/2015 | 03/06/2015 | 385,000,000 | 384,852,844 | ||||||||||||||
Erste Abwicklungsanstalt(a)(c) | 0.180 | % | 02/10/2015 | 02/10/2015 | 125,000,000 | 124,975,000 | ||||||||||||||
General Electric Capital Corp.(a) | 0.200 | % | 01/08/2015 | 01/08/2015 | 100,000,000 | 99,996,111 | ||||||||||||||
HSBC Bank PLC(a)(c) | 0.230 | % | 03/30/2015 | 03/30/2015 | 150,000,000 | 149,915,667 | ||||||||||||||
HSBC Bank PLC(b)(c) | 0.252 | % | 01/12/2015 | 09/10/2015 | 100,000,000 | 100,000,000 | ||||||||||||||
HSBC Bank PLC(b)(c) | 0.244 | % | 01/02/2015 | 10/02/2015 | 175,000,000 | 175,000,000 | ||||||||||||||
JP Morgan Securities LLC(b)(c) | 0.327 | % | 01/06/2015 | 02/06/2015 | 350,000,000 | 350,000,000 | ||||||||||||||
Nationwide Building Society(a)(c) | 0.190 | % | 01/07/2015 | 01/07/2015 | 150,000,000 | 149,995,250 | ||||||||||||||
Nordea Bank AB(a)(c) | 0.200 | % | 01/22/2015 | 01/22/2015 | 145,000,000 | 144,983,083 | ||||||||||||||
Nordea Bank AB(a)(c) | 0.200 | % | 02/24/2015 | 02/24/2015 | 300,000,000 | 299,910,000 | ||||||||||||||
Nordea Bank AB(a)(c) | 0.200 | % | 02/26/2015 | 02/26/2015 | 175,000,000 | 174,945,556 | ||||||||||||||
Skandinaviska Enskilda Banken AB(a)(c) | 0.200 | % | 02/05/2015 | 02/05/2015 | 495,000,000 | 494,903,750 | ||||||||||||||
Skandinaviska Enskilda Banken AB(a)(c) | 0.240 | % | 03/02/2015 | 03/02/2015 | 385,000,000 | 384,846,000 | ||||||||||||||
Societe Generale(a)(c) | 0.240 | % | 03/03/2015 | 03/03/2015 | 325,000,000 | 324,867,833 | ||||||||||||||
Sumitomo Mitsui Banking Corp.(a)(c) | 0.240 | % | 01/22/2015 | 01/22/2015 | 350,000,000 | 349,951,000 | ||||||||||||||
Svenska Handelsbanken AB(a)(c) | 0.200 | % | 04/17/2015 | 04/17/2015 | 200,000,000 | 199,882,222 | ||||||||||||||
Swedbank AB(a) | 0.230 | % | 02/02/2015 | 02/02/2015 | 100,000,000 | 99,979,556 | ||||||||||||||
Swedbank AB(a) | 0.230 | % | 02/05/2015 | 02/05/2015 | 100,000,000 | 99,977,639 | ||||||||||||||
Swedbank AB(a) | 0.230 | % | 02/10/2015 | 02/10/2015 | 200,000,000 | 199,948,889 | ||||||||||||||
Toyota Motor Credit Corp.(a) | 0.200 | % | 01/07/2015 | 01/07/2015 | 50,000,000 | 49,998,333 | ||||||||||||||
Toyota Motor Credit Corp.(a) | 0.200 | % | 01/08/2015 | 01/08/2015 | 129,000,000 | 128,994,984 | ||||||||||||||
Westpac Banking Corp.(b)(c) | 0.231 | % | 01/16/2015 | 01/16/2015 | 409,500,000 | 409,500,000 | ||||||||||||||
Westpac Banking Corp.(b)(c) | 0.228 | % | 01/05/2015 | 03/04/2015 | 250,000,000 | 249,998,437 | ||||||||||||||
Westpac Banking Corp.(b)(c) | 0.243 | % | 01/26/2015 | 04/24/2015 | 150,000,000 | 150,000,000 | ||||||||||||||
|
| |||||||||||||||||||
TOTAL FINANCIAL COMPANY COMMERCIAL PAPER |
| 7,716,942,314 | ||||||||||||||||||
|
| |||||||||||||||||||
See Notes to Financial Statements.
33
Table of Contents
State Street Money Market Portfolio
Portfolio of Investments — (continued)
December 31, 2014
Name of Issuer | Interest Rate | Next Rate Reset Date | Maturity Date | Principal Amount | Value | |||||||||||||||
| CERTIFICATES OF DEPOSIT – 38.2% | ||||||||||||||||||||
Bank of America NA(a) | 0.230 | % | 01/23/2015 | 01/23/2015 | $ | 121,000,000 | $ | 121,000,000 | ||||||||||||
Bank of America NA(a) | 0.230 | % | 01/26/2015 | 01/26/2015 | 195,000,000 | 195,000,000 | ||||||||||||||
Bank of Montreal(a) | 0.190 | % | 01/07/2015 | 01/07/2015 | 145,000,000 | 145,000,000 | ||||||||||||||
Bank of Montreal(b) | 0.282 | % | 01/20/2015 | 06/17/2015 | 325,000,000 | 325,000,000 | ||||||||||||||
Bank of Nova Scotia(b) | 0.287 | % | 01/07/2015 | 06/05/2015 | 335,000,000 | 335,000,000 | ||||||||||||||
Bank of Nova Scotia(b) | 0.262 | % | 01/12/2015 | 09/04/2015 | 350,000,000 | 350,000,000 | ||||||||||||||
Bank of Tokyo – Mitsubishi(a) | 0.200 | % | 01/09/2015 | 01/09/2015 | 140,000,000 | 140,000,000 | ||||||||||||||
Bank of Tokyo – Mitsubishi(a) | 0.200 | % | 02/04/2015 | 02/04/2015 | 200,000,000 | 200,000,000 | ||||||||||||||
Bank of Tokyo – Mitsubishi(a) | 0.200 | % | 03/16/2015 | 03/16/2015 | 350,000,000 | 350,000,000 | ||||||||||||||
Barclays Bank(b) | 0.336 | % | 03/09/2015 | 04/01/2015 | 500,000,000 | 500,000,000 | ||||||||||||||
Barclays Bank(b) | 0.390 | % | 01/26/2015 | 06/25/2015 | 685,000,000 | 685,000,000 | ||||||||||||||
BNP Paribas(a) | 0.250 | % | 02/04/2015 | 02/04/2015 | 500,000,000 | 500,000,000 | ||||||||||||||
BNP Paribas(a) | 0.250 | % | 03/12/2015 | 03/12/2015 | 384,000,000 | 384,000,000 | ||||||||||||||
Canadian Imperial Bank of Commerce(b) | 0.317 | % | 01/05/2015 | 06/04/2015 | 195,000,000 | 195,000,000 | ||||||||||||||
Chase Bank USA NA(b) | 0.240 | % | 01/26/2015 | 01/26/2015 | 124,000,000 | 124,000,000 | ||||||||||||||
Chase Bank USA NA(b) | 0.247 | % | 01/26/2015 | 02/24/2015 | 124,000,000 | 124,000,000 | ||||||||||||||
Citibank NA(a) | 0.200 | % | 01/06/2015 | 01/06/2015 | 50,000,000 | 50,000,000 | ||||||||||||||
Citibank NA(a) | 0.230 | % | 01/26/2015 | 01/26/2015 | 375,000,000 | 375,000,000 | ||||||||||||||
Credit Agricole Corporate & Investment Bank(a) | 0.250 | % | 02/03/2015 | 02/03/2015 | 700,000,000 | 700,000,000 | ||||||||||||||
Credit Suisse(a) | 0.230 | % | 01/07/2015 | 01/07/2015 | 285,000,000 | 285,000,000 | ||||||||||||||
Credit Suisse(a) | 0.310 | % | 02/05/2015 | 02/05/2015 | 400,000,000 | 400,000,000 | ||||||||||||||
ING Bank NV(a) | 0.300 | % | 02/02/2015 | 02/02/2015 | 125,000,000 | 125,000,000 | ||||||||||||||
ING Bank NV(a) | 0.310 | % | 02/11/2015 | 02/11/2015 | 140,000,000 | 140,000,000 | ||||||||||||||
ING Bank NV(a) | 0.310 | % | 02/27/2015 | 02/27/2015 | 200,000,000 | 200,000,000 | ||||||||||||||
ING Bank NV(a) | 0.320 | % | 03/02/2015 | 03/02/2015 | 200,000,000 | 200,000,000 | ||||||||||||||
ING Bank NV(a) | 0.320 | % | 03/10/2015 | 03/10/2015 | 400,000,000 | 400,000,000 | ||||||||||||||
ING Bank NV(a) | 0.240 | % | 03/18/2015 | 03/18/2015 | 208,000,000 | 208,000,000 | ||||||||||||||
Lloyds Bank PLC(a) | 0.250 | % | 02/09/2015 | 02/09/2015 | 221,000,000 | 221,000,000 | ||||||||||||||
Nordea Bank AB(a) | 0.245 | % | 01/22/2015 | 01/22/2015 | 100,000,000 | 99,999,709 | ||||||||||||||
Norinchukin Bank(a) | 0.190 | % | 01/08/2015 | 01/08/2015 | 375,000,000 | 374,999,995 | ||||||||||||||
Norinchukin Bank(a) | 0.230 | % | 01/26/2015 | 01/26/2015 | 500,000,000 | 500,000,000 | ||||||||||||||
Rabobank Nederland NV(a) | 0.210 | % | 01/08/2015 | 01/08/2015 | 216,000,000 | 216,000,000 | ||||||||||||||
Rabobank Nederland NV(a) | 0.220 | % | 03/13/2015 | 03/13/2015 | 350,000,000 | 350,000,000 | ||||||||||||||
Rabobank Nederland NV(a) | 0.210 | % | 04/06/2015 | 04/06/2015 | 300,000,000 | 300,000,000 | ||||||||||||||
Rabobank Nederland NV(a) | 0.210 | % | 05/04/2015 | 05/04/2015 | 200,000,000 | 200,000,000 | ||||||||||||||
Royal Bank of Canada(b) | 0.236 | % | 01/20/2015 | 05/20/2015 | 125,000,000 | 125,000,000 | ||||||||||||||
Royal Bank of Canada(b) | 0.260 | % | 01/29/2015 | 08/31/2015 | 120,000,000 | 120,000,000 | ||||||||||||||
Royal Bank of Canada(b) | 0.262 | % | 01/12/2015 | 09/10/2015 | 180,000,000 | 180,000,000 | ||||||||||||||
Standard Chartered Bank(a) | 0.160 | % | 01/02/2015 | 01/02/2015 | 150,000,000 | 150,000,000 | ||||||||||||||
Sumitomo Mitsui Banking Corp.(a) | 0.240 | % | 01/22/2015 | 01/22/2015 | 150,000,000 | 150,000,000 | ||||||||||||||
Sumitomo Mitsui Banking Corp.(a) | 0.220 | % | 02/06/2015 | 02/06/2015 | 100,000,000 | 100,000,000 | ||||||||||||||
See Notes to Financial Statements.
34
Table of Contents
State Street Money Market Portfolio
Portfolio of Investments — (continued)
December 31, 2014
Name of Issuer | Interest Rate | Next Rate Reset Date | Maturity Date | Principal Amount | Value | |||||||||||||||
| CERTIFICATES OF DEPOSIT – (continued) | ||||||||||||||||||||
Sumitomo Mitsui Banking Corp.(a) | 0.220 | % | 02/27/2015 | 02/27/2015 | $ | 150,000,000 | $ | 150,000,000 | ||||||||||||
Svenska Handelsbanken AB(a) | 0.205 | % | 01/26/2015 | 01/26/2015 | 150,000,000 | 150,000,521 | ||||||||||||||
Svenska Handelsbanken AB(a) | 0.195 | % | 02/02/2015 | 02/02/2015 | 200,000,000 | 200,000,888 | ||||||||||||||
Svenska Handelsbanken AB(a) | 0.220 | % | 02/09/2015 | 02/09/2015 | 178,660,000 | 178,660,966 | ||||||||||||||
Svenska Handelsbanken AB(a) | 0.215 | % | 04/16/2015 | 04/16/2015 | 300,000,000 | 300,004,372 | ||||||||||||||
Swedbank AB(a) | 0.230 | % | 01/07/2015 | 01/07/2015 | 200,000,000 | 200,000,000 | ||||||||||||||
Toronto Dominion Bank(a) | 0.200 | % | 01/13/2015 | 01/13/2015 | 175,000,000 | 175,000,000 | ||||||||||||||
Toronto Dominion Bank(a) | 0.200 | % | 01/14/2015 | 01/14/2015 | 125,000,000 | 125,000,000 | ||||||||||||||
Toronto Dominion Bank(a) | 0.200 | % | 01/15/2015 | 01/15/2015 | 125,000,000 | 125,000,000 | ||||||||||||||
Toronto Dominion Bank(a) | 0.200 | % | 03/03/2015 | 03/03/2015 | 355,000,000 | 355,000,000 | ||||||||||||||
Toronto Dominion Bank(b) | 0.243 | % | 02/23/2015 | 08/24/2015 | 289,000,000 | 289,000,000 | ||||||||||||||
UBS AG(a) | 0.220 | % | 02/06/2015 | 02/06/2015 | 535,000,000 | 535,000,000 | ||||||||||||||
UBS AG(b) | 0.267 | % | 01/05/2015 | 03/05/2015 | 300,500,000 | 300,500,000 | ||||||||||||||
Wells Fargo Bank NA(b) | 0.231 | % | 01/12/2015 | 03/12/2015 | 225,000,000 | 225,000,000 | ||||||||||||||
Wells Fargo Bank NA(b) | 0.231 | % | 01/09/2015 | 04/09/2015 | 214,000,000 | 214,000,000 | ||||||||||||||
Wells Fargo Bank NA(b) | 0.253 | % | 01/08/2015 | 07/07/2015 | 300,000,000 | 300,000,000 | ||||||||||||||
Wells Fargo Bank NA(b) | 0.250 | % | 01/12/2015 | 07/14/2015 | 458,000,000 | 458,000,000 | ||||||||||||||
Westpac Banking Corp.(b) | 0.227 | % | 01/06/2015 | 01/06/2015 | 250,000,000 | 249,999,822 | ||||||||||||||
Westpac Banking Corp.(b) | 0.231 | % | 01/16/2015 | 01/16/2015 | 155,000,000 | 155,000,000 | ||||||||||||||
|
| |||||||||||||||||||
TOTAL CERTIFICATES OF DEPOSIT |
| 15,528,166,273 | ||||||||||||||||||
|
| |||||||||||||||||||
| OTHER NOTES – 3.9% | ||||||||||||||||||||
Bank of America NA(a) | 0.230 | % | 02/09/2015 | 02/09/2015 | 192,000,000 | 192,000,000 | ||||||||||||||
Bank of America NA(a) | 0.230 | % | 02/19/2015 | 02/19/2015 | 234,000,000 | 234,000,000 | ||||||||||||||
JPMorgan Chase Bank NA(b) | 0.355 | % | 03/09/2015 | 01/07/2016 | 260,000,000 | 260,000,000 | ||||||||||||||
JPMorgan Chase Bank NA(b) | 0.352 | % | 01/22/2015 | 01/22/2016 | 175,000,000 | 175,000,000 | ||||||||||||||
Royal Bank of Canada(b)(d) | 0.322 | % | 01/07/2015 | 01/07/2016 | 155,000,000 | 155,000,000 | ||||||||||||||
Svenska Handelsbanken AB(b)(d) | 0.320 | % | 01/27/2015 | 06/26/2015 | 180,000,000 | 180,000,000 | ||||||||||||||
Wells Fargo Bank NA(b) | 0.328 | % | 03/10/2015 | 01/08/2016 | 155,000,000 | 155,000,000 | ||||||||||||||
Wells Fargo Bank NA(b) | 0.336 | % | 01/20/2015 | 01/20/2016 | 227,000,000 | 227,000,000 | ||||||||||||||
|
| |||||||||||||||||||
TOTAL OTHER NOTES | 1,578,000,000 | |||||||||||||||||||
|
| |||||||||||||||||||
See Notes to Financial Statements.
35
Table of Contents
State Street Money Market Portfolio
Portfolio of Investments — (continued)
December 31, 2014
Name of Issuer | Interest Rate | Next Rate Reset Date | Maturity Date | Principal Amount | Value | |||||||||||||||
| GOVERNMENT AGENCY REPURCHASE AGREEMENTS – 1.6% | ||||||||||||||||||||
Agreement with Citigroup Global Markets, Inc. and The Bank of New York Mellon (Tri-Party), dated 12/26/2014 (collateralized by various Federal Home Loan Mortgage Corporations, 3.000% – 6.500% due 10/01/2023 – 12/01/2044, Federal National Mortgage Associations, 3.500% – 6.000% due 06/01/2023 – 12/01/2044, Government National Mortgage Associations, 4.000% – 6.000% due 06/15/2040 – 12/20/2044, and a U.S. Treasury Bond, 2.750% due 02/15/2024, valued at $255,000,066); expected proceeds $250,004,375 | 0.090 | % | 01/02/2015 | 01/02/2015 | $ | 250,000,000 | $ | 250,000,000 | ||||||||||||
Agreement with Goldman Sachs & Co. and The Bank of New York Mellon (Tri-Party), dated 12/31/2014 (collateralized by Federal Home Loan Mortgage Corporations, 2.500% – 5.500% due 03/01/2024 – 01/01/2045, and Federal National Mortgage Associations, 2.500% – 6.000% due 02/01/2024 – 12/01/2044, valued at $306,000,001); expected proceeds $300,004,667 | 0.080 | % | 01/07/2015 | 01/07/2015 | 300,000,000 | 300,000,000 | ||||||||||||||
Agreement with Goldman Sachs & Co. and The Bank of New York Mellon (Tri-Party), dated 12/31/2014 (collateralized by Federal Home Loan Mortgage Corporations, 2.500% – 6.500% due 04/01/2019 – 11/01/2044, and Federal National Mortgage Associations, 2.500% –6.000% due 12/01/2025 – 12/01/2044, valued at $102,000,000); expected proceeds $100,001,778 | 0.080 | % | 01/08/2015 | 01/08/2015 | 100,000,000 | 100,000,000 | ||||||||||||||
|
| |||||||||||||||||||
TOTAL GOVERNMENT AGENCY REPURCHASE AGREEMENTS |
| 650,000,000 | ||||||||||||||||||
|
| |||||||||||||||||||
| TREASURY REPURCHASE AGREEMENTS – 34.1% | ||||||||||||||||||||
Agreement with Federal Reserve Bank of New York and The Bank of New York Mellon (Tri-Party), dated 12/08/2014 (collateralized by a U.S. Treasury Bond, 2.750% due 08/15/2042, and U.S. Treasury Notes, 1.625% – 2.625% due 08/15/2020 – 08/15/2022, valued at $3,013,254,995); expected proceeds $3,000,186,667 | 0.080 | % | 01/05/2015 | 01/05/2015 | 3,000,000,000 | 3,000,000,000 | ||||||||||||||
See Notes to Financial Statements.
36
Table of Contents
State Street Money Market Portfolio
Portfolio of Investments — (continued)
December 31, 2014
Name of Issuer | Interest Rate | Next Rate Reset Date | Maturity Date | Principal Amount | Value | |||||||||||||||
| TREASURY REPURCHASE AGREEMENTS – (continued) | ||||||||||||||||||||
Agreement with Federal Reserve Bank of New York and The Bank of New York Mellon (Tri-Party), dated 12/15/2014 (collateralized by a U.S. Treasury Bond, 4.500% due 05/15/2038, and U.S. Treasury Notes, 1.375% – 4.000% due 08/15/2018 – 08/15/2022, valued at $777,673,569); expected proceeds $775,031,646 | 0.070 | % | 01/05/2015 | 01/05/2015 | $ | 775,000,000 | $ | 775,000,000 | ||||||||||||
Agreement with Federal Reserve Bank of New York and The Bank of New York Mellon (Tri-Party), dated 12/29/2014 (collateralized by a U.S. Treasury Bond, 4.500% due 05/15/2038, and U.S. Treasury Notes, 1.625% – 4.000% due 02/28/2018 – 08/15/2022, valued at $1,504,537,044); expected proceeds $1,500,029,167 | 0.100 | % | 01/05/2015 | 01/05/2015 | 1,500,000,000 | 1,500,000,000 | ||||||||||||||
Agreement with Federal Reserve Bank of New York and The Bank of New York Mellon (Tri-Party), dated 12/31/2014 (collateralized by a U.S. Treasury Bond, 2.750% due 08/15/2042, and U.S. Treasury Notes, 1.375% – 4.000% due 02/29/2016 – 11/15/2022, valued at $8,610,023,984); expected proceeds $8,610,023,917 | 0.050 | % | 01/02/2015 | 01/02/2015 | 8,610,000,000 | 8,610,000,000 | ||||||||||||||
|
| |||||||||||||||||||
TOTAL TREASURY REPURCHASE AGREEMENTS |
| 13,885,000,000 | ||||||||||||||||||
|
| |||||||||||||||||||
| OTHER REPURCHASE AGREEMENTS – 3.3% | ||||||||||||||||||||
Agreement with Citigroup Global Markets, Inc. and The Bank of New York Mellon (Tri-Party), dated 12/05/2014 (collateralized by a Collateralized Mortgage Obligation, 1.255% due 09/17/2031, and Corporate Bonds, 0.524% – 9.750% due 03/06/2015 – 12/31/2099, valued at $162,328,344); expected proceeds $155,244,125 | 0.630 | % | 01/02/2015 | 03/05/2015 | 155,000,000 | 155,000,000 | ||||||||||||||
Agreement with Credit Suisse Securities (USA) LLC and JP Morgan Chase & Co. (Tri-Party), dated 12/31/2014 (collateralized by various Corporate Bonds, 0.000% – 11.875% due 07/15/2015 – 09/01/2066, Medium Term Notes, 4.300% – 5.017% due 10/17/2021 – 06/26/2024, and U.S. Treasury Notes, 0.250% – 4.250% due 08/15/2015 – 12/31/2018 valued at $487,411,705); expected proceeds $450,185,625 | 0.450 | % | 01/02/2015 | 02/02/2015 | 450,000,000 | 450,000,000 | ||||||||||||||
See Notes to Financial Statements.
37
Table of Contents
State Street Money Market Portfolio
Portfolio of Investments — (continued)
December 31, 2014
Name of Issuer | Interest Rate | Next Rate Reset Date | Maturity Date | Principal Amount | Value | |||||||||||||||
| OTHER REPURCHASE AGREEMENTS – (continued) | ||||||||||||||||||||
Agreement with Goldman Sachs & Co. and The Bank of New York Mellon (Tri-Party), dated 12/05/2014 (collateralized by a Common Stock, and U.S. Treasury Strips, 0.000% due 11/15/2031 – 08/15/2043 valued at $128,194,443); expected proceeds $125,125,000 | 0.400 | % | 01/02/2015 | 03/05/2015 | $ | 125,000,000 | $ | 125,000,000 | ||||||||||||
Agreement with Goldman Sachs & Co. and The Bank of New York Mellon (Tri-Party), dated 12/19/2014 (collateralized by various Common Stocks, a Corporate Bond, 5.500% due 02/06/2044, and a U.S. Treasury Bill, 0.000% due 01/08/2015 valued at $334,729,030); expected proceeds $310,471,372 | 0.460 | % | 01/02/2015 | 04/17/2015 | 310,000,000 | 310,000,000 | ||||||||||||||
Agreement with JP Morgan Securities, Inc. and JP Morgan Chase & Co. (Tri-Party), dated 12/19/2014 (collateralized by various Corporate Bonds, 0.000% – 9.700% due 03/15/2015 – 03/15/2072 valued at $344,078,912); expected proceeds $320,385,031 | 0.364 | % | 01/16/2015 | 04/17/2015 | 320,000,000 | 320,000,000 | ||||||||||||||
|
| |||||||||||||||||||
TOTAL OTHER REPURCHASE AGREEMENTS |
| 1,360,000,000 | ||||||||||||||||||
|
| |||||||||||||||||||
TOTAL INVESTMENTS(e)(f) – 100.8% |
| 41,018,040,253 | ||||||||||||||||||
Liabilities in Excess of Other Assets – (0.8)% | (313,572,633 | ) | ||||||||||||||||||
|
| |||||||||||||||||||
NET ASSETS – 100.0% | $ | 40,704,467,620 | ||||||||||||||||||
|
| |||||||||||||||||||
| (a) | Rate represents annualized yield at date of purchase |
| (b) | Variable Rate Security – Interest rate shown is rate in effect as of December 31, 2014. |
| (c) | Rule 144A, Section 4(2) or other security, which is restricted to resale to institutional investors. The Portfolio’s investment manager has deemed this security to be liquid based upon procedures approved by the Board of Trustees. These securities represent $5,712,844,664 or 14.03% of net assets as of December 31, 2014. |
| (d) | Security subject to restrictions on resale under federal securities laws, which may only be resold upon registration under the Securities Act of 1933, as amended (“1933 Act”) or in transactions exempt from registration, including sales to qualified institutional buyers pursuant to Rule 144A of the 1933 Act. The Portfolio does not have the right to demand that this security be registered. The Portfolio’s investment manager has deemed this security to be liquid based upon procedures approved by the Board of Trustees. These securities represent $1,159,637,241 or 2.85% of net assets as of December 31, 2014. |
| (e) | Unless otherwise indicated, the values of the securities of the Portfolio are determined based on Level 2 inputs established by provisions surrounding fair value measurements and disclosures (Note 2). |
| (f) | Also represents the cost for federal tax purposes |
See Notes to Financial Statements.
38
Table of Contents
State Street Tax Free Money Market Portfolio
Portfolio Statistics (Unaudited)
Portfolio Composition* | December 31, 2014 | |||
Cash/Money Market Fund | 24.4 | % | ||
General Obligations | 18.6 | |||
Housing | 14.9 | |||
Health | 7.8 | |||
Transportation | 7.8 | |||
Power | 7.3 | |||
Education | 7.2 | |||
Pollution | 4.1 | |||
Water | 2.5 | |||
Development | 2.1 | |||
Industrial Revenue/Pollution Control Revenue | 1.5 | |||
Airport | 1.2 | |||
Stadium | 0.6 | |||
Liabilities in Excess of Other Assets | (0.0 | )** | ||
Total | 100.0 | % |
Maturity Ladder* | December 31, 2014 | |||
Overnight (1 Day) | 33.3 | % | ||
2-30 Days | 66.7 | |||
31-60 Days | 0.0 | |||
61-90 Days | 0.0 | |||
Over 90 Days | 0.0 | |||
Total | 100.0 | % | ||
Average days to maturity | 5 | |||
Weighted average life | 5 |
| * | As a percentage of net assets as of the date indicated. The Portfolio’s composition will vary over time. |
| ** | Amount represents less than 0.05% of net assets. |
See Notes to Financial Statements.
39
Table of Contents
State Street Tax Free Money Market Portfolio
Portfolio of Investments
December 31, 2014
Name of Issuer | Interest Rate | Next Rate Reset Date | Maturity Date | Principal Amount | Value | |||||||||||||||
| VARIABLE RATE DEMAND NOTES – 75.6% | ||||||||||||||||||||
| California – 6.9% | ||||||||||||||||||||
California Infrastructure & Economic Development Bank, Revenue Bonds, Pacific Gas & Electric Co., LOC: Sumitomo Mitsui Banking(a) | 0.010 | % | 01/02/2015 | 01/02/2015 | $ | 2,000,000 | $ | 2,000,000 | ||||||||||||
California Infrastructure & Economic Development Bank, Revenue Bonds, Pacific Gas & Electric Co., Series D, LOC: Sumitomo Mitsui Banking(a) | 0.010 | % | 01/02/2015 | 01/02/2015 | 4,875,000 | 4,875,000 | ||||||||||||||
City of Hemet, Multi Family Housing Revenue Bonds, Sunwest Retirement, Series A, LIQ: FHLMC(a) | 0.050 | % | 01/07/2015 | 01/07/2015 | 1,500,000 | 1,500,000 | ||||||||||||||
East Bay Municipal Utility District, System Revenue Bonds, Series A-2, RMKT 01/12/11, SPA: Barclays Bank PLC(a) | 0.020 | % | 01/07/2015 | 01/07/2015 | 2,630,000 | 2,630,000 | ||||||||||||||
Lancaster Redevelopment Agency, Multi Family Housing Revenue Bonds, 20th Street Apartments Project, Series C, LIQ: FNMA(a) | 0.050 | % | 01/07/2015 | 01/07/2015 | 1,000,000 | 1,000,000 | ||||||||||||||
San Francisco City & County Airports Commission, Revenue Bonds, Second Series 36-A, RMKT 06/02/09, LOC: U.S. Bank N.A.(a) | 0.020 | % | 01/07/2015 | 01/07/2015 | 3,000,000 | 3,000,000 | ||||||||||||||
State of California, GO Unlimited, Series A, LOC: Royal Bank of Canada(a) | 0.020 | % | 01/07/2015 | 01/07/2015 | 2,500,000 | 2,500,000 | ||||||||||||||
|
| |||||||||||||||||||
| 17,505,000 | ||||||||||||||||||||
|
| |||||||||||||||||||
| Colorado – 5.2% | ||||||||||||||||||||
Colorado Housing & Finance Authority, Revenue Bonds, Multi Family, Class I A-1, SPA: FHLB(a) | 0.020 | % | 01/07/2015 | 01/07/2015 | 5,445,000 | 5,445,000 | ||||||||||||||
Colorado Housing & Finance Authority, Revenue Bonds, Single Family, Series B-3, SPA: Barclays Bank PLC, LIQ: FHA(a) | 0.020 | % | 01/07/2015 | 01/07/2015 | 4,000,000 | 4,000,000 | ||||||||||||||
Southern Ute Indian Tribe of Southern Ute Indian Reservation, Revenue Bonds(a) | 0.070 | % | 01/07/2015 | 01/07/2015 | 3,700,000 | 3,700,000 | ||||||||||||||
|
| |||||||||||||||||||
| 13,145,000 | ||||||||||||||||||||
|
| |||||||||||||||||||
| Connecticut – 6.8% | ||||||||||||||||||||
Connecticut Housing Finance Authority, Revenue Bonds, Mortgage Finance Program, Subseries B-6, SPA: Bank of Tokyo-Mitsubishi UFJ(a) | 0.040 | % | 01/07/2015 | 01/07/2015 | 3,000,000 | 3,000,000 | ||||||||||||||
Connecticut Housing Finance Authority, Revenue Bonds, Subseries E-3, INS: Government Authority, SPA: Bank of Tokyo-Mitsubishi UFJ(a) | 0.040 | % | 01/07/2015 | 01/07/2015 | 4,750,000 | 4,750,000 | ||||||||||||||
See Notes to Financial Statements.
40
Table of Contents
State Street Tax Free Money Market Portfolio
Portfolio of Investments — (continued)
December 31, 2014
Name of Issuer | Interest Rate | Next Rate Reset Date | Maturity Date | Principal Amount | Value | |||||||||||||||
| VARIABLE RATE DEMAND NOTES – (continued) | ||||||||||||||||||||
| Connecticut – (continued) | ||||||||||||||||||||
Connecticut State Health & Educational Facility Authority, Revenue Bonds, Yale University, Series U-2(a) | 0.020 | % | 01/07/2015 | 01/07/2015 | $ | 9,480,000 | $ | 9,480,000 | ||||||||||||
|
| |||||||||||||||||||
| 17,230,000 | ||||||||||||||||||||
|
| |||||||||||||||||||
| Delaware – 2.7% | ||||||||||||||||||||
Delaware River & Bay Authority, Revenue Bonds, LOC: TD Bank N.A.(a) | 0.030 | % | 01/07/2015 | 01/07/2015 | 6,900,000 | 6,900,000 | ||||||||||||||
|
| |||||||||||||||||||
| Florida – 0.9% | ||||||||||||||||||||
JEA Electric System, Revenue Bonds, Series 3-A, SPA: Royal Bank of Canada(a) | 0.020 | % | 01/07/2015 | 01/07/2015 | 2,415,000 | 2,415,000 | ||||||||||||||
|
| |||||||||||||||||||
| Indiana – 4.5% | ||||||||||||||||||||
City of Indianapolis, Revenue Bonds, Lakeside Pointe and Fox Club, LIQ: FNMA(a) | 0.060 | % | 01/07/2015 | 01/07/2015 | 2,000,000 | 2,000,000 | ||||||||||||||
Indiana Finance Authority, Hospital Revenue Bonds, Indiana University Health, Series C, LOC: Northern Trust Company(a) | 0.020 | % | 01/07/2015 | 01/07/2015 | 9,295,000 | 9,295,000 | ||||||||||||||
|
| |||||||||||||||||||
| 11,295,000 | ||||||||||||||||||||
|
| |||||||||||||||||||
| Maryland – 2.0% | ||||||||||||||||||||
Maryland State Health & Higher Educational Facilities Authority, Revenue Bonds, University of Maryland Medical System, Class A, LOC: Wachovia Bank N.A.(a) | 0.060 | % | 01/07/2015 | 01/07/2015 | 3,545,000 | 3,545,000 | ||||||||||||||
Maryland State Stadium Authority Lease, Revenue Bonds, Football Stadium, SPA: Sumitomo Mitsui Banking(a) | 0.040 | % | 01/07/2015 | 01/07/2015 | 1,520,000 | 1,520,000 | ||||||||||||||
|
| |||||||||||||||||||
| 5,065,000 | ||||||||||||||||||||
|
| |||||||||||||||||||
| Massachusetts – 6.8% | ||||||||||||||||||||
Commonwealth of Massachusetts, Central Artery, GO Limited, Series B, SPA: U.S. Bank N.A.(a) | 0.020 | % | 01/02/2015 | 01/02/2015 | 4,465,000 | 4,465,000 | ||||||||||||||
Massachusetts Bay Transportation Authority, Revenue Bonds, Senior Series A-1, SPA: JP Morgan Chase Bank(a) | 0.030 | % | 01/07/2015 | 01/07/2015 | 7,900,000 | 7,900,000 | ||||||||||||||
Massachusetts Bay Transportation Authority, Revenue Bonds, Series A1, RMKT 09/30/11, INS: Government Authority, SPA: Barclays Bank PLC(a) | 0.010 | % | 01/07/2015 | 01/07/2015 | 4,835,000 | 4,835,000 | ||||||||||||||
|
| |||||||||||||||||||
| 17,200,000 | ||||||||||||||||||||
|
| |||||||||||||||||||
| Michigan – 1.2% | ||||||||||||||||||||
Michigan State University, Revenue Bonds, Series A, SPA: JP Morgan Chase Bank(a) | 0.010 | % | 01/07/2015 | 01/07/2015 | 3,000,000 | 3,000,000 | ||||||||||||||
|
| |||||||||||||||||||
See Notes to Financial Statements.
41
Table of Contents
State Street Tax Free Money Market Portfolio
Portfolio of Investments — (continued)
December 31, 2014
Name of Issuer | Interest Rate | Next Rate Reset Date | Maturity Date | Principal Amount | Value | |||||||||||||||
| VARIABLE RATE DEMAND NOTES – (continued) | ||||||||||||||||||||
| Minnesota – 0.6% | ||||||||||||||||||||
City of Minneapolis, Revenue Bonds, University Gateway Project, SPA: Wells Fargo Bank N.A.(a) | 0.040 | % | 01/07/2015 | 01/07/2015 | $ | 1,635,000 | $ | 1,635,000 | ||||||||||||
|
| |||||||||||||||||||
| Missouri – 2.4% | ||||||||||||||||||||
Missouri Development Finance Board Cultural Facilities Revenue Bonds, Nelson Gallery Foundation, Series A, SPA: Northern Trust Company(a) | 0.030 | % | 01/02/2015 | 01/02/2015 | 5,000,000 | 5,000,000 | ||||||||||||||
Missouri State Health & Educational Facilities Authority, Revenue Bonds, Washington University, Series B, SPA: Wells Fargo Bank N.A.(a) | 0.030 | % | 01/02/2015 | 01/02/2015 | 1,000,000 | 1,000,000 | ||||||||||||||
|
| |||||||||||||||||||
| 6,000,000 | ||||||||||||||||||||
|
| |||||||||||||||||||
| New Hampshire – 1.3% | ||||||||||||||||||||
New Hampshire Health & Education Facilities Authority, Revenue Bonds, Dartmouth College, SPA: JP Morgan Chase Bank(a) | 0.030 | % | 01/07/2015 | 01/07/2015 | 3,375,000 | 3,375,000 | ||||||||||||||
|
| |||||||||||||||||||
| New York – 4.7% | ||||||||||||||||||||
New York City Transitional Finance Authority, Revenue Bonds, New York City Recovery, Series 3, Subseries 3-F, SPA: Royal Bank of Canada(a) | 0.030 | % | 01/02/2015 | 01/02/2015 | 2,500,000 | 2,500,000 | ||||||||||||||
New York City Transitional Finance Authority, Revenue Bonds, New York City Recovery, Series 3, Subseries 3-H, SPA: Royal Bank of Canada(a) | 0.030 | % | 01/02/2015 | 01/02/2015 | 2,685,000 | 2,685,000 | ||||||||||||||
New York State Dormitory Authority, Revenue Bonds, Cornell University, Series A, SPA: JP Morgan Chase Bank(a) | 0.040 | % | 01/07/2015 | 01/07/2015 | 1,900,000 | 1,900,000 | ||||||||||||||
New York State Dormitory Authority, Revenue Bonds, Rockefeller University, Series A, SPA: JP Morgan Chase Bank(a) | 0.040 | % | 01/07/2015 | 01/07/2015 | 3,520,000 | 3,520,000 | ||||||||||||||
New York State Dormitory Authority, Revenue Bonds, Rockefeller University, Series B, SPA: U.S. Bank N.A.(a) | 0.040 | % | 01/07/2015 | 01/07/2015 | 1,300,000 | 1,300,000 | ||||||||||||||
|
| |||||||||||||||||||
| 11,905,000 | ||||||||||||||||||||
|
| |||||||||||||||||||
| North Carolina – 11.3% | ||||||||||||||||||||
Charlotte COPs, Convention Facility Project, Series B, SPA: Wachovia Bank N.A.(a) | 0.060 | % | 01/07/2015 | 01/07/2015 | 2,250,000 | 2,250,000 | ||||||||||||||
City of Wilmington, GO Unlimited, SPA: Wells Fargo Bank N.A.(a) | 0.020 | % | 01/07/2015 | 01/07/2015 | 900,000 | 900,000 | ||||||||||||||
County of Guilford, GO Unlimited, Series B, SPA: Wells Fargo Bank N.A.(a) | 0.030 | % | 01/07/2015 | 01/07/2015 | 8,185,000 | 8,185,000 | ||||||||||||||
See Notes to Financial Statements.
42
Table of Contents
State Street Tax Free Money Market Portfolio
Portfolio of Investments — (continued)
December 31, 2014
Name of Issuer | Interest Rate | Next Rate Reset Date | Maturity Date | Principal Amount | Value | |||||||||||||||
| VARIABLE RATE DEMAND NOTES – (continued) | ||||||||||||||||||||
| North Carolina – (continued) | ||||||||||||||||||||
County of Wake, GO Unlimited, Series B, SPA: Wells Fargo Bank N.A.(a) | 0.030 | % | 01/07/2015 | 01/07/2015 | $ | 3,100,000 | $ | 3,100,000 | ||||||||||||
County of Wake, GO Unlimited, Series C, SPA: Wells Fargo Bank N.A.(a) | 0.030 | % | 01/07/2015 | 01/07/2015 | 3,000,000 | 3,000,000 | ||||||||||||||
County of Wake, GO Unlimited, Series C, SPA: Wells Fargo Bank N.A.(a) | 0.030 | % | 01/07/2015 | 01/07/2015 | 4,100,000 | 4,100,000 | ||||||||||||||
North Carolina Medical Care Commission & Health Care facilities, Revenue Bonds, Novant Health Group, Series A, SPA: JP Morgan Chase Bank N.A.(a) | 0.060 | % | 01/07/2015 | 01/07/2015 | 7,000,000 | 7,000,000 | ||||||||||||||
|
| |||||||||||||||||||
| 28,535,000 | ||||||||||||||||||||
|
| |||||||||||||||||||
| Ohio – 3.0% | ||||||||||||||||||||
Ohio Air Quality Development Authority, Revenue Bonds, Ohio Valley Electric Corp., Series B, LOC: Bank of Nova Scotia(a) | 0.040 | % | 01/07/2015 | 01/07/2015 | 7,500,000 | 7,500,000 | ||||||||||||||
|
| |||||||||||||||||||
| Oregon – 3.4% | ||||||||||||||||||||
State of Oregon, GO Unlimited, Veterans Welfare Bonds, Series 84, SPA: Bank of Tokyo-Mitsubishi UFJ(a) | 0.020 | % | 01/07/2015 | 01/07/2015 | 7,600,000 | 7,600,000 | ||||||||||||||
State of Oregon, GO Unlimited, Veterans Welfare Bonds, Series 90-B, SPA: Bank of Tokyo-Mitsubishi UFJ(a) | 0.030 | % | 01/07/2015 | 01/07/2015 | 920,000 | 920,000 | ||||||||||||||
|
| |||||||||||||||||||
| 8,520,000 | ||||||||||||||||||||
|
| |||||||||||||||||||
| Pennsylvania – 1.5% | ||||||||||||||||||||
City of Philadelphia Water & Wastewater, Revenue Bonds, Series B, RMKT 09/10/08, LOC: TD Bank N.A.(a) | 0.030 | % | 01/07/2015 | 01/07/2015 | 3,765,000 | 3,765,000 | ||||||||||||||
|
| |||||||||||||||||||
| Rhode Island – 2.6% | ||||||||||||||||||||
Rhode Island Health & Educational Building Corp., Revenue Bonds, Bryant University, LOC: TD Bank N.A.(a) | 0.020 | % | 01/07/2015 | 01/07/2015 | 6,555,000 | 6,555,000 | ||||||||||||||
|
| |||||||||||||||||||
| South Carolina – 2.0% | ||||||||||||||||||||
City of North Charleston, Tax Increment Revenue Bonds, Charleston Naval Complex, SPA: Bank of America N.A.(a) | 0.030 | % | 01/07/2015 | 01/07/2015 | 5,055,000 | 5,055,000 | ||||||||||||||
|
| |||||||||||||||||||
| Texas – 0.8% | ||||||||||||||||||||
Harris County Health Facilities Development Corps., Revenue Bonds, Texas Children’s, Series B-1, RMKT 02/02/09, SPA: JP Morgan Chase Bank(a) | 0.030 | % | 01/07/2015 | 01/07/2015 | 2,080,000 | 2,080,000 | ||||||||||||||
|
| |||||||||||||||||||
| Utah – 1.2% | ||||||||||||||||||||
County of Utah UT, Revenue Bonds, Series B, IHC Health Services, Inc.,(a) | 0.040 | % | 01/07/2015 | 01/07/2015 | 3,100,000 | 3,100,000 | ||||||||||||||
|
| |||||||||||||||||||
See Notes to Financial Statements.
43
Table of Contents
State Street Tax Free Money Market Portfolio
Portfolio of Investments — (continued)
December 31, 2014
Name of Issuer | Interest Rate | Next Rate Reset Date | Maturity Date | Principal Amount | Value | |||||||||||||||
| VARIABLE RATE DEMAND NOTES – (continued) | ||||||||||||||||||||
| Washington – 2.6% | ||||||||||||||||||||
Washington State Housing Finance Commission, Revenue Bonds, INS: FHLMC, LOC: Bank of America N.A.(a) | 0.050 | % | 01/07/2015 | 01/07/2015 | $ | 1,605,000 | $ | 1,605,000 | ||||||||||||
Washington State Housing Finance Commission, Revenue Bonds, New Haven Apartments, INS: FNMA, LIQ: FNMA(a) | 0.050 | % | 01/07/2015 | 01/07/2015 | 5,000,000 | 5,000,000 | ||||||||||||||
|
| |||||||||||||||||||
| 6,605,000 | ||||||||||||||||||||
|
| |||||||||||||||||||
| West Virginia – 1.2% | ||||||||||||||||||||
West Virginia Economic Development Authority, Solid Waste Disposal Facilities, Appalachian Power Corp., Series B, LOC: Sumitomo Mitsui Banking(a) | 0.040 | % | 01/07/2015 | 01/07/2015 | 3,000,000 | 3,000,000 | ||||||||||||||
|
| |||||||||||||||||||
TOTAL VARIABLE RATE DEMAND NOTES | 191,385,000 | |||||||||||||||||||
|
| |||||||||||||||||||
| Shares | ||||||||||||||||||||
INVESTMENT COMPANY – 24.4% |
| |||||||||||||||||||
Dreyfus Tax Exempt Cash Management Fund Investor Shares 0.07%(b)(c) | 61,856,729 | 61,856,729 | ||||||||||||||||||
|
| |||||||||||||||||||
TOTAL INVESTMENTS(d)(e) – 100.0% | 253,241,729 | |||||||||||||||||||
Liabilities in Excess of Other Assets – (0.0)%(f) | (46,418 | ) | ||||||||||||||||||
|
| |||||||||||||||||||
NET ASSETS – 100.0% | $ | 253,195,311 | ||||||||||||||||||
|
| |||||||||||||||||||
| (a) | Variable Rate Security – Interest rate shown is rate in effect as of December 31, 2014. |
| (b) | Value determined based on Level 1 inputs established by provisions surrounding fair value measurements and disclosures |
| (c) | The rate shown is the annualized seven-day yield at period end. |
| (d) | Unless otherwise indicated, the values of the securities of the Portfolio are determined based on Level 2 inputs established by provisions surrounding fair value measurements and disclosures (Note 2). |
| (e) | Also represents the cost for federal tax purposes |
| (f) | Amount represents less than 0.05% of net assets |
Acronym | Name | |
| COP | Certificates of Participation | |
| FHA | Federal Housing Administration | |
| FHLB | Federal Home Loan Bank | |
| FHLMC | Federal Home Loan Mortgage Corp. | |
| FNMA | Federal National Mortgage Association | |
| GO | General Obligation | |
| INS | Insured | |
| LIQ | Liquidity Agreement | |
| LOC | Letter of Credit | |
| RMKT | Remarketable | |
| SPA | Standby Purchase Agreement |
See Notes to Financial Statements.
44
Table of Contents
State Street U.S. Government Money Market Portfolio
Portfolio Statistics (Unaudited)
Portfolio Composition* | December 31, 2014 | |||
Government Agency Debt | 69.4 | % | ||
Treasury Repurchase Agreements | 15.2 | |||
Treasury Debt | 8.7 | |||
Government Agency Repurchase Agreements | 1.0 | |||
Assets in Excess of Other Liabilities | 5.7 | |||
Total | 100.0 | % |
Maturity Ladder* | December 31, 2014 | |||
Overnight (1 Day) | 13.0 | % | ||
2-30 Days | 34.8 | |||
31-60 Days | 17.4 | |||
61-90 Days | 10.4 | |||
Over 90 Days | 18.7 | |||
Total | 94.3 | % | ||
Average days to maturity | 41 | |||
Weighted average life | 48 |
| * | As a percentage of net assets as of the date indicated. The Portfolio’s composition will vary over time. |
See Notes to Financial Statements.
45
Table of Contents
State Street U.S. Government Money Market Portfolio
Portfolio of Investments
December 31, 2014
Name of Issuer | Interest Rate | Next Rate Reset Date | Maturity Date | Principal Amount | Value | |||||||||||||||
| GOVERNMENT AGENCY DEBT – 69.4% | ||||||||||||||||||||
Federal Farm Credit Bank(a) | 0.102 | % | 01/15/2015 | 01/15/2015 | $ | 30,000,000 | $ | 29,998,833 | ||||||||||||
Federal Farm Credit Bank(b) | 0.103 | % | 01/05/2015 | 03/04/2015 | 111,000,000 | 110,998,970 | ||||||||||||||
Federal Farm Credit Bank(a) | 0.130 | % | 03/17/2015 | 03/17/2015 | 25,000,000 | 24,993,229 | ||||||||||||||
Federal Farm Credit Bank(a) | 0.081 | % | 04/21/2015 | 04/21/2015 | 42,000,000 | 41,989,733 | ||||||||||||||
Federal Home Loan Bank(a) | 0.046 | % | 01/07/2015 | 01/07/2015 | 132,000,000 | 131,999,010 | ||||||||||||||
Federal Home Loan Bank(a) | 0.048 | % | 01/07/2015 | 01/07/2015 | 165,000,000 | 164,998,707 | ||||||||||||||
Federal Home Loan Bank(a) | 0.051 | % | 01/07/2015 | 01/07/2015 | 28,000,000 | 27,999,767 | ||||||||||||||
Federal Home Loan Bank(a) | 0.097 | % | 01/07/2015 | 01/07/2015 | 50,000,000 | 49,999,208 | ||||||||||||||
Federal Home Loan Bank(a) | 0.100 | % | 01/07/2015 | 01/07/2015 | 46,000,000 | 45,999,249 | ||||||||||||||
Federal Home Loan Bank(a) | 0.102 | % | 01/16/2015 | 01/16/2015 | 20,000,000 | 19,999,167 | ||||||||||||||
Federal Home Loan Bank(b) | 0.109 | % | 01/20/2015 | 01/20/2015 | 212,000,000 | 211,999,455 | ||||||||||||||
Federal Home Loan Bank(a) | 0.111 | % | 01/20/2015 | 01/20/2015 | 174,000,000 | 174,000,000 | ||||||||||||||
Federal Home Loan Bank(a) | 0.063 | % | 01/21/2015 | 01/21/2015 | 125,000,000 | 124,995,694 | ||||||||||||||
Federal Home Loan Bank(a) | 0.107 | % | 01/21/2015 | 01/21/2015 | 50,000,000 | 49,997,083 | ||||||||||||||
Federal Home Loan Bank(a) | 0.102 | % | 01/23/2015 | 01/23/2015 | 40,000,000 | 39,997,556 | ||||||||||||||
Federal Home Loan Bank(a) | 0.102 | % | 01/23/2015 | 01/23/2015 | 50,000,000 | 49,996,944 | ||||||||||||||
Federal Home Loan Bank(a) | 0.080 | % | 01/26/2015 | 01/26/2015 | 5,920,000 | 5,919,671 | ||||||||||||||
Federal Home Loan Bank(a) | 0.066 | % | 01/28/2015 | 01/28/2015 | 450,000,000 | 449,978,062 | ||||||||||||||
Federal Home Loan Bank(a) | 0.069 | % | 01/28/2015 | 01/28/2015 | 87,000,000 | 86,995,628 | ||||||||||||||
Federal Home Loan Bank(a) | 0.071 | % | 01/30/2015 | 01/30/2015 | 185,000,000 | 184,989,568 | ||||||||||||||
Federal Home Loan Bank(a) | 0.102 | % | 01/30/2015 | 01/30/2015 | 102,000,000 | 101,991,783 | ||||||||||||||
Federal Home Loan Bank(a) | 0.102 | % | 01/30/2015 | 01/30/2015 | 70,000,000 | 69,994,361 | ||||||||||||||
Federal Home Loan Bank(a) | 0.092 | % | 02/06/2015 | 02/06/2015 | 125,600,000 | 125,588,696 | ||||||||||||||
Federal Home Loan Bank(a) | 0.094 | % | 02/06/2015 | 02/06/2015 | 38,000,000 | 37,996,504 | ||||||||||||||
Federal Home Loan Bank(a) | 0.102 | % | 02/06/2015 | 02/06/2015 | 160,000,000 | 159,984,000 | ||||||||||||||
Federal Home Loan Bank(a) | 0.102 | % | 02/11/2015 | 02/11/2015 | 27,900,000 | 27,896,823 | ||||||||||||||
Federal Home Loan Bank(a) | 0.098 | % | 02/13/2015 | 02/13/2015 | 233,000,000 | 232,973,283 | ||||||||||||||
Federal Home Loan Bank(a) | 0.102 | % | 02/13/2015 | 02/13/2015 | 29,000,000 | 28,996,536 | ||||||||||||||
Federal Home Loan Bank(a) | 0.100 | % | 02/18/2015 | 02/18/2015 | 50,000,000 | 49,993,467 | ||||||||||||||
Federal Home Loan Bank(a) | 0.097 | % | 02/20/2015 | 02/20/2015 | 50,000,000 | 49,993,403 | ||||||||||||||
Federal Home Loan Bank(a) | 0.099 | % | 02/25/2015 | 02/25/2015 | 193,000,000 | 192,971,398 | ||||||||||||||
Federal Home Loan Bank(a) | 0.102 | % | 02/25/2015 | 02/25/2015 | 100,000,000 | 99,984,722 | ||||||||||||||
Federal Home Loan Bank(a) | 0.107 | % | 02/25/2015 | 02/25/2015 | 160,000,000 | 159,974,333 | ||||||||||||||
Federal Home Loan Bank(a) | 0.107 | % | 03/04/2015 | 03/04/2015 | 87,000,000 | 86,983,968 | ||||||||||||||
Federal Home Loan Bank(a) | 0.108 | % | 03/05/2015 | 03/05/2015 | 156,750,000 | 156,747,793 | ||||||||||||||
Federal Home Loan Bank(b) | 0.110 | % | 03/06/2015 | 03/06/2015 | 30,000,000 | 29,999,765 | ||||||||||||||
Federal Home Loan Bank(b) | 0.128 | % | 03/18/2015 | 03/18/2015 | 125,580,000 | 125,580,675 | ||||||||||||||
Federal Home Loan Bank(a) | 0.086 | % | 04/22/2015 | 04/22/2015 | 65,000,000 | 64,982,965 | ||||||||||||||
Federal Home Loan Bank(a) | 0.091 | % | 04/24/2015 | 04/24/2015 | 168,000,000 | 167,952,540 | ||||||||||||||
Federal Home Loan Bank(a) | 0.093 | % | 04/29/2015 | 04/29/2015 | 40,650,000 | 40,637,742 | ||||||||||||||
Federal Home Loan Bank(a) | 0.095 | % | 04/29/2015 | 04/29/2015 | 36,000,000 | 35,988,908 | ||||||||||||||
See Notes to Financial Statements.
46
Table of Contents
State Street U.S. Government Money Market Portfolio
Portfolio of Investments — (continued)
December 31, 2014
Name of Issuer | Interest Rate | Next Rate Reset Date | Maturity Date | Principal Amount | Value | |||||||||||||||
| GOVERNMENT AGENCY DEBT – (continued) | ||||||||||||||||||||
Federal Home Loan Bank(a) | 0.140 | % | 06/03/2015 | 06/03/2015 | $ | 40,000,000 | $ | 39,976,540 | ||||||||||||
Federal Home Loan Bank(a) | 0.142 | % | 06/03/2015 | 06/03/2015 | 7,000,000 | 6,995,835 | ||||||||||||||
Federal Home Loan Mortgage Corp.(a) | 0.092 | % | 01/05/2015 | 01/05/2015 | 62,000,000 | 61,999,380 | ||||||||||||||
Federal Home Loan Mortgage Corp.(a) | 0.041 | % | 01/12/2015 | 01/12/2015 | 38,000,000 | 37,999,536 | ||||||||||||||
Federal Home Loan Mortgage Corp.(a) | 0.051 | % | 01/12/2015 | 01/12/2015 | 38,000,000 | 37,999,419 | ||||||||||||||
Federal Home Loan Mortgage Corp.(a) | 0.087 | % | 01/12/2015 | 01/12/2015 | 88,800,000 | 88,797,694 | ||||||||||||||
Federal Home Loan Mortgage Corp.(a) | 0.097 | % | 01/12/2015 | 01/12/2015 | 26,000,000 | 25,999,245 | ||||||||||||||
Federal Home Loan Mortgage Corp.(a) | 0.072 | % | 01/13/2015 | 01/13/2015 | 55,100,000 | 55,098,714 | ||||||||||||||
Federal Home Loan Mortgage Corp.(a) | 0.097 | % | 01/13/2015 | 01/13/2015 | 25,000,000 | 24,999,208 | ||||||||||||||
Federal Home Loan Mortgage Corp.(a) | 0.041 | % | 01/16/2015 | 01/16/2015 | 27,000,000 | 26,999,550 | ||||||||||||||
Federal Home Loan Mortgage Corp.(a) | 0.087 | % | 01/16/2015 | 01/16/2015 | 19,900,000 | 19,899,295 | ||||||||||||||
Federal Home Loan Mortgage Corp.(a) | 0.092 | % | 01/22/2015 | 01/22/2015 | 137,000,000 | 136,992,807 | ||||||||||||||
Federal Home Loan Mortgage Corp.(a) | 0.092 | % | 01/23/2015 | 01/23/2015 | 113,000,000 | 112,993,785 | ||||||||||||||
Federal Home Loan Mortgage Corp.(a) | 0.041 | % | 01/28/2015 | 01/28/2015 | 151,000,000 | 150,995,470 | ||||||||||||||
Federal Home Loan Mortgage Corp.(a) | 0.071 | % | 01/28/2015 | 01/28/2015 | 18,900,000 | 18,899,008 | ||||||||||||||
Federal Home Loan Mortgage Corp.(a) | 0.092 | % | 02/02/2015 | 02/02/2015 | 38,000,000 | 37,996,960 | ||||||||||||||
Federal Home Loan Mortgage Corp.(a) | 0.090 | % | 02/03/2015 | 02/03/2015 | 99,750,000 | 99,741,771 | ||||||||||||||
Federal Home Loan Mortgage Corp.(a) | 0.087 | % | 02/04/2015 | 02/04/2015 | 103,750,000 | 103,741,671 | ||||||||||||||
Federal Home Loan Mortgage Corp.(a) | 0.103 | % | 02/10/2015 | 02/10/2015 | 31,112,000 | 31,108,543 | ||||||||||||||
Federal Home Loan Mortgage Corp.(a) | 0.091 | % | 03/02/2015 | 03/02/2015 | 187,000,000 | 186,971,950 | ||||||||||||||
Federal Home Loan Mortgage Corp.(a) | 0.076 | % | 03/03/2015 | 03/03/2015 | 195,000,000 | 195,076,931 | ||||||||||||||
Federal Home Loan Mortgage Corp.(a) | 0.096 | % | 03/05/2015 | 03/05/2015 | 50,000,000 | 49,991,688 | ||||||||||||||
Federal Home Loan Mortgage Corp.(a) | 0.085 | % | 03/09/2015 | 03/09/2015 | 70,000,000 | 69,988,926 | ||||||||||||||
Federal Home Loan Mortgage Corp.(a) | 0.055 | % | 03/12/2015 | 03/12/2015 | 51,000,000 | 50,994,546 | ||||||||||||||
Federal Home Loan Mortgage Corp.(a) | 0.095 | % | 03/16/2015 | 03/16/2015 | 84,000,000 | 83,983,597 | ||||||||||||||
Federal Home Loan Mortgage Corp.(a) | 0.070 | % | 03/25/2015 | 03/25/2015 | 110,000,000 | 109,982,247 | ||||||||||||||
Federal Home Loan Mortgage Corp.(a) | 0.071 | % | 04/01/2015 | 04/01/2015 | 173,000,000 | 172,969,725 | ||||||||||||||
Federal Home Loan Mortgage Corp.(a) | 0.111 | % | 04/13/2015 | 04/13/2015 | 195,000,000 | 194,939,225 | ||||||||||||||
Federal Home Loan Mortgage Corp.(a) | 0.096 | % | 04/14/2015 | 04/14/2015 | 100,000,000 | 99,972,819 | ||||||||||||||
Federal Home Loan Mortgage Corp.(a) | 0.096 | % | 04/24/2015 | 04/24/2015 | 100,000,000 | 99,970,181 | ||||||||||||||
Federal Home Loan Mortgage Corp.(a) | 0.101 | % | 04/24/2015 | 04/24/2015 | 75,700,000 | 75,676,239 | ||||||||||||||
Federal Home Loan Mortgage Corp.(a) | 0.101 | % | 05/05/2015 | 05/05/2015 | 61,400,000 | 61,378,851 | ||||||||||||||
Federal Home Loan Mortgage Corp.(a) | 0.091 | % | 05/08/2015 | 05/08/2015 | 125,000,000 | 124,960,312 | ||||||||||||||
Federal Home Loan Mortgage Corp.(a) | 0.111 | % | 05/11/2015 | 05/11/2015 | 18,182,000 | 18,174,778 | ||||||||||||||
Federal Home Loan Mortgage Corp.(a) | 0.111 | % | 05/26/2015 | 05/26/2015 | 78,000,000 | 77,965,442 | ||||||||||||||
Federal Home Loan Mortgage Corp.(a) | 0.132 | % | 06/08/2015 | 06/08/2015 | 67,500,000 | 67,461,487 | ||||||||||||||
Federal Home Loan Mortgage Corp.(a) | 0.133 | % | 06/08/2015 | 06/08/2015 | 70,000,000 | 69,959,754 | ||||||||||||||
Federal Home Loan Mortgage Corp.(a) | 0.150 | % | 06/15/2015 | 06/15/2015 | 84,000,000 | 83,943,020 | ||||||||||||||
Federal Home Loan Mortgage Corp.(a) | 0.152 | % | 06/15/2015 | 06/15/2015 | 20,000,000 | 19,986,250 | ||||||||||||||
Federal National Mortgage Assoc.(a) | 0.072 | % | 01/05/2015 | 01/05/2015 | 27,000,000 | 26,999,790 | ||||||||||||||
Federal National Mortgage Assoc.(a) | 0.051 | % | 01/07/2015 | 01/07/2015 | 9,000,000 | 8,999,925 | ||||||||||||||
See Notes to Financial Statements.
47
Table of Contents
State Street U.S. Government Money Market Portfolio
Portfolio of Investments — (continued)
December 31, 2014
Name of Issuer | Interest Rate | Next Rate Reset Date | Maturity Date | Principal Amount | Value | |||||||||||||||
| GOVERNMENT AGENCY DEBT – (continued) | ||||||||||||||||||||
Federal National Mortgage Assoc.(a) | 0.087 | % | 01/07/2015 | 01/07/2015 | $ | 112,875,000 | $ | 112,873,401 | ||||||||||||
Federal National Mortgage Assoc.(a) | 0.072 | % | 01/12/2015 | 01/12/2015 | 62,330,000 | 62,328,667 | ||||||||||||||
Federal National Mortgage Assoc.(a) | 0.097 | % | 01/14/2015 | 01/14/2015 | 142,000,000 | 141,995,129 | ||||||||||||||
Federal National Mortgage Assoc.(a) | 0.097 | % | 01/21/2015 | 01/21/2015 | 25,000,000 | 24,998,681 | ||||||||||||||
Federal National Mortgage Assoc.(a) | 0.046 | % | 02/02/2015 | 02/02/2015 | 92,000,000 | 91,996,320 | ||||||||||||||
Federal National Mortgage Assoc.(a) | 0.092 | % | 02/02/2015 | 02/02/2015 | 38,000,000 | 37,996,960 | ||||||||||||||
Federal National Mortgage Assoc.(a) | 0.097 | % | 02/02/2015 | 02/02/2015 | 156,000,000 | 155,986,827 | ||||||||||||||
Federal National Mortgage Assoc.(a) | 0.092 | % | 02/03/2015 | 02/03/2015 | 155,000,000 | 154,987,212 | ||||||||||||||
Federal National Mortgage Assoc.(a) | 0.097 | % | 02/04/2015 | 02/04/2015 | 75,000,000 | 74,993,271 | ||||||||||||||
Federal National Mortgage Assoc.(a) | 0.094 | % | 02/11/2015 | 02/11/2015 | 54,000,000 | 53,994,373 | ||||||||||||||
Federal National Mortgage Assoc.(a) | 0.095 | % | 02/11/2015 | 02/11/2015 | 13,000,000 | 12,998,623 | ||||||||||||||
Federal National Mortgage Assoc.(a) | 0.046 | % | 02/17/2015 | 02/17/2015 | 81,000,000 | 80,995,241 | ||||||||||||||
Federal National Mortgage Assoc.(a) | 0.102 | % | 02/18/2015 | 02/18/2015 | 50,000,000 | 49,993,333 | ||||||||||||||
Federal National Mortgage Assoc.(a) | 0.077 | % | 02/25/2015 | 02/25/2015 | 58,333,000 | 58,326,316 | ||||||||||||||
Federal National Mortgage Assoc.(a) | 0.051 | % | 02/26/2015 | 02/26/2015 | 61,000,000 | 60,995,256 | ||||||||||||||
Federal National Mortgage Assoc.(b) | 0.140 | % | 01/27/2015 | 02/27/2015 | 25,000,000 | 25,000,991 | ||||||||||||||
Federal National Mortgage Assoc.(a) | 0.110 | % | 03/18/2015 | 03/18/2015 | 94,000,000 | 93,978,171 | ||||||||||||||
Federal National Mortgage Assoc.(a) | 0.086 | % | 04/01/2015 | 04/01/2015 | 157,000,000 | 156,966,637 | ||||||||||||||
Federal National Mortgage Assoc.(a) | 0.091 | % | 04/02/2015 | 04/02/2015 | 25,000,000 | 24,994,313 | ||||||||||||||
Federal National Mortgage Assoc.(a) | 0.064 | % | 04/15/2015 | 04/15/2015 | 120,000,000 | 119,978,160 | ||||||||||||||
Federal National Mortgage Assoc.(a) | 0.096 | % | 04/16/2015 | 04/16/2015 | 100,000,000 | 99,972,292 | ||||||||||||||
Federal National Mortgage Assoc.(a) | 0.071 | % | 04/27/2015 | 04/27/2015 | 84,000,000 | 83,981,053 | ||||||||||||||
Federal National Mortgage Assoc.(a) | 0.096 | % | 04/27/2015 | 04/27/2015 | 45,000,000 | 44,986,225 | ||||||||||||||
Federal National Mortgage Assoc.(a) | 0.111 | % | 05/13/2015 | 05/13/2015 | 15,000,000 | 14,993,950 | ||||||||||||||
Federal National Mortgage Assoc.(a) | 0.111 | % | 05/27/2015 | 05/27/2015 | 32,353,000 | 32,338,567 | ||||||||||||||
Federal National Mortgage Assoc.(a) | 0.132 | % | 06/03/2015 | 06/03/2015 | 25,000,000 | 24,986,188 | ||||||||||||||
Federal National Mortgage Assoc.(a) | 0.142 | % | 06/10/2015 | 06/10/2015 | 121,750,000 | 121,674,244 | ||||||||||||||
|
| |||||||||||||||||||
TOTAL GOVERNMENT AGENCY DEBT |
| 9,163,951,714 | ||||||||||||||||||
|
| |||||||||||||||||||
| TREASURY DEBT – 8.7% | ||||||||||||||||||||
U.S. Treasury Bill(a) | 0.025 | % | 01/02/2015 | 01/02/2015 | 125,000,000 | 124,999,913 | ||||||||||||||
U.S. Treasury Bill(a) | 0.018 | % | 01/08/2015 | 01/08/2015 | 154,000,000 | 153,999,476 | ||||||||||||||
U.S. Treasury Bill(a) | 0.020 | % | 01/08/2015 | 01/08/2015 | 96,000,000 | 95,999,627 | ||||||||||||||
U.S. Treasury Bill(a) | 0.033 | % | 01/08/2015 | 01/08/2015 | 75,000,000 | 74,999,526 | ||||||||||||||
U.S. Treasury Bill(a) | 0.035 | % | 01/08/2015 | 01/08/2015 | 125,000,000 | 124,999,149 | ||||||||||||||
U.S. Treasury Bill(a) | 0.008 | % | 01/15/2015 | 01/15/2015 | 158,400,000 | 158,399,538 | ||||||||||||||
U.S. Treasury Bill(a) | 0.010 | % | 01/15/2015 | 01/15/2015 | 41,000,000 | 40,999,841 | ||||||||||||||
U.S. Treasury Bill(a) | 0.020 | % | 01/22/2015 | 01/22/2015 | 200,000,000 | 199,997,667 | ||||||||||||||
U.S. Treasury Note(b) | 0.100 | % | 01/01/2015 | 01/31/2016 | 143,000,000 | 142,962,318 | ||||||||||||||
U.S. Treasury Note(b) | 0.108 | % | 01/01/2015 | 10/31/2016 | 34,000,000 | 33,964,040 | ||||||||||||||
|
| |||||||||||||||||||
TOTAL TREASURY DEBT | 1,151,321,095 | |||||||||||||||||||
|
| |||||||||||||||||||
See Notes to Financial Statements.
48
Table of Contents
State Street U.S. Government Money Market Portfolio
Portfolio of Investments — (continued)
December 31, 2014
Name of Issuer | Interest Rate | Next Rate Reset Date | Maturity Date | Principal Amount | Value | |||||||||||||||
| GOVERNMENT AGENCY REPURCHASE AGREEMENTS – 1.0% | ||||||||||||||||||||
Agreement with BNP Paribas Securities Corp. and The Bank of New York Mellon (Tri-Party), dated 12/31/2014 (collateralized by a Federal Home Loan Bank, 0.000% due 08/28/2017, and a U.S. Treasury Note, 2.375% due 08/15/2024, valued at $61,200,063); expected proceeds $60,000,167 | 0.050 | % | 01/02/2015 | 01/02/2015 | $ | 60,000,000 | $ | 60,000,000 | ||||||||||||
Agreement with Citigroup Global Markets, Inc. and The Bank of New York Mellon (Tri-Party), dated 12/31/2014 (collateralized by a Federal Farm Credit Bank, 0.131% due 06/16/2015, Federal Home Loan Banks, 0.000% – 2.000% due 12/18/2019 – 04/10/2028, Federal Home Loan Mortgage Corporations, 0.000% – 1.750% due 05/30/2019 – 08/27/2029, a Federal National Mortgage Association, 2.660% due 09/06/2023, Resolution Funding Strips, 0.000% due 07/15/2026 – 04/15/2028, a RFCSP Strip Principal, 0.000% due 01/15/2030, and U.S. Treasury Notes, 2.000% – 2.250% due 03/31/2016 – 11/30/2020, valued at $54,060,017); expected proceeds $53,000,177 | 0.060 | % | 01/02/2015 | 01/02/2015 | 53,000,000 | 53,000,000 | ||||||||||||||
Agreement with Societe Generale and The Bank of New York Mellon (Tri-Party), dated 12/31/2014 (collateralized by Federal Farm Credit Banks, 0.940% – 1.100% due 08/22/2017 – 11/13/2017, and a Federal Home Loan Bank, 0.625% due 10/24/2016, valued at $25,503,330); expected proceeds $25,000,111 | 0.080 | % | 01/02/2015 | 01/02/2015 | 25,000,000 | 25,000,000 | ||||||||||||||
|
| |||||||||||||||||||
TOTAL GOVERNMENT AGENCY REPURCHASE AGREEMENTS |
| 138,000,000 | ||||||||||||||||||
|
| |||||||||||||||||||
| TREASURY REPURCHASE AGREEMENTS – 15.2% | ||||||||||||||||||||
Agreement with Barclays Capital, Inc. and The Bank of New York Mellon (Tri-Party), dated 12/31/2014 (collateralized by a U.S. Treasury Bond, 3.750% due 11/15/2043, and U.S. Treasury Notes, 2.000% – 3.625% due 08/15/2019 – 02/28/2021, valued at $306,000,026); expected proceeds $300,001,000 | 0.060 | % | 01/02/2015 | 01/02/2015 | 300,000,000 | 300,000,000 | ||||||||||||||
See Notes to Financial Statements.
49
Table of Contents
State Street U.S. Government Money Market Portfolio
Portfolio of Investments — (continued)
December 31, 2014
Name of Issuer | Interest Rate | Next Rate Reset Date | Maturity Date | Principal Amount | Value | |||||||||||||||
| TREASURY REPURCHASE AGREEMENTS – (continued) | ||||||||||||||||||||
Agreement with Barclays Capital, Inc. and The Bank of New York Mellon (Tri-Party), dated 12/31/2014 (collateralized by U.S. Treasury Bonds, 2.750% – 4.250% due 05/15/2039 – 08/15/2042, and a U.S. Treasury Note, 1.375% due 06/30/2018, valued at $357,000,044); expected proceeds $350,002,722 | 0.040 | % | 01/07/2015 | 01/07/2015 | $ | 350,000,000 | $ | 350,000,000 | ||||||||||||
Agreement with BNP Paribas Securities Corp. and The Bank of New York Mellon (Tri-Party), dated 12/31/2014 (collateralized by U.S. Treasury Notes, 0.375% – 1.750% due 03/31/2016 – 04/30/2019, valued at $150,960,140); expected proceeds $148,000,411 | 0.050 | % | 01/02/2015 | 01/02/2015 | 148,000,000 | 148,000,000 | ||||||||||||||
Agreement with Citigroup Global Markets, Inc. and The Bank of New York Mellon (Tri-Party), dated 12/31/2014 (collateralized by U.S. Treasury Notes, 0.500% – 1.000% due 06/30/2016 – 09/15/2017, valued at $53,040,047); expected proceeds $52,000,144 | 0.050 | % | 01/02/2015 | 01/02/2015 | 52,000,000 | 52,000,000 | ||||||||||||||
Agreement with Credit Agricole Corporate and Investment Bank and The Bank of New York Mellon (Tri-Party), dated 12/31/2014 (collateralized by a U.S. Treasury Bill, 0.000% due 04/02/2015, U.S. Treasury Bonds 3.125% – 5.375% due 02/15/2029 – 08/15/2044, and U.S. Treasury Notes, 1.625% – 4.000% due 08/31/2017 – 11/15/2022, valued at $357,000,035); expected proceeds $350,000,972 | 0.050 | % | 01/02/2015 | 01/02/2015 | 350,000,000 | 350,000,000 | ||||||||||||||
Agreement with Credit Agricole Corporate and Investment Bank and The Bank of New York Mellon (Tri-Party), dated 12/31/2014 (collateralized by a U.S. Treasury Bond, 0.125% due 04/15/2019, valued at $178,500,060); expected proceeds $175,000,583 | 0.060 | % | 01/02/2015 | 01/02/2015 | 175,000,000 | 175,000,000 | ||||||||||||||
Agreement with HSBC Securities USA, Inc. and JP Morgan Chase & Co. (Tri-Party), dated 12/31/2014 (collateralized by U.S. Treasury Strips, 0.000% due 05/15/2018 – 11/15/2024, valued at $204,002,778); expected proceeds $200,002,333 | 0.060 | % | 01/07/2015 | 01/07/2015 | 200,000,000 | 200,000,000 | ||||||||||||||
Agreement with JP Morgan Securities, Inc. and JP Morgan Chase & Co. (Tri-Party), dated 12/31/2014 (collateralized by U.S. Treasury Bonds, 3.000% – 3.125% due 05/15/2042 – 02/15/2043, and U.S. Treasury Notes, 0.875% – 4.250% due 08/15/2015 – 11/15/2024, valued at $34,684,057); expected proceeds $34,000,170 | 0.090 | % | 01/02/2015 | 01/02/2015 | 34,000,000 | 34,000,000 | ||||||||||||||
See Notes to Financial Statements.
50
Table of Contents
State Street U.S. Government Money Market Portfolio
Portfolio of Investments — (continued)
December 31, 2014
Name of Issuer | Interest Rate | Next Rate Reset Date | Maturity Date | Principal Amount | Value | |||||||||||||||
| TREASURY REPURCHASE AGREEMENTS – (continued) | ||||||||||||||||||||
Agreement with Merrill Lynch Government Securities, Inc. and The Bank of New York Mellon (Tri-Party), dated 12/31/2014 (collateralized by U.S. Treasury Notes, 0.500% – 1.000% due 08/31/2016 – 10/31/2016, valued at $102,000,022); expected proceeds $100,000,278 | 0.050 | % | 01/02/2015 | 01/02/2015 | $ | 100,000,000 | $ | 100,000,000 | ||||||||||||
Agreement with Societe Generale and The Bank of New York Mellon (Tri-Party), dated 12/31/2014 (collateralized by U.S. Treasury Bonds, 2.750% – 3.750% due 11/15/2042 – 11/15/2043, U.S. Treasury Notes, 0.250% – 2.125% due 01/31/2015 – 11/15/2022, and a U.S. Treasury Strip, 0.000% due 05/15/2024, valued at $299,880,056); expected proceeds $294,001,143 | 0.070 | % | 01/02/2015 | 01/02/2015 | 294,000,000 | 294,000,000 | ||||||||||||||
|
| |||||||||||||||||||
TOTAL TREASURY REPURCHASE AGREEMENTS |
| 2,003,000,000 | ||||||||||||||||||
|
| |||||||||||||||||||
TOTAL INVESTMENTS(c)(d) – 94.3% |
| 12,456,272,809 | ||||||||||||||||||
Assets in Excess of Other Liabilities – 5.7% |
| 751,594,796 | ||||||||||||||||||
|
| |||||||||||||||||||
NET ASSETS – 100.0% |
| $ | 13,207,867,605 | |||||||||||||||||
|
| |||||||||||||||||||
| (a) | Rate represents annualized yield at date of purchase |
| (b) | Variable Rate Security – Interest rate shown is rate in effect at December 31, 2014 |
| (c) | Unless otherwise indicated, the values of the securities of the Portfolio are determined based on Level 2 inputs established by provisions surrounding fair value measurements and disclosures (Note 2). |
| (d) | Also represents the cost for federal tax purposes |
See Notes to Financial Statements.
51
Table of Contents
State Street Treasury Money Market Portfolio
Portfolio Statistics (Unaudited)
Portfolio Composition* | December 31, 2014 | |||
Treasury Debt | 105.4 | % | ||
Liabilities in Excess of Other Assets | (5.4 | ) | ||
Total | 100.0 | % |
Maturity Ladder* | December 31, 2014 | |||
Overnight (1 Day) | 4.7 | % | ||
2-30 Days | 50.3 | |||
31-60 Days | 32.3 | |||
61-90 Days | 10.8 | |||
Over 90 Days | 7.3 | |||
Total | 105.4 | % | ||
Average days to maturity | 35 | |||
Weighted average life | 43 |
| * | As a percentage of net assets as of the date indicated. The Portfolio’s composition will vary over time. |
See Notes to Financial Statements.
52
Table of Contents
State Street Treasury Money Market Portfolio
Portfolio of Investments
December 31, 2014
Name of Issuer | Interest Rate | Next Rate Reset Date | Maturity Date | Principal Amount | Value | |||||||||||||||
| TREASURY DEBT – 105.4% | ||||||||||||||||||||
U.S. Treasury Bill(a) | 0.025 | % | 01/02/2015 | 01/02/2015 | $ | 95,000,000 | $ | 94,999,974 | ||||||||||||
U.S. Treasury Bill(a) | 0.025 | % | 01/02/2015 | 01/02/2015 | 25,030,000 | 25,029,991 | ||||||||||||||
U.S. Treasury Bill(a) | 0.025 | % | 01/02/2015 | 01/02/2015 | 3,410,000 | 3,409,998 | ||||||||||||||
U.S. Treasury Bill(a) | 0.025 | % | 01/02/2015 | 01/02/2015 | 354,357,000 | 354,356,754 | ||||||||||||||
U.S. Treasury Bill(a) | 0.001 | % | 01/08/2015 | 01/08/2015 | 137,491,000 | 137,490,973 | ||||||||||||||
U.S. Treasury Bill(a) | 0.003 | % | 01/08/2015 | 01/08/2015 | 100,000,000 | 99,999,951 | ||||||||||||||
U.S. Treasury Bill(a) | 0.005 | % | 01/08/2015 | 01/08/2015 | 80,000,000 | 79,999,922 | ||||||||||||||
U.S. Treasury Bill(a) | 0.006 | % | 01/08/2015 | 01/08/2015 | 150,000,000 | 149,999,825 | ||||||||||||||
U.S. Treasury Bill(a) | 0.010 | % | 01/08/2015 | 01/08/2015 | 130,000,000 | 129,999,747 | ||||||||||||||
U.S. Treasury Bill(a) | 0.018 | % | 01/08/2015 | 01/08/2015 | 372,000,000 | 371,998,734 | ||||||||||||||
U.S. Treasury Bill(a) | 0.020 | % | 01/08/2015 | 01/08/2015 | 233,000,000 | 232,999,094 | ||||||||||||||
U.S. Treasury Bill(a) | 0.061 | % | 01/08/2015 | 01/08/2015 | 19,411,000 | 19,410,770 | ||||||||||||||
U.S. Treasury Bill(a) | 0.008 | % | 01/15/2015 | 01/15/2015 | 557,000,000 | 556,998,375 | ||||||||||||||
U.S. Treasury Bill(a) | 0.010 | % | 01/15/2015 | 01/15/2015 | 294,000,000 | 293,998,857 | ||||||||||||||
U.S. Treasury Bill(a) | 0.017 | % | 01/15/2015 | 01/15/2015 | 100,000,000 | 99,999,319 | ||||||||||||||
U.S. Treasury Bill(a) | 0.020 | % | 01/15/2015 | 01/15/2015 | 409,000,000 | 408,996,819 | ||||||||||||||
U.S. Treasury Bill(a) | 0.005 | % | 01/22/2015 | 01/22/2015 | 250,000,000 | 249,999,271 | ||||||||||||||
U.S. Treasury Bill(a) | 0.013 | % | 01/22/2015 | 01/22/2015 | 250,000,000 | 249,998,177 | ||||||||||||||
U.S. Treasury Bill(a) | 0.017 | % | 01/22/2015 | 01/22/2015 | 125,000,000 | 124,998,724 | ||||||||||||||
U.S. Treasury Bill(a) | 0.020 | % | 01/22/2015 | 01/22/2015 | 701,000,000 | 700,991,822 | ||||||||||||||
U.S. Treasury Bill(a) | 0.060 | % | 01/22/2015 | 01/22/2015 | 200,000,000 | 199,993,000 | ||||||||||||||
U.S. Treasury Bill(a) | 0.015 | % | 01/29/2015 | 01/29/2015 | 450,000,000 | 449,994,938 | ||||||||||||||
U.S. Treasury Bill(a) | 0.020 | % | 01/29/2015 | 01/29/2015 | 400,000,000 | 399,993,778 | ||||||||||||||
U.S. Treasury Bill(a) | 0.060 | % | 01/29/2015 | 01/29/2015 | 200,000,000 | 199,990,667 | ||||||||||||||
U.S. Treasury Bill(a) | 0.010 | % | 02/05/2015 | 02/05/2015 | 115,000,000 | 114,998,882 | ||||||||||||||
U.S. Treasury Bill(a) | 0.020 | % | 02/05/2015 | 02/05/2015 | 600,000,000 | 599,988,333 | ||||||||||||||
U.S. Treasury Bill(a) | 0.051 | % | 02/05/2015 | 02/05/2015 | 200,000,000 | 199,990,083 | ||||||||||||||
U.S. Treasury Bill(a) | 0.030 | % | 02/12/2015 | 02/12/2015 | 600,000,000 | 599,979,000 | ||||||||||||||
U.S. Treasury Bill(a) | 0.048 | % | 02/12/2015 | 02/12/2015 | 100,000,000 | 99,994,458 | ||||||||||||||
U.S. Treasury Bill(a) | 0.028 | % | 02/19/2015 | 02/19/2015 | 639,000,000 | 638,976,082 | ||||||||||||||
U.S. Treasury Bill(a) | 0.053 | % | 02/19/2015 | 02/19/2015 | 138,000,000 | 137,990,139 | ||||||||||||||
U.S. Treasury Bill(a) | 0.055 | % | 02/19/2015 | 02/19/2015 | 87,000,000 | 86,993,487 | ||||||||||||||
U.S. Treasury Bill(a) | 0.017 | % | 02/26/2015 | 02/26/2015 | 625,000,000 | 624,982,986 | ||||||||||||||
U.S. Treasury Bill(a) | 0.048 | % | 02/26/2015 | 02/26/2015 | 200,000,000 | 199,985,222 | ||||||||||||||
U.S. Treasury Bill(a) | 0.027 | % | 03/05/2015 | 03/05/2015 | 155,000,000 | 154,992,676 | ||||||||||||||
U.S. Treasury Bill(a) | 0.050 | % | 03/05/2015 | 03/05/2015 | 200,000,000 | 199,982,500 | ||||||||||||||
U.S. Treasury Bill(a) | 0.048 | % | 03/12/2015 | 03/12/2015 | 105,000,000 | 104,990,302 | ||||||||||||||
U.S. Treasury Bill(a) | 0.042 | % | 03/19/2015 | 03/19/2015 | 100,000,000 | 99,990,910 | ||||||||||||||
U.S. Treasury Bill(a) | 0.046 | % | 03/19/2015 | 03/19/2015 | 150,000,000 | 149,985,241 | ||||||||||||||
U.S. Treasury Bill(a) | 0.042 | % | 03/26/2015 | 03/26/2015 | 200,000,000 | 199,980,167 | ||||||||||||||
U.S. Treasury Bill(a) | 0.037 | % | 04/02/2015 | 04/02/2015 | 100,000,000 | 99,990,521 | ||||||||||||||
See Notes to Financial Statements.
53
Table of Contents
State Street Treasury Money Market Portfolio
Portfolio of Investments — (continued)
December 31, 2014
Name of Issuer | Interest Rate | Next Rate Reset Date | Maturity Date | Principal Amount | Value | |||||||||||||||
| TREASURY DEBT – (continued) | ||||||||||||||||||||
U.S. Treasury Bill(a) | 0.040 | % | 04/02/2015 | 04/02/2015 | $ | 375,000,000 | $ | 374,962,500 | ||||||||||||
U.S. Treasury Bill(a) | 0.045 | % | 04/09/2015 | 04/09/2015 | 50,000,000 | 49,993,875 | ||||||||||||||
U.S. Treasury Note(b) | 0.100 | % | 01/01/2015 | 01/31/2016 | 193,000,000 | 192,950,122 | ||||||||||||||
U.S. Treasury Note(b) | 0.108 | % | 01/01/2015 | 10/31/2016 | 30,000,000 | 29,968,271 | ||||||||||||||
U.S. Treasury Note(a) | 0.061 | % | 03/31/2015 | 03/31/2015 | 200,000,000 | 200,092,556 | ||||||||||||||
|
| |||||||||||||||||||
TOTAL TREASURY DEBT | 10,797,407,793 | |||||||||||||||||||
|
| |||||||||||||||||||
TOTAL INVESTMENTS(c)(d) – 105.4% |
| 10,797,407,793 | ||||||||||||||||||
Liabilities in Excess of Other Assets – (5.4)% |
| (549,947,502 | ) | |||||||||||||||||
|
| |||||||||||||||||||
NET ASSETS – 100.0% |
| $ | 10,247,460,291 | |||||||||||||||||
|
| |||||||||||||||||||
| (a) | Rate represents annualized yield at date of purchase |
| (b) | Variable Rate Security – Interest rate shown is rate in effect at December 31, 2014 |
| (c) | Unless otherwise indicated, the values of the securities of the Portfolio are determined based on Level 2 inputs established by provisions surrounding fair value measurements and disclosures (Note 2). |
| (d) | Also represents the cost for federal tax purposes |
See Notes to Financial Statements.
54
Table of Contents
State Street Treasury Plus Money Market Portfolio
Portfolio Statistics (Unaudited)
Portfolio Composition* | December 31, 2014 | |||
Treasury Debt | 77.6 | % | ||
Treasury Repurchase Agreements | 16.9 | |||
Assets in Excess of Other Liabilities | 5.5 | |||
Total | 100.0 | % |
Maturity Ladder* | December 31, 2014 | |||
Overnight (1 Day) | 26.9 | % | ||
2-30 Days | 38.7 | |||
31-60 Days | 15.2 | |||
61-90 Days | 8.1 | |||
Over 90 Days | 5.6 | |||
Total | 94.5 | % | ||
Average days to maturity | 24 | |||
Weighted average life | 32 |
| * | As a percentage of net assets as of the date indicated. The Portfolio’s composition will vary over time. |
See Notes to Financial Statements.
55
Table of Contents
State Street Treasury Plus Money Market Portfolio
Portfolio of Investments
December 31, 2014
Name of Issuer | Interest Rate | Next Rate Reset Date | Maturity Date | Principal Amount | Value | |||||||||||||||
| TREASURY DEBT – 77.6% | ||||||||||||||||||||
U.S. Treasury Bill(a) | 0.010 | % | 01/02/2015 | 01/02/2015 | $ | 50,000,000 | $ | 49,999,986 | ||||||||||||
U.S. Treasury Bill(a) | 0.011 | % | 01/02/2015 | 01/02/2015 | 25,000,000 | 24,999,992 | ||||||||||||||
U.S. Treasury Bill(a) | 0.012 | % | 01/02/2015 | 01/02/2015 | 50,000,000 | 49,999,983 | ||||||||||||||
U.S. Treasury Bill(a) | 0.020 | % | 01/02/2015 | 01/02/2015 | 25,000,000 | 24,999,986 | ||||||||||||||
U.S. Treasury Bill(a) | 0.025 | % | 01/02/2015 | 01/02/2015 | 25,000,000 | 24,999,983 | ||||||||||||||
U.S. Treasury Bill (a) | 0.063 | % | 01/02/2015 | 01/02/2015 | 100,000,000 | 99,999,826 | ||||||||||||||
U.S. Treasury Bill(a) | 0.017 | % | 01/08/2015 | 01/08/2015 | 77,000,000 | 76,999,738 | ||||||||||||||
U.S. Treasury Bill (a) | 0.020 | % | 01/08/2015 | 01/08/2015 | 48,000,000 | 47,999,813 | ||||||||||||||
U.S. Treasury Bill(a) | 0.061 | % | 01/08/2015 | 01/08/2015 | 100,000,000 | 99,998,814 | ||||||||||||||
U.S. Treasury Bill(a) | 0.007 | % | 01/15/2015 | 01/15/2015 | 147,000,000 | 146,999,571 | ||||||||||||||
U.S. Treasury Bill(a) | 0.010 | % | 01/15/2015 | 01/15/2015 | 38,000,000 | 37,999,852 | ||||||||||||||
U.S. Treasury Bill(a) | 0.020 | % | 01/15/2015 | 01/15/2015 | 55,000,000 | 54,999,572 | ||||||||||||||
U.S. Treasury Bill(a) | 0.060 | % | 01/15/2015 | 01/15/2015 | 100,000,000 | 99,997,667 | ||||||||||||||
U.S. Treasury Bill(a) | 0.020 | % | 01/22/2015 | 01/22/2015 | 175,000,000 | 174,997,958 | ||||||||||||||
U.S. Treasury Bill(a) | 0.060 | % | 01/22/2015 | 01/22/2015 | 100,000,000 | 99,996,500 | ||||||||||||||
U.S. Treasury Bill(a) | 0.020 | % | 01/29/2015 | 01/29/2015 | 131,000,000 | 130,997,962 | ||||||||||||||
U.S. Treasury Bill(a) | 0.060 | % | 01/29/2015 | 01/29/2015 | 100,000,000 | 99,995,333 | ||||||||||||||
U.S. Treasury Bill(a) | 0.020 | % | 02/05/2015 | 02/05/2015 | 75,000,000 | 74,998,542 | ||||||||||||||
U.S. Treasury Bill(a) | 0.051 | % | 02/05/2015 | 02/05/2015 | 50,000,000 | 49,997,521 | ||||||||||||||
U.S. Treasury Bill(a) | 0.048 | % | 02/12/2015 | 02/12/2015 | 50,000,000 | 49,997,229 | ||||||||||||||
U.S. Treasury Bill(a) | 0.028 | % | 02/19/2015 | 02/19/2015 | 75,000,000 | 74,997,193 | ||||||||||||||
U.S. Treasury Bill(a) | 0.053 | % | 02/19/2015 | 02/19/2015 | 30,000,000 | 29,997,856 | ||||||||||||||
U.S. Treasury Bill(a) | 0.055 | % | 02/19/2015 | 02/19/2015 | 20,000,000 | 19,998,503 | ||||||||||||||
U.S. Treasury Bill(a) | 0.017 | % | 02/26/2015 | 02/26/2015 | 100,000,000 | 99,997,278 | ||||||||||||||
U.S. Treasury Bill(a) | 0.048 | % | 02/26/2015 | 02/26/2015 | 20,000,000 | 19,998,522 | ||||||||||||||
U.S. Treasury Bill(a) | 0.050 | % | 03/05/2015 | 03/05/2015 | 75,000,000 | 74,993,438 | ||||||||||||||
U.S. Treasury Bill(a) | 0.048 | % | 03/12/2015 | 03/12/2015 | 50,000,000 | 49,995,382 | ||||||||||||||
U.S. Treasury Bill(a) | 0.046 | % | 03/19/2015 | 03/19/2015 | 50,000,000 | 49,995,080 | ||||||||||||||
U.S. Treasury Bill(a) | 0.042 | % | 03/26/2015 | 03/26/2015 | 50,000,000 | 49,995,042 | ||||||||||||||
U.S. Treasury Bill(a) | 0.037 | % | 04/02/2015 | 04/02/2015 | 25,000,000 | 24,997,630 | ||||||||||||||
U.S. Treasury Bill(a) | 0.040 | % | 04/02/2015 | 04/02/2015 | 75,000,000 | 74,992,500 | ||||||||||||||
U.S. Treasury Note(b) | 0.100 | % | 01/01/2015 | 01/31/2016 | 47,500,000 | 47,487,736 | ||||||||||||||
U.S. Treasury Note(b) | 0.108 | % | 01/01/2015 | 10/31/2016 | 7,000,000 | 6,992,597 | ||||||||||||||
|
| |||||||||||||||||||
TOTAL TREASURY DEBT | 2,145,414,585 | |||||||||||||||||||
|
| |||||||||||||||||||
| TREASURY REPURCHASE AGREEMENTS – 16.9% | ||||||||||||||||||||
Agreement with Barclays Capital, Inc. and The Bank of New York Mellon (Tri-Party), dated 12/31/2014 (collateralized by U.S. Treasury Notes, 2.250% – 2.625% due 11/15/2020 – 04/30/2021, valued at $204,000,087); expected proceeds $200,000,667 | 0.060 | % | 01/02/2015 | 01/02/2015 | 200,000,000 | 200,000,000 | ||||||||||||||
See Notes to Financial Statements.
56
Table of Contents
State Street Treasury Plus Money Market Portfolio
Portfolio of Investments — (continued)
December 31, 2014
Name of Issuer | Interest Rate | Next Rate Reset Date | Maturity Date | Principal Amount | Value | |||||||||||||||
| TREASURY REPURCHASE AGREEMENTS – (continued) | ||||||||||||||||||||
Agreement with BNP Paribas Securities Corp. and The Bank of New York Mellon (Tri-Party), dated 12/31/2014 (collateralized by U.S. Treasury Notes, 0.250% – 3.500% due 02/29/2016 – 05/15/2020, valued at $20,400,053); expected proceeds $20,000,056 | 0.050 | % | 01/02/2015 | 01/02/2015 | $ | 20,000,000 | $ | 20,000,000 | ||||||||||||
Agreement with Citigroup Global Markets, Inc. and The Bank of New York Mellon (Tri-Party), dated 12/31/2014 (collateralized by a U.S. Treasury Note, 1.000% due 09/15/2017, valued at $30,600,041); expected proceeds $30,000,083 | 0.050 | % | 01/02/2015 | 01/02/2015 | 30,000,000 | 30,000,000 | ||||||||||||||
Agreement with Credit Agricole Corporate and Investment Bank and The Bank of New York Mellon (Tri-Party), dated 12/31/2014 (by U.S. Treasury Inflation Bonds, 0.625% – 2.375% due 01/15/2027 – 02/15/2043, and a U.S. Treasury Note, 1.625% due 11/15/2022, valued at $130,560,043); expected proceeds $128,000,356 | 0.050 | % | 01/02/2015 | 01/02/2015 | 128,000,000 | 128,000,000 | ||||||||||||||
Agreement with Societe Generale Inc. and The Bank of New York Mellon (Tri-Party), dated 12/31/2014 (collateralized by U.S. Treasury Notes, 0.375% – 2.750% due 01/15/2016 – 11/15/2023, and a U.S. Treasury Strip, 0.000% due 02/15/2024, valued at $91,800,092); expected proceeds $90,000,350 | 0.070 | % | 01/02/2015 | 01/02/2015 | 90,000,000 | 90,000,000 | ||||||||||||||
|
| |||||||||||||||||||
TOTAL TREASURY REPURCHASE AGREEMENTS |
| 468,000,000 | ||||||||||||||||||
|
| |||||||||||||||||||
TOTAL INVESTMENTS(c)(d) – 94.5% | 2,613,414,585 | |||||||||||||||||||
Assets in Excess of Other Liabilities – 5.5% | 152,115,386 | |||||||||||||||||||
|
| |||||||||||||||||||
NET ASSETS – 100.0% | $ | 2,765,529,971 | ||||||||||||||||||
|
| |||||||||||||||||||
| (a) | Rate represents annualized yield at date of purchase |
| (b) | Variable Rate Security – Interest rate shown is rate in effect at December 31, 2014 |
| (c) | Unless otherwise indicated, the values of the securities of the Portfolio are determined based on Level 2 inputs established by provisions surrounding fair value measurements and disclosures (Note 2). |
| (d) | Also represents the cost for federal tax purposes |
See Notes to Financial Statements.
57
Table of Contents
State Street Master Funds
Statements of Assets and Liabilities
December 31, 2014
| Money Market Portfolio | Tax Free Money Market Portfolio | U.S. Government Money Market Portfolio | Treasury Money Market Portfolio | Treasury Plus Money Market Portfolio | ||||||||||||||||
Assets | ||||||||||||||||||||
Investments at market value and amortized cost (Note 2) | $ | 25,123,040,253 | $ | 253,241,729 | $ | 10,315,272,809 | $ | 10,797,407,793 | $ | 2,145,414,585 | ||||||||||
Repurchase Agreements, at market value and cost (Note 2) | 15,895,000,000 | – | 2,141,000,000 | – | 468,000,000 | |||||||||||||||
|
|
|
|
|
|
|
|
|
| |||||||||||
Total Investments | 41,018,040,253 | 253,241,729 | 12,456,272,809 | 10,797,407,793 | 2,613,414,585 | |||||||||||||||
Cash | – | – | 752,711,211 | 276,103,845 | 227,408,183 | |||||||||||||||
Interest receivable | 9,189,761 | 11,432 | 309,950 | 156,358 | 7,744 | |||||||||||||||
Prepaid expenses and other assets | 68,570 | 15,761 | 28,896 | 32,012 | 18,599 | |||||||||||||||
|
|
|
|
|
|
|
|
|
| |||||||||||
Total assets | 41,027,298,584 | 253,268,922 | 13,209,322,866 | 11,073,700,008 | 2,840,849,111 | |||||||||||||||
|
|
|
|
|
|
|
|
|
| |||||||||||
Liabilities | ||||||||||||||||||||
Investment securities purchased | – | – | – | 824,957,438 | 74,992,500 | |||||||||||||||
Due to custodian | 318,723,260 | – | – | – | – | |||||||||||||||
Management fee payable (Note 3) | 3,141,229 | 19,560 | 1,094,453 | 953,270 | 215,960 | |||||||||||||||
Administration and custody fees payable (Note 3) | 917,761 | 7,818 | 315,538 | 283,884 | 64,658 | |||||||||||||||
Professional fees payable | 39,505 | 42,039 | 42,039 | 42,039 | 42,039 | |||||||||||||||
Accrued expenses and other liabilities | 9,209 | 4,194 | 3,231 | 3,086 | 3,983 | |||||||||||||||
|
|
|
|
|
|
|
|
|
| |||||||||||
Total liabilities | 322,830,964 | 73,611 | 1,455,261 | 826,239,717 | 75,319,140 | |||||||||||||||
|
|
|
|
|
|
|
|
|
| |||||||||||
Net Assets | $ | 40,704,467,620 | $ | 253,195,311 | $ | 13,207,867,605 | $ | 10,247,460,291 | $ | 2,765,529,971 | ||||||||||
|
|
|
|
|
|
|
|
|
| |||||||||||
See Notes to Financial Statements.
58
Table of Contents
State Street Master Funds
Statements of Operations
Year Ended December 31, 2014
| Money Market Portfolio | Tax Free Money Market Portfolio | U.S. Government Money Market Portfolio | Treasury Money Market Portfolio | Treasury Plus Money Market Portfolio | ||||||||||||||||
Investment Income | ||||||||||||||||||||
Interest | $ | 76,635,514 | $ | 111,966 | $ | 8,111,110 | $ | 5,288,882 | $ | 1,338,376 | ||||||||||
|
|
|
|
|
|
|
|
|
| |||||||||||
Expenses | ||||||||||||||||||||
Management fees (Note 3) | 19,958,835 | 142,719 | 5,464,519 | 5,865,639 | 1,308,611 | |||||||||||||||
Administration and custody fees (Note 3) | 5,052,518 | 37,919 | 1,384,549 | 1,486,005 | 332,865 | |||||||||||||||
Trustees’ fees (Note 4) | 726,374 | 15,002 | 174,472 | 233,559 | 47,767 | |||||||||||||||
Professional fees | 166,651 | 59,486 | 85,730 | 93,057 | 66,712 | |||||||||||||||
Printing fees | 14,349 | 4,570 | 4,571 | 4,571 | 4,571 | |||||||||||||||
Other expenses | 176,390 | 50,990 | 104,706 | 111,525 | 85,247 | |||||||||||||||
|
|
|
|
|
|
|
|
|
| |||||||||||
Total expenses | 26,095,117 | 310,686 | 7,218,547 | 7,794,356 | 1,845,773 | |||||||||||||||
|
|
|
|
|
|
|
|
|
| |||||||||||
Net Investment Income (Loss) | 50,540,397 | (198,720 | ) | 892,563 | (2,505,474 | ) | (507,397 | ) | ||||||||||||
|
|
|
|
|
|
|
|
|
| |||||||||||
Realized Gain (Loss) | ||||||||||||||||||||
Net realized gain on investments | 200,540 | – | 13,831 | 130,828 | – | |||||||||||||||
|
|
|
|
|
|
|
|
|
| |||||||||||
Net Increase (Decrease) in Net Assets Resulting from Operations | $ | 50,740,937 | $ | (198,720 | ) | $ | 906,394 | $ | (2,374,646 | ) | $ | (507,397 | ) | |||||||
|
|
|
|
|
|
|
|
|
| |||||||||||
See Notes to Financial Statements.
59
Table of Contents
State Street Master Funds
Statements of Changes in Net Assets
| Money Market Portfolio | Tax Free Money Market Portfolio | |||||||||||||||
| Year Ended December 31, 2014 | Year Ended December 31, 2013 | Year Ended December 31, 2014 | Year Ended December 31, 2013 | |||||||||||||
Increase (Decrease) in Net Assets From | ||||||||||||||||
Operations: | ||||||||||||||||
Net investment income (loss) | $ | 50,540,397 | $ | 50,355,030 | $ | (198,720 | ) | $ | (118,693 | ) | ||||||
Net realized gain on investments | 200,540 | 179,110 | – | – | ||||||||||||
|
|
|
|
|
|
|
| |||||||||
Net increase (decrease) in net assets from operations | 50,740,937 | 50,534,140 | (198,720 | ) | (118,693 | ) | ||||||||||
|
|
|
|
|
|
|
| |||||||||
Capital Transactions: | ||||||||||||||||
Contributions | 76,110,543,297 | 65,248,452,641 | 966,996,003 | 1,034,388,036 | ||||||||||||
Withdrawals | (69,510,120,416 | ) | (58,754,444,878 | ) | (1,021,632,232 | ) | (1,234,759,623 | ) | ||||||||
|
|
|
|
|
|
|
| |||||||||
Net increase (decrease) in net assets from capital transactions | 6,600,422,881 | 6,494,007,763 | (54,636,229 | ) | (200,371,587 | ) | ||||||||||
|
|
|
|
|
|
|
| |||||||||
Net Increase (Decrease) in Net Assets | 6,651,163,818 | 6,544,541,903 | (54,834,949 | ) | (200,490,280 | ) | ||||||||||
Net Assets | ||||||||||||||||
Beginning of year | 34,053,303,802 | 27,508,761,899 | 308,030,260 | 508,520,540 | ||||||||||||
|
|
|
|
|
|
|
| |||||||||
End of year | $ | 40,704,467,620 | $ | 34,053,303,802 | $ | 253,195,311 | $ | 308,030,260 | ||||||||
|
|
|
|
|
|
|
| |||||||||
See Notes to Financial Statements.
60
Table of Contents
State Street Master Funds
Statements of Changes in Net Assets
| U.S. Government Money Market Portfolio | Treasury Money Market Portfolio | |||||||||||||||
| Year Ended December 31, 2014 | Year Ended December 31, 2013 | Year Ended December 31, 2014 | Year Ended December 31, 2013 | |||||||||||||
Increase (Decrease) in Net Assets From | ||||||||||||||||
Operations: | ||||||||||||||||
Net investment income (loss) | $ | 892,563 | $ | 2,961,527 | $ | (2,505,474 | ) | $ | 268,931 | |||||||
Net realized gain on investments | 13,831 | – | 130,828 | 34,160 | ||||||||||||
|
|
|
|
|
|
|
| |||||||||
Net increase (decrease) in net assets from operations | 906,394 | 2,961,527 | (2,374,646 | ) | 303,091 | |||||||||||
|
|
|
|
|
|
|
| |||||||||
Capital Transactions: | ||||||||||||||||
Contributions | 29,375,563,089 | 23,862,095,303 | 27,518,525,235 | 29,957,818,460 | ||||||||||||
Withdrawals | (24,881,521,721 | ) | (23,773,323,291 | ) | (31,826,712,166 | ) | (28,112,159,319 | ) | ||||||||
|
|
|
|
|
|
|
| |||||||||
Net increase (decrease) in net assets from capital transactions | 4,494,041,368 | 88,772,012 | (4,308,186,931 | ) | 1,845,659,141 | |||||||||||
|
|
|
|
|
|
|
| |||||||||
Net Increase (Decrease) in Net Assets | 4,494,947,762 | 91,733,539 | (4,310,561,577 | ) | 1,845,962,232 | |||||||||||
Net Assets | ||||||||||||||||
Beginning of year | 8,712,919,843 | 8,621,186,304 | 14,558,021,868 | 12,712,059,636 | ||||||||||||
|
|
|
|
|
|
|
| |||||||||
End of year | $ | 13,207,867,605 | $ | 8,712,919,843 | $ | 10,247,460,291 | $ | 14,558,021,868 | ||||||||
|
|
|
|
|
|
|
| |||||||||
See Notes to Financial Statements.
61
Table of Contents
State Street Master Funds
Statements of Changes in Net Assets
| Treasury Plus Money Market Portfolio | ||||||||
| Year Ended December 31, 2014 | Year Ended December 31, 2013 | |||||||
Increase (Decrease) in Net Assets From Operations: | ||||||||
Net investment income (loss) | $ | (507,397 | ) | $ | 26,184 | |||
Net realized gain on investments | – | (1,536 | ) | |||||
|
|
|
| |||||
Net increase (decrease) in net assets from operations | (507,397 | ) | 24,648 | |||||
|
|
|
| |||||
Capital Transactions: | ||||||||
Contributions | 12,046,302,272 | 9,982,616,922 | ||||||
Withdrawals | (12,033,281,777 | ) | (9,528,165,497 | ) | ||||
|
|
|
| |||||
Net increase (decrease) in net assets from capital transactions | 13,020,495 | 454,451,425 | ||||||
|
|
|
| |||||
Net increase (decrease) in net assets | 12,513,098 | 454,476,073 | ||||||
Net Assets | ||||||||
Beginning of year | 2,753,016,873 | 2,298,540,800 | ||||||
|
|
|
| |||||
End of year | $ | 2,765,529,971 | $ | 2,753,016,873 | ||||
|
|
|
| |||||
See Notes to Financial Statements.
62
Table of Contents
State Street Master Funds
Financial Highlights
| Ratios to Average Net Assets | Net Assets End of Period (000s Omitted) | |||||||||||||||||||
Period Ended December 31, | Total Return(a) | Gross Operating Expenses | Net Operating Expenses | Net Investment Income | ||||||||||||||||
Money Market Portfolio | ||||||||||||||||||||
2014 | 0.13 | % | 0.07 | % | 0.07 | % | 0.13 | % | $ | 40,704,468 | ||||||||||
2013 | 0.15 | % | 0.06 | % | 0.06 | % | 0.15 | % | $ | 34,053,304 | ||||||||||
2012 | 0.26 | % | 0.06 | % | 0.06 | % | 0.25 | % | $ | 27,508,762 | ||||||||||
2011 | 0.20 | % | 0.07 | % | 0.07 | % | 0.20 | %(b) | $ | 22,780,186 | ||||||||||
2010 | 0.20 | % | 0.12 | % | 0.12 | % | 0.20 | % | $ | 26,503,826 | ||||||||||
Tax Free Money Market Portfolio | ||||||||||||||||||||
2014 | (0.07 | )% | 0.11 | % | 0.11 | % | (0.07 | )% | $ | 253,195 | ||||||||||
2013 | (0.03 | )% | 0.11 | % | 0.11 | % | (0.04 | )% | $ | 308,030 | ||||||||||
2012 | 0.01 | % | 0.11 | % | 0.11 | % | 0.01 | % | $ | 508,521 | ||||||||||
2011 | 0.04 | % | 0.11 | % | 0.11 | % | 0.04 | %(b) | $ | 331,194 | ||||||||||
2010 | 0.13 | % | 0.13 | % | 0.13 | % | 0.11 | % | $ | 405,328 | ||||||||||
U.S. Government Money Market Portfolio | ||||||||||||||||||||
2014 | 0.01 | % | 0.07 | % | 0.07 | % | 0.01 | % | $ | 13,207,868 | ||||||||||
2013 | 0.03 | % | 0.07 | % | 0.07 | % | 0.03 | % | $ | 8,712,920 | ||||||||||
2012 | 0.08 | % | 0.07 | % | 0.07 | % | 0.08 | % | $ | 8,621,186 | ||||||||||
2011 | 0.04 | % | 0.07 | % | 0.07 | % | 0.04 | %(b) | $ | 5,779,444 | ||||||||||
2010 | 0.07 | % | 0.12 | % | 0.12 | % | 0.08 | % | $ | 4,910,900 | ||||||||||
Treasury Money Market Portfolio | ||||||||||||||||||||
2014 | (0.02 | )% | 0.07 | % | 0.07 | % | (0.02 | )% | $ | 10,247,460 | ||||||||||
2013 | 0.00 | %(c) | 0.07 | % | 0.07 | % | 0.00 | %(c) | $ | 14,558,022 | ||||||||||
2012 | 0.02 | % | 0.07 | % | 0.07 | % | 0.02 | % | $ | 12,712,060 | ||||||||||
2011 | (0.09 | )% | 0.07 | % | 0.07 | % | (0.03 | )%(b) | $ | 12,094,364 | ||||||||||
2010 | 0.01 | % | 0.12 | % | 0.12 | % | 0.01 | % | $ | 3,656,739 | ||||||||||
Treasury Plus Money Market Portfolio | ||||||||||||||||||||
2014 | (0.02 | )% | 0.07 | % | 0.07 | % | (0.02 | )% | $ | 2,765,530 | ||||||||||
2013 | 0.00 | %(c) | 0.07 | % | 0.07 | % | 0.00 | %(c) | $ | 2,753,017 | ||||||||||
2012 | 0.06 | % | 0.08 | % | 0.08 | % | 0.06 | % | $ | 2,298,541 | ||||||||||
2011 | 0.00 | %(c) | 0.08 | % | 0.08 | % | (0.01 | )%(b) | $ | 1,361,158 | ||||||||||
2010 | 0.03 | % | 0.12 | % | 0.12 | % | 0.03 | % | $ | 933,748 | ||||||||||
| (a) | Results represent past performance and are not indicative of future results. Total return for periods of less than one year are not annualized. |
| (b) | Results reflect the effect of expense waivers. Without these waivers, net investment income would have been lower. |
| (c) | Amount is less than 0.005%. |
See Notes to Financial Statements.
63
Table of Contents
State Street Master Funds
Notes to Financial Statements
December 31, 2014
| 1. | Organization |
The State Street Master Funds (the “Trust”) is registered under the Investment Company Act of 1940, as amended (the “1940 Act”), as an open-end management investment company, and was organized as a business trust under the laws of the Commonwealth of Massachusetts on July 27, 1999. The Trust comprises ten investment portfolios: State Street Equity 500 Index Portfolio, State Street Equity 400 Index Portfolio, State Street Equity 2000 Index Portfolio, State Street Aggregate Bond Index Portfolio, State Street Money Market Portfolio, State Street Tax Free Money Market Portfolio, State Street Limited Duration Bond Portfolio, State Street U.S. Government Money Market Portfolio, State Street Treasury Money Market Portfolio and State Street Treasury Plus Money Market Portfolio. At December 31, 2014, the following Portfolios were operational: State Street Equity 500 Index Portfolio, State Street Money Market Portfolio, State Street Tax Free Money Market Portfolio, State Street U.S. Government Money Market Portfolio, State Street Treasury Money Market Portfolio and State Street Treasury Plus Money Market Portfolio. Information presented in these financial statements pertains only to State Street Money Market Portfolio, State Street Tax Free Money Market Portfolio, State Street U.S. Government Money Market Portfolio, State Street Treasury Money Market Portfolio and State Street Treasury Plus Money Market Portfolio (the “Portfolios”). The Portfolios commenced operations as follows:
| Portfolio Name | Commencement Date | |
State Street Money Market Portfolio | August 12, 2004 | |
State Street Tax Free Money Market Portfolio | February 7, 2007 | |
State Street U.S. Government Money Market Portfolio | October 17, 2007 | |
State Street Treasury Money Market Portfolio | October 25, 2007 | |
State Street Treasury Plus Money Market Portfolio | October 24, 2007 |
The Portfolios are authorized to issue an unlimited number of non-transferable beneficial interests.
The Portfolios’ investment objectives are as follows:
| Portfolio Name | Investment Objective | |
| State Street Money Market Portfolio | To seek to maximize current income, to the extent consistent with the preservation of capital and liquidity and the maintenance of a stable $1.00 per share net asset value by investing in U.S. dollar denominated money market securities. | |
| State Street Tax Free Money Market Portfolio | To seek to maximize current income, exempt from federal income taxes, to the extent consistent with the preservation of capital and liquidity and the maintenance of a stable $1.00 per share net asset value. | |
| State Street U.S. Government Money Market Portfolio | To seek to maximize current income, to the extent consistent with the preservation of capital and liquidity and the maintenance of a stable $1.00 per share net asset value. |
64
Table of Contents
State Street Master Funds
Notes to Financial Statements — (continued)
December 31, 2014
| Portfolio Name | Investment Objective | |
| State Street Treasury Money Market Portfolio | To seek a high level of current income consistent with preserving principal and liquidity and the maintenance of a stable $1.00 per share net asset value. | |
| State Street Treasury Plus Money Market Portfolio | To seek a high level of current income consistent with preserving principal and liquidity and the maintenance of a stable $1.00 per share net asset value. |
The Portfolios are investment companies and accordingly follow the investment company accounting and reporting guidance of the Financial Accounting Standards Board (“FASB”) Accounting Standards Codification Topic 946 Financial Services – Investment Companies.
Recent Regulatory Action
On July 23, 2014, the SEC adopted amendments to the governing rules for money market funds. The amendments require that, following a two-year implementation timeframe, institutional prime and institutional tax exempt money market funds adopt a floating net asset value. The rule changes also allow for certain liquidity-based redemption fees and gate, and include enhanced requirements for disclosure and stress testing. The degree to which a money market fund will be impacted by the rule amendments will depend upon the type of fund and type of investors (retail or institutional). At this time, management is evaluating the implications of these amendments and their impact to the Portfolios’ financial statements and accompanying notes.
| 2. | Significant Accounting Policies |
The following is a summary of the significant accounting policies consistently followed by the Portfolios in the preparation of their financial statements.
Security valuation – As permitted under Rule 2a-7 of the 1940 Act and certain conditions therein, securities of the Portfolios are valued initially at cost and thereafter assume a constant amortization to maturity of any discount or premium. Investments in open-end investment companies are valued at their net asset value each business day. Each Portfolio may value securities for which market quotations are not readily available at “fair value,” as determined in good faith pursuant to procedures established by the Board of Trustees (the “Board”). The Board has adopted procedures concerning securities valuation, under which an Oversight Committee makes determinations as to whether market quotations are not readily available or do not otherwise accurately reflect the fair value of the security. The Oversight Committee, or a subgroup thereof, subject to oversight by the Board, may use fair value pricing in a variety of circumstances, including but not limited to, situations when trading in a security has been suspended or halted. If amortized cost is determined not to approximate fair value, the value of the portfolio securities will be determined under procedures established by and under the general supervision of the Oversight Committee. The Oversight Committee will assist in overseeing the comparison of amortized cost to market-based value. Fair value pricing involves subjective judgments and it is possible that the fair value determination for a security is materially different than the value that could be received on the sale of the security.
The Portfolios adopted provisions surrounding fair value measurements and disclosures that define fair value, establish a framework for measuring fair value in generally accepted accounting principles and expand disclosures about fair value measurements. This applies to fair value measurements that are already required or permitted by other accounting standards and is intended to increase consistency of those measurements and applies broadly to securities and other types of assets and liabilities. In accordance with these provisions, fair value is defined as the price that a Portfolio would receive upon selling an investment in a timely transaction to an independent buyer in the principal or most
65
Table of Contents
State Street Master Funds
Notes to Financial Statements — (continued)
December 31, 2014
advantageous market of the investment. Various inputs are used in determining the value of the Portfolios’ investments.
The three tier hierarchy of inputs is summarized below:
| • | Level 1 – quoted prices in active markets for identical securities |
| • | Level 2 – other significant observable inputs (including quoted prices for similar securities, interest rates, prepayment speeds, credit risk, etc.) |
| • | Level 3 – significant unobservable inputs (including a Portfolio’s own assumptions in determining the fair value of investments) |
Investments that use Level 2 or Level 3 inputs may include, but are not limited to: (i) an unlisted security related to corporate actions; (ii) a restricted security (e.g., one that may not be publicly sold without registration under the Securities Act of 1933, as amended); (iii) a security whose trading has been suspended or which has been de-listed from its primary trading exchange; (iv) a security that is thinly traded; (v) a security in default or bankruptcy proceedings for which there is no current market quotation; (vi) a security affected by currency controls or restrictions; and (vii) a security affected by a significant event (e.g., an event that occurs after the close of the markets on which the security is traded but before the time as of which the Portfolios’ net assets are computed and that may materially affect the value of the Portfolio’s investments). The valuation of fixed income securities held by the Portfolios are obtained from an independent pricing service and categorized as Level 2 based on the use of other significant observable market based inputs (including quoted prices for similar securities, interest rates, prepayment speed, credit risk, etc). Examples of events that may be “significant events” are government actions, natural disasters, armed conflict, acts of terrorism, and significant market fluctuations.
Fair value pricing could result in a difference between the prices used to calculate a Portfolio’s net asset value and the prices used by such Portfolio’s benchmark index, which, in turn, could result in a difference between a Portfolio’s performance and the performance of such Portfolio’s benchmark index. The inputs or methodology used for valuation are not necessarily an indication of the risk associated with investing in those investments.
The inputs or methodology used for valuing securities are not an indication of the risk associated with investing in those securities.
The following is a summary of the inputs used, as of December 31, 2014, in valuing the Portfolios’ assets carried at fair value:
| Investments in Securities | ||||||||||||||||||||
| Valuation Inputs | State Street Money Market Portfolio | State Street Tax Free Money Market Portfolio | State Street U.S. Government Money Market Portfolio | State Street Treasury Money Market Portfolio | State Street Treasury Plus Money Market Portfolio | |||||||||||||||
Level 1 – Quoted Prices | $ | – | $ | 61,856,729 | $ | – | $ | – | $ | – | ||||||||||
Level 2 – Other Significant Observable Inputs | 41,018,040,253 | 191,385,000 | 12,456,272,809 | 10,797,407,793 | 2,613,414,585 | |||||||||||||||
Level 3 – Significant Unobservable Inputs | – | – | – | – | – | |||||||||||||||
Total Investments | $ | 41,018,040,253 | $ | 253,241,729 | $ | 12,456,272,809 | $ | 10,797,407,793 | $ | 2,613,414,585 | ||||||||||
The type of inputs used to value each security under the provisions surrounding fair value measurement and disclosures is identified in each Portfolio of Investments, which also includes a breakdown of the Portfolios’ investments by category.
66
Table of Contents
State Street Master Funds
Notes to Financial Statements — (continued)
December 31, 2014
Changes in valuation techniques may result in transfers in or out of an investment’s assigned level within the hierarchy. Transfers between fair value hierarchy levels are recognized at the end of the period. As of the year ended December 31, 2014, there were no transfers between levels.
Securities transactions, investment income and expenses – Securities transactions are recorded on a trade date basis. Interest income is recorded daily on the accrual basis and includes amortization of premium and accretion of discount on investments. Premium is amortized and discount is accreted using the straight line method. Realized gains and losses from securities transactions are recorded on the basis of identified cost. Expenses are accrued daily.
All of the net investment income and realized gains and losses from the security transactions of the Portfolios are allocated pro rata among the partners in the Portfolios daily based on each partner’s daily ownership percentage.
Federal income taxes – The Portfolios are not required to pay federal income taxes on their net investment income and net capital gains because they are treated as partnerships for federal income tax purposes. All interest, gains and losses of the Portfolios are deemed to have been “passed through” to the Portfolios’ partners in proportion to their holdings in the respective Portfolio, regardless of whether such items have been distributed by the Portfolios. Each partner is responsible for tax liability based on its distributive share; therefore, no provision has been made for federal income taxes.
The Portfolios have reviewed the tax positions for open years as of December 31, 2014, and determined they did not have a liability for any unrecognized tax expenses. The Portfolios recognize interest and penalties, if any, related to tax liabilities as income tax expense in the Statements of Operations. As of December 31, 2014, tax years 2012 through 2014 remain subject to examination by the Portfolios’ major tax jurisdictions, which include the United States of America and the Commonwealth of Massachusetts.
At December 31, 2014, the cost of investments for federal income tax purposes was substantially the same as the cost for financial reporting purposes.
Repurchase Agreements – A portfolio may enter into repurchase agreements under the terms of a Master Repurchase Agreement. A repurchase agreement customarily obligates the seller at the time it sells securities to a Portfolio to repurchase the securities at a mutually agreed upon price and time which, in the case of the Portfolios’ transactions, is generally within seven days. The total amount received by a Portfolio on repurchase is calculated to exceed the price paid by the Portfolio, reflecting an agreed-upon market rate of interest for the period of time to the settlement date, and is not necessarily related to the interest rate on the underlying securities. The underlying securities are ordinarily United States Government or Government Agency securities, but may consist of other securities. The value of the underlying securities, at the time of purchase and each subsequent business day, is required to be maintained at such a level that the value is equal to at least the principal amount of the repurchase price plus accrued interest. The use of repurchase agreements involves certain risks. Upon an event of default under the Master Repurchase Agreement, if the seller of securities under a repurchase agreement defaults on its obligation to repurchase the underlying securities (as a result of its bankruptcy or otherwise) a Portfolio will seek to dispose of such securities; this action could involve costs or delays. In addition, the proceeds of any such disposition may be less than the amount a Portfolio is owed under the repurchase agreement. A Portfolio may enter into repurchase agreements maturing within seven days with domestic dealers, banks and other financial institutions deemed to be creditworthy by SSGA Funds Management, Inc. (“SSGA FM” or the “Adviser”), a subsidiary of State Street Corporation and an affiliate of State Street Bank and Trust Company (“State Street”).
Expense allocation – Certain expenses are applicable to multiple Portfolios. Expenses directly attributable to a Portfolio are charged to that Portfolio. Expenses of the Trust that are not directly
67
Table of Contents
State Street Master Funds
Notes to Financial Statements — (continued)
December 31, 2014
attributed to a Portfolio are allocated among the Portfolios, on the basis of relative net assets, except where a more appropriate allocation of expenses to each of the Portfolios can otherwise be made.
Use of estimates – The Portfolios’ financial statements are prepared in accordance with U.S. generally accepted accounting principles, which require the use of management estimates. Actual results could differ from those estimates. It is reasonably possible that these differences could be material.
| 3. | Related Party Fees |
Each Portfolio has entered into an investment advisory agreement with the Adviser, under which the Adviser directs the investments of the Portfolios in accordance with their investment objectives, policies, and limitations. In compensation for the Adviser’s services as investment adviser, each Portfolio pays the Adviser a management fee at an annual rate of 0.05% of its average daily net assets.
State Street is the administrator, custodian and transfer agent for the Portfolios. In compensation for State Street’s services as administrator, custodian and transfer agent, the Portfolios pay State Street an annual fee, which is accrued daily and payable monthly at the following fee rate:
| Asset Levels | Annual percentage of average aggregate daily net assets | |
First $400 million | 0.03% | |
Next $15 billion | 0.02% | |
Thereafter | 0.01% | |
Minimum annual fee per Portfolio | $150,000 |
The minimum fee will be calculated by multiplying the minimum per fund fee by the number of Master and stand-alone funds to arrive at the total minimum fee. The greater of the asset based fee or the minimum fee will be charged to the Master and stand-alone funds.
| 4. | Trustees’ Fees |
Independent Trustees are compensated on a calendar year basis. Any Trustee who is deemed to be an “interested person” (as defined in the 1940 Act) of the Funds does not receive compensation from the Funds for his or her service as a Trustee.
As of January 24, 2014, each Independent Trustee receives for his or her services to the State Street Master Funds, State Street Institutional Investment Trust and SSGA Funds, a $141,500 annual base retainer in addition to $18,000 for each in-person meeting and $2,000 for each telephonic meeting from the Trust. The Trust will bear a pro rata allocation based on the Trust’s average monthly assets. The Co-Chairmen receive an additional $44,000 annual retainer. The Independent Trustees are reimbursed for travel and other out-of-pocket expenses in connection with meeting attendance. As of the date of this Statement, the Trustees were not paid pension or retirement benefits as part of the Trust’s expenses.
The Trust’s officers are compensated by the Adviser and its affiliates.
| 5. | Indemnifications |
The Trust’s organizational documents provide that its officers and trustees are indemnified against certain liabilities arising out of the performance of their duties to the Trust. In addition, both in some of its principal service contracts and in the normal course of its business, the Trust enters into contracts that provide indemnifications to other parties for certain types of losses or liabilities. The Trust’s maximum exposure under these arrangements is unknown as this could involve future claims against the Trust. However, based on experience, the Trust expects the risk of loss to be remote.
68
Table of Contents
Report of Independent Registered Public Accounting Firm
To the Board of Trustees and Owners of Beneficial Interest of
State Street Master Funds:
We have audited the accompanying statements of assets and liabilities, including the portfolios of investments, of State Street Money Market Portfolio, State Street Tax Free Money Market Portfolio, State Street U.S. Government Money Market Portfolio, State Street Treasury Money Market Portfolio and State Street Treasury Plus Money Market Portfolio (five of the portfolios constituting State Street Master Funds) (the “Portfolios”) as of December 31, 2014, and the related statements of operations for the year then ended, the statements of changes in net assets for each of the two years in the period then ended, and the financial highlights for each of the five years in the period then ended. These financial statements and financial highlights are the responsibility of the Portfolios’ management. Our responsibility is to express an opinion on these financial statements and financial highlights based on our audits.
We conducted our audits in accordance with the standards of the Public Company Accounting Oversight Board (United States). Those standards require that we plan and perform the audit to obtain reasonable assurance about whether the financial statements and financial highlights are free of material misstatement. We were not engaged to perform an audit of the Portfolios’ internal control over financial reporting. Our audits included consideration of internal control over financial reporting as a basis for designing audit procedures that are appropriate in the circumstances, but not for the purpose of expressing an opinion on the effectiveness of the Portfolios’ internal control over financial reporting. Accordingly, we express no such opinion. An audit also includes examining, on a test basis, evidence supporting the amounts and disclosures in the financial statements and financial highlights, assessing the accounting principles used and significant estimates made by management, and evaluating the overall financial statement presentation. Our procedures included confirmation of securities owned as of December 31, 2014, by correspondence with the custodian and others or by other appropriate auditing procedures where replies from others were not received. We believe that our audits provide a reasonable basis for our opinion.
In our opinion, the financial statements and financial highlights referred to above present fairly, in all material respects, the financial position of State Street Money Market Portfolio, State Street Tax Free Money Market Portfolio, State Street U.S. Government Money Market Portfolio, State Street Treasury Money Market Portfolio and State Street Treasury Plus Money Market Portfolio (five of the portfolios constituting State Street Master Funds) at December 31, 2014, the results of their operations for the year then ended, the changes in their net assets for each of the two years in the period then ended, and the financial highlights for each of the five years in the period then ended, in conformity with U.S. generally accepted accounting principles.
Boston, Massachusetts
February 27, 2015
69
Table of Contents
State Street Master Funds
General Information
December 31, 2014 (Unaudited)
EXPENSE EXAMPLE
As a shareholder of a fund (the “Funds”), you incur ongoing costs, which include costs for administrative services and to the extent applicable, distribution (12b-1) fees, among others. This example is intended to help you understand your ongoing costs (in dollars) of investing in the Funds and to compare these costs with the ongoing costs of investing in other mutual funds. It is based on an investment of $1,000 made at the beginning of the period shown and held for the entire period from July 1, 2014 to December 31, 2014.
The table below illustrates your Fund’s costs in two ways:
| • | Based on actual fund return – This section helps you to estimate the actual expenses that you paid over the period. The “Ending Account Value” shown is derived from the Fund’s actual return, and the third column shows the dollar amount that would have been paid by an investor who started with $1,000 in the Fund. You may use the information here, together with the amount you invested, to estimate the expenses that you paid over the period. To do so, simply divide your account value by $1,000 (for example, an $8,600 account value divided by $1,000 = 8.6), then multiply the result by the number given for the Fund under the heading “Expenses Paid During Period”. |
| • | Based on hypothetical 5% return – This section is intended to help you compare your Fund’s costs with those of other mutual funds. It assumes that the Fund had a yearly return of 5% before expenses, but that the expense ratio is unchanged. In this case, because the return used is not the Fund’s actual return, the results do not apply to your investment. The example is useful in making comparisons because the Securities and Exchange Commission requires all mutual funds to calculate expenses based on a 5% return. You can assess your Fund’s costs by comparing this hypothetical example with the hypothetical examples that appear in shareholder reports of other funds. |
Six Months Ended December 31, 2014
Beginning July 1, 2014 | Ending Account Value December 31, 2014 | Expenses Paid During Period * | ||||||||||
Based on Actual Portfolio Return | ||||||||||||
Money Market Portfolio | $ | 1,000.00 | $ | 1,000.70 | $ | 0.35 | ||||||
Tax Free Money Market Portfolio | $ | 1,000.00 | $ | 999.60 | $ | 0.60 | ||||||
U.S. Government Money Market Portfolio | $ | 1,000.00 | $ | 1,000.00 | $ | 0.35 | ||||||
Treasury Money Market Portfolio | $ | 1,000.00 | $ | 999.80 | $ | 0.35 | ||||||
Treasury Plus Money Market Portfolio | $ | 1,000.00 | $ | 999.90 | $ | 0.35 | ||||||
70
Table of Contents
State Street Master Funds
General Information — (continued)
December 31, 2014 (Unaudited)
EXPENSE EXAMPLE — (continued)
Beginning July 1, 2014 | Ending Account Value December 31, 2014 | Expenses Paid During Period * | ||||||||||
Based on Hypothetical (5% return before expenses) | ||||||||||||
Money Market Portfolio | $ | 1,000.00 | $ | 1,024.85 | $ | 0.36 | ||||||
Tax Free Money Market Portfolio | $ | 1,000.00 | $ | 1,024.60 | $ | 0.61 | ||||||
U.S. Government Money Market Portfolio | $ | 1,000.00 | $ | 1,024.85 | $ | 0.36 | ||||||
Treasury Money Market Portfolio | $ | 1,000.00 | $ | 1,024.85 | $ | 0.36 | ||||||
Treasury Plus Money Market Portfolio | $ | 1,000.00 | $ | 1,024.85 | $ | 0.36 | ||||||
| * | The calculations are based on expenses incurred in the most recent six month period of the Portfolios. Each Portfolio’s annualized expense ratio for the six months ended December 31, 2014 was as follows: |
Money Market Portfolio | 0.07% | |||
Tax Free Money Market Portfolio | 0.12% | |||
U.S. Government Money Market Portfolio | 0.07% | |||
Treasury Money Market Portfolio | 0.07% | |||
Treasury Plus Money Market Portfolio | 0.07% |
| The dollar amounts shown as “Expenses Paid” are equal to the annualized expense ratio multiplied by the average account value over the period, multiplied by 184/365 (the most recent six month period). |
Proxy Voting Policies and Procedures and Record
Information regarding the Fund’s proxy voting policies and procedures, as well as information regarding how the Fund voted proxies, if any, during the most recent 12-month period ended June 30 is available without charge (1) by calling 1-877-521-4083 (toll free), or (2) on the website of the Securities and Exchange Commission (“SEC”) at www.sec.gov.
Quarterly Portfolio Schedule
The Fund files a complete schedule of portfolio holdings with the SEC for the first and third quarters of each fiscal year on Form N-Q. The Fund’s Forms N-Q are available on the SEC’s website at www.sec.gov and may be reviewed and copied at the SEC’s Public Reference Room in Washington, DC. Information on the operation of the Public Reference Room may be obtained by calling 1-800-SEC-0330. The information on Form N-Q is available upon request, without charge, by calling 1-877-521-4083 (toll-free).
71
Table of Contents
State Street Master Funds
Trustees and Officers Information
December 31, 2014
Name, Address, | Position(s) Held | Term of Office | Principal Occupation | Number of Funds in Fund Complex Overseen by Trustee | Other Directorships | |||||
Independent Trustees | ||||||||||
Michael F. Holland State Street Financial Center One Lincoln Street Boston, MA 02111-2900 YOB: 1944 | Trustee and Co-Chairman of the Board | Term: Indefinite Elected: 7/99 | Chairman, Holland & Company L.L.C. (investment adviser) (1995 – present). | 59 | Trustee, State Street Institutional Investment Trust; Trustee SSGA Funds; Director, the Holland Series Fund, Inc.; Director, The China Fund, Inc.; Director, The Taiwan Fund, Inc.; Director, Reaves Utility Income Fund, Inc.; and Director, Blackstone/GSO Loan Funds. | |||||
Patrick J. Riley State Street Financial Center One Lincoln Street Boston, MA 02111-2900 YOB: 1948 | Trustee and Co-Chairman of the Board | Term: Indefinite Elected: 1/14 | 2002 to May 2010, Associate Justice of the Superior Court, Commonwealth of Massachusetts; 1985 to 2002, Partner, Riley, Burke & Donahue, L.L.P. (law firm); 1998 to Present, Independent Director, State Street Global Advisers Ireland, Ltd. (investment company); 1998 to Present, Independent Director, SSGA Liquidity plc (formerly, SSGA Cash Management Fund plc); January 2009 to Present, Independent Director, SSGA Fixed Income plc; and January 2009 to Present, Independent Director, SSGA Qualified Funds PLC. | 59 | Trustee, State Street Institutional Investment Trust; Trustee SSGA Funds; Board Director and Chairman, SPDR Europe 1PLC (2011 – Present); Board Director and Chairman, SPDR Europe II, PLC (2013 –Present). | |||||
William L. Boyan State Street Financial Center One Lincoln Street Boston, MA 02111-2900 YOB: 1937 | Trustee and Co-Chairman of the Valuation Committee | Term: Indefinite Elected: 7/99 | President and Chief Operations Officer, John Hancock Financial Services (1959 – 1999). Mr. Boyan retired in 1999. Chairman Emeritus, Children’s Hospital, Boston, MA (1984 –2011); Former Chairman, Boston Plan For Excellence, Boston Public Schools (1995 – 2010); Member of Advisory Board of Florida Atlantic University Lifelong Learning Society. | 59 | Trustee, State Street Institutional Investment Trust; Trustee SSGA Funds; Former Trustee of Old Mutual South Africa Master Trust; Trustee, Children’s Hospital, Boston, MA. |
72
Table of Contents
Name, Address, | Position(s) Held | Term of Office | Principal Occupation | Number of Funds in Fund Complex Overseen by Trustee | Other Directorships | |||||
Independent Trustees (continued) | ||||||||||
William L. Marshall State Street Financial Center One Lincoln Street Boston, MA 02111-2900 YOB: 1942 | Trustee and Co-Chairman of the Audit Committee | Term: Indefinite Elected: 1/14 | April 2011 to Present, Chairman (until April 2011, Chief Executive Officer and President), Wm. L. Marshall Associates, Inc., Wm. L. Marshall Companies, Inc. and the Marshall Financial Group, Inc. (a registered investment adviser and provider of financial and related consulting services); Certified Financial Planner; Member, Financial Planners Association; Director, (2008 – 2014) Doylestown Health Foundation Board; and the Ann Silverman Community Clinic of Doylestown, PA. | 59 | Trustee, State Street Institutional Investment Trust; Trustee SSGA Funds; Director, Marshall Financial Group, Inc. | |||||
Richard D. Shirk State Street Financial Center One Lincoln Street Boston, MA 02111-2900 YOB: 1945 | Trustee and Co-Chairman of the Qualified Legal and Compliance Committee | Term: Indefinite Elected: 1/14 | March 2001 to April 2002, Chairman (1996 to March 2001, President and Chief Executive Officer), Cerulean Companies, Inc. (holding company) (Retired); 1992 to March 2001, President and Chief Executive Officer, Blue Cross Blue Shield of Georgia (health insurer, managed healthcare); 1998 to December 2008, Chairman, Board Member and December 2008 to Present, Investment Committee Member, Healthcare Georgia Foundation (private foundation); September 2002 to Present, Lead Director and Board Member, Amerigroup Corp. (managed health care); 1999 to Present, Board Member and (since 2001) Investment Committee Member, Woodruff Arts Center; and 2003 to 2009, Trustee, Gettysburg College. | 59 | Trustee, State Street Institutional Investment Trust; Trustee SSGA Funds; Board member, AeroCare Holdings (privately held healthcare services company) (February 2003 – Present); Board member, Regenesis Biomedical (health care services) (April 2012 –Present). | |||||
Rina K. Spence State Street Financial Center One Lincoln Street Boston, MA 02111-2900 YOB: 1948 | Trustee and Co-Chairman of the Qualified Legal and Compliance Committee and Co-Chairman of the Governance Committee | Term: Indefinite Elected: 7/99 | President of SpenceCare International LLC (international healthcare consulting) (1999 – present); Chief Executive Officer, IEmily.com (health internet company) (2000 – 2001); Chief Executive Officer of Consensus Pharmaceutical, Inc. (1998 – 1999); Founder, President and Chief Executive Officer of Spence Center for Women’s Health (1994 – 1998); President and CEO Emerson Hospital (1984 – 1994); Trustee, Eastern Enterprise (utilities) (1988 – 2000). | 59 | Trustee, State Street Institutional Investment Trust; Trustee SSGA Funds; Director, Berkshire Life Insurance Company of America (1993 – 2009); Director, IEmily.com, Inc. (2000 – 2010); and Trustee, National Osteoporosis Foundation (2005 – 2008). | |||||
73
Table of Contents
Name, Address, | Position(s) Held | Term of Office | Principal Occupation | Number of Funds in Fund Complex Overseen by Trustee | Other Directorships | |||||
Independent Trustees (continued) | ||||||||||
Bruce D. Taber State Street Financial Center One Lincoln Street Boston, MA 02111-2900 YOB: 1943 | Trustee and Co-Chairman of the Valuation Committee and Co-Chairman of the Governance Committee | Term: Indefinite Elected: 1/14 | 1999 to Present, Partner, Zenergy LLC (a technology company providing Computer Modeling and System Analysis to the General Electric Power Generation Division); Until December 2008, Independent Director, SSGA Cash Management Fund plc; Until December 2008, Independent Director, State Street Global Advisers Ireland, Ltd. (investment companies); and Until August 1994, President, Alonzo B. Reed, Inc., (a Boston architect-engineering firm). | 59 | Trustee, State Street Institutional Investment Trust; Trustee SSGA Funds | |||||
Douglas T. Williams State Street Financial Center One Lincoln Street Boston, MA 02111-2900 YOB: 1940 | Trustee and Co-Chairman of the Audit Committee | Term: Indefinite Elected: 7/99 | President, Oakmont Homeowners Association (2012 – 2013); President, Mariner Sands Chapel; Executive Vice President and member of Executive Committee, Chase Manhattan Bank (1987 – 1999); President, Boston Stock Exchange Depository Trust Company, 1981 – 1982. | 59 | Trustee, State Street Institutional Investment Trust; Trustee SSGA Funds; Treasurer, Nantucket Educational Trust, (2002-2007). | |||||
Interested Trustees(1) | ||||||||||
Scott F. Powers State Street Financial Center One Lincoln Street Boston, MA 02111-2900 YOB: 1959 | Trustee | Term: Indefinite Elected Trustee: 1/14 | May 2008 to Present, President and Chief Executive Officer of State Street Global Advisors; 2001 – 2008, Chief Executive Officer of Old Mutual Asset Management; Board of Directors, United Way of Massachusetts Bay; Board of Directors of Middlesex School; Incorporator, Cardigan Mountain School | 59 | ||||||
James E. Ross SSGA Funds Management, Inc. State Street Financial Center One Lincoln Street Boston, MA 02111-2900 YOB: 1965 | Trustee | Term: Indefinite Elected Trustee: 2/07 | Chairman and Director, SSGA Funds Management, Inc. (2012 – present); President, SSGA Funds Management, Inc. (2005 – 2012); Executive Vice President and Senior Managing Director, State Street Global Advisors (2006 – present); and Principal, State Street Global Advisors (2006 – present). | 254 | ||||||
| (1) | Mr. Powers and Mr. Ross are Interested Trustees because of their employment by SSGA Funds Management, Inc., an affiliate of the Trust. |
74
Table of Contents
Name, Address, | Position(s) Held with Trust | Term of Office | Principal Occupation | |||
Officers: | ||||||
Ellen M. Needham SSGA Funds Management, Inc. State Street Financial Center One Lincoln Street Boston, MA 02111-2900 YOB: 1967 | President | Term: Indefinite Elected: 10/12 | President and Director, SSGA Funds Management, Inc. (June 2012 – present); Chief Operating Officer, SSGA Funds Management, Inc. (May 2010 – June 2012); Senior Managing Director, SSGA Funds Management, Inc. (1992 – 2012) and Senior Managing Director, State Street Global Advisors (1992 – present).* | |||
Ann M. Carpenter SSGA Funds Management, Inc. State Street Financial Center One Lincoln Street Boston, MA 02111-2900 YOB: 1966 | Vice President | Term: Indefinite Elected: 10/12 | Chief Operating Officer, SSGA Funds Management, Inc. (April 2014 – present); Vice President, SSGA Funds Management, Inc. (2008 – present); Principal, State Street Global Advisors (2005 – 2008 – present).* | |||
Laura F. Dell State Street Bank and Trust Company 100 Huntington Avenue Boston, MA 02116 YOB: 1964 | Treasurer | Term: Indefinite Elected: 11/10 | Vice President, State Street Bank and Trust Company (2002 – present).* | |||
Chad C. Hallett SSGA Funds Management, Inc. State Street Financial Center One Lincoln Street Boston, MA 02111-2900 YOB: 1969 | Assistant Treasurer | Term: Indefinite Elected: 09/11 | Vice President, State Street Global Advisors and SSGA Funds Management, Inc. (November 2014 – present); Vice President, State Street Bank and Trust Company (2001 – November 2014).* | |||
Caroline M. Connolly State Street Bank and Trust Company 100 Huntington Avenue Boston, MA 02116 YOB: 1975 | Assistant Treasurer | Term: Indefinite Elected: 09/11 | Assistant Vice President, State Street Bank and Trust Company (2007 – present). | |||
Brian Harris State Street Financial Center One Lincoln Street Boston, MA 02111 YOB: 1973 | Chief Compliance Officer | Term: Indefinite Elected: 11/13 | Vice President, State Street Global Advisors and SSGA Funds Management, Inc. (June 2013 – Present); Senior Vice President and Global Head of Investment Compliance, BofA Global Capital Management (September 2010 to May 2013); Director of Compliance, AARP Financial Inc. (July 2008 to August 2010). | |||
David K. James State Street Bank and Trust Company 100 Huntington Avenue Boston, MA 02116 YOB: 1970 | Secretary | Term: Indefinite Elected: 4/13 | Managing Director and Managing Counsel, State Street Bank and Trust Company (2009 – present); Vice President and Counsel, PNC Global Investment Servicing (US), Inc. (2006 – 2009). | |||
Kristin Schantz State Street Bank and Trust Company 100 Huntington Avenue Boston, MA 02116 YOB: 1979 | Assistant Secretary | Term: Indefinite Elected: 2/14 | Vice President and Counsel, State Street Bank and Trust Company (2013 – present); Vice President, Citi Fund Services Ohio, Inc. (2008 – 2013). |
| * | Served in various capacities and/or with various affiliated entities during noted time period. |
The Statement of Additional Information includes additional information about the Trustees and is available, without charge, upon request, by calling (toll free) 877-521-4083.
75
Table of Contents
Trustees
William L. Boyan
Michael F. Holland
William L. Marshall
Scott F. Powers
Patrick J. Riley
James E. Ross
Richard D. Shirk
Rina K. Spence
Bruce D. Taber
Douglas T. Williams
Investment Adviser
SSGA Funds Management, Inc.
State Street Financial Center
One Lincoln Street
Boston, MA 02111
Administrator, Custodian and Transfer Agent
State Street Bank and Trust Company
State Street Financial Center
One Lincoln Street
Boston, MA 02111
Independent Public Registered Accounting Firm
Ernst & Young LLP
200 Clarendon Street
Boston, MA 02116
Legal Counsel
Ropes & Gray LLP
800 Boylston Street
Boston, MA 02199
This report is for shareholder information. This is not a prospectus intended for use in the purchase or
sale of shares of beneficial interest.
State Street Master Funds State Street Bank and Trust Company P.O. Box 5049 Boston, MA 02206 | SSITINVAR IBG-14270 |
Table of Contents
Annual Report
31 December 2014
State Street Institutional Investment Trust
State Street Equity 500 Index Fund
State Street Equity 500 Index II Portfolio

Table of Contents
State Street Equity 500 Index Fund (Unaudited)
Administrative Shares
Growth of a $10,000 Investment (a)
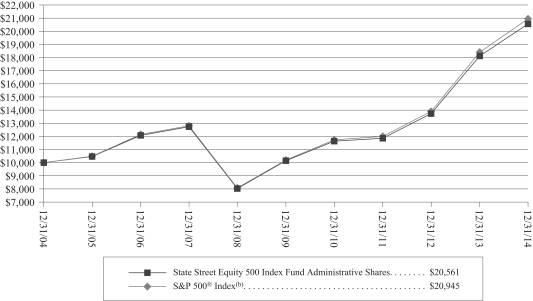
Investment Performance (a)
For the Year Ended December 31, 2014
| Total Return One Year Ended December 31, 2014 | Total Return Average Annual Five Years Ended December 31, 2014 | Total Return Average Annual Ten Years Ended December 31, 2014 | ||||||||||
State Street Equity 500 Index Fund Administrative Shares | 13.41 | % | 15.17 | % | 7.47 | % | ||||||
State Street Equity 500 Index Fund Service Shares | 13.24 | % | 15.05 | % | 7.36 | % | ||||||
State Street Equity 500 Index Fund R Shares(b) | 12.91 | % | 14.66 | % | 6.98 | % | ||||||
State Street Equity 500 Index Fund Class A(c) | 13.07 | % | 14.86 | % | 7.19 | % | ||||||
State Street Equity 500 Index Fund Class I(d) | 13.34 | % | 15.14 | % | 7.45 | % | ||||||
State Street Equity 500 Index Fund Class K(e) | 13.41 | % | 15.17 | % | 7.47 | % | ||||||
S&P 500® Index(f) | 13.68 | % | 15.45 | % | 7.67 | % | ||||||
| (a) | Total returns and performance graph information represent past performance and are not indicative of future results, which may be lower or higher than performance data quoted. Investment return and principal value of an investment will fluctuate so that an investor’s share, when redeemed, may be worth more or less than its original cost. The graph and table above do not reflect the deduction of taxes that a shareholder would pay on fund distributions, sales, or the redemption of fund shares. |
2
Table of Contents
| (b) | NAV performance shown for the periods prior to the inception of Class R shares on June 7, 2005 reflects the historical performance of the fund’s Administrative Shares adjusted to reflect the higher expenses of Class R shares, including applicable 12b-1 fees. |
| (c) | NAV performance shown for the periods prior to the inception of Class A shares on September 17, 2014 reflects the historical performance of the fund’s Administrative Shares adjusted to reflect the higher expenses of Class A shares, including applicable 12b-1 fees. |
| (d) | NAV performance shown for the periods prior to the inception of Class I shares on September 17, 2014 reflects the historical performance of the fund’s Administrative Shares adjusted to reflect the higher expenses of Class I shares, including applicable 12b-1 fees. |
| (e) | NAV performance shown for the periods prior to the inception of Class K shares on September 17, 2014, reflect the historical performance of the fund’s Administrative shares. Had the fund’s Class K fees been reflected, the returns shown for those periods would have been higher. |
| (f) | The Standard & Poor’s 500 Composite Stock Price Index (“S&P 500® Index”) is an unmanaged capitalization-weighted index of 500 widely held stocks recognized by investors to be representative of the stock market in general. It is not possible to invest directly in the S&P 500® Index. |
3
Table of Contents
State Street Equity 500 Index Fund
MANAGEMENT DISCUSSION OF FUND PERFORMANCE
The State Street Equity 500 Index Fund (the “Fund”) seeks to replicate as closely as possible, before expenses, the performance of the Standard & Poor’s 500 Index (the “Index”). In seeking to achieve this objective, the Fund utilizes a passive management strategy designed to track the performance of the Index. The Fund also employs futures to maintain market exposure and otherwise assist in attempting to replicate the performance of the Index. The Fund invested in S&P 500 futures contracts to equitize the small amount of cash in the portfolio during the Reporting Period. Futures performance did not have a material impact on portfolio performance.
For the 12-month period ended December 31, 2014 (the “Reporting Period”), the total return for the Fund’s Administrative Shares was 13.41%, and the total return for the Index was 13.68%. The Fund and Index returns reflect the reinvestment of dividends and other income. The Fund’s performance reflects the expenses of the Fund, including brokerage and advisory expenses. The Index is unmanaged and Index returns do not reflect fees and expenses of any kind, which would have a negative impact on returns. The expenses of managing the Fund and slight variations between the Fund’s holdings and the Index’s constituents contributed to the difference between the Fund’s performance and that of the Index.
The opening quarter of 2014 offered investors plenty of worthwhile return opportunities, but progress was not without pitfalls, and the best results arrived in unlikely corners of the marketplace. A disappointing January brought a number of chillier reports on global economic activity, and the first month of 2014 ended with US stocks hesitating near two-month lows. A weak manufacturing reading in early February served to unnerve investors further, driving averages of larger US equities to the worst levels since late October. But Janet Yellen, newly installed head of the US Federal Reserve, came across as thoroughgoing and confident in her first opportunity to provide formal testimony before Congress. With policy continuity assured, investors used the remainder of February to lift the Index back up and over the record levels at which it had traded near the end of 2013. Although performance of banking names faltered later in March when Citigroup emerged as a prominent failure in Federal Reserve stress tests, prospects for additional share offerings linked to internet and biotechnology themes had already made investors wary of excess equity supply in firms with rapid growth characteristics.
After an initial lift as the second quarter got underway, equities worldwide began once again to struggle with the possibility that growth in 2014 might not evolve as robustly as anticipated. The International Monetary Fund (IMF) contributed further to the uncertainty when it released its updated economic outlook. With interest rates potentially lower for longer than many market participants anticipate and net profit margins on large-cap stocks at 20 year highs, it’s no wonder the equity markets continue to hit record highs. Valuations continued to look attractive especially compared to 10-year interest rates. There was concern, though, amongst investors that the low level of volatility was creating complacency amongst equity owners which would spell trouble for the next correction. However, given the attractive valuations and very few other compelling alternatives, many investors were perhaps begrudgingly adding to their equities. For the quarter, the Index was up 5.22%
Positive earnings news from the US provided some relief from the gloom in the third quarter, as did comments from Fed Chair, Janet Yellen, in testimony before the US Senate. However, July ended with a decided thud, as the market had its biggest down day since February with the Index down 2% on the last day of trading. Equity markets stumbled in September as the Index was down 1.40%
The fourth quarter began as the third quarter ended with stocks sliding and bond markets rallying. The IMF cut its global growth forecasts and interest rates moved lower. US banks began reporting better
4
Table of Contents
State Street Equity 500 Index Fund
MANAGEMENT DISCUSSION OF FUND PERFORMANCE — (continued)
than expected earnings which helped turn the equity rout around. Fed Vice-Chair Stanley Fischer helped improve sentiment when he said, “If foreign growth is weaker than anticipated, the consequences for the US economy could lead the Fed to remove accommodation more slowly than otherwise.” The Index began a dramatic rally and closed out the second half of October with a rise of 8.1% to end the month up 2.44%. The Index was up 2.69% in November which is similar to October’s gain, but the returns for the month were achieved on a much smoother glide upwards than October’s precipitous decline and meteoric rise. December posted a return that was relatively flat, leaving the Fund with a year-to-date return of over 13% for 2014.
On an individual security level, the top positive contributors to the Fund’s performance were: Apple, Inc., Microsoft Corporation and Berkshire Hathaway, Inc. Class B.
The top negative contributors to the Fund’s performance were: Amazon.com, Inc., Exxon Mobil Corp. and International Business Machines Corp.
5
Table of Contents
State Street Equity 500 Index Fund
Statement of Assets and Liabilities
December 31, 2014
Assets | ||||
Investment in State Street Equity 500 Index II Portfolio (39,413,986 shares), at market value (identified cost $394,674,475) | $ | 415,873,125 | ||
Receivable for Fund shares sold | 1,128,923 | |||
Receivable from Adviser (Note 4) | 271,086 | |||
|
| |||
Total assets | 417,273,134 | |||
|
| |||
Liabilities | ||||
Payable for investments purchased | 1,038,987 | |||
Payable for Fund shares repurchased | 86,186 | |||
Distribution fees payable (Note 4) | 82,634 | |||
Management fees payable (Note 4) | 31,235 | |||
Administration fees payable (Note 4) | 28,948 | |||
Insurance expense payable | 11,303 | |||
Custody and accounting fees payable | 4,902 | |||
Registration and filing fees payable | 46,479 | |||
Professional fees payable | 23,868 | |||
Transfer agent fees payable | 12,385 | |||
Sub-transfer agent fee payable (Note 4) | 58 | |||
Miscellaneous fees payable | 13,064 | |||
|
| |||
Total liabilities | 1,380,049 | |||
|
| |||
Net Assets | $ | 415,893,085 | ||
|
| |||
Net Assets Consist of: | ||||
Paid-in capital | $ | 399,689,992 | ||
Accumulated net realized loss | (4,995,557 | ) | ||
Net unrealized appreciation on investments | 21,198,650 | |||
|
| |||
Net Assets | $ | 415,893,085 | ||
|
|
See Notes to Financial Statements.
6
Table of Contents
State Street Equity 500 Index Fund
Statement of Assets and Liabilities — (continued)
December 31, 2014
Net Assets | ||||
Administrative Shares | $ | 248,180,433 | ||
|
| |||
Service Shares | $ | 126,411,810 | ||
|
| |||
Class R | $ | 41,148,459 | ||
|
| |||
Class A | $ | 50,794 | ||
|
| |||
Class K | $ | 50,795 | ||
|
| |||
Class I | $ | 50,794 | ||
|
| |||
Shares of Beneficial Interest Outstanding | ||||
Administrative Shares | 14,372,374 | |||
|
| |||
Service Shares | 7,328,201 | |||
|
| |||
Class R | 2,384,519 | |||
|
| |||
Class A | 2,941 | |||
|
| |||
Class K | 2,941 | |||
|
| |||
Class I | 2,941 | |||
|
| |||
Offering, Net Asset Value, and Redemption Price Per Share | ||||
Administrative Shares | $ | 17.27 | ||
|
| |||
Service Shares | $ | 17.25 | ||
|
| |||
Class R | $ | 17.26 | ||
|
| |||
Class K | $ | 17.27 | ||
|
| |||
Class I | $ | 17.27 | ||
|
| |||
Net Asset Value and Redemption Price Per Share | ||||
Class A | $ | 17.27 | ||
|
| |||
Maximum Sales Charge | ||||
Class A | 5.25 | % | ||
|
| |||
Maximum Offering Price Per Share | ||||
Class A | $ | 18.23 | ||
|
|
See Notes to Financial Statements.
7
Table of Contents
State Street Equity 500 Index Fund
Statement of Operations
Year Ended December 31, 2014*
Income | ||||
Dividend income allocated from the former Master Portfolio** (Note 2) | $ | 4,567,722 | ||
Interest income allocated from the former Master Portfolio** (Note 2) | 3,362 | |||
Expenses allocated from the former Master Portfolio** (Note 2) | (103,754 | ) | ||
Dividend income from affiliated issuer | 3,263,757 | |||
|
| |||
| 7,731,087 | ||||
|
| |||
Expenses | ||||
Management fees (Note 4) | 31,235 | |||
Administration fees (Note 4) | 193,382 | |||
Custody and accounting fees (Note 4) | 4,902 | |||
Sub-transfer agent fee (Note 4) | ||||
Class A | 29 | |||
Class I | 29 | |||
Distribution fees (Note 4) | ||||
Administrative Shares | 353,830 | |||
Service Shares | 286,261 | |||
Class R | 217,989 | |||
Class A | 36 | |||
Registration and filing fees | 108,912 | |||
Professional fees | 25,296 | |||
Transfer agent fees (Note 4) | 46,470 | |||
Insurance expense | 11,303 | |||
Printing fees | 56,585 | |||
Miscellaneous fees | 2,000 | |||
|
| |||
Total expenses | 1,338,259 | |||
Less: Expenses reimbursed by the Adviser (Note 4) | (271,086 | ) | ||
|
| |||
Net expenses | 1,067,173 | |||
|
| |||
Net Investment Income | 6,663,914 | |||
|
| |||
Realized and Unrealized Gain (Loss) | ||||
Net realized gain on: | ||||
Investments – allocated from the former Master Portfolio** | 922,268 | |||
Futures – allocated from the former Master Portfolio** | 682,158 | |||
Investments in affiliated issuer | 311,768 | |||
Capital gains distributions from affiliated issuer | 2,956,218 | |||
|
| |||
| 4,872,412 | ||||
|
| |||
Change in net unrealized appreciation (depreciation) on: | ||||
Investments – allocated from the former Master Portfolio** | 15,986,809 | |||
Futures – allocated from the former Master Portfolio** | (321,596 | ) | ||
Investments in affiliated issuer | 21,287,139 | |||
|
| |||
| 36,952,352 | ||||
|
| |||
Net realized and unrealized gain | 41,824,764 | |||
|
| |||
Net Increase in Net Assets Resulting from Operations | $ | 48,488,678 | ||
|
|
| * | Effective August 11, 2014, the Fund invests substantially all of its investable assets in State Street Equity 500 Index II Portfolio (Note 1). |
| ** | State Street Equity 500 Index Portfolio |
See Notes to Financial Statements.
8
Table of Contents
State Street Equity 500 Index Fund
Statement of Changes in Net Assets
| Year Ended December 31, 2014* | Year Ended December 31, 2013 | |||||||
Increase (Decrease) in Net Assets Resulting from: | ||||||||
Operations: | ||||||||
Net investment income | $ | 6,663,914 | $ | 6,033,399 | ||||
Net realized gain (loss) on investments and futures | 4,872,412 | 3,768,702 | ||||||
Change in net unrealized appreciation on investments and futures | 36,952,352 | 83,670,839 | ||||||
|
|
|
| |||||
Net increase in net assets from operations | 48,488,678 | 93,472,940 | ||||||
|
|
|
| |||||
Distributions to Shareholders from: | ||||||||
Net investment income | ||||||||
Administrative Shares | (4,368,794 | ) | (3,753,200 | ) | ||||
Service Shares | (2,087,460 | ) | (1,891,555 | ) | ||||
Class R | (543,044 | ) | (386,402 | ) | ||||
Class A | (853 | ) | – | |||||
Class K | (920 | ) | – | |||||
Class I | (890 | ) | – | |||||
|
|
|
| |||||
Total distributions | (7,001,961 | ) | (6,031,157 | ) | ||||
|
|
|
| |||||
Net Increase (Decrease) from Fund Share Transactions: | ||||||||
Administrative Shares | ||||||||
Shares sold | 24,425,275 | 12,756,678 | ||||||
Reinvestment of distributions | 4,368,794 | 3,753,200 | ||||||
Shares redeemed | (36,318,004 | ) | (25,196,235 | ) | ||||
|
|
|
| |||||
Net increase (decrease) from Fund share transactions | (7,523,935 | ) | (8,686,357 | ) | ||||
|
|
|
| |||||
Service Shares | ||||||||
Shares sold | 21,364,651 | 45,516,297 | ||||||
Reinvestment of distribution | 2,087,460 | 1,891,555 | ||||||
Shares redeemed | (34,078,747 | ) | (38,161,275 | ) | ||||
|
|
|
| |||||
Net increase (decrease) from Fund share transactions | (10,626,636 | ) | 9,246,577 | |||||
|
|
|
| |||||
Class R | ||||||||
Shares sold | 8,619,272 | 8,134,393 | ||||||
Reinvestment of distributions | 543,044 | 386,402 | ||||||
Shares redeemed | (4,524,963 | ) | (5,041,155 | ) | ||||
|
|
|
| |||||
Net increase (decrease) from Fund share transactions | 4,637,353 | 3,479,640 | ||||||
|
|
|
| |||||
Class A | ||||||||
Shares sold | 50,000 | – | ||||||
|
|
|
| |||||
Class K | ||||||||
Shares sold | 50,000 | – | ||||||
|
|
|
| |||||
Class I | ||||||||
Shares sold | 50,000 | – | ||||||
|
|
|
| |||||
Net Increase in Net Assets | 28,123,499 | 91,481,643 | ||||||
Net Assets | ||||||||
Beginning of year | 387,769,586 | 296,287,943 | ||||||
|
|
|
| |||||
End of year | $ | 415,893,085 | $ | 387,769,586 | ||||
|
|
|
| |||||
Undistributed net investment income | $ | – | $ | 218,696 | ||||
|
|
|
| |||||
See Notes to Financial Statements.
9
Table of Contents
State Street Equity 500 Index Fund
Statement of Changes in Net Assets — (continued)
| Year Ended December 31, 2014* | Year Ended December 31, 2013 | |||||||
Changes in Shares: | ||||||||
Administrative Shares | ||||||||
Shares sold | 1,493,957 | 920,980 | ||||||
Reinvestment of distributions | 250,217 | 243,083 | ||||||
Shares redeemed | (2,229,714 | ) | (1,883,503 | ) | ||||
|
|
|
| |||||
Net increase (decrease) in shares | (485,540 | ) | (719,440 | ) | ||||
|
|
|
| |||||
Service Shares | ||||||||
Shares sold | 1,305,903 | 3,342,278 | ||||||
Reinvestment of distributions | 119,694 | 122,589 | ||||||
Shares redeemed | (2,161,357 | ) | (2,816,214 | ) | ||||
|
|
|
| |||||
Net increase (decrease) in shares | (735,760 | ) | 648,653 | |||||
|
|
|
| |||||
Class R Shares | ||||||||
Shares sold | 529,045 | 593,140 | ||||||
Reinvestment of distributions | 31,120 | 25,026 | ||||||
Shares redeemed | (276,992 | ) | (357,436 | ) | ||||
|
|
|
| |||||
Net increase (decrease) in shares | 283,173 | 260,730 | ||||||
|
|
|
| |||||
Class A | ||||||||
Shares sold | 2,941 | – | ||||||
|
|
|
| |||||
Class K | ||||||||
Shares sold | 2,941 | – | ||||||
|
|
|
| |||||
Class I | ||||||||
Shares sold | 2,941 | – | ||||||
|
|
|
| |||||
| * | Effective August 11, 2014, the Fund invests substantially all of its investable assets in State Street Equity 500 Index II Portfolio (Note 1). |
See Notes to Financial Statements.
10
Table of Contents
State Street Equity 500 Index Fund
Financial Highlights
Selected data for an Administrative Share of beneficial interest outstanding throughout each year is presented below:
| Year Ended 12/31/14 | Year Ended 12/31/13 | Year Ended 12/31/12 | Year Ended 12/31/11 | Year Ended 12/31/10 | ||||||||||||||||
Per Share Operating Performance:(a) | ||||||||||||||||||||
Net Asset Value, Beginning of Year | $ | 15.50 | $ | 11.94 | $ | 10.51 | $ | 10.52 | $ | 9.31 | ||||||||||
|
|
|
|
|
|
|
|
|
| |||||||||||
Investment Operations: | ||||||||||||||||||||
Net investment income(b) | 0.29 | 0.26 | 0.24 | 0.20 | 0.17 | |||||||||||||||
Net realized and unrealized gain (loss) on investments | 1.79 | 3.56 | 1.42 | (0.01 | ) | 1.21 | ||||||||||||||
|
|
|
|
|
|
|
|
|
| |||||||||||
Total from investment operations | 2.08 | 3.82 | 1.66 | 0.19 | 1.38 | |||||||||||||||
|
|
|
|
|
|
|
|
|
| |||||||||||
Less Distributions From: | ||||||||||||||||||||
Net investment income | (0.31 | ) | (0.26 | ) | (0.23 | ) | (0.20 | ) | (0.17 | ) | ||||||||||
|
|
|
|
|
|
|
|
|
| |||||||||||
Net increase (decrease) in net assets | 1.77 | 3.56 | 1.43 | (0.01 | ) | 1.21 | ||||||||||||||
|
|
|
|
|
|
|
|
|
| |||||||||||
Net Asset Value, End of Year | $ | 17.27 | $ | 15.50 | $ | 11.94 | $ | 10.51 | $ | 10.52 | ||||||||||
|
|
|
|
|
|
|
|
|
| |||||||||||
Total Return(c) | 13.41 | % | 31.97 | % | 15.84 | % | 1.79 | % | 14.81 | % | ||||||||||
Ratios and Supplemental Data: | ||||||||||||||||||||
Net Assets, End of Year (000s) | $ | 248,180 | $ | 230,330 | $ | 185,918 | $ | 161,813 | $ | 165,883 | ||||||||||
Ratios to average net assets:(a) | ||||||||||||||||||||
Gross expenses | 0.300 | %(f) | 0.245 | % | 0.245 | % | 0.245 | % | 0.245 | % | ||||||||||
Net expenses | 0.231 | %(f) | 0.245 | % | 0.245 | % | 0.245 | % | 0.245 | % | ||||||||||
Net investment income | 1.78 | % | 1.84 | % | 2.06 | % | 1.83 | % | 1.79 | % | ||||||||||
Portfolio turnover rate | 4 | %(d) | 4 | %(e) | 9 | %(e) | 15 | %(e) | 12 | %(e) | ||||||||||
| (a) | Prior to August 11, 2014, the per share amounts and percentages included the Fund’s proportionate share of income and expenses of the State Street Equity 500 Index Portfolio. |
| (b) | Net investment income per share is calculated using the average shares method. |
| (c) | Total return is calculated assuming a purchase of shares at net asset value on the first day and a sale at net asset value on the last day of each period reported. Distributions are assumed, for the purpose of this calculation, to be reinvested at net asset value per share on the respective payment dates. Results represent past performance and are not indicative of future results. |
| (d) | Portfolio turnover rate is calculated from the State Street Equity 500 Index Portfolio (from 1/1/2014 to 8/10/2014) and the State Street Equity 500 Index II Portfolio (from 8/11/2014 to 12/31/2014). |
| (e) | Portfolio turnover rate is from the State Street Equity 500 Index Portfolio. |
| (f) | Ratio includes expenses allocated from the State Street Equity 500 Index Portfolio from 1/1/2014 through 8/10/2014, and does not include the expenses of the State Street Equity Index II Portfolio from 8/11/2014 through 12/31/2014. |
See Notes to Financial Statements.
11
Table of Contents
State Street Equity 500 Index Fund
Financial Highlights
Selected data for a Service Share of beneficial interest outstanding throughout each year is presented below:
| Year Ended 12/31/14 | Year Ended 12/31/13 | Year Ended 12/31/12 | Year Ended 12/31/11 | Year Ended 12/31/10 | ||||||||||||||||
Per Share Operating Performance:(a) | ||||||||||||||||||||
Net Asset Value, Beginning of Year | $ | 15.49 | $ | 11.92 | $ | 10.50 | $ | 10.51 | $ | 9.30 | ||||||||||
|
|
|
|
|
|
|
|
|
| |||||||||||
Investment Operations: | ||||||||||||||||||||
Net investment income(b) | 0.28 | 0.24 | 0.23 | 0.19 | 0.16 | |||||||||||||||
Net realized and unrealized gain (loss) on investments | 1.77 | 3.57 | 1.41 | (0.01 | ) | 1.21 | ||||||||||||||
|
|
|
|
|
|
|
|
|
| |||||||||||
Total from investment operations | 2.05 | 3.81 | 1.64 | 0.18 | 1.37 | |||||||||||||||
|
|
|
|
|
|
|
|
|
| |||||||||||
Less Distributions From: | ||||||||||||||||||||
Net investment income | (0.29 | ) | (0.24 | ) | (0.22 | ) | (0.19 | ) | (0.16 | ) | ||||||||||
|
|
|
|
|
|
|
|
|
| |||||||||||
Net increase (decrease) in net assets | 1.76 | 3.57 | 1.42 | (0.01 | ) | 1.21 | ||||||||||||||
|
|
|
|
|
|
|
|
|
| |||||||||||
Net Asset Value, End of Year | $ | 17.25 | $ | 15.49 | $ | 11.92 | $ | 10.50 | $ | 10.51 | ||||||||||
|
|
|
|
|
|
|
|
|
| |||||||||||
Total Return(c) | 13.24 | % | 31.97 | % | 15.64 | % | 1.69 | % | 14.71 | % | ||||||||||
Ratios and Supplemental Data: | ||||||||||||||||||||
Net Assets, End of Year (000s) | $ | 126,412 | $ | 124,885 | $ | 88,416 | $ | 77,600 | $ | 78,203 | ||||||||||
Ratios to average net assets: | ||||||||||||||||||||
Gross expenses | 0.401 | %(f) | 0.345 | % | 0.345 | % | 0.345 | % | 0.345 | % | ||||||||||
Net expenses | 0.331 | %(f) | 0.345 | % | 0.345 | % | 0.345 | % | 0.345 | % | ||||||||||
Net investment income | 1.73 | % | 1.74 | % | 1.96 | % | 1.74 | % | 1.69 | % | ||||||||||
Portfolio turnover rate | 4 | %(d) | 4 | %(e) | 9 | %(e) | 15 | %(e) | 12 | %(e) | ||||||||||
| (a) | Prior to August 11, 2014, the per share amounts and percentages included the Fund’s proportionate share of income and expenses of the State Street Equity 500 Index Portfolio. |
| (b) | Net investment income per share is calculated using the average shares method. |
| (c) | Total return is calculated assuming a purchase of shares at net asset value on the first day and a sale at net asset value on the last day of each period reported. Distributions are assumed, for the purpose of this calculation, to be reinvested at net asset value per share on the respective payment dates. Results represent past performance and are not indicative of future results. |
| (d) | Portfolio turnover rate is calculated from the State Street Equity 500 Index Portfolio (from 1/1/2014 to 8/10/2014) and the State Street Equity 500 Index II Portfolio (from 8/11/2014 to 12/31/2014). |
| (e) | Portfolio turnover rate is from the State Street Equity 500 Index Portfolio. |
| (f) | Ratio includes expenses allocated from the State Street Equity 500 Index Portfolio from 1/1/2014 through 8/10/2014, and does not include the expenses of the State Street Equity Index II Portfolio from 8/11/2014 through 12/31/2014. |
See Notes to Financial Statements.
12
Table of Contents
State Street Equity 500 Index Fund
Financial Highlights
Selected data for a Class R Share of beneficial interest outstanding throughout each year is presented below:
| Year Ended 12/31/14 | Year Ended 12/31/13 | Year Ended 12/31/12 | Year Ended 12/31/11 | Year Ended 12/31/10 | ||||||||||||||||
Per Share Operating Performance:(a) | ||||||||||||||||||||
Net Asset Value, Beginning of Year | $ | 15.49 | $ | 11.93 | $ | 10.51 | $ | 10.51 | $ | 9.30 | ||||||||||
|
|
|
|
|
|
|
|
|
| |||||||||||
Investment Operations: | ||||||||||||||||||||
Net investment income(b) | 0.22 | 0.19 | 0.19 | 0.15 | 0.13 | |||||||||||||||
Net realized and unrealized gain on investments | 1.78 | 3.56 | 1.41 | – | 1.20 | |||||||||||||||
|
|
|
|
|
|
|
|
|
| |||||||||||
Total from investment operations | 2.00 | 3.75 | 1.60 | 0.15 | 1.33 | |||||||||||||||
|
|
|
|
|
|
|
|
|
| |||||||||||
Less Distributions From: | ||||||||||||||||||||
Net investment income | (0.23 | ) | (0.19 | ) | (0.18 | ) | (0.15 | ) | (0.12 | ) | ||||||||||
|
|
|
|
|
|
|
|
|
| |||||||||||
Net increase in net assets | 1.77 | 3.56 | 1.42 | 0.00 | 1.21 | |||||||||||||||
|
|
|
|
|
|
|
|
|
| |||||||||||
Net Asset Value, End of Year | $ | 17.26 | $ | 15.49 | $ | 11.93 | $ | 10.51 | $ | 10.51 | ||||||||||
|
|
|
|
|
|
|
|
|
| |||||||||||
Total Return(c) | 12.91 | % | 31.40 | % | 15.22 | % | 1.42 | % | 14.31 | % | ||||||||||
Ratios and Supplemental Data: | ||||||||||||||||||||
Net Assets, End of Year (000s) | $ | 41,148 | $ | 32,555 | $ | 21,954 | $ | 16,363 | $ | 13,862 | ||||||||||
Ratios to average net assets:(a) | ||||||||||||||||||||
Gross expenses | 0.754 | %(f) | 0.695 | % | 0.695 | % | 0.695 | % | 0.695 | % | ||||||||||
Net expenses | 0.680 | %(f) | 0.695 | % | 0.695 | % | 0.695 | % | 0.695 | % | ||||||||||
Net investment income | 1.37 | % | 1.40 | % | 1.62 | % | 1.40 | % | 1.35 | % | ||||||||||
Portfolio turnover rate | 4 | %(d) | 4 | %(e) | 9 | %(e) | 15 | %(e) | 12 | %(e) | ||||||||||
| (a) | Prior to August 11, 2014, the per share amounts and percentages included the Fund’s proportionate share of income and expenses of the State Street Equity 500 Index Portfolio. |
| (b) | Net investment income per share is calculated using the average shares method. |
| (c) | Total return is calculated assuming a purchase of shares at net asset value on the first day and a sale at net asset value on the last day of each period reported. Distributions are assumed, for the purpose of this calculation, to be reinvested at net asset value per share on the respective payment dates. Results represent past performance and are not indicative of future results. |
| (d) | Portfolio turnover rate is calculated from the State Street Equity 500 Index Portfolio (from 1/1/2014 to 8/10/2014) and the State Street Equity 500 Index II Portfolio (from 8/11/2014 to 12/31/2014). |
| (e) | Portfolio turnover rate is from the State Street Equity 500 Index Portfolio. |
| (f) | Ratio includes expenses allocated from the State Street Equity 500 Index Portfolio from 1/1/2014 through 8/10/2014, and does not include the expenses of the State Street Equity Index II Portfolio from 8/11/2014 through 12/31/2014. |
See Notes to Financial Statements.
13
Table of Contents
State Street Equity 500 Index Fund
Financial Highlights
Selected data for a Class A Share of beneficial interest outstanding throughout the period is presented below:
| Period Ended 12/31/14(a) | ||||
Per Share Operating Performance: | ||||
Net Asset Value, Beginning of Year | $ | 17.00 | ||
|
| |||
Investment Operations: | ||||
Net investment income(b) | 0.11 | |||
Net realized and unrealized gain on investments | 0.45 | |||
|
| |||
Total from investment operations | 0.56 | |||
|
| |||
Less Distributions From: | ||||
Net investment income | (0.29 | ) | ||
|
| |||
Net increase in net assets | 0.27 | |||
|
| |||
Net Asset Value, End of Year | $ | 17.27 | ||
|
| |||
Total Return(c) | 3.28 | % | ||
Ratios and Supplemental Data: | ||||
Net Assets, End of Year (000s) | $ | 51 | ||
Ratios to average net assets: | ||||
Gross expenses(f) | 0.700 | %* | ||
Net expenses(f) | 0.507 | %* | ||
Net investment income | 2.32 | %* | ||
Portfolio turnover rate(d)(e) | 4 | % | ||
| (a) | The Fund’s Class A Shares commenced operations on September 17, 2014. |
| (b) | Net investment income per share is calculated using the average shares method. |
| (c) | Total return is calculated assuming a purchase of shares at net asset value on the first day and a sale at net asset value on the last day of each period reported. Distributions are assumed, for the purpose of this calculation, to be reinvested at net asset value per share on the respective payment dates. Total returns for periods of less than one year are not annualized. Results represent past performance and are not indicative of future results. |
| (d) | Portfolio turnover rate is calculated from the State Street Equity 500 Index Portfolio (from 1/1/2014 to 8/10/2014) and the State Street Equity 500 Index II Portfolio (from 8/11/2014 to 12/31/2014). |
| (e) | Not annualized. |
| (f) | Ratio does not include the expenses of the State Street Equity 500 Index II Portfolio. |
| * | Annualized. |
See Notes to Financial Statements.
14
Table of Contents
State Street Equity 500 Index Fund
Financial Highlights
Selected data for a Class K Share of beneficial interest outstanding throughout the period is presented below:
| Period Ended 12/31/14(a) | ||||
Per Share Operating Performance: | ||||
Net Asset Value, Beginning of Year | $ | 17.00 | ||
|
| |||
Investment Operations: | ||||
Net investment income(b) | 0.14 | |||
Net realized and unrealized gain on investments | 0.44 | |||
|
| |||
Total from investment operations | 0.58 | |||
|
| |||
Less Distributions From: | ||||
Net investment income | (0.31 | ) | ||
|
| |||
Net increase in net assets | 0.27 | |||
|
| |||
Net Asset Value, End of Year | $ | 17.27 | ||
|
| |||
Total Return(c) | 3.41 | % | ||
Ratios and Supplemental Data: | ||||
Net Assets, End of Year (000s) | $ | 51 | ||
Ratios to average net assets: | ||||
Gross expenses(f) | 0.272 | %* | ||
Net expenses(f) | 0.057 | %* | ||
Net investment income | 2.78 | %* | ||
Portfolio turnover rate(d)(e) | 4 | % | ||
| (a) | The Fund’s Class K Shares commenced operations on September 17, 2014. |
| (b) | Net investment income per share is calculated using the average shares method. |
| (c) | Total return is calculated assuming a purchase of shares at net asset value on the first day and a sale at net asset value on the last day of each period reported. Distributions are assumed, for the purpose of this calculation, to be reinvested at net asset value per share on the respective payment dates. Total returns for periods of less than one year are not annualized. Results represent past performance and are not indicative of future results. |
| (d) | Portfolio turnover rate is calculated from the State Street Equity 500 Index Portfolio (from 1/1/2014 to 8/10/2014) and the State Street Equity 500 Index II Portfolio (from 8/11/2014 to 12/31/2014). |
| (e) | Not annualized. |
| (f) | Ratio does not include the expenses of the State Street Equity 500 Index II Portfolio. |
| * | Annualized. |
See Notes to Financial Statements.
15
Table of Contents
State Street Equity 500 Index Fund
Financial Highlights
Selected data for a Class I Share of beneficial interest outstanding throughout the period is presented below:
| Period Ended 12/31/14(a) | ||||
Per Share Operating Performance: | ||||
Net Asset Value, Beginning of Year | $ | 17.00 | ||
|
| |||
Investment Operations: | ||||
Net investment income(b) | 0.13 | |||
Net realized and unrealized gain on investments | 0.44 | |||
|
| |||
Total from investment operations | 0.57 | |||
|
| |||
Less Distributions From: | ||||
Net investment income | (0.30 | ) | ||
|
| |||
Net increase in net assets | 0.27 | |||
|
| |||
Net Asset Value, End of Year | $ | 17.27 | ||
|
| |||
Total Return(c) | 3.35 | % | ||
Ratios and Supplemental Data: | ||||
Net Assets, End of Year (000s) | $ | 51 | ||
Ratios to average net assets: | ||||
Gross expenses(f) | 0.450 | %* | ||
Net expenses(f) | 0.258 | %* | ||
Net investment income | 2.57 | %* | ||
Portfolio turnover rate(d)(e) | 4 | % | ||
| (a) | The Fund’s Class I Shares commenced operations on September 17, 2014. |
| (b) | Net investment income per share is calculated using the average shares method. |
| (c) | Total return is calculated assuming a purchase of shares at net asset value on the first day and a sale at net asset value on the last day of each period reported. Distributions are assumed, for the purpose of this calculation, to be reinvested at net asset value per share on the respective payment dates. Total returns for periods of less than one year are not annualized. Results represent past performance and are not indicative of future results. |
| (d) | Portfolio turnover rate is calculated from the State Street Equity 500 Index Portfolio (from 1/1/2014 to 8/10/2014) and the State Street Equity 500 Index II Portfolio (from 8/11/2014 to 12/31/2014). |
| (e) | Not annualized. |
| (f) | Ratio does not include the expenses of the State Street Equity 500 Index II Portfolio. |
| * | Annualized. |
See Notes to Financial Statements.
16
Table of Contents
State Street Equity 500 Index II Portfolio
Portfolio Statistics (Unaudited)
Portfolio Composition* | December 31, 2014 | |||
Common Stocks | 97.3 | % | ||
Money Market Funds | 2.4 | |||
Other Assets in Excess of Liabilities | 0.3 | |||
Total | 100.0 | % |
Top Five Sectors (excluding short-term investments)* | December 31, 2014 | |||
Information Technology | 19.2 | % | ||
Financials | 16.2 | |||
Health Care | 13.9 | |||
Consumer Discretionary | 11.8 | |||
Industrials | 10.1 | |||
Total | 71.2 | % |
| * | As a percentage of net assets as of the date indicated. The Portfolio’s composition will vary over time. |
See Notes to Financial Statements.
17
Table of Contents
State Street Equity 500 Index II Portfolio
Portfolio of Investments
December 31, 2014
| Shares | Value | |||||||
COMMON STOCKS – 97.3% | ||||||||
Consumer Discretionary – 11.8% | ||||||||
Amazon.com, Inc.(a) | 8,690 | $ | 2,696,941 | |||||
AutoNation, Inc.(a) | 1,894 | 114,417 | ||||||
AutoZone, Inc.(a) | 776 | 480,429 | ||||||
Bed Bath & Beyond, Inc.(a) | 4,415 | 336,291 | ||||||
Best Buy Co., Inc. | 6,406 | 249,706 | ||||||
BorgWarner, Inc. | 4,977 | 273,486 | ||||||
Cablevision Systems Corp. | 4,788 | 98,824 | ||||||
CarMax, Inc.(a) | 5,003 | 333,100 | ||||||
Carnival Corp. | 10,201 | 462,411 | ||||||
CBS Corp. Class B | 10,742 | 594,462 | ||||||
Chipotle Mexican Grill, Inc.(a) | 686 | 469,574 | ||||||
Coach, Inc. | 6,028 | 226,412 | ||||||
Comcast Corp. Class A | 58,883 | 3,415,803 | ||||||
D.R. Horton, Inc. | 7,797 | 197,186 | ||||||
Darden Restaurants, Inc. | 2,771 | 162,464 | ||||||
Delphi Automotive PLC | 6,819 | 495,878 | ||||||
DIRECTV(a) | 11,402 | 988,553 | ||||||
Discovery Communications, Inc. Class A(a) | 3,303 | 113,788 | ||||||
Discovery Communications, Inc. Class C(a) | 6,003 | 202,421 | ||||||
Dollar General Corp.(a) | 7,013 | 495,819 | ||||||
Dollar Tree, Inc.(a) | 4,707 | 331,279 | ||||||
Expedia, Inc. | 2,334 | 199,230 | ||||||
Family Dollar Stores, Inc. | 2,093 | 165,787 | ||||||
Ford Motor Co. | 88,638 | 1,373,889 | ||||||
Fossil Group, Inc.(a) | 983 | 108,857 | ||||||
GameStop Corp. Class A | 2,622 | 88,624 | ||||||
Gannett Co., Inc. | 5,322 | 169,931 | ||||||
Gap, Inc. | 5,934 | 249,881 | ||||||
Garmin Ltd. | 2,640 | 139,471 | ||||||
General Motors Co. | 30,723 | 1,072,540 | ||||||
Genuine Parts Co. | 3,389 | 361,166 | ||||||
Goodyear Tire & Rubber Co. | 6,344 | 181,248 | ||||||
H&R Block, Inc. | 5,864 | 197,500 | ||||||
Harley-Davidson, Inc. | 4,816 | 317,423 | ||||||
Harman International Industries, Inc. | 1,616 | 172,443 | ||||||
Hasbro, Inc. | 2,397 | 131,811 | ||||||
Home Depot, Inc. | 30,102 | 3,159,807 | ||||||
Interpublic Group of Cos., Inc. | 9,666 | 200,763 | ||||||
Johnson Controls, Inc. | 14,980 | 724,133 | ||||||
Kohl’s Corp. | 4,645 | 283,531 | ||||||
L Brands, Inc. | 5,721 | 495,153 | ||||||
Leggett & Platt, Inc. | 3,254 | 138,653 | ||||||
Lennar Corp. Class A | 4,106 | 183,990 | ||||||
Lowe’s Cos., Inc. | 22,350 | 1,537,680 | ||||||
Macy’s, Inc. | 7,762 | 510,351 | ||||||
Marriott International, Inc. Class A | 4,753 | 370,877 | ||||||
Mattel, Inc. | 7,433 | 230,014 | ||||||
McDonald’s Corp. | 22,310 | 2,090,447 | ||||||
Michael Kors Holdings, Ltd.(a) | 4,514 | 339,001 | ||||||
Mohawk Industries, Inc.(a) | 1,331 | 206,784 | ||||||
Netflix, Inc.(a) | 1,372 | 468,689 | ||||||
Newell Rubbermaid, Inc. | 5,842 | 222,522 | ||||||
News Corp. Class A(a) | 10,788 | 169,264 | ||||||
NIKE, Inc. Class B | 16,053 | 1,543,496 | ||||||
Nordstrom, Inc. | 3,177 | 252,222 | ||||||
O’Reilly Automotive, Inc.(a) | 2,280 | 439,174 | ||||||
Omnicom Group, Inc. | 5,691 | 440,882 | ||||||
PetSmart, Inc. | 2,327 | 189,173 | ||||||
Priceline Group, Inc.(a) | 1,182 | 1,347,728 | ||||||
PulteGroup, Inc. | 7,362 | 157,989 | ||||||
PVH Corp. | 1,749 | 224,169 | ||||||
Ralph Lauren Corp. | 1,479 | 273,852 | ||||||
Ross Stores, Inc. | 4,628 | 436,235 | ||||||
Royal Caribbean Cruises, Ltd. | 3,700 | 304,991 | ||||||
Scripps Networks Interactive, Inc. Class A | 2,372 | 178,540 | ||||||
Staples, Inc. | 14,799 | 268,158 | ||||||
Starbucks Corp. | 16,815 | 1,379,671 | ||||||
Starwood Hotels & Resorts Worldwide, Inc. | 4,203 | 340,737 | ||||||
Target Corp. | 14,272 | 1,083,387 | ||||||
Tiffany & Co. | 2,499 | 267,043 | ||||||
Time Warner Cable, Inc. | 6,497 | 987,934 | ||||||
Time Warner, Inc. | 19,311 | 1,649,546 | ||||||
TJX Cos., Inc. | 15,737 | 1,079,243 | ||||||
Tractor Supply Co. | 3,026 | 238,509 | ||||||
TripAdvisor, Inc.(a) | 2,442 | 182,320 | ||||||
Twenty-First Century Fox, Inc. | 42,600 | 1,636,053 | ||||||
Under Armour, Inc. Class A(a) | 3,924 | 266,440 | ||||||
Urban Outfitters, Inc.(a) | 2,461 | 86,455 | ||||||
V.F. Corp. | 7,744 | 580,026 | ||||||
Viacom, Inc. Class B | 8,381 | 630,670 | ||||||
Walt Disney Co. | 35,652 | 3,358,062 | ||||||
Whirlpool Corp. | 1,702 | 329,745 | ||||||
Wyndham Worldwide Corp. | 2,753 | 236,097 | ||||||
Wynn Resorts, Ltd. | 1,841 | 273,867 | ||||||
Yum! Brands, Inc. | 9,902 | 721,361 | ||||||
|
| |||||||
| 50,384,479 | ||||||||
|
| |||||||
Consumer Staples – 9.5% | ||||||||
Altria Group, Inc. | 45,329 | 2,233,360 | ||||||
Archer-Daniels-Midland Co. | 14,432 | 750,464 | ||||||
Avon Products, Inc. | 9,102 | 85,468 | ||||||
Brown-Forman Corp. Class B | 3,521 | 309,285 | ||||||
Campbell Soup Co. | 3,882 | 170,808 | ||||||
Clorox Co. | 2,764 | 288,036 | ||||||
Coca-Cola Co. | 90,100 | 3,804,022 | ||||||
Coca-Cola Enterprises, Inc. | 4,988 | 220,569 | ||||||
Colgate-Palmolive Co. | 19,723 | 1,364,634 | ||||||
ConAgra Foods, Inc. | 9,224 | 334,647 | ||||||
Constellation Brands, Inc. Class A(a) | 3,850 | 377,954 | ||||||
Costco Wholesale Corp. | 9,855 | 1,396,946 | ||||||
CVS Health Corp. | 25,905 | 2,494,910 | ||||||
Dr. Pepper Snapple Group, Inc. | 4,397 | 315,177 | ||||||
Estee Lauder Cos., Inc. Class A | 4,941 | 376,504 | ||||||
General Mills, Inc. | 14,042 | 748,860 | ||||||
Hershey Co. | 3,267 | 339,539 | ||||||
Hormel Foods Corp. | 2,851 | 148,537 | ||||||
J.M. Smucker Co. | 2,305 | 232,759 | ||||||
Kellogg Co. | 5,628 | 368,296 | ||||||
Keurig Green Mountain, Inc. | 2,711 | 358,923 | ||||||
Kimberly-Clark Corp. | 8,527 | 985,210 | ||||||
Kraft Foods Group, Inc. | 13,618 | 853,304 | ||||||
Kroger Co. | 11,421 | 733,342 | ||||||
Lorillard, Inc. | 7,955 | 500,688 | ||||||
McCormick & Co., Inc. | 2,792 | 207,446 | ||||||
Mead Johnson Nutrition Co. | 4,450 | 447,403 | ||||||
Molson Coors Brewing Co. Class B | 3,653 | 272,222 | ||||||
Mondelez International, Inc. Class A | 37,815 | 1,373,630 | ||||||
Monster Beverage Corp.(a) | 3,353 | 363,298 | ||||||
See Notes to Financial Statements.
18
Table of Contents
State Street Equity 500 Index II Portfolio
Portfolio of Investments — (continued)
December 31, 2014
| Shares | Value | |||||||
COMMON STOCKS – (continued) | ||||||||
Consumer Staples – (continued) | ||||||||
PepsiCo, Inc. | 34,216 | $ | 3,235,465 | |||||
Philip Morris International, Inc. | 35,512 | 2,892,452 | ||||||
Procter & Gamble Co. | 61,658 | 5,616,427 | ||||||
Reynolds American, Inc. | 7,004 | 450,147 | ||||||
Safeway, Inc. | 4,999 | 175,565 | ||||||
Sysco Corp. | 13,774 | 546,690 | ||||||
Tyson Foods, Inc. Class A | 6,744 | 270,367 | ||||||
Wal-Mart Stores, Inc. | 36,103 | 3,100,526 | ||||||
Walgreens Boots Alliance, Inc. | 19,705 | 1,501,521 | ||||||
Whole Foods Market, Inc. | 8,079 | 407,343 | ||||||
|
| |||||||
| 40,652,744 | ||||||||
|
| |||||||
Energy – 8.2% | ||||||||
Anadarko Petroleum Corp. | 11,382 | 939,015 | ||||||
Apache Corp. | 8,755 | 548,676 | ||||||
Baker Hughes, Inc. | 9,679 | 542,702 | ||||||
Cabot Oil & Gas Corp. | 9,078 | 268,800 | ||||||
Cameron International Corp.(a) | 4,533 | 226,423 | ||||||
Chesapeake Energy Corp. | 11,188 | 218,949 | ||||||
Chevron Corp. | 43,112 | 4,836,304 | ||||||
Cimarex Energy Co. | 1,858 | 196,948 | ||||||
ConocoPhillips | 28,227 | 1,949,357 | ||||||
Consol Energy, Inc. | 5,000 | 169,050 | ||||||
Denbury Resources, Inc. | 8,271 | 67,243 | ||||||
Devon Energy Corp. | 8,601 | 526,467 | ||||||
Diamond Offshore Drilling, Inc. | 1,546 | 56,754 | ||||||
Ensco PLC Class A | 5,111 | 153,074 | ||||||
EOG Resources, Inc. | 12,271 | 1,129,791 | ||||||
EQT Corp. | 3,457 | 261,695 | ||||||
ExxonMobil Corp. | 96,475 | 8,919,114 | ||||||
FMC Technologies, Inc.(a) | 5,191 | 243,146 | ||||||
Halliburton Co. | 19,067 | 749,905 | ||||||
Helmerich & Payne, Inc. | 2,326 | 156,819 | ||||||
Hess Corp. | 5,757 | 424,982 | ||||||
Kinder Morgan, Inc. | 39,050 | 1,652,205 | ||||||
Marathon Oil Corp. | 14,888 | 421,182 | ||||||
Marathon Petroleum Corp. | 6,387 | 576,491 | ||||||
Murphy Oil Corp. | 3,879 | 195,967 | ||||||
Nabors Industries, Ltd. | 6,784 | 88,056 | ||||||
National Oilwell Varco, Inc. | 9,516 | 623,583 | ||||||
Newfield Exploration Co.(a) | 3,215 | 87,191 | ||||||
Noble Corp. PLC | 5,904 | 97,829 | ||||||
Noble Energy, Inc. | 8,325 | 394,855 | ||||||
Occidental Petroleum Corp. | 17,809 | 1,435,583 | ||||||
ONEOK, Inc. | 4,496 | 223,856 | ||||||
Phillips 66 | 12,873 | 922,994 | ||||||
Pioneer Natural Resources Co. | 3,476 | 517,403 | ||||||
QEP Resources, Inc. | 3,645 | 73,702 | ||||||
Range Resources Corp. | 3,859 | 206,264 | ||||||
Schlumberger, Ltd. | 29,486 | 2,518,399 | ||||||
Southwestern Energy Co.(a) | 8,056 | 219,848 | ||||||
Spectra Energy Corp. | 15,357 | 557,459 | ||||||
Tesoro Corp. | 3,016 | 224,240 | ||||||
Transocean, Ltd. | 7,410 | 135,825 | ||||||
Valero Energy Corp. | 11,823 | 585,238 | ||||||
Williams Cos., Inc. (The) | 15,358 | 690,189 | ||||||
|
| |||||||
| 35,033,573 | ||||||||
|
| |||||||
Financials – 16.2% | ||||||||
ACE, Ltd. | 7,433 | 853,903 | ||||||
Affiliated Managers Group, Inc.(a) | 1,224 | 259,782 | ||||||
Aflac, Inc. | 10,153 | 620,247 | ||||||
Allstate Corp. | 9,739 | 684,165 | ||||||
American Express Co. | 20,112 | 1,871,220 | ||||||
American International Group, Inc. | 32,101 | 1,797,977 | ||||||
American Tower Corp. REIT | 8,918 | 881,544 | ||||||
Ameriprise Financial, Inc. | 4,344 | 574,494 | ||||||
Aon PLC | 6,465 | 613,076 | ||||||
Apartment Investment & Management Co. Class A REIT | 3,087 | 114,682 | ||||||
Assurant, Inc. | 1,685 | 115,305 | ||||||
AvalonBay Communities, Inc. REIT | 2,969 | 485,105 | ||||||
Bank of America Corp. | 240,205 | 4,297,267 | ||||||
Bank of New York Mellon Corp. | 25,994 | 1,054,577 | ||||||
BB&T Corp. | 16,231 | 631,224 | ||||||
Berkshire Hathaway, Inc. Class B(a) | 41,584 | 6,243,838 | ||||||
BlackRock, Inc. | 2,916 | 1,042,645 | ||||||
Boston Properties, Inc. REIT | 3,346 | 430,597 | ||||||
Capital One Financial Corp. | 12,895 | 1,064,482 | ||||||
CBRE Group, Inc.(a) | 6,167 | 211,220 | ||||||
Charles Schwab Corp. | 26,204 | 791,099 | ||||||
Chubb Corp. | 5,479 | 566,912 | ||||||
Cincinnati Financial Corp. | 3,109 | 161,139 | ||||||
Citigroup, Inc. | 69,227 | 3,745,873 | ||||||
CME Group, Inc. | 7,363 | 652,730 | ||||||
Comerica, Inc. | 4,027 | 188,625 | ||||||
Crown Castle International Corp. REIT | 7,358 | 579,075 | ||||||
Discover Financial Services | 10,628 | 696,028 | ||||||
E*TRADE Financial Corp.(a) | 6,042 | 146,549 | ||||||
Equity Residential REIT | 8,219 | 590,453 | ||||||
Essex Property Trust, Inc. REIT | 1,445 | 298,537 | ||||||
Fifth Third Bancorp | 19,362 | 394,501 | ||||||
Franklin Resources, Inc. | 8,689 | 481,110 | ||||||
General Growth Properties, Inc. REIT | 13,858 | 389,825 | ||||||
Genworth Financial, Inc. Class A(a) | 11,062 | 94,027 | ||||||
Goldman Sachs Group, Inc. | 9,346 | 1,811,535 | ||||||
Hartford Financial Services Group, Inc. | 9,967 | 415,524 | ||||||
HCP, Inc. REIT | 10,423 | 458,925 | ||||||
Health Care REIT, Inc. | 7,319 | 553,829 | ||||||
Host Hotels & Resorts, Inc. REIT | 16,562 | 393,679 | ||||||
Hudson City Bancorp, Inc. | 10,316 | 104,398 | ||||||
Huntington Bancshares, Inc. | 19,091 | 200,837 | ||||||
Intercontinental Exchange, Inc. | 2,537 | 556,339 | ||||||
Invesco Ltd. | 9,711 | 383,779 | ||||||
Iron Mountain, Inc. REIT | 3,881 | 150,039 | ||||||
J.P. Morgan Chase & Co. | 85,343 | 5,340,765 | ||||||
KeyCorp | 19,996 | 277,944 | ||||||
Kimco Realty Corp. REIT | 8,953 | 225,078 | ||||||
Legg Mason, Inc. | 2,427 | 129,529 | ||||||
Leucadia National Corp. | 7,427 | 166,513 | ||||||
Lincoln National Corp. | 5,782 | 333,448 | ||||||
Loews Corp. | 6,619 | 278,130 | ||||||
M&T Bank Corp. | 3,003 | 377,237 | ||||||
Marsh & McLennan Cos., Inc. | 12,019 | 687,968 | ||||||
McGraw Hill Financial, Inc. | 5,968 | 531,033 | ||||||
MetLife, Inc. | 26,170 | 1,415,535 | ||||||
Moody’s Corp. | 4,232 | 405,468 | ||||||
Morgan Stanley | 35,175 | 1,364,790 | ||||||
NASDAQ OMX Group, Inc. | 2,475 | 118,701 | ||||||
Navient Corp. | 9,313 | 201,254 | ||||||
See Notes to Financial Statements.
19
Table of Contents
State Street Equity 500 Index II Portfolio
Portfolio of Investments — (continued)
December 31, 2014
| Shares | Value | |||||||
COMMON STOCKS – (continued) | ||||||||
Financials – (continued) | ||||||||
Northern Trust Corp. | 4,896 | $ | 329,990 | |||||
People’s United Financial, Inc. | 7,666 | 116,370 | ||||||
Plum Creek Timber Co., Inc. REIT | 4,225 | 180,788 | ||||||
PNC Financial Services Group, Inc. | 12,175 | 1,110,725 | ||||||
Principal Financial Group, Inc. | 6,265 | 325,404 | ||||||
Progressive Corp. | 11,849 | 319,804 | ||||||
ProLogis, Inc. REIT | 10,952 | 471,265 | ||||||
Prudential Financial, Inc. | 10,302 | 931,919 | ||||||
Public Storage, Inc. REIT | 3,235 | 597,990 | ||||||
Regions Financial Corp. | 30,446 | 321,510 | ||||||
Simon Property Group, Inc. REIT | 6,980 | 1,271,128 | ||||||
State Street Corp.(c) | 9,678 | 759,723 | ||||||
SunTrust Banks, Inc. | 11,636 | 487,548 | ||||||
T. Rowe Price Group, Inc. | 5,955 | 511,296 | ||||||
The Macerich Co. REIT | 3,255 | 271,499 | ||||||
Torchmark Corp. | 3,012 | 163,160 | ||||||
Travelers Cos., Inc. | 7,506 | 794,510 | ||||||
U.S. Bancorp | 41,122 | 1,848,434 | ||||||
Unum Group | 5,505 | 192,014 | ||||||
Ventas, Inc. REIT | 6,697 | 480,175 | ||||||
Vornado Realty Trust REIT | 3,968 | 467,073 | ||||||
Wells Fargo & Co. | 107,703 | 5,904,278 | ||||||
Weyerhaeuser Co. REIT | 11,667 | 418,729 | ||||||
XL Group PLC | 6,048 | 207,870 | ||||||
Zions Bancorporation | 4,095 | 116,748 | ||||||
|
| |||||||
| 69,106,060 | ||||||||
|
| |||||||
Health Care – 13.9% | ||||||||
Abbott Laboratories | 34,647 | 1,559,808 | ||||||
AbbVie, Inc. | 36,543 | 2,391,374 | ||||||
Actavis PLC(a) | 6,116 | 1,574,320 | ||||||
Aetna, Inc. | 8,144 | 723,432 | ||||||
Agilent Technologies, Inc. | 7,393 | 302,669 | ||||||
Alexion Pharmaceuticals, Inc.(a) | 4,473 | 827,639 | ||||||
Allergan, Inc. | 6,878 | 1,462,194 | ||||||
AmerisourceBergen Corp. | 4,734 | 426,817 | ||||||
Amgen, Inc. | 17,454 | 2,780,248 | ||||||
Anthem, Inc. | 6,219 | 781,542 | ||||||
Baxter International, Inc. | 12,216 | 895,311 | ||||||
Becton Dickinson and Co. | 4,405 | 613,000 | ||||||
Biogen Idec, Inc.(a) | 5,384 | 1,827,599 | ||||||
Boston Scientific Corp.(a) | 29,457 | 390,305 | ||||||
Bristol-Myers Squibb Co. | 38,004 | 2,243,376 | ||||||
C.R. Bard, Inc. | 1,735 | 289,086 | ||||||
Cardinal Health, Inc. | 7,433 | 600,066 | ||||||
CareFusion Corp.(a) | 4,556 | 270,353 | ||||||
Celgene Corp.(a) | 18,271 | 2,043,794 | ||||||
Cerner Corp.(a) | 6,737 | 435,614 | ||||||
CIGNA Corp. | 5,885 | 605,625 | ||||||
Covidien PLC | 10,487 | 1,072,610 | ||||||
DaVita HealthCare Partners, Inc.(a) | 3,828 | 289,933 | ||||||
DENTSPLY International, Inc. | 3,134 | 166,948 | ||||||
Edwards Lifesciences Corp.(a) | 2,455 | 312,718 | ||||||
Eli Lilly & Co. | 22,518 | 1,553,517 | ||||||
Express Scripts Holding Co.(a) | 16,867 | 1,428,129 | ||||||
Gilead Sciences, Inc.(a) | 34,452 | 3,247,445 | ||||||
Hospira, Inc.(a) | 3,886 | 238,017 | ||||||
Humana, Inc. | 3,390 | 486,906 | ||||||
Intuitive Surgical, Inc.(a) | 848 | 448,541 | ||||||
Johnson & Johnson | 63,808 | 6,672,403 | ||||||
Laboratory Corp. of America Holdings(a) | 1,975 | 213,102 | ||||||
Mallinckrodt PLC(a) | 2,600 | 257,478 | ||||||
McKesson Corp. | 5,224 | 1,084,398 | ||||||
Medtronic, Inc. | 22,668 | 1,636,630 | ||||||
Merck & Co., Inc. | 65,172 | 3,701,118 | ||||||
Mylan, Inc.(a) | 8,502 | 479,258 | ||||||
Patterson Cos., Inc. | 1,735 | 83,453 | ||||||
PerkinElmer, Inc. | 2,586 | 113,086 | ||||||
Perrigo Co. PLC | 3,286 | 549,288 | ||||||
Pfizer, Inc. | 143,833 | 4,480,398 | ||||||
Quest Diagnostics, Inc. | 3,142 | 210,703 | ||||||
Regeneron Pharmaceuticals, Inc.(a) | 1,742 | 714,655 | ||||||
St. Jude Medical, Inc. | 6,273 | 407,933 | ||||||
Stryker Corp. | 6,894 | 650,311 | ||||||
Tenet Healthcare Corp.(a) | 2,090 | 105,900 | ||||||
Thermo Fisher Scientific, Inc. | 9,212 | 1,154,171 | ||||||
UnitedHealth Group, Inc. | 21,774 | 2,201,134 | ||||||
Universal Health Services, Inc. | 2,000 | 222,520 | ||||||
Varian Medical Systems, Inc.(a) | 2,429 | 210,133 | ||||||
Vertex Pharmaceuticals, Inc.(a) | 5,352 | 635,818 | ||||||
Waters Corp.(a) | 1,850 | 208,532 | ||||||
Zimmer Holdings, Inc. | 3,825 | 433,831 | ||||||
Zoetis, Inc. | 11,620 | 500,009 | ||||||
|
| |||||||
| 59,215,198 | ||||||||
|
| |||||||
Industrials – 10.1% | ||||||||
3M Co. | 14,729 | 2,420,269 | ||||||
ADT Corp. | 3,894 | 141,080 | ||||||
Allegion PLC | 1,996 | 110,698 | ||||||
AMETEK, Inc. | 5,299 | 278,886 | ||||||
Boeing Co. | 15,264 | 1,984,015 | ||||||
C.H. Robinson Worldwide, Inc. | 3,279 | 245,564 | ||||||
Caterpillar, Inc. | 13,924 | 1,274,464 | ||||||
Cintas Corp. | 2,166 | 169,901 | ||||||
CSX Corp. | 22,355 | 809,922 | ||||||
Cummins, Inc. | 3,814 | 549,864 | ||||||
Danaher Corp. | 13,694 | 1,173,713 | ||||||
Deere & Co. | 8,083 | 715,103 | ||||||
Delta Air Lines, Inc. | 18,734 | 921,525 | ||||||
Dover Corp. | 3,750 | 268,950 | ||||||
Dun & Bradstreet Corp. | 755 | 91,325 | ||||||
Eaton Corp. PLC | 10,525 | 715,279 | ||||||
Emerson Electric Co. | 15,679 | 967,865 | ||||||
Equifax, Inc. | 2,688 | 217,379 | ||||||
Expeditors International of Washington, Inc. | 4,576 | 204,135 | ||||||
Fastenal Co. | 5,958 | 283,362 | ||||||
FedEx Corp. | 6,050 | 1,050,643 | ||||||
Flowserve Corp. | 2,945 | 176,199 | ||||||
Fluor Corp. | 3,504 | 212,447 | ||||||
General Dynamics Corp. | 7,272 | 1,000,773 | ||||||
General Electric Co. | 229,170 | 5,791,126 | ||||||
Honeywell International, Inc. | 17,978 | 1,796,362 | ||||||
Illinois Tool Works, Inc. | 8,100 | 767,070 | ||||||
Ingersoll-Rand PLC | 6,084 | 385,665 | ||||||
Jacobs Engineering Group, Inc.(a) | 2,743 | 122,585 | ||||||
Joy Global, Inc. | 2,313 | 107,601 | ||||||
Kansas City Southern | 2,496 | 304,587 | ||||||
L-3 Communications Holdings, Inc. | 1,938 | 244,595 | ||||||
Lockheed Martin Corp. | 6,203 | 1,194,512 | ||||||
Masco Corp. | 7,684 | 193,637 | ||||||
See Notes to Financial Statements.
20
Table of Contents
State Street Equity 500 Index II Portfolio
Portfolio of Investments — (continued)
December 31, 2014
| Shares | Value | |||||||
COMMON STOCKS – (continued) | ||||||||
Industrials – (continued) | ||||||||
Nielsen NV | 6,925 | $ | 309,755 | |||||
Norfolk Southern Corp. | 6,887 | 754,884 | ||||||
Northrop Grumman Corp. | 4,625 | 681,679 | ||||||
PACCAR, Inc. | 8,039 | 546,732 | ||||||
Pall Corp. | 2,502 | 253,227 | ||||||
Parker-Hannifin Corp. | 3,389 | 437,011 | ||||||
Pentair PLC | 4,304 | 285,872 | ||||||
Pitney Bowes, Inc. | 4,806 | 117,122 | ||||||
Precision Castparts Corp. | 3,229 | 777,801 | ||||||
Quanta Services, Inc.(a) | 4,707 | 133,632 | ||||||
Raytheon Co. | 7,146 | 772,983 | ||||||
Republic Services, Inc. | 5,789 | 233,007 | ||||||
Robert Half International, Inc. | 3,166 | 184,831 | ||||||
Rockwell Automation, Inc. | 3,026 | 336,491 | ||||||
Rockwell Collins, Inc. | 3,031 | 256,059 | ||||||
Roper Industries, Inc. | 2,165 | 338,498 | ||||||
Ryder System, Inc. | 1,066 | 98,978 | ||||||
Snap-on, Inc. | 1,240 | 169,558 | ||||||
Southwest Airlines Co. | 15,359 | 649,993 | ||||||
Stanley Black & Decker, Inc. | 3,457 | 332,148 | ||||||
Stericycle, Inc.(a) | 1,896 | 248,528 | ||||||
Textron, Inc. | 6,033 | 254,050 | ||||||
Tyco International PLC | 9,764 | 428,249 | ||||||
Union Pacific Corp. | 20,098 | 2,394,275 | ||||||
United Parcel Service, Inc. Class B | 15,791 | 1,755,485 | ||||||
United Rentals, Inc.(a) | 2,100 | 214,221 | ||||||
United Technologies Corp. | 19,451 | 2,236,865 | ||||||
W.W. Grainger, Inc. | 1,357 | 345,886 | ||||||
Waste Management, Inc. | 9,835 | 504,732 | ||||||
Xylem, Inc. | 3,858 | 146,874 | ||||||
|
| |||||||
| 43,090,527 | ||||||||
|
| |||||||
Information Technology – 19.2% | ||||||||
Accenture PLC Class A | 14,318 | 1,278,741 | ||||||
Adobe Systems, Inc.(a) | 11,044 | 802,899 | ||||||
Akamai Technologies, Inc.(a) | 3,890 | 244,914 | ||||||
Alliance Data Systems Corp.(a) | 1,496 | 427,931 | ||||||
Altera Corp. | 6,800 | 251,192 | ||||||
Amphenol Corp. Class A | 7,020 | 377,746 | ||||||
Analog Devices, Inc. | 7,151 | 397,024 | ||||||
Apple, Inc. | 133,624 | 14,749,417 | ||||||
Applied Materials, Inc. | 27,454 | 684,154 | ||||||
Autodesk, Inc.(a) | 4,906 | 294,654 | ||||||
Automatic Data Processing, Inc. | 10,852 | 904,731 | ||||||
Avago Technologies, Ltd. | 5,582 | 561,493 | ||||||
Broadcom Corp. Class A | 11,924 | 516,667 | ||||||
CA, Inc. | 7,140 | 217,413 | ||||||
Cisco Systems, Inc. | 116,990 | 3,254,077 | ||||||
Citrix Systems, Inc.(a) | 3,589 | 228,978 | ||||||
Cognizant Technology Solutions Corp. Class A(a) | 13,941 | 734,133 | ||||||
Computer Sciences Corp. | 3,112 | 196,212 | ||||||
Corning, Inc. | 29,626 | 679,324 | ||||||
eBay, Inc.(a) | 26,045 | 1,461,645 | ||||||
Electronic Arts, Inc.(a) | 6,779 | 318,715 | ||||||
EMC Corp. | 46,810 | 1,392,129 | ||||||
F5 Networks, Inc.(a) | 1,641 | 214,093 | ||||||
Facebook, Inc. Class A(a) | 47,793 | 3,728,810 | ||||||
Fidelity National Information Services, Inc. | 6,291 | 391,300 | ||||||
First Solar, Inc.(a) | 1,821 | 81,208 | ||||||
Fiserv, Inc.(a) | 5,662 | 401,832 | ||||||
FLIR Systems, Inc. | 3,161 | 102,132 | ||||||
Google, Inc. Class A(a) | 6,567 | 3,484,844 | ||||||
Google, Inc. Class C(a) | 6,467 | 3,404,229 | ||||||
Harris Corp. | 2,502 | 179,694 | ||||||
Hewlett-Packard Co. | 42,853 | 1,719,691 | ||||||
Intel Corp. | 110,436 | 4,007,723 | ||||||
International Business Machines Corp. | 21,095 | 3,384,482 | ||||||
Intuit, Inc. | 6,437 | 593,427 | ||||||
Juniper Networks, Inc. | 8,849 | 197,510 | ||||||
KLA-Tencor Corp. | 3,632 | 255,402 | ||||||
Lam Research Corp. | 3,477 | 275,865 | ||||||
Linear Technology Corp. | 5,442 | 248,155 | ||||||
Mastercard, Inc. Class A | 22,451 | 1,934,378 | ||||||
Microchip Technology, Inc. | 4,383 | 197,717 | ||||||
Micron Technology, Inc.(a) | 24,434 | 855,434 | ||||||
Microsoft Corp. | 187,858 | 8,726,004 | ||||||
Motorola Solutions, Inc. | 4,830 | 323,996 | ||||||
NetApp, Inc. | 6,914 | 286,585 | ||||||
NVIDIA Corp. | 12,044 | 241,482 | ||||||
Oracle Corp. | 73,935 | 3,324,857 | ||||||
Paychex, Inc. | 7,107 | 328,130 | ||||||
QUALCOMM, Inc. | 38,026 | 2,826,473 | ||||||
Red Hat, Inc.(a) | 4,370 | 302,142 | ||||||
Salesforce.com, Inc.(a) | 13,595 | 806,320 | ||||||
SanDisk Corp. | 4,961 | 486,079 | ||||||
Seagate Technology PLC | 7,424 | 493,696 | ||||||
Symantec Corp. | 15,260 | 391,495 | ||||||
TE Connectivity, Ltd. | 9,051 | 572,476 | ||||||
Teradata Corp.(a) | 3,407 | 148,818 | ||||||
Texas Instruments, Inc. | 24,293 | 1,298,825 | ||||||
Total System Services, Inc. | 3,576 | 121,441 | ||||||
VeriSign, Inc.(a) | 2,501 | 142,557 | ||||||
Visa, Inc. Class A | 11,190 | 2,934,018 | ||||||
Western Digital Corp. | 4,953 | 548,297 | ||||||
Western Union Co. | 11,645 | 208,562 | ||||||
Xerox Corp. | 23,909 | 331,379 | ||||||
Xilinx, Inc. | 6,160 | 266,666 | ||||||
Yahoo!, Inc.(a) | 20,182 | 1,019,393 | ||||||
|
| |||||||
| 81,761,806 | ||||||||
|
| |||||||
Materials – 3.1% | ||||||||
Air Products & Chemicals, Inc. | 4,402 | 634,900 | ||||||
Airgas, Inc. | 1,560 | 179,681 | ||||||
Alcoa, Inc. | 26,260 | 414,645 | ||||||
Allegheny Technologies, Inc. | 2,317 | 80,562 | ||||||
Avery Dennison Corp. | 2,070 | 107,392 | ||||||
Ball Corp. | 2,966 | 202,192 | ||||||
C.F. Industries Holdings, Inc. | 1,144 | 311,786 | ||||||
Dow Chemical Co. | 25,538 | 1,164,788 | ||||||
E.I. du Pont de Nemours & Co. | 20,518 | 1,517,101 | ||||||
Eastman Chemical Co. | 3,336 | 253,069 | ||||||
Ecolab, Inc. | 6,001 | 627,225 | ||||||
FMC Corp. | 2,878 | 164,132 | ||||||
Freeport-McMoRan, Inc. | 22,940 | 535,878 | ||||||
International Flavors & Fragrances, Inc. | 1,751 | 177,481 | ||||||
International Paper Co. | 9,603 | 514,529 | ||||||
LyondellBasell Industries NV Class A | 9,548 | 758,016 | ||||||
See Notes to Financial Statements.
21
Table of Contents
State Street Equity 500 Index II Portfolio
Portfolio of Investments — (continued)
December 31, 2014
| Shares | Value | |||||||
COMMON STOCKS – (continued) | ||||||||
Materials – (continued) | ||||||||
Martin Marietta Materials, Inc. | 1,345 | $ | 148,380 | |||||
MeadWestvaco Corp. | 3,877 | 172,100 | ||||||
Monsanto Co. | 11,161 | 1,333,405 | ||||||
Mosaic Co. | 7,084 | 323,385 | ||||||
Newmont Mining Corp. | 11,433 | 216,084 | ||||||
Nucor Corp. | 6,948 | 340,799 | ||||||
Owens-Illinois, Inc.(a) | 3,537 | 95,464 | ||||||
PPG Industries, Inc. | 3,127 | 722,806 | ||||||
Praxair, Inc. | 6,511 | 843,565 | ||||||
Sealed Air Corp. | 4,923 | 208,883 | ||||||
Sherwin-Williams Co. | 1,809 | 475,839 | ||||||
Sigma-Aldrich Corp. | 2,773 | 380,650 | ||||||
Vulcan Materials Co. | 2,871 | 188,711 | ||||||
|
| |||||||
| 13,093,448 | ||||||||
|
| |||||||
Telecommunication Services – 2.2% |
| |||||||
AT&T, Inc. | 118,477 | 3,979,642 | ||||||
CenturyLink, Inc. | 12,592 | 498,391 | ||||||
Frontier Communications Corp. | 22,306 | 148,781 | ||||||
Level 3 Communications, Inc.(a) | 6,300 | 311,094 | ||||||
Verizon Communications, Inc. | 94,815 | 4,435,446 | ||||||
Windstream Holdings, Inc. | 13,346 | 109,971 | ||||||
|
| |||||||
| 9,483,325 | ||||||||
|
| |||||||
Utilities – 3.1% | ||||||||
AES Corp. | 15,236 | 209,800 | ||||||
AGL Resources, Inc. | 2,798 | 152,519 | ||||||
Ameren Corp. | 5,604 | 258,512 | ||||||
American Electric Power Co., Inc. | 11,009 | 668,466 | ||||||
CenterPoint Energy, Inc. | 9,376 | 219,680 | ||||||
CMS Energy Corp. | 6,555 | 227,786 | ||||||
Consolidated Edison, Inc. | 6,752 | 445,699 | ||||||
Dominion Resources, Inc. | 13,094 | 1,006,929 | ||||||
DTE Energy Co. | 4,045 | 349,367 | ||||||
Duke Energy Corp. | 15,892 | 1,327,618 | ||||||
Edison International | 7,514 | 492,017 | ||||||
Entergy Corp. | 3,898 | 340,997 | ||||||
Exelon Corp. | 19,684 | 729,883 | ||||||
FirstEnergy Corp. | 9,593 | 374,031 | ||||||
Integrys Energy Group, Inc. | 1,736 | 135,148 | ||||||
NextEra Energy, Inc. | 9,764 | 1,037,816 | ||||||
NiSource, Inc. | 6,804 | 288,626 | ||||||
Northeast Utilities | 7,217 | 386,254 | ||||||
NRG Energy, Inc. | 7,802 | 210,264 | ||||||
Pepco Holdings, Inc. | 5,541 | 149,219 | ||||||
PG&E Corp. | 10,814 | 575,737 | ||||||
Pinnacle West Capital Corp. | 2,404 | 164,217 | ||||||
PPL Corp. | 15,019 | 545,640 | ||||||
Public Service Enterprise Group, Inc. | 11,488 | 475,718 | ||||||
SCANA Corp. | 2,999 | 181,140 | ||||||
Sempra Energy | 5,162 | 574,840 | ||||||
Southern Co. | 20,159 | 990,008 | ||||||
TECO Energy, Inc. | 4,701 | 96,323 | ||||||
Wisconsin Energy Corp. | 5,124 | 270,240 | ||||||
Xcel Energy, Inc. | 11,451 | 411,320 | ||||||
|
| |||||||
| 13,295,814 | ||||||||
|
| |||||||
TOTAL COMMON STOCKS |
| 415,116,974 | ||||||
|
| |||||||
MONEY MARKET FUND – 2.4% |
| |||||||
State Street Institutional Liquid Reserves Fund, Premier Class 0.07%(b)(c)(d) | 10,185,685 | 10,185,685 | ||||||
|
| |||||||
TOTAL MONEY MARKET FUND |
| 10,185,685 | ||||||
|
| |||||||
TOTAL INVESTMENTS(e) – 99.7% |
| 425,302,659 | ||||||
Other Assets in Excess of | 1,407,705 | |||||||
|
| |||||||
NET ASSETS – 100.0% | $ | 426,710,364 | ||||||
|
| |||||||
| (a) | Non-income producing security. |
| (b) | All or part of this security has been designated as collateral for futures contracts. |
| (c) | Affiliated issuer. See table that follows for more information. |
| (d) | The rate shown is the annualized seven-day yield at period end. |
| (e) | Unless otherwise indicated, the values of the securities of the Portfolio are determined based on Level 1 inputs established by provisions surrounding fair value measurements and disclosures. |
| PLC | Public Limited Company |
| REIT | Real Estate Investment Trust |
Schedule of | Number of Contracts | Notional Value | Unrealized Appreciation | |||||||||
S&P 500 Financial Futures Contracts (long) Expiration Date 3/2015 | 102 | $ | 10,467,240 | $ | 114,811 | |||||||
|
| |||||||||||
Total unrealized appreciation on open futures contracts purchased | $ | 114,811 | ||||||||||
|
| |||||||||||
See Notes to Financial Statements.
22
Table of Contents
State Street Equity 500 Index II Portfolio
Portfolio of Investments — (continued)
December 31, 2014
Affiliates Table
Certain investments made by the Portfolio were made in securities affiliated with State Street and SSGA Funds Management, Inc. Investments in State Street Corp., the holding company of State Street, were made according to its representative portion of the S&P 500® Index. The Portfolio also invested in the State Street Institutional Liquid Reserves Fund. Transactions in all affiliates for the period ending December 31, 2014 were as follows:
Security | Number of shares held at 8/11/14* | Shares purchased for the period ended 12/31/14 | Shares sold for the period ended 12/31/14 | Number of shares held at 12/31/14 | Value at 12/31/14 | Income earned for the period ended 12/31/14 | Realized gain/loss on shares sold | |||||||||||||||||||||
State Street Corp. | – | 10,178 | ** | 500 | 9,678 | $ | 759,723 | $ | 5,687 | $ | 9,115 | |||||||||||||||||
State Street Institutional Liquid Reserves Fund, Premier Class | – | 43,348,594 | 33,162,909 | 10,185,685 | 10,185,685 | 2,244 | – | |||||||||||||||||||||
| * | Commencement of operations |
| ** | 9,778 shares of State Street Corp. was acquired as part of an in-kind subscription (Note 7). |
See Notes to Financial Statements.
23
Table of Contents
State Street Equity 500 Index II Portfolio
Statement of Assets and Liabilities
December 31, 2014
Assets | ||||
Investments in unaffiliated issuers at market value | $ | 414,357,251 | ||
Investments in non-controlled affiliates at market value | 10,945,408 | |||
|
| |||
Total investments at market value (identified cost $197,229,777) | 425,302,659 | |||
Cash | 2,489 | |||
Cash at broker | 469,205 | |||
Receivable for fund shares sold | 1,038,987 | |||
Dividends receivable | 542,617 | |||
Dividend receivable from non-controlled affiliates (Note 4) | 5,687 | |||
Receivable from Adviser | 18,909 | |||
|
| |||
Total assets | 427,380,553 | |||
|
| |||
Liabilities | ||||
Daily variation margin on futures contracts | 123,930 | |||
Payable for fund shares repurchased | 482,760 | |||
Professional fees payable | 30,611 | |||
Trustees’ fees payable (Note 5) | 3,750 | |||
Administration and custody fees payable (Note 4) | 19,434 | |||
Accrued expenses and other liabilities | 9,704 | |||
|
| |||
Total liabilities | 670,189 | |||
|
| |||
Net Assets | $ | 426,710,364 | ||
|
| |||
Net Assets Consist of: | ||||
Paid in capital | $ | 197,300,266 | ||
Accumulated net realized gain on investments | 1,222,405 | |||
Unrealized appreciation on investments and futures contracts | 228,187,693 | |||
|
| |||
Net Assets | $ | 426,710,364 | ||
|
| |||
Net asset value, offering, and redemption price per share | $ | 10.55 | ||
|
| |||
Shares outstanding | 40,441,084 |
See Notes to Financial Statements.
24
Table of Contents
State Street Equity 500 Index II Portfolio
Statement of Operations
Period Ended December 31, 2014*
Investment Income | ||||
Dividend income – unaffiliated issuers (net of foreign taxes withheld of $519) | $ | 3,277,966 | ||
Dividend income – non-controlled affiliated issuer | 7,931 | |||
Interest | 2,248 | |||
|
| |||
Total investment income | 3,288,145 | |||
|
| |||
Expenses | ||||
Professional fees | 30,865 | |||
Trustees’ fees (Note 5) | 3,750 | |||
Administration and custody fees (Note 4) | 19,434 | |||
Printing fees | 2,501 | |||
Other expenses | 9,633 | |||
|
| |||
Total expenses | 66,183 | |||
Less: Expenses reimbursed by the Adviser (Note 4) | (18,909 | ) | ||
|
| |||
Total net expenses | 47,274 | |||
|
| |||
Net Investment Income | 3,240,871 | |||
|
| |||
Realized and Unrealized Gain (Loss) | ||||
Net realized gain on: | ||||
Investments – unaffiliated issuers | 4,013,957 | |||
Investments – affiliated issuers | 9,115 | |||
Futures contracts | 258,685 | |||
|
| |||
| 4,281,757 | ||||
|
| |||
Net change in net appreciation (depreciation) on: | ||||
Investments | 20,300,997 | |||
Futures contracts | 114,811 | |||
|
| |||
| 20,415,808 | ||||
|
| |||
Net Increase in Net Assets Resulting from Operations | $ | 27,938,436 | ||
|
|
| * | For the period August 11, 2014 (commencement of operations) through December 31, 2014. |
See Notes to Financial Statements.
25
Table of Contents
State Street Equity 500 Index II Portfolio
Statement of Changes in Net Assets
| For The Period August 11, 2014* to December 31, 2014 | ||||
Increase (Decrease) in Net Assets From Operations: | ||||
Net investment income | $ | 3,240,871 | ||
Net realized gain on investments and futures contracts | 4,281,757 | |||
Net change in net unrealized appreciation (depreciation) on investments and futures contracts | 20,415,808 | |||
|
| |||
Net increase in net assets from operations | 27,938,436 | |||
|
| |||
Distributions From: | ||||
Net investment income | (3,305,865 | ) | ||
Net realized gain on investments | (2,994,358 | ) | ||
|
| |||
Total distributions | (6,300,223 | ) | ||
|
| |||
Fund Share Transactions: | ||||
In-kind subscription (Note 7) | 387,955,841 | |||
Shares sold | 30,018,341 | |||
Reinvestment of distributions | 6,300,223 | |||
Shares redeemed | (19,202,254 | ) | ||
|
| |||
Net increase (decrease) in net assets from fund share transactions | 405,072,151 | |||
|
| |||
Net Increase in Net assets | 426,710,364 | |||
Net Assets | ||||
End of period | $ | 426,710,364 | ||
|
| |||
Change in Shares: | ||||
In-kind subscription (Note 7) | 39,080,818 | |||
Shares sold | 2,613,803 | |||
Reinvestment of distributions | 596,612 | |||
Shares redeemed | (1,850,149 | ) | ||
|
| |||
Net increase in shares | 40,441,084 | |||
|
| |||
| * | Commencement of operations |
See Notes to Financial Statements.
26
Table of Contents
State Street Equity 500 Index II Portfolio
Financial Highlights
Selected data for a Share of beneficial interest outstanding throughout the period is presented below:
| For the Period 8/11/14* - 12/31/14 | ||||
Per Share Operating Performance: | ||||
Net Asset Value, Beginning of Period | $ | 10.00 | ||
|
| |||
Investment Operations: | ||||
Net investment income(a) | 0.08 | |||
Net realized and unrealized gain on investments | 0.63 | |||
|
| |||
Total from investment operations | 0.71 | |||
|
| |||
Less Distributions From: | ||||
Net investment income | (0.08 | ) | ||
Net realized gain | (0.08 | ) | ||
|
| |||
Total distributions | (0.16 | ) | ||
|
| |||
Net Asset Value, End of Period | $ | 10.55 | ||
|
| |||
Total Return(b) | 7.12 | % | ||
Ratios and Supplemental Data: | ||||
Net Assets, End of Period (000s) | $ | 426,710 | ||
Ratios to average net assets: | ||||
Gross expenses(c) | 0.042 | % | ||
Net expenses(c) | 0.030 | % | ||
Net investment income(c) | 2.06 | % | ||
Portfolio turnover rate(d) | 4 | % | ||
| * | Commencement of operations. |
| (a) | Net investment income per share is calculated using the average shares method. |
| (b) | Total return is calculated assuming a purchase of shares at net asset value on the first day and a sale at net asset value on the last day of each period reported. Distributions are assumed, for the purpose of this calculation, to be reinvested at net asset value per share on the respective payment dates. Total return for periods of less than one year is not annualized. Results represent past performance and are not indicative of future results. |
| (c) | Annualized. |
| (d) | Portfolio turnover rate excludes in-kind security transactions (Note 7). |
See Notes to Financial Statements.
27
Table of Contents
State Street Institutional Investment Trust
Notes to Financial Statements
December 31, 2014
| 1. | Organization |
State Street Institutional Investment Trust (the “Trust”) is registered under the Investment Company Act of 1940, as amended (the “1940 Act”), as an open-end management investment company, and was organized as a business trust under the laws of the Commonwealth of Massachusetts on February 16, 2000. The Trust consists of thirty-five (35) series and corresponding classes, each of which have the same rights and privileges, including the same voting rights. The Funds are authorized to issue an unlimited number of shares, with no par value. The financial statements herein relate to the following Funds:
| Fund | Classes | Commencement of Operations: | ||
State Street Equity 500 Index Fund | Administrative Shares Class A Class I Class K Class R Shares Service Shares | April 11, 2001 September 17, 2014 September 17, 2014 September 17, 2014 June 7, 2005 March 10, 2003 | ||
State Street Equity 500 Index II Portfolio | N/A | August 11, 2014 |
State Street Equity 500 Index II Portfolio’s investment objective is to replicate, as closely as possible, before expenses, the performance of the Standard & Poor’s 500® Index (the “S&P 500 Index”). The Portfolio uses a passive management strategy designed to track the performance of the S&P 500 Index. The S&P 500 Index is a well-known, unmanaged, stock index that includes common stocks of 500 companies from several industrial sectors representing a significant portion of the market value of all stocks publicly traded in the U.S. There is no assurance that the Portfolio will achieve its objective.
Effective August 11, 2014, the State Street Equity 500 Index Fund (the “Fund”) invests all of its investable assets in shares of the State Street Equity 500 Index II Portfolio (the “Portfolio”). The Fund invests as part of a “master-feeder” structure, and currently seeks to achieve its investment objective by investing substantially all of its investable assets in the Portfolio, a separate mutual fund, that has a substantially identical investment objective, investment policies, and risks as the Fund. The value of the Fund’s investment in the Portfolio reflects the Fund’s proportionate interest in the net assets of the Portfolio (97.46% at December 31, 2014). The performance of the Fund was directly affected by the performance of the Portfolio.
Prior to August 11, 2014, the Fund invested all of its investable assets in interests of the State Street Equity 500 Index Portfolio (the “Equity 500 Portfolio”), a series of a separately registered investment company called State Street Master Funds. The investment objective and policies of the Equity 500 Portfolio were substantially similar to those of the Fund. The value of the Fund’s investment in the Portfolio reflected the Fund’s proportionate interest in the net assets of the Equity 500 Portfolio. The performance of the Fund was directly affected by the performance of the Equity 500 Portfolio.
Class A shares are offered to investors subject to an initial sales charge. Class A is available to the general public through certain financial intermediaries. Classes I and K and the Administrative, Class R and Service shares are not subject to an initial or contingent deferred sales charge and are only available to a limited group of investors.
The funds are investment companies and accordingly follow the investment company accounting and reporting guidance of the Financial Accounting Standards Board (“FASB”) Accounting Standards Codification Topic 946 Financial Services – Investment Companies.
28
Table of Contents
State Street Institutional Investment Trust
Notes to Financial Statements — (continued)
December 31, 2014
| 2. | Significant Accounting Policies |
The funds’ financial statements are prepared in accordance with U.S. generally accepted accounting principles (“U.S. GAAP”), which require the use of management estimates. Actual results could differ from those estimates. The following is a summary of the significant accounting policies consistently followed by each Fund in the preparation of its financial statements.
Security valuation – The Fund records its investment in the Portfolio at net asset value per share. The Portfolio’s investments are valued each business day by independent pricing services. Equity securities for which market quotations are available are valued at the last sale price or official closing price (closing bid price if no sale has occurred) on the primary market or exchange on which they trade. Investments in other mutual funds are valued at the net asset value per share. Fixed income securities and options are valued on the basis of the closing bid price. Futures contracts are valued at the quoted daily settlement price at the end of each day on the exchange upon which they are traded. Money market instruments maturing within 60 days of the valuation date are valued at amortized cost, a method by which each money market instrument is initially valued at cost, and thereafter a constant accretion or amortization of any discount or premium is recorded until maturity of the security. The Portfolio may value securities for which market quotations are not readily available at “fair value,” as determined in good faith pursuant to procedures established by the Board of Trustees. The Board has adopted procedures concerning securities valuation, under which an Oversight Committee makes determinations as to whether market quotations are not readily available or do not otherwise accurately reflect the fair value of the security. The Oversight Committee, or a subgroup thereof, subject to oversight by the Board, may use fair value pricing in a variety of circumstances, including but not limited to, situations when trading in a security has been suspended or halted. Fair value pricing involves subjective judgments and it is possible that the fair value determination for a security is materially different than the value that could be received on the sale of the security.
The Portfolio adopted provisions surrounding fair value measurements and disclosures that define fair value, establish a framework for measuring fair value in generally accepted accounting principles and expand disclosures about fair value measurements. This applies to fair value measurements that are already required or permitted by other accounting standards and is intended to increase consistency of those measurements and applies broadly to securities and other types of assets and liabilities. In accordance with these provisions, fair value is defined as the price that a fund would receive upon selling an investment in a timely transaction to an independent buyer in the principal or most advantageous market of the investment. Various inputs are used in determining the value of the investments.
The three tier hierarchy of inputs is summarized below:
| • | Level 1 – quoted prices in active markets for identical securities |
| • | Level 2 – other significant observable inputs (including quoted prices for similar securities, interest rates, prepayment speeds, credit risk, etc.) |
| • | Level 3 – significant unobservable inputs (including a Portfolio’s own assumptions in determining the fair value of investments) |
Investments that use Level 2 or Level 3 inputs may include, but are not limited to: (i) an unlisted security related to corporate actions; (ii) a restricted security (e.g., one that may not be publicly sold
29
Table of Contents
State Street Institutional Investment Trust
Notes to Financial Statements — (continued)
December 31, 2014
without registration under the Securities Act of 1933, as amended); (iii) a security whose trading has been suspended or which has been de-listed from its primary trading exchange; (iv) a security that is thinly traded; (v) a security in default or bankruptcy proceedings for which there is no current market quotation; (vi) a security affected by currency controls or restrictions; and (vii) a security affected by a significant event (e.g., an event that occurs after the close of the markets on which the security is traded but before the time as of which the Portfolio’s net assets are computed and that may materially affect the value of the Portfolio’s investments). Examples of events that may be “significant events” are government actions, natural disasters, armed conflict, acts of terrorism, and significant market fluctuations.
Fair value pricing could result in a difference between the prices used to calculate a Portfolio’s net asset value and the prices used by such Portfolio’s benchmark index, which, in turn, could result in a difference between a Portfolio’s performance and the performance of such Portfolio’s benchmark index. The inputs or methodology used for valuing securities are not an indication of the risk associated with investing in those securities.
The following is a summary of the inputs used as of December 31, 2014, in valuing the assets carried at fair value of the Portfolio:
| Fund | Level 1 – Quoted Prices | Level 2 – Other Significant Observable Inputs | Level 3 – Significant Unobservable Inputs | Total | ||||||||||||
ASSETS: INVESTMENTS: | ||||||||||||||||
Common Stocks | $ | 415,116,974 | $ | – | $ | – | $ | 415,116,974 | ||||||||
Money Market Fund | 10,185,685 | – | – | 10,185,685 | ||||||||||||
|
|
|
|
|
|
|
| |||||||||
TOTAL INVESTMENTS | 425,302,659 | – | – | 425,302,659 | ||||||||||||
OTHER ASSETS: | ||||||||||||||||
Futures contracts* | 114,811 | – | – | 114,811 | ||||||||||||
|
|
|
|
|
|
|
| |||||||||
TOTAL ASSETS | $ | 425,417,470 | $ | – | $ | – | $ | 425,417,470 | ||||||||
|
|
|
|
|
|
|
| |||||||||
| * | Only unsettled receivable/payable for variation margin is reported within Statement of Assets and Liabilities. |
The value of the Fund’s investment in the Portfolio is determined based on Level 1 inputs established by provisions surrounding fair value measurements and disclosures.
Transfers between levels are considered to have occurred at the end of the reporting period. For the period ended December 31, 2014, there were no transfers between levels.
Investment transactions and investment income – During the period August 11, 2014 to December 31, 2014, investment transactions are recorded on the trade date basis. Realized gains and losses from the sale of disposition of securities and foreign exchange transactions are recorded on the identified cost basis. Corporate actions (including cash dividends) are recorded net of foreign tax withholdings on the ex-dividend date.
During the period August 11, 2014 to December 31, 2014, dividend income is recorded on the ex-dividend date. Income and capital gains distributions received from the Portfolio by the Fund are recorded on the ex-dividend date. The value of additional securities received as dividend payments is recorded as income and as an increase to the cost basis of such securities. Interest income is recorded on the accrual basis. All premiums and discounts are amortized or accreted for financial reporting purposes.
30
Table of Contents
State Street Institutional Investment Trust
Notes to Financial Statements — (continued)
December 31, 2014
Prior to August 11, 2014, net investment income consisted of the Fund’s pro-rata share of the net investment income of the Equity 500 Portfolio, less all expenses of the Fund and realized and unrealized gains and losses from security transactions consisted of the Fund’s pro-rata share of the Equity 500 Portfolio’s realized and unrealized gains and losses.
Income, non-class specific expenses, and realized and unrealized gains and losses were allocated to the respective classes daily on the basis of relative net assets. Class specific fees are borne by each class.
Dividends and distributions – Dividends, if any, are declared and paid, at least annually. Net realized capital gains, if any, are distributed annually, unless additional distributions are required for compliance with applicable tax regulations.
Expense allocation – Certain expenses are applicable to multiple funds within the Trust. Expenses directly attributable to a fund are charged to that fund. Expenses of the Trust that are not directly attributed to a fund are allocated among the funds, on the basis of relative net assets, except where a more appropriate allocation of expenses to each of the funds can otherwise be made.
Federal income taxes – Each fund has qualified and intends to continue to qualify for and elect treatment as a regulated investment company under Subchapter M of the Internal Revenue Code of 1986, as amended. By so electing and qualifying, the funds will not be subject to federal income taxes to the extent all taxable income, including any net realized capital gains, for each fiscal year is distributes. In addition, by distributing during each calendar year substantially all net taxable income and capital gains, if any, the funds will not be subject to federal excise tax.
For the year ended December 31, 2014, permanent differences identified and reclassified among the components of net assets were as follows:
| Fund | Paid-In Capital | Accumulated Gain (Loss) | Undistributed Net Investment Income (Loss) | |||||||||
State Street Equity 500 Index Fund | $ | (6,752,287 | ) | $ | 6,632,936 | $ | 119,351 | |||||
State Street Equity 500 Index II Portfolio | $ | – | $ | (64,994 | ) | $ | 64,994 | |||||
These differences were primarily attributable to wash sales, distributions in excess of current earnings, real estate investment trusts and distribution redesignations. Net investment income (loss), net realized gains (losses), and net assets were not affected by this reclassification.
At December 31, 2014, the components of distributable earnings on a tax basis were as follows:
| Fund | Undistributed Capital Gains | Capital Loss Carryover | Unrealized Appreciation | Total | ||||||||||||
State Street Equity 500 Index Fund | $ | – | $ | (4,946,685 | ) | $ | 21,149,778 | $ | 16,203,093 | |||||||
State Street Equity 500 Index II Portfolio | $ | 1,310,251 | $ | – | $ | 228,099,847 | $ | 229,410,098 | ||||||||
31
Table of Contents
State Street Institutional Investment Trust
Notes to Financial Statements — (continued)
December 31, 2014
The tax character of distributions paid to shareholders during the year ended December 31, 2014 was as follows:
| Fund | Ordinary Income | Long-Term Capital Gain | Total | |||||||||
State Street Equity 500 Index Fund | $ | 7,001,961 | $ | – | $ | 7,001,961 | ||||||
State Street Equity 500 Index II Portfolio | $ | 3,366,010 | $ | 2,934,213 | $ | 6,300,223 | ||||||
At December 31, 2014, the Funds had capital loss carryforwards which may be utilized to offset future net realized capital gains expiring December 31:
| Fund | 2017 | 2018 | Non-Expiring | Total | ||||||||||||
State Street Equity 500 Index Fund | $ | 1,849,146 | $ | 3,097,539 | $ | – | $ | 4,946,685 | ||||||||
State Street Equity 500 Index II Portfolio | $ | – | $ | – | $ | – | $ | – | ||||||||
During the year, a capital loss carryforward in the amount of $4,360,484 was utilized by the Fund.
At December 31, 2014, the cost of investments and the comparison of unrealized appreciation and depreciation of investments for federal income tax purpose are as follows:
| Fund | Tax Cost | Gross Unrealized Appreciation | Gross Unrealized Depreciation | Net Unrealized Appreciation (Depreciation) | ||||||||||||
State Street Equity 500 Index Fund | $ | 394,723,347 | $ | 21,149,778 | $ | – | $ | 21,149,778 | ||||||||
State Street Equity 500 Index II Portfolio | $ | 197,202,812 | $ | 228,982,645 | $ | 882,798 | $ | 228,099,847 | ||||||||
The Funds have reviewed the tax positions for open years as of December 31, 2014 and determined it did not have a liability for any unrecognized tax expenses. The Funds recognize interest and penalties, if any, related to tax liabilities as income tax expense in the Statement of Operations. As of December 31, 2014, the Funds’ federal tax returns for the prior three fiscal years remain subject to examination by the Fund’s major tax jurisdictions, which include the United States of America and the Commonwealth of Massachusetts.
Futures – The Portfolio may enter into financial futures contracts as part of its strategy to track the performance of the S&P 500® Index. Upon entering into a futures contract, the Portfolio is required to deposit with the broker cash or securities in an amount equal to a certain percentage of the contract amount. Variation margin payments are made or received by the Portfolio each day, depending on the daily fluctuations in the value of the underlying security or index, and are recorded for financial statement purposes as unrealized gains or losses by the Portfolio, which is recorded on the Statement of Assets and Liabilities. The Portfolio recognizes a realized gain or loss when the contract is closed, which is recorded on the Statement of Operations. The Portfolio voluntarily segregates securities in an amount equal to the outstanding value of the open futures contracts in accordance with Securities and Exchange Commission requirements.
The primary risks associated with the use of futures contracts are an imperfect correlation between the change in market value of the benchmark and the prices of futures contracts and the possibility of an
32
Table of Contents
State Street Institutional Investment Trust
Notes to Financial Statements — (continued)
December 31, 2014
illiquid market. To the extent permitted by the investment objective, restrictions and policies set forth in the Portfolio’s Prospectus and Statement of Additional Information, the Portfolio may participate in various derivative-based transactions. Derivative securities are instruments or agreements whose value is derived from an underlying security or index. The Portfolio’s use of derivatives includes futures. These instruments offer unique characteristics and risks that assist the Portfolio in meeting its investment objective. The Portfolio typically uses derivatives in two ways: cash equitization and return enhancement. Cash equitization is a technique that may be used by the Portfolio through the use of options and futures to earn “market-like” returns with the Portfolio’s excess and liquidity reserve cash balances and receivables. Return enhancement can be accomplished through the use of derivatives in the Portfolio. By purchasing certain instruments, the Portfolio may more effectively achieve the desired portfolio characteristics that assist in meeting the Portfolio’s investment objectives. Depending on how the derivatives are structured and utilized, the risks associated with them may vary widely. These risks are generally categorized as market risk, liquidity risk and counterparty or credit risk.
The following table, grouped into appropriate risk categories, discloses the amounts related to the Portfolio’s use of derivative instruments and hedging activities at December 31, 2014:
Asset Derivatives(1)
Equity Contracts Risk | Total | |||||
Futures Contracts | $114,811 | $ | 114,811 | |||
Transactions in derivative instruments during the period ended December 31, 2014, were as follows:
Realized Gain (Loss)(2)
Equity Contracts Risk | Total | |||||
Futures Contracts | $258,685 | $ | 258,685 | |||
Change in Appreciation (Depreciation)(3)
Equity Contracts Risk | Total | |||||
Futures Contracts | $114,811 | $ | 114,811 | |||
| (1) | Portfolio of Investments: Unrealized appreciation of futures contracts. Only unsettled receivable/payable for variation margin is reported within Statement of Assets and Liabilities. |
| (2) | Statement of Operations location: Net realized gain (loss) on: Futures contracts |
| (3) | Statement of Operations location: Net change in unrealized appreciation (depreciation) on: Futures contracts |
The average notional of futures outstanding for the Portfolio during the period ended December 31, 2014 was $6,966,317.
33
Table of Contents
State Street Institutional Investment Trust
Notes to Financial Statements — (continued)
December 31, 2014
| 3. | Securities Transactions |
For the period ended December 31, 2014, purchases and sales of the Portfolio were:
| Fund | Purchases | Sales | ||
State Street Equity 500 Index II Portfolio | $20,391,375 | $17,516,745 |
| 4. | Related Party and Other Fees |
Fund
Effective August 11, 2014, the Fund entered into an investment advisory agreement with SSGA Funds Management, Inc. (the “Adviser” or “SSGA FM”), a subsidiary of State Street Corporation and an affiliate of State Street Bank and Trust Company (“State Street”). Under the agreement, the Adviser directs its investments in accordance with its investment objectives, policies and limitations. In compensation for the Adviser’s services as investment adviser, the Fund pays the Adviser a management fee at an annual rate of 0.02% of its average daily net assets.
Also effective August 11, 2014, the Fund retained SSGA FM as its administrator. Pursuant to the administration agreement, the Fund pays to SSGA FM a fee at an annual rate of 0.05% of its average daily net assets. During the year ended December 31, 2014, the Fund incurred administration fees of $78,086 under this agreement.
Effective August 11, 2014, the Fund pays State Street an annual fee of $12,000 for custody and accounting services. State Street also serves as the sub-administrator for the Fund and is paid a fee by SSGA FM for this service.
For the period from January 1, 2014 to August 10, 2014, the Fund had an investment advisory agreement with SSGA FM, but paid no advisory fee to SSGA FM as long as the Fund invested substantially off of its assets in the Equity 500 Portfolio or another investment company. Also prior to August 11, 2014, the Fund contracted with State Street to provide custody, administration and transfer agent services to the Fund. In compensation for these services and for assuming the Fund’s other operating expenses, State Street received a fee at an annual rate of 0.05% of average daily net assets of the Fund. During the year ended December 31, 2014, fees incurred under this agreement were $115,296 and are shown on the Statement of Operations as part of Administration fees.
Portfolio
The Portfolio’s advisor is SSGA FM. The Portfolio pays no investment advisory fees to SSGA FM. Effective August 11, 2014, its commencement of operations, the Portfolio retained State Street as its custodian, administrator and transfer agent and dividend disbursing agent. In compensation for these services, the Portfolio pays State Street an annual fee, which is included in Administration and custody fees on the Statement of Operations. The fee is accrued daily and payable monthly, and is calculated as the greater of an asset-based fee or a minimum fee. The minimum fee is calculated by multiplying the minimum per fund fee by the number of funds in the State Street Master Funds Trust plus the number of
34
Table of Contents
State Street Institutional Investment Trust
Notes to Financial Statements — (continued)
December 31, 2014
stand-alone funds in the State Street Institutional Investment Trust to arrive at the total minimum fee. The asset-based fee is calculated at the following rates:
| Asset Levels | Annual percentage of average aggregate daily net assets | |
First $400 million | 0.03% | |
Next $15 billion | 0.02% | |
Thereafter | 0.01% | |
Minimum annual fee | $150,000 |
Expense waiver and reimbursement
Fund
Effective July 11, 2014, SSGA FM is contractually obligated until April 30, 2016 to waive its management fee and/or to reimburse the fund for expenses to the extent that total expenses (exclusive of non-recurring account fees, extraordinary expenses, acquired fund fees, any class-specific expenses, such as distribution, shareholder servicing, sub-transfer agency, and administration fees) exceed 0.01% of average daily net assets on an annual basis, This waiver and/ or reimbursement may not be terminated during the relevant period except with the approval of the Fund’s Board of Trustees.
For the year ended December 31, 2014, SSGA FM waived or reimbursed fees under this agreement of $271,086.
Prior to August 11, 2014, there was no agreement to waive fees or reimburse expenses of the Fund.
Portfolio
Effective August 11, 2014, (commencement of operations), SSGA FM has contractually agreed through April 30, 2016, to reimburse certain expenses to the extent necessary such that the total combined annual operating expenses of the Portfolio (exclusive of interest, taxes and extraordinary expenses) do not exceed 0.03% of average daily net assets on an annual basis. For the year ended December 31, 2014, SSGA FM reimbursed expenses of $43,142 under this agreement.
Transfer agent – Boston Financial Data Services (“BFDS”), a joint venture of DST Systems, Inc. and State Street Corporation, serves as transfer agent and dividend disbursing agent to the Fund. For these services, the Fund pays annual account services fees, activity-based fees, charges related to compliance and regulatory services, and a minimum fee of $200.
The Fund also pays a sub-transfer agent fee at an annual rate of 0.20% of the Fund’s average daily net assets attributable to Class A and Class I for recordkeeping, shareholder servicing, or administrative services provided by financial intermediaries.
Distributor – The Fund has adopted a distribution plan pursuant to Rule 12b-1 under the 1940 Act under which a Fund may compensate its distributor (or others) for services in connection with the distribution of the Fund’s Administrative Shares, Service Shares, Class R shares and Class A shares and for services provided to Fund shareholders (the “Plan”). The Plan calls for payments at an annual rate (based on average daily net assets) of 0.15%, 0.25%, 0.60% and 0.25% of the Fund’s net assets attributable to its Administrative Shares, Service Shares, Class R shares and Class A shares, respectively. Because these fees are paid out of the assets of a Fund attributable to its Administrative
35
Table of Contents
State Street Institutional Investment Trust
Notes to Financial Statements — (continued)
December 31, 2014
Shares, Service Shares, Class R shares and Class A shares on an ongoing basis, they will increase the cost of your investment and may cost you more over time than paying other types of sales charges.
Subject to the supervision of the Board of Trustees, the Trust may engage, directly or indirectly, in financing any activities relating to shareholder account administrative and servicing functions, including without limitation making payments to Agents for one or more of the following activities: (a) answering inquiries regarding account status and history, the manner in which purchases and redemptions of each Class may be effected, and certain other matters pertaining to the Trust; (b) assisting in designating and changing dividend options, account designations and addresses; (c) providing necessary personnel and facilities to establish and maintain certain shareholder accounts and records, as requested from time to time by the Trust; (d) assisting in processing purchase and redemption transactions; (e) arranging for the wiring of funds; (f) transmitting and receiving funds in connection with orders to purchase or redeem a Class of shares; (g) verifying and guaranteeing signatures in connection with redemption orders, transfers among and changes in designated accounts; (h) providing periodic statements showing account balances and, to the extent practicable, integration of such information with other client transactions otherwise effected with or through the Agent; (i) furnishing (either separately or on an integrated basis with other reports sent by the Agent) monthly and annual statements and confirmations of all purchases and redemptions of a Class of shares in an account; (j) transmitting proxy statements, annual reports, prospectuses and other communications from the Trust; (k) receiving, tabulating and transmitting to the Trust proxies executed with respect to special meetings of shareholders of the Trust; and (l) providing such other related services as the Trust or customers of the Agent may reasonably request.
| 5. | Trustees’ Fees |
Independent Trustees are compensated on a calendar year basis. Any Trustee who is deemed to be an “interested person” (as defined in the 1940 Act) of the Funds does not receive compensation from the Funds for his or her service as a Trustee.
Each Independent Trustee receives for his or her services to the State Street Master Funds, State Street Institutional Investment Trust and SSGA Funds, a $141,500 annual base retainer in addition to $18,000 for each in-person meeting and $2,000 for each telephonic meeting from the Trust. The Trust will bear a pro rata allocation based on the Trust’s average monthly assets. The Co-Chairmen each receive an additional $44,000 annual retainer. The Independent Trustees are reimbursed for travel and other out-of-pocket expenses in connection with meeting attendance. As of the date of this Report, the Trustees were not paid pension or retirement benefits as part of the Trust’s expenses.
The Trust’s officers are compensated by the Adviser and its affiliates.
Prior to January 24, 2014, each Independent Trustee received for his or her services a $100,000 retainer in addition to $5,000 for each in-person meeting and $1,250 for each telephonic meeting from the Trust. The Chairman received an additional $30,000 annual retainer and the Audit Committee Chair received an additional $10,000 annual retainer.
| 6. | Indemnifications |
The Trust’s organizational documents provide that its officers and trustees are indemnified against certain liabilities arising out of the performance of their duties to the Trust. In addition, both in some of its principal service contracts and in the normal course of its business, the Trust enters into contracts that
36
Table of Contents
State Street Institutional Investment Trust
Notes to Financial Statements — (continued)
December 31, 2014
provide indemnifications to other parties for certain types of losses or liabilities. The Trust’s maximum exposure under these arrangements is unknown as this could involve future claims against the Trust. Management does not expect any significant claims.
| 7. | Initial Subscription |
The Portfolio commenced operations on August 11, 2014, with an initial in-kind contribution of securities from the Fund, as part of a tax-free in-kind transaction in which the Fund redeemed its full interest in the Equity 500 Portfolio and immediately contributed into the Portfolio. The transaction consisted of 503 securities totaling $387,955,841 at market value and $2,852,336 in cash, and included $207,771,885 in unrealized appreciation. The Portfolio has elected to carryforward the allocable tax basis of the 503 securities contributed in kind for purposes of measuring realized and unrealized gain/loss on the Portfolio’s Statement of Operations.
| 8. | Shareholder concentration |
The Portfolio has a concentration of several affiliated shareholders holding a significant percentage of the shares outstanding. Investment activities of these shareholders could have a material impact on the Portfolio. At December 31, 2014, 100% of the shares outstanding of the Portfolio were held by affiliated mutual funds.
37
Table of Contents
Report of Independent Registered Public Accounting Firm
To the Board of Trustees and Shareholders of
State Street Institutional Investment Trust:
We have audited the accompanying statements of assets and liabilities of State Street Equity 500 Index Fund (the “Fund”) and State Street Equity 500 Index II Portfolio (the “Portfolio”) (two of the series constituting the State Street Institutional Investment Trust), including the portfolio of investments of the Portfolio, as of December 31, 2014, and the related statements of operations, the statements of changes in net assets, and the financial highlights for each of the years or periods indicated therein. These financial statements and financial highlights are the responsibility of the Fund’s and Portfolio’s management. Our responsibility is to express an opinion on these financial statements and financial highlights based on our audits.
We conducted our audits in accordance with the standards of the Public Company Accounting Oversight Board (United States). Those standards require that we plan and perform the audit to obtain reasonable assurance about whether the financial statements and financial highlights are free of material misstatement. We were not engaged to perform an audit of the Fund’s and Portfolio’s internal control over financial reporting. Our audits included consideration of internal control over financial reporting as a basis for designing audit procedures that are appropriate in the circumstances, but not for the purpose of expressing an opinion on the effectiveness of the Fund’s and Portfolio’s internal control over financial reporting. Accordingly, we express no such opinion. An audit also includes examining, on a test basis, evidence supporting the amounts and disclosures in the financial statements and financial highlights, assessing the accounting principles used and significant estimates made by management, and evaluating the overall financial statement presentation. Our procedures included confirmation of securities owned as of December 31, 2014, by correspondence with the custodian and others or by other appropriate auditing procedures where replies from others were not received. We believe that our audits provide a reasonable basis for our opinion.
In our opinion, the financial statements and financial highlights referred to above present fairly, in all material respects, the financial position of State Street Equity 500 Index Fund and State Street Equity 500 Index Portfolio (two of the series constituting State Street Institutional Investment Trust) at December 31, 2014, and the results of their operations, the changes in their net assets and the financial highlights for each of the years or periods indicated therein, in conformity with U.S. generally accepted accounting principles.

Boston, Massachusetts
March 2, 2015
38
Table of Contents
State Street Institutional Investment Trust
Other Information
December 31, 2014 (Unaudited)
EXPENSE EXAMPLE
As a shareholder of a fund, you incur ongoing costs, which include costs for administrative services and to the extent applicable, distribution (12b-1) fees, among others. This example is intended to help you understand your ongoing costs (in dollars) of investing in the Funds and to compare these costs with the ongoing costs of investing in other mutual funds. It is based on an investment of $1,000 made at the beginning of the period shown and held for the entire period from July 1, 2014 to December 31, 2014.
The table below illustrates your Fund’s costs in two ways:
| • | Based on actual fund return – This section helps you to estimate the actual expenses that you paid over the period. The “Ending Account Value” shown is derived from the Fund’s actual return, and the third column shows the dollar amount that would have been paid by an investor who started with $1,000 in the Fund. You may use the information here, together with the amount you invested, to estimate the expenses that you paid over the period. To do so, simply divide your account value by $1,000 (for example, an $8,600 account value divided by $1,000 = 8.6), then multiply the result by the number given for the Fund under the heading “Expenses Paid During Period”. |
| • | Based on hypothetical 5% return – This section is intended to help you compare your Fund’s costs with those of other mutual funds. It assumes that the Fund had a yearly return of 5% before expenses, but that the expense ratio is unchanged. In this case, because the return used is not the Fund’s actual return, the results do not apply to your investment. The example is useful in making comparisons because the U.S. Securities and Exchange Commission requires all mutual funds to calculate expenses based on a 5% return. You can assess your Fund’s costs by comparing this hypothetical example with the hypothetical examples that appear in shareholder reports of other funds. |
Six Months Ended December 31, 2014
| State Street Equity 500 Index Fund | Beginning Account Value July 1, 2014 | Ending Account Value December 31, 2014 | Expenses Paid During Period * | |||||||||
Based on Actual Class Return | ||||||||||||
Administrative Shares | $ | 1,000.00 | $ | 1,059.60 | $ | 1.14 | ||||||
Service Shares | $ | 1,000.00 | $ | 1,059.20 | $ | 1.66 | ||||||
Class R | $ | 1,000.00 | $ | 1,057.40 | $ | 3.47 | ||||||
Class A** | $ | 1,000.00 | $ | 1,032.80 | $ | 1.49 | ||||||
Class K** | $ | 1,000.00 | $ | 1,034.10 | $ | 0.18 | ||||||
Class I** | $ | 1,000.00 | $ | 1,033.50 | $ | 0.76 | ||||||
39
Table of Contents
State Street Institutional Investment Trust
Other Information — (continued)
December 31, 2014 (Unaudited)
| State Street Equity 500 Index Fund | Beginning Account Value July 1, 2014 | Ending Account Value December 31, 2014 | Expenses Paid During Period * | |||||||||
Based on Hypothetical (5% return before expenses) | ||||||||||||
Administrative Shares | $ | 1,000.00 | $ | 1,024.10 | $ | 1.12 | ||||||
Service Shares | $ | 1,000.00 | $ | 1,023.59 | $ | 1.63 | ||||||
Class R | $ | 1,000.00 | $ | 1,021.83 | $ | 3.41 | ||||||
Class A** | $ | 1,000.00 | $ | 1,022.63 | $ | 2.60 | ||||||
Class K** | $ | 1,000.00 | $ | 1,024.90 | $ | 0.31 | ||||||
Class I** | $ | 1,000.00 | $ | 1,023.89 | $ | 1.33 | ||||||
| * | The calculations are based on expenses incurred in the most recent fiscal period of each Class. The Administrative Shares, Service Shares, Class R shares, Class A shares, Class K shares and Class I shares annualized expense ratios for the six months ended December 31, 2014 were 0.22%, 0.32%, 0.67%, 0.51%, 0.06% and 0.26%, respectively, which include Administrative Shares’, Service Shares’ and Class R shares’ proportionate share of the expenses of the State Street Equity 500 Index Portfolio for the period 7/1/14-8/10/14. The dollar amounts shown as “Expenses Paid” are equal to the annualized expense ratio multiplied by the average account value over the period, multiplied by 184/365 (the most recent six month period). |
| ** | Actual period is from commencement of operations 9/17/14. Hypothetical period is from 7/1/14. |
Six Months Ended December 31, 2014
| State Street Equity 500 Index II Portfolio | Beginning Account Value July 1, 2014 | Ending Account Value December 31, 2014 | Expenses Paid During Period * | |||||||||
Based on Actual Portfolio Return** | $ | 1,000.00 | $ | 1,071.20 | $ | 0.12 | ||||||
Based on Hypothetical (5% return before expenses) | $ | 1,000.00 | $ | 1,019.34 | $ | 0.12 | ||||||
| * | The calculations are based on expenses incurred in the most recent fiscal period of the Portfolio. The annualized expense ratio for the six months ended December 31, 2014 was 0.03%. The dollar amounts shown as “Expenses Paid” are equal to the annualized expense ratio multiplied by the average account value over the period, multiplied by 184/365 (the most recent six month period). |
| ** | Actual period is from commencement of operations 8/11/14. Hypothetical period is from 7/1/14. |
Proxy Voting Policies and Procedures
Information regarding the Fund’s proxy voting policies and procedures, as well as information regarding how the Fund voted proxies, if any, during the most recent 12-month period ended June 30 is available by August 31 of each year without charge (1) by calling 1-877-521-4083 (toll free), or (2) on the website of the Securities and Exchange Commission (“SEC”) at www.sec.gov.
Quarterly Portfolio Schedule
The Fund files a complete schedule of portfolio holdings with the SEC for the first and third quarters of each fiscal year on Form N-Q. The Fund’s Forms N-Q are available on the SEC’s website at www.sec.gov and may be reviewed and copied at the SEC’s Public Reference Room in Washington,
40
Table of Contents
State Street Institutional Investment Trust
Other Information — (continued)
December 31, 2014 (Unaudited)
DC. Information on the operation of the Public Reference Room may be obtained by calling 1-800-SEC-0330. The information on Form N-Q is available upon request, without charge, by calling 1-877-521-4083 (toll-free).
Tax Information
Long term capital gains dividends of $2,934,213 were paid by the State Street Equity 500 Index II Portfolio during the year ended December 31, 2014.
The Funds designate dividends during the fiscal year as qualifying for the dividends received deduction for corporate shareholders as follows:
| State Street Equity 500 Index Fund | 100.0% | |
| State Street Equity 500 Index II Portfolio | 90.2% |
For the tax year ended December 31, 2014, the Funds hereby designate the following percentage of their net taxable income as qualified dividends taxed at individual net capital gain rates:
| State Street Equity 500 Index Fund | 100.0% | |
| State Street Equity 500 Index II Portfolio | 100.0% |
Form 1099-DIV mailed to you in January 2015 will show the tax status of all distributions paid to your account in calendar year 2014.
Please consult a tax adviser for questions about federal or state income tax laws.
41
Table of Contents
State Street Institutional Investment Trust
Trustees and Officers Information
December 31, 2014 (Unaudited)
Name, Address, and Year of Birth | Position(s) Held | Term of Office Time Served | Principal Occupation During Past Five Years | Number of Funds in Fund Complex Overseen by Trustee | Other Directorships Held by Trustee | |||||
Independent Trustees | ||||||||||
Michael F. Holland YOB: 1944 | Trustee and Co-Chairman of the Board | Term: Indefinite Elected: 7/99 | Chairman, Holland & Company L.L.C. (investment adviser) (1995 – present). | 59 | Trustee, State Street Master Funds; Trustee SSGA Funds; Director, the Holland Series Fund, Inc.; Director, The China Fund, Inc.; Director, The Taiwan Fund, Inc.; Director, Reaves Utility Income Fund, Inc.; and Director, Blackstone/GSO Loan Funds. | |||||
Patrick J. Riley YOB: 1948 | Trustee and Co-Chairman of the Board | Term: Indefinite Elected: 1/14 | 2002 to May 2010, Associate Justice of the Superior Court, Commonwealth of Massachusetts; 1985 to 2002, Partner, Riley, Burke & Donahue, L.L.P. (law firm); 1998 to Present, Independent Director, State Street Global Advisers Ireland, Ltd. (investment company); 1998 to Present, Independent Director, SSGA Liquidity plc (formerly, SSGA Cash Management Fund plc); January 2009 to Present, Independent Director, SSGA Fixed Income plc; and January 2009 to Present, Independent Director, SSGA Qualified Funds PLC. | 59 | Trustee, State Street Master Funds; Trustee SSGA Funds; Board Director and Chairman, SPDR Europe 1PLC Board (2011 – Present); Board Director and Chairman, SPDR Europe II, PLC (2013 – Present). | |||||
William L. Boyan YOB: 1937 | Trustee and Co-Chairman of the Valuation Committee | Term: Indefinite Elected: 7/99 | President and Chief Operations Officer, John Hancock Financial Services (1959 – 1999). Mr. Boyan retired in 1999. Chairman Emeritus, Children���s Hospital, Boston, MA (1984 – 2011); Former Chairman, Boston Plan For Excellence, Boston Public Schools (1995 – 2010); Member of Advisory Board of Florida Atlantic University Lifelong Learning Society. | 59 | Trustee, State Street Master Funds; Trustee SSGA Funds; Former Trustee of Old Mutual South Africa Master Trust; Trustee, Children’s Hospital, Boston, MA. | |||||
William L. Marshall YOB: 1942 | Trustee and Co-Chairman of the Audit Committee | Term: Indefinite Elected: 1/14 | April 2011 to Present, Chairman (until April 2011, Chief Executive Officer and President), Wm. L. Marshall Associates, Inc., Wm. L. Marshall Companies, Inc. and the Marshall Financial Group, Inc. (a registered investment adviser and provider of financial and related consulting services); Certified Financial Planner; Member, Financial Planners Association; Director, (2008 – 2014) Doylestown Health Foundation Board; and the Ann Silverman Community Clinic of Doylestown, PA. | 59 | Trustee, State Street Master Funds; Trustee SSGA Funds; Director, Marshall Financial Group, Inc. |
42
Table of Contents
Name, Address, and Year of Birth | Position(s) Held | Term of Office Time Served | Principal Occupation During Past Five Years | Number of Funds in Fund Complex Overseen by Trustee | Other Directorships Held by Trustee | |||||
Independent Trustees (continued) | ||||||||||
Richard D. Shirk YOB: 1945 | Trustee and Co-Chairman of the Qualified Legal and Compliance Committee | Term: Indefinite Elected: 1/14 | March 2001 to April 2002, Chairman (1996 to March 2001, President and Chief Executive Officer), Cerulean Companies, Inc. (holding company) (Retired); 1992 to March 2001, President and Chief Executive Officer, Blue Cross Blue Shield of Georgia (health insurer, managed healthcare); 1998 to December 2008, Chairman, Board Member and December 2008 to Present, Investment Committee Member, Healthcare Georgia Foundation (private foundation); September 2002 to Present, Lead Director and Board Member, Amerigroup Corp. (managed health care); 1999 to Present, Board Member and (since 2001) Investment Committee Member, Woodruff Arts Center; and 2003 to 2009, Trustee, Gettysburg College. | 59 | Trustee, State Street Master Funds; Trustee SSGA Funds; Board member, AeroCare Holdings (privately held healthcare services company) (February 2003 – Present); Board member, Regenesis Biomedical (health care services) (April 2012 – Present). | |||||
Rina K. Spence YOB: 1948 | Trustee and Co-Chairman of the Qualified Legal and Compliance Committee and Co-Chairman of the Governance Committee | Term: Indefinite Elected: 7/99 | President of SpenceCare International LLC (international healthcare consulting) (1999 – present); Chief Executive Officer, IEmily.com (health internet company) (2000 – 2001); Chief Executive Officer of Consensus Pharmaceutical, Inc. (1998 – 1999); Founder, President and Chief Executive Officer of Spence Center for Women’s Health (1994 – 1998); President and CEO Emerson Hospital (1984 – 1994); Trustee, Eastern Enterprise (utilities) (1988 – 2000). | 59 | Trustee, State Street Master Funds; Trustee SSGA Funds; Director, Berkshire Life Insurance Company of America (1993 – 2009); Director, IEmily.com, Inc. (2000 – 2010); and Trustee, National Osteoporosis Foundation (2005 – 2008). | |||||
Bruce D. Taber YOB: 1943 | Trustee and Co-Chairman of the Valuation Committee and Co-Chairman of the Governance Committee | Term: Indefinite Elected: 1/14 | 1999 to Present, Partner, Zenergy LLC (a technology company providing Computer Modeling and System Analysis to the General Electric Power Generation Division); Until December 2008, Independent Director, SSGA Cash Management Fund plc; Until December 2008, Independent Director, State Street Global Advisers Ireland, Ltd. (investment companies); and Until August 1994, President, Alonzo B. Reed, Inc., (a Boston architect-engineering firm). | 59 | Trustee, State Street Master Funds; Trustee SSGA Funds | |||||
Douglas T. Williams YOB: 1940 | Trustee and Co-Chairman of the Audit Committee | Term: Indefinite Elected: 7/99 | President, Oakmont Homeowners Association (2012 – 2013); President, Mariner Sands Chapel; Executive Vice President and member of Executive Committee, Chase Manhattan Bank (1987 – 1999); President, Boston Stock Exchange Depository Trust Company, 1981 – 1982. | 59 | Trustee, State Street Master Funds; Trustee SSGA Funds; Treasurer, Nantucket Educational Trust, (2002 – 2007). | |||||
43
Table of Contents
Name, Address, | Position(s) Held | Term of Office | Principal Occupation | Number of Funds in Fund Complex Overseen by Trustee | Other Directorships | |||||
Interested Trustees(1) | ||||||||||
Scott F. Powers YOB: 1959 | Trustee | Term: Indefinite Elected Trustee: 1/14 | May 2008 to Present, President and Chief Executive Officer of State Street Global Advisors; 2001 – 2008, Chief Executive Officer of Old Mutual Asset Management; Board of Directors, United Way of Massachusetts Bay; Board of Directors of Middlesex School; Incorporator, Cardigan Mountain School | 59 | ||||||
James E. Ross YOB: 1965 | Trustee | Term: Indefinite Elected Trustee: 2/07 | Chairman and Director, SSGA Funds Management, Inc. (2012 – present); President, SSGA Funds Management, Inc. (2005 – 2012); Executive Vice President and Senior Managing Director, State Street Global Advisors (2006 – present); and Principal, State Street Global Advisors (2006 – present). | 254 |
| (1) | Mr. Powers and Mr. Ross are Interested Trustees because of their employment by SSGA Funds Management, Inc., an affiliate of the Trust. |
Name, Address, | Position(s) Held | Term of Office | Principal Occupation | |||
Officers: | ||||||
Ellen M. Needham YOB: 1967 | President | Term: Indefinite Elected: 10/12 | President and Director, SSGA Funds Management, Inc. (June 2012 – present); Chief Operating Officer, SSGA Funds Management, Inc. (May 2010 – June 2012); Senior Managing Director, SSGA Funds Management, Inc. (1992 – 2012) and Senior Managing Director, State Street Global Advisors (1992 – present).* | |||
Ann M. Carpenter YOB: 1966 | Vice President | Term: Indefinite Elected: 10/12 | Chief Operating Officer, SSGA Funds Management, Inc. (April 2014 – present); Vice President, SSGA Funds Management, Inc. (2008 – present); Principal, State Street Global Advisors (2005 –2008 –present).* | |||
Laura F. Dell YOB: 1964 | Treasurer | Term: Indefinite Elected: 11/10 | Vice President, State Street Bank and Trust Company (2002 – present).* | |||
Chad C. Hallett YOB: 1969 | Assistant Treasurer | Term: Indefinite Elected: 09/11 | Vice President, State Street Global Advisors and SSGA Funds Management, Inc. (November 2014 – present); Vice President, State Street Bank and Trust Company (2001 – November 2014).* | |||
Caroline M. Connolly YOB: 1975 | Assistant Treasurer | Term: Indefinite Elected: 09/11 | Assistant Vice President, State Street Bank and Trust Company (2007 – present). |
44
Table of Contents
Name, Address, | Position(s) Held | Term of Office | Principal Occupation | |||
Officers: (continued) | ||||||
Brian Harris YOB: 1973 | Chief Compliance Officer | Term: Indefinite Elected: 11/13 | Vice President, State Street Global Advisors and SSGA Funds Management, Inc.( June 2013 – Present); Senior Vice President and Global Head of Investment Compliance, BofA Global Capital Management (September 2010 to May 2013); Director of Compliance, AARP Financial Inc. (July 2008 to August 2010). | |||
David K. James YOB: 1970 | Secretary | Term: Indefinite Elected: 4/13 | Managing Director and Managing Counsel, State Street Bank and Trust Company (2009 – present); Vice President and Counsel, PNC Global Investment Servicing (US), Inc. (2006 – 2009). | |||
Kristin Schantz YOB: 1979 | Assistant Secretary | Term: Indefinite Elected: 2/14 | Vice President and Counsel, State Street Bank and Trust Company (2013 – present); Vice President, Citi Fund Services Ohio, Inc. (2008 – 2013). |
| * | Served in various capacities and/or with various affiliated entities during noted time period. |
The Statement of Additional Information includes additional information about the Trustees and is available, without charge, upon request, by calling (toll free) 877-521-4083.
45
Table of Contents
Trustees
William L. Boyan
Michael F. Holland
William L. Marshall
Scott F. Powers
Patrick J. Riley
James E. Ross
Richard D. Shirk
Rina K. Spence
Bruce D. Taber
Douglas T. Williams
Investment Adviser and Administrator of the Equity 500 Fund
SSGA Funds Management, Inc.
State Street Financial Center
One Lincoln Street
Boston, MA 02111
Custodian and Administrator of the Equity 500 II Portfolio
State Street Bank and Trust Company
State Street Financial Center
One Lincoln Street
Boston, MA 02111
Independent Registered Public Accounting Firm
Ernst & Young LLP
200 Clarendon Street
Boston, MA 02116
Legal Counsel
Ropes & Gray LLP
800 Boylston Street
Boston, MA 02119
Transfer Agent of the Equity 500 Fund and the Equity 500 II Portfolio
Boston Financial Data Services
Two Heritage Drive
North Quincy, MA 02171
Distributor
State Street Global Markets LLC
State Street Financial Center
One Lincoln Street
Boston, MA 02111
This report is for shareholder information. This is not a prospectus intended for use in the purchase or sale of shares of beneficial interest.
State Street Institutional Investment Trust State Street Bank and Trust Company P.O. Box 5049 Boston, MA 02206 | SSITEQ5AR IBG-14271 |
Table of Contents
Annual Report
31 December 2014
State Street Institutional Investment Trust
State Street Aggregate Bond Index Fund
State Street Global Equity ex-U.S. Index Fund
State Street Aggregate Bond Index Portfolio
State Street Global Equity ex-U.S. Index Portfolio

Table of Contents
State Street Institutional Investment Trust
Statements of Assets and Liabilities
December 31, 2014
| State Street Aggregate Bond Index Fund | State Street Global Equity ex-U.S. Index Fund | |||||||
Assets | ||||||||
Investments in corresponding Portfolio, at market value (Note 1)* | $ | 75,476,781 | $ | 40,880,447 | ||||
Receivable from Adviser (Note 4) | 69,243 | 69,758 | ||||||
|
|
|
| |||||
Total assets | 75,546,024 | 40,950,205 | ||||||
|
|
|
| |||||
Liabilities | ||||||||
Advisory fees payable | 4,821 | 7,245 | ||||||
Administration fees payable (Note 4) | 8,035 | 6,037 | ||||||
Custody and accounting fees payable | 3,487 | 3,625 | ||||||
Sub-Transfer Agent fee payable (Note 4) | 977 | 54 | ||||||
Distribution fees payable (Note 4) | 24 | 24 | ||||||
Registration and filing fees payable | 16,533 | 16,988 | ||||||
Professional fees payable | 14,990 | 15,030 | ||||||
Transfer agent fees payable | 7,341 | 4,705 | ||||||
Printing fees payable | 1,910 | 761 | ||||||
Insurance fees payable | 3,027 | 3,144 | ||||||
Accrued expenses and other liabilities | 553 | 575 | ||||||
|
|
|
| |||||
Total liabilities | 61,698 | 58,188 | ||||||
|
|
|
| |||||
Net Assets | $ | 75,484,326 | $ | 40,892,017 | ||||
|
|
|
| |||||
Net Assets Consist of: | ||||||||
Paid-in capital | $ | 74,860,525 | $ | 44,594,872 | ||||
Accumulated net realized gain (loss) | – | (1,996 | ) | |||||
Net unrealized appreciation/depreciation on investments | 623,801 | (3,700,859 | ) | |||||
|
|
|
| |||||
Net Assets | $ | 75,484,326 | $ | 40,892,017 | ||||
|
|
|
| |||||
Class A | ||||||||
Net Assets | $ | 50,683 | $ | 45,828 | ||||
Shares of beneficial interest outstanding | 5,000 | 5,000 | ||||||
|
|
|
| |||||
Offering, net asset value, and redemption price per share | $ | 10.14 | $ | 9.17 | ||||
|
|
|
| |||||
Maximum Sales Charge | 4.50 | % | 4.50 | % | ||||
Maximum offering price per share | $ | 10.62 | $ | 9.60 | ||||
|
|
|
| |||||
Class I | ||||||||
Net Assets | $ | 4,483,591 | $ | 45,828 | ||||
Shares of beneficial interest outstanding | 442,452 | 5,000 | ||||||
|
|
|
| |||||
Offering, net asset value, and redemption price per share | $ | 10.13 | $ | 9.17 | ||||
|
|
|
| |||||
Class K | ||||||||
Net Assets | $ | 70,950,052 | $ | 40,800,361 | ||||
Shares of beneficial interest outstanding | 6,999,392 | 4,451,482 | ||||||
|
|
|
| |||||
Offering, net asset value, and redemption price per share | $ | 10.14 | $ | 9.17 | ||||
|
|
|
| |||||
* Investments in corresponding Portfolio, at cost (Note 1) | $ | 74,852,980 | $ | 44,581,306 | ||||
* Shares of corresponding Portfolio | 7,444,123 | 4,460,389 | ||||||
See Notes to Financial Statements and Financial Statements of the corresponding Portfolios.
2
Table of Contents
State Street Institutional Investment Trust
Statements of Operations
Period Ended December 31, 2014
| State Street Aggregate Bond Index Fund* | State Street Global Equity ex-U.S. Index Fund** | |||||||
Income | ||||||||
Dividend income from corresponding Portfolio (Note 1) | $ | 245,468 | $ | 259,727 | ||||
|
|
|
| |||||
Expenses | ||||||||
Advisory fees | 4,821 | 7,245 | ||||||
Administration fees (Note 4) | 12,075 | 10,237 | ||||||
Sub-Transfer Agent fee (Note 4) | ||||||||
Class A | 29 | 27 | ||||||
Class I | 948 | 27 | ||||||
Distribution fees (Note 4) | ||||||||
Class A | 35 | 34 | ||||||
Registration and filing fees | 17,117 | 17,573 | ||||||
Professional fees | 14,996 | 15,035 | ||||||
Transfer agent fees (Note 4) | 28,027 | 25,381 | ||||||
Printing fees | 3,643 | 9,255 | ||||||
Insurance fees | 3,027 | 3,144 | ||||||
|
|
|
| |||||
Total expenses | 84,718 | 87,958 | ||||||
|
|
|
| |||||
Less: Expenses reimbursed by the Adviser (Note 4) | (69,243 | ) | (69,758 | ) | ||||
|
|
|
| |||||
Net expenses | 15,475 | 18,200 | ||||||
|
|
|
| |||||
Net Investment Income | 229,993 | 241,527 | ||||||
|
|
|
| |||||
Realized and Unrealized Gain (Loss) | ||||||||
Net realized gain on: | ||||||||
Net realized gain on investments from corresponding Portfolio | 155,412 | (1,996 | ) | |||||
Change in net unrealized appreciation/depreciation on: | ||||||||
Investments from corresponding Portfolio | 623,801 | (3,700,859 | ) | |||||
|
|
|
| |||||
Total realized and unrealized gain (loss) | 779,213 | (3,702,855 | ) | |||||
|
|
|
| |||||
Net Increase (Decrease) in Net Assets Resulting from Operations | $ | 1,009,206 | $ | (3,461,328 | ) | |||
|
|
|
| |||||
| * | For the period from September 19, 2014 (commencement of operations) to December 31, 2014. |
| ** | For the period from September 17, 2014 (commencement of operations) to December 31, 2014. |
See Notes to Financial Statements and Financial Statements of the corresponding Portfolios.
3
Table of Contents
State Street Institutional Investment Trust
Statements of Changes in Net Assets
| State Street Aggregate Bond Index Fund | State Street Global Equity ex-U.S. Index Fund | |||||||
| For the Period 9/19/14* - 12/31/14 | For the Period 9/17/14* - 12/31/14 | |||||||
Increase (Decrease) in Net Assets Resulting from: | ||||||||
Operations: | ||||||||
Net investment income | $ | 229,993 | $ | 241,527 | ||||
Net realized gain (loss) on investments | 155,412 | (1,996 | ) | |||||
Change in net unrealized appreciation on investments | 623,801 | (3,700,859 | ) | |||||
|
|
|
| |||||
Net increase (decrease) in net assets from operations | 1,009,206 | (3,461,328 | ) | |||||
|
|
|
| |||||
Distributions to Shareholders from: | ||||||||
Net investment income | ||||||||
Class A | (224 | ) | (212 | ) | ||||
Class I | (18,524 | ) | (246 | ) | ||||
Class K | (366,853 | ) | (241,183 | ) | ||||
|
|
|
| |||||
Total distributions | (385,601 | ) | (241,641 | ) | ||||
|
|
|
| |||||
Net Increase (Decrease) from Capital Share Transactions: | ||||||||
Class A | ||||||||
Shares sold | 50,000 | 50,000 | ||||||
|
|
|
| |||||
Class I | ||||||||
Shares sold | 4,450,000 | 50,000 | ||||||
Reinvestment of distribution | 18,266 | – | ||||||
|
|
|
| |||||
Net increase from capital share transactions | 4,468,266 | 50,000 | ||||||
|
|
|
| |||||
Class K | ||||||||
Shares sold | 70,042,895 | 44,253,803 | ||||||
Reinvestment of distributions | 299,560 | 241,183 | ||||||
|
|
|
| |||||
Net increase from capital share transactions | 70,342,455 | 44,494,986 | ||||||
|
|
|
| |||||
Net Increase in Net Assets | 75,484,326 | 40,892,017 | ||||||
Net Assets | ||||||||
End of period | $ | 75,484,326 | $ | 40,892,017 | ||||
|
|
|
| |||||
Changes in Shares: | ||||||||
Class A | ||||||||
Shares sold | 5,000 | 5,000 | ||||||
|
|
|
| |||||
Class I | ||||||||
Shares sold | 440,643 | 5,000 | ||||||
Reinvestment of distributions | 1,809 | – | ||||||
|
|
|
| |||||
Net increase in shares | 442,452 | 5,000 | ||||||
|
|
|
| |||||
Class K | ||||||||
Shares sold | 6,969,737 | 4,425,380 | ||||||
Reinvestment of distributions | 29,655 | 26,102 | ||||||
|
|
|
| |||||
Net increase in shares | 6,999,392 | 4,451,482 | ||||||
|
|
|
| |||||
| * | Commencement of operations |
See Notes to Financial Statements and Financial Statements of the corresponding Portfolios.
4
Table of Contents
State Street Institutional Investment Trust
Financial Highlights
Selected data for a Class A Share of beneficial interest outstanding throughout each period is presented below:
| State Street Aggregate Bond Index Fund Period from 9/19/14* - 12/31/14 | State Street Global Equity ex-U.S. Index Fund Period from 9/17/14* - 12/31/14 | |||||||
Per Share Operating Performance: | ||||||||
Net Asset Value, Beginning of Period | $ | 10.00 | $ | 10.00 | ||||
|
|
|
| |||||
Investment Operations: | ||||||||
Net investment income(a) | 0.02 | 0.04 | ||||||
Net realized and unrealized gain (loss) on investments | 0.16 | (0.83 | ) | |||||
|
|
|
| |||||
Total from investment operations | 0.18 | (0.79 | ) | |||||
|
|
|
| |||||
Less Distributions From: | ||||||||
Net investment income | (0.04 | ) | (0.04 | ) | ||||
|
|
|
| |||||
Net increase (decrease) in net assets | 0.14 | (0.83 | ) | |||||
|
|
|
| |||||
Net Asset Value, End of Period | $ | 10.14 | $ | 9.17 | ||||
|
|
|
| |||||
Total Return(b)(c) | 1.85 | % | (7.88 | )% | ||||
Ratios and Supplemental Data: | ||||||||
Net Assets, End of Period (000s) | $ | 51 | $ | 46 | ||||
Ratios to average net assets: | ||||||||
Gross expenses(d)(e) | 0.91 | % | 1.17 | % | ||||
Net expenses(d)(e) | 0.52 | % | 0.60 | % | ||||
Net investment income(d) | 0.58 | % | 1.55 | % | ||||
Portfolio turnover rate(c)(f) | 16 | % | 0 | % | ||||
| * | Commencement of operations. |
| (a) | Net investment income per share is calculated using the average shares method. |
| (b) | Total return is calculated assuming a purchase of shares at net asset value on the first day and a sale at net asset value on the last day of each period reported. Distributions are assumed, for the purpose of this calculation, to be reinvested at net asset value per share on the respective payment dates. Results represent past performance and are not indicative of future results. |
| (c) | Not annualized. |
| (d) | Annualized. |
| (e) | Ratio does not include the expenses of the corresponding Portfolio. |
| (f) | Portfolio turnover rate is from the corresponding Portfolio. |
See Notes to Financial Statements and Financial Statements of the corresponding Portfolios.
5
Table of Contents
State Street Institutional Investment Trust
Financial Highlights
Selected data for a Class I Share of beneficial interest outstanding throughout each period is presented below:
| State Street Aggregate Bond Index Fund Period from 9/19/14* - 12/31/14 | State Street Global Equity ex-U.S. Index Fund Period from 9/17/14* - 12/31/14 | |||||||
Per Share Operating Performance: | ||||||||
Net Asset Value, Beginning of Period | $ | 10.00 | $ | 10.00 | ||||
|
|
|
| |||||
Investment Operations: | ||||||||
Net investment income(a) | 0.08 | 0.05 | ||||||
Net realized and unrealized gain (loss) on investments | 0.09 | (0.83 | ) | |||||
|
|
|
| |||||
Total from investment operations | 0.17 | (0.78 | ) | |||||
|
|
|
| |||||
Less Distributions From: | ||||||||
Net investment income | (0.04 | ) | (0.05 | ) | ||||
|
|
|
| |||||
Net increase (decrease) in net assets | 0.13 | (0.83 | ) | |||||
|
|
|
| |||||
Net Asset Value, End of Period | $ | 10.13 | $ | 9.17 | ||||
|
|
|
| |||||
Total Return(b)(c) | 1.82 | % | (7.81 | )% | ||||
Ratios and Supplemental Data: | ||||||||
Net Assets, End of Period (000s) | $ | 4,484 | $ | 46 | ||||
Ratios to average net assets: | ||||||||
Gross expenses(d)(e) | 0.88 | % | 0.92 | % | ||||
Net expenses(d)(e) | 0.28 | % | 0.35 | % | ||||
Net investment income(d) | 2.91 | % | 1.81 | % | ||||
Portfolio turnover rate(c)(f) | 16 | % | 0 | % | ||||
| * | Commencement of operations. |
| (a) | Net investment income per share is calculated using the average shares method. |
| (b) | Total return is calculated assuming a purchase of shares at net asset value on the first day and a sale at net asset value on the last day of each period reported. Distributions are assumed, for the purpose of this calculation, to be reinvested at net asset value per share on the respective payment dates. Results represent past performance and are not indicative of future results. |
| (c) | Not annualized. |
| (d) | Annualized. |
| (e) | Ratio does not include the expenses of the corresponding Portfolio. |
| (f) | Portfolio turnover rate is from the corresponding Portfolio. |
See Notes to Financial Statements and Financial Statements of the corresponding Portfolios.
6
Table of Contents
State Street Institutional Investment Trust
Financial Highlights
Selected data for a Class K Share of beneficial interest outstanding throughout each period is presented below:
| State Street Aggregate Bond Index Fund Period from 9/19/14* - 12/31/14 | State Street Global Equity ex-U.S. Index Fund Period from 9/17/14* - 12/31/14 | |||||||
Per Share Operating Performance: | ||||||||
Net Asset Value, Beginning of Period | $ | 10.00 | $ | 10.00 | ||||
|
|
|
| |||||
Investment Operations: | ||||||||
Net investment income(a) | 0.04 | 0.05 | ||||||
Net realized and unrealized gain (loss) on investments | 0.15 | (0.83 | ) | |||||
|
|
|
| |||||
Total from investment operations | 0.19 | (0.78 | ) | |||||
|
|
|
| |||||
Less Distributions From: | ||||||||
Net investment income | (0.05 | ) | (0.05 | ) | ||||
|
|
|
| |||||
Net increase (decrease) in net assets | 0.14 | (0.83 | ) | |||||
|
|
|
| |||||
Net Asset Value, End of Period | $ | 10.14 | $ | 9.17 | ||||
|
|
|
| |||||
Total Return(b)(c) | 1.97 | % | (7.76 | )% | ||||
Ratios and Supplemental Data: | ||||||||
Net Assets, End of Period (000s) | $ | 70,950 | $ | 40,800 | ||||
Ratios to average net assets: | ||||||||
Gross expenses(d)(e) | 0.50 | % | 0.73 | % | ||||
Net expenses(d)(e) | 0.09 | % | 0.15 | % | ||||
Net investment income(d) | 1.33 | % | 2.00 | % | ||||
Portfolio turnover rate(c)(f) | 16 | % | 0 | % | ||||
| * | Commencement of operations. |
| (a) | Net investment income per share is calculated using the average shares method. |
| (b) | Total return is calculated assuming a purchase of shares at net asset value on the first day and a sale at net asset value on the last day of each period reported. Distributions are assumed, for the purpose of this calculation, to be reinvested at net asset value per share on the respective payment dates. Results represent past performance and are not indicative of future results. |
| (c) | Not annualized. |
| (d) | Annualized. |
| (e) | Ratio does not include the expenses of the corresponding Portfolio. |
| (f) | Portfolio turnover rate is from the corresponding Portfolio. |
See Notes to Financial Statements and Financial Statements of the corresponding Portfolios.
7
Table of Contents
State Street Aggregate Bond Index Portfolio
Portfolio Statistics (Unaudited)
Portfolio Composition* | December 31, 2014 | |||
U.S. Treasury Obligations | 36.0 | % | ||
Corporate Bonds | 26.4 | |||
U.S. Government Agency MBS TBA | 23.4 | |||
U.S. Government Agency Obligations | 9.2 | |||
Foreign Government Obligations | 2.2 | |||
Commercial Mortgage Backed Securities | 1.2 | |||
Asset Backed Securities | 0.5 | |||
Municipal Bonds & Notes | 0.2 | |||
Short Term Investments | 24.9 | |||
Other Liabilities in Excess of Assets | (24.0 | ) | ||
Total | 100.0 | % |
Top Five Sectors (excluding short-term investments)* | December 31, 2014 | |||
Oil, Gas & Consumable Fuels | 3.4 | % | ||
Diversified Financial Services | 3.0 | |||
Banks | 2.8 | |||
Electric Utilities | 1.5 | |||
Capital Markets | 1.5 | |||
Total | 12.2 | % |
| * | As a percentage of net assets as of the date indicated. The Portfolio’s composition will vary over time. |
See Notes to Financial Statements.
8
Table of Contents
State Street Aggregate Bond Index Portfolio
Portfolio of Investments
December 31, 2014
Security Description | Interest Rate | Maturity Date | Principal Amount | Value | ||||||||||||
| CORPORATE BONDS – 26.4% | ||||||||||||||||
| Aerospace & Defense – 0.4% | ||||||||||||||||
Boeing Co. (The) | 0.950 | % | 05/15/2018 | $ | 25,000 | $ | 24,364 | |||||||||
Honeywell International, Inc. | 5.300 | % | 03/01/2018 | 25,000 | 27,821 | |||||||||||
L-3 Communications Corp. | 4.950 | % | 02/15/2021 | 25,000 | 27,083 | |||||||||||
Lockheed Martin Corp. | 2.125 | % | 09/15/2016 | 25,000 | 25,433 | |||||||||||
Northrop Grumman Corp. | 4.750 | % | 06/01/2043 | 25,000 | 27,459 | |||||||||||
Precision Castparts Corp. | 2.500 | % | 01/15/2023 | 25,000 | 24,263 | |||||||||||
Raytheon Co. | 3.125 | % | 10/15/2020 | 25,000 | 25,598 | |||||||||||
United Technologies Corp. | 1.800 | % | 06/01/2017 | 25,000 | 25,339 | |||||||||||
United Technologies Corp. | 6.125 | % | 02/01/2019 | 25,000 | 29,017 | |||||||||||
United Technologies Corp. | 6.125 | % | 07/15/2038 | 50,000 | 65,405 | |||||||||||
|
| |||||||||||||||
| 301,782 | ||||||||||||||||
|
| |||||||||||||||
| Air Freight & Logistics – 0.1% | ||||||||||||||||
FedEx Corp. | 4.000 | % | 01/15/2024 | 25,000 | 26,551 | |||||||||||
United Parcel Service, Inc. | 2.450 | % | 10/01/2022 | 25,000 | 24,438 | |||||||||||
|
| |||||||||||||||
| 50,989 | ||||||||||||||||
|
| |||||||||||||||
| Airlines – 0.1% | ||||||||||||||||
American Airlines 2014-1 Pass Through Trust Class A | 3.700 | % | 04/01/2028 | 25,000 | 25,000 | |||||||||||
Southwest Airlines Co. | 2.750 | % | 11/06/2019 | 25,000 | 25,104 | |||||||||||
|
| |||||||||||||||
| 50,104 | ||||||||||||||||
|
| |||||||||||||||
| Auto Components – 0.1% | ||||||||||||||||
Johnson Controls, Inc. | 1.400 | % | 11/02/2017 | 25,000 | 24,739 | |||||||||||
Johnson Controls, Inc. | 3.625 | % | 07/02/2024 | 25,000 | 25,219 | |||||||||||
Johnson Controls, Inc. | 4.950 | % | 07/02/2064 | 25,000 | 25,963 | |||||||||||
|
| |||||||||||||||
| 75,921 | ||||||||||||||||
|
| |||||||||||||||
| Automobiles – 0.1% | ||||||||||||||||
Ford Motor Co. | 4.750 | % | 01/15/2043 | 50,000 | 52,664 | |||||||||||
|
| |||||||||||||||
| Banks – 2.5% | ||||||||||||||||
Abbey National Treasury Services PLC | 3.050 | % | 08/23/2018 | 25,000 | 25,823 | |||||||||||
Bank of Montreal | 1.450 | % | 04/09/2018 | 25,000 | 24,703 | |||||||||||
Bank of Nova Scotia (The) | 1.375 | % | 07/15/2016 | 50,000 | 50,325 | |||||||||||
Bank of Nova Scotia (The) | 1.300 | % | 07/21/2017 | 50,000 | 49,751 | |||||||||||
BB&T Corp. | 2.250 | % | 02/01/2019 | 25,000 | 25,013 | |||||||||||
BNP Paribas SA | 1.375 | % | 03/17/2017 | 25,000 | 24,960 | |||||||||||
BNP Paribas SA | 5.000 | % | 01/15/2021 | 25,000 | 28,223 | |||||||||||
Branch Banking & Trust Co. | 1.450 | % | 10/03/2016 | 25,000 | 25,087 | |||||||||||
Cooperatieve Centrale Raiffeisen-Boerenleenbank BA | 4.500 | % | 01/11/2021 | 50,000 | 54,993 | |||||||||||
Credit Suisse | 6.000 | % | 02/15/2018 | 25,000 | 27,798 | |||||||||||
Deutsche Bank AG | 1.350 | % | 05/30/2017 | 25,000 | 24,876 | |||||||||||
See accompanying notes to financial statements.
9
Table of Contents
State Street Aggregate Bond Index Portfolio
Portfolio of Investments — (continued)
December 31, 2014
Security Description | Interest Rate | Maturity Date | Principal Amount | Value | ||||||||||||
| CORPORATE BONDS – (continued) | ||||||||||||||||
| Banks – (continued) | ||||||||||||||||
Deutsche Bank AG | 2.500 | % | 02/13/2019 | $ | 25,000 | $ | 25,287 | |||||||||
Fifth Third Bancorp | 2.300 | % | 03/01/2019 | 50,000 | 49,988 | |||||||||||
HSBC Holdings PLC | 5.100 | % | 04/05/2021 | 50,000 | 56,487 | |||||||||||
International Finance Corp. | 1.000 | % | 04/24/2017 | 50,000 | 50,083 | |||||||||||
International Finance Corp. | 1.750 | % | 09/16/2019 | 25,000 | 25,063 | |||||||||||
KeyCorp | 2.300 | % | 12/13/2018 | 25,000 | 25,041 | |||||||||||
KFW | 0.875 | % | 12/15/2017 | 75,000 | 74,369 | |||||||||||
KFW | 1.000 | % | 06/11/2018 | 25,000 | 24,685 | |||||||||||
KFW | 4.500 | % | 07/16/2018 | 75,000 | 82,902 | |||||||||||
KFW | 0.500 | % | 04/19/2016 | 75,000 | 75,040 | |||||||||||
KFW | 1.875 | % | 04/01/2019 | 25,000 | 25,286 | |||||||||||
KFW | 2.625 | % | 01/25/2022 | 50,000 | 51,769 | |||||||||||
KFW | 2.125 | % | 01/17/2023 | 100,000 | 99,658 | |||||||||||
KFW | 2.500 | % | 11/20/2024 | 50,000 | 50,649 | |||||||||||
Landwirtschaftliche Rentenbank | 1.000 | % | 04/04/2018 | 50,000 | 49,459 | |||||||||||
Landwirtschaftliche Rentenbank | 2.250 | % | 10/01/2021 | 50,000 | 50,569 | |||||||||||
Lloyds Bank PLC | 4.875 | % | 01/21/2016 | 25,000 | 26,020 | |||||||||||
Oesterreichische Kontrollbank AG | 1.125 | % | 05/29/2018 | 50,000 | 49,526 | |||||||||||
Oesterreichische Kontrollbank AG | 1.625 | % | 03/12/2019 | 25,000 | 25,021 | |||||||||||
PNC Financial Services Group, Inc. (The) | 3.900 | % | 04/29/2024 | 50,000 | 50,878 | |||||||||||
PNC Funding Corp. | 3.300 | % | 03/08/2022 | 50,000 | 51,197 | |||||||||||
Royal Bank of Canada | 2.300 | % | 07/20/2016 | 50,000 | 51,000 | |||||||||||
Royal Bank of Canada | 1.500 | % | 01/16/2018 | 50,000 | 49,725 | |||||||||||
Royal Bank of Canada | 1.200 | % | 09/19/2018 | 50,000 | 49,692 | |||||||||||
SunTrust Banks, Inc. | 2.350 | % | 11/01/2018 | 25,000 | 25,066 | |||||||||||
Toronto-Dominion Bank (The) | 2.375 | % | 10/19/2016 | 50,000 | 51,180 | |||||||||||
Toronto-Dominion Bank (The) | 1.125 | % | 05/02/2017 | 25,000 | 24,883 | |||||||||||
US Bancorp | 2.200 | % | 04/25/2019 | 25,000 | 25,044 | |||||||||||
US Bancorp | 3.600 | % | 09/11/2024 | 25,000 | 25,358 | |||||||||||
Wells Fargo & Co.(a) | 3.676 | % | 06/15/2016 | 50,000 | 51,819 | |||||||||||
Wells Fargo & Co. | 2.150 | % | 01/15/2019 | 25,000 | 25,042 | |||||||||||
Wells Fargo & Co. | 3.000 | % | 01/22/2021 | 50,000 | 51,183 | |||||||||||
Wells Fargo & Co. | 4.125 | % | 08/15/2023 | 25,000 | 26,165 | |||||||||||
Wells Fargo & Co. | 4.480 | % | 01/16/2024 | 25,000 | 26,518 | |||||||||||
Wells Fargo & Co. | 5.606 | % | 01/15/2044 | 50,000 | 58,762 | |||||||||||
Wells Fargo Capital X | 5.950 | % | 12/01/2086 | 25,000 | 25,500 | |||||||||||
Westpac Banking Corp. | 2.250 | % | 01/17/2019 | 25,000 | 25,207 | |||||||||||
|
| |||||||||||||||
| 1,972,673 | ||||||||||||||||
|
| |||||||||||||||
See accompanying notes to financial statements.
10
Table of Contents
State Street Aggregate Bond Index Portfolio
Portfolio of Investments — (continued)
December 31, 2014
Security Description | Interest Rate | Maturity Date | Principal Amount | Value | ||||||||||||
| CORPORATE BONDS – (continued) | ||||||||||||||||
| Beverages – 0.6% | ||||||||||||||||
Anheuser-Busch InBev Finance, Inc. | 1.125 | % | 01/27/2017 | $ | 25,000 | $ | 24,988 | |||||||||
Anheuser-Busch InBev Finance, Inc. | 2.150 | % | 02/01/2019 | 25,000 | 25,043 | |||||||||||
Anheuser-Busch InBev Finance, Inc. | 3.700 | % | 02/01/2024 | 100,000 | 103,881 | |||||||||||
Anheuser-Busch InBev Worldwide, Inc. | 3.750 | % | 07/15/2042 | 50,000 | 47,153 | |||||||||||
Coca-Cola Co. (The) | 1.150 | % | 04/01/2018 | 25,000 | 24,692 | |||||||||||
Coca-Cola Co. (The) | 1.650 | % | 11/01/2018 | 25,000 | 24,954 | |||||||||||
Coca-Cola Co. (The) | 3.200 | % | 11/01/2023 | 25,000 | 25,691 | |||||||||||
Diageo Capital PLC | 1.500 | % | 05/11/2017 | 25,000 | 25,042 | |||||||||||
Diageo Capital PLC | 2.625 | % | 04/29/2023 | 25,000 | 24,270 | |||||||||||
Dr Pepper Snapple Group, Inc. | 2.000 | % | 01/15/2020 | 25,000 | 24,405 | |||||||||||
PepsiCo, Inc. | 2.500 | % | 05/10/2016 | 25,000 | 25,574 | |||||||||||
PepsiCo, Inc. | 0.950 | % | 02/22/2017 | 25,000 | 24,885 | |||||||||||
PepsiCo, Inc. | 3.600 | % | 03/01/2024 | 25,000 | 26,019 | |||||||||||
PepsiCo, Inc. | 4.250 | % | 10/22/2044 | 50,000 | 51,733 | |||||||||||
|
| |||||||||||||||
| 478,330 | ||||||||||||||||
|
| |||||||||||||||
| Biotechnology – 0.2% | ||||||||||||||||
Amgen, Inc. | 3.625 | % | 05/22/2024 | 50,000 | 50,745 | |||||||||||
Amgen, Inc. | 6.375 | % | 06/01/2037 | 50,000 | 62,276 | |||||||||||
Celgene Corp. | 3.625 | % | 05/15/2024 | 25,000 | 25,391 | |||||||||||
Gilead Sciences, Inc. | 4.400 | % | 12/01/2021 | 25,000 | 27,380 | |||||||||||
Gilead Sciences, Inc. | 4.500 | % | 02/01/2045 | 25,000 | 26,626 | |||||||||||
|
| |||||||||||||||
| 192,418 | ||||||||||||||||
|
| |||||||||||||||
| Building Products – 0.0%(b) | ||||||||||||||||
CRH America, Inc. | 6.000 | % | 09/30/2016 | 25,000 | 26,875 | |||||||||||
|
| |||||||||||||||
| Capital Markets – 1.4% | ||||||||||||||||
Bank of New York Mellon Corp. (The) | 2.200 | % | 03/04/2019 | 25,000 | 25,043 | |||||||||||
Bank of New York Mellon Corp. (The) | 2.300 | % | 09/11/2019 | 100,000 | 100,191 | |||||||||||
Bear Stearns Cos. LLC (The) | 6.400 | % | 10/02/2017 | 50,000 | 56,106 | |||||||||||
BlackRock, Inc. | 3.500 | % | 03/18/2024 | 25,000 | 25,646 | |||||||||||
Goldman Sachs Group, Inc. (The) | 3.625 | % | 02/07/2016 | 50,000 | 51,305 | |||||||||||
Goldman Sachs Group, Inc. (The) | 2.900 | % | 07/19/2018 | 50,000 | 51,006 | |||||||||||
Goldman Sachs Group, Inc. (The) | 2.625 | % | 01/31/2019 | 50,000 | 50,190 | |||||||||||
Goldman Sachs Group, Inc. (The) | 2.550 | % | 10/23/2019 | 25,000 | 24,869 | |||||||||||
Goldman Sachs Group, Inc. (The) | 3.625 | % | 01/22/2023 | 25,000 | 25,246 | |||||||||||
Goldman Sachs Group, Inc. (The) | 4.000 | % | 03/03/2024 | 50,000 | 51,970 | |||||||||||
Goldman Sachs Group, Inc. (The) | 5.950 | % | 01/15/2027 | 50,000 | 57,062 | |||||||||||
Goldman Sachs Group, Inc. (The) | 4.800 | % | 07/08/2044 | 50,000 | 53,203 | |||||||||||
HSBC USA, Inc. | 1.625 | % | 01/16/2018 | 100,000 | 99,643 | |||||||||||
Jefferies Group LLC | 5.500 | % | 03/15/2016 | 40,000 | 41,693 | |||||||||||
See accompanying notes to financial statements.
11
Table of Contents
State Street Aggregate Bond Index Portfolio
Portfolio of Investments — (continued)
December 31, 2014
Security Description | Interest Rate | Maturity Date | Principal Amount | Value | ||||||||||||
| CORPORATE BONDS – (continued) | ||||||||||||||||
| Capital Markets – (continued) | ||||||||||||||||
Morgan Stanley | 1.750 | % | 02/25/2016 | $ | 50,000 | $ | 50,297 | |||||||||
Morgan Stanley | 4.750 | % | 03/22/2017 | 50,000 | 53,304 | |||||||||||
Morgan Stanley | 2.125 | % | 04/25/2018 | 25,000 | 24,991 | |||||||||||
Morgan Stanley | 3.750 | % | 02/25/2023 | 50,000 | 51,221 | |||||||||||
Morgan Stanley | 2.375 | % | 07/23/2019 | 50,000 | 49,783 | |||||||||||
Morgan Stanley | 5.500 | % | 07/24/2020 | 100,000 | 112,962 | |||||||||||
Morgan Stanley | 4.350 | % | 09/08/2026 | 50,000 | 50,116 | |||||||||||
Svensk Exportkredit AB | 1.750 | % | 05/30/2017 | 25,000 | 25,419 | |||||||||||
TD Ameritrade Holding Corp. | 5.600 | % | 12/01/2019 | 25,000 | 28,544 | |||||||||||
|
| |||||||||||||||
| 1,159,810 | ||||||||||||||||
|
| |||||||||||||||
| Chemicals – 0.5% | ||||||||||||||||
CF Industries, Inc. | 3.450 | % | 06/01/2023 | 25,000 | 24,420 | |||||||||||
Dow Chemical Co. (The) | 4.250 | % | 11/15/2020 | 25,000 | 26,731 | |||||||||||
Dow Chemical Co. (The) | 3.000 | % | 11/15/2022 | 25,000 | 24,375 | |||||||||||
Dow Chemical Co. (The) | 4.250 | % | 10/01/2034 | 50,000 | 49,491 | |||||||||||
Eastman Chemical Co. | 3.800 | % | 03/15/2025 | 25,000 | 25,262 | |||||||||||
Ecolab, Inc. | 4.350 | % | 12/08/2021 | 25,000 | 27,174 | |||||||||||
EI du Pont de Nemours & Co. | 6.000 | % | 07/15/2018 | 25,000 | 28,419 | |||||||||||
EI du Pont de Nemours & Co. | 3.625 | % | 01/15/2021 | 25,000 | 26,303 | |||||||||||
EI du Pont de Nemours & Co. | 4.150 | % | 02/15/2043 | 25,000 | 24,726 | |||||||||||
Lubrizol Corp. | 8.875 | % | 02/01/2019 | 25,000 | 31,143 | |||||||||||
Monsanto Co. | 4.700 | % | 07/15/2064 | 25,000 | 26,002 | |||||||||||
PPG Industries, Inc. | 2.300 | % | 11/15/2019 | 25,000 | 24,765 | |||||||||||
Praxair, Inc. | 3.550 | % | 11/07/2042 | 25,000 | 23,333 | |||||||||||
|
| |||||||||||||||
| 362,144 | ||||||||||||||||
|
| |||||||||||||||
| Commercial Services & Supplies – 0.1% | ||||||||||||||||
Republic Services, Inc. | 3.550 | % | 06/01/2022 | 25,000 | 25,550 | |||||||||||
Waste Management, Inc. | 3.500 | % | 05/15/2024 | 25,000 | 25,305 | |||||||||||
Western Union Co. (The) | 3.350 | % | 05/22/2019 | 25,000 | 25,662 | |||||||||||
|
| |||||||||||||||
| 76,517 | ||||||||||||||||
|
| |||||||||||||||
| Communications Equipment – 0.1% | ||||||||||||||||
Cisco Systems, Inc. | 5.500 | % | 02/22/2016 | 25,000 | 26,354 | |||||||||||
Cisco Systems, Inc. | 2.125 | % | 03/01/2019 | 25,000 | 25,068 | |||||||||||
Cisco Systems, Inc. | 3.625 | % | 03/04/2024 | 25,000 | 26,175 | |||||||||||
Motorola Solutions, Inc. | 4.000 | % | 09/01/2024 | 25,000 | 25,151 | |||||||||||
|
| |||||||||||||||
| 102,748 | ||||||||||||||||
|
| |||||||||||||||
| Consumer Finance – 0.3% | ||||||||||||||||
Capital One Financial Corp. | 2.450 | % | 04/24/2019 | 50,000 | 49,784 | |||||||||||
See accompanying notes to financial statements.
12
Table of Contents
State Street Aggregate Bond Index Portfolio
Portfolio of Investments — (continued)
December 31, 2014
Security Description | Interest Rate | Maturity Date | Principal Amount | Value | ||||||||||||
| CORPORATE BONDS – (continued) | ||||||||||||||||
| Consumer Finance – (continued) | ||||||||||||||||
Caterpillar Financial Services Corp. | 1.000 | % | 03/03/2017 | $ | 25,000 | $ | 24,905 | |||||||||
Caterpillar Financial Services Corp. | 3.750 | % | 11/24/2023 | 25,000 | 26,466 | |||||||||||
Discover Financial Services | 3.850 | % | 11/21/2022 | 50,000 | 50,768 | |||||||||||
John Deere Capital Corp. | 1.050 | % | 12/15/2016 | 25,000 | 24,962 | |||||||||||
Synchrony Financial | 1.875 | % | 08/15/2017 | 25,000 | 25,010 | |||||||||||
|
| |||||||||||||||
| 201,895 | ||||||||||||||||
|
| |||||||||||||||
| Diversified Consumer Services – 0.1% | ||||||||||||||||
Massachusetts Institute of Technology | 3.959 | % | 07/01/2038 | 50,000 | 52,779 | |||||||||||
|
| |||||||||||||||
| Diversified Financial Services – 3.0% | ||||||||||||||||
Air Lease Corp. | 4.250 | % | 09/15/2024 | 25,000 | 25,244 | |||||||||||
American Express Co. | 3.625 | % | 12/05/2024 | 75,000 | 75,938 | |||||||||||
American Express Credit Corp. | 2.125 | % | 03/18/2019 | 50,000 | 49,837 | |||||||||||
American Express Credit Corp. | 2.250 | % | 08/15/2019 | 50,000 | 49,877 | |||||||||||
American Honda Finance Corp. | 2.250 | % | 08/15/2019 | 25,000 | 25,048 | |||||||||||
Ameriprise Financial, Inc. | 3.700 | % | 10/15/2024 | 50,000 | 51,137 | |||||||||||
Aon PLC | 4.450 | % | 05/24/2043 | 75,000 | 75,399 | |||||||||||
Bank of America Corp. | 1.250 | % | 01/11/2016 | 25,000 | 25,044 | |||||||||||
Bank of America Corp. | 6.500 | % | 08/01/2016 | 75,000 | 80,872 | |||||||||||
Bank of America Corp. | 2.600 | % | 01/15/2019 | 50,000 | 50,332 | |||||||||||
Bank of America Corp. | 2.650 | % | 04/01/2019 | 50,000 | 50,348 | |||||||||||
Bank of America Corp. | 4.125 | % | 01/22/2024 | 25,000 | 26,255 | |||||||||||
Bank of America Corp. | 4.000 | % | 04/01/2024 | 50,000 | 52,064 | |||||||||||
Bank of America Corp. | 4.200 | % | 08/26/2024 | 50,000 | 50,777 | |||||||||||
Bank of America Corp. | 4.250 | % | 10/22/2026 | 75,000 | 74,488 | |||||||||||
Capital One Financial Corp. | 6.750 | % | 09/15/2017 | 25,000 | 28,091 | |||||||||||
Citigroup, Inc. | 1.250 | % | 01/15/2016 | 50,000 | 50,063 | |||||||||||
Citigroup, Inc. | 1.550 | % | 08/14/2017 | 50,000 | 49,707 | |||||||||||
Citigroup, Inc. | 2.500 | % | 09/26/2018 | 50,000 | 50,434 | |||||||||||
Citigroup, Inc. | 2.550 | % | 04/08/2019 | 50,000 | 50,290 | |||||||||||
Citigroup, Inc. | 3.750 | % | 06/16/2024 | 25,000 | 25,512 | |||||||||||
Citigroup, Inc. | 4.300 | % | 11/20/2026 | 50,000 | 49,750 | |||||||||||
Citigroup, Inc. | 5.300 | % | 05/06/2044 | 50,000 | 54,104 | |||||||||||
Credit Suisse USA, Inc. | 7.125 | % | 07/15/2032 | 50,000 | 69,976 | |||||||||||
Ford Motor Credit Co. LLC | 6.625 | % | 08/15/2017 | 100,000 | 111,539 | |||||||||||
General Electric Capital Corp. | 1.000 | % | 01/08/2016 | 25,000 | 25,094 | |||||||||||
General Electric Capital Corp. | 1.500 | % | 07/12/2016 | 25,000 | 25,217 | |||||||||||
General Electric Capital Corp. | 5.625 | % | 09/15/2017 | 50,000 | 55,378 | |||||||||||
General Electric Capital Corp. | 2.300 | % | 01/14/2019 | 25,000 | 25,381 | |||||||||||
General Electric Capital Corp. | 5.300 | % | 02/11/2021 | 25,000 | 28,451 | |||||||||||
See accompanying notes to financial statements.
13
Table of Contents
State Street Aggregate Bond Index Portfolio
Portfolio of Investments — (continued)
December 31, 2014
Security Description | Interest Rate | Maturity Date | Principal Amount | Value | ||||||||||||
| CORPORATE BONDS – (continued) | ||||||||||||||||
| Diversified Financial Services – (continued) | ||||||||||||||||
General Electric Capital Corp. | 4.650 | % | 10/17/2021 | $ | 50,000 | $ | 55,935 | |||||||||
General Electric Capital Corp. | 3.450 | % | 05/15/2024 | 50,000 | 51,606 | |||||||||||
General Electric Capital Corp. | 5.875 | % | 01/14/2038 | 50,000 | 63,176 | |||||||||||
HSBC Finance Corp. | 6.676 | % | 01/15/2021 | 25,000 | 29,551 | |||||||||||
JPMorgan Chase & Co. | 1.350 | % | 02/15/2017 | 50,000 | 49,969 | |||||||||||
JPMorgan Chase & Co. | 1.625 | % | 05/15/2018 | 50,000 | 49,381 | |||||||||||
JPMorgan Chase & Co. | 2.350 | % | 01/28/2019 | 50,000 | 50,279 | |||||||||||
JPMorgan Chase & Co. | 3.375 | % | 05/01/2023 | 75,000 | 73,138 | |||||||||||
JPMorgan Chase & Co. | 3.875 | % | 02/01/2024 | 50,000 | 52,025 | |||||||||||
JPMorgan Chase & Co. | 4.125 | % | 12/15/2026 | 100,000 | 100,289 | |||||||||||
JPMorgan Chase & Co. | 4.850 | % | 02/01/2044 | 50,000 | 55,456 | |||||||||||
National Rural Utilities Cooperative Finance Corp. | 4.750 | % | 04/30/2043 | 75,000 | 73,875 | |||||||||||
Nomura Holdings, Inc. | 2.000 | % | 09/13/2016 | 25,000 | 25,134 | |||||||||||
Royal Bank of Scotland PLC (The) | 4.375 | % | 03/16/2016 | 25,000 | 25,864 | |||||||||||
Toyota Motor Credit Corp. | 0.800 | % | 05/17/2016 | 25,000 | 24,990 | |||||||||||
Toyota Motor Credit Corp. | 2.100 | % | 01/17/2019 | 50,000 | 50,201 | |||||||||||
UBS AG | 5.750 | % | 04/25/2018 | 100,000 | 112,261 | |||||||||||
|
| |||||||||||||||
| 2,404,777 | ||||||||||||||||
|
| |||||||||||||||
| Diversified Telecommunication Services – 0.8% | ||||||||||||||||
AT&T, Inc. | 6.300 | % | 01/15/2038 | 50,000 | 60,649 | |||||||||||
British Telecommunications PLC | 5.950 | % | 01/15/2018 | 100,000 | 111,508 | |||||||||||
Verizon Communications, Inc. | 2.500 | % | 09/15/2016 | 34,000 | 34,756 | |||||||||||
Verizon Communications, Inc. | 2.550 | % | 06/17/2019 | 50,000 | 50,408 | |||||||||||
Verizon Communications, Inc. | 4.500 | % | 09/15/2020 | 50,000 | 54,298 | |||||||||||
Verizon Communications, Inc. | 5.150 | % | 09/15/2023 | 50,000 | 55,258 | |||||||||||
Verizon Communications, Inc. | 3.500 | % | 11/01/2024 | 50,000 | 49,084 | |||||||||||
Verizon Communications, Inc. | 6.400 | % | 09/15/2033 | 25,000 | 30,721 | |||||||||||
Verizon Communications, Inc. | 6.400 | % | 02/15/2038 | 25,000 | 30,925 | |||||||||||
Verizon Communications, Inc. | 6.900 | % | 04/15/2038 | 25,000 | 32,620 | |||||||||||
Verizon Communications, Inc. | 6.550 | % | 09/15/2043 | 50,000 | 63,956 | |||||||||||
Verizon Communications, Inc. | 4.862 | % | 08/21/2046 | 50,000 | 51,520 | |||||||||||
|
| |||||||||||||||
| 625,703 | ||||||||||||||||
|
| |||||||||||||||
| Electric Utilities – 1.5% | ||||||||||||||||
Alabama Power Co. | 3.850 | % | 12/01/2042 | 75,000 | 75,683 | |||||||||||
Appalachian Power Co. | 4.400 | % | 05/15/2044 | 25,000 | 26,495 | |||||||||||
Baltimore Gas & Electric Co. | 6.350 | % | 10/01/2036 | 50,000 | 66,988 | |||||||||||
Berkshire Hathaway Energy Co. | 1.100 | % | 05/15/2017 | 50,000 | 49,468 | |||||||||||
Berkshire Hathaway Finance Corp. | 1.600 | % | 05/15/2017 | 25,000 | 25,187 | |||||||||||
Consolidated Edison Co. of New York, Inc. | 6.200 | % | 06/15/2036 | 25,000 | 33,102 | |||||||||||
See accompanying notes to financial statements.
14
Table of Contents
State Street Aggregate Bond Index Portfolio
Portfolio of Investments — (continued)
December 31, 2014
Security Description | Interest Rate | Maturity Date | Principal Amount | Value | ||||||||||||
| CORPORATE BONDS – (continued) | ||||||||||||||||
| Electric Utilities – (continued) | ||||||||||||||||
Consumers Energy Co. | 2.850 | % | 05/15/2022 | $ | 100,000 | $ | 99,975 | |||||||||
Dominion Gas Holdings LLC | 4.800 | % | 11/01/2043 | 25,000 | 26,835 | |||||||||||
Duke Energy Carolinas LLC | 4.250 | % | 12/15/2041 | 50,000 | 53,937 | |||||||||||
Duke Energy Corp. | 1.625 | % | 08/15/2017 | 50,000 | 49,970 | |||||||||||
Duke Energy Florida, Inc. | 3.850 | % | 11/15/2042 | 100,000 | 101,412 | |||||||||||
Florida Power & Light Co. | 3.250 | % | 06/01/2024 | 25,000 | 25,735 | |||||||||||
Florida Power & Light Co. | 4.050 | % | 10/01/2044 | 50,000 | 53,418 | |||||||||||
Hydro-Quebec | 1.375 | % | 06/19/2017 | 50,000 | 50,293 | |||||||||||
NiSource Finance Corp. | 6.800 | % | 01/15/2019 | 25,000 | 29,172 | |||||||||||
Pacific Gas & Electric Co. | 3.250 | % | 06/15/2023 | 50,000 | 50,274 | |||||||||||
Pacific Gas & Electric Co. | 6.050 | % | 03/01/2034 | 50,000 | 63,653 | |||||||||||
PPL Capital Funding, Inc. | 3.500 | % | 12/01/2022 | 75,000 | 76,041 | |||||||||||
Public Service Co. of Colorado | 3.200 | % | 11/15/2020 | 25,000 | 25,994 | |||||||||||
Public Service Electric & Gas Co. | 3.650 | % | 09/01/2042 | 50,000 | 49,255 | |||||||||||
Southern California Edison Co. | 3.900 | % | 03/15/2043 | 50,000 | 50,879 | |||||||||||
Southern California Gas Co. | 3.150 | % | 09/15/2024 | 25,000 | 25,464 | |||||||||||
Southern Co. (The) | 1.950 | % | 09/01/2016 | 25,000 | 25,371 | |||||||||||
Virginia Electric & Power Co. | 3.450 | % | 02/15/2024 | 50,000 | 51,451 | |||||||||||
|
| |||||||||||||||
| 1,186,052 | ||||||||||||||||
|
| |||||||||||||||
| Electrical Equipment – 0.0%(b) | ||||||||||||||||
Emerson Electric Co. | 2.625 | % | 02/15/2023 | 25,000 | 24,570 | |||||||||||
|
| |||||||||||||||
| Electronic Equipment, Instruments & Components – 0.0%(b) | ||||||||||||||||
Corning, Inc. | 5.750 | % | 08/15/2040 | 25,000 | 29,524 | |||||||||||
|
| |||||||||||||||
| Energy Equipment & Services – 0.1% | ||||||||||||||||
Cameron International Corp. | 5.125 | % | 12/15/2043 | 50,000 | 49,098 | |||||||||||
Halliburton Co. | 7.450 | % | 09/15/2039 | 25,000 | 34,313 | |||||||||||
Weatherford International, Ltd. | 4.500 | % | 04/15/2022 | 25,000 | 22,300 | |||||||||||
|
| |||||||||||||||
| 105,711 | ||||||||||||||||
|
| |||||||||||||||
| Food & Staples Retailing – 0.7% | ||||||||||||||||
Kellogg Co. | 4.150 | % | 11/15/2019 | 25,000 | 26,873 | |||||||||||
Kroger Co. (The) | 3.850 | % | 08/01/2023 | 75,000 | 77,742 | |||||||||||
Mondelez International, Inc. | 6.125 | % | 08/23/2018 | 25,000 | 28,437 | |||||||||||
Mondelez International, Inc. | 4.000 | % | 02/01/2024 | 25,000 | 26,032 | |||||||||||
Sysco Corp. | 3.000 | % | 10/02/2021 | 50,000 | 50,641 | |||||||||||
Target Corp. | 6.500 | % | 10/15/2037 | 100,000 | 135,557 | |||||||||||
Tyson Foods, Inc. | 4.500 | % | 06/15/2022 | 25,000 | 26,971 | |||||||||||
Wal-Mart Stores, Inc. | 1.125 | % | 04/11/2018 | 25,000 | 24,678 | |||||||||||
Wal-Mart Stores, Inc. | 1.950 | % | 12/15/2018 | 25,000 | 25,114 | |||||||||||
See accompanying notes to financial statements.
15
Table of Contents
State Street Aggregate Bond Index Portfolio
Portfolio of Investments — (continued)
December 31, 2014
Security Description | Interest Rate | Maturity Date | Principal Amount | Value | ||||||||||||
| CORPORATE BONDS – (continued) | ||||||||||||||||
| Food & Staples Retailing – (continued) | ||||||||||||||||
Wal-Mart Stores, Inc. | 5.250 | % | 09/01/2035 | $ | 25,000 | $ | 29,652 | |||||||||
Wal-Mart Stores, Inc. | 4.875 | % | 07/08/2040 | 50,000 | 57,599 | |||||||||||
Wal-Mart Stores, Inc. | 4.000 | % | 04/11/2043 | 25,000 | 25,780 | |||||||||||
Walgreens Boots Alliance, Inc. | 3.100 | % | 09/15/2022 | 25,000 | 24,621 | |||||||||||
|
| |||||||||||||||
| 559,697 | ||||||||||||||||
|
| |||||||||||||||
| Food Products – 0.2% | ||||||||||||||||
Archer-Daniels-Midland Co. | 5.765 | % | 03/01/2041 | 25,000 | 31,941 | |||||||||||
ConAgra Foods, Inc. | 1.900 | % | 01/25/2018 | 25,000 | 24,838 | |||||||||||
General Mills, Inc. | 2.200 | % | 10/21/2019 | 25,000 | 24,790 | |||||||||||
Kraft Foods Group, Inc. | 6.125 | % | 08/23/2018 | 25,000 | 28,484 | |||||||||||
Kraft Foods Group, Inc. | 6.875 | % | 01/26/2039 | 50,000 | 65,168 | |||||||||||
|
| |||||||||||||||
| 175,221 | ||||||||||||||||
|
| |||||||||||||||
| Gas Utilities – 0.1% | ||||||||||||||||
AGL Capital Corp. | 5.250 | % | 08/15/2019 | 25,000 | 27,768 | |||||||||||
Atmos Energy Corp. | 4.150 | % | 01/15/2043 | 25,000 | 25,301 | |||||||||||
|
| |||||||||||||||
| 53,069 | ||||||||||||||||
|
| |||||||||||||||
| Health Care Equipment & Supplies – 0.3% | ||||||||||||||||
Baxter International, Inc. | 3.200 | % | 06/15/2023 | 25,000 | 25,101 | |||||||||||
Becton Dickinson and Co. | 2.675 | % | 12/15/2019 | 50,000 | 50,531 | |||||||||||
Boston Scientific Corp. | 2.650 | % | 10/01/2018 | 25,000 | 25,083 | |||||||||||
Covidien International Finance SA | 3.200 | % | 06/15/2022 | 50,000 | 50,181 | |||||||||||
Express Scripts Holding Co. | 6.125 | % | 11/15/2041 | 25,000 | 31,402 | |||||||||||
Medtronic, Inc. | 1.375 | % | 04/01/2018 | 25,000 | 24,682 | |||||||||||
Medtronic, Inc. | 5.550 | % | 03/15/2040 | 25,000 | 29,238 | |||||||||||
Stryker Corp. | 2.000 | % | 09/30/2016 | 25,000 | 25,420 | |||||||||||
|
| |||||||||||||||
| 261,638 | ||||||||||||||||
|
| |||||||||||||||
| Health Care Providers & Services – 0.4% | ||||||||||||||||
Aetna, Inc. | 2.200 | % | 03/15/2019 | 25,000 | 24,894 | |||||||||||
Aetna, Inc. | 4.125 | % | 11/15/2042 | 25,000 | 25,033 | |||||||||||
Anthem, Inc. | 3.500 | % | 08/15/2024 | 25,000 | 25,012 | |||||||||||
Cardinal Health, Inc. | 1.700 | % | 03/15/2018 | 25,000 | 24,799 | |||||||||||
Cigna Corp. | 5.375 | % | 02/15/2042 | 50,000 | 58,942 | |||||||||||
Howard Hughes Medical Institute | 3.500 | % | 09/01/2023 | 25,000 | 26,193 | |||||||||||
Humana, Inc. | 2.625 | % | 10/01/2019 | 25,000 | 24,987 | |||||||||||
Memorial Sloan-Kettering Cancer Center | 4.125 | % | 07/01/2052 | 25,000 | 25,135 | |||||||||||
Quest Diagnostics, Inc. | 2.700 | % | 04/01/2019 | 25,000 | 25,124 | |||||||||||
UnitedHealth Group, Inc. | 2.875 | % | 03/15/2022 | 25,000 | 25,033 | |||||||||||
UnitedHealth Group, Inc. | 6.875 | % | 02/15/2038 | 25,000 | 34,846 | |||||||||||
|
| |||||||||||||||
| 319,998 | ||||||||||||||||
|
| |||||||||||||||
See accompanying notes to financial statements.
16
Table of Contents
State Street Aggregate Bond Index Portfolio
Portfolio of Investments — (continued)
December 31, 2014
Security Description | Interest Rate | Maturity Date | Principal Amount | Value | ||||||||||||
| CORPORATE BONDS – (continued) | ||||||||||||||||
| Hotels, Restaurants & Leisure – 0.1% | ||||||||||||||||
McDonald’s Corp. | 5.800 | % | 10/15/2017 | $ | 25,000 | $ | 27,868 | |||||||||
McDonald’s Corp. | 1.875 | % | 05/29/2019 | 25,000 | 24,706 | |||||||||||
Starwood Hotels & Resorts Worldwide, Inc. | 3.750 | % | 03/15/2025 | 25,000 | 25,157 | |||||||||||
|
| |||||||||||||||
| 77,731 | ||||||||||||||||
|
| |||||||||||||||
| Household Products – 0.1% | ||||||||||||||||
Colgate-Palmolive Co. | 1.750 | % | 03/15/2019 | 25,000 | 24,823 | |||||||||||
Procter & Gamble Co. (The) | 1.450 | % | 08/15/2016 | 25,000 | 25,258 | |||||||||||
Procter & Gamble Co. (The) | 5.800 | % | 08/15/2034 | 50,000 | 65,660 | |||||||||||
|
| |||||||||||||||
| 115,741 | ||||||||||||||||
|
| |||||||||||||||
| Industrial Conglomerates – 0.2% | ||||||||||||||||
3M Co. | 1.625 | % | 06/15/2019 | 25,000 | 24,680 | |||||||||||
General Electric Co. | 2.700 | % | 10/09/2022 | 50,000 | 49,916 | |||||||||||
General Electric Co. | 4.125 | % | 10/09/2042 | 25,000 | 25,832 | |||||||||||
General Electric Co. | 4.500 | % | 03/11/2044 | 50,000 | 54,860 | |||||||||||
|
| |||||||||||||||
| 155,288 | ||||||||||||||||
|
| |||||||||||||||
| Insurance – 0.7% | ||||||||||||||||
ACE INA Holdings, Inc. | 4.150 | % | 03/13/2043 | 25,000 | 25,859 | |||||||||||
Allstate Corp. (The)(a) | 5.750 | % | 08/15/2053 | 25,000 | 26,125 | |||||||||||
American International Group, Inc. | 2.300 | % | 07/16/2019 | 25,000 | 24,961 | |||||||||||
American International Group, Inc. | 4.875 | % | 06/01/2022 | 50,000 | 56,001 | |||||||||||
American International Group, Inc. | 4.500 | % | 07/16/2044 | 25,000 | 26,179 | |||||||||||
Berkshire Hathaway, Inc. | 3.000 | % | 02/11/2023 | 25,000 | 25,190 | |||||||||||
First American Financial Corp. | 4.600 | % | 11/15/2024 | 25,000 | 25,248 | |||||||||||
Hartford Financial Services Group, Inc. (The) | 5.125 | % | 04/15/2022 | 25,000 | 27,978 | |||||||||||
Lincoln National Corp. | 6.300 | % | 10/09/2037 | 50,000 | 63,180 | |||||||||||
Marsh & McLennan Cos., Inc. | 2.550 | % | 10/15/2018 | 25,000 | 25,260 | |||||||||||
MetLife, Inc. | 1.756 | % | 12/15/2017 | 25,000 | 25,058 | |||||||||||
MetLife, Inc. | 4.368 | % | 09/15/2023 | 50,000 | 54,497 | |||||||||||
Prudential Financial, Inc. | 3.500 | % | 05/15/2024 | 50,000 | 50,622 | |||||||||||
Prudential Financial, Inc. | 6.625 | % | 06/21/2040 | 25,000 | 33,159 | |||||||||||
Travelers Cos., Inc. (The) | 6.250 | % | 06/15/2037 | 25,000 | 33,524 | |||||||||||
|
| |||||||||||||||
| 522,841 | ||||||||||||||||
|
| |||||||||||||||
| Internet Software & Services – 0.1% | ||||||||||||||||
Amazon.com, Inc. | 2.500 | % | 11/29/2022 | 25,000 | 23,661 | |||||||||||
eBay, Inc. | 3.450 | % | 08/01/2024 | 25,000 | 24,551 | |||||||||||
Google, Inc. | 2.125 | % | 05/19/2016 | 25,000 | 25,497 | |||||||||||
|
| |||||||||||||||
| 73,709 | ||||||||||||||||
|
| |||||||||||||||
See accompanying notes to financial statements.
17
Table of Contents
State Street Aggregate Bond Index Portfolio
Portfolio of Investments — (continued)
December 31, 2014
Security Description | Interest Rate | Maturity Date | Principal Amount | Value | ||||||||||||
| CORPORATE BONDS – (continued) | ||||||||||||||||
| IT Services – 0.1% | ||||||||||||||||
Fiserv, Inc. | 3.125 | % | 06/15/2016 | $ | 25,000 | $ | 25,664 | |||||||||
Xerox Corp. | 2.950 | % | 03/15/2017 | 25,000 | 25,602 | |||||||||||
|
| |||||||||||||||
| 51,266 | ||||||||||||||||
|
| |||||||||||||||
| Leisure Products – 0.0%(b) | ||||||||||||||||
Mattel, Inc. | 2.350 | % | 05/06/2019 | 25,000 | 24,840 | |||||||||||
|
| |||||||||||||||
| Life Sciences Tools & Services – 0.1% | ||||||||||||||||
Thermo Fisher Scientific, Inc. | 1.850 | % | 01/15/2018 | 50,000 | 49,664 | |||||||||||
Thermo Fisher Scientific, Inc. | 4.150 | % | 02/01/2024 | 25,000 | 26,277 | |||||||||||
Thomson Reuters Corp. | 3.850 | % | 09/29/2024 | 25,000 | 25,269 | |||||||||||
|
| |||||||||||||||
| 101,210 | ||||||||||||||||
|
| |||||||||||||||
| Machinery – 0.2% | ||||||||||||||||
Caterpillar, Inc. | 4.750 | % | 05/15/2064 | 25,000 | 26,927 | |||||||||||
Deere & Co. | 2.600 | % | 06/08/2022 | 25,000 | 24,561 | |||||||||||
Eaton Corp. | 1.500 | % | 11/02/2017 | 25,000 | 24,822 | |||||||||||
Illinois Tool Works, Inc. | 1.950 | % | 03/01/2019 | 25,000 | 24,994 | |||||||||||
Ingersoll-Rand Global Holding Co., Ltd. | 6.875 | % | 08/15/2018 | 25,000 | 28,972 | |||||||||||
Stanley Black & Decker, Inc.(a) | 5.750 | % | 12/15/2053 | 50,000 | 53,750 | |||||||||||
|
| |||||||||||||||
| 184,026 | ||||||||||||||||
|
| |||||||||||||||
| Media – 1.2% | ||||||||||||||||
21st Century Fox America, Inc. | 7.250 | % | 05/18/2018 | 25,000 | 29,219 | |||||||||||
21st Century Fox America, Inc. | 4.000 | % | 10/01/2023 | 25,000 | 26,468 | |||||||||||
21st Century Fox America, Inc. | 5.400 | % | 10/01/2043 | 25,000 | 29,759 | |||||||||||
CBS Corp. | 2.300 | % | 08/15/2019 | 25,000 | 24,669 | |||||||||||
Comcast Corp. | 3.600 | % | 03/01/2024 | 25,000 | 26,104 | |||||||||||
Comcast Corp. | 4.250 | % | 01/15/2033 | 50,000 | 52,940 | |||||||||||
Comcast Corp. | 4.650 | % | 07/15/2042 | 25,000 | 27,054 | |||||||||||
DIRECTV Holdings LLC / DIRECTV Financing Co., Inc. | 2.400 | % | 03/15/2017 | 25,000 | 25,470 | |||||||||||
DIRECTV Holdings LLC / DIRECTV Financing Co., Inc. | 3.800 | % | 03/15/2022 | 50,000 | 50,774 | |||||||||||
DIRECTV Holdings LLC / DIRECTV Financing Co., Inc. | 4.450 | % | 04/01/2024 | 25,000 | 26,182 | |||||||||||
Discovery Communications LLC | 3.250 | % | 04/01/2023 | 25,000 | 24,338 | |||||||||||
Interpublic Group of Cos., Inc. (The) | 4.200 | % | 04/15/2024 | 25,000 | 25,532 | |||||||||||
NBCUniversal Media LLC | 2.875 | % | 04/01/2016 | 25,000 | 25,603 | |||||||||||
NBCUniversal Media LLC | 5.150 | % | 04/30/2020 | 50,000 | 56,450 | |||||||||||
Omnicom Group, Inc. | 6.250 | % | 07/15/2019 | 50,000 | 57,636 | |||||||||||
Time Warner Cable, Inc. | 6.750 | % | 07/01/2018 | 25,000 | 28,688 | |||||||||||
Time Warner Cable, Inc. | 4.000 | % | 09/01/2021 | 25,000 | 26,459 | |||||||||||
Time Warner Cable, Inc. | 5.875 | % | 11/15/2040 | 50,000 | 59,936 | |||||||||||
Time Warner Cable, Inc. | 5.500 | % | 09/01/2041 | 25,000 | 28,624 | |||||||||||
See accompanying notes to financial statements.
18
Table of Contents
State Street Aggregate Bond Index Portfolio
Portfolio of Investments — (continued)
December 31, 2014
Security Description | Interest Rate | Maturity Date | Principal Amount | Value | ||||||||||||
| CORPORATE BONDS – (continued) | ||||||||||||||||
| Media – (continued) | ||||||||||||||||
Time Warner, Inc. | 3.550 | % | 06/01/2024 | $ | 25,000 | $ | 25,090 | |||||||||
Time Warner, Inc. | 6.500 | % | 11/15/2036 | 50,000 | 63,442 | |||||||||||
Time Warner, Inc. | 4.650 | % | 06/01/2044 | 25,000 | 25,822 | |||||||||||
Viacom, Inc. | 2.200 | % | 04/01/2019 | 25,000 | 24,693 | |||||||||||
Viacom, Inc. | 4.850 | % | 12/15/2034 | 50,000 | 51,420 | |||||||||||
Viacom, Inc. | 4.875 | % | 06/15/2043 | 25,000 | 24,917 | |||||||||||
Walt Disney Co. (The) | 1.100 | % | 12/01/2017 | 25,000 | 24,836 | |||||||||||
Walt Disney Co. (The) | 5.500 | % | 03/15/2019 | 25,000 | 28,560 | |||||||||||
WPP Finance 2010 | 3.625 | % | 09/07/2022 | 50,000 | 50,842 | |||||||||||
|
| |||||||||||||||
| 971,527 | ||||||||||||||||
|
| |||||||||||||||
| Metals & Mining – 0.5% | ||||||||||||||||
Barrick Gold Corp. | 5.250 | % | 04/01/2042 | 25,000 | 23,726 | |||||||||||
Barrick North America Finance LLC | 4.400 | % | 05/30/2021 | 25,000 | 25,258 | |||||||||||
BHP Billiton Finance USA, Ltd. | 1.625 | % | 02/24/2017 | 50,000 | 50,407 | |||||||||||
BHP Billiton Finance USA, Ltd. | 4.125 | % | 02/24/2042 | 25,000 | 24,710 | |||||||||||
Freeport-McMoRan, Inc. | 2.375 | % | 03/15/2018 | 25,000 | 24,656 | |||||||||||
Freeport-McMoRan, Inc. | 3.550 | % | 03/01/2022 | 25,000 | 23,523 | |||||||||||
Freeport-McMoRan, Inc. | 4.550 | % | 11/14/2024 | 25,000 | 24,237 | |||||||||||
Newmont Mining Corp. | 3.500 | % | 03/15/2022 | 25,000 | 23,411 | |||||||||||
Nucor Corp. | 4.000 | % | 08/01/2023 | 25,000 | 26,222 | |||||||||||
Rio Tinto Finance USA PLC | 2.250 | % | 12/14/2018 | 25,000 | 24,994 | |||||||||||
Rio Tinto Finance USA PLC | 3.500 | % | 03/22/2022 | 25,000 | 25,117 | |||||||||||
Rio Tinto Finance USA PLC | 4.125 | % | 08/21/2042 | 50,000 | 47,837 | |||||||||||
Teck Resources, Ltd. | 5.200 | % | 03/01/2042 | 50,000 | 40,423 | |||||||||||
Vale Overseas, Ltd. | 4.375 | % | 01/11/2022 | 25,000 | 24,006 | |||||||||||
Vale Overseas, Ltd. | 8.250 | % | 01/17/2034 | 25,000 | 30,121 | |||||||||||
|
| |||||||||||||||
| 438,648 | ||||||||||||||||
|
| |||||||||||||||
| Multi-National – 1.6% | ||||||||||||||||
African Development Bank | 0.875 | % | 05/15/2017 | 25,000 | 24,947 | |||||||||||
Asian Development Bank | 1.750 | % | 09/11/2018 | 50,000 | 50,505 | |||||||||||
Asian Development Bank | 2.125 | % | 11/24/2021 | 75,000 | 75,272 | |||||||||||
Council Of Europe Development Bank | 1.125 | % | 05/31/2018 | 25,000 | 24,775 | |||||||||||
European Bank for Reconstruction & Development | 1.000 | % | 09/17/2018 | 50,000 | 49,136 | |||||||||||
European Bank for Reconstruction & Development | 1.625 | % | 11/15/2018 | 25,000 | 25,082 | |||||||||||
European Investment Bank | 0.625 | % | 04/15/2016 | 75,000 | 75,139 | |||||||||||
European Investment Bank | 0.500 | % | 08/15/2016 | 100,000 | 99,809 | |||||||||||
European Investment Bank | 0.875 | % | 04/18/2017 | 50,000 | 49,964 | |||||||||||
European Investment Bank | 1.000 | % | 06/15/2018 | 50,000 | 49,369 | |||||||||||
European Investment Bank | 1.875 | % | 03/15/2019 | 50,000 | 50,547 | |||||||||||
See accompanying notes to financial statements.
19
Table of Contents
State Street Aggregate Bond Index Portfolio
Portfolio of Investments — (continued)
December 31, 2014
Security Description | Interest Rate | Maturity Date | Principal Amount | Value | ||||||||||||
| CORPORATE BONDS – (continued) | ||||||||||||||||
| Multi-National – (continued) | ||||||||||||||||
European Investment Bank | 1.750 | % | 06/17/2019 | $ | 25,000 | $ | 25,086 | |||||||||
European Investment Bank | 2.500 | % | 04/15/2021 | 50,000 | 51,458 | |||||||||||
European Investment Bank | 2.125 | % | 10/15/2021 | 50,000 | 50,226 | |||||||||||
European Investment Bank | 2.500 | % | 10/15/2024 | 25,000 | 25,344 | |||||||||||
Export-Import Bank of Korea | 5.125 | % | 06/29/2020 | 100,000 | 112,654 | |||||||||||
Inter-American Development Bank | 0.625 | % | 09/12/2016 | 25,000 | 24,992 | |||||||||||
Inter-American Development Bank | 1.375 | % | 10/18/2016 | 50,000 | 50,620 | |||||||||||
Inter-American Development Bank | 1.250 | % | 01/16/2018 | 25,000 | 25,011 | |||||||||||
Inter-American Development Bank | 1.750 | % | 10/15/2019 | 75,000 | 75,122 | |||||||||||
Inter-American Development Bank | 2.125 | % | 11/09/2020 | 25,000 | 25,255 | |||||||||||
International Bank for Reconstruction & Development | 1.000 | % | 09/15/2016 | 100,000 | 100,580 | |||||||||||
International Bank for Reconstruction & Development | 0.750 | % | 12/15/2016 | 25,000 | 25,008 | |||||||||||
International Bank for Reconstruction & Development | 1.875 | % | 03/15/2019 | 25,000 | 25,320 | |||||||||||
International Bank for Reconstruction & Development | 2.125 | % | 11/01/2020 | 25,000 | 25,289 | |||||||||||
International Bank for Reconstruction & Development | 2.500 | % | 11/25/2024 | 50,000 | 50,650 | |||||||||||
International Bank for Reconstruction & Development | 4.750 | % | 02/15/2035 | 25,000 | 31,977 | |||||||||||
|
| |||||||||||||||
| 1,299,137 | ||||||||||||||||
|
| |||||||||||||||
| Multi-Utilities – 0.1% | ||||||||||||||||
American Water Capital Corp. | 3.400 | % | 03/01/2025 | 25,000 | 25,371 | |||||||||||
DTE Energy Co. | 2.400 | % | 12/01/2019 | 25,000 | 24,970 | |||||||||||
Midamerican Funding LLC | 6.927 | % | 03/01/2029 | 50,000 | 65,554 | |||||||||||
|
| |||||||||||||||
| 115,895 | ||||||||||||||||
|
| |||||||||||||||
| Multiline Retail – 0.1% | ||||||||||||||||
Kohl’s Corp. | 6.875 | % | 12/15/2037 | 25,000 | 31,570 | |||||||||||
Macy’s Retail Holdings, Inc. | 3.625 | % | 06/01/2024 | 25,000 | 25,197 | |||||||||||
Target Corp. | 2.300 | % | 06/26/2019 | 25,000 | 25,239 | |||||||||||
|
| |||||||||||||||
| 82,006 | ||||||||||||||||
|
| |||||||||||||||
| Oil, Gas & Consumable Fuels – 3.4% | ||||||||||||||||
Anadarko Petroleum Corp. | 6.200 | % | 03/15/2040 | 25,000 | 28,966 | |||||||||||
Anadarko Petroleum Corp. | 4.500 | % | 07/15/2044 | 50,000 | 48,051 | |||||||||||
Apache Corp. | 3.250 | % | 04/15/2022 | 25,000 | 24,531 | |||||||||||
Apache Corp. | 6.000 | % | 01/15/2037 | 50,000 | 53,191 | |||||||||||
Baker Hughes, Inc. | 3.200 | % | 08/15/2021 | 25,000 | 25,038 | |||||||||||
BP Capital Markets PLC | 1.375 | % | 05/10/2018 | 25,000 | 24,514 | |||||||||||
BP Capital Markets PLC | 2.237 | % | 05/10/2019 | 25,000 | 24,775 | |||||||||||
BP Capital Markets PLC | 3.561 | % | 11/01/2021 | 50,000 | 50,871 | |||||||||||
BP Capital Markets PLC | 3.814 | % | 02/10/2024 | 25,000 | 25,153 | |||||||||||
Buckeye Partners L.P. | 4.875 | % | 02/01/2021 | 25,000 | 26,190 | |||||||||||
See accompanying notes to financial statements.
20
Table of Contents
State Street Aggregate Bond Index Portfolio
Portfolio of Investments — (continued)
December 31, 2014
Security Description | Interest Rate | Maturity Date | Principal Amount | Value | ||||||||||||
| CORPORATE BONDS – (continued) | ||||||||||||||||
| Oil, Gas & Consumable Fuels – (continued) | ||||||||||||||||
Canadian Natural Resources, Ltd. | 3.450 | % | 11/15/2021 | $ | 25,000 | $ | 24,692 | |||||||||
Canadian Natural Resources, Ltd. | 3.900 | % | 02/01/2025 | 25,000 | 24,603 | |||||||||||
CenterPoint Energy, Inc. | 6.500 | % | 05/01/2018 | 100,000 | 113,758 | |||||||||||
Chevron Corp. | 1.718 | % | 06/24/2018 | 25,000 | 25,092 | |||||||||||
Chevron Corp. | 3.191 | % | 06/24/2023 | 25,000 | 25,248 | |||||||||||
ConocoPhillips | 5.750 | % | 02/01/2019 | 25,000 | 28,336 | |||||||||||
ConocoPhillips | 6.000 | % | 01/15/2020 | 50,000 | 58,092 | |||||||||||
ConocoPhillips Holding Co. | 6.950 | % | 04/15/2029 | 50,000 | 66,425 | |||||||||||
Continental Resources, Inc. | 3.800 | % | 06/01/2024 | 25,000 | 22,206 | |||||||||||
DCP Midstream Operating L.P. | 2.500 | % | 12/01/2017 | 25,000 | 24,910 | |||||||||||
Devon Energy Corp. | 3.250 | % | 05/15/2022 | 25,000 | 24,368 | |||||||||||
Ecopetrol SA | 7.375 | % | 09/18/2043 | 50,000 | 53,500 | |||||||||||
Enbridge Energy Partners L.P. | 4.200 | % | 09/15/2021 | 25,000 | 25,968 | |||||||||||
Energy Transfer Partners L.P. | 6.700 | % | 07/01/2018 | 50,000 | 56,181 | |||||||||||
Energy Transfer Partners L.P. | 5.150 | % | 02/01/2043 | 25,000 | 24,466 | |||||||||||
Ensco PLC | 3.250 | % | 03/15/2016 | 25,000 | 25,482 | |||||||||||
Enterprise Products Operating LLC | 6.500 | % | 01/31/2019 | 25,000 | 28,609 | |||||||||||
Enterprise Products Operating LLC | 4.850 | % | 03/15/2044 | 50,000 | 51,842 | |||||||||||
Hess Corp. | 5.600 | % | 02/15/2041 | 25,000 | 26,431 | |||||||||||
Husky Energy, Inc. | 4.000 | % | 04/15/2024 | 50,000 | 48,957 | |||||||||||
Kinder Morgan Energy Partners L.P. | 3.500 | % | 03/01/2021 | 25,000 | 24,488 | |||||||||||
Kinder Morgan Energy Partners L.P. | 5.400 | % | 09/01/2044 | 50,000 | 50,021 | |||||||||||
Kinder Morgan, Inc. | 3.050 | % | 12/01/2019 | 25,000 | 24,655 | |||||||||||
Kinder Morgan, Inc. | 4.300 | % | 06/01/2025 | 75,000 | 75,160 | |||||||||||
Marathon Oil Corp. | 2.800 | % | 11/01/2022 | 25,000 | 23,120 | |||||||||||
Marathon Petroleum Corp. | 3.625 | % | 09/15/2024 | 50,000 | 48,604 | |||||||||||
Nexen Energy ULC | 5.875 | % | 03/10/2035 | 100,000 | 116,693 | |||||||||||
Noble Energy, Inc. | 5.250 | % | 11/15/2043 | 25,000 | 25,011 | |||||||||||
Noble Holding International, Ltd. | 6.200 | % | 08/01/2040 | 25,000 | 22,156 | |||||||||||
Occidental Petroleum Corp. | 4.100 | % | 02/01/2021 | 25,000 | 26,498 | |||||||||||
ONEOK Partners L.P. | 3.375 | % | 10/01/2022 | 25,000 | 22,938 | |||||||||||
Petro-Canada | 5.350 | % | 07/15/2033 | 25,000 | 28,170 | |||||||||||
Petrobras Global Finance BV | 3.250 | % | 03/17/2017 | 25,000 | 23,605 | |||||||||||
Petrobras Global Finance BV | 3.000 | % | 01/15/2019 | 50,000 | 44,379 | |||||||||||
Petrobras Global Finance BV | 6.250 | % | 03/17/2024 | 75,000 | 71,836 | |||||||||||
Petrobras International Finance Co. SA | 5.875 | % | 03/01/2018 | 50,000 | 49,130 | |||||||||||
Petroleos Mexicanos | 3.500 | % | 07/18/2018 | 25,000 | 25,437 | |||||||||||
Petroleos Mexicanos | 3.500 | % | 01/30/2023 | 25,000 | 23,813 | |||||||||||
Petroleos Mexicanos | 4.250 | % | 01/15/2025 | 25,000 | 24,750 | |||||||||||
Petroleos Mexicanos | 5.500 | % | 06/27/2044 | 25,000 | 25,500 | |||||||||||
See accompanying notes to financial statements.
21
Table of Contents
State Street Aggregate Bond Index Portfolio
Portfolio of Investments — (continued)
December 31, 2014
Security Description | Interest Rate | Maturity Date | Principal Amount | Value | ||||||||||||
| CORPORATE BONDS – (continued) | ||||||||||||||||
| Oil, Gas & Consumable Fuels – (continued) | ||||||||||||||||
Petroleos Mexicanos(c) | 6.375 | % | 01/23/2045 | $ | 150,000 | $ | 170,250 | |||||||||
Plains All American Pipeline L.P. / PAA Finance Corp. | 3.600 | % | 11/01/2024 | 25,000 | 24,502 | |||||||||||
Shell International Finance BV | 0.900 | % | 11/15/2016 | 25,000 | 24,913 | |||||||||||
Shell International Finance BV | 4.300 | % | 09/22/2019 | 25,000 | 27,336 | |||||||||||
Shell International Finance BV | 5.500 | % | 03/25/2040 | 25,000 | 30,395 | |||||||||||
Spectra Energy Partners L.P. | 2.950 | % | 09/25/2018 | 25,000 | 25,297 | |||||||||||
Statoil ASA | 1.950 | % | 11/08/2018 | 25,000 | 24,902 | |||||||||||
Statoil ASA | 2.650 | % | 01/15/2024 | 75,000 | 71,705 | |||||||||||
Statoil ASA | 3.700 | % | 03/01/2024 | 25,000 | 25,857 | |||||||||||
Suncor Energy, Inc. | 3.600 | % | 12/01/2024 | 25,000 | 24,642 | |||||||||||
Sunoco Logistics Partners Operations L.P. | 5.350 | % | 05/15/2045 | 25,000 | 25,123 | |||||||||||
Total Capital International SA | 0.750 | % | 01/25/2016 | 11,000 | 11,003 | |||||||||||
Total Capital International SA | 2.700 | % | 01/25/2023 | 50,000 | 48,360 | |||||||||||
Total Capital International SA | 3.750 | % | 04/10/2024 | 25,000 | 25,904 | |||||||||||
Total Capital SA | 2.125 | % | 08/10/2018 | 25,000 | 25,164 | |||||||||||
TransCanada PipeLines, Ltd. | 7.625 | % | 01/15/2039 | 25,000 | 33,917 | |||||||||||
TransCanada PipeLines, Ltd.(a) | 6.350 | % | 05/15/2067 | 25,000 | 24,125 | |||||||||||
Transocean, Inc. | 6.375 | % | 12/15/2021 | 50,000 | 45,750 | |||||||||||
Transocean, Inc. | 3.800 | % | 10/15/2022 | 25,000 | 19,938 | |||||||||||
Valero Energy Corp. | 6.125 | % | 02/01/2020 | 25,000 | 28,147 | |||||||||||
Williams Partners L.P. | 5.250 | % | 03/15/2020 | 25,000 | 26,811 | |||||||||||
Williams Partners L.P. | 3.900 | % | 01/15/2025 | 50,000 | 47,699 | |||||||||||
XTO Energy, Inc. | 6.750 | % | 08/01/2037 | 25,000 | 35,316 | |||||||||||
|
| |||||||||||||||
| 2,733,466 | ||||||||||||||||
|
| |||||||||||||||
| Paper & Forest Products – 0.1% | ||||||||||||||||
Georgia-Pacific LLC | 7.750 | % | 11/15/2029 | 25,000 | 34,491 | |||||||||||
International Paper Co. | 3.650 | % | 06/15/2024 | 25,000 | 24,952 | |||||||||||
|
| |||||||||||||||
| 59,443 | ||||||||||||||||
|
| |||||||||||||||
| Personal Products – 0.0%(b) | ||||||||||||||||
Estee Lauder Cos., Inc. (The) | 3.700 | % | 08/15/2042 | 25,000 | 23,645 | |||||||||||
|
| |||||||||||||||
| Pharmaceuticals – 0.8% | ||||||||||||||||
AbbVie, Inc. | 1.750 | % | 11/06/2017 | 25,000 | 24,980 | |||||||||||
AbbVie, Inc. | 2.900 | % | 11/06/2022 | 25,000 | 24,561 | |||||||||||
Actavis, Inc. | 1.875 | % | 10/01/2017 | 25,000 | 24,865 | |||||||||||
AstraZeneca PLC | 4.000 | % | 09/18/2042 | 25,000 | 25,013 | |||||||||||
Bristol-Myers Squibb Co. | 1.750 | % | 03/01/2019 | 25,000 | 24,795 | |||||||||||
Eli Lilly & Co. | 5.550 | % | 03/15/2037 | 25,000 | 30,387 | |||||||||||
Express Scripts Holding Co. | 2.250 | % | 06/15/2019 | 25,000 | 24,731 | |||||||||||
GlaxoSmithKline Capital, Inc. | 2.800 | % | 03/18/2023 | 50,000 | 49,083 | |||||||||||
See accompanying notes to financial statements.
22
Table of Contents
State Street Aggregate Bond Index Portfolio
Portfolio of Investments — (continued)
December 31, 2014
Security Description | Interest Rate | Maturity Date | Principal Amount | Value | ||||||||||||
| CORPORATE BONDS – (continued) | ||||||||||||||||
| Pharmaceuticals – (continued) | ||||||||||||||||
GlaxoSmithKline Capital, Inc. | 4.200 | % | 03/18/2043 | $ | 25,000 | $ | 25,513 | |||||||||
Johnson & Johnson | 5.550 | % | 08/15/2017 | 25,000 | 27,779 | |||||||||||
Johnson & Johnson | 3.375 | % | 12/05/2023 | 25,000 | 26,588 | |||||||||||
McKesson Corp. | 2.284 | % | 03/15/2019 | 25,000 | 24,918 | |||||||||||
Merck & Co., Inc. | 2.400 | % | 09/15/2022 | 25,000 | 24,287 | |||||||||||
Merck & Co., Inc. | 3.600 | % | 09/15/2042 | 25,000 | 24,078 | |||||||||||
Mylan, Inc. | 1.800 | % | 06/24/2016 | 25,000 | 25,128 | |||||||||||
Novartis Capital Corp. | 3.400 | % | 05/06/2024 | 25,000 | 25,967 | |||||||||||
Novartis Securities Investment, Ltd. | 5.125 | % | 02/10/2019 | 25,000 | 28,060 | |||||||||||
Pfizer, Inc. | 3.400 | % | 05/15/2024 | 25,000 | 25,824 | |||||||||||
Teva Pharmaceutical Finance IV LLC | 2.250 | % | 03/18/2020 | 25,000 | 24,449 | |||||||||||
Wyeth LLC | 5.450 | % | 04/01/2017 | 50,000 | 54,646 | |||||||||||
Wyeth LLC | 6.000 | % | 02/15/2036 | 25,000 | 31,889 | |||||||||||
Zoetis, Inc. | 4.700 | % | 02/01/2043 | 50,000 | 50,801 | |||||||||||
|
| |||||||||||||||
| 648,342 | ||||||||||||||||
|
| |||||||||||||||
| Real Estate Investment Trusts (REITs) – 0.7% | ||||||||||||||||
American Tower Corp. | 3.400 | % | 02/15/2019 | 25,000 | 25,418 | |||||||||||
American Tower Corp. | 3.500 | % | 01/31/2023 | 50,000 | 48,375 | |||||||||||
AvalonBay Communities, Inc. | 2.950 | % | 09/15/2022 | 25,000 | 24,368 | |||||||||||
Boston Properties L.P. | 3.850 | % | 02/01/2023 | 25,000 | 25,901 | |||||||||||
Brandywine Operating Partnership L.P. | 4.100 | % | 10/01/2024 | 25,000 | 25,050 | |||||||||||
DDR Corp. | 3.500 | % | 01/15/2021 | 25,000 | 25,099 | |||||||||||
Duke Realty L.P. | 3.875 | % | 02/15/2021 | 25,000 | 25,805 | |||||||||||
ERP Operating L.P. | 2.375 | % | 07/01/2019 | 50,000 | 49,723 | |||||||||||
HCP, Inc. | 2.625 | % | 02/01/2020 | 25,000 | 24,670 | |||||||||||
Health Care REIT, Inc. | 5.250 | % | 01/15/2022 | 50,000 | 55,331 | |||||||||||
Hospitality Properties Trust | 4.500 | % | 06/15/2023 | 25,000 | 25,445 | |||||||||||
Realty Income Corp. | 4.125 | % | 10/15/2026 | 50,000 | 51,017 | |||||||||||
Simon Property Group L.P. | 2.150 | % | 09/15/2017 | 25,000 | 25,433 | |||||||||||
Simon Property Group L.P. | 5.650 | % | 02/01/2020 | 25,000 | 28,680 | |||||||||||
Tanger Properties L.P. | 3.875 | % | 12/01/2023 | 25,000 | 25,595 | |||||||||||
Ventas Realty L.P. | 1.550 | % | 09/26/2016 | 25,000 | 25,095 | |||||||||||
Weyerhaeuser Co. | 4.625 | % | 09/15/2023 | 25,000 | 26,603 | |||||||||||
|
| |||||||||||||||
| 537,608 | ||||||||||||||||
|
| |||||||||||||||
| Road & Rail – 0.3% | ||||||||||||||||
Burlington Northern Santa Fe LLC | 3.750 | % | 04/01/2024 | 25,000 | 26,100 | |||||||||||
Burlington Northern Santa Fe LLC | 4.450 | % | 03/15/2043 | 50,000 | 52,397 | |||||||||||
Burlington Northern Santa Fe LLC | 4.550 | % | 09/01/2044 | 25,000 | 26,828 | |||||||||||
Canadian National Railway Co. | 2.950 | % | 11/21/2024 | 50,000 | 49,897 | |||||||||||
See accompanying notes to financial statements.
23
Table of Contents
State Street Aggregate Bond Index Portfolio
Portfolio of Investments — (continued)
December 31, 2014
Security Description | Interest Rate | Maturity Date | Principal Amount | Value | ||||||||||||
| CORPORATE BONDS – (continued) | ||||||||||||||||
| Road & Rail – (continued) | ||||||||||||||||
CSX Corp. | 3.400 | % | 08/01/2024 | $ | 25,000 | $ | 25,353 | |||||||||
Norfolk Southern Corp. | 3.000 | % | 04/01/2022 | 25,000 | 24,994 | |||||||||||
Ryder System, Inc. | 2.450 | % | 09/03/2019 | 25,000 | 24,720 | |||||||||||
Union Pacific Corp. | 4.750 | % | 12/15/2043 | 25,000 | 28,184 | |||||||||||
|
| |||||||||||||||
| 258,473 | ||||||||||||||||
|
| |||||||||||||||
| Semiconductors & Semiconductor Equipment – 0.1% | ||||||||||||||||
Intel Corp. | 1.950 | % | 10/01/2016 | 25,000 | 25,421 | |||||||||||
Intel Corp. | 3.300 | % | 10/01/2021 | 25,000 | 26,070 | |||||||||||
Texas Instruments, Inc. | 2.750 | % | 03/12/2021 | 25,000 | 25,245 | |||||||||||
|
| |||||||||||||||
| 76,736 | ||||||||||||||||
|
| |||||||||||||||
| Software – 0.3% | ||||||||||||||||
Microsoft Corp. | 1.000 | % | 05/01/2018 | 25,000 | 24,662 | |||||||||||
Microsoft Corp. | 3.625 | % | 12/15/2023 | 25,000 | 26,736 | |||||||||||
Microsoft Corp. | 5.200 | % | 06/01/2039 | 50,000 | 60,204 | |||||||||||
Oracle Corp. | 2.375 | % | 01/15/2019 | 25,000 | 25,405 | |||||||||||
Oracle Corp. | 2.250 | % | 10/08/2019 | 75,000 | 75,148 | |||||||||||
Oracle Corp. | 4.500 | % | 07/08/2044 | 50,000 | 54,209 | |||||||||||
|
| |||||||||||||||
| 266,364 | ||||||||||||||||
|
| |||||||||||||||
| Specialty Retail – 0.3% | ||||||||||||||||
Costco Wholesale Corp. | 1.125 | % | 12/15/2017 | 25,000 | 24,817 | |||||||||||
CVS Health Corp. | 4.000 | % | 12/05/2023 | 25,000 | 26,459 | |||||||||||
Home Depot, Inc. (The) | 2.250 | % | 09/10/2018 | 25,000 | 25,453 | |||||||||||
Home Depot, Inc. (The) | 3.750 | % | 02/15/2024 | 25,000 | 26,604 | |||||||||||
Lowe’s Cos., Inc. | 4.250 | % | 09/15/2044 | 25,000 | 26,307 | |||||||||||
QVC, Inc. | 5.450 | % | 08/15/2034 | 50,000 | 49,014 | |||||||||||
Starbucks Corp. | 3.850 | % | 10/01/2023 | 25,000 | 26,634 | |||||||||||
|
| |||||||||||||||
| 205,288 | ||||||||||||||||
|
| |||||||||||||||
| Technology Hardware, Storage & Peripherals – 0.5% | ||||||||||||||||
Apple, Inc. | 1.050 | % | 05/05/2017 | 25,000 | 24,983 | |||||||||||
Apple, Inc. | 2.850 | % | 05/06/2021 | 25,000 | 25,546 | |||||||||||
Apple, Inc. | 2.400 | % | 05/03/2023 | 25,000 | 24,326 | |||||||||||
Apple, Inc. | 3.850 | % | 05/04/2043 | 25,000 | 24,971 | |||||||||||
EMC Corp. | 1.875 | % | 06/01/2018 | 25,000 | 24,851 | |||||||||||
Fidelity National Information Services, Inc. | 3.875 | % | 06/05/2024 | 25,000 | 25,156 | |||||||||||
Hewlett-Packard Co. | 5.400 | % | 03/01/2017 | 25,000 | 26,943 | |||||||||||
Hewlett-Packard Co. | 2.750 | % | 01/14/2019 | 25,000 | 25,137 | |||||||||||
Hewlett-Packard Co. | 4.050 | % | 09/15/2022 | 25,000 | 25,457 | |||||||||||
International Business Machines Corp. | 1.875 | % | 05/15/2019 | 100,000 | 99,246 | |||||||||||
See accompanying notes to financial statements.
24
Table of Contents
State Street Aggregate Bond Index Portfolio
Portfolio of Investments — (continued)
December 31, 2014
Security Description | Interest Rate | Maturity Date | Principal Amount | Value | ||||||||||||
| CORPORATE BONDS – (continued) | ||||||||||||||||
| Technology Hardware, Storage & Peripherals – (continued) | ||||||||||||||||
International Business Machines Corp. | 5.875 | % | 11/29/2032 | $ | 25,000 | $ | 31,896 | |||||||||
Seagate HDD Cayman | 4.750 | % | 06/01/2023 | 50,000 | 51,875 | |||||||||||
|
| |||||||||||||||
| 410,387 | ||||||||||||||||
|
| |||||||||||||||
| Tobacco – 0.3% | ||||||||||||||||
Altria Group, Inc. | 2.625 | % | 01/14/2020 | 50,000 | 49,972 | |||||||||||
Altria Group, Inc. | 4.000 | % | 01/31/2024 | 25,000 | 26,056 | |||||||||||
Altria Group, Inc. | 4.500 | % | 05/02/2043 | 25,000 | 25,092 | |||||||||||
Lorillard Tobacco Co. | 3.750 | % | 05/20/2023 | 25,000 | 24,726 | |||||||||||
Philip Morris International, Inc. | 1.875 | % | 01/15/2019 | 50,000 | 49,708 | |||||||||||
Philip Morris International, Inc. | 4.500 | % | 03/26/2020 | 25,000 | 27,496 | |||||||||||
Philip Morris International, Inc. | 4.125 | % | 03/04/2043 | 25,000 | 24,623 | |||||||||||
|
| |||||||||||||||
| 227,673 | ||||||||||||||||
|
| |||||||||||||||
| Trading Companies & Distributors – 0.1% | ||||||||||||||||
GATX Corp. | 2.500 | % | 03/15/2019 | 50,000 | 49,750 | |||||||||||
|
| |||||||||||||||
| Wireless Telecommunication Services – 0.7% | ||||||||||||||||
AT&T, Inc. | 0.900 | % | 02/12/2016 | 25,000 | 24,965 | |||||||||||
AT&T, Inc. | 2.300 | % | 03/11/2019 | 25,000 | 24,994 | |||||||||||
AT&T, Inc. | 3.900 | % | 03/11/2024 | 25,000 | 25,619 | |||||||||||
AT&T, Inc. | 4.800 | % | 06/15/2044 | 50,000 | 50,812 | |||||||||||
BellSouth Corp. | 6.550 | % | 06/15/2034 | 50,000 | 63,219 | |||||||||||
Deutsche Telekom International Finance BV | 5.750 | % | 03/23/2016 | 75,000 | 79,166 | |||||||||||
Orange SA | 2.750 | % | 02/06/2019 | 25,000 | 25,333 | |||||||||||
Telefonica Europe BV | 8.250 | % | 09/15/2030 | 25,000 | 34,788 | |||||||||||
Telefonos de Mexico S.A.B. de C.V. | 5.500 | % | 11/15/2019 | 100,000 | 112,644 | |||||||||||
Vodafone Group PLC | 1.500 | % | 02/19/2018 | 25,000 | 24,506 | |||||||||||
Vodafone Group PLC | 2.950 | % | 02/19/2023 | 25,000 | 23,958 | |||||||||||
Vodafone Group PLC | 4.375 | % | 02/19/2043 | 50,000 | 48,488 | |||||||||||
|
| |||||||||||||||
| 538,492 | ||||||||||||||||
|
| |||||||||||||||
TOTAL CORPORATE BONDS | 21,153,141 | |||||||||||||||
|
| |||||||||||||||
FOREIGN GOVERNMENT OBLIGATIONS – 2.2% | ||||||||||||||||
Brazilian Government International Bond | 5.875 | % | 01/15/2019 | 100,000 | 111,250 | |||||||||||
Brazilian Government International Bond | 5.625 | % | 01/07/2041 | 100,000 | 108,000 | |||||||||||
Canada Government International Bond | 1.625 | % | 02/27/2019 | 50,000 | 50,182 | |||||||||||
Colombia Government International Bond | 7.375 | % | 09/18/2037 | 100,000 | 135,000 | |||||||||||
Export Development Canada | 1.250 | % | 10/26/2016 | 25,000 | 25,246 | |||||||||||
Italy Government International Bond | 5.250 | % | 09/20/2016 | 100,000 | 106,632 | |||||||||||
Mexico Government International Bond | 3.500 | % | 01/21/2021 | 100,000 | 101,850 | |||||||||||
See accompanying notes to financial statements.
25
Table of Contents
State Street Aggregate Bond Index Portfolio
Portfolio of Investments — (continued)
December 31, 2014
Security Description | Interest Rate | Maturity Date | Principal Amount | Value | ||||||||||||
| FOREIGN GOVERNMENT OBLIGATIONS – (continued) | ||||||||||||||||
Mexico Government International Bond | 6.050 | % | 01/11/2040 | $ | 30,000 | $ | 36,900 | |||||||||
Mexico Government International Bond | 4.750 | % | 03/08/2044 | 50,000 | 52,125 | |||||||||||
Panama Government International Bond | 6.700 | % | 01/26/2036 | 50,000 | 63,875 | |||||||||||
Peruvian Government International Bond | 5.625 | % | 11/18/2050 | 50,000 | 58,750 | |||||||||||
Philippine Government International Bond | 7.750 | % | 01/14/2031 | 100,000 | 144,500 | |||||||||||
Poland Government International Bond | 5.000 | % | 03/23/2022 | 50,000 | 55,969 | |||||||||||
Province of British Columbia Canada | 2.650 | % | 09/22/2021 | 50,000 | 51,544 | |||||||||||
Province of Manitoba Canada | 1.125 | % | 06/01/2018 | 25,000 | 24,730 | |||||||||||
Province of Nova Scotia Canada | 5.125 | % | 01/26/2017 | 25,000 | 27,086 | |||||||||||
Province of Ontario Canada | 1.100 | % | 10/25/2017 | 50,000 | 49,716 | |||||||||||
Province of Ontario Canada | 4.400 | % | 04/14/2020 | 50,000 | 55,699 | |||||||||||
Province of Ontario Canada | 2.500 | % | 09/10/2021 | 25,000 | 25,164 | |||||||||||
Province of Quebec Canada | 2.750 | % | 08/25/2021 | 50,000 | 51,119 | |||||||||||
Province of Quebec Canada | 2.625 | % | 02/13/2023 | 50,000 | 50,120 | |||||||||||
South Africa Government International Bond | 6.875 | % | 05/27/2019 | 100,000 | 114,188 | |||||||||||
Turkey Government International Bond | 6.750 | % | 04/03/2018 | 100,000 | 111,525 | |||||||||||
Turkey Government International Bond | 6.875 | % | 03/17/2036 | 100,000 | 124,083 | |||||||||||
Uruguay Government International Bond | 5.100 | % | 06/18/2050 | 50,000 | 51,000 | |||||||||||
|
| |||||||||||||||
TOTAL FOREIGN GOVERNMENT OBLIGATIONS | 1,786,253 | |||||||||||||||
|
| |||||||||||||||
| U.S. GOVERNMENT AGENCY MBS TBA – 23.4% | ||||||||||||||||
Fannie Mae TBA(d) | 3.000 | % | 01/01/2030 | 1,000,000 | 1,039,062 | |||||||||||
Fannie Mae TBA(d) | 3.500 | % | 01/01/2030 | 125,000 | 132,012 | |||||||||||
Fannie Mae TBA(d) | 4.000 | % | 01/01/2030 | 300,000 | 318,188 | |||||||||||
Fannie Mae TBA(d) | 4.500 | % | 01/01/2030 | 200,000 | 210,000 | |||||||||||
Fannie Mae TBA(d) | 3.000 | % | 01/01/2045 | 1,750,000 | 1,771,328 | |||||||||||
Fannie Mae TBA(d) | 3.500 | % | 01/01/2045 | 2,000,000 | 2,085,625 | |||||||||||
Fannie Mae TBA(d) | 4.000 | % | 01/01/2045 | 1,500,000 | 1,601,250 | |||||||||||
Freddie Mac TBA(d) | 2.500 | % | 01/01/2030 | 1,000,000 | 1,017,031 | |||||||||||
Freddie Mac TBA(d) | 3.500 | % | 01/01/2030 | 500,000 | 527,734 | |||||||||||
Freddie Mac TBA(d) | 3.000 | % | 01/01/2045 | 750,000 | 757,910 | |||||||||||
Freddie Mac TBA(d) | 3.500 | % | 01/01/2045 | 1,000,000 | 1,040,234 | |||||||||||
Freddie Mac TBA(d) | 4.000 | % | 01/01/2045 | 1,400,000 | 1,492,750 | |||||||||||
Freddie Mac TBA(d) | 4.500 | % | 01/01/2045 | 200,000 | 216,813 | |||||||||||
Freddie Mac TBA(d) | 5.000 | % | 01/01/2045 | 1,250,000 | 1,377,930 | |||||||||||
Government National Mortgage Association TBA(d) | 3.000 | % | 01/01/2045 | 1,250,000 | 1,278,516 | |||||||||||
Government National Mortgage Association TBA(d) | 3.500 | % | 01/01/2045 | 1,650,000 | 1,732,371 | |||||||||||
Government National Mortgage Association TBA(d) | 4.000 | % | 01/01/2045 | 250,000 | 268,262 | |||||||||||
Government National Mortgage Association TBA(d) | 4.000 | % | 01/01/2045 | 800,000 | 857,437 | |||||||||||
Government National Mortgage Association TBA(d) | 4.500 | % | 01/01/2045 | 150,000 | 163,875 | |||||||||||
Government National Mortgage Association TBA(d) | 4.500 | % | 01/01/2045 | 350,000 | 382,484 | |||||||||||
See accompanying notes to financial statements.
26
Table of Contents
State Street Aggregate Bond Index Portfolio
Portfolio of Investments — (continued)
December 31, 2014
Security Description | Interest Rate | Maturity Date | Principal Amount | Value | ||||||||||||
| U.S. GOVERNMENT AGENCY MBS TBA – (continued) | ||||||||||||||||
Government National Mortgage Association TBA(d) | 5.000 | % | 01/01/2045 | $ | 125,000 | $ | 137,715 | |||||||||
Government National Mortgage Association TBA(d) | 5.000 | % | 01/01/2045 | 250,000 | 273,555 | |||||||||||
|
| |||||||||||||||
TOTAL U.S. GOVERNMENT AGENCY MBS TBA | 18,682,082 | |||||||||||||||
|
| |||||||||||||||
| U.S. GOVERNMENT AGENCY OBLIGATIONS – 9.2% | ||||||||||||||||
Fannie Mae | 0.750 | % | 03/04/2016 | 75,000 | 75,078 | |||||||||||
Fannie Mae | 0.500 | % | 03/30/2016 | 75,000 | 75,010 | |||||||||||
Fannie Mae | 5.375 | % | 07/15/2016 | 50,000 | 53,680 | |||||||||||
Fannie Mae | 0.625 | % | 08/26/2016 | 50,000 | 50,022 | |||||||||||
Fannie Mae | 1.250 | % | 09/28/2016 | 75,000 | 75,816 | |||||||||||
Fannie Mae | 0.750 | % | 04/20/2017 | 75,000 | 74,815 | |||||||||||
Fannie Mae | 2.000 | % | 09/26/2017 | 75,000 | 76,503 | |||||||||||
Fannie Mae | 1.000 | % | 09/27/2017 | 100,000 | 99,810 | |||||||||||
Fannie Mae | 1.532 | % | 10/25/2017 | 80,715 | 81,161 | |||||||||||
Fannie Mae | 0.875 | % | 10/26/2017 | 75,000 | 74,520 | |||||||||||
Fannie Mae | 0.875 | % | 05/21/2018 | 50,000 | 49,291 | |||||||||||
Fannie Mae | 4.000 | % | 09/01/2019 | 234,888 | 248,790 | |||||||||||
Fannie Mae | 1.750 | % | 09/12/2019 | 75,000 | 75,188 | |||||||||||
Fannie Mae | 2.940 | % | 07/25/2021 | 140,000 | 144,276 | |||||||||||
Fannie Mae | 2.385 | % | 03/25/2023 | 48,478 | 48,097 | |||||||||||
Fannie Mae | 2.625 | % | 09/06/2024 | 75,000 | 76,015 | |||||||||||
Fannie Mae | 3.500 | % | 11/01/2025 | 124,463 | 131,698 | |||||||||||
Fannie Mae | 3.500 | % | 01/01/2027 | 142,436 | 150,716 | |||||||||||
Fannie Mae | 3.500 | % | 10/01/2029 | 97,620 | 103,203 | |||||||||||
Fannie Mae | 7.250 | % | 05/15/2030 | 75,000 | 116,229 | |||||||||||
Fannie Mae | 5.500 | % | 02/01/2037 | 98,388 | 109,992 | |||||||||||
Fannie Mae | 5.500 | % | 09/01/2040 | 150,618 | 168,336 | |||||||||||
Fannie Mae | 4.500 | % | 12/01/2040 | 400,000 | 434,594 | |||||||||||
Fannie Mae | 5.500 | % | 09/01/2041 | 245,439 | 274,308 | |||||||||||
Fannie Mae | 4.500 | % | 01/01/2042 | 198,145 | 215,310 | |||||||||||
Fannie Mae | 4.500 | % | 09/01/2043 | 300,000 | 325,945 | |||||||||||
Fannie Mae | 4.500 | % | 09/01/2043 | 99,914 | 108,481 | |||||||||||
Fannie Mae | 4.500 | % | 11/01/2043 | 199,920 | 217,063 | |||||||||||
Fannie Mae | 4.500 | % | 06/01/2044 | 300,024 | 325,880 | |||||||||||
Fannie Mae | 3.500 | % | 10/01/2044 | 99,082 | 103,411 | |||||||||||
Fannie Mae | 4.000 | % | 10/01/2044 | 98,370 | 105,064 | |||||||||||
Federal Farm Credit Banks | 3.500 | % | 12/20/2023 | 50,000 | 54,278 | |||||||||||
Federal Home Loan Bank | 2.000 | % | 09/09/2016 | 25,000 | 25,568 | |||||||||||
Federal Home Loan Bank | 0.625 | % | 11/23/2016 | 100,000 | 99,934 | |||||||||||
Federal Home Loan Bank | 0.625 | % | 12/28/2016 | 50,000 | 49,915 | |||||||||||
Federal Home Loan Bank | 0.850 | % | 02/27/2017 | 50,000 | 49,976 | |||||||||||
See accompanying notes to financial statements.
27
Table of Contents
State Street Aggregate Bond Index Portfolio
Portfolio of Investments — (continued)
December 31, 2014
Security Description | Interest Rate | Maturity Date | Principal Amount | Value | ||||||||||||
| U.S. GOVERNMENT AGENCY OBLIGATIONS – (continued) | ||||||||||||||||
Federal Home Loan Bank | 0.875 | % | 05/24/2017 | $ | 75,000 | $ | 74,973 | |||||||||
Federal Home Loan Bank | 1.000 | % | 06/21/2017 | 100,000 | 100,178 | |||||||||||
Federal Home Loan Bank | 1.200 | % | 05/24/2018 | 50,000 | 49,557 | |||||||||||
Federal Home Loan Bank | 1.875 | % | 03/08/2019 | 50,000 | 50,509 | |||||||||||
Federal Home Loan Bank | 2.250 | % | 06/11/2021 | 75,000 | 75,650 | |||||||||||
Federal Home Loan Bank | 2.875 | % | 09/13/2024 | 50,000 | 51,196 | |||||||||||
Federal Home Loan Mortgage Corp. | 0.700 | % | 09/27/2016 | 75,000 | 74,960 | |||||||||||
Federal Home Loan Mortgage Corp. | 0.700 | % | 09/29/2016 | 50,000 | 49,972 | |||||||||||
Federal Home Loan Mortgage Corp. | 0.875 | % | 10/14/2016 | 100,000 | 100,409 | |||||||||||
Federal Home Loan Mortgage Corp. | 0.875 | % | 02/22/2017 | 75,000 | 75,139 | |||||||||||
Federal Home Loan Mortgage Corp. | 1.000 | % | 04/07/2017 | 50,000 | 49,980 | |||||||||||
Federal Home Loan Mortgage Corp. | 5.000 | % | 04/18/2017 | 100,000 | 109,406 | |||||||||||
Federal Home Loan Mortgage Corp. | 1.000 | % | 06/29/2017 | 50,000 | 50,059 | |||||||||||
Federal Home Loan Mortgage Corp. | 1.000 | % | 09/29/2017 | 100,000 | 99,788 | |||||||||||
Federal Home Loan Mortgage Corp. | 0.875 | % | 03/07/2018 | 75,000 | 74,137 | |||||||||||
Federal Home Loan Mortgage Corp. | 1.250 | % | 10/02/2019 | 75,000 | 73,466 | |||||||||||
Federal Home Loan Mortgage Corp. | 6.750 | % | 09/15/2029 | 75,000 | 110,647 | |||||||||||
Freddie Mac | 3.320 | % | 07/25/2020 | 68,641 | 71,766 | |||||||||||
Freddie Mac | 3.111 | % | 02/25/2023 | 100,000 | 103,760 | |||||||||||
Freddie Mac | 2.500 | % | 10/01/2029 | 98,649 | 100,435 | |||||||||||
Freddie Mac | 4.000 | % | 04/01/2042 | 99,201 | 105,834 | |||||||||||
Government National Mortgage Association | 5.000 | % | 10/15/2041 | 181,528 | 199,893 | |||||||||||
Government National Mortgage Association | 4.000 | % | 02/20/2042 | 67,301 | 72,190 | |||||||||||
Government National Mortgage Association | 4.000 | % | 07/20/2042 | 43,792 | 46,973 | |||||||||||
Government National Mortgage Association | 4.500 | % | 01/20/2044 | 472,730 | 516,531 | |||||||||||
Government National Mortgage Association | 4.000 | % | 08/20/2044 | 121,124 | 129,916 | |||||||||||
Government National Mortgage Association | 3.500 | % | 10/20/2044 | 149,242 | 156,893 | |||||||||||
Tennessee Valley Authority | 3.500 | % | 12/15/2042 | 50,000 | 49,967 | |||||||||||
|
| |||||||||||||||
TOTAL U.S. GOVERNMENT AGENCY OBLIGATIONS | 7,372,157 | |||||||||||||||
|
| |||||||||||||||
| U.S. TREASURY OBLIGATIONS – 36.0% | ||||||||||||||||
U.S. Treasury Note(e) | 0.375 | % | 03/15/2016 | 750,000 | 749,993 | |||||||||||
U.S. Treasury Note(e) | 0.375 | % | 04/30/2016 | 500,000 | 499,800 | |||||||||||
U.S. Treasury Note(e) | 0.500 | % | 06/15/2016 | 725,000 | 725,428 | |||||||||||
U.S. Treasury Note(e) | 0.625 | % | 08/15/2016 | 1,000,000 | 1,001,250 | |||||||||||
U.S. Treasury Note(e) | 0.500 | % | 08/31/2016 | 1,000,000 | 999,260 | |||||||||||
U.S. Treasury Note(e) | 3.000 | % | 08/31/2016 | 800,000 | 832,440 | |||||||||||
U.S. Treasury Note(e) | 0.500 | % | 09/30/2016 | 1,700,000 | 1,697,603 | |||||||||||
U.S. Treasury Note(e) | 0.625 | % | 10/15/2016 | 500,000 | 500,135 | |||||||||||
U.S. Treasury Note(e) | 0.500 | % | 11/30/2016 | 300,000 | 299,250 | |||||||||||
U.S. Treasury Note(e) | 0.625 | % | 12/31/2016 | 350,000 | 349,632 | |||||||||||
See accompanying notes to financial statements.
28
Table of Contents
State Street Aggregate Bond Index Portfolio
Portfolio of Investments — (continued)
December 31, 2014
Security Description | Interest Rate | Maturity Date | Principal Amount | Value | ||||||||||||
| U.S. TREASURY OBLIGATIONS – (continued) | ||||||||||||||||
U.S. Treasury Note(e) | 0.875 | % | 01/31/2017 | $ | 300,000 | $ | 300,903 | |||||||||
U.S. Treasury Note(e) | 1.000 | % | 03/31/2017 | 750,000 | 753,255 | |||||||||||
U.S. Treasury Note(e) | 0.500 | % | 07/31/2017 | 750,000 | 741,330 | |||||||||||
U.S. Treasury Note(e) | 1.000 | % | 09/15/2017 | 1,150,000 | 1,150,230 | |||||||||||
U.S. Treasury Note(e) | 1.875 | % | 09/30/2017 | 500,000 | 511,465 | |||||||||||
U.S. Treasury Note(e) | 0.875 | % | 11/15/2017 | 750,000 | 746,160 | |||||||||||
U.S. Treasury Note(e) | 1.000 | % | 12/15/2017 | 600,000 | 598,620 | |||||||||||
U.S. Treasury Note(e) | 2.625 | % | 01/31/2018 | 750,000 | 783,045 | |||||||||||
U.S. Treasury Note(e) | 2.625 | % | 04/30/2018 | 750,000 | 784,013 | |||||||||||
U.S. Treasury Note(e) | 4.000 | % | 08/15/2018 | 250,000 | 274,140 | |||||||||||
U.S. Treasury Note(e) | 1.375 | % | 09/30/2018 | 100,000 | 99,902 | |||||||||||
U.S. Treasury Note(e) | 1.250 | % | 11/30/2018 | 1,000,000 | 992,660 | |||||||||||
U.S. Treasury Note(e) | 1.375 | % | 02/28/2019 | 500,000 | 497,185 | |||||||||||
U.S. Treasury Note(e) | 1.000 | % | 08/31/2019 | 500,000 | 486,250 | |||||||||||
U.S. Treasury Note(e) | 1.625 | % | 08/31/2019 | 1,450,000 | 1,451,131 | |||||||||||
U.S. Treasury Note(e) | 1.000 | % | 09/30/2019 | 500,000 | 486,270 | |||||||||||
U.S. Treasury Note(e) | 1.000 | % | 11/30/2019 | 750,000 | 727,470 | |||||||||||
U.S. Treasury Note(e) | 1.500 | % | 11/30/2019 | 985,000 | 978,617 | |||||||||||
U.S. Treasury Note(e) | 1.625 | % | 12/31/2019 | 250,000 | 249,630 | |||||||||||
U.S. Treasury Note(e) | 2.125 | % | 08/31/2020 | 750,000 | 763,005 | |||||||||||
U.S. Treasury Note(e) | 2.000 | % | 05/31/2021 | 750,000 | 753,368 | |||||||||||
U.S. Treasury Note(e) | 2.000 | % | 08/31/2021 | 1,000,000 | 1,002,770 | |||||||||||
U.S. Treasury Note(e) | 2.000 | % | 11/15/2021 | 500,000 | 501,660 | |||||||||||
U.S. Treasury Note(e) | 2.000 | % | 02/15/2023 | 500,000 | 497,635 | |||||||||||
U.S. Treasury Note(e) | 1.750 | % | 05/15/2023 | 250,000 | 243,232 | |||||||||||
U.S. Treasury Note(e) | 2.375 | % | 08/15/2024 | 800,000 | 814,312 | |||||||||||
U.S. Treasury Bond(e) | 5.250 | % | 11/15/2028 | 500,000 | 671,055 | |||||||||||
U.S. Treasury Bond(e) | 4.375 | % | 02/15/2038 | 650,000 | 851,272 | |||||||||||
U.S. Treasury Bond(e) | 3.500 | % | 02/15/2039 | 500,000 | 574,865 | |||||||||||
U.S. Treasury Bond(e) | 4.250 | % | 11/15/2040 | 500,000 | 647,580 | |||||||||||
U.S. Treasury Bond(e) | 3.000 | % | 05/15/2042 | 300,000 | 315,528 | |||||||||||
U.S. Treasury Bond(e) | 2.750 | % | 11/15/2042 | 200,000 | 199,938 | |||||||||||
U.S. Treasury Bond(e) | 3.625 | % | 08/15/2043 | 150,000 | 176,520 | |||||||||||
U.S. Treasury Bond(e) | 3.125 | % | 08/15/2044 | 500,000 | 538,165 | |||||||||||
|
| |||||||||||||||
TOTAL U.S. TREASURY OBLIGATIONS | 28,817,972 | |||||||||||||||
|
| |||||||||||||||
| COMMERCIAL MORTGAGE BACKED SECURITIES – 1.2% | ||||||||||||||||
Citigroup Commercial Mortgage Trust 2013-GC11 | 3.093 | % | 04/10/2046 | 75,000 | 75,738 | |||||||||||
COMM 2013-CCRE8 Mortgage Trust | 3.334 | % | 06/10/2046 | 65,000 | 66,848 | |||||||||||
COMM 2013-LC6 Mortgage Trust | 1.906 | % | 01/10/2046 | 75,000 | 75,233 | |||||||||||
Commercial Mortgage Pass Through Certificates | 3.644 | % | 12/10/2047 | 100,000 | 103,878 | |||||||||||
See accompanying notes to financial statements.
29
Table of Contents
State Street Aggregate Bond Index Portfolio
Portfolio of Investments — (continued)
December 31, 2014
Security Description | Interest Rate | Maturity Date | Principal Amount | Value | ||||||||||||
| COMMERCIAL MORTGAGE BACKED SECURITIES – (continued) | ||||||||||||||||
GS Mortgage Securities Trust 2013-GC13 | 4.038 | % | 07/10/2046 | $ | 80,000 | $ | 87,086 | |||||||||
JP Morgan Chase Commercial Mortgage Securities Trust 2006-CIBC15 | 5.814 | % | 06/12/2043 | 84,377 | 88,580 | |||||||||||
JPMBB Commercial Mortgage Securities Trust 2014-C18 | 4.079 | % | 02/15/2047 | 50,000 | 54,055 | |||||||||||
Morgan Stanley Bank of America Merrill Lynch Trust 2013-C8 | 1.689 | % | 12/15/2048 | 90,000 | 89,619 | |||||||||||
Morgan Stanley Capital I Trust 2007-HQ11 | 5.447 | % | 02/12/2044 | 100,000 | 106,692 | |||||||||||
Wachovia Bank Commercial Mortgage Trust Series 2006-C26 | 6.011 | % | 06/15/2045 | 50,000 | 52,762 | |||||||||||
Wells Fargo Commercial Mortgage Trust 2014-LC16 | 1.294 | % | 08/15/2050 | 83,382 | 82,778 | |||||||||||
WFRBS Commercial Mortgage Trust 2014-C19 | 3.660 | % | 03/15/2047 | 75,000 | 78,333 | |||||||||||
|
| |||||||||||||||
TOTAL COMMERCIAL MORTGAGE BACKED SECURITIES | 961,602 | |||||||||||||||
|
| |||||||||||||||
| ASSET BACKED SECURITIES – 0.5% | ||||||||||||||||
| Automobiles – 0.2% | ||||||||||||||||
CarMax Auto Owner Trust 2013-3 | 0.970 | % | 04/16/2018 | 105,000 | 105,131 | |||||||||||
Volkswagen Auto Loan Enhanced Trust 2014-1 | 0.910 | % | 10/22/2018 | 65,000 | 64,640 | |||||||||||
|
| |||||||||||||||
| 169,771 | ||||||||||||||||
|
| |||||||||||||||
| Credit Card Receivables – 0.3% | ||||||||||||||||
Capital One Multi-Asset Execution Trust | 1.480 | % | 07/15/2020 | 30,000 | 29,994 | |||||||||||
Citibank Credit Card Issuance Trust | 5.350 | % | 02/07/2020 | 100,000 | 111,093 | |||||||||||
Citibank Credit Card Issuance Trust | 2.880 | % | 01/23/2023 | 100,000 | 102,769 | |||||||||||
|
| |||||||||||||||
| 243,856 | ||||||||||||||||
|
| |||||||||||||||
TOTAL ASSET BACKED SECURITIES | 413,627 | |||||||||||||||
|
| |||||||||||||||
| MUNICIPAL BONDS & NOTES – 0.2% | ||||||||||||||||
| California – 0.2% | ||||||||||||||||
Los Angeles Department of Water & Power | 5.716 | % | 07/01/2039 | 100,000 | 126,456 | |||||||||||
Los Angeles Unified School District | 5.750 | % | 07/01/2034 | 25,000 | 31,547 | |||||||||||
|
| |||||||||||||||
TOTAL MUNICIPAL BONDS & NOTES | 158,003 | |||||||||||||||
|
| |||||||||||||||
| SHORT TERM INVESTMENTS – 24.9% | ||||||||||||||||
State Street Institutional Liquid Reserves Fund, Premier | 19,953,875 | 19,953,875 | ||||||||||||||
|
| |||||||||||||||
TOTAL INVESTMENTS | 99,298,712 | |||||||||||||||
Other Assets & Liabilities – (24.0)% | (19,254,242 | ) | ||||||||||||||
|
| |||||||||||||||
NET ASSETS – 100.0% | $ | 80,044,470 | ||||||||||||||
|
| |||||||||||||||
| (a) | Variable Rate Security – Interest rate shown is rate in effect at December 31, 2014 |
| (b) | Amount shown represents less than 0.05% of net assets. |
See accompanying notes to financial statements.
30
Table of Contents
State Street Aggregate Bond Index Portfolio
Portfolio of Investments — (continued)
December 31, 2014
| (c) | Security subject to restrictions on resale under federal securities laws, which may only be resold upon registration under the Securities Act of 1933, as amended (“1933 Act”) or in transactions exempt from registration, including sales to qualified institutional buyers pursuant to Rule 144A of the 1933 Act. The Portfolio does not have the right to demand that this security be registered. The Portfolio’s investment manager has deemed this security to be liquid based upon procedures approved by the Board of Trustees. These securities represent $170,250 or 0.21% of net assets as of December 31, 2014. |
| (d) | When-issued security |
| (e) | Security, or a portion of the security has been designated as collateral for TBA securities. |
| (f) | The rate shown is the annualized seven-day yield at period end. |
| (g) | Affiliated Fund managed by SSGA Fund Management, Inc. See table that follows for more information. |
| (h) | Value is determined based on Level 1 inputs established by provisions surrounding fair value measurements and disclosures. |
Abbreviations | ||
| MBS | Mortgage Backed Securities | |
| PLC | Public Limited Company | |
| TBA | To Be Announced | |
Affiliates Table
Certain investments made by the Portfolio were made in securities affiliated with SSGA Funds Management, Inc. (the “Adviser” or “SSGA FM”). The Portfolio invested in the State Street Institutional Liquid Reserves Fund. Transactions in affiliates for the period ending December 31, 2014 were as follows:
Security Description | Number of shares held at 9/19/14* | Shares purchased for the period ended 12/31/14 | Shares sold for the period ended 12/31/14 | Number of shares held at 12/31/14 | Value at 12/31/14 | Income earned for the period ended 12/31/14 | ||||||||||||||||||
State Street Institutional Liquid Reserves Fund, Premier Class | – | 84,349,216 | 64,395,341 | 19,953,875 | $ | 19,953,875 | $ | 3,033 | ||||||||||||||||
| * | Commencement of operations. |
See Notes to Financial Statements.
31
Table of Contents
State Street Global Equity ex-U.S. Index Portfolio
Portfolio Statistics (Unaudited)
Portfolio Composition* | December 31, 2014 | |||
Common Stocks | 97.7 | % | ||
Rights | 0.0 | ** | ||
Short Term Investments | 1.2 | |||
Other Assets in Excess of Liabilities | 1.1 | |||
Total | 100.0 | % |
Top Five Sectors (excluding short-term investments)* | December 31, 2014 | |||
Financials | 27.9 | % | ||
Consumer Discretionary | 10.6 | |||
Industrials | 10.4 | |||
Consumer Staples | 10.1 | |||
Health Care | 8.2 | |||
Total | 67.2 | % |
| * | As a percentage of net assets as of the date indicated. The Portfolio’s composition will vary over time. |
| ** | Less than 0.05% of net assets. |
See Notes to Financial Statements.
32
Table of Contents
State Street Global Equity ex-U.S. Index Portfolio
Portfolio of Investments
December 31, 2014
Security Description | Shares | Value | ||||||
COMMON STOCKS – 97.7% |
| |||||||
Australia – 5.0% |
| |||||||
AGL Energy, Ltd. | 1,517 | $ | 16,531 | |||||
ALS, Ltd. | 911 | 3,951 | ||||||
Alumina, Ltd.(a) | 5,703 | 8,284 | ||||||
Amcor, Ltd. | 2,725 | 30,059 | ||||||
AMP, Ltd. | 6,679 | 29,793 | ||||||
APA Group | 2,516 | 15,356 | ||||||
Asciano, Ltd. | 2,202 | 10,807 | ||||||
ASX, Ltd. | 437 | 13,075 | ||||||
Aurizon Holdings, Ltd. | 4,826 | 18,125 | ||||||
AusNet Services | 3,946 | 4,273 | ||||||
Australia & New Zealand Banking Group, Ltd. | 8,030 | 209,382 | ||||||
Bank of Queensland, Ltd. | 842 | 8,341 | ||||||
Bendigo & Adelaide Bank, Ltd. | 980 | 10,209 | ||||||
BHP Billiton, Ltd. | 8,903 | 211,760 | ||||||
Boral, Ltd. | 1,767 | 7,598 | ||||||
Brambles, Ltd. | 3,529 | 30,464 | ||||||
Caltex Australia, Ltd. | 305 | 8,460 | ||||||
Coca-Cola Amatil, Ltd. | 1,293 | 9,808 | ||||||
Cochlear, Ltd. | 129 | 8,161 | ||||||
Commonwealth Bank of Australia | 4,455 | 310,140 | ||||||
Computershare, Ltd. | 1,068 | 10,238 | ||||||
Crown Resorts, Ltd. | 822 | 8,465 | ||||||
CSL, Ltd. | 1,419 | 100,152 | ||||||
Dexus Property Group REIT | 2,044 | 11,586 | ||||||
Federation Centres REIT | 3,224 | 7,521 | ||||||
Flight Centre Travel Group, Ltd. | 125 | 3,314 | ||||||
Fortescue Metals Group, Ltd. | 3,516 | 7,767 | ||||||
Goodman Group REIT | 3,901 | 18,026 | ||||||
GPT Group (The) REIT | 3,806 | 13,479 | ||||||
Harvey Norman Holdings, Ltd. | 1,254 | 3,428 | ||||||
Iluka Resources, Ltd. | 945 | 4,554 | ||||||
Incitec Pivot, Ltd. | 3,808 | 9,871 | ||||||
Insurance Australia Group, Ltd. | 5,288 | 26,874 | ||||||
Leighton Holdings, Ltd. | 229 | 4,177 | ||||||
Lend Lease Group | 1,239 | 16,536 | ||||||
Macquarie Group, Ltd. | 666 | 31,509 | ||||||
Medibank Pvt, Ltd.(a) | 11,545 | 22,769 | ||||||
Metcash, Ltd. | 2,006 | 3,024 | ||||||
Mirvac Group REIT | 8,337 | 12,069 | ||||||
National Australia Bank, Ltd. | 6,975 | 190,504 | ||||||
Newcrest Mining, Ltd.(a) | 1,731 | 15,451 | ||||||
Novion Property Group REIT | 4,770 | 8,232 | ||||||
Orica, Ltd. | 864 | 13,273 | ||||||
Origin Energy, Ltd. | 2,492 | 23,573 | ||||||
Qantas Airways, Ltd.(a) | 2,430 | 4,723 | ||||||
QBE Insurance Group, Ltd. | 3,030 | 27,549 | ||||||
Ramsay Health Care, Ltd. | 296 | 13,759 | ||||||
REA Group, Ltd. | 119 | 4,382 | ||||||
Rio Tinto, Ltd. | 1,367 | 64,275 | ||||||
Santos, Ltd. | 2,207 | 14,947 | ||||||
Scentre Group REIT(a) | 12,022 | 34,267 | ||||||
Seek, Ltd. | 731 | 10,226 | ||||||
Sonic Healthcare, Ltd. | 860 | 12,946 | ||||||
Stockland REIT | 5,254 | 17,593 | ||||||
Suncorp Group, Ltd. | 2,905 | 33,182 | ||||||
Sydney Airport | 2,452 | 9,394 | ||||||
Tabcorp Holdings, Ltd. | 1,723 | 5,826 | ||||||
Tatts Group, Ltd. | 3,239 | 9,134 | ||||||
Telstra Corp., Ltd. | 13,591 | 66,158 | ||||||
Toll Holdings, Ltd. | 1,538 | 7,338 | ||||||
TPG Telecom, Ltd. | 627 | 3,430 | ||||||
Transurban Group | 4,068 | 28,505 | ||||||
Treasury Wine Estates, Ltd. | 1,466 | 5,717 | ||||||
Wesfarmers, Ltd. | 3,471 | 117,793 | ||||||
Westfield Corp. REIT(a) | 4,457 | 32,664 | ||||||
Westpac Banking Corp. | 8,942 | 240,968 | ||||||
Woodside Petroleum, Ltd. | 2,292 | 71,424 | ||||||
Woolworths, Ltd. | 3,790 | 94,655 | ||||||
WorleyParsons, Ltd. | 468 | 3,869 | ||||||
|
| |||||||
| 2,465,693 | ||||||||
|
| |||||||
Austria – 0.1% | ||||||||
Andritz AG | 164 | 9,013 | ||||||
Erste Group Bank AG | 631 | 14,467 | ||||||
IMMOFINANZ AG(a) | 2,167 | 5,485 | ||||||
OMV AG | 333 | 8,812 | ||||||
Raiffeisen Bank International AG | 265 | 3,959 | ||||||
Vienna Insurance Group AG Wiener Versicherung Gruppe | 87 | 3,872 | ||||||
Voestalpine AG | 253 | 9,973 | ||||||
|
| |||||||
| 55,581 | ||||||||
|
| |||||||
Belgium – 0.8% | ||||||||
Ageas | 501 | 17,767 | ||||||
Anheuser-Busch InBev NV | 2,292 | 257,927 | ||||||
Belgacom SA | 343 | 12,420 | ||||||
Colruyt SA | 159 | 7,373 | ||||||
Delhaize Group SA | 231 | 16,780 | ||||||
Groupe Bruxelles Lambert SA | 182 | 15,492 | ||||||
KBC Groep NV(a) | 565 | 31,358 | ||||||
Solvay SA | 134 | 18,102 | ||||||
Telenet Group Holding NV(a) | 118 | 6,627 | ||||||
UCB SA | 285 | 21,629 | ||||||
Umicore SA | 244 | 9,828 | ||||||
|
| |||||||
| 415,303 | ||||||||
|
| |||||||
Brazil – 2.0% | ||||||||
AMBEV SA | 15,335 | 95,322 | ||||||
Banco Bradesco SA(d) | 3,700 | 49,471 | ||||||
Banco Bradesco SA(d) | 5,300 | 68,238 | ||||||
Banco do Brasil SA | 2,400 | 21,232 | ||||||
BB Seguridade Participacoes SA | 2,000 | 24,008 | ||||||
BM&FBOVESPA SA | 6,900 | 25,561 | ||||||
BRF SA | 1,600 | 37,407 | ||||||
CCR SA | 3,600 | 20,671 | ||||||
Cia Brasileira de Distribuicao | 600 | 22,092 | ||||||
Cia Energetica de Minas Gerais | 3,900 | 19,052 | ||||||
Cielo SA | 2,300 | 36,043 | ||||||
Embraer SA | 2,700 | 24,878 | ||||||
Estacio Participacoes SA | 2,500 | 22,124 | ||||||
Gerdau SA Preference Shares | 6,200 | 21,996 | ||||||
Investimentos Itau SA Preference Shares | 9,500 | 33,118 | ||||||
Itau Unibanco Holding SA | 8,200 | 106,620 | ||||||
JBS SA | 3,600 | 15,160 | ||||||
Kroton Educacional SA | 6,300 | 36,301 | ||||||
Localiza Rent a Car SA | 1,800 | 23,977 | ||||||
Lojas Americanas SA | 5,500 | 27,089 | ||||||
Lojas Renner SA | 1,000 | 28,523 | ||||||
Petroleo Brasileiro SA | 7,500 | 27,382 | ||||||
Petroleo Brasileiro SA Preference Shares | 16,000 | 60,631 | ||||||
See Notes to Financial Statements.
33
Table of Contents
State Street Global Equity ex-U.S. Index Portfolio
Portfolio of Investments — (continued)
December 31, 2014
Security Description | Shares | Value | ||||||
COMMON STOCKS – (continued) |
| |||||||
Brazil – (continued) | ||||||||
Telefonica Brasil SA | 1,300 | $ | 22,961 | |||||
Tim Participacoes SA | 3,900 | 17,327 | ||||||
Tractebel Energia SA | 1,900 | 23,968 | ||||||
Ultrapar Participacoes SA | 1,200 | 22,879 | ||||||
Vale SA(d) | 8,100 | 58,776 | ||||||
Vale SA(d) | 4,500 | 36,856 | ||||||
|
| |||||||
| 1,029,663 | ||||||||
|
| |||||||
Canada – 7.5% | ||||||||
Agnico-Eagle Mines, Ltd. | 500 | 12,484 | ||||||
Agrium, Inc. | 500 | 47,485 | ||||||
Alimentation Couche-Tard, Inc. | 1,300 | 54,649 | ||||||
AltaGas, Ltd. | 300 | 11,226 | ||||||
ARC Resources, Ltd. | 700 | 15,206 | ||||||
Atco, Ltd.(Class I) | 200 | 8,230 | ||||||
Bank of Montreal | 1,800 | 127,713 | ||||||
Bank of Nova Scotia (The) | 3,500 | 200,376 | ||||||
Barrick Gold Corp. | 3,200 | 34,590 | ||||||
Baytex Energy Corp. | 400 | 6,672 | ||||||
BCE, Inc. | 679 | 31,234 | ||||||
BlackBerry, Ltd.(a) | 1,100 | 12,099 | ||||||
Bombardier, Inc. | 3,200 | 11,466 | ||||||
Brookfield Asset Management, Inc. (Class A) | 1,700 | 85,451 | ||||||
CAE, Inc. | 600 | 7,812 | ||||||
Cameco Corp. | 900 | 14,803 | ||||||
Canadian Imperial Bank of Commerce | 1,200 | 103,439 | ||||||
Canadian National Railway Co. | 2,200 | 151,991 | ||||||
Canadian Natural Resources, Ltd. | 3,000 | 93,037 | ||||||
Canadian Oil Sands, Ltd. | 1,100 | 9,896 | ||||||
Canadian Pacific Railway, Ltd. | 500 | 96,590 | ||||||
Canadian Tire Corp., Ltd. (Class A) | 200 | 21,194 | ||||||
Canadian Utilities, Ltd. | 300 | 10,596 | ||||||
Catamaran Corp. (Class A)(a) | 500 | 25,953 | ||||||
Cenovus Energy, Inc. | 2,100 | 43,460 | ||||||
CGI Group, Inc.(a) | 500 | 19,119 | ||||||
CI Financial Corp. | 500 | 13,939 | ||||||
Constellation Software, Inc. | 100 | 29,824 | ||||||
Crescent Point Energy Corp. | 1,200 | 27,880 | ||||||
Dollarama, Inc. | 300 | 15,385 | ||||||
Eldorado Gold Corp. | 1,600 | 9,780 | ||||||
Empire Co., Ltd. (Class A) | 100 | 7,565 | ||||||
Enbridge, Inc. | 2,500 | 128,945 | ||||||
EnCana Corp. | 2,000 | 27,921 | ||||||
Enerplus Corp. | 500 | 4,831 | ||||||
Fairfax Financial Holdings, Ltd. | 100 | 52,560 | ||||||
Finning International, Inc. | 400 | 8,713 | ||||||
First Capital Realty, Inc. | 200 | 3,222 | ||||||
First Quantum Minerals, Ltd. | 1,700 | 24,232 | ||||||
Fortis, Inc. | 800 | 26,910 | ||||||
Franco-Nevada Corp. | 400 | 19,757 | ||||||
George Weston, Ltd. | 100 | 8,664 | ||||||
Gildan Activewear, Inc. | 300 | 17,017 | ||||||
Goldcorp, Inc. | 2,200 | 40,856 | ||||||
Great-West Lifeco, Inc. | 700 | 20,300 | ||||||
H&R REIT | 300 | 5,628 | ||||||
Husky Energy, Inc. | 800 | 18,994 | ||||||
IGM Financial, Inc. | 200 | 7,997 | ||||||
Imperial Oil, Ltd. | 800 | 34,569 | ||||||
Industrial Alliance Insurance & Financial Services, Inc. | 200 | 7,672 | ||||||
Intact Financial Corp. | 300 | 21,718 | ||||||
Inter Pipeline, Ltd. | 900 | 27,927 | ||||||
Keyera Corp. | 200 | 13,999 | ||||||
Kinross Gold Corp.(a) | 2,500 | 7,036 | ||||||
Loblaw Cos., Ltd. | 600 | 32,205 | ||||||
Magna International, Inc. | 700 | 76,083 | ||||||
Manulife Financial Corp. | 5,900 | 112,983 | ||||||
MEG Energy Corp.(a) | 300 | 5,064 | ||||||
Methanex Corp. | 200 | 9,216 | ||||||
Metro, Inc. | 200 | 16,111 | ||||||
National Bank of Canada | 900 | 38,417 | ||||||
New Gold, Inc.(a) | 1,100 | 4,730 | ||||||
Onex Corp. | 200 | 11,649 | ||||||
Open Text Corp. | 300 | 17,512 | ||||||
Pacific Rubiales Energy Corp. | 700 | 4,345 | ||||||
Pembina Pipeline Corp. | 900 | 32,900 | ||||||
Penn West Petroleum, Ltd. | 1,100 | 2,308 | ||||||
Peyto Exploration & Development Corp. | 300 | 8,669 | ||||||
Potash Corp. of Saskatchewan, Inc. | 2,500 | 88,647 | ||||||
Power Corp. of Canada | 1,000 | 27,421 | ||||||
Power Financial Corp. | 600 | 18,742 | ||||||
PrairieSky Royalty, Ltd. | 600 | 15,851 | ||||||
Restaurant Brands International, Inc.(a) | 746 | 29,307 | ||||||
RioCan REIT | 300 | 6,846 | ||||||
Rogers Communications, Inc. (Class B) | 1,000 | 38,998 | ||||||
Royal Bank of Canada | 4,100 | 284,035 | ||||||
Saputo, Inc. | 600 | 18,089 | ||||||
Shaw Communications, Inc. (Class B) | 1,100 | 29,773 | ||||||
Silver Wheaton Corp. | 800 | 16,321 | ||||||
SNC-Lavalin Group, Inc. | 300 | 11,477 | ||||||
Sun Life Financial, Inc. | 1,900 | 68,766 | ||||||
Suncor Energy, Inc. | 4,400 | 140,177 | ||||||
Talisman Energy, Inc. | 2,300 | 18,070 | ||||||
Teck Resources, Ltd. (Class B) | 1,300 | 17,823 | ||||||
TELUS Corp. | 500 | 18,083 | ||||||
Thomson Reuters Corp. | 1,000 | 40,466 | ||||||
Toronto-Dominion Bank | 5,300 | 254,006 | ||||||
Tourmaline Oil Corp.(a) | 400 | 13,365 | ||||||
TransAlta Corp. | 600 | 5,450 | ||||||
TransCanada Corp. | 2,100 | 103,527 | ||||||
Turquoise Hill Resources, Ltd.(a) | 1,800 | 5,579 | ||||||
Valeant Pharmaceuticals International, Inc.(a) | 1,000 | 143,605 | ||||||
Vermilion Energy, Inc. | 200 | 9,842 | ||||||
Yamana Gold, Inc. | 1,900 | 7,694 | ||||||
|
| |||||||
| 3,694,764 | ||||||||
|
| |||||||
Chile – 0.4% | ||||||||
AES Gener SA | 53,702 | 28,409 | ||||||
Cencosud SA | 9,119 | 22,790 | ||||||
Colbun SA | 115,907 | 30,926 | ||||||
Empresa Nacional de Electricidad SA ADR | 26,443 | 39,429 | ||||||
See Notes to Financial Statements.
34
Table of Contents
State Street Global Equity ex-U.S. Index Portfolio
Portfolio of Investments — (continued)
December 31, 2014
Security Description | Shares | Value | ||||||
COMMON STOCKS – (continued) |
| |||||||
Chile – (continued) | ||||||||
Empresas COPEC SA | 1,918 | $ | 21,530 | |||||
Enersis SA | 77,873 | 25,081 | ||||||
Latam Airlines Group SA ADR(a) | 2,319 | 27,535 | ||||||
SACI Falabella | 3,870 | 25,960 | ||||||
|
| |||||||
| 221,660 | ||||||||
|
| |||||||
China – 3.9% | ||||||||
Agricultural Bank of China, Ltd. (Class H) | 65,000 | 32,644 | ||||||
Bank of China, Ltd. (Class H) | 213,000 | 119,253 | ||||||
Bank of Communications Co., Ltd. (Class H) | 41,000 | 37,807 | ||||||
Brilliance China Automotive Holdings, Ltd. | 20,000 | 31,887 | ||||||
China CITIC Bank Corp., Ltd. (Class H) | 48,000 | 38,289 | ||||||
China Communications Construction Co., Ltd. (Class H) | 44,000 | 52,724 | ||||||
China Construction Bank Corp. | 209,000 | 169,562 | ||||||
China Life Insurance Co., Ltd. (Class H) | 23,000 | 89,774 | ||||||
China Longyuan Power Group Corp., Ltd. (Class H) | 29,000 | 29,762 | ||||||
China Mengniu Dairy Co., Ltd. | 6,000 | 24,602 | ||||||
China Merchants Bank Co., Ltd. | 22,000 | 54,901 | ||||||
China Minsheng Banking Corp., Ltd. (Class H) | 32,000 | 41,729 | ||||||
China National Building Material Co., Ltd. (Class H) | 34,000 | 32,870 | ||||||
China Pacific Insurance Group Co., Ltd. (Class H) | 8,800 | 43,820 | ||||||
China Petroleum & Chemical Corp. (Class H) | 80,000 | 64,767 | ||||||
China Shenhua Energy Co., Ltd. (Class H) | 10,500 | 30,854 | ||||||
China Telecom Corp., Ltd. (Class H) | 50,000 | 29,124 | ||||||
Chongqing Rural Commercial Bank Co., Ltd. (Class H) | 64,000 | 39,820 | ||||||
Datang International Power Generation Co., Ltd. (Class H) | 54,000 | 28,910 | ||||||
Dongfeng Motor Group Co., Ltd. (Class H) | 20,000 | 27,907 | ||||||
ENN Energy Holdings, Ltd. | 4,000 | 22,620 | ||||||
Evergrande Real Estate Group, Ltd. | 73,000 | 29,529 | ||||||
Hengan International Group Co., Ltd. | 2,000 | 20,862 | ||||||
Huaneng Power International, Inc. (Class H) | 26,000 | 35,171 | ||||||
Industrial & Commercial Bank of China, Ltd. (Class H) | 215,000 | 156,180 | ||||||
Kerry Properties, Ltd. | 1,500 | 5,409 | ||||||
Lenovo Group, Ltd. | 22,000 | 28,850 | ||||||
PetroChina Co., Ltd. (Class H) | 70,000 | 77,638 | ||||||
PICC Property & Casualty Co., Ltd. (Class H) | 21,800 | 42,179 | ||||||
Ping An Insurance Group Co. of China, Ltd. (Class H) | 8,000 | 80,778 | ||||||
Shanghai Industrial Holdings, Ltd. | 14,000 | 41,801 | ||||||
Sino Land Co., Ltd. | 6,181 | 9,858 | ||||||
Sinopharm Group Co., Ltd. (Class H) | 8,000 | 28,209 | ||||||
SOHO China, Ltd. | 38,500 | 27,119 | ||||||
Tencent Holdings, Ltd. | 14,800 | 212,350 | ||||||
Tingyi Cayman Islands Holding Corp. | 12,000 | 27,362 | ||||||
Tsingtao Brewery Co., Ltd. | 4,000 | 27,106 | ||||||
Want Want China Holdings, Ltd. | 25,000 | 32,795 | ||||||
|
| |||||||
| 1,926,822 | ||||||||
|
| |||||||
Colombia – 0.1% | ||||||||
Bancolombia SA ADR | 500 | 23,940 | ||||||
Ecopetrol SA ADR | 700 | 11,984 | ||||||
Grupo de Inversiones Suramericana SA | 1,089 | 18,145 | ||||||
|
| |||||||
| 54,069 | ||||||||
|
| |||||||
Czech Republic – 0.1% | ||||||||
CEZ AS | 1,178 | 30,267 | ||||||
|
| |||||||
| 30,267 | ||||||||
|
| |||||||
Denmark – 1.0% | ||||||||
AP Moeller – Maersk A/S (Class A) | 16 | 31,807 | ||||||
AP Moeller – Maersk A/S (Class B) | 9 | 17,222 | ||||||
Carlsberg A/S | 241 | 18,717 | ||||||
Coloplast A/S (Class B) | 251 | 21,128 | ||||||
Danske Bank A/S | 2,081 | 56,016 | ||||||
DSV A/S | 400 | 12,153 | ||||||
Novo Nordisk A/S (Class B) | 5,729 | 242,431 | ||||||
Novozymes A/S (Class B) | 541 | 22,701 | ||||||
Pandora A/S | 260 | 21,092 | ||||||
TDC A/S | 1,800 | 13,719 | ||||||
Tryg A/S | 48 | 5,367 | ||||||
Vestas Wind Systems A/S(a) | 506 | 18,281 | ||||||
William Demant Holding AS(a) | 51 | 3,871 | ||||||
|
| |||||||
| 484,505 | ||||||||
|
| |||||||
Egypt – 0.0%(b) | ||||||||
Commercial International Bank Egypt SAE | 3,513 | 24,124 | ||||||
|
| |||||||
| 24,124 | ||||||||
|
| |||||||
Finland – 0.6% | ||||||||
Elisa Oyj | 321 | 8,737 | ||||||
Fortum Oyj | 1,003 | 21,674 | ||||||
Kone Oyj (Class B) | 706 | 32,065 | ||||||
Metso Oyj | 254 | 7,576 | ||||||
Neste Oil Oyj | 290 | 7,027 | ||||||
Nokia Oyj | 11,299 | 88,929 | ||||||
Nokian Renkaat Oyj | 256 | 6,270 | ||||||
Orion Oyj (Class B) | 225 | 6,985 | ||||||
Sampo Oyj (Class A) | 1,392 | 65,270 | ||||||
Stora Enso Oyj | 1,243 | 11,064 | ||||||
UPM-Kymmene Oyj | 1,202 | 19,738 | ||||||
Wartsila Oyj Abp | 334 | 14,988 | ||||||
|
| |||||||
| 290,323 | ||||||||
|
| |||||||
France – 6.3% | ||||||||
Accor SA | 386 | 17,295 | ||||||
Aeroports de Paris | 67 | 8,121 | ||||||
Air Liquide SA | 1,062 | 131,039 | ||||||
Alcatel-Lucent(a) | 6,354 | 22,558 | ||||||
Alstom SA(a) | 488 | 15,742 | ||||||
Arkema SA | 147 | 9,748 | ||||||
See Notes to Financial Statements.
35
Table of Contents
State Street Global Equity ex-U.S. Index Portfolio
Portfolio of Investments — (continued)
December 31, 2014
Security Description | Shares | Value | ||||||
COMMON STOCKS – (continued) |
| |||||||
France – (continued) | ||||||||
AtoS | 178 | $ | 14,086 | |||||
AXA SA | 5,518 | 127,447 | ||||||
BNP Paribas SA | 3,025 | 177,762 | ||||||
Bollore SA | 1,200 | 5,446 | ||||||
Bouygues SA | 433 | 15,625 | ||||||
Bureau Veritas SA | 499 | 11,019 | ||||||
Cap Gemini SA | 326 | 23,220 | ||||||
Carrefour SA | 1,976 | 60,035 | ||||||
Casino Guichard-Perrachon SA | 128 | 11,779 | ||||||
Christian Dior SA | 123 | 21,015 | ||||||
Cie de Saint-Gobain | 1,430 | 60,202 | ||||||
Cie Generale des Etablissements Michelin | 421 | 38,169 | ||||||
CNP Assurances | 388 | 6,871 | ||||||
Credit Agricole SA | 2,260 | 29,054 | ||||||
Danone | 1,716 | 112,890 | ||||||
Dassault Systemes | 286 | 17,405 | ||||||
Edenred | 459 | 12,745 | ||||||
Electricite de France SA | 546 | 14,993 | ||||||
Essilor International SA | 632 | 70,352 | ||||||
Eurazeo SA | 85 | 5,937 | ||||||
Eutelsat Communications SA | 364 | 11,767 | ||||||
Fonciere Des Regions REIT | 64 | 5,922 | ||||||
GDF Suez | 4,318 | 100,848 | ||||||
Gecina SA REIT | 64 | 8,010 | ||||||
Groupe Eurotunnel SA | 1,056 | 13,631 | ||||||
Hermes International | 93 | 33,161 | ||||||
ICADE REIT | 84 | 6,726 | ||||||
Iliad SA | 59 | 14,173 | ||||||
Imerys SA | 77 | 5,678 | ||||||
JCDecaux SA | 152 | 5,220 | ||||||
Kering | 171 | 32,876 | ||||||
Klepierre REIT | 225 | 9,691 | ||||||
L’Oreal SA | 740 | 124,236 | ||||||
Lafarge SA | 422 | 29,618 | ||||||
Lagardere SCA | 266 | 6,904 | ||||||
Legrand SA | 600 | 31,409 | ||||||
LVMH Moet Hennessy Louis Vuitton SA | 847 | 133,940 | ||||||
Natixis | 2,104 | 13,835 | ||||||
Numericable-SFR(a) | 435 | 21,450 | ||||||
Orange SA | 5,557 | 94,504 | ||||||
Pernod Ricard SA | 653 | 72,403 | ||||||
Peugeot SA(a) | 884 | 10,784 | ||||||
Publicis Groupe SA | 410 | 29,365 | ||||||
Remy Cointreau SA | 54 | 3,607 | ||||||
Renault SA | 434 | 31,715 | ||||||
Rexel SA | 610 | 10,893 | ||||||
Safran SA | 612 | 37,668 | ||||||
Sanofi | 3,209 | 292,455 | ||||||
Schneider Electric SE | 1,555 | 112,989 | ||||||
SCOR SE | 347 | 10,501 | ||||||
Societe BIC SA | 64 | 8,494 | ||||||
Societe Generale SA | 2,181 | 91,648 | ||||||
Sodexo SA | 213 | 20,885 | ||||||
Suez Environnement Co. | 634 | 10,991 | ||||||
Technip SA | 231 | 13,794 | ||||||
Thales SA | 210 | 11,331 | ||||||
Total SA | 5,777 | 297,858 | ||||||
Unibail-Rodamco SE REIT(d) | 220 | 56,663 | ||||||
Unibail-Rodamco SE REIT(d) | 80 | 20,447 | ||||||
Valeo SA | 170 | 21,175 | ||||||
Vallourec SA | 246 | 6,717 | ||||||
Veolia Environnement SA | 952 | 16,906 | ||||||
Vinci SA | 1,487 | 81,370 | ||||||
Vivendi SA | 3,658 | 91,249 | ||||||
Wendel SA | 72 | 8,047 | ||||||
Zodiac Aerospace | 420 | 14,174 | ||||||
|
| |||||||
| 3,128,283 | ||||||||
|
| |||||||
Germany – 6.3% | ||||||||
adidas AG | 472 | 32,898 | ||||||
Allianz SE | 1,298 | 215,668 | ||||||
Axel Springer SE | 89 | 5,367 | ||||||
BASF SE | 2,631 | 222,408 | ||||||
Bayer AG | 2,344 | 320,447 | ||||||
Bayerische Motoren Werke AG | 984 | 106,866 | ||||||
Bayerische Motoren Werke AG Preference Shares | 123 | 10,095 | ||||||
Beiersdorf AG | 228 | 18,596 | ||||||
Brenntag AG | 349 | 19,638 | ||||||
Celesio AG | 115 | 3,718 | ||||||
Commerzbank AG(a) | 2,185 | 29,027 | ||||||
Continental AG | 339 | 71,988 | ||||||
Daimler AG | 2,736 | 228,266 | ||||||
Deutsche Annington Immobilien SE | 614 | 20,885 | ||||||
Deutsche Bank AG | 4,151 | 125,467 | ||||||
Deutsche Boerse AG | 436 | 31,246 | ||||||
Deutsche Lufthansa AG | 520 | 8,708 | ||||||
Deutsche Post AG | 2,904 | 95,015 | ||||||
Deutsche Telekom AG | 9,414 | 150,890 | ||||||
Deutsche Wohnen AG | 646 | 15,349 | ||||||
E.ON SE | 5,960 | 102,345 | ||||||
Fraport AG Frankfurt Airport Services Worldwide | 83 | 4,808 | ||||||
Fresenius Medical Care AG & Co. KGaA | 489 | 36,597 | ||||||
Fresenius SE & Co. KGaA | 1,189 | 62,090 | ||||||
Fuchis Petrolub SE Preference Shares | 160 | 6,444 | ||||||
GEA Group AG | 413 | 18,286 | ||||||
Hannover Rueck SE | 136 | 12,336 | ||||||
HeidelbergCement AG | 318 | 22,622 | ||||||
Henkel AG & Co. KGaA(d) | 264 | 25,707 | ||||||
Henkel AG & Co. KGaA(d) | 561 | 60,686 | ||||||
Hugo Boss AG | 72 | 8,840 | ||||||
Infineon Technologies AG | 2,546 | 27,296 | ||||||
K+S AG | 389 | 10,802 | ||||||
Kabel Deutschland Holding AG(a) | 50 | 6,800 | ||||||
Lanxess AG | 207 | 9,630 | ||||||
Linde AG | 554 | 103,332 | ||||||
MAN SE | 80 | 8,922 | ||||||
Merck KGaA | 292 | 27,701 | ||||||
Metro AG(a) | 366 | 11,206 | ||||||
Muenchener Rueckversicherungs-Gesellschaft AG in Muenchen | 515 | 103,176 | ||||||
OSRAM Licht AG(a) | 201 | 7,920 | ||||||
Porsche Automobil Holding SE Preference Shares | 346 | 28,113 | ||||||
ProSiebenSat.1 Media AG | 494 | 20,812 | ||||||
RWE AG | 1,105 | 34,595 | ||||||
See Notes to Financial Statements.
36
Table of Contents
State Street Global Equity ex-U.S. Index Portfolio
Portfolio of Investments — (continued)
December 31, 2014
Security Description | Shares | Value | ||||||
COMMON STOCKS – (continued) |
| |||||||
Germany – (continued) | ||||||||
SAP SE | 2,651 | $ | 187,440 | |||||
Siemens AG | 2,262 | 256,534 | ||||||
Symrise AG | 310 | 18,800 | ||||||
Telefonica Deutschland Holding AG | 1,261 | 6,734 | ||||||
ThyssenKrupp AG(a) | 1,022 | 26,286 | ||||||
United Internet AG | 263 | 11,927 | ||||||
Volkswagen AG | 67 | 14,599 | ||||||
Volkswagen AG Preference Shares | 483 | 107,889 | ||||||
|
| |||||||
| 3,123,817 | ||||||||
|
| |||||||
Greece – 0.2% | ||||||||
Eurobank Ergasias SA(a) | 56,090 | 12,464 | ||||||
Hellenic Telecommunications Organization SA(a) | 2,078 | 22,677 | ||||||
National Bank of Greece SA(a) | 11,861 | 21,071 | ||||||
OPAP SA | 1,974 | 21,094 | ||||||
Piraeus Bank SA(a) | 17,027 | 18,732 | ||||||
|
| |||||||
| 96,038 | ||||||||
|
| |||||||
Hong Kong – 3.3% | ||||||||
AIA Group, Ltd. | 34,800 | 190,954 | ||||||
ASM Pacific Technology, Ltd. | 500 | 4,753 | ||||||
Bank of East Asia, Ltd. | 2,800 | 11,248 | ||||||
Beijing Enterprises Holdings, Ltd. | 3,500 | 27,360 | ||||||
Belle International Holdings, Ltd. | 25,000 | 27,954 | ||||||
BOC Hong Kong Holdings, Ltd. | 8,500 | 28,245 | ||||||
Cathay Pacific Airways, Ltd. | 3,000 | 6,520 | ||||||
Chailease Holding Co., Ltd. | 12,000 | 29,756 | ||||||
Cheung Kong Holdings, Ltd. | 4,000 | 66,846 | ||||||
Cheung Kong Infrastructure Holdings, Ltd. | 1,000 | 7,389 | ||||||
China Everbright International, Ltd. | 12,000 | 17,841 | ||||||
China Merchants Holdings International Co., Ltd. | 10,090 | 33,756 | ||||||
China Mobile, Ltd. | 17,500 | 206,033 | ||||||
China Overseas Land & Investment, Ltd. | 14,000 | 41,405 | ||||||
China Resources Land, Ltd. | 16,000 | 42,097 | ||||||
China Resources Power Holdings Co., Ltd. | 10,000 | 25,739 | ||||||
China Unicom (Hong Kong), Ltd. | 18,000 | 24,108 | ||||||
CITIC, Ltd. | 17,000 | 28,808 | ||||||
CLP Holdings, Ltd. | 4,500 | 39,048 | ||||||
CNOOC, Ltd. | 55,000 | 74,399 | ||||||
COSCO Pacific, Ltd. | 22,000 | 31,216 | ||||||
First Pacific Co., Ltd. | 6,000 | 5,915 | ||||||
Galaxy Entertainment Group, Ltd. | 6,000 | 33,399 | ||||||
Guangdong Investment, Ltd. | 12,000 | 15,583 | ||||||
Hanergy Thin Film Power Group, Ltd. | 54,000 | 19,596 | ||||||
Hang Lung Properties, Ltd. | 5,000 | 13,934 | ||||||
Hang Seng Bank, Ltd. | 1,700 | 28,266 | ||||||
Henderson Land Development Co., Ltd. | 2,000 | 13,857 | ||||||
HKT Trust/HKT, Ltd. | 6,000 | 7,791 | ||||||
Hong Kong & China Gas Co., Ltd. | 14,000 | 31,806 | ||||||
Hong Kong Exchanges and Clearing, Ltd. | 3,400 | 74,794 | ||||||
Hutchison Whampoa, Ltd. | 9,000 | 103,150 | ||||||
Hysan Development Co., Ltd. | 1,000 | 4,443 | ||||||
Li & Fung, Ltd. | 14,000 | 13,092 | ||||||
MTR Corp., Ltd. | 3,500 | 14,294 | ||||||
New World Development Co., Ltd. | 12,000 | 13,726 | ||||||
Noble Group, Ltd. | 10,000 | 8,582 | ||||||
NWS Holdings, Ltd. | 3,000 | 5,486 | ||||||
PCCW, Ltd. | 9,000 | 6,154 | ||||||
Power Assets Holdings, Ltd. | 3,000 | 28,962 | ||||||
Sands China, Ltd. | 5,600 | 27,272 | ||||||
Shangri-La Asia, Ltd. | 4,000 | 5,494 | ||||||
SJM Holdings, Ltd. | 4,000 | 6,295 | ||||||
Sun Hung Kai Properties, Ltd. | 4,000 | 60,484 | ||||||
Swire Pacific, Ltd. | 1,500 | 19,431 | ||||||
Swire Properties, Ltd. | 2,600 | 7,690 | ||||||
Techtronic Industries Co., Ltd. | 3,000 | 9,614 | ||||||
The Link REIT | 5,000 | 31,179 | ||||||
The Wharf Holdings, Ltd. | 3,000 | 21,543 | ||||||
Wheelock & Co., Ltd. | 2,000 | 9,286 | ||||||
Wynn Macau, Ltd. | 3,600 | 10,059 | ||||||
Yangzijiang Shipbuilding Holdings, Ltd. | 4,000 | 3,632 | ||||||
Yue Yuen Industrial Holdings, Ltd. | 1,500 | 5,391 | ||||||
Yuexiu Property Co., Ltd. | 142,000 | 27,356 | ||||||
|
| |||||||
| 1,653,031 | ||||||||
|
| |||||||
India – 0.6% | ||||||||
GAIL India, Ltd. GDR | 400 | 16,899 | ||||||
ICICI Bank, Ltd. ADR | 1,500 | 17,325 | ||||||
Infosys, Ltd. ADR | 3,000 | 94,380 | ||||||
Larsen & Toubro, Ltd. GDR | 750 | 17,475 | ||||||
Mahindra & Mahindra Financial Services, Ltd. GDR | 763 | 14,937 | ||||||
Reliance Industries, Ltd. GDR(c) | 1,500 | 42,300 | ||||||
Reliance Infrastructure, Ltd. GDR | 400 | 9,800 | ||||||
Sesa Sterlite, Ltd. ADR | 700 | 9,506 | ||||||
State Bank of India GDR | 520 | 25,662 | ||||||
Tata Motors, Ltd. ADR | 400 | 16,912 | ||||||
Tata Steel, Ltd. GDR | 1,300 | 8,036 | ||||||
Wipro, Ltd. ADR | 1,200 | 13,584 | ||||||
|
| |||||||
| 286,816 | ||||||||
|
| |||||||
Indonesia – 0.8% | ||||||||
Astra International Tbk PT | 85,000 | 50,453 | ||||||
Bank Central Asia Tbk PT | 46,000 | 48,401 | ||||||
Bank Mandiri Persero Tbk PT | 45,000 | 38,842 | ||||||
Bank Negara Indonesia Persero Tbk PT | 91,500 | 44,679 | ||||||
Bank Rakyat Indonesia Persero Tbk PT | 45,500 | 42,368 | ||||||
Indofood Sukses Makmur Tbk PT | 57,000 | 31,075 | ||||||
Jasa Marga Persero Tbk PT | 58,500 | 33,011 | ||||||
Perusahaan Gas Negara Persero Tbk PT | 58,000 | 27,938 | ||||||
Semen Indonesia Persero Tbk PT | 21,500 | 27,932 | ||||||
Telekomunikasi Indonesia Persero Tbk PT | 190,500 | 43,721 | ||||||
Unilever Indonesia Tbk PT | 7,000 | 18,264 | ||||||
|
| |||||||
| 406,684 | ||||||||
|
| |||||||
Ireland – 0.2% | ||||||||
Bank of Ireland(a) | 62,116 | 23,160 | ||||||
CRH PLC | 1,669 | 40,155 | ||||||
James Hardie Industries PLC | 1,006 | 10,737 | ||||||
Kerry Group PLC | 357 | 24,632 | ||||||
See Notes to Financial Statements.
37
Table of Contents
State Street Global Equity ex-U.S. Index Portfolio
Portfolio of Investments — (continued)
December 31, 2014
Security Description | Shares | Value | ||||||
COMMON STOCKS – (continued) |
| |||||||
Ireland – (continued) | ||||||||
Ryanair Holdings PLC ADR(a) | 406 | $ | 4,812 | |||||
|
| |||||||
| 103,496 | ||||||||
|
| |||||||
Israel – 0.4% | ||||||||
Bank Hapoalim BM | 2,384 | 11,270 | ||||||
Bank Leumi Le-Israel BM(a) | 2,994 | 10,295 | ||||||
Bezeq The Israeli Telecommunication Corp., Ltd. | 4,322 | 7,702 | ||||||
Delek Group, Ltd. | 11 | 2,767 | ||||||
Israel Chemicals, Ltd. | 1,006 | 7,273 | ||||||
Israel Corp., Ltd. (The)(a) | 6 | 2,858 | ||||||
Mizrahi Tefahot Bank, Ltd.(a) | 312 | 3,280 | ||||||
NICE Systems, Ltd. | 128 | 6,495 | ||||||
Teva Pharmaceutical Industries, Ltd. | 2,504 | 144,200 | ||||||
|
| |||||||
| 196,140 | ||||||||
|
| |||||||
Italy – 1.4% | ||||||||
Assicurazioni Generali SpA | 3,588 | 73,322 | ||||||
Atlantia SpA | 932 | 21,647 | ||||||
Banca Monte dei Paschi di Siena SpA(a) | 9,820 | 5,584 | ||||||
Banco Popolare(a) | 818 | 9,792 | ||||||
Enel Green Power SpA | 3,951 | 8,209 | ||||||
Enel SpA | 19,861 | 88,803 | ||||||
Eni SpA | 7,424 | 129,662 | ||||||
Exor SpA | 222 | 9,057 | ||||||
Finmeccanica Finance SpA(a) | 914 | 8,487 | ||||||
Intesa Sanpaolo SpA | 34,698 | 100,376 | ||||||
Intesa Sanpaolo SpA Preference Shares | 2,106 | 5,184 | ||||||
Luxottica Group SpA | 378 | 20,695 | ||||||
Mediobanca SpA | 1,362 | 11,028 | ||||||
Pirelli & C. SpA | 537 | 7,212 | ||||||
Prysmian SpA | 461 | 8,391 | ||||||
Saipem SpA(a) | 598 | 6,280 | ||||||
Snam SpA | 4,582 | 22,604 | ||||||
Telecom Italia SpA(a)(d) | 22,723 | 24,098 | ||||||
Telecom Italia SpA(d) | 13,607 | 11,373 | ||||||
Terna Rete Elettrica Nazionale SpA | 3,404 | 15,420 | ||||||
UniCredit SpA | 13,309 | 84,825 | ||||||
Unione di Banche Italiane SCpA | 1,934 | 13,767 | ||||||
UnipolSai SpA | 2,056 | 5,509 | ||||||
|
| |||||||
| 691,325 | ||||||||
|
| |||||||
Japan – 13.7% | ||||||||
ABC-Mart, Inc. | 100 | 4,841 | ||||||
Acom Co., Ltd.(a) | 900 | 2,736 | ||||||
Advantest Corp. | 400 | 4,979 | ||||||
Aeon Co., Ltd. | 1,400 | 14,078 | ||||||
AEON Financial Service Co., Ltd. | 300 | 5,859 | ||||||
Aeon Mall Co., Ltd. | 300 | 5,300 | ||||||
Aisin Seiki Co., Ltd. | 400 | 14,363 | ||||||
Ajinomoto Co., Inc. | 2,000 | 37,024 | ||||||
Alfresa Holdings Corp. | 400 | 4,830 | ||||||
Amada Co., Ltd. | 800 | 6,852 | ||||||
ANA Holdings, Inc. | 3,000 | 7,377 | ||||||
Aozora Bank, Ltd. | 3,000 | 9,302 | ||||||
Asahi Glass Co., Ltd. | 2,000 | 9,757 | ||||||
Asahi Group Holdings, Ltd. | 900 | 27,753 | ||||||
Asahi Kasei Corp. | 3,000 | 27,467 | ||||||
Asics Corp. | 400 | 9,550 | ||||||
Astellas Pharma, Inc. | 5,400 | 75,083 | ||||||
Bandai Namco Holdings, Inc. | 400 | 8,482 | ||||||
Bank of Kyoto, Ltd. (The) | 1,000 | 8,356 | ||||||
Bank of Yokohama, Ltd. (The) | 3,000 | 16,267 | ||||||
Benesse Holdings, Inc. | 200 | 5,935 | ||||||
Bridgestone Corp. | 2,000 | 69,435 | ||||||
Brother Industries, Ltd. | 500 | 9,063 | ||||||
Calbee, Inc. | 200 | 6,898 | ||||||
Canon, Inc. | 2,900 | 92,021 | ||||||
Casio Computer Co., Ltd. | 500 | 7,671 | ||||||
Central Japan Railway Co. | 400 | 59,951 | ||||||
Chubu Electric Power Co., Inc.(a) | 1,500 | 17,630 | ||||||
Chugai Pharmaceutical Co., Ltd. | 500 | 12,279 | ||||||
Chugoku Bank, Ltd. (The) | 400 | 5,456 | ||||||
Chugoku Electric Power Co., Inc. (The) | 700 | 9,158 | ||||||
Citizen Holdings Co., Ltd. | 600 | 4,612 | ||||||
Credit Saison Co., Ltd. | 300 | 5,576 | ||||||
Dai Nippon Printing Co., Ltd. | 1,000 | 9,017 | ||||||
Dai-ichi Life Insurance Co., Ltd. (The) | 3,500 | 53,061 | ||||||
Daicel Corp. | 1,000 | 11,697 | ||||||
Daihatsu Motor Co., Ltd. | 400 | 5,242 | ||||||
Daiichi Sankyo Co., Ltd. | 1,400 | 19,554 | ||||||
Daikin Industries, Ltd. | 600 | 38,661 | ||||||
Daito Trust Construction Co., Ltd. | 200 | 22,623 | ||||||
Daiwa House Industry Co., Ltd. | 1,300 | 24,593 | ||||||
Daiwa Securities Group, Inc. | 4,000 | 31,121 | ||||||
Denso Corp. | 1,200 | 55,873 | ||||||
Dentsu, Inc. | 500 | 21,022 | ||||||
Don Quijote Holdings Co., Ltd. | 100 | 6,824 | ||||||
East Japan Railway Co. | 1,000 | 74,849 | ||||||
Eisai Co., Ltd. | 600 | 23,226 | ||||||
Electric Power Development Co., Ltd. | 300 | 10,145 | ||||||
FamilyMart Co., Ltd. | 100 | 3,730 | ||||||
FANUC Corp. | 600 | 98,928 | ||||||
Fast Retailing Co., Ltd. | 200 | 72,796 | ||||||
Fuji Electric Co., Ltd. | 1,000 | 3,985 | ||||||
Fuji Heavy Industries, Ltd. | 1,500 | 52,772 | ||||||
FUJIFILM Holdings Corp. | 1,000 | 30,150 | ||||||
Fujitsu, Ltd. | 4,000 | 21,287 | ||||||
Fukuoka Financial Group, Inc. | 2,000 | 10,316 | ||||||
GungHo Online Entertainment, Inc.(a) | 900 | 3,278 | ||||||
Gunma Bank, Ltd. (The) | 1,000 | 6,480 | ||||||
Hachijuni Bank, Ltd. (The) | 1,000 | 6,431 | ||||||
Hakuhodo DY Holdings, Inc. | 500 | 4,788 | ||||||
Hamamatsu Photonics KK | 200 | 9,548 | ||||||
Hankyu Hanshin Holdings, Inc. | 3,000 | 16,125 | ||||||
Hino Motors, Ltd. | 600 | 7,842 | ||||||
Hirose Electric Co., Ltd. | 100 | 11,630 | ||||||
Hiroshima Bank, Ltd. (The) | 1,000 | 4,749 | ||||||
Hisamitsu Pharmaceutical Co., Inc. | 100 | 3,136 | ||||||
Hitachi Chemical Co., Ltd. | 200 | 3,539 | ||||||
Hitachi Construction Machinery Co., Ltd. | 200 | 4,236 | ||||||
Hitachi High-Technologies Corp. | 100 | 2,883 | ||||||
Hitachi Metals, Ltd. | 1,000 | 17,013 | ||||||
Hitachi, Ltd. | 14,000 | 102,343 | ||||||
Hokuhoku Financial Group, Inc. | 3,000 | 6,058 | ||||||
Hokuriku Electric Power Co. | 400 | 5,103 | ||||||
See Notes to Financial Statements.
38
Table of Contents
State Street Global Equity ex-U.S. Index Portfolio
Portfolio of Investments — (continued)
December 31, 2014
Security Description | Shares | Value | ||||||
COMMON STOCKS – (continued) |
| |||||||
Japan – (continued) | ||||||||
Honda Motor Co., Ltd. | 4,800 | $ | 139,449 | |||||
Hoya Corp. | 1,000 | 33,449 | ||||||
Hulic Co., Ltd. | 500 | 4,966 | ||||||
Ibiden Co., Ltd. | 300 | 4,405 | ||||||
Idemitsu Kosan Co., Ltd. | 200 | 3,311 | ||||||
IHI Corp. | 3,000 | 15,217 | ||||||
Inpex Corp. | 2,000 | 22,169 | ||||||
Isetan Mitsukoshi Holdings, Ltd. | 800 | 9,798 | ||||||
Isuzu Motors, Ltd. | 1,500 | 18,283 | ||||||
ITOCHU Corp. | 3,400 | 36,317 | ||||||
Itochu Techno-Solutions Corp. | 100 | 3,540 | ||||||
Iyo Bank, Ltd. (The) | 500 | 5,414 | ||||||
J Front Retailing Co., Ltd. | 500 | 5,817 | ||||||
Japan Airlines Co., Ltd. | 1,000 | 29,183 | ||||||
Japan Display, Inc.(a) | 1,000 | 3,056 | ||||||
Japan Exchange Group, Inc. | 600 | 13,966 | ||||||
Japan Prime Realty Investment Corp. REIT | 2 | 6,936 | ||||||
Japan Real Estate Investment Corp. REIT | 3 | 14,424 | ||||||
Japan Retail Fund Investment Corp. REIT | 5 | 10,534 | ||||||
Japan Tobacco, Inc. | 2,800 | 76,809 | ||||||
JFE Holdings, Inc. | 1,100 | 24,461 | ||||||
JGC Corp. | 1,000 | 20,589 | ||||||
Joyo Bank, Ltd. (The) | 2,000 | 9,915 | ||||||
JSR Corp. | 400 | 6,862 | ||||||
JTEKT Corp. | 500 | 8,460 | ||||||
JX Holdings, Inc. | 5,100 | 19,850 | ||||||
Kajima Corp. | 2,000 | 8,258 | ||||||
Kakaku.com, Inc. | 300 | 4,309 | ||||||
Kamigumi Co., Ltd. | 1,000 | 8,885 | ||||||
Kaneka Corp. | 1,000 | 5,372 | ||||||
Kansai Electric Power Co., Inc. (The)(a) | 1,600 | 15,207 | ||||||
Kansai Paint Co., Ltd. | 1,000 | 15,440 | ||||||
Kao Corp. | 1,200 | 47,294 | ||||||
Kawasaki Heavy Industries, Ltd. | 3,000 | 13,687 | ||||||
KDDI Corp. | 1,500 | 93,765 | ||||||
Keikyu Corp. | 1,000 | 7,399 | ||||||
Keio Corp. | 1,000 | 7,170 | ||||||
Keisei Electric Railway Co., Ltd. | 1,000 | 12,183 | ||||||
Keyence Corp. | 100 | 44,251 | ||||||
Kikkoman Corp. | 1,000 | 24,510 | ||||||
Kintetsu Corp. | 4,000 | 13,180 | ||||||
Kirin Holdings Co., Ltd. | 1,900 | 23,513 | ||||||
Kobe Steel, Ltd. | 7,000 | 12,097 | ||||||
Koito Manufacturing Co., Ltd. | 200 | 6,094 | ||||||
Komatsu, Ltd. | 2,400 | 53,156 | ||||||
Konami Corp. | 200 | 3,684 | ||||||
Konica Minolta, Inc. | 1,100 | 11,854 | ||||||
Kubota Corp. | 3,000 | 43,522 | ||||||
Kuraray Co., Ltd. | 800 | 9,112 | ||||||
Kurita Water Industries, Ltd. | 200 | 4,174 | ||||||
Kyocera Corp. | 700 | 32,053 | ||||||
Kyowa Hakko Kirin Co., Ltd. | 1,000 | 9,404 | ||||||
Kyushu Electric Power Co., Inc.(a) | 1,000 | 10,005 | ||||||
Lawson, Inc. | 100 | 6,041 | ||||||
LIXIL Group Corp. | 600 | 12,677 | ||||||
M3, Inc. | 400 | 6,645 | ||||||
Mabuchi Motor Co., Ltd. | 200 | 7,874 | ||||||
Makita Corp. | 300 | 13,560 | ||||||
Marubeni Corp. | 3,700 | 22,158 | ||||||
Marui Group Co., Ltd. | 500 | 4,518 | ||||||
Maruichi Steel Tube, Ltd. | 100 | 2,128 | ||||||
Mazda Motor Corp. | 1,200 | 28,777 | ||||||
McDonald’s Holdings Co. (Japan), Ltd. | 200 | 4,371 | ||||||
Medipal Holdings Corp. | 300 | 3,481 | ||||||
MEIJI Holdings Co., Ltd. | 100 | 9,099 | ||||||
Minebea Co., Ltd. | 1,000 | 14,623 | ||||||
Miraca Holdings, Inc. | 100 | 4,305 | ||||||
Mitsubishi Chemical Holdings Corp. | 3,100 | 15,082 | ||||||
Mitsubishi Corp. | 3,600 | 65,960 | ||||||
Mitsubishi Electric Corp. | 5,000 | 59,473 | ||||||
Mitsubishi Estate Co., Ltd. | 4,000 | 84,576 | ||||||
Mitsubishi Gas Chemical Co., Inc. | 1,000 | 5,019 | ||||||
Mitsubishi Heavy Industries, Ltd. | 7,000 | 38,667 | ||||||
Mitsubishi Materials Corp. | 3,000 | 9,963 | ||||||
Mitsubishi Motors Corp. | 1,400 | 12,813 | ||||||
Mitsubishi Tanabe Pharma Corp. | 500 | 7,320 | ||||||
Mitsubishi UFJ Financial Group, Inc. | 36,300 | 198,775 | ||||||
Mitsubishi UFJ Lease & Finance Co., Ltd. | 1,100 | 5,193 | ||||||
Mitsui & Co., Ltd. | 4,300 | 57,428 | ||||||
Mitsui Chemicals, Inc. | 2,000 | 5,676 | ||||||
Mitsui Fudosan Co., Ltd. | 3,000 | 80,609 | ||||||
Mitsui OSK Lines, Ltd. | 2,000 | 5,935 | ||||||
Mizuho Financial Group, Inc. | 71,100 | 119,355 | ||||||
MS&AD Insurance Group Holdings, Inc. | 1,100 | 26,102 | ||||||
Murata Manufacturing Co., Ltd. | 500 | 54,564 | ||||||
Nabtesco Corp. | 300 | 7,195 | ||||||
Nagoya Railroad Co., Ltd. | 2,000 | 7,440 | ||||||
NEC Corp. | 6,000 | 17,475 | ||||||
Nexon Co., Ltd. | 300 | 2,795 | ||||||
NGK Insulators, Ltd. | 1,000 | 20,576 | ||||||
NGK Spark Plug Co., Ltd. | 400 | 12,067 | ||||||
NH Foods, Ltd. | 1,000 | 21,852 | ||||||
NHK Spring Co., Ltd. | 400 | 3,487 | ||||||
Nidec Corp. | 500 | 32,400 | ||||||
Nikon Corp. | 800 | 10,612 | ||||||
Nintendo Co., Ltd. | 300 | 31,236 | ||||||
Nippon Building Fund, Inc. REIT | 3 | 15,016 | ||||||
Nippon Electric Glass Co., Ltd. | 1,000 | 4,504 | ||||||
Nippon Express Co., Ltd. | 2,000 | 10,162 | ||||||
Nippon Paint Holdings Co., Ltd. | 1,000 | 28,998 | ||||||
Nippon Prologis REIT, Inc. | 3 | 6,498 | ||||||
Nippon Steel & Sumitomo Metal Corp. | 19,000 | 47,107 | ||||||
Nippon Telegraph & Telephone Corp. | 900 | 46,268 | ||||||
Nippon Yusen KK | 4,000 | 11,303 | ||||||
Nissan Motor Co., Ltd. | 6,300 | 54,822 | ||||||
Nisshin Seifun Group, Inc. | 400 | �� | 3,872 | |||||
Nissin Foods Holdings Co., Ltd. | 100 | 4,781 | ||||||
Nitori Holdings Co., Ltd. | 200 | 10,737 | ||||||
Nitto Denko Corp. | 400 | 22,348 | ||||||
NOK Corp. | 200 | 5,075 | ||||||
Nomura Holdings, Inc. | 9,200 | 52,303 | ||||||
Nomura Real Estate Holdings, Inc. | 300 | 5,150 | ||||||
See Notes to Financial Statements.
39
Table of Contents
State Street Global Equity ex-U.S. Index Portfolio
Portfolio of Investments — (continued)
December 31, 2014
Security Description | Shares | Value | ||||||
COMMON STOCKS – (continued) |
| |||||||
Japan – (continued) | ||||||||
Nomura Research Institute, Ltd. | 300 | $ | 9,203 | |||||
NSK, Ltd. | 1,000 | 11,832 | ||||||
NTT Data Corp. | 300 | 11,204 | ||||||
NTT DoCoMo, Inc. | 3,900 | 57,034 | ||||||
NTT Urban Development Corp. | 300 | 3,007 | ||||||
Obayashi Corp. | 1,000 | 6,421 | ||||||
Odakyu Electric Railway Co., Ltd. | 1,000 | 8,865 | ||||||
OJII Holdings Corp. | 2,000 | 7,170 | ||||||
Olympus Corp.(a) | 500 | 17,601 | ||||||
Omron Corp. | 500 | 22,389 | ||||||
Ono Pharmaceutical Co., Ltd. | 200 | 17,705 | ||||||
Oracle Corp. Japan | 100 | 4,070 | ||||||
Oriental Land Co., Ltd. | 100 | 22,910 | ||||||
ORIX Corp. | 3,000 | 37,467 | ||||||
Osaka Gas Co., Ltd. | 4,000 | 14,936 | ||||||
Otsuka Corp. | 100 | 3,162 | ||||||
Otsuka Holdings Co., Ltd. | 900 | 26,967 | ||||||
Panasonic Corp. | 5,600 | 65,729 | ||||||
Park24 Co., Ltd. | 200 | 2,942 | ||||||
Rakuten, Inc.(a) | 1,800 | 25,037 | ||||||
Recruit Holdings Co., Ltd.(a) | 1,000 | 28,284 | ||||||
Resona Holdings, Inc. | 5,000 | 25,211 | ||||||
Ricoh Co., Ltd. | 1,600 | 16,238 | ||||||
Rinnai Corp. | 100 | 6,727 | ||||||
Rohm Co., Ltd. | 200 | 12,122 | ||||||
Sankyo Co., Ltd. | 100 | 3,443 | ||||||
Sanrio Co., Ltd. | 100 | 2,485 | ||||||
Santen Pharmaceutical Co., Ltd. | 200 | 10,693 | ||||||
SBI Holdings, Inc. | 500 | 5,424 | ||||||
Secom Co., Ltd. | 500 | 28,699 | ||||||
Sega Sammy Holdings, Inc. | 400 | 5,127 | ||||||
Seiko Epson Corp. | 300 | 12,589 | ||||||
Sekisui Chemical Co., Ltd. | 1,000 | 12,027 | ||||||
Sekisui House, Ltd. | 1,200 | 15,702 | ||||||
Seven & I Holdings Co., Ltd. | 1,900 | 68,469 | ||||||
Seven Bank, Ltd. | 1,300 | 5,466 | ||||||
Sharp Corp.(a) | 3,000 | 6,642 | ||||||
Shikoku Electric Power Co., Inc.(a) | 400 | 4,844 | ||||||
Shimadzu Corp. | 1,000 | 10,167 | ||||||
Shimano, Inc. | 200 | 25,845 | ||||||
Shimizu Corp. | 1,000 | 6,803 | ||||||
Shin-Etsu Chemical Co., Ltd. | 1,200 | 77,994 | ||||||
Shinsei Bank, Ltd. | 4,000 | 6,977 | ||||||
Shionogi & Co., Ltd. | 700 | 18,116 | ||||||
Shiseido Co., Ltd. | 800 | 11,192 | ||||||
Shizuoka Bank, Ltd. (The) | 1,000 | 9,138 | ||||||
Showa Shell Sekiyu KK | 400 | 3,938 | ||||||
SMC Corp. | 200 | 52,031 | ||||||
SoftBank Corp. | 2,800 | 166,474 | ||||||
Sompo Japan Nipponkoa Holdings, Inc. | 800 | 20,085 | ||||||
Sony Corp. | 3,300 | 67,120 | ||||||
Sony Financial Holdings, Inc. | 400 | 5,893 | ||||||
Stanley Electric Co., Ltd. | 300 | 6,478 | ||||||
Sumitomo Chemical Co., Ltd. | 3,000 | 11,866 | ||||||
Sumitomo Corp. | 2,500 | 25,653 | ||||||
Sumitomo Dainippon Pharma Co., Ltd. | 400 | 3,884 | ||||||
Sumitomo Electric Industries, Ltd. | 1,700 | 21,190 | ||||||
Sumitomo Heavy Industries, Ltd. | 1,000 | 5,369 | ||||||
Sumitomo Metal Mining Co., Ltd. | 1,000 | 14,908 | ||||||
Sumitomo Mitsui Financial Group, Inc. | 3,800 | 137,172 | ||||||
Sumitomo Mitsui Trust Holdings, Inc. | 8,000 | 30,502 | ||||||
Sumitomo Realty & Development Co., Ltd. | 1,000 | 34,033 | ||||||
Sumitomo Rubber Industries, Ltd. | 400 | 5,950 | ||||||
Suntory Beverage & Food, Ltd. | 1,000 | 34,495 | ||||||
Suruga Bank, Ltd. | 400 | 7,322 | ||||||
Suzuken Co. Ltd/Aichi Japan | 200 | 5,522 | ||||||
Suzuki Motor Corp. | 800 | 24,026 | ||||||
Sysmex Corp. | 300 | 13,296 | ||||||
T&D Holdings, Inc. | 1,300 | 15,625 | ||||||
Taiheiyo Cement Corp. | 3,000 | 9,431 | ||||||
Taisei Corp. | 2,000 | 11,374 | ||||||
Taisho Pharmaceutical Holdings Co., Ltd. | 100 | 6,094 | ||||||
Takashimaya Co., Ltd. | 1,000 | 8,012 | ||||||
Takeda Pharmaceutical Co., Ltd. | 2,000 | 82,912 | ||||||
TDK Corp. | 300 | 17,659 | ||||||
Teijin, Ltd. | 2,000 | 5,321 | ||||||
Terumo Corp. | 700 | 15,927 | ||||||
The Chiba Bank, Ltd. | 2,000 | 13,114 | ||||||
THK Co., Ltd. | 300 | 7,236 | ||||||
Tobu Railway Co., Ltd. | 2,000 | 8,539 | ||||||
Toho Co., Ltd. | 300 | 6,801 | ||||||
Toho Gas Co., Ltd. | 1,000 | 4,896 | ||||||
Tohoku Electric Power Co., Inc. | 1,000 | 11,605 | ||||||
Tokio Marine Holdings, Inc. | 2,100 | 68,132 | ||||||
Tokyo Electric Power Co., Inc.(a) | 3,300 | 13,434 | ||||||
Tokyo Electron, Ltd. | 400 | 30,326 | ||||||
Tokyo Gas Co., Ltd. | 6,000 | 32,346 | ||||||
Tokyo Tatemono Co., Ltd. | 1,000 | 7,276 | ||||||
Tokyu Corp. | 3,000 | 18,593 | ||||||
Tokyu Fudosan Holdings Corp. | 1,100 | 7,572 | ||||||
TonenGeneral Sekiyu KK | 1,000 | 8,540 | ||||||
Toppan Printing Co., Ltd. | 1,000 | 6,504 | ||||||
Toray Industries, Inc. | 3,000 | 24,004 | ||||||
Toshiba Corp. | 9,000 | 38,073 | ||||||
TOTO, Ltd. | 1,000 | 11,620 | ||||||
Toyo Seikan Group Holdings, Ltd. | 400 | 4,930 | ||||||
Toyoda Gosei Co., Ltd. | 100 | 2,017 | ||||||
Toyota Industries Corp. | 400 | 20,419 | ||||||
Toyota Motor Corp. | 7,700 | 479,716 | ||||||
Toyota Tsusho Corp. | 500 | 11,545 | ||||||
Trend Micro, Inc.(a) | 200 | 5,467 | ||||||
Unicharm Corp. | 900 | 21,637 | ||||||
United Urban Investment Corp. REIT | 6 | 9,415 | ||||||
USS Co., Ltd. | 500 | 7,687 | ||||||
West Japan Railway Co. | 400 | 18,936 | ||||||
Yahoo! Japan Corp. | 3,200 | 11,536 | ||||||
Yakult Honsha Co., Ltd. | 200 | 10,545 | ||||||
Yamada Denki Co., Ltd. | 2,000 | 6,669 | ||||||
Yamaha Corp. | 400 | 5,936 | ||||||
Yamaha Motor Co., Ltd. | 600 | 12,055 | ||||||
Yamato Holdings Co., Ltd. | 800 | 15,737 | ||||||
Yamato Kogyo Co., Ltd. | 100 | 2,809 | ||||||
Yaskawa Electric Corp. | 500 | 6,389 | ||||||
Yokogawa Electric Corp. | 500 | 5,499 | ||||||
|
| |||||||
| 6,757,391 | ||||||||
|
| |||||||
See Notes to Financial Statements.
40
Table of Contents
State Street Global Equity ex-U.S. Index Portfolio
Portfolio of Investments — (continued)
December 31, 2014
Security Description | Shares | Value | ||||||
COMMON STOCKS – (continued) |
| |||||||
Luxembourg – 0.2% | ||||||||
Altice SA(a) | 196 | $ | 15,467 | |||||
ArcelorMittal | 2,257 | 24,446 | ||||||
Millicom International Cellular SA | 150 | 11,109 | ||||||
RTL Group SA(a) | 88 | 8,363 | ||||||
SES SA | 686 | 24,607 | ||||||
Subsea 7 SA | 635 | 6,437 | ||||||
Tenaris SA | 1,066 | 16,101 | ||||||
|
| |||||||
| 106,530 | ||||||||
|
| |||||||
Macau – 0.0%(b) | ||||||||
MGM China Holdings, Ltd. | 2,000 | 5,042 | ||||||
|
| |||||||
| 5,042 | ||||||||
|
| |||||||
Mexico – 1.3% | ||||||||
Alfa SAB de CV (Class A) | 9,300 | 20,802 | ||||||
America Movil SAB de CV | 100,200 | 111,758 | ||||||
Arca Continental SAB de CV | 4,100 | 25,938 | ||||||
Cemex SAB de CV(a) | 27,400 | 27,995 | ||||||
Coca-Cola Femsa SAB de CV | 2,800 | 24,253 | ||||||
Controladora Comercial Mexicana SAB de CV | 8,100 | 28,543 | ||||||
Fibra Uno Administracion SA de CV REIT | 8,500 | 25,085 | ||||||
Fomento Economico Mexicano SAB de CV | 4,600 | 40,839 | ||||||
Grupo Bimbo SAB de CV(a) | 9,800 | 26,974 | ||||||
Grupo Carso SAB de CV | 5,000 | 24,688 | ||||||
Grupo Financiero Banorte SAB de CV | 7,000 | 38,715 | ||||||
Grupo Financiero Inbursa SAB de CV | 10,000 | 25,964 | ||||||
Grupo Financiero Santander Mexico SAB de CV (Class B) | 12,300 | 25,710 | ||||||
Grupo Mexico S.A.B. de CV | 11,300 | 32,804 | ||||||
Grupo Televisa SAB de CV | 7,400 | 50,686 | ||||||
Kimberly-Clark de Mexico SAB de CV (Class A) | 12,500 | 27,231 | ||||||
Mexichem SAB de CV(a) | 7,300 | 22,069 | ||||||
Promotora y Operadora de Infraestructura SAB de CV(a) | 2,200 | 26,553 | ||||||
Wal-Mart de Mexico SAB de CV | 11,100 | 23,895 | ||||||
|
| |||||||
| 630,502 | ||||||||
|
| |||||||
Morocco – 0.6% | ||||||||
AMMB Holdings Bhd | 9,500 | 17,906 | ||||||
Axiata Group Bhd | 10,800 | 21,752 | ||||||
CIMB Group Holdings Bhd | 12,600 | 20,019 | ||||||
DiGi.Com Bhd | 7,900 | 13,894 | ||||||
Genting Bhd | 5,200 | 13,182 | ||||||
Genting Malaysia Bhd | 14,600 | 16,956 | ||||||
IHH Healthcare Bhd | 12,100 | 16,651 | ||||||
IOI Corp. Bhd | 13,700 | 18,783 | ||||||
Malayan Banking Bhd | 11,500 | 30,072 | ||||||
Maxis Bhd | 9,000 | 17,569 | ||||||
Petronas Chemicals Group Bhd | 12,600 | 19,601 | ||||||
Petronas Gas Bhd | 3,100 | 19,641 | ||||||
Public Bank Bhd | 6,900 | 36,089 | ||||||
Sime Darby Bhd | 7,700 | 20,204 | ||||||
Tenaga Nasional Bhd | 7,100 | 27,980 | ||||||
|
| |||||||
| 310,299 | ||||||||
|
| |||||||
Netherlands – 2.0% | ||||||||
Aegon NV | 4,091 | 30,695 | ||||||
Airbus Group NV | 1,773 | 88,060 | ||||||
Akzo Nobel NV | 545 | 37,793 | ||||||
ASML Holding NV | 1,060 | 113,565 | ||||||
Boskalis Westminster NV | 196 | 10,716 | ||||||
CNH Industrial NV | 2,138 | 17,235 | ||||||
Corio NV REIT | 160 | 7,808 | ||||||
Delta Lloyd NV | 460 | 10,110 | ||||||
Gemalto NV | 179 | 14,622 | ||||||
Heineken Holding NV | 227 | 14,229 | ||||||
Heineken NV | 520 | 36,940 | ||||||
ING Groep NV(a) | 11,377 | 147,305 | ||||||
Koninklijke (Royal) KPN NV | 7,232 | 22,801 | ||||||
Koninklijke Ahold NV | 2,100 | 37,330 | ||||||
Koninklijke DSM NV | 390 | 23,715 | ||||||
Koninklijke Philips NV | 2,903 | 84,289 | ||||||
Koninklijke Vopak NV | 159 | 8,237 | ||||||
NN Group NV(a) | 577 | 17,193 | ||||||
OCI NV(a) | 190 | 6,594 | ||||||
QIAGEN NV(a) | 527 | 12,341 | ||||||
Randstad Holding NV | 285 | 13,706 | ||||||
Reed Elsevier NV | 1,577 | 37,688 | ||||||
STMicroelectronics NV | 1,439 | 10,731 | ||||||
TNT Express NV | 994 | 6,604 | ||||||
Unilever NV | 4,710 | 185,022 | ||||||
Wolters Kluwer NV | 682 | 20,825 | ||||||
|
| |||||||
| 1,016,154 | ||||||||
|
| |||||||
New Zealand – 0.1% | ||||||||
Auckland International Airport, Ltd. | 2,150 | 7,090 | ||||||
Contact Energy, Ltd. | 828 | 4,129 | ||||||
Fletcher Building, Ltd. | 1,553 | 10,037 | ||||||
Ryman Healthcare, Ltd. | 847 | 5,634 | ||||||
Spark New Zealand, Ltd. | 4,276 | 10,381 | ||||||
|
| |||||||
| 37,271 | ||||||||
|
| |||||||
Norway – 0.4% | ||||||||
DNB ASA | 2,207 | 32,347 | ||||||
Gjensidige Forsikring ASA | 452 | 7,319 | ||||||
Norsk Hydro ASA | 3,037 | 16,980 | ||||||
Orkla ASA | 1,841 | 12,472 | ||||||
Seadrill, Ltd. | 848 | 9,704 | ||||||
Statoil ASA | 3,499 | 60,954 | ||||||
Telenor ASA | 1,712 | 34,315 | ||||||
Yara International ASA | 409 | 18,182 | ||||||
|
| |||||||
| 192,273 | ||||||||
|
| |||||||
Peru – 0.1% | ||||||||
Credicorp, Ltd. | 200 | 32,036 | ||||||
|
| |||||||
| 32,036 | ||||||||
|
| |||||||
Philippines – 0.3% | ||||||||
Ayala Land, Inc. | 48,300 | 36,188 | ||||||
BDO Unibank, Inc. | 7,460 | 18,247 | ||||||
JG Summit Holdings, Inc. | 11,800 | 17,325 | ||||||
Philippine Long Distance Telephone Co. | 570 | 36,783 | ||||||
Universal Robina Corp. | 4,090 | 17,814 | ||||||
|
| |||||||
| 126,357 | ||||||||
|
| |||||||
Poland – 0.5% | ||||||||
Bank Pekao SA | 522 | 26,167 | ||||||
See Notes to Financial Statements.
41
Table of Contents
State Street Global Equity ex-U.S. Index Portfolio
Portfolio of Investments — (continued)
December 31, 2014
Security Description | Shares | Value | ||||||
COMMON STOCKS – (continued) |
| |||||||
Poland – (continued) | ||||||||
Bank Zachodni WBK SA | 230 | $ | 24,277 | |||||
Energa SA | 3,962 | 25,591 | ||||||
KGHM Polska Miedz SA | 698 | 21,212 | ||||||
PGE SA | 4,169 | 22,067 | ||||||
Polski Koncern Naftowy Orlen SA | 2,483 | 33,974 | ||||||
Powszechna Kasa Oszczednosci Bank Polski SA | 3,144 | 31,529 | ||||||
Powszechny Zaklad Ubezpieczen SA | 207 | 28,212 | ||||||
Tauron Polska Energia SA | 17,518 | 24,783 | ||||||
|
| |||||||
| 237,812 | ||||||||
|
| |||||||
Portugal – 0.1% | ||||||||
Banco Comercial Portugues SA(a) | 79,544 | 6,255 | ||||||
EDP – Energias de Portugal SA | 5,229 | 20,223 | ||||||
Galp Energia SGPS SA | 870 | 8,802 | ||||||
Jeronimo Martins SGPS SA | 568 | 5,693 | ||||||
|
| |||||||
| 40,973 | ||||||||
|
| |||||||
Qatar – 0.2% | ||||||||
Industries Qatar QSC | 563 | 25,676 | ||||||
Masraf Al Rayan | 1,940 | 23,034 | ||||||
Qatar National Bank SAQ | 523 | 30,387 | ||||||
|
| |||||||
| 79,097 | ||||||||
|
| |||||||
Russia – 0.7% | ||||||||
Gazprom OAO | 29,710 | 64,387 | ||||||
Lukoil OAO ADR | 1,209 | 47,875 | ||||||
Magnit PJSC GDR | 688 | 31,025 | ||||||
MMC Norilsk Nickle OJSC ADR(a) | 201 | 27,051 | ||||||
Mobile TeleSystems OJSC ADR | 1,700 | 12,206 | ||||||
NovaTeK OAO GDR | 286 | 22,211 | ||||||
Rosneft OAO GDR(a) | 4,950 | 16,133 | ||||||
Sberbank(a) | 15,210 | 13,943 | ||||||
Sberkbank Preference Shares(a) | 28,500 | 17,941 | ||||||
Surgutneftegas OAO ADR(a) | 51,000 | 20,064 | ||||||
Tatneft OAO ADR(a) | 4,850 | 18,309 | ||||||
VTB Bank OJSC(a) | 29,280,000 | 32,676 | ||||||
|
| |||||||
| 323,821 | ||||||||
|
| |||||||
Singapore – 1.1% | ||||||||
Ascendas REIT | 5,000 | 8,972 | ||||||
CapitaCommercial Trust REIT | 5,000 | 6,616 | ||||||
CapitaLand, Ltd. | 6,000 | 14,903 | ||||||
CapitaMall Trust REIT | 5,000 | 7,691 | ||||||
City Developments, Ltd. | 1,000 | 7,718 | ||||||
ComfortDelGro Corp., Ltd. | 5,000 | 9,786 | ||||||
DBS Group Holdings, Ltd. | 5,000 | 77,186 | ||||||
Genting Singapore PLC | 14,000 | 11,339 | ||||||
Global Logistic Properties, Ltd. | 7,000 | 13,087 | ||||||
Golden Agri-Resources, Ltd. | 16,000 | 5,547 | ||||||
Hutchison Port Holdings Trust | 13,000 | 8,958 | ||||||
Jardine Cycle & Carriage, Ltd. | 1,000 | 32,099 | ||||||
Keppel Corp., Ltd. | 3,000 | 20,011 | ||||||
Keppel Land, Ltd. | 2,000 | 5,140 | ||||||
Oversea-Chinese Banking Corp., Ltd. | 7,000 | 54,997 | ||||||
Sembcorp Industries, Ltd. | 2,000 | 6,705 | ||||||
SembCorp Marine, Ltd. | 2,000 | 4,925 | ||||||
Singapore Airlines, Ltd. | 1,000 | 8,740 | ||||||
Singapore Exchange, Ltd. | 2,000 | 11,755 | ||||||
Singapore Press Holdings, Ltd. | 4,000 | 12,702 | ||||||
Singapore Technologies Engineering, Ltd. | 4,000 | 10,237 | ||||||
Singapore Telecommunications, Ltd. | 25,000 | 73,359 | ||||||
StarHub, Ltd. | 1,000 | 3,130 | ||||||
Suntec Real Estate Investment Trust REIT | 12,000 | 17,732 | ||||||
United Overseas Bank, Ltd. | 4,000 | 73,926 | ||||||
UOL Group, Ltd. | 1,000 | 5,246 | ||||||
Wilmar International, Ltd. | 4,000 | 9,755 | ||||||
|
| |||||||
| 522,262 | ||||||||
|
| |||||||
South Africa – 2.1% | ||||||||
AngloGold Ashanti, Ltd.(a) | 1,769 | 15,371 | ||||||
Aspen Pharmacare Holdings, Ltd. | 1,111 | 38,656 | ||||||
Barclays Africa Group, Ltd. | 1,540 | 24,016 | ||||||
Bidvest Group, Ltd. (The) | 1,311 | 34,282 | ||||||
FirstRand, Ltd. | 9,102 | 39,429 | ||||||
Gold Fields, Ltd. | 6,904 | 31,247 | ||||||
Growthpoint Properties, Ltd. REIT | 12,760 | 30,176 | ||||||
Impala Platinum Holdings, Ltd.(a) | 2,581 | 16,817 | ||||||
Investec, Ltd. | 3,260 | 27,203 | ||||||
Life Healthcare Group Holdings, Ltd. | 7,034 | 25,915 | ||||||
Mediclinic International, Ltd. | 3,434 | 29,681 | ||||||
Mr Price Group, Ltd. | 1,504 | 30,380 | ||||||
MTN Group, Ltd. | 4,436 | 84,174 | ||||||
Naspers, Ltd. | 1,155 | 148,691 | ||||||
Nedbank Group, Ltd. | 1,555 | 33,311 | ||||||
Netcare, Ltd. | 9,750 | 31,865 | ||||||
Redefine Properties, Ltd. REIT | 33,583 | 31,034 | ||||||
Remgro, Ltd. | 1,311 | 28,639 | ||||||
RMB Holdings, Ltd. | 5,831 | 32,086 | ||||||
Sanlam, Ltd. | 4,744 | 28,495 | ||||||
Sasol, Ltd. | 1,492 | 55,732 | ||||||
Shoprite Holdings, Ltd. | 2,219 | 32,117 | ||||||
Standard Bank Group, Ltd. | 3,961 | 48,674 | ||||||
Steinhoff International Holdings, Ltd. | 5,915 | 30,261 | ||||||
Tiger Brands, Ltd. | 1,010 | 31,986 | ||||||
Vodacom Group, Ltd. | 2,734 | 30,190 | ||||||
Woolworths Holdings, Ltd. | 4,461 | 29,487 | ||||||
|
| |||||||
| 1,019,915 | ||||||||
|
| |||||||
South Korea – 3.3% | ||||||||
Amorepacific Corp. | 18 | 36,161 | ||||||
BS Financial Group, Inc. | 1,770 | 23,294 | ||||||
Coway Co., Ltd. | 240 | 18,260 | ||||||
DGB Financial Group, Inc. | 1,720 | 17,697 | ||||||
E-Mart Co., Ltd. | 130 | 23,950 | ||||||
Hana Financial Group, Inc. | 1,210 | 34,955 | ||||||
Hankook Tire Co., Ltd. | 360 | 17,127 | ||||||
Hyundai Engineering & Construction Co., Ltd. | 487 | 18,438 | ||||||
Hyundai Glovis Co., Ltd. | 100 | 26,397 | ||||||
Hyundai Heavy Industries Co., Ltd. | 280 | 29,017 | ||||||
Hyundai Mobis Co., Ltd. | 168 | 35,757 | ||||||
Hyundai Motor Co.(d) | 510 | 77,427 | ||||||
Hyundai Motor Co.(d) | 165 | 19,982 | ||||||
Hyundai Steel Co. | 388 | 22,186 | ||||||
See Notes to Financial Statements.
42
Table of Contents
State Street Global Equity ex-U.S. Index Portfolio
Portfolio of Investments — (continued)
December 31, 2014
Security Description | Shares | Value | ||||||
COMMON STOCKS – (continued) |
| |||||||
South Korea – (continued) | ||||||||
Industrial Bank of Korea | 1,780 | $ | 22,668 | |||||
Kangwon Land, Inc. | 590 | 16,214 | ||||||
KB Financial Group, Inc. | 1,333 | 43,535 | ||||||
Kia Motors Corp. | 805 | 38,034 | ||||||
Korea Electric Power Corp. | 770 | 29,654 | ||||||
KT&G Corp. | 363 | 25,171 | ||||||
LG Chem, Ltd. | 149 | 24,316 | ||||||
LG Corp. | 539 | 29,874 | ||||||
LG Display Co., Ltd.(a) | 910 | 27,556 | ||||||
LG Electronics, Inc. | 445 | 23,784 | ||||||
LG Household & Health Care, Ltd. | 73 | 41,367 | ||||||
NAVER Corp. | 94 | 60,726 | ||||||
Orion Corp. | 34 | 31,270 | ||||||
POSCO | 192 | 48,442 | ||||||
Samsung C&T Corp. | 476 | 26,387 | ||||||
Samsung Electronics Co., Ltd.(d) | 300 | 360,616 | ||||||
Samsung Electronics Co., Ltd.(d) | 79 | 73,920 | ||||||
Samsung Fire & Marine Insurance Co., Ltd. | 111 | 28,437 | ||||||
Samsung Life Insurance Co., Ltd. | 378 | 39,924 | ||||||
Samsung SDI Co., Ltd. | 209 | 21,729 | ||||||
Samsung SDS Co., Ltd.(a) | 70 | 18,692 | ||||||
Shinhan Financial Group Co., Ltd. | 1,320 | 52,963 | ||||||
SK C&C Co., Ltd. | 147 | 28,397 | ||||||
SK Holdings Co., Ltd. | 171 | 25,342 | ||||||
SK Hynix, Inc.(a) | 1,720 | 74,062 | ||||||
SK Innovation Co., Ltd. | 444 | 34,153 | ||||||
|
| |||||||
| 1,647,881 | ||||||||
|
| |||||||
Spain – 2.5% | ||||||||
Abertis Infraestructuras SA | 913 | 18,037 | ||||||
ACS Actividades de Construccion y Servicios SA | 399 | 13,815 | ||||||
Amadeus IT Holding SA | 1,361 | 54,082 | ||||||
Banco Bilbao Vizcaya Argentaria SA | 17,373 | 163,504 | ||||||
Banco de Sabadell SA | 7,700 | 20,172 | ||||||
Banco Popular Espanol SA | 4,029 | 19,947 | ||||||
Banco Santander SA | 35,093 | 293,440 | ||||||
Bankia SA(a) | 10,403 | 15,423 | ||||||
Bankinter SA | 2,736 | 21,816 | ||||||
CaixaBank SA | 7,689 | 39,937 | ||||||
Distribuidora Internacional de Alimentacion SA | 1,396 | 9,387 | ||||||
Enagas SA | 458 | 14,497 | ||||||
Ferrovial SA | 949 | 18,699 | ||||||
Gas Natural SDG SA | 791 | 19,899 | ||||||
Grifols SA | 337 | 13,415 | ||||||
Iberdrola SA | 15,613 | 105,045 | ||||||
Inditex SA | 3,275 | 93,839 | ||||||
International Consolidated Airlines Group SA(a) | 2,303 | 17,047 | ||||||
Mapfre SA | 2,086 | 7,025 | ||||||
Red Electrica Corporacion SA | 244 | 21,420 | ||||||
Repsol SA | 3,270 | 60,783 | ||||||
Telefonica SA | 12,190 | 174,365 | ||||||
Zardoya Otis SA | 393 | 4,349 | ||||||
|
| |||||||
| 1,219,943 | ||||||||
|
| |||||||
Sweden – 2.0% | ||||||||
Alfa Laval AB | 710 | 13,376 | ||||||
Assa Abloy AB (Class B) | 1,063 | 55,942 | ||||||
Atlas Copco AB (Class A) | 2,119 | 58,741 | ||||||
Atlas Copco AB (Class B) | 881 | 22,480 | ||||||
Boliden AB | 618 | 9,806 | ||||||
Electrolux AB | 543 | 15,866 | ||||||
Elekta AB (Class B) | 832 | 8,456 | ||||||
Getinge AB (Class B) | 452 | 10,224 | ||||||
Hennes & Mauritz AB (Class B) | 2,806 | 115,912 | ||||||
Hexagon AB (Class B) | 576 | 17,738 | ||||||
Husqvarna AB (Class B) | 921 | 6,745 | ||||||
Industrivarden AB | 332 | 5,742 | ||||||
Investment AB Kinnevik | 532 | 17,181 | ||||||
Investor AB (Class B) | 1,029 | 37,134 | ||||||
Lundin Petroleum AB(a) | 491 | 6,992 | ||||||
Nordea Bank AB | 9,055 | 104,144 | ||||||
Sandvik AB | 2,407 | 23,338 | ||||||
Securitas AB (Class B) | 707 | 8,530 | ||||||
Skandinaviska Enskilda Banken AB (Class A) | 4,789 | 60,325 | ||||||
Skanska AB (Class B) | 858 | 18,266 | ||||||
SKF AB (Class B) | 894 | 18,729 | ||||||
Svenska Cellulosa AB SCA (Class B) | 1,325 | 28,495 | ||||||
Svenska Handelsbanken AB (Class A) | 1,539 | 71,560 | ||||||
Swedbank AB (Class A) | 2,803 | 69,456 | ||||||
Swedish Match AB | 456 | 14,164 | ||||||
Tele2 AB (Class B) | 721 | 8,692 | ||||||
Telefonaktiebolaget LM Ericsson (Class B) | 9,033 | 108,941 | ||||||
TeliaSonera AB | 5,378 | 34,441 | ||||||
Volvo AB (Class B) | 3,463 | 37,244 | ||||||
|
| |||||||
| 1,008,660 | ||||||||
|
| |||||||
Switzerland – 7.0% | ||||||||
AAC Technologies Holdings, Inc. | 3,500 | 18,666 | ||||||
ABB, Ltd. | 6,591 | 139,488 | ||||||
Actelion, Ltd. | 231 | 26,591 | ||||||
Adecco SA | 384 | 26,320 | ||||||
Aryzta AG | 197 | 15,145 | ||||||
Baloise Holding AG | 107 | 13,673 | ||||||
Barry Callebaut AG | 5 | 5,124 | ||||||
Chocoladefabriken Lindt & Sprungli AG(d) | 2 | 9,879 | ||||||
Chocoladefabriken Lindt & Sprungli AG(d) | 1 | 57,428 | ||||||
Cie Financiere Richemont SA | 1,596 | 141,448 | ||||||
CITIC Securities Co., Ltd. | 5,000 | 18,698 | ||||||
Coca-Cola HBC AG | 453 | 8,623 | ||||||
Credit Suisse Group AG | 4,677 | 117,312 | ||||||
EMS-Chemie Holding AG | 19 | 7,718 | ||||||
Geberit AG | 85 | 28,902 | ||||||
Givaudan SA | 21 | 37,570 | ||||||
Glencore PLC | 31,083 | 143,127 | ||||||
Great Wall Motor Co., Ltd. | 4,500 | 25,481 | ||||||
Holcim, Ltd. | 517 | 36,732 | ||||||
Julius Baer Group, Ltd. | 505 | 23,058 | ||||||
Kuehne & Nagel International AG | 122 | 16,593 | ||||||
Lonza Group AG | 119 | 13,418 | ||||||
Nestle SA | 9,037 | 662,793 | ||||||
See Notes to Financial Statements.
43
Table of Contents
State Street Global Equity ex-U.S. Index Portfolio
Portfolio of Investments — (continued)
December 31, 2014
Security Description | Shares | Value | ||||||
COMMON STOCKS – (continued) |
| |||||||
Switzerland – (continued) | ||||||||
Novartis AG | 6,452 | $ | 593,703 | |||||
Pargesa Holding SA | 70 | 5,395 | ||||||
Partners Group Holding AG | 39 | 11,317 | ||||||
Roche Holding AG | 1,974 | 535,330 | ||||||
Schindler Holding AG(d) | 104 | 15,015 | ||||||
Schindler Holding AG(d) | 48 | 6,888 | ||||||
SGS SA | 13 | 26,521 | ||||||
Sika AG | 5 | 14,673 | ||||||
Sonova Holding AG | 122 | 17,894 | ||||||
Sulzer AG | 54 | 5,740 | ||||||
Swiss Life Holding AG | 72 | 17,024 | ||||||
Swiss Prime Site AG | 130 | 9,531 | ||||||
Swiss Re AG | 1,061 | 88,826 | ||||||
Swisscom AG | 53 | 27,846 | ||||||
Syngenta AG | 280 | 89,958 | ||||||
The Swatch Group AG(d) | 70 | 31,100 | ||||||
The Swatch Group AG(d) | 112 | 9,693 | ||||||
Transocean, Ltd. | 817 | 14,981 | ||||||
UBS Group AG | 10,562 | 181,658 | ||||||
Zurich Insurance Group AG | 455 | 142,559 | ||||||
|
| |||||||
| 3,439,439 | ||||||||
|
| |||||||
Taiwan – 2.8% | ||||||||
Advanced Semiconductor Engineering, Inc. | 28,000 | 33,287 | ||||||
Asustek Computer, Inc. | 3,000 | 32,664 | ||||||
AU Optronics Corp. | 40,000 | 20,277 | ||||||
Catcher Technology Co., Ltd. | 3,000 | 23,090 | ||||||
Cathay Financial Holding Co., Ltd. | 22,000 | 32,369 | ||||||
Cheng Shin Rubber Industry Co., Ltd. | 8,000 | 18,765 | ||||||
China Development Financial Holding Corp. | 90,000 | 28,603 | ||||||
China Steel Corp. | 34,000 | 28,198 | ||||||
Chunghwa Telecom Co., Ltd. | 10,000 | 29,707 | ||||||
CTBC Financial Holding Co., Ltd. | 55,997 | 36,179 | ||||||
Delta Electronics, Inc. | 5,000 | 29,710 | ||||||
E.Sun Financial Holding Co., Ltd. | 30,000 | 18,600 | ||||||
Far Eastern New Century Corp. | 31,000 | 30,682 | ||||||
Far EasTone Telecommunications Co., Ltd. | 8,000 | 18,418 | ||||||
First Financial Holding Co., Ltd. | 53,000 | 31,160 | ||||||
Formosa Chemicals & Fibre Corp. | 13,000 | 27,390 | ||||||
Formosa Plastics Corp. | 12,000 | 27,348 | ||||||
Fubon Financial Holding Co., Ltd. | 28,000 | 44,530 | ||||||
Hon Hai Precision Industry Co., Ltd. | 37,000 | 102,030 | ||||||
Hotai Motor Co., Ltd. | 1,000 | 14,948 | ||||||
Hua Nan Financial Holdings Co., Ltd. | 30,000 | 16,779 | ||||||
Innolux Corp. | 38,000 | 18,306 | ||||||
MediaTek, Inc. | 4,000 | 58,232 | ||||||
Mega Financial Holding Co., Ltd. | 46,000 | 35,460 | ||||||
Nan Ya Plastics Corp. | 13,000 | 26,844 | ||||||
Pegatron Corp. | 8,000 | 18,424 | ||||||
President Chain Store Corp. | 4,000 | 30,845 | ||||||
Quanta Computer, Inc. | 11,000 | 27,404 | ||||||
Ruentex Development Co., Ltd. | 17,000 | 27,029 | ||||||
Siliconware Precision Industries Co., Ltd. | 21,000 | 31,663 | ||||||
Taishin Financial Holding Co., Ltd. | 60,000 | 24,612 | ||||||
Taiwan Cement Corp. | 15,000 | 20,486 | ||||||
Taiwan Mobile Co., Ltd. | 7,000 | 23,117 | ||||||
Taiwan Semiconductor Manufacturing Co., Ltd. | 70,000 | 308,891 | ||||||
Uni-President Enterprises Corp. | 18,000 | 28,370 | ||||||
United Microelectronics Corp. | 82,000 | 37,952 | ||||||
Yuanta Financial Holding Co., Ltd. | 39,000 | 18,889 | ||||||
|
| |||||||
| 1,381,258 | ||||||||
|
| |||||||
Thailand – 0.6% | ||||||||
Advanced Info Service PCL NVDR | 5,900 | 45,012 | ||||||
Airports of Thailand PCL NVDR | 1,900 | 16,256 | ||||||
CP ALL PCL NVDR | 27,600 | 35,654 | ||||||
Kasikornbank PCL NVDR | 10,900 | 75,267 | ||||||
PTT Exploration & Production PCL NVDR | 8,100 | 27,574 | ||||||
PTT PCL NVDR | 4,300 | 42,347 | ||||||
The Siam Cement PCL NVDR | 1,400 | 19,042 | ||||||
The Siam Commercial Bank PCL NVDR | 8,000 | 44,255 | ||||||
|
| |||||||
| 305,407 | ||||||||
|
| |||||||
Turkey – 0.6% | ||||||||
Akbank TAS | 8,457 | 31,119 | ||||||
BIM Birlesik Magazalar AS | 1,296 | 27,707 | ||||||
Haci Omer Sabanci Holding AS | 7,057 | 30,616 | ||||||
KOC Holding AS | 6,204 | 32,725 | ||||||
Turkcell Iletisim Hizmetleri AS(a) | 4,027 | 24,558 | ||||||
Turkiye Garanti Bankasi AS | 10,477 | 41,923 | ||||||
Turkiye Halk Bankasi AS | 4,682 | 27,619 | ||||||
Turkiye Is Bankasi (Class C) | 12,616 | 36,140 | ||||||
Turkiye Sise ve Cam Fabrikalari | 21,679 | 33,738 | ||||||
|
| |||||||
| 286,145 | ||||||||
|
| |||||||
United Arab Emirates – 0.1% | ||||||||
DP World, Ltd. | 798 | 16,758 | ||||||
Emaar Properties PJSC | 11,871 | 22,776 | ||||||
First Gulf Bank PJSC | 3,763 | 17,202 | ||||||
|
| |||||||
| 56,736 | ||||||||
|
| |||||||
United Kingdom – 14.4% | ||||||||
3i Group PLC | 2,195 | 15,261 | ||||||
Aberdeen Asset Management PLC | 2,078 | 13,885 | ||||||
Admiral Group PLC | 437 | 8,953 | ||||||
Aggreko PLC | 578 | 13,472 | ||||||
Amec Foster Wheeler PLC | 673 | 8,812 | ||||||
Anglo American PLC | 4,262 | 78,888 | ||||||
Antofagasta PLC | 890 | 10,337 | ||||||
ARM Holdings PLC | 4,373 | 67,365 | ||||||
Ashtead Group PLC | 1,265 | 22,374 | ||||||
Associated British Foods PLC | 1,134 | 55,119 | ||||||
AstraZeneca PLC | 3,602 | 253,491 | ||||||
Aviva PLC | 9,113 | 68,314 | ||||||
Babcock International Group PLC | 1,132 | 18,528 | ||||||
BAE Systems Holding, Inc. PLC | 9,756 | 71,249 | ||||||
Barclays PLC | 47,776 | 179,689 | ||||||
BG Group PLC | 9,898 | 131,804 | ||||||
BHP Billiton PLC | 6,170 | 132,030 | ||||||
BP PLC | 52,188 | 331,518 | ||||||
British American Tobacco PLC | 5,299 | 288,035 | ||||||
BT Group PLC | 23,762 | 147,566 | ||||||
Bunzl PLC | 754 | 20,562 | ||||||
See Notes to Financial Statements.
44
Table of Contents
State Street Global Equity ex-U.S. Index Portfolio
Portfolio of Investments — (continued)
December 31, 2014
Security Description | Shares | Value | ||||||
COMMON STOCKS – (continued) |
| |||||||
United Kingdom – (continued) | ||||||||
Burberry Group PLC | 1,002 | $ | 25,400 | |||||
Capita PLC | 1,493 | 25,032 | ||||||
Carnival PLC | 415 | 18,746 | ||||||
Centrica PLC | 15,622 | 67,264 | ||||||
Cobham PLC | 2,571 | 12,897 | ||||||
Compass Group PLC | 5,079 | 86,604 | ||||||
Croda International PLC | 307 | 12,655 | ||||||
Diageo PLC | 7,165 | 205,586 | ||||||
Direct Line Insurance Group PLC | 3,387 | 15,283 | ||||||
Dixons Carphone PLC | 2,212 | 15,939 | ||||||
easyJet PLC | 358 | 9,244 | ||||||
Experian PLC | 2,244 | 37,867 | ||||||
Fiat Chrysler Automobiles NV(a) | 1,977 | 22,687 | ||||||
Fresnillo PLC | 499 | 5,924 | ||||||
Friends Life Group, Ltd. | 3,202 | 18,111 | ||||||
G4S PLC | 3,504 | 15,086 | ||||||
GKN PLC | 3,704 | 19,655 | ||||||
GlaxoSmithKline PLC | 13,776 | 294,861 | ||||||
Hammerson PLC REIT | 1,610 | 15,054 | ||||||
Hargreaves Lansdown PLC | 536 | 8,361 | ||||||
HSBC Holdings PLC | 53,841 | 509,035 | ||||||
ICAP PLC | 1,244 | 8,681 | ||||||
IMI PLC | 613 | 12,005 | ||||||
Imperial Tobacco Group PLC | 2,962 | 129,769 | ||||||
Indivior PLC(a) | 1,914 | 4,459 | ||||||
Inmarsat PLC | 960 | 11,902 | ||||||
InterContinental Hotels Group PLC | 533 | 21,367 | ||||||
Intertek Group PLC | 364 | 13,200 | ||||||
Intu Properties PLC REIT | 2,031 | 10,507 | ||||||
Investec PLC | 1,238 | 10,346 | ||||||
ITV PLC | 8,649 | 28,825 | ||||||
J Sainsbury PLC | 2,801 | 10,653 | ||||||
Johnson Matthey PLC | 463 | 24,282 | ||||||
Kingfisher PLC | 5,351 | 28,209 | ||||||
Land Securities Group PLC REIT | 1,785 | 31,954 | ||||||
Legal & General Group PLC | 18,381 | 70,627 | ||||||
Liberty Global PLC(a)(d) | 77 | 3,866 | ||||||
Liberty Global PLC(a)(d) | 190 | 9,179 | ||||||
Lloyds Banking Group PLC(a) | 163,149 | 192,737 | ||||||
London Stock Exchange Group PLC | 509 | 17,495 | ||||||
Marks & Spencer Group PLC | 3,686 | 27,226 | ||||||
Meggitt PLC | 1,819 | 14,546 | ||||||
Melrose Industries PLC | 2,420 | 9,962 | ||||||
National Grid PLC | 11,077 | 157,978 | ||||||
Next PLC | 350 | 36,932 | ||||||
Old Mutual PLC | 11,061 | 32,543 | ||||||
Pearson PLC | 1,849 | 34,027 | ||||||
Persimmon PLC | 689 | 16,861 | ||||||
Petrofac, Ltd. | 586 | 6,358 | ||||||
Prudential PLC | 7,493 | 172,502 | ||||||
Randgold Resources, Ltd. | 199 | 13,470 | ||||||
Reckitt Benckiser Group PLC | 1,914 | 154,469 | ||||||
Reed Elsevier PLC | 3,599 | 61,257 | ||||||
Rexam PLC | 1,590 | 11,183 | ||||||
Rio Tinto PLC | 3,683 | 169,756 | ||||||
Rolls-Royce Holdings PLC | 5,765 | 77,693 | ||||||
Royal Bank of Scotland Group PLC(a) | 5,668 | 34,422 | ||||||
Royal Dutch Shell PLC (Class A) | 11,142 | 369,472 | ||||||
Royal Dutch Shell PLC (Class B) | 6,974 | 239,684 | ||||||
Royal Mail PLC | 1,468 | 9,779 | ||||||
RSA Insurance Group PLC(a) | 2,287 | 15,398 | ||||||
SABMiller PLC | 2,860 | 148,073 | ||||||
Schroders PLC | 280 | 11,610 | ||||||
Segro PLC REIT | 1,676 | 9,611 | ||||||
Severn Trent PLC | 540 | 16,750 | ||||||
Shire PLC | 1,735 | 122,808 | ||||||
Sky PLC | 2,332 | 32,471 | ||||||
Smith & Nephew PLC | 2,016 | 37,028 | ||||||
Smiths Group PLC | 891 | 15,087 | ||||||
Sports Direct International PLC(a) | 608 | 6,671 | ||||||
SSE PLC | 2,990 | 75,094 | ||||||
Standard Chartered PLC | 7,462 | 111,954 | ||||||
Standard Life PLC | 5,398 | 33,268 | ||||||
Tate & Lyle PLC | 1,052 | 9,886 | ||||||
Tesco PLC | 25,031 | 72,869 | ||||||
The British Land Co. PLC REIT | 2,171 | 26,091 | ||||||
The Sage Group PLC | 2,476 | 17,863 | ||||||
Travis Perkins PLC | 558 | 16,072 | ||||||
TUI AG(a)(d) | 453 | 7,287 | ||||||
TUI AG(a)(d) | 1,680 | 28,029 | ||||||
Tullow Oil PLC | 2,056 | 13,014 | ||||||
Unilever PLC | 3,806 | 154,667 | ||||||
United Utilities Group PLC | 1,540 | 21,832 | ||||||
Vodafone Group PLC | 73,894 | 253,300 | ||||||
Weir Group PLC (The) | 482 | 13,801 | ||||||
Whitbread PLC | 410 | 30,269 | ||||||
William Hill PLC | 1,969 | 11,077 | ||||||
WM Morrison Supermarkets PLC | 4,746 | 13,513 | ||||||
Wolseley PLC | 601 | 34,228 | ||||||
WPP PLC | 4,003 | 83,082 | ||||||
|
| |||||||
| 7,111,429 | ||||||||
|
| |||||||
United States – 0.0%(b) | ||||||||
Southern Copper Corp. | 700 | 19,740 | ||||||
|
| |||||||
| 19,740 | ||||||||
|
| |||||||
TOTAL COMMON STOCKS |
| 48,292,777 | ||||||
|
| |||||||
RIGHTS – 0.0%(b)(c) | ||||||||
Australia – 0.0%(b) | ||||||||
APA Group(a) | 629 | – | ||||||
|
| |||||||
| – | ||||||||
|
| |||||||
South Korea – 0.0%(b) | ||||||||
DGB Financial Group Inc.(a) | 359 | 376 | ||||||
|
| |||||||
| 376 | ||||||||
|
| |||||||
Spain – 0.0%(b) | ||||||||
Banco Bilbao Vizcaya Argentaria SA(a) | 15,141 | 1,447 | ||||||
Repsol SA(a) | 2,301 | 1,273 | ||||||
|
| |||||||
| 2,720 | ||||||||
|
| |||||||
TOTAL RIGHTS |
| 3,096 | ||||||
|
| |||||||
SHORT TERM INVESTMENTS – 1.2% |
| |||||||
State Street Institutional Liquid Reserves Fund, Premier Class 0.07%(e)(f)(g) | 597,024 | 597,024 | ||||||
|
| |||||||
TOTAL INVESTMENTS – 98.9% |
| 48,892,897 | ||||||
Other Assets in Excess of | 567,014 | |||||||
|
| |||||||
NET ASSETS – 100.0% | $ | 49,459,911 | ||||||
|
| |||||||
See Notes to Financial Statements.
45
Table of Contents
State Street Global Equity ex-U.S. Index Portfolio
Portfolio of Investments — (continued)
December 31, 2014
| (a) | Non-income producing security |
| (b) | Amount shown represents less than 0.05% of net assets. |
| (c) | Security subject to restrictions on resale under federal securities laws, which may only be resold upon registration under the Securities Act of 1933, as amended (“1933 Act”) or in transactions exempt from registration, including sales to qualified institutional buyers pursuant to Rule 144A of the 1933 Act. The Portfolio does not have the right to demand that this security be registered. The Portfolio’s investment manager has deemed this security to be liquid based upon procedures approved by the Board of Trustees. These securities represent $42,300 or 0.09% of net assets as of December 31, 2014. |
| (d) | Reflects separate holdings of the issuer’s common stock traded on different securities exchanges. |
| (e) | The rate shown is the annualized seven-day yield at period end. |
| (f) | Affiliated Fund managed by SSGA Fund Management, Inc. See table that follows for more information. |
Abbreviations | ||
| ADR | American Depositary Receipt | |
| GDR | Global Depositary Receipt | |
| NVDR | Non Voting Depositary Receipt | |
| PCL | Public Company Limited | |
| PLC | Public Limited Company | |
| REIT | Real Estate Investment Trust | |
Schedule of | Number of Contracts | Notional Value | Unrealized Appreciation/ (Depreciation) | |||||||||
Mini MSCI EAFE Futures Contracts (long) Expiration Date 03/2015 | 8 | $ | 703,160 | $ | (9,538 | ) | ||||||
Mini MSCI Emerging Markets Futures Contracts (long) Expiration Date 03/2015 | 2 | 95,770 | 1,038 | |||||||||
|
| |||||||||||
Total unrealized appreciation/(depreciation) on open futures contracts purchased | $ | (8,500 | ) | |||||||||
|
| |||||||||||
Affiliates Table
Certain investments made by the Portfolio were made in securities affiliated with SSGA FM. The Portfolio invested in the State Street Institutional Liquid Reserves Fund. Transactions in affiliates for the period ending December 31, 2014 were as follows:
Security Description | Number of shares held at 9/17/14* | Shares purchased for the period ended 12/31/14 | Shares sold for the period ended 12/31/14 | Number of shares held at 12/31/14 | Value at 12/31/14 | Income earned for the period ended 12/31/14 | ||||||||||||||||||
State Street Institutional Liquid Reserves Fund, Premier Class | – | 18,755,556 | 18,158,532 | 597,024 | $ | 597,024 | $ | 236 | ||||||||||||||||
| * | Commencement of operations. |
See Notes to Financial Statements.
46
Table of Contents
State Street Institutional Investment Trust
Statements of Assets and Liabilities
December 31, 2014
| State Street Aggregate Bond Index Portfolio | State Street Global Equity ex-U.S. Index Portfolio | |||||||
Assets | ||||||||
Investments in unaffiliated issuers at market value (Note 2)* | $ | 79,344,837 | $ | 48,295,873 | ||||
Investments in non-controlled affiliates at market value (Note 4)* | 19,953,875 | 597,024 | ||||||
|
|
|
| |||||
Total Investments* | 99,298,712 | 48,892,897 | ||||||
Cash | – | 156,810 | ||||||
Foreign currency** | – | 251,274 | ||||||
Receivable for investment securities sold | – | 596 | ||||||
Receivable for fund shares sold | 88,220 | 400,936 | ||||||
Dividends and interest receivable | 418,933 | 57,679 | ||||||
Prepaid expenses and other assets | 35,271 | 77,499 | ||||||
|
|
|
| |||||
Total assets | 99,841,136 | 49,837,691 | ||||||
Liabilities | ||||||||
Investment securities purchased | 19,754,821 | 161,900 | ||||||
Due to broker | – | 121,870 | ||||||
Daily variation margin on futures contracts | – | 8,500 | ||||||
Payable for fund shares repurchased | 3,011 | – | ||||||
Deferred foreign taxes payable | – | 694 | ||||||
Professional fees payable | 26,986 | 25,828 | ||||||
Administration and custody fees payable (Note 4) | 2,052 | 49,860 | ||||||
Trustee’s fees payable (Note 4) | 3,750 | 3,750 | ||||||
Accrued expenses and other liabilities | 6,046 | 5,378 | ||||||
|
|
|
| |||||
Total liabilities | 19,796,666 | 377,780 | ||||||
|
|
|
| |||||
Net Assets | $ | 80,044,470 | $ | 49,459,911 | ||||
|
|
|
| |||||
Net Assets Consist of: | ||||||||
Paid in capital | $ | 79,393,966 | $ | 53,360,508 | ||||
Distributions in excess of net investment income | – | (5,293 | ) | |||||
Accumulated net realized gain (loss) on investments | 138,890 | (34,790 | ) | |||||
Unrealized appreciation (depreciation) on investments | 511,614 | (3,860,514 | ) | |||||
|
|
|
| |||||
Net Assets | $ | 80,044,470 | $ | 49,459,911 | ||||
|
|
|
| |||||
Net asset value, offering, and redemption price per share | $ | 10.14 | $ | 9.17 | ||||
Shares outstanding | 7,894,650 | 5,396,454 | ||||||
* Investments in unaffiliated issuers at cost (Note 2) | $ | 78,833,223 | $ | 52,144,423 | ||||
* Investments in non-controlled affiliates at cost (Note 4) | 19,953,875 | 597,024 | ||||||
|
|
|
| |||||
* Total Cost of Investments | 98,787,098 | 52,741,447 | ||||||
|
|
|
| |||||
** Foreign currency, at cost | – | 253,165 | ||||||
See Notes to Financial Statements.
47
Table of Contents
State Street Institutional Investment Trust
Statements of Operations
Period Ended December 31, 2014
| State Street Aggregate Bond Index Portfolio* | State Street Global Equity ex-U.S. Index Portfolio** | |||||||
Investment Income | ||||||||
Interest | $ | 258,173 | $ | 249 | ||||
Dividend income (net of foreign taxes withheld of $0 and $22,982, respectively) | – | 250,208 | ||||||
|
|
|
| |||||
Total investment income | 258,173 | 250,457 | ||||||
|
|
|
| |||||
Expenses | ||||||||
Professional fees | 26,999 | 25,841 | ||||||
Administration and custody fees (Note 4) | 2,052 | 49,860 | ||||||
Trustees’ fees (Note 5) | 3,750 | 3,750 | ||||||
Printing fees | 2,138 | 2,144 | ||||||
Tax expense | – | 7,078 | ||||||
Other expenses | 6,949 | 7,102 | ||||||
|
|
|
| |||||
Total expenses | 41,888 | 95,775 | ||||||
Less: Expenses reimbursed (Note 4) | (35,271 | ) | (77,499 | ) | ||||
|
|
|
| |||||
Total net expenses | 6,617 | 18,276 | ||||||
|
|
|
| |||||
Net Investment Income | 251,556 | 232,181 | ||||||
|
|
|
| |||||
Realized and Unrealized Gain (Loss) | ||||||||
Net realized gain (loss) on: | ||||||||
Net realized gain on investments | 272,305 | (5,423 | ) | |||||
Voluntary contribution from Adviser | 25,627 | 7,401 | ||||||
Foreign currency | – | 17,776 | ||||||
Futures contracts | – | (36,768 | ) | |||||
|
|
|
| |||||
Net realized gain (loss) | 297,932 | (17,014 | ) | |||||
|
|
|
| |||||
Net change in net unrealized appreciation/depreciation on: | ||||||||
Investments | 511,614 | (3,848,550 | ) | |||||
Foreign Currency | – | (3,464 | ) | |||||
Futures contracts | – | (8,500 | ) | |||||
|
|
|
| |||||
Net change in unrealized appreciation/depreciation | 511,614 | (3,860,514 | ) | |||||
|
|
|
| |||||
Net Increase (Decrease) in Net Assets Resulting from Operations | $ | 1,061,102 | $ | (3,645,347 | ) | |||
|
|
|
| |||||
| * | For the period from September 19, 2014 (commencement of operations) to December 31, 2014. |
| ** | For the period from September 17, 2014 (commencement of operations) to December 31, 2014. |
See Notes to Financial Statements.
48
Table of Contents
State Street Institutional Investment Trust
Statements of Changes in Net Assets
| State Street Aggregate Bond Index Portfolio | State Street Global Equity ex-U.S. Index Portfolio | |||||||
| For the Period 9/19/14* – 12/31/14 | For the Period 9/17/14* – 12/31/14 | |||||||
Increase (Decrease) in Net Assets From Operations: | ||||||||
Net investment income | $ | 251,556 | $ | 232,181 | ||||
Net realized gain (loss) | 297,932 | (17,014 | ) | |||||
Net change in net unrealized appreciation/depreciation | 511,614 | (3,860,514 | ) | |||||
|
|
|
| |||||
Net increase (decrease) in net assets from operations | 1,061,102 | (3,645,347 | ) | |||||
|
|
|
| |||||
Distributions From: | ||||||||
Net investment income | (252,366 | ) | (284,533 | ) | ||||
Net realized gain on investments | (158,232 | ) | – | |||||
|
|
|
| |||||
Total distributions | (410,598 | ) | (284,533 | ) | ||||
|
|
|
| |||||
Capital Transactions: | ||||||||
Proceeds from shares sold | 79,369,350 | 53,494,038 | ||||||
Reinvestment of distributions | 410,598 | 284,533 | ||||||
Cost of redemptions | (385,982 | ) | (388,780 | ) | ||||
|
|
|
| |||||
Net increase in net assets from capital transactions | 79,393,966 | 53,389,791 | ||||||
|
|
|
| |||||
Net Increase in Net Assets | 80,044,470 | 49,459,911 | ||||||
Net Assets | ||||||||
End of period | $ | 80,044,470 | $ | 49,459,911 | ||||
|
|
|
| |||||
Distributions in excess of net investment income | $ | – | $ | (5,293 | ) | |||
|
|
|
| |||||
Share Transactions: | ||||||||
Proceeds from shares sold | 7,892,207 | 5,407,432 | ||||||
Reinvestment of distributions | 40,587 | 30,928 | ||||||
Cost of redemptions | (38,144 | ) | (41,906 | ) | ||||
|
|
|
| |||||
Net increase in net assets from share transactions | 7,894,650 | 5,396,454 | ||||||
|
|
|
| |||||
| * | Commencement of operations |
See Notes to Financial Statements.
49
Table of Contents
State Street Institutional Investment Trust
Financial Highlights
| State Street Aggregate Bond Index Portfolio Period from 9/19/14* – 12/31/14 | State Street Global Equity ex-U.S. Index Portfolio Period from 9/17/14* – 12/31/14 | |||||||
Per Share Operating Performance: | ||||||||
Net asset value, beginning of period | $ | 10.00 | $ | 10.00 | ||||
|
|
|
| |||||
Net investment income(a) | 0.04 | 0.05 | ||||||
Net realized and unrealized gain (loss) on investments | 0.16 | (0.82 | ) | |||||
|
|
|
| |||||
Total from investment operations | 0.20 | (0.77 | ) | |||||
|
|
|
| |||||
Distributions from: | ||||||||
Net investment income | (0.04 | ) | (0.06 | ) | ||||
Net realized gain on investments | (0.02 | ) | – | |||||
|
|
|
| |||||
Total distributions | (0.06 | ) | (0.06 | ) | ||||
|
|
|
| |||||
Net increase (decrease) in net assets | 0.14 | (0.83 | ) | |||||
|
|
|
| |||||
Net asset value, end of period | $ | 10.14 | $ | 9.17 | ||||
|
|
|
| |||||
Total Investment Return(c)(d) | 2.00 | %(b) | (7.72 | )%(b) | ||||
Ratios and Supplemental Data: | ||||||||
Net Assets, End of Period (000s) | $ | 80,044 | $ | 49,460 | ||||
Ratios to average net assets: | ||||||||
Gross expenses(e) | 0.25 | % | 0.73 | % | ||||
Net expenses(e) | 0.04 | % | 0.31 | % | ||||
Net investment income(e) | 1.52 | % | 1.77 | % | ||||
Portfolio turnover(d) | 16 | % | 0 | % | ||||
| * | Commencement of operations. |
| (a) | Net investment income per share is calculated using the average shares method. |
| (b) | If the Adviser had not made a voluntary contribution during the period ended 12/31/14, the total return would have decreased by less than 0.005%. |
| (c) | Total return is calculated assuming a purchase of shares at net asset value on the first day and a sale at net asset value on the last day of each period reported. Distributions are assumed, for the purpose of this calculation, to be reinvested at net asset value per share on the respective payment dates. Results represent past performance and are not indicative of future results. |
| (d) | Not annualized. |
| (e) | Annualized. |
See Notes to Financial Statements.
50
Table of Contents
State Street Institutional Investment Trust
Notes to Financial Statements
December 31, 2014
| 1. | Organization |
State Street Institutional Investment Trust (the “Trust”) is registered under the Investment Company Act of 1940, as amended (the “1940 Act”), as an open-end management investment company, and was organized as a business trust under the laws of the Commonwealth of Massachusetts on February 16, 2000. The Trust consists of thirty-five (35) series and corresponding classes, each of which have the same rights and privileges, including the same voting rights. The Funds are authorized to issue an unlimited number of shares, with no par value. Each Fund has registered Class C shares. Each Fund’s Class C shares were not operational at December 31, 2014. The financial statements herein relate to the following Funds:
| Fund | Classes | Commencement of Operations: | ||
State Street Aggregate Bond Index Fund | Class A Class I Class K | September 19, 2014 September 19, 2014 September 19, 2014 | ||
State Street Global Equity ex-U.S. Index Fund | Class A Class I Class K | September 17, 2014 September 17, 2014 September 17, 2014 | ||
State Street Aggregate Bond Index Portfolio | N/A | September 19, 2014 | ||
State Street Global Equity ex-U.S. Index Portfolio | N/A | September 17, 2014 |
The State Street Aggregate Bond Index Portfolio and the State Street Global Equity ex-U.S. Index Portfolio are referred to as the “Portfolios.” The State Street Aggregate Bond Index Fund and the State Street Global Equity ex-U.S. Index Fund are referred to as the “Funds.” Each Fund invests as part of a “master-feeder” structure, and currently seeks to achieve its investment objective by investing substantially all of its investable assets in a corresponding Portfolio, a separate mutual fund, that has a substantially identical investment objective, investment policies, and risks as the Fund.
| Feeder Fund | % Investment in Master | Master Fund | ||
State Street Aggregate Bond Index Fund | 94.27% | State Street Aggregate Bond Index Portfolio | ||
State Street Global Equity ex-U.S. Index Fund | 82.69% | State Street Global Equity ex-U.S. Index Portfolio |
Each Portfolio may hold portions of its assets in short-term debt instruments with remaining maturities of 397 days or less pending investment or to meet anticipated redemptions and day-to-day operating expenses. Each Portfolio’s shares are offered exclusively to other investors (including without limitation, registered investment companies, private investment pools, bank collective funds, and investment separate accounts) that pay fees to SSGA Funds Management, Inc. (“SSGA FM”) SSGA FM or its affiliates. Class A shares of the Funds are available to the general public for investment through transaction-based financial intermediaries. Class A shares may be subject to a 1% CDSC if redeemed within 18 months of purchase. Class I and K shares are sold without a sales charge and only to certain eligible investors.
51
Table of Contents
State Street Institutional Investment Trust
Notes to Financial Statements — (continued)
December 31, 2014
Each Portfolio is permitted to invest in foreign securities. Foreign securities include securities of foreign companies and foreign governments (or agencies or subdivisions thereof). If the Portfolios’ securities are held abroad, the countries in which such securities may be held and the sub-custodian holding them must be approved by the Board of Trustees or its delegate under applicable rules adopted by the U.S. Securities and Exchange Commission (“SEC”). In buying foreign securities, each Portfolio may convert U.S. dollars into foreign currency, but only to effect securities transactions on foreign securities exchanges and not to hold such currency as an investment.
The Funds and Portfolios are investment companies and accordingly follow the investment company accounting and reporting guidance of the Financial Accounting Standards Board (“FASB”) Accounting Standards Codification Topic 946 Financial Services – Investment Companies.
| 2. | Significant Accounting Policies |
The financial statements of the Funds and Portfolios are prepared in accordance with generally accepted accounting principles in the United States of America (“U.S. GAAP”), which require the use of management estimates. Actual results could differ from those estimates. It is reasonably possible that these differences could be material. The following is a summary of the significant accounting policies consistently followed by each Fund or Portfolio in the preparation of its financial statements.
Security valuation – Each Fund records its investment in its respective Portfolio at net asset value. Each Portfolio’s investments are valued each business day by independent pricing services. Equity securities for which market quotations are available are valued at the last sale price or official closing price (closing bid price if no sale has occurred) on the primary market or exchange on which they trade. Investments in other mutual funds are valued at the net asset value per share. Fixed income securities and options are valued on the basis of the closing bid price. Futures contracts are valued at the quoted settlement price at the end of each day on the exchange upon which they are traded. Money market instruments maturing within 60 days of the valuation date are valued initially at cost and thereafter assume a constant amortization to maturity of any discount or premium. Each Portfolio may value securities for which market quotations are not readily available at “fair value,” as determined in good faith pursuant to procedures established by the Board of Trustees (the “Board”). The Board has adopted procedures concerning securities valuation, under which an Oversight Committee makes determinations as to whether market quotations are not readily available or do not otherwise accurately reflect the fair value of the security. The Oversight Committee, or a subgroup thereof, subject to oversight by the Board, may use fair value pricing in a variety of circumstances, including but not limited to, situations when trading in a security has been suspended or halted. Fair value pricing involves subjective judgments and it is possible that the fair value determination for a security is materially different than the value that could be received on the sale of the security.
Each Portfolio has adopted provisions surrounding fair value measurements and disclosures that defines fair value, establishes a framework for measuring fair value in generally accepted accounting principles and expands disclosures about fair value measurements. This applies to fair value measurements that are already required or permitted by other accounting standards and is intended to increase consistency of those measurements and applies broadly to securities and other types of assets and liabilities. In accordance with these provisions, fair value is defined as the price that a fund would receive upon selling an investment in a timely transaction to an independent buyer in the principal or most advantageous market of the investment. Various inputs are used in determining the value of the funds’ investments.
52
Table of Contents
State Street Institutional Investment Trust
Notes to Financial Statements — (continued)
December 31, 2014
The three tier hierarchy of inputs is summarized below:
| • | Level 1 – quoted prices in active markets for identical securities |
| • | Level 2 – other significant observable inputs (including quoted prices for similar securities, interest rates, prepayment speeds, credit risk, etc.) |
| • | Level 3 – significant unobservable inputs (including a Portfolio’s own assumptions in determining the fair value of investments) |
Events or circumstances affecting the values of Portfolio securities that occur between the closing of the principal markets on which they trade and the time the NAV of Portfolio shares is determined may be reflected in the Trust’s calculation of NAVs for each applicable Portfolio when the Trust deems that the particular event or circumstance would materially affect such Portfolio’s NAV. Portfolios that invest primarily in frequently traded exchange-listed securities will use fair value pricing in limited circumstances since reliable market quotations will often be readily available. If market quotations are not readily available for a security or if subsequent events suggest that a market quotation is not reliable, the Portfolios will use the security’s fair value, as determined in accordance with Fair Value Procedures adopted by the Board. Portfolios that invest in foreign securities are likely to use fair value pricing more often since significant events may occur between the close of foreign markets and the time of pricing which would trigger fair value pricing of the foreign securities. Although there are observable inputs assigned on a security level, prices are derived from factors using proprietary models or matrix pricing. For this reason, significant events will cause movement between Levels 1 and 2. Portfolios that invest in low-rated debt securities are also likely to use fair value pricing more often since the markets in which such securities are traded are generally thinner, more limited and less active than those for higher rated securities. Examples of events that could trigger fair value pricing of one or more securities are: (1) market quotations are not readily available because a portfolio security is not traded in a public market or the principal market in which the security trades is closed; (2) trading in a portfolio security is suspended and not resumed prior to the time as of which the Portfolios calculate their NAV; (3) where a significant event affecting the value of a portfolio security is determined to have occurred between the time of the market quotation provided for a portfolio security and the time as of which the Portfolios calculate their NAV; (4) a security’s price has remained unchanged over an extended period of time (often referred to as a “stale price”), or (5) the Portfolios’ custodian or administrator determines that a market quotation is inaccurate.
Equities traded on inactive markets or valued by reference to similar instruments are also categorized as Level 2 of the fair value hierarchy.
The NAV of a portfolio that includes foreign securities may change on days when shareholders will not be able to purchase or redeem Portfolio shares, since foreign securities can trade on non-business days.
53
Table of Contents
State Street Institutional Investment Trust
Notes to Financial Statements — (continued)
December 31, 2014
The following is a summary of the inputs used as of December 31, 2014, in valuing the assets carried at fair value of each Portfolio:
| State Street Aggregate Bond Index Portfolio | Quoted Prices in Active Markets for Identical Assets (Level 1) | Significant Other Observable Inputs (Level 2) | Significant (Level 3) | Total | ||||||||||||
INVESTMENTS: | ||||||||||||||||
Corporate Bonds | $ | – | $ | 21,153,141 | $ | – | $ | 21,153,141 | ||||||||
Foreign Government Obligations | – | 1,786,253 | – | 1,786,253 | ||||||||||||
U.S. Government Agency MBS TBA | – | 18,682,082 | – | 18,682,082 | ||||||||||||
U.S. Government Agency Obligations | – | 7,372,157 | – | 7,372,157 | ||||||||||||
U.S. Treasury Obligations | – | 28,817,972 | – | 28,817,972 | ||||||||||||
Commercial Mortgage Backed Securities | – | 961,602 | – | 961,602 | ||||||||||||
Asset Backed Securities | – | 413,627 | – | 413,627 | ||||||||||||
Municipal Bonds & Notes | – | 158,003 | – | 158,003 | ||||||||||||
Short Term Investments | 19,953,875 | – | – | 19,953,875 | ||||||||||||
|
|
|
|
|
|
|
| |||||||||
TOTAL INVESTMENTS | $ | 19,953,875 | $ | 79,344,837 | $ | – | $ | 99,298,712 | ||||||||
|
|
|
|
|
|
|
| |||||||||
| State Street Global Equity ex-U.S. Index Portfolio | Quoted Prices in Active Markets for Identical Assets (Level 1) | Significant Other Observable Inputs (Level 2) | Significant (Level 3) | Total | ||||||||||||
INVESTMENTS: | ||||||||||||||||
Common Stocks | $ | 5,426,821 | $ | 42,865,956 | $ | – | $ | 48,292,777 | ||||||||
Rights | 3,096 | – | – | 3,096 | ||||||||||||
Short Term Investments | 597,024 | – | – | 597,024 | ||||||||||||
|
|
|
|
|
|
|
| |||||||||
TOTAL INVESTMENTS | $ | 6,026,941 | $ | 42,865,956 | $ | – | $ | 48,892,897 | ||||||||
|
|
|
|
|
|
|
| |||||||||
The Funds investments in the corresponding Portfolios are valued at Level 1 of the hierarchy.
Changes in valuation techniques may result in transfers in or out of an investment’s assigned level within the hierarchy. Transfers between fair value hierarchy levels are recognized at the end of the period. For the period ended December 31, 2014, there were no transfers between levels.
Investment transactions – Investment transactions are recorded on the trade date basis. Realized gains and losses from the sale of disposition of securities and foreign exchange transactions are recorded on the identified cost basis. Corporate actions (including cash dividends) are recorded net of foreign tax withholdings on the ex-dividend date. Class specific distribution and shareholder servicing fees are borne by each class. Income, non-class specific expenses, and realized gains and losses are allocated to the respective classes daily on the basis of relative net assets.
Investment Income – Dividend income is recorded on the ex-dividend date. Income and capital gains distributions received from the Portfolios by the Funds are recorded on the ex-dividend date. The value of additional securities received as dividend payments is recorded as income and as an increase to the
54
Table of Contents
State Street Institutional Investment Trust
Notes to Financial Statements — (continued)
December 31, 2014
cost basis of such securities. Interest income is recorded on the accrual basis. All premiums and discounts are amortized or accreted for financial reporting purposes.
Futures – The State Street Global Equity ex-U.S. Index Portfolio may enter into financial futures contracts. Upon entering into a futures contract, the Portfolio is required to deposit with the broker cash or securities in an amount equal to a certain percentage of the contract amount. Variation margin payments are made or received by the Portfolio each day, depending on the daily fluctuations in the value of the underlying security or index, and are recorded for financial statement purposes as unrealized gains or losses by the Portfolio, which is recorded on the Statement of Assets and Liabilities. The Portfolio recognizes a realized gain or loss when the contract is closed, which is recorded on the Statement of Operations. The Portfolio voluntarily segregates securities in an amount equal to the outstanding value of the open futures contracts in accordance with Securities and Exchange Commission requirements.
The Portfolio adopted provisions surrounding Derivatives and Hedging which requires qualitative disclosures about objectives and strategies for using derivatives, quantitative disclosures about fair value amounts of gains and losses on derivative instruments, and disclosures about credit-risk-related contingent features in derivative agreements.
The primary risks associated with the use of futures contracts are an imperfect correlation between the change in market value of the benchmark and the prices of futures contracts and the possibility of an illiquid market. To the extent permitted by the investment objective, restrictions and policies set forth in the Portfolio’s Prospectus and Statement of Additional Information, the Portfolio may participate in various derivative-based transactions. Derivative securities are instruments or agreements whose value is derived from an underlying security or index. The Portfolio’s use of derivatives includes futures. These instruments offer unique characteristics and risks that assist the Portfolio in meeting its investment objective. The Portfolio typically uses derivatives in two ways: cash equitization and return enhancement. Cash equitization is a technique that may be used by the Portfolio through the use of options and futures to earn “market-like” returns with the Portfolio’s excess and liquidity reserve cash balances and receivables. Return enhancement can be accomplished through the use of derivatives in the Portfolio. By purchasing certain instruments, the Portfolio may more effectively achieve the desired Portfolio characteristics that assist in meeting the Portfolio’s investment objectives. Depending on how the derivatives are structured and utilized, the risks associated with them may vary widely. These risks are generally categorized as market risk, liquidity risk and counterparty or credit risk.
The following table, grouped into appropriate risk categories, discloses the amounts related to the Portfolio’s use of derivative instruments and hedging activities at December 31, 2014:
Liability Derivatives(1)
Equity Contracts Risk | Total | |||||
Futures Contracts | $8,500 | $ | 8,500 | |||
55
Table of Contents
State Street Institutional Investment Trust
Notes to Financial Statements — (continued)
December 31, 2014
Transactions in derivative instruments during the period ended December 31, 2014, were as follows:
Realized Gain (Loss)(2)
Equity Contracts Risk | Total | |||||
Futures Contracts | $(36,768) | $ | (36,768 | ) | ||
Change in Appreciation (Depreciation)(3)
Equity Contracts Risk | Total | |||||
Futures Contracts | $(8,500) | $ | (8,500 | ) | ||
| (1) | Portfolio of Investments: Unrealized depreciation of futures contracts. Only unsettled receivable/payable for variation margin is reported within Statement of Assets and Liabilities. |
| (2) | Statement of Operations location: Net realized gain (loss) on: Futures contracts |
| (3) | Statement of Operations location: Net change in unrealized appreciation (depreciation) on: Futures contracts |
The average notional of futures outstanding during the period ended December 31, 2014 was $619,604.
Foreign Currency Translation and Foreign Investments – The accounting records of the Funds and Portfolios are maintained in U.S. dollars. Portfolio securities and other assets and liabilities denominated in a foreign currency are translated to U.S. dollars at the prevailing rates of exchange at period end. Purchases and sales of securities, income receipts and expense payments are translated into U.S. dollars at the prevailing exchange rate on the respective dates of transactions. The effects of changes in foreign currency exchange rates on portfolio investments are included in the net realized and unrealized gains and losses on investments and foreign currency transaction on the Statements of Operations. Net gains and losses on foreign currency transactions include disposition of foreign currencies, and currency gains and losses between the accrual and receipt dates of portfolio investment income and between the trade and settlement dates of portfolio investment transactions.
Investing in securities of foreign companies and foreign governments involves special risks and considerations not typically associated with investing in U.S. companies and securities of the U.S. governments. These risks include revaluation of currencies and the risk of expropriation. Moreover, the markets for securities of many foreign companies and foreign governments may be less liquid and the prices of such securities may be more volatile than those of comparable U.S. companies and the U.S. government.
Some foreign markets in which the Portfolios invest are considered emerging markets. Investment in these emerging markets subjects a Portfolio to a greater risk of loss than investments in a developed market. This is due to, among other things, greater market volatility, lower trading volume, political and economic instability, higher levels of inflation, deflation or currency devaluation, greater risk of market shut down, and more governmental limitations on foreign investment policy than those typically found in a developed market.
Mortgage Dollar Rolls – The State Street Aggregate Bond Index Portfolio may enter into mortgage dollar roll transactions with respect to mortgage-backed securities for delivery in the current month and simultaneously contract to repurchase similar, but not identical, securities on a fixed date.
56
Table of Contents
State Street Institutional Investment Trust
Notes to Financial Statements — (continued)
December 31, 2014
The counterparty receives all principal and interest payments, including prepayments, made on the security while it is the holder. The Portfolio receives compensation as consideration for entering into the commitment to repurchase.
The compensation is paid in the form of a lower price for the security upon its repurchase, or alternatively, a fee. Mortgage dollar rolls may be renewed with a new sale and repurchase price and a cash settlement made at each renewal without physical delivery of the securities subject to the contract. Certain risks may arise upon entering into mortgage dollar rolls from the potential inability of counterparties to meet the terms of their commitments.
Additionally, the value of such securities may change adversely before the Portfolio is able to repurchase them. There can be no assurance that the Portfolio’s use of the cash that it receives form a mortgage dollar roll will provide a return that exceeds its costs. The Portfolio’s use of to-be announced (“TBA”) mortgage dollar rolls may cause the funds to experience higher transaction costs.
Dividends and distributions – Dividends from net investment income are declared and paid at least monthly by the State Street Aggregate Bond Index Fund and the State Street Aggregate Bond Index Portfolio and annually by the State Street Global Equity ex-U.S. Index Fund and the State Street Global Equity ex-U.S. Index Portfolio. Net realized capital gains, if any, are distributed annually, unless additional distributions are required for compliance with applicable tax regulations.
Expense allocation – Certain expenses are applicable to multiple funds within the Trust. Expenses directly attributable to a fund are charged to that fund. Expenses of the Trust that are not directly attributed to a fund are allocated among the funds, on the basis of relative net assets, except where a more appropriate allocation of expenses to each of the funds can otherwise be made.
Federal income taxes – Each Fund and Portfolio intends to qualify for and elect treatment as a regulated investment company under Subchapter M of the Internal Revenue Code of 1986, as amended. By so qualifying and electing, the Funds and Portfolios will not be subject to federal income taxes to the extent they distribute their taxable income, including any net realized capital gains, for each fiscal year. In addition, by distributing during each calendar year substantially all of their net taxable income and capital gains, if any, the Funds and Portfolios will not be subject to federal excise tax.
For the period ended December 31, 2014, permanent differences identified and reclassified among the components of net assets were as follows:
| Fund | Paid-In Capital | Accumulated Gain (Loss) | Undistributed Net Investment Income (Loss) | |||||||||
State Street Aggregate Bond Index Fund | $ | (196 | ) | $ | (155,412 | ) | $ | 155,608 | ||||
State Street Global Equity ex-U.S. Index Fund | $ | (114 | ) | $ | – | $ | 114 | |||||
State Street Aggregate Bond Index Portfolio | $ | – | $ | (810 | ) | $ | 810 | |||||
State Street Global Equity ex-U.S. Index Portfolio | $ | (29,283 | ) | $ | (17,776 | ) | $ | 47,059 | ||||
These differences were primarily attributable to distribution redesignations. Net investment income (loss), net realized gains (losses), and net assets were not affected by these reclassifications.
57
Table of Contents
State Street Institutional Investment Trust
Notes to Financial Statements — (continued)
December 31, 2014
At December 31, 2014, the Funds and Portfolios had capital loss carryovers are as follows:
| Fund | Non-Expiring Short Term | Non-Expiring Long Term | Total | |||||||||
State Street Aggregate Bond Index Fund | $ | – | $ | – | $ | – | ||||||
State Street Global Equity ex-U.S. Index Fund | $ | 872 | $ | – | $ | 872 | ||||||
State Street Aggregate Bond Index Portfolio | $ | – | $ | – | $ | – | ||||||
State Street Global Equity ex-U.S. Index Portfolio | $ | 16,117 | $ | 27,161 | $ | 43,278 | ||||||
At December 31, 2014, the cost of investments and the comparison of unrealized appreciation and depreciation of investments for federal income tax purpose are as follows:
| Fund | Tax Cost | Gross Unrealized Appreciation | Gross Unrealized Depreciation | Net Unrealized Appreciation (Depreciation) | ||||||||||||
State Street Aggregate Bond Index Fund | $ | 74,852,980 | $ | 623,801 | $ | – | $ | 623,801 | ||||||||
State Street Global Equity ex-U.S. Index Fund | $ | 44,582,430 | $ | – | $ | 3,701,983 | $ | (3,701,983 | ) | |||||||
State Street Aggregate Bond Index Portfolio | $ | 98,787,098 | $ | 678,385 | $ | 166,771 | $ | 511,614 | ||||||||
State Street Global Equity ex-U.S. Index Portfolio | $ | 52,746,752 | $ | 758,032 | $ | 4,611,887 | $ | (3,853,855 | ) | |||||||
The tax character of distributions paid to shareholders during the period ended December 31, 2014 was as follows:
| Fund | Ordinary Income | Long-Term Capital Gain | Total | |||||||||
State Street Aggregate Bond Index Fund | $ | 385,601 | $ | – | $ | 385,601 | ||||||
State Street Global Equity ex-U.S. Index Fund | $ | 241,641 | $ | – | $ | 241,641 | ||||||
State Street Aggregate Bond Index Portfolio | $ | 410,598 | $ | – | $ | 410,598 | ||||||
State Street Global Equity ex-U.S. Index Portfolio | $ | 284,533 | $ | – | $ | 284,533 | ||||||
At December 31, 2014, the components of distributable earnings on a tax basis were as follows:
| Fund | Undistributed Ordinary Income | Capital Loss Carryover | Total | |||||||||
State Street Aggregate Bond Index Fund | $ | – | $ | – | $ | – | ||||||
State Street Global Equity ex-U.S. Index Fund | $ | – | $ | (872 | ) | $ | (872 | ) | ||||
State Street Aggregate Bond Index Portfolio | $ | 138,890 | $ | – | $ | 138,890 | ||||||
State Street Global Equity ex-U.S. Index Portfolio | $ | – | $ | (43,278 | ) | $ | (43,278 | ) | ||||
58
Table of Contents
State Street Institutional Investment Trust
Notes to Financial Statements — (continued)
December 31, 2014
The Funds and Portfolios have reviewed the tax positions for open years as of December 31, 2014, and determined they did not have a liability for any unrecognized tax expenses. The Funds and Portfolios recognize interest and penalties, if any, related to tax liabilities as income tax expense in the Statements of Operations. As of December 31, 2014, the Funds’ and Portfolios’ federal tax returns for the initial year remain subject to examination by the Funds’ and Portfolios’ major tax jurisdictions, which include the United States of America and the Commonwealth of Massachusetts.
| 3. | Securities Transactions |
For the period ended December 31, 2014, the Portfolios had purchases and sales of investment securities (excluding short-term securities) as follows:
| U.S. Government Obligations | Other Securities | |||||||||||||||
| Fund | Purchases | Sales | Purchases | Sales | ||||||||||||
State Street Aggregate Bond Index Portfolio | $ | 68,504,109 | $ | 42,767,865 | $ | 57,394,072 | $ | 4,449,816 | ||||||||
State Street Global Equity ex-U.S. Index Portfolio | $ | – | $ | – | $ | 125,857,186 | $ | 127,408 | ||||||||
| 4. | Related Party and Other Fees |
The Funds and Portfolios retained SSGA FM, a subsidiary of State Street Corporation and an affiliate of State Street Bank and Trust Company (“State Street”), as their investment adviser. Each Fund has entered into an investment advisory agreement with the Adviser, under which the Adviser directs the investments of the Funds in accordance with their investment objectives, policies, and limitations. In compensation for the Adviser’s services as investment adviser, the State Street Global Equity ex-U.S. Index Fund pays the Adviser a management fee at an annual rate of 0.06% of its average daily net assets and the State Street Aggregate Bond Index Fund pays the Adviser a management fee at an annual rate of 0.03% of its average daily net assets. The Portfolios pay no investment advisory fees to SSGA FM.
SSGA FM is contractually obligated until April 30, 2016, to waive its management fee and/or to reimburse each Fund for expenses to the extent that total expenses (exclusive of non-recurring account fees, extraordinary expenses, acquired fund fees, any class-specific expenses, such as distribution, shareholder servicing, sub-transfer agency and administration fees) exceed 0.01% of average daily net assets on an annual basis. SSGA FM is contractually obligated until April 30, 2016, to waive its management fee and/or to reimburse each Portfolio for expenses to the extent that total expenses (exclusive of non-recurring account fees, extraordinary expenses, and acquired fund fees) exceed 0.04% of average daily net assets on an annual basis. This waiver and/or reimbursement may not be terminated during the relevant period except with the approval of the fund’s Board of Trustees.
For the period ended December 31, 2014, SSGA FM reimbursed or waived the fees under these agreements as shown on the respective Statement of Operations.
During the period ended December 31, 2014, the Adviser made contributions of $25,627 and $7,401 to the State Street Aggregate Bond Index Portfolio and State Street Global Equity ex-US Portfolio, respectively. The contributions were made to offset market value changes and transaction costs impacting certain initial shareholders. The amounts appear as Voluntary contribution from Adviser on the Statements of Operations within the Realized and Unrealized Gain (Loss) section.
59
Table of Contents
State Street Institutional Investment Trust
Notes to Financial Statements — (continued)
December 31, 2014
Pursuant to the administration agreement, the Funds each pay a fee at an annual rate of 0.05% of the respective Fund’s net assets accrued daily to SSGA FM. During the period ended December 31, 2014, the administration fees incurred are shown on the respective Statement of Operations.
State Street is the administrator, custodian, transfer agent and dividend disbursing agent for the Portfolios. In compensation for these services, the Portfolios pay State Street an annual fee, which is included in Administration and custody fees on the Statement of Operations. The fee accrued daily and payable monthly, and is calculated as the greater of an asset-based fee or a minimum fee. The minimum fee is calculated by multiplying the minimum per fund fee by the number of funds in the State Street Master Funds Trust plus the number of stand-alone funds in the State Street Institutional Investment Trust to arrive at the total minimum fee. The asset-based fee is calculated at the following rates:
| Asset Levels | Annual percentage of average aggregate daily net assets | |
First $400 million | 0.03% | |
Next $15 billion | 0.02% | |
Thereafter | 0.01% | |
Minimum annual fee | $150,000 |
Boston Financial Data Services (“BFDS”), a joint venture of DST Systems, Inc. and State Street Corporation, serves as transfer agent and dividend disbursing agent to the Funds. For these services, the Funds pay annual account services fees, activity-based fees, charges related to compliance and regulatory services, and a minimum fee of $200 for each Fund.
The Funds have adopted a distribution plan pursuant to Rule 12b-1 under the 1940 Act under which a Fund may compensate its distributor (or others) for services in connection with the distribution of the Fund’s Class A shares and for services provided to Fund shareholders (the “Plan”). The Plan calls for payments at an annual rate (based on average daily net assets) of 0.25% of the Fund’s net assets attributable to its Class A shares. Because these fees are paid out of the assets of a Fund attributable to its Class A shares on an ongoing basis, they will increase the cost of your investment and may cost you more over time than paying other types of sales charges.
Subject to the supervision of the Board of Trustees, the Trust may engage, directly or indirectly, in financing any activities relating to shareholder account administrative and servicing functions, including without limitation making payments to Agents for one or more of the following activities: (a) answering inquiries regarding account status and history, the manner in which purchases and redemptions of each Class may be effected, and certain other matters pertaining to the Trust; (b) assisting in designating and changing dividend options, account designations and addresses; (c) providing necessary personnel and facilities to establish and maintain certain shareholder accounts and records, as requested from time to time by the Trust; (d) assisting in processing purchase and redemption transactions; (e) arranging for the wiring of funds; (f) transmitting and receiving funds in connection with orders to purchase or redeem a Class of shares; (g) verifying and guaranteeing signatures in connection with redemption orders, transfers among and changes in designated accounts; (h) providing periodic statements showing account balances and, to the extent practicable, integration of such information with other client transactions otherwise effected with or through the Agent; (i) furnishing (either separately or on an integrated basis with other reports sent by the Agent) monthly and annual statements and confirmations of all purchases
60
Table of Contents
State Street Institutional Investment Trust
Notes to Financial Statements — (continued)
December 31, 2014
and redemptions of a Class of shares in an account; (j) transmitting proxy statements, annual reports, prospectuses and other communications from the Trust; (k) receiving, tabulating and transmitting to the Trust proxies executed with respect to special meetings of shareholders of the Trust; and (l) providing such other related services as the Trust or customers of the Agent may reasonably request.
The Funds also pay a sub-transfer agent fees at an annual rate of 0.20% of the Fund’s average daily net assets attributable to on Class A and I for recordkeeping, shareholder servicing, or administrative services provided by financial intermediaries.
| 5. | Trustees’ Fees |
Independent Trustees are compensated on a calendar year basis. Any Trustee who is deemed to be an “interested person” (as defined in the 1940 Act) of the Funds and Portfolios does not receive compensation from the Funds and Portfolios for his or her service as a Trustee.
Each Independent Trustee receives for his or her services to the State Street Master Funds, State Street Institutional Investment Trust and SSGA Funds, a $141,500 annual base retainer in addition to $18,000 for each in-person meeting and $2,000 for each telephonic meeting from the Trust. The Trust will bear a pro rata allocation based on the Trust’s average monthly assets. The Co-Chairmen each receive an additional $44,000 annual retainer. The Independent Trustees are reimbursed for travel and other out-of-pocket expenses in connection with meeting attendance. As of the date of this Report, the Trustees were not paid pension or retirement benefits as part of the Trust’s expenses.
The Trust’s officers are compensated by the Adviser and its affiliates.
| 6. | Indemnifications |
The Trust’s organizational documents provide that its officers and trustees are indemnified against certain liabilities arising out of the performance of their duties to the Trust. In addition, both in some of its principal service contracts and in the normal course of its business, the Trust enters into contracts that provide indemnifications to other parties for certain types of losses or liabilities. The Trust’s maximum exposure under these arrangements is unknown as this could involve future claims against the Trust. Management does not expect any significant claims.
61
Table of Contents
Report of Independent Registered Public Accounting Firm
To the Board of Trustees and Shareholders of
State Street Institutional Investment Trust:
We have audited the accompanying statements of assets and liabilities of State Street Aggregate Bond Index Fund and State Street Global Equity ex-U.S. Index Fund (collectively, the “Funds”), and State Street Aggregate Bond Index Portfolio and State Street Global Equity ex-U.S. Index Portfolio (collectively, the “Portfolios”) (four of the series constituting the State Street Institutional Investment Trust), including the portfolios of investments of the Portfolios, as of December 31, 2014, and the related statements of operations, the statements of changes in net assets, and the financial highlights for each of the periods indicated therein. These financial statements and financial highlights are the responsibility of the Funds’ and Portfolios’ management. Our responsibility is to express an opinion on these financial statements and financial highlights based on our audits.
We conducted our audits in accordance with the standards of the Public Company Accounting Oversight Board (United States). Those standards require that we plan and perform the audit to obtain reasonable assurance about whether the financial statements and financial highlights are free of material misstatement. We were not engaged to perform an audit of the Funds’ and Portfolios’ internal control over financial reporting. Our audits included consideration of internal control over financial reporting as a basis for designing audit procedures that are appropriate in the circumstances, but not for the purpose of expressing an opinion on the effectiveness of the Funds’ and Portfolios’ internal control over financial reporting. Accordingly, we express no such opinion. An audit also includes examining, on a test basis, evidence supporting the amounts and disclosures in the financial statements and financial highlights, assessing the accounting principles used and significant estimates made by management, and evaluating the overall financial statement presentation. Our procedures included confirmation of securities owned as of December 31, 2014, by correspondence with the custodian and others or by other appropriate auditing procedures where replies from others were not received. We believe that our audits provide a reasonable basis for our opinion.
In our opinion, the financial statements and financial highlights referred to above present fairly, in all material respects, the financial position of State Street Aggregate Bond Index Fund, State Street Global ex-U.S. Equity Index Fund, State Street Aggregate Bond Index Portfolio and State Street Equity 500 Index Portfolio (four of the series constituting State Street Institutional Investment Trust) at December 31, 2014, and the results of their operations, the changes in their net assets and the financial highlights for each of the periods indicated therein, in conformity with U.S. generally accepted accounting principles.

Boston, Massachusetts
March 2, 2015
62
Table of Contents
State Street Institutional Investment Trust
Other Information
December 31, 2014
EXPENSE EXAMPLE
As a shareholder of a fund (the “Funds”), you incur ongoing costs, which include costs for administrative services and to the extent applicable, distribution (12b-1) fees, among others. This example is intended to help you understand your ongoing costs (in dollars) of investing in the Funds and to compare these costs with the ongoing costs of investing in other mutual funds. It is based on an investment of $1,000 made at the beginning of the period shown and held for the entire period from July 1, 2014 to December 31, 2014.
The table below illustrates your Fund’s costs in two ways:
| • | Based on actual fund return – This section helps you to estimate the actual expenses that you paid over the period. The “Ending Account Value” shown is derived from the Fund’s actual return, and the third column shows the dollar amount that would have been paid by an investor who started with $1,000 in the Fund. You may use the information here, together with the amount you invested, to estimate the expenses that you paid over the period. To do so, simply divide your account value by $1,000 (for example, an $8,600 account value divided by $1,000 = 8.6), then multiply the result by the number given for the Fund under the heading “Expenses Paid During Period”. |
| • | Based on hypothetical 5% return – This section is intended to help you compare your Fund’s costs with those of other mutual funds. It assumes that the Fund had a yearly return of 5% before expenses, but that the expense ratio is unchanged. In this case, because the return used is not the Fund’s actual return, the results do not apply to your investment. The example is useful in making comparisons because the U.S. Securities and Exchange Commission requires all mutual funds to calculate expenses based on a 5% return. You can assess your Fund’s costs by comparing this hypothetical example with the hypothetical examples that appear in shareholder reports of other funds. |
| Class A Shares | Beginning Account Value July 1, 2014 | Ending Account Value December 31, 2014 | Expenses Paid During Period * | |||||||||
Based on Actual Fund Return | ||||||||||||
State Street Aggregate Bond Index Fund** | $ | 1,000.00 | $ | 1,018.50 | $ | 1.51 | ||||||
State Street Global Equity ex-U.S. Index Fund*** | $ | 1,000.00 | $ | 921.20 | $ | 1.65 | ||||||
| Class A Shares | Beginning Account Value July 1, 2014 | Ending Account Value December 31, 2014 | Expenses Paid During Period * | |||||||||
Based on Hypothetical (5% return before expenses) | ||||||||||||
State Street Aggregate Bond Index Fund** | $ | 1,000.00 | $ | 1,022.58 | $ | 2.65 | ||||||
State Street Global Equity ex-U.S. Index Fund*** | $ | 1,000.00 | $ | 1,022.20 | $ | 3.04 | ||||||
63
Table of Contents
State Street Institutional Investment Trust
Other Information — (continued)
December 31, 2014
| * | The calculations are based on expenses incurred in the most recent six month period of each Fund. Each Fund’s Class A Shares’ annualized expense ratio as of December 31, 2014, which includes each Fund’s proportionate share of the expenses of its respective Portfolio, was as follows: |
State Street Aggregate Bond Index Fund** | 0.52% | |||
State Street Global Equity ex-U.S. Index Fund*** | 0.60% |
| The dollar amount show as “Expenses Paid” are equal to the annualized expense ratio multiplied by the average account value over the period, multiplied by 184/365 (the most recent six month period). |
| ** | Actual period is from commencement of operations 9/19/14. Hypothetical period is from 7/1/14. |
| *** | Actual period is from commencement of operations 9/17/14. Hypothetical period is from 7/1/14. |
Six Months Ended December 31, 2014
| Class I Shares | Beginning Account Value July 1, 2014 | Ending Account Value December 31, 2014 | Expenses Paid During Period * | |||||||||
Based on Actual Fund Return | ||||||||||||
State Street Aggregate Bond Index Fund** | $ | 1,000.00 | $ | 1,018.20 | $ | 0.81 | ||||||
State Street Global Equity ex-U.S. Index Fund*** | $ | 1,000.00 | $ | 921.90 | $ | 0.97 | ||||||
| Class I Shares | Beginning Account Value July 1, 2014 | Ending Account Value December 31, 2014 | Expenses Paid During Period * | |||||||||
Based on Hypothetical (5% return before expenses) | ||||||||||||
State Street Aggregate Bond Index Fund** | $ | 1,000.00 | $ | 1,023.79 | $ | 1.43 | ||||||
State Street Global Equity ex-U.S. Index Fund*** | $ | 1,000.00 | $ | 1,023.44 | $ | 1.79 | ||||||
| * | The calculations are based on expenses incurred in the most recent six month period of each Fund. Each Fund’s Class I Shares’ annualized expense ratio as of December 31, 2014, which includes each Fund’s proportionate share of the expenses of its respective Portfolio, was as follows: |
State Street Aggregate Bond Index Fund** | 0.28% | |||
State Street Global Equity ex-U.S. Index Fund*** | 0.35% |
| The dollar amount show as “Expenses Paid” are equal to the annualized expense ratio multiplied by the average account value over the period, multiplied by 184/365 (the most recent six month period). |
| ** | Actual period is from commencement of operations 9/19/14. Hypothetical period is from 7/1/14. |
| *** | Actual period is from commencement of operations 9/17/14. Hypothetical period is from 7/1/14. |
64
Table of Contents
State Street Institutional Investment Trust
Other Information — (continued)
December 31, 2014
Six Months Ended December 31, 2014
| Class K Shares | Beginning Account Value July 1, 2014 | Ending Account Value December 31, 2014 | Expenses Paid During Period * | |||||||||
Based on Actual Fund Return | ||||||||||||
State Street Aggregate Bond Index Fund** | $ | 1,000.00 | $ | 1,019.70 | $ | 0.26 | ||||||
State Street Global Equity ex-U.S. Index Fund*** | $ | 1,000.00 | $ | 922.40 | $ | 0.41 | ||||||
| Class K Shares | Beginning Account Value July 1, 2014 | Ending Account Value December 31, 2014 | Expenses Paid During Period * | |||||||||
Based on Hypothetical (5% return before expenses) | ||||||||||||
State Street Aggregate Bond Index Fund** | $ | 1,000.00 | $ | 1,024.75 | $ | 0.46 | ||||||
State Street Global Equity ex-U.S. Index Fund*** | $ | 1,000.00 | $ | 1,024.45 | $ | 0.77 | ||||||
| * | The calculations are based on expenses incurred in the most recent six month period of each Fund. Each Fund’s Class K Shares’ annualized expense ratio as of December 31, 2014, which includes each Fund’s proportionate share of the expenses of its respective Portfolio, was as follows: |
State Street Aggregate Bond Index Fund** | 0.09% | |||
State Street Global Equity ex-U.S. Index Fund*** | 0.15% |
| The dollar amount show as “Expenses Paid” are equal to the annualized expense ratio multiplied by the average account value over the period, multiplied by 184/365 (the most recent six month period). |
| ** | Actual period is from commencement of operations 9/19/14. Hypothetical period is from 7/1/14. |
| *** | Actual period is from commencement of operations 9/17/14. Hypothetical period is from 7/1/14. |
Six Months Ended December 31, 2014
Beginning July 1, 2014 | Ending Account Value December 31, 2014 | Expenses Paid During Period * | ||||||||||
Based on Actual Portfolio Return | ||||||||||||
State Street Aggregate Bond Index Portfolio** | $ | 1,000.00 | $ | 1,020.00 | $ | 0.12 | ||||||
State Street Global Equity ex-U.S. Index Portfolio*** | $ | 1,000.00 | $ | 922.80 | $ | 0.36 | ||||||
Based on Hypothetical (5% return before expenses) | ||||||||||||
State Street Aggregate Bond Index Portfolio** | $ | 1,000.00 | $ | 1,025.00 | $ | 0.20 | ||||||
State Street Global Equity ex-U.S. Index Portfolio*** | $ | 1,000.00 | $ | 1,024.55 | $ | 0.66 | ||||||
65
Table of Contents
State Street Institutional Investment Trust
Other Information — (continued)
December 31, 2014
| * | The calculations are based on expenses incurred in the most recent six month period of the Portfolios. Each Portfolio’s annualized expense ratio for the six months ended December 31, 2014 was as follows: |
State Street Aggregate Bond Index Portfolio | 0.04% | |||
State Street Global Equity ex-U.S. Index Portfolio | 0.13% |
| The dollar amounts shown as “Expenses Paid” are equal to the annualized expense ratio multiplied by the average account value over the period, multiplied by 184/365 (the most recent six month period). |
| ** | Actual period is from commencement of operations 9/19/14. Hypothetical period is from 7/1/14. |
| *** | Actual period is from commencement of operations 9/17/14. Hypothetical period is from 7/1/14. |
Qualified Dividend Income
A portion of dividends distributed by the Funds during the fiscal period ended December 31, 2014, are considered qualified dividend income, and are eligible for reduced tax rates. These lower rates range from 5% to 20% depending on the individual’s tax bracket. These amounts are noted below:
| Fund | Amount | |||
State Street Global Equity ex-U.S. Index Fund | $ | 172,978 | ||
State Street Global Equity ex-U.S. Index Portfolio | $ | 236,275 | ||
The amount which represent income derived from sources within, and taxes paid to, foreign countries or possessions of the United States are as follows:
| Fund | Foreign Taxes | Foreign Source Income | ||||||
State Street Global Equity ex-U.S. Index Portfolio | $ | 20,293 | $ | 273,190 | ||||
State Street Global Equity ex-U.S. Index Fund | $ | 18,524 | $ | 249,373 | ||||
This information and distribution reported herein may differ from the information and distributions taxable to the shareholders for the calendar year ending December 31, 2014.
Complete information will be computed and reported in conjunction with your 2014 Form 1099-DIV.
At December 31, 2014, the State Street Global Equity ex-U.S. Index Fund had foreign tax credits in the amount of $18,524 and the State Street Global Equity ex-U.S. Index Portfolio had foreign tax credits in the amount of $20,293.
Proxy Voting Policies and Procedures and Record
Information regarding the Fund’s proxy voting policies and procedures, as well as information regarding how the Fund voted proxies, if any, during the most recent 12-month period ended June 30 is available without charge (1) by calling 1-877-521-4083 (toll free), or (2) on the website of the U.S. Securities and Exchange Commission (“SEC”) at www.sec.gov.
Quarterly Portfolio Schedule
The Fund files a complete schedule of portfolio holdings with the SEC for the first and third quarters of each fiscal year on Form N-Q. The Fund’s Forms N-Q are available on the SEC’s website at
66
Table of Contents
State Street Institutional Investment Trust
Other Information — (continued)
December 31, 2014
www.sec.gov and may be reviewed and copied at the SEC’s Public Reference Room in Washington, DC. Information on the operation of the Public Reference Room may be obtained by calling 1-800-SEC-0330. The information on Form N-Q is available upon request, without charge, by calling 1-877-521-4083 (toll-free).
Advisory Agreement Renewal
TRUSTEE CONSIDERATIONS IN APPROVING CONTINUATION OF INVESTMENT ADVISORY AND SUB-ADVISORY AGREEMENTS1
Overview of the Contract Review Process
Under the Investment Company Act of 1940, an investment advisory agreement between a mutual fund and its investment adviser or sub-adviser may continue in effect from year to year only if its continuance is approved at least annually by the fund’s board of trustees, including by a vote of a majority of those trustees who are not “interested persons” of the fund (commonly referred to as, the “Independent Trustees”) cast in person at a meeting called for the purpose of considering such approval.
Consistent with these requirements, the Independent Trustees on the Board of Trustees (the “Board”) of the State Street Master Funds and State Street Institutional Investment Trust (each a “Trust” and together, the “Trusts”), met in Executive Sessions on March 20, 2014, April 14, 2014 and June 19, 2014 to consider a proposal to approve, with respect to each portfolio series of the each Trust (each, a “Fund” and collectively, the “Funds”), the initial approval an investment agreement and sub-advisory agreement for certain Funds and, for certain funds, the continuation of the investment advisory agreement and sub-advisory agreements, as applicable, with SSgA Funds Management, Inc. (the “Adviser”), and, for certain funds, CBRE Clarion Securities, LLC (the “Sub-Adviser”) (the “Advisory Agreements”). Prior to voting on the proposal, the Independent Trustees, as well as the Trustees who are “interested persons” of the Adviser, reviewed information furnished by the Adviser and Sub-Adviser and others reasonably necessary to permit the Board to evaluate the proposal fully. Such information included, among other things, the following:
Information about Performance, Expenses and Fees
| • | A report prepared by an independent provider of investment company data, which includes for each Fund: |
| ¡ | Comparisons of the Fund’s performance over the past one-, three-, five- and ten-year periods ended March 31, 2014, as applicable, to the performance of an appropriate |
| 1 | Over the course of more than 15 years, the Independent Trustees have identified numerous relevant issues, factors and concerns (“issues, factors and concerns”) that they consider each year in connection with the proposed continuation of the advisory and sub-advisory agreements, the administration agreement, the distribution plans, the distribution agreement and various related-party service agreements (the “annual review process”). The statement of issues, factors and concerns and the related conclusions of the Independent Trustees may not change substantially from year to year. However, the information requested by, and provided to, the Independent Trustees with respect to the issues, factors and concerns and on which their conclusions are based is updated annually and, in some cases, may differ substantially from the previous year. The Independent Trustees schedule annually a separate in-person meeting that is dedicated to the annual review process (the “special meeting”). At the special meeting and throughout the annual review process, the Independent Trustees take a fresh look at each of the issues, factors and concerns in light of the latest available information and each year present one or more sets of comments and questions to management with respect to specific issues, factors and concerns. Management responds to such comments and questions to the satisfaction of the Independent Trustee before the annual review process is completed and prior to the Independent Trustees voting on proposals to approve continuation of the agreements and plans. |
67
Table of Contents
State Street Institutional Investment Trust
Other Information — (continued)
December 31, 2014
Advisory Agreement Renewal — (continued)
benchmark for the Fund and a universe of other mutual funds with similar investment objectives and policies; |
| ¡ | Comparisons of the Fund’s expense ratio (with detail of component expenses) to the expense ratios of a group of comparable mutual funds selected by the independent data provider; |
| ¡ | A chart showing the Fund’s historical average net assets relative to its total expenses, management fees, and non-management expenses over the past five years, as applicable; and |
| ¡ | Comparisons of the Fund’s contractual management fee to the contractual management fees of comparable mutual funds at different asset levels. |
| • | Comparative information concerning fees charged by the Adviser for managing institutional accounts using investment strategies and techniques similar to those used in managing the Funds; and |
| • | Profitability analyses for (a) the Adviser with respect to each Fund and (b) affiliates of the Adviser that provide services to the Funds (“Affiliated Service Providers”). |
Information about Portfolio Management
| • | Descriptions of the investment management services provided by the Adviser and Sub-Adviser, as applicable, including their investment strategies and processes; |
| • | Information concerning the allocation of brokerage and the benefits received by the Adviser and Sub-Adviser, as applicable, as a result of brokerage allocation, including information concerning the acquisition of any research through “soft dollar” benefits received in connection with the Funds’ brokerage; and |
| • | Information regarding the procedures and processes used to value the assets of the Funds and the assistance provided to the administrator of the Funds by the Adviser in monitoring the effectiveness of such procedures and processes. |
Information about the Adviser
| • | Reports detailing the financial results and condition of the Sub-Adviser, and Adviser and its affiliates; |
| • | Descriptions of the qualifications, education and experience of the individual investment professionals responsible for managing the portfolios of the Funds; |
| • | A copy of each Code of Ethics adopted by the Adviser and Sub-Adviser, together with information relating to compliance with and the administration of such Codes; |
| • | A copy of the Adviser’s and Sub-Adviser’s proxy voting policies and procedures; |
| • | Information concerning the resources devoted by the Adviser to overseeing compliance by the Funds and their service providers, including the Adviser’s record of compliance with investment policies and restrictions and other operating policies of the Funds; and |
68
Table of Contents
State Street Institutional Investment Trust
Other Information — (continued)
December 31, 2014
Advisory Agreement Renewal — (continued)
| • | A description of the business continuity and disaster recovery plans of the Adviser and Sub-Adviser. |
Other Relevant Information
| • | Information concerning the nature, quality and cost of various non-investment management services provided to the Funds by affiliates of the Adviser, including the custodian, administrator, fund accountant, transfer agent and securities lending agent of the Funds, and the role of the Adviser in managing the Funds’ relationship with these service providers; |
| • | Copies of the Advisory Agreements, Sub-Advisory Agreements and agreements with other service providers of the Funds; |
| • | Draft responses to letter dated February 23, 2014 from Joseph P. Barri, LLC (counsel to the Independent Trustees reviewed prior to such date by Independent Counsel, requesting specific information, from each of: |
| ¡ | The Adviser, with respect to its operations relating to the Funds and its approximate profit margins before taxes from such operations for the Funds’ last fiscal year; and the relevant operations of other affiliated service providers to the Funds, together with their approximate profit margins from such relevant operations for the Funds’ last fiscal year; |
| ¡ | State Street Bank and Trust Company (“State Street”), the administrator, custodian, transfer agent, securities lending agent, and shareholder services for the Funds, with respect to its operations relating to the Funds; and |
| ¡ | State Street Global Markets, LLC, the principal underwriter and distributor of the shares of the Funds (the “Distributor”), with respect to its operations relating to the Funds, together with the Funds’ related distribution plans and arrangements under SEC Rule 12b-1; |
| • | Information from the Adviser, State Street and the Distributor with respect to State Street Master Funds and State Street Institutional Investment Trust providing any material changes to the previous information supplied in response to the letter dated February 23, 2014 from Joseph P. Barri, LLC prior to the Executive Session of the Board on June 19, 2014. |
| • | Excerpts from the Funds’ most recent prospectuses, statements of additional information and respective annual reports for the fiscal year ended December 31, 2013, including (i) the latest prospectus descriptions of each Fund’s investment objectives, strategies and authorized investment techniques and investments; and (ii) the latest Annual Shareholder Report for each Fund, including Portfolio Management Discussion of Performance, as prepared by its portfolio management team, together with a graphic comparison of the performance of each Fund with its benchmark index, for its fiscal year December 31, 2013; |
| • | Lipper materials dated March 2014, obtained by an Independent Trustee and circulated to the other Independent Trustees and to Independent Counsel, with respect to the Funds for which such materials were then available; and |
| • | A summary of the foregoing materials prepared by Independent Counsel. |
69
Table of Contents
State Street Institutional Investment Trust
Other Information — (continued)
December 31, 2014
Advisory Agreement Renewal — (continued)
In addition to the information identified above, the Board considered information provided from time to time by the Adviser, and other service providers of the Funds throughout the year at meetings of the Board and its committees. At such meetings, the Trustees received, among other things, presentations by the portfolio managers and other investment professionals of the Adviser relating to the performance of the Funds and the investment strategies used in pursuing each Fund’s investment objective.
The Independent Trustees were assisted throughout the contract review process by their independent legal counsel. The Independent Trustees relied upon the advice of such counsel and their own business judgment in determining the material factors to be considered in evaluating the Advisory Agreement, and the weight to be given to each such factor. The conclusions reached with respect to the Advisory Agreement were based on a comprehensive evaluation of all the information provided and not any single factor. Moreover, each Trustee may have placed varying emphasis on particular factors in reaching conclusions with respect to each Fund.
Results of the Process
Based on a consideration of the foregoing and such other information as deemed relevant, including the factors and conclusions described below, on June 19, 2014 the Board, including a majority of the Independent Trustees, voted to approve the adoption of, as applicable, and the continuation of, as applicable, the Advisory Agreements and Sub-Advisory Agreements effective July 1, 2014, for an additional year with respect to all Funds.
Nature, Extent and Quality of Services
In considering whether to approve the Advisory Agreements and Sub-Advisory Agreements, the Board evaluated the nature, extent and quality of services provided to each Fund by the Adviser and Sub-Adviser, as applicable.
The Board considered the Adviser’s and Sub-Adviser’s, as applicable, management capabilities and investment process with respect to the types of investments held by each Fund, including the education, experience and number of investment professionals and other personnel who provide portfolio management, investment research, and similar services to the Fund. The Board evaluated, where relevant, the abilities and experience of such investment personnel in analyzing particular markets, industries and specific issuers of securities in these markets and industries. The Board also considered the substantial expertise of the Adviser and Sub-Adviser, as applicable, in developing and applying proprietary quantitative models for managing various Funds that invest primarily in equity securities. With respect to those Funds that invest primarily in fixed-income securities, the Board considered the extensive experience and resources committed by the Adviser to the evaluation of credit, interest-rate and currency risks. With respect to those Funds that operate as money market mutual funds, the Board considered the Adviser’s success in maintaining the constant dollar value of each Fund through extraordinary market conditions. The Board also took into account the compensation paid to recruit and retain investment personnel, and the time and attention devoted to the Funds by senior management.
The Board reviewed the compliance programs of the Adviser, Sub-Adviser and various affiliated service providers. Among other things, the Board considered compliance and reporting matters relating to personal trading by investment personnel, selective disclosure of portfolio holdings, late trading,
70
Table of Contents
State Street Institutional Investment Trust
Other Information — (continued)
December 31, 2014
Advisory Agreement Renewal — (continued)
frequent trading, portfolio valuation, business continuity, the allocation of investment opportunities and the voting of proxies. The Board also considered the role of the Adviser in monitoring each Fund’s securities lending activities.
On the basis of the foregoing and other relevant information, the Board concluded that the Adviser and Sub-Adviser, as applicable, can be expected to continue to provide, high quality investment management and related services for the Funds.
Fund Performance
The Board compared each Fund’s investment performance to the performance of an appropriate benchmark and universe of comparable mutual funds for various time periods ended March 31, 2014.
On the basis of the foregoing and other relevant information, the Board concluded that the performance of each operational Fund is satisfactory or better (a) by comparison to the performance of its peer group funds or (b) after considering steps taken by management to improve the performance of certain Funds.
Management Fees and Expenses
The Board reviewed the contractual investment advisory fee rates payable by each Fund and actual fees paid by each Fund, net of waivers. As part of its review, the Board considered each Fund’s management fee and total expense ratio (both before and after giving effect to any expense caps), as compared to a group of similarly managed funds selected by an independent data provider. The Board also considered the comparability of the fees charged and the services provided to each Fund by the Adviser to the fees charged and services provided to other clients of the Adviser, including institutional accounts. In addition, the Board considered the willingness of the Adviser to provide undertakings from time to time to waive fees or pay expenses of various Funds to limit the total expenses borne by shareholders of such Funds. The Board also considered the fees that Adviser pays to the Sub-Adviser for its services to the applicable Funds.
On the basis of the foregoing and other relevant information, and in light of the nature, extent and quality of the services provided by the Adviser, the Board concluded that the fees and the expense ratio of each Fund compare favorably to the fees and expenses of similar mutual funds and are reasonable in relation to the services provided.
Profitability
The Board reviewed the level of profits realized by the Adviser and its affiliates in providing investment advisory and other services to each Fund and to all Funds as a group. The Board considered other direct and indirect benefits received by the Adviser and the Affiliated Service Providers in connection with their relationships with the Funds, including the benefits of research services that may be available to the Adviser as a result of securities transactions effected for the Funds and other investment advisory clients, together with the ranges of profitability of each of the Affiliated Service Providers with respect to their services to the Funds.
The Board concluded that the profitability of the Adviser with respect to each of the Funds, and the profitability range of each of the Affiliated Service Providers with respect to its services to the Funds, were reasonable in relation to the services provided.
71
Table of Contents
State Street Institutional Investment Trust
Other Information — (continued)
December 31, 2014
Advisory Agreement Renewal — (continued)
Economies of Scale
In reviewing management fees and profitability, the Board also considered the extent to which the Adviser and its affiliates, on the one hand, and each Fund and all Funds as a group, on the other hand, can expect to realize benefits from economies of scale as the assets of the Funds increase. The Board acknowledged the difficulty in accurately measuring the benefits resulting from the economies of scale with respect to the management of any specific Fund or the Funds taken as a whole. The Board concluded that, in light of the current size of each Fund and all Funds as a group, the level of profitability of the Adviser and its affiliates with respect to each Fund and all Funds as a group over various time periods, and the comparatively low management fee and expense ratio of each Fund during these periods, it does not appear that the Adviser or its affiliates has realized benefits from economies of scale in managing the assets of the Funds to such an extent that previously agreed advisory fees should be reduced or that breakpoints in such fees should be implemented for any Fund at this time.
72
Table of Contents
State Street Institutional Investment Trust
Trustees and Officers Information
December 31, 2014
Name, Address, and Year of Birth | Position(s) Held | Term of Office Time Served | Principal Occupation During Past Five Years | Number of Funds in Fund Complex Overseen by Trustee | Other Directorships Held by Trustee During | |||||
Independent Trustees | ||||||||||
Michael F. Holland State Street Financial Center One Lincoln Street Boston, YOB: 1944 | Trustee and Co-Chairman of the Board | Term: Indefinite Elected: 7/99 | Chairman, Holland & Company L.L.C. (investment adviser) (1995 – present). | 59 | Trustee, State Street Master Funds; Trustee SSGA Funds; Director, the Holland Series Fund, Inc.; Director, The China Fund, Inc.; Director, The Taiwan Fund, Inc.; Director, Reaves Utility Income Fund, Inc.; and Director, Blackstone/GSO Loan Funds. | |||||
Patrick J. Riley State Street Financial Center One Lincoln Street Boston, YOB: 1948 | Trustee and Co-Chairman of the Board | Term: Indefinite Elected: 1/14 | 2002 to May 2010, Associate Justice of the Superior Court, Commonwealth of Massachusetts; 1985 to 2002, Partner, Riley, Burke & Donahue, L.L.P. (law firm); 1998 to Present, Independent Director, State Street Global Advisers Ireland, Ltd. (investment company); 1998 to Present, Independent Director, SSGA Liquidity plc (formerly, SSGA Cash Management Fund plc); January 2009 to Present, Independent Director, SSGA Fixed Income plc; and January 2009 to Present, Independent Director, SSGA Qualified Funds PLC. | 59 | Trustee, State Street Master Funds; Trustee SSGA Funds; Board Director and Chairman, SPDR Europe 1PLC Board (2011 – Present); Board Director and Chairman, SPDR Europe II, PLC (2013 – Present). | |||||
William L. Boyan State Street Financial Center One Lincoln Street Boston, YOB: 1937 | Trustee and Co-Chairman of the Valuation Committee | Term: Indefinite Elected: 7/99 | President and Chief Operations Officer, John Hancock Financial Services (1959 – 1999). Mr. Boyan retired in 1999. Chairman Emeritus, Children’s Hospital, Boston, MA (1984 – 2011); Former Chairman, Boston Plan For Excellence, Boston Public Schools (1995 – 2010); Member of Advisory Board of Florida Atlantic University Lifelong Learning Society. | 59 | Trustee, State Street Master Funds; Trustee SSGA Funds; Former Trustee of Old Mutual South Africa Master Trust; Trustee, Children’s Hospital, Boston, MA. | |||||
William L. Marshall State Street Financial Center One Lincoln Street Boston, YOB: 1942 | Trustee and Co-Chairman of the Audit Committee | Term: Indefinite Elected: 1/14 | April 2011 to Present, Chairman (until April 2011, Chief Executive Officer and President), Wm. L. Marshall Associates, Inc., Wm. L. Marshall Companies, Inc. and the Marshall Financial Group, Inc. (a registered investment adviser and provider of financial and related consulting services); Certified Financial Planner; Member, Financial Planners Association; Director, (2008 – 2014) Doylestown Health Foundation Board; and the Ann Silverman Community Clinic of Doylestown, PA. | 59 | Trustee, State Street Master Funds; Trustee SSGA Funds; Director, Marshall Financial Group, Inc. |
73
Table of Contents
Name, Address, and Year of Birth | Position(s) Held | Term of Office Time Served | Principal Occupation During Past Five Years | Number of Funds in Fund Complex Overseen by Trustee | Other Directorships Held by Trustee During | |||||
Independent Trustees (continued) | ||||||||||
Richard D. Shirk State Street Financial Center One Lincoln Street Boston, YOB: 1945 | Trustee and Co-Chairman of the Qualified Legal and Compliance Committee | Term: Indefinite Elected: 1/14 | March 2001 to April 2002, Chairman (1996 to March 2001, President and Chief Executive Officer), Cerulean Companies, Inc. (holding company) (Retired); 1992 to March 2001, President and Chief Executive Officer, Blue Cross Blue Shield of Georgia (health insurer, managed healthcare); 1998 to December 2008, Chairman, Board Member and December 2008 to Present, Investment Committee Member, Healthcare Georgia Foundation (private foundation); September 2002 to Present, Lead Director and Board Member, Amerigroup Corp. (managed health care); 1999 to Present, Board Member and (since 2001) Investment Committee Member, Woodruff Arts Center; and 2003 to 2009, Trustee, Gettysburg College. | 59 | Trustee, State Street Master Funds; Trustee SSGA Funds; Board member, AeroCare Holdings (privately held healthcare services company) (February 2003 – Present); Board member, Regenesis Biomedical (health care services) (April 2012 – Present). | |||||
Rina K. Spence State Street Financial Center One Lincoln Street Boston, YOB: 1948 | Trustee and Co-Chairman of the Qualified Legal and Compliance Committee and Co-Chairman of the Governance Committee | Term: Indefinite Elected: 7/99 | President of SpenceCare International LLC (international healthcare consulting) (1999 – present); Chief Executive Officer, IEmily.com (health internet company) (2000 – 2001); Chief Executive Officer of Consensus Pharmaceutical, Inc. (1998 – 1999); Founder, President and Chief Executive Officer of Spence Center for Women’s Health (1994 – 1998); President and CEO Emerson Hospital (1984 – 1994); Trustee, Eastern Enterprise (utilities) (1988 – 2000). | 59 | Trustee, State Street Master Funds; Trustee SSGA Funds; Director, Berkshire Life Insurance Company of America (1993 – 2009); Director, IEmily.com, Inc. (2000 – 2010); and Trustee, National Osteoporosis Foundation (2005 – 2008). | |||||
Bruce D. Taber State Street Financial Center One Lincoln Street Boston, YOB: 1943 | Trustee and Co-Chairman of the Valuation Committee and Co-Chairman of the Governance Committee | Term: Indefinite Elected: 1/14 | 1999 to Present, Partner, Zenergy LLC (a technology company providing Computer Modeling and System Analysis to the General Electric Power Generation Division); Until December 2008, Independent Director, SSGA Cash Management Fund plc; Until December 2008, Independent Director, State Street Global Advisers Ireland, Ltd. (investment companies); and Until August 1994, President, Alonzo B. Reed, Inc., (a Boston architect-engineering firm). | 59 | Trustee, State Street Master Funds; Trustee SSGA Funds | |||||
74
Table of Contents
Name, Address, and Year of Birth | Position(s) Held | Term of Office Time Served | Principal Occupation During Past Five Years | Number of Funds in Fund Complex Overseen by Trustee | Other Directorships Held by Trustee During | |||||
Independent Trustees (continued) | ||||||||||
Douglas T. Williams State Street Financial Center One Lincoln Street Boston, YOB: 1940 | Trustee and Co-Chairman of the Audit Committee | Term: Indefinite Elected: 7/99 | President, Oakmont Homeowners Association (2012 – 2013); President, Mariner Sands Chapel; Executive Vice President and member of Executive Committee, Chase Manhattan Bank (1987 – 1999); President, Boston Stock Exchange Depository Trust Company, 1981 – 1982. | 59 | Trustee, State Street Master Funds; Trustee SSGA Funds; Treasurer, Nantucket Educational Trust, (2002 – 2007). | |||||
Interested Trustees(1) | ||||||||||
Scott F. Powers State Street Financial Center One Lincoln Street Boston, YOB: 1959 | Trustee | Term: Indefinite Elected Trustee: 1/14 | May 2008 to Present, President and Chief Executive Officer of State Street Global Advisors; 2001 – 2008, Chief Executive Officer of Old Mutual Asset Management; Board of Directors, United Way of Massachusetts Bay; Board of Directors of Middlesex School; Incorporator, Cardigan Mountain School | 59 | ||||||
James E. Ross SSGA Funds Management, Inc. State Street Financial Center One Lincoln Street Boston, MA 02111-2900 YOB: 1965 | Trustee | Term: Indefinite Elected Trustee: 2/07 | Chairman and Director, SSGA Funds Management, Inc. (2012 – present); President, SSGA Funds Management, Inc. (2005 – 2012); Executive Vice President and Senior Managing Director, State Street Global Advisors (2006 – present); and Principal, State Street Global Advisors (2006 – present). | 254 | ||||||
| (1) | Mr. Powers and Mr. Ross are Interested Trustees because of their employment by SSGA Funds Management, Inc., an affiliate of the Trust. |
Name, Address, and Year of Birth | Position(s) Held | Term of Office Time Served | Principal Occupation During Past Five Years | |||
Officers: | ||||||
Ellen M. Needham SSGA Funds Management, Inc. State Street Financial Center One Lincoln Street Boston, YOB: 1967 | President | Term: Indefinite Elected: 10/12 | President and Director, SSGA Funds Management, Inc. (June 2012 – present); Chief Operating Officer, SSGA Funds Management, Inc. (May 2010 – June 2012); Senior Managing Director, SSGA Funds Management, Inc. (1992 – 2012) and Senior Managing Director, State Street Global Advisors (1992 – present).* | |||
Ann M. Carpenter SSGA Funds Management, Inc. State Street Financial Center One Lincoln Street Boston, YOB: 1966 | Vice President | Term: Indefinite Elected: 10/12 | Chief Operating Officer, SSGA Funds Management, Inc. (April 2014 – present); Vice President, SSGA Funds Management, Inc. (2008 – present); Principal, State Street Global Advisors (2005 – 2008 – present).* | |||
Laura F. Dell State Street Bank and Trust Company Channel Center Building One Iron Street, 9th Floor Boston, YOB: 1964 | Treasurer | Term: Indefinite Elected: 11/10 | Vice President, State Street Bank and Trust Company (2002 – present).* |
75
Table of Contents
Name, Address, and Year of Birth | Position(s) Held | Term of Office Time Served | Principal Occupation During Past Five Years | |||
Officers: (continued) | ||||||
Chad C. Hallett SSGA Funds Management, Inc. State Street Financial Center One Lincoln Street Boston, YOB: 1969 | Assistant Treasurer | Term: Indefinite Elected: 09/11 | Vice President, State Street Global Advisors and SSGA Funds Management, Inc. (November 2014 – present); Vice President, State Street Bank and Trust Company (2001 – November 2014).* | |||
Caroline M. Connolly State Street Bank and Trust Company Channel Center Building One Iron Street, 9th Floor Boston, YOB: 1975 | Assistant Treasurer | Term: Indefinite Elected: 09/11 | Assistant Vice President, State Street Bank and Trust Company (2007 – present). | |||
Brian Harris SSGA Funds Management, Inc. State Street Financial Center One Lincoln Street Boston, YOB: 1973 | Chief Compliance Officer | Term: Indefinite Elected: 11/13 | Vice President, State Street Global Advisors and SSGA Funds Management, Inc.( June 2013 – Present); Senior Vice President and Global Head of Investment Compliance, BofA Global Capital Management (September 2010 to May 2013); Director of Compliance, AARP Financial Inc. (July 2008 to August 2010). | |||
David K. James State Street Bank and Trust Company 100 Huntington Avenue Boston, YOB: 1970 | Secretary | Term: Indefinite Elected: 4/13 | Managing Director and Managing Counsel, State Street Bank and Trust Company (2009 – present); Vice President and Counsel, PNC Global Investment Servicing (US), Inc. (2006 – 2009). | |||
Kristin Schantz State Street Bank and Trust Company 100 Huntington Avenue Boston, YOB: 1979 | Assistant Secretary | Term: Indefinite Elected: 2/14 | Vice President and Counsel, State Street Bank and Trust Company (2013 – present); Vice President, Citi Fund Services Ohio, Inc. (2008 – 2013). |
| * | Served in various capacities and/or with various affiliated entities during noted time period. |
The Statement of Additional Information includes additional information about the Trustees and is available, without charge, upon request, by calling (toll free) 877-521-4083.
76
Table of Contents
Trustees
William L. Boyan
Michael F. Holland
William L. Marshall
Scott F. Powers
Patrick J. Riley
James E. Ross
Richard D. Shirk
Rina K. Spence
Bruce D. Taber
Douglas T. Williams
Investment Adviser and Administrator of the Index Funds
SSGA Funds Management, Inc.
State Street Financial Center
One Lincoln Street
Boston, MA 02111
Custodian, Administrator and Transfer Agent of the Index Portfolios
State Street Bank and Trust Company
State Street Financial Center
One Lincoln Street
Boston, MA 02111
Independent Public Registered Accounting Firm
Ernst & Young LLP
200 Clarendon Street
Boston, MA 02116
Legal Counsel
Ropes & Gray LLP
800 Boylston Street
Boston, MA 02199
Transfer Agent of the Index Funds
Boston Financial Data Services
Two Heritage Drive
North Quincy, MA 02171
Distributor
State Street Global Markets LLC
State Street Financial Center
One Lincoln Street
Boston, MA 02111
This report is for shareholder information. This is not a prospectus intended for use in the purchase or sale of shares of beneficial interest.
State Street Institutional Investment Trust State Street Bank and Trust Company P.O. Box 5049 Boston, MA 02206 | SSITCOREAR IBG-14267 |
Table of Contents
Annual Report
31 December 2014
State Street Institutional Investment Trust
State Street Clarion Global Real Estate Income Fund

Table of Contents
State Street Clarion Global Real Estate Income Fund
Portfolio Statistics (Unaudited)
Portfolio Composition* | December 31, 2014 | |||
Common Stocks | 99.3 | % | ||
Money Market Fund | 0.6 | |||
Other Assets in Excess of Liabilities | 0.1 | |||
Total | 100.0 | % |
Top Five Sectors (excluding short-term investments)* | December 31, 2014 | |||
REITS-Diversified | 27.0 | % | ||
REITS-Shopping Centers | 19.7 | |||
REITS-Office Property | 11.0 | |||
REITS-Health Care | 10.2 | |||
REITS-Regional Malls | 9.5 | |||
Total | 77.4 | % |
| * | As a percentage of net assets as of the date indicated. The Portfolio’s composition will vary over time. |
See Notes to Financial Statements.
1
Table of Contents
State Street Clarion Global Real Estate Income Fund
Portfolio of Investments
December 31, 2014
Security Description | Shares | Value | ||||||
COMMON STOCKS – 99.3% | ||||||||
Australia – 7.1% | ||||||||
Federation Centres REIT | 35,400 | $ | 82,586 | |||||
GPT Group (The) REIT | 7,400 | 26,206 | ||||||
Investa Office Fund REIT | 19,500 | 57,734 | ||||||
Mirvac Group REIT | 24,600 | 35,612 | ||||||
Scentre Group REIT(a) | 32,600 | 92,921 | ||||||
Westfield Corp. REIT(a) | 11,100 | 81,348 | ||||||
|
| |||||||
| 376,407 | ||||||||
|
| |||||||
Canada – 3.0% | ||||||||
Calloway Real Estate Investment Trust REIT | 1,700 | 40,069 | ||||||
H&R REIT | 2,600 | 48,779 | ||||||
RioCan REIT | 3,100 | 70,738 | ||||||
|
| |||||||
| 159,586 | ||||||||
|
| |||||||
France – 3.9% | ||||||||
Gecina SA REIT | 200 | 25,032 | ||||||
Mercialys SA REIT | 3,500 | 78,071 | ||||||
Unibail-Rodamco SE REIT | 400 | 103,023 | ||||||
|
| |||||||
| 206,126 | ||||||||
|
| |||||||
Hong Kong – 2.9% | ||||||||
Hongkong Land Holdings, Ltd. | 7,000 | 47,115 | ||||||
The Link REIT | 16,900 | 105,384 | ||||||
|
| |||||||
| 152,499 | ||||||||
|
| |||||||
Japan – 7.2% | ||||||||
Activia Properties, Inc. REIT | 6 | 52,134 | ||||||
Japan Real Estate Investment Corp. REIT | 11 | 52,888 | ||||||
Japan Retail Fund Investment Corp. REIT | 44 | 92,700 | ||||||
Kenedix Office Investment Corp. REIT | 11 | 61,693 | ||||||
Nippon Prologis REIT, Inc. | 29 | 62,810 | ||||||
United Urban Investment Corp. REIT | 39 | 61,200 | ||||||
|
| |||||||
| 383,425 | ||||||||
|
| |||||||
Netherlands – 3.3% | ||||||||
Corio NV REIT | 2,100 | 102,485 | ||||||
Eurocommercial Properties NV | 1,100 | 46,662 | ||||||
Vastned Retail NV REIT | 600 | 27,105 | ||||||
|
| |||||||
| 176,252 | ||||||||
|
| |||||||
Singapore – 1.8% | ||||||||
CapitaCommercial Trust REIT | 70,500 | 93,289 | ||||||
|
| |||||||
Sweden – 0.4% | ||||||||
Castellum AB | 1,500 | 23,301 | ||||||
|
| |||||||
United Kingdom – 7.3% | ||||||||
Hammerson PLC REIT | 11,926 | 111,513 | ||||||
Intu Properties PLC REIT | 6,692 | 34,620 | ||||||
Land Securities Group PLC REIT | 4,598 | 82,310 | ||||||
Segro PLC REIT | 9,000 | 51,611 | ||||||
The British Land Co. PLC REIT | 9,000 | 108,163 | ||||||
|
| |||||||
| 388,217 | ||||||||
|
| |||||||
United States – 62.4% | ||||||||
American Campus Communities, Inc. REIT | 1,400 | 57,904 | ||||||
American Realty Capital Properties, Inc. REIT | 10,500 | 95,025 | ||||||
AvalonBay Communities, Inc. REIT | 400 | 65,356 | ||||||
BioMed Realty Trust, Inc. REIT | 2,400 | 51,696 | ||||||
Boston Properties, Inc. REIT | 900 | 115,821 | ||||||
Brandywine Realty Trust REIT | 4,400 | 70,312 | ||||||
Brixmor Property Group, Inc. REIT | 2,700 | 67,068 | ||||||
CBL & Associates Properties, Inc. REIT | 3,400 | 66,028 | ||||||
Digital Realty Trust, Inc. REIT | 1,440 | 95,472 | ||||||
Douglas Emmett, Inc. REIT | 1,500 | 42,600 | ||||||
Duke Realty Corp. REIT | 3,500 | 70,700 | ||||||
EPR Properties REIT | 900 | 51,867 | ||||||
Equity Residential REIT | 2,200 | 158,048 | ||||||
General Growth Properties, Inc. REIT | 3,600 | 101,268 | ||||||
HCP, Inc. REIT | 3,300 | 145,299 | ||||||
Health Care REIT, Inc. | 2,700 | 204,309 | ||||||
Healthcare Realty Trust, Inc. REIT | 2,500 | 68,300 | ||||||
Highwoods Properties, Inc. REIT | 1,200 | 53,136 | ||||||
Home Properties, Inc. REIT | 800 | 52,480 | ||||||
Hospitality Properties Trust REIT | 1,700 | 52,700 | ||||||
Host Hotels & Resorts, Inc. REIT | 4,000 | 95,080 | ||||||
Kimco Realty Corp. REIT | 4,300 | 108,102 | ||||||
LaSalle Hotel Properties REIT | 700 | 28,329 | ||||||
Liberty Property Trust REIT | 2,400 | 90,312 | ||||||
Paramount Group, Inc. REIT(a) | 2,500 | 46,475 | ||||||
Post Properties, Inc. REIT | 600 | 35,262 | ||||||
ProLogis, Inc. REIT | 3,100 | 133,393 | ||||||
Public Storage, Inc. REIT | 400 | 73,940 | ||||||
Ramco-Gershenson Properties Trust REIT | 3,800 | 71,212 | ||||||
Regency Centers Corp. REIT | 800 | 51,024 | ||||||
Retail Properties of America, Inc. REIT | 3,300 | 55,077 | ||||||
Senior Housing Properties Trust REIT | 2,100 | 46,431 | ||||||
Simon Property Group, Inc. REIT | 1,350 | 245,849 | ||||||
Spirit Realty Capital, Inc. REIT | 7,900 | 93,931 | ||||||
Strategic Hotels & Resorts, Inc. REIT(a) | 2,800 | 37,044 | ||||||
Sun Communities, Inc. REIT | 900 | 54,414 | ||||||
The Macerich Co. REIT | 1,100 | 91,751 | ||||||
UDR, Inc. REIT | 3,000 | 92,460 | ||||||
Ventas, Inc. REIT | 1,100 | 78,870 | ||||||
Vornado Realty Trust REIT | 900 | 105,939 | ||||||
|
| |||||||
| 3,320,284 | ||||||||
|
| |||||||
TOTAL COMMON STOCKS |
| 5,279,386 | ||||||
|
| |||||||
MONEY MARKET FUND – 0.6% |
| |||||||
State Street Institutional Liquid Reserves Fund, Premier Class 0.07%(b) | 35,023 | 35,023 | ||||||
|
| |||||||
TOTAL INVESTMENTS – 99.9% |
| 5,314,409 | ||||||
Other Assets in Excess of | 3,219 | |||||||
|
| |||||||
NET ASSETS – 100.0% | $ | 5,317,628 | ||||||
|
| |||||||
| (a) | Non-income producing security |
| (b) | Affiliated Fund managed by SSGA Fund Management, Inc. See table that follows for more information. |
Abbreviations | ||
| PLC | Public Limited Company | |
| REIT | Real Estate Investment Trust |
See Notes to Financial Statements.
2
Table of Contents
State Street Clarion Global Real Estate Income Fund
Portfolio of Investments — (continued)
December 31, 2014
Affiliates Table
Certain investments made by the Fund were made in securities affiliated with SSGA FM. The Fund invested in the State Street Institutional Liquid Reserves Fund. Transactions in affiliates for the period ending December 31, 2014 were as follows:
Security | Number of shares held at 10/9/14* | Shares purchased for the period ended 12/31/14 | Shares sold for the period ended 12/31/14 | Number of shares held at 12/31/14 | Value at 12/31/14 | Income earned for the period ended 12/31/14 | ||||||||||||||||||
State Street Institutional | ||||||||||||||||||||||||
Liquid Reserves Fund, Premier Class | – | 5,251,651 | 5,216,628 | 35,023 | $ | 35,023 | $ | 64 | ||||||||||||||||
| * | Commencement of operations. |
See Notes to Financial Statements.
3
Table of Contents
State Street Clarion Global Real Estate Income Fund
Statement of Assets and Liabilities
December 31, 2014
Assets | ||||
Investments in securities of unaffiliated issuers, at value* | $ | 5,279,386 | ||
Investments in securities of affiliated issuers, at value* | 35,023 | |||
|
| |||
Total Investments* | 5,314,409 | |||
Foreign currency, at value** | 216 | |||
Receivable for investments sold | 63,201 | |||
Dividends receivable | 23,703 | |||
Receivable for foreign taxes recoverable | 417 | |||
Receivable from Adviser (Note 4) | 59,672 | |||
|
| |||
Total assets | 5,461,618 | |||
|
| |||
Liabilities | ||||
Payable for investments purchased | 82,860 | |||
Advisory fees payable (Note 4) | 10,140 | |||
Administration fees payable (Note 4) | 597 | |||
Custodian fees payable (Note 4) | 8,209 | |||
Sub-Transfer Agent fee payable (Note 4) | 2,386 | |||
Distribution fees payable (Note 4) | 1,491 | |||
Trustees’ fees payable | 3,750 | |||
Registration and filing fees payable | 6,871 | |||
Professional fees payable | 17,929 | |||
Transfer agent fees payable | 5,002 | |||
Accrued expenses and other liabilities | 4,755 | |||
|
| |||
Total liabilities | 143,990 | |||
|
| |||
Net Assets | $ | 5,317,628 | ||
|
| |||
Net Assets Consist of: | ||||
Paid-in capital | $ | 5,000,000 | ||
Distributions in excess of net investment income | (22,764 | ) | ||
Accumulated net realized gain | 26,380 | |||
Net unrealized appreciation on investments | 314,012 | |||
|
| |||
Net Assets | $ | 5,317,628 | ||
|
| |||
Class A | ||||
Net Assets | $ | 2,658,976 | ||
Shares of beneficial interest outstanding | 250,000 | |||
|
| |||
Net asset value and redemption price per share | $ | 10.64 | ||
|
| |||
Maximum Sales Charge | 5.25 | % | ||
Maximum offering price per share | $ | 11.23 | ||
|
| |||
Class I | ||||
Net Assets | $ | 2,658,652 | ||
Shares of beneficial interest outstanding | 250,000 | |||
|
| |||
Offering, net asset value, and redemption price per share | $ | 10.63 | ||
|
| |||
* Investments in securities of unaffiliated issuers, at cost | $ | 4,965,327 | ||
* Investments in securities of affiliated issuers, at cost | 35,023 | |||
|
| |||
* Investments in securities, at cost | $ | 5,000,350 | ||
|
| |||
** Foreign currency, at cost | $ | 215 | ||
|
|
See Notes to Financial Statements.
4
Table of Contents
State Street Clarion Global Real Estate Income Fund
Statement of Operations
Period Ended December 31, 2014*
Income | ||||
Dividend income – unaffiliated issuers (net of foreign taxes withheld of $4,067) | $ | 38,810 | ||
Dividend income – non-controlled affiliated issuer | 64 | |||
|
| |||
Total Investment Income | 38,874 | |||
|
| |||
Expenses | ||||
Advisory fees (Note 4) | 10,140 | |||
Administration fees (Note 4) | 347 | |||
Custodian fees (Note 4) | 8,209 | |||
Sub-Transfer Agent fee (Note 4) | 1,193 | |||
Class I | 1,193 | |||
Distribution fees (Note 4) | ||||
Class A | 1,491 | |||
Trustees’s fees and expenses | 3,750 | |||
Registration and filing fees | 7,408 | |||
Professional fees | 17,929 | |||
Transfer agent fees (Note 4) | 5,002 | |||
Printing fees | 14,528 | |||
Other expenses | 4,885 | |||
|
| |||
Total expenses | 76,075 | |||
|
| |||
Less: Expenses reimbursed by the Adviser (Note 4) | (59,672 | ) | ||
|
| |||
Net expenses | 16,403 | |||
|
| |||
Net Investment Income | 22,471 | |||
|
| |||
Realized and Unrealized Gain (Loss) | ||||
Net realized gain on: | ||||
Investments | 36,794 | |||
Foreign currency transactions | 2,201 | |||
|
| |||
Net realized gain | 38,995 | |||
|
| |||
Change in net unrealized appreciation/depreciation on: | ||||
Investments | 314,059 | |||
Foreign currency transactions | (47 | ) | ||
|
| |||
Net change in unrealized appreciation/depreciation | 314,012 | |||
|
| |||
Net realized and unrealized gain | 353,007 | |||
|
| |||
Net Increase (Decrease) in Net Assets Resulting from Operations | $ | 375,478 | ||
|
|
| * | For the period from October 9, 2014 (commencement of operations) to December 31, 2014. |
See Notes to Financial Statements.
5
Table of Contents
State Street Clarion Global Real Estate Income Fund
Statement of Changes in Net Assets
| Period Ended December 31, 2014* | ||||
Increase (Decrease) in Net Assets Resulting from: | ||||
Operations: | ||||
Net investment income | $ | 22,471 | ||
Net realized gain on investments and foreign currency transactions | 38,995 | |||
Change in net unrealized appreciation on investments and foreign currency transactions | 314,012 | |||
|
| |||
Net increase in net assets from operations | 375,478 | |||
|
| |||
Distributions to Shareholders from: | ||||
Net investment income | ||||
Class A | (26,325 | ) | ||
Class I | (28,175 | ) | ||
Net realized gain on investments | ||||
Class A | (1,675 | ) | ||
Class I | (1,675 | ) | ||
|
| |||
Total distributions | (57,850 | ) | ||
|
| |||
Net Increase (Decrease) from Fund Share Transactions: | ||||
Class A | ||||
Shares sold | 2,500,000 | |||
|
| |||
Class I | ||||
Shares sold | 2,500,000 | |||
|
| |||
Net increase from fund share transactions | 5,000,000 | |||
|
| |||
Net Increase in Net Assets | 5,317,628 | |||
|
| |||
Net Assets | ||||
End of period | $ | 5,317,628 | ||
|
| |||
Distributions in excess of net investment income | $ | (22,764 | ) | |
|
| |||
Changes in Shares: | ||||
Class A | ||||
Shares sold | 250,000 | |||
|
| |||
Class I | ||||
Shares sold | 250,000 | |||
|
| |||
| * | For the period from October 9, 2014 (commencement of operations) to December 31, 2014. |
See Notes to Financial Statements.
6
Table of Contents
State Street Clarion Global Real Estate Income Fund
Financial Highlights
Selected data for a Class A Share of beneficial interest outstanding throughout the period is presented below:
| Period from 10/9/14* - 12/31/14 | ||||
Per Share Operating Performance: | ||||
Net Asset Value, Beginning of Period | $ | 10.00 | ||
|
| |||
Investment Operations: | ||||
Net investment income(a) | 0.04 | |||
Net realized and unrealized gain on investments | 0.72 | |||
|
| |||
Total from investment operations | 0.76 | |||
|
| |||
Less Distributions From: | ||||
Net investment income | (0.11 | ) | ||
Net realized gains | (0.01 | ) | ||
|
| |||
Total distributions | (0.12 | ) | ||
|
| |||
Net increase in net assets | 0.64 | |||
|
| |||
Net Asset Value, End of Period | $ | 10.64 | ||
|
| |||
Total Return(b)(c) | 7.52 | % | ||
Ratios and Supplemental Data: | ||||
Net Assets, End of Period (000s) | $ | 2,659 | ||
Ratios to average net assets: | ||||
Gross expenses(d) | 6.51 | % | ||
Net expenses(d) | 1.50 | % | ||
Net investment income(d) | 1.76 | % | ||
Portfolio turnover rate(c) | 11 | % | ||
| * | Commencement of operations |
| (a) | Net investment income per share is calculated using the average shares method. |
| (b) | Total return is calculated assuming a purchase of shares at net asset value on the first day and a sale at net asset value on the last day of each period reported. Distributions are assumed, for the purpose of this calculation, to be reinvested at net asset value per share on the respective payment dates. Results represent past performance and are not indicative of future results. |
| (c) | Not annualized. |
| (d) | Annualized. |
See Notes to Financial Statements.
7
Table of Contents
State Street Clarion Global Real Estate Income Fund
Financial Highlights
Selected data for a Class I Share of beneficial interest outstanding throughout the period is presented below:
| Period from 10/9/14* - 12/31/14 | ||||
Per Share Operating Performance: | ||||
Net Asset Value, Beginning of Period | $ | 10.00 | ||
|
| |||
Investment Operations: | ||||
Net investment income(a) | 0.05 | |||
Net realized and unrealized gain on investments | 0.70 | |||
|
| |||
Total from investment operations | 0.75 | |||
|
| |||
Less Distributions From: | ||||
Net investment income | (0.11 | ) | ||
Net realized gains | (0.01 | ) | ||
|
| |||
Total distributions | (0.12 | ) | ||
|
| |||
Net increase in net assets | 0.63 | |||
|
| |||
Net Asset Value, End of Period | $ | 10.63 | ||
|
| |||
Total Return(b)(c) | 7.49 | % | ||
Ratios and Supplemental Data: | ||||
Net Assets, End of Period (000s) | $ | 2,659 | ||
Ratios to average net assets: | ||||
Gross expenses(d) | 6.26 | % | ||
Net expenses(d) | 1.25 | % | ||
Net investment income(d) | 2.01 | % | ||
Portfolio turnover rate(c) | 11 | % | ||
| * | Commencement of operations |
| (a) | Net investment income per share is calculated using the average shares method. |
| (b) | Total return is calculated assuming a purchase of shares at net asset value on the first day and a sale at net asset value on the last day of each period reported. Distributions are assumed, for the purpose of this calculation, to be reinvested at net asset value per share on the respective payment dates. Results represent past performance and are not indicative of future results. |
| (c) | Not annualized. |
| (d) | Annualized. |
See Notes to Financial Statements.
8
Table of Contents
State Street Institutional Investment Trust
Notes to Financial Statements
December 31, 2014
| 1. | Organization |
State Street Institutional Investment Trust (the “Trust”) is registered under the Investment Company Act of 1940, as amended (the “1940 Act”), as an open-end management investment company, and was organized as a business trust under the laws of the Commonwealth of Massachusetts on February 16, 2000. The Trust consists of thirty-five (35) series and corresponding classes, each of which have the same rights and privileges, including the same voting rights. The Funds are authorized to issue an unlimited number of shares, with no par value. State Street Global Real Estate Income Fund (the “Fund”) has registered Class C and Class K Shares. The Fund’s Class C and Class K Shares were not operational at December 31, 2014. The financial statements herein relate to the following Fund:
| Fund | Classes | Commencement of Operations: | ||
State Street Clarion Global | Class A | October 9, 2014 | ||
Real Estate Income Fund | Class I | October 9, 2014 |
The investment objective of the Fund is to seek total return with an emphasis on income. SSGA FM serves as the investment adviser and CBRE Clarion Securities LLC serves as the subadviser. Class A shares are available to the general public for investment through transaction-based financial intermediaries. Class A shares impose a 5.25% sales charge (as a percentage of offering price) and may be subject to a 1% CDSC if redeemed within 18 months of purchase. Class I shares are sold without a sales charge and only to certain eligible investors.
The Fund is an investment company and accordingly follows the investment company accounting and reporting guidance of the Financial Accounting Standards Board (“FASB”) Accounting Standards Codification Topic 946 Financial Services – Investment Companies.
| 2. | Significant Accounting Policies |
The Fund’s financial statements are prepared in accordance with accounting principles generally accepted accounting principles in the United States of America (“U.S. GAAP”), which require the use of management estimates. Actual results could differ from those estimates. It is reasonably possible that these differences could be material. The following is a summary of the significant accounting policies consistently followed by the Fund in the preparation of its financial statements.
Security valuation – Investments are valued each business day by independent pricing services. Equity securities for which market quotations are available are valued at the last sale price or official closing price (closing bid price if no sale has occurred) on the primary market or exchange on which they trade. Securities for which market quotations are not readily available may be valued at “fair value,” as determined in good faith pursuant to procedures established by the Board of Trustees (the “Board”). The Board has adopted procedures concerning securities valuation, under which an Oversight Committee makes determinations as to whether market quotations are not readily available or do not otherwise accurately reflect the fair value of the security. The Oversight Committee, or a subgroup thereof, subject to oversight by the Board, may use fair value pricing in a variety of circumstances, including but not limited to, situations when trading in a security has been suspended or halted. Fair value pricing involves subjective judgments and it is possible that the fair value determination for a security is materially different than the value that could be received on the sale of the security.
9
Table of Contents
State Street Institutional Investment Trust
Notes to Financial Statements — (continued)
December 31, 2014
The Fund has adopted provisions surrounding fair value measurements and disclosures that defines fair value, establishes a framework for measuring fair value in generally accepted accounting principles and expands disclosures about fair value measurements. This applies to fair value measurements that are already required or permitted by other accounting standards and is intended to increase consistency of those measurements and applies broadly to securities and other types of assets and liabilities. In accordance with these provisions, fair value is defined as the price that a Fund would receive upon selling an investment in a timely transaction to an independent buyer in the principal or most advantageous market of the investment. Various inputs are used in determining the value of the Fund’s investments.
The three tier hierarchy of inputs is summarized below:
| • | Level 1 – quoted prices in active markets for identical securities |
| • | Level 2 – other significant observable inputs (including quoted prices for similar securities, interest rates, prepayment speeds, credit risk, etc.) |
| • | Level 3 – significant unobservable inputs (including a Portfolio’s own assumptions in determining the fair value of investments) |
Events or circumstances affecting the values of Fund securities that occur between the closing of the principal markets on which they trade and the time the NAV of Fund shares is determined may be reflected in the Trust’s calculation of NAVs for each applicable Fund when the Trust deems that the particular event or circumstance would materially affect such Fund’s NAV. Funds that invest primarily in frequently traded exchange-listed securities will use fair value pricing in limited circumstances since reliable market quotations will often be readily available. If market quotations are not readily available for a security or if subsequent events suggest that a market quotation is not reliable, the Funds will use the security’s fair value, as determined in accordance with Fair Value Procedures adopted by the Board. Funds that invest in foreign securities are likely to use fair value pricing more often since significant events may occur between the close of foreign markets and the time of pricing which would trigger fair value pricing of the foreign securities. Although there are observable inputs assigned on a security level, prices are derived from factors using proprietary models or matrix pricing. For this reason, significant events will cause movement between Levels 1 and 2. Funds that invest in low-rated debt securities are also likely to use fair value pricing more often since the markets in which such securities are traded are generally thinner, more limited and less active than those for higher rated securities. Examples of events that could trigger fair value pricing of one or more securities are: (1) market quotations are not readily available because a portfolio security is not traded in a public market or the principal market in which the security trades is closed; (2) trading in a portfolio security is suspended and not resumed prior to the time as of which the Funds calculate their NAV; (3) where a significant event affecting the value of a portfolio security is determined to have occurred between the time of the market quotation provided for a portfolio security and the time as of which the Funds calculate their NAV; (4) a security’s price has remained unchanged over an extended period of time (often referred to as a “stale price”), or (5) the Funds’ custodian or administrator determines that a market quotation is inaccurate.
Equities traded on inactive markets or valued by reference to similar instruments are also categorized as Level 2 of the fair value hierarchy.
The NAV of a Fund’s portfolio that includes foreign securities may change on days when shareholders will not be able to purchase or redeem Fund shares, since foreign securities can trade on non-business days.
10
Table of Contents
State Street Institutional Investment Trust
Notes to Financial Statements — (continued)
December 31, 2014
The following is a summary of the inputs used as of December 31, 2014, in valuing the assets carried at fair value of the Fund:
| Description | Quoted Prices in Active Markets for Identical Assets (Level 1) | Significant Other Observable Inputs (Level 2) | Significant Unobservable Inputs (Level 3) | Total | ||||||||||||
INVESTMENTS: | ||||||||||||||||
Common Stocks | $ | 3,582,893 | $ | 1,696,493 | $ | – | $ | 5,279,386 | ||||||||
Money Market Fund | 35,023 | – | – | 35,023 | ||||||||||||
|
|
|
|
|
|
|
| |||||||||
TOTAL INVESTMENTS | $ | 3,617,916 | $ | 1,696,493 | $ | – | $ | 5,314,409 | ||||||||
|
|
|
|
|
|
|
| |||||||||
Changes in valuation techniques may result in transfers in or out of an investment’s assigned level within the hierarchy. Transfers between fair value hierarchy levels are recognized at the end of the year. For the period ended December 31, 2014, there were no transfers between levels.
Investment transactions – Investment transactions are recorded on the trade date basis. Realized gains and losses from the sale of disposition of securities and foreign exchange transactions are recorded on the identified cost basis. Corporate actions (including cash dividends) are recorded net of foreign tax withholdings on the ex-dividend date. Class specific distribution and shareholder servicing fees are borne by each class. Income, non-class specific expenses, and realized gains and losses are allocated to the respective classes daily on the basis of relative net assets. The Fund invests in Real Estate Investment Trusts (REITs). REITs will determine the characterization of their income annually and may characterize a portion of their distributions as a return of capital or capital gain. The Fund’s policy is to record all REIT distributions as dividend income initially and re-designate the prior calendar year’s return of capital or capital gain distributions at year end.
REITs owned at December 31, 2014, if any, are identified in the Schedule of Investments.
Investment Income – Dividend income is recorded on the ex-dividend date. The value of additional securities received as dividend payments is recorded as income and as an increase to the cost basis of such securities. Interest income is recorded on the accrual basis.
Foreign currency translation and foreign investments – The accounting records of the Fund is maintained in U.S. dollars. Portfolio securities and other assets and liabilities denominated in a foreign currency are translated to U.S. dollars at the prevailing rates of exchange at period end. Purchases and sales of securities, income receipts and expense payments are translated into U.S. dollars at the prevailing exchange rate on the respective dates of transactions. The effects of changes in foreign currency exchange rates on portfolio investments are included in the net realized and unrealized gains and losses on investments and foreign currency transaction on the Statements of Operations. Net gains and losses on foreign currency transactions include disposition of foreign currencies, and currency gains and losses between the accrual and receipt dates of portfolio investment income and between the trade and settlement dates of portfolio investment transactions.
Investing in securities of foreign companies and foreign governments involves special risks and considerations not typically associated with investing in U.S. companies and securities of the U.S. governments. These risks include revaluation of currencies and the risk of expropriation. Moreover, the markets for securities of many foreign companies and foreign governments may be less liquid and the
11
Table of Contents
State Street Institutional Investment Trust
Notes to Financial Statements — (continued)
December 31, 2014
prices of such securities may be more volatile than those of comparable U.S. companies and the U.S. government.
Some foreign markets in which the Fund invests are considered emerging markets. Investment in these emerging markets subjects the Fund to a greater risk of loss than investments in a developed market. This is due to, among other things, greater market volatility, lower trading volume, political and economic instability, higher levels of inflation, deflation or currency devaluation, greater risk of market shut down, and more governmental limitations on foreign investment policy than those typically found in a developed market.
Dividends and distributions – Dividends from net investment income are declared and paid quarterly. Net realized capital gains, if any, are distributed annually, unless additional distributions are required for compliance with applicable tax regulations. The amount and character of income and gains to be distributed are determined in accordance with federal tax regulations which may differ from net investment income and realized gains recognized for U.S. GAAP purposes. These differences relate primarily to investments in foreign denominated investments, REITs, wash sales and investments in certain securities sold at a loss. Permanent differences between book and tax accounting are reclassified to paid-in capital. Accordingly, the Funds may periodically make reclassifications among certain of their capital accounts without impacting their net asset value.
Expense allocation – Certain expenses are applicable to multiple funds within the Trust. Expenses directly attributable to a fund are charged to that fund. Expenses of the Trust that are not directly attributed to a fund are allocated among the funds, on the basis of relative net assets, except where a more appropriate allocation of expenses to each of the funds can otherwise be made.
Federal income taxes – The Fund intends to qualify for and elect treatment as a regulated investment company under Subchapter M of the Internal Revenue Code of 1986, as amended. By so qualifying and electing, the Fund will not be subject to federal income taxes to the extent they distribute their taxable income, including any net realized capital gains, for each fiscal year. In addition, by distributing during each calendar year substantially all of their net taxable income and capital gains, if any, the Fund will not be subject to federal excise tax.
For the period ended December 31, 2014, permanent differences identified and reclassified among the components of net assets were as follows:
| Fund | Paid-In Capital | Accumulated Gain (Loss) | Undistributed Net Investment Income (Loss) | |||||||||
State Street Clarion Global Real Estate Income Fund | $ | – | $ | (9,265 | ) | $ | 9,265 | |||||
These differences were primarily attributable to distribution redesignations, foreign currency gains and losses and passive foreign investment companies. Net investment income (loss), net realized gains (losses), and net assets were not affected by this reclassification.
At December 31, 2014, the Fund had no capital loss carryovers.
12
Table of Contents
State Street Institutional Investment Trust
Notes to Financial Statements — (continued)
December 31, 2014
At December 31, 2014, the cost of investments and the comparison of unrealized appreciation and depreciation of investments for federal income tax purpose are as follows:
| Fund | Tax Cost | Gross Unrealized Appreciation | Gross Unrealized Depreciation | Net Unrealized Appreciation (Depreciation) | ||||||||||||
State Street Clarion Global Real Estate Income Fund | $ | 5,023,114 | $ | 341,241 | $ | 49,946 | $ | 291,295 | ||||||||
The tax character of distributions paid to shareholders during the period ended December 31, 2014 was as follows:
| Fund | Ordinary Income | Long-Term Capital Gain | Total | |||||||||
State Street Clarion Global Real Estate Income Fund | $ | 57,400 | $ | 450 | $ | 57,850 | ||||||
At December 31, 2014, the components of distributable earnings on a tax basis were as follows:
| Fund | Undistributed Ordinary Income | Undistributed Capital Gains | Unrealized Appreciation (Depreciation) | Total | ||||||||||||
State Street Clarion Global Real Estate Income Fund | $ | 19,379 | $ | 7,001 | $ | 291,248 | $ | 317,628 | ||||||||
The Fund has reviewed the tax positions for open years as of December 31, 2014, and determined they did not have a liability for any unrecognized tax expenses. The Fund recognizes interest and penalties, if any, related to tax liabilities as income tax expense in the Statement of Operations. As of December 31, 2014, the Fund’s federal tax returns for the initial year remain subject to examination by the Fund’s major tax jurisdictions, which include the United States of America and the Commonwealth of Massachusetts.
| 3. | Securities Transactions |
For the period ended December 31, 2014, purchases and sales of the Fund shares were:
| Fund | Purchases | Sales | ||||||
State Street Clarion Global Real Estate Income Fund | $ | 5,534,965 | $ | 594,996 | ||||
| 4. | Related Party and Other Fees |
The Fund retained SSGA Funds Management, Inc. (the “Adviser” or “SSGA FM”), a subsidiary of State Street Corporation and an affiliate of State Street Bank and Trust Company (“State Street”), as its investment adviser. The Fund has entered into an investment advisory agreement with the Adviser. In compensation for the Adviser’s services, the Fund pays the Adviser a management fee at an annual rate of 0.85% of its average daily net assets.
The Adviser has entered into a sub-advisory agreement with the CBRE Clarion Securities LLC (the “Sub-Adviser”) pursuant to which the Sub-Adviser will be responsible for the day-to-day management
13
Table of Contents
State Street Institutional Investment Trust
Notes to Financial Statements — (continued)
December 31, 2014
of any assets of the Fund. The Sub-Adviser receives fees from the Adviser for its services provided to the Fund.
The Adviser, is contractually obligated until April 30, 2016 to waive its management fee and/or to reimburse the fund for expenses to the extent that total expenses (exclusive of non-recurring account fees, extraordinary expenses, acquired fund fees, and distribution, shareholder servicing, and sub-transfer agency fees) exceed 1.05% of average daily net assets on an annual basis. This waiver and/or reimbursement may not be terminated during the relevant period except with the approval of the Fund’s Board of Trustees.
For the period ended December 31, 2014, fees waived and expenses reimbursed by the Adviser, pursuant to the agreement, are shown on the Statement of Operations.
State Street is the administrator, custodian, transfer agent and dividend disbursing agent for the Fund. In compensation for these services, the Fund pays State Street an annual fee, which is included in Administration fees on the Statement of Operations. The fee is accrued daily and payable monthly, and is calculated as the greater of an asset-based fee or a minimum fee. The minimum fee is calculated by multiplying the minimum per fund fee by the number of funds in the State Street Master Funds Trust plus the number of stand-alone funds in the State Street Institutional Investment Trust to arrive at the total minimum fee. The asset-based fee is calculated at the following rates:
| Asset Levels | Annual percentage of average aggregate daily net assets | |
First $400 million | 0.03% | |
Next $15 billion | 0.02% | |
Thereafter | 0.01% | |
Minimum annual fee | $150,000 |
Boston Financial Data Services (“BFDS”), a joint venture of DST Systems, Inc. and State Street Corporation, serves as transfer agent and dividend disbursing agent to the Fund. For these services, the Fund pays annual account services fees, activity-based fees, charges related to compliance and regulatory services, and a minimum fee of $200 for the Fund.
The Fund has adopted a distribution plan pursuant to Rule 12b-1 under the 1940 Act under which the Fund may compensate its distributor (State Street Global Markets LLC or “SSGM”) (or others) for services in connection with the distribution of the Fund’s Class A shares and for services provided to Fund shareholders (the “Plan”). The Plan calls for payments at an annual rate (based on average daily net assets) of 0.25% of the Fund’s net assets attributable to its Class A shares. Because these fees are paid out of the assets of a Fund attributable to its Class A shares on an ongoing basis, they will increase the cost of your investment and may cost you more over time than paying other types of sales charges. In addition to payments under the Plan, the Fund may reimburse SSGM or its affiliates for payments it makes to financial intermediaries that provide certain administrative, recordkeeping, and account maintenance services. The amount of the reimbursement and the manner in which it is calculated are reviewed by the Trustees periodically.
Subject to the supervision of the Board of Trustees, the Trust may engage, directly or indirectly, in financing any activities relating to shareholder account administrative and servicing functions, including
14
Table of Contents
State Street Institutional Investment Trust
Notes to Financial Statements — (continued)
December 31, 2014
without limitation making payments to Agents for one or more of the following activities: (a) answering inquiries regarding account status and history, the manner in which purchases and redemptions of each Class may be effected, and certain other matters pertaining to the Trust; (b) assisting in designating and changing dividend options, account designations and addresses; (c) providing necessary personnel and facilities to establish and maintain certain shareholder accounts and records, as requested from time to time by the Trust; (d) assisting in processing purchase and redemption transactions; (e) arranging for the wiring of funds; (f) transmitting and receiving funds in connection with orders to purchase or redeem a Class of shares; (g) verifying and guaranteeing signatures in connection with redemption orders, transfers among and changes in designated accounts; (h) providing periodic statements showing account balances and, to the extent practicable, integration of such information with other client transactions otherwise effected with or through the Agent; (i) furnishing (either separately or on an integrated basis with other reports sent by the Agent) monthly and annual statements and confirmations of all purchases and redemptions of a Class of shares in an account; (j) transmitting proxy statements, annual reports, prospectuses and other communications from the Trust; (k) receiving, tabulating and transmitting to the Trust proxies executed with respect to special meetings of shareholders of the Trust; and (l) providing such other related services as the Trust or customers of the Agent may reasonably request.
The Fund also pays a sub-transfer agent fees of 0.20% on Class A and I for recordkeeping, shareholder servicing, or administrative services provided by Financial intermediaries.
| 5. | Trustees’ Fees |
Independent Trustees are compensated on a calendar year basis. Any Trustee who is deemed to be an “interested person” (as defined in the 1940 Act) of the Fund does not receive compensation from the Fund for his or her service as a Trustee.
Each Independent Trustee receives for his or her services to the State Street Master Funds, State Street Institutional Investment Trust and SSGA Funds, a $141,500 annual base retainer in addition to $18,000 for each in-person meeting and $2,000 for each telephonic meeting from the Trust. The Trust will bear a pro rata allocation based on the Trust’s average monthly assets. The Co-Chairmen each receive an additional $44,000 annual retainer. The Independent Trustees are reimbursed for travel and other out-of-pocket expenses in connection with meeting attendance. As of the date of this Report, the Trustees were not paid pension or retirement benefits as part of the Trust’s expenses.
The Trust’s officers are compensated by the Adviser and its affiliates.
| 6. | Indemnifications |
The Trust’s organizational documents provide that its officers and trustees are indemnified against certain liabilities arising out of the performance of their duties to the Trust. In addition, both in some of its principal service contracts and in the normal course of its business, the Trust enters into contracts that provide indemnifications to other parties for certain types of losses or liabilities. The Trust’s maximum exposure under these arrangements is unknown as this could involve future claims against the Trust. Management does not expect any significant claims.
15
Table of Contents
State Street Clarion Global Real Estate Income Fund
Report of Independent Registered Public Accounting Firm
To the Board of Trustees and Shareholders of
State Street Institutional Investment Trust:
We have audited the accompanying statement of assets and liabilities, including the portfolio of investments, of State Street Clarion Global Real Estate Income Fund (one of the funds constituting State Street Institutional Investment Trust) (the “Fund”) as of December 31, 2014, and the related statement of operations, statement of changes in net assets, and the financial highlights for the period from October 9, 2014 (commencement of operations) to December 31, 2014. These financial statements and financial highlights are the responsibility of the Fund’s management. Our responsibility is to express an opinion on these financial statements and financial highlights based on our audit.
We conducted our audit in accordance with the standards of the Public Company Accounting Oversight Board (United States). Those standards require that we plan and perform the audit to obtain reasonable assurance about whether the financial statements and financial highlights are free of material misstatement. We were not engaged to perform an audit of the Fund’s internal control over financial reporting. Our audit included consideration of internal control over financial reporting as a basis for designing audit procedures that are appropriate in the circumstances, but not for the purpose of expressing an opinion on the effectiveness of the Fund’s internal control over financial reporting. Accordingly, we express no such opinion. An audit also includes examining, on a test basis, evidence supporting the amounts and disclosures in the financial statements and financial highlights, assessing the accounting principles used and significant estimates made by management, and evaluating the overall financial statement presentation. Our procedures included confirmation of securities owned as of December 31, 2014, by correspondence with the custodian and others or by other appropriate auditing procedures where replies from others were not received. We believe that our audit provides a reasonable basis for our opinion.
In our opinion, the financial statements and financial highlights referred to above present fairly, in all material respects, the financial position of State Street Clarion Global Real Estate Income Fund (one of the funds constituting State Street Institutional Investment Trust) at December 31, 2014, and the results of its operations, the changes in its net assets and the financial highlights for the period from October 9, 2014 (commencement of operations) to December 31, 2014, in conformity with U.S. generally accepted accounting principles.

Boston, Massachusetts
March 2, 2015
16
Table of Contents
State Street Institutional Investment Trust
Other Information
December 31, 2014 (Unaudited)
EXPENSE EXAMPLE
As a shareholder of a fund, you incur ongoing costs, which include costs for administrative services and to the extent applicable, distribution (12b-1) fees, among others. This example is intended to help you understand your ongoing costs (in dollars) of investing in the Fund and to compare these costs with the ongoing costs of investing in other mutual funds. It is based on an investment of $1,000 made at the beginning of the period shown and held for the entire period from July 1, 2014 to December 31, 2014.
The table below illustrates your Fund’s costs in two ways:
| • | Based on actual fund return – This section helps you to estimate the actual expenses that you paid over the period. The “Ending Account Value” shown is derived from the Fund’s actual return, and the third column shows the dollar amount that would have been paid by an investor who started with $1,000 in the Fund. You may use the information here, together with the amount you invested, to estimate the expenses that you paid over the period. To do so, simply divide your account value by $1,000 (for example, an $8,600 account value divided by $1,000 = 8.6), then multiply the result by the number given for the Fund under the heading “Expenses Paid During Period”. |
| • | Based on hypothetical 5% return – This section is intended to help you compare your Fund’s costs with those of other mutual funds. It assumes that the Fund had a yearly return of 5% before expenses, but that the expense ratio is unchanged. In this case, because the return used is not the Fund’s actual return, the results do not apply to your investment. The example is useful in making comparisons because the U.S. Securities and Exchange Commission requires all mutual funds to calculate expenses based on a 5% return. You can assess your Fund’s costs by comparing this hypothetical example with the hypothetical examples that appear in shareholder reports of other funds. |
Six Months Ended December 31, 2014
| Beginning Account Value July 1, 2014 | Ending Account Value December 31, 2014 | Expenses Paid During Period * | ||||||||||
Based on Actual Class Return | ||||||||||||
Class A** | $ | 1,000.00 | $ | 1,075.20 | $ | 3.54 | ||||||
Class I** | $ | 1,000.00 | $ | 1,074.90 | $ | 2.95 | ||||||
Based on Hypothetical (5% return before expenses) | ||||||||||||
Class A** | $ | 1,000.00 | $ | 1,017.64 | $ | 7.63 | ||||||
Class I** | $ | 1,000.00 | $ | 1,018.90 | $ | 6.36 | ||||||
| * | The calculations are based on expenses incurred in the most recent fiscal period of each Class. The Class A Shares and Class I Shares annualized expense ratios for the six months ended December 31, 2014 were 1.50% and 1.25%, respectively. The dollar amounts shown as “Expenses Paid” are equal to the annualized expense ratio multiplied by the average account value over the period, multiplied by 184/365 (the most recent six month period). |
| ** | Actual period is from commencement of operations 10/9/14. Hypothetical period is from 7/1/14. |
17
Table of Contents
State Street Institutional Investment Trust
Other Information — (continued)
December 31, 2014 (Unaudited)
Proxy Voting Policies and Procedures and Record
Information regarding the Fund’s proxy voting policies and procedures, as well as information regarding how the Fund voted proxies, if any, during the most recent 12-month period ended June 30 is available without charge (1) by calling 1-877-521-4083 (toll free), or (2) on the website of the U.S. Securities and Exchange Commission (“SEC”) at www.sec.gov.
Quarterly Portfolio Schedule
The Fund files a complete schedule of portfolio holdings with the SEC for the first and third quarters of each fiscal year on Form N-Q. The Fund’s Forms N-Q are available on the SEC’s website at www.sec.gov and may be reviewed and copied at the SEC’s Public Reference Room in Washington, DC. Information on the operation of the Public Reference Room may be obtained by calling 1-800-SEC-0330. The information on Form N-Q is available upon request, without charge, by calling 1-877-521-4083 (toll-free).
Tax Information
Long term capital gains dividends were paid from the following Fund during the period ended December 31, 2014:
| Fund | Amount | |
State Street Clarion Global Real Estate Income Fund | $450 |
Advisory Agreement Renewal
TRUSTEE CONSIDERATIONS IN APPROVING CONTINUATION OF INVESTMENT ADVISORY AND SUB-ADVISORY AGREEMENTS1
Overview of the Contract Review Process
Under the Investment Company Act of 1940, an investment advisory agreement between a mutual fund and its investment adviser or sub-adviser may continue in effect from year to year only if its continuance
| 1 | Over the course of more than 15 years, the Independent Trustees have identified numerous relevant issues, factors and concerns (“issues, factors and concerns”) that they consider each year in connection with the proposed continuation of the advisory and sub-advisory agreements, the administration agreement, the distribution plans, the distribution agreement and various related-party service agreements (the “annual review process”). The statement of issues, factors and concerns and the related conclusions of the Independent Trustees may not change substantially from year to year. However, the information requested by, and provided to, the Independent Trustees with respect to the issues, factors and concerns and on which their conclusions are based is updated annually and, in some cases, may differ substantially from the previous year. The Independent Trustees schedule annually a separate in-person meeting that is dedicated to the annual review process (the “special meeting”). At the special meeting and throughout the annual review process, the Independent Trustees take a fresh look at each of the issues, factors and concerns in light of the latest available information and each year present one or more sets of comments and questions to management with respect to specific issues, factors and concerns. Management responds to such comments and questions to the satisfaction of the Independent Trustee before the annual review process is completed and prior to the Independent Trustees voting on proposals to approve continuation of the agreements and plans. |
18
Table of Contents
State Street Institutional Investment Trust
Other Information — (continued)
December 31, 2014 (Unaudited)
Advisory Agreement Renewal — (continued)
is approved at least annually by the fund’s board of trustees, including by a vote of a majority of those trustees who are not “interested persons” of the fund (commonly referred to as, the “Independent Trustees”) cast in person at a meeting called for the purpose of considering such approval.
Consistent with these requirements, the Independent Trustees on the Board of Trustees (the “Board”) of the State Street Master Funds and State Street Institutional Investment Trust (each a “Trust” and together, the “Trusts”), met in Executive Sessions on March 20, 2014, April 14, 2014 and June 19, 2014 to consider a proposal to approve, with respect to each portfolio series of the each Trust (each, a “Fund” and collectively, the “Funds”), the initial approval an investment agreement and sub-advisory agreement for certain Funds and, for certain funds, the continuation of the investment advisory agreement and sub-advisory agreements, as applicable, with SSgA Funds Management, Inc. (the “Adviser”), and, for certain funds, CBRE Clarion Securities, LLC (the “Sub-Adviser”) (the “Advisory Agreements”). Prior to voting on the proposal, the Independent Trustees, as well as the Trustees who are “interested persons” of the Adviser, reviewed information furnished by the Adviser and Sub-Adviser and others reasonably necessary to permit the Board to evaluate the proposal fully. Such information included, among other things, the following:
Information about Performance, Expenses and Fees
| • | A report prepared by an independent provider of investment company data, which includes for each Fund: |
| • | Comparisons of the Fund’s performance over the past one-, three-, five- and ten-year periods ended March 31, 2014, as applicable, to the performance of an appropriate benchmark for the Fund and a universe of other mutual funds with similar investment objectives and policies; |
| • | Comparisons of the Fund’s expense ratio (with detail of component expenses) to the expense ratios of a group of comparable mutual funds selected by the independent data provider; |
| • | A chart showing the Fund’s historical average net assets relative to its total expenses, management fees, and non-management expenses over the past five years, as applicable; and |
| • | Comparisons of the Fund’s contractual management fee to the contractual management fees of comparable mutual funds at different asset levels. |
| • | Comparative information concerning fees charged by the Adviser for managing institutional accounts using investment strategies and techniques similar to those used in managing the Funds; and |
| • | Profitability analyses for (a) the Adviser with respect to each Fund and (b) affiliates of the Adviser that provide services to the Funds (“Affiliated Service Providers”). |
Information about Portfolio Management
| • | Descriptions of the investment management services provided by the Adviser and Sub-Adviser, as applicable, including their investment strategies and processes; |
19
Table of Contents
State Street Institutional Investment Trust
Other Information — (continued)
December 31, 2014 (Unaudited)
Advisory Agreement Renewal — (continued)
| • | Information concerning the allocation of brokerage and the benefits received by the Adviser and Sub-Adviser, as applicable, as a result of brokerage allocation, including information concerning the acquisition of any research through “soft dollar” benefits received in connection with the Funds’ brokerage; and |
| • | Information regarding the procedures and processes used to value the assets of the Funds and the assistance provided to the administrator of the Funds by the Adviser in monitoring the effectiveness of such procedures and processes. |
Information about the Adviser
| • | Reports detailing the financial results and condition of the Sub-Adviser, and Adviser and its affiliates; |
| • | Descriptions of the qualifications, education and experience of the individual investment professionals responsible for managing the portfolios of the Funds; |
| • | A copy of each Code of Ethics adopted by the Adviser and Sub-Adviser, together with information relating to compliance with and the administration of such Codes; |
| • | A copy of the Adviser’s and Sub-Adviser’s proxy voting policies and procedures; |
| • | Information concerning the resources devoted by the Adviser to overseeing compliance by the Funds and their service providers, including the Adviser’s record of compliance with investment policies and restrictions and other operating policies of the Funds; and |
| • | A description of the business continuity and disaster recovery plans of the Adviser and Sub-Adviser. |
Other Relevant Information
| • | Information concerning the nature, quality and cost of various non-investment management services provided to the Funds by affiliates of the Adviser, including the custodian, administrator, fund accountant, transfer agent and securities lending agent of the Funds, and the role of the Adviser in managing the Funds’ relationship with these service providers; |
| • | Copies of the Advisory Agreements, Sub-Advisory Agreements and agreements with other service providers of the Funds; |
| • | Draft responses to letter dated February 23, 2014 from Joseph P. Barri, LLC (counsel to the Independent Trustees reviewed prior to such date by Independent Counsel, requesting specific information, from each of: |
| • | The Adviser, with respect to its operations relating to the Funds and its approximate profit margins before taxes from such operations for the Funds’ last fiscal year; and the relevant operations of other affiliated service providers to the Funds, together with their approximate profit margins from such relevant operations for the Funds’ last fiscal year; |
| • | State Street Bank and Trust Company (“State Street”), the administrator, custodian, transfer agent, securities lending agent, and shareholder services for the Funds, with respect to its operations relating to the Funds; and |
20
Table of Contents
State Street Institutional Investment Trust
Other Information — (continued)
December 31, 2014 (Unaudited)
Advisory Agreement Renewal — (continued)
| • | State Street Global Markets, LLC, the principal underwriter and distributor of the shares of the Funds (the “Distributor”), with respect to its operations relating to the Funds, together with the Funds’ related distribution plans and arrangements under SEC Rule 12b-1; |
| • | Information from the Adviser, State Street and the Distributor with respect to State Street Master Funds and State Street Institutional Investment Trust providing any material changes to the previous information supplied in response to the letter dated February 23, 2014 from Joseph P. Barri, LLC prior to the Executive Session of the Board on June 19, 2014. |
| • | Excerpts from the Funds’ most recent prospectuses, statements of additional information and respective annual reports for the fiscal year ended December 31, 2013, including (i) the latest prospectus descriptions of each Fund’s investment objectives, strategies and authorized investment techniques and investments; and (ii) the latest Annual Shareholder Report for each Fund, including Portfolio Management Discussion of Performance, as prepared by its portfolio management team, together with a graphic comparison of the performance of each Fund with its benchmark index, for its fiscal year December 31, 2013; |
| • | Lipper materials dated March 2014, obtained by an Independent Trustee and circulated to the other Independent Trustees and to Independent Counsel, with respect to the Funds for which such materials were then available; and |
| • | A summary of the foregoing materials prepared by Independent Counsel. |
In addition to the information identified above, the Board considered information provided from time to time by the Adviser, and other service providers of the Funds throughout the year at meetings of the Board and its committees. At such meetings, the Trustees received, among other things, presentations by the portfolio managers and other investment professionals of the Adviser relating to the performance of the Funds and the investment strategies used in pursuing each Fund’s investment objective.
The Independent Trustees were assisted throughout the contract review process by their independent legal counsel. The Independent Trustees relied upon the advice of such counsel and their own business judgment in determining the material factors to be considered in evaluating the Advisory Agreement, and the weight to be given to each such factor. The conclusions reached with respect to the Advisory Agreement were based on a comprehensive evaluation of all the information provided and not any single factor. Moreover, each Trustee may have placed varying emphasis on particular factors in reaching conclusions with respect to each Fund.
Results of the Process
Based on a consideration of the foregoing and such other information as deemed relevant, including the factors and conclusions described below, on June 19, 2014 the Board, including a majority of the Independent Trustees, voted to approve the adoption of, as applicable, and the continuation of, as applicable, the Advisory Agreements and Sub-Advisory Agreements effective July 1, 2014, for an additional year with respect to all Funds.
21
Table of Contents
State Street Institutional Investment Trust
Other Information — (continued)
December 31, 2014 (Unaudited)
Advisory Agreement Renewal — (continued)
Nature, Extent and Quality of Services
In considering whether to approve the Advisory Agreements and Sub-Advisory Agreements, the Board evaluated the nature, extent and quality of services provided to each Fund by the Adviser and Sub-Adviser, as applicable.
The Board considered the Adviser’s and Sub-Adviser’s, as applicable, management capabilities and investment process with respect to the types of investments held by each Fund, including the education, experience and number of investment professionals and other personnel who provide portfolio management, investment research, and similar services to the Fund. The Board evaluated, where relevant, the abilities and experience of such investment personnel in analyzing particular markets, industries and specific issuers of securities in these markets and industries. The Board also considered the substantial expertise of the Adviser and Sub-Adviser, as applicable, in developing and applying proprietary quantitative models for managing various Funds that invest primarily in equity securities. With respect to those Funds that invest primarily in fixed-income securities, the Board considered the extensive experience and resources committed by the Adviser to the evaluation of credit, interest-rate and currency risks. With respect to those Funds that operate as money market mutual funds, the Board considered the Adviser’s success in maintaining the constant dollar value of each Fund through extraordinary market conditions. The Board also took into account the compensation paid to recruit and retain investment personnel, and the time and attention devoted to the Funds by senior management.
The Board reviewed the compliance programs of the Adviser, Sub-Adviser and various affiliated service providers. Among other things, the Board considered compliance and reporting matters relating to personal trading by investment personnel, selective disclosure of portfolio holdings, late trading, frequent trading, portfolio valuation, business continuity, the allocation of investment opportunities and the voting of proxies. The Board also considered the role of the Adviser in monitoring each Fund’s securities lending activities.
On the basis of the foregoing and other relevant information, the Board concluded that the Adviser and Sub-Adviser, as applicable, can be expected to continue to provide, high quality investment management and related services for the Funds.
Fund Performance
The Board compared each Fund’s investment performance to the performance of an appropriate benchmark and universe of comparable mutual funds for various time periods ended March 31, 2014.
On the basis of the foregoing and other relevant information, the Board concluded that the performance of each operational Fund is satisfactory or better (a) by comparison to the performance of its peer group funds or (b) after considering steps taken by management to improve the performance of certain Funds.
Management Fees and Expenses
The Board reviewed the contractual investment advisory fee rates payable by each Fund and actual fees paid by each Fund, net of waivers. As part of its review, the Board considered each Fund’s management fee and total expense ratio (both before and after giving effect to any expense caps), as compared to a group of similarly managed funds selected by an independent data provider. The Board also considered
22
Table of Contents
State Street Institutional Investment Trust
Other Information — (continued)
December 31, 2014 (Unaudited)
Advisory Agreement Renewal — (continued)
the comparability of the fees charged and the services provided to each Fund by the Adviser to the fees charged and services provided to other clients of the Adviser, including institutional accounts. In addition, the Board considered the willingness of the Adviser to provide undertakings from time to time to waive fees or pay expenses of various Funds to limit the total expenses borne by shareholders of such Funds. The Board also considered the fees that Adviser pays to the Sub-Adviser for its services to the applicable Funds.
On the basis of the foregoing and other relevant information, and in light of the nature, extent and quality of the services provided by the Adviser, the Board concluded that the fees and the expense ratio of each Fund compare favorably to the fees and expenses of similar mutual funds and are reasonable in relation to the services provided.
Profitability
The Board reviewed the level of profits realized by the Adviser and its affiliates in providing investment advisory and other services to each Fund and to all Funds as a group. The Board considered other direct and indirect benefits received by the Adviser and the Affiliated Service Providers in connection with their relationships with the Funds, including the benefits of research services that may be available to the Adviser as a result of securities transactions effected for the Funds and other investment advisory clients, together with the ranges of profitability of each of the Affiliated Service Providers with respect to their services to the Funds.
The Board concluded that the profitability of the Adviser with respect to each of the Funds, and the profitability range of each of the Affiliated Service Providers with respect to its services to the Funds, were reasonable in relation to the services provided.
Economies of Scale
In reviewing management fees and profitability, the Board also considered the extent to which the Adviser and its affiliates, on the one hand, and each Fund and all Funds as a group, on the other hand, can expect to realize benefits from economies of scale as the assets of the Funds increase. The Board acknowledged the difficulty in accurately measuring the benefits resulting from the economies of scale with respect to the management of any specific Fund or the Funds taken as a whole. The Board concluded that, in light of the current size of each Fund and all Funds as a group, the level of profitability of the Adviser and its affiliates with respect to each Fund and all Funds as a group over various time periods, and the comparatively low management fee and expense ratio of each Fund during these periods, it does not appear that the Adviser or its affiliates has realized benefits from economies of scale in managing the assets of the Funds to such an extent that previously agreed advisory fees should be reduced or that breakpoints in such fees should be implemented for any Fund at this time.
23
Table of Contents
State Street Institutional Investment Trust
Trustees and Officers Information
December 31, 2014 (Unaudited)
Name, Address, | Position(s) Held | Term of Office | Principal Occupation | Number of Funds in Fund Complex Overseen by Trustee | Other Directorships | |||||
Independent Trustees | ||||||||||
Michael F. Holland YOB: 1944 | Trustee and Co- Chairman of the Board | Term: Indefinite Elected: 7/99 | Chairman, Holland & Company L.L.C. (investment adviser) (1995 – present). | 59 | Trustee, State Street Master Funds; Trustee SSGA Funds; Director, the Holland Series Fund, Inc.; Director, The China Fund, Inc.; Director, The Taiwan Fund, Inc.; Director, Reaves Utility Income Fund, Inc.; and Director, Blackstone/GSO Loan Funds. | |||||
Patrick J. Riley YOB: 1948 | Trustee and Co- Chairman of the Board | Term: Indefinite Elected: 1/14 | 2002 to May 2010, Associate Justice of the Superior Court, Commonwealth of Massachusetts; 1985 to 2002, Partner, Riley, Burke & Donahue, L.L.P. (law firm); 1998 to Present, Independent Director, State Street Global Advisers Ireland, Ltd. (investment company); 1998 to Present, Independent Director, SSGA Liquidity plc (formerly, SSGA Cash Management Fund plc); January 2009 to Present, Independent Director, SSGA Fixed Income plc; and January 2009 to Present, Independent Director, SSGA Qualified Funds PLC. | 59 | Trustee, State Street Master Funds; Trustee SSGA Funds; Board Director and Chairman, SPDR Europe 1PLC Board (2011 – Present); Board Director and Chairman, SPDR Europe II, PLC (2013 – Present). | |||||
William L. Boyan YOB: 1937 | Trustee and Co- Chairman of the Valuation Committee | Term: Indefinite Elected: 7/99 | President and Chief Operations Officer, John Hancock Financial Services (1959 – 1999). Mr. Boyan retired in 1999. Chairman Emeritus, Children’s Hospital, Boston, MA (1984 – 2011); Former Chairman, Boston Plan For Excellence, Boston Public Schools (1995 – 2010); Member of Advisory Board of Florida Atlantic University Lifelong Learning Society. | 59 | Trustee, State Street Master Funds; Trustee SSGA Funds; Former Trustee of Old Mutual South Africa Master Trust; Trustee, Children’s Hospital, Boston, MA. | |||||
William L. Marshall State Street Financial Center One Lincoln Street Boston, MA 02111-2900 | Trustee and Co- Chairman of the Audit Committee | Term: Indefinite Elected: 1/14 | April 2011 to Present, Chairman (until April 2011, Chief Executive Officer and President), Wm. L. Marshall Associates, Inc., Wm. L. Marshall Companies, Inc. and the Marshall Financial Group, Inc. (a registered investment adviser and provider of financial and related consulting services); Certified Financial Planner; Member, Financial Planners Association; Director, (2008 – 2014) Doylestown Health Foundation Board; and the Ann Silverman Community Clinic of Doylestown, PA. | 59 | Trustee, State Street Master Funds; Trustee SSGA Funds; Director, Marshall Financial Group, Inc. |
24
Table of Contents
State Street Institutional Investment Trust
Trustees and Officers Information — (continued)
December 31, 2014 (Unaudited)
Name, Address, | Position(s) Held | Term of Office | Principal Occupation | Number of Funds in Fund Complex Overseen by Trustee | Other Directorships | |||||
Independent Trustees (continued) | ||||||||||
Richard D. Shirk State Street Financial Center One Lincoln Street Boston, MA 02111-2900 | Trustee and Co- Chairman of the Qualified Legal and Compliance Committee | Term: Indefinite Elected: 1/14 | March 2001 to April 2002, Chairman (1996 to March 2001, President and Chief Executive Officer), Cerulean Companies, Inc. (holding company) (Retired); 1992 to March 2001, President and Chief Executive Officer, Blue Cross Blue Shield of Georgia (health insurer, managed healthcare); 1998 to December 2008, Chairman, Board Member and December 2008 to Present, Investment Committee Member, Healthcare Georgia Foundation (private foundation); September 2002 to Present, Lead Director and Board Member, Amerigroup Corp. (managed health care); 1999 to Present, Board Member and (since 2001) Investment Committee Member, Woodruff Arts Center; and 2003 to 2009, Trustee, Gettysburg College. | 59 | Trustee, State Street Master Funds; Trustee SSGA Funds; Board member, AeroCare Holdings (privately held healthcare services company) (February 2003 – Present); Board member, Regenesis Biomedical (health care services) (April 2012 – Present). | |||||
Rina K. Spence State Street Financial Center One Lincoln Street Boston, MA 02111-2900 | Trustee and Co- Chairman of the Qualified Legal and Compliance Committee and Co- Chairman of the Governance Committee | Term: Indefinite Elected: 7/99 | President of SpenceCare International LLC (international healthcare consulting) (1999 – present); Chief Executive Officer, IEmily.com (health internet company) (2000 – 2001); Chief Executive Officer of Consensus Pharmaceutical, Inc. (1998 – 1999); Founder, President and Chief Executive Officer of Spence Center for Women’s Health (1994 – 1998); President and CEO Emerson Hospital (1984 – 1994); Trustee, Eastern Enterprise (utilities) (1988 – 2000). | 59 | Trustee, State Street Master Funds; Trustee SSGA Funds; Director, Berkshire Life Insurance Company of America (1993 – 2009); Director, IEmily.com, Inc. (2000 – 2010); and Trustee, National Osteoporosis Foundation (2005 – 2008). | |||||
Bruce D. Taber State Street Financial Center One Lincoln Street Boston, MA 02111-2900 | Trustee and Co- Chairman of the Valuation Committee and Co-Chairman of the Governance Committee | Term: Indefinite Elected: 1/14 | 1999 to Present, Partner, Zenergy LLC (a technology company providing Computer Modeling and System Analysis to the General Electric Power Generation Division); Until December 2008, Independent Director, SSGA Cash Management Fund plc; Until December 2008, Independent Director, State Street Global Advisers Ireland, Ltd. (investment companies); and Until August 1994, President, Alonzo B. Reed, Inc., (a Boston architect-engineering firm). | 59 | Trustee, State Street Master Funds; Trustee SSGA Funds | |||||
Douglas T. Williams State Street Financial Center One Lincoln Street Boston, MA 02111-2900 | Trustee and Co- Chairman of the Audit Committee | Term: Indefinite Elected: 7/99 | President, Oakmont Homeowners Association (2012 – 2013); President, Mariner Sands Chapel; Executive Vice President and member of Executive Committee, Chase Manhattan Bank (1987 – 1999); President, Boston Stock Exchange Depository Trust Company, 1981 – 1982. | 59 | Trustee, State Street Master Funds; Trustee SSGA Funds; Treasurer, Nantucket Educational Trust, (2002 – 2007). | |||||
25
Table of Contents
State Street Institutional Investment Trust
Trustees and Officers Information — (continued)
December 31, 2014 (Unaudited)
Name, Address, | Position(s) Held | Term of Office | Principal Occupation | Number of Funds in Fund Complex Overseen by Trustee | Other Directorships | |||||
Interested Trustees(1) | ||||||||||
Scott F. Powers State Street Financial Center One Lincoln Street Boston, MA 02111-2900 | Trustee | Term: Indefinite Elected Trustee: 1/14 | May 2008 to Present, President and Chief Executive Officer of State Street Global Advisors; 2001 – 2008, Chief Executive Officer of Old Mutual Asset Management; Board of Directors, United Way of Massachusetts Bay; Board of Directors of Middlesex School; Incorporator, Cardigan Mountain School | 59 | ||||||
James E. Ross SSGA Funds Management, Inc. State Street Financial Center One Lincoln Street Boston, MA 02111-2900 | Trustee | Term: Indefinite Elected Trustee: 2/07 | Chairman and Director, SSGA Funds Management, Inc. (2012 – present); President, SSGA Funds Management, Inc. (2005 – 2012); Executive Vice President and Senior Managing Director, State Street Global Advisors (2006 – present); and Principal, State Street Global Advisors (2006 – present). | 254 |
| (1) | Mr. Powers and Mr. Ross are Interested Trustees because of their employment by SSGA Funds Management, Inc., an affiliate of the Trust. |
Name, Address, | Position(s) Held with Trust | Term of Office | Principal Occupation During | |||
Officers: | ||||||
Ellen M. Needham SSGA Funds Management, Inc. State Street Financial Center One Lincoln Street Boston, MA 02111-2900 | President | Term: Indefinite Elected: 10/12 | President and Director, SSGA Funds Management, Inc. (June 2012 – present); Chief Operating Officer, SSGA Funds Management, Inc. (May 2010 – June 2012); Senior Managing Director, SSGA Funds Management, Inc. (1992 – 2012) and Senior Managing Director, State Street Global Advisors (1992 – present).* | |||
Ann M. Carpenter SSGA Funds Management, Inc. State Street Financial Center One Lincoln Street Boston, MA 02111-2900 | Vice President | Term: Indefinite Elected: 10/12 | Chief Operating Officer, SSGA Funds Management, Inc. (April 2014 – present); Vice President, SSGA Funds Management, Inc. (2008 – present); Principal, State Street Global Advisors (2005 – 2008 – present).* | |||
Laura F. Dell State Street Bank and Trust Company 100 Huntington Avenue Boston, MA 02116 | Treasurer | Term: Indefinite Elected: 11/10 | Vice President, State Street Bank and Trust Company (2002 – present).* | |||
Chad C. Hallett SSGA Funds Management, Inc. State Street Financial Center One Lincoln Street Boston, MA 02111-2900 | Assistant Treasurer | Term: Indefinite Elected: 09/11 | Vice President, State Street Global Advisors and SSGA Funds Management, Inc. (November 2014 – present); Vice President, State Street Bank and Trust Company (2001 – November 2014).* |
26
Table of Contents
State Street Institutional Investment Trust
Trustees and Officers Information — (continued)
December 31, 2014 (Unaudited)
Name, Address, | Position(s) Held with Trust | Term of Office | Principal Occupation During | |||
Officers: (continued) | ||||||
Caroline M. Connolly State Street Bank and Trust Company 100 Huntington Avenue Boston, MA 02116 | Assistant Treasurer | Term: Indefinite Elected: 09/11 | Assistant Vice President, State Street Bank and Trust Company (2007 – present). | |||
Brian Harris State Street Financial Center One Lincoln Street Boston, MA 02111 | Chief Compliance Officer | Term: Indefinite Elected: 11/13 | Vice President, State Street Global Advisors and SSGA Funds Management, Inc.( June 2013 – Present); Senior Vice President and Global Head of Investment Compliance, BofA Global Capital Management (September 2010 to May 2013); Director of Compliance, AARP Financial Inc. (July 2008 to August 2010). | |||
David K. James State Street Bank and Trust Company 100 Huntington Avenue Boston, MA 02116 | Secretary | Term: Indefinite Elected: 4/13 | Managing Director and Managing Counsel, State Street Bank and Trust Company (2009 – present); Vice President and Counsel, PNC Global Investment Servicing (US), Inc. (2006 – 2009). | |||
Kristin Schantz State Street Bank and Trust Company 100 Huntington Avenue Boston, MA 02116 | Assistant Secretary | Term: Indefinite Elected: 2/14 | Vice President and Counsel, State Street Bank and Trust Company (2013 – present); Vice President, Citi Fund Services Ohio, Inc. (2008 – 2013). |
| * | Served in various capacities and/or with various affiliated entities during noted time period. |
The Statement of Additional Information includes additional information about the Trustees and is available, without charge, upon request, by calling (toll free) 877-521-4083.
27
Table of Contents
Trustees
William L. Boyan
Michael F. Holland
William L. Marshall
Scott F. Powers
Patrick J. Riley
James E. Ross
Richard D. Shirk
Rina K. Spence
Bruce D. Taber
Douglas T. Williams
Investment Adviser
SSGA Funds Management, Inc.
State Street Financial Center
One Lincoln Street
Boston, MA 02111
Investment Sub-Adviser
CBRE Clarion Securities LLC
201 King of Prussia Road, Suite
600 Radnor, PA 19087
Custodian and Administrator
State Street Bank and Trust Company
State Street Financial Center
One Lincoln Street
Boston, MA 02111
Independent Public Registered Accounting Firm
Ernst & Young LLP
200 Clarendon Street
Boston, MA 02116
Legal Counsel
Ropes & Gray LLP
800 Boylston Street
Boston, MA 02199
Transfer Agent
Boston Financial Data Services
Two Heritage Drive
North Quincy, MA 02171
Distributor
State Street Global Markets LLC
State Street Financial Center
One Lincoln Street
Boston, MA 02111
This report is for shareholder information. This is not a prospectus intended for use in the purchase or sale of shares of beneficial interest.
State Street Institutional Investment Trust State Street Bank and Trust Company P.O. Box 5049 Boston, MA 02206
IBG-14280 | SSITCLARAR |
Table of Contents
Annual Report
31 December 2014
State Street Institutional Investment Trust
State Street Target Retirement Fund
State Street Target Retirement 2015 Fund
State Street Target Retirement 2020 Fund
State Street Target Retirement 2025 Fund
State Street Target Retirement 2030 Fund
State Street Target Retirement 2035 Fund
State Street Target Retirement 2040 Fund
State Street Target Retirement 2045 Fund
State Street Target Retirement 2050 Fund
State Street Target Retirement 2055 Fund
State Street Target Retirement 2060 Fund

Table of Contents
State Street Institutional Investment Trust
Target Retirement Funds
Annual Report
December 31, 2014
| 1 | ||||
| 5 | ||||
| 16 | ||||
| 19 | ||||
| 22 | ||||
| 25 | ||||
| 34 | ||||
| 45 | ||||
| 46 | ||||
| 51 | ||||
| 51 | ||||
| 51 | ||||
| 51 | ||||
| 57 |
Table of Contents
State Street Target Retirement Series (Unaudited)
The Retirement Fund, Target Retirement 2015 Fund, Target Retirement 2020 Fund, Target Retirement 2025 Fund, Target Retirement 2030 Fund, Target Retirement 2035 Fund, Target Retirement 2040 Fund, Target Retirement 2045 Fund, Target Retirement 2050 Fund, Target Retirement 2055 Fund and Target Retirement 2060 Fund are referred to collectively as the (“Target Retirement Funds” or the “Funds”).
SSGA Management, Inc. (“SSGA FM” or the “Adviser”) invests each Target Retirement Fund into underlying funds according to a proprietary asset allocation strategy. Each Fund’s name refers to the approximate retirement year of the investors for whom the Fund’s asset allocation strategy is intended. As the target date for a Fund approaches, the Adviser will adjust the asset allocation and risk profile of the Fund – its glide path – to a what is generally seen to be a more conservative approach to reduce (but not eliminate) risk by increasing the allocation to asset classes that have historically been subject to lower levels of volatility. For example, a Fund with a target retirement date far into the future will typically invest a greater portion of its assets in asset classes with higher risk profiles and the potential for higher returns than a Fund that is intended for investors who are in their retirement years.
State Street Target Retirement Fund
Asset Allocation as of December 31, 2014 (as a percentage of Net Assets)
Domestic Equity Funds | 19.6 | % | ||
Domestic Fixed Income Funds | 64.4 | % | ||
International Equity Funds | 9.9 | % | ||
Real Estate Funds | 4.9 | % | ||
Short Term Funds | 0.2 | % | ||
Other Assets in Excess of Liabilities | 1.0 | % | ||
| 100.0 | % |
State Street Target Retirement 2015 Fund
Asset Allocation as of December 31, 2014 (as a percentage of Net Assets)
Domestic Equity Funds | 27.0 | % | ||
Domestic Fixed Income Funds | 52.1 | % | ||
International Equity Funds | 14.9 | % | ||
Real Estate Funds | 4.9 | % | ||
Short Term Funds | 0.1 | % | ||
Other Assets in Excess of Liabilities | 1.0 | % | ||
| 100.0 | % |
1
Table of Contents
State Street Target Retirement 2020 Fund
Asset Allocation as of December 31, 2014 (as a percentage of Net Assets)
Domestic Equity Funds | 35.9 | % | ||
Domestic Fixed Income Funds | 39.8 | % | ||
International Equity Funds | 21.3 | % | ||
Real Estate Funds | 2.4 | % | ||
Short Term Funds | 0.2 | % | ||
Other Assets in Excess of Liabilities | 0.4 | % | ||
| 100.0 | % |
State Street Target Retirement 2025 Fund
Asset Allocation as of December 31, 2014 (as a percentage of Net Assets)
Domestic Equity Funds | 42.8 | % | ||
Domestic Fixed Income Funds | 30.4 | % | ||
International Equity Funds | 26.3 | % | ||
Short Term Funds | 0.2 | % | ||
Other Assets in Excess of Liabilities | 0.3 | % | ||
| 100.0 | % |
State Street Target Retirement 2030 Fund
Asset Allocation as of December 31, 2014 (as a percentage of Net Assets)
Domestic Equity Funds | 47.2 | % | ||
Domestic Fixed Income Funds | 22.8 | % | ||
International Equity Funds | 29.2 | % | ||
Short Term Funds | 0.4 | % | ||
Other Assets in Excess of Liabilities | 0.4 | % | ||
| 100.0 | % |
State Street Target Retirement 2035 Fund
Asset Allocation as of December 31, 2014 (as a percentage of Net Assets)
Domestic Equity Funds | 50.9 | % | ||
Domestic Fixed Income Funds | 16.8 | % | ||
International Equity Funds | 31.6 | % | ||
Short Term Funds | 0.4 | % | ||
Other Assets in Excess of Liabilities | 0.3 | % | ||
| 100.0 | % |
2
Table of Contents
State Street Target Retirement 2040 Fund
Asset Allocation as of December 31, 2014 (as a percentage of Net Assets)
Domestic Equity Funds | 53.6 | % | ||
Domestic Fixed Income Funds | 11.7 | % | ||
International Equity Funds | 33.5 | % | ||
Short Term Funds | 0.7 | % | ||
Other Assets in Excess of Liabilities | 0.5 | % | ||
| 100.0 | % |
State Street Target Retirement 2045 Fund
Asset Allocation as of December 31, 2014 (as a percentage of Net Assets)
Domestic Equity Funds | 54.4 | % | ||
Domestic Fixed Income Funds | 9.8 | % | ||
International Equity Funds | 33.8 | % | ||
Short Term Funds | 1.1 | % | ||
Other Assets in Excess of Liabilities | 0.9 | % | ||
| 100.0 | % |
State Street Target Retirement 2050 Fund
Asset Allocation as of December 31, 2014 (as a percentage of Net Assets)
Domestic Equity Funds | 53.4 | % | ||
Domestic Fixed Income Funds | 9.6 | % | ||
International Equity Funds | 33.2 | % | ||
Short Term Funds | 1.1 | % | ||
Other Assets in Excess of Liabilities | 2.7 | % | ||
| 100.0 | % |
State Street Target Retirement 2055 Fund
Asset Allocation as of December 31, 2014 (as a percentage of Net Assets)
Domestic Equity Funds | 53.4 | % | ||
Domestic Fixed Income Funds | 9.6 | % | ||
International Equity Funds | 33.2 | % | ||
Short Term Funds | 1.1 | % | ||
Other Assets in Excess of Liabilities | 2.7 | % | ||
| 100.0 | % |
3
Table of Contents
State Street Target Retirement 2060 Fund
Asset Allocation as of December 31, 2014 (as a percentage of Net Assets)
Domestic Equity Funds | 53.5 | % | ||
Domestic Fixed Income Funds | 9.6 | % | ||
International Equity Funds | 33.3 | % | ||
Short Term Funds | 1.1 | % | ||
Other Assets in Excess of Liabilities | 2.5 | % | ||
| 100.0 | % |
4
Table of Contents
State Street Target Retirement Fund
December 31, 2014
| Shares | Value | |||||||
MUTUAL FUNDS AND EXCHANGE TRADED PRODUCTS(a) – 98.8% |
| |||||||
Domestic Equity – 19.6% |
| |||||||
SPDR Russell Small Cap Completeness ETF | 890 | $ | 75,098 | |||||
State Street Equity 500 Index II Portfolio | 37,233 | 392,859 | ||||||
|
| |||||||
| 467,957 | ||||||||
|
| |||||||
Domestic Fixed Income – 64.4% |
| |||||||
SPDR Barclays 1-10 Year TIPS ETF | 22,381 | 426,582 | ||||||
SPDR Barclays High Yield Bond ETF | 4,317 | 166,679 | ||||||
SPDR Barclays Short Term Corporate Bond ETF | 3,128 | 95,686 | ||||||
SPDR Barclays Short Term Treasury ETF | 12,501 | 376,030 | ||||||
State Street Aggregate Bond Index Portfolio | 47,100 | 477,546 | ||||||
|
| |||||||
| 1,542,523 | ||||||||
|
| |||||||
International Equity – 9.9% |
| |||||||
State Street Global Equity ex-U.S. Index Portfolio | 25,905 | 237,423 | ||||||
|
| |||||||
| 237,423 | ||||||||
|
| |||||||
Real Estate – 4.9% |
| |||||||
SPDR Dow Jones Global Real Estate ETF | 2,465 | 117,654 | ||||||
|
| |||||||
| 117,654 | ||||||||
|
| |||||||
TOTAL MUTUAL FUNDS AND EXCHANGE TRADED PRODUCTS |
| 2,365,557 | ||||||
|
| |||||||
SHORT TERM INVESTMENT – 0.2% |
| |||||||
Money Market Funds – 0.2% |
| |||||||
State Street Institutional Liquid Reserves Fund, Premier Class 0.07%(a)(b) | 3,627 | 3,627 | ||||||
|
| |||||||
TOTAL SHORT TERM INVESTMENT |
| 3,627 | ||||||
|
| |||||||
TOTAL INVESTMENTS(c) – 99.0% |
| 2,369,184 | ||||||
Other Assets in Excess of | 24,602 | |||||||
|
| |||||||
NET ASSETS – 100.0% | $ | 2,393,786 | ||||||
|
| |||||||
| (a) | Affiliated funds managed by SSGA Funds Management, Inc. (Note 8). |
| (b) | The rate shown is the annualized seven-day yield at period end. |
| (c) | Unless otherwise indicated, the values of the securities of the Fund are determined based on Level 1 inputs. |
See Notes to Financial Statements.
5
Table of Contents
State Street Target Retirement 2015 Fund
Portfolio of Investments
December 31, 2014
| Shares | Value | |||||||
MUTUAL FUNDS AND EXCHANGE TRADED PRODUCTS(a) – 98.9% |
| |||||||
Domestic Equity – 27.0% |
| |||||||
SPDR Russell Small Cap Completeness ETF | 1,539 | $ | 129,861 | |||||
State Street Equity 500 Index II Portfolio | 62,133 | 655,588 | ||||||
|
| |||||||
| 785,449 | ||||||||
|
| |||||||
Domestic Fixed Income – 52.1% |
| |||||||
SPDR Barclays 1-10 Year TIPS ETF | 27,190 | 518,241 | ||||||
SPDR Barclays High Yield Bond ETF | 5,270 | 203,475 | ||||||
SPDR Barclays Short Term Corporate Bond ETF | 477 | 14,591 | ||||||
SPDR Barclays Short Term Treasury ETF | 1,696 | 51,016 | ||||||
State Street Aggregate Bond Index Portfolio | 71,783 | 727,820 | ||||||
|
| |||||||
| 1,515,143 | ||||||||
|
| |||||||
International Equity – 14.9% |
| |||||||
State Street Global Equity ex-U.S. Index Portfolio | 47,201 | 432,604 | ||||||
|
| |||||||
| 432,604 | ||||||||
|
| |||||||
Real Estate – 4.9% |
| |||||||
SPDR Dow Jones Global Real Estate ETF | 3,009 | 143,620 | ||||||
|
| |||||||
| 143,620 | ||||||||
|
| |||||||
TOTAL MUTUAL FUNDS AND EXCHANGE TRADED PRODUCTS |
| 2,876,816 | ||||||
|
| |||||||
SHORT TERM INVESTMENT – 0.1% |
| |||||||
Money Market Funds – 0.1% |
| |||||||
State Street Institutional Liquid Reserves Fund, Premier Class 0.07%(a)(b) | 4,002 | 4,002 | ||||||
|
| |||||||
TOTAL SHORT TERM INVESTMENT |
| 4,002 | ||||||
|
| |||||||
TOTAL INVESTMENTS(c) – 99.0% |
| 2,880,818 | ||||||
Other Assets in Excess of | 29,510 | |||||||
|
| |||||||
NET ASSETS – 100.0% | $ | 2,910,328 | ||||||
|
| |||||||
| (a) | Affiliated funds managed by SSGA Funds Management, Inc. (Note 8). |
| (b) | The rate shown is the annualized seven-day yield at period end. |
| (c) | Unless otherwise indicated, the values of the securities of the Fund are determined based on Level 1 inputs. |
See Notes to Financial Statements.
6
Table of Contents
State Street Target Retirement 2020 Fund
Portfolio of Investments
December 31, 2014
| Shares | Value | |||||||
MUTUAL FUNDS AND EXCHANGE TRADED PRODUCTS(a) – 99.4% |
| |||||||
Domestic Equity – 35.9% | ||||||||
SPDR Russell Small Cap Completeness ETF | 6,532 | $ | 551,170 | |||||
State Street Equity 500 Index II Portfolio | 223,079 | 2,353,794 | ||||||
|
| |||||||
| 2,904,964 | ||||||||
|
| |||||||
Domestic Fixed Income – 39.8% |
| |||||||
SPDR Barclays High Yield Bond ETF | 12,408 | 479,073 | ||||||
SPDR Barclays Long Term Treasury ETF | 5,229 | 381,016 | ||||||
SPDR Barclays TIPS ETF | 14,377 | 804,825 | ||||||
State Street Aggregate Bond Index Portfolio | 153,272 | 1,554,043 | ||||||
|
| |||||||
| 3,218,957 | ||||||||
|
| |||||||
International Equity – 21.3% |
| |||||||
State Street Global Equity ex-U.S. Index Portfolio | 187,497 | 1,718,452 | ||||||
|
| |||||||
| 1,718,452 | ||||||||
|
| |||||||
Real Estate – 2.4% |
| |||||||
SPDR Dow Jones Global Real Estate ETF | 4,132 | 197,220 | ||||||
|
| |||||||
| 197,220 | ||||||||
|
| |||||||
TOTAL MUTUAL FUNDS AND EXCHANGE TRADED PRODUCTS |
| 8,039,593 | ||||||
|
| |||||||
SHORT TERM INVESTMENT – 0.2% |
| |||||||
Money Market Funds – 0.2% |
| |||||||
State Street Institutional Liquid Reserves Fund, Premier Class 0.07%(a)(b) | 16,109 | 16,109 | ||||||
|
| |||||||
TOTAL SHORT TERM INVESTMENT |
| 16,109 | ||||||
|
| |||||||
TOTAL INVESTMENT(c) – 99.6% |
| 8,055,702 | ||||||
Other Assets in Excess of | 32,962 | |||||||
|
| |||||||
NET ASSETS – 100.0% | $ | 8,088,664 | ||||||
|
| |||||||
| (a) | Affiliated funds managed by SSGA Funds Management, Inc. (Note 8). |
| (b) | The rate shown is the annualized seven-day yield at period end. |
| (c) | Unless otherwise indicated, the values of the securities of the Fund are determined based on Level 1 inputs. |
See Notes to Financial Statements.
7
Table of Contents
State Street Target Retirement 2025 Fund
Portfolio of Investments
December 31, 2014
| Shares | Value | |||||||
MUTUAL FUNDS AND EXCHANGE TRADED PRODUCTS(a) – 99.5% |
| |||||||
Domestic Equity – 42.8% |
| |||||||
SPDR Russell Small Cap Completeness ETF | 7,671 | $ | 647,279 | |||||
State Street Equity 500 Index II Portfolio | 220,882 | 2,330,622 | ||||||
|
| |||||||
| 2,977,901 | ||||||||
|
| |||||||
Domestic Fixed Income – 30.4% |
| |||||||
SPDR Barclays High Yield Bond ETF | 7,349 | 283,745 | ||||||
SPDR Barclays Long Term Treasury ETF | 9,304 | 677,945 | ||||||
SPDR Barclays TIPS ETF | 3,614 | 202,312 | ||||||
State Street Aggregate Bond Index Portfolio | 93,539 | 948,398 | ||||||
|
| |||||||
| 2,112,400 | ||||||||
|
| |||||||
International Equity – 26.3% |
| |||||||
State Street Global Equity ex-U.S. Index Portfolio | 199,123 | 1,825,003 | ||||||
|
| |||||||
| 1,825,003 | ||||||||
|
| |||||||
TOTAL MUTUAL FUNDS AND EXCHANGE TRADED PRODUCTS |
| 6,915,304 | ||||||
|
| |||||||
SHORT TERM INVESTMENT – 0.2% |
| |||||||
Money Market Funds – 0.2% |
| |||||||
State Street Institutional Liquid Reserves Fund, Premier Class 0.07%(a)(b) | 13,242 | 13,242 | ||||||
|
| |||||||
TOTAL SHORT TERM INVESTMENT |
| 13,242 | ||||||
|
| |||||||
TOTAL INVESTMENTS(c) – 99.7% |
| 6,928,546 | ||||||
Other Assets in Excess of | 23,592 | |||||||
|
| |||||||
NET ASSETS – 100.0% | $ | 6,952,138 | ||||||
|
| |||||||
| (a) | Affiliated funds managed by SSGA Funds Management, Inc. (Note 8). |
| (b) | The rate shown is the annualized seven-day yield at period end. |
| (c) | Unless otherwise indicated, the values of the securities of the Fund are determined based on Level 1 inputs. |
See Notes to Financial Statements.
8
Table of Contents
State Street Target Retirement 2030 Fund
Portfolio of Investments
December 31, 2014
| Shares | Value | |||||||
MUTUAL FUNDS AND EXCHANGE TRADED PRODUCTS(a) – 99.2% |
| |||||||
Domestic Equity – 47.2% | ||||||||
SPDR Russell Small Cap Completeness ETF | 6,143 | $ | 518,346 | |||||
State Street Equity 500 Index II Portfolio | 156,596 | 1,652,311 | ||||||
|
| |||||||
| 2,170,657 | ||||||||
|
| |||||||
Domestic Fixed Income – 22.8% | ||||||||
SPDR Barclays High Yield Bond ETF | 1,351 | 52,162 | ||||||
SPDR Barclays Long Term Treasury ETF | 6,096 | 444,191 | ||||||
SPDR Barclays TIPS ETF | 694 | 38,850 | ||||||
State Street Aggregate Bond Index Portfolio | 50,392 | 510,932 | ||||||
|
| |||||||
| 1,046,135 | ||||||||
|
| |||||||
International Equity – 29.2% | ||||||||
State Street Global Equity ex-U.S. Index Portfolio | 146,572 | 1,343,361 | ||||||
|
| |||||||
| 1,343,361 | ||||||||
|
| |||||||
TOTAL MUTUAL FUNDS AND EXCHANGE TRADED PRODUCTS |
| 4,560,153 | ||||||
|
| |||||||
SHORT TERM INVESTMENT – 0.4% |
| |||||||
Money Market Funds – 0.4% |
| |||||||
State Street Institutional Liquid Reserves Fund, Premier Class 0.07%(a)(b) | 18,347 | 18,347 | ||||||
|
| |||||||
TOTAL SHORT TERM INVESTMENT |
| 18,347 | ||||||
|
| |||||||
TOTAL INVESTMENTS(c) – 99.6% | 4,578,500 | |||||||
Other Assets in Excess of | 17,578 | |||||||
|
| |||||||
NET ASSETS – 100.0% | $ | 4,596,078 | ||||||
|
| |||||||
| (a) | Affiliated funds managed by SSGA Funds Management, Inc. (Note 8). |
| (b) | The rate shown is the annualized seven-day yield at period end. |
| (c) | Unless otherwise indicated, the values of the securities of the Fund are determined based on Level 1 inputs. |
See Notes to Financial Statements.
9
Table of Contents
State Street Target Retirement 2035 Fund
Portfolio of Investments
December 31, 2014
| Shares | Value | |||||||
MUTUAL FUNDS AND EXCHANGE TRADED PRODUCTS(a) – 99.3% |
| |||||||
Domestic Equity – 50.9% |
| |||||||
SPDR Russell Small Cap Completeness ETF | 6,860 | $ | 578,847 | |||||
State Street Equity 500 Index II Portfolio | 148,828 | 1,570,347 | ||||||
|
| |||||||
| 2,149,194 | ||||||||
|
| |||||||
Domestic Fixed Income – 16.8% |
| |||||||
SPDR Barclays Long Term Treasury ETF | 5,668 | 413,004 | ||||||
State Street Aggregate Bond Index Portfolio | 29,433 | 298,421 | ||||||
|
| |||||||
| 711,425 | ||||||||
|
| |||||||
International Equity – 31.6% |
| |||||||
State Street Global Equity ex-U.S. Index Portfolio | 145,607 | 1,334,522 | ||||||
|
| |||||||
| 1,334,522 | ||||||||
|
| |||||||
TOTAL MUTUAL FUNDS AND EXCHANGE TRADED PRODUCTS |
| 4,195,141 | ||||||
|
| |||||||
SHORT TERM INVESTMENT – 0.4% |
| |||||||
Money Market Funds – 0.4% |
| |||||||
State Street Institutional Liquid Reserves Fund, Premier Class 0.07%(a)(b) | 15,127 | 15,127 | ||||||
|
| |||||||
TOTAL SHORT TERM INVESTMENT |
| 15,127 | ||||||
|
| |||||||
TOTAL INVESTMENTS(c) – 99.7% |
| 4,210,268 | ||||||
Other Assets in Excess of |
| 14,200 | ||||||
|
| |||||||
NET ASSETS – 100.0% |
| $ | 4,224,468 | |||||
|
| |||||||
| (a) | Affiliated funds managed by SSGA Funds Management, Inc. (Note 8). |
| (b) | The rate shown is the annualized seven-day yield at period end. |
| (c) | Unless otherwise indicated, the values of the securities of the Fund are determined based on Level 1 inputs. |
See Notes to Financial Statements.
10
Table of Contents
State Street Target Retirement 2040 Fund
Portfolio of Investments
December 31, 2014
| Shares | Value | |||||||
MUTUAL FUNDS AND EXCHANGE TRADED PRODUCTS(a) – 98.8% |
| |||||||
Domestic Equity – 53.6% |
| |||||||
SPDR Russell Small Cap Completeness ETF | 4,762 | $ | 401,818 | |||||
State Street Equity 500 Index II Portfolio | 90,269 | 952,462 | ||||||
|
| |||||||
| 1,354,280 | ||||||||
|
| |||||||
Domestic Fixed Income – 11.7% |
| |||||||
SPDR Barclays Long Term Treasury ETF | 3,349 | 244,028 | ||||||
State Street Aggregate Bond Index Portfolio | 5,009 | 50,785 | ||||||
|
| |||||||
| 294,813 | ||||||||
|
| |||||||
International Equity – 33.5% |
| |||||||
State Street Global Equity ex-U.S. Index Portfolio | 92,313 | 846,072 | ||||||
|
| |||||||
| 846,072 | ||||||||
|
| |||||||
TOTAL MUTUAL FUNDS AND EXCHANGE TRADED PRODUCTS |
| 2,495,165 | ||||||
|
| |||||||
SHORT TERM INVESTMENT – 0.7% |
| |||||||
Money Market Funds – 0.7% |
| |||||||
State Street Institutional Liquid Reserves Fund, Premier Class 0.07%(a)(b) | 17,599 | 17,599 | ||||||
|
| |||||||
TOTAL SHORT TERM INVESTMENT |
| 17,599 | ||||||
|
| |||||||
TOTAL INVESTMENTS(c) – 99.5% (Cost $2,507,345) | 2,512,764 | |||||||
Other Assets in Excess of | 11,379 | |||||||
|
| |||||||
NET ASSETS – 100.0% | $ | 2,524,143 | ||||||
|
| |||||||
| (a) | Affiliated funds managed by SSGA Funds Management, Inc. (Note 8). |
| (b) | The rate shown is the annualized seven-day yield at period end. |
| (c) | Unless otherwise indicated, the values of the securities of the Fund are determined based on Level 1 inputs. |
See Notes to Financial Statements.
11
Table of Contents
State Street Target Retirement 2045 Fund
Portfolio of Investments
December 31, 2014
| Shares | Value | |||||||
MUTUAL FUNDS AND EXCHANGE TRADED PRODUCTS(a) – 98.0% |
| |||||||
Domestic Equity – 54.4% | ||||||||
SPDR Russell Small Cap Completeness ETF | 2,038 | $ | 171,966 | |||||
State Street Equity 500 Index II Portfolio | 35,570 | 375,313 | ||||||
|
| |||||||
| 547,279 | ||||||||
|
| |||||||
Domestic Fixed Income – 9.8% | ||||||||
SPDR Barclays Long Term Treasury ETF | 1,348 | 98,223 | ||||||
|
| |||||||
| 98,223 | ||||||||
|
| |||||||
International Equity – 33.8% | ||||||||
State Street Global Equity ex-U.S. Index Portfolio | 37,092 | 339,958 | ||||||
|
| |||||||
| 339,958 | ||||||||
|
| |||||||
TOTAL MUTUAL FUNDS AND EXCHANGE TRADED PRODUCTS |
| 985,460 | ||||||
|
| |||||||
SHORT TERM INVESTMENT – 1.1% |
| |||||||
Money Market Funds – 1.1% | ||||||||
State Street Institutional Liquid Reserves Fund, Premier Class 0.07%(a)(b) | 11,094 | 11,094 | ||||||
|
| |||||||
TOTAL SHORT TERM INVESTMENT |
| 11,094 | ||||||
|
| |||||||
TOTAL INVESTMENTS(c) – 99.1% |
| 996,554 | ||||||
Other Assets in Excess of | 9,462 | |||||||
|
| |||||||
NET ASSETS – 100.0% | $ | 1,006,016 | ||||||
|
| |||||||
| (a) | Affiliated funds managed by SSGA Funds Management, Inc. (Note 8). |
| (b) | The rate shown is the annualized seven-day yield at period end. |
| (c) | Unless otherwise indicated, the values of the securities of the Fund are determined based on Level 1 inputs. |
See Notes to Financial Statements.
12
Table of Contents
State Street Target Retirement 2050 Fund
Portfolio of Investments
December 31, 2014
| Shares | Value | |||||||
MUTUAL FUNDS AND EXCHANGE TRADED PRODUCTS(a) – 96.2% |
| |||||||
Domestic Equity – 53.4% |
| |||||||
SPDR Russell Small Cap Completeness ETF | 995 | $ | 83,958 | |||||
State Street Equity 500 Index II Portfolio | 17,491 | 184,559 | ||||||
|
| |||||||
| 268,517 | ||||||||
|
| |||||||
Domestic Fixed Income – 9.6% |
| |||||||
SPDR Barclays Long Term Treasury ETF | 666 | 48,529 | ||||||
|
| |||||||
| 48,529 | ||||||||
|
| |||||||
International Equity – 33.2% |
| |||||||
State Street Global Equity ex-U.S. Index Portfolio | 18,240 | 167,174 | ||||||
|
| |||||||
| 167,174 | ||||||||
|
| |||||||
TOTAL MUTUAL FUNDS AND EXCHANGE TRADED PRODUCTS |
| 484,220 | ||||||
|
| |||||||
SHORT TERM INVESTMENT – 1.1% |
| |||||||
Money Market Funds – 1.1% |
| |||||||
State Street Institutional Liquid Reserves Fund, Premier Class 0.07%(a)(b) | 5,420 | 5,420 | ||||||
|
| |||||||
TOTAL SHORT TERM INVESTMENT |
| 5,420 | ||||||
|
| |||||||
TOTAL INVESTMENTS(c) – 97.3% |
| 489,640 | ||||||
Other Assets in Excess of |
| 13,342 | ||||||
|
| |||||||
NET ASSETS – 100.0% |
| $ | 502,982 | |||||
|
| |||||||
| (a) | Affiliated funds managed by SSGA Funds Management, Inc. (Note 8). |
| (b) | The rate shown is the annualized seven-day yield at period end. |
| (c) | Unless otherwise indicated, the values of the securities of the Fund are determined based on Level 1 inputs. |
See Notes to Financial Statements.
13
Table of Contents
State Street Target Retirement 2055 Fund
Portfolio of Investments
December 31, 2014
| Shares | Value | |||||||
MUTUAL FUNDS AND EXCHANGE TRADED PRODUCTS(a) – 96.2% |
| |||||||
Domestic Equity – 53.4% |
| |||||||
SPDR Russell Small Cap Completeness ETF | 995 | $ | 83,958 | |||||
State Street Equity 500 Index II Portfolio | 17,491 | 184,559 | ||||||
|
| |||||||
| 268,517 | ||||||||
|
| |||||||
Domestic Fixed Income – 9.6% |
| |||||||
SPDR Barclays Long Term Treasury ETF | 666 | 48,529 | ||||||
|
| |||||||
| 48,529 | ||||||||
|
| |||||||
International Equity – 33.2% |
| |||||||
State Street Global Equity ex-U.S. Index Portfolio | 18,240 | 167,174 | ||||||
|
| |||||||
| 167,174 | ||||||||
|
| |||||||
TOTAL MUTUAL FUNDS AND EXCHANGE TRADED PRODUCTS |
| 484,220 | ||||||
|
| |||||||
SHORT TERM INVESTMENT – 1.1% |
| |||||||
Money Market Funds – 1.1% |
| |||||||
State Street Institutional Liquid Reserves Fund, Premier Class 0.07%(a)(b) | 5,420 | 5,420 | ||||||
|
| |||||||
TOTAL SHORT TERM INVESTMENT (Cost $5,420) | 5,420 | |||||||
|
| |||||||
TOTAL INVESTMENTS(c) – 97.3% |
| 489,640 | ||||||
Other Assets in Excess of |
| 13,342 | ||||||
|
| |||||||
NET ASSETS – 100.0% | $ | 502,982 | ||||||
|
| |||||||
| (a) | Affiliated funds managed by SSGA Funds Management, Inc. (Note 8). |
| (b) | The rate shown is the annualized seven-day yield at period end. |
| (c) | Unless otherwise indicated, the values of the securities of the Fund are determined based on Level 1 inputs. |
See Notes to Financial Statements.
14
Table of Contents
State Street Target Retirement 2060 Fund
Portfolio of Investments
December 31, 2014
| Shares | Value | |||||||
MUTUAL FUNDS AND EXCHANGE TRADED PRODUCTS(a) – 96.4% |
| |||||||
Domestic Equity – 53.5% |
| |||||||
SPDR Russell Small Cap Completeness ETF | 996 | $ | 84,042 | |||||
State Street Equity 500 Index II Portfolio | 17,526 | 184,927 | ||||||
|
| |||||||
| 268,969 | ||||||||
|
| |||||||
Domestic Fixed Income – 9.6% |
| |||||||
SPDR Barclays Long Term Treasury ETF | 667 | 48,602 | ||||||
|
| |||||||
| 48,602 | ||||||||
|
| |||||||
International Equity – 33.3% |
| |||||||
State Street Global Equity ex-U.S. Index Portfolio | 18,275 | 167,497 | ||||||
|
| |||||||
| 167,497 | ||||||||
|
| |||||||
TOTAL MUTUAL FUNDS AND EXCHANGE TRADED PRODUCTS |
| 485,068 | ||||||
|
| |||||||
SHORT TERM INVESTMENT – 1.1% |
| |||||||
Money Market Funds – 1.1% |
| |||||||
State Street Institutional Liquid Reserves Fund, Premier Class 0.07%(a)(b) | 5,435 | 5,435 | ||||||
|
| |||||||
TOTAL SHORT TERM INVESTMENT |
| 5,435 | ||||||
|
| |||||||
TOTAL INVESTMENTS(c) – 97.5% |
| 490,503 | ||||||
Other Assets in Excess of |
| 12,545 | ||||||
|
| |||||||
NET ASSETS – 100.0% | $ | 503,048 | ||||||
|
| |||||||
| (a) | Affiliated funds managed by SSGA Funds Management, Inc. (Note 8). |
| (b) | The rate shown is the annualized seven-day yield at period end. |
| (c) | Unless otherwise indicated, the values of the securities of the Fund are determined based on Level 1 inputs. |
See Notes to Financial Statements.
15
Table of Contents
State Street Institutional Investment Trust
Statements of Assets and Liabilities
December 31, 2014
| State Street Target Retirement Fund | State Street Target Retirement 2015 Fund | State Street Target Retirement 2020 Fund | State Street Target Retirement 2025 Fund | |||||||||||||
Assets | ||||||||||||||||
Investments in securities of affiliated funds, at value | $ | 2,369,184 | $ | 2,880,818 | $ | 8,055,702 | $ | 6,928,546 | ||||||||
Receivable for investments sold | 37,177 | 74,017 | 176,007 | 135,248 | ||||||||||||
Dividends receivable from affiliated funds (Note 8) | 3,627 | 5,521 | 3,646 | 3,980 | ||||||||||||
Receivable from Adviser (Note 4) | 77,868 | 75,786 | 75,319 | 70,463 | ||||||||||||
Cash | – | – | 273,847 | 460,579 | ||||||||||||
|
|
|
|
|
|
|
| |||||||||
Total assets | 2,487,856 | 3,036,142 | 8,584,521 | 7,598,816 | ||||||||||||
|
|
|
|
|
|
|
| |||||||||
Liabilities | ||||||||||||||||
Payable for investments purchased | 33,085 | 68,564 | 438,863 | 590,661 | ||||||||||||
Due to custodian | 1,862 | 18 | – | – | ||||||||||||
Advisory fees payable (Note 4) | 173 | 237 | 387 | 323 | ||||||||||||
Custodian fees payable (Note 4) | 19,077 | 19,141 | 19,291 | 19,227 | ||||||||||||
Distribution fees payable (Note 4) | 168 | 236 | 338 | 271 | ||||||||||||
Sub-transfer agent fee payable (Note 4) | 422 | 592 | 847 | 677 | ||||||||||||
Trustees’ fees payable | 3,750 | 3,750 | 3,750 | 3,750 | ||||||||||||
Registration and filing fees payable | 9,022 | 349 | 590 | 1,361 | ||||||||||||
Professional fees payable | 20,117 | 20,117 | 20,117 | 20,117 | ||||||||||||
Transfer agent fees payable | 3,105 | 9,282 | 9,279 | 6,984 | ||||||||||||
Accrued expenses and other liabilities | 3,289 | 3,528 | 2,395 | 3,307 | ||||||||||||
|
|
|
|
|
|
|
| |||||||||
Total liabilities | 94,070 | 125,814 | 495,857 | 646,678 | ||||||||||||
|
|
|
|
|
|
|
| |||||||||
Net Assets | $ | 2,393,786 | $ | 2,910,328 | $ | 8,088,664 | $ | 6,952,138 | ||||||||
|
|
|
|
|
|
|
| |||||||||
Net Assets Consist of: | ||||||||||||||||
Paid-in capital | $ | 2,397,482 | $ | 2,912,569 | $ | 8,086,185 | $ | 6,949,380 | ||||||||
Accumulated net realized gain | 3,371 | 8,026 | 7,879 | 9,475 | ||||||||||||
Net unrealized appreciation (depreciation) on investments | (7,067 | ) | (10,267 | ) | (5,400 | ) | (6,717 | ) | ||||||||
|
|
|
|
|
|
|
| |||||||||
Net Assets | $ | 2,393,786 | $ | 2,910,328 | $ | 8,088,664 | $ | 6,952,138 | ||||||||
|
|
|
|
|
|
|
| |||||||||
Class A | ||||||||||||||||
Net Assets | $ | 417,896 | $ | 585,336 | $ | 844,726 | $ | 677,353 | ||||||||
Shares of beneficial interest outstanding | 41,667 | 58,334 | 83,333 | 66,667 | ||||||||||||
|
|
|
|
|
|
|
| |||||||||
Net asset value and redemption price per share | $ | 10.03 | $ | 10.03 | $ | 10.14 | $ | 10.16 | ||||||||
|
|
|
|
|
|
|
| |||||||||
Maximum Sales Charge | 4.50 | % | 4.50 | % | 4.50 | % | 4.50 | % | ||||||||
Maximum offering price per share | $ | 10.50 | $ | 10.50 | $ | 10.62 | $ | 10.64 | ||||||||
|
|
|
|
|
|
|
| |||||||||
Class I | ||||||||||||||||
Net Assets | $ | 417,893 | $ | 585,335 | $ | 844,737 | $ | 677,355 | ||||||||
Shares of beneficial interest outstanding | 41,666 | 58,333 | 83,333 | 66,666 | ||||||||||||
|
|
|
|
|
|
|
| |||||||||
Offering, net asset value, and redemption price per share | $ | 10.03 | $ | 10.03 | $ | 10.14 | $ | 10.16 | ||||||||
|
|
|
|
|
|
|
| |||||||||
Class K | ||||||||||||||||
Net Assets | $ | 1,557,997 | $ | 1,739,657 | $ | 6,399,201 | $ | 5,597,430 | ||||||||
Shares of beneficial interest outstanding | 155,392 | 173,365 | 631,497 | 551,006 | ||||||||||||
|
|
|
|
|
|
|
| |||||||||
Offering, net asset value, and redemption price per share | $ | 10.03 | $ | 10.03 | $ | 10.13 | $ | 10.16 | ||||||||
|
|
|
|
|
|
|
| |||||||||
Investments in securities of affiliated funds, at cost | $ | 2,376,251 | $ | 2,891,085 | $ | 8,061,102 | $ | 6,935,263 | ||||||||
|
|
|
|
|
|
|
| |||||||||
See Notes to Financial Statements.
16
Table of Contents
State Street Institutional Investment Trust
Statements of Assets and Liabilities — (continued)
December 31, 2014
| State Street Target Retirement 2030 Fund | State Street Target Retirement 2035 Fund | State Street Target Retirement 2040 Fund | State Street Target Retirement 2045 Fund | |||||||||||||
Assets | ||||||||||||||||
Investments in securities of affiliated funds, at value | $ | 4,578,500 | $ | 4,210,268 | $ | 2,512,764 | $ | 996,554 | ||||||||
Receivable for investments sold | 107,085 | 93,366 | 55,980 | 18,909 | ||||||||||||
Dividends receivable from affiliated funds (Note 8) | 1,247 | 913 | 548 | 224 | ||||||||||||
Receivable from Adviser (Note 4) | 76,000 | 76,181 | 75,699 | 75,735 | ||||||||||||
Cash | 245,356 | 255,550 | 73,936 | – | ||||||||||||
|
|
|
|
|
|
|
| |||||||||
Total assets | 5,008,188 | 4,636,278 | 2,718,927 | 1,091,422 | ||||||||||||
|
|
|
|
|
|
|
| |||||||||
Liabilities | ||||||||||||||||
Payable for investments purchased | 348,904 | 348,935 | 132,467 | 18,907 | ||||||||||||
Due to custodian | – | – | – | 4,639 | ||||||||||||
Advisory fees payable (Note 4) | 294 | 224 | 203 | 127 | ||||||||||||
Custodian fees payable (Note 4) | 19,198 | 19,128 | 19,107 | 19,031 | ||||||||||||
Distribution fees payable (Note 4) | 310 | 204 | 204 | 136 | ||||||||||||
Sub-transfer agent fee payable (Note 4) | 677 | 508 | 508 | 338 | ||||||||||||
Trustees’ fees payable | 3,750 | 3,750 | 3,750 | 3,750 | ||||||||||||
Registration and filing fees payable | 9,588 | 9,856 | 9,347 | 9,465 | ||||||||||||
Professional fees payable | 20,117 | 20,117 | 20,117 | 20,117 | ||||||||||||
Transfer agent fees payable | 5,975 | 5,787 | 5,786 | 5,600 | ||||||||||||
Accrued expenses and other liabilities | 3,297 | 3,301 | 3,295 | 3,296 | ||||||||||||
|
|
|
|
|
|
|
| |||||||||
Total liabilities | 412,110 | 411,810 | 194,784 | 85,406 | ||||||||||||
|
|
|
|
|
|
|
| |||||||||
Net Assets | $ | 4,596,078 | $ | 4,224,468 | $ | 2,524,143 | $ | 1,006,016 | ||||||||
|
|
|
|
|
|
|
| |||||||||
Net Assets Consist of: | ||||||||||||||||
Paid-in capital | $ | 4,587,858 | $ | 4,218,605 | $ | 2,516,691 | $ | 1,000,000 | ||||||||
Accumulated net realized gain | 6,555 | 3,688 | 2,033 | 1,187 | ||||||||||||
Net unrealized appreciation on investments | 1,665 | 2,175 | 5,419 | 4,829 | ||||||||||||
|
|
|
|
|
|
|
| |||||||||
Net Assets | $ | 4,596,078 | $ | 4,224,468 | $ | 2,524,143 | $ | 1,006,016 | ||||||||
|
|
|
|
|
|
|
| |||||||||
Class A | ||||||||||||||||
Net Assets | $ | 676,383 | $ | 508,362 | $ | 506,307 | $ | 335,336 | ||||||||
Shares of beneficial interest outstanding | 66,667 | 50,000 | 50,000 | 33,334 | ||||||||||||
|
|
|
|
|
|
|
| |||||||||
Net asset value and redemption price per share | $ | 10.15 | $ | 10.17 | $ | 10.13 | $ | 10.06 | ||||||||
|
|
|
|
|
|
|
| |||||||||
Maximum Sales Charge | 4.50 | % | 4.50 | % | 4.50 | % | 4.50 | % | ||||||||
Maximum offering price per share | $ | 10.63 | $ | 10.65 | $ | 10.61 | $ | 10.53 | ||||||||
|
|
|
|
|
|
|
| |||||||||
Class I | ||||||||||||||||
Net Assets | $ | 676,394 | $ | 508,367 | $ | 506,312 | $ | 335,338 | ||||||||
Shares of beneficial interest outstanding | 66,666 | 50,000 | 50,000 | 33,333 | ||||||||||||
|
|
|
|
|
|
|
| |||||||||
Offering, net asset value, and redemption price per share | $ | 10.15 | $ | 10.17 | $ | 10.13 | $ | 10.06 | ||||||||
|
|
|
|
|
|
|
| |||||||||
Class K | ||||||||||||||||
Net Assets | $ | 3,243,301 | $ | 3,207,739 | $ | 1,511,524 | $ | 335,342 | ||||||||
Shares of beneficial interest outstanding | 319,554 | 315,476 | 149,272 | 33,333 | ||||||||||||
|
|
|
|
|
|
|
| |||||||||
Offering, net asset value, and redemption price per share | $ | 10.15 | $ | 10.17 | $ | 10.13 | $ | 10.06 | ||||||||
|
|
|
|
|
|
|
| |||||||||
Investments in securities of affiliated funds, at cost | $ | 4,576,835 | $ | 4,208,093 | $ | 2,507,345 | $ | 991,725 | ||||||||
|
|
|
|
|
|
|
| |||||||||
See Notes to Financial Statements.
17
Table of Contents
State Street Institutional Investment Trust
Statements of Assets and Liabilities — (continued)
December 31, 2014
| State Street Target Retirement 2050 Fund | State Street Target Retirement 2055 Fund | State Street Target Retirement 2060 Fund | ||||||||||
Assets | ||||||||||||
Investments in securities of affiliated funds, at value | $ | 489,640 | $ | 489,640 | $ | 490,503 | ||||||
Receivable for investments sold | 9,680 | 9,680 | 9,630 | |||||||||
Dividends receivable from affiliated funds (Note 8) | 109 | 109 | 109 | |||||||||
Receivable from Adviser (Note 4) | 75,279 | 75,169 | 74,993 | |||||||||
|
|
|
|
|
| |||||||
Total assets | 574,708 | 574,598 | 575,235 | |||||||||
|
|
|
|
|
| |||||||
Liabilities | ||||||||||||
Payable for investments purchased | 9,293 | 9,293 | 9,168 | |||||||||
Due to custodian | 2,379 | 2,379 | 2,353 | |||||||||
Advisory fees payable (Note 4) | 63 | 63 | 63 | |||||||||
Custodian fees payable (Note 4) | 18,967 | 18,967 | 18,967 | |||||||||
Distribution fees payable (Note 4) | 68 | 68 | 68 | |||||||||
Sub-transfer agent fee payable (Note 4) | 169 | 169 | 169 | |||||||||
Trustees’ fees payable | 3,750 | 3,750 | 3,750 | |||||||||
Registration and filing fees payable | 9,112 | 9,002 | 8,829 | |||||||||
Professional fees payable | 20,117 | 20,117 | 20,117 | |||||||||
Transfer agent fees payable | 5,414 | 5,414 | 5,414 | |||||||||
Accrued expenses and other liabilities | 2,394 | 2,394 | 3,289 | |||||||||
|
|
|
|
|
| |||||||
Total liabilities | 71,726 | 71,616 | 72,187 | |||||||||
|
|
|
|
|
| |||||||
Net Assets | $ | 502,982 | $ | 502,982 | $ | 503,048 | ||||||
|
|
|
|
|
| |||||||
Net Assets Consist of: | ||||||||||||
Paid-in capital | $ | 500,000 | $ | 500,000 | $ | 500,000 | ||||||
Accumulated net realized gain | 849 | 850 | 880 | |||||||||
Net unrealized appreciation on investments | 2,133 | 2,132 | 2,168 | |||||||||
|
|
|
|
|
| |||||||
Net Assets | $ | 502,982 | $ | 502,982 | $ | 503,048 | ||||||
|
|
|
|
|
| |||||||
Class A | ||||||||||||
Net Assets | $ | 167,659 | $ | 167,659 | $ | 167,681 | ||||||
Shares of beneficial interest outstanding | 16,667 | 16,667 | 16,667 | |||||||||
|
|
|
|
|
| |||||||
Net asset value and redemption price per share | $ | 10.06 | $ | 10.06 | $ | 10.06 | ||||||
|
|
|
|
|
| |||||||
Maximum Sales Charge | 4.50 | % | 4.50 | % | 4.50 | % | ||||||
Maximum offering price per share | $ | 10.53 | $ | 10.53 | $ | 10.53 | ||||||
|
|
|
|
|
| |||||||
Class I | ||||||||||||
Net Assets | $ | 167,661 | $ | 167,661 | $ | 167,684 | ||||||
Shares of beneficial interest outstanding | 16,666 | 16,666 | 16,666 | |||||||||
|
|
|
|
|
| |||||||
Offering, net asset value, and redemption price per share | $ | 10.06 | $ | 10.06 | $ | 10.06 | ||||||
|
|
|
|
|
| |||||||
Class K | ||||||||||||
Net Assets | $ | 167,662 | $ | 167,662 | $ | 167,683 | ||||||
Shares of beneficial interest outstanding | 16,667 | 16,667 | 16,667 | |||||||||
|
|
|
|
|
| |||||||
Offering, net asset value, and redemption price per share | $ | 10.06 | $ | 10.06 | $ | 10.06 | ||||||
|
|
|
|
|
| |||||||
Investments in securities of affiliated funds, at cost | $ | 487,507 | $ | 487,508 | $ | 488,335 | ||||||
|
|
|
|
|
| |||||||
See Notes to Financial Statements.
18
Table of Contents
State Street Institutional Investment Trust
Period Ended December 31, 2014
| State Street Target Retirement Fund* | State Street Target Retirement 2015 Fund* | State Street Target Retirement 2020 Fund* | State Street Target Retirement 2025 Fund* | |||||||||||||
Income | ||||||||||||||||
Dividend income from affiliated funds (Note 8) | $ | 8,851 | $ | 12,714 | $ | 18,708 | $ | 17,421 | ||||||||
|
|
|
|
|
|
|
| |||||||||
Expenses | ||||||||||||||||
Advisory fees (Note 4) | 173 | 237 | 387 | 323 | ||||||||||||
Custodian fees (Note 4) | 19,077 | 19,141 | 19,291 | 19,227 | ||||||||||||
Distribution fees (Note 4): | ||||||||||||||||
Class A | 264 | 370 | 529 | 423 | ||||||||||||
Sub-transfer agent fees (Note 4): | ||||||||||||||||
Class A | 211 | 296 | 423 | 339 | ||||||||||||
Class I | 211 | 296 | 423 | 339 | ||||||||||||
Trustees’ fees and expenses (Note 5) | 3,750 | 3,750 | 3,750 | 3,750 | ||||||||||||
Registration and filing fees | 9,560 | 887 | 1,128 | 1,900 | ||||||||||||
Professional fees | 20,117 | 20,117 | 20,117 | 20,117 | ||||||||||||
Transfer agent fees (Note 4) | 20,537 | 26,714 | 26,714 | 20,987 | ||||||||||||
Printing fees | 3,086 | 3,086 | 3,086 | 3,086 | ||||||||||||
Insurance fees | 1,400 | 1,402 | 1,405 | 1,415 | ||||||||||||
Miscellaneous expenses | 756 | 1,256 | 757 | 757 | ||||||||||||
|
|
|
|
|
|
|
| |||||||||
Total expenses | 79,142 | 77,552 | 78,010 | 72,663 | ||||||||||||
Less: Expenses waived/reimbursed by the Adviser (Note 4) | (77,868 | ) | (75,786 | ) | (75,319 | ) | (70,462 | ) | ||||||||
|
|
|
|
|
|
|
| |||||||||
Net expenses | 1,274 | 1,766 | 2,691 | 2,201 | ||||||||||||
|
|
|
|
|
|
|
| |||||||||
Net Investment Income | 7,577 | 10,948 | 16,017 | 15,220 | ||||||||||||
|
|
|
|
|
|
|
| |||||||||
Realized and Unrealized Gain (Loss) | ||||||||||||||||
Net realized gain on: | ||||||||||||||||
Affiliated funds (Note 8) | 1,976 | 6,830 | 6,129 | 7,842 | ||||||||||||
Capital gain distributions from affiliated funds (Note 8) | 3,902 | 7,462 | 14,371 | 16,012 | ||||||||||||
Change in net unrealized appreciation/depreciation on investments | (7,067 | ) | (10,267 | ) | (5,400 | ) | (6,717 | ) | ||||||||
|
|
|
|
|
|
|
| |||||||||
Total realized and unrealized gain (loss) | (1,189 | ) | 4,025 | 15,100 | 17,137 | |||||||||||
|
|
|
|
|
|
|
| |||||||||
Net Increase in Net Assets Resulting from Operations | $ | 6,388 | $ | 14,973 | $ | 31,117 | $ | 32,357 | ||||||||
|
|
|
|
|
|
|
| |||||||||
| * | For the period September 30, 2014 (commencement of operations) to December 31, 2014. |
See Notes to Financial Statements.
19
Table of Contents
State Street Institutional Investment Trust
Statements of Operations — (continued)
Period Ended December 31, 2014
| State Street Target Retirement 2030 Fund* | State Street Target Retirement 2035 Fund* | State Street Target Retirement 2040 Fund* | State Street Target Retirement 2045 Fund* | |||||||||||||
Income | ||||||||||||||||
Dividend income from affiliated funds (Note 8) | $ | 16,028 | $ | 10,807 | $ | 10,504 | $ | 6,836 | ||||||||
|
|
|
|
|
|
|
| |||||||||
Expenses | ||||||||||||||||
Advisory fees (Note 4) | 294 | 224 | 203 | 127 | ||||||||||||
Custodian fees (Note 4) | 19,198 | 19,128 | 19,107 | 19,031 | ||||||||||||
Distribution fees (Note 4): | ||||||||||||||||
Class A | 423 | 317 | 317 | 211 | ||||||||||||
Sub-transfer agent fees (Note 4): | ||||||||||||||||
Class A | 339 | 254 | 254 | 169 | ||||||||||||
Class I | 339 | 254 | 254 | 169 | ||||||||||||
Trustees’ fees and expenses (Note 5) | 3,750 | 3,750 | 3,750 | 3,750 | ||||||||||||
Registration and filing fees | 10,125 | 10,394 | 9,885 | 10,004 | ||||||||||||
Professional fees | 20,117 | 20,117 | 20,117 | 20,117 | ||||||||||||
Transfer agent fees (Note 4) | 18,265 | 18,077 | 18,076 | 17,889 | ||||||||||||
Printing fees | 3,086 | 3,086 | 3,086 | 3,086 | ||||||||||||
Insurance fees | 1,408 | 1,411 | 1,405 | 1,407 | ||||||||||||
Miscellaneous expenses | 756 | 756 | 756 | 756 | ||||||||||||
|
|
|
|
|
|
|
| |||||||||
Total expenses | 78,100 | 77,768 | 77,210 | 76,716 | ||||||||||||
Less: Expenses waived/reimbursed by the Adviser (Note 4) | (76,000 | ) | (76,181 | ) | (75,699 | ) | (75,735 | ) | ||||||||
|
|
|
|
|
|
|
| |||||||||
Net expenses | 2,100 | 1,587 | 1,511 | 981 | ||||||||||||
|
|
|
|
|
|
|
| |||||||||
Net Investment Income | 13,928 | 9,220 | 8,993 | 5,855 | ||||||||||||
|
|
|
|
|
|
|
| |||||||||
Realized and Unrealized Gain (Loss) | ||||||||||||||||
Net realized gain on: | ||||||||||||||||
Affiliated funds (Note 8) | 6,039 | 3,231 | 1,872 | 1,180 | ||||||||||||
Capital gain distributions from affiliated funds (Note 8) | 18,778 | 13,526 | 15,006 | 10,299 | ||||||||||||
Change in net unrealized appreciation/depreciation on investments | 1,665 | 2,175 | 5,419 | 4,829 | ||||||||||||
|
|
|
|
|
|
|
| |||||||||
Total realized and unrealized gain (loss) | 26,482 | 18,932 | 22,297 | 16,308 | ||||||||||||
|
|
|
|
|
|
|
| |||||||||
Net Increase in Net Assets Resulting from Operations | $ | 40,410 | $ | 28,152 | $ | 31,290 | $ | 22,163 | ||||||||
|
|
|
|
|
|
|
| |||||||||
| * | For the period September 30, 2014 (commencement of operations) to December 31, 2014. |
See Notes to Financial Statements.
20
Table of Contents
State Street Institutional Investment Trust
Statements of Operations — (continued)
Period Ended December 31, 2014
| State Street Target Retirement 2050 Fund* | State Street Target Retirement 2055 Fund* | State Street Target Retirement 2060 Fund* | ||||||||||
Income | ||||||||||||
Dividend income from affiliated funds (Note 8) | $ | 3,362 | $ | 3,362 | $ | 3,370 | ||||||
|
|
|
|
|
| |||||||
Expenses | ||||||||||||
Advisory fees (Note 4) | 63 | 63 | 63 | |||||||||
Custodian fees (Note 4) | 18,967 | 18,967 | 18,967 | |||||||||
Distribution fees (Note 4): | ||||||||||||
Class A | 106 | 106 | 106 | |||||||||
Sub-transfer agent fees (Note 4): | ||||||||||||
Class A | 85 | 85 | 85 | |||||||||
Class I | 85 | 85 | 85 | |||||||||
Trustees’ fees and expenses (Note 5) | 3,750 | 3,750 | 3,750 | |||||||||
Registration and filing fees | 9,650 | 9,540 | 9,368 | |||||||||
Professional fees | 20,117 | 20,117 | 20,117 | |||||||||
Transfer agent fees (Note 4) | 17,703 | 17,703 | 17,703 | |||||||||
Printing fees | 3,086 | 3,086 | 3,086 | |||||||||
Insurance fees | 1,401 | 1,400 | 1,397 | |||||||||
Miscellaneous expenses | 756 | 756 | 756 | |||||||||
|
|
|
|
|
| |||||||
Total expenses | 75,769 | 75,658 | 75,483 | |||||||||
Less: Expenses waived/reimbursed by the Adviser (Note 4) | (75,278 | ) | (75,169 | ) | (74,993 | ) | ||||||
|
|
|
|
|
| |||||||
Net expenses | 491 | 489 | 490 | |||||||||
|
|
|
|
|
| |||||||
Net Investment Income | 2,871 | 2,873 | 2,880 | |||||||||
|
|
|
|
|
| |||||||
Realized and Unrealized Gain (Loss) | ||||||||||||
Net realized gain on: | ||||||||||||
Affiliated funds (Note 8) | 999 | 999 | 961 | |||||||||
Capital gain distributions from affiliated funds (Note 8) | 5,023 | 5,023 | 5,029 | |||||||||
Change in net unrealized appreciation/depreciation on investments | 2,133 | 2,132 | 2,168 | |||||||||
|
|
|
|
|
| |||||||
Total realized and unrealized gain (loss) | 8,155 | 8,154 | 8,158 | |||||||||
|
|
|
|
|
| |||||||
Net Increase in Net Assets Resulting from Operations | $ | 11,026 | $ | 11,027 | $ | 11,038 | ||||||
|
|
|
|
|
| |||||||
| * | For the period September 30, 2014 (commencement of operations) to December 31, 2014. |
See Notes to Financial Statements.
21
Table of Contents
State Street Institutional Investment Trust
Statements of Changes in Net Assets
| State Street Target Retirement Fund | State Street Target Retirement 2015 Fund | State Street Target Retirement 2020 Fund | State Street Target Retirement 2025 Fund | |||||||||||||
| For the Period 9/30/14* - 12/31/14 | For the Period 9/30/14* - 12/31/14 | For the Period 9/30/14* - 12/31/14 | For the Period 9/30/14* - 12/31/14 | |||||||||||||
Increase (Decrease) in Net Assets Resulting from: | ||||||||||||||||
Operations: | ||||||||||||||||
Net investment income | $ | 7,577 | $ | 10,948 | $ | 16,017 | $ | 15,220 | ||||||||
Net realized gain on investments | 5,878 | 14,292 | 20,500 | 23,854 | ||||||||||||
Change in net unrealized appreciation/ depreciation on investments | (7,067 | ) | (10,267 | ) | (5,400 | ) | (6,717 | ) | ||||||||
|
|
|
|
|
|
|
| |||||||||
Net increase in net assets from operations | 6,388 | 14,973 | 31,117 | 32,357 | ||||||||||||
|
|
|
|
|
|
|
| |||||||||
Distributions to Shareholders from: | ||||||||||||||||
Net investment income | ||||||||||||||||
Class A | (1,400 | ) | (2,993 | ) | (2,183 | ) | (2,207 | ) | ||||||||
Class I | (1,667 | ) | (3,366 | ) | (2,708 | ) | (2,633 | ) | ||||||||
Class K | (6,970 | ) | (10,826 | ) | (23,668 | ) | (24,759 | ) | ||||||||
|
|
|
|
|
|
|
| |||||||||
Total distributions from net investment income | (10,037 | ) | (17,185 | ) | (28,559 | ) | (29,599 | ) | ||||||||
|
|
|
|
|
|
|
| |||||||||
Net realized gain on investments | ||||||||||||||||
Class A | (8 | ) | (6 | ) | (8 | ) | – | |||||||||
Class I | (8 | ) | (6 | ) | (8 | ) | – | |||||||||
Class K | (31 | ) | (17 | ) | (63 | ) | – | |||||||||
|
|
|
|
|
|
|
| |||||||||
Total distributions from net realized gain | (47 | ) | (29 | ) | (79 | ) | – | |||||||||
|
|
|
|
|
|
|
| |||||||||
Total distributions | (10,084 | ) | (17,214 | ) | (28,638 | ) | (29,599 | ) | ||||||||
|
|
|
|
|
|
|
| |||||||||
Net Increase (Decrease) from Capital Share Transactions: | ||||||||||||||||
Class A | ||||||||||||||||
Shares sold | 416,668 | 583,334 | 833,334 | 666,668 | ||||||||||||
|
|
|
|
|
|
|
| |||||||||
Class I | ||||||||||||||||
Shares sold | 416,666 | 583,333 | 833,333 | 666,666 | ||||||||||||
|
|
|
|
|
|
|
| |||||||||
Class K | ||||||||||||||||
Shares sold | 1,625,168 | 2,428,746 | 6,398,928 | 5,872,425 | ||||||||||||
Reinvestment of distributions | 5,118 | 7,179 | 20,590 | 21,786 | ||||||||||||
Shares redeemed | (66,138 | ) | (690,023 | ) | – | (278,165 | ) | |||||||||
|
|
|
|
|
|
|
| |||||||||
| 1,564,148 | 1,745,902 | 6,419,518 | 5,616,046 | |||||||||||||
|
|
|
|
|
|
|
| |||||||||
Net increase from capital share transactions | 2,397,482 | 2,912,569 | 8,086,185 | 6,949,380 | ||||||||||||
|
|
|
|
|
|
|
| |||||||||
Net Increase in Net Assets | 2,393,786 | 2,910,328 | 8,088,664 | 6,952,138 | ||||||||||||
Net Assets | ||||||||||||||||
End of period | $ | 2,393,786 | $ | 2,910,328 | $ | 8,088,664 | $ | 6,952,138 | ||||||||
|
|
|
|
|
|
|
| |||||||||
Changes in Shares: | ||||||||||||||||
Class A | ||||||||||||||||
Shares sold | 41,667 | 58,334 | 83,333 | 66,667 | ||||||||||||
|
|
|
|
|
|
|
| |||||||||
Class I | ||||||||||||||||
Shares sold | 41,666 | 58,333 | 83,333 | 66,666 | ||||||||||||
|
|
|
|
|
|
|
| |||||||||
Class K | ||||||||||||||||
Shares sold | 161,439 | 240,505 | 629,480 | 576,019 | ||||||||||||
Reinvestment of distributions | 507 | 709 | 2,017 | 2,125 | ||||||||||||
Shares redeemed | (6,554 | ) | (67,849 | ) | – | (27,138 | ) | |||||||||
|
|
|
|
|
|
|
| |||||||||
Net increase in shares | 155,392 | 173,365 | 631,497 | 551,006 | ||||||||||||
|
|
|
|
|
|
|
| |||||||||
| * | Commencement of operations |
See Notes to Financial Statements.
22
Table of Contents
State Street Institutional Investment Trust
Statements of Changes in Net Assets — (continued)
| State Street Target Retirement 2030 Fund | State Street Target Retirement 2035 Fund | State Street Target Retirement 2040 Fund | State Street Target Retirement 2045 Fund | |||||||||||||
| For the Period 9/30/14* - 12/31/14 | For the Period 9/30/14* - 12/31/14 | For the Period 9/30/14* - 12/31/14 | For the Period 9/30/14* - 12/31/14 | |||||||||||||
Increase (Decrease) in Net Assets Resulting from: | ||||||||||||||||
Operations: | ||||||||||||||||
Net investment income | $ | 13,928 | $ | 9,220 | $ | 8,993 | $ | 5,855 | ||||||||
Net realized gain on investments | 24,817 | 16,757 | 16,878 | 11,479 | ||||||||||||
Change in net unrealized appreciation/ depreciation on investments | 1,665 | 2,175 | 5,419 | 4,829 | ||||||||||||
|
|
|
|
|
|
|
| |||||||||
Net increase in net assets from operations | 40,410 | 28,152 | 31,290 | 22,163 | ||||||||||||
|
|
|
|
|
|
|
| |||||||||
Distributions to Shareholders from: | ||||||||||||||||
Net investment income | ||||||||||||||||
Class A | (4,160 | ) | (2,195 | ) | (4,395 | ) | (5,183 | ) | ||||||||
Class I | (4,580 | ) | (2,515 | ) | (4,715 | ) | (5,397 | ) | ||||||||
Class K | (23,450 | ) | (17,579 | ) | (14,728 | ) | (5,567 | ) | ||||||||
|
|
|
|
|
|
|
| |||||||||
Total distributions | (32,190 | ) | (22,289 | ) | (23,838 | ) | (16,147 | ) | ||||||||
|
|
|
|
|
|
|
| |||||||||
Net Increase (Decrease) from Capital Share Transactions: | ||||||||||||||||
Class A | ||||||||||||||||
Shares sold | 666,668 | 500,000 | 500,000 | 333,334 | ||||||||||||
|
|
|
|
|
|
|
| |||||||||
Class I | ||||||||||||||||
Shares sold | 666,666 | 500,000 | 500,000 | 333,333 | ||||||||||||
|
|
|
|
|
|
|
| |||||||||
Class K | ||||||||||||||||
Shares sold | 3,587,243 | 3,243,252 | 1,506,928 | 333,333 | ||||||||||||
Reinvestment of distributions | 18,530 | 14,813 | 9,763 | – | ||||||||||||
Shares redeemed | (351,249 | ) | (39,460 | ) | – | – | ||||||||||
|
|
|
|
|
|
|
| |||||||||
| 3,254,524 | 3,218,605 | 1,516,691 | 333,333 | |||||||||||||
|
|
|
|
|
|
|
| |||||||||
Net increase from capital share transactions | 4,587,858 | 4,218,605 | 2,516,691 | 1,000,000 | ||||||||||||
|
|
|
|
|
|
|
| |||||||||
Net Increase in Net Assets | 4,596,078 | 4,224,468 | 2,524,143 | 1,006,016 | ||||||||||||
Net Assets | ||||||||||||||||
End of period | $ | 4,596,078 | $ | 4,224,468 | $ | 2,524,143 | $ | 1,006,016 | ||||||||
|
|
|
|
|
|
|
| |||||||||
Changes in Shares: | ||||||||||||||||
Class A | ||||||||||||||||
Shares sold | 66,667 | 50,000 | 50,000 | 33,334 | ||||||||||||
|
|
|
|
|
|
|
| |||||||||
Class I | ||||||||||||||||
Shares sold | 66,666 | 50,000 | 50,000 | 33,333 | ||||||||||||
|
|
|
|
|
|
|
| |||||||||
Class K | ||||||||||||||||
Shares sold | 351,981 | 317,876 | 148,319 | 33,333 | ||||||||||||
Reinvestment of distributions | 1,808 | 1,442 | 953 | – | ||||||||||||
Shares redeemed | (34,235 | ) | (3,842 | ) | – | – | ||||||||||
|
|
|
|
|
|
|
| |||||||||
Net increase in shares | 319,554 | 315,476 | 149,272 | 33,333 | ||||||||||||
|
|
|
|
|
|
|
| |||||||||
| * | Commencement of operations |
See Notes to Financial Statements.
23
Table of Contents
State Street Institutional Investment Trust
Statements of Changes in Net Assets — (continued)
| State Street Target Retirement 2050 Fund | State Street Target Retirement 2055 Fund | State Street Target Retirement 2060 Fund | ||||||||||
| For the Period 9/30/14* - 12/31/14 | For the Period 9/30/14* - 12/31/14 | For the Period 9/30/14* - 12/31/14 | ||||||||||
Increase (Decrease) in Net Assets Resulting from: | ||||||||||||
Operations: | ||||||||||||
Net investment income | $ | 2,871 | $ | 2,873 | $ | 2,880 | ||||||
Net realized gain on investments | 6,022 | 6,022 | 5,990 | |||||||||
Change in net unrealized appreciation/ depreciation on investments | 2,133 | 2,132 | 2,168 | |||||||||
|
|
|
|
|
| |||||||
Net increase in net assets from operations | 11,026 | 11,027 | 11,038 | |||||||||
|
|
|
|
|
| |||||||
Distributions to Shareholders from: | ||||||||||||
Net investment income | ||||||||||||
Class A | (2,548 | ) | (2,549 | ) | (2,538 | ) | ||||||
Class I | (2,653 | ) | (2,653 | ) | (2,643 | ) | ||||||
Class K | (2,738 | ) | (2,738 | ) | (2,728 | ) | ||||||
|
|
|
|
|
| |||||||
Total distributions from net investment income | (7,939 | ) | (7,940 | ) | (7,909 | ) | ||||||
|
|
|
|
|
| |||||||
Net realized gain on investments | ||||||||||||
Class A | (35 | ) | (35 | ) | (27 | ) | ||||||
Class I | (35 | ) | (35 | ) | (27 | ) | ||||||
Class K | (35 | ) | (35 | ) | (27 | ) | ||||||
|
|
|
|
|
| |||||||
Total distributions from net realized gain | (105 | ) | (105 | ) | (81 | ) | ||||||
|
|
|
|
|
| |||||||
Total distributions | (8,044 | ) | (8,045 | ) | (7,990 | ) | ||||||
|
|
|
|
|
| |||||||
Net Increase from Capital Share Transactions: | ||||||||||||
Class A | ||||||||||||
Shares sold | 166,668 | 166,668 | 166,668 | |||||||||
|
|
|
|
|
| |||||||
Class I | ||||||||||||
Shares sold | 166,666 | 166,666 | 166,666 | |||||||||
|
|
|
|
|
| |||||||
Class K | ||||||||||||
Shares sold | 166,666 | 166,666 | 166,666 | |||||||||
|
|
|
|
|
| |||||||
Net increase from capital share transactions | 500,000 | 500,000 | 500,000 | |||||||||
|
|
|
|
|
| |||||||
Net Increase in Net Assets | 502,982 | 502,982 | 503,048 | |||||||||
Net Assets | ||||||||||||
End of period | $ | 502,982 | $ | 502,982 | $ | 503,048 | ||||||
|
|
|
|
|
| |||||||
Changes in Shares: | ||||||||||||
Class A | ||||||||||||
Shares sold | 16,667 | 16,667 | 16,667 | |||||||||
|
|
|
|
|
| |||||||
Class I | ||||||||||||
Shares sold | 16,666 | 16,666 | 16,666 | |||||||||
|
|
|
|
|
| |||||||
Class K | ||||||||||||
Shares sold | 16,667 | 16,667 | 16,667 | |||||||||
|
|
|
|
|
| |||||||
| * | Commencement of operations |
See Notes to Financial Statements.
24
Table of Contents
State Street Institutional Investment Trust
Selected data for a Class A Share of beneficial interest outstanding throughout the period is presented below:
| State Street Target Retirement Fund | State Street Target Retirement 2015 Fund | State Street Target Retirement 2020 Fund | State Street Target Retirement 2025 Fund | |||||||||||||
| For the Period 9/30/14* - 12/31/14 | For the Period 9/30/14* - 12/31/14 | For the Period 9/30/14* - 12/31/14 | For the Period 9/30/14* - 12/31/14 | |||||||||||||
Per Share Operating Performance: | ||||||||||||||||
Net Asset Value, Beginning of Period | $ | 10.00 | $ | 10.00 | $ | 10.00 | $ | 10.00 | ||||||||
|
|
|
|
|
|
|
| |||||||||
Investment Operations: | ||||||||||||||||
Net investment income(a) | 0.05 | 0.05 | 0.05 | 0.06 | ||||||||||||
Net realized and unrealized gain on investments | 0.01 | 0.03 | 0.12 | 0.13 | ||||||||||||
|
|
|
|
|
|
|
| |||||||||
Total from investment operations | 0.06 | 0.08 | 0.17 | 0.19 | ||||||||||||
|
|
|
|
|
|
|
| |||||||||
Less Distributions From: | ||||||||||||||||
Net investment income | (0.03 | ) | (0.05 | ) | (0.03 | ) | (0.03 | ) | ||||||||
Net realized gains | (0.00 | )(b) | (0.00 | )(b) | (0.00 | )(b) | – | |||||||||
|
|
|
|
|
|
|
| |||||||||
Total distributions | (0.03 | ) | (0.05 | ) | (0.03 | ) | (0.03 | ) | ||||||||
|
|
|
|
|
|
|
| |||||||||
Net increase in net assets | 0.03 | 0.03 | 0.14 | 0.16 | ||||||||||||
|
|
|
|
|
|
|
| |||||||||
Net Asset Value, End of Period | $ | 10.03 | $ | 10.03 | $ | 10.14 | $ | 10.16 | ||||||||
|
|
|
|
|
|
|
| |||||||||
Total Return(c) | 0.64 | % | 0.81 | % | 1.66 | % | 1.93 | % | ||||||||
Ratios and Supplemental Data: | ||||||||||||||||
Net Assets, End of Period (000s) | $ | 418 | $ | 585 | $ | 845 | $ | 677 | ||||||||
Ratios to average net assets: | ||||||||||||||||
Gross expenses(d) | 21.65 | % | 15.05 | % | 9.36 | % | 10.90 | % | ||||||||
Net expenses(d) | 0.62 | % | 0.62 | % | 0.62 | % | 0.62 | % | ||||||||
Net investment income(d) | 1.82 | % | 2.06 | % | 2.32 | % | 2.38 | % | ||||||||
Portfolio turnover rate(e) | 8 | % | 39 | % | 5 | % | 13 | % | ||||||||
| * | Commencement of operations |
| (a) | Net investment income per share is calculated using the average shares method. |
| (b) | Amount is less than $0.005 per share. |
| (c) | Total return is calculated assuming a purchase of shares at net asset value on the first day and a sale at net asset value on the last day of each period reported. Distributions are assumed, for the purpose of this calculation, to be reinvested at net asset value per share on the respective payment dates of each Fund. Total return for periods of less than one year is not annualized. Results represent past performance and are not indicative of future results. |
| (d) | Annualized |
| (e) | Not annualized |
See Notes to Financial Statements.
25
Table of Contents
State Street Institutional Investment Trust
Financial Highlights — (continued)
| State Street Target Retirement 2030 Fund | State Street Target Retirement 2035 Fund | State Street Target Retirement 2040 Fund | State Street Target Retirement 2045 Fund | |||||||||||||
| For the Period 9/30/14* - 12/31/14 | For the Period 9/30/14* - 12/31/14 | For the Period 9/30/14* - 12/31/14 | For the Period 9/30/14* - 12/31/14 | |||||||||||||
Per Share Operating Performance: | ||||||||||||||||
Net Asset Value, Beginning of Period | $ | 10.00 | $ | 10.00 | $ | 10.00 | $ | 10.00 | ||||||||
|
|
|
|
|
|
|
| |||||||||
Investment Operations: | ||||||||||||||||
Net investment income(a) | 0.05 | 0.06 | 0.06 | 0.05 | ||||||||||||
Net realized and unrealized gain on investments | 0.16 | 0.15 | 0.16 | 0.17 | ||||||||||||
|
|
|
|
|
|
|
| |||||||||
Total from investment operations | 0.21 | 0.21 | 0.22 | 0.22 | ||||||||||||
|
|
|
|
|
|
|
| |||||||||
Less Distributions From: | ||||||||||||||||
Net investment income | (0.06 | ) | (0.04 | ) | (0.09 | ) | (0.16 | ) | ||||||||
|
|
|
|
|
|
|
| |||||||||
Net increase in net assets | 0.15 | 0.17 | 0.13 | 0.06 | ||||||||||||
|
|
|
|
|
|
|
| |||||||||
Net Asset Value, End of Period | $ | 10.15 | $ | 10.17 | $ | 10.13 | $ | 10.06 | ||||||||
|
|
|
|
|
|
|
| |||||||||
Total Return(b) | 2.12 | % | 2.13 | % | 2.17 | % | 2.14 | % | ||||||||
Ratios and Supplemental Data: | ||||||||||||||||
Net Assets, End of Period (000s) | $ | 676 | $ | 508 | $ | 506 | $ | 335 | ||||||||
Ratios to average net assets: | ||||||||||||||||
Gross expenses(c) | 12.85 | % | 17.04 | % | 18.29 | % | 30.47 | % | ||||||||
Net expenses(c) | 0.62 | % | 0.62 | % | 0.62 | % | 0.62 | % | ||||||||
Net investment income(c) | 2.05 | % | 2.53 | % | 2.28 | % | 2.07 | % | ||||||||
Portfolio turnover rate(d) | 18 | % | 7 | % | 5 | % | 5 | % | ||||||||
| * | Commencement of operations |
| (a) | Net investment income per share is calculated using the average shares method. |
| (b) | Total return is calculated assuming a purchase of shares at net asset value on the first day and a sale at net asset value on the last day of each period reported. Distributions are assumed, for the purpose of this calculation, to be reinvested at net asset value per share on the respective payment dates of each Fund. Total return for periods of less than one year is not annualized. Results represent past performance and are not indicative of future results. |
| (c) | Annualized |
| (d) | Not annualized |
See Notes to Financial Statements.
26
Table of Contents
State Street Institutional Investment Trust
Financial Highlights — (continued)
Selected data for a Class A Share of beneficial interest outstanding throughout the period is presented below:
| State Street Target Retirement 2050 Fund | State Street Target Retirement 2055 Fund | State Street Target Retirement 2060 Fund | ||||||||||
| For the Period 9/30/14* - 12/31/14 | For the Period 9/30/14* - 12/31/14 | For the Period 9/30/14* - 12/31/14 | ||||||||||
Per Share Operating Performance: | ||||||||||||
Net Asset Value, Beginning of Period | $ | 10.00 | $ | 10.00 | $ | 10.00 | ||||||
|
|
|
|
|
| |||||||
Investment Operations: | ||||||||||||
Net investment income(a) | 0.05 | 0.05 | 0.05 | |||||||||
Net realized and unrealized gain on investments | 0.16 | 0.16 | 0.16 | |||||||||
|
|
|
|
|
| |||||||
Total from investment operations | 0.21 | 0.21 | 0.21 | |||||||||
|
|
|
|
|
| |||||||
Less Distributions From: | ||||||||||||
Net investment income | (0.15 | ) | (0.15 | ) | (0.15 | ) | ||||||
Net realized gains | (0.00 | )(b) | (0.00 | )(b) | (0.00 | )(b) | ||||||
|
|
|
|
|
| |||||||
Total distributions | (0.15 | ) | (0.15 | ) | (0.15 | ) | ||||||
|
|
|
|
|
| |||||||
Net increase in net assets | 0.06 | 0.06 | 0.06 | |||||||||
|
|
|
|
|
| |||||||
Net Asset Value, End of Period | $ | 10.06 | $ | 10.06 | $ | 10.06 | ||||||
|
|
|
|
|
| |||||||
Total Return(c) | 2.13 | % | 2.13 | % | 2.12 | % | ||||||
Ratios and Supplemental Data: | ||||||||||||
Net Assets, End of Period (000s) | $ | 168 | $ | 168 | $ | 168 | ||||||
Ratios to average net assets: | ||||||||||||
Gross expenses(d) | 59.96 | % | 59.87 | % | 59.73 | % | ||||||
Net expenses(d) | 0.62 | % | 0.62 | % | 0.62 | % | ||||||
Net investment income(d) | 2.03 | % | 2.03 | % | 2.04 | % | ||||||
Portfolio turnover rate(e) | 7 | % | 7 | % | 7 | % | ||||||
| * | Commencement of operations |
| (a) | Net investment income per share is calculated using the average shares method. |
| (b) | Amount is less than $0.005 per share. |
| (c) | Total return is calculated assuming a purchase of shares at net asset value on the first day and a sale at net asset value on the last day of each period reported. Distributions are assumed, for the purpose of this calculation, to be reinvested at net asset value per share on the respective payment dates of each Fund. Total return for periods of less than one year is not annualized. Results represent past performance and are not indicative of future results. |
| (d) | Annualized |
| (e) | Not annualized |
See Notes to Financial Statements.
27
Table of Contents
State Street Institutional Investment Trust
Financial Highlights — (continued)
Selected data for a Class I Share of beneficial interest outstanding throughout the period is presented below:
| State Street Target Retirement Fund | State Street Target Retirement 2015 Fund | State Street Target Retirement 2020 Fund | State Street Target Retirement 2025 Fund | |||||||||||||
| For the Period 9/30/14* - 12/31/14 | For the Period 9/30/14* - 12/31/14 | For the Period 9/30/14* - 12/31/14 | For the Period 9/30/14* - 12/31/14 | |||||||||||||
Per Share Operating Performance: | ||||||||||||||||
Net Asset Value, Beginning of Period | $ | 10.00 | $ | 10.00 | $ | 10.00 | $ | 10.00 | ||||||||
|
|
|
|
|
|
|
| |||||||||
Investment Operations: | ||||||||||||||||
Net investment income(a) | 0.05 | 0.06 | 0.06 | 0.06 | ||||||||||||
Net realized and unrealized gain (loss) on investments | 0.02 | 0.03 | 0.11 | 0.14 | ||||||||||||
|
|
|
|
|
|
|
| |||||||||
Total from investment operations | 0.07 | 0.09 | 0.17 | 0.20 | ||||||||||||
|
|
|
|
|
|
|
| |||||||||
Less Distributions From: | ||||||||||||||||
Net investment income | (0.04 | ) | (0.06 | ) | (0.03 | ) | (0.04 | ) | ||||||||
Net realized gains | (0.00 | )(b) | (0.00 | )(b) | (0.00 | )(b) | – | |||||||||
|
|
|
|
|
|
|
| |||||||||
Total distributions | (0.04 | ) | (0.06 | ) | (0.03 | ) | (0.04 | ) | ||||||||
|
|
|
|
|
|
|
| |||||||||
Net increase in net assets | 0.03 | 0.03 | 0.14 | 0.16 | ||||||||||||
|
|
|
|
|
|
|
| |||||||||
Net Asset Value, End of Period | $ | 10.03 | $ | 10.03 | $ | 10.14 | $ | 10.16 | ||||||||
|
|
|
|
|
|
|
| |||||||||
Total Return(c) | 0.70 | % | 0.87 | % | 1.72 | % | 1.99 | % | ||||||||
Ratios and Supplemental Data: | ||||||||||||||||
Net Assets, End of Period (000s) | $ | 418 | $ | 585 | $ | 845 | $ | 677 | ||||||||
Ratios to average net assets: | ||||||||||||||||
Gross expenses(d) | 21.40 | % | 14.80 | % | 9.11 | % | 10.65 | % | ||||||||
Net expenses(d) | 0.37 | % | 0.37 | % | 0.37 | % | 0.37 | % | ||||||||
Net investment income(d) | 2.07 | % | 2.31 | % | 2.57 | % | 2.63 | % | ||||||||
Portfolio turnover rate(e) | 8 | % | 39 | % | 5 | % | 13 | % | ||||||||
| * | Commencement of operations |
| (a) | Net investment income per share is calculated using the average shares method. |
| (b) | Amount is less than $0.005 per share. |
| (c) | Total return is calculated assuming a purchase of shares at net asset value on the first day and a sale at net asset value on the last day of each period reported. Distributions are assumed, for the purpose of this calculation, to be reinvested at net asset value per share on the respective payment dates of each Fund. Total return for periods of less than one year is not annualized. Results represent past performance and are not indicative of future results. |
| (d) | Annualized |
| (e) | Not annualized |
See Notes to Financial Statements.
28
Table of Contents
State Street Institutional Investment Trust
Financial Highlights — (continued)
| State Street Target Retirement 2030 Fund | State Street Target Retirement 2035 Fund | State Street Target Retirement 2040 Fund | State Street Target Retirement 2045 Fund | |||||||||||||
| For the Period 9/30/14* - 12/31/14 | For the Period 9/30/14* - 12/31/14 | For the Period 9/30/14* - 12/31/14 | For the Period 9/30/14* - 12/31/14 | |||||||||||||
Per Share Operating Performance: | ||||||||||||||||
Net Asset Value, Beginning of Period | $ | 10.00 | $ | 10.00 | $ | 10.00 | $ | 10.00 | ||||||||
|
|
|
|
|
|
|
| |||||||||
Investment Operations: | ||||||||||||||||
Net investment income(a) | 0.06 | 0.07 | 0.06 | 0.06 | ||||||||||||
Net realized and unrealized gain (loss) on investments | 0.16 | 0.15 | 0.16 | 0.16 | ||||||||||||
|
|
|
|
|
|
|
| |||||||||
Total from investment operations | 0.22 | 0.22 | 0.22 | 0.22 | ||||||||||||
|
|
|
|
|
|
|
| |||||||||
Less Distributions From: | ||||||||||||||||
Net investment income | (0.07 | ) | (0.05 | ) | (0.09 | ) | (0.16 | ) | ||||||||
|
|
|
|
|
|
|
| |||||||||
Net increase in net assets | 0.15 | 0.17 | 0.13 | 0.06 | ||||||||||||
|
|
|
|
|
|
|
| |||||||||
Net Asset Value, End of Period | $ | 10.15 | $ | 10.17 | $ | 10.13 | $ | 10.06 | ||||||||
|
|
|
|
|
|
|
| |||||||||
Total Return(b) | 2.18 | % | 2.20 | % | 2.23 | % | 2.20 | % | ||||||||
Ratios and Supplemental Data: | ||||||||||||||||
Net Assets, End of Period (000s) | $ | 676 | $ | 508 | $ | 506 | $ | 335 | ||||||||
Ratios to average net assets: | ||||||||||||||||
Gross expenses(c) | 12.59 | % | 16.79 | % | 18.04 | % | 30.22 | % | ||||||||
Net expenses(c) | 0.37 | % | 0.37 | % | 0.37 | % | 0.37 | % | ||||||||
Net investment income(c) | 2.30 | % | 2.78 | % | 2.53 | % | 2.32 | % | ||||||||
Portfolio turnover rate(d) | 18 | % | 7 | % | 5 | % | 5 | % | ||||||||
| * | Commencement of operations |
| (a) | Net investment income per share is calculated using the average shares method. |
| (b) | Total return is calculated assuming a purchase of shares at net asset value on the first day and a sale at net asset value on the last day of each period reported. Distributions are assumed, for the purpose of this calculation, to be reinvested at net asset value per share on the respective payment dates of each Fund. Total return for periods of less than one year is not annualized. Results represent past performance and are not indicative of future results. |
| (c) | Annualized |
| (d) | Not annualized |
See Notes to Financial Statements.
29
Table of Contents
State Street Institutional Investment Trust
Financial Highlights — (continued)
Selected data for a Class I Share of beneficial interest outstanding throughout the period is presented below:
| State Street Target Retirement 2050 Fund | State Street Target Retirement 2055 Fund | State Street Target Retirement 2060 Fund | ||||||||||
| For the Period 9/30/14* - 12/31/14 | For the Period 9/30/14* - 12/31/14 | For the Period 9/30/14* - 12/31/14 | ||||||||||
Per Share Operating Performance: | ||||||||||||
Net Asset Value, Beginning of Period | $ | 10.00 | $ | 10.00 | $ | 10.00 | ||||||
|
|
|
|
|
| |||||||
Investment Operations: | ||||||||||||
Net investment income(a) | 0.06 | 0.06 | 0.06 | |||||||||
Net realized and unrealized gain (loss) on investments | 0.16 | 0.16 | 0.16 | |||||||||
|
|
|
|
|
| |||||||
Total from investment operations | 0.22 | 0.22 | 0.22 | |||||||||
|
|
|
|
|
| |||||||
Less Distributions From: | ||||||||||||
Net investment income | (0.16 | ) | (0.16 | ) | (0.16 | ) | ||||||
Net realized gains | (0.00 | )(b) | (0.00 | )(b) | (0.00 | )(b) | ||||||
|
|
|
|
|
| |||||||
Total distributions | (0.16 | ) | (0.16 | ) | (0.16 | ) | ||||||
|
|
|
|
|
| |||||||
Net increase in net assets | 0.06 | 0.06 | 0.06 | |||||||||
|
|
|
|
|
| |||||||
Net Asset Value, End of Period | $ | 10.06 | $ | 10.06 | $ | 10.06 | ||||||
|
|
|
|
|
| |||||||
Total Return(c) | 2.20 | % | 2.20 | % | 2.18 | % | ||||||
Ratios and Supplemental Data: | ||||||||||||
Net Assets, End of Period (000s) | $ | 168 | $ | 168 | $ | 168 | ||||||
Ratios to average net assets: | ||||||||||||
Gross expenses(d) | 59.71 | % | 59.62 | % | 59.48 | % | ||||||
Net expenses(d) | 0.37 | % | 0.37 | % | 0.37 | % | ||||||
Net investment income(d) | 2.28 | % | 2.28 | % | 2.29 | % | ||||||
Portfolio turnover rate(e) | 7 | % | 7 | % | 7 | % | ||||||
| * | Commencement of operations |
| (a) | Net investment income per share is calculated using the average shares method. |
| (b) | Amount is less than $0.005 per share. |
| (c) | Total return is calculated assuming a purchase of shares at net asset value on the first day and a sale at net asset value on the last day of each period reported. Distributions are assumed, for the purpose of this calculation, to be reinvested at net asset value per share on the respective payment dates of each Fund. Total return for periods of less than one year is not annualized. Results represent past performance and are not indicative of future results. |
| (d) | Annualized |
| (e) | Not annualized |
See Notes to Financial Statements.
30
Table of Contents
State Street Institutional Investment Trust
Financial Highlights — (continued)
Selected data for a Class K Share of beneficial interest outstanding throughout the period is presented below:
| State Street Target Retirement Fund | State Street Target Retirement 2015 Fund | State Street Target Retirement 2020 Fund | State Street Target Retirement 2025 Fund | |||||||||||||
| For the Period 9/30/14* - 12/31/14 | For the Period 9/30/14* - 12/31/14 | For the Period 9/30/14* - 12/31/14 | For the Period 9/30/14* - 12/31/14 | |||||||||||||
Per Share Operating Performance: | ||||||||||||||||
Net Asset Value, Beginning of Period | $ | 10.00 | $ | 10.00 | $ | 10.00 | $ | 10.00 | ||||||||
|
|
|
|
|
|
|
| |||||||||
Investment Operations: | ||||||||||||||||
Net investment income(a) | 0.06 | 0.06 | 0.04 | 0.05 | ||||||||||||
Net realized and unrealized gain on investments | 0.02 | 0.03 | 0.13 | 0.15 | ||||||||||||
|
|
|
|
|
|
|
| |||||||||
Total from investment operations | 0.08 | 0.09 | 0.17 | 0.20 | ||||||||||||
|
|
|
|
|
|
|
| |||||||||
Less Distributions From: | ||||||||||||||||
Net investment income | (0.05 | ) | (0.06 | ) | (0.04 | ) | (0.04 | ) | ||||||||
Net realized gains | (0.00 | )(b) | (0.00 | )(b) | (0.00 | )(b) | – | |||||||||
|
|
|
|
|
|
|
| |||||||||
Total distributions | (0.05 | ) | (0.06 | ) | (0.04 | ) | (0.04 | ) | ||||||||
|
|
|
|
|
|
|
| |||||||||
Net increase in net assets | 0.03 | 0.03 | 0.13 | 0.16 | ||||||||||||
|
|
|
|
|
|
|
| |||||||||
Net Asset Value, End of Period | $ | 10.03 | $ | 10.03 | $ | 10.13 | $ | 10.16 | ||||||||
|
|
|
|
|
|
|
| |||||||||
Total Return(c) | 0.75 | % | 0.92 | % | 1.67 | % | 2.04 | % | ||||||||
Ratios and Supplemental Data: | ||||||||||||||||
Net Assets, End of Period (000s) | $ | 1,558 | $ | 1,740 | $ | 6,399 | $ | 5,597 | ||||||||
Ratios to average net assets: | ||||||||||||||||
Gross expenses(d) | 25.06 | % | 18.68 | % | 11.13 | % | 11.75 | % | ||||||||
Net expenses(d) | 0.17 | % | 0.17 | % | 0.17 | % | 0.17 | % | ||||||||
Net investment income(d) | 2.59 | % | 2.50 | % | 1.62 | % | 2.19 | % | ||||||||
Portfolio turnover rate(e) | 8 | % | 39 | % | 5 | % | 13 | % | ||||||||
| * | Commencement of operations |
| (a) | Net investment income per share is calculated using the average shares method. |
| (b) | Amount is less than $0.005 per share. |
| (c) | Total return is calculated assuming a purchase of shares at net asset value on the first day and a sale at net asset value on the last day of each period reported. Distributions are assumed, for the purpose of this calculation, to be reinvested at net asset value per share on the respective payment dates of each Fund. Total return for periods of less than one year is not annualized. Results represent past performance and are not indicative of future results. |
| (d) | Annualized |
| (e) | Not annualized |
See Notes to Financial Statements.
31
Table of Contents
State Street Institutional Investment Trust
Financial Highlights — (continued)
| State Street Target Retirement 2030 Fund | State Street Target Retirement 2035 Fund | State Street Target Retirement 2040 Fund | State Street Target Retirement 2045 Fund | |||||||||||||
| For the Period 9/30/14* - 12/31/14 | For the Period 9/30/14* - 12/31/14 | For the Period 9/30/14* - 12/31/14 | For the Period 9/30/14* - 12/31/14 | |||||||||||||
Per Share Operating Performance: | ||||||||||||||||
Net Asset Value, Beginning of Period | $ | 10.00 | $ | 10.00 | $ | 10.00 | $ | 10.00 | ||||||||
|
|
|
|
|
|
|
| |||||||||
Investment Operations: | ||||||||||||||||
Net investment income(a) | 0.07 | 0.03 | 0.05 | 0.06 | ||||||||||||
Net realized and unrealized gain on investments | 0.15 | 0.20 | 0.18 | 0.17 | ||||||||||||
|
|
|
|
|
|
|
| |||||||||
Total from investment operations | 0.22 | 0.23 | 0.23 | 0.23 | ||||||||||||
|
|
|
|
|
|
|
| |||||||||
Less Distributions From: | ||||||||||||||||
Net investment income | (0.07 | ) | (0.06 | ) | (0.10 | ) | (0.17 | ) | ||||||||
|
|
|
|
|
|
|
| |||||||||
Net increase in net assets | 0.15 | 0.17 | 0.13 | 0.06 | ||||||||||||
|
|
|
|
|
|
|
| |||||||||
Net Asset Value, End of Period | $ | 10.15 | $ | 10.17 | $ | 10.13 | $ | 10.06 | ||||||||
|
|
|
|
|
|
|
| |||||||||
Total Return(b) | 2.23 | % | 2.25 | % | 2.28 | % | 2.25 | % | ||||||||
Ratios and Supplemental Data: | ||||||||||||||||
Net Assets, End of Period (000s) | $ | 3,243 | $ | 3,208 | $ | 1,512 | $ | 335 | ||||||||
Ratios to average net assets: | ||||||||||||||||
Gross expenses(c) | 14.05 | % | 17.89 | % | 20.53 | % | 30.02 | % | ||||||||
Net expenses(c) | 0.17 | % | 0.17 | % | 0.17 | % | 0.17 | % | ||||||||
Net investment income(c) | 2.64 | % | 1.28 | % | 1.90 | % | 2.53 | % | ||||||||
Portfolio turnover rate(d) | 18 | % | 7 | % | 5 | % | 5 | % | ||||||||
| * | Commencement of operations |
| (a) | Net investment income per share is calculated using the average shares method. |
| (b) | Total return is calculated assuming a purchase of shares at net asset value on the first day and a sale at net asset value on the last day of each period reported. Distributions are assumed, for the purpose of this calculation, to be reinvested at net asset value per share on the respective payment dates of each Fund. Total return for periods of less than one year is not annualized. Results represent past performance and are not indicative of future results. |
| (c) | Annualized |
| (d) | Not annualized |
See Notes to Financial Statements.
32
Table of Contents
State Street Institutional Investment Trust
Financial Highlights — (continued)
Selected data for a Class K Share of beneficial interest outstanding throughout the period is presented below:
| State Street Target Retirement 2050 Fund | State Street Target Retirement 2055 Fund | State Street Target Retirement 2060 Fund | ||||||||||
| For the Period 9/30/14* - 12/31/14 | For the Period 9/30/14* - 12/31/14 | For the Period 9/30/14* - 12/31/14 | ||||||||||
Per Share Operating Performance: | ||||||||||||
Net Asset Value, Beginning of Period | $ | 10.00 | $ | 10.00 | $ | 10.00 | ||||||
|
|
|
|
|
| |||||||
Investment Operations: | ||||||||||||
Net investment income(a) | 0.06 | 0.06 | 0.06 | |||||||||
Net realized and unrealized gain on investments | 0.16 | 0.16 | 0.16 | |||||||||
|
|
|
|
|
| |||||||
Total from investment operations | 0.22 | 0.22 | 0.22 | |||||||||
|
|
|
|
|
| |||||||
Less Distributions From: | ||||||||||||
Net investment income | (0.16 | ) | (0.16 | ) | (0.16 | ) | ||||||
Net realized gains | (0.00 | )(b) | (0.00 | )(b) | (0.00 | )(b) | ||||||
|
|
|
|
|
| |||||||
Total distributions | (0.16 | ) | (0.16 | ) | (0.16 | ) | ||||||
|
|
|
|
|
| |||||||
Net increase in net assets | 0.06 | 0.06 | 0.06 | |||||||||
|
|
|
|
|
| |||||||
Net Asset Value, End of Period | $ | 10.06 | $ | 10.06 | $ | 10.06 | ||||||
|
|
|
|
|
| |||||||
Total Return(c) | 2.25 | % | 2.25 | % | 2.24 | % | ||||||
Ratios and Supplemental Data: | ||||||||||||
Net Assets, End of Period (000s) | $ | 168 | $ | 168 | $ | 168 | ||||||
Ratios to average net assets: | ||||||||||||
Gross expenses(d) | 59.52 | % | 59.42 | % | 59.28 | % | ||||||
Net expenses(d) | 0.17 | % | 0.17 | % | 0.17 | % | ||||||
Net investment income(d) | 2.48 | % | 2.48 | % | 2.49 | % | ||||||
Portfolio turnover rate(e) | 7 | % | 7 | % | 7 | % | ||||||
| * | Commencement of operations |
| (a) | Net investment income per share is calculated using the average shares method. |
| (b) | Amount is less than $0.005 per share. |
| (c) | Total return is calculated assuming a purchase of shares at net asset value on the first day and a sale at net asset value on the last day of each period reported. Distributions are assumed, for the purpose of this calculation, to be reinvested at net asset value per share on the respective payment dates of each Fund. Total return for periods of less than one year is not annualized. Results represent past performance and are not indicative of future results. |
| (d) | Annualized |
| (e) | Not annualized |
See Notes to Financial Statements.
33
Table of Contents
State Street Institutional Investment Trust
December 31, 2014
| 1. | Organization |
State Street Institutional Investment Trust (the “Trust”) is registered under the Investment Company Act of 1940, as amended (the “1940 Act”), as an open-end management investment company, and was organized as a business trust under the laws of the Commonwealth of Massachusetts on February 16, 2000. The Trust consists of thirty-five (35) series and corresponding classes, each of which have the same rights and privileges, including the same voting rights. The Target Retirement Funds are authorized to issue an unlimited number of shares, with no par value. Each Target Retirement Fund has registered Class C shares. Each Target Retirement Fund’s Class C shares were not operational at December 31, 2014. The financial statements herein relate to the following Funds:
| Fund | Classes | Commencement of Operations: | ||
State Street Target Retirement Fund | Class A Class I Class K | September 30, 2014 September 30, 2014 September 30, 2014 | ||
State Street Target Retirement 2015 Fund | Class A Class I Class K | September 30, 2014 September 30, 2014 September 30, 2014 | ||
State Street Target Retirement 2020 Fund | Class A Class I Class K | September 30, 2014 September 30, 2014 September 30, 2014 | ||
State Street Target Retirement 2025 Fund | Class A Class I Class K | September 30, 2014 September 30, 2014 September 30, 2014 | ||
State Street Target Retirement 2030 Fund | Class A Class I Class K | September 30, 2014 September 30, 2014 September 30, 2014 | ||
State Street Target Retirement 2035 Fund | Class A Class I Class K | September 30, 2014 September 30, 2014 September 30, 2014 | ||
State Street Target Retirement 2040 Fund | Class A Class I Class K | September 30, 2014 September 30, 2014 September 30, 2014 | ||
State Street Target Retirement 2045 Fund | Class A Class I Class K | September 30, 2014 September 30, 2014 September 30, 2014 | ||
State Street Target Retirement 2050 Fund | Class A Class I Class K | September 30, 2014 September 30, 2014 September 30, 2014 | ||
State Street Target Retirement 2055 Fund | Class A Class I Class K | September 30, 2014 September 30, 2014 September 30, 2014 | ||
State Street Target Retirement 2060 Fund | Class A Class I Class K | September 30, 2014 September 30, 2014 September 30, 2014 |
34
Table of Contents
State Street Institutional Investment Trust
Notes to Financial Statements — (continued)
December 31, 2014
The Target Retirement Funds retained SSGA Funds Management, Inc. (the “Adviser”), a subsidiary of State Street Corporation and an affiliate of State Street Bank and Trust Company (“State Street”), as their investment adviser. The Adviser manages the Funds using a proprietary asset allocation strategy. The Funds are “fund of funds” that invest in a combination of mutual funds and exchange traded funds (“ETFs”) sponsored by the Adviser or its affiliates (“Underlying Funds”). The Underlying Funds may invest in a wide variety of asset classes, including equity and fixed-income securities of issuers anywhere in the world, including emerging markets investments, and including, among others, high yield, commodity, and real estate investments. The Underlying Funds may invest in obligations of domestic U.S. issuers, non-U.S. issuers, or both.
Class A shares are available to the general public for investment through transaction-based financial intermediaries. Class A shares may be subject to a 1% CDSC if redeemed within 18 months of purchase. Class I and K shares are sold without a sales charge and only to certain eligible investors.
Each Fund operates as a diversified investment company and accordingly follows the investment company accounting and reporting guidance of the Financial Accounting Standards Board (“FASB”) Accounting Standards Codification Topic 946 Financial Services – Investment Companies.
| 2. | Significant Accounting Policies |
The Funds’ financial statements are prepared in accordance with accounting principles generally accepted accounting principles in the United States of America (“U.S. GAAP”), which require the use of management estimates. Actual results could differ from those estimates. It is reasonably possible that these differences could be material. The following is a summary of the significant accounting policies consistently followed by each Fund in the preparation of its financial statements.
Security valuation – Each Fund’s investments are valued each business day by independent pricing services. Equity securities for which market quotations are available are valued at the last sale price or official closing price (closing bid price if no sale has occurred) on the primary market or exchange on which they trade. Investments in other mutual funds are valued at the net asset value per share. Fixed income securities and options are valued on the basis of the closing bid price. The Portfolio may value securities for which market quotations are not readily available at “fair value,” as determined in good faith pursuant to procedures established by the Board of Trustees.
The three tier hierarchy of inputs is summarized below:
| • | Level 1 – quoted prices in active markets for identical securities |
| • | Level 2 – other significant observable inputs (including quoted prices for similar securities, interest rates, prepayment speeds, credit risk, etc.) |
| • | Level 3 – significant unobservable inputs (including a Portfolio’s own assumptions in determining the fair value of investments) |
The inputs or methodology used for valuing securities are not an indication of the risk associated with investing in those securities.
Investments in the Underlying Funds are valued at their closing NAV each business day and are categorized as Level 1 in the hierarchy.
35
Table of Contents
State Street Institutional Investment Trust
Notes to Financial Statements — (continued)
December 31, 2014
Changes in valuation techniques may result in transfers in or out of an investment’s assigned level within the hierarchy. Transfers between fair value hierarchy levels are recognized at the end of the period. For the period ended December 31, 2014, there were no transfers between levels.
Investment transactions – Investment transactions are recorded on the trade date basis. Realized gains and losses from the sale of disposition of securities and foreign exchange transactions are recorded on the identified cost basis. Corporate actions (including cash dividends) are recorded net of foreign tax withholdings on the ex-dividend date.
Investment Income – Dividend income is recorded on the ex-dividend date. Income and capital gains distributions received by the Funds are recorded on the ex-dividend date. The value of additional securities received as dividend payments is recorded as income and as an increase to the cost basis of such securities. Interest income is recorded on the accrual basis. All premiums and discounts are amortized or accreted for financial reporting purposes.
Dividends and distributions – Dividends from net investment income are declared and paid at least annually. Net realized capital gains, if any, are distributed annually, unless additional distributions are required for compliance with applicable tax regulations.
Expense allocation – Certain expenses are applicable to multiple Funds within the Trust. Expenses directly attributable to a Fund are charged to that Fund. Expenses of the Trust that are not directly attributed to a Fund are allocated among the Funds, on the basis of relative net assets, except where a more appropriate allocation of expenses to each of the Funds can otherwise be made. Class specific fees are borne by each class.
Federal income taxes – Each Fund intends to qualify for and elect treatment as a regulated investment company under Subchapter M of the Internal Revenue Code of 1986, as amended. By so qualifying and electing, the Funds will not be subject to federal income taxes to the extent they distribute their taxable income, including any net realized capital gains, for each fiscal year. In addition, by distributing during each calendar year substantially all of their net taxable income and capital gains, if any, the Funds will not be subject to federal excise tax.
For the year ended December 31, 2014, permanent differences identified and reclassified among the components of net assets were as follows:
| Fund | Paid-In Capital | Accumulated Gain (Loss) | Undistributed Net Investment Income (Loss) | |||||||||
State Street Target Retirement Fund | $ | – | $ | (2,460 | ) | $ | 2,460 | |||||
State Street Target Retirement 2015 Fund | – | (6,237 | ) | 6,237 | ||||||||
State Street Target Retirement 2020 Fund | – | (12,542 | ) | 12,542 | ||||||||
State Street Target Retirement 2025 Fund | – | (14,379 | ) | 14,379 | ||||||||
State Street Target Retirement 2030 Fund | – | (18,262 | ) | 18,262 | ||||||||
State Street Target Retirement 2035 Fund | – | (13,069 | ) | 13,069 | ||||||||
State Street Target Retirement 2040 Fund | – | (14,845 | ) | 14,845 | ||||||||
State Street Target Retirement 2045 Fund | – | (10,292 | ) | 10,292 | ||||||||
36
Table of Contents
State Street Institutional Investment Trust
Notes to Financial Statements — (continued)
December 31, 2014
| Fund | Paid-In Capital | Accumulated Gain (Loss) | Undistributed Net Investment Income (Loss) | |||||||||
State Street Target Retirement 2050 Fund | $ | – | $ | (5,068 | ) | $ | 5,068 | |||||
State Street Target Retirement 2055 Fund | – | (5,067 | ) | 5,067 | ||||||||
State Street Target Retirement 2060 Fund | – | (5,029 | ) | 5,029 | ||||||||
These differences were primarily attributable to distribution redesignations. Net investment income (loss), net realized gains (losses), and net assets were not affected by this reclassification.
At December 31, 2014, the components of distributable earnings on a tax basis were as follows:
| Fund | Undistributed Ordinary Income | Undistributed Long-Term Capital Gains | Net Unrealized Appreciation (Depreciation) | |||||||||
State Street Target Retirement Fund | $ | 2,023 | $ | 2,222 | $ | (7,941 | ) | |||||
State Street Target Retirement 2015 Fund | 11,940 | 4,377 | (18,558 | ) | ||||||||
State Street Target Retirement 2020 Fund | – | 7,994 | (5,515 | ) | ||||||||
State Street Target Retirement 2025 Fund | 3,109 | 9,570 | (9,921 | ) | ||||||||
State Street Target Retirement 2030 Fund | 813 | 11,017 | (3,610 | ) | ||||||||
State Street Target Retirement 2035 Fund | – | 4,367 | 1,496 | |||||||||
State Street Target Retirement 2040 Fund | – | 2,280 | 5,172 | |||||||||
State Street Target Retirement 2045 Fund | – | 1,450 | 4,566 | |||||||||
State Street Target Retirement 2050 Fund | – | 980 | 2,002 | |||||||||
State Street Target Retirement 2055 Fund | – | 981 | 2,001 | |||||||||
State Street Target Retirement 2060 Fund | – | 1,011 | 2,037 | |||||||||
The tax character of distributions paid to shareholders during the period ended December 31, 2014 was as follows:
| Fund | Ordinary Income | Long-Term Capital Gain | Total | |||||||||
State Street Target Retirement Fund | 10,084 | – | 10,084 | |||||||||
State Street Target Retirement 2015 Fund | 17,214 | – | 17,214 | |||||||||
State Street Target Retirement 2020 Fund | 28,000 | 638 | 28,638 | |||||||||
State Street Target Retirement 2025 Fund | 29,599 | – | 29,599 | |||||||||
State Street Target Retirement 2030 Fund | 32,190 | – | 32,190 | |||||||||
State Street Target Retirement 2035 Fund | 18,802 | 3,487 | 22,289 | |||||||||
State Street Target Retirement 2040 Fund | 17,563 | 6,275 | 23,838 | |||||||||
State Street Target Retirement 2045 Fund | 11,761 | 4,386 | 16,147 | |||||||||
State Street Target Retirement 2050 Fund | 6,168 | 1,876 | 8,044 | |||||||||
State Street Target Retirement 2055 Fund | 6,170 | 1,875 | 8,045 | |||||||||
State Street Target Retirement 2060 Fund | 6,141 | 1,849 | 7,990 | |||||||||
37
Table of Contents
State Street Institutional Investment Trust
Notes to Financial Statements — (continued)
December 31, 2014
The Funds may have net tax basis capital loss carryforwards which may be applied against any realized short-term or long-term taxable gains in each succeeding year until they are utilized. At December 31, 2014, the Funds had no net tax basis capital loss carryforwards.
At December 31, 2014, the cost of investments and the comparison of unrealized appreciation and depreciation of investments for federal income tax purpose are as follows:
| Fund | Tax Cost | Gross Unrealized Appreciation | Gross Unrealized Depreciation | Net Unrealized Appreciation (Depreciation) | ||||||||||||
State Street Target Retirement Fund | 2,377,125 | 11,981 | 19,922 | (7,941 | ) | |||||||||||
State Street Target Retirement 2015 Fund | 2,899,376 | 12,042 | 30,600 | (18,558 | ) | |||||||||||
State Street Target Retirement 2020 Fund | 8,061,217 | 36,862 | 42,377 | (5,515 | ) | |||||||||||
State Street Target Retirement 2025 Fund | 6,938,467 | 30,772 | 40,693 | (9,921 | ) | |||||||||||
State Street Target Retirement 2030 Fund | 4,582,110 | 28,317 | 31,927 | (3,610 | ) | |||||||||||
State Street Target Retirement 2035 Fund | 4,208,772 | 29,501 | 28,005 | 1,496 | ||||||||||||
State Street Target Retirement 2040 Fund | 2,507,592 | 32,708 | 27,536 | 5,172 | ||||||||||||
State Street Target Retirement 2045 Fund | 991,988 | 21,928 | 17,362 | 4,566 | ||||||||||||
State Street Target Retirement 2050 Fund | 487,638 | 10,583 | 8,581 | 2,002 | ||||||||||||
State Street Target Retirement 2055 Fund | 487,639 | 10,583 | 8,582 | 2,001 | ||||||||||||
State Street Target Retirement 2060 Fund | 488,466 | 10,635 | 8,598 | 2,037 | ||||||||||||
In accordance with provisions surrounding income taxes, management has analyzed the Funds’ tax positions taken on federal and state income tax returns for tax returns since the Funds’ inception on September 30, 2014 and has concluded that no provision for income tax is required in the Funds’ financial statements.
| 3. | Securities Transactions |
For the period ended December 31, 2014, purchases and sales of the Underlying Fund shares were:
| Fund | Purchases | Sales | ||||||
State Street Target Retirement Fund | $ | 2,497,240 | $ | 126,593 | ||||
State Street Target Retirement 2015 Fund | 3,674,503 | 794,249 | ||||||
State Street Target Retirement 2020 Fund | 8,238,117 | 199,253 | ||||||
State Street Target Retirement 2025 Fund | 7,333,941 | 419,763 | ||||||
State Street Target Retirement 2030 Fund | 5,030,193 | 477,744 | ||||||
State Street Target Retirement 2035 Fund | 4,336,950 | 147,214 | ||||||
State Street Target Retirement 2040 Fund | 2,567,469 | 79,594 | ||||||
State Street Target Retirement 2045 Fund | 1,027,425 | 47,974 | ||||||
State Street Target Retirement 2050 Fund | 517,857 | 36,768 | ||||||
State Street Target Retirement 2055 Fund | 517,857 | 36,769 | ||||||
State Street Target Retirement 2060 Fund | 517,100 | 35,161 | ||||||
38
Table of Contents
State Street Institutional Investment Trust
Notes to Financial Statements — (continued)
December 31, 2014
| 4. | Related Party and Other Fees |
Each Fund has entered into an investment advisory agreement with the Adviser, under which the Adviser directs the investments of the Funds in accordance with their investment objectives, policies, and limitations. In compensation for the Adviser’s services as investment adviser, each Fund pays the Adviser a management fee at an annual rate of 0.05% of its average daily net assets.
SSGA FM is contractually obligated until April 30, 2016, to waive its management fee and/or to reimburse the fund for expenses to the extent that total expenses (exclusive of nonrecurring account fees, extraordinary expenses, acquired fund fees, and distribution, shareholder servicing, and sub-transfer agency fees) exceed 0.30% of average daily net assets on an annual basis. This waiver and/or reimbursement may not be terminated during the relevant period except with the approval of the fund’s Board of Trustees. SSGA FM waived or reimbursed fees under this agreement as shown on each Statement of Operations.
The Funds pay an annual fee of $25,000 per Fund for custody and accounting services. Pursuant to the administration agreement, the Funds pay an annual fee of $50,000 for each Fund serviced by State Street. These fees are prorated for the first year of operation.
Boston Financial Data Services (“BFDS”), a joint venture of DST Systems, Inc. and State Street Corporation, serves as transfer agent and dividend disbursing agent to the Funds. For these services, the Funds pay annual account services fees, activity-based fees, charges related to compliance and regulatory services, and a minimum fee of $200 for each Fund.
The Funds have adopted a distribution plan pursuant to Rule 12b-1 under the 1940 Act under which a Fund may compensate its distributor (or others) for services in connection with the distribution of the Fund’s Class A shares and for services provided to Fund shareholders (the “Plan”). The Plan calls for payments at an annual rate (based on average daily net assets) of 0.25% of the Fund’s net assets attributable to its Class A shares. Because these fees are paid out of the assets of a Fund attributable to its Class A shares on an ongoing basis, they will increase the cost of your investment and may cost you more over time than paying other types of sales charges.
Subject to the supervision of the Board of Trustees, the Trust may engage, directly or indirectly, in financing any activities relating to shareholder account administrative and servicing functions, including without limitation making payments to Agents for one or more of the following activities: (a) answering inquiries regarding account status and history, the manner in which purchases and redemptions of each Class may be effected, and certain other matters pertaining to the Trust; (b) assisting in designating and changing dividend options, account designations and addresses; (c) providing necessary personnel and facilities to establish and maintain certain shareholder accounts and records, as requested from time to time by the Trust; (d) assisting in processing purchase and redemption transactions; (e) arranging for the wiring of funds; (f) transmitting and receiving funds in connection with orders to purchase or redeem a Class of shares; (g) verifying and guaranteeing signatures in connection with redemption orders, transfers among and changes in designated accounts; (h) providing periodic statements showing account balances and, to the extent practicable, integration of such information with other client transactions otherwise effected with or through the Agent; (i) furnishing (either separately or on an integrated basis with other reports sent by the Agent) monthly and annual statements and confirmations of all purchases and redemptions of a Class of shares in an account; (j) transmitting proxy statements, annual reports, prospectuses and other communications from the Trust; (k) receiving, tabulating and transmitting to the
39
Table of Contents
State Street Institutional Investment Trust
Notes to Financial Statements — (continued)
December 31, 2014
Trust proxies executed with respect to special meetings of shareholders of the Trust; and (l) providing such other related services as the Trust or customers of the Agent may reasonably request.
The Funds also pay a sub-transfer agent fees of 0.20% on Class A and I for recordkeeping, shareholder servicing, or administrative services provided by financial intermediaries.
| 5. | Trustees’ Fees |
Independent Trustees are compensated on a calendar year basis. Any Trustee who is deemed to be an “interested person” (as defined in the 1940 Act) of the Funds does not receive compensation from the Funds for his or her service as a Trustee.
Each Independent Trustee receives for his or her services to the State Street Master Funds, State Street Institutional Investment Trust and SSGA Funds, a $141,500 annual base retainer in addition to $18,000 for each in-person meeting and $2,000 for each telephonic meeting from the Trust. The Trust pays a fixed allocation of $15,000 per Fund. The Co-Chairmen each receive an additional $44,000 annual retainer. The Independent Trustees are reimbursed for travel and other out-of pocket expenses in connection with meeting attendance. As of the date of this Report, the Trustees were not paid pension or retirement benefits as part of the Trust’s expenses.
The Trust’s officers are compensated by the Adviser and its affiliates.
| 6. | Indemnifications |
The Trust’s organizational documents provide that its officers and trustees are indemnified against certain liabilities arising out of the performance of their duties to the Trust. In addition, both in some of its principal service contracts and in the normal course of its business, the Trust enters into contracts that provide indemnifications to other parties for certain types of losses or liabilities. The Trust’s maximum exposure under these arrangements is unknown as this could involve future claims against the Trust. Management does not expect any significant claims.
| 7. | Beneficial Interest |
The Funds do not invest in the Underlying Funds for the purpose of exercising management or control; however, investments within the set limits may represent 5% or more of an Underlying Funds’ outstanding shares. At December 31, 2014, none of the Funds held 5% or greater of the Underlying Funds’ outstanding shares.
| 8. | Transaction with Affiliates |
The Funds may invest in Underlying Funds affiliated with the Adviser. Amounts related to investments in affiliated Underlying Funds for the period September 30, 2014 (commencement of operations) through December 31, 2014 are:
State Street Target | Purchased | Sold | Number of Shares Held at 12/31/14 | Value at 12/31/14 | Dividend Income | Realized Gain (Loss) | Short Term Capital Gains Distributions | Long Term Capital Gains Distributions | ||||||||||||||||||||||||||||||||
| Cost | Shares | Proceeds | Shares | |||||||||||||||||||||||||||||||||||||
SPDR Russell Small Cap Completeness ETF | $ | 80,666 | 970 | $ | 6,729 | 80 | 890 | $ | 75,098 | $ | 157 | $ | 114 | $ | 1,003 | $ | 712 | |||||||||||||||||||||||
State Street Equity 500 Index II Portfolio | 422,206 | 40,568 | 35,387 | 3,335 | 37,233 | 392,859 | 1,722 | 1,339 | 63 | 1,496 | ||||||||||||||||||||||||||||||
SPDR Barclays 1-10 Year TIPS ETF | 448,133 | 23,081 | 13,365 | 700 | 22,381 | 426,582 | 1,837 | (295 | ) | – | – | |||||||||||||||||||||||||||||
40
Table of Contents
State Street Institutional Investment Trust
Notes to Financial Statements — (continued)
December 31, 2014
State Street Target | Purchased | Sold | Number of Shares Held at 12/31/14 | Value at 12/31/14 | Dividend Income | Realized Gain (Loss) | Short Term Capital Gains Distributions | Long Term Capital Gains Distributions | ||||||||||||||||||||||||||||||||
| Cost | Shares | Proceeds | Shares | |||||||||||||||||||||||||||||||||||||
SPDR Barclays High Yield Bond ETF | $ | 173,696 | 4,394 | $ | 3,005 | 77 | 4,317 | $ | 166,679 | $ | 2,020 | $ | (90 | ) | $ | – | $ | – | ||||||||||||||||||||||
SPDR Barclays Short Term Corporate Bond ETF | 97,054 | 3,167 | 1,190 | 39 | 3,128 | 95,686 | 245 | (8 | ) | 59 | 23 | |||||||||||||||||||||||||||||
SPDR Barclays Short Term Treasury ETF | 396,454 | 13,159 | 19,806 | 658 | 12,501 | 376,030 | 630 | (35 | ) | 31 | – | |||||||||||||||||||||||||||||
State Street Aggregate Bond Index Portfolio | 505,756 | 49,198 | 21,175 | 2,098 | 47,100 | 477,546 | 956 | 154 | 516 | – | ||||||||||||||||||||||||||||||
State Street Global Equity ex-U.S. Index Portfolio | 244,350 | 27,025 | 10,388 | 1,120 | 25,905 | 237,423 | 758 | (428 | ) | – | – | |||||||||||||||||||||||||||||
SPDR Dow Jones Global Real Estate ETF | 128,925 | 2,788 | 15,548 | 323 | 2,465 | 117,654 | 557 | 1,225 | – | – | ||||||||||||||||||||||||||||||
State Street Institutional Liquid Reserves Fund, Premier Class | 20,465 | 20,465 | 16,838 | 16,838 | 3,627 | 3,627 | – | – | – | – | ||||||||||||||||||||||||||||||
State Street Target | Purchased | Sold | Number of Shares Held at 12/31/14 | Value at 12/31/14 | Dividend Income | Realized Gain (Loss) | Short Term Capital Gains Distributions | Long Term Capital Gains Distributions | ||||||||||||||||||||||||||||||||
| Cost | Shares | Proceeds | Shares | |||||||||||||||||||||||||||||||||||||
SPDR Russell Small Cap Completeness ETF | $ | 171,399 | 2,061 | $ | 43,749 | 522 | 1,539 | $ | 129,861 | $ | 320 | $ | 588 | $ | 2,044 | $ | 1,450 | |||||||||||||||||||||||
State Street Equity 500 Index II Portfolio | 859,510 | 82,514 | 216,646 | 20,381 | 62,133 | 655,588 | 3,364 | 8,556 | 123 | 2,924 | ||||||||||||||||||||||||||||||
SPDR Barclays 1-10 Year TIPS ETF | 651,920 | 33,588 | 122,699 | 6,398 | 27,190 | 518,241 | 2,193 | (2,148 | ) | – | – | |||||||||||||||||||||||||||||
SPDR Barclays High Yield Bond ETF | 253,700 | 6,424 | 44,782 | 1,154 | 5,270 | 203,475 | 2,633 | (1,602 | ) | – | – | |||||||||||||||||||||||||||||
SPDR Barclays Long Term Treasury ETF | 8,469 | 121 | 8,790 | 121 | – | – | 50 | 321 | – | – | ||||||||||||||||||||||||||||||
SPDR Barclays Short Term Corporate Bond ETF | 14,612 | 477 | – | – | 477 | 14,591 | 33 | – | 8 | 3 | ||||||||||||||||||||||||||||||
SPDR Barclays Short Term Treasury ETF | 76,081 | 2,526 | 24,963 | 830 | 1,696 | 51,016 | 58 | (63 | ) | 2 | – | |||||||||||||||||||||||||||||
State Street Aggregate Bond Index Portfolio | 903,255 | 89,685 | 181,343 | 17,902 | 71,783 | 727,820 | 1,679 | 1,963 | 907 | – | ||||||||||||||||||||||||||||||
State Street Global Equity ex-U.S. Index Portfolio | 551,140 | 58,480 | 104,494 | 11,279 | 47,201 | 432,604 | 1,629 | (4,466 | ) | – | – | |||||||||||||||||||||||||||||
SPDR Dow Jones Global Real Estate ETF | 184,417 | 3,981 | 46,783 | 972 | 3,009 | 143,620 | 756 | 3,681 | – | – | ||||||||||||||||||||||||||||||
State Street Institutional Liquid Reserves Fund, Premier Class | 25,292 | 25,292 | 21,290 | 21,290 | 4,002 | 4,002 | 2 | – | – | – | ||||||||||||||||||||||||||||||
State Street Target | Purchased | Sold | Number of Shares Held at 12/31/14 | Value at 12/31/14 | Dividend Income | Realized Gain (Loss) | Short Term Capital Gains Distributions | Long Term Capital Gains Distributions | ||||||||||||||||||||||||||||||||
| Cost | Shares | Proceeds | Shares | |||||||||||||||||||||||||||||||||||||
SPDR Russell Small Cap Completeness ETF | $ | 580,757 | 6,969 | $ | 36,755 | 437 | 6,532 | $ | 551,170 | $ | 709 | $ | 622 | $ | 4,534 | $ | 3,217 | |||||||||||||||||||||||
State Street Equity 500 Index II Portfolio | 2,472,040 | 235,689 | 133,099 | 12,610 | 223,079 | 2,353,794 | 6,230 | 4,348 | 227 | 5,415 | ||||||||||||||||||||||||||||||
41
Table of Contents
State Street Institutional Investment Trust
Notes to Financial Statements — (continued)
December 31, 2014
State Street Target | Purchased | Sold | Number of Shares Held at 12/31/14 | Value at 12/31/14 | Dividend Income | Realized Gain (Loss) | Short Term Capital Gains Distributions | Long Term Capital Gains Distributions | ||||||||||||||||||||||||||||||||
| Cost | Shares | Proceeds | Shares | |||||||||||||||||||||||||||||||||||||
SPDR Barclays High Yield Bond ETF | $ | 487,326 | 12,408 | $ | – | – | 12,408 | $ | 479,073 | $ | 4,327 | $ | – | $ | – | $ | – | |||||||||||||||||||||||
SPDR Barclays Long Term Treasury ETF | 389,445 | 5,492 | 18,741 | 263 | 5,229 | 381,016 | 1,739 | 954 | – | – | ||||||||||||||||||||||||||||||
SPDR Barclays TIPS ETF | 805,098 | 14,377 | – | – | 14,377 | 804,825 | – | – | – | – | ||||||||||||||||||||||||||||||
State Street Aggregate Bond Index Portfolio | 1,549,494 | 153,566 | 2,971 | 294 | 153,272 | 1,554,043 | 1,788 | 28 | 978 | – | ||||||||||||||||||||||||||||||
State Street Global Equity ex-U.S. Index Portfolio | 1,755,973 | 187,889 | 3,670 | 392 | 187,497 | 1,718,452 | 3,336 | (115 | ) | – | – | |||||||||||||||||||||||||||||
SPDR Dow Jones Global Real Estate ETF | 197,984 | 4,216 | 4,017 | 84 | 4,132 | 197,220 | 565 | 292 | – | – | ||||||||||||||||||||||||||||||
State Street Institutional Liquid Reserves Fund, Premier Class | 51,819 | 51,819 | 35,710 | 35,710 | 16,109 | 16,109 | 14 | – | – | – | ||||||||||||||||||||||||||||||
State Street Target | Purchased | Sold | Number of Shares Held at 12/31/14 | Value at 12/31/14 | Dividend Income | Realized Gain (Loss) | Short Term Capital Gains Distributions | Long Term Capital Gains Distributions | ||||||||||||||||||||||||||||||||
| Cost | Shares | Proceeds | Shares | |||||||||||||||||||||||||||||||||||||
SPDR Russell Small Cap Completeness ETF | $ | 699,856 | 8,386 | $ | 60,021 | 715 | 7,671 | $ | 647,279 | $ | 871 | $ | 902 | $ | 5,564 | $ | 3,948 | |||||||||||||||||||||||
State Street Equity 500 Index II Portfolio | 2,526,841 | 240,578 | 208,958 | 19,696 | 220,882 | 2,330,622 | 6,468 | 7,869 | 236 | 5,623 | ||||||||||||||||||||||||||||||
SPDR Barclays High Yield Bond ETF | 288,366 | 7,349 | – | – | 7,349 | 283,745 | 2,414 | – | – | – | ||||||||||||||||||||||||||||||
SPDR Barclays Long Term Treasury ETF | 694,441 | 9,776 | 33,772 | 472 | 9,304 | 677,945 | 2,863 | 1,848 | – | – | ||||||||||||||||||||||||||||||
SPDR Barclays TIPS ETF | 202,438 | 3,614 | – | – | 3,614 | 202,312 | �� | – | – | – | ||||||||||||||||||||||||||||||
State Street Aggregate Bond Index Portfolio | 984,292 | 97,513 | 40,255 | 3,974 | 93,539 | 948,398 | 1,086 | 427 | 642 | – | ||||||||||||||||||||||||||||||
State Street Global Equity ex-U.S. Index Portfolio | 1,937,707 | 207,400 | 76,757 | 8,277 | 199,123 | 1,825,003 | 3,708 | (3,204 | ) | – | – | |||||||||||||||||||||||||||||
State Street Institutional Liquid Reserves Fund, Premier Class | 34,884 | 34,884 | 21,642 | 21,642 | 13,242 | 13,242 | 11 | – | – | – | ||||||||||||||||||||||||||||||
State Street Target | Purchased | Sold | Number of Shares Held at 12/31/14 | Value at 12/31/14 | Dividend Income | Realized Gain (Loss) | Short Term Capital Gains Distributions | Long Term Capital Gains Distributions | ||||||||||||||||||||||||||||||||
| Cost | Shares | Proceeds | Shares | |||||||||||||||||||||||||||||||||||||
SPDR Russell Small Cap Completeness ETF | $ | 597,089 | 7,155 | $ | 84,979 | 1,012 | 6,143 | $ | 518,346 | $ | 1,090 | $ | 1,303 | $ | 6,975 | $ | 4,948 | |||||||||||||||||||||||
State Street Equity 500 Index II Portfolio | 1,840,024 | 176,065 | 207,167 | 19,469 | 156,596 | 1,652,311 | 6,982 | 8,390 | 255 | 6,068 | ||||||||||||||||||||||||||||||
SPDR Barclays High Yield Bond ETF | 53,170 | 1,351 | – | – | 1,351 | 52,162 | 500 | – | – | – | ||||||||||||||||||||||||||||||
SPDR Barclays Long Term Treasury ETF | 452,139 | 6,435 | 24,227 | 339 | 6,096 | 444,191 | 2,380 | 1,299 | – | – | ||||||||||||||||||||||||||||||
SPDR Barclays TIPS ETF | 38,818 | 694 | – | – | 694 | 38,850 | – | – | – | – | ||||||||||||||||||||||||||||||
State Street Aggregate Bond Index Portfolio | 553,452 | 54,893 | 45,424 | 4,501 | 50,392 | 510,932 | 896 | 322 | 532 | – | ||||||||||||||||||||||||||||||
State Street Global Equity ex-U.S. Index Portfolio | 1,495,501 | 159,120 | 115,947 | 12,548 | 146,572 | 1,343,361 | 4,164 | (5,275 | ) | – | – | |||||||||||||||||||||||||||||
42
Table of Contents
State Street Institutional Investment Trust
Notes to Financial Statements — (continued)
December 31, 2014
State Street Target | Purchased | Sold | Number of Shares Held at 12/31/14 | Value at 12/31/14 | Dividend Income | Realized Gain (Loss) | Short Term Capital Gains Distributions | Long Term Capital Gains Distributions | ||||||||||||||||||||||||||||||||
| Cost | Shares | Proceeds | Shares | |||||||||||||||||||||||||||||||||||||
State Street Institutional Liquid Reserves Fund, Premier Class | $ | 38,775 | 38,775 | $ | 20,428 | 20,428 | 18,347 | $ | 18,347 | $ | 16 | $ | – | $ | – | $ | – | |||||||||||||||||||||||
State Street Target | Purchased | Sold | Number of Shares Held at 12/31/14 | Value at 12/31/14 | Dividend Income | Realized Gain (Loss) | Short Term Capital Gains Distributions | Long Term Capital Gains Distributions | ||||||||||||||||||||||||||||||||
| Cost | Shares | Proceeds | Shares | |||||||||||||||||||||||||||||||||||||
SPDR Russell Small Cap Completeness ETF | $ | 601,148 | 7,217 | $ | 30,026 | 357 | 6,860 | $ | 578,847 | $ | 826 | $ | 508 | $ | 5,287 | $ | 3,751 | |||||||||||||||||||||||
State Street Equity 500 Index II Portfolio | 1,644,365 | 157,042 | 86,986 | 8,214 | 148,828 | 1,570,347 | 4,720 | 3,117 | 172 | 4,103 | ||||||||||||||||||||||||||||||
SPDR Barclays Long Term Treasury ETF | 409,872 | 5,793 | 8,703 | 125 | 5,668 | 413,004 | 1,920 | 248 | – | – | ||||||||||||||||||||||||||||||
State Street Aggregate Bond Index Portfolio | 300,575 | 29,800 | 3,715 | 367 | 29,433 | 298,421 | 392 | 37 | 213 | – | ||||||||||||||||||||||||||||||
State Street Global Equity ex-U.S. Index Portfolio | 1,380,990 | 147,518 | 17,784 | 1,911 | 145,607 | 1,334,522 | 2,932 | (679 | ) | – | – | |||||||||||||||||||||||||||||
State Street Institutional Liquid Reserves Fund, Premier Class | 37,324 | 37,324 | 22,197 | 22,197 | 15,127 | 15,127 | 17 | – | – | – | ||||||||||||||||||||||||||||||
State Street Target | Purchased | Sold | Number of Shares Held at 12/31/14 | Value at 12/31/14 | Dividend Income | Realized Gain (Loss) | Short Term Capital Gains Distributions | Long Term Capital Gains Distributions | ||||||||||||||||||||||||||||||||
| Cost | Shares | Proceeds | Shares | |||||||||||||||||||||||||||||||||||||
SPDR Russell Small Cap Completeness ETF | $ | 414,171 | 4,986 | $ | 18,840 | 224 | 4,762 | $ | 401,818 | $ | 972 | $ | 319 | $ | 6,222 | $ | 4,414 | |||||||||||||||||||||||
State Street Equity 500 Index II Portfolio | 981,339 | 94,593 | 45,704 | 4,324 | 90,269 | 952,462 | 4,763 | 1,554 | 174 | 4,141 | ||||||||||||||||||||||||||||||
SPDR Barclays Long Term Treasury ETF | 241,111 | 3,471 | 8,495 | 122 | 3,349 | 244,028 | 1,556 | 243 | – | – | ||||||||||||||||||||||||||||||
State Street Aggregate Bond Index Portfolio | 50,711 | 5,036 | 273 | 27 | 5,009 | 50,785 | 101 | 3 | 55 | – | ||||||||||||||||||||||||||||||
State Street Global Equity ex-U.S. Index Portfolio | 880,137 | 92,989 | 6,282 | 676 | 92,313 | 846,072 | 3,096 | (247 | ) | – | – | |||||||||||||||||||||||||||||
State Street Institutional Liquid Reserves Fund, Premier Class | 32,613 | 32,613 | 15,014 | 15,014 | 17,599 | 17,599 | 16 | – | – | – | ||||||||||||||||||||||||||||||
State Street Target | Purchased | Sold | Number of Shares Held at 12/31/14 | Value at 12/31/14 | Dividend Income | Realized Gain (Loss) | Short Term Capital Gains Distributions | Long Term Capital Gains Distributions | ||||||||||||||||||||||||||||||||
| Cost | Shares | Proceeds | Shares | |||||||||||||||||||||||||||||||||||||
SPDR Russell Small Cap Completeness ETF | $ | 169,502 | 2,050 | $ | 1,009 | 12 | 2,038 | $ | 171,966 | $ | 680 | $ | 17 | $ | 4,347 | $ | 3,084 | |||||||||||||||||||||||
State Street Equity 500 Index II Portfolio | 389,243 | 38,104 | 26,824 | 2,534 | 35,570 | 375,313 | 3,165 | 949 | 116 | 2,752 | ||||||||||||||||||||||||||||||
SPDR Barclays Long Term Treasury ETF | 104,013 | 1,534 | 13,057 | 186 | 1,348 | 98,223 | 894 | 477 | – | – | ||||||||||||||||||||||||||||||
State Street Global Equity ex-U.S. Index Portfolio | 364,667 | 37,853 | 7,084 | 761 | 37,092 | 339,958 | 2,087 | (263 | ) | – | – | |||||||||||||||||||||||||||||
State Street Institutional Liquid Reserves Fund, Premier Class | 22,494 | 22,494 | 11,400 | 11,400 | 11,094 | 11,094 | 10 | – | – | – | ||||||||||||||||||||||||||||||
43
Table of Contents
State Street Institutional Investment Trust
Notes to Financial Statements — (continued)
December 31, 2014
State Street Target | Purchased | Sold | Number of Shares Held at 12/31/14 | Value at 12/31/14 | Dividend Income | Realized Gain (Loss) | Short Term Capital Gains Distributions | Long Term Capital Gains Distributions | ||||||||||||||||||||||||||||||||
| Cost | Shares | Proceeds | Shares | |||||||||||||||||||||||||||||||||||||
SPDR Russell Small Cap Completeness ETF | $ | 87,167 | 1,053 | $ | 5,007 | 58 | 995 | $ | 83,958 | $ | 330 | $ | 212 | $ | 2,110 | $ | 1,497 | |||||||||||||||||||||||
State Street Equity 500 Index II Portfolio | 194,585 | 19,049 | 16,493 | 1,558 | 17,491 | 184,559 | 1,564 | 593 | 57 | 1,359 | ||||||||||||||||||||||||||||||
SPDR Barclays Long Term Treasury ETF | 54,743 | 806 | 9,815 | 140 | 666 | 48,529 | 432 | 346 | – | – | ||||||||||||||||||||||||||||||
State Street Global Equity ex-U.S. Index Portfolio | 181,362 | 18,820 | 5,453 | 580 | 18,240 | 167,174 | 1,031 | (152 | ) | – | – | |||||||||||||||||||||||||||||
State Street Institutional Liquid Reserves Fund, Premier Class | 18,661 | 18,661 | 13,241 | 13,241 | 5,420 | 5,420 | 5 | – | – | – | ||||||||||||||||||||||||||||||
State Street Target | Purchased | Sold | Number of Shares Held at 12/31/14 | Value at 12/31/14 | Dividend Income | Realized Gain (Loss) | Short Term Capital Gains Distributions | Long Term Capital Gains Distributions | ||||||||||||||||||||||||||||||||
| Cost | Shares | Proceeds | Shares | |||||||||||||||||||||||||||||||||||||
SPDR Russell Small Cap Completeness ETF | $ | 87,167 | 1,053 | $ | 5,008 | 58 | 995 | $ | 83,958 | $ | 330 | $ | 212 | $ | 2,110 | $ | 1,497 | |||||||||||||||||||||||
State Street Equity 500 Index II Portfolio | 194,585 | 19,048 | 16,493 | 1,557 | 17,491 | 184,559 | 1,564 | 593 | 57 | 1,359 | ||||||||||||||||||||||||||||||
SPDR Barclays Long Term Treasury ETF | 54,743 | 806 | 9,815 | 140 | 666 | 48,529 | 432 | 346 | – | – | ||||||||||||||||||||||||||||||
State Street Global Equity ex-U.S. Index Portfolio | 181,362 | 18,820 | 5,453 | 580 | 18,240 | 167,174 | 1,031 | (152 | ) | – | – | |||||||||||||||||||||||||||||
State Street Institutional Liquid Reserves Fund, Premier Class | 18,661 | 18,661 | 13,241 | 13,241 | 5,420 | 5,420 | 5 | – | – | – | ||||||||||||||||||||||||||||||
State Street Target | Purchased | Sold | Number of Shares Held at 12/31/14 | Value at 12/31/14 | Dividend Income | Realized Gain (Loss) | Short Term Capital Gains Distributions | Long Term Capital Gains Distributions | ||||||||||||||||||||||||||||||||
| Cost | Shares | Proceeds | Shares | |||||||||||||||||||||||||||||||||||||
SPDR Russell Small Cap Completeness ETF | $ | 86,735 | 1,048 | $ | 4,491 | 52 | 996 | $ | 84,042 | $ | 330 | $ | 191 | $ | 2,112 | $ | 1,499 | |||||||||||||||||||||||
State Street Equity 500 Index II Portfolio | 194,590 | 19,049 | 16,126 | 1,523 | 17,526 | 184,927 | 1,567 | 578 | 57 | 1,361 | ||||||||||||||||||||||||||||||
SPDR Barclays Long Term Treasury ETF | 54,391 | 801 | 9,403 | 134 | 667 | 48,602 | 436 | 340 | – | – | ||||||||||||||||||||||||||||||
State Street Global Equity ex-U.S. Index Portfolio | 181,384 | 18,823 | 5,141 | 548 | 18,275 | 167,497 | 1,032 | (148 | ) | – | – | |||||||||||||||||||||||||||||
State Street Institutional Liquid Reserves Fund, Premier Class | 16,976 | 16,976 | 11,541 | 11,541 | 5,435 | 5,435 | 5 | – | – | – | ||||||||||||||||||||||||||||||
44
Table of Contents
Report of Independent Registered Public Accounting Firm
To the Board of Trustees and Shareholders of
State Street Institutional Investment Trust:
We have audited the accompanying statements of assets and liabilities, including the portfolios of investments, of State Street Target Retirement Fund, State Street Target Retirement 2015 Fund, State Street Target Retirement 2020 Fund, State Street Target Retirement 2025 Fund, State Street Target Retirement 2030 Fund, State Street Target Retirement 2035 Fund, State Street Target Retirement 2040 Fund, State Street Target Retirement 2045 Fund, State Street Target Retirement 2050 Fund, State Street Target Retirement 2055 Fund and State Street Target Retirement 2060 Fund (eleven of the funds constituting State Street Institutional Investment Trust) (the “Funds”) as of December 31, 2014, and the related statements of operations and changes in net assets, and the financial highlights for the period from September 30, 2014 (commencement of operations) to December 31, 2014. These financial statements and financial highlights are the responsibility of the Funds’ management. Our responsibility is to express an opinion on these financial statements and financial highlights based on our audits.
We conducted our audits in accordance with the standards of the Public Company Accounting Oversight Board (United States). Those standards require that we plan and perform the audit to obtain reasonable assurance about whether the financial statements and financial highlights are free of material misstatement. We were not engaged to perform an audit of the Funds’ internal control over financial reporting. Our audits included consideration of internal control over financial reporting as a basis for designing audit procedures that are appropriate in the circumstances, but not for the purpose of expressing an opinion on the effectiveness of the Funds’ internal control over financial reporting. Accordingly, we express no such opinion. An audit also includes examining, on a test basis, evidence supporting the amounts and disclosures in the financial statements and financial highlights, assessing the accounting principles used and significant estimates made by management, and evaluating the overall financial statement presentation. Our procedures included confirmation of securities owned as of December 31, 2014, by correspondence with the custodian and others or by other appropriate auditing procedures where replies from others were not received. We believe that our audits provide a reasonable basis for our opinion.
In our opinion, the financial statements and financial highlights referred to above present fairly, in all material respects, the financial position of State Street Target Retirement Fund, State Street Target Retirement 2015 Fund, State Street Target Retirement 2020 Fund, State Street Target Retirement 2025 Fund, State Street Target Retirement 2030 Fund, State Street Target Retirement 2035 Fund, State Street Target Retirement 2040 Fund, State Street Target Retirement 2045 Fund, State Street Target Retirement 2050 Fund, State Street Target Retirement 2055 Fund and State Street Target Retirement 2060 Fund (eleven of the funds constituting State Street Institutional Investment Trust) at December 31, 2014, and the results of their operations, changes in their net assets and the financial highlights for the period from September 30, 2014 (commencement of operations) to December 31, 2014, in conformity with U.S. generally accepted accounting principles.

Boston, Massachusetts
March 2, 2015
45
Table of Contents
State Street Institutional Investment Trust
Other Information
December 31, 2014 (Unaudited)
As a shareholder of a Fund, you incur ongoing costs, which include costs for administrative services and to the extent applicable, distribution (12b-1) fees, among others. This example is intended to help you understand your ongoing costs (in dollars) of investing in the Fund and to compare these costs with the ongoing costs of investing in other mutual funds. It is based on an investment of $1,000 made at the beginning of the period shown and held for the entire period from July 1, 2014 to December 31, 2014.
The table below illustrates your Fund’s costs in two ways:
| • | Based on actual fund return – This section helps you to estimate the actual expenses that you paid over the period. The “Ending Account Value” shown is derived from each Fund’s actual return, and the third column shows the dollar amount that would have been paid by an investor who started with $1,000 in the Fund. You may use the information here, together with the amount you invested, to estimate the expenses that you paid over the period. To do so, simply divide your account value by $1,000 (for example, an $8,600 account value divided by $1,000 = 8.6), then multiply the result by the number given for the Fund under the heading “Expenses Paid During Period”. |
| • | Based on hypothetical 5% return – This section is intended to help you compare your Fund’s costs with those of other mutual funds. It assumes that the Fund had a yearly return of 5% before expenses, but that the expense ratio is unchanged. In this case, because the return used is not the Fund’s actual return, the results do not apply to your investment. The example is useful in making comparisons because the Securities and Exchange Commission requires all mutual funds to calculate expenses based on a 5% return. You can assess your Fund’s costs by comparing this hypothetical example with the hypothetical examples that appear in shareholder reports of other funds. |
| Annualized Expense Ratio | Beginning Account Value July 1, 2014 | Ending Account Value December 31, 2014 | Expenses Paid During the Period * | |||||||||||||
State Street Target Retirement Fund | ||||||||||||||||
Class A | 0.62 | % | ||||||||||||||
Actual** | $ | 1,000.00 | $ | 1,001.61 | $ | 1.57 | ||||||||||
Hypothetical*** | $ | 1,000.00 | $ | 1,012.71 | $ | 3.17 | ||||||||||
Class I | 0.37 | % | ||||||||||||||
Actual** | $ | 1,000.00 | $ | 1,001.76 | $ | 0.93 | ||||||||||
Hypothetical*** | $ | 1,000.00 | $ | 1,012.71 | $ | 1.89 | ||||||||||
Class K | 0.17 | % | ||||||||||||||
Actual** | $ | 1,000.00 | $ | 1,001.89 | $ | 0.43 | ||||||||||
Hypothetical*** | $ | 1,000.00 | $ | 1,012.71 | $ | 0.87 | ||||||||||
46
Table of Contents
State Street Institutional Investment Trust
Other Information — (continued)
December 31, 2014 (Unaudited)
| Annualized Expense Ratio | Beginning Account Value July 1, 2014 | Ending Account Value December 31, 2014 | Expenses Paid During the Period * | |||||||||||||
State Street Target Retirement 2015 Fund | ||||||||||||||||
Class A | 0.62 | % | ||||||||||||||
Actual** | $ | 1,000.00 | $ | 1,002.04 | $ | 1.57 | ||||||||||
Hypothetical*** | $ | 1,000.00 | $ | 1,012.71 | $ | 3.17 | ||||||||||
Class I | 0.37 | % | ||||||||||||||
Actual** | $ | 1,000.00 | $ | 1,002.19 | $ | 0.93 | ||||||||||
Hypothetical*** | $ | 1,000.00 | $ | 1,012.71 | $ | 1.89 | ||||||||||
Class K | 0.17 | % | ||||||||||||||
Actual** | $ | 1,000.00 | $ | 1,002.32 | $ | 0.43 | ||||||||||
Hypothetical*** | $ | 1,000.00 | $ | 1,012.71 | $ | 0.87 | ||||||||||
State Street Target Retirement 2020 Fund | ||||||||||||||||
Class A | 0.62 | % | ||||||||||||||
Actual** | $ | 1,000.00 | $ | 1,004.18 | $ | 1.57 | ||||||||||
Hypothetical*** | $ | 1,000.00 | $ | 1,012.71 | $ | 3.17 | ||||||||||
Class I | 0.37 | % | ||||||||||||||
Actual** | $ | 1,000.00 | $ | 1,004.34 | $ | 0.94 | ||||||||||
Hypothetical*** | $ | 1,000.00 | $ | 1,012.71 | $ | 1.89 | ||||||||||
Class K | 0.17 | % | ||||||||||||||
Actual** | $ | 1,000.00 | $ | 1,004.21 | $ | 0.43 | ||||||||||
Hypothetical*** | $ | 1,000.00 | $ | 1,012.71 | $ | 0.87 | ||||||||||
State Street Target Retirement 2025 Fund | ||||||||||||||||
Class A | 0.62 | % | ||||||||||||||
Actual** | $ | 1,000.00 | $ | 1,004.86 | $ | 1.57 | ||||||||||
Hypothetical*** | $ | 1,000.00 | $ | 1,012.71 | $ | 3.17 | ||||||||||
Class I | 0.37 | % | ||||||||||||||
Actual** | $ | 1,000.00 | $ | 1,005.02 | $ | 0.94 | ||||||||||
Hypothetical*** | $ | 1,000.00 | $ | 1,012.71 | $ | 1.89 | ||||||||||
Class K | 0.17 | % | ||||||||||||||
Actual** | $ | 1,000.00 | $ | 1,005.14 | $ | 0.43 | ||||||||||
Hypothetical*** | $ | 1,000.00 | $ | 1,012.71 | $ | 0.87 | ||||||||||
47
Table of Contents
State Street Institutional Investment Trust
Other Information — (continued)
December 31, 2014 (Unaudited)
| Annualized Expense Ratio | Beginning Account Value July 1, 2014 | Ending Account Value December 31, 2014 | Expenses Paid During the Period * | |||||||||||||
State Street Target Retirement 2030 Fund | ||||||||||||||||
Class A | 0.62 | % | ||||||||||||||
Actual** | $ | 1,000.00 | $ | 1,005.34 | $ | 1.57 | ||||||||||
Hypothetical*** | $ | 1,000.00 | $ | 1,012.71 | $ | 3.17 | ||||||||||
Class I | 0.37 | % | ||||||||||||||
Actual** | $ | 1,000.00 | $ | 1,005.49 | $ | 0.94 | ||||||||||
Hypothetical*** | $ | 1,000.00 | $ | 1,012.71 | $ | 1.89 | ||||||||||
Class K | 0.17 | % | ||||||||||||||
Actual** | $ | 1,000.00 | $ | 1,005.62 | $ | 0.43 | ||||||||||
Hypothetical*** | $ | 1,000.00 | $ | 1,012.71 | $ | 0.87 | ||||||||||
State Street Target Retirement 2035 Fund | ||||||||||||||||
Class A | 0.62 | % | ||||||||||||||
Actual** | $ | 1,000.00 | $ | 1,005.37 | $ | 1.57 | ||||||||||
Hypothetical*** | $ | 1,000.00 | $ | 1,012.71 | $ | 3.17 | ||||||||||
Class I | 0.37 | % | ||||||||||||||
Actual** | $ | 1,000.00 | $ | 1,005.55 | $ | 0.94 | ||||||||||
Hypothetical*** | $ | 1,000.00 | $ | 1,012.71 | $ | 1.89 | ||||||||||
Class K | 0.17 | % | ||||||||||||||
Actual** | $ | 1,000.00 | $ | 1,005.67 | $ | 0.43 | ||||||||||
Hypothetical*** | $ | 1,000.00 | $ | 1,012.71 | $ | 0.87 | ||||||||||
State Street Target Retirement 2040 Fund | ||||||||||||||||
Class A | 0.62 | % | ||||||||||||||
Actual** | $ | 1,000.00 | $ | 1,005.47 | $ | 1.57 | ||||||||||
Hypothetical*** | $ | 1,000.00 | $ | 1,012.71 | $ | 3.17 | ||||||||||
Class I | 0.37 | % | ||||||||||||||
Actual** | $ | 1,000.00 | $ | 1,005.62 | $ | 0.94 | ||||||||||
Hypothetical*** | $ | 1,000.00 | $ | 1,012.71 | $ | 1.89 | ||||||||||
Class K | 0.17 | % | ||||||||||||||
Actual** | $ | 1,000.00 | $ | 1,005.75 | $ | 0.43 | ||||||||||
Hypothetical*** | $ | 1,000.00 | $ | 1,012.71 | $ | 0.87 | ||||||||||
48
Table of Contents
State Street Institutional Investment Trust
Other Information — (continued)
December 31, 2014 (Unaudited)
| Annualized Expense Ratio | Beginning Account Value July 1, 2014 | Ending Account Value December 31, 2014 | Expenses Paid During the Period * | |||||||||||||
State Street Target Retirement 2045 Fund | ||||||||||||||||
Class A | 0.62 | % | ||||||||||||||
Actual** | $ | 1,000.00 | $ | 1,005.39 | $ | 1.57 | ||||||||||
Hypothetical*** | $ | 1,000.00 | $ | 1,012.71 | $ | 3.17 | ||||||||||
Class I | 0.37 | % | ||||||||||||||
Actual** | $ | 1,000.00 | $ | 1,005.55 | $ | 0.94 | ||||||||||
Hypothetical*** | $ | 1,000.00 | $ | 1,012.71 | $ | 1.89 | ||||||||||
Class K | 0.17 | % | ||||||||||||||
Actual** | $ | 1,000.00 | $ | 1,005.67 | $ | 0.43 | ||||||||||
Hypothetical*** | $ | 1,000.00 | $ | 1,012.71 | $ | 0.87 | ||||||||||
State Street Target Retirement 2050 Fund | ||||||||||||||||
Class A | 0.62 | % | ||||||||||||||
Actual** | $ | 1,000.00 | $ | 1,005.37 | $ | 1.57 | ||||||||||
Hypothetical*** | $ | 1,000.00 | $ | 1,012.71 | $ | 3.17 | ||||||||||
Class I | 0.37 | % | ||||||||||||||
Actual** | $ | 1,000.00 | $ | 1,005.55 | $ | 0.94 | ||||||||||
Hypothetical*** | $ | 1,000.00 | $ | 1,012.71 | $ | 1.89 | ||||||||||
Class K | 0.17 | % | ||||||||||||||
Actual** | $ | 1,000.00 | $ | 1,005.67 | $ | 0.43 | ||||||||||
Hypothetical*** | $ | 1,000.00 | $ | 1,012.71 | $ | 0.87 | ||||||||||
State Street Target Retirement 2055 Fund | ||||||||||||||||
Class A | 0.62 | % | ||||||||||||||
Actual** | $ | 1,000.00 | $ | 1,005.37 | $ | 1.57 | ||||||||||
Hypothetical*** | $ | 1,000.00 | $ | 1,012.71 | $ | 3.17 | ||||||||||
Class I | 0.37 | % | ||||||||||||||
Actual** | $ | 1,000.00 | $ | 1,005.55 | $ | 0.94 | ||||||||||
Hypothetical*** | $ | 1,000.00 | $ | 1,012.71 | $ | 1.89 | ||||||||||
Class K | 0.17 | % | ||||||||||||||
Actual** | $ | 1,000.00 | $ | 1,005.67 | $ | 0.43 | ||||||||||
Hypothetical*** | $ | 1,000.00 | $ | 1,012.71 | $ | 0.87 | ||||||||||
49
Table of Contents
State Street Institutional Investment Trust
Other Information — (continued)
December 31, 2014 (Unaudited)
| Annualized Expense Ratio | Beginning Account Value July 1, 2014 | Ending Account Value December 31, 2014 | Expenses Paid During the Period * | |||||||||||||
State Street Target Retirement 2060 Fund | ||||||||||||||||
Class A | 0.62 | % | ||||||||||||||
Actual** | $ | 1,000.00 | $ | 1,005.34 | $ | 1.57 | ||||||||||
Hypothetical*** | $ | 1,000.00 | $ | 1,012.71 | $ | 3.17 | ||||||||||
Class I | 0.37 | % | ||||||||||||||
Actual** | $ | 1,000.00 | $ | 1,005.49 | $ | 0.94 | ||||||||||
Hypothetical*** | $ | 1,000.00 | $ | 1,012.71 | $ | 1.89 | ||||||||||
Class K | 0.17 | % | ||||||||||||||
Actual** | $ | 1,000.00 | $ | 1,005.65 | $ | 0.43 | ||||||||||
Hypothetical*** | $ | 1,000.00 | $ | 1,012.71 | $ | 0.87 | ||||||||||
| * | Expenses are equal to the Fund’s annualized expense ratio (representing the six month period annualized), multiplied by the average account value over the period, multiplied by 184/365 (to reflect the one-half year period). Includes amounts waived, reimbursed and/or other credits. Without the waiver, reimbursement and/or other credits, expenses would have been higher. |
| ** | Actual period is from September 30, 2014 (commencement of operations). Hypothetical period is from July 1, 2014. |
| *** | 5% return per year before expenses |
50
Table of Contents
State Street Institutional Investment Trust
Other Information — (continued)
December 31, 2014 (Unaudited)
For federal tax income tax purposes, the following information is furnished with respect to the distributions from the Funds for the fiscal period ended December 31, 2014.
Long term capital gains dividends were paid from the following Funds during the period ended December 31, 2014:
| Amount | ||||
State Street Target Retirement 2020 Fund | $ | 638 | ||
State Street Target Retirement 2035 Fund | 3,487 | |||
State Street Target Retirement 2040 Fund | 6,275 | |||
State Street Target Retirement 2045 Fund | 4,386 | |||
State Street Target Retirement 2050 Fund | 1,876 | |||
State Street Target Retirement 2055 Fund | 1,875 | |||
State Street Target Retirement 2060 Fund | 1,849 | |||
Proxy Voting Policies and Procedures and Record
Information regarding the Funds’ proxy voting policies and procedures, as well as information regarding how the Funds voted proxies, if any, during the most recent 12-month period ended June 30 is available without charge (1) by calling 1-877-521-4083 (toll free), or (2) on the website of the U.S. Securities and Exchange Commission (“SEC”) at www.sec.gov.
The Funds file a complete schedule of portfolio holdings with the SEC for the first and third quarters of each fiscal year on Form N-Q. The Funds’ Forms N-Q are available on the SEC’s website at www.sec.gov and may be reviewed and copied at the SEC’s Public Reference Room in Washington, DC. Information on the operation of the Public Reference Room may be obtained by calling 1-800-SEC-0330. The information on Form N-Q is available upon request, without charge, by calling 1-877-521-4083 (toll-free).
Under the Investment Company Act of 1940, an investment advisory agreement between a mutual fund and its investment adviser or sub-adviser may continue in effect from year to year only if its continuance is approved at least annually by the fund’s board of trustees, including by a vote of a majority of those trustees who are not “interested persons” of the fund (commonly referred to as, the “Independent Trustees”) cast in person at a meeting called for the purpose of considering such approval.
51
Table of Contents
State Street Institutional Investment Trust
Other Information — (continued)
December 31, 2014 (Unaudited)
Consistent with these requirements, the Independent Trustees on the Board of Trustees (the “Board”) of the State Street Master Funds and State Street Institutional Investment Trust (each a “Trust” and together, the “Trusts”), met in Executive Sessions on March 20, 2014, April 14, 2014 and June 19, 2014 to consider a proposal to approve, with respect to each portfolio series of the each Trust (each, a “Fund” and collectively, the “Funds”), the initial approval an investment agreement and sub-advisory agreement for certain Funds and, for certain funds, the continuation of the investment advisory agreement and sub-advisory agreements, as applicable, with SSgA Funds Management, Inc. (the “Adviser”), and, for certain funds, CBRE Clarion Securities, LLC (the “Sub-Adviser”) (the “Advisory Agreements”). Prior to voting on the proposal, the Independent Trustees, as well as the Trustees who are “interested persons” of the Adviser, reviewed information furnished by the Adviser and Sub-Adviser and others reasonably necessary to permit the Board to evaluate the proposal fully. Such information included, among other things, the following:
Information about Performance, Expenses and Fees
| • | A report prepared by an independent provider of investment company data, which includes for each Fund: |
| • | Comparisons of the Fund’s performance over the past one-, three-, five- and ten-year periods ended March 31, 2014, as applicable, to the performance of an appropriate benchmark for the Fund and a universe of other mutual funds with similar investment objectives and policies; |
| • | Comparisons of the Fund’s expense ratio (with detail of component expenses) to the expense ratios of a group of comparable mutual funds selected by the independent data provider; |
| • | A chart showing the Fund’s historical average net assets relative to its total expenses, management fees, and non-management expenses over the past five years, as applicable; and |
| • | Comparisons of the Fund’s contractual management fee to the contractual management fees of comparable mutual funds at different asset levels. |
| • | Comparative information concerning fees charged by the Adviser for managing institutional accounts using investment strategies and techniques similar to those used in managing the Funds; and |
| • | Profitability analyses for (a) the Adviser with respect to each Fund and (b) affiliates of the Adviser that provide services to the Funds (“Affiliated Service Providers”). |
Information about Portfolio Management
| • | Descriptions of the investment management services provided by the Adviser and Sub-Adviser, as applicable, including their investment strategies and processes; |
| • | Information concerning the allocation of brokerage and the benefits received by the Adviser and Sub-Adviser, as applicable, as a result of brokerage allocation, including information concerning the acquisition of any research through “soft dollar” benefits received in connection with the Funds’ brokerage; and |
52
Table of Contents
State Street Institutional Investment Trust
Other Information — (continued)
December 31, 2014 (Unaudited)
| • | Information regarding the procedures and processes used to value the assets of the Funds and the assistance provided to the administrator of the Funds by the Adviser in monitoring the effectiveness of such procedures and processes. |
Information about the Adviser
| • | Reports detailing the financial results and condition of the Sub-Adviser, and Adviser and its affiliates; |
| • | Descriptions of the qualifications, education and experience of the individual investment professionals responsible for managing the portfolios of the Funds; |
| • | A copy of each Code of Ethics adopted by the Adviser and Sub-Adviser, together with information relating to compliance with and the administration of such Codes; |
| • | A copy of the Adviser’s and Sub-Adviser’s proxy voting policies and procedures; |
| • | Information concerning the resources devoted by the Adviser to overseeing compliance by the Funds and their service providers, including the Adviser’s record of compliance with investment policies and restrictions and other operating policies of the Funds; and |
| • | A description of the business continuity and disaster recovery plans of the Adviser and Sub-Adviser. |
Other Relevant Information
| • | Information concerning the nature, quality and cost of various non-investment management services provided to the Funds by affiliates of the Adviser, including the custodian, administrator, fund accountant, transfer agent and securities lending agent of the Funds, and the role of the Adviser in managing the Funds’ relationship with these service providers; |
| • | Copies of the Advisory Agreements, Sub-Advisory Agreements and agreements with other service providers of the Funds; |
| • | Draft responses to letter dated February 23, 2014 from Joseph P. Barri, LLC (counsel to the Independent Trustees reviewed prior to such date by Independent Counsel, requesting specific information, from each of: |
| • | The Adviser, with respect to its operations relating to the Funds and its approximate profit margins before taxes from such operations for the Funds’ last fiscal year; and the relevant operations of other affiliated service providers to the Funds, together with their approximate profit margins from such relevant operations for the Funds’ last fiscal year; |
| • | State Street Bank and Trust Company (“State Street”), the administrator, custodian, transfer agent, securities lending agent, and shareholder services for the Funds, with respect to its operations relating to the Funds; and |
| • | State Street Global Markets, LLC, the principal underwriter and distributor of the shares of the Funds (the “Distributor”), with respect to its operations relating to the Funds, together with the Funds’ related distribution plans and arrangements under SEC Rule 12b-1; |
53
Table of Contents
State Street Institutional Investment Trust
Other Information — (continued)
December 31, 2014 (Unaudited)
| • | Information from the Adviser, State Street and the Distributor with respect to State Street Master Funds and State Street Institutional Investment Trust providing any material changes to the previous information supplied in response to the letter dated February 23, 2014 from Joseph P. Barri, LLC prior to the Executive Session of the Board on June 19, 2014. |
| • | Excerpts from the Funds’ most recent prospectuses, statements of additional information and respective annual reports for the fiscal year ended December 31, 2013, including (i) the latest prospectus descriptions of each Fund’s investment objectives, strategies and authorized investment techniques and investments; and (ii) the latest Annual Shareholder Report for each Fund, including Portfolio Management Discussion of Performance, as prepared by its portfolio management team, together with a graphic comparison of the performance of each Fund with its benchmark index, for its fiscal year December 31, 2013; |
| • | Lipper materials dated March 2014, obtained by an Independent Trustee and circulated to the other Independent Trustees and to Independent Counsel, with respect to the Funds for which such materials were then available; and |
| • | A summary of the foregoing materials prepared by Independent Counsel. |
In addition to the information identified above, the Board considered information provided from time to time by the Adviser, and other service providers of the Funds throughout the year at meetings of the Board and its committees. At such meetings, the Trustees received, among other things, presentations by the portfolio managers and other investment professionals of the Adviser relating to the performance of the Funds and the investment strategies used in pursuing each Fund’s investment objective.
The Independent Trustees were assisted throughout the contract review process by their independent legal counsel. The Independent Trustees relied upon the advice of such counsel and their own business judgment in determining the material factors to be considered in evaluating the Advisory Agreement, and the weight to be given to each such factor. The conclusions reached with respect to the Advisory Agreement were based on a comprehensive evaluation of all the information provided and not any single factor. Moreover, each Trustee may have placed varying emphasis on particular factors in reaching conclusions with respect to each Fund.
Results of the Process
Based on a consideration of the foregoing and such other information as deemed relevant, including the factors and conclusions described below, on June 19, 2014 the Board, including a majority of the Independent Trustees, voted to approve the adoption of, as applicable, and the continuation of, as applicable, the Advisory Agreements and Sub-Advisory Agreements effective July 1, 2014, for an additional year with respect to all Funds.
Nature, Extent and Quality of Services
In considering whether to approve the Advisory Agreements and Sub-Advisory Agreements, the Board evaluated the nature, extent and quality of services provided to each Fund by the Adviser and Sub-Adviser, as applicable.
The Board considered the Adviser’s and Sub-Adviser’s, as applicable, management capabilities and investment process with respect to the types of investments held by each Fund, including the education,
54
Table of Contents
State Street Institutional Investment Trust
Other Information — (continued)
December 31, 2014 (Unaudited)
experience and number of investment professionals and other personnel who provide portfolio management, investment research, and similar services to the Fund. The Board evaluated, where relevant, the abilities and experience of such investment personnel in analyzing particular markets, industries and specific issuers of securities in these markets and industries. The Board also considered the substantial expertise of the Adviser and Sub-Adviser, as applicable, in developing and applying proprietary quantitative models for managing various Funds that invest primarily in equity securities. With respect to those Funds that invest primarily in fixed-income securities, the Board considered the extensive experience and resources committed by the Adviser to the evaluation of credit, interest-rate and currency risks. With respect to those Funds that operate as money market mutual funds, the Board considered the Adviser’s success in maintaining the constant dollar value of each Fund through extraordinary market conditions. The Board also took into account the compensation paid to recruit and retain investment personnel, and the time and attention devoted to the Funds by senior management.
The Board reviewed the compliance programs of the Adviser, Sub-Adviser and various affiliated service providers. Among other things, the Board considered compliance and reporting matters relating to personal trading by investment personnel, selective disclosure of portfolio holdings, late trading, frequent trading, portfolio valuation, business continuity, the allocation of investment opportunities and the voting of proxies. The Board also considered the role of the Adviser in monitoring each Fund’s securities lending activities.
On the basis of the foregoing and other relevant information, the Board concluded that the Adviser and Sub-Adviser, as applicable, can be expected to continue to provide, high quality investment management and related services for the Funds.
Fund Performance
The Board compared each Fund’s investment performance to the performance of an appropriate benchmark and universe of comparable mutual funds for various time periods ended March 31, 2014.
On the basis of the foregoing and other relevant information, the Board concluded that the performance of each operational Fund is satisfactory or better (a) by comparison to the performance of its peer group funds or (b) after considering steps taken by management to improve the performance of certain Funds.
Management Fees and Expenses
The Board reviewed the contractual investment advisory fee rates payable by each Fund and actual fees paid by each Fund, net of waivers. As part of its review, the Board considered each Fund’s management fee and total expense ratio (both before and after giving effect to any expense caps), as compared to a group of similarly managed funds selected by an independent data provider. The Board also considered the comparability of the fees charged and the services provided to each Fund by the Adviser to the fees charged and services provided to other clients of the Adviser, including institutional accounts. In addition, the Board considered the willingness of the Adviser to provide undertakings from time to time to waive fees or pay expenses of various Funds to limit the total expenses borne by shareholders of such Funds. The Board also considered the fees that Adviser pays to the Sub-Adviser for its services to the applicable Funds.
55
Table of Contents
State Street Institutional Investment Trust
Other Information — (continued)
December 31, 2014 (Unaudited)
On the basis of the foregoing and other relevant information, and in light of the nature, extent and quality of the services provided by the Adviser, the Board concluded that the fees and the expense ratio of each Fund compare favorably to the fees and expenses of similar mutual funds and are reasonable in relation to the services provided.
Profitability
The Board reviewed the level of profits realized by the Adviser and its affiliates in providing investment advisory and other services to each Fund and to all Funds as a group. The Board considered other direct and indirect benefits received by the Adviser and the Affiliated Service Providers in connection with their relationships with the Funds, including the benefits of research services that may be available to the Adviser as a result of securities transactions effected for the Funds and other investment advisory clients, together with the ranges of profitability of each of the Affiliated Service Providers with respect to their services to the Funds.
The Board concluded that the profitability of the Adviser with respect to each of the Funds, and the profitability range of each of the Affiliated Service Providers with respect to its services to the Funds, were reasonable in relation to the services provided.
Economies of Scale
In reviewing management fees and profitability, the Board also considered the extent to which the Adviser and its affiliates, on the one hand, and each Fund and all Funds as a group, on the other hand, can expect to realize benefits from economies of scale as the assets of the Funds increase. The Board acknowledged the difficulty in accurately measuring the benefits resulting from the economies of scale with respect to the management of any specific Fund or the Funds taken as a whole. The Board concluded that, in light of the current size of each Fund and all Funds as a group, the level of profitability of the Adviser and its affiliates with respect to each Fund and all Funds as a group over various time periods, and the comparatively low management fee and expense ratio of each Fund during these periods, it does not appear that the Adviser or its affiliates has realized benefits from economies of scale in managing the assets of the Funds to such an extent that previously agreed advisory fees should be reduced or that breakpoints in such fees should be implemented for any Fund at this time.
56
Table of Contents
State Street Institutional Investment Trust
Trustees and Officers Information
December 31, 2014
Name, Address, | Position(s) Held | Term of Office | Principal Occupation | Number of Funds in Fund Complex Overseen by Trustee | Other Directorships | |||||
Independent Trustees | ||||||||||
Michael F. Holland State Street Financial Center One Lincoln Street Boston, MA 02111-2900 YOB: 1944 | Trustee and Co-Chairman of the Board | Term: Indefinite Elected: 7/99 | Chairman, Holland & Company L.L.C. (investment adviser) (1995 – present). | 59 | Trustee, State Street Master Funds; Trustee SSGA Funds; Director, the Holland Series Fund, Inc.; Director, The China Fund, Inc.; Director, The Taiwan Fund, Inc.; Director, Reaves Utility Income Fund, Inc.; and Director, Blackstone/GSO Loan Funds. | |||||
Patrick J. Riley State Street Financial Center One Lincoln Street Boston, MA 02111-2900 YOB: 1948 | Trustee and Co-Chairman of the Board | Term: Indefinite Elected: 1/14 | 2002 to May 2010, Associate Justice of the Superior Court, Commonwealth of Massachusetts; 1985 to 2002, Partner, Riley, Burke & Donahue, L.L.P. (law firm); 1998 to Present, Independent Director, State Street Global Advisers Ireland, Ltd. (investment company); 1998 to Present, Independent Director, SSGA Liquidity plc (formerly, SSGA Cash Management Fund plc); January 2009 to Present, Independent Director, SSGA Fixed Income plc; and January 2009 to Present, Independent Director, SSGA Qualified Funds PLC. | 59 | Trustee, State Street Master Funds; Trustee SSGA Funds; Board Director and Chairman, SPDR Europe 1PLC Board (2011-Present); Board Director and Chairman, SPDR Europe II, PLC (2013- Present). | |||||
William L. Boyan State Street Financial Center One Lincoln Street Boston, MA 02111-2900 YOB: 1937 | Trustee and Co-Chairman of the Valuation Committee | Term: Indefinite Elected: 7/99 | President and Chief Operations Officer, John Hancock Financial Services (1959 – 1999). Mr. Boyan retired in 1999. Chairman Emeritus, Children’s Hospital, Boston, MA (1984 – 2011); Former Chairman, Boston Plan For Excellence, Boston Public Schools (1995 – 2010); Member of Advisory Board of Florida Atlantic University Lifelong Learning Society. | 59 | Trustee, State Street Master Funds; Trustee SSGA Funds; Former Trustee of Old Mutual South Africa Master Trust; Trustee, Children’s Hospital, Boston, MA. | |||||
William L. Marshall State Street Financial Center One Lincoln Street Boston, MA 02111-2900 YOB: 1942 | Trustee and Co-Chairman of the Audit Committee | Term: Indefinite Elected: 1/14 | April 2011 to Present, Chairman (until April 2011, Chief Executive Officer and President), Wm. L. Marshall Associates, Inc., Wm. L. Marshall Companies, Inc. and the Marshall Financial Group, Inc. (a registered investment adviser and provider of financial and related consulting services); Certified Financial Planner; Member, Financial Planners Association; Director, (2008 – 2014) Doylestown Health Foundation Board; and the Ann Silverman Community Clinic of Doylestown, PA. | 59 | Trustee, State Street Master Funds; Trustee SSGA Funds; Director, Marshall Financial Group, Inc. | |||||
57
Table of Contents
Name, Address, | Position(s) Held | Term of Office | Principal Occupation | Number of Funds in Fund Complex Overseen by Trustee | Other Directorships | |||||
Independent Trustees (continued) | ||||||||||
Richard D. Shirk State Street Financial Center One Lincoln Street Boston, MA 02111-2900 YOB: 1945 | Trustee and Co-Chairman of the Qualified Legal and Compliance Committee | Term: Indefinite Elected: 1/14 | March 2001 to April 2002, Chairman (1996 to March 2001, President and Chief Executive Officer), Cerulean Companies, Inc. (holding company) (Retired); 1992 to March 2001, President and Chief Executive Officer, Blue Cross Blue Shield of Georgia (health insurer, managed healthcare); 1998 to December 2008, Chairman, Board Member and December 2008 to Present, Investment Committee Member, Healthcare Georgia Foundation (private foundation); September 2002 to Present, Lead Director and Board Member, Amerigroup Corp. (managed health care); 1999 to Present, Board Member and (since 2001) Investment Committee Member, Woodruff Arts Center; and 2003 to 2009, Trustee, Gettysburg College. | 59 | Trustee, State Street Master Funds; Trustee SSGA Funds; Board member, AeroCare Holdings (privately held healthcare services company) (February 2003 – Present); Board member, Regenesis Biomedical (health care services) (April 2012 – Present). | |||||
Rina K. Spence State Street Financial Center One Lincoln Street Boston, MA 02111-2900 YOB: 1948 | Trustee and Co-Chairman of the Qualified Legal and Compliance Committee and Co-Chairman of the Governance Committee | Term: Indefinite Elected: 7/99 | President of SpenceCare International LLC (international healthcare consulting) (1999 – present); Chief Executive Officer, IEmily.com (health internet company) (2000 – 2001); Chief Executive Officer of Consensus Pharmaceutical, Inc. (1998 – 1999); Founder, President and Chief Executive Officer of Spence Center for Women’s Health (1994 – 1998); President and CEO Emerson Hospital (1984 – 1994); Trustee, Eastern Enterprise (utilities) (1988 – 2000). | 59 | Trustee, State Street Master Funds; Trustee SSGA Funds; Director, Berkshire Life Insurance Company of America (1993 – 2009); Director, IEmily.com, Inc. (2000 – 2010); and Trustee, National Osteoporosis Foundation (2005 – 2008). | |||||
Bruce D. Taber State Street Financial Center One Lincoln Street Boston, MA 02111-2900 YOB: 1943 | Trustee and Co-Chairman of the Valuation Committee and Co-Chairman of the Governance Committee | Term: Indefinite Elected: 1/14 | 1999 to Present, Partner, Zenergy LLC (a technology company providing Computer Modeling and System Analysis to the General Electric Power Generation Division); Until December 2008, Independent Director, SSGA Cash Management Fund plc; Until December 2008, Independent Director, State Street Global Advisers Ireland, Ltd. (investment companies); and Until August 1994, President, Alonzo B. Reed, Inc., (a Boston architect-engineering firm). | 59 | Trustee, State Street Master Funds; Trustee SSGA Funds | |||||
Douglas T. Williams State Street Financial Center One Lincoln Street Boston, MA 02111-2900 YOB: 1940 | Trustee and Co-Chairman of the Audit Committee | Term: Indefinite Elected: 7/99 | President, Oakmont Homeowners Association (2012 – 2013); President, Mariner Sands Chapel; Executive Vice President and member of Executive Committee, Chase Manhattan Bank (1987 – 1999); President, Boston Stock Exchange Depository Trust Company, 1981 – 1982. | 59 | Trustee, State Street Master Funds; Trustee SSGA Funds; Treasurer, Nantucket Educational Trust, (2002 – 2007). | |||||
58
Table of Contents
Name, Address, | Position(s) Held | Term of Office | Principal Occupation | Number of Funds in Fund Complex Overseen by Trustee | Other Directorships | |||||
Interested Trustees(1) | ||||||||||
Scott F. Powers State Street Financial Center One Lincoln Street Boston, MA 02111-2900 YOB: 1959 | Trustee | Term: Indefinite Elected Trustee: 1/14 | May 2008 to Present, President and Chief Executive Officer of State Street Global Advisors; 2001 – 2008, Chief Executive Officer of Old Mutual Asset Management; Board of Directors, United Way of Massachusetts Bay; Board of Directors of Middlesex School; Incorporator, Cardigan Mountain School | 59 | ||||||
James E. Ross SSGA Funds Management, Inc. State Street Financial Center One Lincoln Street Boston, MA 02111-2900 YOB: 1965 | Trustee | Term: Indefinite Elected Trustee: 2/07 | Chairman and Director, SSGA Funds Management, Inc. (2012 – present); President, SSGA Funds Management, Inc. (2005 – 2012); Executive Vice President and Senior Managing Director, State Street Global Advisors (2006 – present); and Principal, State Street Global Advisors (2006 – present). | 254 |
| (1) | Mr. Powers and Mr. Ross are Interested Trustees because of their employment by SSGA Funds Management, Inc., an affiliate of the Trust. |
Name, Address, | Position(s) Held | Term of Office | Principal Occupation | |||
Officers: | ||||||
Ellen M. Needham SSGA Funds Management, Inc. State Street Financial Center One Lincoln Street Boston, MA 02111-2900 YOB: 1967 | President | Term: Indefinite Elected: 10/12 | President and Director, SSGA Funds Management, Inc. (June 2012 – present); Chief Operating Officer, SSGA Funds Management, Inc. (May 2010 – June 2012); Senior Managing Director, SSGA Funds Management, Inc. (1992 – 2012) and Senior Managing Director, State Street Global Advisors (1992 – present).* | |||
Ann M. Carpenter SSGA Funds Management, Inc. State Street Financial Center One Lincoln Street Boston, MA 02111-2900 YOB: 1966 | Vice President | Term: Indefinite Elected: 10/12 | Chief Operating Officer, SSGA Funds Management, Inc. (April 2014 – present); Vice President, SSGA Funds Management, Inc. (2008 – present); Principal, State Street Global Advisors (2005 – 2008 – present).* | |||
Laura F. Dell State Street Bank and Trust Company 100 Huntington Avenue, CPH0326 Boston, MA 02116 | Treasurer | Term: Indefinite Elected: 11/10 | Vice President, State Street Bank and Trust Company (2002 – present).* | |||
Chad C. Hallett SSGA Funds Management, Inc. State Street Financial Center One Lincoln Street Boston, MA 02111-2900 | Assistant Treasurer | Term: Indefinite Elected: 09/11 | Vice President, State Street Global Advisors and SSGA Funds Management, Inc. (November 2014 – present); Vice President, State Street Bank and Trust Company (2001 – November 2014).* | |||
Caroline M. Connolly State Street Bank and Trust Company 100 Huntington Avenue, CPH0326 Boston, MA 02116 | Assistant Treasurer | Term: Indefinite Elected: 09/11 | Assistant Vice President, State Street Bank and Trust Company (2007 – present). |
59
Table of Contents
Name, Address, | Position(s) Held | Term of Office | Principal Occupation | |||
Officers: (continued) | ||||||
Brian Harris SSGA Funds Management, Inc. State Street Financial Center One Lincoln Street Boston, MA 02111 | Chief Compliance Officer | Term: Indefinite Elected: 11/13 | Vice President, State Street Global Advisors and SSGA Funds Management, Inc.( June 2013 – Present); Senior Vice President and Global Head of Investment Compliance, BofA Global Capital Management (September 2010 to May 2013); Director of Compliance, AARP Financial Inc. (July 2008 to August 2010). | |||
David K. James State Street Bank and Trust Company 100 Huntington Avenue, CPH0326 Boston, MA 02116 | Secretary | Term: Indefinite Elected: 4/13 | Managing Director and Managing Counsel, State Street Bank and Trust Company (2009 – present); Vice President and Counsel, PNC Global Investment Servicing (US), Inc. (2006 – 2009). | |||
Kristin Schantz State Street Bank and Trust Company 100 Huntington Avenue, CPH0326 Boston, MA 02116 | Assistant Secretary | Term: Indefinite Elected: 2/14 | Vice President and Counsel, State Street Bank and Trust Company (2013 – present); Vice President, Citi Fund Services Ohio, Inc. (2008 – 2013). |
| * | Served in various capacities and/or with various affiliated entities during noted time period. |
The Statement of Additional Information includes additional information about the Trustees and is available, without charge, upon request, by calling (toll free) 877-521-4083.
60
Table of Contents
Trustees
William L. Boyan
Michael F. Holland
William L. Marshall
Scott F. Powers
Patrick J. Riley
James E. Ross
Richard D. Shirk
Rina K. Spence
Bruce D. Taber
Douglas T. Williams
Investment Adviser
SSGA Funds Management, Inc.
State Street Financial Center
One Lincoln Street
Boston, MA 02111
Custodian and Administrator
State Street Bank and Trust Company
State Street Financial Center
One Lincoln Street
Boston, MA 02111
Independent Public Registered Accounting Firm
Ernst & Young LLP
200 Clarendon Street
Boston, MA 02116
Legal Counsel
Ropes & Gray LLP
800 Boylston Street
Boston, MA 02199
Transfer Agent
Boston Financial Data Services
Two Heritage Drive
North Quincy, MA 02171
Distributor
State Street Global Markets LLC
State Street Financial Center
One Lincoln Street
Boston, MA 02111
This report is for shareholder information. This is not a prospectus intended for use in the purchase or sale of shares of beneficial interest.
State Street Institutional Investment Trust State Street Bank and Trust Company P.O. Box 5049 Boston, MA 02206 | SSITTRAR IBG-14269 |
Table of Contents
| Item 2. | Code of Ethics. |
As of the end of the period covered by this report, State Street Institutional Investment Trust (the “Trust” or “Registrant”) has adopted a code of ethics, as defined in Item 2(b) of Form N-CSR, that applies to the Registrant’s principal executive officer, principal financial officer, principal accounting officer or controller, or persons performing similar functions, regardless of whether these individuals are employed by the registrant or a third party (the “Code”). That Code comprises written standards that are reasonably designed to deter wrongdoing and to promote: (1) honest and ethical conduct, including the ethical handling of actual or apparent conflicts of interest between personal and professional relationships; (2) full, fair, accurate, timely and understandable disclosure in reports and documents that a Registrant files with, or submits to, the U.S. Securities Exchange Commission (the “SEC”) and in other public communications made by a Registrant; (3) compliance with applicable laws and governmental rules and regulations; (4) the prompt internal reporting to an appropriate person or persons identified in the Code of violations of the Code; and (5) accountability for adherence to the Code. As of the end of the period covered by the report, the Code was combined with other mutual funds advised by SSGA Funds Management, Inc. (“SSGA FM”). The Registrant has not granted any waivers from any provisions of the Code during the covered period. A copy of the Registrant’s Code is filed as Exhibit 12(a)(1) to this Form N-CSR.
| Item 3. | Audit Committee Financial Expert. |
The Trust’s Board of Trustees (the “Board”) has determined that the Trust has the following “audit committee financial experts” as defined in Item 3(b) of Form N-CSR serving on its Audit Committee: Messrs. Michael F. Holland, William L. Boyan and Mr. Richard D. Shirk. Each of the audit committee financial experts is “independent” as that term is defined in Item 3(a)(2) of Form N-CSR.
An “audit committee financial expert” is not an “expert” for any purpose, including for purposes of Section 11 of the Securities Act of 1933, as a result of being designated as an “audit committee financial expert.” Further, the designation of a person as an “audit committee financial expert” does not mean that the person has any greater duties, obligations, or liability than those imposed on the person without the “audit committee financial expert” designation. Similarly, the designation of a person as an “audit committee financial expert” does not affect the duties, obligations, or liability of any other member of the Audit Committee or Board of Trustees.
| Item 4. | Principal Accountant Fees and Services. |
| (a) | Audit Fees |
For the fiscal years ended December 31, 2014 and December 31, 2013, the aggregate audit fees billed for professional services rendered by Ernst & Young LLP (“E&Y”), the Trust’s principal accountant, for the audit of the Trust’s annual
Table of Contents
| financial statements or services normally provided by E&Y in connection with the Trust’s statutory and regulatory filings and engagements were $285,425 and $82,600, respectively. |
| (b) | Audit-Related Fees |
For the fiscal years ended December 31, 2014 and December 31, 2013, there were no fees for assurance and related services by E&Y reasonably related to the performance of the audit of the Trust’s financial statements that were not reported under paragraph (a) of this Item.
| (c) | Tax Fees |
The aggregate tax fees billed for professional services rendered by E&Y for tax compliance, tax advice, and tax planning in the form of preparation of excise filings and income tax returns for the last two fiscal years ended December 31, 2014 and December 31, 2013 were $150,891 and $33,891, respectively.
| (d) | All Other Fees |
For the fiscal years ended December 31, 2014 and December 31, 2013, there were no fees billed for professional services rendered by E&Y for products and services provided by E&Y to the Trust, other than the services reported in paragraphs (a) through (c).
For the fiscal years ended December 31, 2014 and December 31, 2013, the aggregate fees for professional services rendered by E&Y for products and services provided by E&Y to SSGA Funds Management, Inc. (the “Adviser”) and any entity controlling, controlled by, or under common control with the Adviser that provides ongoing services to the Trust that (i) relate directly to the operations and financial reporting of the Trust and (ii) were pre-approved by the Trust’s audit committee were approximately $7,886,395 and $7,426,155, respectively.
| (e)(1) | Audit Committee Pre-Approval Policies and Procedures |
The Trust’s Audit Committee Charter states the following with respect to pre-approval procedures:
The Audit Committee shall have the following duties and powers:
| • | To pre-approve engagements by a Trust’s independent auditor for non-audit services to be rendered to the Fund’s investment adviser (not including any subadviser whose role is primarily portfolio management and is subcontracted with or overseen by another investment adviser), and any entity controlling, controlled by, or under common control with the investment adviser that provides ongoing services to the Fund, if the |
Table of Contents
engagement relates directly to the operations and financial reporting of the Fund; |
| • | To establish, if deemed necessary or appropriate as an alternative to Audit Committee pre-approval of services to be provided by the independent auditor as required by paragraph (b) above, policies and procedures to permit such services to be pre-approved by other means, such as by action of a designated member or members of the Audit Committee, subject to the requirement that the decision of any member to whom authority is delegated to pre-approve an activity shall be presented to the full Audit Committee at its next scheduled meeting; |
Alternate Pre-Approval Procedure:
| • | The Chairperson, or a Co-Chairperson, of the Audit Committee is authorized to pre-approve any engagement involving the Trust’s independent auditors to the same extent as the Audit Committee. Any pre-approval decision by the Chairperson, or a Co-Chairperson, under the foregoing authority shall be presented to the Audit Committee at its next scheduled meeting. |
| (e)(2) | Percentages of Services |
None of the services described in paragraphs (b) through (d) of this Item were performed in reliance on paragraph (c)(7)(i)(C) of Rule 2-01 of Regulation S-X during the period of time for which such rule was effective.
| (f) | Not applicable. |
| (g) | Total Fees Paid By Adviser and Certain Affiliates |
For the fiscal years ended December 31, 2014 and December 31, 2013, the aggregate non-audit fees billed by E&Y for services rendered to the Trust and the Adviser and any entity controlling, controlled by, or under common control with the Adviser that provided ongoing services to the Trust were approximately $22,200,000 and $19,400,000, respectively.
| (h) | E&Y notified the Trust’s Audit Committee of all non-audit services that were rendered by E&Y to the Adviser and any entity controlling, controlled by, or under common control with the Adviser that provides services to the Trust, which services were not required to be pre-approved pursuant to paragraph (c)(7)(ii) of Rule 2-01 of Regulation S-X, allowing the Trust’s Audit Committee to consider whether such services were compatible with maintaining E&Y’s independence. |
| Item 5. | Audit Committees of Listed Registrants. |
Not applicable to the Registrant.
Table of Contents
| Item 6. | Schedule of Investments. |
(a) Schedule of Investments is included as part of Item 1 of this Form N-CSR.
(b) Not applicable.
| Item 7. | Disclosure of Proxy Voting Policies and Procedures for Closed-End Management Investment Companies. |
Not applicable to the Registrant.
| Item 8. | Portfolio Managers of Closed-End Management Investment Companies. |
Not applicable to the Registrant.
| Item 9. | Purchases of Equity Securities by Closed-End Management Investment Company and Affiliated Purchasers. |
Not applicable to the Registrant.
| Item 10. | Submission of Matters to a Vote of Security Holders. |
The Board of Trustees approved an Amended and Restated Nominating Committee Charter (the “Charter”) at their February 13, 2014 Board Meeting. The Charter contains procedures related to how shareholders are to submit recommendations for Trustee candidates to the Trusts. Those procedures are as follows:
Procedures for Shareholders to Submit Nominee Candidates
(As of February 13, 2014)
A shareholder of the Trust, or of any series thereof, if applicable, must follow the following procedures in order to submit properly a nominee recommendation for the Nominating Committee’s consideration.
| 1. | The shareholder must submit any such recommendation (a “Shareholder Recommendation”) in writing to the Trust, to the attention of the Trust’s Secretary, at the address of the principal executive offices of the Trust. |
| 2. | The Shareholder Recommendation must be delivered to, or mailed and received at, the principal executive offices of the Trust not less than sixty (60) calendar days nor more than ninety (90) calendar days prior to the date of the Board or shareholder meeting at which the nominee candidate would be considered for election. Shareholder Recommendations will be kept on file for two years after receipt of the Shareholder Recommendation. A Shareholder Recommendation considered by the Nominating Committee in connection with the Nominating Committee’s nomination of any candidate(s) for appointment or election as an independent Trustee need not be considered again by the Nominating Committee in connection with any subsequent nomination(s). |
| 3. | The Shareholder Recommendation must include: (i) a statement in writing setting forth (A) the name, age, date of birth, business address, residence address and nationality of the person |
Table of Contents
| recommended by the shareholder (the “candidate”), and the names and addresses of at least three professional references; (B) the number of all shares of the Trust (including the series and class, if applicable) owned of record or beneficially by the candidate, the date such shares were acquired and the investment intent of such acquisition(s), as reported to such shareholder by the candidate; (C) any other information regarding the candidate called for with respect to director nominees by paragraphs (a), (d), (e) and (f) of Item 401 of Regulation S-K or paragraph (b) of Item 22 of Rule 14a-101 (Schedule 14A) under the Securities Exchange Act of 1934, as amended (the “Exchange Act”), adopted by the Securities and Exchange Commission (or the corresponding provisions of any applicable regulation or rule subsequently adopted by the Securities and Exchange Commission or any successor agency with jurisdiction related to the Trust); (D) any other information regarding the candidate that would be required to be disclosed if the candidate were a nominee in a proxy statement or other filing required to be made in connection with solicitation of proxies for election of directors pursuant to Section 14 of the Exchange Act and the rules and regulations promulgated thereunder or any other applicable law or regulation; and (E) whether the recommending shareholder believes that the candidate is or will be an “interested person” of the Trust (as defined in the Investment Company Act of 1940, as amended) and, if not an “interested person,” information regarding the candidate that will be sufficient, in the discretion of the Board or the Nominating Committee, for the Trust to make such determination; (ii) the written and signed consent of the candidate to be named as a nominee and to serve as a Trustee if elected; (iii) the recommending shareholder’s name as it appears on the Trust’s books; (iv) the number of all shares of the Trust (including the series and class, if applicable) owned beneficially and of record by the recommending shareholder; (v) a complete description of all arrangements or understandings between the recommending shareholder and the candidate and any other person or persons (including their names) pursuant to which the recommendation is being made by the recommending shareholder including, without limitation, all direct and indirect compensation and other material monetary agreements, arrangements and understandings between the candidate and recommending shareholder during the past three years, and (vi) a brief description of the candidate’s relevant background and experience for membership on the Board, such as qualification as an audit committee financial expert. |
| 4. | The Nominating Committee may require the recommending shareholder to furnish such other information as it may reasonably require or deem necessary to verify any information furnished pursuant to paragraph 3 above or to determine the eligibility of the candidate to serve as a Trustee of the Trust or to satisfy applicable law. If the recommending shareholder fails to provide such other information in writing within seven days of receipt of a written request from the Nominating Committee, the recommendation of such candidate as a nominee will be deemed not properly submitted for consideration, and the Nominating Committee will not be required to consider such candidate. |
| Item 11. | Controls and Procedures. |
(a) The Trust’s principal executive officer and principal financial officer have concluded that the Trust’s disclosure controls and procedures (as defined in Rule 30a-3(c) under the Investment Company Act of 1940, as amended (the “1940 Act”)) are effective to provide reasonable assurance that information required to be disclosed by the registrant on Form N-CSR is recorded, processed, summarized and reported as of a date within 90 days of the filing date of this report, that includes the disclosure required by this paragraph, based on their evaluation of these controls and procedures required by Rule 30a-3(b) under the 1940 Act and Rules 13a-15(b) or 15d-15(b) under the Securities Exchange Act of 1934.
Table of Contents
(b) There were no changes in the Trust’s internal control over financial reporting (as defined in Rule 30a-3(d) under the 1940 Act) that occurred during the Trust’s second fiscal quarter of the period covered by this Form N-CSR filing that has materially affected, or is reasonably likely to materially affect, the Trust’s internal control over financial reporting.
| Item 12. | Exhibits. |
(a)(1) Code of Ethics pursuant to Item 2 of Form N-CSR is attached hereto.
(a)(2) Certifications of principal executive officer and principal financial and accounting officer of the Trust as required by Rule 30a-2(a) under the 1940 Act are attached hereto.
(a)(3) Not applicable to the Registrant.
(b) Certifications of principal executive officer and principal financial and accounting officer of the Trust as required by Rule 30a-2(b) under the 1940 Act and Section 906 of the Sarbanes-Oxley Act of 2002 are attached hereto.
Table of Contents
SIGNATURES
Pursuant to the requirements of the Securities Exchange Act of 1934 and the Investment Company Act of 1940, the Registrant has duly caused this report to be signed on its behalf by the undersigned, thereunto duly authorized.
Registrant: STATE STREET INSTITUTIONAL INVESTMENT TRUST
| By: | /s/ Ellen M. Needham | |
| Ellen M. Needham | ||
| President |
Date: March 11, 2015
Pursuant to the requirements of the Securities Exchange Act of 1934 and the Investment Company Act of 1940, this report has been signed below by the following persons on behalf of the Registrant and in the capacities and on the dates indicated.
| By: | /s/ Ellen M. Needham | |
| Ellen M. Needham | ||
| President (Principal Executive Officer) | ||
| Date: | March 11, 2015 | |
| By: | /s/ Laura Dell | |
| Laura Dell | ||
| Treasurer (Principal Financial and Accounting Officer) | ||
| Date: | March 11, 2015 | |