Table of Contents
UNITED STATES
SECURITIES AND EXCHANGE COMMISSION
Washington, D.C. 20549
FORM N-CSR
CERTIFIED SHAREHOLDER REPORT OF REGISTERED
MANAGEMENT INVESTMENT COMPANIES
Investment Company Act file number: 811-09819
STATE STREET INSTITUTIONAL INVESTMENT TRUST
(Exact name of registrant as specified in charter)
P.O. Box 5501
Boston, Massachusetts 02206
(Address of principal executive offices)(Zip code)
| (Name and Address of Agent for Service) | Copy to: | |
Joshua A. Weinberg, Esq. Vice President and Managing Counsel SSGA Funds Management, Inc. One Lincoln Street Boston, Massachusetts 02111 | Timothy W. Diggins, Esq. Ropes & Gray 800 Boylston Street Boston, Massachusetts 02110-2624 |
Registrant’s telephone number, including area code: (617) 664-7037
Date of fiscal year end: December 31
Date of reporting period: December 31, 2015
Table of Contents
Item 1. Shareholder Reports.
Table of Contents
Annual Report
31 December 2015
State Street Institutional Investment Trust
State Street Institutional Liquid Reserves Fund

Table of Contents
State Street Institutional Investment Trust
State Street Institutional Liquid Reserves Fund
Annual Report
December 31, 2015
| 1 | ||||
| 2 | ||||
| 3 | ||||
| 4 | ||||
| 6 | ||||
| 12 | ||||
| 13 | ||||
| 15 | ||||
| 16 | ||||
Table of Contents
State Street Institutional Investment Trust
State Street Institutional Liquid Reserves Fund
Statement of Assets and Liabilities
December 31, 2015
Assets | ||||
Investments in corresponding Portfolio, at market value and cost (Note 1) | $ | 47,149,123,775 | ||
Receivable for Fund shares sold | 3,043,572 | |||
Due from Affiliate (Note 3) | 925,062 | |||
Receivable from Adviser (Note 3) | 58,152 | |||
Prepaid expenses and other assets | 74,335 | |||
|
| |||
Total assets | 47,153,224,896 | |||
|
| |||
Liabilities | ||||
Administration and custody fees payable (Note 3) | 1,994,211 | |||
Due to custodian | 925,062 | |||
Registration and filing fees payable | 580,206 | |||
Shareholder servicing fee payable (Note 3) | 96,130 | |||
Distribution fees payable (Note 3) | 38,450 | |||
Transfer agent fees payable | 5,185 | |||
Dividends payable | 1,303,061 | |||
Accrued expenses and other liabilities | 34,711 | |||
|
| |||
Total liabilities | 4,977,016 | |||
|
| |||
Net Assets | $ | 47,148,247,880 | ||
|
| |||
Net Assets Consist of: | ||||
Paid-in capital | $ | 47,148,148,132 | ||
Accumulated net realized gain | 99,748 | |||
|
| |||
Net Assets | $ | 47,148,247,880 | ||
|
| |||
Net Assets | ||||
Premier Class | $ | 45,207,441,608 | ||
|
| |||
Investment Class | $ | 485,292,113 | ||
|
| |||
Class M Shares | $ | 1,455,514,159 | ||
|
| |||
Shares of Beneficial Interest Outstanding | ||||
Premier Class | 45,207,377,000 | |||
|
| |||
Investment Class | 485,271,391 | |||
|
| |||
Class M Shares | 1,455,497,412 | |||
|
| |||
Offering, Net Asset Value, and Redemption Price Per Share | ||||
Premier Class | $ | 1.00 | ||
|
| |||
Investment Class | $ | 1.00 | ||
|
| |||
Class M Shares | $ | 1.00 | ||
|
|
See accompanying notes to financial statements and financial statements of the corresponding portfolio.
1
Table of Contents
State Street Institutional Investment Trust
State Street Institutional Liquid Reserves Fund
Year Ended December 31, 2015
Income | ||||
Interest income allocated from Portfolio (Note 2) | $ | 96,747,688 | ||
Expenses allocated from Portfolio (Note 2) | (26,520,629 | ) | ||
|
| |||
| 70,227,059 | ||||
|
| |||
Expenses | ||||
Administration and custody fees (Note 3) | 19,989,023 | |||
Shareholder servicing fee – Investment Class (Note 3) | 1,021,286 | |||
Printing fees | 99,653 | |||
Distribution fees – Investment Class (Note 3) | 408,514 | |||
Registration and filing fees | 77,168 | |||
Transfer agent fees (Note 3) | 59,546 | |||
Professional fees | 28,223 | |||
Trustees’ fees and expenses | 19,133 | |||
Other expenses | 807,362 | |||
|
| |||
Total expenses | 22,509,908 | |||
Shareholder servicing fees waived – Investment Class (Note 3) | (541,028 | ) | ||
Distribution fees waived – Investment Class (Note 3) | (408,514 | ) | ||
|
| |||
Net expenses | 21,560,366 | |||
|
| |||
Net Investment Income | 48,666,693 | |||
|
| |||
Net realized gain on investments allocated from Portfolio | 158,273 | |||
|
| |||
Net Increase in Net Assets Resulting from Operations | $ | 48,824,966 | ||
|
|
See accompanying notes to financial statements and financial statements of the corresponding portfolio.
2
Table of Contents
State Street Institutional Investment Trust
State Street Institutional Liquid Reserves Fund
Statements of Changes in Net Assets
| Year Ended December 31, 2015 | Year Ended December 31, 2014 | |||||||
Increase (Decrease) in Net Assets Resulting from: | ||||||||
Operations: | ||||||||
Net investment income | $ | 48,666,693 | $ | 28,786,736 | ||||
Net realized gain on investments allocated from Portfolio | 158,273 | 198,661 | ||||||
|
|
|
| |||||
Net increase in net assets from operations | 48,824,966 | 28,985,397 | ||||||
|
|
|
| |||||
Distributions to Shareholders from: | ||||||||
Net investment income | ||||||||
Premier Class | (46,325,536 | ) | (26,599,363 | ) | ||||
Class M Shares | (2,599,150 | ) | (2,186,566 | ) | ||||
|
|
|
| |||||
Total distributions | (48,924,686 | ) | (28,785,929 | ) | ||||
|
|
|
| |||||
Net Increase (Decrease) from Capital Share Transactions: | ||||||||
Premier Class | ||||||||
Shares sold | 343,115,810,381 | 353,923,706,878 | ||||||
Reinvestment of distributions | 38,372,463 | 21,491,940 | ||||||
Shares redeemed | (335,879,414,180 | ) | (345,862,628,800 | ) | ||||
|
|
|
| |||||
Net increase from capital share transactions | 7,274,768,664 | 8,082,570,018 | ||||||
|
|
|
| |||||
Investment Class | ||||||||
Shares sold | 1,644,487,418 | 4,696,526,177 | ||||||
Shares redeemed | (1,886,106,932 | ) | (4,982,772,495 | ) | ||||
|
|
|
| |||||
Net decrease from capital share transactions | (241,619,514 | ) | (286,246,318 | ) | ||||
|
|
|
| |||||
Class M Shares | ||||||||
Shares sold | 13,547,257,128 | 17,170,761,953 | ||||||
Reinvestment of distributions | 2,600,751 | 2,186,586 | ||||||
Shares redeemed | (13,720,665,910 | ) | (18,371,959,020 | ) | ||||
|
|
|
| |||||
Net decrease from capital share transactions | (170,808,031 | ) | (1,199,010,481 | ) | ||||
|
|
|
| |||||
Net Increase in Net Assets | 6,862,241,399 | 6,597,512,687 | ||||||
Net Assets | ||||||||
Beginning of year | 40,286,006,481 | 33,688,493,794 | ||||||
|
|
|
| |||||
End of year | $ | 47,148,247,880 | $ | 40,286,006,481 | ||||
|
|
|
| |||||
Undistributed (Distributions in excess of) net investment income | $ | – | $ | 807 | ||||
|
|
|
| |||||
Changes in Shares: | ||||||||
Premier Class | ||||||||
Shares sold | 343,115,810,381 | 353,923,706,878 | ||||||
Reinvestment of distributions | 38,372,463 | 21,491,940 | ||||||
Shares redeemed | (335,879,414,180 | ) | (345,862,628,800 | ) | ||||
|
|
|
| |||||
Net increase in shares | 7,274,768,664 | 8,082,570,018 | ||||||
|
|
|
| |||||
Investment Class | ||||||||
Shares sold | 1,644,487,418 | 4,696,526,177 | ||||||
Shares redeemed | (1,886,106,932 | ) | (4,982,772,495 | ) | ||||
|
|
|
| |||||
Net decrease in shares | (241,619,514 | ) | (286,246,318 | ) | ||||
|
|
|
| |||||
Class M Shares | ||||||||
Shares sold | 13,547,257,128 | 17,170,761,953 | ||||||
Reinvestment of distributions | 2,600,751 | 2,186,586 | ||||||
Shares redeemed | (13,720,665,910 | ) | (18,371,959,020 | ) | ||||
|
|
|
| |||||
Net decrease in shares | (170,808,031 | ) | (1,199,010,481 | ) | ||||
|
|
|
| |||||
See accompanying notes to financial statements and financial statements of the corresponding portfolio.
3
Table of Contents
State Street Institutional Investment Trust
State Street Institutional Liquid Reserves Fund
Selected data for a share of beneficial interest outstanding throughout each year is presented below(a):
Period Ended December 31, | Net Asset Value Beginning of Period | Net Investment Income/(Loss) | Gain (Loss) on Investments | Total from Investment Operations | Distributions from Net Investment Income | Distributions from Capital Gains | Total Distributions | |||||||||||||||||||||
Premier Class | ||||||||||||||||||||||||||||
2015 | $ | 1.0000 | $ | 0.0012 | $ | 0.0000 | (d) | $ | 0.0012 | $ | (0.0012 | ) | $ | – | $ | (0.0012 | ) | |||||||||||
2014 | $ | 1.0000 | $ | 0.0008 | $ | (0.0001 | ) | $ | 0.0007 | $ | (0.0007 | ) | $ | – | $ | (0.0007 | ) | |||||||||||
2013 | $ | 1.0000 | $ | 0.0010 | $ | 0.0000 | (d) | $ | 0.0010 | $ | (0.0010 | ) | $ | (0.0000 | )(d) | $ | (0.0010 | ) | ||||||||||
2012 | $ | 1.0000 | $ | 0.0020 | $ | 0.0000 | (d) | $ | 0.0020 | $ | (0.0020 | ) | $ | (0.0000 | )(d) | $ | (0.0020 | ) | ||||||||||
2011 | $ | 1.0000 | $ | 0.0015 | $ | 0.0000 | (d) | $ | 0.0015 | $ | (0.0015 | ) | $ | – | $ | (0.0015 | ) | |||||||||||
Investment Class | ||||||||||||||||||||||||||||
2015 | $ | 1.0000 | $ | 0.0000 | (d) | $ | 0.0000 | (d) | $ | 0.0000 | (d) | $ | – | $ | – | $ | – | |||||||||||
2014 | $ | 1.0000 | $ | 0.0000 | (d) | $ | 0.0000 | (d) | $ | 0.0000 | (d) | $ | – | $ | – | $ | – | |||||||||||
2013 | $ | 1.0000 | $ | 0.0000 | (d) | $ | 0.0000 | (d) | $ | 0.0000 | (d) | $ | (0.0000 | )(d) | $ | (0.0000 | )(d) | $ | (0.0000 | )(d) | ||||||||
2012 | $ | 1.0000 | $ | 0.0000 | (d) | $ | 0.0000 | (d) | $ | 0.0000 | (d) | $ | (0.0000 | )(d) | $ | (0.0000 | )(d) | $ | (0.0000 | )(d) | ||||||||
2011 | $ | 1.0000 | $ | 0.0000 | (d) | $ | 0.0000 | (d) | $ | 0.0000 | (d) | $ | – | $ | – | $ | – | |||||||||||
Class M | ||||||||||||||||||||||||||||
2015 | $ | 1.0000 | $ | 0.0014 | $ | 0.0000 | (d) | $ | 0.0014 | $ | (0.0014 | ) | $ | – | $ | (0.0014 | ) | |||||||||||
2014 | $ | 1.0000 | $ | 0.0009 | $ | 0.0000 | (d) | $ | 0.0009 | $ | (0.0009 | ) | $ | – | $ | (0.0009 | ) | |||||||||||
2013 | $ | 1.0000 | $ | 0.0012 | $ | 0.0000 | (d) | $ | 0.0012 | $ | (0.0012 | ) | $ | (0.0000 | )(d) | $ | (0.0012 | ) | ||||||||||
2012 | $ | 1.0000 | $ | 0.0022 | $ | 0.0000 | (d) | $ | 0.0022 | $ | (0.0022 | ) | $ | (0.0000 | )(d) | $ | (0.0022 | ) | ||||||||||
2011(f) | $ | 1.0000 | $ | 0.0001 | $ | 0.0000 | (d) | $ | 0.0001 | $ | (0.0001 | ) | $ | – | $ | (0.0001 | ) | |||||||||||
| (a) | The per share amounts and percentages include the Fund’s proportionate share of income and expenses of the corresponding Portfolio. |
| (b) | Total return is calculated assuming a purchase of shares at net asset value on the first day and a sale at net asset value on the last day of each period reported. Distributions are assumed, for the purpose of this calculation, to be reinvested at net asset value per share on the respective payment dates. Total return for periods of less than one year are not annualized. Results represent past performance and are not indicative of future results. |
| (c) | This expense waiver is reflected in both the net operating expense and the net investment income ratios shown above. Without these waivers, net investment income would have been lower. |
| (d) | Amount is less than $0.00005 per share. |
| (e) | Amount is less than 0.005%. |
| (f) | The Fund’s Class M Shares commenced operations on December 15, 2011. |
| ** | Annualized. |
See accompanying notes to financial statements and financial statements of the corresponding portfolio.
4
Table of Contents
Period Ended December 31, | Net Asset Value End of Period | Ratios to Average Net Assets/Supplemental Data(a) | Net Assets End of Period (000s omitted) | |||||||||||||||||||||||||
| Total Return(b) | Gross Expenses | Net Expenses | Net Investment Income | Expense Waiver(c) | ||||||||||||||||||||||||
Premier Class | ||||||||||||||||||||||||||||
2015 | $ | 1.0000 | 0.12 | % | 0.12 | % | 0.12 | % | 0.12 | % | – | $ | 45,207,442 | |||||||||||||||
2014 | $ | 1.0000 | 0.07 | % | 0.12 | % | 0.12 | % | 0.07 | % | – | $ | 37,932,781 | |||||||||||||||
2013 | $ | 1.0000 | 0.10 | % | 0.12 | % | 0.12 | % | 0.10 | % | – | $ | 29,850,029 | |||||||||||||||
2012 | $ | 1.0000 | 0.20 | % | 0.12 | % | 0.12 | % | 0.20 | % | – | $ | 24,408,802 | |||||||||||||||
2011 | $ | 1.0000 | 0.15 | % | 0.12 | % | 0.12 | % | 0.15 | % | – | $ | 19,597,264 | |||||||||||||||
Investment Class | ||||||||||||||||||||||||||||
2015 | $ | 1.0000 | 0.00 | %(e) | 0.47 | % | 0.24 | % | 0.00 | %(e) | 0.23 | % | $ | 485,292 | ||||||||||||||
2014 | $ | 1.0000 | 0.00 | %(e) | 0.47 | % | 0.19 | % | 0.00 | %(e) | 0.28 | % | $ | 726,910 | ||||||||||||||
2013 | $ | 1.0000 | 0.00 | %(e) | 0.47 | % | 0.22 | % | 0.00 | %(e) | 0.25 | % | $ | 1,013,152 | ||||||||||||||
2012 | $ | 1.0000 | 0.00 | %(e) | 0.47 | % | 0.32 | % | 0.00 | %(e) | 0.15 | % | $ | 961,168 | ||||||||||||||
2011 | $ | 1.0000 | 0.00 | %(e) | 0.46 | % | 0.27 | % | 0.00 | %(e) | 0.19 | % | $ | 992,736 | ||||||||||||||
Class M | ||||||||||||||||||||||||||||
2015 | $ | 1.0000 | 0.14 | % | 0.10 | % | 0.10 | % | 0.14 | % | – | $ | 1,455,514 | |||||||||||||||
2014 | $ | 1.0000 | 0.09 | % | 0.10 | % | 0.10 | % | 0.09 | % | – | $ | 1,626,315 | |||||||||||||||
2013 | $ | 1.0000 | 0.12 | % | 0.10 | % | 0.10 | % | 0.12 | % | – | $ | 2,825,313 | |||||||||||||||
2012 | $ | 1.0000 | 0.22 | % | 0.10 | % | 0.10 | % | 0.22 | % | – | $ | 1,897,611 | |||||||||||||||
2011(f) | $ | 1.0000 | 0.01 | % | 0.10 | %** | 0.10 | %** | 0.17 | %** | – | $ | 2,012,117 | |||||||||||||||
See accompanying notes to financial statements and financial statements of the corresponding portfolio.
5
Table of Contents
State Street Institutional Investment Trust
State Street Institutional Liquid Reserves Fund
December 31, 2015
1. Organization
State Street Institutional Investment Trust (the “Trust”) is registered under the Investment Company Act of 1940, as amended (the “1940 Act”), as an open-end management investment company, and was organized as a business trust under the laws of the Commonwealth of Massachusetts on February 16, 2000. The Trust consists of forty-five (45) series and corresponding classes, each of which have the same rights and privileges, including the same voting rights. Each series is authorized to issue an unlimited number of shares, with no par value. The financial statements herein relate to the following fund (the “Fund”).:
| Fund | Classes | Commencement of Operations: | ||
State Street Institutional Liquid Reserves Fund | Administration Class Class M Shares Premier Class Service Class Institutional Class Investment Class Investor Class | Not commenced December 15, 2011 August 12, 2004 Not commenced Not commenced October 15, 2007 Not commenced |
The Fund is part of a master-feeder investment structure and invests all of its investable assets in interests of its master portfolio (the “Portfolio”) as reflected in the table below. The investment objective and policies of the Portfolio are substantially similar to those of the Fund. The value of the Fund’s investment in its Portfolio reflects the Fund’s proportionate interest in the net assets of the Portfolio. The performance of the Fund is directly affected by the performance of the Portfolio. The financial statements of the Portfolio, including its Schedule of Investments, are attached to this report and should be read in conjunction with the Fund’s financial statements.
| Fund | % Investment in Master | Portfolio | ||
State Street Institutional Liquid | 98.88% | State Street Money Market Portfolio* |
| * | A series of the State Street Master Funds |
The State Street Institutional Liquid Reserves Fund is considered to be a money market fund pursuant to Rule 2a-7 under the 1940 Act. It is the Fund’s policy, as a money market fund, to maintain a stable net asset value per share of $1.00. However, there is no assurance the Fund will be able to maintain a stable net asset value per share.
An investment in the Fund is not insured or guaranteed by the Federal Deposit Insurance Corporation or any other government agency. Although the Fund seeks to preserve the value of shareholders’ investment at $1.00 per share, it is possible to lose money by investing in the Fund.
Under the Trust’s organizational documents, its officers and trustees are indemnified against certain liabilities arising out of the performance of their duties to the Trust. Additionally, in the normal course of business, the Trust enters into contracts with service providers that contain general indemnification clauses. The Trust’s maximum exposure under these arrangements is unknown as this could involve future claims that may be made against the Trust that have not yet occurred.
6
Table of Contents
State Street Institutional Investment Trust
State Street Institutional Liquid Reserves Fund
Notes to Financial Statements — (continued)
December 31, 2015
| 2. | Summary of Significant Accounting Policies |
The following is a summary of significant accounting policies followed by the Trust in the preparation of its financial statements:
The preparation of financial statements in accordance with U.S. generally accepted accounting principles (“U.S. GAAP”) requires management to make estimates and assumptions that affect the reported amounts and disclosures in the financial statements. Actual results could differ from those estimates. The Fund is an investment company under U.S. GAAP and follows the accounting and reporting guidance applicable to investment companies in Financial Accounting Standards Board (“FASB”) Accounting Standards Codification (“ASC”) 946, Financial Services Investment Companies (“ASC 946”).
Security Valuation – The Fund records its investment in the Portfolio at value. The valuation policy of the Portfolio is discussed in Note 2 of the Portfolio’s Notes to Financial Statements, which are attached to this report.
The Portfolio’s investments are valued at fair value each day that the Portfolio’s listing exchange is open and, for financial reporting purposes, as of the report date should the reporting period end on a day that the Portfolio’s listing exchange is not open. Fair value is generally defined as the price a fund would receive to sell an asset or pay to transfer a liability in an orderly transaction between market participants at the measurement date. By its nature, a fair value price is a good faith estimate of the valuation in a current sale and may not reflect an actual market price. The investments of the Portfolio are valued pursuant to the policy and procedures developed by the Oversight Committee (the “Committee”) and approved by the Board of Trustees of the Trust (the “Board”). The Committee provides oversight of the valuation of investments for the Fund. The summary of the inputs used for the Portfolio, as of December 31, 2015, in valuing the Portfolio’s assets carried at fair value are discussed in Note 2 of the Portfolio’s Notes to Financial Statements, which are attached to this report.
Investment Transactions and Income Recognition – Investment transactions are accounted for on trade date for financial reporting purposes. Net investment income consists of the Fund’s pro-rata share of the net investment income of the Portfolio, less all expenses of the Fund. Dividends from net investment income are declared daily and are payable as of the last business day of each month. Realized gains and losses from security transactions consist of the Fund’s pro-rata share of the Portfolio’s realized gains and losses. Distributions from capital gains, if any, are distributed annually. Class specific distribution and shareholder servicing fees are borne by each class. Income, non-class specific expenses, and realized gains and losses are allocated to the respective classes daily on the basis of relative net assets.
Expenses – Certain expenses, which are directly identifiable to a specific fund, are applied to that fund within the Trust. Other expenses which cannot be attributed to a specific fund are allocated in such a manner as deemed equitable, taking into consideration the nature and type of expense and the relative net assets of the funds within the Trust.
Federal income taxes – The Fund has qualified and intends to continue to qualify for and elect treatment as a “regulated investment company” under Subchapter M of the Internal Revenue Code of 1986, as amended. By so qualifying and electing, the Fund will not be subject to federal income taxes to
7
Table of Contents
State Street Institutional Investment Trust
State Street Institutional Liquid Reserves Fund
Notes to Financial Statements — (continued)
December 31, 2015
the extent it distributes its taxable income, including any net realized capital gains, for each fiscal year. In addition, by distributing during each calendar year substantially all of its net investment income and capital gains, if any, the Fund will not be subject to federal excise tax. Income and capital gain distributions, if any, are determined in accordance with income tax regulation which may differ from U.S. GAAP.
At December 31, 2015, the cost of investments for federal income tax purposes was substantially the same as the cost for financial reporting purposes.
SSGA Funds Management, Inc. (“SSGA FM” or the “Adviser) has reviewed the Fund’s tax positions for the open tax years as of December 31, 2015, and has determined that no provision for income tax is required in the Fund’s financial statements. The Fund’s federal tax returns for the prior three fiscal years remain subject to examination by the Fund’s major tax jurisdictions, which include the United States of America and the Commonwealth of Massachusetts. The Fund recognizes interest and penalties, if any, related to tax liabilities as income tax expense in the Statements of Operations. No income tax returns are currently under examination. Management has analyzed tax laws and regulations and their applications to the Fund’s facts and circumstances and does not believe there are any uncertain tax positions that require recognition of tax liability.
For the year ended December 31, 2015, permanent differences identified and reclassified among the components of net assets were as follows:
Paid-In Capital | Accumulated Gain (Loss) | Undistributed Net Investment Income (Loss) | ||||||||||
State Street Institutional Liquid Reserves Fund | $ | – | $ | (257,186 | ) | $ | 257,186 | |||||
These differences were primarily attributable to distribution redesignations, net operating loss, non-deductible tax paid and distributions in excess of current earnings. Net investment income (loss), net realized gains (losses), and net assets were not affected by this reclassification.
The tax character of distributions paid to shareholders during the years ended December 31, 2015, and December 31, 2014, was as follows:
| December 31, 2015 | December 31, 2014 | |||||||||||||||||||||||
Ordinary Income | Tax Exempt Income | Long Term Capital Gain | Ordinary Income | Tax Exempt Income | Long Term Capital Gain | |||||||||||||||||||
State Street Institutional Liquid Reserves Fund | $ | 48,924,686 | $ | – | $ | – | $ | 28,785,929 | $ | – | $ | – | ||||||||||||
At December 31, 2015, the components of distributable earnings on a tax basis were as follows:
| Undistributed Ordinary Income | Undistributed Tax Exempt Income | Capital Loss Carryover | Total | |||||||||||||
State Street Institutional Liquid Reserves Fund | $ | 99,748 | $ | – | $ | – | $ | 99,748 | ||||||||
8
Table of Contents
State Street Institutional Investment Trust
State Street Institutional Liquid Reserves Fund
Notes to Financial Statements — (continued)
December 31, 2015
| 3. | Related Party and Other Fees |
The Portfolio retained SSGA FM, a subsidiary of State Street Corporation and an affiliate of State Street Bank and Trust Company (“State Street”), as its investment adviser. The Portfolio has entered into an investment advisory agreement with the Adviser, under which the Adviser directs the investments of the Portfolio in accordance with its investment objectives, policies, and limitations. In compensation for the Adviser’s services as investment adviser, the Portfolio pays the Adviser a management fee at an annual rate of 0.05% of its average daily net assets.
The Adviser is contractually obligated until April 30, 2016, to waive its management fee and/or to reimburse the Fund for expenses to the extent that total annual fund operating expenses (exclusive of non-recurring account fees, extraordinary expenses, acquired fund fees and any class specific expenses such as Distribution, Shareholder Servicing, Administration and Sub-Transfer Agency Fees, as measured on an annualized basis) exceed 0.07% of average daily net assets on an annual basis. This waiver and/or reimbursement may not be terminated during the relevant period except with approval of the Board. For the year ended December 31, 2015, SSGA FM did not reimburse or waive any expenses.
Additionally, the Adviser may reimburse expenses or waive fees in order to avoid a negative yield. Any such waiver or reimbursement would be voluntary and may be revised or cancelled at any time without notice. For the year ended December 31, 2015, SSGA FM did not voluntarily waive any expenses.
Under the terms of the reimbursement agreement the Fund agrees to repay SSGA FM up to the amount of fees waived or expenses reduced under the agreement provided that a Fund is not obligated to reimburse SSGA FM (1) more than three years after the end of the fiscal year of the Fund in which SSGA FM provided a voluntary reduction; (2) in respect of any business day for which the net annualized one-day yield of such Fund is less than 0.00%; (3) to the extent that the amount of the reimbursement to SSGA FM on any day exceeds fifty percent of the yield (net of all expenses, exclusive of the reimbursement) of the Fund on that day; (4) to the extent that the amount of the reimbursement would cause the Fund’s net yield to fall below a certain minimum net yield; or (5) in respect of any such fee waivers and/or expense reimbursements that are necessary to maintain a limit on a Fund’s expenses per contractual fee waivers and/or reimbursements by SSGA FM which are effective at the time of such fee waivers and/or expense reimbursements. As of December 31, 2015, SSGA FM has not recouped any expenses from the Fund. The Fund had no waived/reduced fees subject to potential recovery at year-end.
Pursuant to the administration agreement, the Fund, except Class M Shares, pays a fee at an annual rate of 0.05% of its net assets accrued daily to SSGA FM. Class M Shares pay a fee at an annual rate of 0.03% of its net assets accrued daily to SSGA FM. During the year ended December 31, 2015, the Fund incurred the following administration fees:
| Class | Amount | |||
Premier Class | $ | 19,195,781 | ||
Investment Class | 204,257 | |||
Class M | 576,296 | |||
The Fund pays State Street an annual fee for custody and accounting services. Pursuant to the sub-administration agreement, SSGA FM pays an annual fee to State Street for services provided for the Fund.
9
Table of Contents
State Street Institutional Investment Trust
State Street Institutional Liquid Reserves Fund
Notes to Financial Statements — (continued)
December 31, 2015
The Fund’s Investment Class has adopted a plan of distribution pursuant to Rule 12b-1 under the 1940 Act (the “Rule 12b-1 Plan”). Under the Rule 12b-1 Plan, the Fund compensates financial intermediaries in connection with the distribution of Fund shares and for services provided to the Fund’s shareholders. The Fund’s Investment Class Shares may make payments under the Rule 12b-1 Plan at an annual rate up to 0.10% of eligible average daily net assets of the Investment Class Shares. State Street Global Markets LLC (“SSGM” or the “Distributor”), a subsidiary of State Street Corporation, is the Fund’s Distributor.
During the year ended December 31, 2015, the Fund was charged $408,514 but did not make any payments to SSGM under the Rule 12b-1 Plan, as SSGM voluntarily agreed to waive the entire amount of the Rule 12b-1 fees.
Wealth Management Services (“WMS”), a division of State Street, is among the financial intermediaries who may receive fees under the Rule 12b-1 Plan. During the year ended December 31, 2015, SSGM did not make any payments to WMS.
Under the Fund’s Shareholder Servicing Plan, the Fund compensates financial intermediaries for providing certain services to shareholders and for maintaining shareholder accounts. The Fund’s Investment Class Shares made payments under the Shareholder Servicing Plan at an annual rate up to 0.25% of the eligible average daily net assets of the Investment Class Shares. During the year ended December 31, 2015, the Fund paid SSGM $684,929 under the shareholder servicing agreement which SSGM subsequently paid to financial intermediaries.
During the year ended December 31, 2015, SSGM voluntarily agreed to waive shareholder services fees of $541,028.
WMS is among the financial intermediaries who may receive fees under the shareholder serving agreement. For the year ended December 31, 2015, WMS received payment of $573,521.
Boston Financial Data Services (“BFDS”), a joint venture of DST Systems, Inc. and State Street Corporation, serves as transfer agent and dividend paying agent to the Fund. For these services, the Fund pays annual account services fees, activity-based fees, and charges related to compliance and regulatory services.
The custodian will reimburse the Fund in the amount of $925,062, in connection with an excess expense payment made from the Fund to the custodian on December 31, 2015. This amount is contained within Due from Affiliate on the Statement of Assets and Liabilities.
| 4. | Trustees’ Fees |
Independent Trustees are compensated on a calendar year basis. Any Trustee who is deemed to be an “interested person” (as defined in the 1940 Act) of the Fund does not receive compensation from the Fund for his or her service as a Trustee.
Each Independent Trustee receives for his or her services to the State Street Master Funds, State Street Institutional Investment Trust and SSGA Funds, a $141,500 annual base retainer in addition to $18,000 for each in-person meeting and $2,000 for each telephonic meeting from the Trust. The Co-Chairmen each receive an additional $44,000 annual retainer. The Independent Trustees are reimbursed for travel
10
Table of Contents
State Street Institutional Investment Trust
State Street Institutional Liquid Reserves Fund
Notes to Financial Statements — (continued)
December 31, 2015
and other out-of-pocket expenses in connection with meeting attendance. Trustees’ fees and expenses are allocated among the Trusts and funds overseen by the Trustees in a manner deemed equitable taking into consideration the relative net assets of the funds, subject to a $15,000 minimum per fund. As of the date of this Shareholder Report, the Trustees were not paid pension or retirement benefits as part of Trust’s expenses. However, the Trust has, pursuant to an exemptive order from the SEC, implemented an optional deferred compensation plan by which the Independent Trustees may defer receipt of compensation and receive a return on the deferred amount determined with reference to the performance of shares of specified State Street Institutional Investment Trust series. As of the fiscal year ended December 31, 2015, none of the Independent Trustees participated in the optional deferred compensation program.
The Trust’s officers are compensated by the Adviser and its affiliates.
| 5. | Rule Issuance |
On July 23, 2014, the U.S. Securities and Exchange Commission (the “SEC”) adopted amendments to the governing rules for money market funds. The amendments require that, following a two-year implementation timeframe, institutional prime and institutional tax exempt money market funds adopt a floating net asset value. The rule changes also allow for certain liquidity-based redemption fees and gate, and include enhanced requirements for disclosure and stress testing. The degree to which a money market fund will be impacted by the rule amendments will depend upon the type of fund and type of investors (retail or institutional). At this time, management is evaluating the implications of these amendments and their impact to the Fund’s financial statements and related disclosure.
| 6. | Subsequent Events |
Management has evaluated the impact of all subsequent events on the Fund through the date the financial statements were available to be issued and has determined that there were no subsequent events requiring adjustment or disclosure in the financial statements.
11
Table of Contents
Report of Independent Registered Public Accounting Firm
To the Board of Trustees and Shareholders of
State Street Institutional Investment Trust:
We have audited the accompanying statement of assets and liabilities of State Street Institutional Liquid Reserves Fund (one of the funds constituting State Street Institutional Investment Trust) (the “Fund”) as of December 31, 2015, and the related statement of operations for the year then ended, the statements of changes in net assets for each of the two years in the period then ended, and the financial highlights for each of the five years in the period then ended. These financial statements and financial highlights are the responsibility of the Fund’s management. Our responsibility is to express an opinion on these financial statements and financial highlights based on our audits.
We conducted our audits in accordance with the standards of the Public Company Accounting Oversight Board (United States). Those standards require that we plan and perform the audit to obtain reasonable assurance about whether the financial statements and financial highlights are free of material misstatement. We were not engaged to perform an audit of the Fund’s internal control over financial reporting. Our audits included consideration of internal control over financial reporting as a basis for designing audit procedures that are appropriate in the circumstances, but not for the purpose of expressing an opinion on the effectiveness of the Fund’s internal control over financial reporting. Accordingly, we express no such opinion. An audit also includes examining, on a test basis, evidence supporting the amounts and disclosures in the financial statements and financial highlights, assessing the accounting principles used and significant estimates made by management, and evaluating the overall financial statement presentation. We believe that our audits provide a reasonable basis for our opinion.
In our opinion, the financial statements and financial highlights referred to above present fairly, in all material respects, the financial position of the State Street Institutional Liquid Reserves Fund (one of the funds constituting State Street Institutional Investment Trust) at December 31, 2015, the results of its operations for the year then ended, the changes in its net assets for each of the two years in the period then ended, and the financial highlights for each of the periods indicated therein, in conformity with U.S. generally accepted accounting principles.

Boston, Massachusetts
February 26, 2016
12
Table of Contents
State Street Institutional Investment Trust
State Street Institutional Liquid Reserves Fund
Other Information
December 31, 2015 (Unaudited)
SHAREHOLDER EXPENSE EXAMPLE
As a shareholder of a fund, you incur two types of costs: (1) transaction costs, and (2) ongoing costs, including administration fees; distribution (12b-1) and/or service fees; and other fund expenses. This example is intended to help you understand your ongoing costs (in dollars) of investing in the Fund and to compare these costs with the ongoing costs of investing in other mutual funds. It is based on an investment of $1,000 made at the beginning of the period shown and held for the entire period from July 1, 2015 to December 31, 2015.
The table below illustrates your Fund’s costs in two ways:
| • | Actual Expenses. This section helps you to estimate the actual expenses that you paid over the period. The “Ending Account Value” shown is derived from the Fund’s actual return, and the third column shows the dollar amount that would have been paid by an investor who started with $1,000 in the Fund. You may use the information here, together with the amount you invested, to estimate the expenses that you paid over the period. To do so, simply divide your account value by $1,000 (for example, an $8,600 account value divided by $1,000 = 8.6), then multiply the result by the number given for the Fund under the heading “Expenses Paid During Period.” |
| • | Hypothetical Example for Comparison Purposes. This section is intended to help you compare your Fund’s costs with those of other mutual funds. It assumes that the Fund had a yearly return of 5% before expenses, but that the expense ratio is unchanged. In this case, because the return used is not the Fund’s actual return, the results do not apply to your investment. The example is useful in making comparisons because the Securities and Exchange Commission requires all mutual funds to calculate expenses based on a 5% return. You can assess your Fund’s costs by comparing this hypothetical example with the hypothetical examples that appear in shareholder reports of other funds. |
Six Months Ended December 31, 2015
| Beginning Account Value July 1, 2015 | Ending Account Value December 31, 2015 | Expenses Paid During Period* | ||||||||||
Premier Class Shares | ||||||||||||
Based on Actual Fund Return | $ | 1,000.00 | $ | 1,001.40 | $ | 0.61 | ||||||
Based on Hypothetical (5% return before expenses) | $ | 1,000.00 | $ | 1,024.60 | $ | 0.61 | ||||||
Investment Class Shares | ||||||||||||
Based on Actual Fund Return | $ | 1,000.00 | $ | 1,000.00 | $ | 1.31 | ||||||
Based on Hypothetical (5% return before expenses) | $ | 1,000.00 | $ | 1,023.89 | $ | 1.33 | ||||||
13
Table of Contents
State Street Institutional Investment Trust
State Street Institutional Liquid Reserves Fund
Other Information — (continued)
December 31, 2015 (Unaudited)
SHAREHOLDER EXPENSE EXAMPLE — (continued)
| Beginning Account Value July 1, 2015 | Ending Account Value December 31, 2015 | Expenses Paid During Period* | ||||||||||
Class M Shares | ||||||||||||
Based on Actual Fund Return | $ | 1,000.00 | $ | 1,001.60 | $ | 0.50 | ||||||
Based on Hypothetical (5% return before expenses) | $ | 1,000.00 | $ | 1,024.70 | $ | 0.51 | ||||||
| * | The calculations are based on expense incurred in the most recent six month period of the Fund. The annualized average weighted expense ratio as of December 31, 2015, which includes the Fund’s proportionate share of the expenses of the Portfolio, was 0.12%, 0.26% and 0.10%, for the Premier Class, Investment Class and Class M, respectively. |
| The dollar amount shown as “Expenses Paid” is equal to the annualized average weighted expense ratio multiplied by the average account value over the period, multiplied by 184/365 (the most recent six month period). |
14
Table of Contents
State Street Institutional Investment Trust
State Street Institutional Liquid Reserves Fund
Shareholder Requests for Additional Information
December 31, 2015 (Unaudited)
Proxy Voting Policies and Procedures and Record
The Fund has adopted the proxy voting policies of the Adviser. A description of the policies and procedures that the Fund has adopted to determine how to vote proxies relating to portfolio securities are contained in the Fund’s Statement of Additional Information, which is available (i) without charge, upon request, by calling the Funds at 1-877-521-4083, (ii) on the Fund’s website at www.SSGA.com/cash, (iii) on the U.S. Securities and Exchange Commission’s website at www.sec.gov, or (iv) at the U.S. Securities and Exchange Commission’s public reference room. Information on the operation of the public reference room may be obtained by calling 1-800-SEC-0330. Information regarding the Trust’s proxy voting policies and procedures, as well as information regarding how the Trust voted proxies, if any, during the most recent 12-month period ended June 30 is available without charge (1) by calling 1-877-521-4083 (toll free), or (2) on the website of the Securities and Exchange Commission (“SEC”) at www.sec.gov.
Quarterly Portfolio Schedule
The Fund will file its complete schedule of investments with the U.S. Securities and Exchange Commission for the first and third quarters of each fiscal year on Form N-Q. For the second and fourth quarters, the complete schedule of investments is available in the Fund’s semi-annual and annual financial statements. The Fund’s Form N-Q is available (i) without charge, upon request, by calling the Fund at 1-877-521-4083, (ii) on the Fund’s website at www.SSGA.com/cash, (iii) on the Securities and Exchange Commission’s website at www.sec.gov, or (iv) at the Securities and Exchange Commission’s public reference room. Information on the operation of the public reference room may be obtained by calling 1-800-SEC-0330.
Monthly Portfolio Schedule
The Fund files its monthly portfolio holdings with the U.S. Securities and Exchange Commission on Form N-MFP. The SEC delays the public availability of the information filed on Form N-MFP for 60 days after the end of the reporting period included in the filing. The Fund’s Form N-MFP is available (i) on the U.S. Securities and Exchange Commission’s website at www.sec.gov, or ii) at the Securities and Exchange Commission’s public reference room.
15
Table of Contents
State Street Institutional Investment Trust
State Street Institutional Liquid Reserves Fund
Disclosure of Information about Fund Trustees and Officers
December 31, 2015 (Unaudited)
Name, Address, and Year of Birth | Position(s) Held | Term of Office Time Served | Principal Occupation During Past Five Years and Relevant Experience | Number of Funds in Fund Complex Overseen by Trustee | Other Directorships Held by Trustee During Past Five Years | |||||
Independent Trustees | ||||||||||
Michael F. Holland State Street Bank and 100 Huntington Avenue, CPH 0326 Boston, MA 02116 YOB: 1944 | Trustee and Co-Chairman of the Board | Term: Indefinite Elected: 7/99 | Chairman, Holland & Company L.L.C. (investment adviser) (1995 – present). | 75 | Director, the Holland Series Fund, Inc.; Director, The China Fund, Inc.; Director, The Taiwan Fund, Inc.; Director, Reaves Utility Income Fund, Inc.; and Director, Blackstone/GSO Loan Funds. | |||||
Patrick J. Riley State Street Bank and 100 Huntington Avenue, CPH 0326 Boston, MA 02116 YOB: 1948 | Trustee and Co-Chairman of the Board | Term: Indefinite Elected:1/14 | 2002 to May 2010, Associate Justice of the Superior Court, Commonwealth of Massachusetts; 1985 to 2002, Partner, Riley, Burke & Donahue, L.L.P. (law firm); 1998 to Present, Independent Director, State Street Global Advisers Ireland, Ltd. (investment company); 1998 to Present, Independent Director, SSGA Liquidity plc (formerly, SSGA Cash Management Fund plc); January 2009 to Present, Independent Director, SSGA Fixed Income plc; and January 2009 to Present, Independent Director, SSGA Qualified Funds PLC. | 75 | Board Director and Chairman, SPDR Europe 1PLC Board (2011 – Present); Board Director and Chairman, SPDR Europe II, PLC (2013 – Present). | |||||
William L. Boyan State Street Bank and 100 Huntington Avenue, CPH 0326 Boston, MA 02116 YOB: 1937 | Trustee and Co-Chairman of the Valuation Committee | Term: Indefinite Elected: 7/99 | President and Chief Operations Officer, John Hancock Financial Services (1959 – 1999). Mr. Boyan retired in 1999. Chairman Emeritus, Children’s Hospital, Boston, MA (1984 – 2011); Former Trustee of Old Mutual South Africa Master Trust (investments) (1995 – 2008); Former Chairman, Boston Plan For Excellence, Boston Public Schools (1995 – 2010); Member of Advisory Board of Florida Atlantic University Lifelong Learning Society. | 75 | Former Trustee of Old Mutual South Africa Master Trust. | |||||
William L. Marshall State Street Bank and 100 Huntington Avenue, CPH 0326 Boston, MA 02116 YOB: 1942 | Trustee and Co-Chairman of the Audit Committee | Term: Indefinite Elected: 1/14 | April 2011 to Present, Chairman (until April 2011, Chief Executive Officer and President), Wm. L. Marshall Associates, Inc., Wm. L. Marshall Companies, Inc. and the Marshall Financial Group, Inc. (a registered investment adviser and provider of financial and related consulting services); Certified Financial Planner; Member, Financial Planners Association; 2015 to present, Board Member, The Doylestown Health Foundation Board. | 75 | Marshall Financial Group, Inc. |
16
Table of Contents
State Street Institutional Investment Trust
State Street Institutional Liquid Reserves Fund
Disclosure of Information about Fund Trustees and Officers — (continued)
December 31, 2015 (Unaudited)
Name, Address, and Year of Birth | Position(s) Held | Term of Office Time Served | Principal Occupation During Past Five Years and Relevant Experience | Number of Funds in Fund Complex Overseen by Trustee | Other Directorships Held by Trustee During Past Five Years | |||||
Independent Trustees (continued) | ||||||||||
Richard D. Shirk State Street Bank and 100 Huntington Avenue, CPH 0326 Boston, MA 02116 YOB: 1945 | Trustee and Co-Chairman of the Qualified Legal and Compliance Committee | Term: Indefinite Elected: 1/14 | March 2001 to April 2002, Chairman (1996 to March 2001, President and Chief Executive Officer), Cerulean Companies, Inc. (holding company) (Retired); 1992 to March 2001, President and Chief Executive Officer, Blue Cross Blue Shield of Georgia (health insurer, managed healthcare); 1998 to December 2008, Chairman, Board Member and December 2008 to Present, Investment Committee Member, Healthcare Georgia Foundation (private foundation); September 2002 to 2012, Lead Director and Board Member, Amerigroup Corp. (managed health care); 1999 to 2013, Board Member and (since 2001) Investment Committee Member, Woodruff Arts Center; and 2003 to 2009, Trustee, Gettysburg College. | 75 | Board member, AeroCare Holdings (privately held healthcare services company) (February 2003 – Present); Board member, Regenesis Biomedical (health care services) (April 2012 –Present); Chairman (January 2014 – Present). | |||||
Rina K. Spence State Street Bank and 100 Huntington Avenue, CPH 0326 Boston, MA 02116 YOB: 1948 | Trustee and Co-Chairman of the Qualified Legal and Compliance Committee and Co-Chairman of the Governance Committee | Term: Indefinite Elected: 7/99 | President of SpenceCare International LLC (international healthcare consulting) (1999 – present); Chief Executive Officer, IEmily.com (health internet company) (2000 – 2001); Chief Executive Officer of Consensus Pharmaceutical, Inc. (1998 – 1999); Founder, President and Chief Executive Officer of Spence Center for Women’s Health (1994 – 1998); President and CEO Emerson Hospital (1984 – 1994); Trustee, Eastern Enterprise (utilities) (1988 – 2000); Director, Berkshire Life Insurance Company of America (1993 – 2009); Honorary Consul for Monaco in Boston (2015 –present). | 75 | ||||||
17
Table of Contents
State Street Institutional Investment Trust
State Street Institutional Liquid Reserves Fund
Disclosure of Information about Fund Trustees and Officers — (continued)
December 31, 2015 (Unaudited)
Name, Address, and Year of Birth | Position(s) Held | Term of Office Time Served | Principal Occupation During Past Five Years and Relevant Experience | Number of Funds in Fund Complex Overseen by Trustee | Other Directorships Held by Trustee During Past Five Years | |||||
Independent Trustees (continued) | ||||||||||
Bruce D. Taber State Street Bank and 100 Huntington Avenue, CPH 0326 Boston, MA 02116 YOB: 1943 | Trustee and Co-Chairman of the Valuation Committee and Co-Chairman of the Governance Committee | Term: Indefinite Elected: 1/14 | 1999 to Present, Partner, Zenergy LLC (a technology company providing Computer Modeling and System Analysis to the General Electric Power Generation Division); Until December 2008, Independent Director, SSGA Cash Management Fund plc; Until December 2008, Independent Director, State Street Global Advisers Ireland, Ltd. (investment companies); and Until August 1994, President, Alonzo B. Reed, Inc., (a Boston architect-engineering firm). | 75 | ||||||
Douglas T. Williams State Street Bank and 100 Huntington Avenue, CPH 0326 Boston, MA 02116 YOB: 1940 | Trustee and Co-Chairman of the Audit Committee | Term: Indefinite Elected: 7/99 | President, Oakmont Homeowners Association; President, Mariner Sands Chapel; Executive Vice President and member of Executive Committee, Chase Manhattan Bank (1987 – 1999); President, Boston Stock Exchange Depository Trust Company, 1981 – 1982; Treasurer, Nantucket Educational Trust, (2002 – 2007). | 75 | ||||||
Interested Trustee(1) | ||||||||||
James E. Ross SSGA Funds Management, Inc. State Street Financial Center One Lincoln Street Boston, MA 02111 YOB: 1965 | Trustee | Term: Indefinite Elected Trustee: 2/07 | Chairman and Director, SSGA Funds Management, Inc. (2012 – present); President, SSGA Funds Management, Inc. (2005 – 2012); Executive Vice President and Senior Managing Director, State Street Global Advisors (2006 –present); and Principal, State Street Global Advisors (2006 – present). | 290 | Trustee, SPDR Series Trust; Trustee, SPDR Index Shares Funds; Trustee, Select Sector SPDR Trust; Trustee, SSGA Active Trust; and Trustee, SSGA Master Trust. | |||||
| (1) | Mr. Ross is an Interested Trustee because of his employment by SSGA Funds Management, Inc., an affiliate of the Trust. |
Name, Address, and Year of Birth | Position(s) Held | Term of Office Time Served | Principal Occupation During Past Five Years | |||
Officers: | ||||||
Ellen M. Needham SSGA Funds Management, Inc. State Street Financial Center One Lincoln Street Boston, MA 02111 YOB: 1967 | President | Term: Indefinite Elected: 10/12 | President and Director, SSGA Funds Management, Inc. (June 2012 – present); Chief Operating Officer, SSGA Funds Management, Inc. (May 2010 – June 2012); Senior Managing Director, SSGA Funds Management, Inc. (1992 – 2012) and Senior Managing Director, State Street Global Advisors (1992 – present).* | |||
18
Table of Contents
State Street Institutional Investment Trust
State Street Institutional Liquid Reserves Fund
Disclosure of Information about Fund Trustees and Officers — (continued)
December 31, 2015 (Unaudited)
Name, Address, and Year of Birth | Position(s) Held | Term of Office Time Served | Principal Occupation During Past Five Years | |||
Officers: (continued) | ||||||
Bruce S. Rosenberg SSGA Funds Management, Inc. State Street Financial Center One Lincoln Street Boston, MA 02111 YOB: 1961 | Treasurer | Term: Indefinite Elected: 2/16 | Managing Director, State Street Global Advisors and SSGA Funds Management, Inc. (July 2015 – present); Director, Credit Suisse (April 2008 – July 2015). | |||
Ann M. Carpenter SSGA Funds Management, Inc. State Street Financial Center One Lincoln Street Boston, MA 02111 YOB: 1966 | Vice President Deputy Treasurer | Term: Indefinite Elected: 10/12 Term: Indefinite Elected: 2/16 | Chief Operating Officer, SSGA Funds Management, Inc. (April 2014 – present); Vice President, State Street Global Advisors and SSGA Funds Management, Inc. (2005 – present).* | |||
Chad C. Hallett SSGA Funds Management, Inc. State Street Financial Center One Lincoln Street Boston, MA 02111 YOB: 1969 | Deputy Treasurer | Term: Indefinite Elected: 2/16 | Vice President, State Street Global Advisors and SSGA Funds Management, Inc. (November 2014 – present); Vice President, State Street Bank and Trust Company (2001 – November 2014).* | |||
Sujata Upreti SSGA Funds Management, Inc. State Street Financial Center One Lincoln Street Boston, MA 02111 YOB: 1974 | Assistant Treasurer | Term: Indefinite Elected: 2/16 | Vice President, State Street Global Advisors and SSGA Funds Management, Inc. (May 2015 – present); Assistant Director, Cambridge Associates, LLC (July 2014 – January 2015); Vice President, Bank of New York Mellon (July 2012 – August 2013); Manager, PricewaterhouseCoopers, LLP (September 2009 – July 2012). | |||
Daniel Foley SSGA Funds Management, Inc. State Street Financial Center One Lincoln Street Boston, MA 02111 YOB: 1972 | Assistant Treasurer | Term: Indefinite Elected: 2/16 | Vice President, State Street Global Advisors and SSGA Funds Management, Inc. (April 2014– present); Principal, State Street Global Advisors and SSGA Funds Management, Inc. (April 2007 – April 2014). | |||
Brian Harris SSGA Funds Management, Inc. State Street Financial Center One Lincoln Street Boston, MA 02111 YOB: 1973 | Chief Compliance Officer | Term: Indefinite Elected: 11/13 | Vice President, State Street Global Advisors and SSGA Funds Management, Inc.( June 2013 – Present); Senior Vice President and Global Head of Investment Compliance, BofA Global Capital Management (September 2010 to May 2013); Director of Compliance, AARP Financial Inc. (July 2008 to August 2010). | |||
Trevor Swanberg SSGA Funds Management, Inc. State Street Financial Center One Lincoln Street Boston, MA 02111 YOB: 1979 | Code of Ethics Compliance Officer | Term: Indefinite Elected:8/15 | Vice President, State Street Global Advisors and SSGA Funds Management, Inc. (January 2015 – Present); Senior Manager-Mutual Fund Compliance, ICMA-Retirement Corporation (December 2011 –January 2015); Assistant Vice President, J.P. Morgan (September 2007 – December 2011). | |||
Joshua A. Weinberg SSGA Funds Management, Inc. State Street Financial Center One Lincoln Street Boston, MA 02111 YOB: 1978 | Chief Legal Officer | Term: Indefinite Elected: 2/15 | Vice President and Managing Counsel, State Street Global Advisors (2011 – present); Clerk, SSGA Funds Management, Inc. (2013 – present); Associate, Financial Services Group, Dechert LLP (2006 – 2011). | |||
19
Table of Contents
State Street Institutional Investment Trust
State Street Institutional Liquid Reserves Fund
Disclosure of Information about Fund Trustees and Officers — (continued)
December 31, 2015 (Unaudited)
Name, Address, and Year of Birth | Position(s) Held | Term of Office Time Served | Principal Occupation During Past Five Years | |||
Officers: (continued) | ||||||
David K. James State Street Bank and Trust Company 100 Huntington Avenue, 3rd Floor Boston, MA 02116 YOB: 1970 | Secretary | Term: Indefinite Elected: 4/13 | Managing Director and Managing Counsel, State Street Bank and Trust Company (2009 – present); Vice President and Counsel, PNC Global Investment Servicing (US), Inc. (2006 – 2009). | |||
Kristin Schantz State Street Bank and Trust Company 100 Huntington Avenue, 3rd Floor Boston, MA 02116 YOB: 1979 | Assistant Secretary | Term: Indefinite Elected: 2/14 | Vice President and Counsel, State Street Bank and Trust Company (2013 – present); Vice President, Citi Fund Services Ohio, Inc. (2008 – 2013). | |||
| * | Served in various capacities and/or with various affiliated entities during noted time period. |
20
Table of Contents
Trustees
William L. Boyan
Michael F. Holland
William L. Marshall
Patrick J. Riley
James E. Ross
Richard D. Shirk
Rina K. Spence
Bruce D. Taber
Douglas T. Williams
Investment Adviser and Administrator
SSGA Funds Management, Inc.
State Street Financial Center
One Lincoln Street
Boston, MA 02111
Custodian and Sub-Administrator
State Street Bank and Trust Company
State Street Financial Center
One Lincoln Street
Boston, MA 02111
Independent Registered Public Accounting Firm
Ernst & Young LLP
200 Clarendon Street
Boston, MA 02116
Legal Counsel
Ropes & Gray LLP
800 Boylston Street
Boston, MA 02199
Transfer Agent
Boston Financial Data Services
2000 Crown Colony Drive
Quincy, MA 02169
Distributor
State Street Global Markets LLC
State Street Financial Center
One Lincoln Street
Boston, MA 02111
This report is for shareholder information. This is not a prospectus intended for use in the purchase or sale of shares of beneficial interest.
State Street Institutional Investment Trust State Street Bank and Trust Company P.O. Box 5049 Boston, MA 02206 |
Table of Contents
[THIS PAGE INTENTIONALLY LEFT BLANK]
Table of Contents
Annual Report
31 December 2015
State Street Master Funds
State Street Money Market Portfolio
Table of Contents
State Street Master Funds
State Street Money Market Portfolio
Annual Report
December 31, 2015
| 25 | ||||
| 26 | ||||
| 34 | ||||
| 35 | ||||
| 36 | ||||
| 37 | ||||
| 38 | ||||
| 43 | ||||
| 44 | ||||
| 45 | ||||
Disclosure of Information about Portfolio Trustees and Officers | 46 | |||
Table of Contents
State Street Master Funds
State Street Money Market Portfolio
Portfolio Statistics (Unaudited)
Portfolio Composition* | December 31, 2015 | |||
Certificates of Deposit | 41.7 | % | ||
Financial Company Commercial Paper | 20.3 | |||
Treasury Repurchase Agreements | 19.6 | |||
Other Notes | 6.4 | |||
Government Agency Debt | 2.9 | |||
Asset Backed Commercial Paper | 2.8 | |||
Government Agency Repurchase Agreements | 2.1 | |||
Other Repurchase Agreements | 1.2 | |||
Other Assets in Excess of Liabilities | 3.0 | |||
Total | 100.0 | % |
Maturity Ladder* | December 31, 2015 | |||
Overnight (1 Day) | 24.2 | % | ||
2-30 Days | 24.4 | |||
31-60 Days | 22.5 | |||
61-90 Days | 11.5 | |||
Over 90 Days | 14.4 | |||
Total | 97.0 | % | ||
Average days to maturity | 23 | |||
Weighted average life | 40 |
| * | As a percentage of net assets as of the date indicated. The Portfolio’s composition will vary over time. |
See accompanying notes to financial statements.
25
Table of Contents
State Street Master Funds
State Street Money Market Portfolio
December 31, 2015
Name of Issuer | Interest Rate | Next Rate Reset Date | Maturity Date | Principal Amount | Market Value | |||||||||||||||
| ASSET BACKED COMMERCIAL PAPER – 2.8% | ||||||||||||||||||||
Atlantic Asset Securitization LLC(a)(b) | 0.300 | % | 01/13/2016 | 01/13/2016 | $ | 133,950,000 | $ | 133,936,605 | ||||||||||||
Kells Funding LLC(b)(c) | 0.250 | % | 01/19/2016 | 01/19/2016 | 125,000,000 | 124,984,375 | ||||||||||||||
Kells Funding LLC(b)(c) | 0.340 | % | 02/04/2016 | 02/04/2016 | 150,000,000 | 149,951,833 | ||||||||||||||
Kells Funding LLC(b)(c) | 0.340 | % | 02/11/2016 | 02/11/2016 | 100,000,000 | 99,961,278 | ||||||||||||||
Kells Funding LLC(b)(c) | 0.330 | % | 02/12/2016 | 02/12/2016 | 200,000,000 | 199,923,000 | ||||||||||||||
Kells Funding LLC(b)(c) | 0.370 | % | 03/02/2016 | 03/02/2016 | 150,000,000 | 149,905,958 | ||||||||||||||
Kells Funding LLC(b)(c) | 0.340 | % | 03/09/2016 | 03/09/2016 | 75,000,000 | 74,951,833 | ||||||||||||||
Kells Funding LLC(b)(c) | 0.380 | % | 03/09/2016 | 03/09/2016 | 150,000,000 | 149,892,334 | ||||||||||||||
Versailles Commercial Paper LLC(a)(b) | 0.320 | % | 01/04/2016 | 01/04/2016 | 125,000,000 | 124,996,667 | ||||||||||||||
Versailles Commercial Paper LLC(a)(b) | 0.340 | % | 02/01/2016 | 02/01/2016 | 150,000,000 | 149,956,083 | ||||||||||||||
|
| |||||||||||||||||||
TOTAL ASSET BACKED COMMERCIAL PAPER |
| 1,358,459,966 | ||||||||||||||||||
|
| |||||||||||||||||||
| FINANCIAL COMPANY COMMERCIAL PAPER – 20.3% | ||||||||||||||||||||
Australia & New Zealand Banking Group Ltd.(a)(b) | 0.441 | % | 01/11/2016 | 01/11/2016 | 85,000,000 | 85,000,000 | ||||||||||||||
Australia & New Zealand Banking Group Ltd.(a)(d) | 0.441 | % | 01/13/2016 | 01/19/2016 | 100,000,000 | 100,000,357 | ||||||||||||||
Australia & New Zealand Banking Group Ltd.(a)(b) | 0.542 | % | 01/19/2016 | 01/19/2016 | 78,000,000 | 78,000,000 | ||||||||||||||
Australia & New Zealand Banking Group Ltd.(a)(b) | 0.400 | % | 02/25/2016 | 02/25/2016 | 26,000,000 | 25,984,111 | ||||||||||||||
Australia & New Zealand Banking Group Ltd.(a)(b) | 0.400 | % | 03/01/2016 | 03/01/2016 | 52,000,000 | 51,965,333 | ||||||||||||||
Australia & New Zealand Banking Group Ltd.(a)(d) | 0.361 | % | 01/04/2016 | 05/04/2016 | 126,000,000 | 125,997,770 | ||||||||||||||
Caisse des Depots et Consignations(b)(c) | 0.350 | % | 01/25/2016 | 01/25/2016 | 200,000,000 | 199,953,333 | ||||||||||||||
Caisse des Depots et Consignations(b)(c) | 0.270 | % | 02/02/2016 | 02/02/2016 | 305,000,000 | 304,926,800 | ||||||||||||||
Caisse des Depots et Consignations(b)(c) | 0.330 | % | 02/03/2016 | 02/03/2016 | 195,000,000 | 194,941,013 | ||||||||||||||
Caisse des Depots et Consignations(b)(c) | 0.410 | % | 02/05/2016 | 02/05/2016 | 200,000,000 | 199,920,278 | ||||||||||||||
Caisse des Depots et Consignations(b)(c) | 0.330 | % | 02/19/2016 | 02/19/2016 | 250,000,000 | 249,887,708 | ||||||||||||||
Caisse des Depots et Consignations(b)(c) | 0.320 | % | 02/22/2016 | 02/22/2016 | 260,000,000 | 259,879,822 | ||||||||||||||
Caisse des Depots et Consignations(b)(c) | 0.320 | % | 02/26/2016 | 02/26/2016 | 75,000,000 | 74,962,667 | ||||||||||||||
Caisse des Depots et Consignations(b)(c) | 0.340 | % | 03/01/2016 | 03/01/2016 | 63,000,000 | 62,964,300 | ||||||||||||||
Caisse des Depots et Consignations(b)(c) | 0.345 | % | 03/15/2016 | 03/15/2016 | 52,000,000 | 51,963,123 | ||||||||||||||
Caisse des Depots et Consignations(b)(c) | 0.460 | % | 03/16/2016 | 03/16/2016 | 200,000,000 | 199,808,333 | ||||||||||||||
Commonwealth Bank of Australia(a)(b) | 0.441 | % | 01/11/2016 | 01/11/2016 | 88,000,000 | 88,000,000 | ||||||||||||||
Commonwealth Bank of Australia(a)(d) | 0.602 | % | 01/26/2016 | 04/26/2016 | 110,000,000 | 110,000,000 | ||||||||||||||
DBS Bank Ltd.(a)(b) | 0.340 | % | 01/21/2016 | 01/21/2016 | 80,000,000 | 79,984,889 | ||||||||||||||
DBS Bank Ltd.(a)(b) | 0.340 | % | 02/02/2016 | 02/02/2016 | 100,000,000 | 99,969,778 | ||||||||||||||
DBS Bank Ltd.(a)(b) | 0.340 | % | 02/04/2016 | 02/04/2016 | 100,000,000 | 99,967,889 | ||||||||||||||
DBS Bank Ltd.(a)(b) | 0.330 | % | 02/05/2016 | 02/05/2016 | 100,000,000 | 99,967,917 | ||||||||||||||
DBS Bank Ltd.(a)(b) | 0.330 | % | 02/10/2016 | 02/10/2016 | 125,000,000 | 124,954,167 | ||||||||||||||
See accompanying notes to the financial statements.
26
Table of Contents
State Street Master Funds
State Street Money Market Portfolio
Schedule of Investments — (continued)
December 31, 2015
Name of Issuer | Interest Rate | Next Rate Reset Date | Maturity Date | Principal Amount | Market Value | |||||||||||||||
| FINANCIAL COMPANY COMMERCIAL PAPER – (continued) | ||||||||||||||||||||
DnB Bank ASA(a)(b) | 0.355 | % | 02/23/2016 | 02/23/2016 | $ | 375,000,000 | $ | 374,804,010 | ||||||||||||
DnB Bank ASA(a)(b) | 0.340 | % | 03/07/2016 | 03/07/2016 | 350,000,000 | 349,781,833 | ||||||||||||||
Erste Abwicklungsanstalt(a)(b) | 0.320 | % | 01/12/2016 | 01/12/2016 | 140,000,000 | 139,986,311 | ||||||||||||||
Erste Abwicklungsanstalt(a)(b) | 0.320 | % | 03/08/2016 | 03/08/2016 | 50,000,000 | 49,970,222 | ||||||||||||||
General Electric Capital Corp.(b) | 0.150 | % | 01/04/2016 | 01/04/2016 | 150,000,000 | 149,998,125 | ||||||||||||||
HSBC Bank PLC(a)(d) | 0.570 | % | 01/18/2016 | 05/18/2016 | 252,000,000 | 252,000,000 | ||||||||||||||
National Australia Bank Ltd.(a)(b) | 0.427 | % | 01/12/2016 | 01/12/2016 | 60,000,000 | 60,000,000 | ||||||||||||||
National Australia Bank Ltd.(a)(b) | 0.400 | % | 03/03/2016 | 03/03/2016 | 201,100,000 | 200,961,465 | ||||||||||||||
National Australia Bank Ltd.(a)(d) | 0.439 | % | 01/06/2016 | 04/06/2016 | 172,000,000 | 172,000,000 | ||||||||||||||
Nederlandse Waterschapsbank NV(a)(b) | 0.340 | % | 01/27/2016 | 01/27/2016 | 75,000,000 | 74,981,583 | ||||||||||||||
Nordea Bank AB(a)(b) | 0.375 | % | 02/23/2016 | 02/23/2016 | 300,000,000 | 299,834,375 | ||||||||||||||
Nordea Bank AB(a)(b) | 0.330 | % | 03/07/2016 | 03/07/2016 | 51,000,000 | 50,969,145 | ||||||||||||||
Nordea Bank AB(a)(b) | 0.330 | % | 03/08/2016 | 03/08/2016 | 50,000,000 | 49,969,292 | ||||||||||||||
NRW.Bank(a)(b) | 0.265 | % | 01/13/2016 | 01/13/2016 | 170,000,000 | 169,984,983 | ||||||||||||||
NRW.Bank(a)(b) | 0.210 | % | 01/14/2016 | 01/14/2016 | 157,000,000 | 156,988,094 | ||||||||||||||
Skandinaviska Enskilda Banken AB(a)(b) | 0.330 | % | 02/03/2016 | 02/03/2016 | 136,000,000 | 135,958,860 | ||||||||||||||
Skandinaviska Enskilda Banken AB(a)(b) | 0.335 | % | 02/04/2016 | 02/04/2016 | 250,000,000 | 249,920,903 | ||||||||||||||
Skandinaviska Enskilda Banken AB(a)(b) | 0.325 | % | 02/11/2016 | 02/11/2016 | 118,000,000 | 117,956,324 | ||||||||||||||
Skandinaviska Enskilda Banken AB(a)(b) | 0.325 | % | 02/12/2016 | 02/12/2016 | 300,000,000 | 299,886,250 | ||||||||||||||
Skandinaviska Enskilda Banken AB(a)(b) | 0.325 | % | 02/23/2016 | 02/23/2016 | 250,000,000 | 249,880,382 | ||||||||||||||
Societe Generale(a)(b) | 0.350 | % | 01/05/2016 | 01/05/2016 | 250,000,000 | 249,990,278 | ||||||||||||||
Societe Generale(a)(b) | 0.500 | % | 02/01/2016 | 02/01/2016 | 250,000,000 | 249,892,361 | ||||||||||||||
Standard Chartered Bank(a)(b) | 0.290 | % | 01/22/2016 | 01/22/2016 | 96,000,000 | 95,983,760 | ||||||||||||||
Standard Chartered Bank(a)(b) | 0.300 | % | 02/05/2016 | 02/05/2016 | 142,000,000 | 141,958,583 | ||||||||||||||
Standard Chartered Bank(a)(b) | 0.650 | % | 04/04/2016 | 04/04/2016 | 145,000,000 | 144,753,903 | ||||||||||||||
Sumitomo Mitsui Banking Corp.(a)(b) | 0.310 | % | 01/13/2016 | 01/13/2016 | 250,000,000 | 249,974,167 | ||||||||||||||
Sumitomo Mitsui Banking Corp.(a)(b) | 0.300 | % | 01/20/2016 | 01/20/2016 | 92,000,000 | 91,985,433 | ||||||||||||||
Svenska Handelsbanken AB(a)(b) | 0.310 | % | 02/12/2016 | 02/12/2016 | 300,000,000 | 299,891,500 | ||||||||||||||
Swedbank AB(b) | 0.350 | % | 02/03/2016 | 02/03/2016 | 75,000,000 | 74,975,938 | ||||||||||||||
Swedbank AB(b) | 0.350 | % | 02/04/2016 | 02/04/2016 | 200,000,000 | 199,933,889 | ||||||||||||||
Swedbank AB(b) | 0.330 | % | 02/10/2016 | 02/10/2016 | 100,000,000 | 99,963,333 | ||||||||||||||
Swedbank AB(b) | 0.330 | % | 02/11/2016 | 02/11/2016 | 200,000,000 | 199,924,833 | ||||||||||||||
Swedbank AB(b) | 0.400 | % | 03/01/2016 | 03/01/2016 | 111,000,000 | 110,926,000 | ||||||||||||||
Swedbank AB(b) | 0.400 | % | 03/03/2016 | 03/03/2016 | 63,000,000 | 62,956,600 | ||||||||||||||
Swedbank AB(b) | 0.400 | % | 03/04/2016 | 03/04/2016 | 138,000,000 | 137,903,400 | ||||||||||||||
Toyota Motor Credit Corp.(d) | 0.369 | % | 01/07/2016 | 01/12/2016 | 150,000,000 | 150,000,000 | ||||||||||||||
Toyota Motor Credit Corp.(d) | 0.387 | % | 01/11/2016 | 01/14/2016 | 95,000,000 | 95,000,000 | ||||||||||||||
Westpac Banking Corp.(a)(b) | 0.441 | % | 01/11/2016 | 01/11/2016 | 160,000,000 | 160,000,000 | ||||||||||||||
Westpac Banking Corp.(a)(d) | 0.532 | % | 01/25/2016 | 02/25/2016 | 71,500,000 | 71,500,000 | ||||||||||||||
Westpac Banking Corp.(a)(d) | 0.532 | % | 01/26/2016 | 02/26/2016 | 71,500,000 | 71,500,000 | ||||||||||||||
Westpac Banking Corp.(a)(d) | 0.411 | % | 01/11/2016 | 03/11/2016 | 122,000,000 | 122,000,000 | ||||||||||||||
|
| |||||||||||||||||||
TOTAL FINANCIAL COMPANY COMMERCIAL PAPER |
| 9,655,845,723 | ||||||||||||||||||
|
| |||||||||||||||||||
See accompanying notes to the financial statements.
27
Table of Contents
State Street Master Funds
State Street Money Market Portfolio
Schedule of Investments — (continued)
December 31, 2015
Name of Issuer | Interest Rate | Next Rate Reset Date | Maturity Date | Principal Amount | Market Value | |||||||||||||||
| CERTIFICATES OF DEPOSIT – 41.7% | ||||||||||||||||||||
Bank of Montreal(b) | 0.290 | % | 01/07/2016 | 01/07/2016 | $ | 268,000,000 | $ | 268,000,000 | ||||||||||||
Bank of Montreal(b) | 0.290 | % | 01/08/2016 | 01/08/2016 | 175,000,000 | 175,000,000 | ||||||||||||||
Bank of Montreal(b) | 0.300 | % | 01/11/2016 | 01/11/2016 | 205,000,000 | 205,000,000 | ||||||||||||||
Bank of Montreal(b) | 0.451 | % | 01/15/2016 | 01/15/2016 | 100,000,000 | 100,000,000 | ||||||||||||||
Bank of Montreal(b) | 0.520 | % | 01/15/2016 | 01/15/2016 | 325,000,000 | 325,000,000 | ||||||||||||||
Bank of Montreal(b) | 0.320 | % | 02/17/2016 | 02/17/2016 | 90,000,000 | 90,000,000 | ||||||||||||||
Bank of Montreal(d) | 0.487 | % | 01/14/2016 | 03/14/2016 | 100,000,000 | 100,000,000 | ||||||||||||||
Bank of Montreal(d) | 0.530 | % | 01/19/2016 | 03/18/2016 | 100,000,000 | 100,000,000 | ||||||||||||||
Bank of Nova Scotia(b) | 0.260 | % | 02/01/2016 | 02/01/2016 | 290,000,000 | 290,000,000 | ||||||||||||||
Bank of Nova Scotia(d) | 0.449 | % | 01/07/2016 | 04/07/2016 | 335,000,000 | 335,000,000 | ||||||||||||||
Bank of Nova Scotia(d) | 0.459 | % | 01/05/2016 | 05/05/2016 | 295,000,000 | 295,000,000 | ||||||||||||||
Bank of Tokyo – Mitsubishi(b) | 0.250 | % | 01/04/2016 | 01/04/2016 | 213,000,000 | 213,000,000 | ||||||||||||||
Bank of Tokyo – Mitsubishi(b) | 0.380 | % | 01/04/2016 | 01/04/2016 | 200,000,000 | 200,000,000 | ||||||||||||||
Bank of Tokyo – Mitsubishi(b) | 0.300 | % | 01/06/2016 | 01/06/2016 | 450,000,000 | 450,000,000 | ||||||||||||||
Bank of Tokyo – Mitsubishi(b) | 0.340 | % | 01/07/2016 | 01/07/2016 | 300,000,000 | 300,000,000 | ||||||||||||||
Bank of Tokyo – Mitsubishi(b) | 0.300 | % | 01/11/2016 | 01/11/2016 | 350,000,000 | 350,000,000 | ||||||||||||||
Bank of Tokyo – Mitsubishi(b) | 0.300 | % | 01/14/2016 | 01/14/2016 | 200,000,000 | 200,000,000 | ||||||||||||||
Bank of Tokyo – Mitsubishi(b) | 0.300 | % | 02/01/2016 | 02/01/2016 | 350,000,000 | 350,000,000 | ||||||||||||||
BNP Paribas(b) | 0.310 | % | 02/03/2016 | 02/03/2016 | 128,000,000 | 128,000,000 | ||||||||||||||
BNP Paribas(b) | 0.320 | % | 02/26/2016 | 02/26/2016 | 125,000,000 | 125,000,000 | ||||||||||||||
BNP Paribas(b) | 0.360 | % | 03/02/2016 | 03/02/2016 | 247,000,000 | 247,000,000 | ||||||||||||||
BNP Paribas(b) | 0.400 | % | 03/03/2016 | 03/03/2016 | 112,000,000 | 112,000,000 | ||||||||||||||
BNP Paribas(b) | 0.500 | % | 03/16/2016 | 03/16/2016 | 500,000,000 | 500,000,000 | ||||||||||||||
Canadian Imperial Bank of Commerce(b) | 0.426 | % | 01/08/2016 | 01/08/2016 | 250,000,000 | 250,000,000 | ||||||||||||||
Canadian Imperial Bank of Commerce(d) | 0.465 | % | 01/19/2016 | 02/16/2016 | 238,000,000 | 238,000,000 | ||||||||||||||
Chase Bank USA NA(d) | 0.562 | % | 01/21/2016 | 04/21/2016 | 202,000,000 | 202,000,000 | ||||||||||||||
Chase Bank USA NA(d) | 0.612 | % | 01/26/2016 | 05/26/2016 | 100,000,000 | 100,000,000 | ||||||||||||||
Credit Agricole Corporate & Investment Bank(b) | 0.420 | % | 02/01/2016 | 02/01/2016 | 400,000,000 | 400,000,000 | ||||||||||||||
Credit Agricole Corporate & Investment Bank(b) | 0.360 | % | 02/05/2016 | 02/05/2016 | 200,000,000 | 200,000,000 | ||||||||||||||
Credit Agricole Corporate & Investment Bank(b) | 0.400 | % | 02/08/2016 | 02/08/2016 | 250,000,000 | 250,000,000 | ||||||||||||||
Credit Agricole Corporate & Investment Bank(b) | 0.400 | % | 02/09/2016 | 02/09/2016 | 200,000,000 | 200,000,000 | ||||||||||||||
Credit Suisse(d) | 0.630 | % | 01/19/2016 | 04/18/2016 | 250,000,000 | 250,000,000 | ||||||||||||||
Credit Suisse(d) | 0.692 | % | 01/27/2016 | 05/02/2016 | 200,000,000 | 200,000,000 | ||||||||||||||
ING Bank NV(b) | 0.400 | % | 02/01/2016 | 02/01/2016 | 400,000,000 | 400,000,000 | ||||||||||||||
ING Bank NV(b) | 0.380 | % | 02/02/2016 | 02/02/2016 | 400,000,000 | 400,000,000 | ||||||||||||||
ING Bank NV(b) | 0.370 | % | 02/05/2016 | 02/05/2016 | 400,000,000 | 400,000,000 | ||||||||||||||
ING Bank NV(b) | 0.440 | % | 03/14/2016 | 03/14/2016 | 200,000,000 | 200,000,000 | ||||||||||||||
See accompanying notes to the financial statements.
28
Table of Contents
State Street Master Funds
State Street Money Market Portfolio
Schedule of Investments — (continued)
December 31, 2015
Name of Issuer | Interest Rate | Next Rate Reset Date | Maturity Date | Principal Amount | Market Value | |||||||||||||||
| CERTIFICATES OF DEPOSIT – (continued) | ||||||||||||||||||||
KBC Bank NV(b) | 0.290 | % | 01/05/2016 | 01/05/2016 | $ | 400,000,000 | $ | 400,000,000 | ||||||||||||
National Australia Bank Ltd.(b) | 0.275 | % | 01/11/2016 | 01/11/2016 | 245,000,000 | 245,000,340 | ||||||||||||||
National Australia Bank Ltd.(b) | 0.270 | % | 01/12/2016 | 01/12/2016 | 140,000,000 | 140,000,000 | ||||||||||||||
Nordea Bank AB(b) | 0.280 | % | 01/20/2016 | 01/20/2016 | 225,000,000 | 225,000,000 | ||||||||||||||
Nordea Bank AB(b) | 0.360 | % | 02/19/2016 | 02/19/2016 | 225,000,000 | 225,000,000 | ||||||||||||||
Norinchukin Bank(b) | 0.220 | % | 01/04/2016 | 01/04/2016 | 40,000,000 | 40,000,000 | ||||||||||||||
Norinchukin Bank(b) | 0.250 | % | 01/05/2016 | 01/05/2016 | 275,000,000 | 275,000,000 | ||||||||||||||
Norinchukin Bank(b) | 0.250 | % | 01/08/2016 | 01/08/2016 | 150,000,000 | 150,000,000 | ||||||||||||||
Norinchukin Bank(b) | 0.250 | % | 01/11/2016 | 01/11/2016 | 165,000,000 | 165,000,000 | ||||||||||||||
Norinchukin Bank(b) | 0.320 | % | 01/12/2016 | 01/12/2016 | 199,000,000 | 198,999,999 | ||||||||||||||
Norinchukin Bank(b) | 0.310 | % | 01/13/2016 | 01/13/2016 | 247,000,000 | 247,000,000 | ||||||||||||||
Norinchukin Bank(b) | 0.300 | % | 01/28/2016 | 01/28/2016 | 300,000,000 | 299,998,876 | ||||||||||||||
Norinchukin Bank(b) | 0.410 | % | 02/05/2016 | 02/05/2016 | 400,000,000 | 400,000,000 | ||||||||||||||
Rabobank Nederland NV(d) | 0.497 | % | 01/14/2016 | 03/14/2016 | 345,000,000 | 345,000,000 | ||||||||||||||
Rabobank Nederland NV(d) | 0.583 | % | 01/22/2016 | 03/22/2016 | 340,000,000 | 340,000,000 | ||||||||||||||
Rabobank Nederland NV(d) | 0.487 | % | 01/13/2016 | 04/13/2016 | 209,000,000 | 209,000,000 | ||||||||||||||
Royal Bank of Canada(d) | 0.463 | % | 01/11/2016 | 03/10/2016 | 200,000,000 | 200,000,000 | ||||||||||||||
Royal Bank of Canada(d) | 0.552 | % | 01/20/2016 | 05/20/2016 | 125,000,000 | 125,000,000 | ||||||||||||||
Societe Generale(b) | 0.440 | % | 02/01/2016 | 02/01/2016 | 350,000,000 | 350,000,000 | ||||||||||||||
Societe Generale(b) | 0.500 | % | 03/07/2016 | 03/07/2016 | 300,000,000 | 300,000,000 | ||||||||||||||
Standard Chartered Bank(b) | 0.290 | % | 01/21/2016 | 01/21/2016 | 104,000,000 | 104,000,000 | ||||||||||||||
Standard Chartered Bank(b) | 0.300 | % | 01/29/2016 | 01/29/2016 | 393,000,000 | 393,000,000 | ||||||||||||||
Sumitomo Mitsui Banking Corp.(b) | 0.300 | % | 01/21/2016 | 01/21/2016 | 150,000,000 | 150,000,000 | ||||||||||||||
Sumitomo Mitsui Banking Corp.(b) | 0.300 | % | 01/27/2016 | 01/27/2016 | 175,000,000 | 175,000,000 | ||||||||||||||
Sumitomo Mitsui Banking Corp.(b) | 0.300 | % | 01/28/2016 | 01/28/2016 | 150,000,000 | 150,000,000 | ||||||||||||||
Sumitomo Mitsui Banking Corp.(b) | 0.400 | % | 02/01/2016 | 02/01/2016 | 275,000,000 | 275,000,000 | ||||||||||||||
Sumitomo Mitsui Banking Corp.(b) | 0.400 | % | 02/16/2016 | 02/16/2016 | 123,000,000 | 122,999,994 | ||||||||||||||
Sumitomo Mitsui Banking Corp.(b) | 0.400 | % | 02/29/2016 | 02/29/2016 | 100,000,000 | 99,999,996 | ||||||||||||||
Sumitomo Mitsui Banking Corp.(b) | 0.670 | % | 04/01/2016 | 04/01/2016 | 400,000,000 | 400,000,000 | ||||||||||||||
Svenska Handelsbanken AB(b) | 0.240 | % | 01/04/2016 | 01/04/2016 | 260,000,000 | 260,000,000 | ||||||||||||||
Svenska Handelsbanken AB(b) | 0.270 | % | 01/07/2016 | 01/07/2016 | 150,000,000 | 150,000,000 | ||||||||||||||
Svenska Handelsbanken AB(b) | 0.481 | % | 01/15/2016 | 01/15/2016 | 300,000,000 | 300,000,000 | ||||||||||||||
Svenska Handelsbanken AB(b) | 0.405 | % | 03/02/2016 | 03/02/2016 | 300,000,000 | 300,002,539 | ||||||||||||||
Toronto Dominion Bank(d) | 0.487 | % | 01/12/2016 | 02/12/2016 | 183,000,000 | 183,000,000 | ||||||||||||||
Toronto Dominion Bank(d) | 0.532 | % | 01/25/2016 | 02/25/2016 | 139,500,000 | 139,507,009 | ||||||||||||||
Toronto Dominion Bank(d) | 0.495 | % | 01/19/2016 | 03/16/2016 | 188,000,000 | 188,000,000 | ||||||||||||||
Toronto Dominion Bank(d) | 0.429 | % | 01/05/2016 | 04/05/2016 | 109,000,000 | 109,000,000 | ||||||||||||||
Toronto Dominion Bank(d) | 0.540 | % | 01/19/2016 | 04/18/2016 | 114,000,000 | 114,000,000 | ||||||||||||||
Toronto Dominion Bank(d) | 0.572 | % | 01/26/2016 | 05/26/2016 | 175,000,000 | 175,000,000 | ||||||||||||||
UBS AG(d) | 0.595 | % | 01/19/2016 | 04/18/2016 | 400,000,000 | 400,000,000 | ||||||||||||||
UBS AG(d) | 0.504 | % | 01/04/2016 | 05/03/2016 | 350,000,000 | 350,000,000 | ||||||||||||||
See accompanying notes to the financial statements.
29
Table of Contents
State Street Master Funds
State Street Money Market Portfolio
Schedule of Investments — (continued)
December 31, 2015
Name of Issuer | Interest Rate | Next Rate Reset Date | Maturity Date | Principal Amount | Market Value | |||||||||||||||
| CERTIFICATES OF DEPOSIT – (continued) | ||||||||||||||||||||
Wells Fargo Bank NA(d) | 0.409 | % | 01/07/2016 | 01/08/2016 | $ | 200,000,000 | $ | 200,000,000 | ||||||||||||
Wells Fargo Bank NA(b) | 0.397 | % | 01/11/2016 | 01/11/2016 | 215,000,000 | 215,000,000 | ||||||||||||||
Wells Fargo Bank NA(b) | 0.467 | % | 01/13/2016 | 01/13/2016 | 225,000,000 | 225,000,000 | ||||||||||||||
Wells Fargo Bank NA(b) | 0.542 | % | 03/03/2016 | 03/03/2016 | 275,000,000 | 275,000,000 | ||||||||||||||
Wells Fargo Bank NA(d) | 0.570 | % | 01/01/2016 | 04/04/2016 | 64,000,000 | 64,000,000 | ||||||||||||||
Wells Fargo Bank NA(d) | 0.570 | % | 01/01/2016 | 04/08/2016 | 215,000,000 | 215,000,000 | ||||||||||||||
Westpac Banking Corp.(d) | 0.542 | % | 01/25/2016 | 04/25/2016 | 139,000,000 | 139,000,000 | ||||||||||||||
|
| |||||||||||||||||||
TOTAL CERTIFICATES OF DEPOSIT |
| 19,899,508,753 | ||||||||||||||||||
|
| |||||||||||||||||||
| OTHER NOTES – 6.4% | ||||||||||||||||||||
Bank of America NA(b) | 0.491 | % | 01/15/2016 | 01/15/2016 | 168,000,000 | 168,000,000 | ||||||||||||||
Bank of America NA(d) | 0.434 | % | 01/04/2016 | 03/01/2016 | 151,000,000 | 151,000,000 | ||||||||||||||
Bank of America NA(d) | 0.439 | % | 01/05/2016 | 04/05/2016 | 148,000,000 | 148,000,000 | ||||||||||||||
Bank of America NA(d) | 0.439 | % | 01/06/2016 | 04/06/2016 | 145,000,000 | 145,000,000 | ||||||||||||||
Bank of America NA(d) | 0.471 | % | 01/11/2016 | 04/11/2016 | 84,000,000 | 84,000,000 | ||||||||||||||
Bank of America NA(d) | 0.487 | % | 01/12/2016 | 04/12/2016 | 82,000,000 | 82,000,000 | ||||||||||||||
Bank of America NA(d) | 0.434 | % | 01/04/2016 | 05/03/2016 | 141,000,000 | 141,000,000 | ||||||||||||||
Bank of America NA(d) | 0.592 | % | 01/21/2016 | 05/19/2016 | 175,000,000 | 175,000,000 | ||||||||||||||
BNP Paribas(b) | 0.250 | % | 01/04/2016 | 01/04/2016 | 81,745,000 | 81,745,000 | ||||||||||||||
JPMorgan Chase Bank NA(d) | 0.612 | % | 03/07/2016 | 08/05/2016 | 260,000,000 | 260,000,000 | ||||||||||||||
JPMorgan Chase Bank NA(d) | 0.480 | % | 01/22/2016 | 08/22/2016 | 175,000,000 | 175,000,000 | ||||||||||||||
Lloyds Bank PLC(b) | 0.260 | % | 01/04/2016 | 01/04/2016 | 720,000,000 | 720,000,000 | ||||||||||||||
Royal Bank of Canada(c)(d) | 0.443 | % | 01/07/2016 | 08/08/2016 | 155,000,000 | 155,000,000 | ||||||||||||||
Svenska Handelsbanken AB(b)(c) | 0.612 | % | 01/27/2016 | 01/27/2016 | 180,000,000 | 180,000,000 | ||||||||||||||
Wells Fargo Bank NA(d) | 0.607 | % | 03/10/2016 | 08/09/2016 | 155,000,000 | 155,000,000 | ||||||||||||||
Wells Fargo Bank NA(d) | 0.602 | % | 01/20/2016 | 08/19/2016 | 227,000,000 | 227,000,000 | ||||||||||||||
|
| |||||||||||||||||||
TOTAL OTHER NOTES |
| 3,047,745,000 | ||||||||||||||||||
|
| |||||||||||||||||||
| GOVERNMENT AGENCY DEBT – 2.9% | ||||||||||||||||||||
Federal Home Loan Bank(b) | 0.083 | % | 01/04/2016 | 01/04/2016 | 321,000,000 | 320,997,807 | ||||||||||||||
Federal Home Loan Bank(b) | 0.117 | % | 01/06/2016 | 01/06/2016 | 226,000,000 | 225,996,390 | ||||||||||||||
Federal Home Loan Bank(b) | 0.123 | % | 01/06/2016 | 01/06/2016 | 172,039,000 | 172,036,133 | ||||||||||||||
Federal Home Loan Bank(b) | 0.132 | % | 01/08/2016 | 01/08/2016 | 252,000,000 | 251,993,630 | ||||||||||||||
Federal Home Loan Bank(b) | 0.131 | % | 01/13/2016 | 01/13/2016 | 146,000,000 | 145,993,722 | ||||||||||||||
Federal Home Loan Bank(b) | 0.304 | % | 01/29/2016 | 01/29/2016 | 275,000,000 | 274,936,261 | ||||||||||||||
|
| |||||||||||||||||||
TOTAL GOVERNMENT AGENCY DEBT |
| 1,391,953,943 | ||||||||||||||||||
|
| |||||||||||||||||||
See accompanying notes to the financial statements.
30
Table of Contents
State Street Master Funds
State Street Money Market Portfolio
Schedule of Investments — (continued)
December 31, 2015
Name of Issuer | Interest Rate | Next Rate Reset Date | Maturity Date | Principal Amount | Market Value | |||||||||||||||
| GOVERNMENT AGENCY REPURCHASE AGREEMENTS – 2.1% | ||||||||||||||||||||
Agreement with Bank of Nova Scotia and Bank of New York Mellon (Tri-Party), dated 12/31/2015 (collateralized by Federal Home Loan Mortgage Corporations, 3.000% – 4.000% due 04/01/2026 – 08/01/2045, Federal National Mortgage Associations, 2.500% – 5.500% due 04/01/2026 – 07/01/2045, Government National Mortgage Associations, 2.000% – 5.000% due 03/20/2041 – 09/20/2045, and U.S. Treasury Notes, 0.625% – 3.250% due 06/30/2016 – 02/15/2023, valued at $255,009,352); expected proceeds $250,009,167 | 0.330 | % | 01/04/2016 | 01/04/2016 | $ | 250,000,000 | $ | 250,000,000 | ||||||||||||
Agreement with Goldman Sachs & Co. and Bank of New York Mellon (Tri-Party), dated 12/30/2015 (collateralized by a Federal National Mortgage Association, 3.000% due 01/01/2025, and Government National Mortgage Associations, 4.500% – 5.000% due 03/15/2040 – 11/20/2043, valued at $127,500,000); expected proceeds $125,007,292 | 0.300 | % | 01/06/2016 | 01/06/2016 | 125,000,000 | 125,000,000 | ||||||||||||||
Agreement with Goldman Sachs & Co. and Bank of New York Mellon (Tri-Party), dated 12/31/2015 (collateralized by a Federal National Mortgage Association, 1.629% due 08/25/2041, a Government National Mortgage Association, 3.000% due 07/20/2045, U.S. Treasury Bonds, 0.125% – 8.750% due 01/15/2016 – 07/15/2025, U.S. Treasury Inflation Index Bonds, 1.375% – 3.625% due 01/15/2027 – 02/15/2044, U.S. Treasury Notes, 0.500% – 3.750% due 02/28/2017 – 03/31/2020, and a U.S. Treasury Strip, 0.000% due 05/15/2020, valued at $332,520,067); expected proceeds $326,011,953 | 0.330 | % | 01/04/2016 | 01/04/2016 | 326,000,000 | 326,000,000 | ||||||||||||||
|
| |||||||||||||||||||
TOTAL GOVERNMENT AGENCY REPURCHASE AGREEMENTS |
| 701,000,000 | ||||||||||||||||||
|
| |||||||||||||||||||
| TREASURY REPURCHASE AGREEMENTS – 19.6% | ||||||||||||||||||||
Agreement with Citigroup Global Markets, Inc. and Bank of New York Mellon (Tri-Party), dated 12/28/2015 (collateralized by U.S. Treasury Bonds, 3.375% – 3.625% due 08/15/2043 – 05/15/2044, valued at $153,000,057); expected proceeds $150,009,625 | 0.330 | % | 01/04/2016 | 01/04/2016 | 150,000,000 | 150,000,000 | ||||||||||||||
See accompanying notes to the financial statements.
31
Table of Contents
State Street Master Funds
State Street Money Market Portfolio
Schedule of Investments — (continued)
December 31, 2015
Name of Issuer | Interest Rate | Next Rate Reset Date | Maturity Date | Principal Amount | Market Value | |||||||||||||||
| TREASURY REPURCHASE AGREEMENTS – (continued) | ||||||||||||||||||||
Agreement with Federal Reserve Bank of New York and Bank of New York Mellon (Tri-Party), dated 12/31/2015 (collateralized by U.S. Treasury Bonds, 3.125% – 6.625% due 02/15/2027 – 02/15/2043, and U.S. Treasury Notes, 0.875% – 3.500% due 08/31/2016 – 08/15/2021, valued at $8,300,230,563); expected proceeds $8,300,230,556 | 0.250 | % | 01/04/2016 | 01/04/2016 | $ | 8,300,000,000 | $ | 8,300,000,000 | ||||||||||||
Agreement with Goldman Sachs & Co. and Bank of New York Mellon (Tri-Party), dated 12/28/2015 (collateralized by U.S. Treasury Notes, 0.500% – 3.250% due 05/31/2016 – 05/31/2022, valued at $408,000,014); expected proceeds $400,020,222 | 0.260 | % | 01/04/2016 | 01/04/2016 | 400,000,000 | 400,000,000 | ||||||||||||||
Agreement with Goldman Sachs & Co. and Bank of New York Mellon (Tri-Party), dated 12/29/2015 (collateralized by U.S. Treasury Bonds, 5.250% –8.125% due 08/15/2021 – 05/15/2030, and U.S. Treasury Notes, 0.500% – 3.125% due 09/30/2016 – 11/15/2022, valued at $510,000,014); expected proceeds $500,025,278 | 0.260 | % | 01/05/2016 | 01/05/2016 | 500,000,000 | 500,000,000 | ||||||||||||||
|
| |||||||||||||||||||
TOTAL TREASURY REPURCHASE AGREEMENTS |
| 9,350,000,000 | ||||||||||||||||||
|
| |||||||||||||||||||
| OTHER REPURCHASE AGREEMENTS – 1.2% | ||||||||||||||||||||
Agreement with Citigroup Global Markets, Inc. and Bank of New York Mellon (Tri-Party), dated 12/23/2015 (collateralized by various Corporate Bonds, 3.375% –10.500% due 01/27/2016 – 10/02/2043, and U.S. Treasury Notes, 1.250% – 4.250% due 10/31/2017 – 07/31/2022, valued at $117,683,506); expected proceeds $110,165,000 | 0.600 | % | 01/01/2016 | 03/22/2016 | 110,000,000 | 110,000,000 | ||||||||||||||
Agreement with Goldman Sachs & Co. and Bank of New York Mellon (Tri-Party), dated 12/17/2015 (collateralized by various Common Stocks, and a U.S. Treasury Bond, 0.125% due 04/15/2017, valued at $330,895,987); expected proceeds $310,475,333 | 0.460 | % | 01/04/2016 | 04/15/2016 | 310,000,000 | 310,000,000 | ||||||||||||||
Agreement with Goldman Sachs & Co. and Bank of New York Mellon (Tri-Party), dated 12/10/2015 (collateralized by various Common Stocks, and a U.S. Treasury Bond, 1.750% due 01/15/2028, valued at $133,490,792); expected proceeds $125,125,000 | 0.400 | % | 01/01/2016 | 03/09/2016 | 125,000,000 | 125,000,000 | ||||||||||||||
See accompanying notes to the financial statements.
32
Table of Contents
State Street Master Funds
State Street Money Market Portfolio
Schedule of Investments — (continued)
December 31, 2015
Name of Issuer | Interest Rate | Next Rate Reset Date | Maturity Date | Principal Amount | Market Value | |||||||||||||||
| OTHER REPURCHASE AGREEMENTS – (continued) | ||||||||||||||||||||
Agreement with JP Morgan Securities, Inc. and JP Morgan Chase & Co. (Tri-Party), dated 12/30/2015 (collateralized by various Corporate Bonds, 0.000% – 6.950% due 05/10/2017 – 09/01/2046, Federal Home Loan Mortgage Corporations, 2.500% – 10.000% due 06/01/2017 – 12/01/2045, and Federal National Mortgage Associations, 3.000% – 5.500% due 04/01/2037 – 12/01/2045, valued at $335,512,190); expected proceeds $320,669,333 | 0.628 | % | 01/29/2016 | 04/28/2016 | $ | 320,000,000 | $ | 320,000,000 | ||||||||||||
|
| |||||||||||||||||||
TOTAL OTHER REPURCHASE AGREEMENTS |
| 865,000,000 | ||||||||||||||||||
|
| |||||||||||||||||||
TOTAL INVESTMENTS(e)(f) – 97.0% |
| 46,269,513,385 | ||||||||||||||||||
Other Assets in Excess of Liabilities – 3.0% |
| 1,414,342,897 | ||||||||||||||||||
|
| |||||||||||||||||||
NET ASSETS – 100.0% |
| $ | 47,683,856,282 | |||||||||||||||||
|
| |||||||||||||||||||
| (a) | Rule 144A, Section 4(2) or other security, which is restricted to resale to institutional investors. The Portfolio’s investment manager has deemed this security to be liquid based upon procedures approved by the Board of Trustees. These securities represent $6,983,945,508 or 14.65% of net assets as of December 31, 2015. |
| (b) | Rate represents annualized yield at date of purchase. |
| (c) | Security subject to restrictions on resale under federal securities laws, which may only be resold upon registration under the Securities Act of 1933, as amended (“1933 Act”) or in transactions exempt from registration, including sales to qualified institutional buyers pursuant to Rule 144A of the 1933 Act. The Portfolio does not have the right to demand that this security be registered. The Portfolio’s investment manager has deemed this security to be liquid based upon procedures approved by the Board of Trustees. These securities represent $3,083,777,912 or 6.47% of net assets as of December 31, 2015. |
| (d) | Variable Rate Security – Interest rate shown is rate in effect at December 31, 2015. |
| (e) | Unless otherwise indicated, the values of the securities of the Portfolio are determined based on Level 2 inputs established by provisions surrounding fair value measurements and disclosures. (Note 2) |
| (f) | Also represents the cost for federal tax purposes. |
See accompanying notes to the financial statements.
33
Table of Contents
State Street Master Funds
State Street Money Market Portfolio
Statement of Assets and Liabilities
December 31, 2015
Assets | ||||
Investments at value and amortized cost (Note 2) | $ | 35,353,513,385 | ||
Repurchase Agreements, at value and cost (Note 2) | 10,916,000,000 | |||
|
| |||
Total Investments | 46,269,513,385 | |||
Cash | 1,406,802,892 | |||
Interest receivable | 10,724,708 | |||
Prepaid expenses and other assets | 44,893 | |||
|
| |||
Total assets | 47,687,085,878 | |||
Liabilities | ||||
Management fee payable (Note 3) | 2,040,177 | |||
Administration and custody fees payable (Note 3) | 1,155,060 | |||
Professional fees payable | 9,275 | |||
Accrued expenses and other liabilities | 25,084 | |||
|
| |||
Total liabilities | 3,229,596 | |||
|
| |||
Net Assets | $ | 47,683,856,282 | ||
|
|
See accompanying notes to financial statements.
34
Table of Contents
State Street Master Funds
State Street Money Market Portfolio
Year Ended December 31, 2015
Investment Income | ||||
Interest | $ | 97,938,852 | ||
|
| |||
Expenses | ||||
Management fees (Note 3) | 20,608,762 | |||
Administration and custody fees (Note 3) | 5,218,138 | |||
Trustees’ fees (Note 4) | 617,284 | |||
Professional fees | 166,747 | |||
Printing fees | 14,070 | |||
Other expenses | 219,054 | |||
|
| |||
Total expenses | 26,844,055 | |||
|
| |||
Net Investment Income | $ | 71,094,797 | ||
|
| |||
Realized Gain | ||||
Net realized gain on investments | 160,294 | |||
|
| |||
Net Increase in Net Assets Resulting from Operations | $ | 71,255,091 | ||
|
|
See accompanying notes to financial statements.
35
Table of Contents
State Street Master Funds
State Street Money Market Portfolio
Statements of Changes in Net Assets
| Year Ended December 31, 2015 | Year Ended December 31, 2014 | |||||||
Increase (Decrease) in Net Assets From Operations: | ||||||||
Net investment income | $ | 71,094,797 | $ | 50,540,397 | ||||
Net realized gain on investments | 160,294 | 200,540 | ||||||
|
|
|
| |||||
Net increase in net assets from operations | 71,255,091 | 50,740,937 | ||||||
|
|
|
| |||||
Capital Transactions: | ||||||||
Contributions | 85,345,364,590 | 76,110,543,297 | ||||||
Withdrawals | (78,437,231,019 | ) | (69,510,120,416 | ) | ||||
|
|
|
| |||||
Net increase in net assets from capital transactions | 6,908,133,571 | 6,600,422,881 | ||||||
|
|
|
| |||||
Net Increase in Net Assets | 6,979,388,662 | 6,651,163,818 | ||||||
Net Assets | ||||||||
Beginning of year | 40,704,467,620 | 34,053,303,802 | ||||||
|
|
|
| |||||
End of year | $ | 47,683,856,282 | $ | 40,704,467,620 | ||||
|
|
|
| |||||
See accompanying notes to financial statements.
36
Table of Contents
State Street Master Funds
State Street Money Market Portfolio
| Ratios to Average Net Assets | Net Assets End of Year (000s Omitted) | |||||||||||||||||||
Year Ended December 31, | Total Return(a) | Gross Operating Expenses | Net Operating Expenses | Net Investment Income | ||||||||||||||||
2015 | 0.17 | % | 0.07 | % | 0.07 | % | 0.17 | % | $ | 47,683,856 | ||||||||||
2014 | 0.13 | % | 0.07 | % | 0.07 | % | 0.13 | % | $ | 40,704,468 | ||||||||||
2013 | 0.15 | % | 0.06 | % | 0.06 | % | 0.15 | % | $ | 34,053,304 | ||||||||||
2012 | 0.26 | % | 0.06 | % | 0.06 | % | 0.25 | % | $ | 27,508,762 | ||||||||||
2011 | 0.20 | % | 0.07 | % | 0.07 | % | 0.20 | %(b) | $ | 22,780,186 | ||||||||||
| (a) | Results represent past performance and are not indicative of future results. |
| (b) | Results reflect the effect of expense waivers. Without these waivers, net investment income would have been lower. |
See accompanying notes to financial statements.
37
Table of Contents
State Street Master Funds
State Street Money Market Portfolio
December 31, 2015
| 1. | Organization |
The State Street Master Funds (the “Trust”) is registered under the Investment Company Act of 1940, as amended (the “1940 Act”), as an open-end management investment company, and was organized as a business trust under the laws of the Commonwealth of Massachusetts on July 27, 1999. The Trust comprises five investment portfolios: State Street Equity 500 Index Portfolio, State Street Money Market Portfolio, State Street U.S. Government Money Market Portfolio, State Street Treasury Money Market Portfolio and State Street Treasury Plus Money Market Portfolio. Information presented in these financial statements pertains only to State Street Money Market Portfolio (the “Portfolio”). The Portfolio commenced operations on August 12, 2004.
The Portfolio is authorized to issue an unlimited number of non-transferable beneficial interests.
The Portfolio’s investment objective is to seek to maximize current income, to the extent consistent with the preservation of capital and liquidity and the maintenance of a stable $1.00 per share net asset value by investing in U.S. dollar denominated money market securities.
Under the Trust’s organizational documents, its officers and trustees are indemnified against certain liabilities arising out of the performance of their duties to the Trust. Additionally, in the normal course of business, the Trust enters into contracts with service providers that contain general indemnification clauses. The Trust’s maximum exposure under these arrangements is unknown as this could involve future claims that may be made against the Trust that have not yet occurred.
| 2. | Summary of Significant Accounting Policies |
The following is a summary of significant accounting policies followed by the Trust in the preparation of its financial statements:
The preparation of financial statements in accordance with U.S. generally accepted accounting principles (“U.S. GAAP”) requires management to make estimates and assumptions that affect the reported amounts and disclosures in the financial statements. Actual results could differ from those estimates. The Portfolio is an investment company under U.S. GAAP and follows the accounting and reporting guidance applicable to investment companies in Financial Accounting Standards Board (“FASB”) Accounting Standards Codification (“ASC”) 946, Financial Services Investment Companies (“ASC 946”).
Security Valuation – The Portfolio’s securities are recorded on the basis of amortized cost which approximates fair value as permitted by Rule 2a-7 under the 1940 Act. This method values a security at its cost on the date of purchase and, thereafter, assumes a constant amortization to maturity of any premiums or accretion of any discounts. The Portfolio may value securities for which market quotations are not readily available at “fair value,” as determined in good faith pursuant to procedures established by the Board of Trustees of the Trust (the “Board”). The Board has adopted procedures concerning securities valuation, under which an Oversight Committee (the “Committee”) makes determinations as to whether market quotations are not readily available or do not otherwise accurately reflect the fair value of the security. The Committee, or a subgroup thereof, subject to oversight by the Board, may use fair value pricing in a variety of circumstances, including but not limited to, situations when trading in a security has been suspended or halted. If amortized cost is determined not to approximate fair value, the
38
Table of Contents
State Street Master Funds
State Street Money Market Portfolio
Notes to Financial Statements — (continued)
December 31, 2015
value of the portfolio securities will be determined under procedures established by and under the general supervision of the Committee. The Committee will assist in overseeing the comparison of amortized cost to market-based value. Fair value pricing involves subjective judgments and it is possible that the fair value determination for a security is materially different than the value that could be received on the sale of the security.
Because of the inherent uncertainties of valuation and under certain market conditions, the values reflected in the financial statements may differ from the value received upon actual sale of those investments and it is possible that the differences could be material.
The Portfolio values its assets and liabilities at fair value using a hierarchy that prioritizes the inputs to valuation techniques giving the highest priority to readily available unadjusted quoted prices in active markets for identical assets or liabilities (Level 1 measurements) and the lowest priority to unobservable inputs (Level 3 measurements) when market prices are not readily available or reliable. The categorization of a value determined for an investment within the hierarchy is based upon the pricing transparency of the investment and is not necessarily an indication of the risk associated with investing in it.
The three levels of the fair value hierarchy are as follows:
| • | Level 1 – Unadjusted quoted prices in active markets for identical assets or liabilities; |
| • | Level 2 – Inputs other than quoted prices included within Level 1 that are observable for the asset or liability either directly or indirectly, including quoted prices for similar assets or liabilities in active markets, quoted prices for identical or similar assets or liabilities in markets that are not considered to be active, inputs other than quoted prices that are observable for the asset or liability (such as exchange rates, financing terms, interest rates, yield curves, volatilities, prepayment speeds, loss severities, credit risks and default rates) or other market-corroborated inputs; and |
| • | Level 3 – Unobservable inputs for the asset or liability, including the Committee’s assumptions used in determining the fair value of investments. |
Changes in valuation techniques may result in transfers in or out of an assigned level within the fair value hierarchy. Transfers between different levels of the fair value hierarchy are recognized at the end of the reporting period. The Portfolio had no transfers between levels for the year ended December 31, 2015. Unless otherwise indicated on the Schedule of Investments, the values of the securities of the Portfolio are determined based on Level 2 inputs.
Investment Transactions and Income Recognition – Investment transactions are accounted for on trade date for financial reporting purposes. Interest income is recorded daily on an accrual basis and includes amortization of premium and accretion of discount on investments. Realized gains and losses from the sale or disposition of investments are determined using the identified cost method.
Expenses – Advisory fees and other expenses, which are directly identifiable to a specific portfolio, are applied to that portfolio within the Trust. Trustees’ fees and other expenses which cannot be attributed to a specific portfolio are allocated in such a manner as deemed equitable, taking into consideration the nature and type of expense and the relative net assets of the portfolios within the Trust.
39
Table of Contents
State Street Master Funds
State Street Money Market Portfolio
Notes to Financial Statements — (continued)
December 31, 2015
Repurchase Agreements – The Portfolio may enter into repurchase agreements under the terms of a master repurchase agreement. A repurchase agreement customarily obligates the seller at the time it sells securities to the Portfolio to repurchase the securities at a mutually agreed upon price and time. The total amount received by the Portfolio on repurchase is calculated to exceed the price paid by the Portfolio, reflecting an agreed-upon market rate of interest for the period of time to the settlement date, and is not necessarily related to the interest rate on the underlying securities. The underlying securities are ordinarily United States Government or Government Agency securities, but may consist of other securities. The value of the underlying securities, at the time of purchase and each subsequent business day, is required to be maintained at such a level that the value is equal to at least the principal amount of the repurchase price plus accrued interest. The use of repurchase agreements involves certain risks. Upon an event of default under the Master Repurchase Agreement, if the seller of securities under a repurchase agreement defaults on its obligation to repurchase the underlying securities (as a result of its bankruptcy or otherwise) the Portfolio will seek to dispose of such securities; this action could involve losses, costs or delays. In addition, the proceeds of any such disposition may be less than the amount the Portfolio is owed under the repurchase agreement. The Portfolio may enter into repurchase agreements maturing within a specified date with domestic dealers, banks and other financial institutions deemed to be creditworthy by SSGA FM, a subsidiary of State Street Corporation and an affiliate of State Street Bank and Trust Company (“State Street”).
Federal Income Taxes – The Portfolio is not required to pay federal income taxes on its net investment income and net capital gains because it is treated as a partnership for federal income tax purposes. All interest, gains and losses of the Portfolio are deemed to have been “passed through” to the Portfolio’s partners in proportion to their holdings in the Portfolio, regardless of whether such items have been distributed by the Portfolio. Each partner is responsible for tax liability based on its distributive share; therefore, no provision has been made for federal income taxes.
SSGA Funds Management, Inc. (“SSGA FM” or the “Adviser”) has reviewed the tax positions for open years as of December 31, 2015, and has determined that no provision for income tax is required in the Portfolio’s financial statements. The Portfolio’s federal tax returns for the past three years remain subject to examination by the Portfolio’s major tax jurisdictions, which include the United States of America and the Commonwealth of Massachusetts. The Portfolio recognizes interest and penalties, if any, related to tax liabilities as income tax expense in the Statement of Operations. No income tax returns are currently under examination. Management has analyzed tax laws and regulations and their applications to the Portfolio’s facts and circumstances and does not believe there are any uncertain tax positions that require recognition of a tax liability.
At December 31, 2015, the cost of investments for federal income tax purposes was substantially the same as the cost for financial reporting purposes.
| 3. | Related Party Fees |
The Trust has entered into an investment advisory agreement with the Adviser, under which the Adviser directs the investments of the Portfolio in accordance with its investment objectives, policies, and limitations. In compensation for the Adviser’s services as investment adviser, the Portfolio pays the Adviser a management fee at an annual rate of 0.05% of its average daily net assets.
40
Table of Contents
State Street Master Funds
State Street Money Market Portfolio
Notes to Financial Statements — (continued)
December 31, 2015
Effective June 1, 2015, SSGA FM serves as administrator and State Street serves as sub-administrator. A fee is paid by the Portfolio for the administration, sub-administration, custody and transfer agency services SSGA FM and State Street provide. The annual fee is accrued daily and payable monthly at the following fee rate:
| Asset Levels | Annual percentage of average aggregate monthly net assets | |
First $400 million | 0.03% | |
Next $15 billion | 0.02% | |
Thereafter | 0.01% | |
Minimum annual fee per Portfolio | $150,000 |
The minimum fee will be calculated by multiplying the minimum per fund fee by the number of portfolios within the Trust to arrive at the total minimum fee. The greater of the asset based fee or the minimum fee will be charged to the portfolios. SSGA FM and State Street each receive a portion of the fee.
Prior to June 1, 2015, State Street served as administrator. The administration fees paid by the Portfolio were not changed as a result of the administrator and sub-administrator appointments as of June 1, 2015.
| 4. | Trustees’ Fees |
Independent Trustees are compensated on a calendar year basis. Any Trustee who is deemed to be an “interested person” (as defined in the 1940 Act) of the Trust does not receive compensation from the Trust for his or her service as a Trustee.
Each Independent Trustee receives for his or her services to the State Street Master Funds, State Street Institutional Investment Trust and SSGA Funds, a $141,500 annual base retainer in addition to $18,000 for each in-person meeting and $2,000 for each telephonic meeting from the Trust. The Co-Chairmen each receive an additional $44,000 annual retainer. The Independent Trustees are reimbursed for travel and other out-of-pocket expenses in connection with meeting attendance. Trustees’ fees and expenses are allocated among the Trusts and funds overseen by the Trustees in a manner deemed equitable taking into consideration the relative net assets of the funds, subject to a $15,000 minimum per fund. As of the date of this Shareholder Report, the Trustees were not paid pension or retirement benefits as part of the Trust’s expenses. However, the State Street Master Funds have, pursuant to an exemptive order from the SEC, implemented an optional deferred compensation plan by which the Independent Trustees may defer receipt of compensation and receive a return on the deferred amount determined with reference to the performance of shares of specified State Street Master Funds. As of the fiscal year ended December 31, 2015, none of the Independent Trustees participated in the optional deferred compensation program
The Trust’s officers are compensated by the Adviser and its affiliates.
41
Table of Contents
State Street Master Funds
State Street Money Market Portfolio
Notes to Financial Statements — (continued)
December 31, 2015
| 5. | Market, Credit and Counterparty Risk |
In the normal course of business, the Portfolio invests in securities and enters into transactions where risks exist due to fluctuations in the market (market risk) or failure of the other party to a transaction to perform (counterparty risk). The value of securities held by the Portfolio may decline in response to certain events, including those directly involving the companies whose securities are owned by the Portfolio; conditions affecting the general economy; overall market changes; local, regional or global political, social or economic instability; and currency and interest rate and price fluctuations (credit risk). Similar to credit risk, the Portfolio may be exposed to counterparty risk, or the risk that an entity with which the Portfolio has unsettled or open transactions may default. Financial assets, which potentially expose the Portfolio to credit and counterparty risks, consist principally of investments and cash due from counterparties. The extent of the Portfolio’s exposure to credit and counterparty risks in respect to these financial assets approximates their value as recorded in the Portfolio’s Statement of Assets and Liabilities, less any collateral held by the Portfolio.
| 6. | Rule Issuance |
On July 23, 2014, the U.S. Securities and Exchange Commission (“SEC”) adopted amendments to the governing rules for money market funds. The amendments require that, following a two-year implementation timeframe, institutional prime and institutional tax exempt money market funds adopt a floating net asset value. The rule changes also allow for certain liquidity-based redemption fees and gate, and include enhanced requirements for disclosure and stress testing. The degree to which a money market fund will be impacted by the rule amendments will depend upon the type of fund and type of investors (retail or institutional). At this time, management is evaluating the implications of these amendments and their impact to the Portfolio’s financial statements and accompanying notes.
| 7. | Subsequent Events |
Management has evaluated the impact of all subsequent events on the Portfolio through the date the financial statements were available to be issued and has determined that there were no subsequent events requiring adjustment or disclosure in the financial statements.
42
Table of Contents
Report of Independent Registered Public Accounting Firm
To the Board of Trustees and Owners of Beneficial Interest of
State Street Master Funds:
We have audited the accompanying statement of assets and liabilities, including the schedule of investments, of State Street Money Market Portfolio (one of the portfolios constituting State Street Master Funds) (the “Portfolio”) as of December 31, 2015, and the related statement of operations for the year then ended, the statements of changes in net assets for each of the two years in the period then ended, and the financial highlights for each of the five years in the period then ended. These financial statements and financial highlights are the responsibility of the Portfolio’s management. Our responsibility is to express an opinion on these financial statements and financial highlights based on our audits.
We conducted our audits in accordance with the standards of the Public Company Accounting Oversight Board (United States). Those standards require that we plan and perform the audit to obtain reasonable assurance about whether the financial statements and financial highlights are free of material misstatement. We were not engaged to perform an audit of the Portfolio’s internal control over financial reporting. Our audits included consideration of internal control over financial reporting as a basis for designing audit procedures that are appropriate in the circumstances, but not for the purpose of expressing an opinion on the effectiveness of the Portfolio’s internal control over financial reporting. Accordingly, we express no such opinion. An audit also includes examining, on a test basis, evidence supporting the amounts and disclosures in the financial statements and financial highlights, assessing the accounting principles used and significant estimates made by management, and evaluating the overall financial statement presentation. Our procedures included confirmation of securities owned as of December 31, 2015, by correspondence with the custodian and others or by other appropriate auditing procedures where replies from others were not received. We believe that our audits provide a reasonable basis for our opinion.
In our opinion, the financial statements and financial highlights referred to above present fairly, in all material respects, the financial position of State Street Money Market Portfolio (one of the portfolios constituting State Street Master Funds) at December 31, 2015, the results of its operations for the year then ended, the changes in its net assets for each of the two years in the period then ended, and the financial highlights for each of the five years in the period then ended, in conformity with U.S. generally accepted accounting principles.
Boston, Massachusetts
February 26, 2016
43
Table of Contents
State Street Master Funds
State Street Money Market Portfolio
December 31, 2015 (Unaudited)
SHAREHOLDER EXPENSE EXAMPLE
As a shareholder of a fund, you incur two types of costs: (1) transaction costs, and (2) ongoing costs, including advisory and administration fees, among others. This example is intended to help you understand your ongoing costs (in dollars) of investing in a fund and to compare these costs with the ongoing costs of investing in other mutual funds. It is based on an investment of $1,000 made at the beginning of the period shown and held for the entire period from July 1, 2015 to December 31, 2015.
The table below illustrates your Portfolio’s costs in two ways:
| • | Actual Expenses. This section helps you to estimate the actual expenses that you paid over the period. The “Ending Account Value” shown is derived from the Portfolio’s actual return, and the third column shows the dollar amount that would have been paid by an investor who started with $1,000 in the Portfolio. You may use the information here, together with the amount you invested, to estimate the expenses that you paid over the period. To do so, simply divide your account value by $1,000 (for example, an $8,600 account value divided by $1,000 = 8.6), then multiply the result by the number given for the Portfolio under the heading “Expenses Paid During Period.” |
| • | Hypothetical Example for Comparison Purposes. This section is intended to help you compare your Portfolio’s costs with those of other mutual funds. It assumes that the Portfolio had a yearly return of 5% before expenses, but that the expense ratio is unchanged. In this case, because the return used is not the Portfolio’s actual return, the results do not apply to your investment. The example is useful in making comparisons because the Securities and Exchange Commission requires all mutual funds to calculate expenses based on a 5% return. You can assess your Portfolio’s costs by comparing this hypothetical example with the hypothetical examples that appear in shareholder reports of other funds. |
Six Months Ended December 31, 2015
Beginning July 1, 2015 | Ending Account Value December 31, | Expenses Paid During Period * | ||||||||||
Based on Actual Portfolio Return | $ | 1,000.00 | $ | 1,001.00 | $ | 0.35 | ||||||
Based on Hypothetical (5% return before expenses) | $ | 1,000.00 | $ | 1,024.85 | $ | 0.36 | ||||||
| * | The calculations are based on expenses incurred in the most recent six month period of the Portfolio. The Portfolio’s annualized expense ratio for the six months ended December 31, 2015 was 0.07%. |
| The dollar amounts shown as “Expenses Paid” are equal to the annualized expense ratio multiplied by the average account value over the period, multiplied by 184/365 (the most recent six month period). |
44
Table of Contents
State Street Master Funds
State Street Money Market Portfolio
Shareholder Requests for Additional Information
December 31, 2015 (Unaudited)
Proxy Voting Policies and Procedures and Record
The Portfolio has adopted the proxy voting policies of the Adviser. A description of the policies and procedures that the Portfolio have adopted to determine how to vote proxies relating to portfolio securities are contained in the Portfolio’s Statement of Additional Information, which is available (i) without charge, upon request, by calling the Portfolio at 1-877-521-4083, (ii) on the U.S. Securities and Exchange Commission’s website at www.sec.gov, or (iii) at the U.S. Securities and Exchange Commission’s public reference room. Information on the operation of the public reference room may be obtained by calling 1-800-SEC-0330. Information regarding how the Portfolio voted proxies, if any, during the most recent 12-month period ended June 30 is available by August 31 of each year without charge (1) by calling 1-877-521-4083 (toll free), or (2) on the website of the Securities and Exchange Commission (“SEC”) at www.sec.gov.
Quarterly Portfolio Schedule
The Portfolio will file their complete schedules of investments with the U.S. Securities and Exchange Commission for the first and third quarters of each fiscal year on Form N-Q. For the second and fourth quarters, the complete schedules of investments are available in the Portfolio’s semi-annual and annual financial statements. The Portfolio’s Form N-Q is available (i) without charge, upon request, by calling the Portfolio at 1-877-521-4083, (ii) on the Securities and Exchange Commission’s website at www.sec.gov, or (iii) at the Securities and Exchange Commission’s public reference room. Information on the operation of the public reference room may be obtained by calling 1-800-SEC-0330.
Monthly Portfolio Schedule
The Portfolio files its monthly portfolio holdings with the U.S. Securities and Exchange Commission on Form N-MFP. The SEC delays the public availability of the information filed on Form N-MFP for 60 days after the end of the reporting period included in the filing. The Portfolio’s Form N-MFP is available (i) on the U.S. Securities and Exchange Commission’s website at www.sec.gov, or ii) at the Securities and Exchange Commission’s public reference room.
45
Table of Contents
State Street Money Market Portfolio
Disclosure of Information about Fund Trustees and Officers
December 31, 2015 (Unaudited)
Name, Address, and Year of Birth | Position(s) Held | Term of Office Time Served | Principal Occupation During Past Five Years and Relevant Experience | Number of Funds in Fund Complex Overseen by Trustee | Other Directorships Held by Trustee During Past Five Years | |||||
Independent Trustees | ||||||||||
Michael F. Holland State Street Bank and 100 Huntington Avenue, CPH 0326 Boston, MA 02116 YOB: 1944 | Trustee and Co-Chairman of the Board | Term: Indefinite Elected: 7/99 | Chairman, Holland & Company L.L.C. (investment adviser) (1995 – present). | 75 | Director, the Holland Series Fund, Inc.; Director, The China Fund, Inc.; Director, The Taiwan Fund, Inc.; Director, Reaves Utility Income Fund, Inc.; and Director, Blackstone/GSO Loan Funds. | |||||
Patrick J. Riley State Street Bank and 100 Huntington Avenue, CPH 0326 Boston, MA 02116 YOB: 1948 | Trustee and Co-Chairman of the Board | Term: Indefinite Elected:1/14 | 2002 to May 2010, Associate Justice of the Superior Court, Commonwealth of Massachusetts; 1985 to 2002, Partner, Riley, Burke & Donahue, L.L.P. (law firm); 1998 to Present, Independent Director, State Street Global Advisers Ireland, Ltd. (investment company); 1998 to Present, Independent Director, SSGA Liquidity plc (formerly, SSGA Cash Management Fund plc); January 2009 to Present, Independent Director, SSGA Fixed Income plc; and January 2009 to Present, Independent Director, SSGA Qualified Funds PLC. | 75 | Board Director and Chairman, SPDR Europe 1PLC Board (2011 – Present); Board Director and Chairman, SPDR Europe II, PLC (2013 – Present). | |||||
William L. Boyan State Street Bank and 100 Huntington Avenue, CPH 0326 Boston, MA 02116 YOB: 1937 | Trustee and Co-Chairman of the Valuation Committee | Term: Indefinite Elected: 7/99 | President and Chief Operations Officer, John Hancock Financial Services (1959 – 1999). Mr. Boyan retired in 1999. Chairman Emeritus, Children’s Hospital, Boston, MA (1984 – 2011); Former Trustee of Old Mutual South Africa Master Trust (investments) (1995 – 2008); Former Chairman, Boston Plan For Excellence, Boston Public Schools (1995 – 2010); Member of Advisory Board of Florida Atlantic University Lifelong Learning Society. | 75 | Former Trustee of Old Mutual South Africa Master Trust. | |||||
William L. Marshall State Street Bank and 100 Huntington Avenue, CPH 0326 Boston, MA 02116 YOB: 1942 | Trustee and Co-Chairman of the Audit Committee | Term: Indefinite Elected: 1/14 | April 2011 to Present, Chairman (until April 2011, Chief Executive Officer and President), Wm. L. Marshall Associates, Inc., Wm. L. Marshall Companies, Inc. and the Marshall Financial Group, Inc. (a registered investment adviser and provider of financial and related consulting services); Certified Financial Planner; Member, Financial Planners Association; 2015 to present, Board Member, The Doylestown Health Foundation Board. | 75 | Marshall Financial Group, Inc. |
46
Table of Contents
State Street Master Funds
State Street Money Market Portfolio
Disclosure of Information about Fund Trustees and Officers — (continued)
December 31, 2015 (Unaudited)
Name, Address, and Year of Birth | Position(s) Held | Term of Office Time Served | Principal Occupation During Past Five Years and Relevant Experience | Number of Funds in Fund Complex Overseen by Trustee | Other Directorships Held by Trustee During Past Five Years | |||||
Independent Trustees (continued) | ||||||||||
Richard D. Shirk State Street Bank and 100 Huntington Avenue, CPH 0326 Boston, MA 02116 YOB: 1945 | Trustee and Co-Chairman of the Qualified Legal and Compliance Committee | Term: Indefinite Elected: 1/14 | March 2001 to April 2002, Chairman (1996 to March 2001, President and Chief Executive Officer), Cerulean Companies, Inc. (holding company) (Retired); 1992 to March 2001, President and Chief Executive Officer, Blue Cross Blue Shield of Georgia (health insurer, managed healthcare); 1998 to December 2008, Chairman, Board Member and December 2008 to Present, Investment Committee Member, Healthcare Georgia Foundation (private foundation); September 2002 to 2012, Lead Director and Board Member, Amerigroup Corp. (managed health care); 1999 to 2013, Board Member and (since 2001) Investment Committee Member, Woodruff Arts Center; and 2003 to 2009, Trustee, Gettysburg College. | 75 | Board member, AeroCare Holdings (privately held healthcare services company) (February 2003 – Present); Board member, Regenesis Biomedical (health care services) (April 2012 –Present); Chairman (January 2014 – Present). | |||||
Rina K. Spence State Street Bank and 100 Huntington Avenue, CPH 0326 Boston, MA 02116 YOB: 1948 | Trustee and Co-Chairman of the Qualified Legal and Compliance Committee and Co-Chairman of the Governance Committee | Term: Indefinite Elected: 7/99 | President of SpenceCare International LLC (international healthcare consulting) (1999 – present); Chief Executive Officer, IEmily.com (health internet company) (2000 – 2001); Chief Executive Officer of Consensus Pharmaceutical, Inc. (1998 – 1999); Founder, President and Chief Executive Officer of Spence Center for Women’s Health (1994 – 1998); President and CEO Emerson Hospital (1984 – 1994); Trustee, Eastern Enterprise (utilities) (1988 – 2000); Director, Berkshire Life Insurance Company of America (1993 – 2009); Honorary Consul for Monaco in Boston (2015 –present). | 75 | ||||||
47
Table of Contents
State Street Master Funds
State Street Money Market Portfolio
Disclosure of Information about Fund Trustees and Officers — (continued)
December 31, 2015 (Unaudited)
Name, Address, and Year of Birth | Position(s) Held | Term of Office Time Served | Principal Occupation During Past Five Years and Relevant Experience | Number of Funds in Fund Complex Overseen by Trustee | Other Directorships Held by Trustee During Past Five Years | |||||
Independent Trustees (continued) | ||||||||||
Bruce D. Taber State Street Bank and 100 Huntington Avenue, CPH 0326 Boston, MA 02116 YOB: 1943 | Trustee and Co-Chairman of the Valuation Committee and Co-Chairman of the Governance Committee | Term: Indefinite Elected: 1/14 | 1999 to Present, Partner, Zenergy LLC (a technology company providing Computer Modeling and System Analysis to the General Electric Power Generation Division); Until December 2008, Independent Director, SSGA Cash Management Fund plc; Until December 2008, Independent Director, State Street Global Advisers Ireland, Ltd. (investment companies); and Until August 1994, President, Alonzo B. Reed, Inc., (a Boston architect-engineering firm). | 75 | ||||||
Douglas T. Williams State Street Bank and 100 Huntington Avenue, CPH 0326 Boston, MA 02116 YOB: 1940 | Trustee and Co-Chairman of the Audit Committee | Term: Indefinite Elected: 7/99 | President, Oakmont Homeowners Association; President, Mariner Sands Chapel; Executive Vice President and member of Executive Committee, Chase Manhattan Bank (1987 – 1999); President, Boston Stock Exchange Depository Trust Company, 1981 – 1982; Treasurer, Nantucket Educational Trust, (2002 – 2007). | 75 | ||||||
Interested Trustee(1) | ||||||||||
James E. Ross SSGA Funds Management, Inc. State Street Financial Center One Lincoln Street Boston, MA 02111 YOB: 1965 | Trustee | Term: Indefinite Elected Trustee: 2/07 | Chairman and Director, SSGA Funds Management, Inc. (2012 – present); President, SSGA Funds Management, Inc. (2005 – 2012); Executive Vice President and Senior Managing Director, State Street Global Advisors (2006 –present); and Principal, State Street Global Advisors (2006 – present). | 290 | Trustee, SPDR Series Trust; Trustee, SPDR Index Shares Funds; Trustee, Select Sector SPDR Trust; Trustee, SSGA Active Trust; and Trustee, SSGA Master Trust. | |||||
| (1) | Mr. Ross is an Interested Trustee because of his employment by SSGA Funds Management, Inc., an affiliate of the Trust. |
Name, Address, and Year of Birth | Position(s) Held | Term of Office Time Served | Principal Occupation During Past Five Years | |||
Officers: | ||||||
Ellen M. Needham SSGA Funds Management, Inc. State Street Financial Center One Lincoln Street Boston, MA 02111 YOB: 1967 | President | Term: Indefinite Elected: 10/12 | President and Director, SSGA Funds Management, Inc. (June 2012 – present); Chief Operating Officer, SSGA Funds Management, Inc. (May 2010 – June 2012); Senior Managing Director, SSGA Funds Management, Inc. (1992 – 2012) and Senior Managing Director, State Street Global Advisors (1992 – present).* | |||
48
Table of Contents
State Street Master Funds
State Street Money Market Portfolio
Disclosure of Information about Fund Trustees and Officers — (continued)
December 31, 2015 (Unaudited)
Name, Address, and Year of Birth | Position(s) Held | Term of Office Time Served | Principal Occupation During Past Five Years | |||
Officers: (continued) | ||||||
Bruce S. Rosenberg SSGA Funds Management, Inc. State Street Financial Center One Lincoln Street Boston, MA 02111 YOB: 1961 | Treasurer | Term: Indefinite Elected: 2/16 | Managing Director, State Street Global Advisors and SSGA Funds Management, Inc. (July 2015 – present); Director, Credit Suisse (April 2008 – July 2015). | |||
Ann M. Carpenter SSGA Funds Management, Inc. State Street Financial Center One Lincoln Street Boston, MA 02111 YOB: 1966 | Vice President Deputy Treasurer | Term: Indefinite Elected: 10/12 Term: Indefinite Elected: 2/16 | Chief Operating Officer, SSGA Funds Management, Inc. (April 2014 – present); Vice President, State Street Global Advisors and SSGA Funds Management, Inc. (2005 – present).* | |||
Chad C. Hallett SSGA Funds Management, Inc. State Street Financial Center One Lincoln Street Boston, MA 02111 YOB: 1969 | Deputy Treasurer | Term: Indefinite Elected: 2/16 | Vice President, State Street Global Advisors and SSGA Funds Management, Inc. (November 2014 – present); Vice President, State Street Bank and Trust Company (2001 – November 2014).* | |||
Sujata Upreti SSGA Funds Management, Inc. State Street Financial Center One Lincoln Street Boston, MA 02111 YOB: 1974 | Assistant Treasurer | Term: Indefinite Elected: 2/16 | Vice President, State Street Global Advisors and SSGA Funds Management, Inc. (May 2015 – present); Assistant Director, Cambridge Associates, LLC (July 2014 – January 2015); Vice President, Bank of New York Mellon (July 2012 – August 2013); Manager, PricewaterhouseCoopers, LLP (September 2009 – July 2012). | |||
Daniel Foley SSGA Funds Management, Inc. State Street Financial Center One Lincoln Street Boston, MA 02111 YOB: 1972 | Assistant Treasurer | Term: Indefinite Elected: 2/16 | Vice President, State Street Global Advisors and SSGA Funds Management, Inc. (April 2014– present); Principal, State Street Global Advisors and SSGA Funds Management, Inc. (April 2007 – April 2014). | |||
Brian Harris SSGA Funds Management, Inc. One Lincoln Street Boston, MA 02111 YOB: 1973 | Chief Compliance Officer | Term: Indefinite Elected: 11/13 | Vice President, State Street Global Advisors and SSGA Funds Management, Inc.( June 2013 – Present); Senior Vice President and Global Head of Investment Compliance, BofA Global Capital Management (September 2010 to May 2013); Director of Compliance, AARP Financial Inc. (July 2008 to August 2010). | |||
Trevor Swanberg SSGA Funds Management, Inc. State Street Financial Center One Lincoln Street Boston, MA 02111 YOB: 1979 | Code of Ethics Compliance Officer | Term: Indefinite Elected:8/15 | Vice President, State Street Global Advisors and SSGA Funds Management, Inc. (January 2015 – Present); Senior Manager-Mutual Fund Compliance, ICMA-Retirement Corporation (December 2011 –January 2015); Assistant Vice President, J.P. Morgan (September 2007 – December 2011). | |||
Joshua A. Weinberg SSGA Funds Management, Inc. State Street Financial Center One Lincoln Street Boston, MA 02111 YOB: 1978 | Chief Legal Officer | Term: Indefinite Elected: 2/15 | Vice President and Managing Counsel, State Street Global Advisors (2011 – present); Clerk, SSGA Funds Management, Inc. (2013 – present); Associate, Financial Services Group, Dechert LLP (2006 – 2011). | |||
49
Table of Contents
State Street Master Funds
State Street Money Market Portfolio
Disclosure of Information about Fund Trustees and Officers — (continued)
December 31, 2015 (Unaudited)
Name, Address, and Year of Birth | Position(s) Held | Term of Office Time Served | Principal Occupation During Past Five Years | |||
Officers: (continued) | ||||||
David K. James State Street Bank and Trust Company 100 Huntington Avenue, 3rd Floor Boston, MA 02116 YOB: 1970 | Secretary | Term: Indefinite Elected: 4/13 | Managing Director and Managing Counsel, State Street Bank and Trust Company (2009 – present); Vice President and Counsel, PNC Global Investment Servicing (US), Inc. (2006 – 2009). | |||
Kristin Schantz State Street Bank and Trust Company 100 Huntington Avenue, 3rd Floor Boston, MA 02116 YOB: 1979 | Assistant Secretary | Term: Indefinite Elected: 2/14 | Vice President and Counsel, State Street Bank and Trust Company (2013 – present); Vice President, Citi Fund Services Ohio, Inc. (2008 – 2013). | |||
| * | Served in various capacities and/or with various affiliated entities during noted time period. |
50
Table of Contents
Trustees
William L. Boyan
Michael F. Holland
William L. Marshall
Patrick J. Riley
James E. Ross
Richard D. Shirk
Rina K. Spence
Bruce D. Taber
Douglas T. Williams
Investment Adviser and Administrator
SSGA Funds Management, Inc.
State Street Financial Center
One Lincoln Street
Boston, MA 02111
Custodian, Sub-Administrator and Transfer Agent
State Street Bank and Trust Company
State Street Financial Center
One Lincoln Street
Boston, MA 02111
Independent Registered Public Accounting Firm
Ernst & Young LLP
200 Clarendon Street
Boston, MA 02116
Legal Counsel
Ropes & Gray LLP
800 Boylston Street
Boston, MA 02199
This report is for shareholder information. This is not a prospectus intended for use in the purchase or sale of shares of beneficial interest.
State Street Master Funds State Street Bank and Trust Company P.O. Box 5049 Boston, MA 02206 | SSITINVAR IBG-18443 |
Table of Contents
Annual Report
31 December 2015
State Street Institutional Investment Trust
State Street Institutional Treasury Money Market Fund

Table of Contents
State Street Institutional Investment Trust
State Street Institutional Treasury Money Market Fund
Annual Report
December 31, 2015
| 1 | ||||
| 2 | ||||
| 3 | ||||
| 4 | ||||
| 6 | ||||
| 12 | ||||
| 13 | ||||
| 14 | ||||
| 15 | ||||
Table of Contents
State Street Institutional Investment Trust
State Street Institutional Treasury Money Market Fund
Statement of Assets and Liabilities
December 31, 2015
Assets |
| |||
Investments in corresponding Portfolio, at market value and cost (Note 1) | $ | 11,138,158,172 | ||
Cash | 3,764 | |||
Receivable for Fund shares sold | 28,676 | |||
Receivable from Adviser (Note 3) | 305,625 | |||
Prepaid expenses and other assets | 13,252 | |||
|
| |||
Total assets | 11,138,509,489 | |||
Liabilities | ||||
Administration and custody fees payable (Note 3) | 480,043 | |||
Shareholder servicing fee payable (Note 3) | 151,827 | |||
Registration and filing fees payable | 113,999 | |||
Distribution fees payable (Note 3) | 60,731 | |||
Professional fees payable | 9,421 | |||
Transfer agent fees payable | 2,462 | |||
Dividends payable | 16,124 | |||
Accrued expenses and other liabilities | 25,860 | |||
|
| |||
Total liabilities | 860,467 | |||
|
| |||
Net Assets | $ | 11,137,649,022 | ||
|
| |||
Net Assets Consist of: | ||||
Paid-in capital | $ | 11,137,607,755 | ||
Accumulated net realized gain | 41,267 | |||
|
| |||
Net Assets | $ | 11,137,649,022 | ||
|
| |||
Net Assets | ||||
Premier Class | $ | 10,412,966,455 | ||
|
| |||
Investment Class | $ | 724,682,567 | ||
|
| |||
Shares of Beneficial Interest Outstanding | ||||
Premier Class | 10,413,041,670 | |||
|
| |||
Investment Class | 724,666,847 | |||
|
| |||
Offering, Net Asset Value, and Redemption Price Per Share | ||||
Premier Class | $ | 1.00 | ||
|
| |||
Investment Class | $ | 1.00 | ||
|
| |||
See accompanying notes to financial statements and financial statements of corresponding portfolio.
1
Table of Contents
State Street Institutional Investment Trust
State Street Institutional Treasury Money Market Fund
Year Ended December 31, 2015
Income |
| |||
Interest income allocated from Portfolio (Note 2) | $ | 4,056,143 | ||
Expenses allocated from Portfolio (Note 2) | (6,972,810 | ) | ||
|
| |||
| (2,916,667 | ) | |||
|
| |||
Expenses | ||||
Administration fees (Note 3) | 5,285,419 | |||
Shareholder servicing fee – Investment Class (Note 3) | 1,732,375 | |||
Distribution fees – Investment Class (Note 3) | 692,950 | |||
Trustees’ fees and expenses | 16,033 | |||
Registration and filing fees | 54,788 | |||
Professional fees | 28,223 | |||
Transfer agent fees (Note 3) | 47,663 | |||
Printing fees | 47,251 | |||
Other expenses | 210,004 | |||
|
| |||
Total expenses | 8,114,706 | |||
Less: Expenses reimbursed by the Adviser (Note 3) | (8,650,278 | ) | ||
Shareholder servicing fees waived – Investment Class (Note 3) | (1,732,375 | ) | ||
Distribution fees waived – Investment Class (Note 3) | (692,950 | ) | ||
|
| |||
Net expenses | (2,960,897 | ) | ||
|
| |||
Net Investment Income | 44,230 | |||
|
| |||
Net realized gain on investments allocated from Portfolio | 112,061 | |||
|
| |||
Net Increase in Net Assets Resulting from Operations | $ | 156,291 | ||
|
| |||
See accompanying notes to financial statements and financial statements of corresponding portfolio.
2
Table of Contents
State Street Institutional Investment Trust
State Street Institutional Treasury Money Market Fund
Statements of Changes in Net Assets
| Year Ended December 31, 2015 | Year Ended December 31, 2014 | |||||||
Increase (Decrease) in Net Assets Resulting from: | ||||||||
Operations: | ||||||||
Net investment income | $ | 44,230 | $ | – | ||||
Net realized gain on investments | 112,061 | 117,085 | ||||||
|
|
|
| |||||
Net increase in net assets from operations | 156,291 | 117,085 | ||||||
|
|
|
| |||||
Distributions to Shareholders from: | ||||||||
Net investment income | ||||||||
Premier Class | (124,494 | ) | – | |||||
|
|
|
| |||||
Net realized gain on investments | ||||||||
Premier Class | – | (115,556 | ) | |||||
Investment Class | – | (10,904 | ) | |||||
|
|
|
| |||||
Total distributions | (124,494 | ) | (126,460 | ) | ||||
|
|
|
| |||||
Net Increase (Decrease) from Capital Share Transactions: |
| |||||||
Premier Class | ||||||||
Shares sold | 34,794,959,292 | 31,975,975,514 | ||||||
Reinvestment of distributions | 108,212 | 95,741 | ||||||
Shares redeemed | (32,720,944,051 | ) | (35,586,824,951 | ) | ||||
|
|
|
| |||||
Net increase (decrease) from capital share transactions | 2,074,123,453 | (3,610,753,696 | ) | |||||
|
|
|
| |||||
Investment Class | ||||||||
Shares sold | 1,531,621,992 | 1,670,573,898 | ||||||
Reinvestment of distributions | – | 19 | ||||||
Shares redeemed | (1,548,193,858 | ) | (2,336,534,788 | ) | ||||
|
|
|
| |||||
Net decrease from capital share transactions | (16,571,866 | ) | (665,960,871 | ) | ||||
|
|
|
| |||||
Net Increase (Decrease) in Net Assets | 2,057,583,384 | (4,276,723,942 | ) | |||||
Net Assets | ||||||||
Beginning of year | 9,080,065,638 | 13,356,789,580 | ||||||
|
|
|
| |||||
End of year | $ | 11,137,649,022 | $ | 9,080,065,638 | ||||
|
|
|
| |||||
Undistributed (Distributions in excess of) net investment income | $ | – | $ | – | ||||
|
|
|
| |||||
Changes in Shares: | ||||||||
Premier Class | ||||||||
Shares sold | 34,794,959,292 | 31,975,975,514 | ||||||
Reinvestment of distributions | 108,212 | 95,741 | ||||||
Shares redeemed | (32,720,944,051 | ) | (35,586,824,951 | ) | ||||
|
|
|
| |||||
Net increase (decrease) in shares | 2,074,123,453 | (3,610,753,696 | ) | |||||
|
|
|
| |||||
Investment Class | ||||||||
Shares sold | 1,531,621,992 | 1,670,573,898 | ||||||
Reinvestment of distributions | – | 19 | ||||||
Shares redeemed | (1,548,193,859 | ) | (2,336,534,788 | ) | ||||
|
|
|
| |||||
Net decrease in shares | (16,571,867 | ) | (665,960,871 | ) | ||||
|
|
|
| |||||
See accompanying notes to financial statements and financial statements of corresponding portfolio.
3
Table of Contents
State Street Institutional Investment Trust
State Street Institutional Treasury Money Market Fund
Selected data for a share of beneficial interest outstanding throughout each year is presented below(a):
Year Ended December 31, | Net Asset Value Beginning of Year | Net Investment Income/(Loss) | Gain on Investments | Total from Investment Operations | Distributions from Net Investment Income | Distributions from Capital Gains | Total Distributions | |||||||||||||||||||||
Premier Class | ||||||||||||||||||||||||||||
2015 | $ | 1.0000 | $ | 0.0000 | (d) | $ | 0.0000 | (d) | $ | 0.0000 | (d) | $ | (0.0000 | )(d) | $ | – | $ | (0.0000 | )(d) | |||||||||
2014 | $ | 1.0000 | $ | – | $ | 0.0000 | (d) | $ | 0.0000 | (d) | $ | – | $ | (0.0000 | )(d) | $ | (0.0000 | )(d) | ||||||||||
2013 | $ | 1.0000 | $ | 0.0000 | (d) | $ | 0.0000 | (d) | $ | 0.0000 | (d) | $ | (0.0000 | )(d) | $ | (0.0000 | )(d) | $ | (0.0000 | )(d) | ||||||||
2012 | $ | 1.0000 | $ | 0.0000 | (d) | $ | 0.0000 | (d) | $ | 0.0000 | (d) | $ | – | $ | (0.0000 | )(d) | $ | (0.0000 | )(d) | |||||||||
2011 | $ | 1.0000 | $ | 0.0001 | $ | 0.0000 | (d) | $ | 0.0001 | $ | (0.0001 | ) | $ | – | $ | (0.0001 | ) | |||||||||||
Investment Class | ||||||||||||||||||||||||||||
2015 | $ | 1.0000 | $ | 0.0000 | (d) | $ | 0.0000 | (d) | $ | 0.0000 | (d) | $ | – | $ | – | $ | – | |||||||||||
2014 | $ | 1.0000 | $ | (0.0010 | ) | $ | 0.0010 | $ | 0.0000 | (d) | $ | – | $ | (0.0000 | )(d) | $ | (0.0000 | )(d) | ||||||||||
2013 | $ | 1.0000 | $ | 0.0000 | (d) | $ | 0.0000 | (d) | $ | 0.0000 | (d) | $ | (0.0000 | )(d) | $ | (0.0000 | )(d) | $ | (0.0000 | )(d) | ||||||||
2012 | $ | 1.0000 | $ | 0.0000 | (d) | $ | 0.0000 | (d) | $ | 0.0000 | (d) | $ | – | $ | (0.0000 | )(d) | $ | (0.0000 | )(d) | |||||||||
2011 | $ | 1.0000 | $ | 0.0000 | (d) | $ | 0.0000 | (d) | $ | 0.0000 | (d) | $ | (0.0000 | )(d) | $ | – | $ | (0.0000 | )(d) | |||||||||
| (a) | The per share amounts and percentages include the Fund’s proportionate share of income and expenses of the Portfolio. |
| (b) | Total return is calculated assuming a purchase of shares at net asset value on the first day and a sale at net asset value on the last day of each period reported. Distributions are assumed, for the purpose of this calculation, to be reinvested at net asset value per share on the respective payment dates. Results represent past performance and are not indicative of future results. |
| (c) | This expense waiver is reflected in both the net operating expense and the net investment income ratios shown above. Without these waivers, net investment income would have been lower. |
| (d) | Amount is less than $0.00005 per share. |
| (e) | Amount is less than 0.005%. |
See accompanying notes to financial statements and financial statements of corresponding portfolio.
4
Table of Contents
Year Ended December 31, | Net Asset Value End of Year | Ratios to Average Net Assets/Supplemental Data(a) | Net Assets End of Year (000s omitted) | |||||||||||||||||||||||||
| Total Return(b) | Gross Expenses | Net Expenses | Net Investment Income | Expense Waiver(c) | ||||||||||||||||||||||||
Premier Class | ||||||||||||||||||||||||||||
2015 | $ | 1.0000 | 0.00 | %(e) | 0.12 | % | 0.04 | % | 0.00 | %(e) | 0.08 | % | $ | 10,412,966 | ||||||||||||||
2014 | $ | 1.0000 | 0.00 | %(e) | 0.12 | % | 0.04 | % | 0.00 | %(e) | 0.08 | % | $ | 8,338,818 | ||||||||||||||
2013 | $ | 1.0000 | 0.00 | %(e) | 0.12 | % | 0.07 | % | 0.00 | %(e) | 0.05 | % | $ | 11,949,583 | ||||||||||||||
2012 | $ | 1.0000 | 0.00 | %(e) | 0.12 | % | 0.08 | % | 0.00 | %(e) | 0.04 | % | $ | 10,151,078 | �� | |||||||||||||
2011 | $ | 1.0000 | 0.01 | % | 0.13 | % | 0.03 | % | 0.00 | %(e) | 0.10 | % | $ | 9,426,334 | ||||||||||||||
Investment Class | ||||||||||||||||||||||||||||
2015 | $ | 1.0000 | 0.00 | %(e) | 0.47 | % | 0.04 | % | 0.00 | %(e) | 0.43 | % | $ | 724,683 | ||||||||||||||
2014 | $ | 1.0000 | 0.00 | %(e) | 0.47 | % | 0.05 | % | 0.00 | %(e) | 0.42 | % | $ | 741,248 | ||||||||||||||
2013 | $ | 1.0000 | 0.00 | %(e) | 0.47 | % | 0.07 | % | 0.00 | %(e) | 0.40 | % | $ | 1,407,207 | ||||||||||||||
2012 | $ | 1.0000 | 0.00 | %(e) | 0.47 | % | 0.08 | % | 0.00 | %(e) | 0.39 | % | $ | 1,475,932 | ||||||||||||||
2011 | $ | 1.0000 | 0.00 | %(e) | 0.48 | % | 0.05 | % | 0.00 | %(e) | 0.43 | % | $ | 1,381,305 | ||||||||||||||
See accompanying notes to financial statements and financial statements of corresponding portfolio.
5
Table of Contents
State Street Institutional Investment Trust
State Street Institutional Treasury Money Market Fund
December 31, 2015
| 1. | Organization |
State Street Institutional Investment Trust (the “Trust”) is registered under the Investment Company Act of 1940, as amended (the “1940 Act”), as an open-end management investment company, and was organized as a business trust under the laws of the Commonwealth of Massachusetts on February 16, 2000. The Trust consists of forty-five (45) series and corresponding classes, each of which have the same rights and privileges, including the same voting rights. Each series is authorized to issue an unlimited number of shares, with no par value. The financial statements herein relate to the following fund (the “Fund”):
| Fund | Classes | Commencement of Operations: | ||
State Street Institutional Treasury Money Market Fund | Administration Class Institutional Class Investment Class Investor Class Premier Class Service Class | Not commenced Not commenced October 25, 2007 Not commenced October 25, 2007 Not commenced |
The Fund is part of a master-feeder investment structure and invests all of its investable assets in interests of its master portfolio (the “Portfolio”) as reflected in the table below. The investment objective and policies of the Portfolio are substantially similar to those of the Fund. The value of the Fund’s investment in its Portfolio reflects the Fund’s proportionate interest in the net assets of the Portfolio. The performance of the Fund is directly affected by the performance of the Portfolio. The financial statements of the Portfolio, including its Schedule of Investments, are attached to this report and should be read in conjunction with the Fund’s financial statements.
| Fund | % Investment in Master | Portfolio | ||
State Street Institutional Treasury Money Market Fund | 94.10% | State Street Treasury Money Market Portfolio* |
| * | A series of the State Street Master Funds |
The State Street Institutional Treasury Money Market Fund is considered to be a money market fund pursuant to Rule 2a-7 under the 1940 Act. It is the Fund’s policy, as a money market fund, to maintain a stable net asset value per share of $1.00. However, there is no assurance the Fund will be able to maintain a stable net asset value per share.
An investment in the Fund is not insured or guaranteed by the Federal Deposit Insurance Corporation or any other government agency. Although the Fund seeks to preserve the value of shareholders’ investment at $1.00 per share, it is possible to lose money by investing in the Fund.
Under the Trust’s organizational documents, its officers and trustees are indemnified against certain liabilities arising out of the performance of their duties to the Trust. Additionally, in the normal course of business, the Trust enters into contracts with service providers that contain general indemnification clauses. The Trust’s maximum exposure under these arrangements is unknown as this could involve future claims that may be made against the Trust that have not yet occurred.
6
Table of Contents
State Street Institutional Investment Trust
State Street Institutional Treasury Money Market Fund
Notes to Financial Statements — (continued)
December 31, 2015
| 2. | Summary of Significant Accounting Policies |
The following is a summary of significant accounting policies followed by the Trust in the preparation of its financial statements:
The preparation of financial statements in accordance with U.S. generally accepted accounting principles (“U.S. GAAP”) requires management to make estimates and assumptions that affect the reported amounts and disclosures in the financial statements. Actual results could differ from those estimates. The Fund is an investment company under U.S. GAAP and follows the accounting and reporting guidance applicable to investment companies in Financial Accounting Standards Board (“FASB”) Accounting Standards Codification (“ASC”) 946, Financial Services Investment Companies (“ASC 946”).
Security valuation – The Fund records its investment in the Portfolio at value. The valuation policy of the Portfolio is discussed in Note 2 of the Portfolio’s Notes to Financial Statements, which are attached to this report.
The Portfolio’s investments are valued at fair value each day that the Portfolio’s listing exchange is open and, for financial reporting purposes, as of the report date should the reporting period end on a day that the Portfolio’s listing exchange is not open. Fair value is generally defined as the price a fund would receive to sell an asset or pay to transfer a liability in an orderly transaction between market participants at the measurement date. By its nature, a fair value price is a good faith estimate of the valuation in a current sale and may not reflect an actual market price. The investments of the Portfolio are valued pursuant to the policy and procedures developed by the Oversight Committee (the “Committee”) and approved by the Board of Trustees of the Trust (the “Board”). The Committee provides oversight of the valuation of investments for the Fund. The summary of the inputs used for the Portfolio, as of December 31, 2015, in valuing the Portfolio’s assets carried at fair value are discussed in Note 2 of the Portfolio’s Notes to Financial Statements, which are attached to this report.
Investment transactions and income recognition – Investment transactions are accounted for on trade date for financial reporting purposes. Net investment income consists of the Fund’s pro-rata share of the net investment income of the Portfolio, less all expenses of the Fund. Dividends from net investment income are declared daily and are payable as of the last business day of each month. Realized gains and losses from security transactions consist of the Fund’s pro-rata share of the Portfolio’s realized gains and losses. Distributions from capital gains, if any, are distributed annually. Class specific distribution and shareholder servicing fees are borne by each class. Income, non-class specific expenses, and realized gains and losses are allocated to the respective classes daily on the basis of relative net assets.
Expenses – Certain expenses, which are directly identifiable to a specific fund, are applied to that fund within the Trust. Other expenses which cannot be attributed to a specific fund are allocated in such a manner as deemed equitable, taking into consideration the nature and type of expense and the relative net assets of the funds within the Trust.
Federal income taxes – The Fund has qualified and intends to continue to qualify for and elect treatment as a “regulated investment company” under Subchapter M of the Internal Revenue Code of 1986, as amended. By so qualifying and electing, the Fund will not be subject to federal income taxes to the extent it distributes its taxable income, including any net realized capital gains, for each fiscal year.
7
Table of Contents
State Street Institutional Investment Trust
State Street Institutional Treasury Money Market Fund
Notes to Financial Statements — (continued)
December 31, 2015
In addition, by distributing during each calendar year substantially all of its net investment income and capital gains, if any, the Fund will not be subject to federal excise tax. Income and capital gain distributions, if any, are determined in accordance with income tax regulation which may differ from U.S. GAAP.
At December 31, 2015, the cost of investments for federal income tax purposes was substantially the same as the cost for financial reporting purposes.
SSGA Funds Management, Inc. (“SSGA FM” or the “Adviser) has reviewed the Fund’s tax positions for the open tax years as of December 31, 2015, and has determined that no provision for income tax is required in the Fund’s financial statements. The Fund’s federal tax returns for the prior three fiscal years remain subject to examination by the Fund’s major tax jurisdictions, which include the United States of America and the Commonwealth of Massachusetts. The Fund recognizes interest and penalties, if any, related to tax liabilities as income tax expense in the Statements of Operations. No income tax returns are currently under examination. Management has analyzed tax laws and regulations and their applications to the Fund’s facts and circumstances and does not believe there are any uncertain tax positions that require recognition of tax liability.
For the year ended December 31, 2015, permanent differences identified and reclassified among the components of net assets were as follows:
Paid-In Capital | Accumulated Gain (Loss) | Undistributed Net Investment Income (Loss) | ||||||||||
State Street Institutional Treasury Money Market Fund | $ | – | $ | (80,264 | ) | $ | 80,264 | |||||
These differences were primarily attributable to distribution redesignations, net operating loss, non-deductible tax paid and distributions in excess of current earnings. Net investment income (loss), net realized gains (losses), and net assets were not affected by this reclassification.
The tax character of distributions paid to shareholders during the years ended December 31, 2015, and December 31, 2014, was as follows:
| December 31, 2015 | December 31, 2014 | |||||||||||
Ordinary Income | Tax Exempt Income | Long Term Capital Gain | Ordinary Income | Tax Exempt Income | Long Term Capital Gain | |||||||
State Street Institutional Treasury Money Market Fund | $124,494 | $– | $– | $126,460 | $– | $– | ||||||
At December 31, 2015, the components of distributable earnings on a tax basis were as follows:
| Undistributed Ordinary Income | Undistributed Tax Exempt Income | Capital Loss Carryover | Total | |||||||||||||
State Street Institutional Treasury Money Market Fund | $ | 41,267 | $ | – | $ | – | $ | 41,267 | ||||||||
8
Table of Contents
State Street Institutional Investment Trust
State Street Institutional Treasury Money Market Fund
Notes to Financial Statements — (continued)
December 31, 2015
| 3. | Related Party and Other Fees |
The Portfolio retained SSGA FM, a subsidiary of State Street Corporation and an affiliate of State Street Bank and Trust Company (“State Street”), as its investment adviser. The Portfolio has entered into an investment advisory agreement with the Adviser, under which the Adviser directs the investments of the Portfolio in accordance with its investment objectives, policies, and limitations. In compensation for the Adviser’s services as investment adviser, the Portfolio pays the Adviser a management fee at an annual rate of 0.05% of its average daily net assets.
SSGA FM may reimburse expenses or waive fees in order to avoid a negative yield. Any such waiver or reimbursement would be voluntary and may be revised or cancelled at any time without notice. For the year ended December 31, 2015, SSGA FM voluntarily waived $8,650,278.
Under the terms of the reimbursement agreement the Fund agrees to repay SSGA FM up to the amount of fees waived or expenses reduced under the agreement provided that a Fund is not obligated to reimburse SSGA FM (1) more than three years after the end of the fiscal year of the Fund in which SSGA FM provided a voluntary reduction; (2) in respect of any business day for which the net annualized one-day yield of such Fund is less than 0.00%; (3) to the extent that the amount of the reimbursement to SSGA FM on any day exceeds fifty percent of the yield (net of all expenses, exclusive of the reimbursement) of the Fund on that day; (4) to the extent that the amount of the reimbursement would cause the Fund’s net yield to fall below a certain minimum net yield; or (5) in respect of any such fee waivers and/or expense reimbursements that are necessary to maintain a limit on a Fund’s expenses per contractual fee waivers and/or reimbursements by SSGA FM which are effective at the time of such fee waivers and/or expense reimbursements. As of December 31, 2015, SSGA FM has not recouped any expenses from the Fund. Waived/reduced fees subject to potential recovery by year of expiration are as follows:
| Expiration Date | Amount | |||
12/31/2016 | $ | 6,058,938 | ||
12/31/2017 | 7,917,168 | |||
12/31/2018 | 8,650,278 | |||
Pursuant to the administration agreement, the Fund pays a fee at an annual rate of 0.05% of its net assets accrued daily to SSGA FM. The Fund pays State Street an annual fee for custody and accounting services. Pursuant to the sub-administration agreement, SSGA FM pays an annual fee to State Street for services provided to the Fund.
The Fund’s Investment Class has adopted a plan of distribution pursuant to Rule 12b-1 under the 1940 Act (the “Rule 12b-1 Plan”). Under the Rule 12b-1 Plan, the Fund compensates financial intermediaries in connection with the distribution of Fund shares and for services provided to the Fund’s shareholders. The Fund’s Investment Class Shares may make payments under the Rule 12b-1 Plan at an annual rate up to 0.10% of eligible average daily net assets of the Investment Class Shares. State Street Global Markets LLC (“SSGM” or the “Distributor”), a subsidiary of State Street Corporation, is the Fund’s Distributor.
9
Table of Contents
State Street Institutional Investment Trust
State Street Institutional Treasury Money Market Fund
Notes to Financial Statements — (continued)
December 31, 2015
During the year ended December 31, 2015, the Fund was charged $692,950 but did not make any payments to SSGM under the Rule 12b-1 Plan, as SSGM voluntarily agreed to waive the entire amount of the Rule 12b-1 fees.
Wealth Management Services (“WMS”), a division of State Street, is among the financial intermediaries who may receive fees under the Rule 12b-1 Plan. During the year ended December 31, 2015, SSGM did not make any payments to WMS.
Under the Fund’s Shareholder Servicing Plan, the Fund compensates financial intermediaries for providing certain services to shareholders and for maintaining shareholder accounts. The Fund’s Investment Class Shares made payments under the Shareholder Servicing Plan at an annual rate up to 0.25% of the eligible average daily net assets of the Investment Class Shares. During the year ended December 31, 2015, the Fund paid SSGM $97,257 under the shareholder servicing agreement which SSGM subsequently paid to financial intermediaries.
During the year ended December 31, 2015, SSGM voluntarily agreed to waive shareholder services fees of $1,732,375.
WMS is among the financial intermediaries who may receive fees under the shareholder serving agreement. For the year ended December 31, 2015, WMS received payment of $97,257.
Boston Financial Data Services (“BFDS”), a joint venture of DST Systems, Inc. and State Street Corporation, serves as transfer agent and dividend paying agent to the Fund. For these services, the Fund pays annual account services fees, activity-based fees, and charges related to compliance and regulatory services.
| 4. | Trustees’ Fees |
Independent Trustees are compensated on a calendar year basis. Any Trustee who is deemed to be an “interested person” (as defined in the 1940 Act) of the Fund does not receive compensation from the Fund for his or her service as a Trustee.
Each Independent Trustee receives for his or her services to the State Street Master Funds, State Street Institutional Investment Trust and SSGA Funds, a $141,500 annual base retainer in addition to $18,000 for each in-person meeting and $2,000 for each telephonic meeting from the Trust. The Co-Chairmen each receive an additional $44,000 annual retainer. The Independent Trustees are reimbursed for travel and other out-of-pocket expenses in connection with meeting attendance. Trustees’ fees and expenses are allocated among the Trusts and funds overseen by the Trustees in a manner deemed equitable taking into consideration the relative net assets of the funds, subject to a $15,000 minimum per fund. As of the date of this Shareholder Report, the Trustees were not paid pension or retirement benefits as part of Trust’s expenses. However, the Trust has, pursuant to an exemptive order from the SEC, implemented an optional deferred compensation plan by which the Independent Trustees may defer receipt of compensation and receive a return on the deferred amount determined with reference to the performance of shares of specified State Street Institutional Investment Trust series. As of the fiscal year ended December 31, 2015, none of the Independent Trustees participated in the optional deferred compensation program.
10
Table of Contents
State Street Institutional Investment Trust
State Street Institutional Treasury Money Market Fund
Notes to Financial Statements — (continued)
December 31, 2015
The Trust’s officers are compensated by the Adviser and its affiliates.
| 5. | Rule Issuance |
On July 23, 2014, the U.S. Securities and Exchange Commission (the “SEC”) adopted amendments to the governing rules for money market funds. The amendments require that, following a two-year implementation timeframe, institutional prime and institutional tax exempt money market funds adopt a floating net asset value. The rule changes also allow for certain liquidity-based redemption fees and gate, and include enhanced requirements for disclosure and stress testing. The degree to which a money market fund will be impacted by the rule amendments will depend upon the type of fund and type of investors (retail or institutional). At this time, management is evaluating the implications of these amendments and their impact to the Fund’s financial statements and related disclosure.
| 6. | Subsequent Events |
Management has evaluated the impact of all subsequent events on the Fund through the date the financial statements were available to be issued and has determined that there were no subsequent events requiring adjustment or disclosure in the financial statements.
11
Table of Contents
Report of Independent Registered Public Accounting Firm
To the Board of Trustees and Shareholders of
State Street Institutional Investment Trust:
We have audited the accompanying statement of assets and liabilities of the State Street Institutional Treasury Money Market Fund (one of the funds constituting State Street Institutional Investment Trust) (the “Fund”) as of December 31, 2015, and the related statement of operations for the year then ended, the statements of changes in net assets for each of the two years in the period then ended, and the financial highlights for each of the five years in the period then ended. These financial statements and financial highlights are the responsibility of the Fund’s management. Our responsibility is to express an opinion on these financial statements and financial highlights based on our audits.
We conducted our audits in accordance with the standards of the Public Company Accounting Oversight Board (United States). Those standards require that we plan and perform the audit to obtain reasonable assurance about whether the financial statements and financial highlights are free of material misstatement. We were not engaged to perform an audit of the Fund’s internal control over financial reporting. Our audits included consideration of internal control over financial reporting as a basis for designing audit procedures that are appropriate in the circumstances, but not for the purpose of expressing an opinion on the effectiveness of the Fund’s internal control over financial reporting. Accordingly, we express no such opinion. An audit also includes examining, on a test basis, evidence supporting the amounts and disclosures in the financial statements and financial highlights, assessing the accounting principles used and significant estimates made by management, and evaluating the overall financial statement presentation. We believe that our audits provide a reasonable basis for our opinion.
In our opinion, the financial statements and financial highlights referred to above present fairly, in all material respects, the financial position of the State Street Institutional Treasury Money Market Fund (one of the funds constituting State Street Institutional Investment Trust) at December 31, 2015, the results of its operations for the year then ended, the changes in its net assets for each of the two years in the period then ended, and the financial highlights for each of the five years in the period then ended, in conformity with U.S. generally accepted accounting principles.

Boston, Massachusetts
February 26, 2016
12
Table of Contents
State Street Institutional Investment Trust
State Street Institutional Treasury Money Market Fund
December 31, 2015 (Unaudited)
SHAREHOLDER EXPENSE EXAMPLE
As a shareholder of a fund, you incur two types of costs: (1) transaction costs, and (2) ongoing costs, including administration fees; distribution (12b-1) and/or service fees; and other fund expenses. This example is intended to help you understand your ongoing costs (in dollars) of investing in the Fund and to compare these costs with the ongoing costs of investing in other mutual funds. It is based on an investment of $1,000 made at the beginning of the period shown and held for the entire period from July 1, 2015 to December 31, 2015.
The table below illustrates your Fund’s costs in two ways:
| • | Actual expenses. This section helps you to estimate the actual expenses that you paid over the period. The “Ending Account Value” shown is derived from the Fund’s actual return, and the third column shows the dollar amount that would have been paid by an investor who started with $1,000 in the Fund. You may use the information here, together with the amount you invested, to estimate the expenses that you paid over the period. To do so, simply divide your account value by $1,000 (for example, an $8,600 account value divided by $1,000 = 8.6), then multiply the result by the number given for the Fund under the heading “Expenses Paid During Period.” |
| • | Hypothetical example for comparison purposes. This section is intended to help you compare your Fund’s costs with those of other mutual funds. It assumes that the Fund had a yearly return of 5% before expenses, but that the expense ratio is unchanged. In this case, because the return used is not the Fund’s actual return, the results do not apply to your investment. The example is useful in making comparisons because the Securities and Exchange Commission requires all mutual funds to calculate expenses based on a 5% return. You can assess your Fund’s costs by comparing this hypothetical example with the hypothetical examples that appear in shareholder reports of other funds. |
Six Months Ended December 31, 2015
| Beginning Account Value July 1, 2015 | Ending Account Value December 31, 2015 | Expenses Paid During Period * | ||||||||||
Premier Class Shares | ||||||||||||
Based on Actual Fund Return | $ | 1,000.00 | $ | 1,000.00 | $ | 0.25 | ||||||
Based on Hypothetical (5% return before expenses) | $ | 1,000.00 | $ | 1,024.95 | $ | 0.26 | ||||||
Investment Class Shares | ||||||||||||
Based on Actual Fund Return | $ | 1,000.00 | $ | 1,000.00 | $ | 0.25 | ||||||
Based on Hypothetical (5% return before expenses) | $ | 1,000.00 | $ | 1,024.95 | $ | 0.26 | ||||||
| * | The calculations are based on expense incurred in the most recent six month period of the Fund. The annualized average weighted expense ratio as of December 31, 2015, which includes the Fund’s proportionate share of the expenses of the Portfolio, was 0.05% and 0.05% for the Premier Class and Investment Class, respectively. |
| The dollar amount shown as “Expenses Paid” is equal to the annualized average weighted expense ratio multiplied by the average account value over the period, multiplied by 184/365 (the most recent six month period). |
13
Table of Contents
State Street Institutional Investment Trust
State Street Institutional Treasury Money Market Fund
Shareholder Requests for Additional Information
December 31, 2015 (Unaudited)
Proxy Voting Policies and Procedures and Record
The Fund has adopted the proxy voting policies of the Adviser. A description of the policies and procedures that the Fund has adopted to determine how to vote proxies relating to portfolio securities are contained in the Fund’s Statement of Additional Information, which is available (i) without charge, upon request, by calling the Funds at 1-877-521-4083, (ii) on the Fund’s website at www.SSGA.com/cash, (iii) on the U.S. Securities and Exchange Commission’s website at www.sec.gov, or (iv) at the U.S. Securities and Exchange Commission’s public reference room. Information regarding the Trust’s proxy voting policies and procedures, as well as information regarding how the Trust voted proxies, if any, during the most recent 12-month period ended June 30 is available without charge (1) by calling 1-877-521-4083 (toll free), or (2) on the website of the Securities and Exchange Commission (“SEC”) at www.sec.gov.
Quarterly Portfolio Schedule
The Fund will file its complete schedule of investments with the U.S. Securities and Exchange Commission for the first and third quarters of each fiscal year on Form N-Q. For the second and fourth quarters, the complete schedule of investments is available in the Fund’s semi-annual and annual financial statements. The Fund’s Form N-Q is available (i) without charge, upon request, by calling the Fund at 1-877-521-4083, (ii) on the Fund’s website at www.SSGA.com/cash, (iii) on the Securities and Exchange Commission’s website at www.sec.gov, or (iv) at the Securities and Exchange Commission’s public reference room. Information on the operation of the public reference room may be obtained by calling 1-800-SEC-0330.
Monthly Portfolio Schedule
The Fund files its monthly portfolio holdings with the U.S. Securities and Exchange Commission on Form N-MFP. The SEC delays the public availability of the information filed on Form N-MFP for 60 days after the end of the reporting period included in the filing. The Fund’s Form N-MFP is available (i) on the U.S. Securities and Exchange Commission’s website at www.sec.gov, or (ii) at the Securities and Exchange Commission’s public reference room.
14
Table of Contents
State Street Institutional Investment Trust
State Street Institutional Treasury Money Market Fund
Disclosure of Information about Fund Trustees and Officers
December 31, 2015 (Unaudited)
Name, Address, | Position(s) Held | Term of Office | Principal Occupation | Number of Funds in Fund Complex Overseen by Trustee | Other Directorships | |||||
Independent Trustees | ||||||||||
Michael F. Holland State Street Bank and Trust Company 100 Huntington Avenue, CPH 0326 Boston, MA 02116 YOB: 1944 | Trustee and Co-Chairman of the Board | Term: Indefinite Elected: 7/99 | Chairman, Holland & Company L.L.C. (investment adviser) (1995 – present). | 75 | Director, the Holland Series Fund, Inc.; Director, The China Fund, Inc.; Director, The Taiwan Fund, Inc.; Director, Reaves Utility Income Fund, Inc.; and Director, Blackstone/GSO Loan Funds. | |||||
Patrick J. Riley State Street Bank and Trust Company 100 Huntington Avenue, CPH 0326 Boston, MA 02116 YOB: 1948 | Trustee and Co-Chairman of the Board | Term: Indefinite Elected: 1/14 | 2002 to May 2010, Associate Justice of the Superior Court, Commonwealth of Massachusetts; 1985 to 2002, Partner, Riley, Burke & Donahue, L.L.P. (law firm); 1998 to Present, Independent Director, State Street Global Advisers Ireland, Ltd. (investment company); 1998 to Present, Independent Director, SSGA Liquidity plc (formerly, SSGA Cash Management Fund plc); January 2009 to Present, Independent Director, SSGA Fixed Income plc; and January 2009 to Present, Independent Director, SSGA Qualified Funds PLC. | 75 | Board Director and Chairman, SPDR Europe 1PLC Board (2011 – Present); Board Director and Chairman, SPDR Europe II, PLC (2013 – Present). | |||||
William L. Boyan State Street Bank and Trust Company 100 Huntington Avenue, CPH 0326 Boston, MA 02116 YOB: 1937 | Trustee and Co-Chairman of the Valuation Committee | Term: Indefinite Elected: 7/99 | President and Chief Operations Officer, John Hancock Financial Services (1959 – 1999). Mr. Boyan retired in 1999. Chairman Emeritus, Children’s Hospital, Boston, MA (1984 – 2011); Former Trustee of Old Mutual South Africa Master Trust (investments) (1995 – 2008); Former Chairman, Boston Plan For Excellence, Boston Public Schools (1995 – 2010); Member of Advisory Board of Florida Atlantic University Lifelong Learning Society. | 75 | Former Trustee of Old Mutual South Africa Master Trust. |
15
Table of Contents
State Street Institutional Investment Trust
State Street Institutional Treasury Money Market Fund
Disclosure of Information about Fund Trustees and Officers — (continued)
December 31, 2015 (Unaudited)
Name, Address, | Position(s) Held | Term of Office | Principal Occupation | Number of Funds in Fund Complex Overseen by Trustee | Other Directorships | |||||
Independent Trustees (continued) | ||||||||||
William L. Marshall State Street Bank and Trust Company 100 Huntington Avenue, CPH 0326 Boston, MA 02116 YOB: 1942 | Trustee and Co-Chairman of the Audit Committee | Term: Indefinite Elected: 1/14 | April 2011 to Present, Chairman (until April 2011, Chief Executive Officer and President), Wm. L. Marshall Associates, Inc., Wm. L. Marshall Companies, Inc. and the Marshall Financial Group, Inc. (a registered investment adviser and provider of financial and related consulting services); Certified Financial Planner; Member, Financial Planners Association; 2015 to present, Board Member, The Doylestown Health Foundation Board. | 75 | Marshall Financial Group, Inc. | |||||
Richard D. Shirk State Street Bank and Trust Company 100 Huntington Avenue, CPH 0326 Boston, MA 02116 YOB: 1945 | Trustee and Co-Chairman of the Qualified Legal and Compliance Committee | Term: Indefinite Elected: 1/14 | March 2001 to April 2002, Chairman (1996 to March 2001, President and Chief Executive Officer), Cerulean Companies, Inc. (holding company) (Retired); 1992 to March 2001, President and Chief Executive Officer, Blue Cross Blue Shield of Georgia (health insurer, managed healthcare); 1998 to December 2008, Chairman, Board Member and December 2008 to Present, Investment Committee Member, Healthcare Georgia Foundation (private foundation); September 2002 to 2012, Lead Director and Board Member, Amerigroup Corp. (managed health care); 1999 to 2013, Board Member and (since 2001) Investment Committee Member, Woodruff Arts Center; and 2003 to 2009, Trustee, Gettysburg College. | 75 | Board member, AeroCare Holdings (privately held healthcare services company) (February 2003 – Present); Board member, Regenesis Biomedical (health care services) (April 2012 – Present); Chairman (January 2014 – Present). | |||||
Rina K. Spence State Street Bank and Trust Company 100 Huntington Avenue, CPH 0326 Boston, MA 02116 YOB: 1948 | Trustee and Co-Chairman of the Qualified Legal and Compliance Committee and Co-Chairman of the Governance Committee | Term: Indefinite Elected: 7/99 | President of SpenceCare International LLC (international healthcare consulting) (1999 – present); Chief Executive Officer, IEmily.com (health internet company) (2000 – 2001); Chief Executive Officer of Consensus Pharmaceutical, Inc. (1998 – 1999); Founder, President and Chief Executive Officer of Spence Center for Women’s Health (1994 – 1998); President and CEO Emerson Hospital (1984 – 1994); Trustee, Eastern Enterprise (utilities) (1988 – 2000); Director, Berkshire Life Insurance Company of America (1993 – 2009); Honorary Consul for Monaco in Boston (2015 – present). | 75 | ||||||
16
Table of Contents
State Street Institutional Investment Trust
State Street Institutional Treasury Money Market Fund
Disclosure of Information about Fund Trustees and Officers — (continued)
December 31, 2015 (Unaudited)
Name, Address, | Position(s) Held | Term of Office | Principal Occupation | Number of Funds in Fund Complex Overseen by Trustee | Other Directorships | |||||
Independent Trustees (continued) | ||||||||||
Bruce D. Taber State Street Bank and Trust Company 100 Huntington Avenue, CPH 0326 Boston, MA 02116 YOB: 1943 | Trustee and Co-Chairman of the Valuation Committee and Co-Chairman of the Governance Committee | Term: Indefinite Elected: 1/14 | 1999 to Present, Partner, Zenergy LLC (a technology company providing Computer Modeling and System Analysis to the General Electric Power Generation Division); Until December 2008, Independent Director, SSGA Cash Management Fund plc; Until December 2008, Independent Director, State Street Global Advisers Ireland, Ltd. (investment companies); and Until August 1994, President, Alonzo B. Reed, Inc., (a Boston architect-engineering firm). | 75 | ||||||
Douglas T. Williams State Street Bank and Trust Company 100 Huntington Avenue, CPH 0326 Boston, MA 02116 YOB: 1940 | Trustee and Co-Chairman of the Audit Committee | Term: Indefinite Elected: 7/99 | President, Oakmont Homeowners Association; President, Mariner Sands Chapel; Executive Vice President and member of Executive Committee, Chase Manhattan Bank (1987 – 1999); President, Boston Stock Exchange Depository Trust Company, 1981-1982; Treasurer, Nantucket Educational Trust, (2002 – 2007). | 75 | ||||||
Interested Trustee(1) | ||||||||||
James E. Ross SSGA Funds Management, Inc. State Street Financial Center One Lincoln Street Boston, MA 02111 YOB: 1965 | Trustee | Term: Indefinite Elected Trustee: 2/07 | Chairman and Director, SSGA Funds Management, Inc. (2012 – present); President, SSGA Funds Management, Inc. (2005 – 2012); Executive Vice President and Senior Managing Director, State Street Global Advisors (2006 – present); and Principal, State Street Global Advisors (2006 – present). | 290 | Trustee, SPDR Series Trust; Trustee, SPDR Index Shares Funds; Trustee, Select Sector SPDR Trust; Trustee, SSGA Active Trust; and Trustee, SSGA Master Trust. | |||||
| (1) | Mr. Ross is an Interested Trustee because of his employment by SSGA Funds Management, Inc., an affiliate of the Trust. |
Name, Address, | Position(s) Held | Term of Office | Principal Occupation | |||
Officers: | ||||||
Ellen M. Needham SSGA Funds Management, Inc. State Street Financial Center One Lincoln Street Boston, MA 02111 YOB: 1967 | President | Term: Indefinite Elected: 10/12 | President and Director, SSGA Funds Management, Inc. (June 2012 – present); Chief Operating Officer, SSGA Funds Management, Inc. (May 2010 – June 2012); Senior Managing Director, SSGA Funds Management, Inc. (1992 – 2012) and Senior Managing Director, State Street Global Advisors (1992 – present).* |
17
Table of Contents
State Street Institutional Investment Trust
State Street Institutional Treasury Money Market Fund
Disclosure of Information about Fund Trustees and Officers — (continued)
December 31, 2015 (Unaudited)
Name, Address, | Position(s) Held | Term of Office | Principal Occupation | |||
Officers: (continued) | ||||||
Bruce S. Rosenberg SSGA Funds Management, Inc. State Street Financial Center One Lincoln Street Boston, MA 02111 YOB: 1961 | Treasurer | Term: Indefinite Elected: 2/16 | Managing Director, State Street Global Advisors and SSGA Funds Management, Inc. (July 2015 – present); Director, Credit Suisse (April 2008 – July 2015). | |||
Ann M. Carpenter SSGA Funds Management, Inc. State Street Financial Center One Lincoln Street Boston, MA 02111 YOB: 1966 | Vice President Deputy Treasurer | Term: Indefinite Elected: 10/12 Term: Indefinite Elected: 4/15 | Chief Operating Officer, SSGA Funds Management, Inc. (April 2014 – present); Vice President, State Street Global Advisors and SSGA Funds Management, Inc. (2005 – present).* | |||
Chad C. Hallett SSGA Funds Management, Inc. State Street Financial Center One Lincoln Street Boston, MA 02111 YOB: 1969 | Deputy Treasurer | Term: Indefinite Elected: 4/15 | Vice President, State Street Global Advisors and SSGA Funds Management, Inc. (November 2014 – present); Vice President, State Street Bank and Trust Company (2001 – November 2014).* | |||
Sujata Upreti SSGA Funds Management, Inc. State Street Financial Center One Lincoln Street Boston, MA 02111 YOB: 1974 | Assistant Treasurer | Term: Indefinite Elected: 2/16 | Vice President, State Street Global Advisors and SSGA Funds Management, Inc. (May 2015 – present); Assistant Director, Cambridge Associates, LLC (July 2014 – January 2015); Vice President, Bank of New York Mellon (July 2012 – August 2013); Manager, PricewaterhouseCoopers, LLP (September 2009 – July 2012). | |||
Daniel Foley SSGA Funds Management, Inc. State Street Financial Center One Lincoln Street Boston, MA 02111 YOB: 1972 | Assistant Treasurer | Term: Indefinite Elected: 2/16 | Vice President, State Street Global Advisors and SSGA Funds Management, Inc. (April 2014 – present); Principal, State Street Global Advisors and SSGA Funds Management, Inc. (April 2007 – April 2014). | |||
Brian Harris SSGA Funds Management, Inc. State Street Financial Center One Lincoln Street Boston, MA 02111 YOB: 1973 | Chief Compliance Officer | Term: Indefinite Elected: 11/13 | Vice President, State Street Global Advisors and SSGA Funds Management, Inc. (June 2013 – Present); Senior Vice President and Global Head of Investment Compliance, BofA Global Capital Management (September 2010 to May 2013); Director of Compliance, AARP Financial Inc. (July 2008 to August 2010). | |||
Trevor Swanberg SSGA Funds Management, Inc. State Street Financial Center One Lincoln Street Boston, MA 02111 YOB: 1979 | Code of Ethics Compliance Officer | Term: Indefinite Elected: 8/15 | Vice President, State Street Global Advisors and SSGA Funds Management, Inc. (January 2015 – Present); Senior Manager-Mutual Fund Compliance, ICMA-Retirement Corporation (December 2011 – January 2015); Assistant Vice President, J.P. Morgan (September 2007 – December 2011). | |||
Joshua A. Weinberg SSGA Funds Management, Inc. State Street Financial Center One Lincoln Street Boston, MA 02111 YOB: 1978 | Chief Legal Officer | Term: Indefinite Elected: 2/15 | Vice President and Managing Counsel, State Street Global Advisors (2011 – present); Clerk, SSGA Funds Management, Inc. (2013 – present); Associate, Financial Services Group, Dechert LLP (2006 – 2011). | |||
18
Table of Contents
State Street Institutional Investment Trust
State Street Institutional Treasury Money Market Fund
Disclosure of Information about Fund Trustees and Officers — (continued)
December 31, 2015 (Unaudited)
Name, Address, | Position(s) Held | Term of Office | Principal Occupation | |||
Officers: (continued) | ||||||
David K. James State Street Bank and Trust Company 100 Huntington Avenue, 3rd Floor Boston, MA 02116 YOB: 1970 | Secretary | Term: Indefinite Elected: 4/13 | Managing Director and Managing Counsel, State Street Bank and Trust Company (2009 – present); Vice President and Counsel, PNC Global Investment Servicing (US), Inc. (2006 – 2009). | |||
Kristin Schantz State Street Bank and Trust Company 100 Huntington Avenue, 3rd Floor Boston, MA 02116 YOB: 1979 | Assistant Secretary | Term: Indefinite Elected: 2/14 | Vice President and Counsel, State Street Bank and Trust Company (2013 – present); Vice President, Citi Fund Services Ohio, Inc. (2008 – 2013). | |||
| * | Served in various capacities and/or with various affiliated entities during noted time period. |
19
Table of Contents
Trustees
William L. Boyan
Michael F. Holland
William L. Marshall
Patrick J. Riley
James E. Ross
Richard D. Shirk
Rina K. Spence
Bruce D. Taber
Douglas T. Williams
Investment Adviser and Administrator
SSGA Funds Management, Inc.
State Street Financial Center
One Lincoln Street
Boston, MA 02111
Custodian and Sub-Administrator
State Street Bank and Trust Company
State Street Financial Center
One Lincoln Street
Boston, MA 02111
Independent Registered Public Accounting Firm
Ernst & Young LLP
200 Clarendon Street
Boston, MA 02116
Legal Counsel
Ropes & Gray LLP
800 Boylston Street
Boston, MA 02199
Transfer Agent
Boston Financial Data Services
2000 Crown Colony Drive
Quincy, MA 02169
Distributor
State Street Global Markets LLC
State Street Financial Center
One Lincoln Street
Boston, MA 02111
This report is for shareholder information. This is not a prospectus intended for use in the purchase or sale of shares of beneficial interest.
State Street Institutional Investment Trust State Street Bank and Trust Company P.O. Box 5049 Boston, MA 02206 |
Table of Contents
[THIS PAGE INTENTIONALLY LEFT BLANK]
Table of Contents
[THIS PAGE INTENTIONALLY LEFT BLANK]
Table of Contents
Annual Report
31 December 2015
State Street Master Funds
State Street Treasury Money Market Portfolio
Table of Contents
State Street Master Funds
State Street Treasury Money Market Portfolio
Annual Report
December 31, 2015
| 25 | ||||
| 26 | ||||
| 28 | ||||
| 29 | ||||
| 30 | ||||
| 31 | ||||
| 32 | ||||
| 37 | ||||
| 38 | ||||
| 39 | ||||
Disclosure of Information about Portfolio Trustees and Officers | 40 | |||
Table of Contents
State Street Master Funds
State Street Treasury Money Market Portfolio
Portfolio Statistics (Unaudited)
Portfolio Composition* | December 31, 2015 | |||
Treasury Debt | 100.0 | % | ||
Other Assets in Excess of Liabilities | 0.0 | ** | ||
Total | 100.0 | % |
Maturity Ladder* | December 31, 2015 | |||
2-30 Days | 55.8 | |||
31-60 Days | 17.1 | |||
61-90 Days | 13.1 | |||
Over 90 Days | 14.0 | |||
Total | 100.0 | % | ||
Average days to maturity | 28 | |||
Weighted average life | 70 |
| * | As a percentage of net assets as of the date indicated. The Portfolio’s composition will vary over time. |
| ** | Amount represents less than 0.05% of net assets. |
See accompanying notes to financial statements.
25
Table of Contents
State Street Master Funds
State Street Treasury Money Market Portfolio
December 31, 2015
Name of Issuer and Title of Issue | Interest Rate | Next Rate Reset Date | Maturity Date | Principal Amount | Value | |||||||||||||||
| TREASURY DEBT – 100.0% | ||||||||||||||||||||
U.S. Treasury Bill(a) | 0.000 | % | 01/07/2016 | 01/07/2016 | $ | 132,100,000 | $ | 132,099,945 | ||||||||||||
U.S. Treasury Bill(a) | 0.003 | % | 01/07/2016 | 01/07/2016 | 45,000,000 | 44,999,542 | ||||||||||||||
U.S. Treasury Bill(a) | 0.018 | % | 01/07/2016 | 01/07/2016 | 120,000,000 | 119,999,650 | ||||||||||||||
U.S. Treasury Bill(a) | 0.050 | % | 01/07/2016 | 01/07/2016 | 196,000,000 | 195,998,367 | ||||||||||||||
U.S. Treasury Bill(a) | 0.055 | % | 01/07/2016 | 01/07/2016 | 53,000,000 | 52,999,514 | ||||||||||||||
U.S. Treasury Bill(a) | 0.060 | % | 01/07/2016 | 01/07/2016 | 253,000,000 | 252,997,470 | ||||||||||||||
U.S. Treasury Bill(a) | 0.235 | % | 01/07/2016 | 01/07/2016 | 601,140,000 | 601,140,000 | ||||||||||||||
U.S. Treasury Bill(a) | 0.000 | % | 01/14/2016 | 01/14/2016 | 553,375,000 | 553,375,000 | ||||||||||||||
U.S. Treasury Bill(a) | 0.001 | % | 01/14/2016 | 01/14/2016 | 75,000,000 | 74,999,973 | ||||||||||||||
U.S. Treasury Bill(a) | 0.020 | % | 01/14/2016 | 01/14/2016 | 50,000,000 | 49,999,639 | ||||||||||||||
U.S. Treasury Bill(a) | 0.065 | % | 01/14/2016 | 01/14/2016 | 27,000,000 | 26,999,366 | ||||||||||||||
U.S. Treasury Bill(a) | 0.070 | % | 01/14/2016 | 01/14/2016 | 165,000,000 | 164,995,829 | ||||||||||||||
U.S. Treasury Bill(a) | 0.072 | % | 01/14/2016 | 01/14/2016 | 27,000,000 | 26,999,293 | ||||||||||||||
U.S. Treasury Bill(a) | 0.075 | % | 01/14/2016 | 01/14/2016 | 81,000,000 | 80,997,806 | ||||||||||||||
U.S. Treasury Bill(a) | 0.080 | % | 01/14/2016 | 01/14/2016 | 125,000,000 | 124,996,389 | ||||||||||||||
U.S. Treasury Bill(a) | 0.095 | % | 01/14/2016 | 01/14/2016 | 68,902,000 | 68,899,636 | ||||||||||||||
U.S. Treasury Bill(a) | 0.100 | % | 01/14/2016 | 01/14/2016 | 86,000,000 | 85,996,894 | ||||||||||||||
U.S. Treasury Bill(a) | 0.205 | % | 01/14/2016 | 01/14/2016 | 1,000,000,000 | 999,925,972 | ||||||||||||||
U.S. Treasury Bill(a) | 0.001 | % | 01/21/2016 | 01/21/2016 | 100,000,000 | 99,999,944 | ||||||||||||||
U.S. Treasury Bill(a) | 0.005 | % | 01/21/2016 | 01/21/2016 | 30,768,000 | 30,767,915 | ||||||||||||||
U.S. Treasury Bill(a) | 0.010 | % | 01/21/2016 | 01/21/2016 | 163,000,000 | 162,999,094 | ||||||||||||||
U.S. Treasury Bill(a) | 0.015 | % | 01/21/2016 | 01/21/2016 | 450,000,000 | 449,996,250 | ||||||||||||||
U.S. Treasury Bill(a) | 0.180 | % | 01/21/2016 | 01/21/2016 | 100,000,000 | 99,990,000 | ||||||||||||||
U.S. Treasury Bill(a) | 0.195 | % | 01/21/2016 | 01/21/2016 | 650,000,000 | 649,929,583 | ||||||||||||||
U.S. Treasury Bill(a) | 0.020 | % | 01/28/2016 | 01/28/2016 | 450,000,000 | 449,993,250 | ||||||||||||||
U.S. Treasury Bill(a) | 0.140 | % | 01/28/2016 | 01/28/2016 | 100,000,000 | �� | 99,989,500 | |||||||||||||
U.S. Treasury Bill(a) | 0.170 | % | 01/28/2016 | 01/28/2016 | 900,000,000 | 899,885,250 | ||||||||||||||
U.S. Treasury Bill(a) | 0.115 | % | 02/04/2016 | 02/04/2016 | 283,000,000 | 282,969,263 | ||||||||||||||
U.S. Treasury Bill(a) | 0.118 | % | 02/04/2016 | 02/04/2016 | 42,000,000 | 41,995,339 | ||||||||||||||
U.S. Treasury Bill(a) | 0.135 | % | 02/11/2016 | 02/11/2016 | 250,000,000 | 249,961,563 | ||||||||||||||
U.S. Treasury Bill(a) | 0.145 | % | 02/18/2016 | 02/18/2016 | 250,000,000 | 249,951,667 | ||||||||||||||
U.S. Treasury Bill(a) | 0.140 | % | 02/25/2016 | 02/25/2016 | 237,000,000 | 236,949,308 | ||||||||||||||
U.S. Treasury Bill(a) | 0.210 | % | 03/03/2016 | 03/03/2016 | 200,000,000 | 199,927,667 | ||||||||||||||
U.S. Treasury Bill(a) | 0.215 | % | 03/03/2016 | 03/03/2016 | 250,000,000 | 249,907,431 | ||||||||||||||
U.S. Treasury Bill(a) | 0.240 | % | 03/10/2016 | 03/10/2016 | 50,000,000 | 49,977,000 | ||||||||||||||
U.S. Treasury Bill(a) | 0.268 | % | 03/10/2016 | 03/10/2016 | 92,000,000 | 91,952,831 | ||||||||||||||
U.S. Treasury Bill(a) | 0.280 | % | 03/10/2016 | 03/10/2016 | 108,000,000 | 107,942,040 | ||||||||||||||
U.S. Treasury Bill(a) | 0.255 | % | 03/17/2016 | 03/17/2016 | 146,000,000 | 145,921,403 | ||||||||||||||
U.S. Treasury Bill(a) | 0.280 | % | 03/17/2016 | 03/17/2016 | 300,000,000 | 299,822,667 | ||||||||||||||
U.S. Treasury Bill(a) | 0.195 | % | 03/24/2016 | 03/24/2016 | 50,000,000 | 49,977,521 | ||||||||||||||
26
See accompanying notes to the financial statements.
Table of Contents
State Street Master Funds
State Street Treasury Money Market Portfolio
Schedule of Investments — (continued)
December 31, 2015
Name of Issuer and Title of Issue | Interest Rate | Next Rate Reset Date | Maturity Date | Principal Amount | Value | |||||||||||||||
| TREASURY DEBT – (continued) | ||||||||||||||||||||
U.S. Treasury Bill(a) | 0.245 | % | 03/24/2016 | 03/24/2016 | $ | 159,000,000 | $ | 158,910,187 | ||||||||||||
U.S. Treasury Bill(a) | 0.250 | % | 03/24/2016 | 03/24/2016 | 192,103,100 | 191,992,374 | ||||||||||||||
U.S. Treasury Bill(a) | 0.250 | % | 03/31/2016 | 03/31/2016 | 93,000,000 | 92,941,875 | ||||||||||||||
U.S. Treasury Bill(a) | 0.260 | % | 03/31/2016 | 03/31/2016 | 210,812,500 | 210,675,472 | ||||||||||||||
U.S. Treasury Note(a) | 0.052 | % | 01/31/2016 | 01/31/2016 | 70,000,000 | 70,018,454 | ||||||||||||||
U.S. Treasury Note(b) | 0.305 | % | 01/01/2016 | 01/31/2016 | 595,000,000 | 594,998,806 | ||||||||||||||
U.S. Treasury Note(a) | 0.303 | % | 02/29/2016 | 02/29/2016 | 300,000,000 | 299,973,979 | ||||||||||||||
U.S. Treasury Note(b) | 0.329 | % | 01/01/2016 | 04/30/2016 | 307,600,000 | 307,612,754 | ||||||||||||||
U.S. Treasury Note(b) | 0.330 | % | 01/01/2016 | 07/31/2016 | 80,000,000 | 80,005,884 | ||||||||||||||
U.S. Treasury Note(b) | 0.313 | % | 01/01/2016 | 10/31/2016 | 280,000,000 | 279,961,823 | ||||||||||||||
U.S. Treasury Note(b) | 0.344 | % | 01/01/2016 | 01/31/2017 | 238,000,000 | 237,999,246 | ||||||||||||||
U.S. Treasury Note(b) | 0.334 | % | 01/01/2016 | 04/30/2017 | 121,000,000 | 121,000,396 | ||||||||||||||
U.S. Treasury Note(b) | 0.337 | % | 01/01/2016 | 07/31/2017 | 231,000,000 | 230,890,343 | ||||||||||||||
U.S. Treasury Note(b) | 0.428 | % | 01/01/2016 | 10/31/2017 | 100,000,000 | 99,815,200 | ||||||||||||||
|
| |||||||||||||||||||
TOTAL TREASURY DEBT |
| 11,836,023,564 | ||||||||||||||||||
|
| |||||||||||||||||||
TOTAL INVESTMENTS(c)(d) – 100.0% |
| 11,836,023,564 | ||||||||||||||||||
OTHER ASSETS IN EXCESS OF LIABILITIES – 0.0%(e) |
| 1,104,096 | ||||||||||||||||||
|
| |||||||||||||||||||
NET ASSETS – 100.0% |
| $ | 11,837,127,660 | |||||||||||||||||
|
| |||||||||||||||||||
| (a) | Rate represents annualized yield at date of purchase. |
| (b) | Variable Rate Security – Interest rate shown is rate in effect at December 31, 2015. |
| (c) | Unless otherwise indicated, the values of the securities of the Portfolio are determined based on Level 2 inputs established by provisions surrounding fair value measurements and disclosures. (Note 2) |
| (d) | Also represents the cost for federal tax purposes. |
| (e) | Amount shown represents less than 0.05% of net assets. |
27
See accompanying notes to the financial statements.
Table of Contents
State Street Master Funds
State Street Treasury Money Market Portfolio
Statement of Assets and Liabilities
December 31, 2015
Assets |
| |||
Investments at value and amortized cost (Note 2) | $ | 11,836,023,564 | ||
Cash | 737,563 | |||
Interest receivable | 1,226,928 | |||
Prepaid expenses and other assets | 14,607 | |||
|
| |||
Total assets | 11,838,002,662 | |||
Liabilities | ||||
Management fee payable (Note 3) | 506,101 | |||
Administration and custody fees payable (Note 3) | 323,510 | |||
Professional fees payable | 31,124 | |||
Accrued expenses and other liabilities | 14,267 | |||
|
| |||
Total liabilities | 875,002 | |||
|
| |||
Net Assets | $ | 11,837,127,660 | ||
|
| |||
See accompanying notes to financial statements.
28
Table of Contents
State Street Master Funds
State Street Treasury Money Market Portfolio
Year Ended December 31, 2015
Investment Income |
| |||
Interest | $ | 4,368,076 | ||
|
| |||
Expenses | ||||
Management fees (Note 3) | 5,725,045 | |||
Administration and custody fees (Note 3) | 1,450,726 | |||
Trustees’ fees (Note 4) | 168,115 | |||
Professional fees | 100,302 | |||
Printing fees | 7,040 | |||
Other expenses | 119,357 | |||
|
| |||
Total expenses | 7,570,585 | |||
|
| |||
Net Investment Loss | (3,202,509 | ) | ||
|
| |||
Realized Gain (Loss) | ||||
Net realized gain on investments | 119,782 | |||
|
| |||
Net Decrease in Net Assets Resulting from Operations | $ | (3,082,727 | ) | |
|
| |||
See accompanying notes to financial statements.
29
Table of Contents
State Street Master Funds
State Street Treasury Money Market Portfolio
Statements of Changes in Net Assets
| Year Ended December 31, 2015 | Year Ended December 31, 2014 | |||||||
Increase (Decrease) in Net Assets From Operations: | ||||||||
Net investment loss | $ | (3,202,509 | ) | $ | (2,505,474 | ) | ||
Net realized gain on investments | 119,782 | 130,828 | ||||||
|
|
|
| |||||
Net decrease in net assets from operations | (3,082,727 | ) | (2,374,646 | ) | ||||
|
|
|
| |||||
Capital Transactions: | ||||||||
Contributions | 26,921,306,751 | 27,518,525,235 | ||||||
Withdrawals | (25,328,556,655 | ) | (31,826,712,166 | ) | ||||
|
|
|
| |||||
Net increase (decrease) in net assets from capital transactions | 1,592,750,096 | (4,308,186,931 | ) | |||||
|
|
|
| |||||
Net Increase (Decrease) in Net Assets | 1,589,667,369 | (4,310,561,577 | ) | |||||
Net Assets | ||||||||
Beginning of year | 10,247,460,291 | 14,558,021,868 | ||||||
|
|
|
| |||||
End of year | $ | 11,837,127,660 | $ | 10,247,460,291 | ||||
|
|
|
| |||||
See accompanying notes to financial statements.
30
Table of Contents
State Street Master Funds
State Street Treasury Money Market Portfolio
| Total Return(a) | Ratios to Average Net Assets | Net Assets End of Year (000s Omitted) | ||||||||||||||||||
Year Ended December 31, | Gross Operating Expenses | Net Operating Expenses | Net Investment Income | |||||||||||||||||
2015 | (0.04 | )% | 0.07 | % | 0.07 | % | (0.03 | )% | $ | 11,837,128 | ||||||||||
2014 | (0.02 | )% | 0.07 | % | 0.07 | % | (0.02 | )% | $ | 10,247,460 | ||||||||||
2013 | 0.00 | %(b) | 0.07 | % | 0.07 | % | 0.00 | %(b) | $ | 14,558,022 | ||||||||||
2012 | 0.02 | % | 0.07 | % | 0.07 | % | 0.02 | % | $ | 12,712,060 | ||||||||||
2011 | (0.09 | )% | 0.07 | % | 0.07 | % | (0.03 | )%(c) | $ | 12,094,364 | ||||||||||
| (a) | Results represent past performance and are not indicative of future results. |
| (b) | Amount is less than 0.005%. |
| (c) | Results reflect the effect of expense waivers. Without these waivers, net investment income would have been lower. |
See accompanying notes to financial statements.
31
Table of Contents
State Street Master Funds
State Street Treasury Money Market Portfolio
December 31, 2015
| 1. | Organization |
The State Street Master Funds (the “Trust”) is registered under the Investment Company Act of 1940, as amended (the “1940 Act”), as an open-end management investment company, and was organized as a business trust under the laws of the Commonwealth of Massachusetts on July 27, 1999. The Trust comprises five investment portfolios: State Street Equity 500 Index Portfolio, State Street Money Market Portfolio, State Street U.S. Government Money Market Portfolio, State Street Treasury Money Market Portfolio and State Street Treasury Plus Money Market Portfolio. Information presented in these financial statements pertains only to State Street Treasury Money Market Portfolio (the “Portfolio”). The Portfolio commenced operations on October 25, 2007.
The Portfolio is authorized to issue an unlimited number of non-transferable beneficial interests.
The Portfolio’s investment objective is to seek a high level of current income consistent with preserving principal and liquidity and the maintenance of a stable $1.00 per share net asset value.
Under the Trust’s organizational documents, its officers and trustees are indemnified against certain liabilities arising out of the performance of their duties to the Trust. Additionally, in the normal course of business, the Trust enters into contracts with service providers that contain general indemnification clauses. The Trust’s maximum exposure under these arrangements is unknown as this could involve future claims that may be made against the Trust that have not yet occurred.
| 2. | Summary of Significant Accounting Policies |
The following is a summary of significant accounting policies followed by the Trust in the preparation of its financial statements:
The preparation of financial statements in accordance with U.S. generally accepted accounting principles (“U.S. GAAP”) requires management to make estimates and assumptions that affect the reported amounts and disclosures in the financial statements. Actual results could differ from those estimates. The Portfolio is an investment company under U.S. GAAP and follows the accounting and reporting guidance applicable to investment companies in Financial Accounting Standards Board (“FASB”) Accounting Standards Codification (“ASC”) 946, Financial Services Investment Companies (“ASC 946”).
Security valuation – The Portfolio’s securities are recorded on the basis of amortized cost which approximates fair value as permitted by Rule 2a-7 under the 1940 Act. This method values a security at its cost on the date of purchase and, thereafter, assumes a constant amortization to maturity of any premiums or accretion of any discounts. The Portfolio may value securities for which market quotations are not readily available at “fair value,” as determined in good faith pursuant to procedures established by the Board of Trustees of the Trust (the “Board.”) The Board has adopted procedures concerning securities valuation, under which an Oversight Committee (the “Committee”) makes determinations as to whether market quotations are not readily available or do not otherwise accurately reflect the fair value of the security. The Committee, or a subgroup thereof, subject to oversight by the Board, may use fair value pricing in a variety of circumstances, including but not limited to, situations when trading in a security has been suspended or halted. If amortized cost is determined not to approximate fair value, the value of the portfolio securities will be determined under procedures established by and under the general
32
Table of Contents
State Street Master Funds
State Street Treasury Money Market Portfolio
Notes to Financial Statements — (continued)
December 31, 2015
supervision of the Committee. The Committee will assist in overseeing the comparison of amortized cost to market-based value. Fair value pricing involves subjective judgments and it is possible that the fair value determination for a security is materially different than the value that could be received on the sale of the security.
Because of the inherent uncertainties of valuation and under certain market conditions, the values reflected in the financial statements may differ from the value received upon actual sale of those investments and it is possible that the differences could be material.
The Portfolio values its assets and liabilities at fair value using a hierarchy that prioritizes the inputs to valuation techniques giving the highest priority to readily available unadjusted quoted prices in active markets for identical assets or liabilities (Level 1 measurements) and the lowest priority to unobservable inputs (Level 3 measurements) when market prices are not readily available or reliable. The categorization of a value determined for an investment within the hierarchy is based upon the pricing transparency of the investment and is not necessarily an indication of the risk associated with investing in it.
The three levels of the fair value hierarchy are as follows:
| • | Level 1 – Unadjusted quoted prices in active markets for identical assets or liabilities; |
| • | Level 2 – Inputs other than quoted prices included within Level 1 that are observable for the asset or liability either directly or indirectly, including quoted prices for similar assets or liabilities in active markets, quoted prices for identical or similar assets or liabilities in markets that are not considered to be active, inputs other than quoted prices that are observable for the asset or liability (such as exchange rates, financing terms, interest rates, yield curves, volatilities, prepayment speeds, loss severities, credit risks and default rates) or other market-corroborated inputs; and |
| • | Level 3 – Unobservable inputs for the asset or liability, including the Committee’s assumptions used in determining the fair value of investments. |
Changes in valuation techniques may result in transfers in or out of an assigned level within the fair value hierarchy. Transfers between different levels of the fair value hierarchy are recognized at the end of the reporting period. The Portfolio had no transfers between levels for the year ended December 31, 2015. Unless otherwise indicated on the Schedule of Investments, the values of the securities of the Portfolio are determined based on Level 2 inputs.
Investment transactions and income recognition – Investment transactions are accounted for on trade date for financial reporting purposes. Interest income is recorded daily on an accrual basis and includes amortization of premium and accretion of discount on investments. Realized gains and losses from the sale or disposition of investments are determined using the identified cost method.
Expenses – Advisory fees and other expenses, which are directly identifiable to a specific portfolio, are applied to that portfolio within the Trust. Trustees’ fees and other expenses which cannot be attributed to a specific portfolio are allocated in such a manner as deemed equitable, taking into consideration the nature and type of expense and the relative net assets of the portfolios within the Trust.
33
Table of Contents
State Street Master Funds
State Street Treasury Money Market Portfolio
Notes to Financial Statements — (continued)
December 31, 2015
Repurchase agreements – The Portfolio may enter into repurchase agreements under the terms of a master repurchase agreement. A repurchase agreement customarily obligates the seller at the time it sells securities to the Portfolio to repurchase the securities at a mutually agreed upon price and time. The total amount received by the Portfolio on repurchase is calculated to exceed the price paid by the Portfolio, reflecting an agreed-upon market rate of interest for the period of time to the settlement date, and is not necessarily related to the interest rate on the underlying securities. The underlying securities are ordinarily United States Government or Government Agency securities, but may consist of other securities. The value of the underlying securities, at the time of purchase and each subsequent business day, is required to be maintained at such a level that the value is equal to at least the principal amount of the repurchase price plus accrued interest. The use of repurchase agreements involves certain risks. Upon an event of default under the Master Repurchase Agreement, if the seller of securities under a repurchase agreement defaults on its obligation to repurchase the underlying securities (as a result of its bankruptcy or otherwise) the Portfolio will seek to dispose of such securities; this action could involve losses, costs or delays. In addition, the proceeds of any such disposition may be less than the amount the Portfolio is owed under the repurchase agreement. The Portfolio may enter into repurchase agreements maturing within a specified date with domestic dealers, banks and other financial institutions deemed to be creditworthy by SSGA FM, a subsidiary of State Street Corporation and an affiliate of State Street Bank and Trust Company (“State Street”).
Federal income taxes – The Portfolio is not required to pay federal income taxes on its net investment income and net capital gains because it is treated as a partnership for federal income tax purposes. All interest, gains and losses of the Portfolio are deemed to have been “passed through” to the Portfolio’s partners in proportion to their holdings in the Portfolio, regardless of whether such items have been distributed by the Portfolio. Each partner is responsible for tax liability based on its distributive share; therefore, no provision has been made for federal income taxes.
SSGA Funds Management, Inc. (“SSGA FM” or the “Adviser”) has reviewed the tax positions for open years as of December 31, 2015, and has determined that no provision for income tax is required in the Portfolio’s financial statements. The Portfolio’s federal tax returns for the past three years remain subject to examination by the Portfolio’s major tax jurisdictions, which include the United States of America and the Commonwealth of Massachusetts. The Portfolio recognizes interest and penalties, if any, related to tax liabilities as income tax expense in the Statement of Operations. No income tax returns are currently under examination. Management has analyzed tax laws and regulations and their applications to the Portfolio’s facts and circumstances and does not believe there are any uncertain tax positions that require recognition of a tax liability.
At December 31, 2015, the cost of investments for federal income tax purposes was substantially the same as the cost for financial reporting purposes.
| 3. | Related Party Fees |
The Trust has entered into an investment advisory agreement with the Adviser, under which the Adviser directs the investments of the Portfolio in accordance with its investment objectives, policies, and limitations. In compensation for the Adviser’s services as investment adviser, the Portfolio pays the Adviser a management fee at an annual rate of 0.05% of its average daily net assets.
34
Table of Contents
State Street Master Funds
State Street Treasury Money Market Portfolio
Notes to Financial Statements — (continued)
December 31, 2015
Effective June 1, 2015, SSGA FM serves as administrator and State Street serves as sub-administrator. A fee is paid by the Portfolio for the administration, sub-administration, custody and transfer agency services SSGA FM and State Street provide. The annual fee is accrued daily and payable monthly at the following fee rate:
| Asset Levels | Annual percentage of average aggregate monthly net assets | |
First $400 million | 0.03% | |
Next $15 billion | 0.02% | |
Thereafter | 0.01% | |
Minimum annual fee per Portfolio | $150,000 |
The minimum fee will be calculated by multiplying the minimum per fund fee by the number of portfolios within the Trust to arrive at the total minimum fee. The greater of the asset based fee or the minimum fee will be charged to the portfolios. SSGA FM and State Street each receive a portion of the fee.
Prior to June 1, 2015, State Street served as administrator. The administration fees paid by the Portfolio were not changed as a result of the administrator and sub-administrator appointments as of June 1, 2015.
| 4. | Trustees’ Fees |
Independent Trustees are compensated on a calendar year basis. Any Trustee who is deemed to be an “interested person” (as defined in the 1940 Act) of the Trust does not receive compensation from the Trust for his or her service as a Trustee.
Each Independent Trustee receives for his or her services to the State Street Master Funds, State Street Institutional Investment Trust and SSGA Funds, a $141,500 annual base retainer in addition to $18,000 for each in-person meeting and $2,000 for each telephonic meeting from the Trust. The Co-Chairmen each receive an additional $44,000 annual retainer. The Independent Trustees are reimbursed for travel and other out-of-pocket expenses in connection with meeting attendance. Trustees’ fees and expenses are allocated among the Trusts and funds overseen by the Trustees in a manner deemed equitable taking into consideration the relative net assets of the funds, subject to a $15,000 minimum per fund. As of the date of this Shareholder Report, the Trustees were not paid pension or retirement benefits as part of the Trust’s expenses. However, the State Street Master Funds have, pursuant to an exemptive order from the SEC, implemented an optional deferred compensation plan by which the Independent Trustees may defer receipt of compensation and receive a return on the deferred amount determined with reference to the performance of shares of specified State Street Master Funds. As of the fiscal year ended December 31, 2015, none of the Independent Trustees participated in the optional deferred compensation program
The Trust’s officers are compensated by the Adviser and its affiliates.
35
Table of Contents
State Street Master Funds
State Street Treasury Money Market Portfolio
Notes to Financial Statements — (continued)
December 31, 2015
| 5. | Market, Credit and Counterparty Risk |
In the normal course of business, the Portfolio invests in securities and enters into transactions where risks exist due to fluctuations in the market (market risk) or failure of the other party to a transaction to perform (counterparty risk). The value of securities held by the Portfolio may decline in response to certain events, including those directly involving the companies whose securities are owned by the Portfolio; conditions affecting the general economy; overall market changes; local, regional or global political, social or economic instability; and currency and interest rate and price fluctuations (credit risk). Similar to credit risk, the Portfolio may be exposed to counterparty risk, or the risk that an entity with which the Portfolio has unsettled or open transactions may default. Financial assets, which potentially expose the Portfolio to credit and counterparty risks, consist principally of investments and cash due from counterparties. The extent of the Portfolio’s exposure to credit and counterparty risks in respect to these financial assets approximates their value as recorded in the Portfolio’s Statement of Assets and Liabilities, less any collateral held by the Portfolio.
| 6. | Rule Issuance |
On July 23, 2014, the U.S. Securities and Exchange Commission (“SEC”) adopted amendments to the governing rules for money market funds. The amendments require that, following a two-year implementation timeframe, institutional prime and institutional tax exempt money market funds adopt a floating net asset value. The rule changes also allow for certain liquidity-based redemption fees and gate, and include enhanced requirements for disclosure and stress testing. The degree to which a money market fund will be impacted by the rule amendments will depend upon the type of fund and type of investors (retail or institutional). At this time, management is evaluating the implications of these amendments and their impact to the Portfolio’s financial statements and accompanying notes.
| 7. | Subsequent Events |
Management has evaluated the impact of all subsequent events on the Portfolio through the date the financial statements were available to be issued and has determined that there were no subsequent events requiring adjustment or disclosure in the financial statements.
36
Table of Contents
Report of Independent Registered Public Accounting Firm
To the Board of Trustees and Owners of Beneficial Interest of
State Street Master Funds:
We have audited the accompanying statement of assets and liabilities, including the schedule of investments, of the State Street Treasury Money Market Portfolio (one of the portfolios constituting State Street Master Funds) (the “Portfolio”) as of December 31, 2015, and the related statement of operations for the year then ended, the statements of changes in net assets for each of the two years in the period then ended, and the financial highlights for each of the five years in the period then ended. These financial statements and financial highlights are the responsibility of the Portfolio’s management. Our responsibility is to express an opinion on these financial statements and financial highlights based on our audits.
We conducted our audits in accordance with the standards of the Public Company Accounting Oversight Board (United States). Those standards require that we plan and perform the audit to obtain reasonable assurance about whether the financial statements and financial highlights are free of material misstatement. We were not engaged to perform an audit of the Portfolio’s internal control over financial reporting. Our audits included consideration of internal control over financial reporting as a basis for designing audit procedures that are appropriate in the circumstances, but not for the purpose of expressing an opinion on the effectiveness of the Portfolio’s internal control over financial reporting. Accordingly, we express no such opinion. An audit also includes examining, on a test basis, evidence supporting the amounts and disclosures in the financial statements and financial highlights, assessing the accounting principles used and significant estimates made by management, and evaluating the overall financial statement presentation. Our procedures included confirmation of securities owned as of December 31, 2015, by correspondence with the custodian and others or by other appropriate auditing procedures where replies from others were not received. We believe that our audits provide a reasonable basis for our opinion.
In our opinion, the financial statements and financial highlights referred to above present fairly, in all material respects, the financial position of the State Street Treasury Money Market Portfolio (one of the portfolios constituting State Street Master Funds) at December 31, 2015, the results of its operations for the year then ended, the changes in its net assets for each of the two years in the period then ended, and the financial highlights for each of the five years in the period then ended, in conformity with U.S. generally accepted accounting principles.
Boston, Massachusetts
February 26, 2016
37
Table of Contents
State Street Master Funds
State Street Treasury Money Market Portfolio
December 31, 2015 (Unaudited)
SHAREHOLDER EXPENSE EXAMPLE
As a shareholder of a fund, you incur two types of costs: (1) transaction costs, and (2) ongoing costs, including advisory and administration fees, among others. This example is intended to help you understand your ongoing costs (in dollars) of investing in a fund and to compare these costs with the ongoing costs of investing in other mutual funds. It is based on an investment of $1,000 made at the beginning of the period shown and held for the entire period from July 1, 2015 to December 31, 2015.
The table below illustrates your Portfolio’s costs in two ways:
| • | Actual expenses. This section helps you to estimate the actual expenses that you paid over the period. The “Ending Account Value” shown is derived from the Portfolio’s actual return, and the third column shows the dollar amount that would have been paid by an investor who started with $1,000 in the Portfolio. You may use the information here, together with the amount you invested, to estimate the expenses that you paid over the period. To do so, simply divide your account value by $1,000 (for example, an $8,600 account value divided by $1,000 = 8.6), then multiply the result by the number given for the Portfolio under the heading “Expenses Paid During Period.” |
| • | Hypothetical example for comparison purposes. This section is intended to help you compare your Portfolio’s costs with those of other mutual funds. It assumes that the Portfolio had a yearly return of 5% before expenses, but that the expense ratio is unchanged. In this case, because the return used is not the Portfolio’s actual return, the results do not apply to your investment. The example is useful in making comparisons because the Securities and Exchange Commission requires all mutual funds to calculate expenses based on a 5% return. You can assess your Portfolio’s costs by comparing this hypothetical example with the hypothetical examples that appear in shareholder reports of other funds. |
Six Months Ended December 31, 2015
Beginning July 1, 2015 | Ending Account Value December 31, 2015 | Expenses Paid During Period * | ||||||||||
Based on Actual Portfolio Return | $ | 1,000.00 | $ | 999.80 | $ | 0.35 | ||||||
Based on Hypothetical (5% return before expenses) | $ | 1,000.00 | $ | 1,024.85 | $ | 0.36 | ||||||
| * | The calculations are based on expenses incurred in the most recent six month period of the Portfolio. The Portfolio’s annualized expense ratio for the six months ended December 31, 2015 was 0.07%. |
| The dollar amounts shown as “Expenses Paid” are equal to the annualized expense ratio multiplied by the average account value over the period, multiplied by 184/365 (the most recent six month period). |
38
Table of Contents
State Street Master Funds
State Street Treasury Money Market Portfolio
Shareholder Requests for Additional Information
December 31, 2015 (Unaudited)
Proxy Voting Policies and Procedures and Record
The Portfolio has adopted the proxy voting policies of the Adviser. A description of the policies and procedures that the Portfolio have adopted to determine how to vote proxies relating to portfolio securities are contained in the Portfolio’s Statement of Additional Information, which is available (i) without charge, upon request, by calling the Portfolio at 1-877-521-4083, (ii) on the U.S. Securities and Exchange Commission’s website at www.sec.gov, or (iii) at the U.S. Securities and Exchange Commission’s public reference room. Information on the operation of the public reference room may be obtained by calling 1-800-SEC-0330. Information regarding how the Portfolio voted proxies, if any, during the most recent 12-month period ended June 30 is available by August 31 of each year without charge (1) by calling 1-877-521-4083 (toll free), or (2) on the website of the Securities and Exchange Commission (“SEC”) at www.sec.gov.
Quarterly Portfolio Schedule
The Portfolio will file their complete schedules of investments with the U.S. Securities and Exchange Commission for the first and third quarters of each fiscal year on Form N-Q. For the second and fourth quarters, the complete schedules of investments are available in the Portfolio’s semi-annual and annual financial statements. The Portfolio’s Form N-Q is available (i) without charge, upon request, by calling the Portfolio at 1-877-521-4083, (ii) on the Securities and Exchange Commission’s website at www.sec.gov, or (iii) at the Securities and Exchange Commission’s public reference room. Information on the operation of the public reference room may be obtained by calling 1-800-SEC-0330.
Monthly Portfolio Schedule
The Portfolio files its monthly portfolio holdings with the U.S. Securities and Exchange Commission on Form N-MFP. The SEC delays the public availability of the information filed on Form N-MFP for 60 days after the end of the reporting period included in the filing. The Portfolio’s Form N-MFP is available (i) on the U.S. Securities and Exchange Commission’s website at www.sec.gov, or (ii) at the Securities and Exchange Commission’s public reference room.
39
Table of Contents
State Street Treasury Money Market Portfolio
Disclosure of Information about Fund Trustees and Officers
December 31, 2015 (Unaudited)
Name, Address, | Position(s) Held | Term of Office | Principal Occupation | Number of Funds in Fund Complex Overseen by Trustee | Other Directorships | |||||
Independent Trustees | ||||||||||
Michael F. Holland State Street Bank and Trust Company 100 Huntington Avenue, CPH 0326 Boston, MA 02116 YOB: 1944 | Trustee and Co-Chairman of the Board | Term: Indefinite Elected: 7/99 | Chairman, Holland & Company L.L.C. (investment adviser) (1995 – present). | 75 | Director, the Holland Series Fund, Inc.; Director, The China Fund, Inc.; Director, The Taiwan Fund, Inc.; Director, Reaves Utility Income Fund, Inc.; and Director, Blackstone/GSO Loan Funds. | |||||
Patrick J. Riley State Street Bank and Trust Company 100 Huntington Avenue, CPH 0326 Boston, MA 02116 YOB: 1948 | Trustee and Co-Chairman of the Board | Term: Indefinite Elected: 1/14 | 2002 to May 2010, Associate Justice of the Superior Court, Commonwealth of Massachusetts; 1985 to 2002, Partner, Riley, Burke & Donahue, L.L.P. (law firm); 1998 to Present, Independent Director, State Street Global Advisers Ireland, Ltd. (investment company); 1998 to Present, Independent Director, SSGA Liquidity plc (formerly, SSGA Cash Management Fund plc); January 2009 to Present, Independent Director, SSGA Fixed Income plc; and January 2009 to Present, Independent Director, SSGA Qualified Funds PLC. | 75 | Board Director and Chairman, SPDR Europe 1PLC Board (2011 – Present); Board Director and Chairman, SPDR Europe II, PLC (2013 – Present). | |||||
William L. Boyan State Street Bank and Trust Company 100 Huntington Avenue, CPH 0326 Boston, MA 02116 YOB: 1937 | Trustee and Co-Chairman of the Valuation Committee | Term: Indefinite Elected: 7/99 | President and Chief Operations Officer, John Hancock Financial Services (1959 – 1999). Mr. Boyan retired in 1999. Chairman Emeritus, Children’s Hospital, Boston, MA (1984 – 2011); Former Trustee of Old Mutual South Africa Master Trust (investments) (1995 – 2008); Former Chairman, Boston Plan For Excellence, Boston Public Schools (1995 – 2010); Member of Advisory Board of Florida Atlantic University Lifelong Learning Society. | 75 | Former Trustee of Old Mutual South Africa Master Trust. |
40
Table of Contents
State Street Treasury Money Market Portfolio
Disclosure of Information about Fund Trustees and Officers — (continued)
December 31, 2015 (Unaudited)
Name, Address, | Position(s) Held | Term of Office | Principal Occupation | Number of Funds in Fund Complex Overseen by Trustee | Other Directorships | |||||
Independent Trustees (continued) | ||||||||||
William L. Marshall State Street Bank and Trust Company 100 Huntington Avenue, CPH 0326 Boston, MA 02116 YOB: 1942 | Trustee and Co-Chairman of the Audit Committee | Term: Indefinite Elected: 1/14 | April 2011 to Present, Chairman (until April 2011, Chief Executive Officer and President), Wm. L. Marshall Associates, Inc., Wm. L. Marshall Companies, Inc. and the Marshall Financial Group, Inc. (a registered investment adviser and provider of financial and related consulting services); Certified Financial Planner; Member, Financial Planners Association; 2015 to present, Board Member, The Doylestown Health Foundation Board. | 75 | Marshall Financial Group, Inc. | |||||
Richard D. Shirk State Street Bank and Trust Company 100 Huntington Avenue, CPH 0326 Boston, MA 02116 YOB: 1945 | Trustee and Co-Chairman of the Qualified Legal and Compliance Committee | Term: Indefinite Elected: 1/14 | March 2001 to April 2002, Chairman (1996 to March 2001, President and Chief Executive Officer), Cerulean Companies, Inc. (holding company) (Retired); 1992 to March 2001, President and Chief Executive Officer, Blue Cross Blue Shield of Georgia (health insurer, managed healthcare); 1998 to December 2008, Chairman, Board Member and December 2008 to Present, Investment Committee Member, Healthcare Georgia Foundation (private foundation); September 2002 to 2012, Lead Director and Board Member, Amerigroup Corp. (managed health care); 1999 to 2013, Board Member and (since 2001) Investment Committee Member, Woodruff Arts Center; and 2003 to 2009, Trustee, Gettysburg College. | 75 | Board member, AeroCare Holdings (privately held healthcare services company) (February 2003 – Present); Board member, Regenesis Biomedical (health care services) (April 2012 – Present); Chairman (January 2014 – Present). | |||||
Rina K. Spence State Street Bank and Trust Company 100 Huntington Avenue, CPH 0326 Boston, MA 02116 YOB: 1948 | Trustee and Co-Chairman of the Qualified Legal and Compliance Committee and Co-Chairman of the Governance Committee | Term: Indefinite Elected: 7/99 | President of SpenceCare International LLC (international healthcare consulting) (1999 – present); Chief Executive Officer, IEmily.com (health internet company) (2000 – 2001); Chief Executive Officer of Consensus Pharmaceutical, Inc. (1998 – 1999); Founder, President and Chief Executive Officer of Spence Center for Women’s Health (1994 – 1998); President and CEO Emerson Hospital (1984 – 1994); Trustee, Eastern Enterprise (utilities) (1988 – 2000); Director, Berkshire Life Insurance Company of America (1993 – 2009); Honorary Consul for Monaco in Boston (2015 – present). | 75 | ||||||
41
Table of Contents
State Street Treasury Money Market Portfolio
Disclosure of Information about Fund Trustees and Officers — (continued)
December 31, 2015 (Unaudited)
Name, Address, | Position(s) Held | Term of Office | Principal Occupation | Number of Funds in Fund Complex Overseen by Trustee | Other Directorships | |||||
Independent Trustees (continued) | ||||||||||
Bruce D. Taber State Street Bank and Trust Company 100 Huntington Avenue, CPH 0326 Boston, MA 02116 YOB: 1943 | Trustee and Co-Chairman of the Valuation Committee and Co-Chairman of the Governance Committee | Term: Indefinite Elected: 1/14 | 1999 to Present, Partner, Zenergy LLC (a technology company providing Computer Modeling and System Analysis to the General Electric Power Generation Division); Until December 2008, Independent Director, SSGA Cash Management Fund plc; Until December 2008, Independent Director, State Street Global Advisers Ireland, Ltd. (investment companies); and Until August 1994, President, Alonzo B. Reed, Inc., (a Boston architect-engineering firm). | 75 | ||||||
Douglas T. Williams State Street Bank and Trust Company 100 Huntington Avenue, CPH 0326 Boston, MA 02116 YOB: 1940 | Trustee and Co-Chairman of the Audit Committee | Term: Indefinite Elected: 7/99 | President, Oakmont Homeowners Association; President, Mariner Sands Chapel; Executive Vice President and member of Executive Committee, Chase Manhattan Bank (1987 – 1999); President, Boston Stock Exchange Depository Trust Company, 1981-1982; Treasurer, Nantucket Educational Trust, (2002 – 2007). | 75 | ||||||
Interested Trustee(1) | ||||||||||
James E. Ross SSGA Funds Management, Inc. State Street Financial Center One Lincoln Street Boston, MA 02111 YOB: 1965 | Trustee | Term: Indefinite Elected Trustee: 2/07 | Chairman and Director, SSGA Funds Management, Inc. (2012 – present); President, SSGA Funds Management, Inc. (2005 – 2012); Executive Vice President and Senior Managing Director, State Street Global Advisors (2006 – present); and Principal, State Street Global Advisors (2006 – present). | 290 | Trustee, SPDR Series Trust; Trustee, SPDR Index Shares Funds; Trustee, Select Sector SPDR Trust; Trustee, SSGA Active Trust; and Trustee, SSGA Master Trust. | |||||
| (1) | Mr. Ross is an Interested Trustee because of his employment by SSGA Funds Management, Inc., an affiliate of the Trust. |
Name, Address, | Position(s) Held | Term of Office | Principal Occupation | |||
Officers: | ||||||
Ellen M. Needham SSGA Funds Management, Inc. State Street Financial Center One Lincoln Street Boston, MA 02111 YOB: 1967 | President | Term: Indefinite Elected: 10/12 | President and Director, SSGA Funds Management, Inc. (June 2012 – present); Chief Operating Officer, SSGA Funds Management, Inc. (May 2010 – June 2012); Senior Managing Director, SSGA Funds Management, Inc. (1992 – 2012) and Senior Managing Director, State Street Global Advisors (1992 – present).* |
42
Table of Contents
State Street Treasury Money Market Portfolio
Disclosure of Information about Fund Trustees and Officers — (continued)
December 31, 2015 (Unaudited)
Name, Address, | Position(s) Held | Term of Office | Principal Occupation | |||
Officers: (continued) | ||||||
Bruce S. Rosenberg SSGA Funds Management, Inc. State Street Financial Center One Lincoln Street Boston, MA 02111 YOB: 1961 | Treasurer | Term: Indefinite Elected: 2/16 | Managing Director, State Street Global Advisors and SSGA Funds Management, Inc. (July 2015 – present); Director, Credit Suisse (April 2008 – July 2015). | |||
Ann M. Carpenter SSGA Funds Management, Inc. State Street Financial Center One Lincoln Street Boston, MA 02111 YOB: 1966 | Vice President Deputy Treasurer | Term: Indefinite Elected: 10/12 Term: Indefinite Elected: 2/16 | Chief Operating Officer, SSGA Funds Management, Inc. (April 2014 – present); Vice President, State Street Global Advisors and SSGA Funds Management, Inc. (2005 – present).* | |||
Chad C. Hallett SSGA Funds Management, Inc. State Street Financial Center One Lincoln Street Boston, MA 02111 YOB: 1969 | Deputy Treasurer | Term: Indefinite Elected: 2/16 | Vice President, State Street Global Advisors and SSGA Funds Management, Inc. (November 2014 – present); Vice President, State Street Bank and Trust Company (2001 – November 2014).* | |||
Sujata Upreti SSGA Funds Management, Inc. State Street Financial Center One Lincoln Street Boston, MA 02111 YOB: 1974 | Assistant Treasurer | Term: Indefinite Elected: 2/16 | Vice President, State Street Global Advisors and SSGA Funds Management, Inc. (May 2015 – present); Assistant Director, Cambridge Associates, LLC (July 2014 – January 2015); Vice President, Bank of New York Mellon (July 2012 – August 2013); Manager, PricewaterhouseCoopers, LLP (September 2009 – July 2012). | |||
Daniel Foley SSGA Funds Management, Inc. State Street Financial Center One Lincoln Street Boston, MA 02111 YOB: 1972 | Assistant Treasurer | Term: Indefinite Elected: 2/16 | Vice President, State Street Global Advisors and SSGA Funds Management, Inc. (April 2014 – present); Principal, State Street Global Advisors and SSGA Funds Management, Inc. (April 2007 – April 2014). | |||
Brian Harris SSGA Funds Management, Inc. State Street Financial Center One Lincoln Street Boston, MA 02111 YOB: 1973 | Chief Compliance Officer | Term: Indefinite Elected: 11/13 | Vice President, State Street Global Advisors and SSGA Funds Management, Inc. (June 2013 – Present); Senior Vice President and Global Head of Investment Compliance, BofA Global Capital Management (September 2010 to May 2013); Director of Compliance, AARP Financial Inc. (July 2008 to August 2010). | |||
Trevor Swanberg SSGA Funds Management, Inc. State Street Financial Center One Lincoln Street Boston, MA 02111 YOB: 1979 | Code of Ethics Compliance Officer | Term: Indefinite Elected: 8/15 | Vice President, State Street Global Advisors and SSGA Funds Management, Inc. (January 2015 – Present); Senior Manager-Mutual Fund Compliance, ICMA-Retirement Corporation (December 2011 – January 2015); Assistant Vice President, J.P. Morgan (September 2007 – December 2011). | |||
Joshua A. Weinberg SSGA Funds Management, Inc. State Street Financial Center One Lincoln Street Boston, MA 02111 YOB: 1978 | Chief Legal Officer | Term: Indefinite Elected: 2/15 | Vice President and Managing Counsel, State Street Global Advisors (2011 – present); Clerk, SSGA Funds Management, Inc. (2013 – present); Associate, Financial Services Group, Dechert LLP (2006 – 2011). |
43
Table of Contents
State Street Treasury Money Market Portfolio
Disclosure of Information about Fund Trustees and Officers — (continued)
December 31, 2015
Name, Address, | Position(s) Held | Term of Office | Principal Occupation | |||
Officers: (continued) | ||||||
David K. James State Street Bank and Trust Company 100 Huntington Avenue, 3rd Floor Boston, MA 02116 YOB: 1970 | Secretary | Term: Indefinite Elected: 4/13 | Managing Director and Managing Counsel, State Street Bank and Trust Company (2009 – present); Vice President and Counsel, PNC Global Investment Servicing (US), Inc. (2006 – 2009). | |||
Kristin Schantz State Street Bank and Trust Company 100 Huntington Avenue, 3rd Floor Boston, MA 02116 YOB: 1979 | Assistant Secretary | Term: Indefinite Elected: 2/14 | Vice President and Counsel, State Street Bank and Trust Company (2013 – present); Vice President, Citi Fund Services Ohio, Inc. (2008 – 2013). |
| * | Served in various capacities and/or with various affiliated entities during noted time period. |
44
Table of Contents
Trustees
William L. Boyan
Michael F. Holland
William L. Marshall
Patrick J. Riley
James E. Ross
Richard D. Shirk
Rina K. Spence
Bruce D. Taber
Douglas T. Williams
Investment Adviser and Administrator
SSGA Funds Management, Inc.
State Street Financial Center
One Lincoln Street
Boston, MA 02111
Custodian, Sub-Administrator, and Transfer Agent
State Street Bank and Trust Company
State Street Financial Center
One Lincoln Street
Boston, MA 02111
Independent Registered Public Accounting Firm
Ernst & Young LLP
200 Clarendon Street
Boston, MA 02116
Legal Counsel
Ropes & Gray LLP
800 Boylston Street
Boston, MA 02199
This report is for shareholder information. This is not a prospectus intended for use in the purchase or sale of shares of beneficial interest.
State Street Master Funds State Street Bank and Trust Company P.O. Box 5049 Boston, MA 02206 | SSITINVAR IBG-18444 |
Table of Contents
Annual Report
31 December 2015
State Street Institutional Investment Trust
State Street Institutional Treasury Plus Money Market Fund

Table of Contents
State Street Institutional Investment Trust
State Street Institutional Treasury Plus Money Market Fund
Annual Report
December 31, 2015
| 1 | ||||
| 2 | ||||
| 3 | ||||
| 4 | ||||
| 6 | ||||
| 12 | ||||
| 13 | ||||
| 14 | ||||
| 15 | ||||
Table of Contents
State Street Institutional Investment Trust
State Street Institutional Treasury Plus Money Market Fund
Statement of Assets and Liabilities
December 31, 2015
Assets | ||||
Investments in corresponding Portfolio, at market value and cost (Note 1) | $ | 1,744,812,778 | ||
Cash | 3,764 | |||
Receivable from Adviser (Note 3) | 40,385 | |||
Prepaid expenses and other assets | 5,287 | |||
|
| |||
Total assets | 1,744,862,214 | |||
Liabilities | ||||
Administration and custody fees payable (Note 3) | 77,116 | |||
Professional fees payable | 17,064 | |||
Shareholder servicing fee payable (Note 3) | 13,041 | |||
Distribution fees payable (Note 3) | 5,424 | |||
Transfer agent fees payable | 3,361 | |||
Registration and filing fees payable | 2,767 | |||
Dividends payable | 5,464 | |||
Accrued expenses and other liabilities | 45,371 | |||
|
| |||
Total liabilities | 169,608 | |||
|
| |||
Net Assets | $ | 1,744,692,606 | ||
|
| |||
Net Assets Consist of: | ||||
Paid-in capital | $ | 1,744,693,446 | ||
Accumulated net realized loss | (840 | ) | ||
|
| |||
Net Assets | $ | 1,744,692,606 | ||
|
| |||
Net Assets | ||||
Premier Class | $ | 1,684,651,605 | ||
|
| |||
Investment Class | $ | 60,041,001 | ||
|
| |||
Shares of Beneficial Interest Outstanding | ||||
Premier Class | 1,684,776,182 | |||
|
| |||
Investment Class | 60,065,187 | |||
|
| |||
Offering, Net Asset Value, and Redemption Price Per Share | ||||
Premier Class | $ | 1.00 | ||
|
| |||
Investment Class | $ | 1.00 | ||
|
|
See accompanying notes to financial statements and financial statements of the corresponding portfolio.
1
Table of Contents
State Street Institutional Investment Trust
State Street Institutional Treasury Plus Money Market Fund
Year Ended December 31, 2015
Income | ||||
Interest income allocated from Portfolio (Note 2) | $ | 1,081,476 | ||
Expenses allocated from Portfolio (Note 2) | (1,329,553 | ) | ||
|
| |||
| (248,077 | ) | |||
|
| |||
Expenses | ||||
Administration and custody fees (Note 3) | 902,976 | |||
Shareholder servicing fee – Investment Class (Note 3) | 137,790 | |||
Distribution fees – Investment Class (Note 3) | 55,116 | |||
Trustees’ fees and expenses | 15,207 | |||
Registration and filing fees | 56,768 | |||
Professional fees | 28,223 | |||
Transfer agent fees (Note 3) | 52,166 | |||
Printing fees | 67,724 | |||
Other expenses | 27,243 | |||
|
| |||
Total expenses | 1,343,213 | |||
Less: Expenses reimbursed by the Adviser (Note 3) | (1,444,631 | ) | ||
Shareholder servicing fees waived – Investment Class (Note 3) | (137,790 | ) | ||
Distribution fees waived – Investment Class (Note 3) | (55,116 | ) | ||
|
| |||
Net expenses | (294,324 | ) | ||
|
| |||
Net Investment Income | 46,247 | |||
|
| |||
Net realized gain on investments allocated from Portfolio | 695 | |||
|
| |||
Net Increase in Net Assets Resulting from Operations | $ | 46,942 | ||
|
|
See accompanying notes to financial statements and financial statements of the corresponding portfolio.
2
Table of Contents
State Street Institutional Investment Trust
State Street Institutional Treasury Plus Money Market Fund
Statements of Changes in Net Assets
| Year Ended December 31, 2015 | Year Ended December 31, 2014 | |||||||
Increase (Decrease) in Net Assets Resulting from: | ||||||||
Operations: |
| |||||||
Net investment income | $ | 46,247 | $ | 4 | ||||
Net realized gain on investments | 695 | – | ||||||
|
|
|
| |||||
Net increase in net assets from operations | 46,942 | 4 | ||||||
|
|
|
| |||||
Distributions to Shareholders from: | ||||||||
Net investment income | ||||||||
Premier Class | (46,249 | ) | – | |||||
|
|
|
| |||||
Net Increase (Decrease) from Capital Share Transactions: | ||||||||
Premier Class | ||||||||
Shares sold | 10,751,778,055 | 13,323,353,168 | ||||||
Reinvestment of distributions | 40,118 | – | ||||||
Shares redeemed | (11,758,126,363 | ) | (13,311,990,338 | ) | ||||
|
|
|
| |||||
Net increase (decrease) from capital share transactions | (1,006,308,190 | ) | 11,362,830 | |||||
|
|
|
| |||||
Investment Class | ||||||||
Shares sold | 222,890,448 | 412,002,624 | ||||||
Shares redeemed | (237,630,175 | ) | (410,670,896 | ) | ||||
|
|
|
| |||||
Net increase (decrease) from capital share transactions | (14,739,727 | ) | 1,331,728 | |||||
|
|
|
| |||||
Net Increase (Decrease) in Net Assets | (1,021,047,224 | ) | 12,694,562 | |||||
Net Assets | ||||||||
Beginning of year | 2,765,739,830 | 2,753,045,268 | ||||||
|
|
|
| |||||
End of year | $ | 1,744,692,606 | $ | 2,765,739,830 | ||||
|
|
|
| |||||
Undistributed net investment income | $ | – | $ | 38 | ||||
|
|
|
| |||||
Changes in Shares: | ||||||||
Premier Class | ||||||||
Shares sold | 10,751,778,055 | 13,323,353,168 | ||||||
Reinvestment of distribution | 40,118 | – | ||||||
Shares redeemed | (11,758,126,363 | ) | (13,311,990,338 | ) | ||||
|
|
|
| |||||
Net increase (decrease) in shares | (1,006,308,190 | ) | 11,362,830 | |||||
|
|
|
| |||||
Investment Class | ||||||||
Shares sold | 222,890,448 | 412,002,624 | ||||||
Shares redeemed | (237,630,175 | ) | (410,670,896 | ) | ||||
|
|
|
| |||||
Net increase (decrease) in shares | (14,739,727 | ) | 1,331,728 | |||||
|
|
|
| |||||
See accompanying notes to financial statements and financial statements of the corresponding portfolio.
3
Table of Contents
State Street Institutional Investment Trust
State Street Institutional Treasury Plus Money Market Fund
Selected data for a share of beneficial interest outstanding throughout each year is presented below(a):
Year Ended December 31, | Net Asset Value Beginning of Year | Net Investment Income/(Loss) | Gain (Loss) on Investments | Total from Investment Operations | Distributions from Net Investment Income | Distributions from Capital Gains | Total Distributions | |||||||||||||||||||||
Premier Class | ||||||||||||||||||||||||||||
2015 | $ | 1.0000 | $ | 0.0000 | (d) | $ | 0.0000 | (d) | $ | 0.0000 | (d) | $ | (0.0000 | )(d) | $ | – | $ | (0.0000 | )(d) | |||||||||
2014 | $ | 1.0000 | $ | 0.0000 | (d) | $ | 0.0000 | (d) | $ | 0.0000 | (d) | $ | – | $ | – | $ | – | |||||||||||
2013 | $ | 1.0000 | $ | (0.0001 | ) | $ | 0.0001 | $ | 0.0000 | (d) | $ | (0.0000 | )(d) | $ | (0.0000 | )(d) | $ | (0.0000 | )(d) | |||||||||
2012 | $ | 1.0000 | $ | 0.0002 | $ | 0.0000 | (d) | $ | 0.0002 | $ | (0.0002 | ) | $ | – | $ | (0.0002 | ) | |||||||||||
2011 | $ | 1.0000 | $ | 0.0001 | $ | 0.0000 | (d) | $ | 0.0001 | $ | (0.0001 | ) | $ | – | $ | (0.0001 | ) | |||||||||||
Investment Class | ||||||||||||||||||||||||||||
2015 | $ | 1.0000 | $ | 0.0000 | (d) | $ | 0.0000 | (d) | $ | 0.0000 | (d) | $ | – | $ | – | $ | – | |||||||||||
2014 | $ | 1.0000 | $ | 0.0000 | (d) | $ | 0.0000 | (d) | $ | 0.0000 | (d) | $ | – | $ | – | $ | – | |||||||||||
2013 | $ | 1.0000 | $ | (0.0001 | ) | $ | 0.0001 | $ | 0.0000 | (d) | $ | – | $ | (0.0000 | )(d) | $ | (0.0000 | )(d) | ||||||||||
2012 | $ | 1.0000 | $ | 0.0000 | (d) | $ | 0.0000 | (d) | $ | 0.0000 | (d) | $ | – | $ | – | $ | – | |||||||||||
2011 | $ | 1.0000 | $ | 0.0000 | (d) | $ | 0.0000 | (d) | $ | 0.0000 | (d) | $ | – | $ | – | $ | – | |||||||||||
| (a) | The per share amounts and percentages include the Fund’s proportionate share of income and expenses of the Portfolio. |
| (b) | Total return is calculated assuming a purchase of shares at net asset value on the first day and a sale at net asset value on the last day of each period reported. Distributions are assumed, for the purpose of this calculation, to be reinvested at net asset value per share on the respective payment dates. Results represent past performance and are not indicative of future results. |
| (c) | This expense waiver is reflected in both the net operating expense and the net investment income ratios shown above. Without these waivers, net investment income would have been lower. |
| (d) | Amount is less than $0.00005 per share. |
| (e) | Amount is less than 0.005%. |
See accompanying notes to financial statements and financial statements of the corresponding portfolio.
4
Table of Contents
Year Ended December 31, | Net Asset Value End of Year | Ratios to Average Net Assets/Supplemental Data(a) | Net Assets End of Year (000s omitted) | |||||||||||||||||||||||||
| Total Return(b) | Gross Expenses | Net Expenses | Net Investment Income | Expense Waiver(c) | ||||||||||||||||||||||||
Premier Class | ||||||||||||||||||||||||||||
2015 | $ | 1.0000 | 0.00 | %(e) | 0.14 | % | 0.06 | % | 0.00 | %(e) | 0.08 | % | $ | 1,684,652 | ||||||||||||||
2014 | $ | 1.0000 | 0.00 | %(e) | 0.13 | % | 0.05 | % | 0.00 | %(e) | 0.08 | % | $ | 2,690,959 | ||||||||||||||
2013 | $ | 1.0000 | 0.00 | %(e) | 0.13 | % | 0.08 | % | 0.00 | %(e) | 0.05 | % | $ | 2,679,596 | ||||||||||||||
2012 | $ | 1.0000 | 0.02 | % | 0.14 | % | 0.11 | % | 0.02 | % | 0.03 | % | $ | 2,203,141 | ||||||||||||||
2011 | $ | 1.0000 | 0.01 | % | 0.14 | % | 0.06 | % | 0.01 | % | 0.08 | % | $ | 1,220,159 | ||||||||||||||
Investment Class | ||||||||||||||||||||||||||||
2015 | $ | 1.0000 | 0.00 | %(e) | 0.49 | % | 0.06 | % | 0.00 | %(e) | 0.43 | % | $ | 60,041 | ||||||||||||||
2014 | $ | 1.0000 | 0.00 | %(e) | 0.48 | % | 0.05 | % | 0.00 | %(e) | 0.43 | % | $ | 74,781 | ||||||||||||||
2013 | $ | 1.0000 | 0.00 | %(e) | 0.48 | % | 0.08 | % | 0.00 | %(e) | 0.40 | % | $ | 73,449 | ||||||||||||||
2012 | $ | 1.0000 | 0.00 | %(e) | 0.49 | % | 0.13 | % | 0.00 | %(e) | 0.36 | % | $ | 95,222 | ||||||||||||||
2011 | $ | 1.0000 | 0.00 | %(e) | 0.49 | % | 0.08 | % | 0.00 | %(e) | 0.41 | % | $ | 141,023 | ||||||||||||||
See accompanying notes to financial statements and financial statements of the corresponding portfolio.
5
Table of Contents
State Street Institutional Investment Trust
State Street Institutional Treasury Plus Money Market Fund
December 31, 2015
| 1. | Organization |
State Street Institutional Investment Trust (the “Trust”) is registered under the Investment Company Act of 1940, as amended (the “1940 Act”), as an open-end management investment company, and was organized as a business trust under the laws of the Commonwealth of Massachusetts on February 16, 2000. The Trust consists of forty-five (45) series and corresponding classes, each of which have the same rights and privileges, including the same voting rights. Each series is authorized to issue an unlimited number of shares, with no par value. The financial statements herein relate to the following fund (the “Fund”):
| Fund | Classes | Commencement of Operations: | ||
State Street Institutional Treasury Plus Money Market Fund | Service Class Investment Class Premier Class Institutional Class Investor Class Administration Class | Not commenced October 24, 2007 October 24, 2007 Not commenced Not commenced Not commenced |
The Fund is part of a master-feeder investment structure and invests all of its investable assets in interests of its master portfolio (the “Portfolio”) as reflected in the table below. The investment objective and policies of the Portfolio are substantially similar to those of the Fund. The value of the Fund’s investment in its Portfolio reflects the Fund’s proportionate interest in the net assets of the Portfolio. The performance of the Fund is directly affected by the performance of the Portfolio. The financial statements of the Portfolio, including its Schedule of Investments, are attached to this report and should be read in conjunction with the Fund’s financial statements.
| Fund | % Investment in Master | Portfolio | ||
State Street Institutional Treasury Plus Money Market Fund | 100.00% | State Street Treasury Plus Money Market Portfolio* |
| * | A series of the State Street Master Funds |
The State Street Treasury Plus Money Market Fund is considered to be a money market fund pursuant to Rule 2a-7 under the 1940 Act. It is the Fund’s policy, as a money market fund, to maintain a stable net asset value per share of $1.00. However, there is no assurance the Fund will maintain a stable net asset value per share.
An investment in the Fund is not insured or guaranteed by the Federal Deposit Insurance Corporation or any other government agency. Although the Fund seeks to preserve the value of the shareholders’ investment at $1.00 per share, it is possible to lose money by investing in the Fund.
Under the Trust’s organizational documents, its officers and trustees are indemnified against certain liabilities arising out of the performance of their duties to the Trust. Additionally, in the normal course of business, the Trust enters into contracts with service providers that contain general indemnification clauses. The Trust’s maximum exposure under these arrangements is unknown as this could involve future claims that may be made against the Trust that have not yet occurred.
6
Table of Contents
State Street Institutional Investment Trust
State Street Institutional Treasury Plus Money Market Fund
Notes to Financial Statements — (continued)
December 31, 2015
| 2. | Summary of Significant Accounting Policies |
The following is a summary of significant accounting policies followed by the Trust in the preparation of its financial statements:
The preparation of financial statements in accordance with U.S. generally accepted accounting principles (“U.S. GAAP”) requires management to make estimates and assumptions that affect the reported amounts and disclosures in the financial statements. Actual results could differ from those estimates. The Fund is an investment company under U.S. GAAP and follows the accounting and reporting guidance applicable to investment companies in Financial Accounting Standards Board (“FASB”) Accounting Standards Codification (“ASC”) 946, Financial Services Investment Companies (“ASC 946”).
Security valuation – The Fund records its investment in the Portfolio at value. The valuation policy of the Portfolio is discussed in Note 2 of the Portfolio’s Notes to Financial Statements, which are attached to this report.
The Portfolio’s investments are valued at fair value each day that the Portfolio’s listing exchange is open and, for financial reporting purposes, as of the report date should the reporting period end on a day that the Portfolio’s listing exchange is not open. Fair value is generally defined as the price a fund would receive to sell an asset or pay to transfer a liability in an orderly transaction between market participants at the measurement date. By its nature, a fair value price is a good faith estimate of the valuation in a current sale and may not reflect an actual market price. The investments of the Portfolio are valued pursuant to the policy and procedures developed by the Oversight Committee (the “Committee”) and approved by the Board of Trustees of the Trust (the “Board”). The Committee provides oversight of the valuation of investments for the Fund. The summary of the inputs used for the Portfolio, as of December 31, 2015, in valuing the Portfolio’s assets carried at fair value are discussed in Note 2 of the Portfolio’s Notes to Financial Statements, which are attached to this report.
Investment transactions and income recognition – Investment transactions are accounted for on trade date for financial reporting purposes. Net investment income consists of the Fund’s pro-rata share of the net investment income of the Portfolio, less all expenses of the Fund. Dividends from net investment income are declared daily and are payable as of the last business day of each month. Realized gains and losses from security transactions consist of the Fund’s pro-rata share of the Portfolio’s realized gains and losses. Distributions from capital gains, if any, are distributed annually. Class specific distribution and shareholder servicing fees are borne by each class. Income, non-class specific expenses, and realized gains and losses are allocated to the respective classes daily on the basis of relative net assets.
Expenses – Certain expenses, which are directly identifiable to a specific fund, are applied to that fund within the Trust. Other expenses which cannot be attributed to a specific fund are allocated in such a manner as deemed equitable, taking into consideration the nature and type of expense and the relative net assets of the funds within the Trust.
Federal income taxes – The Fund has qualified and intends to continue to qualify for and elect treatment as a “regulated investment company” under Subchapter M of the Internal Revenue Code of 1986, as amended. By so qualifying and electing, the Fund will not be subject to federal income taxes to the extent it distributes its taxable income, including any net realized capital gains, for each fiscal year.
7
Table of Contents
State Street Institutional Investment Trust
State Street Institutional Treasury Plus Money Market Fund
Notes to Financial Statements — (continued)
December 31, 2015
In addition, by distributing during each calendar year substantially all of its net investment income and capital gains, if any, the Fund will not be subject to federal excise tax. Income and capital gain distributions, if any, are determined in accordance with income tax regulation which may differ from U.S. GAAP.
At December 31, 2015, the cost of investments for federal income tax purposes was substantially the same as the cost for financial reporting purposes.
SSGA Funds Management, Inc. (“SSGA FM” or the “Adviser) has reviewed the Fund’s tax positions for the open tax years as of December 31, 2015, and has determined that no provision for income tax is required in the Fund’s financial statements. The Fund’s federal tax returns for the prior three fiscal years remain subject to examination by the Fund’s major tax jurisdictions, which include the United States of America and the Commonwealth of Massachusetts. The Fund recognizes interest and penalties, if any, related to tax liabilities as income tax expense in the Statements of Operations. No income tax returns are currently under examination. Management has analyzed tax laws and regulations and their applications to the Fund’s facts and circumstances and does not believe there are any uncertain tax positions that require recognition of tax liability.
For the year ended December 31, 2015, permanent differences identified and reclassified among the components of net assets were as follows:
Paid-In Capital | Accumulated Gain (Loss) | Undistributed Net Investment Income (Loss) | ||||||||||
State Street Institutional Treasury Plus Money Market Fund | $ | 36 | $ | – | $ | (36 | ) | |||||
These differences were primarily attributable to distribution redesignations, net operating loss, non-deductible tax paid and distributions in excess of current earnings. Net investment income (loss), net realized gains (losses), and net assets were not affected by this reclassification.
The tax character of distributions paid to shareholders during the years ended December 31, 2015, and December 31, 2014, was as follows:
| December 31, 2015 | December 31, 2014 | |||||||||||||||||||||||
Ordinary Income | Tax Exempt Income | Long Term Capital Gain | Ordinary Income | Tax Exempt Income | Long Term Capital Gain | |||||||||||||||||||
State Street Institutional Treasury Plus Money Market Fund | $ | 46,247 | $ | – | $ | – | $ | – | $ | – | $ | – | ||||||||||||
At December 31, 2015, the components of distributable earnings on a tax basis were as follows:
| Undistributed Ordinary Income | Undistributed Tax Exempt Income | Capital Loss Carryover | Total | |||||||||||||
State Street Institutional Treasury Plus Money Market Fund | $ | – | $ | – | $ | (840 | ) | $ | (840 | ) | ||||||
8
Table of Contents
State Street Institutional Investment Trust
State Street Institutional Treasury Plus Money Market Fund
Notes to Financial Statements — (continued)
December 31, 2015
| 3. | Related Party and Other Fees |
The Portfolio retained SSGA FM, a subsidiary of State Street Corporation and an affiliate of State Street Bank and Trust Company (“State Street”), as its investment adviser. The Portfolio has entered into an investment advisory agreement with the Adviser, under which the Adviser directs the investments of the Portfolio in accordance with its investment objectives, policies, and limitations. In compensation for the Adviser’s services as investment adviser, the Portfolio pays the Adviser a management fee at an annual rate of 0.05% of its average daily net assets.
The Adviser is contractually obligated until April 30, 2016 to waive its management fee and/or to reimburse the Fund for expenses to the extent that total annual fund operating expenses (exclusive of non-recurring account fees, extraordinary expenses, acquired fund fees and any class specific expenses such as Distribution, Shareholder Servicing, Administration, and Sub-Transfer Agency Fees, as measured on an annualized basis) exceed 0.07% of average daily net assets on an annual basis. The waiver and/or reimbursement may not be terminated during the relevant period except with approval of the Board. For the year ended December 31, 2015, SSGA FM reimbursed or waived $328,526.
Additionally, the Adviser may reimburse expenses or waive fees in order to avoid a negative yield. Any such waiver or reimbursement would be voluntary and may be revised or cancelled at any time without notice. For the year ended December 31, 2015, SSGA FM voluntarily waived $1,116,105.
Under the terms of the reimbursement agreement the Fund agrees to repay SSGA FM up to the amount of fees waived or expenses reduced under the agreement provided that a Fund is not obligated to reimburse SSGA FM (1) more than three years after the end of the fiscal year of the Fund in which SSGA FM provided a voluntary reduction; (2) in respect of any business day for which the net annualized one-day yield of such Fund is less than 0.00%; (3) to the extent that the amount of the reimbursement to SSGA FM on any day exceeds fifty percent of the yield (net of all expenses, exclusive of the reimbursement) of the Fund on that day; (4) to the extent that the amount of the reimbursement would cause the Fund’s net yield to fall below a certain minimum net yield; or (5) in respect of any such fee waivers and/or expense reimbursements that are necessary to maintain a limit on a Fund’s expenses per contractual fee waivers and/or reimbursements by SSGA FM which are effective at the time of such fee waivers and/or expense reimbursements. As of December 31, 2015, SSGA FM has not recouped any expenses from the Fund. Waived/reduced fees subject to potential recovery by year of expiration are as follows:
| Expiration Date | Amount | |||
12/31/2016 | $ | 1,004,830 | ||
12/31/2017 | 1,802,611 | |||
12/31/2018 | 1,116,105 | |||
Pursuant to the administration agreement, the Fund pays a fee at an annual rate of 0.05% of its net assets accrued daily to SSGA FM. The Fund pays State Street an annual fee for custody and accounting services. Pursuant to the sub-administration agreement, SSGA FM pays an annual fee to State Street for services provided to the Fund.
9
Table of Contents
State Street Institutional Investment Trust
State Street Institutional Treasury Plus Money Market Fund
Notes to Financial Statements — (continued)
December 31, 2015
The Fund’s Investment Class has adopted a plan of distribution pursuant to Rule 12b-1 under the 1940 Act (the “Rule 12b-1 Plan”). Under the Rule 12b-1 Plan, the Fund compensates financial intermediaries in connection with the distribution of Fund shares and for services provided to the Fund’s shareholders. The Fund’s Investment Class Shares may make payments under the Rule 12b-1 Plan at an annual rate up to 0.10% of eligible average daily net assets of the Investment Class Shares. State Street Global Markets LLC (“SSGM” or the “Distributor”), a subsidiary of State Street Corporation, is the Fund’s Distributor.
During the year ended December 31, 2015, the Fund was charged $55,116 but did not make any payments to SSGM under the Rule 12b-1 Plan, as SSGM voluntarily agreed to waive the entire amount of the Rule 12b-1 fees.
Wealth Management Services (“WMS”), a division of State Street, is among the financial intermediaries who may receive fees under the Rule 12b-1 Plan. During the year ended December 31, 2015, SSGM did not make any payments to WMS.
Under the Fund’s Shareholder Servicing Plan, the Fund compensates financial intermediaries for providing certain services to shareholders and for maintaining shareholder accounts. The Fund’s Investment Class Shares made payments under the Shareholder Servicing Plan at an annual rate up to 0.25% of the eligible average daily net assets of the Investment Class Shares. During the year ended December 31, 2015, the Fund paid SSGM $12,958 under the shareholder servicing agreement which SSGM subsequently paid to financial intermediaries.
During the year ended December 31, 2015, SSGM voluntarily agreed to waive shareholder services fees of $9,478.
WMS is among the financial intermediaries who may receive fees under the shareholder serving agreement. For the year ended December 31, 2015, WMS received payment of $3,481.
Boston Financial Data Services (“BFDS”), a joint venture of DST Systems, Inc. and State Street Corporation, serves as transfer agent and dividend paying agent to the Fund. For these services, the Fund pays annual account services fees, activity-based fees, and charges related to compliance and regulatory services.
| 4. | Trustees’ Fees |
Independent Trustees are compensated on a calendar year basis. Any Trustee who is deemed to be an “interested person” (as defined in the 1940 Act) of the Fund does not receive compensation from the Fund for his or her service as a Trustee.
Each Independent Trustee receives for his or her services to the State Street Master Funds, State Street Institutional Investment Trust and SSGA Funds, a $141,500 annual base retainer in addition to $18,000 for each in-person meeting and $2,000 for each telephonic meeting from the Trust. The Co-Chairmen each receive an additional $44,000 annual retainer. The Independent Trustees are reimbursed for travel and other out-of-pocket expenses in connection with meeting attendance. Trustees’ fees and expenses are allocated among the Trusts and funds overseen by the Trustees in a manner deemed equitable taking into consideration the relative net assets of the funds, subject to a $15,000 minimum per fund. As of the date of this Shareholder Report, the Trustees were not paid pension or retirement benefits as part of
10
Table of Contents
State Street Institutional Investment Trust
State Street Institutional Treasury Plus Money Market Fund
Notes to Financial Statements — (continued)
December 31, 2015
Trust’s expenses. However, the Trust has, pursuant to an exemptive order from the SEC, implemented an optional deferred compensation plan by which the Independent Trustees may defer receipt of compensation and receive a return on the deferred amount determined with reference to the performance of shares of specified State Street Institutional Investment Trust series. As of the fiscal year ended December 31, 2015, none of the Independent Trustees participated in the optional deferred compensation program.
The Trust’s officers are compensated by the Adviser and its affiliates.
| 5. | Rule Issuance |
On July 23, 2014, the U.S. Securities and Exchange Commission (the “SEC”) adopted amendments to the governing rules for money market funds. The amendments require that, following a two-year implementation timeframe, institutional prime and institutional tax exempt money market funds adopt a floating net asset value. The rule changes also allow for certain liquidity-based redemption fees and gate, and include enhanced requirements for disclosure and stress testing. The degree to which a money market fund will be impacted by the rule amendments will depend upon the type of fund and type of investors (retail or institutional). At this time, management is evaluating the implications of these amendments and their impact to the Fund’s financial statements and related disclosure.
| 6. | Subsequent Events |
Management has evaluated the impact of all subsequent events on the Fund through the date the financial statements were available to be issued and has determined that there were no subsequent events requiring adjustment or disclosure in the financial statements.
11
Table of Contents
Report of Independent Registered Public Accounting Firm
To the Board of Trustees and Shareholders of
State Street Institutional Investment Trust:
We have audited the accompanying statement of assets and liabilities of the State Street Institutional Treasury Plus Money Market Fund (one of the funds constituting State Street Institutional Investment Trust) (the “Fund”) as of December 31, 2015, and the related statement of operations for the year then ended, the statements of changes in net assets for each of the two years in the period then ended, and the financial highlights for each of the five years in the period then ended. These financial statements and financial highlights are the responsibility of the Fund’s management. Our responsibility is to express an opinion on these financial statements and financial highlights based on our audits.
We conducted our audits in accordance with the standards of the Public Company Accounting Oversight Board (United States). Those standards require that we plan and perform the audit to obtain reasonable assurance about whether the financial statements and financial highlights are free of material misstatement. We were not engaged to perform an audit of the Fund’s internal control over financial reporting. Our audits included consideration of internal control over financial reporting as a basis for designing audit procedures that are appropriate in the circumstances, but not for the purpose of expressing an opinion on the effectiveness of the Fund’s internal control over financial reporting. Accordingly, we express no such opinion. An audit also includes examining, on a test basis, evidence supporting the amounts and disclosures in the financial statements and financial highlights, assessing the accounting principles used and significant estimates made by management, and evaluating the overall financial statement presentation. We believe that our audits provide a reasonable basis for our opinion.
In our opinion, the financial statements and financial highlights referred to above present fairly, in all material respects, the financial position of State Street Institutional Treasury Plus Money Market Fund (one of the funds constituting State Street Institutional Investment Trust) at December 31, 2015, the results of its operations for the year then ended, the changes in its net assets for each of the two years in the period then ended, and the financial highlights for each of the five years in the period then ended, in conformity with U.S. generally accepted accounting principles.

Boston, Massachusetts
February 26, 2016
12
Table of Contents
State Street Institutional Treasury Plus Money Market Fund
December 31, 2015 (Unaudited)
SHAREHOLDER EXPENSE EXAMPLE
As a shareholder of a fund, you incur two types of costs: (1) transaction costs, and (2) ongoing costs, including administration fees; distribution (12b-1) and/or service fees; and other fund expenses. This example is intended to help you understand your ongoing costs (in dollars) of investing in the Fund and to compare these costs with the ongoing costs of investing in other mutual funds. It is based on an investment of $1,000 made at the beginning of the period shown and held for the entire period from July 1, 2015 to December 31, 2015.
The table below illustrates your Fund’s costs in two ways:
| • | Actual expenses. This section helps you to estimate the actual expenses that you paid over the period. The “Ending Account Value” shown is derived from the Fund’s actual return, and the third column shows the dollar amount that would have been paid by an investor who started with $1,000 in the Fund. You may use the information here, together with the amount you invested, to estimate the expenses that you paid over the period. To do so, simply divide your account value by $1,000 (for example, an $8,600 account value divided by $1,000 = 8.6), then multiply the result by the number given for the Fund under the heading “Expenses Paid During Period.” |
| • | Hypothetical example for comparison purposes. This section is intended to help you compare your Fund’s costs with those of other mutual funds. It assumes that the Fund had a yearly return of 5% before expenses, but that the expense ratio is unchanged. In this case, because the return used is not the Fund’s actual return, the results do not apply to your investment. The example is useful in making comparisons because the Securities and Exchange Commission requires all mutual funds to calculate expenses based on a 5% return. You can assess your Fund’s costs by comparing this hypothetical example with the hypothetical examples that appear in shareholder reports of other funds. |
Six Months Ended December 31, 2015
| Beginning Account Value July 1, 2015 | Ending Account Value December 31, 2015 | Expenses Paid During Period * | ||||||||||
Premier Class Shares | ||||||||||||
Based on Actual Fund Return | $ | 1,000.00 | $ | 1,000.00 | $ | 0.35 | ||||||
Based on Hypothetical (5% return before expenses) | $ | 1,000.00 | $ | 1,024.85 | $ | 0.36 | ||||||
Investment Class Shares | ||||||||||||
Based on Actual Fund Return | $ | 1,000.00 | $ | 1,000.00 | $ | 0.40 | ||||||
Based on Hypothetical (5% return before expenses) | $ | 1,000.00 | $ | 1,024.80 | $ | 0.41 | ||||||
| * | The calculations are based on expense incurred in the most recent six month period of the Fund. The annualized average weighted expense ratio as of December 31, 2015, which includes the Fund’s proportionate share of the expenses of the Portfolio, was 0.07% and 0.08% for the Premier Class and Investment Class, respectively. |
| The dollar amount shown as “Expenses Paid” is equal to the annualized average weighted expense ratio multiplied by the average account value over the period, multiplied by 184/365 (the most recent six month period). |
13
Table of Contents
State Street Institutional Treasury Plus Money Market Fund
Shareholder Requests for Additional Information
December 31, 2015 (Unaudited)
Proxy Voting Policies and Procedures and Record
The Fund has adopted the proxy voting policies of the Adviser. A description of the policies and procedures that the Fund has adopted to determine how to vote proxies relating to portfolio securities are contained in the Fund’s Statement of Additional Information, which is available (i) without charge, upon request, by calling the Funds at 1-877-521-4083, (ii) on the Fund’s website at www.SSGA.com/cash, (iii) on the U.S. Securities and Exchange Commission’s website at www.sec.gov, or (iv) at the U.S. Securities and Exchange Commission’s public reference room. Information regarding the Trust’s proxy voting policies and procedures, as well as information regarding how the Trust voted proxies, if any, during the most recent 12-month period ended June 30 is available without charge (1) by calling 1-877-521-4083 (toll free), or (2) on the website of the Securities and Exchange Commission (“SEC”) at www.sec.gov.
Quarterly Portfolio Schedule
The Fund will file its complete schedule of investments with the U.S. Securities and Exchange Commission for the first and third quarters of each fiscal year on Form N-Q. For the second and fourth quarters, the complete schedule of investments is available in the Fund’s semi-annual and annual financial statements. The Fund’s Form N-Q is available (i) without charge, upon request, by calling the Fund at 1-877-521-4083, (ii) on the Fund’s website at www.SSGA.com/cash, (iii) on the Securities and Exchange Commission’s website at www.sec.gov, or (iv) at the Securities and Exchange Commission’s public reference room. Information on the operation of the public reference room may be obtained by calling 1-800-SEC-0330.
Monthly Portfolio Schedule
The Fund files its monthly portfolio holdings with the U.S. Securities and Exchange Commission on Form N-MFP. The SEC delays the public availability of the information filed on Form N-MFP for 60 days after the end of the reporting period included in the filing. The Fund’s Form N-MFP is available (i) on the U.S. Securities and Exchange Commission’s website at www.sec.gov, or (ii) at the Securities and Exchange Commission’s public reference room.
14
Table of Contents
State Street Institutional Investment Trust
State Street Treasury Plus Money Market Fund
Disclosure of Information about Fund Trustees and Officers
December 31, 2015 (Unaudited)
Name, Address, and Year of Birth | Position(s) Held | Term of Office Time Served | Principal Occupation During Past Five Years and Relevant Experience | Number of Funds in Fund Complex Overseen by Trustee | Other Directorships Held by Trustee During Past Five Years | |||||
Independent Trustees | ||||||||||
Michael F. Holland State Street Bank and Trust Company 100 Huntington Avenue, CPH 0326 Boston, MA 02116 YOB: 1944 | Trustee and Co-Chairman of the Board | Term: Indefinite Elected: 7/99 | Chairman, Holland & Company L.L.C. (investment adviser) (1995 – present). | 75 | Director, the Holland Series Fund, Inc.; Director, The China Fund, Inc.; Director, The Taiwan Fund, Inc.; Director, Reaves Utility Income Fund, Inc.; and Director, Blackstone/GSO Loan Funds. | |||||
Patrick J. Riley State Street Bank and Trust Company 100 Huntington Avenue, CPH 0326 Boston, MA 02116 YOB: 1948 | Trustee and Co-Chairman of the Board | Term: Indefinite Elected:1/14 | 2002 to May 2010, Associate Justice of the Superior Court, Commonwealth of Massachusetts; 1985 to 2002, Partner, Riley, Burke & Donahue, L.L.P. (law firm); 1998 to Present, Independent Director, State Street Global Advisers Ireland, Ltd. (investment company); 1998 to Present, Independent Director, SSGA Liquidity plc (formerly, SSGA Cash Management Fund plc); January 2009 to Present, Independent Director, SSGA Fixed Income plc; and January 2009 to Present, Independent Director, SSGA Qualified Funds PLC. | 75 | Board Director and Chairman, SPDR Europe 1PLC Board (2011 – Present); Board Director and Chairman, SPDR Europe II, PLC (2013 – Present). | |||||
William L. Boyan State Street Bank and Trust Company 100 Huntington Avenue, CPH 0326 Boston, MA 02116 YOB: 1937 | Trustee and Co-Chairman of the Valuation Committee | Term: Indefinite Elected: 7/99 | President and Chief Operations Officer, John Hancock Financial Services (1959 – 1999). Mr. Boyan retired in 1999. Chairman Emeritus, Children’s Hospital, Boston, MA (1984 – 2011); Former Trustee of Old Mutual South Africa Master Trust (investments) (1995 – 2008); Former Chairman, Boston Plan For Excellence, Boston Public Schools (1995 – 2010); Member of Advisory Board of Florida Atlantic University Lifelong Learning Society. | 75 | Former Trustee of Old Mutual South Africa Master Trust. | |||||
15
Table of Contents
State Street Institutional Investment Trust
State Street Treasury Plus Money Market Fund
Disclosure of Information about Fund Trustees and Officers — (continued)
December 31, 2015 (Unaudited)
Name, Address, and Year of Birth | Position(s) Held | Term of Office Time Served | Principal Occupation During Past Five Years and Relevant Experience | Number of Funds in Fund Complex Overseen by Trustee | Other Directorships Held by Trustee During Past Five Years | |||||
Independent Trustees (continued) | ||||||||||
William L. Marshall State Street Bank and Trust Company 100 Huntington Avenue, CPH 0326 Boston, MA 02116 YOB: 1942 | Trustee and Co-Chairman of the Audit Committee | Term: Indefinite Elected: 1/14 | April 2011 to Present, Chairman (until April 2011, Chief Executive Officer and President), Wm. L. Marshall Associates, Inc., Wm. L. Marshall Companies, Inc. and the Marshall Financial Group, Inc. (a registered investment adviser and provider of financial and related consulting services); Certified Financial Planner; Member, Financial Planners Association; 2015 to present, Board Member, The Doylestown Health Foundation Board. | 75 | Marshall Financial Group, Inc. | |||||
Richard D. Shirk State Street Bank and Trust Company 100 Huntington Avenue, CPH 0326 Boston, MA 02116 YOB: 1945 | Trustee and Co-Chairman of the Qualified Legal and Compliance Committee | Term: Indefinite Elected: 1/14 | March 2001 to April 2002, Chairman (1996 to March 2001, President and Chief Executive Officer), Cerulean Companies, Inc. (holding company) (Retired); 1992 to March 2001, President and Chief Executive Officer, Blue Cross Blue Shield of Georgia (health insurer, managed healthcare); 1998 to December 2008, Chairman, Board Member and December 2008 to Present, Investment Committee Member, Healthcare Georgia Foundation (private foundation); September 2002 to 2012, Lead Director and Board Member, Amerigroup Corp. (managed health care); 1999 to 2013, Board Member and (since 2001) Investment Committee Member, Woodruff Arts Center; and 2003 to 2009, Trustee, Gettysburg College. | 75 | Board member, AeroCare Holdings (privately held healthcare services company) (February 2003 – Present); Board member, Regenesis Biomedical (health care services) (April 2012 – Present); Chairman (January 2014 – Present). | |||||
Rina K. Spence State Street Bank and Trust Company 100 Huntington Avenue, CPH 0326 Boston, MA 02116 YOB: 1948 | Trustee and Co-Chairman of the Qualified Legal and Compliance Committee and Co-Chairman of the Governance Committee | Term: Indefinite Elected: 7/99 | President of SpenceCare International LLC (international healthcare consulting) (1999 – present); Chief Executive Officer, IEmily.com (health internet company) (2000 – 2001); Chief Executive Officer of Consensus Pharmaceutical, Inc. (1998 – 1999); Founder, President and Chief Executive Officer of Spence Center for Women’s Health (1994 – 1998); President and CEO Emerson Hospital (1984 – 1994); Trustee, Eastern Enterprise (utilities) (1988 – 2000); Director, Berkshire Life Insurance Company of America (1993 – 2009); Honorary Consul for Monaco in Boston (2015 – present). | 75 | ||||||
16
Table of Contents
State Street Institutional Investment Trust
State Street Treasury Plus Money Market Fund
Disclosure of Information about Fund Trustees and Officers — (continued)
December 31, 2015 (Unaudited)
Name, Address, and Year of Birth | Position(s) Held | Term of Office Time Served | Principal Occupation During Past Five Years and Relevant Experience | Number of Funds in Fund Complex Overseen by Trustee | Other Directorships Held by Trustee During Past Five Years | |||||
Independent Trustees (continued) | ||||||||||
Bruce D. Taber State Street Bank and Trust Company 100 Huntington Avenue, CPH 0326 Boston, MA 02116 YOB: 1943 | Trustee and Co-Chairman of the Valuation Committee and Co-Chairman of the Governance Committee | Term: Indefinite Elected: 1/14 | 1999 to Present, Partner, Zenergy LLC (a technology company providing Computer Modeling and System Analysis to the General Electric Power Generation Division); Until December 2008, Independent Director, SSGA Cash Management Fund plc; Until December 2008, Independent Director, State Street Global Advisers Ireland, Ltd. (investment companies); and Until August 1994, President, Alonzo B. Reed, Inc., (a Boston architect-engineering firm). | 75 | ||||||
Douglas T. Williams State Street Bank and Trust Company 100 Huntington Avenue, CPH 0326 Boston, MA 02116 YOB: 1940 | Trustee and Co-Chairman of the Audit Committee | Term: Indefinite Elected: 7/99 | President, Oakmont Homeowners Association; President, Mariner Sands Chapel; Executive Vice President and member of Executive Committee, Chase Manhattan Bank (1987 – 1999); President, Boston Stock Exchange Depository Trust Company, 1981 – 1982; Treasurer, Nantucket Educational Trust, (2002 – 2007). | 75 | ||||||
Interested Trustee(1) | ||||||||||
James E. Ross SSGA Funds Management, Inc. State Street Financial Center One Lincoln Street Boston, MA 02111 YOB: 1965 | Trustee | Term: Indefinite Elected Trustee: 2/07 | Chairman and Director, SSGA Funds Management, Inc. (2012 – present); President, SSGA Funds Management, Inc. (2005 – 2012); Executive Vice President and Senior Managing Director, State Street Global Advisors (2006 – present); and Principal, State Street Global Advisors (2006 – present). | 290 | Trustee, SPDR Series Trust; Trustee, SPDR Index Shares Funds; Trustee, Select Sector SPDR Trust; Trustee, SSGA Active Trust; and Trustee, SSGA Master Trust. | |||||
| (1) | Mr. Ross is an Interested Trustee because of his employment by SSGA Funds Management, Inc., an affiliate of the Trust. |
Name, Address, and Year of Birth | Position(s) Held With Trust | Term of Office and Length of Time Served | Principal Occupation During Past Five Years | |||
Officers: | ||||||
Ellen M. Needham SSGA Funds Management, Inc. State Street Financial Center One Lincoln Street Boston, MA 02111 YOB: 1967 | President | Term: Indefinite Elected: 10/12 | President and Director, SSGA Funds Management, Inc. (June 2012 – present); Chief Operating Officer, SSGA Funds Management, Inc. (May 2010 – June 2012); Senior Managing Director, SSGA Funds Management, Inc. (1992 – 2012) and Senior Managing Director, State Street Global Advisors (1992 – present).* |
17
Table of Contents
State Street Institutional Investment Trust
State Street Treasury Plus Money Market Fund
Disclosure of Information about Fund Trustees and Officers — (continued)
December 31, 2015 (Unaudited)
Name, Address, and Year of Birth | Position(s) Held With Trust | Term of Office and Length of Time Served | Principal Occupation During Past Five Years | |||
Officers: (continued) | ||||||
Bruce S. Rosenberg SSGA Funds Management, Inc. State Street Financial Center One Lincoln Street Boston, MA 02111 YOB: 1961 | Treasurer | Term: Indefinite Elected: 2/16 | Managing Director, State Street Global Advisors and SSGA Funds Management, Inc. (July 2015 – present); Director, Credit Suisse (April 2008 – July 2015). | |||
Ann M. Carpenter SSGA Funds Management, Inc. State Street Financial Center One Lincoln Street Boston, MA 02111 YOB: 1966 | Vice President Deputy Treasurer | Term: Indefinite Elected: 10/12 Term: Indefinite Elected: 2/16 | Chief Operating Officer, SSGA Funds Management, Inc. (April 2014 – present); Vice President, State Street Global Advisors and SSGA Funds Management, Inc. (2005 – present).* | |||
Chad C. Hallett SSGA Funds Management, Inc. State Street Financial Center One Lincoln Street Boston, MA 02111 YOB: 1969 | Deputy Treasurer | Term: Indefinite Elected: 2/16 | Vice President, State Street Global Advisors and SSGA Funds Management, Inc. (November 2014 – present); Vice President, State Street Bank and Trust Company (2001 – November 2014).* | |||
Sujata Upreti SSGA Funds Management, Inc. State Street Financial Center One Lincoln Street Boston, MA 02111 YOB: 1974 | Assistant Treasurer | Term: Indefinite Elected: 2/16 | Vice President, State Street Global Advisors and SSGA Funds Management, Inc. (May 2015 – present); Assistant Director, Cambridge Associates, LLC (July 2014 – January 2015); Vice President, Bank of New York Mellon (July 2012 – August 2013); Manager, PricewaterhouseCoopers, LLP (September 2009 – July 2012). | |||
Daniel Foley SSGA Funds Management, Inc. State Street Financial Center One Lincoln Street Boston, MA 02111 YOB: 1972 | Assistant Treasurer | Term: Indefinite Elected: 2/16 | Vice President, State Street Global Advisors and SSGA Funds Management, Inc. (April 2014 – present); Principal, State Street Global Advisors and SSGA Funds Management, Inc. (April 2007 – April 2014). | |||
Brian Harris SSGA Funds Management, Inc. State Street Financial Center One Lincoln Street Boston, MA 02111 YOB: 1973 | Chief Compliance Officer | Term: Indefinite Elected: 11/13 | Vice President, State Street Global Advisors and SSGA Funds Management, Inc.( June 2013 – Present); Senior Vice President and Global Head of Investment Compliance, BofA Global Capital Management (September 2010 to May 2013); Director of Compliance, AARP Financial Inc. (July 2008 to August 2010). | |||
Trevor Swanberg SSGA Funds Management, Inc. State Street Financial Center One Lincoln Street Boston, MA 02111 YOB: 1979 | Code of Ethics Compliance Officer | Term: Indefinite Elected:8/15 | Vice President, State Street Global Advisors and SSGA Funds Management, Inc. (January 2015 – Present); Senior Manager – Mutual Fund Compliance, ICMA-Retirement Corporation (December 2011 – January 2015); Assistant Vice President, J.P. Morgan (September 2007 – December 2011). | |||
Joshua A. Weinberg SSGA Funds Management, Inc. State Street Financial Center One Lincoln Street Boston, MA 02111 YOB: 1978 | Chief Legal Officer | Term: Indefinite Elected: 2/15 | Vice President and Managing Counsel, State Street Global Advisors (2011 – present); Clerk, SSGA Funds Management, Inc. (2013 – present); Associate, Financial Services Group, Dechert LLP (2006 – 2011). |
18
Table of Contents
State Street Institutional Investment Trust
State Street Treasury Plus Money Market Fund
Disclosure of Information about Fund Trustees and Officers — (continued)
December 31, 2015 (Unaudited)
Name, Address, and Year of Birth | Position(s) Held With Trust | Term of Office and Length of Time Served | Principal Occupation During Past Five Years | |||
Officers: (continued) | ||||||
David K. James State Street Bank and Trust Company 100 Huntington Avenue, 3rd Floor Boston, MA 02116 YOB: 1970 | Secretary | Term: Indefinite Elected: 4/13 | Managing Director and Managing Counsel, State Street Bank and Trust Company (2009 – present); Vice President and Counsel, PNC Global Investment Servicing (US), Inc. (2006 – 2009). | |||
Kristin Schantz State Street Bank and Trust Company 100 Huntington Avenue, 3rd Floor Boston, MA 02116 YOB: 1979 | Assistant Secretary | Term: Indefinite Elected: 2/14 | Vice President and Counsel, State Street Bank and Trust Company (2013 – present); Vice President, Citi Fund Services Ohio, Inc. (2008 – 2013). |
| * | Served in various capacities and/or with various affiliated entities during noted time period. |
19
Table of Contents
Trustees
William L. Boyan
Michael F. Holland
William L. Marshall
Patrick J. Riley
James E. Ross
Richard D. Shirk
Rina K. Spence
Bruce D. Taber
Douglas T. Williams
Investment Adviser and Administrator
SSGA Funds Management, Inc.
State Street Financial Center
One Lincoln Street
Boston, MA 02111
Custodian and Sub-Administrator
State Street Bank and Trust Company
State Street Financial Center
One Lincoln Street
Boston, MA 02111
Independent Registered Public Accounting Firm
Ernst & Young LLP
200 Clarendon Street
Boston, MA 02116
Legal Counsel
Ropes & Gray LLP
800 Boylston Street
Boston, MA 02199
Transfer Agent
Boston Financial Data Services
2000 Crown Colony Drive
Quincy, MA 02169
Distributor
State Street Global Markets LLC
State Street Financial Center
One Lincoln Street
Boston, MA 02111
This report is for shareholder information. This is not a prospectus intended for use in the purchase or sale of shares of beneficial interest.
State Street Institutional Investment Trust
State Street Bank and Trust Company
P.O. Box 5049
Boston, MA 02206
Table of Contents
[THIS PAGE INTENTIONALLY LEFT BLANK]
Table of Contents
[THIS PAGE INTENTIONALLY LEFT BLANK]
Table of Contents
Annual Report
31 December 2015
State Street Master Funds
State Street Treasury Plus Money Market Portfolio
Table of Contents
State Street Master Funds
State Street Treasury Plus Money Market Portfolio
Annual Report
December 31, 2015
| 25 | ||||
| 26 | ||||
| 29 | ||||
| 30 | ||||
| 31 | ||||
| 32 | ||||
| 33 | ||||
| 38 | ||||
| 39 | ||||
| 40 | ||||
Disclosure of Information about Portfolio Trustees and Officers | 41 | |||
Table of Contents
State Street Master Funds
State Street Treasury Plus Money Market Portfolio
Portfolio Statistics (Unaudited)
Portfolio Composition* | December 31, 2015 | |||
Treasury Debt | 70.7 | % | ||
Treasury Repurchase Agreements | 25.1 | |||
Other Assets in Excess of Liabilities | 4.2 | |||
Total | 100.0 | % |
Maturity Ladder* | December 31, 2015 | |||
Overnight (1 Day) | 25.1 | % | ||
2-30 Days | 39.6 | |||
31-60 Days | 13.5 | |||
61-90 Days | 7.7 | |||
Over 90 Days | 9.9 | |||
Total | 95.8 | % | ||
Average days to maturity | 19 | |||
Weighted average life | 57 |
| * | As a percentage of net assets as of the date indicated. The Portfolio’s composition will vary over time. |
See accompanying notes to financial statements.
25
Table of Contents
State Street Master Funds
State Street Treasury Plus Money Market Portfolio
December 31, 2015
Name of Issuer | Interest Rate | Next Rate Reset Date | Maturity Date | Principal Amount | Market Value | |||||||||||||||
| TREASURY DEBT – 70.7% | ||||||||||||||||||||
U.S. Treasury Bill(a) | 0.003 | % | 01/07/2016 | 01/07/2016 | $ | 60,300,000 | $ | 60,299,985 | ||||||||||||
U.S. Treasury Bill(a) | 0.050 | % | 01/07/2016 | 01/07/2016 | 21,000,000 | 20,999,825 | ||||||||||||||
U.S. Treasury Bill(a) | 0.055 | % | 01/07/2016 | 01/07/2016 | 11,000,000 | 10,999,899 | ||||||||||||||
U.S. Treasury Bill(a) | 0.060 | % | 01/07/2016 | 01/07/2016 | 31,000,000 | 30,999,690 | ||||||||||||||
U.S. Treasury Bill(a) | 0.061 | % | 01/07/2016 | 01/07/2016 | 9,000,000 | 8,999,909 | ||||||||||||||
U.S. Treasury Bill(a) | 0.235 | % | 01/07/2016 | 01/07/2016 | 125,000,000 | 124,995,104 | ||||||||||||||
U.S. Treasury Bill(a) | 0.000 | % | 01/14/2016 | 01/14/2016 | 32,000,000 | 32,000,000 | ||||||||||||||
U.S. Treasury Bill(a) | 0.001 | % | 01/14/2016 | 01/14/2016 | 8,000,000 | 7,999,997 | ||||||||||||||
U.S. Treasury Bill(a) | 0.020 | % | 01/14/2016 | 01/14/2016 | 20,000,000 | 19,999,856 | ||||||||||||||
U.S. Treasury Bill(a) | 0.065 | % | 01/14/2016 | 01/14/2016 | 7,000,000 | 6,999,836 | ||||||||||||||
U.S. Treasury Bill(a) | 0.070 | % | 01/14/2016 | 01/14/2016 | 41,000,000 | 40,998,964 | ||||||||||||||
U.S. Treasury Bill(a) | 0.072 | % | 01/14/2016 | 01/14/2016 | 7,000,000 | 6,999,817 | ||||||||||||||
U.S. Treasury Bill(a) | 0.075 | % | 01/14/2016 | 01/14/2016 | 20,000,000 | 19,999,458 | ||||||||||||||
U.S. Treasury Bill(a) | 0.205 | % | 01/14/2016 | 01/14/2016 | 25,000,000 | 24,998,149 | ||||||||||||||
U.S. Treasury Bill(a) | 0.010 | % | 01/21/2016 | 01/21/2016 | 10,000,000 | 9,999,944 | ||||||||||||||
U.S. Treasury Bill(a) | 0.015 | % | 01/21/2016 | 01/21/2016 | 50,000,000 | 49,999,583 | ||||||||||||||
U.S. Treasury Bill(a) | 0.195 | % | 01/21/2016 | 01/21/2016 | 67,000,000 | 66,992,742 | ||||||||||||||
U.S. Treasury Bill(a) | 0.020 | % | 01/28/2016 | 01/28/2016 | 50,000,000 | 49,999,250 | ||||||||||||||
U.S. Treasury Bill(a) | 0.170 | % | 01/28/2016 | 01/28/2016 | 75,000,000 | 74,990,437 | ||||||||||||||
U.S. Treasury Bill(a) | 0.115 | % | 02/04/2016 | 02/04/2016 | 26,100,000 | 26,097,165 | ||||||||||||||
U.S. Treasury Bill(a) | 0.117 | % | 02/04/2016 | 02/04/2016 | 3,900,000 | 3,899,567 | ||||||||||||||
U.S. Treasury Bill(a) | 0.135 | % | 02/11/2016 | 02/11/2016 | 20,000,000 | 19,996,925 | ||||||||||||||
U.S. Treasury Bill(a) | 0.145 | % | 02/18/2016 | 02/18/2016 | 25,000,000 | 24,995,167 | ||||||||||||||
U.S. Treasury Bill(a) | 0.140 | % | 02/25/2016 | 02/25/2016 | 24,000,000 | 23,994,867 | ||||||||||||||
U.S. Treasury Bill(a) | 0.215 | % | 03/03/2016 | 03/03/2016 | 30,000,000 | 29,988,892 | ||||||||||||||
U.S. Treasury Bill(a) | 0.268 | % | 03/10/2016 | 03/10/2016 | 12,000,000 | 11,993,848 | ||||||||||||||
U.S. Treasury Bill(a) | 0.280 | % | 03/10/2016 | 03/10/2016 | 18,000,000 | 17,990,340 | ||||||||||||||
U.S. Treasury Bill(a) | 0.280 | % | 03/17/2016 | 03/17/2016 | 50,000,000 | 49,970,444 | ||||||||||||||
U.S. Treasury Bill(a) | 0.245 | % | 03/24/2016 | 03/24/2016 | 11,000,000 | 10,993,787 | ||||||||||||||
U.S. Treasury Bill(a) | 0.250 | % | 03/24/2016 | 03/24/2016 | 14,000,000 | 13,991,931 | ||||||||||||||
U.S. Treasury Bill(a) | 0.250 | % | 03/31/2016 | 03/31/2016 | 5,000,000 | 4,996,875 | ||||||||||||||
U.S. Treasury Bill(a) | 0.260 | % | 03/31/2016 | 03/31/2016 | 10,000,000 | 9,993,500 | ||||||||||||||
U.S. Treasury Note(a) | 0.026 | % | 01/15/2016 | 01/15/2016 | 20,000,000 | 20,002,658 | ||||||||||||||
U.S. Treasury Note(b) | 0.305 | % | 01/01/2016 | 01/31/2016 | 87,000,000 | 86,999,358 | ||||||||||||||
U.S. Treasury Note(a) | 0.303 | % | 02/29/2016 | 02/29/2016 | 50,000,000 | 49,995,663 | ||||||||||||||
U.S. Treasury Note(b) | 0.329 | % | 01/01/2016 | 04/30/2016 | 34,500,000 | 34,501,221 | ||||||||||||||
U.S. Treasury Note(b) | 0.330 | % | 01/01/2016 | 07/31/2016 | 10,000,000 | 10,000,735 | ||||||||||||||
U.S. Treasury Note(b) | 0.313 | % | 01/01/2016 | 10/31/2016 | 25,000,000 | 24,994,855 | ||||||||||||||
U.S. Treasury Note(b) | 0.344 | % | 01/01/2016 | 01/31/2017 | 6,000,000 | 5,999,604 | ||||||||||||||
U.S. Treasury Note(b) | 0.320 | % | 01/01/2016 | 04/30/2017 | 4,000,000 | 4,000,014 | ||||||||||||||
U.S. Treasury Note(b) | 0.334 | % | 01/01/2016 | 04/30/2017 | 11,430,000 | 11,430,040 | ||||||||||||||
See accompanying notes to the financial statements.
26
Table of Contents
State Street Master Funds
State Street Treasury Plus Money Market Portfolio
Schedule of Investments — (continued)
December 31, 2015
Name of Issuer | Interest Rate | Next Rate Reset Date | Maturity Date | Principal Amount | Market Value | |||||||||||||||
| TREASURY DEBT – (continued) | ||||||||||||||||||||
U.S. Treasury Note(b) | 0.337 | % | 01/01/2016 | 07/31/2017 | $ | 42,000,000 | $ | 41,980,285 | ||||||||||||
U.S. Treasury Note(b) | 0.428 | % | 01/01/2016 | 10/31/2017 | 25,000,000 | 24,948,078 | ||||||||||||||
|
| |||||||||||||||||||
TOTAL TREASURY DEBT |
| 1,233,028,264 | ||||||||||||||||||
|
| |||||||||||||||||||
| TREASURY REPURCHASE AGREEMENTS – 25.1% | ||||||||||||||||||||
Agreement with Bank of America and Bank of New York Mellon (Tri-Party), dated 12/31/2015 (collateralized by a U.S. Treasury Note, 1.375% due 02/29/2020, valued at $10,200,037); expected proceeds $10,000,326 | 0.290 | % | 01/04/2016 | 01/04/2016 | 10,000,000 | 10,000,000 | ||||||||||||||
Agreement with BNP Paribas Securities Corp. and Bank of New York Mellon (Tri-Party), dated 12/31/2015 (collateralized by U.S. Treasury Bills, 0.000% –1.000% due 01/21/2016 – 12/31/2017, U.S. Treasury Bonds, 0.125% –4.500% due 04/15/2016 – 02/15/2036, a U.S. Treasury Inflation Index Bond, 2.125% due 02/15/2040, U.S. Treasury Notes, 2.500% –6.875% due 08/15/2023 – 11/15/2028, and U.S. Treasury Strips, 0.000% due 11/15/2016 – 11/15/2021, valued at $56,100,000); expected proceeds $55,001,772 | 0.290 | % | 01/04/2016 | 01/04/2016 | 55,000,000 | 55,000,000 | ||||||||||||||
Agreement with Citigroup Global Markets, Inc. and Bank of New York Mellon (Tri-Party), dated 12/31/2015 (collateralized by a U.S. Treasury Note, 2.000% due 09/30/2020, valued at $21,420,044); expected proceeds $21,000,747 | 0.320 | % | 01/04/2016 | 01/04/2016 | 21,000,000 | 21,000,000 | ||||||||||||||
Agreement with Credit Agricole Corporate and Investment Bank and Bank of New York Mellon (Tri-Party), dated 12/31/2015 (collateralized by a U.S. Treasury Bill, 0.000% due 01/07/2016, and U.S. Treasury Bonds, 0.125% due 04/15/2016 – 04/15/2020, valued at $113,220,056); expected proceeds $111,004,070 | 0.330 | % | 01/04/2016 | 01/04/2016 | 111,000,000 | 111,000,000 | ||||||||||||||
Agreement with Societe Generale and Bank of New York Mellon (Tri-Party), dated 12/31/2015 (collateralized by a U.S. Treasury Bond, 1.250% due 10/31/2018, a U.S. Treasury Note, 0.375% due 07/15/2023, and U.S. Treasury Strips, 0.000% due 05/15/2018 – 05/15/2023, valued at $71,400,090); expected proceeds $70,002,489 | 0.320 | % | 01/04/2016 | 01/04/2016 | 70,000,000 | 70,000,000 | ||||||||||||||
See accompanying notes to the financial statements.
27
Table of Contents
State Street Master Funds
State Street Treasury Plus Money Market Portfolio
Schedule of Investments — (continued)
December 31, 2015
Name of Issuer | Interest Rate | Next Rate Reset Date | Maturity Date | Principal Amount | Market Value | |||||||||||||||
| TREASURY REPURCHASE AGREEMENTS – (continued) | ||||||||||||||||||||
Agreement with TD Securities (USA) LLC and Bank of New York Mellon (Tri-Party), dated 12/31/2015 (collateralized by a U.S. Treasury Bond, 6.250% due 05/15/2030, and U.S. Treasury Notes, 0.500% –2.000% due 11/30/2016 – 02/28/2021, valued at $175,373,892); expected proceeds $171,935,113 | 0.320 | % | 01/04/2016 | 01/04/2016 | $ | 171,929,000 | $ | 171,929,000 | ||||||||||||
|
| |||||||||||||||||||
TOTAL TREASURY REPURCHASE AGREEMENTS |
| 438,929,000 | ||||||||||||||||||
|
| |||||||||||||||||||
TOTAL INVESTMENTS(c)(d) – 95.8% |
| 1,671,957,264 | ||||||||||||||||||
OTHER ASSETS IN EXCESS OF LIABILITIES – 4.2% |
| 72,856,538 | ||||||||||||||||||
|
| |||||||||||||||||||
NET ASSETS – 100.0% |
| $ | 1,744,813,802 | |||||||||||||||||
|
| |||||||||||||||||||
| (a) | Rate represents annualized yield at date of purchase. |
| (b) | Variable Rate Security – Interest rate shown is rate in effect at December 31, 2015. |
| (c) | Unless otherwise indicated, the values of the securities of the Portfolio are determined based on Level 2 inputs established by provisions surrounding fair value measurements and disclosures. (Note 2) |
| (d) | Also represents the cost for federal tax purposes. |
See accompanying notes to the financial statements.
28
Table of Contents
State Street Master Funds
State Street Treasury Plus Money Market Portfolio
Statement of Assets and Liabilities
December 31, 2015
Assets | ||||
Investments at value and amortized cost (Note 2) | $ | 1,233,028,264 | ||
Repurchase Agreements, at value and cost (Note 2) | 438,929,000 | |||
|
| |||
Total Investments | 1,671,957,264 | |||
Cash | 72,833,570 | |||
Interest receivable | 190,562 | |||
Prepaid expenses and other assets | 3,896 | |||
|
| |||
Total assets | 1,744,985,292 | |||
Liabilities |
| |||
Management fee payable (Note 3) | 79,110 | |||
Professional fees payable | 39,795 | |||
Administration and custody fees payable (Note 3) | 38,274 | |||
Accrued expenses and other liabilities | 14,311 | |||
|
| |||
Total liabilities | 171,490 | |||
|
| |||
Net Assets | $ | 1,744,813,802 | ||
|
| |||
See accompanying notes to financial statements.
29
Table of Contents
State Street Master Funds
State Street Treasury Plus Money Market Portfolio
Year Ended December 31, 2015
Investment Income |
| |||
Interest | $ | 1,081,476 | ||
|
| |||
Expenses |
| |||
Management fees (Note 3) | 896,030 | |||
Administration and custody fees (Note 3) | 227,950 | |||
Professional fees | 81,390 | |||
Trustees’ fees (Note 4) | 33,999 | |||
Printing fees | 7,097 | |||
Other expenses | 83,087 | |||
|
| |||
Total expenses | 1,329,553 | |||
|
| |||
Net Investment Loss | $ | (248,077 | ) | |
|
| |||
Realized Gain (Loss) |
| |||
Net realized gain on investments | 695 | |||
|
| |||
Net Decrease in Net Assets Resulting from Operations | $ | (247,382 | ) | |
|
| |||
See accompanying notes to financial statements.
30
Table of Contents
State Street Master Funds
State Street Treasury Plus Money Market Portfolio
Statements of Changes in Net Assets
| Year Ended December 31, 2015 | Year Ended December 31, 2014 | |||||||
Increase (Decrease) in Net Assets From Operations: |
| |||||||
Net investment gain (loss) | $ | (248,077 | ) | $ | (507,397 | ) | ||
Net realized gain on investments | 695 | – | ||||||
|
|
|
| |||||
Net decrease in net assets from operations | (247,382 | ) | (507,397 | ) | ||||
|
|
|
| |||||
Capital Transactions: |
| |||||||
Contributions | 8,379,100,091 | 12,046,302,272 | ||||||
Withdrawals | (9,399,568,878 | ) | (12,033,281,777 | ) | ||||
|
|
|
| |||||
Net increase (decrease) in net assets from capital transactions | (1,020,468,787 | ) | 13,020,495 | |||||
|
|
|
| |||||
Net Increase (Decrease) in Net Assets | (1,020,716,169 | ) | 12,513,098 | |||||
Net Assets |
| |||||||
Beginning of year | 2,765,529,971 | 2,753,016,873 | ||||||
|
|
|
| |||||
End of year | $ | 1,744,813,802 | $ | 2,765,529,971 | ||||
|
|
|
| |||||
See accompanying notes to financial statements.
31
Table of Contents
State Street Master Funds
State Street Treasury Plus Money Market Portfolio
| Total Return(a) | Ratios to Average Net Assets | Net Assets End of Year (000s Omitted) | ||||||||||||||||||
Year Ended December 31, | Gross Operating Expenses | Net Operating Expenses | Net Investment Income | |||||||||||||||||
2015 | (0.01 | )% | 0.07 | % | 0.07 | % | (0.01 | )% | $ | 1,744,814 | ||||||||||
2014 | (0.02 | )% | 0.07 | % | 0.07 | % | (0.02 | )% | $ | 2,765,530 | ||||||||||
2013 | 0.00 | %(b) | 0.07 | % | 0.07 | % | 0.00 | %(b) | $ | 2,753,017 | ||||||||||
2012 | 0.06 | % | 0.08 | % | 0.08 | % | 0.06 | % | $ | 2,298,541 | ||||||||||
2011 | 0.00 | %(b) | 0.08 | % | 0.08 | % | (0.01 | )%(c) | $ | 1,361,158 | ||||||||||
| (a) | Results represent past performance and are not indicative of future results. |
| (b) | Amount is less than 0.005%. |
| (c) | Results reflect the effect of expense waivers. Without these waivers, net investment income would have been lower. |
See accompanying notes to financial statements.
32
Table of Contents
State Street Master Funds
State Street Treasury Plus Money Market Portfolio
December 31, 2015
| 1. | Organization |
The State Street Master Funds (the “Trust”) is registered under the Investment Company Act of 1940, as amended (the “1940 Act”), as an open-end management investment company, and was organized as a business trust under the laws of the Commonwealth of Massachusetts on July 27, 1999. The Trust comprises five investment portfolios: State Street Equity 500 Index Portfolio, State Street Money Market Portfolio, State Street U.S. Government Money Market Portfolio, State Street Treasury Money Market Portfolio and State Street Treasury Plus Money Market Portfolio. Information presented in these financial statements pertains only to State Street Treasury Plus Money Market Portfolio (the “Portfolio”). The Portfolio commenced operations on October 24, 2007.
The Portfolio is authorized to issue an unlimited number of non-transferable beneficial interests.
The Portfolio’s investment objective is to seek a high level of current income consistent with preserving principal and liquidity and the maintenance of a stable $1.00 per share net asset value.
Under the Trust’s organizational documents, its officers and trustees are indemnified against certain liabilities arising out of the performance of their duties to the Trust. Additionally, in the normal course of business, the Trust enters into contracts with service providers that contain general indemnification clauses. The Trust’s maximum exposure under these arrangements is unknown as this could involve future claims that may be made against the Trust that have not yet occurred.
| 2. | Summary of Significant Accounting Policies |
The following is a summary of significant accounting policies followed by the Trust in the preparation of its financial statements:
The preparation of financial statements in accordance with U.S. generally accepted accounting principles (“U.S. GAAP”) requires management to make estimates and assumptions that affect the reported amounts and disclosures in the financial statements. Actual results could differ from those estimates. The Portfolio is an investment company under U.S. GAAP and follows the accounting and reporting guidance applicable to investment companies in Financial Accounting Standards Board (“FASB”) Accounting Standards Codification (“ASC”) 946, Financial Services Investment Companies (“ASC 946”).
Security valuation – The Portfolio’s securities are recorded on the basis of amortized cost which approximates fair value as permitted by Rule 2a-7 under the 1940 Act. This method values a security at its cost on the date of purchase and, thereafter, assumes a constant amortization to maturity of any premiums or accretion of any discounts. The Portfolio may value securities for which market quotations are not readily available at “fair value,” as determined in good faith pursuant to procedures established by the Board of Trustees of the Trust (the “Board”). The Board has adopted procedures concerning securities valuation, under which an Oversight Committee (the “Committee”) makes determinations as to whether market quotations are not readily available or do not otherwise accurately reflect the fair value of the security. The Committee, or a subgroup thereof, subject to oversight by the Board, may use fair value pricing in a variety of circumstances, including but not limited to, situations when trading in a security has been suspended or halted. If amortized cost is determined not to approximate fair value, the value of the portfolio securities will be determined under procedures established by and under the
33
Table of Contents
State Street Master Funds
State Street Treasury Plus Money Market Portfolio
Notes to Financial Statements — (continued)
December 31, 2015
general supervision of the Committee. The Committee will assist in overseeing the comparison of amortized cost to market-based value. Fair value pricing involves subjective judgments and it is possible that the fair value determination for a security is materially different than the value that could be received on the sale of the security.
Because of the inherent uncertainties of valuation and under certain market conditions, the values reflected in the financial statements may differ from the value received upon actual sale of those investments and it is possible that the differences could be material.
The Portfolio values its assets and liabilities at fair value using a hierarchy that prioritizes the inputs to valuation techniques giving the highest priority to readily available unadjusted quoted prices in active markets for identical assets or liabilities (Level 1 measurements) and the lowest priority to unobservable inputs (Level 3 measurements) when market prices are not readily available or reliable. The categorization of a value determined for an investment within the hierarchy is based upon the pricing transparency of the investment and is not necessarily an indication of the risk associated with investing in it.
The three levels of the fair value hierarchy are as follows:
| • | Level 1 – Unadjusted quoted prices in active markets for identical assets or liabilities; |
| • | Level 2 – Inputs other than quoted prices included within Level 1 that are observable for the asset or liability either directly or indirectly, including quoted prices for similar assets or liabilities in active markets, quoted prices for identical or similar assets or liabilities in markets that are not considered to be active, inputs other than quoted prices that are observable for the asset or liability (such as exchange rates, financing terms, interest rates, yield curves, volatilities, prepayment speeds, loss severities, credit risks and default rates) or other market-corroborated inputs; and |
| • | Level 3 – Unobservable inputs for the asset or liability, including the Committee’s assumptions used in determining the fair value of investments. |
Changes in valuation techniques may result in transfers in or out of an assigned level within the fair value hierarchy. Transfers between different levels of the fair value hierarchy are recognized at the end of the reporting period. The Portfolio had no transfers between levels for the year ended December 31, 2015. Unless otherwise indicated on the Schedule of Investments, the values of the securities of the Portfolio are determined based on Level 2 inputs.
Investment transactions and income recognition – Investment transactions are accounted for on trade date for financial reporting purposes. Interest income is recorded daily on an accrual basis and includes amortization of premium and accretion of discount on investments. Realized gains and losses from the sale or disposition of investments are determined using the identified cost method.
Expenses – Advisory fees and other expenses, which are directly identifiable to a specific portfolio, are applied to that portfolio within the Trust. Trustees’ fees and other expenses which cannot be attributed to a specific portfolio are allocated in such a manner as deemed equitable, taking into consideration the nature and type of expense and the relative net assets of the portfolios within the Trust.
34
Table of Contents
State Street Master Funds
State Street Treasury Plus Money Market Portfolio
Notes to Financial Statements — (continued)
December 31, 2015
Repurchase agreements – The Portfolio may enter into repurchase agreements under the terms of a master repurchase agreement. A repurchase agreement customarily obligates the seller at the time it sells securities to the Portfolio to repurchase the securities at a mutually agreed upon price and time. The total amount received by the Portfolio on repurchase is calculated to exceed the price paid by the Portfolio, reflecting an agreed-upon market rate of interest for the period of time to the settlement date, and is not necessarily related to the interest rate on the underlying securities. The underlying securities are ordinarily United States Government or Government Agency securities, but may consist of other securities. The value of the underlying securities, at the time of purchase and each subsequent business day, is required to be maintained at such a level that the value is equal to at least the principal amount of the repurchase price plus accrued interest. The use of repurchase agreements involves certain risks. Upon an event of default under the Master Repurchase Agreement, if the seller of securities under a repurchase agreement defaults on its obligation to repurchase the underlying securities (as a result of its bankruptcy or otherwise) the Portfolio will seek to dispose of such securities; this action could involve losses, costs or delays. In addition, the proceeds of any such disposition may be less than the amount the Portfolio is owed under the repurchase agreement. The Portfolio may enter into repurchase agreements maturing within a specified date with domestic dealers, banks and other financial institutions deemed to be creditworthy by SSGA FM, a subsidiary of State Street Corporation and an affiliate of State Street Bank and Trust Company (“State Street”).
Federal income taxes – The Portfolio is not required to pay federal income taxes on its net investment income and net capital gains because it is treated as a partnership for federal income tax purposes. All interest, gains and losses of the Portfolio are deemed to have been “passed through” to the Portfolio’s partners in proportion to their holdings in the Portfolio, regardless of whether such items have been distributed by the Portfolio. Each partner is responsible for tax liability based on its distributive share; therefore, no provision has been made for federal income taxes.
SSGA Funds Management, Inc. (“SSGA FM” or the “Adviser”) has reviewed the tax positions for open years as of December 31, 2015, and has determined that no provision for income tax is required in the Portfolio’s financial statements. The Portfolio’s federal tax returns for the past three years remain subject to examination by the Portfolio’s major tax jurisdictions, which include the United States of America and the Commonwealth of Massachusetts. The Portfolio recognizes interest and penalties, if any, related to tax liabilities as income tax expense in the Statement of Operations. No income tax returns are currently under examination. Management has analyzed tax laws and regulations and their applications to the Portfolio’s facts and circumstances and does not believe there are any uncertain tax positions that require recognition of a tax liability.
At December 31, 2015, the cost of investments for federal income tax purposes was substantially the same as the cost for financial reporting purposes.
| 3. | Related Party Fees |
The Trust has entered into an investment advisory agreement with the Adviser, under which the Adviser directs the investments of the Portfolio in accordance with its investment objectives, policies, and limitations. In compensation for the Adviser’s services as investment adviser, the Portfolio pays the Adviser a management fee at an annual rate of 0.05% of its average daily net assets.
35
Table of Contents
State Street Master Funds
State Street Treasury Plus Money Market Portfolio
Notes to Financial Statements — (continued)
December 31, 2015
Effective June 1, 2015, SSGA FM serves as administrator and State Street serves as sub-administrator. A fee is paid by the Portfolio for the administration, sub-administration, custody and transfer agency services SSGA FM and State Street provide. The annual fee is accrued daily and payable monthly at the following fee rate:
| Asset Levels | Annual percentage of average aggregate monthly net assets | |
First $400 million | 0.03% | |
Next $15 billion | 0.02% | |
Thereafter | 0.01% | |
Minimum annual fee per Portfolio | $150,000 |
The minimum fee will be calculated by multiplying the minimum per fund fee by the number of portfolios within the Trust to arrive at the total minimum fee. The greater of the asset based fee or the minimum fee will be charged to the portfolios. SSGA FM and State Street each receive a portion of the fee.
Prior to June 1, 2015, State Street served as administrator. The administration fees paid by the Portfolio were not changed as a result of the administrator and sub-administrator appointments as of June 1, 2015.
| 4. | Trustees’ Fees |
Independent Trustees are compensated on a calendar year basis. Any Trustee who is deemed to be an “interested person” (as defined in the 1940 Act) of the Trust does not receive compensation from the Trust for his or her service as a Trustee.
Each Independent Trustee receives for his or her services to the State Street Master Funds, State Street Institutional Investment Trust and SSGA Funds, a $141,500 annual base retainer in addition to $18,000 for each in-person meeting and $2,000 for each telephonic meeting from the Trust. The Co-Chairmen each receive an additional $44,000 annual retainer. The Independent Trustees are reimbursed for travel and other out-of-pocket expenses in connection with meeting attendance. Trustees’ fees and expenses are allocated among the Trusts and funds overseen by the Trustees in a manner deemed equitable taking into consideration the relative net assets of the funds, subject to a $15,000 minimum per fund. As of the date of this Shareholder Report, the Trustees were not paid pension or retirement benefits as part of the Trust’s expenses. However, the State Street Master Funds have, pursuant to an exemptive order from the SEC, implemented an optional deferred compensation plan by which the Independent Trustees may defer receipt of compensation and receive a return on the deferred amount determined with reference to the performance of shares of specified State Street Master Funds. As of the fiscal year ended December 31, 2015, none of the Independent Trustees participated in the optional deferred compensation program
The Trust’s officers are compensated by the Adviser and its affiliates.
36
Table of Contents
State Street Master Funds
State Street Treasury Plus Money Market Portfolio
Notes to Financial Statements — (continued)
December 31, 2015
| 5. | Market, Credit and Counterparty Risk |
In the normal course of business, the Portfolio invests in securities and enters into transactions where risks exist due to fluctuations in the market (market risk) or failure of the other party to a transaction to perform (counterparty risk). The value of securities held by the Portfolio may decline in response to certain events, including those directly involving the companies whose securities are owned by the Portfolio; conditions affecting the general economy; overall market changes; local, regional or global political, social or economic instability; and currency and interest rate and price fluctuations (credit risk). Similar to credit risk, the Portfolio may be exposed to counterparty risk, or the risk that an entity with which the Portfolio has unsettled or open transactions may default. Financial assets, which potentially expose the Portfolio to credit and counterparty risks, consist principally of investments and cash due from counterparties. The extent of the Portfolio’s exposure to credit and counterparty risks in respect to these financial assets approximates their value as recorded in the Portfolio’s Statement of Assets and Liabilities, less any collateral held by the Portfolio.
| 6. | Rule Issuance |
On July 23, 2014, the U.S. Securities and Exchange Commission (“SEC”) adopted amendments to the governing rules for money market funds. The amendments require that, following a two-year implementation timeframe, institutional prime and institutional tax exempt money market funds adopt a floating net asset value. The rule changes also allow for certain liquidity-based redemption fees and gate, and include enhanced requirements for disclosure and stress testing. The degree to which a money market fund will be impacted by the rule amendments will depend upon the type of fund and type of investors (retail or institutional). At this time, management is evaluating the implications of these amendments and their impact to the Portfolio’s financial statements and accompanying notes.
| 7. | Subsequent Events |
Management has evaluated the impact of all subsequent events on the Portfolio through the date the financial statements were available to be issued and has determined that there were no subsequent events requiring adjustment or disclosure in the financial statements.
37
Table of Contents
Report of Independent Registered Public Accounting Firm
To the Board of Trustees and Owners of Beneficial Interest of
State Street Master Funds:
We have audited the accompanying statement of assets and liabilities, including the schedule of investments, of the State Street Treasury Plus Money Market Portfolio (one of the portfolios constituting State Street Master Funds) (the “Portfolio”) as of December 31, 2015, and the related statement of operations for the year then ended, the statements of changes in net assets for each of the two years in the period then ended, and the financial highlights for each of the five years in the period then ended. These financial statements and financial highlights are the responsibility of the Portfolio’s management. Our responsibility is to express an opinion on these financial statements and financial highlights based on our audits.
We conducted our audits in accordance with the standards of the Public Company Accounting Oversight Board (United States). Those standards require that we plan and perform the audit to obtain reasonable assurance about whether the financial statements and financial highlights are free of material misstatement. We were not engaged to perform an audit of the Portfolio’s internal control over financial reporting. Our audits included consideration of internal control over financial reporting as a basis for designing audit procedures that are appropriate in the circumstances, but not for the purpose of expressing an opinion on the effectiveness of the Portfolio’s internal control over financial reporting. Accordingly, we express no such opinion. An audit also includes examining, on a test basis, evidence supporting the amounts and disclosures in the financial statements and financial highlights, assessing the accounting principles used and significant estimates made by management, and evaluating the overall financial statement presentation. Our procedures included confirmation of securities owned as of December 31, 2015, by correspondence with the custodian and others or by other appropriate auditing procedures where replies from others were not received. We believe that our audits provide a reasonable basis for our opinion.
In our opinion, the financial statements and financial highlights referred to above present fairly, in all material respects, the financial position of the State Street Treasury Plus Money Market Portfolio (one of the portfolios constituting State Street Master Funds) at December 31, 2015, the results of its operations for the year then ended, the changes in its net assets for each of the two years in the period then ended, and the financial highlights for each of the five years in the period then ended, in conformity with U.S. generally accepted accounting principles.
Boston, Massachusetts
February 26, 2016
38
Table of Contents
State Street Master Funds
State Street Treasury Plus Money Market Portfolio
December 31, 2015 (Unaudited)
SHAREHOLDER EXPENSE EXAMPLE
As a shareholder of a fund, you incur two types of costs: (1) transaction costs, and (2) ongoing costs, including advisory and administration fees, among others. This example is intended to help you understand your ongoing costs (in dollars) of investing in a fund and to compare these costs with the ongoing costs of investing in other mutual funds. It is based on an investment of $1,000 made at the beginning of the period shown and held for the entire period from July 1, 2015 to December 31, 2015.
The table below illustrates your Portfolio’s costs in two ways:
| • | Actual expenses. This section helps you to estimate the actual expenses that you paid over the period. The “Ending Account Value” shown is derived from the Portfolio’s actual return, and the third column shows the dollar amount that would have been paid by an investor who started with $1,000 in the Portfolio. You may use the information here, together with the amount you invested, to estimate the expenses that you paid over the period. To do so, simply divide your account value by $1,000 (for example, an $8,600 account value divided by $1,000 = 8.6), then multiply the result by the number given for the Portfolio under the heading “Expenses Paid During Period.” |
| • | Hypothetical example for comparison purposes. This section is intended to help you compare your Portfolio’s costs with those of other mutual funds. It assumes that the Portfolio had a yearly return of 5% before expenses, but that the expense ratio is unchanged. In this case, because the return used is not the Portfolio’s actual return, the results do not apply to your investment. The example is useful in making comparisons because the Securities and Exchange Commission requires all mutual funds to calculate expenses based on a 5% return. You can assess your Portfolio’s costs by comparing this hypothetical example with the hypothetical examples that appear in shareholder reports of other funds. |
Six Months Ended December 31, 2015
Beginning July 1, 2015 | Ending Account Value December 31, 2015 | Expenses Paid During Period * | ||||||||||
Based on Actual Portfolio Return | $ | 1,000.00 | $ | 1,000.00 | $ | 0.40 | ||||||
Based on Hypothetical (5% return before expenses) | $ | 1,000.00 | $ | 1,024.80 | $ | 0.41 | ||||||
| * | The calculations are based on expenses incurred in the most recent six month period of the Portfolio. The Portfolio’s annualized expense ratio for the six months ended December 31, 2015 was 0.07%. |
| The dollar amounts shown as “Expenses Paid” are equal to the annualized expense ratio multiplied by the average account value over the period, multiplied by 184/365 (the most recent six month period). |
39
Table of Contents
State Street Master Funds
State Street Treasury Plus Money Market Portfolio
Shareholder Requests for Additional Information
December 31, 2015 (Unaudited)
Proxy Voting Policies and Procedures and Record
The Portfolio has adopted the proxy voting policies of the Adviser. A description of the policies and procedures that the Portfolio have adopted to determine how to vote proxies relating to portfolio securities are contained in the Portfolio’s Statement of Additional Information, which is available (i) without charge, upon request, by calling the Portfolio at 1-877-521-4083, (ii) on the U.S. Securities and Exchange Commission’s website at www.sec.gov, or (iii) at the U.S. Securities and Exchange Commission’s public reference room. Information on the operation of the public reference room may be obtained by calling 1-800-SEC-0330. Information regarding how the Portfolio voted proxies, if any, during the most recent 12-month period ended June 30 is available by August 31 of each year without charge (1) by calling 1-877-521-4083 (toll free), or (2) on the website of the Securities and Exchange Commission (“SEC”) at www.sec.gov.
Quarterly Portfolio Schedule
The Portfolio will file their complete schedules of investments with the U.S. Securities and Exchange Commission for the first and third quarters of each fiscal year on Form N-Q. For the second and fourth quarters, the complete schedules of investments are available in the Portfolio’s semi-annual and annual financial statements. The Portfolio’s Form N-Q is available (i) without charge, upon request, by calling the Portfolio at 1-877-521-4083, (ii) on the Securities and Exchange Commission’s website at www.sec.gov, or (iii) at the Securities and Exchange Commission’s public reference room. Information on the operation of the public reference room may be obtained by calling 1-800-SEC-0330.
Monthly Portfolio Schedule
The Portfolio files its monthly portfolio holdings with the U.S. Securities and Exchange Commission on Form N-MFP. The SEC delays the public availability of the information filed on Form N-MFP for 60 days after the end of the reporting period included in the filing. The Portfolio’s Form N-MFP is available (i) on the U.S. Securities and Exchange Commission’s website at www.sec.gov, or (ii) at the Securities and Exchange Commission’s public reference room.
40
Table of Contents
State Street Treasury Plus Money Market Portfolio
Disclosure of Information about Fund Trustees and Officers
December 31, 2015 (Unaudited)
Name, Address, and Year of Birth | Position(s) Held | Term of Office Time Served | Principal Occupation During Past Five Years and Relevant Experience | Number of Funds in Fund Complex Overseen by Trustee | Other Directorships Held by Trustee During Past Five Years | |||||
Independent Trustees | ||||||||||
Michael F. Holland State Street Bank and Trust Company 100 Huntington Avenue, CPH 0326 Boston, MA 02116 YOB: 1944 | Trustee and Co-Chairman of the Board | Term: Indefinite Elected: 7/99 | Chairman, Holland & Company L.L.C. (investment adviser) (1995 – present). | 75 | Director, the Holland Series Fund, Inc.; Director, The China Fund, Inc.; Director, The Taiwan Fund, Inc.; Director, Reaves Utility Income Fund, Inc.; and Director, Blackstone/GSO Loan Funds. | |||||
Patrick J. Riley State Street Bank and Trust Company 100 Huntington Avenue, CPH 0326 Boston, MA 02116 YOB: 1948 | Trustee and Co-Chairman of the Board | Term: Indefinite Elected:1/14 | 2002 to May 2010, Associate Justice of the Superior Court, Commonwealth of Massachusetts; 1985 to 2002, Partner, Riley, Burke & Donahue, L.L.P. (law firm); 1998 to Present, Independent Director, State Street Global Advisers Ireland, Ltd. (investment company); 1998 to Present, Independent Director, SSGA Liquidity plc (formerly, SSGA Cash Management Fund plc); January 2009 to Present, Independent Director, SSGA Fixed Income plc; and January 2009 to Present, Independent Director, SSGA Qualified Funds PLC. | 75 | Board Director and Chairman, SPDR Europe 1PLC Board (2011 – Present); Board Director and Chairman, SPDR Europe II, PLC (2013 – Present). | |||||
William L. Boyan State Street Bank and Trust Company 100 Huntington Avenue, CPH 0326 Boston, MA 02116 YOB: 1937 | Trustee and Co-Chairman of the Valuation Committee | Term: Indefinite Elected: 7/99 | President and Chief Operations Officer, John Hancock Financial Services (1959 – 1999). Mr. Boyan retired in 1999. Chairman Emeritus, Children’s Hospital, Boston, MA (1984 – 2011); Former Trustee of Old Mutual South Africa Master Trust (investments) (1995 – 2008); Former Chairman, Boston Plan For Excellence, Boston Public Schools (1995 – 2010); Member of Advisory Board of Florida Atlantic University Lifelong Learning Society. | 75 | Former Trustee of Old Mutual South Africa Master Trust. | |||||
41
Table of Contents
State Street Master Funds
State Street Treasury Plus Money Market Portfolio
Disclosure of Information about Fund Trustees and Officers — (continued)
December 31, 2015 (Unaudited)
Name, Address, and Year of Birth | Position(s) Held | Term of Office Time Served | Principal Occupation During Past Five Years and Relevant Experience | Number of Funds in Fund Complex Overseen by Trustee | Other Directorships Held by Trustee During Past Five Years | |||||
Independent Trustees (continued) | ||||||||||
William L. Marshall State Street Bank and Trust Company 100 Huntington Avenue, CPH 0326 Boston, MA 02116 YOB: 1942 | Trustee and Co-Chairman of the Audit Committee | Term: Indefinite Elected: 1/14 | April 2011 to Present, Chairman (until April 2011, Chief Executive Officer and President), Wm. L. Marshall Associates, Inc., Wm. L. Marshall Companies, Inc. and the Marshall Financial Group, Inc. (a registered investment adviser and provider of financial and related consulting services); Certified Financial Planner; Member, Financial Planners Association; 2015 to present, Board Member, The Doylestown Health Foundation Board. | 75 | Marshall Financial Group, Inc. | |||||
Richard D. Shirk State Street Bank and Trust Company 100 Huntington Avenue, CPH 0326 Boston, MA 02116 YOB: 1945 | Trustee and Co-Chairman of the Qualified Legal and Compliance Committee | Term: Indefinite Elected: 1/14 | March 2001 to April 2002, Chairman (1996 to March 2001, President and Chief Executive Officer), Cerulean Companies, Inc. (holding company) (Retired); 1992 to March 2001, President and Chief Executive Officer, Blue Cross Blue Shield of Georgia (health insurer, managed healthcare); 1998 to December 2008, Chairman, Board Member and December 2008 to Present, Investment Committee Member, Healthcare Georgia Foundation (private foundation); September 2002 to 2012, Lead Director and Board Member, Amerigroup Corp. (managed health care); 1999 to 2013, Board Member and (since 2001) Investment Committee Member, Woodruff Arts Center; and 2003 to 2009, Trustee, Gettysburg College. | 75 | Board member, AeroCare Holdings (privately held healthcare services company) (February 2003 – Present); Board member, Regenesis Biomedical (health care services) (April 2012 – Present); Chairman (January 2014 – Present). | |||||
Rina K. Spence State Street Bank and Trust Company 100 Huntington Avenue, CPH 0326 Boston, MA 02116 YOB: 1948 | Trustee and Co-Chairman of the Qualified Legal and Compliance Committee and Co-Chairman of the Governance Committee | Term: Indefinite Elected: 7/99 | President of SpenceCare International LLC (international healthcare consulting) (1999 – present); Chief Executive Officer, IEmily.com (health internet company) (2000 – 2001); Chief Executive Officer of Consensus Pharmaceutical, Inc. (1998 – 1999); Founder, President and Chief Executive Officer of Spence Center for Women’s Health (1994 – 1998); President and CEO Emerson Hospital (1984 – 1994); Trustee, Eastern Enterprise (utilities) (1988 – 2000); Director, Berkshire Life Insurance Company of America (1993 – 2009); Honorary Consul for Monaco in Boston (2015 – present). | 75 | ||||||
42
Table of Contents
State Street Master Funds
State Street Treasury Plus Money Market Portfolio
Disclosure of Information about Fund Trustees and Officers — (continued)
December 31, 2015 (Unaudited)
Name, Address, and Year of Birth | Position(s) Held | Term of Office Time Served | Principal Occupation During Past Five Years and Relevant Experience | Number of Funds in Fund Complex Overseen by Trustee | Other Directorships Held by Trustee During Past Five Years | |||||
Independent Trustees (continued) | ||||||||||
Bruce D. Taber State Street Bank and Trust Company 100 Huntington Avenue, CPH 0326 Boston, MA 02116 YOB: 1943 | Trustee and Co-Chairman of the Valuation Committee and Co-Chairman of the Governance Committee | Term: Indefinite Elected: 1/14 | 1999 to Present, Partner, Zenergy LLC (a technology company providing Computer Modeling and System Analysis to the General Electric Power Generation Division); Until December 2008, Independent Director, SSGA Cash Management Fund plc; Until December 2008, Independent Director, State Street Global Advisers Ireland, Ltd. (investment companies); and Until August 1994, President, Alonzo B. Reed, Inc., (a Boston architect-engineering firm). | 75 | ||||||
Douglas T. Williams State Street Bank and Trust Company 100 Huntington Avenue, CPH 0326 Boston, MA 02116 YOB: 1940 | Trustee and Co-Chairman of the Audit Committee | Term: Indefinite Elected: 7/99 | President, Oakmont Homeowners Association; President, Mariner Sands Chapel; Executive Vice President and member of Executive Committee, Chase Manhattan Bank (1987 – 1999); President, Boston Stock Exchange Depository Trust Company, 1981 – 1982; Treasurer, Nantucket Educational Trust, (2002 – 2007). | 75 | ||||||
Interested Trustee(1) | ||||||||||
James E. Ross SSGA Funds Management, Inc. State Street Financial Center One Lincoln Street Boston, MA 02111 YOB: 1965 | Trustee | Term: Indefinite Elected Trustee: 2/07 | Chairman and Director, SSGA Funds Management, Inc. (2012 – present); President, SSGA Funds Management, Inc. (2005 – 2012); Executive Vice President and Senior Managing Director, State Street Global Advisors (2006 – present); and Principal, State Street Global Advisors (2006 – present). | 290 | Trustee, SPDR Series Trust; Trustee, SPDR Index Shares Funds; Trustee, Select Sector SPDR Trust; Trustee, SSGA Active Trust; and Trustee, SSGA Master Trust. | |||||
| (1) | Mr. Ross is an Interested Trustee because of his employment by SSGA Funds Management, Inc., an affiliate of the Trust. |
Name, Address, and Year of Birth | Position(s) Held With Trust | Term of Office and Length of Time Served | Principal Occupation During Past Five Years | |||
Officers: | ||||||
Ellen M. Needham SSGA Funds Management, Inc. State Street Financial Center One Lincoln Street Boston, MA 02111 YOB: 1967 | President | Term: Indefinite Elected: 10/12 | President and Director, SSGA Funds Management, Inc. (June 2012 – present); Chief Operating Officer, SSGA Funds Management, Inc. (May 2010 – June 2012); Senior Managing Director, SSGA Funds Management, Inc. (1992 – 2012) and Senior Managing Director, State Street Global Advisors (1992 – present).* |
43
Table of Contents
State Street Master Funds
State Street Treasury Plus Money Market Portfolio
Disclosure of Information about Fund Trustees and Officers — (continued)
December 31, 2015 (Unaudited)
Name, Address, and Year of Birth | Position(s) Held With Trust | Term of Office and Length of Time Served | Principal Occupation During Past Five Years | |||
Officers: (continued) | ||||||
Bruce S. Rosenberg SSGA Funds Management, Inc. State Street Financial Center One Lincoln Street Boston, MA 02111 YOB: 1961 | Treasurer | Term: Indefinite Elected: 2/16 | Managing Director, State Street Global Advisors and SSGA Funds Management, Inc. (July 2015 – present); Director, Credit Suisse (April 2008 – July 2015). | |||
Ann M. Carpenter SSGA Funds Management, Inc. State Street Financial Center One Lincoln Street Boston, MA 02111 YOB: 1966 | Vice President Deputy Treasurer | Term: Indefinite Elected: 10/12 Term: Indefinite Elected: 2/16 | Chief Operating Officer, SSGA Funds Management, Inc. (April 2014 – present); Vice President, State Street Global Advisors and SSGA Funds Management, Inc. (2005 – present).* | |||
Chad C. Hallett SSGA Funds Management, Inc. State Street Financial Center One Lincoln Street Boston, MA 02111 YOB: 1969 | Deputy Treasurer | Term: Indefinite Elected: 2/16 | Vice President, State Street Global Advisors and SSGA Funds Management, Inc. (November 2014 – present); Vice President, State Street Bank and Trust Company (2001 – November 2014).* | |||
Sujata Upreti SSGA Funds Management, Inc. State Street Financial Center One Lincoln Street Boston, MA 02111 YOB: 1974 | Assistant Treasurer | Term: Indefinite Elected: 2/16 | Vice President, State Street Global Advisors and SSGA Funds Management, Inc. (May 2015 – present); Assistant Director, Cambridge Associates, LLC (July 2014 – January 2015); Vice President, Bank of New York Mellon (July 2012 – August 2013); Manager, PricewaterhouseCoopers, LLP (September 2009 – July 2012). | |||
Daniel Foley SSGA Funds Management, Inc. State Street Financial Center One Lincoln Street Boston, MA 02111 YOB: 1972 | Assistant Treasurer | Term: Indefinite Elected: 2/16 | Vice President, State Street Global Advisors and SSGA Funds Management, Inc. (April 2014 – present); Principal, State Street Global Advisors and SSGA Funds Management, Inc. (April 2007 – April 2014). | |||
Brian Harris SSGA Funds Management, Inc. State Street Financial Center One Lincoln Street Boston, MA 02111 YOB: 1973 | Chief Compliance Officer | Term: Indefinite Elected: 11/13 | Vice President, State Street Global Advisors and SSGA Funds Management, Inc.( June 2013 – Present); Senior Vice President and Global Head of Investment Compliance, BofA Global Capital Management (September 2010 to May 2013); Director of Compliance, AARP Financial Inc. (July 2008 to August 2010). | |||
Trevor Swanberg SSGA Funds Management, Inc. State Street Financial Center One Lincoln Street Boston, MA 02111 YOB: 1979 | Code of Ethics Compliance Officer | Term: Indefinite Elected:8/15 | Vice President, State Street Global Advisors and SSGA Funds Management, Inc. (January 2015 – Present); Senior Manager – Mutual Fund Compliance, ICMA-Retirement Corporation (December 2011 – January 2015); Assistant Vice President, J.P. Morgan (September 2007 – December 2011). | |||
Joshua A. Weinberg SSGA Funds Management, Inc. State Street Financial Center One Lincoln Street Boston, MA 02111 YOB: 1978 | Chief Legal Officer | Term: Indefinite Elected: 2/15 | Vice President and Managing Counsel, State Street Global Advisors (2011 – present); Clerk, SSGA Funds Management, Inc. (2013 – present); Associate, Financial Services Group, Dechert LLP (2006 – 2011). |
44
Table of Contents
State Street Master Funds
State Street Treasury Plus Money Market Portfolio
Disclosure of Information about Fund Trustees and Officers — (continued)
December 31, 2015
Name, Address, and Year of Birth | Position(s) Held With Trust | Term of Office and Length of Time Served | Principal Occupation During Past Five Years | |||
Officers: (continued) | ||||||
David K. James State Street Bank and Trust Company 100 Huntington Avenue, 3rd Floor Boston, MA 02116 YOB: 1970 | Secretary | Term: Indefinite Elected: 4/13 | Managing Director and Managing Counsel, State Street Bank and Trust Company (2009 – present); Vice President and Counsel, PNC Global Investment Servicing (US), Inc. (2006 – 2009). | |||
Kristin Schantz State Street Bank and Trust Company 100 Huntington Avenue, 3rd Floor Boston, MA 02116 YOB: 1979 | Assistant Secretary | Term: Indefinite Elected: 2/14 | Vice President and Counsel, State Street Bank and Trust Company (2013 – present); Vice President, Citi Fund Services Ohio, Inc. (2008 – 2013). |
| * | Served in various capacities and/or with various affiliated entities during noted time period. |
45
Table of Contents
Trustees
William L. Boyan
Michael F. Holland
William L. Marshall
Patrick J. Riley
James E. Ross
Richard D. Shirk
Rina K. Spence
Bruce D. Taber
Douglas T. Williams
Investment Adviser and Administrator
SSGA Funds Management, Inc.
State Street Financial Center
One Lincoln Street
Boston, MA 02111
Custodian, Sub-Administrator and Transfer Agent
State Street Bank and Trust Company
State Street Financial Center
One Lincoln Street
Boston, MA 02111
Independent Registered Public Accounting Firm
Ernst & Young LLP
200 Clarendon Street
Boston, MA 02116
Legal Counsel
Ropes & Gray LLP
800 Boylston Street
Boston, MA 02199
This report is for shareholder information. This is not a prospectus intended for use in the purchase or sale of shares of beneficial interest.
State Street Master Funds State Street Bank and Trust Company P.O. Box 5049 Boston, MA 02206 | SSITINVAR IBG-18445 |
Table of Contents
Annual Report
31 December 2015
State Street Institutional Investment Trust
State Street Institutional U.S. Government Money Market Fund

Table of Contents
State Street Institutional Investment Trust
State Street Institutional U.S. Government Money Market Fund
Annual Report
December 31, 2015
| 1 | ||||
| 2 | ||||
| 3 | ||||
| 4 | ||||
| 6 | ||||
| 12 | ||||
| 13 | ||||
| 15 | ||||
| 16 | ||||
Table of Contents
State Street Institutional Investment Trust
State Street Institutional U.S. Government Money Market Fund
Statement of Assets and Liabilities
December 31, 2015
Assets | ||||
Investments in corresponding Portfolio, at market value and cost (Note 1) | $ | 15,221,665,348 | ||
Cash | 3,764 | |||
Receivable from Adviser (Note 3) | 181,307 | |||
Prepaid expenses and other assets | 15,871 | |||
|
| |||
Total assets | 15,221,866,290 | |||
|
| |||
Liabilities | ||||
Administration and custody fees payable (Note 3) | 557,354 | |||
Registration and filing fees payable | 235,616 | |||
Shareholder servicing fee payable (Note 3) | 154,436 | |||
Distribution fees payable (Note 3) | 61,771 | |||
Professional fees payable | 8,302 | |||
Transfer agent fees payable | 4,118 | |||
Dividends payable | 63,849 | |||
Accrued expenses and other liabilities | 28,052 | |||
|
| |||
Total liabilities | 1,113,498 | |||
|
| |||
Net Assets | $ | 15,220,752,792 | ||
|
| |||
Net Assets Consist of: | ||||
Paid-in capital | $ | 15,220,752,792 | ||
|
| |||
Net Assets | $ | 15,220,752,792 | ||
|
| |||
Net Assets | ||||
Premier Class | $ | 13,516,264,037 | ||
|
| |||
Investment Class | $ | 971,551,181 | ||
|
| |||
Class G Shares | $ | 732,937,574 | ||
|
| |||
Shares of Beneficial Interest Outstanding | ||||
Premier Class | 13,516,527,738 | |||
|
| |||
Investment Class | 971,616,529 | |||
|
| |||
Class G Shares | 732,930,190 | |||
|
| |||
Offering, Net Asset Value, and Redemption Price Per Share | ||||
Premier Class | $ | 1.00 | ||
|
| |||
Investment Class | $ | 1.00 | ||
|
| |||
Class G Shares | $ | 1.00 | ||
|
|
See accompanying notes to financial statements and financial statements of corresponding portfolio.
1
Table of Contents
State Street Institutional Investment Trust
State Street Institutional U.S. Government Money Market Fund
Year Ended December 31, 2015
Income | ||||
Interest income allocated from Portfolio (Note 2) | $ | 12,715,335 | ||
Expenses allocated from Portfolio (Note 2) | (8,425,030 | ) | ||
|
| |||
| 4,290,305 | ||||
|
| |||
Expenses | ||||
Administration and custody fees (Note 3) | 6,055,546 | |||
Shareholder servicing fee – Investment Class (Note 3) | 1,691,657 | |||
Distribution fees – Investment Class (Note 3) | 676,663 | |||
Trustees’ fees and expenses | 16,277 | |||
Registration and filing fees | 76,169 | |||
Professional fees | 28,223 | |||
Transfer agent fees (Note 3) | 70,868 | |||
Printing fees | 68,124 | |||
Other expenses | 296,911 | |||
|
| |||
Total expenses | 8,980,438 | |||
Less: Expenses reimbursed by the Adviser (Note 3) | (3,042,069 | ) | ||
Shareholder servicing fees waived – Investment Class (Note 3) | (1,691,657 | ) | ||
Distribution fees waived – Investment Class (Note 3) | (676,663 | ) | ||
|
| |||
Net expenses | 3,570,049 | |||
|
| |||
Net Investment Income | 720,256 | |||
|
| |||
Net realized gain on investments allocated from Portfolio | 101,189 | |||
|
| |||
Net Increase in Net Assets Resulting from Operations | $ | 821,445 | ||
|
|
See accompanying notes to financial statements and financial statements of corresponding portfolio.
2
Table of Contents
State Street Institutional Investment Trust
State Street Institutional U.S. Government Money Market Fund
Statements of Changes in Net Assets
| Year Ended December 31, 2015 | Year Ended December 31, 2014 | |||||||
Increase (Decrease) in Net Assets Resulting from: Operations: | ||||||||
Net investment income | $ | 720,256 | $ | (43 | ) | |||
Net realized gain on investments allocated from Portfolio | 101,189 | 13,046 | ||||||
|
|
|
| |||||
Net increase in net assets from operations | 821,445 | 13,003 | ||||||
|
|
|
| |||||
Distributions to Shareholders from: | ||||||||
Net investment income | ||||||||
Premier Class | (565,219 | ) | — | |||||
Class G Shares | (155,037 | ) | (43 | ) | ||||
|
|
|
| |||||
Total distributions | (720,256 | ) | (43 | ) | ||||
|
|
|
| |||||
Net Increase (Decrease) from Capital Share Transactions: | ||||||||
Premier Class | ||||||||
Shares sold | 43,034,500,814 | 35,021,325,932 | ||||||
Reinvestment of distributions | 492,834 | — | ||||||
Shares redeemed | (40,481,619,457 | ) | (31,247,787,167 | ) | ||||
|
|
|
| |||||
Net increase from capital share transactions | 2,553,374,191 | 3,773,538,765 | ||||||
|
|
|
| |||||
Investment Class | ||||||||
Shares sold | 4,327,886,922 | 3,966,547,545 | ||||||
Shares redeemed | (3,972,047,433 | ) | (4,042,310,684 | ) | ||||
|
|
|
| |||||
Net increase (decrease) from capital share transactions | 355,839,489 | (75,763,139 | ) | |||||
|
|
|
| |||||
Class G Shares* | ||||||||
Shares sold | 2,487,611,939 | 1,626,172,411 | ||||||
Reinvestment of distributions | 155,037 | 43 | ||||||
Shares redeemed | (2,627,170,798 | ) | (753,838,442 | ) | ||||
|
|
|
| |||||
Net increase (decrease) from capital share transactions | (139,403,822 | ) | 872,334,012 | |||||
|
|
|
| |||||
Net Increase in Net Assets | 2,769,911,047 | 4,570,122,598 | ||||||
Net Assets | ||||||||
Beginning of year | 12,450,841,745 | 7,880,719,147 | ||||||
|
|
|
| |||||
End of year | $ | 15,220,752,792 | $ | 12,450,841,745 | ||||
|
|
|
| |||||
Undistributed net investment income | $ | — | $ | — | ||||
|
|
|
| |||||
Changes in Shares: | ||||||||
Premier Class | ||||||||
Shares sold | 43,034,500,814 | 35,021,325,932 | ||||||
Reinvestment of distributions | 492,834 | — | ||||||
Shares redeemed | (40,481,619,457 | ) | (31,247,787,167 | ) | ||||
|
|
|
| |||||
Net increase in shares | 2,553,374,191 | 3,773,538,765 | ||||||
|
|
|
| |||||
Investment Class | ||||||||
Shares sold | 4,327,886,922 | 3,966,547,545 | ||||||
Shares redeemed | (3,972,047,433 | ) | (4,042,310,684 | ) | ||||
|
|
|
| |||||
Net increase (decrease) in shares | 355,839,489 | (75,763,139 | ) | |||||
|
|
|
| |||||
Class G Shares* | ||||||||
Shares sold | 2,487,611,932 | 1,626,172,411 | ||||||
Reinvestment of distributions | 155,044 | 43 | ||||||
Shares redeemed | (2,627,170,798 | ) | (753,838,442 | ) | ||||
|
|
|
| |||||
Net increase (decrease) in shares | (139,403,822 | ) | 872,334,012 | |||||
|
|
|
| |||||
| * | The Fund’s Class G Shares commenced operations on October 5, 2014. |
See accompanying notes to financial statements and financial statements of corresponding portfolio.
3
Table of Contents
State Street Institutional Investment Trust
State Street Institutional U.S. Government Money Market Fund
Selected data for a share of beneficial interest outstanding throughout each year is presented below(a):
Period Ended December 31, | Net Asset Value Beginning of Period | Net Investment Income/(Loss) | Gain (Loss) on Investments | Total from Investment Operations | Distributions from Net Investment Income | |||||||||||||||
Premier Class | ||||||||||||||||||||
2015 | $ | 1.0000 | $ | 0.0000 | (d) | $ | 0.0000 | (d) | $ | 0.0000 | $ | (0.0000 | )(d) | |||||||
2014 | $ | 1.0000 | $ | (0.0000 | )(d) | $ | – | $ | (0.0000 | )(d) | $ | – | ||||||||
2013 | $ | 1.0000 | $ | 0.0001 | $ | – | $ | 0.0001 | $ | (0.0001 | ) | |||||||||
2012 | $ | 1.0000 | $ | 0.0003 | $ | 0.0000 | (d) | $ | 0.0003 | $ | (0.0003 | ) | ||||||||
2011 | $ | 1.0000 | $ | 0.0002 | $ | 0.0000 | (d) | $ | 0.0002 | $ | (0.0002 | ) | ||||||||
Investment Class | ||||||||||||||||||||
2015 | $ | 1.0000 | $ | 0.0000 | (d) | $ | – | $ | 0.0000 | (d) | $ | – | ||||||||
2014 | $ | 1.0000 | $ | (0.0000 | )(d) | $ | – | $ | (0.0000 | )(d) | $ | – | ||||||||
2013 | $ | 1.0000 | $ | 0.0000 | (d) | $ | – | $ | 0.0000 | (d) | $ | – | ||||||||
2012 | $ | 1.0000 | $ | 0.0000 | (d) | $ | 0.0000 | (d) | $ | 0.0000 | (d) | $ | – | |||||||
2011 | $ | 1.0000 | $ | (0.0001 | ) | $ | 0.0001 | $ | 0.0000 | (d) | $ | – | ||||||||
Class G | ||||||||||||||||||||
2015 | $ | 1.0000 | $ | 0.0002 | $ | 0.0000 | (d) | $ | 0.0002 | $ | (0.0002 | ) | ||||||||
2014(f) | $ | 1.0000 | $ | 0.0000 | $ | 0.0000 | $ | 0.0000 | $ | (0.0000 | )(d) | |||||||||
| (a) | The per share amounts and percentages include the Fund’s proportionate share of income and expenses of the Portfolio. |
| (b) | Total return is calculated assuming a purchase of shares at net asset value on the first day and a sale at net asset value on the last day of each period reported. Distributions are assumed, for the purpose of this calculation, to be reinvested at net asset value per share on the respective payment dates. Total returns for periods of less than one year are not annualized. Results represent past performance and are not indicative of future results. |
| (c) | This expense waiver is reflected in both the net operating expense and the net investment income ratios shown above. Without these waivers, net investment income would have been lower. |
| (d) | Amount is less than $0.00005 per share. |
| (e) | Amount is less than 0.005%. |
| (f) | The Fund’s Class G Shares commenced operations on October 5, 2014. |
| ** | Annualized. |
See accompanying notes to financial statements and financial statements of corresponding portfolio.
4
Table of Contents
Period Ended December 31, | Net Asset Value End of Period | Total Return(b) | Ratios to Average Net Assets/Supplemental Data(a) | Net Assets End of Period (000s omitted) | ||||||||||||||||||||||||
| Gross Expenses | Net Expenses | Investment Income | Net Expense Waiver(c) | |||||||||||||||||||||||||
Premier Class | ||||||||||||||||||||||||||||
2015 | $ | 1.0000 | 0.00 | %(e) | 0.12 | % | 0.09 | % | 0.00 | %(e) | 0.03 | % | $ | 13,516,264 | ||||||||||||||
2014 | $ | 1.0000 | 0.00 | %(e) | 0.12 | % | 0.07 | % | 0.00 | %(e) | 0.05 | % | $ | 10,962,800 | ||||||||||||||
2013 | $ | 1.0000 | 0.01 | % | 0.12 | % | 0.09 | % | 0.01 | % | 0.03 | % | $ | 7,189,250 | ||||||||||||||
2012 | $ | 1.0000 | 0.03 | % | 0.13 | % | 0.12 | % | 0.03 | % | 0.01 | % | $ | 7,114,213 | ||||||||||||||
2011 | $ | 1.0000 | 0.02 | % | 0.12 | % | 0.10 | % | 0.02 | % | 0.02 | % | $ | 5,139,795 | ||||||||||||||
Investment Class | ||||||||||||||||||||||||||||
2015 | $ | 1.0000 | 0.00 | %(e) | 0.47 | % | 0.10 | % | 0.00 | %(e) | 0.37 | % | $ | 971,551 | ||||||||||||||
2014 | $ | 1.0000 | 0.00 | %(e) | 0.47 | % | 0.07 | % | 0.00 | %(e) | 0.40 | % | $ | 615,706 | ||||||||||||||
2013 | $ | 1.0000 | 0.00 | %(e) | 0.47 | % | 0.10 | % | 0.00 | %(e) | 0.37 | % | $ | 691,469 | ||||||||||||||
2012 | $ | 1.0000 | 0.00 | %(e) | 0.47 | % | 0.14 | % | 0.00 | %(e) | 0.33 | % | $ | 654,978 | ||||||||||||||
2011 | $ | 1.0000 | 0.00 | %(e) | 0.47 | % | 0.11 | % | 0.00 | %(e) | 0.36 | % | $ | 638,101 | ||||||||||||||
Class G | ||||||||||||||||||||||||||||
2015 | $ | 1.0000 | 0.02 | % | 0.08 | % | 0.08 | % | 0.02 | % | 0.00 | %(e) | $ | 732,938 | ||||||||||||||
2014(f) | $ | 1.0000 | 0.00 | %(e) | 0.09 | %** | 0.08 | %** | 0.00 | %(e)** | 0.01 | %** | $ | 872,335 | ||||||||||||||
See accompanying notes to financial statements and financial statements of corresponding portfolio.
5
Table of Contents
State Street Institutional Investment Trust
State Street Institutional U.S. Government Money Market Fund
December 31, 2015
| 1. | Organization |
State Street Institutional Investment Trust (the “Trust”) is registered under the Investment Company Act of 1940, as amended (the “1940 Act”), as an open-end management investment company, and was organized as a business trust under the laws of the Commonwealth of Massachusetts on February 16, 2000. The Trust consists of forty-five (45) series and corresponding classes, each of which have the same rights and privileges, including the same voting rights. Each series is authorized to issue an unlimited number of shares, with no par value. The financial statements herein relate to the following fund (the “Fund”):
| Fund | Classes | Commencement of Operations: | ||
State Street Institutional U.S. Government Money Market Fund | Administration Class Class G Institutional Class Investment Class Investor Class Premier Class Service Class | Not commenced October 5, 2014 Not commenced October 17, 2007 Not commenced October 25, 2007 Not commenced |
The Fund is part of a master-feeder investment structure and invests all of its investable assets in interests of its master portfolio (the “Portfolio”) as reflected in the table below. The investment objective and policies of the Portfolio are substantially similar to those of the Fund. The value of the Fund’s investment in its Portfolio reflects the Fund’s proportionate interest in the net assets of the Portfolio. The performance of the Fund is directly affected by the performance of the Portfolio. The financial statements of the Portfolio, including its Schedule of Investments, are attached to this report and should be read in conjunction with the Fund’s financial statements.
| Fund | % Investment in Master | Portfolio | ||
State Street Institutional U.S. Government Money Market Fund | 95.00% | State Street U.S. Government Money Market Portfolio* |
| * | A series of the State Street Master Funds |
The State Street Institutional U.S. Government Money Market Fund is considered to be a money market fund pursuant to Rule 2a-7 under the 1940 Act. It is the Fund’s policy, as a money market fund, to maintain a stable net asset value per share of $1.00. However, there is no assurance the Fund will be able to maintain a stable net asset value per share.
An investment in the Fund is not insured or guaranteed by the Federal Deposit Insurance Corporation or any other government agency. Although the Fund seeks to preserve the value of the shareholders’ investment at $1.00 per share, it is possible to lose money by investing in the Fund.
Under the Trust’s organizational documents, its officers and trustees are indemnified against certain liabilities arising out of the performance of their duties to the Trust. Additionally, in the normal course of business, the Trust enters into contracts with service providers that contain general indemnification clauses. The Trust’s maximum exposure under these arrangements is unknown as this could involve future claims that may be made against the Trust that have not yet occurred.
6
Table of Contents
State Street Institutional Investment Trust
State Street Institutional U.S. Government Money Market Fund
Notes to Financial Statements — (continued)
December 31, 2015
| 2. | Summary of Significant Accounting Policies |
The following is a summary of significant accounting policies followed by the Trust in the preparation of its financial statements:
The preparation of financial statements in accordance with U.S. generally accepted accounting principles (“U.S. GAAP”) requires management to make estimates and assumptions that affect the reported amounts and disclosures in the financial statements. Actual results could differ from those estimates. The Fund is an investment company under U.S. GAAP and follows the accounting and reporting guidance applicable to investment companies in Financial Accounting Standards Board (“FASB”) Accounting Standards Codification (“ASC”) 946, Financial Services Investment Companies (“ASC 946”).
Security Valuation – The Fund records its investment in the Portfolio at value. The valuation policy of the Portfolio is discussed in Note 2 of the Portfolio’s Notes to Financial Statements, which are attached to this report.
The Portfolio’s investments are valued at fair value each day that the Portfolio’s listing exchange is open and, for financial reporting purposes, as of the report date should the reporting period end on a day that the Portfolio’s listing exchange is not open. Fair value is generally defined as the price a fund would receive to sell an asset or pay to transfer a liability in an orderly transaction between market participants at the measurement date. By its nature, a fair value price is a good faith estimate of the valuation in a current sale and may not reflect an actual market price. The investments of the Portfolio are valued pursuant to the policy and procedures developed by the Oversight Committee (the “Committee”) and approved by the Board of Trustees of the Trust (the “Board”). The Committee provides oversight of the valuation of investments for the Fund. The summary of the inputs used for the Portfolio, as of December 31, 2015, in valuing the Portfolio’s assets carried at fair value are discussed in Note 2 of the Portfolio’s Notes to Financial Statements, which are attached to this report.
Investment Transactions and Income Recognition – Investment transactions are accounted for on trade date for financial reporting purposes. Net investment income consists of the Fund’s pro-rata share of the net investment income of the Portfolio, less all expenses of the Fund. Dividends from net investment income are declared daily and are payable as of the last business day of each month. Realized gains and losses from security transactions consist of the Fund’s pro-rata share of the Portfolio’s realized gains and losses. Class specific distribution and shareholder servicing fees are borne by each class. Income, non-class specific expenses, and realized gains and losses are allocated to the respective classes daily on the basis of relative net assets.
Expenses – Certain expenses, which are directly identifiable to a specific fund, are applied to that fund within the Trust. Other expenses which cannot be attributed to a specific fund are allocated in such a manner as deemed equitable, taking into consideration the nature and type of expense and the relative net assets of the funds within the Trust.
Federal income taxes – The Fund has qualified and intends to continue to qualify for and elect treatment as a “regulated investment company” under Subchapter M of the Internal Revenue Code of 1986, as amended. By so qualifying and electing, the Fund will not be subject to federal income taxes to the extent it distributes its taxable income, including any net realized capital gains, for each fiscal year.
7
Table of Contents
State Street Institutional Investment Trust
State Street Institutional U.S. Government Money Market Fund
Notes to Financial Statements — (continued)
December 31, 2015
In addition, by distributing during each calendar year substantially all of its net investment income and capital gains, if any, the Fund will not be subject to federal excise tax. Income and capital gain distributions, if any, are determined in accordance with income tax regulation which may differ from U.S. GAAP.
At December 31, 2015, the cost of investments for federal income tax purposes was substantially the same as the cost for financial reporting purposes.
SSGA Funds Management, Inc. (“SSGA FM” or the “Adviser) has reviewed the Fund’s tax positions for the open tax years as of December 31, 2015, and has determined that no provision for income tax is required in the Fund’s financial statements. The Fund’s federal tax returns for the prior three fiscal years remain subject to examination by the Fund’s major tax jurisdictions, which include the United States of America and the Commonwealth of Massachusetts. The Fund recognizes interest and penalties, if any, related to tax liabilities as income tax expense in the Statements of Operations. No income tax returns are currently under examination. Management has analyzed tax laws and regulations and their applications to the Fund’s facts and circumstances and does not believe there are any uncertain tax positions that require recognition of tax liability.
For the year ended December 31, 2015, permanent differences identified and reclassified among the components of net assets were as follows:
Paid-In Capital | Accumulated Gain (Loss) | Undistributed Net Investment Income (Loss) | ||||
State Street Institutional U.S. Government Money Market Fund | $(51,345) | $51,345 | $– |
These differences were primarily attributable to distribution redesignations, net operating loss, non-deductible tax paid and distributions in excess of current earnings. Net investment income (loss), net realized gains (losses), and net assets were not affected by this reclassification.
The tax character of distributions paid to shareholders during the years ended December 31, 2015, and December 31, 2014, was as follows:
| December 31, 2015 | December 31, 2014 | |||||||||||
Ordinary Income | Tax Income | Long Term Capital Gain | Ordinary Income | Tax Income | Long Term Capital Gain | |||||||
State Street Institutional U.S. Government Money Market Fund | $720,256 | $– | $– | $43 | $– | $– | ||||||
At December 31, 2015, the components of distributable earnings on a tax basis were as follows:
| Undistributed Ordinary Income | Undistributed Tax Exempt Income | Capital Loss Carryover | Total | |||||
State Street Institutional U.S. Government Money Market Fund | $– | $– | $– | $– |
8
Table of Contents
State Street Institutional Investment Trust
State Street Institutional U.S. Government Money Market Fund
Notes to Financial Statements — (continued)
December 31, 2015
| 3. | Related Party and Other Fees |
The Portfolio retained SSGA FM, a subsidiary of State Street Corporation and an affiliate of State Street Bank and Trust Company (“State Street”), as its investment adviser. The Portfolio has entered into an investment advisory agreement with the Adviser, under which the Adviser directs the investments of the Portfolio in accordance with its investment objectives, policies, and limitations. In compensation for the Adviser’s services as investment adviser, the Portfolio pays the Adviser a management fee at an annual rate of 0.05% of its average daily net assets.
The Adviser is contractually obligated until April 30, 2016, to waive its management fee and/or to reimburse the Fund for expenses to the extent that total annual fund operating expenses (exclusive of non-recurring account fees, extraordinary expenses, acquired fund fees and any class specific expenses such as Distribution, Shareholder Servicing, Administration, and Sub-Transfer Agency Fees, as measured on an annualized basis) exceed 0.07% of average daily net assets on an annual basis. The waiver and/or reimbursement may not be terminated during the relevant period except with approval of the Board. For the year ended December 31, 2015, SSGA FM did not reimburse or waived any fees.
Additionally, the Adviser may reimburse expenses or waive fees in order to avoid a negative yield. Any such waiver or reimbursement would be voluntary and may be revised or cancelled at any time without notice. For the year ended December 31, 2015, SSGA FM voluntarily waived $3,042,069.
Under the terms of the reimbursement agreement the Fund agrees to repay SSGA FM up to the amount of fees waived or expenses reduced under the agreement provided that a Fund is not obligated to reimburse SSGA FM (1) more than three years after the end of the fiscal year of the Fund in which SSGA FM provided a voluntary reduction; (2) in respect of any business day for which the net annualized one-day yield of such Fund is less than 0.00%; (3) to the extent that the amount of the reimbursement to SSGA FM on any day exceeds fifty percent of the yield (net of all expenses, exclusive of the reimbursement) of the Fund on that day; (4) to the extent that the amount of the reimbursement would cause the Fund’s net yield to fall below a certain minimum net yield; or (5) in respect of any such fee waivers and/or expense reimbursements that are necessary to maintain a limit on a Fund’s expenses per contractual fee waivers and/or reimbursements by SSGA FM which are effective at the time of such fee waivers and/or expense reimbursements. As of December 31, 2015, SSGA FM has not recouped any expenses from the Fund. Waived/reduced fees subject to potential recovery by year of expiration are as follows:
| Expiration Date | Amount | |||
12/31/2016 | $ | 1,976,248 | ||
12/31/2017 | 4,726,293 | |||
12/31/2018 | 3,042,069 | |||
Pursuant to the administration agreement, the Fund, except Class G Shares, pays a fee at an annual rate of 0.05% of its net assets accrued daily to SSGA FM. Class G Shares pay a fee at an annual rate of
9
Table of Contents
State Street Institutional Investment Trust
State Street Institutional U.S. Government Money Market Fund
Notes to Financial Statements — (continued)
December 31, 2015
0.01% of its net assets accrued daily to SSGA FM. During the year ended December 31, 2015, the Fund incurred the following administration fees:
| Class | Amount | |||
Premier Class | $ | 5,616,176 | ||
Investment Class | 338,331 | |||
Class G | 88,398 | |||
The Fund pays State Street an annual fee for custody and accounting services. Pursuant to the sub-administration agreement, SSGA FM pays an annual fee to State Street for services provided to the Fund.
The Fund’s Investment Class has adopted a plan of distribution pursuant to Rule 12b-1 under the 1940 Act (the “Rule 12b-1 Plan”). Under the Rule 12b-1 Plan, the Fund compensates financial intermediaries in connection with the distribution of Fund shares and for services provided to the Fund’s shareholders. The Fund’s Investment Class Shares may make payments under the Rule 12b-1 Plan at an annual rate up to 0.10% of eligible average daily net assets of the Investment Class Shares. State Street Global Markets LLC (“SSGM” or the “Distributor”), a subsidiary of State Street Corporation, is the Fund’s Distributor.
During the year ended December 31, 2015, the Fund was charged $676,663 but did not make any payments to SSGM under the Rule 12b-1 Plan, as SSGM voluntarily agreed to waive the entire amount of the Rule 12b-1 fees.
Wealth Management Services (“WMS”), a division of State Street, is among the financial intermediaries who may receive fees under the Rule 12b-1 Plan. During the year ended December 31, 2015, SSGM did not make any payments to WMS.
Under the Fund’s Shareholder Servicing Plan, the Fund compensates financial intermediaries for providing certain services to shareholders and for maintaining shareholder accounts. The Fund’s Investment Class Shares made payments under the Shareholder Servicing Plan at an annual rate up to 0.25% of the eligible average daily net assets of the Investment Class Shares. During the year ended December 31, 2015, the Fund paid SSGM $405,713 under the shareholder servicing agreement which SSGM subsequently paid to financial intermediaries.
During the year ended December 31, 2015, SSGM voluntarily agreed to waive shareholder services fees of $1,691,657.
WMS is among the financial intermediaries who may receive fees under the shareholder serving agreement. For the year ended December 31, 2015, WMS received payment of $390,796.
Boston Financial Data Services (“BFDS”), a joint venture of DST Systems, Inc. and State Street Corporation, serves as transfer agent and dividend paying agent to the Fund. For these services, the Fund pays annual account services fees, activity-based fees, and charges related to compliance and regulatory services.
10
Table of Contents
State Street Institutional Investment Trust
State Street Institutional U.S. Government Money Market Fund
Notes to Financial Statements — (continued)
December 31, 2015
| 4. | Trustees’ Fees |
Independent Trustees are compensated on a calendar year basis. Any Trustee who is deemed to be an “interested person” (as defined in the 1940 Act) of the Fund does not receive compensation from the Fund for his or her service as a Trustee.
Each Independent Trustee receives for his or her services to the State Street Master Funds, State Street Institutional Investment Trust and SSGA Funds, a $141,500 annual base retainer in addition to $18,000 for each in-person meeting and $2,000 for each telephonic meeting from the Trust. The Co-Chairmen each receive an additional $44,000 annual retainer. The Independent Trustees are reimbursed for travel and other out-of-pocket expenses in connection with meeting attendance. Trustees’ fees and expenses are allocated among the Trusts and funds overseen by the Trustees in a manner deemed equitable taking into consideration the relative net assets of the funds, subject to a $15,000 minimum per fund. As of the date of this Shareholder Report, the Trustees were not paid pension or retirement benefits as part of Trust’s expenses. However, the Trust has, pursuant to an exemptive order from the SEC, implemented an optional deferred compensation plan by which the Independent Trustees may defer receipt of compensation and receive a return on the deferred amount determined with reference to the performance of shares of specified State Street Institutional Investment Trust series. As of the fiscal year ended December 31, 2015, none of the Independent Trustees participated in the optional deferred compensation program.
The Trust’s officers are compensated by the Adviser and its affiliates.
| 5. | Rule Issuance |
On July 23, 2014, the U.S. Securities and Exchange Commission (the “SEC”) adopted amendments to the governing rules for money market funds. The amendments require that, following a two-year implementation timeframe, institutional prime and institutional tax exempt money market funds adopt a floating net asset value. The rule changes also allow for certain liquidity-based redemption fees and gate, and include enhanced requirements for disclosure and stress testing. The degree to which a money market fund will be impacted by the rule amendments will depend upon the type of fund and type of investors (retail or institutional). At this time, management is evaluating the implications of these amendments and their impact to the Fund’s financial statements and related disclosure.
| 6. | Subsequent Events |
Management has evaluated the impact of all subsequent events on the Fund through the date the financial statements were available to be issued and has determined that there were no subsequent events requiring adjustment or disclosure in the financial statements.
11
Table of Contents
Report of Independent Registered Public Accounting Firm
To the Board of Trustees and Shareholders of
State Street Institutional Investment Trust:
We have audited the accompanying statement of assets and liabilities of the State Street Institutional U.S. Government Money Market Fund (one of the funds constituting State Street Institutional Investment Trust) (the “Fund”) as of December 31, 2015, and the related statement of operations for the year then ended, the statements of changes in net assets for each of the two years in the period then ended, and the financial highlights for each of the periods indicated therein. These financial statements and financial highlights are the responsibility of the Fund’s management. Our responsibility is to express an opinion on these financial statements and financial highlights based on our audits.
We conducted our audits in accordance with the standards of the Public Company Accounting Oversight Board (United States). Those standards require that we plan and perform the audit to obtain reasonable assurance about whether the financial statements and financial highlights are free of material misstatement. We were not engaged to perform an audit of the Fund’s internal control over financial reporting. Our audits included consideration of internal control over financial reporting as a basis for designing audit procedures that are appropriate in the circumstances, but not for the purpose of expressing an opinion on the effectiveness of the Fund’s internal control over financial reporting. Accordingly, we express no such opinion. An audit also includes examining, on a test basis, evidence supporting the amounts and disclosures in the financial statements and financial highlights, assessing the accounting principles used and significant estimates made by management, and evaluating the overall financial statement presentation. We believe that our audits provide a reasonable basis for our opinion.
In our opinion, the financial statements and financial highlights referred to above present fairly, in all material respects, the financial position of the State Street Institutional U.S. Government Money Market Fund (one of the funds constituting State Street Institutional Investment Trust) at December 31, 2015, the results of its operations for the year then ended, the changes in its net assets for each of the two years in the period then ended, and the financial highlights for each of the periods indicated therein, in conformity with U.S. generally accepted accounting principles.

Boston, Massachusetts
February 26, 2016
12
Table of Contents
State Street Institutional Investment Trust
State Street Institutional U.S. Government Money Market Fund
December 31, 2015 (Unaudited)
SHAREHOLDER EXPENSE EXAMPLE
As a shareholder of a fund, you incur two types of costs: (1) transaction costs, and (2) ongoing costs, including administration fees; distribution (12b-1) and/or service fees; and other fund expenses. This example is intended to help you understand your ongoing costs (in dollars) of investing in the Fund and to compare these costs with the ongoing costs of investing in other mutual funds. It is based on an investment of $1,000 made at the beginning of the period shown and held for the entire period from July 1, 2015 to December 31, 2015.
The table below illustrates your Fund’s costs in two ways:
| • | Actual Expenses. This section helps you to estimate the actual expenses that you paid over the period. The “Ending Account Value” shown is derived from the Fund’s actual return, and the third column shows the dollar amount that would have been paid by an investor who started with $1,000 in the Fund. You may use the information here, together with the amount you invested, to estimate the expenses that you paid over the period. To do so, simply divide your account value by $1,000 (for example, an $8,600 account value divided by $1,000 = 8.6), then multiply the result by the number given for the Fund under the heading “Expenses Paid During Period.” |
| • | Hypothetical Example for Comparison Purposes. This section is intended to help you compare your Fund’s costs with those of other mutual funds. It assumes that the Fund had a yearly return of 5% before expenses, but that the expense ratio is unchanged. In this case, because the return used is not the Fund’s actual return, the results do not apply to your investment. The example is useful in making comparisons because the Securities and Exchange Commission requires all mutual funds to calculate expenses based on a 5% return. You can assess your Fund’s costs by comparing this hypothetical example with the hypothetical examples that appear in shareholder reports of other funds. |
Six Months Ended December 31, 2015
| Beginning Account Value July 1, 2015 | Ending Account Value December 31, 2015 | Expenses Paid During Period* | ||||||||||
Premier Class Shares | ||||||||||||
Based on Actual Fund Return | $ | 1,000.00 | $ | 1,000.10 | $ | 0.50 | ||||||
Based on Hypothetical (5% return before expenses) | $ | 1,000.00 | $ | 1,024.70 | $ | 0.51 | ||||||
Investment Class Shares | ||||||||||||
Based on Actual Fund Return | $ | 1,000.00 | $ | 1,000.00 | $ | 0.55 | ||||||
Based on Hypothetical (5% return before expenses) | $ | 1,000.00 | $ | 1,024.65 | $ | 0.56 | ||||||
13
Table of Contents
State Street Institutional Investment Trust
State Street Institutional U.S. Government Money Market Fund
Other Information — (continued)
December 31, 2015 (Unaudited)
SHAREHOLDER EXPENSE EXAMPLE — (continued)
| Beginning Account Value July 1, 2015 | Ending Account Value December 31, 2015 | Expenses Paid During Period* | ||||||||||
Class G Shares | ||||||||||||
Based on Actual Fund Return | $ | 1,000.00 | $ | 1,000.30 | $ | 0.40 | ||||||
Based on Hypothetical (5% return before expenses) | $ | 1,000.00 | $ | 1,024.80 | $ | 0.41 | ||||||
| * | The calculations are based on expense incurred in the most recent six month period of the Fund. The annualized average weighted expense ratio as of December 31, 2015, which includes the Fund’s proportionate share of the expenses of the Portfolio, was 0.10%, 0.11% and 0.08%, for the Premier Class, Investment Class and Class G, respectively. |
| The dollar amount shown as “Expenses Paid” is equal to the annualized average weighted expense ratio multiplied by the average account value over the period, multiplied by 184/365 (the most recent six month period). |
14
Table of Contents
State Street Institutional Investment Trust
State Street Institutional U.S. Government Money Market Fund
Shareholder Requests for Additional Information
December 31, 2015 (Unaudited)
Proxy Voting Policies and Procedures and Record
The Fund has adopted the proxy voting policies of the Adviser. A description of the policies and procedures that the Fund has adopted to determine how to vote proxies relating to portfolio securities are contained in the Fund’s Statement of Additional Information, which is available (i) without charge, upon request, by calling the Funds at 1-877-521-4083, (ii) on the Fund’s website at www.SSGA.com/cash, (iii) on the U.S. Securities and Exchange Commission’s website at www.sec.gov, or (iv) at the U.S. Securities and Exchange Commission’s public reference room. Information regarding the Trust’s proxy voting policies and procedures, as well as information regarding how the Trust voted proxies, if any, during the most recent 12-month period ended June 30 is available without charge (1) by calling 1-877-521-4083 (toll free), or (2) on the website of the Securities and Exchange Commission (“SEC”) at www.sec.gov.
Quarterly Portfolio Schedule
The Fund will file its complete schedule of investments with the U.S. Securities and Exchange Commission for the first and third quarters of each fiscal year on Form N-Q. For the second and fourth quarters, the complete schedule of investments is available in the Fund’s semi-annual and annual financial statements. The Fund’s Form N-Q is available (i) without charge, upon request, by calling the Fund at 1-877-521-4083, (ii) on the Fund’s website at www.SSGA.com/cash, (iii) on the Securities and Exchange Commission’s website at www.sec.gov, or (iv) at the Securities and Exchange Commission’s public reference room. Information on the operation of the public reference room may be obtained by calling 1-800-SEC-0330.
Monthly Portfolio Schedule
The Fund files its monthly portfolio holdings with the U.S. Securities and Exchange Commission on Form N-MFP. The SEC delays the public availability of the information filed on Form N-MFP for 60 days after the end of the reporting period included in the filing. The Fund’s Form N-MFP is available (i) on the U.S. Securities and Exchange Commission’s website at www.sec.gov, or (ii) at the Securities and Exchange Commission’s public reference room.
15
Table of Contents
State Street Institutional Investment Trust
State Street U.S. Government Money Market Fund
Disclosure of Information about Fund Trustees and Officers
December 31, 2015 (Unaudited)
Name, Address, | Position(s) Held | Term of Office | Principal Occupation | Number of Funds in Fund Complex Overseen by Trustee | Other Directorships | |||||
Independent Trustees | ||||||||||
Michael F. Holland State Street Bank and Trust Company 100 Huntington Avenue, CPH 0326 Boston, MA 02116 | Trustee and Co-Chairman of the Board | Term: Indefinite Elected: 7/99 | Chairman, Holland & Company L.L.C. (investment adviser) (1995 – present). | 75 | Director, the Holland Series Fund, Inc.; Director, The China Fund, Inc.; Director, The Taiwan Fund, Inc.; Director, Reaves Utility Income Fund, Inc.; and Director, Blackstone/GSO Loan Funds. | |||||
Patrick J. Riley State Street Bank and Trust Company 100 Huntington Avenue, CPH 0326 Boston, MA 02116 | Trustee and Co-Chairman of the Board | Term: Indefinite Elected: 1/14 | 2002 to May 2010, Associate Justice of the Superior Court, Commonwealth of Massachusetts; 1985 to 2002, Partner, Riley, Burke & Donahue, L.L.P. (law firm); 1998 to Present, Independent Director, State Street Global Advisers Ireland, Ltd. (investment company); 1998 to Present, Independent Director, SSGA Liquidity plc (formerly, SSGA Cash Management Fund plc); January 2009 to Present, Independent Director, SSGA Fixed Income plc; and January 2009 to Present, Independent Director, SSGA Qualified Funds PLC. | 75 | Board Director and Chairman, SPDR Europe 1PLC Board (2011 – Present); Board Director and Chairman, SPDR Europe II, PLC (2013 – Present). | |||||
William L. Boyan State Street Bank and Trust Company 100 Huntington Avenue, CPH 0326 Boston, MA 02116 | Trustee and Co-Chairman of the Valuation Committee | Term: Indefinite Elected: 7/99 | President and Chief Operations Officer, John Hancock Financial Services (1959 – 1999). Mr. Boyan retired in 1999. Chairman Emeritus, Children’s Hospital, Boston, MA (1984 – 2011); Former Trustee of Old Mutual South Africa Master Trust (investments) (1995 – 2008); Former Chairman, Boston Plan For Excellence, Boston Public Schools (1995 – 2010); Member of Advisory Board of Florida Atlantic University Lifelong Learning Society. | 75 | Former Trustee of Old Mutual South Africa Master Trust. | |||||
William L. Marshall State Street Bank and Trust Company 100 Huntington Avenue, CPH 0326 Boston, MA 02116 | Trustee and Co-Chairman of the Audit Committee | Term: Indefinite Elected: 1/14 | April 2011 to Present, Chairman (until April 2011, Chief Executive Officer and President), Wm. L. Marshall Associates, Inc., Wm. L. Marshall Companies, Inc. and the Marshall Financial Group, Inc. (a registered investment adviser and provider of financial and related consulting services); Certified Financial Planner; Member, Financial Planners Association; 2015 to present, Board Member, The Doylestown Health Foundation Board. | 75 | Marshall Financial Group, Inc. | |||||
16
Table of Contents
State Street Institutional Investment Trust
State Street U.S. Government Money Market Fund
Disclosure of Information about Fund Trustees and Officers — (continued)
December 31, 2015 (Unaudited)
Name, Address, | Position(s) Held | Term of Office | Principal Occupation | Number of Funds in Fund Complex Overseen by Trustee | Other Directorships | |||||
Independent Trustees (continued) | ||||||||||
Richard D. Shirk State Street Bank and Trust Company 100 Huntington Avenue, CPH 0326 Boston, MA 02116 | Trustee and Co-Chairman of the Qualified Legal and Compliance Committee | Term: Indefinite Elected: 1/14 | March 2001 to April 2002, Chairman (1996 to March 2001, President and Chief Executive Officer), Cerulean Companies, Inc. (holding company) (Retired); 1992 to March 2001, President and Chief Executive Officer, Blue Cross Blue Shield of Georgia (health insurer, managed healthcare); 1998 to December 2008, Chairman, Board Member and December 2008 to Present, Investment Committee Member, Healthcare Georgia Foundation (private foundation); September 2002 to 2012, Lead Director and Board Member, Amerigroup Corp. (managed health care); 1999 to 2013, Board Member and (since 2001) Investment Committee Member, Woodruff Arts Center; and 2003 to 2009, Trustee, Gettysburg College. | 75 | Board member, AeroCare Holdings (privately held healthcare services company) (February 2003 – Present); Board member, Regenesis Biomedical (health care services) (April 2012 – Present); Chairman (January 2014 – Present). | |||||
Rina K. Spence State Street Bank and Trust Company 100 Huntington Avenue, CPH 0326 Boston, MA 02116 | Trustee and Co-Chairman of the Qualified Legal and Compliance Committee and Co-Chairman of the Governance Committee | Term: Indefinite Elected: 7/99 | President of SpenceCare International LLC (international healthcare consulting) (1999 – present); Chief Executive Officer, IEmily.com (health internet company) (2000 – 2001); Chief Executive Officer of Consensus Pharmaceutical, Inc. (1998 – 1999); Founder, President and Chief Executive Officer of Spence Center for Women’s Health (1994 – 1998); President and CEO Emerson Hospital (1984 – 1994); Trustee, Eastern Enterprise (utilities) (1988 – 2000); Director, Berkshire Life Insurance Company of America (1993 – 2009); Honorary Consul for Monaco in Boston (2015 – present). | 75 | ||||||
Bruce D. Taber State Street Bank and Trust Company 100 Huntington Avenue, CPH 0326 Boston, MA 02116 | Trustee and Co-Chairman of the Valuation Committee and Co-Chairman of the Governance Committee | Term: Indefinite Elected: 1/14 | 1999 to Present, Partner, Zenergy LLC (a technology company providing Computer Modeling and System Analysis to the General Electric Power Generation Division); Until December 2008, Independent Director, SSGA Cash Management Fund plc; Until December 2008, Independent Director, State Street Global Advisers Ireland, Ltd. (investment companies); and Until August 1994, President, Alonzo B. Reed, Inc., (a Boston architect-engineering firm). | 75 | ||||||
17
Table of Contents
State Street Institutional Investment Trust
State Street U.S. Government Money Market Fund
Disclosure of Information about Fund Trustees and Officers — (continued)
December 31, 2015 (Unaudited)
Name, Address, | Position(s) Held | Term of Office | Principal Occupation | Number of Funds in Fund Complex Overseen by Trustee | Other Directorships | |||||
Independent Trustees (continued) | ||||||||||
Douglas T. Williams State Street Bank and Trust Company 100 Huntington Avenue, CPH 0326 Boston, MA 02116 | Trustee and Co-Chairman of the Audit Committee | Term: Indefinite Elected: 7/99 | President, Oakmont Homeowners Association; President, Mariner Sands Chapel; Executive Vice President and member of Executive Committee, Chase Manhattan Bank (1987 – 1999); President, Boston Stock Exchange Depository Trust Company, 1981 – 1982; Treasurer, Nantucket Educational Trust, (2002 – 2007). | 75 | ||||||
Interested Trustee(1) | ||||||||||
James E. Ross SSGA Funds Management, Inc. State Street Financial Center One Lincoln Street Boston, MA 02111 | Trustee | Term: Indefinite Elected Trustee: 2/07 | Chairman and Director, SSGA Funds Management, Inc. (2012 – present); President, SSGA Funds Management, Inc. (2005 – 2012); Executive Vice President and Senior Managing Director, State Street Global Advisors (2006 –present); and Principal, State Street Global Advisors (2006 – present). | 290 | Trustee, SPDR Series Trust; Trustee, SPDR Index Shares Funds; Trustee, Select Sector SPDR Trust; Trustee, SSGA Active Trust; and Trustee, SSGA Master Trust. | |||||
| (1) | Mr. Ross is an Interested Trustee because of his employment by SSGA Funds Management, Inc., an affiliate of the Trust. |
Name, Address, | Position(s) Held | Term of Office | Principal Occupation | |||
Officers: | ||||||
Ellen M. Needham SSGA Funds Management, Inc. State Street Financial Center One Lincoln Street Boston, MA 02111 | President | Term: Indefinite Elected: 10/12 | President and Director, SSGA Funds Management, Inc. (June 2012 – present); Chief Operating Officer, SSGA Funds Management, Inc. (May 2010 – June 2012); Senior Managing Director, SSGA Funds Management, Inc. (1992 – 2012) and Senior Managing Director, State Street Global Advisors (1992 – present).* | |||
Bruce S. Rosenberg SSGA Funds Management, Inc. State Street Financial Center One Lincoln Street Boston, MA 02111 | Treasurer | Term: Indefinite Elected: 2/16 | Managing Director, State Street Global Advisors and SSGA Funds Management, Inc. (July 2015 – present); Director, Credit Suisse (April 2008 – July 2015). | |||
Ann M. Carpenter SSGA Funds Management, Inc. State Street Financial Center One Lincoln Street Boston, MA 02111 | Vice President Deputy Treasurer | Term: Indefinite Elected: 10/12 Elected: 2/16 | Chief Operating Officer, SSGA Funds Management, Inc. (April 2014 – present); Vice President, State Street Global Advisors and SSGA Funds Management, Inc. (2005 – present).* | |||
Chad C. Hallett SSGA Funds Management, Inc. State Street Financial Center One Lincoln Street Boston, MA 02111 | Deputy Treasurer | Term: Indefinite Elected: 2/16 | Vice President, State Street Global Advisors and SSGA Funds Management, Inc. (November 2014 – present); Vice President, State Street Bank and Trust Company (2001 – November 2014).* |
18
Table of Contents
State Street Institutional Investment Trust
State Street U.S. Government Money Market Fund
Disclosure of Information about Fund Trustees and Officers — (continued)
December 31, 2015 (Unaudited)
Name, Address, | Position(s) Held | Term of Office | Principal Occupation | |||
Officers: (continued) | ||||||
Sujata Upreti SSGA Funds Management, Inc. State Street Financial Center One Lincoln Street Boston, MA 02111 | Assistant Treasurer | Term: Indefinite Elected: 2/16 | Vice President, State Street Global Advisors and SSGA Funds Management, Inc. (May 2015 – present); Assistant Director, Cambridge Associates, LLC (July 2014 – January 2015); Vice President, Bank of New York Mellon (July 2012 – August 2013); Manager, PricewaterhouseCoopers, LLP (September 2009 – July 2012). | |||
Daniel Foley SSGA Funds Management, Inc. State Street Financial Center One Lincoln Street Boston, MA 02111 | Assistant Treasurer | Term: Indefinite Elected: 2/16 | Vice President, State Street Global Advisors and SSGA Funds Management, Inc. (April 2014 – present); Principal, State Street Global Advisors and SSGA Funds Management, Inc. (April 2007 – April 2014). | |||
Brian Harris SSGA Funds Management, Inc. State Street Financial Center One Lincoln Street Boston, MA 02111 | Chief Compliance Officer | Term: Indefinite Elected: 11/13 | Vice President, State Street Global Advisors and SSGA Funds Management, Inc. (June 2013 – Present); Senior Vice President and Global Head of Investment Compliance, BofA Global Capital Management (September 2010 to May 2013); Director of Compliance, AARP Financial Inc. (July 2008 to August 2010). | |||
Trevor Swanberg SSGA Funds Management, Inc. State Street Financial Center One Lincoln Street Boston, MA 02111 | Code of Ethics Compliance Officer | Term: Indefinite Elected: 8/15 | Vice President, State Street Global Advisors and SSGA Funds Management, Inc. (January 2015 – Present); Senior Manager – Mutual Fund Compliance, ICMA – Retirement Corporation (December 2011 – January 2015); Assistant Vice President, J.P. Morgan (September 2007 – December 2011). | |||
Joshua A. Weinberg SSGA Funds Management, Inc. State Street Financial Center One Lincoln Street Boston, MA 02111 | Chief Legal Officer | Term: Indefinite Elected: 2/15 | Vice President and Managing Counsel, State Street Global Advisors (2011 – present); Clerk, SSGA Funds Management, Inc. (2013 – present); Associate, Financial Services Group, Dechert LLP (2006 – 2011). | |||
David K. James State Street Bank and Trust Company 100 Huntington Avenue, 3rd Floor Boston, MA 02116 | Secretary | Term: Indefinite Elected: 4/13 | Managing Director and Managing Counsel, State Street Bank and Trust Company (2009 – present); Vice President and Counsel, PNC Global Investment Servicing (US), Inc. (2006 – 2009). | |||
Kristin Schantz State Street Bank and Trust Company 100 Huntington Avenue, 3rd Floor Boston, MA 02116 | Assistant Secretary | Term: Indefinite Elected: 2/14 | Vice President and Counsel, State Street Bank and Trust Company (2013 – present); Vice President, Citi Fund Services Ohio, Inc. (2008 – 2013). |
| * | Served in various capacities and/or with various affiliated entities during noted time period. |
19
Table of Contents
Trustees
William L. Boyan
Michael F. Holland
William L. Marshall
Patrick J. Riley
James E. Ross
Richard D. Shirk
Rina K. Spence
Bruce D. Taber
Douglas T. Williams
Investment Adviser and Administrator
SSGA Funds Management, Inc.
State Street Financial Center
One Lincoln Street
Boston, MA 02111
Custodian and Sub-Administrator
State Street Bank and Trust Company
State Street Financial Center
One Lincoln Street
Boston, MA 02111
Independent Registered Public Accounting Firm
Ernst & Young LLP
200 Clarendon Street
Boston, MA 02116
Legal Counsel
Ropes & Gray LLP
800 Boylston Street
Boston, MA 02199
Transfer Agent
Boston Financial Data Services
2000 Crown Colony Drive
Quincy, MA 02169
Distributor
State Street Global Markets LLC
State Street Financial Center
One Lincoln Street
Boston, MA 02111
This report is for shareholder information. This is not a prospectus intended for use in the purchase or sale of shares of beneficial interest.
State Street Institutional Investment Trust State Street Bank and Trust Company P.O. Box 5049 Boston, MA 02206 |
Table of Contents
[THIS PAGE INTENTIONALLY LEFT BLANK]
Table of Contents
[THIS PAGE INTENTIONALLY LEFT BLANK]
Table of Contents
Annual Report
31 December 2015
State Street Master Funds
State Street U.S. Government Money Market Portfolio
Table of Contents
State Street Master Funds
State Street U.S. Government Money Market Portfolio
Annual Report
December 31, 2015
Table of Contents
| 25 | ||||
| 26 | ||||
| 30 | ||||
| 31 | ||||
| 32 | ||||
| 33 | ||||
| 34 | ||||
| 39 | ||||
| 40 | ||||
| 41 | ||||
Disclosure of Information about Portfolio Trustees and Officers | 42 | |||
Table of Contents
State Street Master Funds
State Street U.S. Government Money Market Portfolio
Portfolio Statistics (Unaudited)
Portfolio Composition* | December 31, 2015 | |||
Government Agency Debt | 64.0 | % | ||
Treasury Repurchase Agreements | 14.7 | |||
Treasury Debt | 12.5 | |||
Government Agency Repurchase Agreement | 1.2 | |||
Other Assets in Excess of Liabilities | 7.6 | |||
Total | 100.0 | % |
Maturity Ladder* | December 31, 2015 | |||
Overnight (1 Day) | 16.8 | % | ||
2-30 Days | 33.2 | |||
31-60 Days | 15.2 | |||
61-90 Days | 11.2 | |||
Over 90 Days | 16.0 | |||
Total | 92.4 | % | ||
Average days to maturity | 25 | |||
Weighted average life | 63 |
| * | As a percentage of net assets as of the date indicated. The Portfolio’s composition will vary over time. |
See Notes to Financial Statements.
25
Table of Contents
State Street Master Funds
State Street U.S. Government Money Market Portfolio
December 31, 2015
Name of Issuer | Interest Rate | Next Payment/ Reset Date | Maturity Date | Principal Amount | Value | |||||||||||||||
| GOVERNMENT AGENCY DEBT – 64.0% | ||||||||||||||||||||
Federal Farm Credit Bank(a) | 0.221 | % | 01/05/2016 | 01/05/2016 | $ | 70,000,000 | $ | 70,000,000 | ||||||||||||
Federal Farm Credit Bank(a) | 0.271 | % | 01/11/2016 | 01/11/2016 | 73,000,000 | 73,000,000 | ||||||||||||||
Federal Farm Credit Bank(a) | 0.092 | % | 01/19/2016 | 01/19/2016 | 35,100,000 | 35,098,421 | ||||||||||||||
Federal Farm Credit Bank(a) | 0.184 | % | 01/21/2016 | 01/21/2016 | 12,800,000 | 12,798,720 | ||||||||||||||
Federal Farm Credit Bank(a) | 0.183 | % | 01/25/2016 | 01/25/2016 | 14,300,000 | 14,298,284 | ||||||||||||||
Federal Farm Credit Bank(a) | 0.183 | % | 01/28/2016 | 01/28/2016 | 23,900,000 | 23,896,774 | ||||||||||||||
Federal Farm Credit Bank(b) | 0.320 | % | 01/18/2016 | 02/18/2016 | 86,000,000 | 85,999,001 | ||||||||||||||
Federal Farm Credit Bank(b) | 0.277 | % | 01/11/2016 | 09/09/2016 | 47,600,000 | 47,600,473 | ||||||||||||||
Federal Farm Credit Bank(b) | 0.412 | % | 01/26/2016 | 10/26/2016 | 79,500,000 | 79,500,000 | ||||||||||||||
Federal Home Loan Bank(a) | 0.108 | % | 01/04/2016 | 01/04/2016 | 124,300,000 | 124,298,912 | ||||||||||||||
Federal Home Loan Bank(a) | 0.098 | % | 01/05/2016 | 01/05/2016 | 79,200,000 | 79,199,164 | ||||||||||||||
Federal Home Loan Bank(a) | 0.113 | % | 01/06/2016 | 01/06/2016 | 38,000,000 | 37,999,415 | ||||||||||||||
Federal Home Loan Bank(a) | 0.114 | % | 01/06/2016 | 01/06/2016 | 551,000,000 | 550,991,510 | ||||||||||||||
Federal Home Loan Bank(a) | 0.133 | % | 01/08/2016 | 01/08/2016 | 482,000,000 | 481,989,691 | ||||||||||||||
Federal Home Loan Bank(a) | 0.114 | % | 01/13/2016 | 01/13/2016 | 500,000,000 | 499,981,472 | ||||||||||||||
Federal Home Loan Bank(a) | 0.115 | % | 01/13/2016 | 01/13/2016 | 100,000,000 | 99,996,294 | ||||||||||||||
Federal Home Loan Bank(a) | 0.118 | % | 01/15/2016 | 01/15/2016 | 342,000,000 | 341,984,555 | ||||||||||||||
Federal Home Loan Bank(a) | 0.123 | % | 01/15/2016 | 01/15/2016 | 100,000,000 | 99,995,484 | ||||||||||||||
Federal Home Loan Bank(a) | 0.402 | % | 01/25/2016 | 01/25/2016 | 114,000,000 | 114,000,000 | ||||||||||||||
Federal Home Loan Bank(a) | 0.126 | % | 01/27/2016 | 01/27/2016 | 268,000,000 | 267,976,193 | ||||||||||||||
Federal Home Loan Bank(a) | 0.148 | % | 01/28/2016 | 01/28/2016 | 118,000,000 | 117,987,167 | ||||||||||||||
Federal Home Loan Bank(a) | 0.143 | % | 01/29/2016 | 01/29/2016 | 150,000,000 | 149,983,667 | ||||||||||||||
Federal Home Loan Bank(a) | 0.148 | % | 02/03/2016 | 02/03/2016 | 200,000,000 | 199,973,417 | ||||||||||||||
Federal Home Loan Bank(a) | 0.170 | % | 02/05/2016 | 02/05/2016 | 250,000,000 | 249,959,653 | ||||||||||||||
Federal Home Loan Bank(a) | 0.276 | % | 02/24/2016 | 02/24/2016 | 50,000,000 | 49,979,750 | ||||||||||||||
Federal Home Loan Bank(a) | 0.486 | % | 03/11/2016 | 03/11/2016 | 75,000,000 | 74,930,000 | ||||||||||||||
Federal Home Loan Bank(a) | 0.354 | % | 03/23/2016 | 03/23/2016 | 234,510,000 | 234,323,043 | ||||||||||||||
Federal Home Loan Bank(a) | 0.403 | % | 03/23/2016 | 03/23/2016 | 100,000,000 | 99,909,344 | ||||||||||||||
Federal Home Loan Bank(a) | 0.385 | % | 04/01/2016 | 04/01/2016 | 162,500,000 | 162,349,056 | ||||||||||||||
Federal Home Loan Bank(b) | 0.368 | % | 01/25/2016 | 06/24/2016 | 235,000,000 | 235,000,000 | ||||||||||||||
Federal Home Loan Bank(b) | 0.226 | % | 01/08/2016 | 07/08/2016 | 110,000,000 | 110,000,000 | ||||||||||||||
Federal Home Loan Bank(b) | 0.281 | % | 01/15/2016 | 07/15/2016 | 176,000,000 | 176,000,000 | ||||||||||||||
Federal Home Loan Bank(b) | 0.262 | % | 01/12/2016 | 08/12/2016 | 224,000,000 | 224,000,000 | ||||||||||||||
Federal Home Loan Bank(b) | 0.392 | % | 01/20/2016 | 09/20/2016 | 119,100,000 | 119,100,000 | ||||||||||||||
Federal Home Loan Mortgage Corp.(a) | 0.098 | % | 01/04/2016 | 01/04/2016 | 23,600,000 | 23,599,813 | ||||||||||||||
Federal Home Loan Mortgage Corp.(a) | 0.123 | % | 01/07/2016 | 01/07/2016 | 281,715,000 | 281,709,366 | ||||||||||||||
Federal Home Loan Mortgage Corp.(a) | 0.234 | % | 01/08/2016 | 01/08/2016 | 91,000,000 | 90,995,930 | ||||||||||||||
Federal Home Loan Mortgage Corp.(a) | 0.234 | % | 01/13/2016 | 01/13/2016 | 91,000,000 | 90,993,023 | ||||||||||||||
Federal Home Loan Mortgage Corp.(a) | 0.092 | % | 01/14/2016 | 01/14/2016 | 333,015,000 | 333,004,177 | ||||||||||||||
See accompanying notes to the financial statements.
26
Table of Contents
State Street Master Funds
State Street U.S. Government Money Market Portfolio
Schedule of Investments — (continued)
December 31, 2015
Name of Issuer | Interest Rate | Next Payment/ Reset Date | Maturity Date | Principal Amount | Value | |||||||||||||||
| GOVERNMENT AGENCY DEBT – (continued) | ||||||||||||||||||||
Federal Home Loan Mortgage Corp.(a) | 0.122 | % | 01/15/2016 | 01/15/2016 | $ | 58,600,000 | $ | 58,596,595 | ||||||||||||
Federal Home Loan Mortgage Corp.(a) | 0.163 | % | 01/15/2016 | 01/15/2016 | 163,000,000 | 162,990,528 | ||||||||||||||
Federal Home Loan Mortgage Corp.(a) | 0.092 | % | 01/20/2016 | 01/20/2016 | 355,897,000 | 355,879,978 | ||||||||||||||
Federal Home Loan Mortgage Corp.(a) | 0.102 | % | 01/20/2016 | 01/20/2016 | 23,600,000 | 23,598,871 | ||||||||||||||
Federal Home Loan Mortgage Corp.(a) | 0.100 | % | 01/21/2016 | 01/21/2016 | 25,000,000 | 24,998,639 | ||||||||||||||
Federal Home Loan Mortgage Corp.(a) | 0.072 | % | 01/25/2016 | 01/25/2016 | 23,800,000 | 23,798,889 | ||||||||||||||
Federal Home Loan Mortgage Corp.(a) | 0.179 | % | 02/09/2016 | 02/09/2016 | 116,000,000 | 115,978,008 | ||||||||||||||
Federal Home Loan Mortgage Corp.(a) | 0.138 | % | 02/11/2016 | 02/11/2016 | 123,400,000 | 123,381,027 | ||||||||||||||
Federal Home Loan Mortgage Corp.(a) | 0.200 | % | 02/17/2016 | 02/17/2016 | 205,300,000 | 205,246,394 | ||||||||||||||
Federal Home Loan Mortgage Corp.(a) | 0.224 | % | 02/23/2016 | 02/23/2016 | 24,567,000 | 24,559,043 | ||||||||||||||
Federal Home Loan Mortgage Corp.(a) | 0.275 | % | 02/26/2016 | 02/26/2016 | 262,700,000 | 262,590,075 | ||||||||||||||
Federal Home Loan Mortgage Corp.(a) | 0.152 | % | 03/04/2016 | 03/04/2016 | 93,000,000 | 92,975,587 | ||||||||||||||
Federal Home Loan Mortgage Corp.(a) | 0.435 | % | 03/08/2016 | 03/08/2016 | 148,000,000 | 147,881,559 | ||||||||||||||
Federal Home Loan Mortgage Corp.(a) | 0.232 | % | 03/09/2016 | 03/09/2016 | 328,400,000 | 328,257,328 | ||||||||||||||
Federal Home Loan Mortgage Corp.(a) | 0.283 | % | 03/14/2016 | 03/14/2016 | 162,700,000 | 162,607,623 | ||||||||||||||
Federal Home Loan Mortgage Corp.(a) | 0.458 | % | 04/11/2016 | 04/11/2016 | 148,000,000 | 147,813,150 | ||||||||||||||
Federal Home Loan Mortgage Corp.(a) | 0.519 | % | 04/26/2016 | 04/26/2016 | 150,000,000 | 149,753,500 | ||||||||||||||
Federal Home Loan Mortgage Corp.(b) | 0.296 | % | 01/18/2016 | 08/17/2016 | 126,500,000 | 126,500,000 | ||||||||||||||
Federal Home Loan Mortgage Corp.(b) | 0.373 | % | 01/25/2016 | 08/24/2016 | 136,000,000 | 136,000,000 | ||||||||||||||
Federal Home Loan Mortgage Corp.(b) | 0.365 | % | 01/20/2016 | 04/20/2017 | 100,000,000 | 99,980,097 | ||||||||||||||
Federal National Mortgage Assoc.(a) | 0.092 | % | 01/06/2016 | 01/06/2016 | 140,833,000 | 140,831,240 | ||||||||||||||
Federal National Mortgage Assoc.(a) | 0.091 | % | 01/08/2016 | 01/08/2016 | 96,600,000 | 96,598,309 | ||||||||||||||
Federal National Mortgage Assoc.(a) | 0.080 | % | 01/13/2016 | 01/13/2016 | 50,800,000 | 50,798,679 | ||||||||||||||
Federal National Mortgage Assoc.(a) | 0.082 | % | 01/20/2016 | 01/20/2016 | 104,000,000 | 103,995,609 | ||||||||||||||
Federal National Mortgage Assoc.(a) | 0.061 | % | 01/27/2016 | 01/27/2016 | 23,400,000 | 23,398,986 | ||||||||||||||
Federal National Mortgage Assoc.(a) | 0.374 | % | 02/02/2016 | 02/02/2016 | 100,000,000 | 99,968,000 | ||||||||||||||
Federal National Mortgage Assoc.(a) | 0.066 | % | 02/03/2016 | 02/03/2016 | 38,500,000 | 38,497,706 | ||||||||||||||
Federal National Mortgage Assoc.(a) | 0.153 | % | 02/17/2016 | 02/17/2016 | 61,238,000 | 61,226,008 | ||||||||||||||
Federal National Mortgage Assoc.(a) | 0.224 | % | 02/22/2016 | 02/22/2016 | 7,000,000 | 6,997,776 | ||||||||||||||
Federal National Mortgage Assoc.(a) | 0.205 | % | 02/24/2016 | 02/24/2016 | 94,000,000 | 93,971,800 | ||||||||||||||
Federal National Mortgage Assoc.(a) | 0.273 | % | 03/02/2016 | 03/02/2016 | 128,000,000 | 127,941,440 | ||||||||||||||
Federal National Mortgage Assoc.(a) | 0.435 | % | 03/09/2016 | 03/09/2016 | 155,749,000 | 155,622,497 | ||||||||||||||
Federal National Mortgage Assoc.(a) | 0.405 | % | 03/16/2016 | 03/16/2016 | 108,000,000 | 107,910,000 | ||||||||||||||
Federal National Mortgage Assoc.(a) | 0.339 | % | 03/30/2016 | 03/30/2016 | 55,000,000 | 54,954,449 | ||||||||||||||
Federal National Mortgage Assoc.(a) | 0.388 | % | 04/06/2016 | 04/06/2016 | 150,000,000 | 149,848,000 | ||||||||||||||
|
| |||||||||||||||||||
TOTAL GOVERNMENT AGENCY DEBT |
| 10,250,349,159 | ||||||||||||||||||
|
| |||||||||||||||||||
See accompanying notes to the financial statements.
27
Table of Contents
State Street Master Funds
State Street U.S. Government Money Market Portfolio
Schedule of Investments — (continued)
December 31, 2015
Name of Issuer | Interest Rate | Next Payment/ Reset Date | Maturity Date | Principal Amount | Value | |||||||||||||||
| TREASURY DEBT – 12.5% | ||||||||||||||||||||
U.S. Treasury Bill(a) | 0.050 | % | 01/07/2016 | 01/07/2016 | $ | 241,000,000 | $ | 240,997,992 | ||||||||||||
U.S. Treasury Bill(a) | 0.055 | % | 01/07/2016 | 01/07/2016 | 64,000,000 | 63,999,413 | ||||||||||||||
U.S. Treasury Bill(a) | 0.060 | % | 01/07/2016 | 01/07/2016 | 53,000,000 | 52,999,461 | ||||||||||||||
U.S. Treasury Bill(a) | 0.060 | % | 01/07/2016 | 01/07/2016 | 29,000,000 | 28,999,710 | ||||||||||||||
U.S. Treasury Bill(a) | 0.115 | % | 02/04/2016 | 02/04/2016 | 217,700,000 | 217,676,355 | ||||||||||||||
U.S. Treasury Bill(a) | 0.118 | % | 02/04/2016 | 02/04/2016 | 32,300,000 | 32,296,416 | ||||||||||||||
U.S. Treasury Bill(a) | 0.135 | % | 02/11/2016 | 02/11/2016 | 175,000,000 | 174,973,094 | ||||||||||||||
U.S. Treasury Bill(a) | 0.145 | % | 02/18/2016 | 02/18/2016 | 50,000,000 | 49,990,333 | ||||||||||||||
U.S. Treasury Bill(a) | 0.280 | % | 03/17/2016 | 03/17/2016 | 200,000,000 | 199,881,778 | ||||||||||||||
U.S. Treasury Note(b) | 0.305 | % | 01/01/2016 | 01/31/2016 | 143,000,000 | 142,997,138 | ||||||||||||||
U.S. Treasury Note(a) | 0.303 | % | 02/29/2016 | 02/29/2016 | 200,000,000 | 199,982,654 | ||||||||||||||
U.S. Treasury Note(b) | 0.329 | % | 01/01/2016 | 04/30/2016 | 36,350,000 | 36,350,182 | ||||||||||||||
U.S. Treasury Note(b) | 0.313 | % | 01/01/2016 | 10/31/2016 | 82,000,000 | 81,975,759 | ||||||||||||||
U.S. Treasury Note(b) | 0.334 | % | 01/01/2016 | 04/30/2017 | 131,000,000 | 131,000,598 | ||||||||||||||
U.S. Treasury Note(b) | 0.337 | % | 01/01/2016 | 07/31/2017 | 206,000,000 | 205,902,590 | ||||||||||||||
U.S. Treasury Note(b) | 0.428 | % | 01/01/2016 | 10/31/2017 | 150,000,000 | 149,722,800 | ||||||||||||||
|
| |||||||||||||||||||
TOTAL TREASURY DEBT |
| 2,009,746,273 | ||||||||||||||||||
|
| |||||||||||||||||||
| GOVERNMENT AGENCY REPURCHASE AGREEMENTS – 1.2% | ||||||||||||||||||||
Agreement with Citigroup Global Markets, Inc. and Bank of New York Mellon (Tri-Party), dated 12/28/2015 (collateralized by Federal Home Loan Banks, 0.000% – 2.000% due 09/09/2016 – 10/21/2022, Federal Home Loan Mortgage Corporations, 1.000% – 6.250% due 03/08/2017 – 07/15/2032, Federal National Mortgage Associations, 0.875% – 2.200% due 10/26/2017 –10/25/2022, Federal National Mortgage Associations Principal Strips, 0.000% –5.250% due 12/28/2016 – 05/15/2030, Residual Funding Corporations Principal Strips, 0.000% due 01/15/2030 –04/15/2030, and a Tennessee Valley Authority, 0.000% due 11/01/2025, valued at $204,000,941); expected proceeds $200,012,444 | 0.320 | % | 01/04/2016 | 01/04/2016 | 200,000,000 | 200,000,000 | ||||||||||||||
|
| |||||||||||||||||||
See accompanying notes to the financial statements.
28
Table of Contents
State Street Master Funds
State Street U.S. Government Money Market Portfolio
Schedule of Investments — (continued)
December 31, 2015
Name of Issuer | Interest Rate | Next Payment/ Reset Date | Maturity Date | Principal Amount | Value | |||||||||||||||
| TREASURY REPURCHASE AGREEMENTS – 14.7% | ||||||||||||||||||||
Agreement with Federal Reserve Bank of New York and Bank of New York Mellon (Tri-Party), dated 12/31/2015 (collateralized by U.S. Treasury Bonds, 3.125% – 8.000% due 11/15/2021 –02/15/2043, and U.S. Treasury Notes, 1.375% – 3.500% due 02/28/2019 –05/15/2020, valued at $2,225,061,871); expected proceeds $2,225,061,806 | 0.250 | % | 01/04/2016 | 01/04/2016 | $ | 2,225,000,000 | $ | 2,225,000,000 | ||||||||||||
Agreement with Mitsubishi UFJ Securities Co., Ltd. and Bank of New York Mellon (Tri-Party), dated 12/31/2015 (collateralized by a U.S. Treasury Bonds, 2.000% due 11/30/2022, and U.S. Treasury Notes, 0.625% – 2.500% due 12/31/2018 – 11/15/2025, valued at $127,504,277); expected proceeds $125,004,167 | 0.300 | % | 01/04/2016 | 01/04/2016 | 125,000,000 | 125,000,000 | ||||||||||||||
|
| |||||||||||||||||||
TOTAL TREASURY REPURCHASE AGREEMENTS |
| 2,350,000,000 | ||||||||||||||||||
|
| |||||||||||||||||||
TOTAL INVESTMENTS(c)(d) – 92.4% |
| 14,810,095,432 | ||||||||||||||||||
Other Assets in Excess of Liabilities – 7.6% |
| 1,213,395,159 | ||||||||||||||||||
|
| |||||||||||||||||||
NET ASSETS – 100.0% |
| $ | 16,023,490,591 | |||||||||||||||||
|
| |||||||||||||||||||
| (a) | Rate represents annualized yield at date of purchase |
| (b) | Variable Rate Security – Interest rate shown is rate in effect at December 31, 2015. |
| (c) | Unless otherwise indicated, the values of the securities of the Portfolio are determined based on Level 2 inputs established by provisions surrounding fair value measurements and disclosures. (Note 2) |
| (d) | Also represents the cost for federal tax purposes |
See accompanying notes to the financial statements.
29
Table of Contents
State Street Master Funds
State Street U.S. Government Money Market Portfolio
Statement of Assets and Liabilities
December 31, 2015
Assets | ||||
Investments at value and amortized cost (Note 2) | $ | 12,260,095,432 | ||
Repurchase Agreements, at value and cost (Note 2) | 2,550,000,000 | |||
|
| |||
Total Investments | 14,810,095,432 | |||
Cash | 1,375,985,680 | |||
Interest receivable | 752,063 | |||
Prepaid expenses and other assets | 19,149 | |||
|
| |||
Total assets | 16,186,852,324 | |||
Liabilities | ||||
Investment securities purchased | 162,349,056 | |||
Management fee payable (Note 3) | 614,461 | |||
Administration and custody fees payable (Note 3) | 354,578 | |||
Professional fees payable | 29,951 | |||
Accrued expenses and other liabilities | 13,687 | |||
|
| |||
Total liabilities | 163,361,733 | |||
|
| |||
Net Assets | $ | 16,023,490,591 | ||
|
|
See accompanying notes to financial statements.
30
Table of Contents
State Street Master Funds
State Street U.S. Government Money Market Portfolio
Year Ended December 31, 2015
Investment Income | ||||
Interest | $ | 13,458,047 | ||
|
| |||
Expenses | ||||
Management fees (Note 3) | 6,773,799 | |||
Administration and custody fees (Note 3) | 1,716,481 | |||
Trustees’ fees (Note 4) | 201,692 | |||
Professional fees | 105,193 | |||
Printing fees | 7,096 | |||
Other expenses | 117,259 | |||
|
| |||
Total expenses | 8,921,520 | |||
|
| |||
Net Investment Income | $ | 4,536,527 | ||
|
| |||
Realized Gain | ||||
Net realized gain on investments | 106,964 | |||
|
| |||
Net Increase in Net Assets Resulting from Operations | $ | 4,643,491 | ||
|
|
See accompanying notes to financial statements.
31
Table of Contents
State Street Master Funds
State Street U.S. Government Money Market Portfolio
Statements of Changes in Net Assets
| Year Ended December 31, 2015 | Year Ended December 31, 2014 | |||||||
Increase (Decrease) in Net Assets From Operations: | ||||||||
Net investment income | $ | 4,536,527 | $ | 892,563 | ||||
Net realized gain on investments | 106,964 | 13,831 | ||||||
|
|
|
| |||||
Net increase in net assets from operations | 4,643,491 | 906,394 | ||||||
|
|
|
| |||||
Capital Transactions: | ||||||||
Contributions | 30,186,959,859 | 29,375,563,089 | ||||||
Withdrawals | (27,375,980,364 | ) | (24,881,521,721 | ) | ||||
|
|
|
| |||||
Net increase in net assets from capital transactions | 2,810,979,495 | 4,494,041,368 | ||||||
|
|
|
| |||||
Net Increase in Net Assets | 2,815,622,986 | 4,494,947,762 | ||||||
Net Assets | ||||||||
Beginning of year | 13,207,867,605 | 8,712,919,843 | ||||||
|
|
|
| |||||
End of year | $ | 16,023,490,591 | $ | 13,207,867,605 | ||||
|
|
|
| |||||
See accompanying notes to financial statements.
32
Table of Contents
State Street Master Funds
State Street U.S. Government Money Market Portfolio
| Ratios to Average Net Assets | Net Assets End of Year (000s Omitted) | |||||||||||||||||||
Year Ended December 31, | Total Return(a) | Gross Operating Expenses | Net Operating Expenses | Net Investment Income | ||||||||||||||||
2015 | 0.03 | % | 0.07 | % | 0.07 | % | 0.03 | % | $ | 16,023,491 | ||||||||||
2014 | 0.01 | % | 0.07 | % | 0.07 | % | 0.01 | % | $ | 13,207,868 | ||||||||||
2013 | 0.03 | % | 0.07 | % | 0.07 | % | 0.03 | % | $ | 8,712,920 | ||||||||||
2012 | 0.08 | % | 0.07 | % | 0.07 | % | 0.08 | % | $ | 8,621,186 | ||||||||||
2011 | 0.04 | % | 0.07 | % | 0.07 | % | 0.04 | %(b) | $ | 5,779,444 | ||||||||||
| (a) | Results represent past performance and are not indicative of future results. |
| (b) | Results reflect the effect of expense waivers. Without these waivers, net investment income would have been lower. |
See accompanying notes to financial statements.
33
Table of Contents
State Street Master Funds
State Street U.S. Government Money Market Portfolio
December 31, 2015
| 1. | Organization |
The State Street Master Funds (the “Trust”) is registered under the Investment Company Act of 1940, as amended (the “1940 Act”), as an open-end management investment company, and was organized as a business trust under the laws of the Commonwealth of Massachusetts on July 27, 1999. The Trust comprises five investment portfolios: State Street Equity 500 Index Portfolio, State Street Money Market Portfolio, State Street U.S. Government Money Market Portfolio, State Street Treasury Money Market Portfolio and State Street Treasury Plus Money Market Portfolio. Information presented in these financial statements pertains only to State Street U.S. Government Money Market Portfolio (the “Portfolio”). The Portfolio commenced operations on October 17, 2007.
The Portfolio is authorized to issue an unlimited number of non-transferable beneficial interests.
The Portfolio’s investment objective is to seek to maximize current income, to the extent consistent with the preservation of capital and liquidity and the maintenance of a stable $1.00 per share net asset value.
Under the Trust’s organizational documents, its officers and trustees are indemnified against certain liabilities arising out of the performance of their duties to the Trust. Additionally, in the normal course of business, the Trust enters into contracts with service providers that contain general indemnification clauses. The Trust’s maximum exposure under these arrangements is unknown as this could involve future claims that may be made against the Trust that have not yet occurred.
| 2. | Summary of Significant Accounting Policies |
The following is a summary of significant accounting policies followed by the Trust in the preparation of its financial statements:
The preparation of financial statements in accordance with U.S. generally accepted accounting principles (“U.S. GAAP”) requires management to make estimates and assumptions that affect the reported amounts and disclosures in the financial statements. Actual results could differ from those estimates. The Portfolio is an investment company under U.S. GAAP and follows the accounting and reporting guidance applicable to investment companies in Financial Accounting Standards Board (“FASB”) Accounting Standards Codification (“ASC”) 946, Financial Services Investment Companies (“ASC 946”).
Security Valuation – The Portfolio’s securities are recorded on the basis of amortized cost which approximates fair value as permitted by Rule 2a-7 under the 1940 Act. This method values a security at its cost on the date of purchase and, thereafter, assumes a constant amortization to maturity of any premiums or accretion of any discounts. The Portfolio may value securities for which market quotations are not readily available at “fair value,” as determined in good faith pursuant to procedures established by the Board of Trustees of the Trust (the “Board”). The Board has adopted procedures concerning securities valuation, under which an Oversight Committee (the “Committee”) makes determinations as to whether market quotations are not readily available or do not otherwise accurately reflect the fair value of the security. The Committee, or a subgroup thereof, subject to oversight by the Board, may use fair value pricing in a variety of circumstances, including but not limited to, situations when trading in a security has been suspended or halted. If amortized cost is determined not to approximate fair value, the value of the portfolio securities will be determined under procedures established by and under the
34
Table of Contents
State Street Master Funds
State Street U.S. Government Money Market Portfolio
Notes to Financial Statements — (continued)
December 31, 2015
general supervision of the Committee. The Committee will assist in overseeing the comparison of amortized cost to market-based value. Fair value pricing involves subjective judgments and it is possible that the fair value determination for a security is materially different than the value that could be received on the sale of the security.
Because of the inherent uncertainties of valuation and under certain market conditions, the values reflected in the financial statements may differ from the value received upon actual sale of those investments and it is possible that the differences could be material.
The Portfolio values its assets and liabilities at fair value using a hierarchy that prioritizes the inputs to valuation techniques giving the highest priority to readily available unadjusted quoted prices in active markets for identical assets or liabilities (Level 1 measurements) and the lowest priority to unobservable inputs (Level 3 measurements) when market prices are not readily available or reliable. The categorization of a value determined for an investment within the hierarchy is based upon the pricing transparency of the investment and is not necessarily an indication of the risk associated with investing in it.
The three levels of the fair value hierarchy are as follows:
| • | Level 1 – Unadjusted quoted prices in active markets for identical assets or liabilities; |
| • | Level 2 – Inputs other than quoted prices included within Level 1 that are observable for the asset or liability either directly or indirectly, including quoted prices for similar assets or liabilities in active markets, quoted prices for identical or similar assets or liabilities in markets that are not considered to be active, inputs other than quoted prices that are observable for the asset or liability (such as exchange rates, financing terms, interest rates, yield curves, volatilities, prepayment speeds, loss severities, credit risks and default rates) or other market-corroborated inputs; and |
| • | Level 3 – Unobservable inputs for the asset or liability, including the Committee’s assumptions used in determining the fair value of investments. |
Changes in valuation techniques may result in transfers in or out of an assigned level within the disclosure hierarchy. Transfers between different levels of the fair value hierarchy are recognized at the end of the reporting period. The Portfolios had no transfers between levels for the year ended December 31, 2015. Unless otherwise indicated on the Schedule of Investments, the values of the securities of the Fund are determined based on Level 2 inputs.
Investment Transactions and Income Recognition – Investment transactions are accounted for on trade date for financial reporting purposes. Interest income is recorded daily on an accrual basis and includes amortization of premium and accretion of discount on investments. Realized gains and losses from the sale or disposition of investments are determined using the identified cost method.
Expenses – Advisory fees and other expenses, which are directly identifiable to a specific portfolio, are applied to that portfolio within the Trust. Trustees’ fees and other expenses which cannot be attributed to a specific portfolio are allocated in such a manner as deemed equitable, taking into consideration the nature and type of expense and the relative net assets of the portfolios within the Trust.
35
Table of Contents
State Street Master Funds
State Street U.S. Government Money Market Portfolio
Notes to Financial Statements — (continued)
December 31, 2015
Repurchase Agreements – The Portfolio may enter into repurchase agreements under the terms of a master repurchase agreement. A repurchase agreement customarily obligates the seller at the time it sells securities to the Portfolio to repurchase the securities at a mutually agreed upon price and time. The total amount received by the Portfolio on repurchase is calculated to exceed the price paid by the Portfolio, reflecting an agreed-upon market rate of interest for the period of time to the settlement date, and is not necessarily related to the interest rate on the underlying securities. The underlying securities are ordinarily United States Government or Government Agency securities, but may consist of other securities. The value of the underlying securities, at the time of purchase and each subsequent business day, is required to be maintained at such a level that the value is equal to at least the principal amount of the repurchase price plus accrued interest. The use of repurchase agreements involves certain risks. Upon an event of default under the Master Repurchase Agreement, if the seller of securities under a repurchase agreement defaults on its obligation to repurchase the underlying securities (as a result of its bankruptcy or otherwise) the Portfolio will seek to dispose of such securities; this action could involve losses, costs or delays. In addition, the proceeds of any such disposition may be less than the amount the Portfolio is owed under the repurchase agreement. The Portfolio may enter into repurchase agreements maturing within a specified date with domestic dealers, banks and other financial institutions deemed to be creditworthy by SSGA FM, a subsidiary of State Street Corporation and an affiliate of State Street Bank and Trust Company (“State Street”).
Federal Income Taxes – The Portfolio is not required to pay federal income taxes on its net investment income and net capital gains because it is treated as a partnership for federal income tax purposes. All interest, gains and losses of the Portfolio are deemed to have been “passed through” to the Portfolio’s partners in proportion to their holdings in the Portfolio, regardless of whether such items have been distributed by the Portfolio. Each partner is responsible for tax liability based on its distributive share; therefore, no provision has been made for federal income taxes.
SSGA Funds Management, Inc. (“SSGA FM” or the “Adviser”) has reviewed the tax positions for open years as of December 31, 2015, and has determined that no provision for income tax is required in the Portfolio’s financial statements. The Portfolio’s federal tax returns for the past three years remain subject to examination by the Portfolio’s major tax jurisdictions, which include the United States of America and the Commonwealth of Massachusetts. The Portfolio recognizes interest and penalties, if any, related to tax liabilities as income tax expense in the Statement of Operations. No income tax returns are currently under examination. Management has analyzed tax laws and regulations and their applications to the Portfolio’s facts and circumstances and does not believe there are any uncertain tax positions that require recognition of a tax liability.
At December 31, 2015, the cost of investments for federal income tax purposes was substantially the same as the cost for financial reporting purposes.
| 3. | Related Party Fees |
The Trust has entered into an investment advisory agreement with the Adviser, under which the Adviser directs the investments of the Portfolio in accordance with its investment objectives, policies, and limitations. In compensation for the Adviser’s services as investment adviser, the Portfolio pays the Adviser a management fee at an annual rate of 0.05% of its average daily net assets.
36
Table of Contents
State Street Master Funds
State Street U.S. Government Money Market Portfolio
Notes to Financial Statements — (continued)
December 31, 2015
Effective June 1, 2015, SSGA FM serves as administrator and State Street serves as sub-administrator. A fee is paid by the Portfolio for the administration, sub-administration, custody and transfer agency services SSGA FM and State Street provide. The annual fee is accrued daily and payable monthly at the following fee rate:
| Asset Levels | Annual percentage of average aggregate monthly net assets | |
First $400 million | 0.03% | |
Next $15 billion | 0.02% | |
Thereafter | 0.01% | |
Minimum annual fee per Portfolio | $150,000 |
The minimum fee will be calculated by multiplying the minimum per fund fee by the number of portfolios within the Trust to arrive at the total minimum fee. The greater of the asset based fee or the minimum fee will be charged to the portfolios. SSGA FM and State Street each receive a portion of the fee.
Prior to June 1, 2015, State Street served as a administrator. The administration fees paid by the Portfolio were not changed as a result of the administrator and sub-administrator appointments as of June 1, 2015.
| 4. | Trustees’ Fees |
Independent Trustees are compensated on a calendar year basis. Any Trustee who is deemed to be an “interested person” (as defined in the 1940 Act) of the Trust does not receive compensation from the Trust for his or her service as a Trustee.
Each Independent Trustee receives for his or her services to the State Street Master Funds, State Street Institutional Investment Trust and SSGA Funds, a $141,500 annual base retainer in addition to $18,000 for each in-person meeting and $2,000 for each telephonic meeting from the Trust. The Co-Chairmen each receive an additional $44,000 annual retainer. The Independent Trustees are reimbursed for travel and other out-of-pocket expenses in connection with meeting attendance. Trustees’ fees and expenses are allocated among the Trusts and funds overseen by the Trustees in a manner deemed equitable taking into consideration the relative net assets of the funds, subject to a $15,000 minimum per fund. As of the date of this Shareholder Report, the Trustees were not paid pension or retirement benefits as part of the Trust’s expenses. However, the State Street Master Funds have, pursuant to an exemptive order from the SEC, implemented an optional deferred compensation plan by which the Independent Trustees may defer receipt of compensation and receive a return on the deferred amount determined with reference to the performance of shares of specified State Street Master Funds. As of the fiscal year ended December 31, 2015, none of the Independent Trustees participated in the optional deferred compensation program
The Trust’s officers are compensated by the Adviser and its affiliates.
37
Table of Contents
State Street Master Funds
State Street U.S. Government Money Market Portfolio
Notes to Financial Statements — (continued)
December 31, 2015
| 5. | Market, Credit and Counterparty Risk |
In the normal course of business, the Portfolio invests in securities and enters into transactions where risks exist due to fluctuations in the market (market risk) or failure of the other party to a transaction to perform (counterparty risk). The value of securities held by the Portfolio may decline in response to certain events, including those directly involving the companies whose securities are owned by the Portfolio; conditions affecting the general economy; overall market changes; local, regional or global political, social or economic instability; and currency and interest rate and price fluctuations (credit risk). Similar to credit risk, the Portfolio may be exposed to counterparty risk, or the risk that an entity with which the Portfolio has unsettled or open transactions may default. Financial assets, which potentially expose the Portfolio to credit and counterparty risks, consist principally of investments and cash due from counterparties. The extent of the Portfolio’s exposure to credit and counterparty risks in respect to these financial assets approximates their value as recorded in the Portfolio’s Statement of Assets and Liabilities, less any collateral held by the Portfolio.
| 6. | Rule Issuance |
On July 23, 2014, the U.S. Securities and Exchange Commission (“SEC”) adopted amendments to the governing rules for money market funds. The amendments require that, following a two-year implementation timeframe, institutional prime and institutional tax exempt money market funds adopt a floating net asset value. The rule changes also allow for certain liquidity-based redemption fees and gate, and include enhanced requirements for disclosure and stress testing. The degree to which a money market fund will be impacted by the rule amendments will depend upon the type of fund and type of investors (retail or institutional). At this time, management is evaluating the implications of these amendments and their impact to the Portfolio’s financial statements and accompanying notes.
| 7. | Subsequent Events |
Management has evaluated the impact of all subsequent events on the Portfolio through the date the financial statements were available to be issued and has determined that there were no subsequent events requiring adjustment or disclosure in the financial statements.
38
Table of Contents
Report of Independent Registered Public Accounting Firm
To the Board of Trustees and Owners of Beneficial Interest of
State Street Master Funds:
We have audited the accompanying statement of assets and liabilities, including the schedule of investments, of State Street U.S. Government Money Market Portfolio (one of the portfolios constituting State Street Master Funds) (the “Portfolio”) as of December 31, 2015, and the related statement of operations for the year then ended, the statements of changes in net assets for each of the two years in the period then ended, and the financial highlights for each of the five years in the period then ended. These financial statements and financial highlights are the responsibility of the Portfolio’s management. Our responsibility is to express an opinion on these financial statements and financial highlights based on our audits.
We conducted our audits in accordance with the standards of the Public Company Accounting Oversight Board (United States). Those standards require that we plan and perform the audit to obtain reasonable assurance about whether the financial statements and financial highlights are free of material misstatement. We were not engaged to perform an audit of the Portfolio’s internal control over financial reporting. Our audits included consideration of internal control over financial reporting as a basis for designing audit procedures that are appropriate in the circumstances, but not for the purpose of expressing an opinion on the effectiveness of the Portfolio’s internal control over financial reporting. Accordingly, we express no such opinion. An audit also includes examining, on a test basis, evidence supporting the amounts and disclosures in the financial statements and financial highlights, assessing the accounting principles used and significant estimates made by management, and evaluating the overall financial statement presentation. Our procedures included confirmation of securities owned as of December 31, 2015, by correspondence with the custodian and others or by other appropriate auditing procedures where replies from others were not received. We believe that our audits provide a reasonable basis for our opinion.
In our opinion, the financial statements and financial highlights referred to above present fairly, in all material respects, the financial position of State Street U.S. Government Money Market Portfolio (one of the portfolios constituting State Street Master Funds) at December 31, 2015, the results of its operations for the year then ended, the changes in its net assets for each of the two years in the period then ended, and the financial highlights for each of the five years in the period then ended, in conformity with U.S. generally accepted accounting principles.
Boston, Massachusetts
February 26, 2016
39
Table of Contents
State Street Master Funds
State Street U.S. Government Money Market Portfolio
December 31, 2015 (Unaudited)
SHAREHOLDER EXPENSE EXAMPLE
As a shareholder of a fund, you incur two types of costs: (1) transaction costs, and (2) ongoing costs, including advisory and administration fees, among others. This example is intended to help you understand your ongoing costs (in dollars) of investing in a fund and to compare these costs with the ongoing costs of investing in other mutual funds. It is based on an investment of $1,000 made at the beginning of the period shown and held for the entire period from July 1, 2015 to December 31, 2015.
The table below illustrates your Portfolio’s costs in two ways:
| • | Actual Expenses. This section helps you to estimate the actual expenses that you paid over the period. The “Ending Account Value” shown is derived from the Portfolio’s actual return, and the third column shows the dollar amount that would have been paid by an investor who started with $1,000 in the Portfolio. You may use the information here, together with the amount you invested, to estimate the expenses that you paid over the period. To do so, simply divide your account value by $1,000 (for example, an $8,600 account value divided by $1,000 = 8.6), then multiply the result by the number given for the Portfolio under the heading “Expenses Paid During Period.” |
| • | Hypothetical Example for Comparison Purposes. This section is intended to help you compare your Portfolio’s costs with those of other mutual funds. It assumes that the Portfolio had a yearly return of 5% before expenses, but that the expense ratio is unchanged. In this case, because the return used is not the Portfolio’s actual return, the results do not apply to your investment. The example is useful in making comparisons because the Securities and Exchange Commission requires all mutual funds to calculate expenses based on a 5% return. You can assess your Portfolio’s costs by comparing this hypothetical example with the hypothetical examples that appear in shareholder reports of other funds. |
Six Months Ended December 31, 2015
Beginning July 1, 2015 | Ending Account Value December 31, 2015 | Expenses Paid During Period * | ||||||||||
Based on Actual Portfolio Return | $ | 1,000.00 | $ | 1,000.20 | $ | 0.35 | ||||||
Based on Hypothetical (5% return before expenses) | $ | 1,000.00 | $ | 1,024.85 | $ | 0.36 | ||||||
| * | The calculations are based on expenses incurred in the most recent six month period of the Portfolio. The Portfolio’s annualized expense ratio for the six months ended December 31, 2015 was 0.07%. |
| The dollar amounts shown as “Expenses Paid” are equal to the annualized expense ratio multiplied by the average account value over the period, multiplied by 184/365 (the most recent six month period). |
40
Table of Contents
State Street Master Funds
State Street U.S. Government Money Market Portfolio
Shareholder Requests for Additional Information
December 31, 2015 (Unaudited)
Proxy Voting Policies and Procedures and Record
The Portfolio has adopted the proxy voting policies of the Adviser. A description of the policies and procedures that the Portfolio have adopted to determine how to vote proxies relating to portfolio securities are contained in the Portfolio’s Statement of Additional Information, which is available (i) without charge, upon request, by calling the Portfolio at 1-877-251-4083, (ii) on the U.S. Securities and Exchange Commission’s website at www.sec.gov, or (iii) at the U.S. Securities and Exchange Commission’s public reference room. Information on the operation of the public reference room may be obtained by calling 1-800-SEC-0330. Information regarding how the Portfolio voted proxies, if any, during the most recent 12-month period ended June 30 is available by August 31 of each year without charge (1) by calling 1-877-251-4083 (toll free), or (2) on the website of the Securities and Exchange Commission (“SEC”) at www.sec.gov.
Quarterly Portfolio Schedule
The Portfolio will file their complete schedules of investments with the U.S. Securities and Exchange Commission for the first and third quarters of each fiscal year on Form N-Q. For the second and fourth quarters, the complete schedules of investments are available in the Portfolio’s semi-annual and annual financial statements. The Portfolio’s Form N-Q is available (i) without charge, upon request, by calling the Portfolio at 1-877-251-4083, (ii) on the Securities and Exchange Commission’s website at www.sec.gov, or (iii) at the Securities and Exchange Commission’s public reference room. Information on the operation of the public reference room may be obtained by calling 1-800-SEC-0330.
Monthly Portfolio Schedule
The Portfolio files its monthly portfolio holdings with the U.S. Securities and Exchange Commission on Form N-MFP. The SEC delays the public availability of the information filed on Form N-MFP for 60 days after the end of the reporting period included in the filing. The Portfolio’s Form N-MFP is available (i) on the U.S. Securities and Exchange Commission’s website at www.sec.gov, or (ii) at the Securities and Exchange Commission’s public reference room.
41
Table of Contents
State Street Master Funds
State Street U.S. Government Money Market Portfolio
Disclosure of Information about Fund Trustees and Officers
December 31, 2015 (Unaudited)
Name, Address, | Position(s) Held | Term of Office | Principal Occupation | Number of Funds in Fund Complex Overseen by Trustee | Other Directorships | |||||
Independent Trustees | ||||||||||
Michael F. Holland State Street Bank and Trust Company 100 Huntington Avenue, CPH 0326 Boston, MA 02116 | Trustee and Co-Chairman of the Board | Term: Indefinite Elected: 7/99 | Chairman, Holland & Company L.L.C. (investment adviser) (1995 – present). | 75 | Director, the Holland Series Fund, Inc.; Director, The China Fund, Inc.; Director, The Taiwan Fund, Inc.; Director, Reaves Utility Income Fund, Inc.; and Director, Blackstone/GSO Loan Funds. | |||||
Patrick J. Riley State Street Bank and Trust Company 100 Huntington Avenue, CPH 0326 Boston, MA 02116 | Trustee and Co-Chairman of the Board | Term: Indefinite Elected: 1/14 | 2002 to May 2010, Associate Justice of the Superior Court, Commonwealth of Massachusetts; 1985 to 2002, Partner, Riley, Burke & Donahue, L.L.P. (law firm); 1998 to Present, Independent Director, State Street Global Advisers Ireland, Ltd. (investment company); 1998 to Present, Independent Director, SSGA Liquidity plc (formerly, SSGA Cash Management Fund plc); January 2009 to Present, Independent Director, SSGA Fixed Income plc; and January 2009 to Present, Independent Director, SSGA Qualified Funds PLC. | 75 | Board Director and Chairman, SPDR Europe 1PLC Board (2011 – Present); Board Director and Chairman, SPDR Europe II, PLC (2013 – Present). | |||||
William L. Boyan State Street Bank and Trust Company 100 Huntington Avenue, CPH 0326 Boston, MA 02116 | Trustee and Co-Chairman of the Valuation Committee | Term: Indefinite Elected: 7/99 | President and Chief Operations Officer, John Hancock Financial Services (1959 – 1999). Mr. Boyan retired in 1999. Chairman Emeritus, Children’s Hospital, Boston, MA (1984 – 2011); Former Trustee of Old Mutual South Africa Master Trust (investments) (1995 – 2008); Former Chairman, Boston Plan For Excellence, Boston Public Schools (1995 – 2010); Member of Advisory Board of Florida Atlantic University Lifelong Learning Society. | 75 | Former Trustee of Old Mutual South Africa Master Trust. | |||||
William L. Marshall State Street Bank and Trust Company 100 Huntington Avenue, CPH 0326 Boston, MA 02116 | Trustee and Co-Chairman of the Audit Committee | Term: Indefinite Elected: 1/14 | April 2011 to Present, Chairman (until April 2011, Chief Executive Officer and President), Wm. L. Marshall Associates, Inc., Wm. L. Marshall Companies, Inc. and the Marshall Financial Group, Inc. (a registered investment adviser and provider of financial and related consulting services); Certified Financial Planner; Member, Financial Planners Association; 2015 to present, Board Member, The Doylestown Health Foundation Board. | 75 | Marshall Financial Group, Inc. | |||||
42
Table of Contents
State Street Master Funds
State Street U.S. Government Money Market Portfolio
Disclosure of Information about Fund Trustees and Officers — (continued)
December 31, 2015 (Unaudited)
Name, Address, | Position(s) Held | Term of Office | Principal Occupation | Number of Funds in Fund Complex Overseen by Trustee | Other Directorships | |||||
Independent Trustees (continued) | ||||||||||
Richard D. Shirk State Street Bank and Trust Company 100 Huntington Avenue, CPH 0326 Boston, MA 02116 | Trustee and Co-Chairman of the Qualified Legal and Compliance Committee | Term: Indefinite Elected: 1/14 | March 2001 to April 2002, Chairman (1996 to March 2001, President and Chief Executive Officer), Cerulean Companies, Inc. (holding company) (Retired); 1992 to March 2001, President and Chief Executive Officer, Blue Cross Blue Shield of Georgia (health insurer, managed healthcare); 1998 to December 2008, Chairman, Board Member and December 2008 to Present, Investment Committee Member, Healthcare Georgia Foundation (private foundation); September 2002 to 2012, Lead Director and Board Member, Amerigroup Corp. (managed health care); 1999 to 2013, Board Member and (since 2001) Investment Committee Member, Woodruff Arts Center; and 2003 to 2009, Trustee, Gettysburg College. | 75 | Board member, AeroCare Holdings (privately held healthcare services company) (February 2003 – Present); Board member, Regenesis Biomedical (health care services) (April 2012 – Present); Chairman (January 2014 – Present). | |||||
Rina K. Spence State Street Bank and Trust Company 100 Huntington Avenue, CPH 0326 Boston, MA 02116 | Trustee and Co-Chairman of the Qualified Legal and Compliance Committee and Co-Chairman of the Governance Committee | Term: Indefinite Elected: 7/99 | President of SpenceCare International LLC (international healthcare consulting) (1999 – present); Chief Executive Officer, IEmily.com (health internet company) (2000 – 2001); Chief Executive Officer of Consensus Pharmaceutical, Inc. (1998 – 1999); Founder, President and Chief Executive Officer of Spence Center for Women’s Health (1994 – 1998); President and CEO Emerson Hospital (1984 – 1994); Trustee, Eastern Enterprise (utilities) (1988 – 2000); Director, Berkshire Life Insurance Company of America (1993 – 2009); Honorary Consul for Monaco in Boston (2015 – present). | 75 | ||||||
Bruce D. Taber State Street Bank and Trust Company 100 Huntington Avenue, CPH 0326 Boston, MA 02116 | Trustee and Co-Chairman of the Valuation Committee and Co-Chairman of the Governance Committee | Term: Indefinite Elected: 1/14 | 1999 to Present, Partner, Zenergy LLC (a technology company providing Computer Modeling and System Analysis to the General Electric Power Generation Division); Until December 2008, Independent Director, SSGA Cash Management Fund plc; Until December 2008, Independent Director, State Street Global Advisers Ireland, Ltd. (investment companies); and Until August 1994, President, Alonzo B. Reed, Inc., (a Boston architect-engineering firm). | 75 | ||||||
43
Table of Contents
State Street Master Funds
State Street U.S. Government Money Market Portfolio
Disclosure of Information about Fund Trustees and Officers — (continued)
December 31, 2015 (Unaudited)
Name, Address, | Position(s) Held | Term of Office | Principal Occupation | Number of Funds in Fund Complex Overseen by Trustee | Other Directorships | |||||
Independent Trustees (continued) | ||||||||||
Douglas T. Williams State Street Bank and Trust Company 100 Huntington Avenue, CPH 0326 Boston, MA 02116 | Trustee and Co-Chairman of the Audit Committee | Term: Indefinite Elected: 7/99 | President, Oakmont Homeowners Association; President, Mariner Sands Chapel; Executive Vice President and member of Executive Committee, Chase Manhattan Bank (1987 – 1999); President, Boston Stock Exchange Depository Trust Company, 1981 – 1982; Treasurer, Nantucket Educational Trust, (2002 – 2007). | 75 | ||||||
Interested Trustee(1) | ||||||||||
James E. Ross SSGA Funds Management, Inc. State Street Financial Center One Lincoln Street Boston, MA 02111 | Trustee | Term: Indefinite Elected Trustee: 2/07 | Chairman and Director, SSGA Funds Management, Inc. (2012 – present); President, SSGA Funds Management, Inc. (2005 – 2012); Executive Vice President and Senior Managing Director, State Street Global Advisors (2006 –present); and Principal, State Street Global Advisors (2006 – present). | 290 | Trustee, SPDR Series Trust; Trustee, SPDR Index Shares Funds; Trustee, Select Sector SPDR Trust; Trustee, SSGA Active Trust; and Trustee, SSGA Master Trust. | |||||
| (1) | Mr. Ross is an Interested Trustee because of his employment by SSGA Funds Management, Inc., an affiliate of the Trust. |
Name, Address, | Position(s) Held | Term of Office | Principal Occupation | |||
Officers: | ||||||
Ellen M. Needham SSGA Funds Management, Inc. State Street Financial Center One Lincoln Street Boston, MA 02111 | President | Term: Indefinite Elected: 10/12 | President and Director, SSGA Funds Management, Inc. (June 2012 – present); Chief Operating Officer, SSGA Funds Management, Inc. (May 2010 – June 2012); Senior Managing Director, SSGA Funds Management, Inc. (1992 – 2012) and Senior Managing Director, State Street Global Advisors (1992 – present).* | |||
Bruce S. Rosenberg SSGA Funds Management, Inc. State Street Financial Center One Lincoln Street Boston, MA 02111 | Treasurer | Term: Indefinite Elected: 2/16 | Managing Director, State Street Global Advisors and SSGA Funds Management, Inc. (July 2015 – present); Director, Credit Suisse (April 2008 – July 2015). | |||
Ann M. Carpenter SSGA Funds Management, Inc. State Street Financial Center One Lincoln Street Boston, MA 02111 | Vice President Deputy Treasurer | Term: Indefinite Elected: 10/12 Elected: 2/16 | Chief Operating Officer, SSGA Funds Management, Inc. (April 2014 – present); Vice President, State Street Global Advisors and SSGA Funds Management, Inc. (2005 – present).* | |||
Chad C. Hallett SSGA Funds Management, Inc. State Street Financial Center One Lincoln Street Boston, MA 02111 | Deputy Treasurer | Term: Indefinite Elected: 2/16 | Vice President, State Street Global Advisors and SSGA Funds Management, Inc. (November 2014 – present); Vice President, State Street Bank and Trust Company (2001 – November 2014).* |
44
Table of Contents
State Street Master Funds
State Street U.S. Government Money Market Portfolio
Disclosure of Information about Fund Trustees and Officers — (continued)
December 31, 2015 (Unaudited)
Name, Address, | Position(s) Held | Term of Office | Principal Occupation | |||
Officers: (continued) | ||||||
Sujata Upreti SSGA Funds Management, Inc. State Street Financial Center One Lincoln Street Boston, MA 02111 | Assistant Treasurer | Term: Indefinite Elected: 2/16 | Vice President, State Street Global Advisors and SSGA Funds Management, Inc. (May 2015 – present); Assistant Director, Cambridge Associates, LLC (July 2014 – January 2015); Vice President, Bank of New York Mellon (July 2012 – August 2013); Manager, PricewaterhouseCoopers, LLP (September 2009 – July 2012). | |||
Daniel Foley SSGA Funds Management, Inc. State Street Financial Center One Lincoln Street Boston, MA 02111 | Assistant Treasurer | Term: Indefinite Elected: 2/16 | Vice President, State Street Global Advisors and SSGA Funds Management, Inc. (April 2014 – present); Principal, State Street Global Advisors and SSGA Funds Management, Inc. (April 2007 – April 2014). | |||
Brian Harris SSGA Funds Management, Inc. State Street Financial Center One Lincoln Street Boston, MA 02111 | Chief Compliance Officer | Term: Indefinite Elected: 11/13 | Vice President, State Street Global Advisors and SSGA Funds Management, Inc. (June 2013 – Present); Senior Vice President and Global Head of Investment Compliance, BofA Global Capital Management (September 2010 to May 2013); Director of Compliance, AARP Financial Inc. (July 2008 to August 2010). | |||
Trevor Swanberg SSGA Funds Management, Inc. State Street Financial Center One Lincoln Street Boston, MA 02111 | Code of Ethics Compliance Officer | Term: Indefinite Elected: 8/15 | Vice President, State Street Global Advisors and SSGA Funds Management, Inc. (January 2015 – Present); Senior Manager – Mutual Fund Compliance, ICMA – Retirement Corporation (December 2011 – January 2015); Assistant Vice President, J.P. Morgan (September 2007 – December 2011). | |||
Joshua A. Weinberg SSGA Funds Management, Inc. State Street Financial Center One Lincoln Street Boston, MA 02111 | Chief Legal Officer | Term: Indefinite Elected: 2/15 | Vice President and Managing Counsel, State Street Global Advisors (2011 – present); Clerk, SSGA Funds Management, Inc. (2013 – present); Associate, Financial Services Group, Dechert LLP (2006 – 2011). | |||
David K. James State Street Bank and Trust Company 100 Huntington Avenue, 3rd Floor Boston, MA 02116 | Secretary | Term: Indefinite Elected: 4/13 | Managing Director and Managing Counsel, State Street Bank and Trust Company (2009 – present); Vice President and Counsel, PNC Global Investment Servicing (US), Inc. (2006 – 2009). | |||
Kristin Schantz State Street Bank and Trust Company 100 Huntington Avenue, 3rd Floor Boston, MA 02116 | Assistant Secretary | Term: Indefinite Elected: 2/14 | Vice President and Counsel, State Street Bank and Trust Company (2013 – present); Vice President, Citi Fund Services Ohio, Inc. (2008 – 2013). |
| * | Served in various capacities and/or with various affiliated entities during noted time period. |
45
Table of Contents
Trustees
William L. Boyan
Michael F. Holland
William L. Marshall
Patrick J. Riley
James E. Ross
Richard D. Shirk
Rina K. Spence
Bruce D. Taber
Douglas T. Williams
Investment Adviser and Administrator
SSGA Funds Management, Inc.
State Street Financial Center
One Lincoln Street
Boston, MA 02111
Custodian, Sub-Administrator and Transfer Agent
State Street Bank and Trust Company
State Street Financial Center
One Lincoln Street
Boston, MA 02111
Independent Registered Public Accounting Firm
Ernst & Young LLP
200 Clarendon Street
Boston, MA 02116
Legal Counsel
Ropes & Gray LLP
800 Boylston Street
Boston, MA 02199
This report is for shareholder information. This is not a prospectus intended for use in the purchase or sale of shares of beneficial interest.
State Street Master Funds State Street Bank and Trust Company P.O. Box 5049 Boston, MA 02206 | SSITINVAR IBG-18446 |
Table of Contents
Annual Report
31 December 2015
State Street Institutional Investment Trust
State Street Equity 500 Index Fund
State Street Equity 500 Index II Portfolio

Table of Contents
State Street Institutional Investment Trust
Annual Report
December 31, 2015
| 1 | ||||
| 3 | ||||
| 5 | ||||
| 7 | ||||
| 8 | ||||
| 10 | ||||
| 16 | ||||
| 17 | ||||
| 22 | ||||
| 23 | ||||
| 24 | ||||
| 25 | ||||
| 26 | ||||
| 35 | ||||
| 36 | ||||
| 38 | ||||
| 39 | ||||
| 40 | ||||
Table of Contents
State Street Equity 500 Index Fund
MANAGEMENT DISCUSSION OF FUND PERFORMANCE
The State Street Equity 500 Index Fund (the “Fund”) normally invests substantially all of its investable assets in the State Street Equity 500 Index II Portfolio (the “Portfolio”), which seeks to provide investment results that, before expenses, correspond generally to the total return of the Standard & Poor’s 500 Index (the “S&P 500” or the “Index”). In seeking to achieve this objective, the Fund utilizes a passive management strategy designed to track the performance of the Index. The Fund also employs futures to maintain market exposure and otherwise assist in attempting to replicate the performance of the Index. During the 12-month period ended December 31, 2015 (the “Reporting Period”), the Fund invested in S&P 500 futures contracts to equitize the small amount of cash in the portfolio. Futures performance did not have a material impact on portfolio performance.
For the Reporting Period, the total return for the Fund’s Administrative Shares was 1.08%, and the total return for the Index was 1.38%. The Fund and Index returns reflect the reinvestment of dividends and other income. The Fund’s performance reflects the expenses of the Fund, including brokerage and advisory expenses. The Index is unmanaged and Index returns do not reflect fees and expenses of any kind, which would have a negative impact on returns. The expenses of managing the Fund, managing cash inflows to and outflows from the Fund and small security misweights contributed to the difference between the Fund’s performance and that of the Index.
After a turbulent January 2015 for equity markets, volatility subsided through the month of February as oil prices stabilized and the aggressive pace of global central bank actions witnessed the prior month moderated. In March, the Bureau of Labor Statistics reported better than expected employment numbers which potentially increased the likelihood that the U.S Federal Reserve (the “Fed”) would increase interest rates sooner rather than later. This possibility contributed to a selloff of gold and U.S. equities. However, the rout was short lived as news broke that the Fed would allow several large Wall Street banks to initiate or raise their dividends. U.S. equities rallied on the news.
Kicking off the second quarter of 2015, April provided a bumpy ride for investors exposed to a number of recent popular trends in the market. After rising for nine consecutive months on anticipated policy divergence between the Fed and other central banks, the U.S. dollar declined nearly 4% for the month, which reflected in part a softening in U.S. economic data and a later than expected start to Fed interest rate hikes. Global markets entered the month of May 2015 digesting an initial first quarter 2015 GDP report released in April that showed a much lower than expected 0.2% annualized rate of growth in the U.S. Despite the weak U.S. growth data, May opened with global interest rates continuing to rise sharply on the heels of a market selloff that began in late April 2015.
Markets in the third quarter of 2015 were unsettled by a steady stream of worrying headlines from Europe. After the market selloff in August, expectations that the Fed would make good on the median forecast of Fed Board members and bank presidents in June, that interest rates would increase in two increments for the remainder of the year beginning in September 2015 were brought into question.
Contributing to a lackluster outcome for 2015 was a challenging environment for U.S. companies’ ability to earn a profit, evidenced by a year over year decline in the earnings of issuers listed on the Index. This falloff in earnings is most significantly attributable to the energy sector, where a significant decline in oil prices through the end of September corresponded to a nearly identical decline in energy sector earnings. Excluding the energy sector, aggregate earnings growth for issuers included in the Index remained positive, though still soft given the impact on multinationals of the stronger U.S. dollar and the backdrop of subdued global growth.
1
Table of Contents
State Street Equity 500 Index Fund
MANAGEMENT DISCUSSION OF FUND PERFORMANCE — (continued)
After being battered to close the third quarter of 2015 on a rapidly deteriorating global growth outlook, equity markets found their footing in October to open the fourth quarter. The shift in market sentiment was aided by new policy commitments from global central banks to provide additional stimulus to combat the effects of a slowing global economy – commitments that were seemingly validated when the International Monetary Fund downgraded its forecast for global growth in early October. The fourth quarter proved a strong one for the Index, which finished positive for the three month period.
On an individual security level, the top positive contributors to the Fund’s performance were: Amazon.com, Inc., Microsoft Corp., and General Electric Co. The top negative contributors to the Fund’s performance were: Kinder Morgan, Inc. Class P, Exxon Mobil Corp., and QUALCOMM Inc.
The views expressed above reflect those of the Fund’s portfolio manager only through the Reporting Period and do not necessarily represent the views of the Adviser as a whole. Any such views are subject to change at any time based upon market or other conditions, and the Adviser disclaims any responsibility to update such views. These views may not be relied on as investment advice and, because investment decisions for a fund are based on numerous factors, may not be relied on as an indication of trading intent on behalf of any fund.
2
Table of Contents
State Street Equity 500 Index Fund
Administrative Shares
Growth of a $10,000 Investment (a)
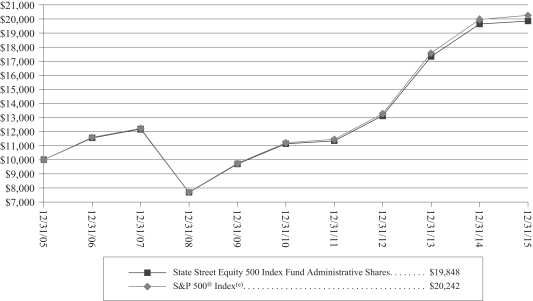
Investment Performance (a)
As of December 31, 2015
| Total Return One Year Ended December 31, 2015 | Average Annual Total Return Five Years Ended December 31, 2015 | Average Annual Total Return Ten Years Ended December 31, 2015 | ||||||||||
State Street Equity 500 Index Fund Administrative Shares | 1.08 | % | 12.27 | % | 7.10 | % | ||||||
State Street Equity 500 Index Fund Service Shares | 0.98 | % | 12.16 | % | 6.99 | % | ||||||
State Street Equity 500 Index Fund R Shares | 0.58 | % | 11.76 | % | 6.61 | % | ||||||
State Street Equity 500 Index Fund Class A(b) | 0.78 | % | 11.96 | % | 6.81 | % | ||||||
State Street Equity 500 Index Fund Class I(c) | 1.03 | % | 12.24 | % | 7.07 | % | ||||||
State Street Equity 500 Index Fund Class K(d) | 1.23 | % | 12.31 | % | 7.11 | % | ||||||
S&P 500® Index(e) | 1.38 | % | 12.57 | % | 7.31 | % | ||||||
| (a) | Total returns and performance graph information represent past performance and are not indicative of future results, which may be lower or higher than performance data quoted. Investment return and principal value of an investment will fluctuate so that an investor’s share, when redeemed, may be worth more or less than its original cost. The graph and table above do not reflect the deduction of taxes that a shareholder would pay on fund distributions, sales, or the redemption of fund shares. |
3
Table of Contents
| (b) | NAV Performance shown for the periods prior to the inception of Class A shares on September 17, 2014 reflects the historical performance of the fund’s Administrative Shares adjusted to reflect the higher expenses of Class A shares, including applicable 12b-1 fees. |
| (c) | NAV Performance shown for the periods prior to the inception of Class I shares on September 17, 2014 reflects the historical performance of the fund’s Administrative Shares adjusted to reflect the higher expenses of Class I shares, including applicable 12b-1 fees. |
| (d) | NAV Performance shown for the periods prior to the inception of Class K shares on September 17, 2014 reflect the historical performance of the fund’s Administrative shares. Had the fund’s Class K fees been reflected, the returns shown for those periods would have been higher. |
| (e) | The Standard & Poor’s 500 Composite Stock Price Index (“S&P 500® Index”) is an unmanaged capitalization-weighted index of 500 widely held stocks recognized by investors to be representative of the stock market in general. It is not possible to invest directly in the S&P 500® Index. |
4
Table of Contents
State Street Equity 500 Index Fund
Statement of Assets and Liabilities
December 31, 2015
Assets | ||||
Investment in corresponding Portfolio (45,139,604 shares), at market value (cost $456,273,810) | $ | 465,840,709 | ||
Receivable for investments sold | 540,027 | |||
Receivable for fund shares sold | 216,759 | |||
Receivable from Adviser (Note 4) | 142,098 | |||
Cash | 35,285 | |||
Prepaid expenses and other assets | 3,520 | |||
|
| |||
Total assets | 466,778,398 | |||
|
| |||
Liabilities | ||||
Payable for fund shares repurchased | 786,370 | |||
Distribution fees payable (Note 4) | 79,013 | |||
Custody and accounting fees payable (Note 4) | 4,105 | |||
Registration and filing fees payable | 35,755 | |||
Administration fees payable (Note 4) | 24,226 | |||
Professional fees payable | 19,069 | |||
Transfer agent fees payable (Note 4) | 6,936 | |||
Shareholder servicing fee payable (Note 4) | 276 | |||
Miscellaneous fees payable | 34,892 | |||
|
| |||
Total liabilities | 990,642 | |||
|
| |||
Net Assets | $ | 465,787,756 | ||
|
| |||
Net Assets Consist of: | ||||
Paid-in capital | $ | 453,146,395 | ||
Accumulated net realized gain | 3,074,462 | |||
Net unrealized appreciation on investments and futures | 9,566,899 | |||
|
| |||
Net Assets | $ | 465,787,756 | ||
|
| |||
Net Assets | ||||
Administrative Shares | $ | 261,038,088 | ||
|
| |||
Service Shares | $ | 104,730,362 | ||
|
| |||
Class R | $ | 37,845,271 | ||
|
| |||
Class A | $ | 59,881 | ||
|
| |||
Class I | $ | 50,495 | ||
|
| |||
Class K | $ | 62,063,659 | ||
|
| |||
Shares of Beneficial Interest Outstanding | ||||
Administrative Shares | 15,207,158 | |||
|
| |||
Service Shares | 6,107,022 | |||
|
| |||
Class R | 2,206,107 | |||
|
| |||
Class A | 3,488 | |||
|
| |||
Class I | 2,941 | |||
|
| |||
Class K | 3,615,061 | |||
|
|
See accompanying notes to financial statements and financial statements of the corresponding Portfolio.
5
Table of Contents
State Street Equity 500 Index Fund
Statement of Assets and Liabilities – (continued)
December 31, 2015
Offering, Net Asset Value, and Redemption Price Per Share | ||||
Administrative Shares | $ | 17.17 | ||
|
| |||
Service Shares | $ | 17.15 | ||
|
| |||
Class R | $ | 17.15 | ||
|
| |||
Class I | $ | 17.17 | ||
|
| |||
Class K | $ | 17.17 | ||
|
| |||
Net Asset Value and Redemption Price Per Share | ||||
Class A | $ | 17.17 | ||
|
| |||
Maximum Sales Charge | ||||
Class A | 5.25 | % | ||
|
| |||
Maximum Offering Price Per Share | ||||
Class A | $ | 18.12 | ||
|
|
See accompanying notes to financial statements and financial statements of the corresponding Portfolio.
6
Table of Contents
State Street Equity 500 Index Fund
Statement of Operations
Year Ended December 31, 2015
Income | ||||
Dividend income from corresponding Portfolio (Note 2) | $ | 8,676,662 | ||
|
| |||
Expenses | ||||
Management fees (Note 4) | 86,528 | |||
Administration fees (Note 4) | 216,320 | |||
Custody and accounting fees (Note 4) | 8,658 | |||
Distribution fees (Note 4) | ||||
Administrative Shares | 379,884 | |||
Service Shares | 311,339 | |||
Class R Shares | 246,906 | |||
Class A Shares | 149 | |||
Registration and filing fees | 73,619 | |||
Professional fees | 26,874 | |||
Transfer agent fees (Note 4) | 148,984 | |||
Sub-Transfer agent fees (Note 4) | 222 | |||
Printing fees | 122,913 | |||
Miscellaneous fees | 12,678 | |||
|
| |||
Total expenses | 1,635,074 | |||
Less: Expenses reimbursed and waived by the Adviser (Note 4) | (565,958 | ) | ||
|
| |||
Net expenses | 1,069,116 | |||
|
| |||
Net Investment Income | $ | 7,607,546 | ||
|
| |||
Realized and Unrealized Gain (Loss) | ||||
Net realized gain on: | ||||
Investment in corresponding Portfolio | 1,043,957 | |||
Capital gain distributions from corresponding Portfolio | 6,990,261 | |||
Change in net unrealized appreciation (depreciation) on investment in corresponding Portfolio | (11,631,751 | ) | ||
|
| |||
Net realized and unrealized gain (loss) | (3,597,533 | ) | ||
|
| |||
Net Increase in Net Assets Resulting from Operations | $ | 4,010,013 | ||
|
|
See accompanying notes to financial statements and financial statements of the corresponding Portfolio.
7
Table of Contents
State Street Equity 500 Index Fund
Statements of Changes in Net Assets
| Year Ended December 31, 2015 | Year Ended December 31, 2014* | |||||||
Increase (Decrease) in Net Assets Resulting from: | ||||||||
Operations: | ||||||||
Net investment income | $ | 7,607,546 | $ | 6,663,914 | ||||
Net realized gain on corresponding Portfolio | 8,034,218 | 4,872,412 | ||||||
Change in net unrealized appreciation (depreciation) on investment in corresponding Portfolio | (11,631,751 | ) | 36,952,352 | |||||
|
|
|
| |||||
Net increase in net assets from operations | 4,010,013 | 48,488,678 | ||||||
|
|
|
| |||||
Distributions to Shareholders from: | ||||||||
Net investment income | ||||||||
Administrative Shares | (4,364,601 | ) | (4,368,794 | ) | ||||
Service Shares | (1,622,598 | ) | (2,087,460 | ) | ||||
Class R | (461,399 | ) | (543,044 | ) | ||||
Class A | (829 | ) | (853 | ) | ||||
Class I | (827 | ) | (920 | ) | ||||
Class K | (1,121,491 | ) | (890 | ) | ||||
|
|
|
| |||||
Total distributions | (7,571,745 | ) | (7,001,961 | ) | ||||
|
|
|
| |||||
Net Increase (Decrease) from Fund Share Transactions: | ||||||||
Administrative Shares | ||||||||
Shares sold | 41,802,550 | 24,425,275 | ||||||
Reinvestment of distributions | 4,364,601 | 4,368,794 | ||||||
Shares redeemed | (31,463,427 | ) | (36,318,004 | ) | ||||
|
|
|
| |||||
Net increase (decrease) from Fund share transactions | 14,703,724 | (7,523,935 | ) | |||||
|
|
|
| |||||
Service Shares | ||||||||
Shares sold | 17,158,854 | 21,364,651 | ||||||
Reinvestment of distributions | 1,622,598 | 2,087,460 | ||||||
Shares redeemed | (39,708,683 | ) | (34,078,747 | ) | ||||
|
|
|
| |||||
Net decrease from Fund share transactions | (20,927,231 | ) | (10,626,636 | ) | ||||
|
|
|
| |||||
Class R | ||||||||
Shares sold | 10,803,830 | 8,619,272 | ||||||
Reinvestment of distributions | 461,399 | 543,044 | ||||||
Shares redeemed | (14,403,865 | ) | (4,524,963 | ) | ||||
|
|
|
| |||||
Net increase (decrease) from Fund share transactions | (3,138,636 | ) | 4,637,353 | |||||
|
|
|
| |||||
Class A | ||||||||
Shares sold | 9,470 | 50,000 | ||||||
|
|
|
| |||||
Class I | ||||||||
Shares sold | – | 50,000 | ||||||
|
|
|
| |||||
Class K | ||||||||
Shares sold | 61,692,390 | 50,000 | ||||||
Reinvestment of distributions | 1,120,561 | – | ||||||
Shares redeemed | (3,875 | ) | – | |||||
|
|
|
| |||||
Net increase from Fund share transactions | 62,809,076 | 50,000 | ||||||
|
|
|
| |||||
Net increase (decrease) in net assets from share transactions | 53,456,403 | (13,363,218 | ) | |||||
|
|
|
| |||||
See accompanying notes to financial statements and financial statements of the corresponding Portfolio.
8
Table of Contents
State Street Equity 500 Index Fund
Statements of Changes in Net Assets — (continued)
| Year Ended December 31, 2015 | Year Ended December 31, 2014* | |||||||
Net Increase in Net Assets | $ | 49,894,671 | $ | 28,123,499 | ||||
Net Assets | ||||||||
Beginning of year | 415,893,085 | 387,769,586 | ||||||
|
|
|
| |||||
End of year | $ | 465,787,756 | $ | 415,893,085 | ||||
|
|
|
| |||||
Changes in Shares: | ||||||||
Administrative Shares | ||||||||
Shares sold | 2,410,360 | 1,493,957 | ||||||
Reinvestment of distributions | 251,852 | 250,217 | ||||||
Shares redeemed | (1,827,428 | ) | (2,229,714 | ) | ||||
|
|
|
| |||||
Net increase (decrease) in shares | 834,784 | (485,540 | ) | |||||
|
|
|
| |||||
Service Shares | ||||||||
Shares sold | 992,013 | 1,305,903 | ||||||
Reinvestment of distributions | 93,683 | 119,694 | ||||||
Shares redeemed | (2,306,875 | ) | (2,161,357 | ) | ||||
|
|
|
| |||||
Net decrease in shares | (1,221,179 | ) | (735,760 | ) | ||||
|
|
|
| |||||
Class R Shares | ||||||||
Shares sold | 620,202 | 529,045 | ||||||
Reinvestment of distributions | 26,640 | 31,120 | ||||||
Shares redeemed | (825,254 | ) | (276,992 | ) | ||||
|
|
|
| |||||
Net increase (decrease) in shares | (178,412 | ) | 283,173 | |||||
|
|
|
| |||||
Class A | ||||||||
Shares sold | 547 | 2,941 | ||||||
|
|
|
| |||||
Class I | ||||||||
Shares sold | – | 2,941 | ||||||
|
|
|
| |||||
Class K | ||||||||
Shares sold | 3,547,720 | 2,941 | ||||||
Reinvestment of distributions | 64,623 | – | ||||||
Shares redeemed | (223 | ) | – | |||||
|
|
|
| |||||
Net increase in shares | 3,612,120 | 2,941 | ||||||
|
|
|
| |||||
| * | Effective August 11, 2014, the Fund invests substantially all of its investable assets in State Street Equity 500 Index II Portfolio (Note 1). |
See accompanying notes to financial statements and financial statements of the corresponding Portfolio.
9
Table of Contents
State Street Equity 500 Index Fund
Financial Highlights
Selected data for an Administrative Share of beneficial interest outstanding throughout each period is presented below:
| Year Ended 12/31/15 | Year Ended 12/31/14 | Year Ended 12/31/13 | Year Ended 12/31/12 | Year Ended 12/31/11 | ||||||||||||||||
Per Share Operating Performance:(a) | ||||||||||||||||||||
Net Asset Value, Beginning of Year | $ | 17.27 | $ | 15.50 | $ | 11.94 | $ | 10.51 | $ | 10.52 | ||||||||||
|
|
|
|
|
|
|
|
|
| |||||||||||
Investment Operations: | ||||||||||||||||||||
Net investment income(b) | 0.31 | 0.29 | 0.26 | 0.24 | 0.20 | |||||||||||||||
Net realized and unrealized gain (loss) on investments | (0.12 | ) | 1.79 | 3.56 | 1.42 | (0.01 | ) | |||||||||||||
|
|
|
|
|
|
|
|
|
| |||||||||||
Total from investment operations | 0.19 | 2.08 | 3.82 | 1.66 | 0.19 | |||||||||||||||
|
|
|
|
|
|
|
|
|
| |||||||||||
Less Distributions From: | ||||||||||||||||||||
Net investment income | (0.29 | ) | (0.31 | ) | (0.26 | ) | (0.23 | ) | (0.20 | ) | ||||||||||
|
|
|
|
|
|
|
|
|
| |||||||||||
Net increase (decrease) in net assets | (0.10 | ) | 1.77 | 3.56 | 1.43 | (0.01 | ) | |||||||||||||
|
|
|
|
|
|
|
|
|
| |||||||||||
Net Asset Value, End of Year | $ | 17.17 | $ | 17.27 | $ | 15.50 | $ | 11.94 | $ | 10.51 | ||||||||||
|
|
|
|
|
|
|
|
|
| |||||||||||
Total Return(c) | 1.08 | % | 13.41 | % | 31.97 | % | 15.84 | % | 1.79 | % | ||||||||||
Ratios and Supplemental Data: | ||||||||||||||||||||
Net Assets, End of Year (000s) | $ | 261,038 | $ | 248,180 | $ | 230,330 | $ | 185,918 | $ | 161,813 | ||||||||||
Ratios to average net assets:(a) | ||||||||||||||||||||
Expenses before waivers and payments by affiliates | 0.311 | % | 0.300 | %(d) | 0.245 | % | 0.245 | % | 0.245 | % | ||||||||||
Expenses net of waivers and payments by affiliates | 0.180 | % | 0.231 | %(d) | 0.245 | % | 0.245 | % | 0.245 | % | ||||||||||
Net investment income | 1.76 | % | 1.78 | % | 1.84 | % | 2.06 | % | 1.83 | % | ||||||||||
Portfolio turnover rate | 5 | %(e) | 4 | %(f) | 4 | %(g) | 9 | %(g) | 15 | %(g) | ||||||||||
| (a) | Prior to August 11, 2014, the per shares amounts and percentages included the Fund’s proportionate share of income and expenses of the State Street Equity 500 Index Portfolio. |
| (b) | Net investment income per share is calculated using the average shares method. |
| (c) | Total return is calculated assuming a purchase of shares at net asset value on the first day and a sale at net asset value on the last day of each period reported. Distributions are assumed, for the purpose of this calculation, to be reinvested at net asset value per share on the respective payment dates. Results represent past performance and are not indicative of future results. |
| (d) | Ratio includes expenses allocated from the State Street Equity 500 Index Portfolio from 1/1/2014 through 8/10/2014, and does not include the expenses of the State Street Equity 500 Index II Portfolio from 8/11/2014 through 12/31/2014. |
| (e) | Portfolio turnover rate is from the State Street Equity 500 Index II Portfolio. |
| (f) | Portfolio turnover rate is calculated from the State Street Equity 500 Index Portfolio (from 1/1/2014 to 8/10/2014) and the State Street Equity 500 Index II Portfolio (from 8/11/2014 to 12/31/2014). |
| (g) | Portfolio turnover rate is from the State Street Equity 500 Index Portfolio. |
See accompanying notes to financial statements and financial statements of the corresponding Portfolio.
10
Table of Contents
State Street Equity 500 Index Fund
Financial Highlights — (continued)
Selected data for a Service Share of beneficial interest outstanding throughout each period is presented below:
| Year Ended 12/31/15 | Year Ended 12/31/14 | Year Ended 12/31/13 | Year Ended 12/31/12 | Year Ended 12/31/11 | ||||||||||||||||
Per Share Operating Performance:(a) | ||||||||||||||||||||
Net Asset Value, Beginning of Year | $ | 17.25 | $ | 15.49 | $ | 11.92 | $ | 10.50 | $ | 10.51 | ||||||||||
|
|
|
|
|
|
|
|
|
| |||||||||||
Investment Operations: | ||||||||||||||||||||
Net investment income(b) | 0.22 | 0.28 | 0.24 | 0.23 | 0.19 | |||||||||||||||
Net realized and unrealized gain (loss) on investments | (0.05 | ) | 1.77 | 3.57 | 1.41 | (0.01 | ) | |||||||||||||
|
|
|
|
|
|
|
|
|
| |||||||||||
Total from investment operations | 0.17 | 2.05 | 3.81 | 1.64 | 0.18 | |||||||||||||||
|
|
|
|
|
|
|
|
|
| |||||||||||
Less Distributions From: | ||||||||||||||||||||
Net investment income | (0.27 | ) | (0.29 | ) | (0.24 | ) | (0.22 | ) | (0.19 | ) | ||||||||||
|
|
|
|
|
|
|
|
|
| |||||||||||
Net increase (decrease) in net assets | (0.10 | ) | 1.76 | 3.57 | 1.42 | (0.01 | ) | |||||||||||||
|
|
|
|
|
|
|
|
|
| |||||||||||
Net Asset Value, End of Year | $ | 17.15 | $ | 17.25 | $ | 15.49 | $ | 11.92 | $ | 10.50 | ||||||||||
|
|
|
|
|
|
|
|
|
| |||||||||||
Total Return(c) | 0.98 | % | 13.24 | % | 31.97 | % | 15.64 | % | 1.69 | % | ||||||||||
Ratios and Supplemental Data: | ||||||||||||||||||||
Net Assets, End of Year (000s) | $ | 104,730 | $ | 126,412 | $ | 124,885 | $ | 88,416 | $ | 77,600 | ||||||||||
Ratios to average net assets: | ||||||||||||||||||||
Expenses before waivers and payments by affiliates | 0.411 | % | 0.401 | %(d) | 0.345 | % | 0.345 | % | 0.345 | % | ||||||||||
Expenses net of waivers and payments by affiliates | 0.280 | % | 0.331 | %(d) | 0.345 | % | 0.345 | % | 0.345 | % | ||||||||||
Net investment income | 1.25 | % | 1.73 | % | 1.74 | % | 1.96 | % | 1.74 | % | ||||||||||
Portfolio turnover rate | 5 | %(e) | 4 | %(f) | 4 | %(g) | 9 | %(g) | 15 | %(g) | ||||||||||
| (a) | Prior to August 11, 2014, the per share amounts and percentages included the Fund’s proportionate share of income and expenses of the State Street Equity 500 Index Portfolio. |
| (b) | Net investment income per share is calculated using the average shares method. |
| (c) | Total return is calculated assuming a purchase of shares at net asset value on the first day and a sale at net asset value on the last day of each period reported. Distributions are assumed, for the purpose of this calculation, to be reinvested at net asset value per share on the respective payment dates. Results represent past performance and are not indicative of future results. |
| (d) | Ratio includes expenses allocated from the State Street Equity 500 Index Portfolio from 1/1/2014 through 8/10/2014, and does not include the expenses of the State Street Equity 500 Index II Portfolio from 8/11/2014 through 12/31/2014. |
| (e) | Portfolio turnover rate is from the State Street Equity 500 Index II Portfolio. |
| (f) | Portfolio turnover rate is calculated from the State Street Equity 500 Index Portfolio (from 1/1/2014 to 8/10/2014) and the State Street Equity 500 Index II Portfolio (from 8/11/2014 to 12/31/2014). |
| (g) | Portfolio turnover rate is from the State Street Equity 500 Index Portfolio. |
See accompanying notes to financial statements and financial statements of the corresponding Portfolio.
11
Table of Contents
State Street Equity 500 Index Fund
Financial Highlights — (continued)
Selected data for a Class R Share of beneficial interest outstanding throughout each period is presented below:
| Year Ended 12/31/15 | Year Ended 12/31/14 | Year Ended 12/31/13 | Year Ended 12/31/12 | Year Ended 12/31/11 | ||||||||||||||||
Per Share Operating Performance:(a) | ||||||||||||||||||||
Net Asset Value, Beginning of Year | $ | 17.26 | $ | 15.49 | $ | 11.93 | $ | 10.51 | $ | 10.51 | ||||||||||
|
|
|
|
|
|
|
|
|
| |||||||||||
Investment Operations: | ||||||||||||||||||||
Net investment income(b) | 0.19 | 0.22 | 0.19 | 0.19 | 0.15 | |||||||||||||||
Net realized and unrealized gain (loss) on investments | (0.09 | ) | 1.78 | 3.56 | 1.41 | – | ||||||||||||||
|
|
|
|
|
|
|
|
|
| |||||||||||
Total from investment operations | 0.10 | 2.00 | 3.75 | 1.60 | 0.15 | |||||||||||||||
|
|
|
|
|
|
|
|
|
| |||||||||||
Less Distributions From: | ||||||||||||||||||||
Net investment income | (0.21 | ) | (0.23 | ) | (0.19 | ) | (0.18 | ) | (0.15 | ) | ||||||||||
|
|
|
|
|
|
|
|
|
| |||||||||||
Net increase (decrease) in net assets | (0.11 | ) | 1.77 | 3.56 | 1.42 | 0.00 | ||||||||||||||
|
|
|
|
|
|
|
|
|
| |||||||||||
Net Asset Value, End of Year | $ | 17.15 | $ | 17.26 | $ | 15.49 | $ | 11.93 | $ | 10.51 | ||||||||||
|
|
|
|
|
|
|
|
|
| |||||||||||
Total Return(c) | 0.58 | % | 12.91 | % | 31.40 | % | 15.22 | % | 1.42 | % | ||||||||||
Ratios and Supplemental Data: | ||||||||||||||||||||
Net Assets, End of Year (000s) | $ | 37,845 | $ | 41,148 | $ | 32,555 | $ | 21,954 | $ | 16,363 | ||||||||||
Ratios to average net assets:(a) | ||||||||||||||||||||
Expenses before waivers and payments by affiliates | 0.761 | % | 0.754 | %(d) | 0.695 | % | 0.695 | % | 0.695 | % | ||||||||||
Expenses net of waivers and payments by affiliates | 0.630 | % | 0.680 | %(d) | 0.695 | % | 0.695 | % | 0.695 | % | ||||||||||
Net investment income | 1.09 | % | 1.37 | % | 1.40 | % | 1.62 | % | 1.40 | % | ||||||||||
Portfolio turnover rate | 5 | %(e) | 4 | %(f) | 4 | %(g) | 9 | %(g) | 15 | %(g) | ||||||||||
| (a) | Prior to August 11, 2014, the per share amounts and percentages included the Fund’s proportionate share of income and expenses of the State Street Equity 500 Index Portfolio. |
| (b) | Net investment income per share is calculated using the average shares method. |
| (c) | Total return is calculated assuming a purchase of shares at net asset value on the first day and a sale at net asset value on the last day of each period reported. Distributions are assumed, for the purpose of this calculation, to be reinvested at net asset value per share on the respective payment dates. Results represent past performance and are not indicative of future results. |
| (d) | Ratio includes expenses allocated from the State Street Equity 500 Index Portfolio from 1/1/2014 through 8/10/2014, and does not include the expenses of the State Street Equity 500 Index II Portfolio from 8/11/2014 through 12/31/2014. |
| (e) | Portfolio turnover rate is from the State Street Equity 500 Index II Portfolio. |
| (f) | Portfolio turnover rate is calculated from the State Street Equity 500 Index Portfolio (from 1/1/2014 to 8/10/2014) and the State Street Equity 500 Index II Portfolio (from 8/11/2014 to 12/31/2014). |
| (g) | Portfolio turnover rate is from the State Street Equity 500 Index Portfolio. |
See accompanying notes to financial statements and financial statements of the corresponding Portfolio.
12
Table of Contents
State Street Equity 500 Index Fund
Financial Highlights — (continued)
Selected data for a Class A Share of beneficial interest outstanding throughout the period is presented below:
| Year Ended 12/31/15 | Period Ended 12/31/14(a) | |||||||
Per Share Operating Performance: | ||||||||
Net Asset Value, Beginning of Period | $ | 17.27 | $ | 17.00 | ||||
|
|
|
| |||||
Investment Operations: | ||||||||
Net investment income(b) | 0.25 | 0.11 | ||||||
Net realized and unrealized gain (loss) on investments | (0.11 | ) | 0.45 | |||||
|
|
|
| |||||
Total from investment operations | 0.14 | 0.56 | ||||||
|
|
|
| |||||
Less Distributions From: | ||||||||
Net investment income | (0.24 | ) | (0.29 | ) | ||||
|
|
|
| |||||
Net increase (decrease) in net assets | (0.10 | ) | 0.27 | |||||
|
|
|
| |||||
Net Asset Value, End of Period | $ | 17.17 | $ | 17.27 | ||||
|
|
|
| |||||
Total Return(c) | 0.78 | % | 3.28 | % | ||||
Ratios and Supplemental Data: | ||||||||
Net Assets, End of Period (000s) | $ | 60 | $ | 51 | ||||
Ratios to average net assets: | ||||||||
Expenses before waivers and payments by affiliates | 0.608 | % | 0.700 | %(d)(e) | ||||
Expenses net of waivers and payments by affiliates | 0.479 | % | 0.507 | %(d)(e) | ||||
Net investment income | 1.43 | % | 2.32 | %(e) | ||||
Portfolio turnover rate | 5 | %(f) | 4 | %(g)(h) | ||||
| (a) | The Fund’s Class A Shares commenced operations on September 17, 2014. |
| (b) | Net investment income per share is calculated using the average shares method. |
| (c) | Total return is calculated assuming a purchase of shares at net asset value on the first day and a sale at net asset value on the last day of each period reported. Distributions are assumed, for the purpose of this calculation, to be reinvested at net asset value per share on the respective payment dates. Total returns for periods of less than one year are not annualized. Results represent past performance and are not indicative of future results. |
| (d) | Ratio does not include the expenses of the State Street Equity 500 Index II Portfolio. |
| (e) | Annualized. |
| (f) | Portfolio turnover rate is from the State Street Equity 500 Index II Portfolio. |
| (g) | Portfolio turnover rate is calculated from the State Street Equity 500 Index Portfolio (from 1/1/2014 to 8/10/2014) and the State Street Equity 500 Index II Portfolio (from 8/11/2014 to 12/31/2014). |
| (h) | Not annualized. |
See accompanying notes to financial statements and financial statements of the corresponding Portfolio.
13
Table of Contents
State Street Equity 500 Index Fund
Financial Highlights — (continued)
Selected data for a Class I Share of beneficial interest outstanding throughout the period is presented below:
| Year Ended 12/31/15 | Period Ended 12/31/14(a) | |||||||
Per Share Operating Performance: | ||||||||
Net Asset Value, Beginning of Period | $ | 17.27 | $ | 17.00 | ||||
|
|
|
| |||||
Investment Operations: | ||||||||
Net investment income(b) | 0.29 | 0.13 | ||||||
Net realized and unrealized gain (loss) on investments | (0.11 | ) | 0.44 | |||||
|
|
|
| |||||
Total from investment operations | 0.18 | 0.57 | ||||||
|
|
|
| |||||
Less Distributions From: | ||||||||
Net investment income | (0.28 | ) | (0.30 | ) | ||||
|
|
|
| |||||
Net increase (decrease) in net assets | (0.10 | ) | 0.27 | |||||
|
|
|
| |||||
Net Asset Value, End of Period | $ | 17.17 | $ | 17.27 | ||||
|
|
|
| |||||
Total Return(c) | 1.03 | % | 3.35 | % | ||||
Ratios and Supplemental Data: | ||||||||
Net Assets, End of Period (000s) | $ | 50 | $ | 51 | ||||
Ratios to average net assets: | ||||||||
Expenses before waivers and payments by affiliates | 0.361 | % | 0.450 | %(d)(e) | ||||
Expenses net of waivers and payments by affiliates | 0.230 | % | 0.258 | %(d)(e) | ||||
Net investment income | 1.66 | % | 2.57 | %(e) | ||||
Portfolio turnover rate | 5 | %(f) | 4 | %(g)(h) | ||||
| (a) | The Fund’s Class I Shares commenced operations on September 17, 2014. |
| (b) | Net investment income per share is calculated using the average shares method. |
| (c) | Total return is calculated assuming a purchase of shares at net asset value on the first day and a sale at net asset value on the last day of each period reported. Distributions are assumed, for the purpose of this calculation, to be reinvested at net asset value per share on the respective payment dates. Total returns for periods of less than one year are not annualized. Results represent past performance and are not indicative of future results. |
| (d) | Ratio does not include the expenses of the State Street Equity 500 Index II Portfolio. |
| (e) | Annualized. |
| (f) | Portfolio turnover rate is from the State Street Equity 500 Index II Portfolio. |
| (g) | Portfolio turnover rate is calculated from the State Street Equity 500 Index Portfolio (from 1/1/2014 to 8/10/2014) and the State Street Equity 500 Index II Portfolio (from 8/11/2014 to 12/31/2014). |
| (h) | Not annualized. |
See accompanying notes to financial statements and financial statements of the corresponding Portfolio.
14
Table of Contents
State Street Equity 500 Index Fund
Financial Highlights — (continued)
Selected data for a Class K Share of beneficial interest outstanding throughout the period is presented below:
| Year Ended 12/31/15 | Period Ended 12/31/14(a) | |||||||
Per Share Operating Performance: | ||||||||
Net Asset Value, Beginning of Period | $ | 17.27 | $ | 17.00 | ||||
|
|
|
| |||||
Investment Operations: | ||||||||
Net investment income(b) | 1.45 | 0.14 | ||||||
Net realized and unrealized gain (loss) on investments | (1.23 | ) | 0.44 | |||||
|
|
|
| |||||
Total from investment operations | 0.22 | 0.58 | ||||||
|
|
|
| |||||
Less Distributions From: | ||||||||
Net investment income | (0.32 | ) | (0.31 | ) | ||||
|
|
|
| |||||
Net increase (decrease) in net assets | (0.10 | ) | 0.27 | |||||
|
|
|
| |||||
Net Asset Value, End of Period | $ | 17.17 | $ | 17.27 | ||||
|
|
|
| |||||
Total Return(c) | 1.23 | % | 3.41 | % | ||||
Ratios and Supplemental Data: | ||||||||
Net Assets, End of Period (000s) | $ | 62,064 | $ | 51 | ||||
Ratios to average net assets: | ||||||||
Expenses before waivers and payments by affiliates | 0.160 | % | 0.272 | %(d)(e) | ||||
Expenses net of waivers and payments by affiliates | 0.030 | % | 0.057 | %(d)(e) | ||||
Net investment income | 8.45 | %(f) | 2.78 | %(e) | ||||
Portfolio turnover rate | 5 | %(g) | 4 | %(h)(i) | ||||
| (a) | The Fund’s Class K Shares commenced operations on September 17, 2014. |
| (b) | Net investment income per share is calculated using the average shares method. |
| (c) | Total return is calculated assuming a purchase of shares at net asset value on the first day and a sale at net asset value on the last day of each period reported. Distributions are assumed, for the purpose of this calculation, to be reinvested at net asset value per share on the respective payment dates. Total returns for periods of less than one year are not annualized. Results represent past performance and are not indicative of future results. |
| (d) | Ratio does not include the expenses of the State Street Equity 500 Index II Portfolio. |
| (e) | Annualized. |
| (f) | The calculation of the Net investment income ratio is affected by the timing and relative size of a class’ shareholder activity during the period. As a result, the Net investment income ratio may vary significantly from period to period. |
| (g) | Portfolio turnover rate is from the State Street Equity 500 Index II Portfolio. |
| (h) | Portfolio turnover rate is calculated from the State Street Equity 500 Index Portfolio (from 1/1/2014 to 8/10/2014) and the State Street Equity 500 Index II Portfolio (from 8/11/2014 to 12/31/2014). |
| (i) | Not annualized. |
See accompanying notes to financial statements and financial statements of the corresponding Portfolio.
15
Table of Contents
State Street Equity 500 Index II Portfolio
Portfolio Statistics (Unaudited)
Portfolio Composition* | December 31, 2015 | |||
Common Stocks | 98.4 | % | ||
Short-Term Investment | 1.6 | |||
Liabilities in Excess of Other Assets | (0.0 | )** | ||
Total | 100.0 | % |
Top Five Sectors (excluding short-term investment)* | December 31, 2015 | |||
Information Technology | 20.4 | % | ||
Financials | 16.2 | |||
Health Care | 14.9 | |||
Consumer Discretionary | 12.7 | |||
Consumer Staples | 9.9 | |||
Industrials | 9.9 | |||
Total | 84.0 | % |
| * | As a percentage of net assets as of the date indicated. The Portfolio’s composition will vary over time. |
| ** | Less than 0.05% of net assets. |
See accompanying notes to financial statements.
16
Table of Contents
State Street Equity 500 Index II Portfolio
Schedule of Investments
December 31, 2015
Security Description | Shares | Value | ||||||
COMMON STOCKS – 98.4% |
| |||||||
Consumer Discretionary – 12.7% |
| |||||||
Advance Auto Parts, Inc. | 2,200 | $ | 331,122 | |||||
Amazon.com, Inc.(a) | 11,490 | 7,765,976 | ||||||
AutoNation, Inc.(a) | 1,894 | 112,996 | ||||||
AutoZone, Inc.(a) | 876 | 649,913 | ||||||
Bed Bath & Beyond, Inc.(a) | 5,515 | 266,099 | ||||||
Best Buy Co., Inc. | 9,806 | 298,593 | ||||||
BorgWarner, Inc. | 6,077 | 262,709 | ||||||
Cablevision Systems Corp. (Class A) | 6,888 | 219,727 | ||||||
CarMax, Inc.(a) | 6,303 | 340,173 | ||||||
Carnival Corp. | 13,701 | 746,431 | ||||||
CBS Corp. (Class B) | 13,642 | 642,947 | ||||||
Chipotle Mexican Grill, Inc.(a) | 886 | 425,147 | ||||||
Coach, Inc. | 7,528 | 246,391 | ||||||
Comcast Corp. (Class A) | 73,383 | 4,141,003 | ||||||
Darden Restaurants, Inc. | 3,271 | 208,166 | ||||||
Delphi Automotive PLC | 8,419 | 721,761 | ||||||
Discovery Communications, Inc. (Class A)(a) | 5,403 | 144,152 | ||||||
Discovery Communications, Inc. (Class C)(a)(b) | 7,003 | 176,616 | ||||||
Dollar General Corp. | 9,013 | 647,764 | ||||||
Dollar Tree, Inc.(a) | 7,026 | 542,548 | ||||||
D.R. Horton, Inc. | 9,097 | 291,377 | ||||||
Expedia, Inc. | 3,134 | 389,556 | ||||||
Ford Motor Co. | 117,838 | 1,660,337 | ||||||
Fossil Group, Inc.(a) | 783 | 28,626 | ||||||
GameStop Corp. (Class A) | 2,622 | 73,521 | ||||||
Gap, Inc. | 7,434 | 183,620 | ||||||
Garmin, Ltd. | 4,340 | 161,318 | ||||||
General Motors Co. | 42,123 | 1,432,603 | ||||||
Genuine Parts Co. | 4,789 | 411,327 | ||||||
Goodyear Tire & Rubber Co. | 8,244 | 269,331 | ||||||
H&R Block, Inc. | 7,664 | 255,288 | ||||||
Hanesbrands, Inc. | 12,200 | 359,046 | ||||||
Harley-Davidson, Inc. | 5,816 | 263,988 | ||||||
Harman International Industries, Inc. | 2,416 | 227,611 | ||||||
Hasbro, Inc. | 3,197 | 215,350 | ||||||
Home Depot, Inc. | 37,902 | 5,012,540 | ||||||
Interpublic Group of Cos., Inc. | 12,566 | 292,537 | ||||||
Johnson Controls, Inc. | 19,280 | 761,367 | ||||||
Kohl���s Corp. | 5,445 | 259,345 | ||||||
L Brands, Inc. | 7,921 | 758,990 | ||||||
Leggett & Platt, Inc. | 4,654 | 195,561 | ||||||
Lennar Corp. (Class A) | 4,906 | 239,952 | ||||||
Lowe’s Cos., Inc. | 26,850 | 2,041,674 | ||||||
Macy’s, Inc. | 8,662 | 302,997 | ||||||
Marriott International, Inc. (Class A) | 5,653 | 378,977 | ||||||
Mattel, Inc. | 9,633 | 261,729 | ||||||
McDonald’s Corp. | 27,110 | 3,202,775 | ||||||
Michael Kors Holdings, Ltd.(a) | 5,514 | 220,891 | ||||||
Mohawk Industries, Inc.(a) | 2,031 | 384,651 | ||||||
Netflix, Inc.(a) | 12,504 | 1,430,208 | ||||||
Newell Rubbermaid, Inc. | 7,542 | 332,451 | ||||||
News Corp. (Class A) | 13,088 | 174,856 | ||||||
News Corp. (Class B) | 4,700 | 65,612 | ||||||
Nike, Inc. (Class B) | 40,706 | 2,544,125 | ||||||
Nordstrom, Inc. | 3,877 | 193,113 | ||||||
O’Reilly Automotive, Inc.(a) | 2,980 | 755,192 | ||||||
Omnicom Group, Inc. | 7,491 | 566,769 | ||||||
Priceline Group, Inc.(a) | 1,461 | 1,862,702 | ||||||
PulteGroup, Inc. | 10,862 | 193,561 | ||||||
PVH Corp. | 2,349 | 173,004 | ||||||
Ralph Lauren Corp. | 1,979 | 220,619 | ||||||
Ross Stores, Inc. | 12,256 | 659,495 | ||||||
Royal Caribbean Cruises, Ltd. | 5,300 | 536,413 | ||||||
Scripps Networks Interactive, Inc. (Class A) | 2,372 | 130,958 | ||||||
Signet Jewelers, Ltd. | 2,500 | 309,225 | ||||||
Staples, Inc. | 21,299 | 201,702 | ||||||
Starbucks Corp. | 44,630 | 2,679,139 | ||||||
Starwood Hotels & Resorts Worldwide, Inc. | 5,203 | 360,464 | ||||||
Target Corp. | 18,372 | 1,333,991 | ||||||
TEGNA, Inc. | 7,622 | 194,513 | ||||||
Tiffany & Co. | 3,199 | 244,052 | ||||||
Time Warner Cable, Inc. | 8,297 | 1,539,840 | ||||||
Time Warner, Inc. | 23,411 | 1,513,989 | ||||||
TJX Cos., Inc. | 19,737 | 1,399,551 | ||||||
Tractor Supply Co. | 4,326 | 369,873 | ||||||
TripAdvisor, Inc. (a) | 3,142 | 267,856 | ||||||
Twenty-First Century Fox, Inc. (Class A) | 35,800 | 972,328 | ||||||
Twenty-First Century Fox, Inc. (Class B) | 13,700 | 373,051 | ||||||
Under Armour, Inc. (Class A)(a) | 5,124 | 413,046 | ||||||
Urban Outfitters, Inc.(a) | 2,461 | 55,988 | ||||||
VF Corp. | 10,044 | 625,239 | ||||||
Viacom, Inc. (Class B) | 10,881 | 447,862 | ||||||
Walt Disney Co. | 45,052 | 4,734,064 | ||||||
Whirlpool Corp. | 2,502 | 367,469 | ||||||
Wyndham Worldwide Corp. | 3,353 | 243,595 | ||||||
Wynn Resorts, Ltd. | 2,141 | 148,136 | ||||||
Yum! Brands, Inc. | 12,702 | 927,881 | ||||||
|
| |||||||
| 68,989,051 | ||||||||
|
| |||||||
Consumer Staples – 9.9% | ||||||||
Altria Group, Inc. | 58,829 | 3,424,436 | ||||||
Archer-Daniels-Midland Co. | 17,932 | 657,746 | ||||||
Brown-Forman Corp. (Class B) | 2,921 | 289,997 | ||||||
Campbell Soup Co. | 5,082 | 267,059 | ||||||
Church & Dwight Co., Inc. | 3,900 | 331,032 | ||||||
Clorox Co. | 4,064 | 515,437 | ||||||
Coca-Cola Co. | 115,900 | 4,979,064 | ||||||
Coca-Cola Enterprises, Inc. | 5,788 | 285,001 | ||||||
Colgate-Palmolive Co. | 27,223 | 1,813,596 | ||||||
ConAgra Foods, Inc. | 12,824 | 540,660 | ||||||
Constellation Brands, Inc. (Class A) | 5,050 | 719,322 | ||||||
Costco Wholesale Corp. | 13,255 | 2,140,682 | ||||||
CVS Health Corp. | 32,705 | 3,197,568 | ||||||
Dr. Pepper Snapple Group, Inc. | 5,997 | 558,920 | ||||||
Estee Lauder Cos. Inc (Class A) | 6,741 | 593,612 | ||||||
General Mills, Inc. | 17,642 | 1,017,238 | ||||||
Hershey Co. | 4,667 | 416,623 | ||||||
Hormel Foods Corp. | 3,851 | 304,537 | ||||||
J.M. Smucker Co | 3,605 | 444,641 | ||||||
Kellogg Co. | 7,628 | 551,276 | ||||||
Keurig Green Mountain, Inc. | 3,211 | 288,926 | ||||||
Kimberly-Clark Corp. | 10,627 | 1,352,817 | ||||||
See accompanying notes to financial statements.
17
Table of Contents
State Street Equity 500 Index II Portfolio
Schedule of Investments — (continued)
December 31, 2015
Security Description | Shares | Value | ||||||
COMMON STOCKS – (continued) | ||||||||
Consumer Staples – (continued) | ||||||||
Kraft Heinz Co. | 17,418 | $ | 1,267,334 | |||||
Kroger Co. | 28,542 | 1,193,912 | ||||||
McCormick & Co., Inc. | 3,592 | 307,332 | ||||||
Mead Johnson Nutrition Co. | 6,250 | 493,437 | ||||||
Molson Coors Brewing Co. (Class B) | 4,453 | 418,226 | ||||||
Mondelez International, Inc. (Class A) | 46,715 | 2,094,701 | ||||||
Monster Beverage Corp.(a) | 4,753 | 708,007 | ||||||
PepsiCo, Inc. | 43,316 | 4,328,135 | ||||||
Philip Morris International, Inc. | 45,812 | 4,027,333 | ||||||
Procter & Gamble Co. | 80,658 | 6,405,052 | ||||||
Reynolds American, Inc. | 24,308 | 1,121,814 | ||||||
Sysco Corp. | 14,874 | 609,834 | ||||||
Tyson Foods, Inc. (Class A) | 9,444 | 503,648 | ||||||
Wal-Mart Stores, Inc. | 47,403 | 2,905,804 | ||||||
Walgreens Boots Alliance, Inc. | 26,305 | 2,240,002 | ||||||
Whole Foods Market, Inc. | 9,379 | 314,196 | ||||||
|
| |||||||
| 53,628,957 | ||||||||
|
| |||||||
Energy – 6.4% | ||||||||
Anadarko Petroleum Corp. | 14,882 | 722,968 | ||||||
Apache Corp. | 11,255 | 500,510 | ||||||
Baker Hughes, Inc. | 12,879 | 594,366 | ||||||
Cabot Oil & Gas Corp. | 11,278 | 199,508 | ||||||
Cameron International Corp.(a) | 5,533 | 349,686 | ||||||
Chesapeake Energy Corp. | 14,988 | 67,446 | ||||||
Chevron Corp. | 55,712 | 5,011,852 | ||||||
Cimarex Energy Co. | 2,958 | 264,386 | ||||||
Columbia Pipeline Group, Inc. | 10,604 | 212,080 | ||||||
ConocoPhillips | 37,227 | 1,738,129 | ||||||
CONSOL Energy, Inc. | 5,000 | 39,500 | ||||||
Devon Energy Corp. | 11,501 | 368,032 | ||||||
Diamond Offshore Drilling, Inc. | 1,546 | 32,621 | ||||||
Ensco PLC (Class A) | 8,711 | 134,062 | ||||||
EOG Resources, Inc. | 16,071 | 1,137,666 | ||||||
EQT Corp. | 4,157 | 216,704 | ||||||
Exxon Mobil Corp. | 123,575 | 9,632,671 | ||||||
FMC Technologies, Inc.(a) | 6,591 | 191,205 | ||||||
Halliburton Co. | 25,167 | 856,685 | ||||||
Helmerich & Payne, Inc. | 3,126 | 167,397 | ||||||
Hess Corp. | 6,757 | 327,579 | ||||||
Kinder Morgan, Inc. | 52,550 | 784,046 | ||||||
Marathon Oil Corp. | 20,488 | 257,944 | ||||||
Marathon Petroleum Corp. | 15,874 | 822,908 | ||||||
Murphy Oil Corp. | 3,879 | 87,084 | ||||||
National Oilwell Varco, Inc. | 11,016 | 368,926 | ||||||
Newfield Exploration Co.(a) | 4,215 | 137,240 | ||||||
Noble Energy, Inc. | 11,925 | 392,690 | ||||||
Occidental Petroleum Corp. | 23,109 | 1,562,399 | ||||||
ONEOK, Inc. | 5,796 | 142,929 | ||||||
Phillips 66 | 14,073 | 1,151,171 | ||||||
Pioneer Natural Resources Co. | 4,476 | 561,201 | ||||||
Range Resources Corp. | 5,859 | 144,190 | ||||||
Schlumberger, Ltd. | 37,986 | 2,649,523 | ||||||
Southwestern Energy Co.(a) | 10,456 | 74,342 | ||||||
Spectra Energy Corp. | 19,957 | 477,771 | ||||||
Tesoro Corp. | 3,416 | 359,944 | ||||||
Transocean, Ltd. | 10,910 | 135,066 | ||||||
Valero Energy Corp. | 14,623 | 1,033,992 | ||||||
Williams Cos., Inc. | 20,658 | 530,911 | ||||||
|
| |||||||
| 34,439,330 | ||||||||
|
| |||||||
Financials – 16.2% | ||||||||
ACE, Ltd. | 9,533 | 1,113,931 | ||||||
Affiliated Managers Group, Inc.(a) | 1,524 | 243,474 | ||||||
Aflac, Inc. | 12,753 | 763,905 | ||||||
Allstate Corp. | 11,839 | 735,083 | ||||||
American Express Co. | 24,512 | 1,704,810 | ||||||
American International Group, Inc. | 37,301 | 2,311,543 | ||||||
American Tower Corp. | 12,418 | 1,203,925 | ||||||
Ameriprise Financial, Inc. | 5,344 | 568,708 | ||||||
Aon PLC | 8,265 | 762,116 | ||||||
Apartment Investment & Management Co. (Class A) | 4,087 | 163,603 | ||||||
Assurant, Inc. | 1,685 | 135,710 | ||||||
AvalonBay Communities, Inc. | 3,969 | 730,812 | ||||||
Bank of America Corp. | 309,005 | 5,200,554 | ||||||
Bank of New York Mellon Corp. | 32,394 | 1,335,281 | ||||||
BB&T Corp. | 23,031 | 870,802 | ||||||
Berkshire Hathaway, Inc. (Class B)(a) | 55,584 | 7,339,311 | ||||||
BlackRock, Inc. | 3,716 | 1,265,372 | ||||||
Boston Properties, Inc. | 4,546 | 579,797 | ||||||
Capital One Financial Corp. | 15,895 | 1,147,301 | ||||||
CBRE Group, Inc. (Class A)(a) | 9,367 | 323,911 | ||||||
Charles Schwab Corp. | 35,204 | 1,159,268 | ||||||
Chubb Corp. | 6,679 | 885,903 | ||||||
Cincinnati Financial Corp. | 4,209 | 249,047 | ||||||
Citigroup, Inc. | 88,827 | 4,596,797 | ||||||
CME Group, Inc. | 9,963 | 902,648 | ||||||
Comerica, Inc. | 5,927 | 247,926 | ||||||
Crown Castle International Corp. | 9,858 | 852,224 | ||||||
Discover Financial Services | 12,928 | 693,199 | ||||||
E*TRADE Financial Corp.(a) | 8,242 | 244,293 | ||||||
Equinix, Inc. | 1,943 | 587,563 | ||||||
Equity Residential | 10,719 | 874,563 | ||||||
Essex Property Trust, Inc. | 1,945 | 465,652 | ||||||
Fifth Third Bancorp | 25,362 | 509,776 | ||||||
Franklin Resources, Inc. | 12,189 | 448,799 | ||||||
General Growth Properties, Inc. | 17,158 | 466,869 | ||||||
Goldman Sachs Group, Inc. | 11,646 | 2,098,959 | ||||||
Hartford Financial Services Group, Inc. | 12,967 | 563,546 | ||||||
HCP, Inc. | 13,823 | 528,591 | ||||||
Host Hotels & Resorts, Inc. | 23,662 | 362,975 | ||||||
Huntington Bancshares, Inc. | 24,691 | 273,082 | ||||||
Intercontinental Exchange, Inc. | 3,237 | 829,514 | ||||||
Invesco, Ltd. | 13,411 | 449,000 | ||||||
Iron Mountain, Inc. | 5,481 | 148,042 | ||||||
JPMorgan Chase & Co. | 109,343 | 7,219,918 | ||||||
KeyCorp | 27,096 | 357,396 | ||||||
Kimco Realty Corp. | 11,353 | 300,400 | ||||||
Legg Mason, Inc. | 3,827 | 150,133 | ||||||
Leucadia National Corp. | 10,227 | 177,848 | ||||||
Lincoln National Corp. | 6,982 | 350,915 | ||||||
Loews Corp. | 8,219 | 315,610 | ||||||
M&T Bank Corp. | 4,563 | 552,944 | ||||||
Macerich Co. | 4,355 | 351,405 | ||||||
Marsh & McLennan Cos., Inc. | 15,619 | 866,074 | ||||||
McGraw Hill Financial, Inc. | 8,068 | 795,343 | ||||||
MetLife, Inc. | 33,770 | 1,628,052 | ||||||
See accompanying notes to financial statements.
18
Table of Contents
State Street Equity 500 Index II Portfolio
Schedule of Investments — (continued)
December 31, 2015
Security Description | Shares | Value | ||||||
COMMON STOCKS – (continued) | ||||||||
Financials – (continued) | ||||||||
Moody’s Corp. | 4,932 | $ | 494,877 | |||||
Morgan Stanley | 44,575 | 1,417,931 | ||||||
Nasdaq, Inc. | 3,075 | 178,873 | ||||||
Navient Corp. | 9,313 | 106,634 | ||||||
Northern Trust Corp. | 6,796 | 489,924 | ||||||
People’s United Financial, Inc. | 7,666 | 123,806 | ||||||
Plum Creek Timber Co., Inc. | 5,825 | 277,969 | ||||||
PNC Financial Services Group, Inc. | 15,075 | 1,436,798 | ||||||
Principal Financial Group, Inc. | 8,665 | 389,752 | ||||||
Progressive Corp. | 16,649 | 529,438 | ||||||
Prologis, Inc. | 15,552 | 667,492 | ||||||
Prudential Financial, Inc. | 13,202 | 1,074,775 | ||||||
Public Storage | 4,435 | 1,098,549 | ||||||
Realty Income Corp. | 7,500 | 387,225 | ||||||
Regions Financial Corp. | 37,146 | 356,602 | ||||||
Simon Property Group, Inc. | 9,080 | 1,765,515 | ||||||
SL Green Realty Corp. | 3,000 | 338,940 | ||||||
State Street Corp.(c) | 12,078 | 801,496 | ||||||
SunTrust Banks, Inc. | 15,336 | 656,994 | ||||||
Synchrony Financial(a) | 25,675 | 780,777 | ||||||
T Rowe Price Group, Inc. | 7,655 | 547,256 | ||||||
Torchmark Corp. | 3,012 | 172,166 | ||||||
Travelers Cos., Inc. | 9,106 | 1,027,703 | ||||||
Unum Group | 7,205 | 239,854 | ||||||
US Bancorp | 49,922 | 2,130,172 | ||||||
Ventas, Inc. | 9,897 | 558,488 | ||||||
Vornado Realty Trust | 5,268 | 526,589 | ||||||
Wells Fargo & Co. | 138,103 | 7,507,279 | ||||||
Welltower, Inc. | 10,419 | 708,805 | ||||||
Weyerhaeuser Co. | 15,967 | 478,691 | ||||||
Willis Group Holdings PLC | 100 | 4,857 | ||||||
XL Group PLC | 8,448 | 330,993 | ||||||
Zions Bancorp | 6,095 | 166,393 | ||||||
|
| |||||||
| 87,777,836 | ||||||||
|
| |||||||
Health Care – 14.9% |
| |||||||
Abbott Laboratories | 44,947 | 2,018,570 | ||||||
AbbVie, Inc. | 48,243 | 2,857,915 | ||||||
Aetna, Inc. | 10,244 | 1,107,581 | ||||||
Agilent Technologies, Inc. | 10,593 | 442,893 | ||||||
Alexion Pharmaceuticals, Inc.(a) | 6,773 | 1,291,950 | ||||||
Allergan PLC(a) | 11,606 | 3,626,875 | ||||||
AmerisourceBergen Corp. | 6,134 | 636,157 | ||||||
Amgen, Inc. | 22,354 | 3,628,725 | ||||||
Anthem, Inc. | 7,719 | 1,076,337 | ||||||
Baxalta, Inc. | 16,216 | 632,911 | ||||||
Baxter International, Inc. | 16,216 | 618,640 | ||||||
Becton Dickinson and Co. | 6,236 | 960,905 | ||||||
Biogen, Inc.(a) | 6,484 | 1,986,374 | ||||||
Boston Scientific Corp.(a) | 39,857 | 734,963 | ||||||
Bristol-Myers Squibb Co. | 50,004 | 3,439,775 | ||||||
Cardinal Health, Inc. | 9,633 | 859,938 | ||||||
Celgene Corp.(a) | 23,171 | 2,774,959 | ||||||
Cerner Corp.(a) | 9,137 | 549,773 | ||||||
Cigna Corp. | 7,585 | 1,109,913 | ||||||
C.R. Bard, Inc. | 2,235 | 423,398 | ||||||
DaVita HealthCare Partners, Inc.(a) | 4,728 | 329,589 | ||||||
DENTSPLY International, Inc. | 3,834 | 233,299 | ||||||
Edwards Lifesciences Corp.(a) | 6,510 | 514,160 | ||||||
Eli Lilly & Co. | 28,618 | 2,411,353 | ||||||
Endo International PLC(a) | 6,300 | 385,686 | ||||||
Express Scripts Holding Co.(a) | 20,467 | 1,789,021 | ||||||
Gilead Sciences, Inc. | 43,252 | 4,376,670 | ||||||
HCA Holdings, Inc.(a) | 9,900 | 669,537 | ||||||
Henry Schein, Inc.(a) | 2,500 | 395,475 | ||||||
Humana, Inc. | 4,390 | 783,659 | ||||||
Illumina, Inc.(a) | 4,300 | 825,364 | ||||||
Intuitive Surgical, Inc.(a) | 1,148 | 626,992 | ||||||
Johnson & Johnson | 82,108 | 8,434,134 | ||||||
Laboratory Corp. of America Holdings(a) | 3,175 | 392,557 | ||||||
Mallinckrodt PLC(a) | 3,200 | 238,816 | ||||||
McKesson Corp. | 6,824 | 1,345,898 | ||||||
Medtronic PLC | 41,593 | 3,199,334 | ||||||
Merck & Co., Inc. | 83,072 | 4,387,863 | ||||||
Mylan NV(a) | 12,402 | 670,576 | ||||||
Patterson Cos., Inc. | 3,135 | 141,733 | ||||||
PerkinElmer, Inc. | 3,886 | 208,173 | ||||||
Perrigo Co. PLC | 4,386 | 634,654 | ||||||
Pfizer, Inc. | 182,933 | 5,905,077 | ||||||
Quest Diagnostics, Inc. | 4,042 | 287,548 | ||||||
Regeneron Pharmaceuticals, Inc.(a) | 2,342 | 1,271,402 | ||||||
St Jude Medical, Inc. | 8,373 | 517,200 | ||||||
Stryker Corp. | 9,594 | 891,666 | ||||||
Tenet Healthcare Corp.(a) | 2,590 | 78,477 | ||||||
Thermo Fisher Scientific, Inc. | 11,612 | 1,647,162 | ||||||
UnitedHealth Group, Inc. | 28,574 | 3,361,445 | ||||||
Universal Health Services, Inc. (Class B) | 2,500 | 298,725 | ||||||
Varian Medical Systems, Inc.(a) | 3,229 | 260,903 | ||||||
Vertex Pharmaceuticals, Inc.(a) | 7,252 | 912,519 | ||||||
Waters Corp.(a) | 2,350 | 316,263 | ||||||
Zimmer Biomet Holdings, Inc. | 5,125 | 525,774 | ||||||
Zoetis, Inc. | 13,120 | 628,710 | ||||||
|
| |||||||
| 80,675,966 | ||||||||
|
| |||||||
Industrials – 9.9% |
| |||||||
3M Co. | 18,129 | 2,730,953 | ||||||
ADT Corp. | 5,794 | 191,086 | ||||||
Allegion PLC | 2,496 | 164,536 | ||||||
American Airlines Group, Inc. | 18,100 | 766,535 | ||||||
AMETEK, Inc. | 7,299 | 391,153 | ||||||
Boeing Co. | 18,564 | 2,684,169 | ||||||
Caterpillar, Inc. | 17,624 | 1,197,727 | ||||||
C.H. Robinson Worldwide, Inc. | 4,079 | 252,980 | ||||||
Cintas Corp. | 2,566 | 233,634 | ||||||
CSX Corp. | 29,055 | 753,977 | ||||||
Cummins, Inc. | 4,914 | 432,481 | ||||||
Danaher Corp. | 17,994 | 1,671,283 | ||||||
Deere & Co. | 9,183 | 700,387 | ||||||
Delta Air Lines, Inc. | 23,334 | 1,182,800 | ||||||
Dover Corp. | 4,550 | 278,961 | ||||||
Dun & Bradstreet Corp. | 1,255 | 130,432 | ||||||
Eaton Corp. PLC | 13,825 | 719,453 | ||||||
Emerson Electric Co. | 19,379 | 926,898 | ||||||
Equifax, Inc. | 3,288 | 366,185 | ||||||
Expeditors International of Washington, Inc. | 5,776 | 260,498 | ||||||
Fastenal Co. | 8,758 | 357,502 | ||||||
FedEx Corp. | 7,750 | 1,154,672 | ||||||
Flowserve Corp. | 3,545 | 149,174 | ||||||
See accompanying notes to financial statements.
19
Table of Contents
State Street Equity 500 Index II Portfolio
Schedule of Investments — (continued)
December 31, 2015
Security Description | Shares | Value | ||||||
COMMON STOCKS – (continued) | ||||||||
Industrials – (continued) | ||||||||
Fluor Corp. | 4,804 | $ | 226,845 | |||||
General Dynamics Corp. | 8,872 | 1,218,658 | ||||||
General Electric Co. | 280,088 | 8,724,741 | ||||||
Honeywell International, Inc. | 22,978 | 2,379,831 | ||||||
Illinois Tool Works, Inc. | 10,100 | 936,068 | ||||||
Ingersoll-Rand PLC | 8,284 | 458,022 | ||||||
Jacobs Engineering Group, Inc.(a) | 4,343 | 182,189 | ||||||
JB Hunt Transport Services, Inc. | 2,400 | 176,064 | ||||||
Kansas City Southern | 2,996 | 223,711 | ||||||
L-3 Communications Holdings, Inc. | 2,438 | 291,365 | ||||||
Lockheed Martin Corp. | 7,803 | 1,694,421 | ||||||
Masco Corp. | 9,984 | 282,547 | ||||||
Nielsen Holdings PLC | 11,525 | 537,065 | ||||||
Norfolk Southern Corp. | 8,887 | 751,751 | ||||||
Northrop Grumman Corp. | 5,525 | 1,043,175 | ||||||
PACCAR, Inc. | 10,539 | 499,549 | ||||||
Parker-Hannifin Corp. | 3,989 | 386,853 | ||||||
Pentair PLC | 5,504 | 272,613 | ||||||
Pitney Bowes, Inc. | 4,806 | 99,244 | ||||||
Precision Castparts Corp. | 4,029 | 934,768 | ||||||
Quanta Services, Inc.(a) | 4,707 | 95,317 | ||||||
Raytheon Co. | 8,946 | 1,114,045 | ||||||
Republic Services, Inc. | 7,789 | 342,638 | ||||||
Robert Half International, Inc. | 4,166 | 196,385 | ||||||
Rockwell Automation, Inc. | 4,226 | 433,630 | ||||||
Rockwell Collins, Inc. | 3,631 | 335,141 | ||||||
Roper Technologies, Inc. | 2,965 | 562,727 | ||||||
Ryder System, Inc. | 1,366 | 77,630 | ||||||
Snap-on, Inc. | 1,640 | 281,145 | ||||||
Southwest Airlines Co. | 19,459 | 837,905 | ||||||
Stanley Black & Decker, Inc. | 4,757 | 507,715 | ||||||
Stericycle, Inc.(a) | 2,296 | 276,898 | ||||||
Textron, Inc. | 8,933 | 375,275 | ||||||
Tyco International PLC | 12,664 | 403,855 | ||||||
Union Pacific Corp. | 25,098 | 1,962,664 | ||||||
United Continental Holdings, Inc.(a) | 11,200 | 641,760 | ||||||
United Parcel Service, Inc. (Class B) | 21,091 | 2,029,587 | ||||||
United Rentals, Inc.(a) | 2,500 | 181,350 | ||||||
United Technologies Corp. | 24,951 | 2,397,043 | ||||||
Verisk Analytics, Inc.(a) | 4,900 | 376,712 | ||||||
Waste Management, Inc. | 12,435 | 663,656 | ||||||
WW Grainger, Inc. | 1,557 | 315,433 | ||||||
Xylem, Inc. | 4,758 | 173,667 | ||||||
|
| |||||||
| 53,599,134 | ||||||||
|
| |||||||
Information Technology – 20.4% |
| |||||||
Accenture PLC (Class A) | 18,818 | 1,966,481 | ||||||
Activision Blizzard, Inc. | 15,000 | 580,650 | ||||||
Adobe Systems, Inc.(a) | 14,544 | 1,366,263 | ||||||
Akamai Technologies, Inc.(a) | 5,790 | 304,728 | ||||||
Alliance Data Systems Corp.(a) | 1,896 | 524,377 | ||||||
Alphabet, Inc. (Class C)(a) | 8,887 | 6,744,167 | ||||||
Alphabet, Inc. (Class A)(a) | 8,667 | 6,743,013 | ||||||
Amphenol Corp. (Class A) | 9,220 | 481,561 | ||||||
Analog Devices, Inc. | 9,351 | 517,297 | ||||||
Apple, Inc. | 165,724 | 17,444,108 | ||||||
Applied Materials, Inc. | 35,754 | 667,527 | ||||||
Autodesk, Inc.(a) | 6,806 | 414,690 | ||||||
Automatic Data Processing, Inc. | 13,652 | 1,156,597 | ||||||
Avago Technologies, Ltd. | 7,682 | 1,115,042 | ||||||
Broadcom Corp. (Class A) | 16,924 | 978,546 | ||||||
CA, Inc. | 8,940 | 255,326 | ||||||
Cisco Systems, Inc. | 152,290 | 4,135,435 | ||||||
Citrix Systems, Inc.(a) | 4,489 | 339,593 | ||||||
Cognizant Technology Solutions Corp. (Class A)(a) | 17,841 | 1,070,817 | ||||||
Corning, Inc. | 36,426 | 665,867 | ||||||
CSRA, Inc. | 4,012 | 120,360 | ||||||
eBay, Inc.(a) | 33,845 | 930,061 | ||||||
Electronic Arts, Inc.(a) | 9,279 | 637,653 | ||||||
EMC Corp. | 56,310 | 1,446,041 | ||||||
F5 Networks, Inc.(a) | 1,941 | 188,199 | ||||||
Facebook, Inc. (Class A)(a) | 67,293 | 7,042,885 | ||||||
Fidelity National Information Services, Inc. | 8,391 | 508,495 | ||||||
First Solar, Inc.(a) | 1,821 | 120,168 | ||||||
Fiserv, Inc.(a) | 7,162 | 655,037 | ||||||
FLIR Systems, Inc. | 3,161 | 88,729 | ||||||
Harris Corp. | 4,002 | 347,774 | ||||||
Hewlett Packard Enterprise Co. | 52,853 | 803,366 | ||||||
HP, Inc. | 52,853 | 625,780 | ||||||
Intel Corp. | 140,236 | 4,831,130 | ||||||
International Business Machines Corp. | 26,395 | 3,632,480 | ||||||
Intuit, Inc. | 8,237 | 794,870 | ||||||
Juniper Networks, Inc. | 10,749 | 296,672 | ||||||
KLA-Tencor Corp. | 4,532 | 314,294 | ||||||
Lam Research Corp. | 5,077 | 403,215 | ||||||
Linear Technology Corp. | 6,742 | 286,333 | ||||||
MasterCard, Inc. (Class A) | 29,251 | 2,847,877 | ||||||
Microchip Technology, Inc. | 6,883 | 320,335 | ||||||
Micron Technology, Inc.(a) | 32,134 | 455,017 | ||||||
Microsoft Corp.(b) | 237,258 | 13,163,074 | ||||||
Motorola Solutions, Inc. | 4,872 | 333,488 | ||||||
NetApp, Inc. | 8,514 | 225,876 | ||||||
NVIDIA Corp. | 15,944 | 525,514 | ||||||
Oracle Corp. | 95,835 | 3,500,853 | ||||||
Paychex, Inc. | 9,607 | 508,114 | ||||||
PayPal Holdings, Inc.(a) | 32,545 | 1,178,129 | ||||||
Qorvo, Inc.(a) | 3,700 | 188,330 | ||||||
QUALCOMM, Inc. | 45,426 | 2,270,619 | ||||||
Red Hat, Inc.(a) | 5,470 | 452,971 | ||||||
salesforce.com, Inc.(a) | 18,195 | 1,426,488 | ||||||
SanDisk Corp. | 5,861 | 445,377 | ||||||
Seagate Technology PLC | 8,624 | 316,156 | ||||||
Skyworks Solutions, Inc. | 5,700 | 437,931 | ||||||
Symantec Corp. | 21,360 | 448,560 | ||||||
TE Connectivity, Ltd. | 11,851 | 765,693 | ||||||
Teradata Corp.(a) | 3,407 | 90,013 | ||||||
Texas Instruments, Inc. | 29,693 | 1,627,473 | ||||||
Total System Services, Inc. | 5,476 | 272,705 | ||||||
VeriSign, Inc.(a) | 3,301 | 288,375 | ||||||
Visa, Inc. (Class A) | 57,560 | 4,463,778 | ||||||
Western Digital Corp. | 6,553 | 393,508 | ||||||
Western Union Co. | 14,645 | 262,292 | ||||||
Xerox Corp. | 28,809 | 306,240 | ||||||
Xilinx, Inc. | 7,560 | 355,093 | ||||||
Yahoo!, Inc.(a) | 25,582 | 850,857 | ||||||
|
| |||||||
| 110,266,363 | ||||||||
|
| |||||||
See accompanying notes to financial statements.
20
Table of Contents
State Street Equity 500 Index II Portfolio
Schedule of Investments — (continued)
December 31, 2015
Security Description | Shares | Value | ||||||
COMMON STOCKS – (continued) | ||||||||
Materials – 2.7% | ||||||||
Air Products & Chemicals, Inc. | 5,702 | $ | 741,887 | |||||
Airgas, Inc. | 1,760 | 243,443 | ||||||
Alcoa, Inc. | 42,060 | 415,132 | ||||||
Avery Dennison Corp. | 2,870 | 179,834 | ||||||
Ball Corp. | 3,766 | 273,901 | ||||||
C.F. Industries Holdings, Inc. | 6,720 | 274,243 | ||||||
Dow Chemical Co. | 33,638 | 1,731,684 | ||||||
Eastman Chemical Co. | 4,136 | 279,221 | ||||||
Ecolab, Inc. | 7,801 | 892,278 | ||||||
E.I. du Pont de Nemours & Co. | 26,518 | 1,766,099 | ||||||
FMC Corp. | 3,878 | 151,746 | ||||||
Freeport-McMoRan, Inc. | 34,240 | 231,805 | ||||||
International Flavors & Fragrances, Inc. | 2,251 | 269,310 | ||||||
International Paper Co. | 12,503 | 471,363 | ||||||
LyondellBasell Industries NV (Class A) | 10,348 | 899,241 | ||||||
Martin Marietta Materials, Inc. | 2,145 | 292,964 | ||||||
Monsanto Co. | 12,761 | 1,257,214 | ||||||
Mosaic Co. | 10,184 | 280,977 | ||||||
Newmont Mining Corp. | 16,933 | 304,625 | ||||||
Nucor Corp. | 9,648 | 388,814 | ||||||
Owens-Illinois, Inc.(a) | 3,537 | 61,615 | ||||||
PPG Industries, Inc. | 7,954 | 786,014 | ||||||
Praxair, Inc. | 8,411 | 861,287 | ||||||
Sealed Air Corp. | 6,723 | 299,846 | ||||||
Sherwin-Williams Co. | 2,309 | 599,417 | ||||||
Vulcan Materials Co. | 3,671 | 348,635 | ||||||
AT&T, Inc. | 182,387 | 6,275,937 | ||||||
WestRock Co. | 7,836 | 357,478 | ||||||
|
| |||||||
| 14,660,073 | ||||||||
|
| |||||||
Telecommunication Services – 2.4% |
| |||||||
AT&T, Inc. | 182,387 | 6,275,937 | ||||||
CenturyLink, Inc. | 17,492 | 440,099 | ||||||
Frontier Communications Corp. | 29,906 | 139,661 | ||||||
Level 3 Communications, Inc.(a) | 8,700 | 472,932 | ||||||
Verizon Communications, Inc. | 120,515 | 5,570,203 | ||||||
|
| |||||||
| 12,898,832 | ||||||||
|
| |||||||
Utilities – 2.9% | ||||||||
AES Corp. | 22,836 | 218,541 | ||||||
AGL Resources, Inc. | 3,698 | 235,969 | ||||||
Ameren Corp. | 6,604 | 285,491 | ||||||
American Electric Power Co., Inc. | 14,509 | 845,439 | ||||||
CenterPoint Energy, Inc. | 12,276 | 225,387 | ||||||
CMS Energy Corp. | 8,455 | 305,056 | ||||||
Consolidated Edison, Inc. | 8,752 | 562,491 | ||||||
Dominion Resources, Inc. | 17,394 | 1,176,530 | ||||||
DTE Energy Co. | 5,345 | 428,616 | ||||||
Duke Energy Corp. | 20,892 | 1,491,480 | ||||||
Edison International | 9,714 | 575,166 | ||||||
Entergy Corp. | 5,798 | 396,351 | ||||||
Eversource Energy | 9,517 | 486,033 | ||||||
Exelon Corp. | 25,484 | 707,691 | ||||||
FirstEnergy Corp. | 13,493 | 428,133 | ||||||
NextEra Energy, Inc. | 13,464 | 1,398,775 | ||||||
NiSource, Inc. | 10,904 | 212,737 | ||||||
NRG Energy, Inc. | 7,802 | 91,830 | ||||||
Pepco Holdings, Inc. | 6,641 | 172,732 | ||||||
PG&E Corp. | 14,814 | 787,957 | ||||||
Pinnacle West Capital Corp. | 2,904 | 187,250 | ||||||
PPL Corp. | 19,819 | 676,422 | ||||||
Public Service Enterprise Group, Inc. | 14,988 | 579,886 | ||||||
SCANA Corp. | 4,699 | 284,243 | ||||||
Sempra Energy | 6,962 | 654,498 | ||||||
Southern Co | 26,659 | 1,247,375 | ||||||
TECO Energy, Inc. | 6,601 | 175,917 | ||||||
WEC Energy Group, Inc. | 9,382 | 481,390 | ||||||
Xcel Energy, Inc. | 15,151 | 544,072 | ||||||
|
| |||||||
| 15,863,458 | ||||||||
|
| |||||||
TOTAL COMMON STOCKS |
| 532,799,000 | ||||||
|
| |||||||
SHORT-TERM INVESTMENT – 1.6% |
| |||||||
State Street Institutional U.S. Government Money Market Fund, Premier Class 0.09%(b)(c)(d) | 8,664,695 | 8,664,695 | ||||||
|
| |||||||
TOTAL INVESTMENTS – 100.0%(e) |
| 541,463,695 | ||||||
Liabilities in Excess of | (128,734 | ) | ||||||
|
| |||||||
NET ASSETS – 100.0% |
| $ | 541,334,961 | |||||
|
| |||||||
| (a) | Non-income producing security |
| (b) | All or part of this security has been designated as collateral for futures contracts. |
| (c) | Affiliated issuer (Note 4). |
| (d) | The rate shown is the annualized seven-day yield at period end. |
| (e) | Unless otherwise indicated, the values of the securities of the Fund are determined based on Level 1 inputs. |
| (f) | Amount represents less than 0.05% of net assets. |
At December 31, 2015, open futures contracts purchased were as follows:
Futures | Expiration Date | Number of Contracts | Notional Value | Unrealized Appreciation | ||||||||||||
S&P 500 Financial Futures Contracts (long)* | 03/18/2016 | 97 | $ | 9,871,690 | $ | 144,320 | ||||||||||
|
| |||||||||||||||
| * | Futures contracts are valued at Level 1 inputs. |
See accompanying notes to financial statements.
21
Table of Contents
State Street Equity 500 Index II Portfolio
Statement of Assets and Liabilities
December 31, 2015
Assets | ||||
Investments in unaffiliated issuers, at value (cost $317,308,793) | $ | 531,997,504 | ||
Investments in non-controlled affiliates, at value (cost $9,161,575) (Note 4) | 9,466,191 | |||
|
| |||
Total investments at value (cost $326,470,368) | 541,463,695 | |||
Cash | 11,241 | |||
Cash at broker | 446,364 | |||
Receivable for investment securities sold | 7,334 | |||
Receivable for fund shares sold | 205,559 | |||
Dividends receivable | 715,017 | |||
Dividend receivable from non-controlled affiliates (Note 4) | 4,107 | |||
Receivable from advisor (Note 4) | 32,540 | |||
Prepaid expenses and other assets | 6,068 | |||
|
| |||
Total assets | 542,891,925 | |||
|
| |||
Liabilities | ||||
Payable for investment securities purchased | 4,898 | |||
Daily variation margin on futures contracts | 93,120 | |||
Payable for fund shares repurchased | 1,405,678 | |||
Professional fees payable | 34,014 | |||
Administration and custody fees payable (Note 4) | 10,117 | |||
Accrued expenses and other liabilities | 9,137 | |||
|
| |||
Total liabilities | 1,556,964 | |||
|
| |||
Net Assets | $ | 541,334,961 | ||
|
| |||
Net Assets Consist of: | ||||
Paid in capital | $ | 325,811,350 | ||
Accumulated net realized gain on investments | 385,964 | |||
Unrealized appreciation on investments and futures contracts | 215,137,647 | |||
|
| |||
Net Assets | $ | 541,334,961 | ||
|
| |||
Net asset value, offering, and redemption price per share | $ | 10.32 | ||
|
| |||
Shares outstanding | 52,437,412 |
See accompanying notes to financial statements.
22
Table of Contents
State Street Equity 500 Index II Portfolio
Statement of Operations
Year Ended December 31, 2015
Investment Income | ||||
Dividend income – unaffiliated issuers (net of foreign taxes withheld of $719) | $ | 10,143,360 | ||
Dividend income – non-controlled affiliated issuer | 23,011 | |||
|
| |||
Total investment income | 10,166,371 | |||
|
| |||
Expenses | ||||
Administration and custody fees (Note 4) | 66,316 | |||
Professional fees | 65,834 | |||
Printing fees | 51,305 | |||
Other expenses | 10,030 | |||
|
| |||
Total expenses | 193,485 | |||
Less: Expenses reimbursed and waived by the Adviser (Note 4) | (45,211 | ) | ||
|
| |||
Total net expenses | 148,274 | |||
|
| |||
Net Investment Income | 10,018,097 | |||
|
| |||
Realized and Unrealized Gain (Loss) | ||||
Net realized gain (loss) on: | ||||
Investments | 7,707,158 | |||
Futures contracts | (232,078 | ) | ||
|
| |||
| 7,475,080 | ||||
|
| |||
Net change in net unrealized appreciation (depreciation) on: | ||||
Investments | (13,079,555 | ) | ||
Futures contracts | 29,509 | |||
|
| |||
| (13,050,046 | ) | |||
|
| |||
Net Increase in Net Assets Resulting From Operations | $ | 4,443,131 | ||
|
|
See accompanying notes to financial statements.
23
Table of Contents
State Street Equity 500 Index II Portfolio
Statements of Changes in Net Assets
| Year Ended December 31, 2015 | For the Period August 11, 2014* – December 31, 2014 | |||||||
Increase (Decrease) in Net Assets From Operations: | ||||||||
Net investment income | $ | 10,018,097 | $ | 3,240,871 | ||||
Net realized gain on investments and futures contracts | 7,475,080 | 4,281,757 | ||||||
Net change in net unrealized appreciation (depreciation) on investments and futures contracts | (13,050,046 | ) | 20,415,808 | |||||
|
|
|
| |||||
Net increase in net assets from operations | 4,443,131 | 27,938,436 | ||||||
|
|
|
| |||||
Distributions From: | ||||||||
Net investment income | (10,151,317 | ) | (3,305,865 | ) | ||||
Net realized gain on investments | (8,178,301 | ) | (2,994,358 | ) | ||||
|
|
|
| |||||
Total distributions | (18,329,618 | ) | (6,300,223 | ) | ||||
|
|
|
| |||||
Fund Share Transactions | ||||||||
In-kind subscription (Note 7) | – | 387,955,841 | ||||||
Shares sold | 169,454,825 | 30,018,341 | ||||||
Reinvestment of distributions | 18,329,618 | 6,300,223 | ||||||
Shares redeemed | (59,273,359 | ) | (19,202,254 | ) | ||||
|
|
|
| |||||
Net increase in net assets from fund transactions | 128,511,084 | 405,072,151 | ||||||
|
|
|
| |||||
Net Increase in Net Assets | 114,624,597 | 426,710,364 | ||||||
Net Assets | ||||||||
Beginning of period | 426,710,364 | – | ||||||
|
|
|
| |||||
End of period | $ | 541,334,961 | $ | 426,710,364 | ||||
|
|
|
| |||||
Change in Shares | ||||||||
In-kind subscriptions (Note 7) | – | 39,080,818 | ||||||
Shares sold | 15,808,989 | 2,613,803 | ||||||
Reinvestment of distributions | 1,811,227 | 596,612 | ||||||
Shares redeemed | (5,623,888 | ) | (1,850,149 | ) | ||||
|
|
|
| |||||
Net increase in net assets from share transactions | 11,996,328 | 40,441,084 | ||||||
|
|
|
| |||||
| * | Commencement of operations |
See accompanying notes to financial statements.
24
Table of Contents
State Street Equity 500 Index II Portfolio
Financial Highlights
| Year Ended 12/31/15 | For the Period 8/11/14* – 12/31/14 | |||||||
Per Share Operating Performance: | ||||||||
Net asset value, beginning of period | $ | 10.55 | $ | 10.00 | ||||
|
|
|
| |||||
Net investment income(a) | 0.22 | 0.08 | ||||||
Net realized and unrealized gain (loss) on investments | (0.09 | ) | 0.63 | |||||
|
|
|
| |||||
Total from investment operations | 0.13 | 0.71 | ||||||
|
|
|
| |||||
Distributions From: | ||||||||
Net investment income | (0.20 | ) | (0.08 | ) | ||||
Net realized gain on investments | (0.16 | ) | (0.08 | ) | ||||
|
|
|
| |||||
Total distributions | (0.36 | ) | (0.16 | ) | ||||
|
|
|
| |||||
Net increase (decrease) in net assets | (0.23 | ) | 0.55 | |||||
|
|
|
| |||||
Net asset value, end of period | $ | 10.32 | $ | 10.55 | ||||
|
|
|
| |||||
Total Return(b) | 1.29 | % | 7.12 | % | ||||
Ratios and Supplemental Data: | ||||||||
Net assets, end of period (000s) | $ | 541,335 | $ | 426,710 | ||||
Expenses before waivers and payments by affiliates | 0.039 | % | 0.042 | %(c) | ||||
Expenses net of waivers and payments by affiliates | 0.030 | % | 0.030 | %(c) | ||||
Net investment income | 2.05 | % | 2.06 | %(c) | ||||
Portfolio turnover | 5 | % | 4 | %(d)(e) | ||||
| * | Commencement of operations |
| (a) | Net investment income per share is calculated using the average shares method. |
| (b) | Total return is calculated assuming a purchase of shares at net asset value on the first day and a sale at net asset value on the last day of each period reported. Distributions are assumed, for the purpose of this calculation, to be reinvested at net asset value per share on the respective payment dates. Total return for period of less than one year is not annualized. Results represent past performance and are not indicative of future results. |
| (c) | Annualized. |
| (d) | Portfolio turnover rate excludes in-kind security transactions (Note 7). |
| (e) | Not annualized. |
See accompanying notes to financial statements.
25
Table of Contents
State Street Institutional Investment Trust
Notes to Financial Statements
December 31, 2015
| 1. | Organization |
State Street Institutional Investment Trust (the “Trust”) is registered under the Investment Company Act of 1940, as amended (“1940 Act”), as an open-end management investment company, and was organized as a Massachusetts business trust on February 16, 2000. The Trust consists of forty-five (45) series and corresponding classes, each of which have the same rights and privileges, including the same voting rights. The Declaration of Trust permits the Board of Trustees of the Trust (the “Board”) to authorize the issuance of an unlimited number of shares, with no par value. The financial statements herein relate to the following funds:
| Fund | Classes | Commencement of Operations: | ||
State Street Equity 500 Index Fund (diversified) | Administrative Shares Service Shares Class A Class I Class K Class R Shares | April 11, 2001 March 10, 2003 September 17, 2014 September 17, 2014 September 17, 2014 June 7, 2005 | ||
State Street Equity 500 Index II Portfolio (diversified) | N/A | August 11, 2014 |
The State Street Equity 500 Index Fund (the “Fund”) offers Administrative, Class A, I, K, R and Service Shares Class. Class A shares of the Funds are available to the general public for investment through transaction-based financial intermediaries. Class A shares impose a 5.25% sales charge (as a percentage of offering price) and may be subject to a 1% contingent deferred sales charge (“CDSC”) if no initial sales charge was paid at the time of purchase of an investment of $1,000,000 or more and the shares are redeemed within 18 months of purchase. Class I and K shares are sold only to certain eligible investors.
State Street Equity 500 Index II Portfolio’s (the “Portfolio”) investment objective is to seek to provide investment results that, before expenses, correspond generally to the total return of the Standard & Poor’s 500 Index (the “S&P 500® Index”). The Portfolio uses a passive management strategy designed to track the performance of the S&P 500 Index. The S&P 500 Index is a well-known, unmanaged, stock index that includes common stocks of 500 companies from several industrial sectors representing a significant portion of the market value of all stocks publicly traded in the United States. There is no assurance that the Portfolio will achieve its objective.
The Fund invests as part of a “master-feeder” structure, and currently seeks to achieve its investment objective by investing substantially all of its investable assets in the Portfolio (86.08% at December 31, 2015), a separate mutual fund, that has a substantially similar investment objective, investment policies, and risks as the Fund. The performance of the Fund was directly affected by the performance of the Portfolio.
Prior to August 11, 2014, the Fund invested all of its investable assets in interests of the State Street Equity 500 Index Portfolio (the “Equity 500 Portfolio”), a series of a separately registered investment company called State Street Master Funds. The investment objective and policies of the Equity 500 Portfolio were substantially similar to those of the Fund. The value of the Fund’s investment in the Portfolio reflected the Fund’s proportionate interest in the net assets of the Equity 500 Portfolio. The performance of the Fund was directly affected by the performance of the Equity 500 Portfolio.
26
Table of Contents
State Street Institutional Investment Trust
Notes to Financial Statements — (continued)
December 31, 2015
Under the Trust’s organizational documents, its officers and trustees are indemnified against certain liabilities arising out of the performance of their duties to the Trust. Additionally, in the normal course of business, the Trust enters into contracts with service providers that contain general indemnification clauses. The Trust’s maximum exposure under these arrangements is unknown as this could involve future claims that may be made against the Trust that have not yet occurred.
| 2. | Summary of Significant Accounting Policies |
The following is a summary of significant accounting policies followed by the Trust in the preparation of its financial statements:
The preparation of financial statements in accordance with U.S. generally accepted accounting principles (“U.S. GAAP”) requires management to make estimates and assumptions that affect the reported amounts and disclosures in the financial statements. Actual results could differ from those estimates. The Fund and the Portfolio are investment companies under U.S. GAAP and follow the accounting and reporting guidance applicable to investment companies in Financial Accounting Standards Board (“FASB”) Accounting Standards Codification (“ASC”) 946, Financial Services Investment Companies (“ASC 946”).
Security valuation – The Fund records its investment in the Portfolio at net asset value per share. The Portfolio’s investments are valued at fair value each day that the Portfolio’s listing exchange is open and, for financial reporting purposes, as of the report date should the reporting period end on a day that the Portfolio’s listing exchange is not open. Fair value is generally defined as the price a fund would receive to sell an asset or pay to transfer a liability in an orderly transaction between market participants at the measurement date. By its nature, a fair value price is a good faith estimate of the valuation in a current sale and may not reflect an actual market price. The investments of the Portfolio are valued pursuant to policy and procedures developed by the Oversight Committee (the “Committee”) and approved by the Board. The Committee provides oversight of the valuation of investments for the Portfolio. The Board has responsibility for determining the fair value of investments. The members of the Committee are approved by the Board.
Valuation techniques used to value the Portfolio’s investments by major category are as follows:
| • | Equity investments (including registered investment companies that are exchange-traded funds) traded on a recognized securities exchange for which market quotations are readily available are valued at the last sale price or official closing price, as applicable, on the primary market or exchange on which they trade. Equity investments traded on a recognized exchange for which there were no sales on that day are valued at the last published sale price or at fair value. |
| • | Investments in registered investment companies (including money market funds) or other unitized pooled investment vehicles that are not traded on an exchange are valued at that day’s published net asset value per share or unit. Money market funds generally value portfolio investments using the amortized cost method as set forth in Rule 2a-7 under the 1940 Act and in accordance with their procedures to stabilize net asset value. |
| • | Exchange-traded futures contracts are valued at the closing settlement price on the primary market on which they are traded most extensively. Exchange- traded futures contracts traded on a recognized exchange for which there were no sales on that day are valued at the last reported sale price obtained from independent pricing services or brokers or at fair value. |
27
Table of Contents
State Street Institutional Investment Trust
Notes to Financial Statements — (continued)
December 31, 2015
In the event prices or quotations are not readily available or that the application of these valuation methods results in a price for an investment that is deemed to be not representative of the fair value of such investment, fair value will be determined in good faith by the Committee, in accordance with the valuation policy and procedures approved by the Board.
Fair value pricing could result in a difference between the prices used to calculate the Portfolio’s net asset value and the prices used by the Portfolio’s underlying index, which in turn could result in a difference between the Portfolio’s performance and the performance of the Portfolio’s underlying index. Various inputs are used in determining the value of the Portfolio’s investments. These inputs are categorized into a fair value hierarchy consisting of three broad levels for financial reporting purposes.
The Portfolio values its assets and liabilities at fair value using a hierarchy that prioritizes the inputs to valuation techniques giving the highest priority to readily available unadjusted quoted prices in active markets for identical assets or liabilities (Level 1 measurements) and the lowest priority to unobservable inputs (Level 3 measurements) when market prices are not readily available or reliable. The categorization of a value determined for an investment within the hierarchy is based upon the pricing transparency of the investment and is not necessarily an indication of the risk associated with investing in it.
The three levels of the fair value hierarchy are as follows:
| • | Level 1 – Unadjusted quoted prices in active markets for identical assets or liabilities; |
| • | Level 2 – Inputs other than quoted prices included within Level 1 that are observable for the asset or liability either directly or indirectly, including quoted prices for similar assets or liabilities in active markets, quoted prices for identical or similar assets or liabilities in markets that are not considered to be active, inputs other than quoted prices that are observable for the asset or liability (such as exchange rates, financing terms, interest rates, yield curves, volatilities, prepayment speeds, loss severities, credit risks and default rates) or other market-corroborated inputs; and |
| • | Level 3 – Unobservable inputs for the asset or liability, including the Committee’s assumptions used in determining the fair value of investments. |
Changes in valuation techniques may result in transfers in or out of an assigned level within the fair value hierarchy. Transfers between different levels of the fair value hierarchy are recognized at the end of the reporting period. The Portfolio had no transfers between levels for year ended December 31, 2015. Unless otherwise indicated on the Schedule of Investments, the values of the securities of the Portfolio are determined based on Level 1 inputs.
Investment Transactions and Income Recognition – Investment transactions are accounted for on trade date for financial reporting purposes. Dividend income and capital gain distributions, if any, are recognized on the ex-dividend dates, net of foreign taxes withheld at the source, if any. Distributions received by the Portfolio may include a return of capital that is estimated by management. Such amounts are recorded as a reduction of the cost of investments or reclassified to capital gains. The Portfolio may invest in Real Estate Investment Trusts (REITs). REITs determine the character of their distributions annually and may characterize a portion of their distributions as income, return of capital, or capital gain. The Portfolio’s policy is to record all REIT distributions initially as dividend income and re-designate to return of capital or capital gain distributions at year end based on information provided by
28
Table of Contents
State Street Institutional Investment Trust
Notes to Financial Statements — (continued)
December 31, 2015
the REIT and management’s estimates of such re-designations for which actual information has not yet been reported. Realized gains and losses from the sale of disposition of investments and foreign exchange transactions are determined using the identified cost method.
Dividends and Distributions – Dividends from net investment income are declared and paid at least annually. Net realized capital gains, if any, are distributed annually, unless additional distributions are required for compliance with applicable tax regulations. The amount and character of income and gains to be distributed are determined in accordance with federal tax regulations which may differ from net investment income and realized gains recognized for U.S. GAAP purposes.
Expenses – Certain expenses, which are directly identifiable to a specific fund, are applied to that fund. Other expenses which cannot be attributed to a specific fund are allocated in such a manner as deemed equitable, taking into consideration the nature and type of expense and the relative net assets of the funds within the Trust. Class specific fees are borne by each class.
Federal Income Taxes – The Fund and the Portfolio have each qualified and intend to continue to qualify for and elect treatment as a “regulated investment company” under Subchapter M of the Internal Revenue Code of 1986, as amended. By so qualifying and electing, the Fund and the Portfolio will not be subject to federal income taxes to the extent they distribute their taxable income, including any net realized capital gains, for each fiscal year. In addition, by distributing during each calendar year substantially all of their net investment income and capital gains, if any, the Fund and the Portfolio will not be subject to federal excise tax. Income and capital gain distributions are determined in accordance with income tax regulation which may differ from U.S. GAAP. These book-tax differences are primarily due to differing treatments for distribution redesignations, real estate investment trusts and non taxable dividend adjustments to income. No income tax returns are currently under examination. Management has analyzed tax laws and regulations and their applications to the Fund’s and the Portfolio’s facts and circumstances and does not believe there are any uncertain tax positions that require recognition of a tax liability.
SSGA Funds Management, Inc. (the “Adviser” or “SSGA FM”), has reviewed the tax positions for the open tax years as of December 31, 2015 and has determined that no provision for income tax is required in the Fund’s and the Portfolio’s financial statements. The federal tax returns for the prior three fiscal years, as applicable, remain subject to examination by the major tax jurisdictions, which include the United States of America and the Commonwealth of Massachusetts. The Fund and the Portfolio recognize interest and penalties, if any, related to tax liabilities as income tax expense in their respective Statement of Operations.
For the year ended December 31, 2015, permanent differences identified and reclassified among the components of net assets were as follows:
| Fund | Paid-In Capital | Accumulated Gain (Loss) | Undistributed Net Investment Income (Loss) | |||||||||
State Street Equity 500 Index Fund | $ | – | $ | 35,801 | $ | (35,801 | ) | |||||
State Street Equity 500 Index II Portfolio | $ | – | $ | (133,220 | ) | $ | 133,220 | |||||
These differences were primarily attributable to distribution redesignations. Net investment income (loss), net realized gains (losses), and net assets were not affected by this reclassification.
29
Table of Contents
State Street Institutional Investment Trust
Notes to Financial Statements — (continued)
December 31, 2015
At December 31, 2015, the components of distributable earnings on a tax basis were as follows:
| Fund | Undistributed Capital Gains | Post October Capital Loss Deferral | Net Unrealized Appreciation | Total | ||||||||||||
State Street Equity 500 Index Fund | $ | 3,257,113 | $ | – | $ | 9,384,248 | $ | 12,641,361 | ||||||||
State Street Equity 500 Index II Portfolio | $ | 1,067,796 | $ | (87,411 | ) | $ | 214,543,226 | $ | 215,523,611 | |||||||
The tax character of distributions paid to shareholders during the year ended December 31, 2015, was as follows:
| Fund | Ordinary Income | Long-Term Capital Gain | Total | |||||||||
State Street Equity 500 Index Fund | $ | 7,503,399 | $ | 68,346 | $ | 7,571,745 | ||||||
State Street Equity 500 Index II Portfolio | $ | 10,029,469 | $ | 8,300,149 | $ | 18,329,618 | ||||||
The tax character of distributions paid to shareholders during the period ended December 31, 2014, was as follows:
| Fund | Ordinary Income | Long-Term Capital Gain | Total | |||||||||
State Street Equity 500 Index Fund | $ | 7,001,961 | $ | – | $ | 7,001,961 | ||||||
State Street Equity 500 Index II Portfolio | $ | 3,366,010 | $ | 2,934,213 | $ | 6,300,223 | ||||||
At December 31, 2015, the Fund and Portfolio had no capital loss carryforwards.
During the year, a capital loss carryforward in the amount of $4,946,685 was utilized on the Fund.
At December 31, 2015, gross unrealized appreciation and gross unrealized depreciation based on cost for federal income tax purposes were as follows:
| Fund | Tax Cost | Gross Unrealized Appreciation | Gross Unrealized Depreciation | Net Unrealized Appreciation | ||||||||||||
State Street Equity 500 Index Fund | $ | 456,456,461 | $ | 9,384,248 | $ | – | $ | 9,384,248 | ||||||||
State Street Equity 500 Index II Portfolio | $ | 326,920,341 | $ | 220,110,578 | $ | (5,567,224 | ) | $ | 214,543,354 | |||||||
Futures – The Portfolio may enter into futures contracts as part of its strategy to track the performance of the S&P 500® Index. A futures contract is a standardized, exchange-traded agreement to buy or sell a financial instrument at a set price on a future date. Upon entering into a futures contract, the Portfolio is required to deposit with the broker, cash or securities in an amount equal to the minimum initial margin requirements of the clearing house. Variation margin payments are made or received by the Portfolio each day, depending on the daily fluctuations in the value of the underlying security or index. Such receipt or payment is recorded by the Portfolio for financial statement purposes as part of unrealized gains or losses, and is recorded on the Statement of Assets and Liabilities as Receivable or Payable from
30
Table of Contents
State Street Institutional Investment Trust
Notes to Financial Statements — (continued)
December 31, 2015
broker – variation margin on open futures contracts. The Portfolio recognizes a realized gain or loss when the contract is closed, which is recorded on the Statement of Operations. The risk of loss in trading futures contracts in some strategies is potentially unlimited.
Losses may arise if the value of a futures contract decreases due to unfavorable changes in the market rates or values of the underlying instrument during the term of the contract or if the counterparty does not perform under the contract. The use of futures contracts also involves the risk that the movements in the price of the futures contracts do not correlate the movement of the assets underlying such contracts.
For the year ended December 31, 2015, the Portfolio entered into futures contracts for cash equalization and return enhancement.
The following table summarizes the value of the Portfolio’s derivative instruments as of December 31, 2015, and the related location in the accompanying Schedule of Investments, Statement of Assets and Liabilities and Statement of Operations presented by primary underlying risk exposure:
Asset Derivatives(1)
Equity Contracts Risk | Total | |||||
Futures Contracts | $144,320 | $ | 144,320 | |||
Transactions in derivative instruments during the year ended December 31, 2015, were as follows:
Realized Gain (Loss)(2)
Equity Contracts Risk | Total | |||||
Futures Contracts | $(232,078) | $ | (232,078 | ) | ||
Change in Appreciation (Depreciation)(3)
Equity Contracts Risk | Total | |||||
Futures Contracts | $29,509 | $ | 29,509 | |||
| (1) | Schedule of Investments: Unrealized appreciation on futures contracts. Only unsettled receivable/payable for variation margin is reported within Statement of Assets and Liabilities. |
| (2) | Statement of Operations location: Net realized gain (loss) on: Futures contracts |
| (3) | Statement of Operations location: Net change in unrealized appreciation (depreciation) on: Futures contracts |
The average notional of futures outstanding for the Portfolio during the year ended December 31, 2015 was $11,328,273.
| 3. | Investment Transactions |
For the year ended December 31, 2015, purchases and sales of investment securities (excluding short-term securities) by the Portfolio were $147,853,422 and $21,768,007, respectively.
31
Table of Contents
State Street Institutional Investment Trust
Notes to Financial Statements — (continued)
December 31, 2015
| 4. | Fees and Compensation paid to Affiliates and Other Related Party Transactions |
The Fund and Portfolio have entered into Investment Advisory Agreements with SSGA FM, a subsidiary of State Street Corporation and an affiliate of State Street Bank and Trust Company (“State Street”), under which the Adviser directs the investments of the Portfolio in accordance with its investment objectives, policies, and limitations. In compensation for the Adviser’s services as investment adviser, the Fund pays the Adviser fee at an annual rate of 0.02% of its average daily net assets. The Portfolio pays no investment advisory fees to SSGA FM.
SSGA FM is contractually obligated until April 30, 2016, to waive its management fee and/or to reimburse the Fund for expenses to the extent that total expenses (exclusive of non-recurring account fees, extraordinary expenses, acquired fund fees, any class-specific expenses, such as distribution, shareholder servicing, sub-transfer agency, and administration expenses) exceed 0.01% of average daily net assets on an annual basis. This waiver and/or reimbursement may not be terminated during the relevant period except with the approval the Fund’s Board.
SSGA FM is contractually obligated until April 30, 2016, to waive its management fee and/or to reimburse the Portfolio for expenses to the extent that total expenses (exclusive of non-recurring account fees, extraordinary expenses, acquired fund fees, and distribution, shareholder servicing, and sub-transfer agency expenses) exceed 0.03% of average daily net assets on an annual basis. This waiver and/or reimbursement may not be terminated during the relevant period except with the approval the Portfolio’s Board.
For the year ended December 31, 2015, SSGA FM reimbursed or waived the fees under these agreements as shown on their respective Statement of Operations.
SSGA FM serves as administrator and State Street serves as sub-administrator and custodian to the Fund. For its administration services, the Fund pays SSGA FM a fee at an annual rate of 0.05% of its average daily net assets. For its services as custodian, the Fund pays State Street an annual fee. SSGA FM pays State Street for its services as sub-administrator.
SSGA FM serves as administrator and State Street serves as the sub-administrator, custodian, and transfer agent to the Portfolio. For its administration services, the Portfolio pays SSGA FM an annual fee. SSGA FM compensates State Street for its services as sub-administrator, custodian, and transfer agent to the Portfolio.
Prior to June 1, 2015, State Street served as administrator of the Portfolio. For its services as custodian, administrator, transfer agent and dividend disbursing agent, the Portfolio paid State Street an annual fee. The fee was accrued daily and payable monthly, and was calculated as the greater of an asset-based fee or a minimum fee. The minimum fee was calculated by multiplying the minimum per fund fee by the number of funds in the State Street Master Funds Trust plus the number of stand-alone funds in the State Street Institutional Investment Trust to arrive at the total minimum fee. The asset-based fee was calculated at the following rates:
| Asset Levels | Annual percentage of average aggregate daily net assets | |
First $400 million | 0.03% | |
Next $15 billion | 0.02% | |
Thereafter | 0.01% | |
Minimum annual fee | $150,000 |
32
Table of Contents
State Street Institutional Investment Trust
Notes to Financial Statements — (continued)
December 31, 2015
Boston Financial Data Services (“BFDS”), a joint venture of DST Systems, Inc. and State Street Corporation, serves as transfer agent and dividend disbursing agent to the Fund. For these services, the Fund pays annual account services fees, activity-based fees, charges related to compliance and regulatory services.
State Street Global Markets LLC (“SSGM” or the “Distributor”) serves as the distributor of the Fund. SSGM is a wholly owned subsidiary of State Street Corporation. The Fund has adopted a distribution plan pursuant to Rule 12b-1 under the 1940 Act under which the Fund may compensate the Distributor (or others) for services in connection with the distribution of the Fund’s Administrative Shares, Service Shares, Class R shares and Class A shares and for services provided to Fund shareholders (the “Plan”). The Plan calls for payments at an annual rate (based on average daily net assets) of 0.15%, 0.25%, 0.60% and 0.25% of the Fund’s net assets attributable to its Administrative Shares, Service Shares, Class R shares and Class A shares, respectively. Because these fees are paid out of the assets of the Fund attributable to its Administrative Shares, Service Shares, Class R shares and Class A shares on an ongoing basis, they will increase the cost of your investment and may cost you more over time than paying other types of sales charges. In addition to payments under the Plan, the Fund may reimburse SSGM or its affiliates for payments it makes to financial intermediaries that provide certain administrative, recordkeeping, and account maintenance services. The amount of the reimbursement and the manner in which it is calculated are reviewed by the Trustees periodically.
The Fund may also pay a sub-transfer agent fee at an annual rate of up to 0.20% of the Fund’s average daily net assets attributable to Class A and Class I for recordkeeping, shareholder servicing, or administrative services provided by financial intermediaries.
Certain investments made by the Portfolio were made in securities affiliated with State Street and SSGA FM. Investments in State Street Corp., the holding company of State Street, were made according to its representative portion of the S&P 500® Index. The Portfolio also invested in the State Street Institutional Liquid Reserves Fund and State Street Institutional U.S. Government Money Market Fund. Transactions in all affiliates for the year ending December 31, 2015 were as follows:
Security Description | Number of shares held at 12/31/14 | Purchased | Sold | Number of shares held at 12/31/15 | Value at 12/31/15 | Income earned for the year ended 12/31/15 | Realized gain/loss on shares sold | |||||||||||||||||||||||||||||
| Cost | Shares | Proceeds | Shares | |||||||||||||||||||||||||||||||||
State Street Corp. | 9,678 | $ | 168,883 | 2,400 | $ | – | – | 12,078 | $ | 801,496 | $ | 13,204 | $ | – | ||||||||||||||||||||||
State Street Institutional Liquid Reserves Fund, Premier Class | 10,185,685 | 109,537,255 | 109,537,255 | 119,722,940 | 119,722,940 | – | – | 9,125 | – | |||||||||||||||||||||||||||
State Street Institutional U.S. Government Money Market Fund, Premier Class | – | 82,171,525 | 82,171,525 | 73,506,831 | 73,506,831 | 8,664,695 | 8,664,695 | 682 | – | |||||||||||||||||||||||||||
33
Table of Contents
State Street Institutional Investment Trust
Notes to Financial Statements — (continued)
December 31, 2015
| 5. | Trustees’ Fees |
Independent Trustees are compensated on a calendar year basis. Any Trustee who is deemed to be an “interested person” (as defined in the 1940 Act) of the Fund or Portfolio does not receive compensation from the Fund or Portfolio for his or her service as a Trustee.
Each Independent Trustee receives for his or her services to the State Street Master Funds, State Street Institutional Investment Trust and SSGA Funds, a $141,500 annual base retainer in addition to $18,000 for each in-person meeting and $2,000 for each telephonic meeting from the Trust. The Co-Chairmen each receive an additional $44,000 annual retainer. The Independent Trustees are reimbursed for travel and other out-of-pocket expenses in connection with meeting attendance. Trustees’ fees and expenses are allocated among the Trusts and funds overseen by the Trustees in a manner deemed equitable taking into consideration the relative net assets of the funds, subject to a $15,000 minimum per fund. As of the date of these financial statements, the Trustees were not paid pension or retirement benefits as part of the Trust’s expenses.
The Trust’s officers are compensated by the Adviser and its affiliates.
| 6. | Line of Credit |
Effective October 15, 2015 the Portfolio and other affiliated funds (each a “Participant” and, collectively, the “Participants”) share in a $360 million revolving credit facility provided by a syndication of banks. The Participants may borrow for the purpose of meeting shareholder redemption requests that otherwise might require the untimely disposition of securities. The Participants are charged an annual commitment fee which is calculated based on the unused portion of the shared credit line. Commitment fees are allocated among each of the Participants based on relative net assets. Commitment fees are ordinary fund operating expenses and are paid by the Adviser. A Participant incurs and pays the interest expense related to its borrowing. Interest is calculated at a rate per annum equal to the sum of the New York Fed Bank Rate plus 1%. A Participant may borrow up to a maximum of 33% of its assets or a lower amount as may be set forth in the Portfolio’s prospectus. The Portfolio had no outstanding loans during the year ended December 31, 2015.
| 7. | Initial Subscription |
The Portfolio commenced operations on August 11, 2014, with an initial in-kind contribution of securities from the Fund, as part of a tax-free in-kind transaction in which the Fund redeemed its full interest in the Equity 500 Portfolio and immediately contributed into the Portfolio. The transaction consisted of 503 securities totaling $387,955,841 at market value and $2,852,336 in cash, and included $207,771,885 in unrealized appreciation. The Portfolio has elected to carryforward the allocable tax basis of the 503 securities contributed in kind for purposes of measuring realized and unrealized gain/loss on the Portfolio’s Statement of Operations.
| 8. | Subsequent Events |
Management has evaluated the impact of all subsequent events on the Fund and Portfolio through the date the financial statements were available to be issued and has determined that there were no subsequent events requiring adjustment or disclosure in the financial statements.
34
Table of Contents
Report of Independent Registered Public Accounting Firm
To the Board of Trustees and Shareholders of State Street Institutional Investment Trust:
We have audited the accompanying statements of assets and liabilities of State Street Equity 500 Index Fund (the “Fund”) and State Street Equity 500 Index II Portfolio (the “Portfolio”) (two of the series constituting the State Street Institutional Investment Trust), including the schedule of investments of the Portfolio, as of December 31, 2015, and the related statements of operations for the year then ended and the statements of changes in net assets and the financial highlights for each of the years or periods indicated therein. These financial statements and financial highlights are the responsibility of the Fund’s and Portfolio’s management. Our responsibility is to express an opinion on these financial statements and financial highlights based on our audits.
We conducted our audits in accordance with the standards of the Public Company Accounting Oversight Board (United States). Those standards require that we plan and perform the audit to obtain reasonable assurance about whether the financial statements and financial highlights are free of material misstatement. We were not engaged to perform an audit of the Fund’s and Portfolio’s internal control over financial reporting. Our audits included consideration of internal control over financial reporting as a basis for designing audit procedures that are appropriate in the circumstances, but not for the purpose of expressing an opinion on the effectiveness of the Fund’s and Portfolio’s internal control over financial reporting. Accordingly, we express no such opinion. An audit also includes examining, on a test basis, evidence supporting the amounts and disclosures in the financial statements and financial highlights, assessing the accounting principles used and significant estimates made by management, and evaluating the overall financial statement presentation. Our procedures included confirmation of securities owned as of December 31, 2015, by correspondence with the custodian and others or by other appropriate auditing procedures where replies from others were not received. We believe that our audits provide a reasonable basis for our opinion.
In our opinion, the financial statements and financial highlights referred to above present fairly, in all material respects, the financial position of State Street Equity 500 Index Fund and State Street Equity 500 Index Portfolio (two of the series constituting State Street Institutional Investment Trust) at December 31, 2015, the results of their operations for the year then ended and the changes in their net assets and the financial highlights for each of the years or periods indicated therein, in conformity with U.S. generally accepted accounting principles.

Boston, Massachusetts
February 26, 2016
35
Table of Contents
State Street Institutional Investment Trust
Other Information
December 31, 2015 (Unaudited)
SHAREHOLDER
EXPENSE EXAMPLE
As a shareholder of a fund (the “Funds”), you incur ongoing costs, (1) transaction costs, and (2) ongoing costs, including advisory and administration fees, among others. This example is intended to help you understand your ongoing costs (in dollars) of investing in the Funds and to compare these costs with the ongoing costs of investing in other mutual funds. It is based on an investment of $1,000 made at the beginning of the period shown and held for the entire period from July 1, 2015 to December 31, 2015.
The table below illustrates your Fund’s costs in two ways:
| • | Actual Expenses – This section helps you to estimate the actual expenses that you paid over the period. The “Ending Account Value” shown is derived from the Fund’s actual return, and the third column shows the dollar amount that would have been paid by an investor who started with $1,000 in the Fund. You may use the information here, together with the amount you invested, to estimate the expenses that you paid over the period. To do so, simply divide your account value by $1,000 (for example, an $8,600 account value divided by $1,000 = 8.6), then multiply the result by the number given for the Fund under the heading “Expenses Paid During Period”. |
| • | Hypothetical Example for Comparison Purposes – This section is intended to help you compare your Fund’s costs with those of other mutual funds. It assumes that the Fund had a yearly return of 5% before expenses, but that the expense ratio is unchanged. In this case, because the return used is not the Fund’s actual return, the results do not apply to your investment. The example is useful in making comparisons because the Securities and Exchange Commission requires all mutual funds to calculate expenses based on a 5% return. You can assess your Fund’s costs by comparing this hypothetical example with the hypothetical examples that appear in shareholder reports of other funds. |
Six Months Ended December 31, 2015
| State Street Equity 500 Index Fund | Beginning Account Value July 1, 2015 | Ending December 31, 2015 | Expenses Paid During Period * | |||||||||
Based on Actual Class Return | ||||||||||||
Administrative Shares | $ | 1,000.00 | $ | 999.84 | $ | 0.77 | ||||||
Service Shares | $ | 1,000.00 | $ | 999.42 | $ | 1.25 | ||||||
Class R | $ | 1,000.00 | $ | 997.10 | $ | 3.02 | ||||||
Class A | $ | 1,000.00 | $ | 998.01 | $ | 2.27 | ||||||
Class K | $ | 1,000.00 | $ | 1,000.74 | $ | 0.15 | ||||||
Class I | $ | 1,000.00 | $ | 999.34 | $ | 1.02 | ||||||
36
Table of Contents
State Street Institutional Investment Trust
Other Information — (continued)
December 31, 2015 (Unaudited)
| State Street Equity 500 Index Fund | Beginning Account Value July 1, 2015 | Ending December 31, 2015 | Expenses Paid During Period * | |||||||||
Based on Hypothetical (5% return before expenses) | ||||||||||||
Administrative Shares | $ | 1,000.00 | $ | 1,024.44 | $ | 0.78 | ||||||
Service Shares | $ | 1,000.00 | $ | 1,023.96 | $ | 1.27 | ||||||
Class R | $ | 1,000.00 | $ | 1,022.18 | $ | 3.06 | ||||||
Class A | $ | 1,000.00 | $ | 1,022.94 | $ | 2.30 | ||||||
Class K | $ | 1,000.00 | $ | 1,025.05 | $ | 0.15 | ||||||
Class I | $ | 1,000.00 | $ | 1,024.18 | $ | 1.03 | ||||||
| * | The calculations are based on expenses incurred in the most recent fiscal period of each Class. The Administrative Shares, Service Shares, Class R shares, Class A shares, Class K shares and Class I shares annualized expense ratios for the six months ended December 31, 2015 were 0.15%, 0.25%, 0.60%, 0.45%, 0.03% and 0.20%, respectively. The dollar amounts shown as “Expenses Paid” are equal to the annualized expense ratio multiplied by the average account value over the period, multiplied by 184/365 (the most recent six month period). |
Six Months Ended December 31, 2015
| State Street Equity 500 Index II Portfolio | Beginning Account Value | Ending December 31, 2015 | Expenses Paid During | |||||||||
Based on Actual Portfolio Return | $ | 1,000.00 | $ | 1,000.53 | $ | 0.16 | ||||||
Based on Hypothetical (5% return before expenses) | $ | 1,000.00 | $ | 1,025.04 | $ | 0.17 | ||||||
| * | The calculations are based on expenses incurred in the most recent fiscal period of the Portfolio. The annualized expense ratio for the six months ended December 31, 2015 was 0.03%. The dollar amounts shown as “Expenses Paid” are equal to the annualized expense ratio multiplied by the average account value over the period, multiplied by 184/365 (the most recent six month period). |
37
Table of Contents
State Street Institutional Investment Trust
December 31, 2015 (Unaudited)
Dividend Received Deduction
For federal income tax purposes, the following information is furnished with respect to the distributions of the Trust for its fiscal period ended December 31, 2015.
Percentage of distributions which qualify for the corporate dividends received deduction:
| Fund | Percentage | |
State Street Equity 500 Index Fund | 100.00% | |
State Street Equity 500 Index II Portfolio | 93.27 |
Qualified Dividend Income
A portion of dividends distributed by the Funds during the fiscal period ended December 31, 2015, are considered qualified dividend income, and are eligible for reduced tax rates. These lower rates range from 5% to 20% depending on the individual’s tax bracket. These amounts are noted below:
| Fund | Amount | |
State Street Equity 500 Index Fund | $8,490,958 | |
State Street Equity 500 Index II Portfolio | 9,816,125 |
Long Term Capital Gains
Long term capital gains dividends were paid from the following Funds during the year ended December 31, 2015:
| Fund | Amount | |
State Street Equity 500 Index Fund | $68,346 | |
State Street Equity 500 Index II Portfolio | 8,300,149 |
General Tax Disclosure
Form 1099-DIV mailed to you in January 2016 will show the tax status of all distributions paid to your account in calendar year 2015.
Please consult a tax adviser for questions about federal or state income tax laws.
38
Table of Contents
State Street Institutional Investment Trust
Shareholder Requests for Additional Information
December 31, 2015 (Unaudited)
Proxy Voting Policies and Procedures and Record
The Portfolio has adopted the proxy voting policies of the Adviser. A description of the policies and procedures that the Portfolio have adopted to determine how to vote proxies relating to portfolio securities are contained in the Portfolio’s Statement of Additional Information, which is available (i) without charge, upon request, by calling the Portfolio at 1-877-521-4083, (ii) on the U.S. Securities and Exchange Commission’s website at www.sec.gov, or (iii) at the U.S. Securities and Exchange Commission’s public reference room. Information on the operation of the public reference room may be obtained by calling 1-800-SEC-0330. Information regarding how the Portfolio voted proxies, if any, during the most recent 12-month period ended June 30 is available by August 31 of each year without charge (1) by calling 1-877-521-4083 (toll free), or (2) on the website of the Securities and Exchange Commission (“SEC”) at www.sec.gov.
Quarterly Portfolio Schedule
The Fund and Portfolio each file a complete schedules of investments with the U.S. Securities and Exchange Commission for the first and third quarters of each fiscal year on Form N-Q. For the second and fourth quarters, the complete schedules of investments are available in the Portfolio’s semi-annual and annual financial statements. The Portfolio’s Form N-Q is available (i) without charge, upon request, by calling the Portfolio at 1-877-521-4083, (ii) on the Securities and Exchange Commission’s website at www.sec.gov, or (iii) at the Securities and Exchange Commission’s public reference room. Information on the operation of the public reference room may be obtained by calling 1-800-SEC-0330.
39
Table of Contents
State Street Institutional Investment Trust
Trustees and Officers Information
December 31, 2015 (Unaudited)
Name, Address, and Year of Birth | Position(s) Held | Term of Office Time Served | Principal Occupation During Past Five Years and Relevant Experience | Number of Funds in Fund Complex Overseen by Trustee | Other Directorships Held by Trustee During Past | |||||
Independent Trustees | ||||||||||
Michael F. Holland State Street Bank and Trust Company 100 Huntington Avenue, CPH 0326 Boston, MA 02116 YOB: 1944 | Trustee and Co-Chairman of the Board | Term: Indefinite Elected: 7/99 | Chairman, Holland & Company L.L.C. (investment adviser) (1995 – present). | 75 | Director, the Holland Series Fund, Inc.; Director, The China Fund, Inc.; Director, The Taiwan Fund, Inc.; Director, Reaves Utility Income Fund, Inc.; and Director, Blackstone/GSO Loan Funds. | |||||
Patrick J. Riley State Street Bank and Trust Company 100 Huntington Avenue, CPH 0326 Boston, MA 02116 YOB: 1948 | Trustee and Co-Chairman of the Board | Term: Indefinite Elected:1/14 | 2002 to May 2010, Associate Justice of the Superior Court, Commonwealth of Massachusetts; 1985 to 2002, Partner, Riley, Burke & Donahue, L.L.P. (law firm); 1998 to Present, Independent Director, State Street Global Advisers Ireland, Ltd. (investment company); 1998 to Present, Independent Director, SSgA Liquidity plc (formerly, SSgA Cash Management Fund plc); January 2009 to Present, Independent Director, SSGA Fixed Income plc; and January 2009 to Present, Independent Director, SSGA Qualified Funds PLC. | 75 | Board Director and Chairman, SPDR Europe 1PLC Board (2011 – Present); Board Director and Chairman, SPDR Europe II, PLC (2013 – Present). | |||||
William L. Boyan State Street Bank and Trust Company 100 Huntington Avenue, CPH 0326 Boston, MA 02116 YOB: 1937 | Trustee and Co-Chairman of the Valuation Committee | Term: Indefinite Elected: 7/99 | President and Chief Operations Officer, John Hancock Financial Services (1959 – 1999). Mr. Boyan retired in 1999. Chairman Emeritus, Children’s Hospital, Boston, MA (1984 – 2011); Former Trustee of Old Mutual South Africa Master Trust (investments) (1995 – 2008); Former Chairman, Boston Plan For Excellence, Boston Public Schools (1995 – 2010); Member of Advisory Board of Florida Atlantic University Lifelong Learning Society. | 75 | Former Trustee of Old Mutual South Africa Master Trust. | |||||
William L. Marshall State Street Bank and Trust Company 100 Huntington Avenue, CPH 0326 Boston, MA 02116 YOB: 1942 | Trustee and Co-Chairman of the Audit Committee | Term: Indefinite Elected: 1/14 | April 2011 to Present, Chairman (until April 2011, Chief Executive Officer and President), Wm. L. Marshall Associates, Inc., Wm. L. Marshall Companies, Inc. and the Marshall Financial Group, Inc. (a registered investment adviser and provider of financial and related consulting services); Certified Financial Planner; Member, Financial Planners Association; 2015 to present, Board Member, The Doylestown Health Foundation Board. | 75 | Marshall Financial Group, Inc. | |||||
40
Table of Contents
State Street Institutional Investment Trust
Trustees and Officers Information — (continued)
December 31, 2015 (Unaudited)
Name, Address, and Year of Birth | Position(s) Held | Term of Office Time Served | Principal Occupation During Past Five Years and Relevant Experience | Number of Funds in Fund Complex Overseen by Trustee | Other Directorships Held by Trustee During Past | |||||
Independent Trustees (continued) | ||||||||||
Richard D. Shirk State Street Bank and Trust Company 100 Huntington Avenue, CPH 0326 Boston, MA 02116 YOB: 1945 | Trustee and Co-Chairman of the Qualified Legal and Compliance Committee | Term: Indefinite Elected: 1/14 | March 2001 to April 2002, Chairman (1996 to March 2001, President and Chief Executive Officer), Cerulean Companies, Inc. (holding company) (Retired); 1992 to March 2001, President and Chief Executive Officer, Blue Cross Blue Shield of Georgia (health insurer, managed healthcare); 1998 to December 2008, Chairman, Board Member and December 2008 to Present, Investment Committee Member, Healthcare Georgia Foundation (private foundation); September 2002 to 2012, Lead Director and Board Member, Amerigroup Corp. (managed health care); 1999 to 2013, Board Member and (since 2001) Investment Committee Member, Woodruff Arts Center; and 2003 to 2009, Trustee, Gettysburg College. | 75 | Board member, AeroCare Holdings (privately held healthcare services company) (February 2003 – Present); Board member, Regenesis Biomedical (health care services) (April 2012 – Present); Chairman (January 2014 – Present). | |||||
Rina K. Spence State Street Bank and Trust Company 100 Huntington Avenue, CPH 0326 Boston, MA 02116 YOB: 1948 | Trustee and Co-Chairman of the Qualified Legal and Compliance Committee and Co-Chairman of the Governance Committee | Term: Indefinite Elected: 7/99 | President of SpenceCare International LLC (international healthcare consulting) (1999 – present); Chief Executive Officer, IEmily.com (health internet company) (2000 – 2001); Chief Executive Officer of Consensus Pharmaceutical, Inc. (1998 – 1999); Founder, President and Chief Executive Officer of Spence Center for Women’s Health (1994 – 1998); President and CEO Emerson Hospital (1984 – 1994); Trustee, Eastern Enterprise (utilities) (1988 – 2000); Director, Berkshire Life Insurance Company of America (1993 – 2009); Honorary Consul for Monaco in Boston (2015 – present). | 75 | ||||||
Bruce D. Taber State Street Bank and Trust Company 100 Huntington Avenue, CPH 0326 Boston, MA 02116 YOB: 1943 | Trustee and Co-Chairman of the Valuation Committee and Co-Chairman of the Governance Committee | Term: Indefinite Elected: 1/14 | 1999 to Present, Partner, Zenergy LLC (a technology company providing Computer Modeling and System Analysis to the General Electric Power Generation Division); Until December 2008, Independent Director, SSGA Cash Management Fund plc; Until December 2008, Independent Director, State Street Global Advisers Ireland, Ltd. (investment companies); and Until August 1994, President, Alonzo B. Reed, Inc., (a Boston architect-engineering firm). | 75 | ||||||
41
Table of Contents
State Street Institutional Investment Trust
Trustees and Officers Information — (continued)
December 31, 2015 (Unaudited)
Name, Address, and Year of Birth | Position(s) Held | Term of Office Time Served | Principal Occupation During Past Five Years and Relevant Experience | Number of Funds in Fund Complex Overseen by Trustee | Other Directorships Held by Trustee During Past | |||||
Independent Trustees (continued) | ||||||||||
Douglas T. Williams State Street Bank and Trust Company 100 Huntington Avenue, CPH 0326 Boston, MA 02116 YOB: 1940 | Trustee and Co-Chairman of the Audit Committee | Term: Indefinite Elected: 7/99 | President, Oakmont Homeowners Association; President, Mariner Sands Chapel; Executive Vice President and member of Executive Committee, Chase Manhattan Bank (1987 -1999); President, Boston Stock Exchange Depository Trust Company, 1981-1982; Treasurer, Nantucket Educational Trust, (2002-2007). | 75 | ||||||
Interested Trustee(1) | ||||||||||
James E. Ross SSGA Funds Management, Inc. State Street Financial Center One Lincoln Street Boston, MA 02111 YOB: 1965 | Trustee | Term: Indefinite Elected Trustee: 2/07 | Chairman and Director, SSGA Funds Management, Inc. (2012 – present); President, SSGA Funds Management, Inc. (2005 – 2012); Executive Vice President and Senior Managing Director, State Street Global Advisors (2006 – present); and Principal, State Street Global Advisors (2006 – present). | 290 | Trustee, SPDR Series Trust; Trustee, SPDR Index Shares Funds; Trustee, Select Sector SPDR Trust; Trustee, SSGA Active Trust; and Trustee, SSGA Master Trust. | |||||
| (1) | Mr. Ross is an Interested Trustee because of his employment by SSGA Funds Management, Inc., an affiliate of the Trust. |
Name, Address, and Year of Birth | Position(s) Held | Term of Office Time Served | Principal Occupation | |||
Officers: | ||||||
Ellen M. Needham SSGA Funds Management, Inc. One Lincoln Street Boston, MA 02111 YOB: 1967 | President | Term: Indefinite Elected: 10/12 | President and Director, SSGA Funds Management, Inc. (June 2012 – present); Chief Operating Officer, SSGA Funds Management, Inc. (May 2010 – June 2012); Senior Managing Director, SSGA Funds Management, Inc. (1992 – 2012) and Senior Managing Director, State Street Global Advisors (1992 – present).* | |||
Bruce S. Rosenberg SSGA Funds Management, Inc. State Street Financial Center One Lincoln Street Boston, MA 02111 YOB: 1961 | Treasurer | Term: Indefinite Elected: 2/16 | Managing Director, State Street Global Advisors and SSGA Funds Management, Inc. (July 2015 – present); Director, Credit Suisse (April 2008 – July 2015). | |||
Ann M. Carpenter SSGA Funds Management, Inc. State Street Financial Center One Lincoln Street Boston, MA 02111 YOB: 1966 | Vice President and Deputy Treasurer | Term: Indefinite Elected 10/12 Term: Indefinite Elected: 2/16 | Chief Operating Officer, SSGA Funds Management, Inc. (April 2014 – present); Vice President, State Street Global Advisors and SSGA Funds Management, Inc. (2005 – present).* | |||
Chad C. Hallett SSGA Funds Management, Inc. State Street Financial Center One Lincoln Street Boston, MA 02111 YOB: 1969 | Deputy Treasurer | Term: Indefinite Elected: 2/16 | Vice President, State Street Global Advisors and SSGA Funds Management, Inc. (November 2014 – present); Vice President, State Street Bank and Trust Company (2001 – November 2014).* | |||
42
Table of Contents
State Street Institutional Investment Trust
Trustees and Officers Information — (continued)
December 31, 2015 (Unaudited)
Name, Address, and Year of Birth | Position(s) Held | Term of Office Time Served | Principal Occupation | |||
Officers: (continued) | ||||||
Sujata Upreti SSGA Funds Management, Inc. State Street Financial Center One Lincoln Street Boston, MA 02111 YOB: 1974 | Assistant Treasurer | Term: Indefinite Elected: 2/16 | Vice President, State Street Global Advisors and SSGA Funds Management, Inc. (May 2015 – present); Assistant Director, Cambridge Associates, LLC (July 2014 – January 2015); Vice President, Bank of New York Mellon (July 2012 – August 2013); Manager, PricewaterhouseCoopers, LLP (September 2009 – July 2012). | |||
Daniel Foley SSGA Funds Management, Inc. State Street Financial Center One Lincoln Street Boston, MA 02111 YOB: 1972 | Assistant Treasurer | Term: Indefinite Elected: 2/16 | Vice President, State Street Global Advisors and SSGA Funds Management, Inc. (April 2014 – present); Principal, State Street Global Advisors and SSGA Funds Management, Inc. (April 2007 – April 2014). | |||
Brian Harris SSGA Funds Management, Inc. State Street Financial Center One Lincoln Street Boston, MA 02111 YOB: 1973 | Chief Compliance Officer | Term: Indefinite Elected: 11/13 | Vice President, State Street Global Advisors and SSGA Funds Management, Inc.( June 2013 – Present); Senior Vice President and Global Head of Investment Compliance, BofA Global Capital Management (September 2010 to May 2013); Director of Compliance, AARP Financial Inc. (July 2008 to August 2010). | |||
Trevor Swanberg SSGA Funds Management, Inc. State Street Financial Center One Lincoln Street Boston, MA 02111 YOB: 1979 | Code of Ethics Compliance Officer | Term: Indefinite Elected: 8/15 | Vice President, State Street Global Advisors and SSGA Funds Management, Inc. (January 2015 – Present); Senior Manager-Mutual Fund Compliance, ICMA-Retirement Corporation (December 2011 – January 2015); Assistant Vice President, J.P. Morgan (September 2007 – December 2011). | |||
Joshua A. Weinberg SSGA Funds Management, Inc. State Street Financial Center One Lincoln Street Boston, MA 02111 YOB: 1978 | Chief Legal Officer | Term: Indefinite Elected: 2/15 | Vice President and Managing Counsel, State Street Global Advisors (2011 – present); Clerk, SSGA Funds Management, Inc. (2013 – present); Associate, Financial Services Group, Dechert LLP (2006 – 2011). | |||
David K. James State Street Bank and Trust Company 100 Huntington Avenue, 3rd Floor Boston, MA 02116 YOB: 1970 | Secretary | Term: Indefinite Elected: 4/13 | Managing Director and Managing Counsel, State Street Bank and Trust Company (2009 – present); Vice President and Counsel, PNC Global Investment Servicing (US), Inc. (2006 – 2009). | |||
Kristin Schantz State Street Bank and Trust Company 100 Huntington Avenue, 3rd Floor Boston, MA 02116 YOB: 1979 | Assistant Secretary | Term: Indefinite Elected: 2/14 | Vice President and Senior Counsel, State Street Bank and Trust Company (2013 – present); Vice President, Citi Fund Services Ohio, Inc. (2008 – 2013). | |||
43
Table of Contents
Trustees
William L. Boyan
Michael F. Holland
William L. Marshall
Patrick J. Riley
James E. Ross
Richard D. Shirk
Rina K. Spence
Bruce D. Taber
Douglas T. Williams
Investment Adviser and Administrator
SSGA Funds Management, Inc.
State Street Financial Center
One Lincoln Street
Boston, MA 02111
Custodian and Sub-Administrator of the Fund and Portfolio, Transfer Agent of the Portfolio
State Street Bank and Trust Company
State Street Financial Center
One Lincoln Street
Boston, MA 02111
Independent Registered Public Accounting Firm
Ernst & Young LLP
200 Clarendon Street
Boston, MA 02116
Legal Counsel
Ropes & Gray LLP
800 Boylston Street
Boston, MA 02199
Transfer Agent
Boston Financial Data Services
2000 Crown Colony Drive
Quincy, MA 02169
Distributor
State Street Global Markets LLC
State Street Financial Center
One Lincoln Street
Boston, MA 02111
This report is for shareholder information. This is not a prospectus intended for use in the purchase or sale of shares of beneficial interest.
State Street Institutional Investment Trust State Street Bank and Trust Company P.O. Box 5049 Boston, MA 02206 | IBG-18491 |
Table of Contents
Annual Report
31 December 2015
State Street Institutional
Investment Trust
State Street Clarion Global Infrastructure & MLP Fund

Table of Contents
State Street Institutional Investment Trust
State Street Clarion Global Infrastructure & MLP Fund
Annual Report
December 31, 2015
| 1 | ||||
| 4 | ||||
| 5 | ||||
| 6 | ||||
| 7 | ||||
| 9 | ||||
| 14 | ||||
| 15 | ||||
| 17 | ||||
| 18 | ||||
| 23 | ||||
Financial Statements of the State Street Clarion Global Infrastructure & MLP Portfolio | 27 | |||
Table of Contents
State Street Clarion Global Infrastructure & MLP Fund
MANAGEMENT DISCUSSION OF FUND PERFORMANCE
The State Street Clarion Global Infrastructure & MLP Fund (the “Fund”) normally invests substantially all of its investable assets in the State Street Clarion Global Infrastructure & MLP Portfolio (the “Portfolio”), which seeks to provide long-term total return. As a result, this Fund invests indirectly through the Portfolio. The Fund’s benchmark is the MSCI ACWI IMI Index (the “Index”).
For the 12-month period ended December 31, 2015 (the “Reporting Period”), the total return for Class I of the Fund was -5.91%, and the total return for the Index was -2.19%. The Fund’s secondary benchmark, the State Street Clarion Global Infrastructure & MLP Composite Index (the “Secondary Index”), yielded a return of -10.52% for the Reporting Period. The returns of the Fund and both the Index and the Secondary Index reflect the reinvestment of dividends and other income. The Fund’s performance reflects the expenses of managing the Fund, including brokerage and advisory expenses. Both the Index and the Secondary Index are unmanaged and their returns do not reflect fees and expenses of any kind, which would have a negative impact on returns.
Global listed infrastructure and MLP securities declined during the Reporting Period, underperforming global equities, as fears of rising interest rates, falling commodity prices, and slowing global economic growth weighed on investors’ confidence. By geography, the Fund’s performance in the Americas region dampened the overall return due to continued pressure in the energy infrastructure sector. In contrast, the Fund enjoyed positive absolute performance in Asia and Europe. In Europe, the Fund generated strong absolute returns in local currency terms in both continental Europe and the U.K. Returns in terms of the U.S. dollar, the currency of the Fund, were less positive given the appreciation of the U.S. dollar against European currencies during the Reporting Period. Within Continental Europe, investments in the toll road sector were the largest contributors to the total return of the Fund. Investments in Europe were balanced between more economically sensitive sectors like toll roads and more predictable sectors like regulated electric and water utilities. In addition, the Fund’s focus in the U.K. on the regulated electric and water sectors contributed to performance results. Asia was the best performing region during the Reporting Period, and the Fund had strong performance from its significant investment in Japanese passenger rail companies. In the Americas, the Fund’s exposure to MLPs and rails were the primary detractors from the total return, offset in part by the positive performance of the towers and utilities sectors.
The top positive contributors to the Fund’s performance were East Japan Railway Co., Vinci SA and Crown Castle International Corp. East Japan Railway benefited from continued traffic improvement on its passenger rail assets driven by growth in tourism in Japan. Vinci SA is a French toll road and construction company. Passenger growth on its toll roads in France continued in 2015 driving the performance of the company. Crown Castle International is a U.S. listed tower company. While earnings growth slowed for the company in 2015, the company divested its Australian tower assets, focusing its business on the U.S., and the market favored this purely-domestic investment story.
The top detractors from the Fund’s performance relative to the Index were Williams Cos., Inc., Union Pacific Corp. and TerraForm Power Inc. Williams Cos., Inc. is an energy infrastructure company operating in the U.S. The timing of the Fund’s investment in Williams Cos., Inc. coincided with a significant deterioration in the outlook of energy infrastructure companies due to the sharp fall in the price of oil in the second half of the year. Similarly, the timing of our investment in TerraForm Power Inc., a renewable energy infrastructure company, coincided with substantial equity issuance from renewable energy companies that saturated the market and caused share prices to decline. Union Pacific Corporation is a freight railroad owner operating across the U.S. The stock declined as rail volumes
1
Table of Contents
State Street Clarion Global Infrastructure & MLP Fund
MANAGEMENT DISCUSSION OF FUND PERFORMANCE — (continued)
suffered from the decline in coal demand and industrial demand more broadly. Earnings estimates for the company were reduced throughout the year adjusting to weaker volume expectations and driving down the company’s share price.
The Fund did not invest in derivatives during the Reporting Period.
The views expressed above reflect those of the Fund’s portfolio manager only through the Reporting Period and do not necessarily represent the views of the Adviser as a whole. Any such views are subject to change at any time based upon market or other conditions, and the Adviser disclaims any responsibility to update such views. These views may not be relied on as investment advice and, because investment decisions for a fund are based on numerous factors, may not be relied on as an indication of trading intent on behalf of any fund.
2
Table of Contents
State Street Clarion Global Infrastructure & MLP Fund
Class I
Growth of a $10,000 Investment(a)
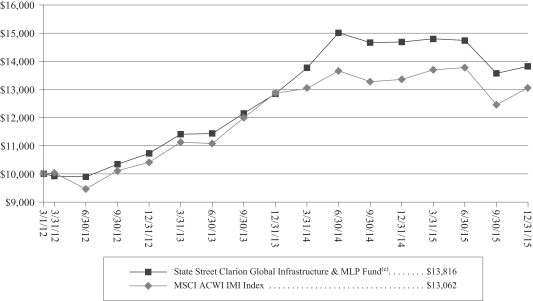
Investment Performance(a)
For the Year Ended December 31, 2015
| Total Return One Year Ended December 31, 2015 | Total Return Average Annual Three Year Ended December 31, 2015 | Total Return Average Annual Inception to Date December 31, 2015 | ||||||||||
State Street Clarion Global Infrastructure & MLP Fund Class A(b) | -6.13 | % | 8.54 | % | 8.52 | % | ||||||
State Street Clarion Global Infrastructure & MLP Fund Class I(c) | -5.91 | % | 8.80 | % | 8.79 | % | ||||||
MSCI ACWI IMI Index(d) | -2.19 | % | 7.86 | % | 7.22 | % | ||||||
| (a) | Total returns and performance graph information represent past performance and are not indicative of future results, which may be lower or higher than performance data quoted. Investment return and principal value of an investment will fluctuate so that an investor’s share, when redeemed, may be worth more or less than its original cost. The graph and table above do not reflect the deduction of taxes that a shareholder would pay on fund distributions, sales, or the redemption of fund shares. |
| (b) | NAV Performance shown for the periods prior to the inception of Class A shares on January 21, 2015 reflects the historical performance of the fund when managed by the Sub-Adviser adjusted to reflect the higher expenses of Class A shares, estimated for their first year of operations, including applicable 12b-1 fees. |
| (c) | NAV Performance shown for the periods prior to the inception of Class I shares on January 21, 2015 reflects the historical performance of the fund when managed by the Sub-Adviser adjusted to reflect the higher expenses of Class I shares, estimated for their first year of operations, including applicable 12b-1 fees. |
| (d) | The MSCI ACWI IMI Index is a free float-adjusted market capitalization-weighted index that is designed to measure the combined equity market performance of developed and emerging markets. The Index covers approximately 99% of the global equity investment opportunity set. |
| (e) | NAV Performance shown for the periods prior to the inception of the Fund on January 21, 2015 reflects the historical performance of the fund when managed by the Sub-Adviser. |
3
Table of Contents
State Street Institutional Investment Trust
State Street Clarion Global Infrastructure & MLP Fund
Statement of Assets and Liabilities
December 31, 2015
Assets |
| |||
Investment in State Street Clarion Global Infrastructure & MLP Portfolio (1,652,514 shares), at value (cost $16,432,507) (Note 1) | $ | 14,808,698 | ||
Receivable for investments sold | 11,201 | |||
Prepaid Expenses | 12,896 | |||
|
| |||
Total assets | 14,832,795 | |||
|
| |||
Liabilities | ||||
Professional fees payable | 17,018 | |||
Advisory fees payable (Note 3) | 11,206 | |||
Due to custodian | 5,525 | |||
Administration fees payable (Note 3) | 8,703 | |||
Custodian fees payable (Note 3) | 3,680 | |||
Registration and filing fees payable | 1,584 | |||
Transfer agent fees payable (Note 3) | 788 | |||
Printing fees payable | 703 | |||
Accrued expenses and other liabilities | 269 | |||
|
| |||
Total liabilities | 49,476 | |||
|
| |||
Net Assets | $ | 14,783,319 | ||
|
| |||
Net Assets Consist of: | ||||
Paid-in capital | $ | 16,436,904 | ||
Accumulated net realized gain | (29,776 | ) | ||
Net unrealized appreciation (depreciation) on Investment in State Street Clarion Global Infrastructure & MLP Portfolio | (1,623,809 | ) | ||
|
| |||
Net Assets | $ | 14,783,319 | ||
|
| |||
Net Assets | ||||
Class A | $ | 1,923,270 | ||
|
| |||
Class I | $ | 12,860,049 | ||
|
| |||
Shares of Beneficial Interest Outstanding | ||||
Class A | 214,703 | |||
|
| |||
Class I | 1,435,410 | |||
|
| |||
Net Asset Value and Redemption Price Per Share | ||||
Class A | $ | 8.96 | ||
|
| |||
Maximum Sales Charge | ||||
Class A | 5.25 | % | ||
|
| |||
Maximum Offering Price Per Share | ||||
Class A | $ | 9.46 | ||
|
| |||
Offering, Net Asset Value, and Redemption Price Per Share | ||||
Class I | $ | 8.96 | ||
|
| |||
See Notes to Financial Statements and Financial Statements of the Master Portfolio.
4
Table of Contents
State Street Institutional Investment Trust
State Street Clarion Global Infrastructure & MLP Fund
Period Ended December 31, 2015*
Income |
| |||
Dividend income from State Street Clarion Global Infrastructure & MLP Portfolio (Note 3) | $ | 471,844 | ||
|
| |||
Expenses | ||||
Advisory fees (Note 3) | 133,913 | |||
Custodian fees (Note 3) | 23,929 | |||
Administration fees (Note 3) | 4,517 | |||
Distribution fees (Note 3) | ||||
Class A | 4,811 | |||
Trustees’ fees and expenses (Note 4) | 11,252 | |||
Registration and filing fees | 23,705 | |||
Professional fees | 22,291 | |||
Transfer agent fees (Note 3) | 19,817 | |||
Printing fees | 13,050 | |||
Insurance fees | 3,143 | |||
Miscellaneous fees | 3,147 | |||
|
| |||
Total expenses | 263,575 | |||
|
| |||
Less: Expenses reimbursed by the Adviser (Note 3) | (80,214 | ) | ||
|
| |||
Net expenses | 183,361 | |||
|
| |||
Net Investment Income | $ | 288,483 | ||
|
| |||
Realized and Unrealized Gain (Loss) on Investments | ||||
Net realized gain (loss) on: | ||||
Investment in State Street Clarion Global Infrastructure & MLP Portfolio | (24,107 | ) | ||
Capital gain distributions from affiliated issuer | 413,050 | |||
Change in unrealized appreciation (depreciation) on: | ||||
Investment in State Street Clarion Global Infrastructure & MLP Portfolio | (1,623,809 | ) | ||
|
| |||
Net realized and unrealized loss | (1,234,866 | ) | ||
|
| |||
Net Increase (Decrease) in Net Assets from Operations | $ | (946,383 | ) | |
|
| |||
| * | For the period January 20, 2015 (inception date) through December 31, 2015. |
See Notes to Financial Statements and Financial Statements of the Master Portfolio.
5
Table of Contents
State Street Institutional Investment Trust
State Street Clarion Global Infrastructure & MLP Fund
Statement of Changes in Net Assets
| For the Period 1/20/15*-12/31/15 | ||||
Increase (Decrease) in Net Assets Resulting from: | ||||
Operations: | ||||
Net investment income | $ | 288,483 | ||
Net realized gain on investments | 388,943 | |||
Change in net unrealized appreciation (depreciation) on Investment in State Street Clarion Global Infrastructure & MLP Portfolio | (1,623,809 | ) | ||
|
| |||
Net increase (decrease) in net assets from operations | (946,383 | ) | ||
|
| |||
Distributions to Shareholders from: | ||||
Net investment income | ||||
Class A | (88,991 | ) | ||
Class I | (612,792 | ) | ||
|
| |||
Total distributions from net investment income | (701,783 | ) | ||
|
| |||
Net realized gain on investments | ||||
Class A | (773 | ) | ||
Class I | (5,021 | ) | ||
|
| |||
Total distributions from net realized gain on investments | (5,794 | ) | ||
|
| |||
Total distributions | (707,577 | ) | ||
|
| |||
Net Increase (Decrease) from Capital Share Transactions: | ||||
Class A | ||||
Contribution from SSGA FM (**) | 2,000,000 | |||
Proceeds from shares sold | 161,054 | |||
Reinvestment of distributions | 5,144 | |||
Cost of redemptions | (23,813 | ) | ||
|
| |||
Net increase from Capital share transactions | 2,142,385 | |||
|
| |||
Class I | ||||
In-kind transfer from CBRE Clarion Global Listed Infrastructure Fund, LP (Note 1) | 11,569,962 | |||
Contribution from SSGA FM (**) | 2,000,000 | |||
Proceeds from shares sold | 196,001 | |||
Reinvestment of distributions | 528,931 | |||
|
| |||
Net increase from Capital share transactions | 14,294,894 | |||
|
| |||
Total increase from Capital share transactions | 16,437,279 | |||
|
| |||
Net Increase in Net Assets | 14,783,319 | |||
Net Assets | ||||
Beginning of period | — | |||
|
| |||
End of period | $ | 14,783,319 | ||
|
| |||
Distributions in excess of net investment income | $ | (413,300 | ) | |
|
| |||
Changes in Shares: | ||||
Class A | ||||
Shares sold | 216,521 | |||
Reinvestment of distributions | 583 | |||
Shares redeemed | (2,401 | ) | ||
|
| |||
Net increase in shares | 214,703 | |||
Class I | ||||
In-kind transfer from CBRE Clarion Global Listed Infrastructure Fund, LP (Note 1) | 1,176,596 | |||
Shares sold | 200,000 | |||
Reinvestment of distributions | 58,814 | |||
|
| |||
Net increase in shares | 1,435,410 | |||
|
| |||
| * | Inception date |
| ** | See Financial Statements of the Master Portfolio |
See Notes to Financial Statements and Financial Statements of the Master Portfolio.
6
Table of Contents
State Street Institutional Investment Trust
State Street Clarion Global Infrastructure & MLP Fund
Selected data for a Class A Share of beneficial interest outstanding throughout the period is presented below:
| Period from 1/21/15*-12/31/15 | ||||
Net Asset Value, Beginning of Period | $ | 10.00 | ||
|
| |||
Investment Operations: | ||||
Net investment income(a) | 0.16 | |||
Net realized and unrealized gain (loss) on investments | (0.78 | ) | ||
|
| |||
Total from investment operations | (0.62 | ) | ||
|
| |||
Less Distributions From: | ||||
Net investment income | (0.42 | ) | ||
Net realized gain | (0.00 | )(b) | ||
|
| |||
Total distributions | (0.42 | ) | ||
|
| |||
Net decrease in net assets | (1.04 | ) | ||
|
| |||
Net Asset Value, End of Period | $ | 8.96 | ||
|
| |||
Total Return(c) | (6.13 | )% | ||
Ratios and Supplemental Data: | ||||
Net Assets, End of Period (000s) | $ | 1,923 | ||
Ratios to average net assets: | ||||
Expenses before waiver and payments by affiliates | 1.99 | %(d) | ||
Expenses net of waivers and payments by affiliates | 1.45 | %(d) | ||
Net investment income | 1.73 | %(d) | ||
Portfolio turnover rate(e) | 54 | %(f) | ||
| * | Commencement of operations |
| (a) | Net investment income per share is calculated using the average shares method. |
| (b) | Amount is less than $0.005 per share. |
| (c) | Total return is calculated assuming a purchase of shares at net asset value on the first day and a sale at net asset value on the last day of each period reported. Distributions are assumed, for the purpose of this calculation, to be reinvested at net asset value per share on the respective payment dates of each Fund. Total return for periods of less than one year are not annualized. Results represent past performance and are not indicative of future results. |
| (d) | Annualized. |
| (e) | Portfolio turnover rate is from the Portfolio. |
| (f) | Not annualized |
See Notes to Financial Statements and Financial Statements of the Master Portfolio.
7
Table of Contents
State Street Institutional Investment Trust
State Street Clarion Global Infrastructure & MLP Fund
Financial Highlights
Selected data for a Class I Share of beneficial interest outstanding throughout the period is presented below:
| Period from 1/21/15*-12/31/15 | ||||
Net Asset Value, Beginning of Period | $ | 10.00 | ||
|
| |||
Investment Operations: | ||||
Net investment income (loss)(a) | 0.18 | |||
Net realized and unrealized loss on investments | (0.78 | ) | ||
|
| |||
Total from investment operations | (0.60 | ) | ||
|
| |||
Less Distributions From: | ||||
Net investment income | (0.44 | ) | ||
Net realized gains | (0.00 | )(b) | ||
|
| |||
Total distributions | (0.44 | ) | ||
|
| |||
Net decrease in net assets | (1.04 | ) | ||
|
| |||
Net Asset Value, End of Period | $ | 8.96 | ||
|
| |||
Total Return(c) | (5.91 | )% | ||
Ratios and Supplemental Data: | ||||
Net Assets, End of Period (000s) | $ | 12,860 | ||
Ratios to average net assets: | ||||
Expenses before waiver and payments by affiliates | 1.74 | %(d) | ||
Expenses net of waivers and payments by affiliates | 1.20 | %(d) | ||
Net investment income | 1.97 | %(d) | ||
Portfolio turnover rate(e) | 54 | %(f) | ||
| * | Commencement of operations |
| (a) | Net investment income per share is calculated using the average shares method. |
| (b) | Amount is less than $0.005 per share. |
| (c) | Total return is calculated assuming a purchase of shares at net asset value on the first day and a sale at net asset value on the last day of each period reported. Distributions are assumed, for the purpose of this calculation, to be reinvested at net asset value per share on the respective payment dates of each Fund. Total return for periods of less than one year are not annualized. Results represent past performance and are not indicative of future results. |
| (d) | Annualized. |
| (e) | Portfolio turnover rate is from the Portfolio. |
| (f) | Not annualized. |
See Notes to Financial Statements and Financial Statements of the Master Portfolio.
8
Table of Contents
State Street Institutional Investment Trust
State Street Clarion Global Infrastructure & MLP Fund
December 31, 2015
| 1. | Organization |
State Street Institutional Investment Trust (the “Trust”) which is registered under the Investment Company Act of 1940, as amended (the “1940 Act”), is as an open-end management investment company, and was organized as a Massachusetts business trust on February 16, 2000. The Trust consists of forty-five (45) series and corresponding classes, each of which have the same rights and privileges, including the same voting rights. State Street Clarion Global Infrastructure & MLP Fund (the “Fund”), a separate non-diversified series of the Trust, is authorized to issue an unlimited number of shares, with no par value. The Fund has registered Class A, Class C, Class I and Class K Shares. The Fund’s Class C and Class K Shares were not operational at December 31, 2015. The financial statements herein relate to the following Fund:
| Fund | Classes | Commencement of Operations: | ||||
State Street Clarion Global Infrastructure & MLP Fund | Class A Class I |
| January 21, 2015 January 21, 2015 |
| ||
The investment objective of the Fund is to provide long-term total return. The Fund seeks to achieve its investment objective by investing substantially all of its investable assets (100% at December 31, 2015) in the State Street Clarion Global Infrastructure & MLP Portfolio (the “Portfolio”), a series of a separately registered investment company called SSGA Active Trust, which has substantially similar investment policies to the Fund.
Class A shares are available to the general public for investment through transaction-based financial intermediaries. Class A shares impose a 5.25% sales charge (as a percentage of offering price) and may be subject to a 1% CDSC if no initial sales charge was paid at the time of purchase of an investment of $1,000,000 or more and the shares are redeemed within 18 months of purchase. Class I shares are sold without a sales charge and only to certain eligible investors.
The financial statements of the Portfolio, including the Schedule of Investments, is attached with this report and should be read in conjunction with the Fund’s financial statements.
The Portfolio of the State Street Clarion Global Infrastructure & MLP Fund commenced operations on January 21, 2015, after it acquired the net assets of the CBRE Clarion Global Listed Infrastructure Fund, LP (the “Partnership”), in exchange for Fund shares. The Partnership commenced operations on March 1, 2012. The acquisition of net assets of the Partnership was accomplished by an in-kind transfer of all of the Partnership’s net assets amounting to $11,569,962 and a cash transfer of $196,000 by the Partnership in exchange for 1,176,596 shares of the Fund. The Partnership elected to make a deemed sale election pursuant to the subscription agreement. SSGA FM contributed initial capital of $4,000,100 to the Fund in exchange for its shares. The fund substantially invested all of its assets into the MLP Portfolio as part of commencement of its operations. Immediately prior to the acquisition, the Portfolio did not have any assets or liabilities nor operations or investment activities.
Under the Trust’s organizational documents, its officers and trustees are indemnified against certain liabilities arising out of the performance of their duties to the Trust. Additionally, in the normal course of business, the Trust enters into contracts with service providers that contain general indemnification clauses. The Trust’s maximum exposure under these arrangements is unknown as this could involve future claims that may be made against the Trust that have not yet occurred.
9
Table of Contents
State Street Institutional Investment Trust
State Street Clarion Global Infrastructure & MLP Fund
Notes to Financial Statements — (continued)
December 31, 2015
| 2. | Summary of Significant Accounting Policies |
The following is a summary of significant accounting policies followed by the Trust in the preparation of its financial statements:
The preparation of financial statements in accordance with U.S. generally accepted accounting principles (“U.S. GAAP”) requires management to make estimates and assumptions that affect the reported amounts and disclosures in the financial statements. Actual results could differ from those estimates. The Fund is an investment company under U.S. GAAP and follows the accounting and reporting guidance applicable to investment companies in Financial Accounting Standards Board (“FASB”) Accounting Standards Codification (“ASC”) 946, Financial Services Investment Companies (“ASC 946”).
Security Valuation – The Fund records its investment in the Portfolio at fair value (net asset value) each business day. The valuation policy of the Portfolio is discussed in Note 2 of the Portfolio’s Notes to Financial Statements.
The Portfolio adopted provisions surrounding fair value measurements and disclosures that define fair value, establish a framework for measuring fair value in accordance with generally accepted accounting principles and expand disclosures about fair value measurements. This applies to fair value measurements that are already required or permitted by other accounting standards and is intended to increase consistency of those measurements and applies broadly to securities and other types of assets and liabilities. The summary of the inputs used for the Portfolio, as of December 31, 2015, in valuing the Portfolio’s securities carried at fair value are discussed in Note 2 of the Portfolio’s Notes to Financial Statements, which are attached to this report. The investment in the Portfolio is categorized as Level 1 for financial reporting purposes.
Investment Transactions and Income Recognition – Investment transactions are accounted for on the trade date for financial reporting purposes. Dividend income and capital gain distributions, if any, are recognized daily on the ex-dividend date, net of foreign taxes withheld at source, if any. Realized gains and losses from the sale or disposition of investments are determined using the identified cost method.
Expenses – Advisory fees and other expenses, which are directly identifiable to a specific fund, are applied to that fund within the Trust. Trustees’ fees and other expenses which cannot be attributed to a specific fund are allocated in such a manner as deemed equitable, taking into consideration the nature and type of expense and the relative net assets of the funds within the Trust. Class specific fees are borne by each class.
Federal Income Taxes – The Fund has qualified and intends to qualify for and elect treatment as a “regulated investment company” under Subchapter M of the Internal Revenue Code of 1986, as amended. By so qualifying and electing, the Fund will not be subject to federal income taxes to the extent it distributes its taxable income, including any net realized capital gains, for each fiscal year. In addition, by distributing during each calendar year substantially all of its net investment income and capital gains, if any, the Fund will not be subject to federal excise tax. Income and capital gain distributions are determined in accordance with income tax regulations which may differ from U.S. GAAP. These book-tax differences are primarily due to differing treatments for foreign currencies and losses deferred due to wash sales.
10
Table of Contents
State Street Institutional Investment Trust
State Street Clarion Global Infrastructure & MLP Fund
Notes to Financial Statements — (continued)
December 31, 2015
SSGA FM has reviewed the tax positions for the open tax years as of December 31, 2015 and has determined that no provision for income tax is required in the Fund’s financial statements. The Fund’s federal tax return for the initial fiscal year remains subject to examination by the Fund’s major tax jurisdictions, which include the United States of America and the Commonwealth of Massachusetts. The Fund recognizes interest and penalties, if any, related to tax liabilities as income tax expense in the Statement of Operations. No income tax returns are currently under examination. Management has analyzed tax laws and regulations and their applications to the Fund’s facts and circumstances and does not believe there are any uncertain tax positions that require recognition of a tax liability.
The tax character of distributions paid to shareholders during the period ended December 31, 2015, was as follows:
Ordinary Income | Long-Term Capital Gain | Tax Return of Capital | Total | |||||||||
$707,577 | $ | — | — | $ | 707,577 | |||||||
At December 31, 2015, the components of distributable earnings on a tax basis were as follows:
| Undistributed Ordinary Income | Undistributed Tax Exempt Income | Unrealized Appreciation (Depreciation) | Total | |||||||||
$— | $ | — | $ | (1,653,585 | ) | $ | (1,653,585 | ) | ||||
For the period ended December 31, 2015, permanent differences identified and reclassified among the components of net assets were as follows:
| Paid-In Capital | Accumulated Gain (Loss) | Undistributed Net Investment Income (Loss) | ||||||
$(375) | $ | (412,925 | ) | $ | 413,300 | |||
These differences were primarily attributable to distribution redesignations. Net investment income (loss), net realized gains (losses), and net assets were not affected by this reclassification.
At December 31, 2015, gross unrealized appreciation and gross unrealized depreciation based on cost for federal income tax purpose were as follows:
Tax Cost | Gross Unrealized Appreciation | Gross Unrealized Depreciation | Net Unrealized Appreciation (Depreciation) | |||||||||
$16,462,283 | $ | — | $ | (1,653,585 | ) | $ | (1,653,585 | ) | ||||
Distributions – Dividends from net investment income are declared and paid quarterly. Net realized capital gains, if any, are distributed annually, unless additional distributions are required for compliance with applicable tax regulations. The amount and character of income and gains to be distributed are determined in accordance with federal tax regulations which may differ from net investment income and realized gains recognized for U.S. GAAP purposes.
11
Table of Contents
State Street Institutional Investment Trust
State Street Clarion Global Infrastructure & MLP Fund
Notes to Financial Statements — (continued)
December 31, 2015
| 3. | Related Party and Other Fees |
SSGA Funds Management, Inc. ( “SSGA FM” or the “Adviser”), a subsidiary of State Street Corporation and an affiliate of State Street Bank and Trust Company (“State Street”), serves as the investment adviser and CBRE Clarion Securities LLC (the “Sub-Adviser”) serves as the subadviser. The Trust, on behalf of the Fund, has entered into an Investment Advisory Agreement with the Adviser. For its advisory services to the Fund, the Fund pays the Adviser a management fee at an annual rate of 0.90% of its average daily net assets.
The Adviser has entered into a sub-advisory agreement with the Sub-Adviser pursuant to which the Sub-Adviser will be responsible for the day-to-day management of any assets of the Fund. The Sub-Adviser receives fees from the Adviser for its services provided to the Fund.
The Adviser is contractually obligated until April 30, 2016, to waive its management fee and/or to reimburse the Fund for expenses to the extent that total expenses (exclusive of non-recurring account fees, extraordinary expenses, acquired fund fees and expenses, and distribution, shareholder servicing, and sub- transfer agency fees) exceed 1.20% of average daily net assets on an annual basis. This waiver and/or reimbursement may not be terminated prior to April 30, 2016, except with the approval of the Board. Fees waived and expenses reimbursed by SSGA FM are shown on the Statement of Operations.
Effective June 1, 2015, SSGA FM serves as administrator and State Street serves as sub-administrator and custodian. For services as administrator, SSGA FM receives a fee at an annual rate of 0.05% of average daily net assets attributable to each class of shares of the Fund. The fees are accrued daily and paid monthly. State Street receives fees for its services as sub-administrator, accounting agent and custodian. Prior to June 1, 2015, State Street served as administrator. For the period January 21, 2015 to May 31, 2015, the Fund paid State Street an annualized fee of $25,000 for its services as administrator.
Boston Financial Data Services (“BFDS”), a joint venture of DST Systems, Inc. and State Street Corporation, serves as transfer agent and dividend disbursing agent to the Fund. For these services, the Fund pays annual account services fees, activity-based fees, charges related to compliance and regulatory services.
State Street Global Markets LLC (“SSGM” or the “Distributor”) serves as the distributor of the Fund. SSGM is a wholly owned subsidiary of State Street Corporation. The Fund has adopted a distribution plan pursuant to Rule 12b-1 under the 1940 Act under which the Fund may compensate its distributor (State Street Global Markets LLC or “SSGM”) for services in connection with the distribution of the Fund’s Class A shares and for services provided to Fund shareholders in that class (the “Plan”). The Plan calls for payments at an annual rate (based on average daily net assets) of 0.25% of the Fund’s net assets attributable to its Class A shares. Because these fees are paid out of the assets of the Fund attributable to its Class A shares on an ongoing basis, they will increase the cost of your investment and may cost you more over time than paying other types of sales charges. In addition to payments under the Plan, the Fund may reimburse SSGM or its affiliates for payments it makes to financial intermediaries that provide certain administrative, recordkeeping, and account maintenance services. The amount of the reimbursement and the manner in which it is calculated are reviewed by the Trustees periodically.
The Fund also may pay a sub-transfer agent fee at an annual rate of up to 0.20% of the Fund’s average daily net assets attributable to Class A and I for recordkeeping, shareholder servicing, or administrative services provided by financial intermediaries.
12
Table of Contents
State Street Institutional Investment Trust
State Street Clarion Global Infrastructure & MLP Fund
Notes to Financial Statements — (continued)
December 31, 2015
| 4. | Trustees’ Fees |
Independent Trustees are compensated on a calendar year basis. Any Trustee who is deemed to be an “interested person” (as defined in the 1940 Act) of the Fund does not receive compensation from the Fund for his or her service as a Trustee.
Each Independent Trustee receives for his or her services to the Trust, the State Street Master Funds, and SSGA Funds, a $141,500 annual base retainer in addition to $18,000 for each in-person meeting and $2,000 for each telephonic meeting from the Trusts. The Co-Chairmen each receive an additional $44,000 annual retainer. The Independent Trustees are reimbursed for travel and other out-of-pocket expenses in connection with meeting attendance. Trustees’ fees and expenses are allocated among the Trusts and each of their respective series in such a manner as deemed equitable, taking into consideration the relative net assets of the series, subject to a $15,000 minimum per Fund. As of the date of these financial statements, the Trustees were not paid pension or retirement benefits as part of the Trust’s expenses.
| 5. | Subsequent Events |
Management has evaluated the impact of all subsequent events on the Fund through the date the financial statements were available to be issued and has determined that there were no subsequent events requiring adjustment or disclosure in the financial statements.
13
Table of Contents
Report of Independent Registered Public Accounting Firm
To the Board of Trustees and Shareholders of State Street Institutional Investment Trust:
We have audited the accompanying statement of assets and liabilities of State Street Clarion Global Infrastructure & MLP Fund (one of the funds constituting State Street Institutional Investment Trust) (the “Fund”) as of December 31, 2015, and the related statement of operations, statement of changes in net assets and the financial highlights for the period from January 21, 2015 (commencement of operations) to December 31, 2015. These financial statements and financial highlights are the responsibility of the Fund’s management. Our responsibility is to express an opinion on these financial statements and financial highlights based on our audit.
We conducted our audit in accordance with the standards of the Public Company Accounting Oversight Board (United States). Those standards require that we plan and perform the audit to obtain reasonable assurance about whether the financial statements and financial highlights are free of material misstatement. We were not engaged to perform an audit of the Fund’s internal control over financial reporting. Our audit included consideration of internal control over financial reporting as a basis for designing audit procedures that are appropriate in the circumstances, but not for the purpose of expressing an opinion on the effectiveness of the Fund’s internal control over financial reporting. Accordingly, we express no such opinion. An audit also includes examining, on a test basis, evidence supporting the amounts and disclosures in the financial statements and financial highlights, assessing the accounting principles used and significant estimates made by management, and evaluating the overall financial statement presentation. Our procedures included confirmation of securities owned as of December 31, 2015, by correspondence with the custodian. We believe that our audit provides a reasonable basis for our opinion.
In our opinion, the financial statements and financial highlights referred to above present fairly, in all material respects, the financial position of State Street Clarion Global Infrastructure & MLP Fund (one of the funds constituting State Street Institutional Investment Trust) at December 31, 2015, and the results of its operations, the changes in its net assets and the financial highlights for the period from January 21, 2015 (commencement of operations) to December 31, 2015, in conformity with U.S. generally accepted accounting principles.

Boston, Massachusetts
February 26, 2016
14
Table of Contents
State Street Institutional Investment Trust
State Street Clarion Global Infrastructure & MLP Fund
December 31, 2015 (Unaudited)
Shareholder Expense Example
As a shareholder of the Fund, you incur (1) transaction costs, including sales charges (loads) on purchase payments, reinvested dividends, or other distributions and (2) ongoing costs, including management fees and to the extent applicable, distribution (12b-1) or service fees, among others. This example is intended to help you understand your ongoing costs (in dollars) of investing in the Fund and to compare these costs with the ongoing costs of investing in other mutual funds. It is based on an investment of $1,000 made at the beginning of the period shown and held for the six months ended from July 1, 2015 to December 31, 2015.
| • | Actual Expenses – The first section helps you to estimate the actual expenses that you paid over the period. The “Ending Account Value” shown is derived from the Fund’s actual return, and the third column shows the dollar amount that would have been paid by an investor who started with $1,000 in the Fund. You may use the information here, together with the amount you invested, to estimate the expenses that you paid over the period. To do so, simply divide your account value by $1,000 (for example, an $8,600 account value divided by $1,000 = 8.6), then multiply the result by the number given for the Fund under the heading “Expenses Paid During Period”. |
| • | Hypothetical Example for Comparison Purposes – The second section is intended to help you compare your Fund’s costs with those of other mutual funds. It assumes that the Fund had a yearly return of 5% before expenses, but that the expense ratio is unchanged. In this case, because the return used is not the Fund’s actual return, the results do not apply to your investment. The example is useful in making comparisons because the U.S. Securities and Exchange Commission requires all mutual funds to calculate expenses based on a 5% return. You can assess your Fund’s costs by comparing this hypothetical example with the hypothetical examples that appear in shareholder reports of other funds. |
Please note that the expenses shown in the table are meant to highlight your ongoing costs only and do not reflect any transaction costs, such as sales charges (loads). Therefore, the hypothetical 5% return section of the table is useful in comparing ongoing costs only, and will not help you determine the relative total costs of owning different funds. In addition, if these transaction costs were included, your costs would have been higher.
Six Months Ended December 31, 2015 | ||||||
| Class A Shares** | Beginning Account Value July 1, 2015 | Ending Account Value December 31, 2015 | Expenses Paid During Period * | |||
Based on Actual Fund Return | ||||||
State Street Clarion Global Infrastructure & MLP Fund | $1,000.00 | $ 936.19 | $7.08 | |||
Based on Hypothetical (5% return before expenses) | ||||||
State Street Clarion Global Infrastructure & MLP Fund | $1,000.00 | $1,017.90 | $7.38 | |||
| * | The calculations are based on expenses incurred in the most recent six month period of the Fund. The Fund’s Class A Shares’ annualized expense ratio as of December 31, 2015, which includes the Fund’s proportionate share of the expenses of its Portfolio, was 1.45%. The dollar amounts shown as “Expenses Paid” are equal to the annualized expense ratio multiplied by the average account value over the period, multiplied by 184/365 (the most recent six month period). |
15
Table of Contents
State Street Institutional Investment Trust
State Street Clarion Global Infrastructure & MLP Fund
Other Information — (continued)
December 31, 2015 (Unaudited)
Six Months Ended December 31, 2015 | ||||||
| Class I Shares** | Beginning Account Value July 1, 2015 | Ending Account Value December 31, 2015 | Expenses Paid During Period * | |||
Based on Actual Fund Return | ||||||
State Street Clarion Global Infrastructure & MLP Fund | $1,000.00 | $937.40 | $5.86 | |||
Based on Hypothetical (5% return before expenses) | ||||||
State Street Clarion Global Infrastructure & MLP Fund | $1,000.00 | $1,019.16 | $6.11 | |||
| * | The calculations are based on expenses incurred in the most recent six month period of the Fund. The Fund’s Class I Shares’ annualized expense ratio as of December 31, 2015, which includes the Fund’s proportionate share of the expenses of its Portfolio, was 1.20%. The dollar amounts shown as “Expenses Paid” are equal to the annualized expense ratio multiplied by the average account value over the period, multiplied by 184/365 (the most recent six month period). |
Tax Information
Dividend Received Deduction
For federal income tax purposes, the following information is furnished with respect to the distributions of the Trust for its fiscal period ended December 31, 2015.
Percentage of distributions which qualify for the corporate dividends received deduction:
| Fund | Percentage | |
State Street Clarion Global Infrastructure & MLP Fund | 12.11% |
Qualified Dividend Income
A portion of dividends distributed by the Funds during the fiscal period ended December 31, 2015, are considered qualified dividend income, and are eligible for reduced tax rates. These lower rates range from 5% to 20% depending on the individual’s tax bracket. These amounts are noted below:
| Fund | Amount | |
State Street Clarion Global Infrastructure & MLP Fund | $357,404 |
16
Table of Contents
State Street Institutional Investment Trust
State Street Clarion Global Infrastructure & MLP Fund
Shareholder Requests for Additional Information
December 31, 2015 (Unaudited)
Proxy Voting Policies and Procedures
A description of the Trust’s proxy voting policies and procedures that are used by the Fund’s and the Portfolio’s investment adviser to vote proxies relating to the portfolio of securities are available (i) without charge, upon request by calling 1-877-521-4083 (toll free) or (ii) on the website of the U.S. Securities and Exchange Commission (the “SEC”), at www.sec.gov. Information regarding how the investment adviser voted for the prior 12-month period ended June 30 is available by August 31 of each year by calling the same number and on the SEC’s website, at www.sec.gov, and on the Portfolio’s website at www.ssgafunds.com.
Quarterly Portfolio Schedule
The Fund and the Portfolio file a complete schedule of investments with the SEC for the first and third quarters of each fiscal year on Form N-Q. The Fund’s and the Portfolio’s Forms N-Q are available on the SEC’s website at www.sec.gov and may be reviewed and copied at the SEC’s Public Reference Room in Washington, DC. Information on the operation of the Public Reference Room may be obtained by calling 1-800-SEC-0330. The information on Form N-Q is available upon request, without charge, by calling 1-877-521-4083 (toll-free).
17
Table of Contents
State Street Clarion Global Infrastructure & MLP Fund
Disclosure of Information about Fund Trustees and Officers
December 31, 2015 (Unaudited)
Name, Address, and Year of Birth | Position(s) Held | Term of Office Time Served | Principal Occupation During Past Five Years and Relevant Experience | Number of Funds in Fund Complex Overseen by Trustee | Other Directorships Held by Trustee During Past Five Years | |||||
Independent Trustees | ||||||||||
Michael F. Holland State Street Bank and Trust Company 100 Huntington Avenue, CPH 0326 Boston, MA 02116 YOB: 1944 | Trustee and Co-Chairman of the Board | Term: Indefinite Elected: 7/99 | Chairman, Holland & Company L.L.C. (investment adviser) (1995 – present). | 75 | Director, the Holland Series Fund, Inc.; Director, The China Fund, Inc.; Director, The Taiwan Fund, Inc.; Director, Reaves Utility Income Fund, Inc.; and Director, Blackstone/GSO Loan Funds. | |||||
Patrick J. Riley State Street Bank and Trust Company 100 Huntington Avenue, CPH 0326 Boston, MA 02116 YOB: 1948 | Trustee and Co-Chairman of the Board | Term: Indefinite Elected: 1/14 | 2002 to May 2010, Associate Justice of the Superior Court, Commonwealth of Massachusetts; 1985 to 2002, Partner, Riley, Burke & Donahue, L.L.P. (law firm); 1998 to Present, Independent Director, State Street Global Advisers Ireland, Ltd. (investment company); 1998 to Present, Independent Director, SSGA Liquidity plc (formerly, SSGA Cash Management Fund plc); January 2009 to Present, Independent Director, SSGA Fixed Income plc; and January 2009 to Present, Independent Director, SSGA Qualified Funds PLC. | 75 | Board Director and Chairman, SPDR Europe 1PLC Board (2011 – Present); Board Director and Chairman, SPDR Europe II, PLC (2013 – Present). | |||||
William L. Boyan State Street Bank and Trust Company 100 Huntington Avenue, CPH 0326 Boston, MA 02116 YOB: 1937 | Trustee and Co-Chairman of the Valuation Committee | Term: Indefinite Elected: 7/99 | President and Chief Operations Officer, John Hancock Financial Services (1959 – 1999). Mr. Boyan retired in 1999. Chairman Emeritus, Children’s Hospital, Boston, MA (1984 – 2011); Former Trustee of Old Mutual South Africa Master Trust (investments) (1995 – 2008); Former Chairman, Boston Plan For Excellence, Boston Public Schools (1995 – 2010); Member of Advisory Board of Florida Atlantic University Lifelong Learning Society. | 75 | Former Trustee of Old Mutual South Africa Master Trust. | |||||
William L. Marshall State Street Bank and Trust Company 100 Huntington Avenue, CPH 0326 Boston, MA 02116 YOB: 1942 | Trustee and Co-Chairman of the Audit Committee | Term: Indefinite Elected: 1/14 | April 2011 to Present, Chairman (until April 2011, Chief Executive Officer and President), Wm. L. Marshall Associates, Inc., Wm. L. Marshall Companies, Inc. and the Marshall Financial Group, Inc. (a registered investment adviser and provider of financial and related consulting services); Certified Financial Planner; Member, Financial Planners Association; 2015 to present, Board Member, The Doylestown Health Foundation Board. | 75 | Marshall Financial Group, Inc. |
18
Table of Contents
State Street Clarion Global Infrastructure & MLP Fund
Disclosure of Information about Fund Trustees and Officers — (continued)
December 31, 2015 (Unaudited)
Name, Address, and Year of Birth | Position(s) Held | Term of Office Time Served | Principal Occupation During Past Five Years and Relevant Experience | Number of Funds in Fund Complex Overseen by Trustee | Other Directorships Held by Trustee During Past Five Years | |||||
Independent Trustees (continued) | ||||||||||
Richard D. Shirk State Street Bank and Trust Company 100 Huntington Avenue, CPH 0326 Boston, MA 02116 YOB: 1945 | Trustee and Co-Chairman of the Qualified Legal and Compliance Committee | Term: Indefinite Elected: 1/14 | March 2001 to April 2002, Chairman (1996 to March 2001, President and Chief Executive Officer), Cerulean Companies, Inc. (holding company) (Retired); 1992 to March 2001, President and Chief Executive Officer, Blue Cross Blue Shield of Georgia (health insurer, managed healthcare); 1998 to December 2008, Chairman, Board Member and December 2008 to Present, Investment Committee Member, Healthcare Georgia Foundation (private foundation); September 2002 to 2012, Lead Director and Board Member, Amerigroup Corp. (managed health care); 1999 to 2013, Board Member and (since 2001) Investment Committee Member, Woodruff Arts Center; and 2003 to 2009, Trustee, Gettysburg College. | 75 | Board member, AeroCare Holdings (privately held healthcare services company) (February 2003 – Present); Board member, Regenesis Biomedical (health care services) (April 2012 – Present); Chairman (January 2014 – Present). | |||||
Rina K. Spence State Street Bank and Trust Company 100 Huntington Avenue, CPH 0326 Boston, MA 02116 YOB: 1948 | Trustee and Co-Chairman of the Qualified Legal and Compliance Committee and Co-Chairman of the Governance Committee | Term: Indefinite Elected: 7/99 | President of SpenceCare International LLC (international healthcare consulting) (1999 – present); Chief Executive Officer, IEmily.com (health internet company) (2000 – 2001); Chief Executive Officer of Consensus Pharmaceutical, Inc. (1998 – 1999); Founder, President and Chief Executive Officer of Spence Center for Women’s Health (1994 – 1998); President and CEO Emerson Hospital (1984 – 1994); Trustee, Eastern Enterprise (utilities) (1988 – 2000); Director, Berkshire Life Insurance Company of America (1993 – 2009); Honorary Consul for Monaco in Boston (2015 – present). | 75 | ||||||
19
Table of Contents
State Street Clarion Global Infrastructure & MLP Fund
Disclosure of Information about Fund Trustees and Officers — (continued)
December 31, 2015 (Unaudited)
Name, Address, and Year of Birth | Position(s) Held | Term of Office Time Served | Principal Occupation During Past Five Years and Relevant Experience | Number of Funds in Fund Complex Overseen by Trustee | Other Directorships Held by Trustee During Past Five Years | |||||
Independent Trustees (continued) | ||||||||||
Bruce D. Taber State Street Bank and Trust Company 100 Huntington Avenue, CPH 0326 Boston, MA 02116 YOB: 1943 | Trustee and Co-Chairman of the Valuation Committee and Co-Chairman of the Governance Committee | Term: Indefinite Elected: 1/14 | 1999 to Present, Partner, Zenergy LLC (a technology company providing Computer Modeling and System Analysis to the General Electric Power Generation Division); Until December 2008, Independent Director, SSGA Cash Management Fund plc; Until December 2008, Independent Director, State Street Global Advisers Ireland, Ltd. (investment companies); and Until August 1994, President, Alonzo B. Reed, Inc., (a Boston architect-engineering firm). | 75 | ||||||
Douglas T. Williams State Street Bank and Trust Company 100 Huntington Avenue, CPH 0326 Boston, MA 02116 YOB: 1940 | Trustee and Co-Chairman of the Audit Committee | Term: Indefinite Elected: 7/99 | President, Oakmont Homeowners Association; President, Mariner Sands Chapel; Executive Vice President and member of Executive Committee, Chase Manhattan Bank (1987 – 1999); President, Boston Stock Exchange Depository Trust Company, 1981 – 1982; Treasurer, Nantucket Educational Trust, (2002 – 2007). | 75 | ||||||
Interested Trustee(1) | ||||||||||
James E. Ross SSGA Funds Management, Inc. State Street Financial Center One Lincoln Street Boston, MA 02111 YOB: 1965 | Trustee | Term: Indefinite Elected Trustee: 2/07 | Chairman and Director, SSGA Funds Management, Inc. (2012 – present); President, SSGA Funds Management, Inc. (2005 – 2012); Executive Vice President and Senior Managing Director, State Street Global Advisors (2006 – present); and Principal, State Street Global Advisors (2006 – present). | 290 | Trustee, SPDR Series Trust; Trustee, SPDR Index Shares Funds; Trustee, Select Sector SPDR Trust; Trustee, SSGA Active Trust; and Trustee, SSGA Master Trust. | |||||
| (1) | Mr. Ross is an Interested Trustee because of his employment by SSGA Funds Management, Inc., an affiliate of the Trust. |
Name, Address, and Year of Birth | Position(s) Held | Term of Office Time Served | Principal Occupation During Past Five Years | |||
Officers: | ||||||
Ellen M. Needham SSGA Funds Management, Inc. State Street Financial Center One Lincoln Street Boston, MA 02111 YOB: 1967 | President | Term: Indefinite Elected: 10/12 | President and Director, SSGA Funds Management, Inc. (June 2012 – present); Chief Operating Officer, SSGA Funds Management, Inc. (May 2010 – June 2012); Senior Managing Director, SSGA Funds Management, Inc. (1992 – 2012) and Senior Managing Director, State Street Global Advisors (1992 – present).* |
20
Table of Contents
State Street Clarion Global Infrastructure & MLP Fund
Disclosure of Information about Fund Trustees and Officers — (continued)
December 31, 2015 (Unaudited)
Name, Address, and Year of Birth | Position(s) Held | Term of Office Time Served | Principal Occupation During Past Five Years | |||
Officers: (continued) | ||||||
Bruce S. Rosenberg SSGA Funds Management, Inc. State Street Financial Center One Lincoln Street Boston, MA 02111 YOB: 1961 | Treasurer | Term: Indefinite Elected: 2/16 | Managing Director, State Street Global Advisors and SSGA Funds Management, Inc. (July 2015 – present); Director, Credit Suisse (April 2008 – July 2015). | |||
Ann M. Carpenter SSGA Funds Management, Inc. State Street Financial Center One Lincoln Street Boston, MA 02111 YOB: 1966 | Vice President Deputy Treasurer | Term: Indefinite Elected: 10/12 Term: Indefinite Elected: 2/16 | Chief Operating Officer, SSGA Funds Management, Inc. (April 2014 – present); Vice President, State Street Global Advisors and SSGA Funds Management, Inc. (2005 – present).* | |||
Chad C. Hallett SSGA Funds Management, Inc. State Street Financial Center One Lincoln Street Boston, MA 02111 YOB: 1969 | Deputy Treasurer | Term: Indefinite Elected: 2/16 | Vice President, State Street Global Advisors and SSGA Funds Management, Inc. (November 2014 – present); Vice President, State Street Bank and Trust Company (2001 – November 2014).* | |||
Sujata Upreti SSGA Funds Management, Inc. State Street Financial Center One Lincoln Street Boston, MA 02111 YOB: 1974 | Assistant Treasurer | Term: Indefinite Elected: 2/16 | Vice President, State Street Global Advisors and SSGA Funds Management, Inc. (May 2015 – present); Assistant Director, Cambridge Associates, LLC (July 2014 – January 2015); Vice President, Bank of New York Mellon (July 2012 – August 2013); Manager, PricewaterhouseCoopers, LLP (September 2009 – July 2012). | |||
Daniel Foley SSGA Funds Management, Inc. State Street Financial Center One Lincoln Street Boston, MA 02111 YOB: 1972 | Assistant Treasurer | Term: Indefinite Elected: 2/16 | Vice President, State Street Global Advisors and SSGA Funds Management, Inc. (April 2014 – present); Principal, State Street Global Advisors and SSGA Funds Management, Inc. (April 2007 – April 2014). | |||
Brian Harris SSGA Funds Management, Inc. State Street Financial Center One Lincoln Street Boston, MA 02111 YOB: 1973 | Chief Compliance Officer | Term: Indefinite Elected: 11/13 | Vice President, State Street Global Advisors and SSGA Funds Management, Inc.( June 2013 – Present); Senior Vice President and Global Head of Investment Compliance, BofA Global Capital Management (September 2010 to May 2013); Director of Compliance, AARP Financial Inc. (July 2008 to August 2010). | |||
Trevor Swanberg SSGA Funds Management, Inc. State Street Financial Center One Lincoln Street Boston, MA 02111 YOB: 1979 | Code of Ethics Compliance Officer | Term: Indefinite Elected: 8/15 | Vice President, State Street Global Advisors and SSGA Funds Management, Inc. (January 2015 – Present); Senior Manager-Mutual Fund Compliance, ICMA-Retirement Corporation (December 2011 – January 2015); Assistant Vice President, J.P. Morgan (September 2007 – December 2011). | |||
Joshua A. Weinberg SSGA Funds Management, Inc. State Street Financial Center One Lincoln Street Boston, MA 02111 YOB: 1978 | Chief Legal Officer | Term: Indefinite Elected: 2/15 | Vice President and Managing Counsel, State Street Global Advisors (2011 – present); Clerk, SSGA Funds Management, Inc. (2013 – present); Associate, Financial Services Group, Dechert LLP (2006 – 2011). |
21
Table of Contents
State Street Clarion Global Infrastructure & MLP Fund
Disclosure of Information about Fund Trustees and Officers — (continued)
December 31, 2015 (Unaudited)
Name, Address, and Year of Birth | Position(s) Held | Term of Office Time Served | Principal Occupation During Past Five Years | |||
Officers: (continued) | ||||||
David K. James State Street Bank and Trust Company 100 Huntington Avenue, 3rd Floor Boston, MA 02116 YOB: 1970 | Secretary | Term: Indefinite Elected: 4/13 | Managing Director and Managing Counsel, State Street Bank and Trust Company (2009 – present); Vice President and Counsel, PNC Global Investment Servicing (US), Inc. (2006 – 2009). | |||
Kristin Schantz State Street Bank and Trust Company 100 Huntington Avenue, 3rd Floor Boston, MA 02116 YOB: 1979 | Assistant Secretary | Term: Indefinite Elected: 2/14 | Vice President and Counsel, State Street Bank and Trust Company (2013 – present); Vice President, Citi Fund Services Ohio, Inc. (2008 – 2013). |
| * | Served in various capacities and/or with various affiliated entities during noted time period. |
22
Table of Contents
Trustees
William L. Boyan
Michael F. Holland
William L. Marshall
Patrick J. Riley
James E. Ross
Richard D. Shirk
Rina K. Spence
Bruce D. Taber
Douglas T. Williams
Investment Adviser and Administrator
SSGA Funds Management, Inc.
State Street Financial Center
One Lincoln Street
Boston, MA 02111
Investment Sub-Adviser
CBRE Clarion Securities LLC.
201 King of Prussia Road, Suite 600
Radnor, PA 19087
Custodian and Sub-Administrator
State Street Bank and Trust Company
State Street Financial Center
One Lincoln Street
Boston, MA 02111
Independent Registered Public Accounting Firm
Ernst & Young LLP
200 Clarendon Street
Boston, MA 02116
Legal Counsel
Ropes & Gray LLP
800 Boylston Street
Boston, MA 02199
Transfer Agent
Boston Financial Data Services
2000 Crown Colony Drive
Quincy, MA 02169
Distributor
State Street Global Markets LLC
State Street Financial Center
One Lincoln Street
Boston, MA 02111
This report is for shareholder information. This is not a prospectus intended for use in the purchase or sale of shares of beneficial interest.
State Street Institutional Investment Trust
State Street Bank and Trust Company
P.O. Box 5049
Boston, MA 02206
IBG-18451
Table of Contents
[THIS PAGE INTENTIONALLY LEFT BLANK]
Table of Contents
31 December 2015
SSGA Active Trust
State Street Clarion Global Infrastructure & MLP Portfolio

Table of Contents
[THIS PAGE INTENTIONALLY LEFT BLANK]
Table of Contents
State Street Clarion Global Infrastructure & MLP Portfolio
SCHEDULE OF INVESTMENTS
December 31, 2015 (Unaudited)
Security Description | Shares | Value | ||||||
COMMON STOCKS — 98.5% | ||||||||
AUSTRALIA — 5.0% | ||||||||
Transurban Group Stapled Security (a) (b) | 93,689 | $ | 709,038 | |||||
Transurban Group (a) (b) (c) | 5,205 | 39,649 | ||||||
|
| |||||||
| 748,687 | ||||||||
|
| |||||||
CANADA — 2.3% | ||||||||
Pembina Pipeline Corp. | 8,100 | 175,808 | ||||||
Veresen, Inc. | 26,100 | 166,472 | ||||||
|
| |||||||
| 342,280 | ||||||||
|
| |||||||
CHINA — 1.8% | ||||||||
Beijing Enterprises Holdings, Ltd. (b) | 19,000 | 114,536 | ||||||
COSCO Pacific, Ltd. (b) | 132,700 | 145,866 | ||||||
|
| |||||||
| 260,402 | ||||||||
|
| |||||||
FRANCE — 6.3% | ||||||||
Aeroports de Paris (b) | 1,653 | 192,278 | ||||||
Suez Environnement Co. (b) | 11,169 | 208,811 | ||||||
Vinci SA (b) | 8,332 | 533,816 | ||||||
|
| |||||||
| 934,905 | ||||||||
|
| |||||||
ITALY — 3.6% | ||||||||
Atlantia SpA (b) | 5,041 | 133,321 | ||||||
Ei Towers SpA (b) | 2,847 | 183,354 | ||||||
Enel SpA (b) | 52,206 | 218,825 | ||||||
|
| |||||||
| 535,500 | ||||||||
|
| |||||||
JAPAN — 8.5% | ||||||||
Central Japan Railway Co. (b) | 3,100 | 549,897 | ||||||
East Japan Railway Co. (b) | 7,500 | 705,657 | ||||||
|
| |||||||
| 1,255,554 | ||||||||
|
| |||||||
MEXICO — 1.1% | ||||||||
Grupo Aeroportuario del Sureste SAB de CV Class B | 11,370 | 160,558 | ||||||
|
| |||||||
SPAIN — 8.2% | ||||||||
Abertis Infraestructuras SA (b) | 23,414 | 366,029 | ||||||
Enagas SA (b) | 8,386 | 236,454 | ||||||
Ferrovial SA (b) | 14,956 | 338,063 | ||||||
Red Electrica Corp. SA (b) | 3,362 | 280,710 | ||||||
|
| |||||||
| 1,221,256 | ||||||||
|
| |||||||
SWITZERLAND — 1.3% | ||||||||
Flughafen Zuerich AG (b) | 250 | 187,690 | ||||||
|
| |||||||
UNITED KINGDOM — 4.6% | ||||||||
National Grid PLC (b) | 39,798 | 548,765 | ||||||
United Utilities Group PLC (b) | 9,403 | 129,447 | ||||||
|
| |||||||
| 678,212 | ||||||||
|
| |||||||
UNITED STATES — 55.8% | ||||||||
American Electric Power Co., Inc. | 4,300 | 250,561 | ||||||
American Tower Corp. REIT | 3,300 | 319,935 | ||||||
Avangrid, Inc. (c) | 3,300 | 126,720 | ||||||
Boardwalk Pipeline Partners L.P. | 8,700 | 112,926 | ||||||
California Water Service Group | 5,600 | 130,312 | ||||||
Crown Castle International Corp. REIT | 8,335 | 720,561 | ||||||
Dominion Midstream Partners L.P. (c) | 5,400 | 165,564 | ||||||
Dominion Resources, Inc. | 5,968 | 403,675 | ||||||
DTE Energy Co. | 5,784 | 463,819 | ||||||
Edison International | 5,509 | 326,188 | ||||||
Energy Transfer Partners L.P. | 8,229 | 277,564 | ||||||
Enterprise Products Partners L.P. | 13,400 | 342,772 | ||||||
EQT Midstream Partners L.P. | 3,960 | 298,822 | ||||||
Eversource Energy | 5,062 | 258,516 | ||||||
Exelon Corp. | 15,898 | 441,487 | ||||||
Genesis Energy L.P. | 3,000 | 110,220 | ||||||
ITC Holdings Corp. | 5,300 | 208,025 | ||||||
Magellan Midstream Partners L.P. | 3,100 | 210,552 | ||||||
NextEra Energy Partners L.P. | 5,100 | 152,235 | ||||||
NextEra Energy, Inc. | 4,310 | 447,766 | ||||||
NiSource, Inc. | 13,319 | 259,854 | ||||||
Norfolk Southern Corp. | 3,800 | 321,442 | ||||||
NRG Yield, Inc. Class A | 11,100 | 154,401 | ||||||
PG&E Corp. | 5,900 | 313,821 | ||||||
PPL Corp. | 4,500 | 153,585 | ||||||
Sempra Energy | 2,505 | 235,495 | ||||||
Sunoco Logistics Partners L.P. | 8,571 | 220,275 | ||||||
Tesoro Logistics L.P. | 2,600 | 130,832 | ||||||
Union Pacific Corp. | 3,694 | 288,871 | ||||||
Valero Energy Partners L.P. | 1,800 | 92,898 | ||||||
Williams Cos., Inc. | 8,000 | 205,600 | ||||||
Williams Partners L.P. | 4,100 | 114,186 | ||||||
|
| |||||||
| 8,259,480 | ||||||||
|
| |||||||
TOTAL COMMON STOCKS | 14,584,524 | |||||||
|
| |||||||
SHORT-TERM INVESTMENT — 1.7% |
| |||||||
State Street Institutional Liquid Reserves Fund, Premier Class 0.23% (d) (e) (Cost $257,047) | 257,047 | 257,047 | ||||||
|
| |||||||
TOTAL INVESTMENTS (f) — 100.2% | 14,841,571 | |||||||
LIABILITIES IN EXCESS OF OTHER ASSETS — (0.2)% | (33,348 | ) | ||||||
|
| |||||||
NET ASSETS — 100.0% | $ | 14,808,223 | ||||||
|
| |||||||
| (a) | Reflects separate holdings of the issuer’s common stock traded on different securities exchanges. |
| (b) | Security is fair valued at year end by applying factors provided by independent third party in accordance with Fund’s valuation policy and procedures. The independent fair value service takes into account multiple factors including, but not limited to, movements in the U.S. securities markets, certain depositary receipts, futures contracts and foreign currency exchange rates that have occurred subsequent to the close of foreign securities exchanges. The use of the independent fair value service or alternative fair valuation methods would result in the investments being classified within Level 2 of the fair value hierarchy.Total market value of such securities represent 5,782,557 and 39.1% of net assets of the Fund at December 31, 2015. |
| (c) | Non-income producing security. |
| (d) | Affiliated Fund managed by SSGA Funds Management, Inc. (Note 3). |
| (e) | The rate shown is the annualized seven-day yield at December 31, 2015. |
| (f) | Unless otherwise indicated, the values of the securities of the Portfolio are determined based on Level 1 inputs established by provisions surrounding fair value measurements and disclosures. |
See accompanying notes which are an integral part of the financial statements.
27
Table of Contents
State Street Clarion Global Infrastructure & MLP Portfolio
SCHEDULE OF INVESTMENTS (continued)
December 31, 2015 (Unaudited)
Description | Level 1 — Quoted Prices | Level 2 — Other Significant Other Observable Inputs | Level 3 — Significant Unobservable Inputs | Total | ||||||||||||
INVESTMENTS: | ||||||||||||||||
Common Stocks | $ | 8,762,318 | $ | 5,822,206 | $ | — | $ | 14,584,524 | ||||||||
Short-Term Investment | 257,047 | — | — | 257,047 | ||||||||||||
|
|
|
|
|
|
|
| |||||||||
TOTAL INVESTMENTS | $ | 9,019,365 | $ | 5,822,206 | $ | — | $ | 14,841,571 | ||||||||
|
|
|
|
|
|
|
| |||||||||
See accompanying notes which are an integral part of the financial statements.
28
Table of Contents
SSGA Active Trust
State Street Clarion Global Infrastructure & MLP Portfolio
SCHEDULE OF INVESTMENTS (continued)
December 31, 2015 (Unaudited)
Security Valuation
The Portfolio’s investments are valued at fair value each day that the Portfolio’s listing exchange is open and, for financial reporting purposes, as of the report date should the reporting period end on a day that the Portfolio’s listing exchange is not open. Fair value is generally defined as the price a fund would receive to sell an asset or pay to transfer a liability in an orderly transaction between market participants at the measurement date. By its nature, a fair value price is a good faith estimate of the valuation in a current sale and may not reflect an actual market price. The investments of the Portfolio are valued pursuant to policies and procedures developed by the Oversight Committee (the “Committee”) and approved by the Board of Trustees of the Trust (the “Board”). The Committee provides oversight of the valuation of investments for the Portfolio. The Board has responsibility for determining the fair value of investments.
Valuation techniques used to value the Portfolio’s investments by major category are as follows:
| • | Equity investments (including registered investment companies that are exchange-traded funds) traded on a recognized securities exchange for which market quotations are readily available are valued at the last sale price or official closing price, as applicable, on the primary market or exchange on which they trade. Equity investments traded on a recognized exchange for which there were no sales on that day are valued at the last published sale price or at fair value. |
| • | Investments in registered investment companies (including money market funds) or other unitized pooled investment vehicles that are not traded on an exchange are valued at that day’s published net asset value per share or unit. Money market funds generally value portfolio investments using the amortized cost method as set forth in Rule 2a-7 under the 1940 Act and in accordance with Portfolio procedures to stabilize net asset value. |
In the event prices or quotations are not readily available or that application of these methods of valuation results in a price for an investment which is deemed not to be representative of the fair value of such investment, fair value will be determined in good faith by the Committee, in accordance with valuation policy and procedures approved by the Board.
Fair value pricing could result in a difference between the prices used to calculate the Portfolio’s net asset value and the prices used by the Portfolio’s underlying index, which in turn could result in a difference between the Portfolio’s performance and the performance of the Portfolio’s underlying index. Various inputs are used in determining the value of Portfolio’s investments. These inputs are categorized into a fair value hierarchy consisting of three broad levels for financial reporting purposes. The Portfolio values its assets and liabilities at fair value using a hierarchy that prioritizes the inputs to valuation techniques giving the highest priority to readily available unadjusted quoted prices in active markets for identical assets or liabilities (Level 1 measurements) and the lowest priority to unobservable inputs (Level 3 measurements) when market prices are not readily available or reliable. The categorization of a value determined for an investment within the hierarchy is based upon the pricing transparency of the investment and is not necessarily an indication of the risk associated with investing in it.
The three levels of the fair value hierarchy are as follows:
| • | Level 1 — Unadjusted quoted prices in active markets for identical assets or liabilities; |
| • | Level 2 — Inputs other than quoted prices included within Level 1 that are observable for the asset or liability either directly or indirectly, including quoted prices for similar assets or liabilities in active markets, quoted prices for identical or similar assets or liabilities in markets that are not considered to be active, inputs other than quoted prices that are observable for the asset or liability (such as exchange rates, financing terms, interest rates, yield curves, volatilities, prepayment speeds, loss severities, credit risks and default rates) or other market-corroborated inputs; and |
| • | Level 3 — Unobservable inputs for the asset or liability, including the Committee’s assumptions used in determining the fair value of investments. |
Changes in valuation techniques may result in transfers in or out of an assigned level within the disclosure hierarchy. Transfers between different levels of the fair value hierarchy are recognized at the end of the reporting period. The Portfolio had no transfers between levels for the period ended December 31, 2015.
29
Table of Contents
SSGA Active Trust
State Street Clarion Global Infrastructure & MLP Portfolio
SCHEDULE OF INVESTMENTS (continued)
December 31, 2015 (Unaudited)
Transactions with Affiliates
The Portfolio may invest in certain money market funds affiliated with the Adviser. Amounts related to investments in affiliated underlying Portfolio at December 31, 2015, and for the period then ended are:
State Street Clarion Global Infrastructure & MLP Portfolio | Value at 6/30/15 | Shares Purchased | Shares Sold | Value at 12/31/15 | Income | Realized Gain/(Loss) | ||||||||||||||||||
State Street Institutional Liquid Reserves Fund, Premier Class | $ | 284,165 | 3,553,157 | 3,580,275 | $ | 257,047 | $ | 149 | $ | 0 | ||||||||||||||
30
Table of Contents
SSGA Active Trust
State Street Clarion Global Infrastructure & MLP Portfolio
STATEMENT OF ASSETS AND LIABILITIES
December 31, 2015 (Unaudited)
ASSETS |
| |||
Investments in securities of unaffiliated issuers, at value | $ | 14,584,524 | ||
Investments in securities of affiliated issuers, at value | 257,047 | |||
|
| |||
Total Investments | 14,841,571 | |||
Foreign currency, at value | 22,763 | |||
Dividends receivable from unaffiliated issuers | 34,815 | |||
Dividends receivable from affiliated funds | 40 | |||
Receivable for foreign taxes recoverable | 8,347 | |||
Receivable from Adviser | 33,340 | |||
|
| |||
TOTAL ASSETS | 14,940,876 | |||
|
| |||
LIABILITIES | ||||
Payable for investments purchased | 87,957 | |||
Payable for fund shares repurchased | 11,201 | |||
Advisory fees payable | 33,340 | |||
Trustees’ fees payable | 155 | |||
|
| |||
TOTAL LIABILITIES | 132,653 | |||
|
| |||
NET ASSETS | $ | 14,808,223 | ||
|
| |||
NET ASSETS CONSIST OF: | ||||
Paid-in capital | $ | 16,456,615 | ||
Distributions in excess of net investment income | (5,693 | ) | ||
Accumulated net realized loss | (922,215 | ) | ||
Net unrealized appreciation (depreciation) on: | ||||
Investments in securities of unaffiliated issuers | (720,024 | ) | ||
Foreign currency transactions | (460 | ) | ||
|
| |||
NET ASSETS | $ | 14,808,223 | ||
|
| |||
NET ASSETS | $ | 14,808,223 | ||
Shares of beneficial interest outstanding | 1,652,756 | |||
|
| |||
Net asset value, and redemption price per share | $ | 8.96 | ||
|
| |||
Investments in securities of unaffiliated issuers, at cost | 15,304,548 | |||
Investments in securities of affiliated issuers, at cost | 257,047 | |||
|
| |||
Total cost of investments | $ | 15,561,595 | ||
|
| |||
Foreign currency, at cost | $ | 22,817 | ||
|
| |||
See accompanying notes which are an integral part of the financial statements.
31
Table of Contents
[THIS PAGE INTENTIONALLY LEFT BLANK]
Table of Contents
Annual Report
30 June 2015
SSGA Active Trust
State Street Clarion Global Infrastructure & MLP Portfolio
Table of Contents
[THIS PAGE INTENTIONALLY LEFT BLANK]
Table of Contents

STATE STREET CLARION GLOBAL INFRASTRUCTURE & MLP PORTFOLIO — PORTFOLIO SUMMARY
The Portfolio had less than six months of operations at reporting period end and therefore does not have performance history to provide in this report.
TOP FIVE HOLDINGS AS OF JUNE 30, 2015
| DESCRIPTION | CROWN CASTLE INTERNATIONAL CORP. | EAST JAPAN RAILWAY CO. | UNION PACIFIC CORP. | NATIONAL GRID PLC | VINCI SA | |||||||||
| MARKET VALUE | $773,691 | 728,811 | 628,870 | 598,780 | 593,307 | |||||||||
| % OF NET ASSETS | 4.9 | 4.6 | 3.9 | 3.8 | 3.7 | |||||||||
(The five largest holdings are subject to change, and there are no guarantees the Portfolio will continue to remain invested in any particular security.)
INDUSTRY BREAKDOWN AS OF JUNE 30, 2015*
| PERCENT OF NET ASSETS | ||||||||
Oil, Gas & Consumable Fuels | 23.4 | % | ||||||
Electric Utilities | 15.3 | |||||||
Multi-utilities | 14.1 | |||||||
Road & Rail | 13.8 | |||||||
Transportation Infrastructure | 10.6 | |||||||
Construction & Engineering | 7.4 | |||||||
Real Estate Investment Trusts | 4.9 | |||||||
Independent Power & Renewable Electricity Producers | 4.1 | |||||||
Water Utilities | 2.2 | |||||||
Gas Utilities | 1.8 | |||||||
Industrial Conglomerates | 1.1 | |||||||
Short Term Investment | 1.8 | |||||||
Other Assets & Liabilities | (0.5 | ) | ||||||
TOTAL | 100.0 | % | ||||||
| * | The Portfolio’s industry breakdown is expressed as a percentage of net assets and may change over time. |
35
Table of Contents
SSGA Active Trust
State Street Clarion Global Infrastructure & MLP Portfolio
June 30, 2015
Security Description | Shares | Value | ||||||
COMMON STOCKS — 98.7% | ||||||||
AUSTRALIA — 5.8% | ||||||||
Aurizon Holdings, Ltd. | 93,230 | $ | 367,598 | |||||
Transurban Group | 76,527 | 547,014 | ||||||
|
| |||||||
| 914,612 | ||||||||
|
| |||||||
CANADA — 4.1% | ||||||||
TransCanada Corp. | 10,640 | 432,606 | ||||||
Veresen, Inc. | 16,200 | 219,166 | ||||||
|
| |||||||
| 651,772 | ||||||||
|
| |||||||
FRANCE — 5.4% | ||||||||
Suez Environnement Co. | 13,817 | 256,864 | ||||||
Vinci SA | 10,264 | 593,307 | ||||||
|
| |||||||
| 850,171 | ||||||||
|
| |||||||
GERMANY — 0.8% | ||||||||
Hamburger Hafen und Logistik AG | 6,530 | 132,055 | ||||||
|
| |||||||
HONG KONG — 4.7% | ||||||||
Beijing Enterprises Holdings, Ltd. | 23,500 | 176,874 | ||||||
China Resources Gas Group, Ltd. | 25,500 | 75,653 | ||||||
COSCO Pacific, Ltd. | 172,700 | 234,349 | ||||||
Power Assets Holdings, Ltd. | 29,300 | 267,204 | ||||||
|
| |||||||
| 754,080 | ||||||||
|
| |||||||
ITALY — 4.7% | ||||||||
Atlantia SpA | 15,314 | 378,113 | ||||||
Enel SpA | 82,465 | 373,410 | ||||||
|
| |||||||
| 751,523 | ||||||||
|
| |||||||
JAPAN — 7.5% | ||||||||
Central Japan Railway Co. | 2,600 | 469,685 | ||||||
East Japan Railway Co. | 8,100 | 728,811 | ||||||
|
| |||||||
| 1,198,496 | ||||||||
|
| |||||||
MEXICO — 1.5% | ||||||||
Grupo Aeroportuario del Pacifico SAB de CV (Class B) | 35,100 | 240,970 | ||||||
|
| |||||||
SPAIN — 6.4% | ||||||||
Enagas SA | 7,429 | 201,927 | ||||||
Ferrovial SA | 26,761 | 579,943 | ||||||
Red Electrica Corp. SA | 2,935 | 235,060 | ||||||
|
| |||||||
| 1,016,930 | ||||||||
|
| |||||||
SWITZERLAND — 1.0% | ||||||||
Flughafen Zuerich AG | 197 | 152,511 | ||||||
|
| |||||||
UNITED KINGDOM — 7.1% | ||||||||
National Grid PLC | 46,590 | 598,780 | ||||||
Severn Trent PLC | 4,933 | 161,447 | ||||||
United Utilities Group PLC | 13,900 | 194,996 | ||||||
VTTI Energy Partners LP (a) | 7,116 | 178,184 | ||||||
|
| |||||||
| 1,133,407 | ||||||||
|
| |||||||
UNITED STATES — 49.7% | ||||||||
Cone Midstream Partners LP (a) | 17,716 | 313,573 | ||||||
Crown Castle International Corp. | 9,635 | 773,691 | ||||||
Dominion Resources, Inc. | 5,968 | 399,080 | ||||||
DTE Energy Co. | 5,584 | 416,790 | ||||||
Edison International | 5,009 | 278,400 | ||||||
Energy Transfer Equity LP (a) | 4,765 | 305,770 | ||||||
Security Description | Shares | Value | ||||||
Energy Transfer Partners LP (a) | 10,029 | $ | 523,514 | |||||
EnLink Midstream Partners LP (a) | 4,931 | 108,334 | ||||||
EQT GP Holdings LP (a) (b) | 4,859 | 165,157 | ||||||
EQT Midstream Partners LP (a) | 3,960 | 322,898 | ||||||
Eversource Energy | 6,662 | 302,522 | ||||||
Exelon Corp. | 9,298 | 292,143 | ||||||
ITC Holdings Corp. | 6,300 | 202,734 | ||||||
NextEra Energy Partners LP (a) | 5,900 | 233,758 | ||||||
NextEra Energy, Inc. | 4,910 | 481,327 | ||||||
NiSource, Inc. | 5,719 | 260,729 | ||||||
NRG Yield, Inc. (Class A) | 7,200 | 158,328 | ||||||
Plains GP Holdings LP (Class A) (a) | 10,600 | 273,904 | ||||||
Sempra Energy | 3,105 | 307,209 | ||||||
Summit Midstream Partners LP (a) | 9,277 | 306,512 | ||||||
Sunoco Logistics Partners LP (a) | 9,271 | 352,576 | ||||||
TerraForm Power, Inc. (Class A) (b) | 6,700 | 254,466 | ||||||
Union Pacific Corp. | 6,594 | 628,870 | ||||||
Valero Energy Partners LP (a) | 4,750 | 242,629 | ||||||
|
| |||||||
| 7,904,914 | ||||||||
|
| |||||||
TOTAL COMMON STOCKS | 15,701,441 | |||||||
|
| |||||||
SHORT TERM INVESTMENT — 1.8% |
| |||||||
MONEY MARKET FUND — 1.8% |
| |||||||
State Street Institutional Liquid Reserves Fund, Premier Class 0.11% (c) (d) | 284,165 | 284,165 | ||||||
|
| |||||||
TOTAL INVESTMENTS — 100.5% (e) | 15,985,606 | |||||||
OTHER ASSETS & | (74,661 | ) | ||||||
|
| |||||||
NET ASSETS — 100.0% | $ | 15,910,945 | ||||||
|
| |||||||
| (a) | Master Limited Partnership. Represents $3,326,809 or 20.91% of net assets. |
| (b) | Non-income producing security |
| (c) | Affiliated Fund managed by SSGA Funds Management, Inc. (Note 3). |
| (d) | The rate shown is the annualized seven-day yield at period end. |
| (e) | Unless otherwise indicated, the values of the securities of the Portfolio are determined based on Level 1 inputs (Note 2). |
PLC = Public Limited Company
See accompanying notes to financial statements.
36
Table of Contents
SSGA Active Trust
State Street Clarion Global Infrastructure & MLP Portfolio
STATEMENT OF ASSETS AND LIABILITIES
June 30, 2015
ASSETS | ||||
Investments in securities of unaffiliated issuers, at value | $ | 15,701,441 | ||
Investments in securities of affiliated issuers, at value | 284,165 | |||
Foreign currency, at value | 25,303 | |||
Dividends receivable from unaffiliated issuers (Note 3) | 54,109 | |||
Dividends receivable from affiliated issuers (Note 3) | 30 | |||
Receivable for foreign taxes recoverable | 6,968 | |||
Receivable from Adviser (Note 3) | 21,589 | |||
|
| |||
TOTAL ASSETS | 16,093,605 | |||
|
| |||
LIABILITIES | ||||
Payable for investments purchased | 160,836 | |||
Payable for Fund shares repurchased | 235 | |||
Advisory fees payable (Note 3) | 21,589 | |||
|
| |||
TOTAL LIABILITIES | 182,660 | |||
|
| |||
NET ASSETS | $ | 15,910,945 | ||
|
| |||
NET ASSETS CONSIST OF: | ||||
Paid-in capital | $ | 15,939,961 | ||
Undistributed net investment income | 26,377 | |||
Accumulated net realized gain | 421,536 | |||
Net unrealized (depreciation) on: | ||||
Investments in securities of unaffiliated issuers | (476,974 | ) | ||
Foreign currency transactions | 45 | |||
|
| |||
NET ASSETS | $ | 15,910,945 | ||
|
| |||
NET ASSETS | $ | 15,910,945 | ||
Shares of beneficial interest outstanding | 1,593,481 | |||
|
| |||
Net asset value and redemption price per share | $ | 9.99 | ||
|
| |||
Investments in securities of unaffiliated issuers, at cost | $ | 16,178,415 | ||
Investments in securities of affiliated issuers, at cost | 284,165 | |||
|
| |||
Total Cost of Investments | $ | 16,462,580 | ||
|
| |||
Foreign currency, at cost | $ | 25,644 | ||
|
|
See accompanying notes to financial statements.
37
Table of Contents
SSGA Active Trust
State Street Clarion Global Infrastructure & MLP Portfolio
STATEMENT OF OPERATIONS
Period Ended June 30, 2015*
INVESTMENT INCOME |
| |||
Dividend income from unaffiliated issuers | $ | 220,246 | ||
Dividend income from master limited partnerships and related companies | 58,205 | |||
Return of capital on dividends from master limited partnerships and related companies (Note 2) | (49,137 | ) | ||
|
| |||
Net dividend income from master limited partnerships and related companies | 9,068 | |||
|
| |||
Interest income on securities of affiliated issuers (Note 2 and Note 3) | 135 | |||
Foreign taxes withheld | (15,887 | ) | ||
|
| |||
TOTAL INVESTMENT INCOME | 213,562 | |||
|
| |||
EXPENSES | ||||
Advisory fee (Note 3) | 21,589 | |||
Trustees’ fees and expenses (Note 3) | 69 | |||
|
| |||
TOTAL EXPENSES | 21,658 | |||
|
| |||
Less: Expenses reimbursed by the Adviser (Note 3) | (21,589 | ) | ||
|
| |||
Net expenses | 69 | |||
|
| |||
NET INVESTMENT INCOME | $ | 213,493 | ||
|
| |||
REALIZED AND UNREALIZED GAIN (LOSS) ON INVESTMENTS | ||||
Net realized gain on: | ||||
Investments in securities of unaffiliated issuers | 410,113 | |||
Foreign currency transactions | 5,124 | |||
Net change in unrealized appreciation (depreciation) on: | ||||
Investments in securities of unaffiliated issuers | (476,974 | ) | ||
Foreign currency transactions | 45 | |||
|
| |||
NET REALIZED AND UNREALIZED LOSS ON INVESTMENTS AND FOREIGN CURRENCY TRANSACTIONS | (61,692 | ) | ||
|
| |||
NET INCREASE IN NET ASSETS RESULTING FROM OPERATIONS | $ | 151,801 | ||
|
| |||
| * | For the period from January 21, 2015 (commencement of operations) to June 30, 2015. |
See accompanying notes to financial statements.
38
Table of Contents
SSGA Active Trust
State Street Clarion Global Infrastructure & MLP Portfolio
STATEMENT OF CHANGES IN NET ASSETS
| Period Ended 6/30/15* | ||||
INCREASE (DECREASE) IN NET ASSETS FROM OPERATIONS: | ||||
Net investment income | $ | 213,493 | ||
Net realized gain on investments and foreign currency transactions | 415,237 | |||
Change in net unrealized appreciation (depreciation) on investments and foreign currency transactions | (476,929 | ) | ||
|
| |||
Net increase in net assets from operations | 151,801 | |||
|
| |||
DISTRIBUTIONS TO SHAREHOLDERS FROM: | ||||
Net investment income | (180,817 | ) | ||
|
| |||
Total distributions to shareholders | (180,817 | ) | ||
|
| |||
FROM BENEFICIAL INTEREST TRANSACTIONS: | ||||
In-kind transfer from CBRE Clarion Global Listed Infrastructure Fund, LP | 11,569,962 | |||
Contribution from SSGA Funds Management, Inc. (Note 1) | 4,000,100 | |||
Proceeds from shares sold | 348,304 | |||
Reinvestment of distributions | 180,817 | |||
Cost of redemptions | (159,222 | ) | ||
|
| |||
Net increase (decrease) in net assets from beneficial interest transactions | 15,939,961 | |||
|
| |||
Net increase in net assets | 15,910,945 | |||
NET ASSETS END OF PERIOD (1) | ||||
Beginning of period | — | |||
|
| |||
End of period | $ | 15,910,945 | ||
|
| |||
SHARES OF BENEFICIAL INTEREST: | ||||
In-kind transfer from CBRE Clarion Global Listed Infrastructure Fund, LP (Note 1) | 1,176,596 | |||
Shares sold | 414,875 | |||
Reinvestment of distributions | 17,385 | |||
Shares redeemed | (15,375 | ) | ||
|
| |||
Net increase in shares | 1,593,481 | |||
|
| |||
(1) Undistributed net investment income | $ | 26,377 | ||
|
| |||
| * | For the period from January 21, 2015 (commencement of operations) to June 30, 2015. |
See accompanying notes to financial statements.
39
Table of Contents
SSGA Active Trust
State Street Clarion Global Infrastructure & MLP Portfolio
Selected data for a share of beneficial interest outstanding throughout the period is presented below:
| Period Ended 6/30/15* | ||||
Net asset value, beginning of period | $ | 10.00 | ||
|
| |||
Income (loss) from investment operations: | ||||
Net investment income(1) | 0.14 | |||
Net realized and unrealized gain (loss) on investments | (0.04 | ) | ||
|
| |||
Total from investment operations | 0.10 | |||
|
| |||
Less Distributions to Shareholders From: | ||||
Net investment income | (0.11 | ) | ||
|
| |||
Total distributions to shareholders | (0.11 | ) | ||
|
| |||
Net decrease in net assets | (0.01 | ) | ||
|
| |||
Net Asset Value, End of Period | $ | 9.99 | ||
|
| |||
Total Return(2) | 1.00 | % | ||
Ratios and Supplemental Data: | ||||
Net Assets, End of Period (000s) | $ | 15,911 | ||
Ratios to average net assets: | ||||
Gross operating expenses | 0.30 | %(3) | ||
Expense waiver | (0.30 | )%(3) | ||
Net operating expenses | 0.00 | %(3)(4) | ||
Net investment income | 2.97 | %(3) | ||
Portfolio turnover rate | 37 | % | ||
| * | For the period from January 21, 2015 (commencement of operations) to June 30, 2015. |
| (1) | Net investment income per share is calculated using the average shares method. |
| (2) | Total return is calculated assuming a purchase of shares at net asset value on the first day and a sale at net asset value on the last day of each period reported. Distributions are assumed, for the purpose of this calculation, to be reinvested at net asset value per share on the respective payment dates. Total return for periods of less than one year are not annualized. Broker commission charges are not included in this calculation. |
| (3) | Annualized. |
| (4) | Less than 0.005% |
See accompanying notes to financial statements.
40
Table of Contents
SSGA Active Trust
State Street Clarion Global Infrastructure & MLP Portfolio
June 30, 2015
| 1. | Organization |
SSGA Active Trust (the “Trust”), which is registered under the Investment Company Act of 1940, as amended (“1940 Act”), is an open-end management investment company that was organized as a Massachusetts business trust on March 30, 2011.
As of June 30, 2015, the Trust offered eleven (11) funds, 10 feeders and 1 master portfolio. The financial statements herein relate to the State Street Clarion Global Infrastructure & MLP Portfolio (the “Portfolio”), a separate non-diversified series of the Active Trust. The Portfolio operates as the master portfolio in a master feeder structure.
The investment objective of the Portfolio is to seek long-term total return. The Portfolio invests in infrastructure companies located worldwide including infrastructure companies organized as Master Limited Partnerships (“MLPs”). The Portfolio is part of a master feeder structure where State Street Clarion Infrastructure & MLP Fund (the “Feeder Fund”) invests substantially all of its assets in the Portfolio. SSGA Funds Management, Inc. (the “Adviser” or “SSGA FM”) serves as the investment adviser and CBRE Clarion Securities LLC serves as the subadviser.
The Portfolio commenced operations on January 21, 2015, after it acquired the net assets of the CBRE Clarion Global Listed Infrastructure Fund, LP (the “Partnership”), via the Feeder Fund. The acquisition of net assets of the Partnership was accomplished by an in-kind transfer of all of the Partnership’s net assets amounting to $11,569,962 and a cash transfer of $196,000 by the Partnership in exchange for 1,176,596 shares of the Feeder Fund (the “transaction”). The Partnership elected to make a deemed sale election related to the transaction, pursuant to the subscription agreement. SSGA FM contributed initial capital of $4,000,100 to the Feeder Fund in exchange for the Feeder Fund’s shares. Immediately prior to the acquisition, the Portfolio did not have any assets or liabilities nor operations or investment activities.
Under the Trust’s organizational documents, its officers and trustees are indemnified against certain liabilities arising out of the performance of their duties to the Trust. Additionally, in the normal course of business, the Trust enters into contracts with service providers that contain general indemnification clauses. The Trust’s maximum exposure under these arrangements is unknown as this could involve future claims that may be made against the Trust that have not yet occurred.
| 2. | Summary of Significant Accounting Policies |
The following is a summary of significant accounting policies followed by the Trust in the preparation of its financial statements:
The preparation of financial statements in accordance with accounting principles generally accepted in the United States of America (“U.S. GAAP”) requires management to make estimates and assumptions that affect the reported amounts and disclosures in the financial statements. Actual results could differ from those estimates.
The Portfolio is an investment company under U.S. GAAP and follows the accounting and reporting guidance applicable to investment companies in Financial Accounting Standards Board (“FASB”) Accounting Standards Codification (“ASC”) 946, Financial Services—Investment Companies (“ASC 946”).
Security Valuation
The Portfolio’s investments are valued at fair value each day that the Portfolio’s listing exchange is open and, for financial reporting purposes, as of the report date should the reporting period end on a day that the Portfolio’s listing exchange is not open. Fair value is generally defined as the price a fund would receive to sell an asset or pay to transfer a liability in an orderly transaction between market participants at the measurement date. By its nature, a fair value price is a good faith estimate of the valuation in a current sale and may not reflect an actual market price. The investments of the Portfolio are valued pursuant to policies and procedures developed by the Oversight Committee (the “Committee”) and approved by the Board of Trustees of the Trust (the “Board”). The Committee provides oversight of the valuation of investments for the Portfolio. The Board has responsibility for determining the fair value of investments. The members of the Committee are approved by the Board.
41
Table of Contents
SSGA Active Trust
State Street Clarion Global Infrastructure & MLP Portfolio
NOTES TO FINANCIAL STATEMENTS (continued)
June 30, 2015
Valuation techniques used to value the Portfolio’s investments by major category are as follows:
| • | Equity investments (including registered investment companies that are exchange-traded funds) traded on a recognized securities exchange for which market quotations are readily available are valued at the last sale price or official closing price, as applicable, on the primary market or exchange on which they trade. Equity investments traded on a recognized exchange for which there were no sales on that day are valued at the last published sale price or at fair value. |
| • | Investments in registered investment companies (including money market funds) or other unitized pooled investment vehicles that are not traded on an exchange are valued at that day’s published net asset value per share or unit. Money market funds generally value portfolio investments using the amortized cost method as set forth in Rule 2a-7 under the 1940 Act and in accordance with Portfolio procedures to stabilize net asset value. |
In the event prices or quotations are not readily available or that application of these methods of valuation results in a price for an investment which is deemed not to be representative of the fair value of such investment, fair value will be determined in good faith by the Committee, in accordance with valuation policy and procedures approved by the Board.
Fair value pricing could result in a difference between the prices used to calculate the Portfolio’s net asset value and the prices used by the Portfolio’s underlying index, which in turn could result in a difference between the Portfolio’s performance and the performance of the Portfolio’s underlying index. Various inputs are used in determining the value of the Portfolio’s investments. These inputs are categorized into a fair value hierarchy consisting of three broad levels for financial reporting purposes. The Portfolio values its assets and liabilities at fair value using a hierarchy that prioritizes the inputs to valuation techniques giving the highest priority to readily available unadjusted quoted prices in active markets for identical assets or liabilities (Level 1 measurements) and the lowest priority to unobservable inputs (Level 3 measurements) when market prices are not readily available or reliable. The categorization of a value determined for an investment within the hierarchy is based upon the pricing transparency of the investment and is not necessarily an indication of the risk associated with investing in it.
The three levels of the fair value hierarchy are as follows:
| • | Level 1 — Unadjusted quoted prices in active markets for identical assets or liabilities; |
| • | Level 2 — Inputs other than quoted prices included within Level 1 that are observable for the asset or liability either directly or indirectly, including quoted prices for similar assets or liabilities in active markets, quoted prices for identical or similar assets or liabilities in markets that are not considered to be active, inputs other than quoted prices that are observable for the asset or liability (such as exchange rates, financing terms, interest rates, yield curves, volatilities, prepayment speeds, loss severities, credit risks and default rates) or other market-corroborated inputs; and |
| • | Level 3 — Unobservable inputs for the asset or liability, including the Committee’s assumptions used in determining the fair value of investments. |
Changes in valuation techniques may result in transfers in or out of an assigned level within the disclosure hierarchy. Transfers between different levels of the fair value hierarchy are recognized at the end of the reporting period. The Portfolio had no transfers between levels for the period ended June 30, 2015.
As of June 30, 2015, all of the Portfolio’s assets were valued using Level 1 inputs.
Investment Transactions and Income Recognition
Investment transactions are accounted for on trade date for financial reporting purposes. Interest income, if any, is recorded daily on an accrual basis. Dividend income and capital gain distributions received, if any, are recognized on the ex-dividend dates, net of any foreign taxes withheld at the source. Non-cash dividends received in the form of stock, if any, are recorded as dividend income at fair value. Distributions received by the portfolio may include a return of capital that is estimated by SSGA FM. Such amounts are recorded as a reduction of the cost of investments or reclassified as capital gains. Realized gains and losses from investment transactions are determined using identified cost method.
42
Table of Contents
SSGA Active Trust
State Street Clarion Global Infrastructure & MLP Portfolio
NOTES TO FINANCIAL STATEMENTS (continued)
June 30, 2015
Distributions received from the Portfolio’s investments in master limited partnerships or limited liability companies that have economic characteristics substantially similar to master limited partnerships (collectively, “MLPs”) generally are comprised of ordinary income and return of capital from the MLPs. The Portfolio records distributions from MLPs as dividend income and redesignates between income and return of capital at year end. Such estimates are based on information provided by each MLP and other industry sources. These estimates may subsequently be revised based on actual allocations received from MLPs after their tax reporting periods are concluded, as the actual character of these distributions is not known until after the fiscal year end of the Portfolio. For the period ended June 30, 2015, the Portfolio estimated the allocation of investment income and return of capital for the distributions received from MLPs within the Statement of Operations. For this period, the Portfolio has estimated approximately 82.4% as income and approximately 17.6% as return of capital.
Foreign Currency Translation
The accounting records of the Portfolio are maintained in U.S. dollars. Foreign currencies as well as investment securities and other assets and liabilities denominated in a foreign currency are translated to U.S. dollars using exchange rates deemed appropriate pursuant to the valuation policy at period end. Purchases and sales of securities, income receipts and expense payments are translated into U.S. dollars on the respective dates of transactions. The Portfolio does not isolate the effect of fluctuations in foreign exchange rates from the effect of fluctuations in the market prices of securities. Such fluctuations are reflected by the Portfolio as a component of realized and unrealized gains and losses from investments for financial reporting purposes.
Foreign Taxes
The Portfolio may be subject to foreign taxes (a portion of which may be reclaimable) on income, stock dividends, capital gains on investments, or certain foreign currency transactions. All foreign taxes are recorded in accordance with the applicable foreign tax regulations and rates that exist in the foreign jurisdictions in which the Portfolio invests. These foreign taxes, if any, are paid by the Portfolio and are reflected in its statements of operations as follows: foreign taxes withheld at source are presented as a reduction of income, and foreign taxes on capital gains from sales of investments and foreign taxes on foreign currency transactions are included in their respective net realized gain (loss) categories. Foreign taxes payable or deferred and foreign taxes recoverable as of June 30, 2015, if any, are disclosed in the Portfolio’s statements of assets and liabilities.
Expenses
Advisory fees and other expenses, which are directly identifiable to the Portfolio, are applied to the Portfolio. Trustees’ fees and other expenses which cannot be attributed directly to the Portfolio are allocated in such a manner as deemed equitable, taking into consideration the nature and type of expense and the relative net assets of the Portfolio.
Federal Income Tax
The Portfolio intends to qualify for and elect treatment as a “regulated investment company” under Subchapter M of the Internal Revenue Code of 1986, as amended. By so qualifying and electing, the Portfolio will not be subject to federal income taxes to the extent it distributes its taxable income, including any net realized capital gains, for each fiscal year. In addition, by distributing during each calendar year substantially all of net investment income and capital gains, if any, the Portfolio will not be subject to federal excise tax. Income and capital gain distributions are determined in accordance with income tax regulations which may differ from U.S. GAAP.
| Paid-In Capital | Accumulated Gain (Loss) | Undistributed Net Investment Income (Loss) | ||||||
| $— | $ | 6,299 | $ | (6,299 | ) | |||
These book-tax differences are primarily due to differing treatments for foreign currencies, return of capital securities and losses deferred due to wash sales.
43
Table of Contents
SSGA Active Trust
State Street Clarion Global Infrastructure & MLP Portfolio
NOTES TO FINANCIAL STATEMENTS (continued)
June 30, 2015
The tax character of distributions paid during the period ended June 30, 2015 was as follows:
| Ordinary Income | Long-Term Capital Gains | Tax Return of Capital | ||||||
| $180,817 | $ | — | $ | — | ||||
For the period ended June 30, 2015, there were no significant differences between the book basis and the tax basis character of distributions to shareholders.
For the period ended June 30, 2015, there were no significant differences between the book basis and the tax basis of components of net assets other than differences in the net unrealized appreciation (depreciation) in the value of investments attributable to the tax deferral of losses on wash sales, foreign currency gains and losses and distributions from MLPs.
As of June 30, 2015, the components of distributable earnings on a tax basis were as follows:
| Undistributed Ordinary Income | Undistributed Long-Term Capital Gains | Net Unrealized Appreciation (Depreciation) | ||||||
| $439,427 | $ | — | $ | (468,443 | ) | |||
As a limited partner in the MLPs, the Portfolio reports its allocable share of the MLP’s taxable income in computing its own taxable income. The distributions paid by the MLPs generally do not constitute income for tax purposes. Each MLP may allocate losses to the Portfolio which are generally not deductible in computing the Portfolio’s taxable income until such time as that particular MLP either generates income to offset those losses or the Portfolio disposes of units in that MLP. This may result in the Portfolio’s taxable income being substantially different than its book income in any given year. As a result, the Portfolio may have insufficient taxable income to support its distributions paid resulting in a return of capital to shareholders. A return of capital distribution is generally not treated as taxable income to shareholders and instead reduces a shareholder’s basis in their shares of the Portfolio.
SSGA FM has analyzed the Portfolio’s tax positions it will take on its income tax returns and has concluded that as of June 30, 2015, no provision for income tax is required in the Portfolio’s financial statements. The Portfolio’s federal and state income and federal excise tax returns for tax years for which the applicable statutes of limitations have not expired are subject to examination by the Internal Revenue Service and state departments of revenue.
Under the applicable foreign tax laws, a withholding tax may be imposed on interest, dividends and capital gains at various rates.
Dividends and Distributions
Dividends from net investment income, if any, are generally declared and paid quarterly. Distributions of net realized capital gains, if any, are generally declared and paid at least annually, unless otherwise required to be compliant with applicable tax regulations. The Portfolio currently intends to pay distributions out of its distributable cash flow, which generally consists of cash and paid-in-kind distributions from MLPs or their affiliates, dividends from common stocks and income from other investments held by the Portfolio less current or accrued operating expenses of the Portfolio, including taxes on Portfolio taxable income. Dividends and distributions paid by the Portfolio are recorded on the ex-dividend dates. Income and capital gain distributions are determined in accordance with income tax regulations, which may differ from U.S. GAAP.
| 3. | Fees and Compensation Paid to Affiliates and Other Related Party Transactions |
Advisory Fee
The Trust, on behalf of the Portfolio has entered into an Investment Advisory Agreement with SSGA FM. For its advisory services to the Portfolio, the Adviser is paid a management fee by the Portfolio at an annual rate of 0.30% of its average daily net assets. The Adviser has contractually agreed to waive the entire amount of the advisory fee until the later of April 30, 2016, or such time as the shares of the Portfolio cease to be the only investment security held by the State Street Clarion Global Infrastructure & MLP Fund series of the State Street Institutional Investment Trust. The waiver may be terminated only by the Portfolio’s Board of Trustees.
44
Table of Contents
SSGA Active Trust
State Street Clarion Global Infrastructure & MLP Portfolio
NOTES TO FINANCIAL STATEMENTS (continued)
June 30, 2015
The Adviser pays all operating expenses of the Portfolio other than management fee, distribution fee pursuant to the Portfolio’s Distribution and Service Plan, if any, brokerage, taxes, interest, fees and expenses of the Independent Trustees (including any Trustees’ counsel fees), litigation expenses, and other extraordinary expenses.
Effective June 1, 2015, SSGA FM serves as Administrator and State Street Bank and Trust Company (“State Street”) serves as Sub-Administrator. State Street, an affiliate of the Adviser, receives fees for its services as Custodian, Sub-Administrator and Transfer Agent from the Adviser. CBRE Clarion Securities LLC serves as the subadviser for the Portfolio. Prior to June 1, 2015, State Street served as Administrator.
Trustees’ Fees
The Trust, SSGA Master Trust, SPDR Series Trust and SPDR Index Shares Funds (together with the Trust, the “Trusts”) pay, in the aggregate, each Independent Trustee an annual fee of $185,000 (effective July 1, 2015, the annual fee is $200,000) plus $10,000 per in-person meeting attended and $1,250 for each telephonic or video conference meeting attended. The Chairman of the Board receives an additional annual fee of $50,000 and the Chairman of the Audit Committee receives an additional annual fee of $20,000. The Trust also reimburses each Independent Trustee for travel and other out-of-pocket expenses incurred by him/her in connection with attending such meetings and in connection with attending industry seminars and meetings. Independent Trustee fees are allocated among the Trusts and each of their respective series in such a manner as deemed equitable, taking into consideration the relative net assets of the series.
Transactions with Affiliates
The Portfolio may invest in certain money market funds affiliated with the Adviser. Amounts related to investments in affiliated underlying Portfolio at June 30, 2015, and for the period then ended are:
State Street Clarion Global Infrastructure & MLP Portfolio | Value at 1/21/15* | Shares Purchased | Shares Sold | Value at 6/30/15 | Income | Realized Gain/(Loss) | ||||||||||||||||||
State Street Institutional Liquid Reserves Fund, | $ | 0 | 7,144,133 | 6,859,968 | $ | 284,165 | $ | 135 | $ | 0 | ||||||||||||||
| * | Commencement of operations |
| 4. | Aggregate Unrealized Appreciation and Depreciation |
As of June 30, 2015, gross unrealized appreciation and gross unrealized depreciation based on cost for federal income tax purposes were as follows:
| Tax Cost | Gross Unrealized Appreciation | Gross Unrealized Depreciation | Net Unrealized Appreciation (Depreciation) | |||||||||||||
State Street Clarion Global Infrastructure & MLP Portfolio | $ | 16,454,094 | $ | 399,773 | $ | (868,261 | ) | $ | (468,488 | ) | ||||||
| 5. | Investment Transactions |
For the period ended June 30, 2015, the Portfolio had purchases and sales of investments (excluding in-kind transactions and short-term investments) that aggregated to $10,159,693 and $5,924,235, respectively.
| 6. | Concentration of Ownership |
From time to time, the Portfolio may have a concentration of one or more accounts constituting a significant percentage of shares outstanding. Investment activities by holders of such accounts could have material impacts on the Portfolio. As of June 30, 2015, based on management’s evaluation of the shareholder account base, the Portfolio had accounts representing controlling ownership of more than 5% of the Portfolio’s total outstanding shares. The number of such
45
Table of Contents
SSGA Active Trust
State Street Clarion Global Infrastructure & MLP Portfolio
NOTES TO FINANCIAL STATEMENTS (continued)
June 30, 2015
accounts, based on accounts that represent more than 5% of an individual class of shares, and the aggregate percentage of net assets represented by such holdings were as follows:
Fund | Number of 5% Non-Affiliated Account Holders | Percentage of Non-Affiliated Ownership | Percentage of Affiliated Ownership | Total Percentage of Ownership | ||||||||||||
State Street Clarion Global Infrastructure & MLP Fund | 0 | 0 | % | 100 | % | 100 | % | |||||||||
| 7. | Concentration of Risk |
The Portfolio concentrates its investments in the infrastructure sector. Because the Portfolio concentrates its investments in infrastructure-related securities, the Portfolio has greater exposure to adverse economic, regulatory, political, legal, and other conditions or events affecting the issuers of such securities. Additionally, infrastructure-related entities may be subject to regulation by various governmental authorities and may also be affected by governmental regulation of rates charged to customers, service interruption and or legal challenges due to environmental, operational or other conditions or events and the imposition of special tariffs and changes in tax laws, regulatory policies and accounting standards.
| 8. | Subsequent Events |
Management has evaluated the impact of all subsequent events on the Portfolio through the date the financial statements were available to be issued and has determined that there were no subsequent events requiring adjustment or disclosure in the financial statements.
46
Table of Contents
SSGA Active Trust
State Street Clarion Global Infrastructure & MLP Portfolio
REPORT OF INDEPENDENT REGISTERED PUBLIC ACCOUNTING FIRM
To the Shareholders and Board of Trustees of
SSGA Active Trust
We have audited the accompanying statement of assets and liabilities, including the schedule of investments, of State Street Clarion Global Infrastructure & MLP Portfolio (the “Portfolio”) (one of the portfolios constituting SSGA Active Trust) as of June 30, 2015, and the related statement of operations, statement of changes in net assets, and the financial highlights for the period from January 21, 2015 (commencement of operations) to June 30, 2015. These financial statements and financial highlights are the responsibility of the Portfolio’s management. Our responsibility is to express an opinion on these financial statements and financial highlights based on our audit.
We conducted our audit in accordance with the standards of the Public Company Accounting Oversight Board (United States). Those standards require that we plan and perform the audit to obtain reasonable assurance about whether the financial statements and financial highlights are free of material misstatement. We were not engaged to perform an audit of the Portfolio’s internal control over financial reporting. Our audit included consideration of internal control over financial reporting as a basis for designing audit procedures that are appropriate in the circumstances, but not for the purpose of expressing an opinion on the effectiveness of the Portfolio’s internal control over financial reporting. Accordingly, we express no such opinion. An audit also includes examining, on a test basis, evidence supporting the amounts and disclosures in the financial statements and financial highlights, assessing the accounting principles used and significant estimates made by management, and evaluating the overall financial statement presentation. Our procedures included confirmation of securities owned as of June 30, 2015, by correspondence with the custodian and others or by other appropriate auditing procedures where replies from others were not received. We believe that our audit provides a reasonable basis for our opinion.
In our opinion, the financial statements and financial highlights referred to above present fairly, in all material respects, the financial position of State Street Clarion Global Infrastructure & MLP Portfolio (one of the portfolios constituting SSGA Active Trust) at June 30, 2015, and the results of its operations, the changes in its net assets and the financial highlights for the period from January 21, 2015 (commencement of operations) to June 30, 2015, in conformity with U.S. generally accepted accounting principles.

Boston, Massachusetts
August 31, 2015
47
Table of Contents
SSGA Active Trust
State Street Clarion Global Infrastructure & MLP Portfolio
June 30, 2015 (Unaudited)
Expense Example
As a shareholder of the Portfolio, you incur ongoing costs, which include costs for administrative services and to the extent applicable, distribution (12b-1) fees, among others. This example is intended to help you understand your ongoing costs (in dollars) of investing in the Portfolio and to compare these costs with the ongoing costs of investing in other mutual funds. It is based on an investment of $1,000 made at the beginning of the period shown and held for the entire period from January 1, 2015 to June 30, 2015.
Actual Expenses
The first table below provides information about actual account values and actual expenses. You may use the information in this table, together with the amount you invested, to estimate the expenses that you incurred over the period. Simply divide your account value by $1,000 (for example, an $8,600 account value divided by $1,000 = 8.6), then multiply the result by the number in the first table under the heading entitled “Expenses Paid During Period” to estimate the expenses attributable to your investment during this period.
Hypothetical Example for Comparison Purposes
The second table below also provides information about hypothetical account values and hypothetical expenses based on the Portfolio’s actual expense ratio and an assumed rate of return of 5% per year before expenses, which is not the Portfolio’s actual return. Thus, you should not use the hypothetical account values and expenses to estimate the actual ending account balance or your expenses for the period. Rather, these figures are provided to enable you to compare the ongoing costs of investing in the Portfolio and other funds. To do so, compare this 5% hypothetical example with the 5% hypothetical examples that appear in the shareholder reports of the other funds. The Portfolio charges transaction fees at scheduled amounts ranging from $50 to $1,350 per Creation Unit to those persons creating or redeeming Creation Units. If you buy or sell the Portfolio’s shares in the secondary market, you will incur customary brokerage commissions and charges.
Please note that the expenses shown in the table are meant to highlight your ongoing costs only and do not reflect any transaction costs, such as creation and redemption fees, or brokerage charges. Therefore, the second table is useful in comparing ongoing costs only, and will not help you determine the relative total costs of owning different funds. In addition, if these transaction costs were included, your costs would have been higher.
| Annualized Expense Ratio | Beginning Account Value 1/1/15 | Ending Account Value 6/30/15 | Expenses Paid During Period* 1/1/15 to 6/30/15 | |||||||||||||
Actual** | 0.00 | % | $ | 1,000 | $ | 1,010.00 | $ | 0.00 | ||||||||
Hypothetical** (assuming a 5% return before expenses) | 0.00 | % | $ | 1,000 | $ | 1,024.80 | $ | 0.00 | ||||||||
| * | Expenses are equal to the Portfolio’s annualized net expense ratio multiplied by the average account value of the period, multiplied by the number of days in the most recent six month period, then divided by 365. |
| ** | Actual period is from commencement of operations 1/21/15. Hypothetical period is from 1/1/15. |
48
Table of Contents
SSGA Active Trust
State Street Clarion Global Infrastructure & MLP Portfolio
OTHER INFORMATION (continued)
June 30, 2015 (Unaudited)
Tax Information
For federal income tax purposes, the following information is furnished with respect to the distributions of the Portfolio for its fiscal period ended June 30, 2015.
For U.S. federal income tax purposes, the percentage of distributions that qualify for the corporate dividends received deduction for the fiscal period ended June 30, 2015 is 9.95%.
Qualified Dividend Income
A portion of dividends distributed by the Portfolio during the fiscal period ended June 30, 2015, are considered qualified dividend income, and are eligible for reduced tax rates. These lower rates range from 5% to 20% depending on the individual’s tax bracket. These amounts were $183,136 for the fiscal period ended June 30, 2015.
Proxy Voting Policies and Procedures and Records
A description of the Trust’s proxy voting policies and procedures that are used by the Portfolio’s investment adviser to vote proxies relating to the portfolio of securities are available (i) without charge, upon request by calling 1-866-787-2257 (toll free) or (ii) on the website of the U.S. Securities and Exchange Commission, at www.sec.gov. Information regarding how the investment advisor voted for the prior 12-months period ended June 30 is available by August 31 of each year by calling the same number and on the SEC’s website, at www.sec.gov, and on the Portfolio’s website at www.ssgafunds.com.
Quarterly Portfolio Schedule
The Portfolio files a complete schedule of portfolio holdings with the SEC for the first and third quarters of each fiscal year on Form N-Q. The Portfolio’s Form N-Q is available on the SEC’s website at www.sec.gov and may be reviewed and copied at the SEC’s Public Reference Room in Washington DC. Information on the operation of the Public Reference Room may be obtained by calling 1-800-SEC-0330. The information on the Form N-Q is available upon request, without charge, by calling 1-866-787-2257 (toll free) and on the Portfolio’s website at www.ssgafunds.com.
Advisory Agreement Renewal
Approval of Advisory Agreement
At an in-person meeting held prior to June 30, 2015, the Board of Trustees of the Trust (the “Board”) evaluated a proposal to approve the Investment Advisory Agreement (the “Agreement”) between SSGA Active Trust (the “Trust”) and SSGA Funds Management, Inc. (the “Adviser” or “SSGA FM”) with respect to the State Street Clarion Global Infrastructure & MLP Portfolio, a new series of the Trust (the “New Fund”), which commenced operations during the period covered by this Annual Report. The Trustees who are not “interested persons” of the Trust within the meaning of the Investment Company Act of 1940, as amended (the “Independent Trustees”) also met separately with their independent legal counsel to consider the Agreement.
In evaluating the Agreement, the Board drew on materials provided to them by SSGA FM, the Trust’s investment adviser and administrator, and other materials provided by State Street Bank and Trust Company, the Trust’s sub-administrator, transfer agent and custodian (“State Street”). In deciding whether to approve the Agreement, the Board considered various factors, including the (i) nature, extent and quality of services expected to be provided by the Adviser with respect to the New Fund under the Agreement, (ii) fees charged to comparable funds, (iii) other benefits to the Adviser, and (iv) extent to which economies of scale would be shared as the New Fund grows.
Nature, Extent and Quality of Services
The Board considered the nature, extent and quality of services expected to be provided by the Adviser. In doing so, the Trustees relied on their prior experience in overseeing the management of the Trust and materials provided prior to and at the meeting. The Board reviewed the Agreement and the Adviser’s anticipated responsibilities for managing investment operations of the New Fund in accordance with its investment objective and policies, and applicable legal
49
Table of Contents
SSGA Active Trust
State Street Clarion Global Infrastructure & MLP Portfolio
OTHER INFORMATION (continued)
June 30, 2015 (Unaudited)
and regulatory requirements. The Board appreciated the nature of the New Fund in a master-feeder structure and the experience and expertise of the Adviser. The Board considered the background and experience of the Adviser’s senior management, including those individuals responsible for portfolio management, oversight of sub-advisers and regulatory compliance of the New Fund. The Board also considered the portfolio management and oversight resources, structures and practices of the Adviser, including those associated with monitoring and securing the New Fund’s compliance with its investment objective and policies and with applicable laws and regulations. The Board also considered information about the Adviser’s best execution procedures and overall investment management business, noting that the Adviser serves a wide range of clients across a broad spectrum of asset classes. The Board looked at the Adviser’s general knowledge of the investment business and that of its affiliates which make up State Street Global Advisors, through which the Adviser shares all of its senior personnel. The Board considered that the Adviser and its affiliates constitute one of the world’s largest investment management enterprises. The Board also considered the Adviser’s experience in active management, managing funds in master-feeder structures and overseeing third-party sub-advisers.
Fees Charged to Comparable Funds
The Board evaluated the New Fund’s unitary fee through review of comparative information with respect to fees paid by similar funds. The Board reviewed the universe of similar funds based upon data independently obtained from Lipper Analytical Services and related comparative information for similar funds. The Board also reviewed the fee structure of the New Fund in connection with the master-feeder structure and the estimated expense ratio for the New Fund.
Other Benefits
The Board considered whether the Adviser or its affiliates benefited in other ways from its relationship with the Trust, noting that the Adviser does not maintain soft-dollar arrangements in connection with the Trust’s brokerage transactions.
Economies of Scale
The Board reviewed information regarding economies of scale or other efficiencies that may result as the New Fund’s assets grow in size. The Board noted that the Agreement did not provide for breakpoints in the New Fund’s advisory fee rate as assets of the New Fund increase. However, the Board further noted the Adviser’s assertion that future economies of scale (among several factors) had been taken into consideration for the New Fund by fixing relatively low advisory fees, effectively sharing the benefits of lower fees with the New Fund from inception. The Adviser also asserted that one of the benefits of the unitary fee was to provide an unvarying expense structure, which could be lost or diluted with the addition of breakpoints. The Board noted that it intends to continue to monitor fees as the New Fund grows in size and assess whether fee breakpoints may be warranted.
The Board, including the Independent Trustees voting separately, approved the Agreement for the New Fund after weighing the foregoing factors, none of which was dispositive in itself and may have been weighed differently by each Trustee. The Board’s conclusions with respect to the Agreement were as follows: (a) the nature and extent of the services expected to be provided by the Adviser with respect to the New Fund were appropriate; (b) the Adviser’s unitary fee for the New Fund, considered in relation to services expected to be provided, and in relation to fees charged to comparable funds, was fair and reasonable; and (c) any additional potential benefits to the Adviser or its affiliates were not of a magnitude to materially affect the Board’s conclusions.
Approval of CBRE Clarion Securities LLC Sub-Advisory Agreement
At an in-person meeting held prior to June 30, 2015, the Board also considered the approval of the Sub-Advisory Agreement (the “Clarion Sub-Advisory Agreement”) between the Adviser and CBRE Clarion Securities LLC (“Clarion”) with respect to the State Street Clarion Global Infrastructure & MLP Portfolio (the “Clarion Portfolio”), a series of the SSGA Active Trust. The Trustees who are not “interested persons” of the Trust within the meaning of the Investment Company Act of 1940, as amended (the “Independent Trustees”) also met separately with their independent legal counsel to consider the Clarion Sub-Advisory Agreement.
50
Table of Contents
SSGA Active Trust
State Street Clarion Global Infrastructure & MLP Portfolio
OTHER INFORMATION (continued)
June 30, 2015 (Unaudited)
In evaluating the Clarion Sub-Advisory Agreement, the Board drew on materials provided to them by Clarion and the Adviser. In deciding whether to approve the Clarion Sub-Advisory Agreement, the Board considered various factors, including the (i) nature, extent and quality of services expected to be provided by Clarion with respect to the Clarion Portfolio under the Clarion Sub-Advisory Agreement; and (ii) investment performance of other actively managed mandates managed by Clarion. The Board was apprised of the portion of the advisory fee that the Adviser would pay to Clarion under the Clarion Sub-Advisory Agreement and also considered that such fees would be paid directly by the Adviser and would not result in increased fees payable by the Clarion Portfolio.
The Board considered the background and experience of Clarion’s senior management and in particular Clarion’s experience in investing in infrastructure companies. The Board noted that Clarion would bring significant actively managed experience to bear in managing the Clarion Portfolio. The Board noted that Clarion has extensive experience in managing securities of infrastructure companies and reviewed Clarion’s assets under management in similar portfolios of securities.
The Board, including the Independent Trustees voting separately, approved the Clarion Sub-Advisory Agreement for the Clarion Portfolio after weighing the foregoing factors, none of which was dispositive in itself and may have been weighed differently by each Trustee. The Board’s conclusions with respect to the Clarion Agreement were as follows: (a) the nature and extent of the services expected to be provided by Clarion with respect to the Clarion Portfolio were adequate and appropriate; and (b) Clarion’s experience in managing securities of infrastructure companies is extensive; (c) Clarion’s fees for the Clarion Portfolio and the unitary fee, considered in relation to the services expected to be provided, were fair and reasonable; (d) any additional potential benefits to Clarion were not of a magnitude to materially affect the Board’s conclusions; and (e) fees expected to be paid to Clarion were expected to share economies of scale with the Clarion Portfolio by way of the relatively low fee structure of the Trusts.
51
Table of Contents
SSGA Active Trust
State Street Clarion Global Infrastructure & MLP Portfolio
TRUSTEES AND OFFICERS INFORMATION
June 30, 2015 (Unaudited)
TRUSTEES
Name, Address and Year of Birth | Position(s) with Funds | Term of Office and Length of Time Served | Principal Occupation(s) During Past 5 Years | Number of Portfolios in Fund Complex Overseen by Trustee | Other Directorships Held by Trustee | |||||||
Independent Trustees | ||||||||||||
FRANK NESVET | Independent Trustee, Chairman, Trustee Committee Chair | Term: Unlimited Served: since March 2011 | Chief Executive Officer, Libra Group, Inc. (a financial services consulting company) (1998-present). | 192 | SPDR Index Shares Funds (Trustee); SPDR Series Trust (Trustee); SSGA Master Trust (Trustee). | |||||||
DAVID M. KELLY | Independent Trustee, Audit Committee Chair | Term: Unlimited Served: since March 2011 | Retired. | 192 | Chicago Stock Exchange (Former Director, retired); Penson Worldwide Inc. (Former Director, retired); SPDR Index Shares Funds (Trustee); SPDR Series Trust (Trustee); SSGA Master Trust (Trustee). | |||||||
BONNY EUGENIA BOATMAN c/o SSGA Active Trust | Independent Trustee | Term: Unlimited Served: since March 2011 | Retired. | 192 | SPDR Index Shares Funds (Trustee); SPDR Series Trust (Trustee); SSGA Master Trust (Trustee). | |||||||
DWIGHT D. CHURCHILL | Independent Trustee | Term: Unlimited Served: since March 2011 | Self-employed consultant since 2010; CEO and President, CFA Institute (June 2014-January 2015). | 192 | SPDR Index Shares Funds (Trustee); SPDR Series Trust (Trustee); SSGA Master Trust (Trustee); Affiliated Managers Group, Inc. (Director). | |||||||
CARL G. VERBONCOEUR | Independent Trustee | Term: Unlimited Served: since March 2011 | Self-employed consultant since 2009. | 192 | The Motley Fool Funds Trust (Trustee); SPDR Index Shares Funds (Trustee); SPDR Series Trust (Trustee); SSGA Master Trust (Trustee). | |||||||
52
Table of Contents
SSGA Active Trust
State Street Clarion Global Infrastructure & MLP Portfolio
TRUSTEES AND OFFICERS INFORMATION (continued)
June 30, 2015 (Unaudited)
Name, Address and Year of Birth | Position(s) with Funds | Term of Office and Length of Time Served | Principal Occupation(s) During Past 5 Years | Number of Portfolios in Fund Complex Overseen by Trustee | Other Directorships Held by Trustee | |||||||
Interested Trustee | ||||||||||||
JAMES E. ROSS* | Interested Trustee | Term: Unlimited Served as Trustee: since March 2011 | Chairman and Director, SSGA Funds Management, Inc. (2005-present); Senior Managing Director and Principal, State Street Global Advisors (2006-present); President, SSGA Funds Management, Inc. (2005-2012). | 256 | SPDR Index Shares Funds (Trustee); SPDR Series Trust (Trustee); SSGA Master Trust (Trustee); Select Sector SPDR Trust (Trustee); State Street Master Funds (Trustee); and State Street Institutional Investment Trust (Trustee). | |||||||
| * | Mr. Ross is an Interested Trustee because of his employment with the Adviser and ownership interest in an affiliate of the Adviser. |
OFFICERS
Name, Address and Year of Birth | Position(s) with Funds | Term of Office and Length of Time Served | Principal Occupation(s) During Past 5 Years | |||
ELLEN M. NEEDHAM | President | Term: Unlimited Served: since October 2012 | President and Director, SSGA Funds Management, Inc. (June 2012-present); Chief Operating Officer, SSGA Funds Management, Inc. (May 2010-June 2012); Senior Managing Director, SSGA Funds Management, Inc. (1992-2012)*; Senior Managing Director, State Street Global Advisors (1992-present).* | |||
ANN M. CARPENTER | Vice President; Assistant Treasurer | Term: Unlimited Served: since August 2012; Term: Unlimited Served: since April 2015 | Chief Operating Officer, SSGA Funds Management, Inc. (April 2014-present); Vice President, State Street Global Advisors and SSGA Funds Management, Inc. (2005-present).* | |||
MICHAEL P. RILEY | Vice President | Term: Unlimited Served: since March 2011 | Vice President, State Street Global Advisors and SSGA Funds Management, Inc. (2008-present); Principal, State Street Global Advisors and SSGA Funds Management, Inc. (2005-2008). | |||
JOSHUA A. WEINBERG | Chief Legal Officer | Term: Unlimited Served: since February 2015 | Vice President and Managing Counsel, State Street Global Advisors (2011-present); Clerk, SSGA Funds Management, Inc. (2013-present); Associate, Financial Services Group, Dechert LLP (2006-2011). |
53
Table of Contents
SSGA Active Trust
State Street Clarion Global Infrastructure & MLP Portfolio
TRUSTEES AND OFFICERS INFORMATION (continued)
June 30, 2015 (Unaudited)
Name, Address and Year of Birth | Position(s) with Funds | Term of Office and Length of Time Served | Principal Occupation(s) During Past 5 Years | |||
CHRISTOPHER A. MADDEN | Secretary | Term: Unlimited Served: since August 2013 | Vice President and Senior Counsel, State Street Bank and Trust Company (2013-present); Counsel, Atlantic Fund Services (2009-2013); Vice President, Citigroup Fund Services, LLC (2005-2009).* | |||
PATRICIA A. MORISETTE | Assistant Secretary | Term: Unlimited Served: since February 2015 | Vice President and Counsel, State Street Bank and Trust Company (2014-present); Assistant Vice President and Counsel, John Hancock Financial Services (2011-2013); Independent legal consultant (2009-2011); Associate, Bingham McCutchen LLP (2003-2009).*,** | |||
CHAD C. HALLETT | Treasurer | Term: Unlimited Served: since March 2011 | Vice President, State Street Global Advisors and SSGA Funds Management, Inc. (November 2014-present); Vice President, State Street Bank and Trust Company (2001-November 2014).* | |||
BRIAN HARRIS | Chief Compliance Officer | Term: Unlimited Served: since November 2013 | Vice President, State Street Global Advisors and SSGA Funds Management, Inc. (2013-Present); Senior Vice President and Global Head of Investment Compliance, BofA Global Capital Management (2010-2013); Director of Compliance, AARP Financial Inc. (2008-2010). |
| * | Served in various capacities and/or with various affiliated entities during noted time period. |
| ** | Served in various capacities and/or with unaffiliated mutual funds or closed-end funds for which State Street Bank and Trust Company or its affiliates act as a provider of services during the noted time period. |
54
Table of Contents
SSGA Active Trust
Trustees
Bonny E. Boatman
Dwight D. Churchill
David M. Kelly
Frank Nesvet, Chairman
James E. Ross
Carl G. Verboncoeur
Officers
Ellen M. Needham, President
Ann Carpenter, Vice President and Assistant Treasurer
Michael P. Riley, Vice President
Joshua A. Weinberg, Chief Legal Officer
Chad C. Hallett, Treasurer
Christopher A. Madden, Secretary
Patricia A. Morisette, Assistant Secretary
Brian Harris, Chief Compliance Officer
Investment Manager and Administrator
SSGA Funds Management, Inc.
State Street Financial Center
One Lincoln Street
Boston, MA 02111
Distributor
State Street Global Markets, LLC
One Lincoln Street
Boston, MA 02111
Custodian, Sub-Administrator and Transfer Agent
State Street Bank and Trust Company
One Lincoln Street
Boston, MA 02111
Legal Counsel
Morgan, Lewis & Bockius LLP
2020 K Street, NW
Washington, DC 20006
Independent Registered Public Accounting Firm
Ernst & Young LLP
200 Clarendon Street
Boston, MA 02116
Distributor: State Street Global Markets, LLC, member FINRA, SIPC, a wholly owned subsidiary of State Street Corporation. References to State Street may include State Street Corporation and its affiliates. The SSGA Funds pay State Street Bank and Trust Company for its services as custodian, transfer agent and shareholder servicing agent and pays SSGA Funds Management, Inc. for investment advisory services.
Before investing, consider the funds’ investment objectives, risks, charges and expenses. To obtain a prospectus or summary prospectus which contains this and other information, call 1-800-997-7327 or visit www.SSGAfunds.com. Read it carefully.
Fund Shares are distributed by State Street Global Markets, LLC, a wholly-owned subsidiary of State Street Corporation. State Street Global Markets, LLC; member FINRA, SIPC.
The information contained in this report is intended for the general information of shareholders of the Trust. This report is not authorized for distribution to prospective investors unless preceded or accompanied by a current Trust prospectus which contains important information concerning the Trust. You may obtain a current prospectus and SAI from the Distributor by calling 1-866-787-2257 or visiting www.ssgafunds.com Please read the prospectus carefully before you invest.
| Not FDIC Insured — No Bank Guarantee — May Lose Value | © 2015 State Street Corporation — All Rights Reserved IBG-16220 |
Table of Contents
Annual Report
31 December 2015
State Street Institutional Investment Trust
State Street Clarion Global Real Estate Income Fund

Table of Contents
State Street Institutional Investment Trust
State Street Clarion Global Real Estate Income Fund
Annual Report
December 31, 2015
| 1 | ||||
| 4 | ||||
| 5 | ||||
| 8 | ||||
| 10 | ||||
| 11 | ||||
| 12 | ||||
| 14 | ||||
| 23 | ||||
| 24 | ||||
| 26 | ||||
| 27 | ||||
Table of Contents
State Street Clarion Global Real Estate Income Fund
MANAGEMENT DISCUSSION OF FUND PERFORMANCE
The State Street Clarion Global Real Estate Income Fund (the “Fund”) seeks total return with an emphasis on income. The Fund is benchmarked to the FTSE EPRA/NAREIT Developed Rental Index (the “Index”).
For the 12-month period ended December 31, 2015 (the “Reporting Period”), the total return for Class I of the Fund was 0.10%, and the total return for the Index was 0.98%. The Fund and Index returns reflect the reinvestment of dividends and other income. The Fund’s performance reflects the expenses of managing the Fund, including brokerage and advisory expenses. The Index is unmanaged, and Index returns do not reflect fees and expenses of any kind, which would have a negative impact on returns.
Global real estate stocks generated modestly positive returns in 2015, outperforming equities and bonds in most markets. Solid fundamentals and stable earnings growth continued to attract investors to real estate securities, particularly in Continental Europe, the United Kingdom and Australia. However, the overall sector performance fell short of our expectations set out at the start of the year as fears of rising interest rates, geopolitical concerns, and slowing global economic growth weighed on investors’ confidence.
The Fund underperformed the Index during the Reporting Period. Detractors from the Fund’s performance included stock selection in the U.K., as London office positions were challenged despite improving fundamentals, stock selection in Continental Europe, and stock selection in Hong Kong, where Fund holdings suffered from Chinese economic weakness, which indirectly impacted property companies in nations with strong economic ties to China. Positioning in the Americas, in terms of both security selection and weighting versus the Index, contributed positively to relative performance. An underweight allocation to Canada generated meaningful alpha as it was the worst performing market during the Reporting Period. In the U.S., key positive contributors to relative performance included high conviction positioning in apartment companies due to their healthy fundamentals, outperforming mall holdings and a meaningful underweight position in the underperforming healthcare sector. Asset allocation was favorable in Asia-Pacific, which was largely the result of an underweight allocation to Singapore, the second worst performing market during the year.
The top positive contributors to the Fund’s relative performance were Equity Residential, RioCan REIT and QTS Realty Trust, Inc. An overweight position in outperforming Equity Residential, an S&P 500 company focused on the acquisition, development and management of high-quality apartment properties in top U.S. growth markets, benefited the Fund as U.S. apartment fundamentals continue to accelerate, particularly in coastal markets with limited new supply and high demand. A timely exit of RioCan REIT, a Canadian retail REIT, added to relative value as the stock declined significantly in the Index versus a positive total return in the Fund. A position in QTS Realty contributed positively to relative results due to strong performance. Given the sharp underperformance in the technology real estate (data centers) sector despite strong demand drivers, the Fund added small-cap QTS Realty Trust during the year, and it delivered a significantly positive total return.
The top negative contributors to the Fund’s relative performance were Extra Space Storage, Host Hotels & Resorts, Inc. and LaSalle Hotel Properties. The Fund was underweight Extra Space Storage, the second-largest owner of self-storage, which trades at a hefty premium to its peers.
We feel this premium is unwarranted and driven by the market’s overly optimistic growth prospects. An overweight position in underperforming Host Hotels, a $23 billion hotel REIT concentrated in branded full-service assets, and LaSalle Hotel Properties, a hotel REIT with a $6.3 billion portfolio concentrated
1
Table of Contents
State Street Clarion Global Real Estate Income Fund
MANAGEMENT DISCUSSION OF FUND PERFORMANCE — (continued)
in independently branded urban hotels, detracted from relative results as the uninspiring macro-economic environment caused stock weakness in the shortest duration and most economically sensitive hotel property sector during the Reporting Period.
The Fund did not invest in derivatives during the Reporting Period.
The views expressed above reflect those of the Fund’s portfolio manager only through the Reporting Period and do not necessarily represent the views of the Adviser as a whole. Any such views are subject to change at any time based upon market or other conditions, and the Adviser disclaims any responsibility to update such views. These views may not be relied on as investment advice and, because investment decisions for a fund are based on numerous factors, may not be relied on as an indication of trading intent on behalf of any fund.
2
Table of Contents
State Street Clarion Global Real Estate Income Fund
Class I
Growth of a $10,000 Investment (a)
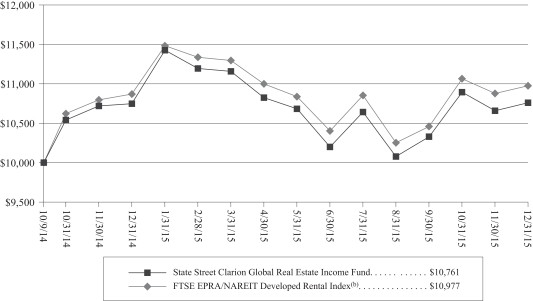
Investment Performance (a)
as of December 31, 2015
| Total Return One Year Ended December 31, 2015 | Total Return Average Annual Inception to Date December 31, 2015 | |||||||
State Street Clarion Global Real Estate Income Fund Class A | -0.22 | % | 5.88 | % | ||||
State Street Clarion Global Real Estate Income Fund Class I | 0.10 | % | 6.14 | % | ||||
FTSE EPRA/NAREIT Developed Rental Index(b) | 0.98 | % | 7.90 | % | ||||
| (a) | Total returns and performance graph information represent past performance and are not indicative of future results, which may be lower or higher than performance data quoted. Investment return and principal value of an investment will fluctuate so that an investor’s share, when redeemed, may be worth more or less than its original cost. The graph and table above do not reflect the deduction of taxes that a shareholder would pay on fund distributions, sales, or the redemption of fund shares. |
| (b) | The FTSE EPRA/NAREIT Developed Rental Index is designed to measure the stock performance of companies engaged in specific Rental real-estate activities in North America, Europe and Asia. A company is included in the FTSE EPRA/NAREIT Developed Rental Index if its rental revenue from investment properties is greater than or equal to 70% of total revenue. Relevant real-estate activities are defined as the ownership, disposal and development of income producing real estate. |
3
Table of Contents
State Street Institutional Investment Trust
State Street Clarion Global Real Estate Income Fund
Portfolio Statistics (Unaudited)
Portfolio Composition* | December 31, 2015 | |||
Common Stocks | 99.6 | % | ||
Short-Term Investment | 1.0 | |||
Liabilities in Excess of Other Assets | (0.6 | )% | ||
Total | 100.0 | % |
Top Five Sectors (excluding short-term investment)* | December 31, 2015 | |||
REITS-Diversified | 20.4 | % | ||
REITS-Office Property | 14.2 | |||
REITS-Apartments | 13.3 | |||
REITS-Shopping Centers | 11.2 | |||
REITS-Regional Malls | 10.9 | |||
Total | 70.0 | % |
| * | As a percentage of net assets as of the date indicated. The Fund’s composition will vary over time. |
See accompanying notes to financial statements.
4
Table of Contents
State Street Institutional Investment Trust
State Street Clarion Global Real Estate Income Fund
December 31, 2015
Security Description | Shares | Value | ||||||
COMMON STOCKS – 99.6% | ||||||||
| AUSTRALIA – 6.2% | ||||||||
GPT Group REIT(a) | 17,621 | $ | 60,929 | |||||
Investa Office Fund REIT(a) | 19,262 | 55,671 | ||||||
Mirvac Group REIT(a) | 18,984 | 27,134 | ||||||
Vicinity Centres(a) | 31,048 | 62,887 | ||||||
Westfield Corp. REIT(a) | 15,852 | 108,888 | ||||||
|
| |||||||
| 315,509 | ||||||||
|
| |||||||
| FRANCE – 6.2% | ||||||||
Gecina SA(a) | 377 | 45,813 | ||||||
Klepierre REIT(a) | 2,597 | 115,388 | ||||||
Unibail-Rodamco SE REIT | 604 | 153,796 | ||||||
|
| |||||||
| 314,997 | ||||||||
|
| |||||||
| GERMANY – 3.2% | ||||||||
Deutsche EuroShop AG(a) | 1,399 | 61,257 | ||||||
LEG Immobilien AG(a)(b) | 1,236 | 100,693 | ||||||
|
| |||||||
| 161,950 | ||||||||
|
| |||||||
| HONG KONG – 1.4% | ||||||||
Cheung Kong Property Holdings, Ltd.(a) | 7,500 | 48,854 | ||||||
Link REIT(a) | 3,900 | 23,326 | ||||||
|
| |||||||
| 72,180 | ||||||||
|
| |||||||
| JAPAN – 6.6% | ||||||||
Fukuoka Corp. REIT(a) | 23 | 39,716 | ||||||
GLP J - REIT(a) | 31 | 29,974 | ||||||
Invincible Investment Corp.(a) | 5 | 2,902 | ||||||
Japan Retail Fund Investment Corp. REIT(a) | 37 | 71,124 | ||||||
Kenedix Office Investment Corp. REIT(a) | 17 | 79,409 | ||||||
Mitsui Fudosan Co., Ltd.(a) | 2,000 | 50,154 | ||||||
Nippon Prologis, Inc. REIT(a) | 34 | 61,453 | ||||||
|
| |||||||
| 334,732 | ||||||||
|
| |||||||
| NETHERLANDS – 0.9% | ||||||||
Eurocommercial Properties NV(a) | 1,050 | 45,342 | ||||||
|
| |||||||
| SPAIN – 0.8% | ||||||||
Hispania Activos Inmobiliarios SA(a)(b) | 2,922 | 41,537 | ||||||
|
| |||||||
| SWEDEN – 0.7% | ||||||||
Hufvudstaden AB Class A(a) | 2,368 | 33,519 | ||||||
|
| |||||||
| UNITED KINGDOM – 7.9% | ||||||||
British Land Co. PLC REIT(a) | 13,538 | 156,614 | ||||||
Great Portland Estates PLC REIT(a) | 7,312 | 89,104 | ||||||
See accompanying notes to financial statements.
5
Table of Contents
State Street Institutional Investment Trust
State Street Clarion Global Real Estate Income Fund
Schedule of Investments — (continued)
December 31, 2015
Security Description | Shares | Value | ||||||
| COMMON STOCKS – (continued) | ||||||||
| UNITED KINGDOM – (continued) | ||||||||
Hammerson PLC REIT(a) | 4,550 | $ | 40,215 | |||||
Land Securities Group PLC(a) | 5,007 | 86,779 | ||||||
ST Modwen Properties PLC(a) | 3,991 | 24,415 | ||||||
|
| |||||||
| 397,127 | ||||||||
|
| |||||||
| UNITED STATES – 65.7% | ||||||||
Alexandria Real Estate Equities, Inc. REIT | 1,100 | 99,396 | ||||||
AvalonBay Communities, Inc. REIT | 1,000 | 184,130 | ||||||
Boston Properties, Inc. REIT | 1,100 | 140,294 | ||||||
CubeSmart REIT | 1,700 | 52,054 | ||||||
DCT Industrial Trust, Inc. REIT | 1,000 | 37,370 | ||||||
DDR Corp. REIT | 5,600 | 94,304 | ||||||
Digital Realty Trust, Inc. | 1,100 | 83,182 | ||||||
Douglas Emmett, Inc. REIT | 1,300 | 40,534 | ||||||
Equity Residential REIT | 3,400 | 277,406 | ||||||
Essex Property Trust, Inc. REIT | 375 | 89,779 | ||||||
General Growth Properties, Inc. REIT | 7,000 | 190,470 | ||||||
Healthcare Realty Trust, Inc. REIT | 1,800 | 50,976 | ||||||
Host Hotels & Resorts, Inc. REIT | 7,100 | 108,914 | ||||||
Kilroy Realty Corp. REIT | 1,600 | 101,248 | ||||||
Kimco Realty Corp. REIT | 4,600 | 121,716 | ||||||
LaSalle Hotel Properties REIT | 2,400 | 60,384 | ||||||
Liberty Property Trust REIT | 2,000 | 62,100 | ||||||
Paramount Group, Inc. REIT | 2,700 | 48,870 | ||||||
Post Properties, Inc. REIT | 738 | 43,660 | ||||||
Prologis, Inc. REIT | 4,000 | 171,680 | ||||||
Public Storage, Inc. REIT | 800 | 198,160 | ||||||
QTS Realty Trust, Inc. Class A REIT | 719 | 32,434 | ||||||
Simon Property Group, Inc. REIT | 1,850 | 359,714 | ||||||
SL Green Realty Corp. REIT | 1,200 | 135,576 | ||||||
Spirit Realty Capital, Inc. REIT | 7,800 | 78,156 | ||||||
Sunstone Hotel Investors, Inc. REIT | 3,900 | 48,711 | ||||||
UDR, Inc. REIT | 1,920 | 72,134 | ||||||
Vornado Realty Trust REIT | 1,300 | 129,948 | ||||||
Welltower, Inc. | 3,000 | 204,090 | ||||||
|
| |||||||
| 3,317,390 | ||||||||
|
| |||||||
TOTAL COMMON STOCKS | 5,034,283 | |||||||
|
| |||||||
See accompanying notes to financial statements.
6
Table of Contents
State Street Institutional Investment Trust
State Street Clarion Global Real Estate Income Fund
Schedule of Investments — (continued)
December 31, 2015
Security Description | Shares | Value | ||||||
SHORT-TERM INVESTMENT – 1.0% | ||||||||
State Street Institutional Liquid Reserves Fund, Premier Class 0.23%(c)(d) | 49,258 | $ | 49,258 | |||||
|
| |||||||
TOTAL INVESTMENTS – 100.6%(e) | 5,083,541 | |||||||
LIABILITIES IN EXCESS OF OTHER ASSETS – (0.6)% |
| (32,123 | ) | |||||
|
| |||||||
NET ASSETS – 100.0% |
| $ | 5,051,418 | |||||
|
| |||||||
| (a) | Security is fair valued at year end by applying factors provided by independent third party in accordance with the Fund’s valuation policy and procedures. The independent fair value service takes into account multiple factors including, but not limited to, movements in the U.S. securities markets, certain depositary receipts, futures contracts and foreign currency exchange rates that have occurred subsequent to the close of foreign securities exchanges. The use of the independent fair value service or alternative fair valuation methods results in the investments being classified within Level 2 of the fair value hierarchy. Total market value of such securities represent $862,697 and 17.1% of net assets of the Fund at December 31, 2015. |
| (b) | Non-income producing security |
| (c) | The rate shown is the annualized seven-day yield at December 31, 2015. |
| (d) | Affiliated Fund managed by SSGA Funds Management, Inc. (Note 4). |
| (e) | Unless otherwise indicated, the values of the securities of the Portfolio are determined based on Level 1 inputs established by provisions surrounding fair value measurements and disclosures. |
| REIT | Real Estate Investment Trust |
See accompanying notes to financial statements.
7
Table of Contents
State Street Institutional Investment Trust
State Street Clarion Global Real Estate Income Fund
Statement of Assets and Liabilities
December 31, 2015
Assets | ||||
Investments in securities of unaffiliated issuers, at value (Note 2) | $ | 5,034,283 | ||
Investments in securities of non-controlled affiliated issuer, at value (Notes 2 and 4) | 49,258 | |||
|
| |||
Total Investments | 5,083,541 | |||
Cash | 4,767 | |||
Foreign currency, at value | 1,015 | |||
Receivable for investments sold | 6,405 | |||
Dividends receivable from unaffiliated issuers | 29,689 | |||
Dividends receivable from non-controlled affiliated issuers | 2 | |||
Receivable for foreign taxes recoverable | 2,431 | |||
Receivable from Adviser (Note 4) | 14,099 | |||
Prepaid expenses and other assets | 3,081 | |||
|
| |||
Total assets | 5,145,030 | |||
|
| |||
Liabilities | ||||
Payable for investments purchased | 14,663 | |||
Advisory fees payable (Note 4) | 3,689 | |||
Custodian fees payable (Note 4) | 14,007 | |||
Professional fees payable | 43,391 | |||
Registration and filing fees payable | 6,891 | |||
Sub-Transfer Agent fees payable (Note 4) | 2,379 | |||
Administration fees payable (Note 4) | 1,216 | |||
Transfer agent fees payable | 572 | |||
Distribution fees payable (Note 4) | 385 | |||
Printing fees payable | 6,143 | |||
Accrued expenses and other liabilities | 276 | |||
|
| |||
Total liabilities | 93,612 | |||
|
| |||
Net Assets | $ | 5,051,418 | ||
|
| |||
Net Assets Consist of: | ||||
Paid-in capital | $ | 4,992,270 | ||
Distributions in excess of net investment income | (10,249 | ) | ||
Accumulated net realized loss on investments and foreign currency transactions | (21,698 | ) | ||
Net unrealized appreciation (depreciation) on investments and foreign currency | 91,095 | |||
|
| |||
Net Assets | $ | 5,051,418 | ||
|
|
See accompanying notes to financial statements.
8
Table of Contents
State Street Institutional Investment Trust
State Street Clarion Global Real Estate Income Fund
Statement of Assets and Liabilities — (continued)
December 31, 2015
Class A | ||||
Net Assets | $ | 2,525,658 | ||
Shares of beneficial interest outstanding | 250,000 | |||
|
| |||
Offering, net asset value, and redemption price per share | $ | 10.10 | ||
|
| |||
Maximum Sales Charge | 5.25 | % | ||
Maximum offering price per share | $ | 10.66 | ||
|
| |||
Class I | ||||
Net Assets | $ | 2,525,760 | ||
Shares of beneficial interest outstanding | 250,000 | |||
|
| |||
Offering, net asset value, and redemption price per share | $ | 10.10 | ||
|
| |||
Investments in securities of unaffiliated issuers, at cost | 4,947,003 | |||
Investments in securities of affiliated issuers, at cost | 49,258 | |||
|
| |||
Investments in securities, at cost | 4,996,261 | |||
|
| |||
Foreign currency, at cost | 1,015 |
See accompanying notes to financial statements.
9
Table of Contents
State Street Institutional Investment Trust
State Street Clarion Global Real Estate Income Fund
Year Ended December 31, 2015
Income | ||||
Dividend income – unaffiliated issuers (net of foreign taxes withheld of $8,890) | $ | 159,228 | ||
Dividend income – non-controlled affiliated issuer (Note 4) | 44 | |||
|
| |||
Total investment income | 159,272 | |||
|
| |||
Expenses | ||||
Advisory fees (Note 4) | 44,893 | |||
Administration fees (Note 4) | 1,503 | |||
Custodian fees (Note 4) | 38,091 | |||
Distribution fees (Note 4) | ||||
Class A | 6,601 | |||
Trustees’ fees and expenses (Note 5) | 15,339 | |||
Registration and filing fees | 35,204 | |||
Professional fees | 57,347 | |||
Transfer agent fees (Note 4) | 20,505 | |||
Printing fees | 20,984 | |||
Miscellaneous expenses | 1,619 | |||
|
| |||
Total expenses | 242,086 | |||
Less: Expenses waived/reimbursed by the Adviser (Note 4) | (179,971 | ) | ||
|
| |||
Net expenses | 62,115 | |||
|
| |||
Net Investment Income | $ | 97,157 | ||
|
| |||
Realized and Unrealized Gain (Loss) | ||||
Net realized gain (loss) on: | ||||
Investments | 115,590 | |||
Foreign currency transactions | (2,190 | ) | ||
|
| |||
Net realized gain (loss) | 113,400 | |||
|
| |||
Change in unrealized appreciation (depreciation) on: | ||||
Investments | (226,779 | ) | ||
Foreign currency translations | 3,862 | |||
|
| |||
Net change in unrealized appreciation (depreciation) | (222,917 | ) | ||
|
| |||
Net realized and unrealized loss | (139,993 | ) | ||
|
| |||
Net Increase (Decrease) in Net Assets Resulting from Operations | $ | (12,360 | ) | |
|
|
See accompanying notes to financial statements.
10
Table of Contents
State Street Institutional Investment Trust
State Street Clarion Global Real Estate Income Fund
Statements of Changes in Net Assets
| Year Ended December 31, 2015 | Period from 10/9/14* to 12/31/14 | |||||||
Increase (Decrease) in Net Assets Resulting from: | ||||||||
Operations: | ||||||||
Net investment income | $ | 97,157 | $ | 22,471 | ||||
Net realized gain (loss) on investments and foreign currency transactions | 113,400 | 38,995 | ||||||
Change in net unrealized appreciation (depreciation) on investments and foreign currency translations | (222,917 | ) | 314,012 | |||||
|
|
|
| |||||
Net increase (decrease) in net assets from operations | (12,360 | ) | 375,478 | |||||
|
|
|
| |||||
Distributions to Shareholders from: | ||||||||
Net investment income | ||||||||
Class A | (57,025 | ) | (26,325 | ) | ||||
Class I | (63,075 | ) | (28,175 | ) | ||||
|
|
|
| |||||
Total distributions from net investment income | (120,100 | ) | (54,500 | ) | ||||
|
|
|
| |||||
Net realized gain on investments | ||||||||
Class A | (66,875 | ) | (1,675 | ) | ||||
Class I | (66,875 | ) | (1,675 | ) | ||||
|
|
|
| |||||
Total distributions from net realized gain on investments | (133,750 | ) | (3,350 | ) | ||||
|
|
|
| |||||
Total distributions | (253,850 | ) | (57,850 | ) | ||||
|
|
|
| |||||
Net Increase (Decrease) from Capital Share Transactions: | ||||||||
Class A | ||||||||
Shares sold | – | 2,500,000 | ||||||
|
|
|
| |||||
Class I | ||||||||
Shares sold | – | 2,500,000 | ||||||
|
|
|
| |||||
Net increase from capital share transactions | – | 5,000,000 | ||||||
|
|
|
| |||||
Net Increase (Decrease) in Net Assets | (266,210 | ) | 5,317,628 | |||||
Net Assets | ||||||||
Beginning of period | 5,317,628 | – | ||||||
|
|
|
| |||||
End of period | $ | 5,051,418 | $ | 5,317,628 | ||||
|
|
|
| |||||
Distributions in excess of net investment income | $ | (10,249 | ) | $ | (22,764 | ) | ||
|
|
|
| |||||
Changes in Shares: | ||||||||
Class A | ||||||||
Shares sold | – | 250,000 | ||||||
|
|
|
| |||||
Class I | ||||||||
Shares sold | – | 250,000 | ||||||
|
|
|
| |||||
| * | Commencement of operations |
See accompanying notes to financial statements.
11
Table of Contents
State Street Institutional Investment Trust
State Street Clarion Global Real Estate Income Fund
Selected data for a Class A Share of beneficial interest outstanding throughout each year is presented below:
| Year Ended 12/31/15 | Period from 10/9/14*-12/31/14 | |||||||
Per Share Operating Performance: | ||||||||
Net Asset Value, Beginning of Period | $ | 10.64 | $ | 10.00 | ||||
|
|
|
| |||||
Investment Operations: | ||||||||
Net investment income(a) | 0.18 | 0.04 | ||||||
Net realized and unrealized gain (loss) on investments | (0.22 | ) | 0.72 | |||||
|
|
|
| |||||
Total from investment operations | (0.04 | ) | 0.76 | |||||
|
|
|
| |||||
Less Distributions From: | ||||||||
Net investment income | (0.23 | ) | (0.11 | ) | ||||
Net realized gain | (0.27 | ) | (0.01 | ) | ||||
|
|
|
| |||||
Total distributions | (0.50 | ) | (0.12 | ) | ||||
|
|
|
| |||||
Net increase (decrease) in net assets | (0.54 | ) | 0.64 | |||||
|
|
|
| |||||
Net Asset Value, End of Period | $ | 10.10 | $ | 10.64 | ||||
|
|
|
| |||||
Total Return(b) | (0.32 | )% | 7.52 | %(c) | ||||
Ratios and Supplemental Data: | ||||||||
Net Assets, End of Period (000s) | $ | 2,526 | $ | 2,659 | ||||
Ratios to average net assets: | ||||||||
Expenses before waiver and payments by affiliates | 4.71 | % | 6.51 | %(d) | ||||
Expenses net of waivers and payments by affiliates | 1.30 | % | 1.50 | %(d) | ||||
Net investment income | 1.74 | % | 1.76 | %(d) | ||||
Portfolio turnover rate | 93 | % | 11 | %(c) | ||||
| * | Commencement of operations. |
| (a) | Net investment income per share is calculated using the average shares method. |
| (b) | Total return is calculated assuming a purchase of shares at net asset value on the first day and a sale at net asset value on the last day of each period reported. Distributions are assumed, for the purpose of this calculation, to be reinvested at net asset value per share on the respective payment dates. Results represent past performance and are not indicative of future results. |
| (c) | Not annualized. |
| (d) | Annualized. |
See accompanying notes to financial statements.
12
Table of Contents
State Street Institutional Investment Trust
State Street Clarion Global Real Estate Income Fund
Financial Highlights
Selected data for a Class I Share of beneficial interest outstanding throughout each year is presented below:
| Year Ended 12/31/15 | Period from 10/9/14*-12/31/14 | |||||||
Per Share Operating Performance: | ||||||||
Net Asset Value, Beginning of Period | $ | 10.63 | $ | 10.00 | ||||
|
|
|
| |||||
Investment Operations: | ||||||||
Net investment income (loss)(a) | 0.20 | 0.05 | ||||||
Net realized and unrealized gain (loss) on investments | (0.21 | ) | 0.70 | |||||
|
|
|
| |||||
Total from investment operations | (0.01 | ) | 0.75 | |||||
|
|
|
| |||||
Less Distributions From: | ||||||||
Net investment income | (0.25 | ) | (0.11 | ) | ||||
Net realized gains | (0.27 | ) | (0.01 | ) | ||||
|
|
|
| |||||
Total distributions | (0.52 | ) | (0.12 | ) | ||||
|
|
|
| |||||
Net increase (decrease) in net assets | (0.53 | ) | 0.63 | |||||
|
|
|
| |||||
Net Asset Value, End of Period | $ | 10.10 | $ | 10.63 | ||||
|
|
|
| |||||
Total Return(b) | 0.01 | % | 7.49 | %(c) | ||||
Ratios and Supplemental Data: | ||||||||
Net Assets, End of Period (000s) | $ | 2,526 | $ | 2,659 | ||||
Ratios to average net assets: | ||||||||
Expenses before waiver and payments by affiliates | 4.46 | % | 6.26 | %(d) | ||||
Expenses net of waivers and payments by affiliates | 1.05 | % | 1.25 | %(d) | ||||
Net investment income | 1.93 | % | 2.01 | %(d) | ||||
Portfolio turnover rate | 93 | % | 11 | %(c) | ||||
| * | Commencement of operations. |
| (a) | Net investment income per share is calculated using the average shares method. |
| (b) | Total return is calculated assuming a purchase of shares at net asset value on the first day and a sale at net asset value on the last day of each period reported. Distributions are assumed, for the purpose of this calculation, to be reinvested at net asset value per share on the respective payment dates. Results represent past performance and are not indicative of future results. |
| (c) | Not annualized. |
| (d) | Annualized. |
See accompanying notes to financial statements.
13
Table of Contents
State Street Institutional Investment Trust
State Street Clarion Global Real Estate Income Fund
December 31, 2015
| 1. | Organization |
State Street Institutional Investment Trust (the “Trust”) which is registered under the Investment Company Act of 1940, as amended (the “1940 Act”), is an open-end management investment company, and was organized as a Massachusetts business trust on February 16, 2000. The Trust consists of forty-five (45) series and corresponding classes, each of which have the same rights and privileges, including the same voting rights. Information presented in these financial statements pertains only to the State Street Clarion Global Real Estate Income Fund (the “Fund”). The Fund has registered Class A, Class C, Class I and Class K Shares. The Fund’s Class C and Class K were not operational at December 31, 2015.
| Fund | Classes | Commencement of Operations: | ||
State Street Clarion Global Real Estate Income Fund | Class A | October 9, 2014 | ||
State Street Clarion Global Real Estate Income Fund | Class I | October 9, 2014 |
The Fund is authorized to issue an unlimited number of shares, with no par value.
The investment objective of the Fund is to seek total return with an emphasis on income. Class A shares of the Fund are available to the general public for investment through transaction-based financial intermediaries. Class A shares impose a 5.25% sales charge (as a percentage of offering price) and may be subject to a 1% CDSC if no initial sales charge was paid at the time of purchase of an investment of $1,000,000 or more and the shares are redeemed within 18 months of purchase. Class I shares are sold without a sales charge and only to certain eligible investors.
The Fund is classified as a diversified investment company under the 1940 Act.
Under the Trust’s organizational documents, its officers and trustees are indemnified against certain liabilities arising out of the performance of their duties to the Trust. Additionally, in the normal course of business, the Trust enters into contracts with service providers that contain general indemnification clauses. The Trust’s maximum exposure under these arrangements is unknown as this could involve future claims that may be made against the Trust that have not yet occurred.
| 2. | Summary of Significant Accounting Policies |
The following is a summary of significant accounting policies followed by the Trust in the preparation of its financial statements:
The preparation of financial statements in accordance with U.S. generally accepted accounting principles (“U.S. GAAP”) requires management to make estimates and assumptions that affect the reported amounts and disclosures in the financial statements. Actual results could differ from those estimates. The Fund is an investment company under U.S. GAAP and follows the accounting and reporting guidance applicable to investment companies in Financial Accounting Standards Board (“FASB”) Accounting Standards Codification (“ASC”) 946, Financial ServicesInvestment Companies (“ASC 946”).
Security Valuation
The Fund’s investments are valued at fair value each day that the Fund’s listing exchange is open and, for financial reporting purposes, as of the report date should the reporting period end on a day that the
14
Table of Contents
State Street Institutional Investment Trust
State Street Clarion Global Real Estate Income Fund
Notes to Financial Statements — (continued)
December 31, 2015
Fund’s listing exchange is not open. Fair value is generally defined as the price a fund would receive to sell an asset or pay to transfer a liability in an orderly transaction between market participants at the measurement date. By its nature, a fair value price is a good faith estimate of the valuation in a current sale and may not reflect an actual market price. The investments of the Fund are valued pursuant to the policy and procedures developed by the Oversight Committee (the “Committee”) and approved by the Board of Trustees of the Trust (the “Board”). The Committee provides oversight of the valuation of investments for the Fund. The Board has responsibility for determining the fair value of investments. Valuation techniques used to value the Fund’s investments by major category are as follows:
| • | Equity investments (including registered investment companies) traded on a recognized securities exchange for which market quotations are readily available are valued at the last sale price or official closing price, as applicable, on the primary market or exchange on which they trade. Equity investments traded on a recognized exchange for which there were no sales on that day are valued at the last published sale price or at fair value. |
| • | Investments in registered investment companies (including money market funds) or other unitized pooled investment vehicles that are not traded on an exchange are valued at that day’s published net asset value per share or unit. Money market funds generally value portfolio investments using the amortized cost method as set forth in Rule 2a-7 under the 1940 Act and in accordance with their procedures to stabilize net asset value. |
Fair value pricing could result in a difference between the prices used to calculate the Fund’s net asset value and the prices used by the Fund’s underlying index, which in turn could result in a difference between the Fund’s performance and the performance of the Fund’s underlying index.
In the event prices or quotations are not readily available or that the application of these valuation methods results in a price for an investment that is deemed to be not representative of the fair value of such investment, fair value will be determined in good faith by the Committee, in accordance with the valuation policy and procedures approved by the Board.
Various inputs are used in determining the value of the Fund’s investments. These inputs are categorized into a hierarchy consisting of three broad levels for financial reporting purposes.
The Fund values its assets and liabilities at fair value using a hierarchy that prioritizes the inputs to valuation techniques, giving the highest priority to readily available unadjusted quoted prices in active markets for identical assets or liabilities (Level 1 measurements) and the lowest priority to unobservable inputs (Level 3 measurements) when market prices are not readily available or reliable. The categorization of a value determined for an investment within the hierarchy is based upon the pricing transparency of the investment and is not necessarily an indication of the risk associated with investing in it.
The three levels of the fair value hierarchy are as follows:
| • | Level 1 – Unadjusted quoted prices in active markets for identical assets or liabilities; |
| • | Level 2 – Inputs other than quoted prices included within Level 1 that are observable for the asset or liability either directly or indirectly, including quoted prices for similar assets or liabilities in active markets, quoted prices for identical or similar assets or liabilities in markets that are not considered to be active, inputs other than quoted prices that are observable for the |
15
Table of Contents
State Street Institutional Investment Trust
State Street Clarion Global Real Estate Income Fund
Notes to Financial Statements — (continued)
December 31, 2015
asset or liability (such as exchange rates, financing terms, interest rates, yield curves, volatilities, prepayment speeds, loss severities, credit risks and default rates) or other market– corroborated inputs; and |
| • | Level 3 – Unobservable inputs for the asset or liability, including the Committee’s assumptions used in determining the fair value of investments. |
Changes in valuation techniques may result in transfers in or out of an assigned level within the fair value hierarchy. Transfers between different levels of the fair value hierarchy are recognized at the end of the reporting period. The Fund had no transfers between levels for the year ended December 31, 2015.
The following table summarizes the value of the Fund’s investments according to the fair value hierarchy as of December 31, 2015.
| Description | Level 1 – Quoted Prices | Level 2 – Other Significant Observable Inputs | Level 3 – Significant Unobservable Inputs | Total | ||||||||||||
INVESTMENTS: | ||||||||||||||||
Common Stocks | $ | 3,471,186 | $ | 1,563,097 | $ | – | $ | 5,034,283 | ||||||||
Short-Term Investment | 49,258 | – | – | 49,258 | ||||||||||||
|
|
|
|
|
|
|
| |||||||||
TOTAL INVESTMENTS | $ | 3,520,444 | $ | 1,563,097 | $ | – | $ | 5,083,541 | ||||||||
|
|
|
|
|
|
|
| |||||||||
Investment Transactions and Income Recognition
Investment transactions are accounted for on the trade date for financial reporting purposes. Dividend income and capital gain distributions, if any, are recognized daily on the ex-dividend date, net of foreign taxes withheld at source, if any. Non-cash dividends received in the form of stock, if any, are received as dividend income at fair value. Distributions received by the Fund may include a return of capital that is estimated by management. Such amounts are recorded as a reduction of the cost of investments or reclassified to capital gains. The Fund may invest in Real Estate Investment Trusts (REITs). REITs determine the tax characterization of their distributions annually and may characterize a portion of their distributions as income, return of capital or capital gain. The Fund’s policy is to record all REIT distributions initially as dividend income and re-designate to return of capital or capital gain distributions at year end based on information provided by the REITs and management’s estimates of such re-designations for which actual information has not been reported. Realized gains and losses from the sale or disposition of investments and foreign exchange transactions are determined using the identified cost method.
Expenses
Advisory fees and other expenses, which are directly identifiable to a specific fund, are applied to that fund within the Trust. Trustees’ fees and other expenses which can not be attributed to a specific fund are allocated in such a manner as deemed equitable, taking into consideration the nature and type of expense and the relative net assets of the funds. Class specific fees and expenses are borne by each class.
16
Table of Contents
State Street Institutional Investment Trust
State Street Clarion Global Real Estate Income Fund
Notes to Financial Statements — (continued)
December 31, 2015
Foreign Currency Translation
The accounting records of the Fund are maintained in U.S. dollars. Foreign currencies as well as investment securities and other assets and liabilities denominated in a foreign currency are translated to U.S. dollars using exchange rates deemed appropriate pursuant to the valuation policy and procedures at period end. Purchases and sales of securities, income receipts and expense payments are translated into U.S. dollars at the prevailing exchange rate on the respective dates of transactions. The Fund does not isolate the effect of fluctuations in foreign exchange from the effect of fluctuations in the market price of securities. Such fluctuations are reflected by the Fund as a component of realized and unrealized gains and losses from investments for financial reporting purposes.
Foreign Taxes
The Fund may be subject to foreign taxes (a portion of which may be reclaimable) on income, stock dividends, capital gains on investments or certain foreign currency transactions. All foreign taxes are recorded in accordance with applicable foreign tax regulations and rates that exist in the foreign jurisdictions in which the Fund invests. These foreign taxes, if any, are paid by the Fund and are reflected in the Statement of Operations, if applicable.
Foreign taxes payable or deferred as of December 31, 2015, if any, are disclosed in the Fund’s Statement of Assets and Liabilities.
Distributions
Dividends from net investment income are declared and paid quarterly. Net realized capital gains, if any, are distributed annually, unless additional distributions are required for compliance with applicable tax regulations. The amount and character of income and gains to be distributed are determined in accordance with federal tax regulations which may differ from net investment income and realized gains recognized for U.S. GAAP purposes.
Federal Income Tax
The Fund has qualified and intends to continue to qualify for and elect treatment as a “regulated investment company” under Subchapter M of the Internal Revenue Code of 1986, as amended. By so qualifying and electing, the Fund will not be subject to federal income taxes to the extent it distributes its taxable income, including any net realized capital gains, for each fiscal year. In addition, by distributing during each calendar year substantially all of its net investment income and capital gains, if any, the Fund will not be subject to federal excise tax. Income and capital gain distributions, if any, are determined in accordance with income tax regulation which may differ from U.S. GAAP. These book-tax differences are primarily due to differing treatments for foreign currency, passive foreign investment companies and return of capital distributions.
Additionally, based on the SSGA Funds Management, Inc. (the “Adviser” or “SSGA FM”) understanding of the tax rules and rates related to income, gains and transactions for the foreign jurisdictions in which the Fund invests, the Fund will provide for foreign taxes and, where appropriate, deferred foreign taxes.
17
Table of Contents
State Street Institutional Investment Trust
State Street Clarion Global Real Estate Income Fund
Notes to Financial Statements — (continued)
December 31, 2015
SSGA FM has reviewed the Fund’s tax positions for the open tax years as of December 31, 2015, and has determined that no provision for income tax is required in the Fund’s financial statements. The Fund’s federal tax returns for the prior fiscal year, as applicable, remains subject to examination by the Fund’s major tax jurisdictions, which include the United States of America and the Commonwealth of Massachusetts. The Fund recognizes interest and penalties, if any, related to tax liabilities as income tax expense in the Statement of Operations. No income tax returns are currently under examination. Management has analyzed tax laws and regulations and their applications to the Fund’s facts and circumstances and does not believe there are any uncertain tax positions that require recognition of a tax liability.
As of December 31, 2015, the Fund had no capital loss carryforwards.
For the year ended December 31, 2015, permanent differences identified and reclassified among the components of net assets were as follows:
| Paid-In Capital | Accumulated Gain (Loss) | Undistributed Net Investment Income (Loss) | ||
$(7,730) | $(27,728) | $35,458 |
These differences were primarily attributable to distribution redesignations. Net investment income (loss), net realized gains (losses), and net assets were not affected by this reclassification.
The tax character of distributions paid to shareholders during the year ended December 31, 2015, was as follows:
| Ordinary Income | Long-Term Capital Gain | Tax Return of Capital | Total | |||
$224,930 | $21,190 | 7,730 | $253,850 |
The tax character of distributions paid to shareholders during the period ended December 31, 2014, was as follows:
| Ordinary Income | Long-Term Capital Gain | Tax Return of Capital | Total | |||
$57,400 | $450 | $– | $57,850 |
At December 31, 2015, the components of distributable earnings on a tax basis were as follows:
Post October | Unrealized | Total | ||
$(18,411) | $77,559 | $59,148 |
At December 31, 2015, gross unrealized appreciation and gross unrealized depreciation of investments based on cost for federal income tax purpose were as follows:
| Tax Cost | Gross Appreciation | Gross Unrealized Depreciation | Net Unrealized Appreciation (Depreciation) | |||
$5,005,914 | $254,929 | $(177,302) | $77,627 |
18
Table of Contents
State Street Institutional Investment Trust
State Street Clarion Global Real Estate Income Fund
Notes to Financial Statements — (continued)
December 31, 2015
| 3. | Investment Transactions |
Purchases and sales of investments (excluding short-term securities) for the year ended December 31, 2015 were $4,856,886 and $4,964,219, respectively.
| 4. | Fees and Compensation paid to Affiliates and other Related Party Transactions |
The Trust, on behalf of the Fund, has entered into an Investment Advisory Agreement with SSGA FM. For its advisory services, the Fund pays the Adviser a management fee at an annual rate of 0.85% of its average daily net assets.
The Adviser has entered into a sub-advisory agreement with the CBRE Clarion Securities LLC (the “Sub-Adviser”) pursuant to which the Sub-Adviser will be responsible for the day-to-day management of any assets of the Fund. The Sub-Adviser receives fees from the Adviser for its services provided to the Fund.
The Adviser is contractually obligated until April 30, 2016, to waive its management fee and/or to reimburse the Fund for expenses to the extent that total expenses (exclusive of non-recurring account fees, extraordinary expenses, acquired fund fees and expenses, and distribution, shareholder servicing, and sub- transfer agency fees) exceed 1.05% of average daily net assets on an annual basis. This waiver and/or reimbursement may not be terminated prior to April 30, 2016 except with the approval of the Board. Fees waived and expenses reimbursed by SSGA FM are shown on the Statement of Operations.
Effective June 1, 2015, SSGA FM serves as administrator and State Street Bank and Trust Company (“State Street”) serves as sub-administrator and custodian. The Fund pays SSGA FM a fee at the annual rate of 0.05% of its average daily net assets. The fees are accrued daily and paid monthly. State Street receives fees for its services as custodian and sub-administrator.
Prior to June 1, 2015, State Street served as administrator of the Fund. For it services as the administrator and custodian, the Fund paid State Street an annual fee. The fee was accrued daily and payable monthly, and was calculated as the greater of an asset-based fee or a minimum fee. The minimum fee was calculated by multiplying the minimum per fund fee by the number of funds in the State Street Master Funds Trust plus the number of stand-alone funds in the State Street Institutional Investment Trust to arrive at the total minimum fee. The asset-based fee was calculated at the following rates:
| Asset Levels | Annual percentage of average aggregate monthly net assets | |
First $400 million | 0.03% | |
Next $15 billion | 0.02% | |
Thereafter | 0.01% | |
Minimum annual fee per Portfolio | $150,000 |
Boston Financial Data Services (“BFDS”), a joint venture of DST Systems, Inc. and State Street Corporation, serves as transfer agent and dividend disbursing agent to the Fund. For these services, the Fund pays annual account services fees, activity-based fees, charges related to compliance and regulatory services.
19
Table of Contents
State Street Institutional Investment Trust
State Street Clarion Global Real Estate Income Fund
Notes to Financial Statements — (continued)
December 31, 2015
State Street Global Markets LLC (“SSGM” or the “Distributor”) serves as the distributor of the Fund. SSGM is a wholly owned subsidiary of State Street Corporation. The Fund has adopted a distribution plan pursuant to Rule 12b-1 under the 1940 Act under which the Fund may compensate the Distributor (or others) for services in connection with the distribution of the Fund’s Class A shares and for services provided to Fund shareholders in that class (the “Plan”). The Plan calls for payments at an annual rate (based on average daily net assets) of 0.25% of the Fund’s net assets attributable to its Class A shares. Because these fees are paid out of the assets of the Fund attributable to its Class A shares on an ongoing basis, they will increase the cost of the shareholders’ investment and may cost the shareholders more over time than paying other types of sales charges. In addition to payments under the Plan, the Fund may reimburse SSGM or its affiliates for payments it makes to financial intermediaries that provide certain administrative, recordkeeping, and account maintenance services. The amount of the reimbursement and the manner in which it is calculated are reviewed by the Trustees periodically.
The Fund also pays a sub-transfer agent fee at an annual rate of up to 0.20% of average daily net assets attributable to Class A and I for recordkeeping, shareholder servicing, or administrative services provided by financial intermediaries.
Transactions with Affiliates
Certain investments made by the Fund were securities affiliated with SSGA FM. The Fund invested in the State Street Institutional Liquid Reserves Fund. Transactions in affiliates for the year ending December 31, 2015, were as follows:
Security Description | Number of shares held at 12/31/14 | Shares ended | Shares ended | Number of shares held at 12/31/15 | Value at | Income ended | ||||||||||||||||||
State Street Institutional Liquid Reserves Fund, Premier Class | 35,023 | 986,226 | 971,991 | 49,258 | $ | 49,258 | $ | 44 | ||||||||||||||||
| 5. | Trustees’ Fees |
Independent Trustees are compensated on a calendar year basis. Any Trustee who is deemed to be an “interested person” (as defined in the 1940 Act) of the Fund does not receive compensation from the Fund for his or her service as a Trustee.
Each Independent Trustee receives for his or her services to the State Street Master Funds, State Street Institutional Investment Trust and SSGA Funds, a $141,500 annual base retainer in addition to $18,000 for each in-person meeting and $2,000 for each telephonic meeting from the Trusts. The Co-Chairmen each receive an additional $44,000 annual retainer. The Independent Trustees are reimbursed for travel and other out-of-pocket expenses in connection with meeting attendance. Trustees’ fees and expenses are allocated among the Trusts and Funds overseen by the Trustees in a manner deemed equitable taking into consideration the relative net assets of the Funds, subject to a $15,000 minimum per Fund. As of the date of these financial statements, the Trustees were not paid pension or retirement benefits as part of the Trust’s expenses.
20
Table of Contents
State Street Institutional Investment Trust
State Street Clarion Global Real Estate Income Fund
Notes to Financial Statements — (continued)
December 31, 2015
The Trust’s officers are compensated by the Adviser and its affiliates.
| 6. | Concentration Risk |
The Fund’s assets may be concentrated in a particular state or geographic area, or in a particular industry, group of industries or sector. Because the Fund will generally concentrate its investments to approximately the same extent that its index is so concentrated, a Fund may be adversely affected by the performance of investments of a particular state or geographic area, or in a particular industry, group of industries or sector, and its shares may be subject to increased price volatility. In addition, if the Fund concentrates in a single industry, group of industries or type of instrument, it may be more susceptible to any single economic, market, political or regulatory occurrence affecting that industry, group of industries or type of instrument.
| 7. | Foreign Investment Risks |
Investing in securities of foreign companies and foreign governments involves special risks and considerations not typically associated with investing in U.S. companies and securities of the U.S. government. These risks include revaluation of currencies and the risk of expropriation. Moreover, the markets for securities of many foreign companies and foreign governments may be less liquid and the prices of such securities may be more volatile than those of comparable U.S. companies and the U.S. government.
| 8. | Concentration of Ownership |
From time to time, the Fund may have a concentration of one or more accounts constituting a significant percentage of shares outstanding. Investment activities by holders of such accounts could have material impacts on the Fund. As of December 31, 2015, based on management’s evaluation of the shareholder account base, the Fund had accounts representing controlling ownership of more than 10% of the Fund’s total outstanding shares. The number of such accounts, based on accounts that represent more than 10% of an individual class of shares, and the aggregate percentage of net assets represented by such holdings were as follows:
| Fund | Number of 10% Affiliated Account Holders | Percentage of Affiliated Ownership | ||||||
State Street Clarion Global Real Estate Income Fund | 1 | 100 | % | |||||
| 9. | Line of Credit |
Effective October 15, 2015, certain funds and other affiliated funds (each a “Participant” and, collectively, the “Participants”) share in a $360 million revolving credit facility provided by a syndication of banks. The Participants may borrow for the purpose of meeting shareholder redemption requests that otherwise might require the untimely disposition of securities. The Participants are charged an annual commitment fee which is calculated based on the unused portion of the shared credit line. Commitment fees are allocated among each of the Participants based on relative net assets. Commitment fees are ordinary fund operating expenses and are paid by the Adviser. A Participant incurs and pays the
21
Table of Contents
State Street Institutional Investment Trust
State Street Clarion Global Real Estate Income Fund
Notes to Financial Statements — (continued)
December 31, 2015
interest expense related to its borrowing. Interest is calculated at a rate per annum equal to the sum of the New York Fed Bank Rate plus 1%. A Participant may borrow up to a maximum of 33% of its assets or a lower amount as may be set forth in the Fund’s prospectus.
The Fund had no outstanding loans during the year ended December 31, 2015.
| 10. | Subsequent Events |
Management has evaluated the impact of all subsequent events on the Fund through the date the financial statements were available to be issued and has determined that there were no subsequent events requiring adjustment or disclosure in the financial statements.
22
Table of Contents
Report of Independent Registered Public Accounting Firm
To the Board of Trustees and Shareholders of State Street Institutional Investment Trust:
We have audited the accompanying statement of assets and liabilities, including the schedule of investments, of State Street Clarion Global Real Estate Income Fund (one of the funds constituting State Street Institutional Investment Trust) (the “Fund”) as of December 31, 2015, and the related statement of operations for the year then ended and the statement of changes in net assets and the financial highlights for each of the periods indicated therein. These financial statements and financial highlights are the responsibility of the Fund’s management. Our responsibility is to express an opinion on these financial statements and financial highlights based on our audits.
We conducted our audits in accordance with the standards of the Public Company Accounting Oversight Board (United States). Those standards require that we plan and perform the audit to obtain reasonable assurance about whether the financial statements and financial highlights are free of material misstatement. We were not engaged to perform an audit of the Fund’s internal control over financial reporting. Our audit included consideration of internal control over financial reporting as a basis for designing audit procedures that are appropriate in the circumstances, but not for the purpose of expressing an opinion on the effectiveness of the Fund’s internal control over financial reporting. Accordingly, we express no such opinion. An audit also includes examining, on a test basis, evidence supporting the amounts and disclosures in the financial statements and financial highlights, assessing the accounting principles used and significant estimates made by management, and evaluating the overall financial statement presentation. Our procedures included confirmation of securities owned as of December 31, 2015, by correspondence with the custodian and others or by other appropriate auditing procedures where replies from others were not received. We believe that our audits provide a reasonable basis for our opinion.
In our opinion, the financial statements and financial highlights referred to above present fairly, in all material respects, the financial position of State Street Clarion Global Real Estate Income Fund (one of the funds constituting State Street Institutional Investment Trust) at December 31, 2015, the results of its operations for the year then ended and the changes in its net assets and the financial highlights for each of the periods indicated therein, in conformity with U.S. generally accepted accounting principles.

Boston, Massachusetts
February 26, 2016
23
Table of Contents
State Street Institutional Investment Trust
State Street Clarion Global Real Estate Income Fund
December 31, 2015 (Unaudited)
Shareholder Expense Example
As a shareholder of the Fund, you incur ongoing costs, which include costs for administrative services and to the extent applicable, distribution (12b-1) fees, among others. This example is intended to help you understand your ongoing costs (in dollars) of investing in the Fund and to compare these costs with the ongoing costs of investing in other mutual funds. It is based on an investment of $1,000 made at the beginning of the period shown and held for the six months ended from July 1, 2015 to December 31, 2015.
| • | Actual Expenses – This section helps you to estimate the actual expenses that you paid over the period. The “Ending Account Value” shown is derived from the Fund’s actual return, and the third column shows the dollar amount that would have been paid by an investor who started with $1,000 in the Fund. You may use the information here, together with the amount you invested, to estimate the expenses that you paid over the period. To do so, simply divide your account value by $1,000 (for example, an $8,600 account value divided by $1,000 = 8.6), then multiply the result by the number given for the Fund under the heading “Expenses Paid During Period”. |
| • | Hypothetical Example for Comparison Purposes – This section is intended to help you compare your Fund’s costs with those of other mutual funds. It assumes that the Fund had a yearly return of 5% before expenses, but that the expense ratio is unchanged. In this case, because the return used is not the Fund’s actual return, the results do not apply to your investment. The example is useful in making comparisons because the U.S. Securities and Exchange Commission requires all mutual funds to calculate expenses based on a 5% return. You can assess your Fund’s costs by comparing this hypothetical example with the hypothetical examples that appear in shareholder reports of other funds. |
Six Months Ended December 31, 2015
Beginning Account Value July 1, 2015 | Ending Account Value December 31, 2015 | Expenses Paid During Period* | ||||||||||
Based on Actual Class Return | ||||||||||||
Class A | $ | 1,000.00 | $ | 1,053.47 | $ | 6.73 | ||||||
Class I | $ | 1,000.00 | $ | 1,054.82 | $ | 5.44 | ||||||
Based on Hypothetical (5% return before expenses) | ||||||||||||
Class A | $ | 1,000.00 | $ | 1,018.65 | $ | 6.61 | ||||||
Class I | $ | 1,000.00 | $ | 1,019.91 | $ | 5.35 | ||||||
| * | The calculations are based on expenses incurred in the most recent fiscal period of each Class. The Class A Shares and Class I Shares annualized expense ratios for the six months ended December 31, 2015 were 1.30% and 1.05%, respectively. The dollar amounts shown as “Expenses Paid” are equal to the annualized expense ratio multiplied by the average account value over the period, multiplied by 184/365 (the most recent six month period). |
24
Table of Contents
State Street Institutional Investment Trust
State Street Clarion Global Real Estate Income Fund
Other Information — (continued)
December 31, 2015 (Unaudited)
Tax Information
Dividend Received Deduction
For federal income tax purposes, the following information is furnished with respect to the distributions of the Trust for its fiscal period ended December 31, 2015.
Percentage of distributions which qualify for the corporate dividends received deduction:
| Fund | Percentage | |
State Street Clarion Global Real Estate Income Fund | 0.00% |
Qualified Dividend Income
A portion of dividends distributed by the Funds during the fiscal period ended December 31, 2015, are considered qualified dividend income, and are eligible for reduced tax rates. These lower rates range from 5% to 20% depending on the individual’s tax bracket. These amounts are noted below:
| Fund | Amount | |
State Street Clarion Global Real Estate Income Fund | $43,303 |
Long Term Capital Gains
Long term capital gains dividends were paid from the following Funds during the year ended December 31, 2015:
| Fund | Amount | |
State Street Clarion Global Real Estate Income Fund | $21,190 |
General Tax Disclosure
Form 1099-DIV mailed to you in January 2016 will show the tax status of all distributions paid to your account in calendar year 2015.
Please consult a tax adviser for questions about federal or state income tax laws.
25
Table of Contents
State Street Institutional Investment Trust
State Street Clarion Global Real Estate Income Fund
Shareholder Requests for Additional Information
December 31, 2015 (Unaudited)
Proxy Voting Policies and Procedures and Record
Information regarding the Fund’s proxy voting policies and procedures, as well as information regarding how the Fund voted proxies, if any, during the most recent 12-month period ended June 30 is available without charge (1) by calling 1-877-521-4083 (toll free), or (2) on the website of the Securities and Exchange Commission (“SEC”) at www.sec.gov.
Quarterly Portfolio Schedule
The Fund files a complete schedule of investments with the SEC for the first and third quarters of each fiscal year on Form N-Q. The Fund’s Forms N-Q are available on the SEC’s website at www.sec.gov and may be reviewed and copied at the SEC’s Public Reference Room in Washington, DC. Information on the operation of the Public Reference Room may be obtained by calling 1-800-SEC-0330. The information on Form N-Q is available upon request, without charge, by calling 1-877-521-4083 (toll-free).
26
Table of Contents
State Street Institutional Investment Trust
State Street Clarion Global Real Estate Income Fund
Disclosure of Information about Fund Trustees and Officers
December 31, 2015 (Unaudited)
Name, Address, | Position(s) Held | Term of Office | Principal Occupation and Relevant Experience | Number of Funds in Fund Complex Overseen by Trustee | Other Directorships | |||||
Independent Trustees | ||||||||||
Michael F. Holland State Street Bank and 100 Huntington Avenue, CPH 0326 Boston, MA 02116 YOB: 1944 | Trustee and Co-Chairman of the Board | Term: Indefinite Elected: 7/99 | Chairman, Holland & Company L.L.C. (investment adviser) (1995 – present). | 75 | Director, the Holland Series Fund, Inc.; Director, The China Fund, Inc.; Director, The Taiwan Fund, Inc.; Director, Reaves Utility Income Fund, Inc.; and Director, Blackstone/GSO Loan Funds. | |||||
Patrick J. Riley State Street Bank and 100 Huntington Avenue, CPH 0326 Boston, MA 02116 YOB: 1948 | Trustee and Co-Chairman of the Board | Term: Indefinite Elected: 1/14 | 2002 to May 2010, Associate Justice of the Superior Court, Commonwealth of Massachusetts; 1985 to 2002, Partner, Riley, Burke & Donahue, L.L.P. (law firm); 1998 to Present, Independent Director, State Street Global Advisers Ireland, Ltd. (investment company); 1998 to Present, Independent Director, SSgA Liquidity plc (formerly, SSgA Cash Management Fund plc); January 2009 to Present, Independent Director, SSGA Fixed Income plc; and January 2009 to Present, Independent Director, SSGA Qualified Funds PLC. | 75 | Board Director and Chairman, SPDR Europe 1PLC Board (2011 – Present); Board Director and Chairman, SPDR Europe II, PLC (2013 – Present). | |||||
William L. Boyan State Street Bank and 100 Huntington Avenue, CPH 0326 Boston, MA 02116 YOB: 1937 | Trustee and Co-Chairman of the Valuation Committee | Term: Indefinite Elected: 7/99 | President and Chief Operations Officer, John Hancock Financial Services (1959 – 1999). Mr. Boyan retired in 1999. Chairman Emeritus, Children’s Hospital, Boston, MA (1984 – 2011); Former Trustee of Old Mutual South Africa Master Trust (investments) (1995 – 2008); Former Chairman, Boston Plan For Excellence, Boston Public Schools (1995 – 2010); Member of Advisory Board of Florida Atlantic University Lifelong Learning Society. | 75 | Former Trustee of Old Mutual South Africa Master Trust. | |||||
William L. Marshall State Street Bank and 100 Huntington Avenue, CPH 0326 Boston, MA 02116 YOB: 1942 | Trustee and Co-Chairman of the Audit Committee | Term: Indefinite Elected: 1/14 | April 2011 to Present, Chairman (until April 2011, Chief Executive Officer and President), Wm. L. Marshall Associates, Inc., Wm. L. Marshall Companies, Inc. and the Marshall Financial Group, Inc. (a registered investment adviser and provider of financial and related consulting services); Certified Financial Planner; Member, Financial Planners Association; 2015 to present, Board Member, The Doylestown Health Foundation Board. | 75 | Marshall Financial Group, Inc. | |||||
27
Table of Contents
State Street Institutional Investment Trust
State Street Clarion Global Real Estate Income Fund
Disclosure of Information about Fund Trustees and Officers — (continued)
December 31, 2015 (Unaudited)
Name, Address, | Position(s) Held | Term of Office | Principal Occupation and Relevant Experience | Number of Funds in Fund Complex Overseen by Trustee | Other Directorships | |||||
Independent Trustees (continued) | ||||||||||
Richard D. Shirk State Street Bank and 100 Huntington Avenue, CPH 0326 Boston, MA 02116 YOB: 1945 | Trustee and Co-Chairman of the Qualified Legal and Compliance Committee | Term: Indefinite Elected: 1/14 | March 2001 to April 2002, Chairman (1996 to March 2001, President and Chief Executive Officer), Cerulean Companies, Inc. (holding company) (Retired); 1992 to March 2001, President and Chief Executive Officer, Blue Cross Blue Shield of Georgia (health insurer, managed healthcare); 1998 to December 2008, Chairman, Board Member and December 2008 to Present, Investment Committee Member, Healthcare Georgia Foundation (private foundation); September 2002 to 2012, Lead Director and Board Member, Amerigroup Corp. (managed health care); 1999 to 2013, Board Member and (since 2001) Investment Committee Member, Woodruff Arts Center; and 2003 to 2009, Trustee, Gettysburg College. | 75 | Board member, AeroCare Holdings (privately held healthcare services company) (February 2003 – Present); Board member, Regenesis Biomedical (health care services) (April 2012 – Present); Chairman (January 2014 – Present). | |||||
Rina K. Spence State Street Bank and 100 Huntington Avenue, CPH 0326 Boston, MA 02116 YOB: 1948 | Trustee and Co-Chairman of the Qualified Legal and Compliance Committee and Co-Chairman of the Governance Committee | Term: Indefinite Elected: 7/99 | President of SpenceCare International LLC (international healthcare consulting) (1999 – present); Chief Executive Officer, IEmily.com (health internet company) (2000 – 2001); Chief Executive Officer of Consensus Pharmaceutical, Inc. (1998 – 1999); Founder, President and Chief Executive Officer of Spence Center for Women’s Health (1994 – 1998); President and CEO Emerson Hospital (1984 – 1994); Trustee, Eastern Enterprise (utilities) (1988 – 2000); Director, Berkshire Life Insurance Company of America (1993 – 2009); Honorary Consul for Monaco in Boston (2015 – present). | 75 | ||||||
28
Table of Contents
State Street Institutional Investment Trust
State Street Clarion Global Real Estate Income Fund
Disclosure of Information about Fund Trustees and Officers — (continued)
December 31, 2015 (Unaudited)
Name, Address, | Position(s) Held | Term of Office | Principal Occupation and Relevant Experience | Number of Funds in Fund Complex Overseen by Trustee | Other Directorships | |||||
Independent Trustees (continued) | ||||||||||
Bruce D. Taber State Street Bank and 100 Huntington Avenue, CPH 0326 Boston, MA 02116 YOB: 1943 | Trustee and Co-Chairman of the Valuation Committee and Co-Chairman of the Governance Committee | Term: Indefinite Elected: 1/14 | 1999 to Present, Partner, Zenergy LLC (a technology company providing Computer Modeling and System Analysis to the General Electric Power Generation Division); Until December 2008, Independent Director, SSGA Cash Management Fund plc; Until December 2008, Independent Director, State Street Global Advisers Ireland, Ltd. (investment companies); and Until August 1994, President, Alonzo B. Reed, Inc., (a Boston architect-engineering firm). | 75 | ||||||
Douglas T. Williams State Street Bank and 100 Huntington Avenue, CPH 0326 Boston, MA 02116 YOB: 1940 | Trustee and Co-Chairman of the Audit Committee | Term: Indefinite Elected: 7/99 | President, Oakmont Homeowners Association; President, Mariner Sands Chapel; Executive Vice President and member of Executive Committee, Chase Manhattan Bank (1987 – 1999); President, Boston Stock Exchange Depository Trust Company, 1981 – 1982; Treasurer, Nantucket Educational Trust, (2002 – 2007). | 75 | ||||||
Interested Trustee(1) | ||||||||||
James E. Ross SSGA Funds Management, Inc. State Street Financial Center One Lincoln Street Boston, MA 02111 YOB: 1965 | Trustee | Term: Indefinite Elected Trustee: 2/07 | Chairman and Director, SSGA Funds Management, Inc. (2012 – present); President, SSGA Funds Management, Inc. (2005 – 2012); Executive Vice President and Senior Managing Director, State Street Global Advisors (2006 – present); and Principal, State Street Global Advisors (2006 – present). | 290 | Trustee, SPDR Series Trust; Trustee, SPDR Index Shares Funds; Trustee, Select Sector SPDR Trust; Trustee, SSGA Active Trust; and Trustee, SSGA Master Trust. | |||||
| (1) | Mr. Ross is an Interested Trustee because of his employment by SSGA Funds Management, Inc., an affiliate of the Trust. |
Name, Address, | Position(s) Held | Term of Office | Principal Occupation | |||
Officers: | ||||||
Ellen M. Needham SSGA Funds Management, Inc. State Street Financial Center One Lincoln Street Boston, MA 02111 YOB: 1967 | President | Term: Indefinite Elected: 10/12 | President and Director, SSGA Funds Management, Inc. (June 2012 – present); Chief Operating Officer, SSGA Funds Management, Inc. (May 2010 – June 2012); Senior Managing Director, SSGA Funds Management, Inc. (1992 – 2012) and Senior Managing Director, State Street Global Advisors (1992 – present).* |
29
Table of Contents
State Street Institutional Investment Trust
State Street Clarion Global Real Estate Income Fund
Disclosure of Information about Fund Trustees and Officers — (continued)
December 31, 2015 (Unaudited)
Name, Address, | Position(s) Held | Term of Office | Principal Occupation | |||
Officers: (continued) | ||||||
Bruce S. Rosenberg SSGA Funds Management, Inc. State Street Financial Center One Lincoln Street Boston, MA 02111 YOB: 1961 | Treasurer | Term: Indefinite Elected: 2/16 | Managing Director, State Street Global Advisors and SSGA Funds Management, Inc. (July 2015 – present); Director, Credit Suisse (April 2008 – July 2015). | |||
Ann M. Carpenter SSGA Funds Management, Inc. State Street Financial Center One Lincoln Street Boston, MA 02111 YOB: 1966 | Vice President Deputy Treasurer | Term: Indefinite Elected: 10/12 Term: Indefinite Elected: 2/16 | Chief Operating Officer, SSGA Funds Management, Inc. (April 2014 – present); Vice President, SSGA Funds Management, Inc. (2008 – present); Principal, State Street Global Advisors and SSGA Funds Management, Inc. (2005 – present).* | |||
Chad C. Hallett SSGA Funds Management, Inc. State Street Financial Center One Lincoln Street Boston, MA 02111 YOB: 1969 | Deputy Treasurer | Term: Indefinite Elected: 2/16 | Vice President, State Street Global Advisors and SSGA Funds Management, Inc. (November 2014 – present); Vice President, State Street Bank and Trust Company (2001 – November 2014).* | |||
Sujata Upreti SSGA Funds Management, Inc. State Street Financial Center One Lincoln Street Boston, MA 02111 YOB: 1974 | Assistant Treasurer | Term: Indefinite Elected: 2/16 | Vice President, State Street Global Advisors and SSGA Funds Management, Inc. (May 2015 – present); Assistant Director, Cambridge Associates, LLC (July 2014 – January 2015); Vice President, Bank of New York Mellon (July 2012 – August 2013); Manager, PricewaterhouseCoopers, LLP (September 2009 – July 2012). | |||
Daniel Foley SSGA Funds Management, Inc. State Street Financial Center One Lincoln Street Boston, MA 02111 YOB: 1972 | Assistant Treasurer | Term: Indefinite Elected: 2/16 | Vice President, State Street Global Advisors and SSGA Funds Management, Inc. (April 2014 – present); Principal, State Street Global Advisors and SSGA Funds Management, Inc. (April 2007 – April 2014). | |||
Brian Harris SSGA Funds Management, Inc. State Street Financial Center One Lincoln Street Boston, MA 02111 YOB: 1973 | Chief Compliance Officer | Term: Indefinite Elected: 11/13 | Vice President, State Street Global Advisors and SSGA Funds Management, Inc.( June 2013 – Present); Senior Vice President and Global Head of Investment Compliance, BofA Global Capital Management (September 2010 to May 2013); Director of Compliance, AARP Financial Inc. (July 2008 to August 2010). | |||
Trevor Swanberg SSGA Funds Management, Inc. State Street Financial Center One Lincoln Street Boston, MA 02111 YOB: 1979 | Code of Ethics Compliance Officer | Term: Indefinite Elected: 8/15 | Vice President, State Street Global Advisors and SSGA Funds Management, Inc. (January 2015 – Present); Senior Manager-Mutual Fund Compliance, ICMA-Retirement Corporation (December 2011 – January 2015); Assistant Vice President, J.P. Morgan (September 2007 – December 2011). | |||
Joshua A. Weinberg SSGA Funds Management, Inc. State Street Financial Center One Lincoln Street Boston, MA 02111 YOB: 1978 | Chief Legal Officer | Term: Indefinite Elected: 2/15 | Vice President and Managing Counsel, State Street Global Advisors (2011 – present); Clerk, SSGA Funds Management, Inc. (2013 – present); Associate, Financial Services Group, Dechert LLP (2006 – 2011). |
30
Table of Contents
State Street Institutional Investment Trust
State Street Clarion Global Real Estate Income Fund
Disclosure of Information about Fund Trustees and Officers — (continued)
December 31, 2015 (Unaudited)
Name, Address, | Position(s) Held | Term of Office | Principal Occupation | |||
Officers: (continued) | ||||||
David K. James State Street Bank and Trust Company 100 Huntington Avenue, 3rd Floor Boston, MA 02116 YOB: 1970 | Secretary | Term: Indefinite Elected: 4/13 | Managing Director and Managing Counsel, State Street Bank and Trust Company (2009 – present); Vice President and Counsel, PNC Global Investment Servicing (US), Inc. (2006 – 2009). | |||
Kristin Schantz State Street Bank and Trust Company 100 Huntington Avenue, 3rd Floor Boston, MA 02116 YOB: 1979 | Assistant Secretary | Term: Indefinite Elected: 2/14 | Vice President and Counsel, State Street Bank and Trust Company (2013 – present); Vice President, Citi Fund Services Ohio, Inc. (2008 – 2013). |
| * | Served in various capacities and/or with various affiliated entities during noted time period. |
31
Table of Contents
Trustees
William L. Boyan
Michael F. Holland
William L. Marshall
Patrick J. Riley
James E. Ross
Richard D. Shirk
Rina K. Spence
Bruce D. Taber
Douglas T. Williams
Investment Adviser and Administrator
SSGA Funds Management, Inc.
State Street Financial Center
One Lincoln Street
Boston, MA 02111
Investment Sub-Adviser
CBRE Clarion Securities LLC
201 King of Prussia Road, Suite 600
Radnor, PA 19087
Custodian and Sub-Administrator
State Street Bank and Trust Company
State Street Financial Center
One Lincoln Street
Boston, MA 02111
Independent Registered Public Accounting Firm
Ernst & Young LLP
200 Clarendon Street
Boston, MA 02116
Legal Counsel
Ropes & Gray LLP
800 Boylston Street
Boston, MA 02199
Transfer Agent
Boston Financial Data Services
2000 Crown Colony Drive
Quincy, MA 02169
Distributor
State Street Global Markets LLC
State Street Financial Center
One Lincoln Street
Boston, MA 02111
This report is for shareholder information. This is not a prospectus intended for use in the purchase or sale of shares of beneficial interest.
State Street Institutional Investment Trust State Street Bank and Trust Company P.O. Box 5049 Boston, MA 02206 | IBG-18460 |
Table of Contents
Annual Report
31 December 2015
State Street Institutional Investment Trust
State Street Aggregate Bond Index Fund
State Street Global Equity ex-U.S. Index Fund
State Street Small/Mid Cap Equity Index Fund
State Street Aggregate Bond Index Portfolio
State Street Global Equity ex-U.S. Index Portfolio
State Street Small/Mid Cap Equity Index Portfolio

Table of Contents
State Street Institutional Investment Trust
Annual Report
December 31, 2015
State Street Aggregate Bond Index Fund | ||||
Management Discussion of Fund Performance | 1 | |||
Performance Summary | 3 | |||
State Street Global Equity ex-U.S. Index Fund | ||||
Management Discussion of Fund Performance | 4 | |||
Performance Summary | 5 | |||
| 6 | ||||
| 7 | ||||
| 8 | ||||
| 11 | ||||
| 14 | ||||
| 15 | ||||
| 29 | ||||
| 30 | ||||
| 50 | ||||
| 51 | ||||
| 73 | ||||
| 74 | ||||
| 75 | ||||
| 77 | ||||
| 78 | ||||
| 93 | ||||
| 94 | ||||
| 104 | ||||
Table of Contents
State Street Aggregate Bond Index Fund
MANAGEMENT DISCUSSION OF FUND PERFORMANCE
The State Street Aggregate Bond Index Fund (the “Fund”) normally invests substantially all of its investable assets in the State Street Aggregate Bond Index Portfolio (the “Portfolio”), which seeks to provide investment results that, before fees and expenses, correspond generally to the price and yield performance of an index, the Barclays U.S. Aggregate Index (the “Index”), that tracks the U.S. dollar denominated investment grade bond market over the long term. As a result, the Fund invests indirectly through the Portfolio.
For the 12-month period ended December 31, 2015 (the “Reporting Period”), the total return for Class K of the Fund was 0.54% and the total return for the Index was 0.55%. The Fund and Index returns reflect the reinvestment of dividends and other income. The Fund’s performance reflects the expenses of managing the Fund, including brokerage and advisory expenses. The Index is unmanaged, and Index returns do not reflect fees and expenses of any kind, which would have a negative impact on returns.
For the Reporting Period, the Fund underperformed the Index. The fees and expenses of managing the Fund contributed to the Fund’s underperformance in relation to the Index. Security sampling within the Fund aided the performance of the Fund relative to the Index over the Reporting Period.
Over the Reporting Period, markets generally witnessed strong support for safe-haven products such as U.S. Treasuries and securitized products and a rotation out of credit products such as high yield.
The Reporting Period brought on positive total returns for the broader U.S. fixed income market. The positive performance can be attributed to the Index’s exposure to U.S. securitized products (U.S. mortgage-backed securities (“MBS”), asset-backed securities (“ABS”) and commercial mortgage-backed securities (“CMBS”)) and U.S. Treasuries. Poor global economic data releases and continued low realized inflation weighed on markets culminating in negative front-end interest rates in Europe. Concerns abroad, mainly in Europe, added to the allure of U.S. bonds as the European Central Bank began to outline details of a bond purchasing, or quantitative easing (“QE”) plan which was officially implemented in March. By mid-2015, investors seemed relatively confident in the QE plan which spurred a large selloff in European bonds and spread to the U.S. At the same time, the threat of a Greek exit from the Eurozone loomed and slowing Chinese growth sparked a selloff in oil and commodities. Towards the end of the summer, investors began focusing on the U.S. Federal Reserve’s (the “Fed’s”) interest rate decision. The Fed held rates steady while signaling the prospect of a December tightening. As the market began to anticipate a December tightening, volatility fell and the yield curve flattened into the end of the Reporting Period.
The Reporting Period proved to be difficult for credit markets, as evidenced in the corporate sector’s negative annual total return and widening option-adjusted spread. Attractive yields and demand led to a record year for investment grade issuance. Swelling balance sheets had investors demanding higher yields as default risks rose and corporate profitability deteriorated. The Non-corporate component of the Index was negatively impacted by turmoil in Emerging Markets and the downgrade of Brazilian debt in September. The securitized component remained resilient, posting positive total returns for the Reporting Period. It was supported by demand for high quality spread products and the Fed’s continuing MBS repurchase program.
The Fund invested in Mortgages To-Be-Announced (“TBAs”) to gain exposure to the MBS portion of the Index during the Reporting Period. These investments neither significantly added nor detracted from Fund performance relative to the Index during the Reporting Period.
1
Table of Contents
State Street Aggregate Bond Index Fund
MANAGEMENT DISCUSSION OF FUND PERFORMANCE — (continued)
The views expressed above reflect those of the Fund’s portfolio manager only through the Reporting Period, and do not necessarily represent the views of the Adviser as a whole. Any such views are subject to change at any time based upon market or other conditions, and the Adviser disclaims any responsibility to update such views. These views may not be relied on as investment advice and, because investment decisions for a fund are based on numerous factors, may not be relied on as an indication of trading intent on behalf of any fund.
2
Table of Contents
State Street Aggregate Bond Index Fund
Class K
Performance Summary
Growth of a $10,000 Investment (a)
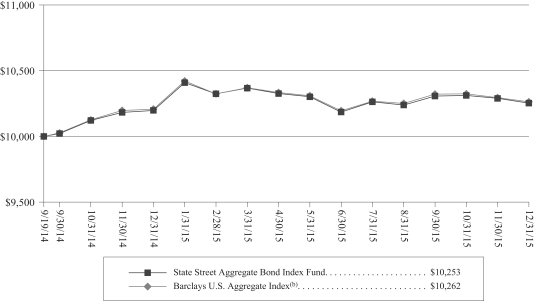
Investment Performance (a)
as of December 31, 2015
Total Return One Year Ended December 31, 2015 | Average Annual Total Return Inception to Date* | |||||||
State Street Aggregate Bond Index Fund Class A | 0.35 | % | 1.71 | % | ||||
State Street Aggregate Bond Index Fund Class I | 0.60 | % | 1.89 | % | ||||
State Street Aggregate Bond Index Fund Class K | 0.54 | % | 1.96 | % | ||||
Barclays U.S. Aggregate Index(b) | 0.55 | % | 2.04 | % | ||||
| * | Inception date is September 19, 2014. |
| (a) | Total returns and performance graph information represent past performance and are not indicative of future results, which may be lower or higher than performance data quoted. Investment return and principal value of an investment will fluctuate so that an investor’s share, when redeemed, may be worth more or less than its original cost. The graph and table above do not reflect the deduction of taxes that a shareholder would pay on fund distributions, sales, or the redemption of fund shares. |
| (b) | The Barclays U.S. Aggregate Index provides a measure of the performance of the U.S. dollar denominated investment grade bond market, which includes investment grade (must be Baa3/BBB- or higher using the middle rating of Moody’s Investor Service, Inc., Standard & Poor’s, and Fitch Inc.) |
3
Table of Contents
State Street Global Equity ex-U.S. Index Fund
MANAGEMENT DISCUSSION OF FUND PERFORMANCE
The State Street Global Equity ex-U.S. Index Fund (the “Fund”) normally invests substantially all of its investable assets in the State Street Global Equity ex-U.S. Index Portfolio (the Portfolio”), which seeks to provide investment results that, before fees and expenses, correspond generally to the total return performance of a broad-based index of world (ex-U.S.) equity markets over the long term. As a result, this Fund invests indirectly through the Portfolio.
For the 12-month period ended December 31, 2015 (the “Reporting Period”), the total return for Class K of the Fund was –5.94%, and the total return for the MSCI ACWI ex USA Index (the “Index”) was –5.66%. The Fund and Index returns reflect the reinvestment of dividends and other income. The Fund’s performance reflects the expenses of managing the Fund, including brokerage and advisory expenses. The Index is unmanaged, and Index returns do not reflect fees and expenses of any kind, which would have a negative impact on returns. The cumulative effect of small weight differences between the securities in the Fund and the Index, the Fund’s cash flows and fair value pricing contributed to the difference between the Fund’s performance and that of the Index.
The Fund underperformed the Index during the Reporting Period. The performance of the Fund and Index for the first half of the year was positive despite concerns about a global economic slowdown, disappointing macro data, Chinese Yuan devaluations and uncertainty around the direction the U.S. Federal Reserve (the “Fed”) would take on interest rates. The markets were also weighed down by Volkswagen’s emissions scandal, coordinated Islamic terrorist attacks across four countries and scrutiny by U.S. lawmakers regarding the pricing practices of drug makers. Positive factors like a Greek bailout plan, a nuclear deal with Iran and positive macro and earnings data could not offset the negative factors in the second half of the year. The second half of the year remained volatile with negative returns despite accommodative monetary policy (a Chinese interest rate cut, quantitative easing by the European Central Bank and a gradual pace of rate increases for the Fed). A combination of the negative factors helped push down the performance of both the Index and the Fund for the Reporting Period amid the plunge in oil prices and the terrorist attacks in Paris.
On an individual security level, the top positive contributors to the Fund’s performance were Novo Nordisk A/S (Class B), Tencent Holdings, Ltd., and Anheuser-Busch InBev SA. The top negative contributors to the Fund’s performance were Banco Santander SA, Royal Dutch Shell PLC (Class A), and Glencore PLC.
The views expressed above reflect those of the Fund’s portfolio manager only through the Reporting Period and do not necessarily represent the views of the Adviser as a whole. Any such views are subject to change at any time based upon market or other conditions, and the Adviser disclaims any responsibility to update such views. These views may not be relied on as investment advice and, because investment decisions for a fund are based on numerous factors, may not be relied on as an indication of trading intent on behalf of any fund.
4
Table of Contents
State Street Global Equity ex-U.S. Index Fund
Class K
Performance Summary
Growth of a $10,000 Investment (a)
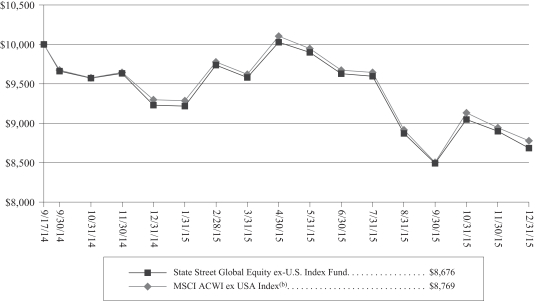
Investment Performance (a)
as of December 31, 2015
| Total Return One Year Ended December 31, 2015 | Average Annual Total Return | |||||||
State Street Global Equity ex-U.S. Index Fund Class A | -6.17 | % | -10.68 | % | ||||
State Street Global Equity ex-U.S. Index Fund Class I | -5.94 | % | -10.46 | % | ||||
State Street Global Equity ex-U.S. Index Fund Class K | -5.94 | % | -10.42 | % | ||||
MSCI ACWI ex USA Index(b) | -5.66 | % | -9.70 | % | ||||
| * | Inception date is September 17, 2014. |
| (a) | Total returns and performance graph information represent past performance and are not indicative of future results, which may be lower or higher than performance data quoted. Investment return and principal value of an investment will fluctuate so that an investor’s share, when redeemed, may be worth more or less than its original cost. The graph and table above do not reflect the deduction of taxes that a shareholder would pay on fund distributions, sales, or the redemption of fund shares. |
| (b) | The MSCI ACWI ex-USA Index is a float-adjusted market capitalization index that is designed to measure the combined equity market performance of developed and emerging market countries excluding the United States. |
5
Table of Contents
State Street Institutional Investment Trust
Statements of Assets and Liabilities
December 31, 2015
| State Street Aggregate Bond Index Fund | State Street Global Equity ex-U.S. Index Fund | State Street Small/Mid Cap Equity Index Fund | ||||||||||
Assets |
| |||||||||||
Investment in corresponding Portfolio, at value (Note 1)* | $ | 54,344,404 | $ | 57,296,961 | $ | 4,195,101 | ||||||
Cash | 15,057 | 13,337 | 7,116 | |||||||||
Receivable for fund shares sold | – | 4,180 | – | |||||||||
Receivable from Adviser (Note 4) | 29,221 | 50,289 | 401 | |||||||||
Prepaid Expenses | 3,129 | 3,122 | – | |||||||||
|
|
|
|
|
| |||||||
Total assets | 54,391,811 | 57,367,889 | 4,202,618 | |||||||||
|
|
|
|
|
| |||||||
Liabilities |
| |||||||||||
Payable for investments purchased | 9,337 | 11,806 | 1,456 | |||||||||
Advisory fees payable (Note 4) | 1,381 | 2,923 | 106 | |||||||||
Custodian fees payable (Note 4) | 1,806 | 1,769 | 3,091 | |||||||||
Professional fees payable | 19,559 | 19,568 | 14,226 | |||||||||
Registration and filing fees payable | 16,378 | 19,878 | 14,947 | |||||||||
Administration fees payable (Note 4) | 4,385 | 4,520 | 2,260 | |||||||||
Transfer agent fees payable | 1,900 | 1,898 | 630 | |||||||||
Sub-Transfer Agent fees payable (Note 4) | 975 | 54 | – | |||||||||
Distribution fees payable (Note 4) | 43 | 14 | 53 | |||||||||
Printing fees payable | 2,341 | 2,033 | 6,490 | |||||||||
Accrued expenses and other liabilities | 149 | 152 | 34,413 | |||||||||
|
|
|
|
|
| |||||||
Total liabilities | 58,254 | 64,615 | 77,672 | |||||||||
|
|
|
|
|
| |||||||
Net Assets | $ | 54,333,557 | $ | 57,303,274 | $ | 4,124,946 | ||||||
|
|
|
|
|
| |||||||
Net Assets Consist of: |
| |||||||||||
Paid-in capital | $ | 55,312,301 | $ | 65,173,529 | $ | 4,425,061 | ||||||
Undistributed (distributions in excess of) net investment income | – | 280 | – | |||||||||
Accumulated net realized gain (loss) | 93,921 | (30,975 | ) | 1,218 | ||||||||
Net unrealized appreciation (depreciation) on investments | (1,072,665 | ) | (7,839,560 | ) | (301,333 | ) | ||||||
|
|
|
|
|
| |||||||
Net Assets | $ | 54,333,557 | $ | 57,303,274 | $ | 4,124,946 | ||||||
|
|
|
|
|
| |||||||
Class A |
| |||||||||||
Net Assets | $ | 183,908 | $ | 42,267 | $ | 97,371 | ||||||
Shares of beneficial interest outstanding | 18,869 | 5,000 | 10,471 | |||||||||
|
|
|
|
|
| |||||||
Offering, net asset value, and redemption price per share | $ | 9.75 | $ | 8.45 | $ | 9.30 | ||||||
|
|
|
|
|
| |||||||
Maximum Sales Charge | 3.75 | % | 4.50 | % | 4.50 | % | ||||||
Maximum offering price per share | $ | 10.13 | $ | 8.85 | $ | 9.74 | ||||||
|
|
|
|
|
| |||||||
Class I |
| |||||||||||
Net Assets | $ | 4,508,280 | $ | 42,269 | $ | 97,372 | ||||||
Shares of beneficial interest outstanding | 462,709 | 5,000 | 10,471 | |||||||||
|
|
|
|
|
| |||||||
Offering, net asset value, and redemption price per share | $ | 9.74 | $ | 8.45 | $ | 9.30 | ||||||
|
|
|
|
|
| |||||||
Class K |
| |||||||||||
Net Assets | $ | 49,641,369 | $ | 57,218,738 | $ | 3,930,203 | ||||||
Shares of beneficial interest outstanding | 5,096,647 | 6,769,397 | 422,677 | |||||||||
|
|
|
|
|
| |||||||
Offering, net asset value, and redemption price per share | $ | 9.74 | $ | 8.45 | $ | 9.30 | ||||||
|
|
|
|
|
| |||||||
*Investment in corresponding Portfolio, at cost (Note 1) | 55,417,069 | 65,136,521 | 4,496,434 | |||||||||
|
|
|
|
|
| |||||||
See Notes to Financial Statements and Financial Statements of the corresponding Portfolios.
6
Table of Contents
State Street Institutional Investment Trust
Year Ended December 31, 2015
| State Street Aggregate Bond Index Fund | State Street Global Equity ex-U.S. Index Fund | State Street Small/Mid Cap Equity Index Fund* | ||||||||||
Income |
| |||||||||||
Dividend income from corresponding Portfolio (Note 2) | $ | 990,084 | $ | 1,206,997 | $ | 25,177 | ||||||
|
|
|
|
|
| |||||||
Expenses |
| |||||||||||
Advisory fees (Note 4) | 15,237 | 27,364 | 479 | |||||||||
Administration fees (Note 4) | 45,495 | 42,825 | 6,858 | |||||||||
Distribution fees (Note 4) | ||||||||||||
Class A | 185 | 116 | 53 | |||||||||
Registration and filing fees | 56,922 | 45,320 | 38,769 | |||||||||
Professional fees | 25,700 | 25,660 | 15,121 | |||||||||
Transfer agent fees (Note 4) | 53,176 | 55,764 | 8,055 | |||||||||
Printing fees | 12,829 | 10,158 | 7,999 | |||||||||
Insurance fees | 154 | 30 | – | |||||||||
|
|
|
|
|
| |||||||
Total expenses | 209,698 | 207,237 | 77,334 | |||||||||
|
|
|
|
|
| |||||||
Less: Expenses waived/reimbursed by the Adviser (Note 4) | (179,024 | ) | (178,231 | ) | (76,482 | ) | ||||||
|
|
|
|
|
| |||||||
Net expenses | 30,674 | 29,006 | 852 | |||||||||
|
|
|
|
|
| |||||||
Net Investment Income | 959,410 | 1,177,991 | 24,325 | |||||||||
|
|
|
|
|
| |||||||
Realized and Unrealized Gain (Loss) |
| |||||||||||
Net realized gain (loss) on: |
| |||||||||||
Investment in corresponding Portfolio | 773,958 | (31,679 | ) | (995 | ) | |||||||
Capital gain distributions from corresponding Portfolio | 615,929 | – | 5,520 | |||||||||
Change in net unrealized appreciation (depreciation) on: |
| |||||||||||
Investment in corresponding Portfolio | (1,696,466 | ) | (4,138,701 | ) | (301,333 | ) | ||||||
|
|
|
|
|
| |||||||
Total realized and unrealized loss | (306,579 | ) | (4,170,380 | ) | (296,808 | ) | ||||||
|
|
|
|
|
| |||||||
Net Increase (Decrease) in Net Assets Resulting from Operations | $ | 652,831 | $ | (2,992,389 | ) | $ | (272,483 | ) | ||||
|
|
|
|
|
| |||||||
| * | For the period from August 11, 2015 (inception date) to December 31, 2015. |
See Notes to Financial Statements and Financial Statements of the corresponding Portfolios.
7
Table of Contents
State Street Institutional Investment Trust
Statements of Changes in Net Assets
| State Street Aggregate Bond Index Fund | State Street Global Equity ex-U.S. Index Fund | |||||||||||||||
| For the Year Ended December 31, 2015 | For the Period 9/19/14* to 12/31/14 | For the Year Ended December 31, 2015 | For the Period 9/17/14* to 12/31/14 | |||||||||||||
Increase (Decrease) in Net Assets Resulting from: | ||||||||||||||||
Operations: | ||||||||||||||||
Net investment income | $ | 959,410 | $ | 229,993 | $ | 1,177,991 | $ | 241,527 | ||||||||
Net realized gain (loss) on investments | 1,389,887 | 155,412 | (31,679 | ) | (1,996 | ) | ||||||||||
Change in net unrealized appreciation (depreciation) on investments | (1,696,466 | ) | 623,801 | (4,138,701 | ) | (3,700,859 | ) | |||||||||
|
|
|
|
|
|
|
| |||||||||
Net increase (decrease) in net assets from operations | 652,831 | 1,009,206 | (2,992,389 | ) | (3,461,328 | ) | ||||||||||
|
|
|
|
|
|
|
| |||||||||
Distributions to Shareholders from: | ||||||||||||||||
Net investment income | ||||||||||||||||
Class A | (3,397 | ) | (224 | ) | (778 | ) | (212 | ) | ||||||||
Class I | (129,825 | ) | (18,524 | ) | (885 | ) | (246 | ) | ||||||||
Class K | (1,347,561 | ) | (366,853 | ) | (1,173,348 | ) | (241,183 | ) | ||||||||
|
|
|
|
|
|
|
| |||||||||
Total distributions from net investment income | (1,480,783 | ) | (385,601 | ) | (1,175,011 | ) | (241,641 | ) | ||||||||
|
|
|
|
|
|
|
| |||||||||
Net realized gain on investments | ||||||||||||||||
Class A | (2,642 | ) | – | – | – | |||||||||||
Class I | (64,302 | ) | – | – | – | |||||||||||
Class K | (708,038 | ) | – | – | – | |||||||||||
|
|
|
|
|
|
|
| |||||||||
Total distributions from net realized gain on investments | (774,982 | ) | – | – | – | |||||||||||
|
|
|
|
|
|
|
| |||||||||
Return of capital | ||||||||||||||||
Class A | (217 | ) | – | – | – | |||||||||||
Class I | (8,278 | ) | – | – | – | |||||||||||
Class K | (85,925 | ) | – | – | – | |||||||||||
|
|
|
|
|
|
|
| |||||||||
Total return of capital | (94,420 | ) | – | – | – | |||||||||||
|
|
|
|
|
|
|
| |||||||||
Total distributions | (2,350,185 | ) | (385,601 | ) | (1,175,011 | ) | (241,641 | ) | ||||||||
|
|
|
|
|
|
|
| |||||||||
Net Increase (Decrease) from Capital Share Transactions: | ||||||||||||||||
Class A | ||||||||||||||||
Shares sold | 136,350 | 50,000 | – | 50,000 | ||||||||||||
Reinvestment of distributions | 4,126 | – | – | – | ||||||||||||
|
|
|
|
|
|
|
| |||||||||
Net increase from capital share transactions | 140,476 | 50,000 | – | 50,000 | ||||||||||||
|
|
|
|
|
|
|
| |||||||||
Class I | ||||||||||||||||
Shares sold | – | 4,450,000 | – | 50,000 | ||||||||||||
Reinvestment of distributions | 200,148 | 18,266 | – | – | ||||||||||||
|
|
|
|
|
|
|
| |||||||||
Net increase from capital share transactions | 200,148 | 4,468,266 | – | 50,000 | ||||||||||||
|
|
|
|
|
|
|
| |||||||||
Class K | ||||||||||||||||
Shares sold | 10,758,828 | 70,042,895 | 19,529,351 | 44,253,803 | ||||||||||||
Reinvestment of distributions | 2,141,524 | 299,560 | 1,173,348 | 241,183 | ||||||||||||
Shares redeemed | (32,694,391 | ) | – | (124,042 | ) | – | ||||||||||
|
|
|
|
|
|
|
| |||||||||
Net increase (decrease) from capital share transactions | (19,794,039 | ) | 70,342,455 | 20,578,657 | 44,494,986 | |||||||||||
|
|
|
|
|
|
|
| |||||||||
Total increase from capital share transactions | (19,453,415 | ) | 74,860,721 | 20,578,657 | 44,594,986 | |||||||||||
|
|
|
|
|
|
|
| |||||||||
Net Increase (Decrease) in Net Assets | (21,150,769 | ) | 75,484,326 | 16,411,257 | 40,892,017 | |||||||||||
Net Assets | ||||||||||||||||
Beginning of year | 75,484,326 | – | 40,892,017 | – | ||||||||||||
|
|
|
|
|
|
|
| |||||||||
End of year | $ | 54,333,557 | $ | 75,484,326 | $ | 57,303,274 | $ | 40,892,017 | ||||||||
|
|
|
|
|
|
|
| |||||||||
Undistributed (distributions in excess of) net investment income | $ | – | $ | – | $ | 280 | $ | – | ||||||||
|
|
|
|
|
|
|
| |||||||||
See Notes to Financial Statements and Financial Statements of the corresponding Portfolios.
8
Table of Contents
State Street Institutional Investment Trust
Statements of Changes in Net Assets — (continued)
| State Street Aggregate Bond Index Fund | State Street Global Equity ex-U.S. Index Fund | |||||||||||||||
| For the Year Ended December 31, 2015 | For the Period 9/19/14* to 12/31/14 | For the Year Ended December 31, 2015 | For the Period 9/17/14* to 12/31/14 | |||||||||||||
Changes in Shares: | ||||||||||||||||
Class A | ||||||||||||||||
Shares sold | 13,447 | 5,000 | – | 5,000 | ||||||||||||
Reinvestment of distributions | 422 | – | – | – | ||||||||||||
|
|
|
|
|
|
|
| |||||||||
Net increase in shares | 13,869 | 5,000 | – | 5,000 | ||||||||||||
|
|
|
|
|
|
|
| |||||||||
Class I | ||||||||||||||||
Shares sold | – | 440,643 | – | 5,000 | ||||||||||||
Reinvestment of distributions | 20,257 | 1,809 | – | – | ||||||||||||
|
|
|
|
|
|
|
| |||||||||
Net increase in shares | 20,257 | 442,452 | – | 5,000 | ||||||||||||
|
|
|
|
|
|
|
| |||||||||
Class K | ||||||||||||||||
Shares sold | 1,072,582 | 6,969,737 | 2,194,817 | 4,425,380 | ||||||||||||
Reinvestment of distributions | 216,970 | 29,655 | 137,394 | 26,102 | ||||||||||||
Shares redeemed | (3,192,297 | ) | – | (14,296 | ) | – | ||||||||||
|
|
|
|
|
|
|
| |||||||||
Net increase (decrease) in shares | (1,902,745 | ) | 6,999,392 | 2,317,915 | 4,451,482 | |||||||||||
|
|
|
|
|
|
|
| |||||||||
| * | Commencement of operations |
See Notes to Financial Statements and Financial Statements of the corresponding Portfolios.
9
Table of Contents
State Street Institutional Investment Trust
Statements of Changes in Net Assets
| State Street Small/Mid Cap Equity Index Fund | ||||
| For the Period 8/11/15* to 12/31/15 | ||||
Increase (Decrease) in Net Assets Resulting from: |
| |||
Operations: |
| |||
Net investment income | $ | 24,325 | ||
Net realized gain on investments | 4,525 | |||
Change in net unrealized appreciation on investments | (301,333 | ) | ||
|
| |||
Net increase (decrease) in net assets from operations | (272,483 | ) | ||
|
| |||
Distributions to Shareholders from: |
| |||
Net investment income | ||||
Class A | (606 | ) | ||
Class I | (658 | ) | ||
Class K | (26,368 | ) | ||
|
| |||
Total distributions from net investment income | (27,632 | ) | ||
|
| |||
Net Increase (Decrease) from Capital Share Transactions: |
| |||
Class A |
| |||
Shares sold | 100,000 | |||
|
| |||
Class I |
| |||
Shares sold | 100,000 | |||
|
| |||
Class K |
| |||
Shares sold | 4,198,693 | |||
Reinvestment of distributions | 26,368 | |||
|
| |||
Net increase (decrease) from capital share transactions | 4,225,061 | |||
|
| |||
Total increase from capital share transactions | 4,425,061 | |||
|
| |||
Net Increase (Decrease) in Net Assets | 4,124,946 | |||
Net Assets |
| |||
Beginning of year | – | |||
|
| |||
End of year | $ | 4,124,946 | ||
|
| |||
Undistributed (distributions in excess of) net investment income | $ | – | ||
|
| |||
Changes in Shares: |
| |||
Class A |
| |||
Shares sold | 10,471 | |||
|
| |||
Class I |
| |||
Shares sold | 10,471 | |||
|
| |||
Class K |
| |||
Shares sold | 419,869 | |||
Reinvestment of distributions | 2,808 | |||
Shares redeemed | – | |||
|
| |||
Net increase (decrease) in shares | 422,677 | |||
|
| |||
| * | Inception date |
See Notes to Financial Statements and Financial Statements of the corresponding Portfolios.
10
Table of Contents
State Street Institutional Investment Trust
Selected data for a Class A Share of beneficial interest outstanding throughout each year is presented below:
| State Street Aggregate Bond Index Fund | State Street Global Equity ex-U.S. Index Fund | State Street Small/Mid Cap Equity Index Fund | ||||||||||||||||||
| Year Ended 12/31/15 | Period from 9/19/14* – 12/31/14 | Year Ended 12/31/15 | Period from 9/17/14* – 12/31/14 | Period from 10/16/15* – 12/31/15 | ||||||||||||||||
Per Share Operating Performance: | ||||||||||||||||||||
Net Asset Value, Beginning of Period | $ | 10.14 | $ | 10.00 | $ | 9.17 | $ | 10.00 | $ | 10.00 | ||||||||||
|
|
|
|
|
|
|
|
|
| |||||||||||
Investment Operations: | ||||||||||||||||||||
Net investment income(a) | 0.21 | 0.02 | 0.15 | 0.04 | 0.05 | |||||||||||||||
Net realized and unrealized gain (loss) on investments | (0.18 | ) | 0.16 | (0.71 | ) | (0.83 | ) | (0.69 | ) | |||||||||||
|
|
|
|
|
|
|
|
|
| |||||||||||
Total from investment operations | 0.03 | 0.18 | (0.56 | ) | (0.79 | ) | (0.64 | ) | ||||||||||||
|
|
|
|
|
|
|
|
|
| |||||||||||
Less Distributions From: | ||||||||||||||||||||
Net investment income | (0.26 | ) | (0.04 | ) | (0.16 | ) | (0.04 | ) | (0.06 | ) | ||||||||||
Net realized gains | (0.14 | ) | – | – | – | – | ||||||||||||||
Return of capital | (0.02 | ) | – | – | – | – | ||||||||||||||
|
|
|
|
|
|
|
|
|
| |||||||||||
Total distributions | (0.42 | ) | (0.04 | ) | (0.16 | ) | (0.04 | ) | (0.06 | ) | ||||||||||
|
|
|
|
|
|
|
|
|
| |||||||||||
Net increase (decrease) in net assets | (0.39 | ) | 0.14 | (0.72 | ) | (0.83 | ) | (0.70 | ) | |||||||||||
|
|
|
|
|
|
|
|
|
| |||||||||||
Net Asset Value, End of Period | $ | 9.75 | $ | 10.14 | $ | 8.45 | $ | 9.17 | $ | 9.30 | ||||||||||
|
|
|
|
|
|
|
|
|
| |||||||||||
Total Return(b) | 0.35 | % | 1.85 | %(c) | (6.17 | )% | (7.88 | )%(c) | (6.27 | )%(c) | ||||||||||
Ratios and Supplemental Data: | ||||||||||||||||||||
Net Assets, End of Period (000s) | $ | 184 | $ | 51 | $ | 42 | $ | 46 | $ | 97 | ||||||||||
Ratios to average net assets: | ||||||||||||||||||||
Expenses before waiver and payments by affiliates(d) | 0.66 | % | 0.91 | %(e) | 0.70 | % | 1.17 | %(e) | 5.08 | %(e) | ||||||||||
Expenses net of waiver and payments by affiliates(d) | 0.31 | % | 0.52 | %(e) | 0.32 | % | 0.60 | %(e) | 0.30 | %(e) | ||||||||||
Net investment income | 2.11 | % | 0.58 | %(e) | 1.64 | % | 1.55 | %(e) | 2.55 | %(e) | ||||||||||
Portfolio turnover rate(f) | 62 | % | 16 | %(c) | 3 | % | 0 | %(c) | 8 | %(c) | ||||||||||
| * | Commencement of operations. |
| (a) | Net investment income per share is calculated using the average shares method. |
| (b) | Total return is calculated assuming a purchase of shares at net asset value on the first day and a sale at net asset value on the last day of each period reported. Distributions are assumed, for the purpose of this calculation, to be reinvested at net asset value per share on the respective payment dates. Results represent past performance and are not indicative of future results. |
| (c) | Not annualized. |
| (d) | Ratio does not include the expenses of the corresponding Portfolio. |
| (e) | Annualized. |
| (f) | Portfolio turnover rate is from the corresponding Portfolio. |
See Notes to Financial Statements and Financial Statements of the corresponding Portfolios.
11
Table of Contents
State Street Institutional Investment Trust
Financial Highlights
Selected data for a Class I Share of beneficial interest outstanding throughout each year is presented below:
| State Street Aggregate Bond Index Fund | State Street Global Equity ex-U.S. Index Fund | State Street Small/Mid Cap Equity Index Fund | ||||||||||||||||||
| Year Ended 12/31/15 | Period from 9/19/14* – 12/31/14 | Year Ended 12/31/15 | Period from 9/17/14* – 12/31/14 | Period from 10/16/15* – 12/31/15 | ||||||||||||||||
Per Share Operating Performance: | ||||||||||||||||||||
Net Asset Value, Beginning of Period | $ | 10.13 | $ | 10.00 | $ | 9.17 | $ | 10.00 | $ | 10.00 | ||||||||||
|
|
|
|
|
|
|
|
|
| |||||||||||
Investment Operations: | ||||||||||||||||||||
Net investment income (loss)(a) | 0.20 | 0.08 | 0.18 | 0.05 | 0.06 | |||||||||||||||
Net realized and unrealized gain (loss) on investments | (0.14 | ) | 0.09 | (0.72 | ) | (0.83 | ) | (0.70 | ) | |||||||||||
|
|
|
|
|
|
|
|
|
| |||||||||||
Total from investment operations | 0.06 | 0.17 | (0.54 | ) | (0.78 | ) | (0.64 | ) | ||||||||||||
|
|
|
|
|
|
|
|
|
| |||||||||||
Less Distributions From: | ||||||||||||||||||||
Net investment income | (0.29 | ) | (0.04 | ) | (0.18 | ) | (0.05 | ) | (0.06 | ) | ||||||||||
Net realized gains | (0.14 | ) | – | �� | – | – | – | |||||||||||||
Return of capital | (0.02 | ) | – | – | – | – | ||||||||||||||
|
|
|
|
|
|
|
|
|
| |||||||||||
Total distributions | (0.45 | ) | (0.04 | ) | (0.18 | ) | (0.05 | ) | (0.06 | ) | ||||||||||
|
|
|
|
|
|
|
|
|
| |||||||||||
Net increase (decrease) in net assets | (0.39 | ) | 0.13 | (0.72 | ) | (0.83 | ) | (0.70 | ) | |||||||||||
|
|
|
|
|
|
|
|
|
| |||||||||||
Net Asset Value, End of Period | $ | 9.74 | $ | 10.13 | $ | 8.45 | $ | 9.17 | $ | 9.30 | ||||||||||
|
|
|
|
|
|
|
|
|
| |||||||||||
Total Return(b) | 0.60 | % | 1.82 | %(c) | (5.94 | )% | (7.81 | )%(c) | (6.18 | )%(c) | ||||||||||
Ratios and Supplemental Data: | ||||||||||||||||||||
Net Assets, End of Period (000s) | $ | 4,508 | $ | 4,484 | $ | 42 | $ | 46 | $ | 97 | ||||||||||
Ratios to average net assets: | ||||||||||||||||||||
Expenses before waiver and payments by affiliates(d) | 0.41 | % | 0.88 | %(e) | 0.45 | % | 0.92 | %(e) | 4.83 | %(e) | ||||||||||
Expenses net of waivers and payments by affiliates(d) | 0.06 | % | 0.28 | %(e) | 0.06 | % | 0.35 | %(e) | 0.05 | %(e) | ||||||||||
Net investment income | 1.95 | % | 2.91 | %(e) | 1.89 | % | 1.81 | %(e) | 2.80 | %(e) | ||||||||||
Portfolio turnover rate(f) | 62 | % | 16 | %(c) | 3 | % | 0 | %(c) | 8 | %(c) | ||||||||||
| * | Commencement of operations. |
| (a) | Net investment income per share is calculated using the average shares method. |
| (b) | Total return is calculated assuming a purchase of shares at net asset value on the first day and a sale at net asset value on the last day of each period reported. Distributions are assumed, for the purpose of this calculation, to be reinvested at net asset value per share on the respective payment dates. Results represent past performance and are not indicative of future results. |
| (c) | Not annualized. |
| (d) | Ratio does not include the expenses of the corresponding Portfolio. |
| (e) | Annualized. |
| (f) | Portfolio turnover rate is from the corresponding Portfolio. |
See Notes to Financial Statements and Financial Statements of the corresponding Portfolios.
12
Table of Contents
State Street Institutional Investment Trust
Financial Highlights
Selected data for a Class K Share of beneficial interest outstanding throughout each year is presented below:
| State Street Aggregate Bond Index Fund | State Street Global Equity ex-U.S. Index Fund | State Street Small/Mid Cap Equity Index Fund | ||||||||||||||||||
| Year Ended 12/31/15 | Period from 9/19/14* – 12/31/14 | Year Ended 12/31/15 | Period from 9/17/14* – 12/31/14 | Period from 8/12/15* – 12/31/15 | ||||||||||||||||
Per Share Operating Performance: | ||||||||||||||||||||
Net Asset Value, Beginning of Period | $ | 10.14 | $ | 10.00 | $ | 9.17 | $ | 10.00 | $ | 10.00 | ||||||||||
|
|
|
|
|
|
|
|
|
| |||||||||||
Investment Operations: | ||||||||||||||||||||
Net investment income(a) | 0.20 | 0.04 | 0.24 | 0.05 | 0.06 | |||||||||||||||
Net realized and unrealized gain (loss) on investments | (0.15 | ) | 0.15 | (0.78 | ) | (0.83 | ) | (0.70 | ) | |||||||||||
|
|
|
|
|
|
|
|
|
| |||||||||||
Total from investment operations | 0.05 | 0.19 | (0.54 | ) | (0.78 | ) | (0.64 | ) | ||||||||||||
|
|
|
|
|
|
|
|
|
| |||||||||||
Less Distributions From: | ||||||||||||||||||||
Net investment income | (0.29 | ) | (0.05 | ) | (0.18 | ) | (0.05 | ) | (0.06 | ) | ||||||||||
Net realized gains | (0.14 | ) | – | – | – | – | ||||||||||||||
Return of capital | (0.02 | ) | – | – | – | – | ||||||||||||||
|
|
|
|
|
|
|
|
|
| |||||||||||
Total distributions | (0.45 | ) | (0.05 | ) | (0.18 | ) | (0.05 | ) | (0.06 | ) | ||||||||||
|
|
|
|
|
|
|
|
|
| |||||||||||
Net increase (decrease) in net assets | (0.40 | ) | 0.14 | (0.72 | ) | (0.83 | ) | (0.70 | ) | |||||||||||
|
|
|
|
|
|
|
|
|
| |||||||||||
Net Asset Value, End of Period | $ | 9.74 | $ | 10.14 | $ | 8.45 | $ | 9.17 | $ | 9.30 | ||||||||||
|
|
|
|
|
|
|
|
|
| |||||||||||
Total Return(b) | 0.54 | % | 1.97 | %(c) | (5.94 | )% | (7.76 | )%(c) | (6.38 | )%(c) | ||||||||||
Ratios and Supplemental Data: | ||||||||||||||||||||
Net Assets, End of Period (000s) | $ | 49,641 | $ | 70,950 | $ | 57,219 | $ | 40,800 | $ | 3,930 | ||||||||||
Ratios to average net assets: | ||||||||||||||||||||
Expenses before waiver and payments by affiliates(d) | 0.41 | % | 0.50 | %(e) | 0.45 | % | 0.73 | %(e) | 4.71 | %(e) | ||||||||||
Expenses net of waivers and payments by affiliates(d) | 0.06 | % | 0.09 | %(e) | 0.06 | % | 0.15 | %(e) | 0.05 | %(e) | ||||||||||
Net investment income | 1.88 | % | 1.33 | %(e) | 2.59 | % | 2.00 | %(e) | 1.49 | %(e) | ||||||||||
Portfolio turnover rate(f) | 62 | % | 16 | %(c) | 3 | % | 0 | %(c) | 8 | %(c) | ||||||||||
| * | Commencement of operations. |
| (a) | Net investment income per share is calculated using the average shares method. |
| (b) | Total return is calculated assuming a purchase of shares at net asset value on the first day and a sale at net asset value on the last day of each period reported. Distributions are assumed, for the purpose of this calculation, to be reinvested at net asset value per share on the respective payment dates. Results represent past performance and are not indicative of future results. |
| (c) | Not annualized. |
| (d) | Ratio does not include the expenses of the corresponding Portfolio. |
| (e) | Annualized. |
| (f) | Portfolio turnover rate is from the corresponding Portfolio. |
See Notes to Financial Statements and Financial Statements of the corresponding Portfolios.
13
Table of Contents
State Street Aggregate Bond Index Portfolio
Portfolio Statistics (Unaudited)
Portfolio Composition* | December 31, 2015 | |||
U.S. Treasury Obligations | 36.0 | % | ||
U.S. Government Agency Obligations | 31.7 | |||
Corporate Bonds & Notes | 26.7 | |||
Foreign Government Obligations | 1.8 | |||
Mortgage-Backed Securities | 1.1 | |||
Municipal Bonds & Notes | 0.6 | |||
Asset-Backed Securities | 0.5 | |||
Short-Term Investment | 15.9 | |||
Liabilities in Excess of Other Assets | (14.3 | ) | ||
Total | 100.0 | % |
Top Five Sectors (excluding short-term investment)* | December 31, 2015 | |||
Banks | 5.8 | % | ||
Oil & Gas | 1.9 | |||
Electric | 1.5 | |||
Multi-National | 1.4 | |||
Telecommunications | 1.2 | |||
Total | 11.8 | % |
| * | As a percentage of net assets as of the date indicated. The Portfolio’s composition will vary over time. |
See accompanying notes to the financial statements.
14
Table of Contents
State Street Aggregate Bond Index Portfolio
December 31, 2015
Security Description | Principal Amount | Value | ||||||
CORPORATE BONDS & NOTES – 26.7% |
| |||||||
Advertising – 0.1% | ||||||||
Interpublic Group of Cos., Inc. | $ | 25,000 | $ | 24,696 | ||||
WPP Finance 2010 | 25,000 | 25,116 | ||||||
|
| |||||||
| 49,812 | ||||||||
|
| |||||||
Aerospace & Defense – 0.4% |
| |||||||
Boeing Co. | 25,000 | 24,638 | ||||||
Embraer Netherlands Finance B.V. | 35,000 | 31,894 | ||||||
L-3 Communications Corp. | 25,000 | 25,762 | ||||||
Lockheed Martin Corp.: | ||||||||
3.60%, 3/1/2035 | 50,000 | 45,035 | ||||||
4.70%, 5/15/2046 | 35,000 | 35,852 | ||||||
Northrop Grumman Corp. | 25,000 | 25,619 | ||||||
Raytheon Co. | 25,000 | 25,757 | ||||||
United Technologies Corp.: | ||||||||
1.80%, 6/1/2017 | 25,000 | 25,128 | ||||||
6.13%, 2/1/2019 | 25,000 | 27,830 | ||||||
6.13%, 7/15/2038 | 50,000 | 60,867 | ||||||
|
| |||||||
| 328,382 | ||||||||
|
| |||||||
Agriculture – 0.3% | ||||||||
Altria Group, Inc.: | ||||||||
2.63%, 1/14/2020 | 50,000 | 49,951 | ||||||
4.00%, 1/31/2024 | 25,000 | 25,898 | ||||||
4.50%, 5/2/2043 | 25,000 | 23,681 | ||||||
Philip Morris International, Inc.: | ||||||||
1.88%, 1/15/2019 | 50,000 | 49,743 | ||||||
4.13%, 3/4/2043 | 25,000 | 23,725 | ||||||
4.50%, 3/26/2020 | 25,000 | 27,154 | ||||||
Reynolds American, Inc.: | ||||||||
2.30%, 6/12/2018 | 25,000 | 25,164 | ||||||
3.75%, 5/20/2023 | 25,000 | 24,974 | ||||||
5.70%, 8/15/2035 | 25,000 | 27,299 | ||||||
|
| |||||||
| 277,589 | ||||||||
|
| |||||||
Airlines – 0.1% | ||||||||
American Airlines 2014-1 Pass Through Trust, Class A | 23,546 | 23,310 | ||||||
Southwest Airlines Co. | 25,000 | 25,089 | ||||||
|
| |||||||
| 48,399 | ||||||||
|
| |||||||
Auto Manufacturers – 0.5% |
| |||||||
American Honda Finance Corp.: Series MTN, 2.25%, 8/15/2019 | 25,000 | 25,060 | ||||||
2.45%, 9/24/2020 | 25,000 | 24,999 | ||||||
Ford Motor Co. | 50,000 | 46,959 | ||||||
Ford Motor Credit Co. LLC | 100,000 | 106,544 | ||||||
General Motors Co. | 25,000 | 25,245 | ||||||
General Motors Financial Co., Inc.: | ||||||||
3.15%, 1/15/2020 | 35,000 | 34,541 | ||||||
3.20%, 7/13/2020 | 25,000 | 24,584 | ||||||
4.00%, 1/15/2025 | 35,000 | 33,148 | ||||||
Toyota Motor Credit Corp.: Series MTN, 2.10%, 1/17/2019 | 50,000 | 50,146 | ||||||
Series GMTN, 2.80%, 7/13/2022 | 25,000 | 24,976 | ||||||
|
| |||||||
| 396,202 | ||||||||
|
| |||||||
Auto Parts & Equipment – 0.1% |
| |||||||
Delphi Automotive PLC | 25,000 | 25,046 | ||||||
Johnson Controls, Inc.: | ||||||||
1.40%, 11/2/2017 | 25,000 | 24,716 | ||||||
3.63%, 7/2/2024 | 25,000 | 24,110 | ||||||
|
| |||||||
| 73,872 | ||||||||
|
| |||||||
Banks – 5.8% | ||||||||
Abbey National Treasury Services PLC | 25,000 | 25,592 | ||||||
Bank of America Corp.: | ||||||||
Series L, 2.60%, 1/15/2019 | 50,000 | 50,174 | ||||||
Series L, 2.65%, 4/1/2019 | 50,000 | 50,122 | ||||||
Series L, 3.95%, 4/21/2025 | 50,000 | 48,683 | ||||||
Series MTN, 4.00%, 4/1/2024 | 50,000 | 51,143 | ||||||
Series MTN, 4.13%, 1/22/2024 | 25,000 | 25,812 | ||||||
Series MTN, 4.20%, 8/26/2024 | 50,000 | 49,798 | ||||||
Series MTN, 4.25%, 10/22/2026 | 75,000 | 74,064 | ||||||
Series MTN, 5.00%, 5/13/2021 | 50,000 | 54,274 | ||||||
5.63%, 7/1/2020 | 50,000 | 55,419 | ||||||
Bank of Montreal: | ||||||||
1.40%, 4/10/2018 | 25,000 | 24,737 | ||||||
Series MTN, 1.45%, 4/9/2018 | 25,000 | 24,781 | ||||||
Bank of New York Mellon Corp.: | ||||||||
Series MTN, 2.20%, 3/4/2019 | 25,000 | 25,081 | ||||||
Series G, 3.00%, 2/24/2025 | 100,000 | 97,834 | ||||||
Bank of Nova Scotia: | ||||||||
1.30%, 7/21/2017 | 50,000 | 49,746 | ||||||
2.35%, 10/21/2020 | 100,000 | 99,007 | ||||||
BB&T Corp.: | ||||||||
2.25%, 2/1/2019 | 25,000 | 25,086 | ||||||
Series MTN, 2.63%, 6/29/2020 | 50,000 | 50,196 | ||||||
BNP Paribas SA: | ||||||||
Series MTN, 1.38%, 3/17/2017 | 25,000 | 24,959 | ||||||
5.00%, 1/15/2021 | 25,000 | 27,567 | ||||||
Capital One Financial Corp.: | ||||||||
2.45%, 4/24/2019 | 50,000 | 49,967 | ||||||
6.75%, 9/15/2017 | 25,000 | 26,901 | ||||||
Citigroup, Inc.: | ||||||||
1.55%, 8/14/2017 | 50,000 | 49,776 | ||||||
2.50%, 9/26/2018 | 50,000 | 50,310 | ||||||
2.55%, 4/8/2019 | 50,000 | 50,201 | ||||||
3.75%, 6/16/2024 | 25,000 | 25,499 | ||||||
4.30%, 11/20/2026 | 50,000 | 49,673 | ||||||
4.45%, 9/29/2027 | 50,000 | 49,700 | ||||||
5.30%, 5/6/2044 | 50,000 | 51,947 | ||||||
Cooperatieve Centrale Raiffeisen-Boerenleenbank BA: | ||||||||
3.88%, 2/8/2022 | 50,000 | 52,349 | ||||||
4.50%, 1/11/2021 | 50,000 | 54,449 | ||||||
See accompanying notes to financial statements.
15
Table of Contents
State Street Aggregate Bond Index Portfolio
Schedule of Investments — (continued)
December 31, 2015
Security Description | Principal Amount | Value | ||||||
CORPORATE BONDS & NOTES – (continued) |
| |||||||
Banks – (continued) | ||||||||
Credit Suisse AG: | ||||||||
5.30%, 8/13/2019 | $ | 100,000 | $ | 110,166 | ||||
6.00%, 2/15/2018 | 25,000 | 26,864 | ||||||
Deutsche Bank AG: | ||||||||
1.35%, 5/30/2017 | 25,000 | 24,832 | ||||||
2.50%, 2/13/2019 | 25,000 | 24,962 | ||||||
2.95%, 8/20/2020 | 50,000 | 49,955 | ||||||
Fifth Third Bancorp | 50,000 | 49,696 | ||||||
Goldman Sachs Group, Inc.: | ||||||||
2.55%, 10/23/2019 | 25,000 | 24,972 | ||||||
2.63%, 1/31/2019 | 50,000 | 50,390 | ||||||
2.90%, 7/19/2018 | 50,000 | 50,895 | ||||||
3.50%, 1/23/2025 | 100,000 | 98,579 | ||||||
3.63%, 1/22/2023 | 25,000 | 25,357 | ||||||
4.00%, 3/3/2024 | 50,000 | 51,312 | ||||||
Series MTN, 4.80%, 7/8/2044 | 50,000 | 49,463 | ||||||
5.95%, 1/15/2027 | 50,000 | 55,673 | ||||||
HSBC Holdings PLC | 50,000 | 55,457 | ||||||
HSBC USA, Inc. | 100,000 | 99,403 | ||||||
Huntington Bancshares, Inc. | 50,000 | 50,151 | ||||||
International Finance Corp.: | ||||||||
1.00%, 4/24/2017 | 50,000 | 49,902 | ||||||
1.75%, 9/16/2019 | 25,000 | 25,098 | ||||||
JPMorgan Chase & Co.: | ||||||||
Series MTN, 1.35%, 2/15/2017 | 50,000 | 49,871 | ||||||
1.63%, 5/15/2018 | 50,000 | 49,494 | ||||||
2.35%, 1/28/2019 | 50,000 | 50,073 | ||||||
3.38%, 5/1/2023 | 75,000 | 73,418 | ||||||
3.88%, 2/1/2024 | 50,000 | 51,573 | ||||||
4.85%, 2/1/2044 | 50,000 | 53,186 | ||||||
4.95%, 6/1/2045 | 50,000 | 49,844 | ||||||
KeyCorp.: | ||||||||
Series MTN, 2.30%, 12/13/2018 | 25,000 | 24,947 | ||||||
Series MTN, 2.90%, 9/15/2020 | 50,000 | 49,671 | ||||||
KFW: | ||||||||
0.88%, 12/15/2017 | 75,000 | 74,477 | ||||||
1.00%, 6/11/2018 | 25,000 | 24,759 | ||||||
1.88%, 4/1/2019 | 25,000 | 25,208 | ||||||
2.00%, 5/2/2025 | 100,000 | 96,278 | ||||||
2.13%, 1/17/2023 | 100,000 | 98,891 | ||||||
2.50%, 11/20/2024 | 50,000 | 50,222 | ||||||
2.63%, 1/25/2022 | 50,000 | 51,322 | ||||||
4.50%, 7/16/2018 | 75,000 | 80,755 | ||||||
Landwirtschaftliche Rentenbank: | ||||||||
1.00%, 4/4/2018 | 50,000 | 49,620 | ||||||
2.25%, 10/1/2021 | 50,000 | 50,289 | ||||||
Morgan Stanley: | ||||||||
2.13%, 4/25/2018 | 25,000 | 25,023 | ||||||
Series MTN, 2.20%, 12/7/2018 | 50,000 | 49,796 | ||||||
Series GMTN, 2.38%, 7/23/2019 | 50,000 | 49,669 | ||||||
2.80%, 6/16/2020 | 50,000 | 50,040 | ||||||
3.75%, 2/25/2023 | 50,000 | 51,275 | ||||||
3.95%, 4/23/2027 | 25,000 | 24,209 | ||||||
Series GMTN, 4.35%, 9/8/2026 | 50,000 | 50,100 | ||||||
4.75%, 3/22/2017 | 50,000 | 51,789 | ||||||
Oesterreichische Kontrollbank AG: | ||||||||
1.13%, 5/29/2018 | 50,000 | 49,654 | ||||||
1.63%, 3/12/2019 | 25,000 | 24,996 | ||||||
PNC Financial Services Group, Inc. | 50,000 | 50,790 | ||||||
PNC Funding Corp. | 50,000 | 51,178 | ||||||
Royal Bank of Canada: | ||||||||
Series CB8, 1.20%, 9/19/2017 | 50,000 | 49,732 | ||||||
Series MTN, 1.50%, 1/16/2018 | 50,000 | 49,736 | ||||||
Santander Holdings USA, Inc. | 50,000 | 50,854 | ||||||
Santander UK Group Holdings PLC | 100,000 | 99,441 | ||||||
SunTrust Banks, Inc. | 25,000 | 25,070 | ||||||
Toronto-Dominion Bank: | ||||||||
Series GMTN, 1.13%, 5/2/2017 | 25,000 | 24,882 | ||||||
Series GMTN, 2.50%, 12/14/2020 | 50,000 | 49,952 | ||||||
US Bancorp: | ||||||||
Series MTN, 2.20%, 4/25/2019 | 25,000 | 25,116 | ||||||
Series MTN, 3.60%, 9/11/2024 | 25,000 | 25,359 | ||||||
Wells Fargo & Co.: | ||||||||
2.15%, 1/15/2019 | 25,000 | 25,058 | ||||||
Series MTN, 3.00%, 1/22/2021 | 50,000 | 50,585 | ||||||
Series MTN, 3.55%, 9/29/2025 | 50,000 | 50,385 | ||||||
4.13%, 8/15/2023 | 25,000 | 25,858 | ||||||
Series GMTN, 4.30%, 7/22/2027 | 50,000 | 50,840 | ||||||
4.48%, 1/16/2024 | 25,000 | 26,300 | ||||||
5.61%, 1/15/2044 | 50,000 | 55,430 | ||||||
Wells Fargo Capital | 25,000 | 25,238 | ||||||
Westpac Banking Corp.: | ||||||||
1.55%, 5/25/2018 | 100,000 | 99,009 | ||||||
2.25%, 1/17/2019 | 25,000 | 25,051 | ||||||
|
| |||||||
| 4,834,287 | ||||||||
|
| |||||||
Beverages – 0.5% | ||||||||
Anheuser-Busch InBev Finance, Inc.: | ||||||||
1.13%, 1/27/2017 | 25,000 | 24,945 | ||||||
2.15%, 2/1/2019 | 25,000 | 24,962 | ||||||
Anheuser-Busch InBev Worldwide, Inc.: | ||||||||
2.50%, 7/15/2022 | 50,000 | 48,019 | ||||||
3.75%, 7/15/2042 | 50,000 | 43,316 | ||||||
Coca-Cola Co.: | ||||||||
1.15%, 4/1/2018 | 25,000 | 24,876 | ||||||
1.65%, 11/1/2018 | 25,000 | 25,170 | ||||||
3.20%, 11/1/2023 | 25,000 | 25,688 | ||||||
Diageo Capital PLC: | ||||||||
1.50%, 5/11/2017 | 25,000 | 24,989 | ||||||
2.63%, 4/29/2023 | 25,000 | 24,185 | ||||||
Dr Pepper Snapple Group, Inc. | 25,000 | 24,428 | ||||||
PepsiCo, Inc.: | ||||||||
0.95%, 2/22/2017 | 25,000 | 24,949 | ||||||
1.85%, 4/30/2020 | 25,000 | 24,670 | ||||||
See accompanying notes to financial statements.
16
Table of Contents
State Street Aggregate Bond Index Portfolio
Schedule of Investments — (continued)
December 31, 2015
Security Description | Principal Amount | Value | ||||||
CORPORATE BONDS & NOTES – (continued) |
| |||||||
Beverages – (continued) | ||||||||
3.60%, 3/1/2024 | $ | 25,000 | $ | 26,148 | ||||
4.45%, 4/14/2046 | 25,000 | 25,753 | ||||||
4.60%, 7/17/2045 | 25,000 | 26,365 | ||||||
|
| |||||||
| 418,463 | ||||||||
|
| |||||||
Biotechnology – 0.4% | ||||||||
Amgen, Inc.: | ||||||||
2.13%, 5/15/2017 | 50,000 | 50,333 | ||||||
6.38%, 6/1/2037 | 50,000 | 58,318 | ||||||
Biogen, Inc. | 25,000 | 24,890 | ||||||
Celgene Corp.: | ||||||||
2.88%, 8/15/2020 | 25,000 | 24,811 | ||||||
3.63%, 5/15/2024 | 25,000 | 24,643 | ||||||
3.88%, 8/15/2025 | 25,000 | 24,859 | ||||||
Gilead Sciences, Inc.: | ||||||||
3.65%, 3/1/2026 | 35,000 | 35,215 | ||||||
4.40%, 12/1/2021 | 25,000 | 26,987 | ||||||
4.50%, 2/1/2045 | 25,000 | 24,443 | ||||||
4.75%, 3/1/2046 | 25,000 | 25,399 | ||||||
|
| |||||||
| 319,898 | ||||||||
|
| |||||||
Chemicals – 0.5% | ||||||||
Airgas, Inc. | 25,000 | 25,157 | ||||||
CF Industries, Inc. | 25,000 | 23,246 | ||||||
Dow Chemical Co.: | ||||||||
3.00%, 11/15/2022 | 25,000 | 24,011 | ||||||
4.25%, 11/15/2020 | 25,000 | 26,174 | ||||||
4.25%, 10/1/2034 | 50,000 | 45,241 | ||||||
Eastman Chemical Co. | 25,000 | 24,194 | ||||||
Ecolab, Inc. | 25,000 | 26,612 | ||||||
EI du Pont de Nemours & Co.: | ||||||||
3.63%, 1/15/2021 | 25,000 | 25,607 | ||||||
6.00%, 7/15/2018 | 25,000 | 27,220 | ||||||
Lubrizol Corp. | 25,000 | 29,741 | ||||||
LyondellBasell Industries NV | 25,000 | 20,408 | ||||||
Monsanto Co. | 25,000 | 19,052 | ||||||
PPG Industries, Inc. | 25,000 | 24,409 | ||||||
Praxair, Inc.: | ||||||||
3.20%, 1/30/2026 | 25,000 | 24,966 | ||||||
3.55%, 11/7/2042 | 25,000 | 22,030 | ||||||
|
| |||||||
| 388,068 | ||||||||
|
| |||||||
Commercial Services – 0.1% |
| |||||||
Automatic Data Processing, Inc. | 20,000 | 19,999 | ||||||
Massachusetts Institute of Technology | 50,000 | 51,758 | ||||||
Western Union Co | 25,000 | 25,239 | ||||||
|
| |||||||
| 96,996 | ||||||||
|
| |||||||
Diversified Financial Services – 1.2% |
| |||||||
Air Lease Corp. | 25,000 | 24,332 | ||||||
American Express Credit Corp.: | ||||||||
2.13%, 3/18/2019 | 50,000 | 49,883 | ||||||
Series GMTN, 2.25%, 8/15/2019 | 50,000 | 49,791 | ||||||
Ameriprise Financial, Inc. | 50,000 | 50,765 | ||||||
Bear Stearns Cos. LLC | 50,000 | 53,740 | ||||||
BlackRock, Inc. | 25,000 | 25,618 | ||||||
Credit Suisse USA, Inc. | 50,000 | 64,033 | ||||||
Discover Financial Services | 50,000 | 49,474 | ||||||
General Electric Capital Corp.: | ||||||||
2.30%, 1/14/2019 | 25,000 | 25,293 | ||||||
3.45%, 5/15/2024 | 50,000 | 51,590 | ||||||
4.65%, 10/17/2021 | 50,000 | 55,138 | ||||||
5.30%, 2/11/2021 | 25,000 | 28,146 | ||||||
Series GMTN, 5.63%, 9/15/2017 | 50,000 | 53,563 | ||||||
Series MTN, 5.88%, 1/14/2038 | 50,000 | 61,304 | ||||||
HSBC Finance Corp. | 25,000 | 28,638 | ||||||
Intercontinental Exchange, Inc. | 25,000 | 24,999 | ||||||
Invesco Finance PLC | 50,000 | 50,092 | ||||||
National Rural Utilities Cooperative Finance Corp. | 75,000 | 72,000 | ||||||
Synchrony Financial | 25,000 | 24,858 | ||||||
TD Ameritrade Holding Corp. | 25,000 | 27,824 | ||||||
Visa, Inc. | 100,000 | 99,938 | ||||||
|
| |||||||
| 971,019 | ||||||||
|
| |||||||
Electric – 1.5% | ||||||||
Alabama Power Co. | 75,000 | 68,639 | ||||||
Appalachian Power Co. | 25,000 | 23,755 | ||||||
Baltimore Gas & Electric Co. | 50,000 | 61,844 | ||||||
Berkshire Hathaway Energy Co. | 50,000 | 49,573 | ||||||
Consolidated Edison Co. of New York, Inc. | 25,000 | 29,819 | ||||||
DTE Energy Co. | 25,000 | 24,722 | ||||||
Duke Energy Carolinas LLC | 50,000 | 49,688 | ||||||
Duke Energy Corp. | 50,000 | 49,835 | ||||||
Duke Energy Florida LLC | 50,000 | 63,338 | ||||||
See accompanying notes to financial statements.
17
Table of Contents
State Street Aggregate Bond Index Portfolio
Schedule of Investments — (continued)
December 31, 2015
Security Description | Principal Amount | Value | ||||||
CORPORATE BONDS & NOTES – (continued) |
| |||||||
Electric– (continued) | ||||||||
Entergy Corp. | $ | 50,000 | $ | 50,460 | ||||
Florida Power & Light Co.: | ||||||||
3.25%, 6/1/2024 | 25,000 | 25,357 | ||||||
4.05%, 10/1/2044 | 50,000 | 49,245 | ||||||
Hydro-Quebec | 50,000 | 50,114 | ||||||
Midamerican Funding LLC | 50,000 | 62,091 | ||||||
NiSource Finance Corp. | 25,000 | 27,970 | ||||||
Oncor Electric Delivery Co. LLC | 50,000 | 66,667 | ||||||
Pacific Gas & Electric Co.: | ||||||||
3.25%, 6/15/2023 | 50,000 | 50,174 | ||||||
6.05%, 3/1/2034 | 50,000 | 59,753 | ||||||
PPL Capital Funding, Inc. | 75,000 | 75,687 | ||||||
Public Service Co. of Colorado | 25,000 | 25,667 | ||||||
Public Service Electric & Gas Co. | 50,000 | 45,536 | ||||||
Puget Sound Energy, Inc. | 50,000 | 60,152 | ||||||
Southern California Edison Co. | 50,000 | 47,191 | ||||||
Southwestern Public Service Co. | 50,000 | 50,154 | ||||||
Virginia Electric & Power Co. | 50,000 | 50,949 | ||||||
WEC Energy Group, Inc. | 25,000 | 24,949 | ||||||
|
| |||||||
| 1,243,329 | ||||||||
|
| |||||||
Electrical Components & Equipment – 0.0%(b) |
| |||||||
Emerson Electric Co. | 25,000 | 24,346 | ||||||
|
| |||||||
Electronics – 0.2% | ||||||||
Corning, Inc. | 25,000 | 27,005 | ||||||
Honeywell International, Inc. | 25,000 | 26,976 | ||||||
Thermo Fisher Scientific, Inc.: 1.85%, 1/15/2018 | 50,000 | 49,926 | ||||||
4.15%, 2/1/2024 | 25,000 | 25,973 | ||||||
|
| |||||||
| 129,880 | ||||||||
|
| |||||||
Environmental Control – 0.1% |
| |||||||
Republic Services, Inc. | 25,000 | 25,563 | ||||||
Waste Management, Inc. | 25,000 | 25,201 | ||||||
|
| |||||||
| 50,764 | ||||||||
|
| |||||||
Food – 0.5% |
| |||||||
ConAgra Foods, Inc. | 25,000 | 24,638 | ||||||
General Mills, Inc. | 25,000 | 24,373 | ||||||
Hershey Co. | 25,000 | 24,885 | ||||||
JM Smucker Co. | 25,000 | 24,752 | ||||||
Kellogg Co. | 25,000 | 25,950 | ||||||
Kraft Foods Group, Inc.: | ||||||||
6.13%, 8/23/2018 | 25,000 | 27,389 | ||||||
6.88%, 1/26/2039 | 50,000 | 59,142 | ||||||
Kraft Heinz Foods Co. | 50,000 | 50,444 | ||||||
Kroger Co. | 75,000 | 77,492 | ||||||
Mondelez International, Inc. | 25,000 | 25,633 | ||||||
Sysco Corp.: | ||||||||
3.75%, 10/1/2025 | 5,000 | 5,061 | ||||||
4.85%, 10/1/2045 | 5,000 | 5,159 | ||||||
Tyson Foods, Inc. | 25,000 | 26,562 | ||||||
|
| |||||||
| 401,480 | ||||||||
|
| |||||||
Forest Products & Paper – 0.1% |
| |||||||
Georgia-Pacific LLC | 25,000 | 32,329 | ||||||
International Paper Co. | 25,000 | 24,543 | ||||||
|
| |||||||
| 56,872 | ||||||||
|
| |||||||
Gas – 0.3% | ||||||||
AGL Capital Corp. | 25,000 | 26,871 | ||||||
Atmos Energy Corp. | 25,000 | 23,676 | ||||||
CenterPoint Energy, Inc. | 100,000 | 109,068 | ||||||
Dominion Gas Holdings LLC: | ||||||||
3.60%, 12/15/2024 | 50,000 | 49,151 | ||||||
4.80%, 11/1/2043 | 25,000 | 23,641 | ||||||
Southern California Gas Co. | 25,000 | 25,045 | ||||||
|
| |||||||
| 257,452 | ||||||||
|
| |||||||
Hand & Machine Tools – 0.1% |
| |||||||
Stanley Black & Decker, Inc. | 50,000 | 52,500 | ||||||
|
| |||||||
Health Care Products – 0.4% |
| |||||||
Baxter International, Inc. | 25,000 | 23,923 | ||||||
Becton Dickinson and Co. | 50,000 | 50,139 | ||||||
Boston Scientific Corp. | 25,000 | 25,116 | ||||||
Covidien International Finance SA | 50,000 | 50,350 | ||||||
Danaher Corp. | 25,000 | 24,966 | ||||||
Medtronic, Inc.: | ||||||||
1.38%, 4/1/2018 | 25,000 | 24,890 | ||||||
4.38%, 3/15/2035 | 25,000 | 25,242 | ||||||
4.63%, 3/15/2045 | 25,000 | 25,710 | ||||||
5.55%, 3/15/2040 | 25,000 | 28,563 | ||||||
See accompanying notes to financial statements.
18
Table of Contents
State Street Aggregate Bond Index Portfolio
Schedule of Investments — (continued)
December 31, 2015
Security Description | Principal Amount | Value | ||||||
CORPORATE BONDS & NOTES – (continued) |
| |||||||
Health Care Products – (continued) |
| |||||||
Stryker Corp. | $ | 25,000 | $ | 24,688 | ||||
Zimmer Biomet Holdings, Inc. | 25,000 | 24,276 | ||||||
|
| |||||||
| 327,863 | ||||||||
|
| |||||||
Health Care Services – 0.5% |
| |||||||
Aetna, Inc.: | ||||||||
2.20%, 3/15/2019 | 25,000 | 24,884 | ||||||
4.13%, 11/15/2042 | 25,000 | 23,105 | ||||||
Anthem, Inc.: | ||||||||
2.25%, 8/15/2019 | 50,000 | 49,142 | ||||||
3.50%, 8/15/2024 | 25,000 | 24,406 | ||||||
Cigna Corp. | 50,000 | 54,836 | ||||||
Howard Hughes Medical Institute | 25,000 | 25,944 | ||||||
Humana, Inc. | 25,000 | 24,888 | ||||||
Laboratory Corp. of America Holdings | 25,000 | 24,594 | ||||||
Memorial Sloan-Kettering Cancer Center | 25,000 | 23,243 | ||||||
Quest Diagnostics, Inc.: | ||||||||
2.70%, 4/1/2019 | 25,000 | 24,922 | ||||||
4.70%, 3/30/2045 | 25,000 | 22,712 | ||||||
UnitedHealth Group, Inc.: | ||||||||
1.90%, 7/16/2018 | 25,000 | 25,071 | ||||||
2.70%, 7/15/2020 | 5,000 | 5,053 | ||||||
2.88%, 3/15/2022 | 25,000 | 24,928 | ||||||
3.75%, 7/15/2025 | 5,000 | 5,152 | ||||||
4.63%, 7/15/2035 | 25,000 | 25,999 | ||||||
4.75%, 7/15/2045 | 5,000 | 5,254 | ||||||
6.88%, 2/15/2038 | 25,000 | 32,758 | ||||||
|
| |||||||
| 446,891 | ||||||||
|
| |||||||
Holding Companies-Divers – 0.0%(b) |
| |||||||
MUFG Americas Holdings Corp. | 25,000 | 24,374 | ||||||
|
| |||||||
Household Products – 0.1% |
| |||||||
Colgate-Palmolive Co. | 25,000 | 24,945 | ||||||
Estee Lauder Cos., Inc. | 25,000 | 22,561 | ||||||
Procter & Gamble Co. | 50,000 | 60,993 | ||||||
|
| |||||||
| 108,499 | ||||||||
|
| |||||||
Household Products & Wares – 0.0%(b) |
| |||||||
Kimberly-Clark Corp. | 25,000 | 24,792 | ||||||
|
| |||||||
Insurance – 0.9% | ||||||||
ACE INA Holdings, Inc.: | ||||||||
4.15%, 3/13/2043 | 25,000 | 24,128 | ||||||
4.35%, 11/3/2045 | 25,000 | 25,332 | ||||||
Aflac, Inc. | 50,000 | 50,675 | ||||||
Allstate Corp. | 25,000 | 25,500 | ||||||
American International Group, Inc.: | ||||||||
2.30%, 7/16/2019 | 25,000 | 24,772 | ||||||
4.88%, 6/1/2022 | 50,000 | 53,932 | ||||||
Aon PLC | 25,000 | 23,241 | ||||||
Berkshire Hathaway Finance Corp. | 25,000 | 25,142 | ||||||
Berkshire Hathaway, Inc. | 25,000 | 25,359 | ||||||
First American Financial Corp. | 25,000 | 25,043 | ||||||
Hartford Financial Services Group, Inc. | 25,000 | 27,354 | ||||||
Lincoln National Corp. | 50,000 | 58,412 | ||||||
Marsh & McLennan Cos., Inc.: | ||||||||
Series MTN, 2.55%, 10/15/2018 | 25,000 | 25,212 | ||||||
3.75%, 3/14/2026 | 25,000 | 24,945 | ||||||
MetLife, Inc.: | ||||||||
1.76%, 12/15/2017 | 25,000 | 25,013 | ||||||
Series D, 4.37%, 9/15/2023 | 50,000 | 53,683 | ||||||
Principal Financial Group, Inc. | 25,000 | 24,875 | ||||||
Progressive Corp. | 50,000 | 52,595 | ||||||
Prudential Financial, Inc.: | 50,000 | 50,267 | ||||||
6.63%, 6/21/2040 | 25,000 | 30,944 | ||||||
Travelers Cos., Inc. | 25,000 | 31,420 | ||||||
XLIT, Ltd. | 25,000 | 23,480 | ||||||
|
| |||||||
| 731,324 | ||||||||
|
| |||||||
Internet – 0.1% | ||||||||
Amazon.com, Inc. | 25,000 | 24,216 | ||||||
eBay, Inc. | 25,000 | 23,702 | ||||||
|
| |||||||
| 47,918 | ||||||||
|
| |||||||
Iron/Steel – 0.1% | ||||||||
Nucor Corp. | 25,000 | 24,242 | ||||||
Vale Overseas, Ltd.: | ||||||||
4.38%, 1/11/2022 | 25,000 | 18,937 | ||||||
8.25%, 1/17/2034 | 25,000 | 20,094 | ||||||
|
| |||||||
| 63,273 | ||||||||
|
| |||||||
IT Services – 0.6% | ||||||||
Apple, Inc.: | ||||||||
1.05%, 5/5/2017 | 25,000 | 25,006 | ||||||
1.55%, 2/7/2020 | 25,000 | 24,530 | ||||||
2.40%, 5/3/2023 | 25,000 | 24,282 | ||||||
2.85%, 5/6/2021 | 25,000 | 25,522 | ||||||
3.85%, 5/4/2043 | 25,000 | 23,124 | ||||||
4.38%, 5/13/2045 | 75,000 | 75,430 | ||||||
See accompanying notes to financial statements.
19
Table of Contents
State Street Aggregate Bond Index Portfolio
Schedule of Investments — (continued)
December 31, 2015
Security Description | Principal Amount | Value | ||||||
CORPORATE BONDS & NOTES – (continued) |
| |||||||
IT Services – (continued) | ||||||||
EMC Corp. | $ | 25,000 | $ | 23,256 | ||||
Hewlett Packard Enterprise Co.: | ||||||||
2.85%, 10/5/2018(c) | 20,000 | 19,966 | ||||||
3.60%, 10/15/2020(c) | 10,000 | 10,008 | ||||||
4.90%, 10/15/2025(c) | 20,000 | 19,624 | ||||||
6.20%, 10/15/2035(c) | 10,000 | 9,613 | ||||||
6.35%, 10/15/2045(c) | 10,000 | 9,525 | ||||||
HP, Inc. | 25,000 | 23,927 | ||||||
International Business Machines Corp.: | ||||||||
2.88%, 11/9/2022 | 100,000 | 99,498 | ||||||
3.63%, 2/12/2024 | 50,000 | 51,342 | ||||||
5.88%, 11/29/2032 | 25,000 | 30,236 | ||||||
Seagate HDD Cayman | 50,000 | 43,750 | ||||||
|
| |||||||
| 538,639 | ||||||||
|
| |||||||
Lodging – 0.1% | ||||||||
Marriott International, Inc. | 50,000 | 49,583 | ||||||
Starwood Hotels & Resorts Worldwide, Inc. | 25,000 | 24,379 | ||||||
|
| |||||||
| 73,962 | ||||||||
|
| |||||||
Machinery, Construction & Mining – 0.1% |
| |||||||
Caterpillar Financial Services Corp.: | ||||||||
Series MTN, 1.00%, 3/3/2017 | 25,000 | 24,904 | ||||||
Series MTN, 3.75%, 11/24/2023 | 25,000 | 25,942 | ||||||
Caterpillar, Inc. | 25,000 | 23,863 | ||||||
|
| |||||||
| 74,709 | ||||||||
|
| |||||||
Machinery-Diversified – 0.1% |
| |||||||
Deere & Co. | 25,000 | 24,569 | ||||||
John Deere Capital Corp.: | ||||||||
Series MTN, 2.38%, 7/14/2020 | 25,000 | 24,919 | ||||||
Series MTN, 3.40%, 9/11/2025 | 25,000 | 25,318 | ||||||
|
| |||||||
| 74,806 | ||||||||
|
| |||||||
Media – 1.0% | ||||||||
21st Century Fox America, Inc.: | ||||||||
4.00%, 10/1/2023 | 25,000 | 25,746 | ||||||
5.40%, 10/1/2043 | 25,000 | 26,105 | ||||||
7.25%, 5/18/2018 | 25,000 | 27,897 | ||||||
CBS Corp. | 25,000 | 24,614 | ||||||
CCO Safari II LLC: | ||||||||
3.58%, 7/23/2020(c) | 15,000 | 14,924 | ||||||
4.91%, 7/23/2025(c) | 50,000 | 49,743 | ||||||
6.48%, 10/23/2045(c) | 10,000 | 10,043 | ||||||
Comcast Corp.: | ||||||||
3.60%, 3/1/2024 | 25,000 | 25,903 | ||||||
4.25%, 1/15/2033 | 50,000 | 49,520 | ||||||
4.65%, 7/15/2042 | 25,000 | 25,538 | ||||||
DIRECTV Holdings LLC/ DIRECTV Financing Co., Inc.: | ||||||||
2.40%, 3/15/2017 | 25,000 | 25,213 | ||||||
4.45%, 4/1/2024 | 25,000 | 25,633 | ||||||
Discovery Communications LLC | 25,000 | 22,973 | ||||||
NBCUniversal Media LLC: | ||||||||
5.15%, 4/30/2020 | 50,000 | 55,730 | ||||||
6.40%, 4/30/2040 | 50,000 | 61,821 | ||||||
Thomson Reuters Corp. | 25,000 | 24,624 | ||||||
Time Warner Cable, Inc.: | ||||||||
4.00%, 9/1/2021 | 25,000 | 25,303 | ||||||
5.50%, 9/1/2041 | 25,000 | 22,645 | ||||||
5.88%, 11/15/2040 | 50,000 | 47,404 | ||||||
6.75%, 7/1/2018 | 25,000 | 27,290 | ||||||
Time Warner, Inc.: | ||||||||
3.55%, 6/1/2024 | 25,000 | 24,543 | ||||||
4.65%, 6/1/2044 | 25,000 | 23,109 | ||||||
6.50%, 11/15/2036 | 50,000 | 57,586 | ||||||
Viacom, Inc.: | ||||||||
2.20%, 4/1/2019 | 25,000 | 24,422 | ||||||
4.38%, 3/15/2043 | 25,000 | 17,961 | ||||||
4.88%, 6/15/2043 | 25,000 | 19,643 | ||||||
Walt Disney Co.: | ||||||||
Series MTN, 1.10%, 12/1/2017 | 25,000 | 24,890 | ||||||
Series GMTN, 3.15%, 9/17/2025 | 25,000 | 25,259 | ||||||
Series MTN, 5.50%, 3/15/2019 | 25,000 | 27,826 | ||||||
|
| |||||||
| 863,908 | ||||||||
|
| |||||||
Metal Fabricate & Hardware – 0.0%(b) |
| |||||||
Precision Castparts Corp. | 25,000 | 24,018 | ||||||
|
| |||||||
Mining – 0.3% | ||||||||
Barrick Gold Corp. | 25,000 | 16,664 | ||||||
Barrick North America Finance LLC | 25,000 | 22,423 | ||||||
BHP Billiton Finance USA, Ltd.: | ||||||||
1.63%, 2/24/2017 | 50,000 | 49,911 | ||||||
4.13%, 2/24/2042 | 25,000 | 20,055 | ||||||
Freeport-McMoRan, Inc.: | ||||||||
2.38%, 3/15/2018 | 25,000 | 19,500 | ||||||
3.55%, 3/1/2022 | 25,000 | 14,500 | ||||||
4.55%, 11/14/2024 | 25,000 | 14,375 | ||||||
Newmont Mining Corp. | 25,000 | 22,308 | ||||||
Rio Tinto Finance USA PLC: | ||||||||
2.25%, 12/14/2018 | 25,000 | 24,216 | ||||||
3.50%, 3/22/2022 | 25,000 | 23,491 | ||||||
Rio Tinto Finance USA, Ltd. | 50,000 | 45,351 | ||||||
Southern Copper Corp. | 7,000 | 5,409 | ||||||
|
| |||||||
| 278,203 | ||||||||
|
| |||||||
Miscellaneous Manufacturer – 0.2% |
| |||||||
3M Co. | 25,000 | 24,812 | ||||||
See accompanying notes to financial statements.
20
Table of Contents
State Street Aggregate Bond Index Portfolio
Schedule of Investments — (continued)
December 31, 2015
Security Description | Principal Amount | Value | ||||||
CORPORATE BONDS & NOTES – (continued) |
| |||||||
Miscellaneous Manufacturer – (continued) |
| |||||||
Eaton Corp. | $ | 25,000 | $ | 24,806 | ||||
General Electric Co. | 50,000 | 51,456 | ||||||
Illinois Tool Works, Inc. | 25,000 | 24,923 | ||||||
Ingersoll-Rand Global Holding Co., Ltd. | 25,000 | 27,575 | ||||||
Parker-Hannifin Corp. | 50,000 | 50,504 | ||||||
|
| |||||||
| 204,076 | ||||||||
|
| |||||||
Multi-National – 1.4% | ||||||||
African Development Bank | 25,000 | 24,919 | ||||||
Asian Development Bank: | ||||||||
1.75%, 9/11/2018 | 50,000 | 50,453 | ||||||
2.13%, 11/24/2021 | 75,000 | 75,073 | ||||||
Council of Europe Development Bank | 25,000 | 24,853 | ||||||
European Bank for Reconstruction & Development: | ||||||||
1.00%, 9/17/2018 | 50,000 | 49,414 | ||||||
1.63%, 11/15/2018 | 25,000 | 25,108 | ||||||
European Investment Bank: | ||||||||
0.88%, 4/18/2017 | 50,000 | 49,832 | ||||||
1.00%, 6/15/2018 | 50,000 | 49,516 | ||||||
1.13%, 8/15/2018 | 75,000 | 74,389 | ||||||
1.75%, 6/17/2019 | 25,000 | 25,063 | ||||||
1.88%, 3/15/2019 | 50,000 | 50,403 | ||||||
1.88%, 2/10/2025 | 100,000 | 95,267 | ||||||
2.13%, 10/15/2021 | 50,000 | 49,926 | ||||||
2.50%, 4/15/2021 | 50,000 | 51,050 | ||||||
2.50%, 10/15/2024 | 25,000 | 25,189 | ||||||
Inter-American Development Bank: | ||||||||
1.13%, 8/28/2018 | 50,000 | 49,651 | ||||||
1.25%, 1/16/2018 | 25,000 | 25,009 | ||||||
1.25%, 10/15/2019 | 100,000 | 98,308 | ||||||
1.88%, 6/16/2020 | 35,000 | 35,011 | ||||||
2.13%, 11/9/2020 | 25,000 | 25,227 | ||||||
International Bank for Reconstruction & Development: | ||||||||
1.00%, 10/5/2018 | 100,000 | 98,913 | ||||||
2.13%, 11/1/2020 | 25,000 | 25,250 | ||||||
Series GDIF, 2.50%, 11/25/2024 | 50,000 | 50,462 | ||||||
Series GDIF, 2.50%, 7/29/2025 | 50,000 | 50,344 | ||||||
Series GMTN, 4.75%, 2/15/2035 | 25,000 | 30,639 | ||||||
|
| |||||||
| 1,209,269 | ||||||||
|
| |||||||
Office & Business Equipment – 0.0%(b) |
| |||||||
Xerox Corp. | 25,000 | 25,152 | ||||||
|
| |||||||
Oil & Gas – 1.9% | ||||||||
Anadarko Petroleum Corp.: | ||||||||
3.45%, 7/15/2024 | 50,000 | 44,104 | ||||||
6.20%, 3/15/2040 | 25,000 | 22,626 | ||||||
Apache Corp. | 50,000 | 47,317 | ||||||
BP Capital Markets PLC: | ||||||||
1.38%, 5/10/2018 | 25,000 | 24,599 | ||||||
1.67%, 2/13/2018 | 25,000 | 24,871 | ||||||
2.24%, 5/10/2019 | 25,000 | 24,789 | ||||||
3.81%, 2/10/2024 | 25,000 | 24,893 | ||||||
Canadian Natural Resources, Ltd.: | ||||||||
3.45%, 11/15/2021 | 25,000 | 23,107 | ||||||
3.90%, 2/1/2025 | 25,000 | 21,882 | ||||||
Chevron Corp.: | ||||||||
1.72%, 6/24/2018 | 25,000 | 24,846 | ||||||
2.42%, 11/17/2020 | 75,000 | 74,379 | ||||||
3.19%, 6/24/2023 | 25,000 | 25,105 | ||||||
ConocoPhillips Co.: | ||||||||
2.20%, 5/15/2020 | 50,000 | 48,271 | ||||||
5.75%, 2/1/2019 | 25,000 | 27,086 | ||||||
ConocoPhillips Holding Co. | 50,000 | 56,636 | ||||||
Continental Resources, Inc. | 25,000 | 17,500 | ||||||
Devon Energy Corp. | 25,000 | 21,733 | ||||||
Ecopetrol SA | 50,000 | 41,625 | ||||||
EOG Resources, Inc. | 25,000 | 21,991 | ||||||
Exxon Mobil Corp. | 25,000 | 24,925 | ||||||
Hess Corp. | 25,000 | 20,707 | ||||||
Marathon Oil Corp. | 25,000 | 20,109 | ||||||
Marathon Petroleum Corp. | 50,000 | 47,305 | ||||||
Nexen Energy ULC | 100,000 | 107,871 | ||||||
Noble Energy, Inc. | 25,000 | 19,616 | ||||||
Noble Holding International, Ltd. | 25,000 | 14,750 | ||||||
Occidental Petroleum Corp. | 25,000 | 26,228 | ||||||
Petro-Canada | 25,000 | 25,370 | ||||||
Petroleos Mexicanos: | ||||||||
2.46%, 12/15/2025 | 25,000 | 24,992 | ||||||
3.50%, 7/18/2018 | 25,000 | 24,829 | ||||||
3.50%, 1/30/2023 | 25,000 | 21,718 | ||||||
4.25%, 1/15/2025(c) | 25,000 | 21,972 | ||||||
5.50%, 6/27/2044(c) | 25,000 | 18,940 | ||||||
6.38%, 1/23/2045 | 100,000 | 84,903 | ||||||
Phillips 66 | 35,000 | 36,209 | ||||||
Shell International Finance B.V.: | ||||||||
4.30%, 9/22/2019 | 25,000 | 26,682 | ||||||
See accompanying notes to financial statements.
21
Table of Contents
State Street Aggregate Bond Index Portfolio
Schedule of Investments — (continued)
December 31, 2015
Security Description | Principal Amount | Value | ||||||
CORPORATE BONDS & NOTES – (continued) |
| |||||||
Oil & Gas – (continued) | ||||||||
4.38%, 5/11/2045 | $ | 100,000 | $ | 93,788 | ||||
5.50%, 3/25/2040 | 25,000 | 27,037 | ||||||
Statoil ASA: | 25,000 | 24,914 | ||||||
2.65%, 1/15/2024 | 75,000 | 70,942 | ||||||
3.70%, 3/1/2024 | 25,000 | 25,395 | ||||||
Suncor Energy, Inc. | 25,000 | 23,492 | ||||||
Total Capital International SA | 25,000 | 25,345 | ||||||
Total Capital SA | 25,000 | 25,076 | ||||||
Valero Energy Corp. | 25,000 | 27,475 | ||||||
XTO Energy, Inc. | 25,000 | 34,339 | ||||||
|
| |||||||
| 1,562,289 | ||||||||
|
| |||||||
Oil & Gas Services – 0.2% | ||||||||
Baker Hughes, Inc. | 25,000 | 24,619 | ||||||
Halliburton Co.: | ||||||||
5.00%, 11/15/2045 | 35,000 | 34,359 | ||||||
7.45%, 9/15/2039 | 25,000 | 30,572 | ||||||
National Oilwell Varco, Inc. | 75,000 | 65,888 | ||||||
|
| |||||||
| 155,438 | ||||||||
|
| |||||||
Pharmaceuticals – 1.1% | ||||||||
Abbott Laboratories | 25,000 | 24,650 | ||||||
AbbVie, Inc.: | ||||||||
1.75%, 11/6/2017 | 25,000 | 24,954 | ||||||
2.50%, 5/14/2020 | 25,000 | 24,672 | ||||||
2.90%, 11/6/2022 | 25,000 | 24,248 | ||||||
4.50%, 5/14/2035 | 50,000 | 48,797 | ||||||
Actavis Funding SCS: | ||||||||
2.35%, 3/12/2018 | 25,000 | 25,029 | ||||||
3.00%, 3/12/2020 | 25,000 | 25,028 | ||||||
3.80%, 3/15/2025 | 25,000 | 24,892 | ||||||
4.75%, 3/15/2045 | 25,000 | 24,533 | ||||||
Actavis, Inc. | 25,000 | 24,911 | ||||||
AstraZeneca PLC: | ||||||||
3.38%, 11/16/2025 | 35,000 | 34,707 | ||||||
4.00%, 9/18/2042 | 25,000 | 23,549 | ||||||
Baxalta, Inc.: | ||||||||
2.88%, 6/23/2020(c) | 25,000 | 24,714 | ||||||
4.00%, 6/23/2025(c) | 25,000 | 24,755 | ||||||
Bristol-Myers Squibb Co. | 25,000 | 24,846 | ||||||
Cardinal Health, Inc. | 25,000 | 24,772 | ||||||
Eli Lilly & Co. | 25,000 | 29,902 | ||||||
Express Scripts Holding Co.: | ||||||||
2.25%, 6/15/2019 | 25,000 | 24,753 | ||||||
6.13%, 11/15/2041 | 25,000 | 28,190 | ||||||
GlaxoSmithKline Capital, Inc.: | ||||||||
2.80%, 3/18/2023 | 25,000 | 24,877 | ||||||
4.20%, 3/18/2043 | 25,000 | 24,918 | ||||||
Johnson & Johnson: | ||||||||
3.38%, 12/5/2023 | 25,000 | 26,517 | ||||||
5.55%, 8/15/2017 | 25,000 | 26,749 | ||||||
McKesson Corp. | 25,000 | 24,910 | ||||||
Merck & Co., Inc.: | ||||||||
2.40%, 9/15/2022 | 25,000 | 24,354 | ||||||
3.60%, 9/15/2042 | 25,000 | 22,830 | ||||||
3.70%, 2/10/2045 | 25,000 | 23,108 | ||||||
Novartis Capital Corp. | 25,000 | 25,834 | ||||||
Novartis Securities Investment, Ltd. | 25,000 | 27,382 | ||||||
Pfizer, Inc. | 25,000 | 25,594 | ||||||
Sanofi | 25,000 | 26,704 | ||||||
Teva Pharmaceutical Finance IV LLC | 25,000 | 24,166 | ||||||
Wyeth LLC: | ||||||||
5.45%, 4/1/2017 | 50,000 | 52,575 | ||||||
6.00%, 2/15/2036 | 25,000 | 30,040 | ||||||
Zoetis, Inc. | 25,000 | 21,976 | ||||||
|
| |||||||
| 944,436 | ||||||||
|
| |||||||
Pipelines – 0.6% | ||||||||
Buckeye Partners L.P. | 25,000 | 23,887 | ||||||
Enbridge Energy Partners L.P. | 25,000 | 23,836 | ||||||
Energy Transfer Partners L.P.: | ||||||||
4.75%, 1/15/2026 | 25,000 | 21,436 | ||||||
5.15%, 2/1/2043 | 25,000 | 17,854 | ||||||
6.70%, 7/1/2018 | 50,000 | 52,124 | ||||||
Enterprise Products Operating LLC: | ||||||||
4.85%, 3/15/2044 | 50,000 | 39,825 | ||||||
Series N, 6.50%, 1/31/2019 | 25,000 | 26,981 | ||||||
Kinder Morgan Energy Partners L.P.: | ||||||||
3.50%, 3/1/2021 | 25,000 | 22,462 | ||||||
5.40%, 9/1/2044 | 25,000 | 19,154 | ||||||
Kinder Morgan, Inc.: | ||||||||
3.05%, 12/1/2019 | 25,000 | 23,033 | ||||||
5.05%, 2/15/2046 | 50,000 | 36,983 | ||||||
ONEOK Partners L.P. | 25,000 | 20,217 | ||||||
Plains All American Pipeline L.P./PAA Finance Corp. | 25,000 | 20,219 | ||||||
Spectra Energy Partners L.P. | 25,000 | 24,374 | ||||||
Sunoco Logistics Partners Operations L.P. | 25,000 | 18,844 | ||||||
See accompanying notes to financial statements.
22
Table of Contents
State Street Aggregate Bond Index Portfolio
Schedule of Investments — (continued)
December 31, 2015
Security Description | Principal Amount | Value | ||||||
CORPORATE BONDS & NOTES – (continued) |
| |||||||
Pipelines – (continued) | ||||||||
TransCanada PipeLines, Ltd.: | ||||||||
4.63%, 3/1/2034 | $ | 50,000 | $ | 47,092 | ||||
6.35%, 5/15/2067 | 25,000 | 18,750 | ||||||
7.63%, 1/15/2039 | 25,000 | 31,054 | ||||||
Williams Partners L.P.: | ||||||||
3.90%, 1/15/2025 | 50,000 | 37,449 | ||||||
5.25%, 3/15/2020 | 25,000 | 23,084 | ||||||
|
| |||||||
| 548,658 | ||||||||
|
| |||||||
Real Estate – 0.1% | ||||||||
Prologis L.P. | 50,000 | 49,609 | ||||||
|
| |||||||
Real Estate Investment Trusts – 0.7% |
| |||||||
American Tower Corp.: | ||||||||
3.40%, 2/15/2019 | 25,000 | 25,482 | ||||||
3.50%, 1/31/2023 | 50,000 | 48,484 | ||||||
AvalonBay Communities, Inc. | 25,000 | 24,439 | ||||||
Boston Properties L.P. | 25,000 | 25,489 | ||||||
Brandywine Operating Partnership L.P. | 25,000 | 24,149 | ||||||
DDR Corp. | 25,000 | 24,862 | ||||||
Digital Realty Trust L.P. | 25,000 | 24,737 | ||||||
Duke Realty L.P. | 25,000 | 25,571 | ||||||
ERP Operating L.P. | 50,000 | 49,957 | ||||||
HCP, Inc. | 25,000 | 24,547 | ||||||
Hospitality Properties Trust | 25,000 | 24,803 | ||||||
Realty Income Corp. | 50,000 | 49,779 | ||||||
Simon Property Group L.P.: | ||||||||
2.15%, 9/15/2017 | 25,000 | 25,222 | ||||||
5.65%, 2/1/2020 | 25,000 | 27,959 | ||||||
Tanger Properties L.P. | 25,000 | 24,830 | ||||||
Ventas Realty L.P./Ventas Capital Corp. | 50,000 | 49,748 | ||||||
Welltower, Inc. | 50,000 | 54,208 | ||||||
Weyerhaeuser Co. | 25,000 | 26,016 | ||||||
|
| |||||||
| 580,282 | ||||||||
|
| |||||||
Retail – 1.0% | ||||||||
AutoNation, Inc. | 25,000 | 24,942 | ||||||
AutoZone, Inc. | 25,000 | 24,512 | ||||||
Costco Wholesale Corp. | 25,000 | 24,891 | ||||||
CVS Health Corp.: | ||||||||
2.80%, 7/20/2020 | 20,000 | 20,092 | ||||||
3.38%, 8/12/2024 | 25,000 | 24,722 | ||||||
3.88%, 7/20/2025 | 20,000 | 20,359 | ||||||
4.00%, 12/5/2023 | 25,000 | 25,997 | ||||||
4.88%, 7/20/2035 | 20,000 | 20,692 | ||||||
5.13%, 7/20/2045 | 10,000 | 10,604 | ||||||
Dollar General Corp. | 25,000 | 24,709 | ||||||
Home Depot, Inc.: | ||||||||
2.00%, 6/15/2019 | 25,000 | 25,162 | ||||||
2.25%, 9/10/2018 | 25,000 | 25,481 | ||||||
3.75%, 2/15/2024 | 25,000 | 26,530 | ||||||
Kohl’s Corp. | 20,000 | 18,708 | ||||||
Lowe’s Cos., Inc.: | ||||||||
3.38%, 9/15/2025 | 25,000 | 25,343 | ||||||
4.25%, 9/15/2044 | 25,000 | 24,916 | ||||||
4.38%, 9/15/2045 | 25,000 | 25,603 | ||||||
Macy’s Retail Holdings, Inc. | 25,000 | 23,025 | ||||||
McDonald’s Corp.: | ||||||||
1.88%, 5/29/2019 | 25,000 | 24,596 | ||||||
2.75%, 12/9/2020 | 25,000 | 25,022 | ||||||
Series GMTN, 5.80%, 10/15/2017 | 25,000 | 26,723 | ||||||
QVC, Inc. | 50,000 | 42,974 | ||||||
Starbucks Corp. | 25,000 | 26,546 | ||||||
Target Corp.: | ||||||||
2.30%, 6/26/2019 | 25,000 | 25,335 | ||||||
6.00%, 1/15/2018 | 25,000 | 27,264 | ||||||
Wal-Mart Stores, Inc.: | ||||||||
1.13%, 4/11/2018 | 25,000 | 24,860 | ||||||
1.95%, 12/15/2018 | 25,000 | 25,270 | ||||||
4.00%, 4/11/2043 | 25,000 | 24,310 | ||||||
4.88%, 7/8/2040 | 50,000 | 54,012 | ||||||
5.25%, 9/1/2035 | 25,000 | 28,525 | ||||||
Walgreen Co. | 25,000 | 24,079 | ||||||
Walgreens Boots Alliance, Inc. | 25,000 | 22,854 | ||||||
|
| |||||||
| 818,658 | ||||||||
|
| |||||||
Semiconductors – 0.2% | ||||||||
Applied Materials, Inc. | 25,000 | 25,028 | ||||||
Intel Corp.: | ||||||||
2.45%, 7/29/2020 | 50,000 | 50,431 | ||||||
3.30%, 10/1/2021 | 25,000 | 25,820 | ||||||
Lam Research Corp. | 25,000 | 24,338 | ||||||
QUALCOMM, Inc. | 50,000 | 49,523 | ||||||
Texas Instruments, Inc. | 25,000 | 25,058 | ||||||
|
| |||||||
| 200,198 | ||||||||
|
| |||||||
See accompanying notes to financial statements.
23
Table of Contents
State Street Aggregate Bond Index Portfolio
Schedule of Investments — (continued)
December 31, 2015
Security Description | Principal Amount | Value | ||||||
CORPORATE BONDS & NOTES – (continued) |
| |||||||
Software – 0.5% | ||||||||
Fidelity National Information Services, Inc. | $ | 25,000 | $ | 23,836 | ||||
Microsoft Corp.: | ||||||||
2.00%, 11/3/2020 | 50,000 | 49,884 | ||||||
3.63%, 12/15/2023 | 25,000 | 26,411 | ||||||
4.20%, 11/3/2035 | 65,000 | 65,859 | ||||||
4.45%, 11/3/2045 | 25,000 | 25,790 | ||||||
5.20%, 6/1/2039 | 50,000 | 56,439 | ||||||
Oracle Corp.: | ||||||||
2.25%, 10/8/2019 | 75,000 | 75,539 | ||||||
2.38%, 1/15/2019 | 25,000 | 25,341 | ||||||
2.50%, 5/15/2022 | 50,000 | 48,940 | ||||||
2.95%, 5/15/2025 | 10,000 | 9,731 | ||||||
3.90%, 5/15/2035 | 5,000 | 4,726 | ||||||
4.38%, 5/15/2055 | 10,000 | 9,301 | ||||||
|
| |||||||
| 421,797 | ||||||||
|
| |||||||
Sovereign – 0.0%(b) | ||||||||
Svensk Exportkredit AB | 25,000 | 25,198 | ||||||
|
| |||||||
Telecommunications – 1.2% |
| |||||||
AT&T, Inc.: | ||||||||
1.40%, 12/1/2017 | 50,000 | 49,641 | ||||||
2.30%, 3/11/2019 | 25,000 | 24,961 | ||||||
3.90%, 3/11/2024 | 25,000 | 25,487 | ||||||
4.80%, 6/15/2044 | 50,000 | 46,071 | ||||||
6.30%, 1/15/2038 | 50,000 | 55,207 | ||||||
BellSouth LLC | 50,000 | 53,215 | ||||||
Cisco Systems, Inc.: | ||||||||
2.13%, 3/1/2019 | 25,000 | 25,171 | ||||||
3.00%, 6/15/2022 | 25,000 | 25,432 | ||||||
3.50%, 6/15/2025 | 25,000 | 25,761 | ||||||
3.63%, 3/4/2024 | 25,000 | 26,133 | ||||||
Motorola Solutions, Inc. | 25,000 | 21,618 | ||||||
Orange SA | 25,000 | 25,296 | ||||||
Telefonica Europe B.V. | 25,000 | 32,842 | ||||||
Telefonos de Mexico SAB de CV | 100,000 | 109,551 | ||||||
Verizon Communications, Inc.: | ||||||||
3.50%, 11/1/2024 | 50,000 | 49,156 | ||||||
4.27%, 1/15/2036 | 28,000 | 25,372 | ||||||
4.50%, 9/15/2020 | 50,000 | 53,606 | ||||||
4.52%, 9/15/2048 | 25,000 | 22,311 | ||||||
4.86%, 8/21/2046 | 50,000 | 47,421 | ||||||
5.05%, 3/15/2034 | 35,000 | 34,997 | ||||||
5.15%, 9/15/2023 | 50,000 | 54,800 | ||||||
6.40%, 9/15/2033 | 15,000 | 17,255 | ||||||
6.40%, 2/15/2038 | 25,000 | 28,662 | ||||||
6.55%, 9/15/2043 | 50,000 | 59,347 | ||||||
6.90%, 4/15/2038 | 15,000 | 18,093 | ||||||
Vodafone Group PLC: | ||||||||
1.50%, 2/19/2018 | 25,000 | 24,738 | ||||||
2.95%, 2/19/2023 | 25,000 | 23,569 | ||||||
4.38%, 2/19/2043 | 50,000 | 40,316 | ||||||
|
| |||||||
| 1,046,029 | ||||||||
|
| |||||||
Toys/Games/Hobbies – 0.0%(b) |
| |||||||
Mattel, Inc. | 25,000 | 24,760 | ||||||
|
| |||||||
Transportation – 0.4% | ||||||||
Burlington Northern Santa Fe LLC: | ||||||||
3.75%, 4/1/2024 | 25,000 | 25,598 | ||||||
4.45%, 3/15/2043 | 50,000 | 48,014 | ||||||
4.55%, 9/1/2044 | 25,000 | 24,373 | ||||||
Canadian National Railway Co. | 50,000 | 49,322 | ||||||
Canadian Pacific Railway Co. | 30,000 | 29,584 | ||||||
CSX Corp. | 25,000 | 24,750 | ||||||
FedEx Corp.: | ||||||||
4.00%, 1/15/2024 | 25,000 | 26,037 | ||||||
4.75%, 11/15/2045 | 25,000 | 24,683 | ||||||
Norfolk Southern Corp. | 25,000 | 24,557 | ||||||
Ryder System, Inc. | 25,000 | 24,439 | ||||||
Union Pacific Corp. | 25,000 | 26,718 | ||||||
United Parcel Service, Inc. | 25,000 | 24,684 | ||||||
|
| |||||||
| 352,759 | ||||||||
|
| |||||||
Trucking & Leasing – 0.1% | ||||||||
GATX Corp. | 50,000 | 49,164 | ||||||
|
| |||||||
Water – 0.0%(b) | ||||||||
American Water Capital Corp. | 25,000 | 24,949 | ||||||
|
| |||||||
TOTAL CORPORATE BONDS & NOTES |
| 22,365,510 | ||||||
|
| |||||||
FOREIGN GOVERNMENT OBLIGATIONS – 1.8% |
| |||||||
Canada Government International Bond: | ||||||||
1.13%, 3/19/2018 | 75,000 | 74,805 | ||||||
1.63%, 2/27/2019 | 50,000 | 50,192 | ||||||
Export-Import Bank of Korea | 100,000 | 110,971 | ||||||
Mexico Government International Bond: | ||||||||
3.50%, 1/21/2021 | 100,000 | 101,714 | ||||||
3.63%, 3/15/2022 | 100,000 | 100,601 | ||||||
4.75%, 3/8/2044 | 50,000 | 45,791 | ||||||
6.05%, 1/11/2040 | 30,000 | 32,950 | ||||||
Panama Government International Bond | 50,000 | 60,190 | ||||||
Peruvian Government International Bond | 50,000 | 51,356 | ||||||
Philippine Government International Bond | 100,000 | 140,750 | ||||||
Poland Government International Bond | 50,000 | 55,450 | ||||||
See accompanying notes to financial statements.
24
Table of Contents
State Street Aggregate Bond Index Portfolio
Schedule of Investments — (continued)
December 31, 2015
Security Description | Principal Amount | Value | ||||||
FOREIGN GOVERNMENT OBLIGATIONS – (continued) |
| |||||||
Province of British Columbia Canada | $ | 50,000 | $ | 51,073 | ||||
Province of Manitoba Canada | 25,000 | 24,770 | ||||||
Province of Nova Scotia Canada | 25,000 | 26,017 | ||||||
Province of Ontario Canada: | ||||||||
1.10%, 10/25/2017 | 50,000 | 49,769 | ||||||
2.50%, 9/10/2021 | 25,000 | 25,003 | ||||||
4.40%, 4/14/2020 | 50,000 | 54,616 | ||||||
Province of Quebec Canada: | ||||||||
2.63%, 2/13/2023 | 50,000 | 49,673 | ||||||
2.75%, 8/25/2021 | 50,000 | 50,686 | ||||||
South Africa Government International Bond | 100,000 | 107,270 | ||||||
Turkey Government International Bond: | ||||||||
6.75%, 4/3/2018 | 100,000 | 107,502 | ||||||
6.88%, 3/17/2036 | 50,000 | 56,125 | ||||||
Uruguay Government International Bond | 50,000 | 43,375 | ||||||
|
| |||||||
TOTAL FOREIGN GOVERNMENT OBLIGATIONS |
| 1,470,649 | ||||||
|
| |||||||
U.S. GOVERNMENT AGENCY OBLIGATIONS – 31.7% |
| |||||||
Federal Farm Credit Banks: | ||||||||
0.71%, 10/20/2017 | 100,000 | 99,416 | ||||||
3.50%, 12/20/2023 | 50,000 | 53,827 | ||||||
Federal Home Loan Bank: | ||||||||
Series 1, 0.88%, 5/24/2017 | 75,000 | 74,816 | ||||||
Series 1, 1.00%, 6/21/2017 | 100,000 | 99,874 | ||||||
1.88%, 3/8/2019 | 50,000 | 50,574 | ||||||
Series 0000, 2.25%, 6/11/2021 | 75,000 | 75,278 | ||||||
2.88%, 9/13/2024 | 50,000 | 51,088 | ||||||
Federal Home Loan Mortgage Corp.: | ||||||||
0.88%, 2/22/2017 | 75,000 | 74,915 | ||||||
0.88%, 3/7/2018 | 75,000 | 74,472 | ||||||
1.00%, 6/29/2017 | 50,000 | 49,931 | ||||||
1.00%, 9/29/2017 | 100,000 | 99,819 | ||||||
1.25%, 10/2/2019 | 75,000 | 73,953 | ||||||
2.38%, 1/13/2022 | 75,000 | 76,041 | ||||||
2.50%, 10/1/2029 | 85,262 | 86,084 | ||||||
TBA, 2.50%, 1/1/2031(d) | 750,000 | 756,562 | ||||||
TBA, 3.00%, 1/1/2031(d) | 500,000 | 515,234 | ||||||
3.00%, 6/1/2045 | 146,930 | 146,836 | ||||||
3.00%, 8/1/2045 | 295,834 | 295,645 | ||||||
TBA, 3.00%, 1/1/2046(d) | 500,000 | 499,258 | ||||||
Series K028, Class A2, 3.11%, 2/25/2023 | 100,000 | 102,753 | ||||||
Series K040, Class A2, 3.24%, 9/25/2024 | 75,000 | 76,714 | ||||||
Series K010, Class A1, 3.32%, 7/25/2020 | 49,062 | 50,421 | ||||||
3.50%, 11/1/2044 | 106,134 | 109,348 | ||||||
3.50%, 1/1/2045 | 136,006 | 140,148 | ||||||
3.50%, 7/1/2045 | 98,584 | 101,586 | ||||||
3.50%, 7/1/2045 | 98,182 | 101,319 | ||||||
3.50%, 10/1/2045 | 124,184 | 127,966 | ||||||
TBA, 3.50%, 1/1/2046(d) | 1,200,000 | 1,235,531 | ||||||
4.00%, 4/1/2025 | 193,085 | 202,749 | ||||||
4.00%, 4/1/2042 | 79,651 | 84,535 | ||||||
4.00%, 12/1/2044 | 125,929 | 133,098 | ||||||
4.00%, 4/1/2045 | 91,981 | 97,315 | ||||||
TBA, 4.00%, 1/1/2046(d) | 900,000 | 950,906 | ||||||
4.50%, 5/1/2044 | 172,013 | 185,356 | ||||||
5.00%, 4/18/2017 | 100,000 | 105,078 | ||||||
5.00%, 7/1/2041 | 381,449 | 416,466 | ||||||
6.25%, 7/15/2032 | 35,000 | 48,663 | ||||||
Federal National Mortgage Association: | ||||||||
0.75%, 4/20/2017 | 75,000 | 74,736 | ||||||
0.88%, 10/26/2017 | 75,000 | 74,672 | ||||||
0.88%, 5/21/2018 | 50,000 | 49,556 | ||||||
Series 0001, 1.00%, 9/27/2017 | 100,000 | 99,839 | ||||||
1.50%, 6/22/2020 | 100,000 | 98,772 | ||||||
Series 2013-M12, Class A, 1.53%, 10/25/2017 | 50,034 | 50,132 | ||||||
1.75%, 9/14/2018 | 200,000 | 201,037 | ||||||
1.75%, 9/12/2019 | 75,000 | 75,355 | ||||||
2.00%, 5/16/2017 | 100,000 | 100,525 | ||||||
2.00%, 9/26/2017 | 75,000 | 75,711 | ||||||
Series 2013-M12, Class APT, 2.39%, 3/25/2023(a) | 43,776 | 43,305 | ||||||
TBA, 2.50%, 1/1/2031(d) | 450,000 | 453,586 | ||||||
Series 2011-M5, Class A2, 2.94%, 7/25/2021 | 140,000 | 143,906 | ||||||
3.00%, 3/1/2028 | 100,000 | 98,733 | ||||||
3.00%, 10/1/2028 | 175,000 | 180,589 | ||||||
3.00%, 8/1/2029 | 91,901 | 94,752 | ||||||
3.00%, 6/1/2030 | 118,041 | 121,717 | ||||||
3.00%, 9/1/2030 | 95,666 | 98,646 | ||||||
3.00%, 11/1/2030 | 197,154 | 203,294 | ||||||
3.00%, 12/1/2030 | 124,359 | 128,232 | ||||||
3.00%, 7/1/2043 | 129,846 | 130,085 | ||||||
3.00%, 9/1/2045 | 123,057 | 123,170 | ||||||
TBA, 3.00%, 1/1/2046(d) | 1,375,000 | 1,375,107 | ||||||
3.50%, 11/1/2025 | 95,896 | 100,599 | ||||||
3.50%, 1/1/2027 | 111,585 | 117,058 | ||||||
3.50%, 5/1/2029 | 105,035 | 110,177 | ||||||
3.50%, 10/1/2029 | 80,961 | 84,925 | ||||||
3.50%, 10/1/2044 | 82,725 | 85,408 | ||||||
3.50%, 1/1/2045 | 110,419 | 114,022 | ||||||
3.50%, 1/1/2045 | 135,801 | 140,205 | ||||||
3.50%, 5/1/2045 | 95,802 | 98,928 | ||||||
3.50%, 8/1/2045 | 122,522 | 126,520 | ||||||
3.50%, 8/1/2045 | 171,212 | 176,798 | ||||||
3.50%, 11/1/2045 | 124,276 | 128,330 | ||||||
TBA, 3.50%, 1/1/2046(d) | 1,575,000 | 1,625,080 | ||||||
4.00%, 8/1/2018 | 98,859 | 103,178 | ||||||
4.00%, 1/1/2019 | 90,782 | 94,639 | ||||||
4.00%, 9/1/2019 | 145,585 | 151,843 | ||||||
4.00%, 5/1/2020 | 95,848 | 100,036 | ||||||
4.00%, 3/1/2021 | 100,851 | 105,381 | ||||||
4.00%, 10/1/2044 | 78,531 | 83,136 | ||||||
4.00%, 10/1/2044 | 67,796 | 71,772 | ||||||
4.00%, 3/1/2045 | 137,833 | 145,977 | ||||||
4.00%, 7/1/2045 | 121,878 | 129,080 | ||||||
TBA, 4.00%, 1/1/2046(d) | 1,500,000 | 1,587,422 | ||||||
See accompanying notes to financial statements.
25
Table of Contents
State Street Aggregate Bond Index Portfolio
Schedule of Investments — (continued)
December 31, 2015
Security Description | Principal Amount | Value | ||||||
U.S. GOVERNMENT AGENCY OBLIGATIONS – (continued) |
| |||||||
4.50%, 4/1/2018 | $ | 56,467 | $ | 58,657 | ||||
4.50%, 5/1/2020 | 66,655 | 69,240 | ||||||
4.50%, 12/1/2040 | 311,041 | 336,502 | ||||||
4.50%, 1/1/2042 | 150,335 | 162,745 | ||||||
4.50%, 9/1/2043 | 231,494 | 250,442 | ||||||
4.50%, 9/1/2043 | 73,465 | 79,349 | ||||||
4.50%, 11/1/2043 | 176,348 | 190,474 | ||||||
4.50%, 6/1/2044 | 221,120 | 238,836 | ||||||
5.00%, 7/1/2041 | 131,869 | 145,251 | ||||||
5.00%, 5/1/2042 | 129,890 | 143,071 | ||||||
5.00%, 1/1/2045 | 191,406 | 210,709 | ||||||
5.50%, 2/1/2037 | 72,250 | 80,515 | ||||||
5.50%, 9/1/2040 | 107,531 | 119,837 | ||||||
5.50%, 9/1/2041 | 176,206 | 196,345 | ||||||
TBA, 5.50%, 1/1/2046(d) | 350,000 | 390,305 | ||||||
6.63%, 11/15/2030 | 50,000 | 70,907 | ||||||
7.25%, 5/15/2030 | 75,000 | 111,146 | ||||||
Government National Mortgage Association: | ||||||||
3.00%, 12/20/2044 | 134,067 | 136,067 | ||||||
3.00%, 3/20/2045 | 71,381 | 72,429 | ||||||
3.00%, 6/20/2045 | 97,643 | 99,077 | ||||||
3.00%, 7/20/2045 | 171,889 | 174,413 | ||||||
3.00%, 8/20/2045 | 147,880 | 150,052 | ||||||
TBA, 3.00%, 1/1/2046(d) | 600,000 | 608,016 | ||||||
3.50%, 9/20/2043 | 98,166 | 102,626 | ||||||
3.50%, 10/20/2044 | 116,763 | 121,947 | ||||||
3.50%, 12/20/2044 | 82,501 | 86,164 | ||||||
3.50%, 4/20/2045 | 191,248 | 199,703 | ||||||
3.50%, 6/20/2045 | 145,224 | 151,643 | ||||||
TBA, 3.50%, 1/1/2046(d) | 1,700,000 | 1,772,781 | ||||||
4.00%, 4/15/2040 | 119,078 | 127,279 | ||||||
4.00%, 2/20/2042 | 51,506 | 54,855 | ||||||
4.00%, 7/20/2042 | 33,600 | 35,784 | ||||||
4.00%, 8/20/2044 | 79,201 | 84,174 | ||||||
4.00%, 10/20/2044 | 100,810 | 107,140 | ||||||
4.00%, 8/20/2045 | 97,182 | 103,459 | ||||||
TBA, 4.00%, 1/1/2046(d) | 875,000 | 928,594 | ||||||
4.50%, 1/20/2044 | 326,443 | 351,044 | ||||||
4.50%, 11/20/2044 | 124,703 | 134,057 | ||||||
4.50%, 12/20/2044 | 100,206 | 107,722 | ||||||
TBA, 4.50%, 1/1/2046(d) | 200,000 | 215,656 | ||||||
5.00%, 6/15/2040 | 98,149 | 108,901 | ||||||
5.00%, 10/15/2041 | 157,940 | 174,846 | ||||||
5.00%, 3/20/2044 | 165,869 | 181,925 | ||||||
5.50%, 10/20/2043 | 133,352 | 149,088 | ||||||
Tennessee Valley Authority | 50,000 | 45,721 | ||||||
|
| |||||||
TOTAL U.S. GOVERNMENT AGENCY OBLIGATIONS |
| 26,539,040 | ||||||
|
| |||||||
U.S. TREASURY OBLIGATIONS – 36.0% |
| |||||||
Treasury Bonds: | ||||||||
2.50%, 2/15/2045(e) | 540,000 | 484,839 | ||||||
2.75%, 8/15/2042(e) | 150,000 | 143,457 | ||||||
2.75%, 11/15/2042(e) | 350,000 | 333,921 | ||||||
2.88%, 8/15/2045(e) | 80,000 | 77,738 | ||||||
3.00%, 5/15/2042(e) | 200,000 | 201,330 | ||||||
3.00%, 11/15/2044(e) | 175,000 | 174,456 | ||||||
3.00%, 5/15/2045(e) | 375,000 | 373,459 | ||||||
3.13%, 11/15/2041(e) | 300,000 | 310,131 | ||||||
3.13%, 8/15/2044(e) | 500,000 | 511,355 | ||||||
3.63%, 8/15/2043(e) | 100,000 | 112,697 | ||||||
4.38%, 2/15/2038(e) | 350,000 | 441,777 | ||||||
4.38%, 5/15/2040(e) | 500,000 | 629,360 | ||||||
5.25%, 11/15/2028(e) | 450,000 | 587,876 | ||||||
Treasury Notes: | ||||||||
0.50%, 2/28/2017(e) | 500,000 | 498,080 | ||||||
0.50%, 4/30/2017(e) | 250,000 | 248,700 | ||||||
0.50%, 7/31/2017(e) | 750,000 | 744,382 | ||||||
0.63%, 5/31/2017(e) | 750,000 | 746,753 | ||||||
0.63%, 6/30/2017(e) | 300,000 | 298,515 | ||||||
0.63%, 7/31/2017(e) | 250,000 | 248,622 | ||||||
0.63%, 8/31/2017(e) | 1,000,000 | 993,690 | ||||||
0.75%, 6/30/2017(e) | 250,000 | 249,230 | ||||||
0.75%, 3/31/2018(e) | 250,000 | 247,822 | ||||||
0.75%, 4/15/2018(e) | 200,000 | 198,062 | ||||||
0.88%, 11/15/2017(e) | 750,000 | 747,517 | ||||||
0.88%, 1/15/2018(e) | 250,000 | 248,882 | ||||||
0.88%, 7/15/2018(e) | 350,000 | 346,888 | ||||||
0.88%, 10/15/2018(e) | 500,000 | 494,520 | ||||||
1.00%, 3/31/2017(e) | 750,000 | 751,305 | ||||||
1.00%, 2/15/2018(e) | 500,000 | 498,535 | ||||||
1.00%, 5/31/2018(e) | 500,000 | 497,515 | ||||||
1.00%, 8/15/2018(e) | 300,000 | 298,074 | ||||||
1.00%, 9/15/2018(e) | 100,000 | 99,292 | ||||||
1.00%, 8/31/2019(e) | 500,000 | 490,150 | ||||||
1.00%, 9/30/2019(e) | 750,000 | 734,438 | ||||||
1.13%, 6/15/2018(e) | 150,000 | 149,675 | ||||||
1.13%, 4/30/2020(e) | 100,000 | 97,726 | ||||||
1.25%, 1/31/2020(e) | 250,000 | 246,170 | ||||||
1.38%, 9/30/2018(e) | 100,000 | 100,314 | ||||||
1.38%, 2/28/2019(e) | 500,000 | 499,685 | ||||||
1.38%, 2/29/2020(e) | 500,000 | 494,325 | ||||||
1.38%, 4/30/2020(e) | 350,000 | 345,517 | ||||||
1.38%, 5/31/2020(e) | 500,000 | 492,850 | ||||||
1.38%, 8/31/2020(e) | 200,000 | 196,822 | ||||||
1.38%, 9/30/2020(e) | 250,000 | 245,697 | ||||||
1.38%, 10/31/2020(e) | 350,000 | 343,836 | ||||||
1.50%, 12/31/2018(e) | 750,000 | 753,435 | ||||||
1.50%, 5/31/2020(e) | 300,000 | 297,438 | ||||||
1.50%, 1/31/2022(e) | 200,000 | 194,458 | ||||||
1.63%, 8/31/2019(e) | 800,000 | 802,456 | ||||||
1.63%, 12/31/2019(e) | 750,000 | 750,135 | ||||||
1.63%, 6/30/2020(e) | 75,000 | 74,689 | ||||||
1.63%, 7/31/2020(e) | 100,000 | 99,535 | ||||||
1.75%, 10/31/2018(e) | 500,000 | 506,510 | ||||||
1.75%, 10/31/2020(e) | 650,000 | 649,103 | ||||||
1.75%, 2/28/2022(e) | 300,000 | 295,806 | ||||||
1.75%, 3/31/2022(e) | 250,000 | 246,182 | ||||||
1.75%, 4/30/2022(e) | 300,000 | 295,245 | ||||||
1.75%, 5/15/2023(e) | 250,000 | 243,583 | ||||||
1.88%, 9/30/2017(e) | 750,000 | 760,567 | ||||||
1.88%, 10/31/2017(e) | 500,000 | 507,280 | ||||||
1.88%, 5/31/2022(e) | 100,000 | 99,058 | ||||||
1.88%, 8/31/2022(e) | 150,000 | 148,290 | ||||||
2.00%, 2/28/2021(e) | 750,000 | 756,255 | ||||||
2.00%, 5/31/2021(e) | 350,000 | 352,429 | ||||||
2.00%, 8/31/2021(e) | 300,000 | 301,338 | ||||||
2.00%, 11/15/2021(e) | 500,000 | 501,605 | ||||||
See accompanying notes to financial statements.
26
Table of Contents
State Street Aggregate Bond Index Portfolio
Schedule of Investments — (continued)
December 31, 2015
Security Description | Principal Amount | Value | ||||||
U.S. TREASURY OBLIGATIONS – (continued) |
| |||||||
2.00%, 7/31/2022(e) | $ | 100,000 | $ | 99,742 | ||||
2.00%, 2/15/2023(e) | 500,000 | 497,120 | ||||||
2.00%, 2/15/2025(e) | 625,000 | 610,944 | ||||||
2.00%, 8/15/2025(e) | 450,000 | 438,768 | ||||||
2.13%, 8/31/2020(e) | 500,000 | 508,075 | ||||||
2.13%, 6/30/2022(e) | 150,000 | 150,791 | ||||||
2.13%, 12/31/2022(e) | 650,000 | 651,222 | ||||||
2.13%, 5/15/2025(e) | 300,000 | 296,058 | ||||||
2.25%, 11/15/2024(e) | 75,000 | 74,960 | ||||||
2.25%, 11/15/2025(e) | 200,000 | 199,546 | ||||||
2.63%, 8/15/2020(e) | 150,000 | 155,889 | ||||||
2.63%, 11/15/2020(e) | 250,000 | 259,832 | ||||||
2.75%, 2/15/2024(e) | 100,000 | 104,157 | ||||||
4.00%, 8/15/2018(e) | 250,000 | 268,360 | ||||||
|
| |||||||
TOTAL U.S. TREASURY OBLIGATIONS |
| 30,226,846 | ||||||
|
| |||||||
MUNICIPAL BONDS & NOTES – 0.6% |
| |||||||
California – 0.4% | ||||||||
California, State General Obligation | 100,000 | 139,537 | ||||||
Los Angeles, CA, Department of Water & Power Revenue | 100,000 | 121,449 | ||||||
Los Angeles, CA, Unified School District, General Obligation | 25,000 | 30,095 | ||||||
University of California, Revenue | 50,000 | 64,175 | ||||||
|
| |||||||
| 355,256 | ||||||||
|
| |||||||
Illinois – 0.1% | ||||||||
State of Illinois | 50,000 | 51,855 | ||||||
|
| |||||||
New Jersey – 0.1% | ||||||||
New Jersey, State Turnpike Authority Revenue | 50,000 | 68,723 | ||||||
|
| |||||||
New York – 0.0%(b) | ||||||||
New York, NY, City Municipal Water Finance Authority, Water & Sewer System Revenue | 25,000 | 30,557 | ||||||
|
| |||||||
Pennsylvania – 0.0%(b) | ||||||||
Pennsylvania, State General Obligation | 20,000 | 22,798 | ||||||
|
| |||||||
TOTAL MUNICIPAL BONDS & NOTES |
| 529,189 | ||||||
|
| |||||||
ASSET-BACKED SECURITIES – 0.5% |
| |||||||
Asset-Backed – Automobile – 0.2% |
| |||||||
CarMax Auto Owner Trust 2015-1 | 75,000 | 74,595 | ||||||
Fifth Third Auto Trust 2015-1 | 100,000 | 99,200 | ||||||
|
| |||||||
| 173,795 | ||||||||
|
| |||||||
Asset-Backed – Credit Card – 0.3% |
| |||||||
Capital One Multi-Asset Execution Trust | 30,000 | 30,000 | ||||||
Citibank Credit Card Issuance Trust: | ||||||||
Series 2014-A1, Class A1, 2.88%, 1/23/2023 | 100,000 | 102,550 | ||||||
Series 2008-A1, Class A1, 5.35%, 2/7/2020 | 100,000 | 107,360 | ||||||
|
| |||||||
| 239,910 | ||||||||
|
| |||||||
TOTAL ASSET-BACKED SECURITIES |
| 413,705 | ||||||
|
| |||||||
MORTGAGE-BACKED SECURITIES – 1.1% |
| |||||||
Banc of America Commercial Mortgage Trust 2015-UBS7 | 100,000 | 100,967 | ||||||
Citigroup Commercial Mortgage Trust 2013-GC11 | 75,000 | 74,437 | ||||||
COMM 2013-CCRE8 Mortgage Trust | 65,000 | 65,644 | ||||||
COMM 2013-LC6 Mortgage Trust | 75,000 | 74,659 | ||||||
COMM 2014-UBS6 Mortgage Trust | 100,000 | 101,061 | ||||||
COMM 2015-LC21 Mortgage Trust | 50,000 | 50,668 | ||||||
GS Mortgage Securities Trust 2013-GC13 | 80,000 | 84,974 | ||||||
JP Morgan Chase Commercial Mortgage Securities Trust 2007-CIBC20 | 44,182 | 45,956 | ||||||
JP Morgan Chase Commercial Mortgage Securities Trust 2013-C16 | 60,000 | 63,668 | ||||||
JPMBB Commercial Mortgage Securities Trust 2014-C18 | 50,000 | 52,546 | ||||||
See accompanying notes to financial statements.
27
Table of Contents
State Street Aggregate Bond Index Portfolio
Schedule of Investments — (continued)
December 31, 2015
Security Description | Principal Amount | Value | ||||||
MORTGAGE-BACKED SECURITIES – (continued) |
| |||||||
Morgan Stanley Bank of America Merrill Lynch Trust 2013-C8 | $ | 90,000 | $ | 89,013 | ||||
Wells Fargo Commercial Mortgage Trust 2014-LC16 | 69,504 | 68,793 | ||||||
WFRBS Commercial Mortgage Trust 2014-C19 | 75,000 | 77,436 | ||||||
TOTAL MORTGAGE-BACKED SECURITIES |
| 949,822 | ||||||
|
| |||||||
| Shares | ||||||||
SHORT-TERM INVESTMENT – 15.9% |
| |||||||
State Street Institutional Liquid Reserves Fund, Premier Class 0.23%(f)(g) (Cost $13,317,540) | 13,317,540 | 13,317,540 | ||||||
|
| |||||||
TOTAL INVESTMENTS – 114.3% |
| 95,812,301 | ||||||
Liabilities in Excess of Other Assets – (14.3)% | (11,970,320 | ) | ||||||
|
| |||||||
NET ASSETS – 100.0% | $ | 83,841,981 | ||||||
|
| |||||||
| (a) | Variable Rate Security – Interest rate shown is rate in effect at December 31, 2015. |
| (b) | Amount is less than 0.05% of net assets. |
| (c) | Securities purchased pursuant to Rule 144A of the Securities Act of 1933. These Securities, which represent 0.3% of net assets as of December 31, 2015, are considered liquid and may be resold in transactions exempt from registration, normally to qualified institutional buyers. |
| (d) | When-issued security |
| (e) | All or a portion of the principal held as collateral for TBA’s purchased by the Portfolio. |
| (f) | The rate shown is the annualized seven-day yield at December 31, 2015. |
| (g) | Affiliated Fund managed by SSGA Funds Management, Inc. (Note 4). |
| GMTN | Global Medium Term Note | |
| MTN | Medium Term Note | |
| TBA | To Be Announced |
Description | Level 1 – Quoted Prices | Level 2 – Other Significant Observable Inputs | Level 3 – Significant Unobservable Inputs | Total | ||||||||||||
Investments: | ||||||||||||||||
Corporate Bonds & Notes | $ | — | $ | 22,365,510 | $ | — | $ | 22,365,510 | ||||||||
Foreign Government Obligations | — | 1,470,649 | — | 1,470,649 | ||||||||||||
U.S. Government Agency Obligations | — | 26,539,040 | — | 26,539,040 | ||||||||||||
U.S. Treasury Obligations | — | 30,226,846 | — | 30,226,846 | ||||||||||||
Municipal Bonds & Notes | — | 529,189 | — | 529,189 | ||||||||||||
Asset-Backed Securities | — | 413,705 | — | 413,705 | ||||||||||||
Mortgage-Backed Securities | — | 949,822 | — | 949,822 | ||||||||||||
Short-term Investment | 13,317,540 | — | — | 13,317,540 | ||||||||||||
|
|
|
|
|
|
|
| |||||||||
Total Investments | $ | 13,317,540 | $ | 82,494,761 | $ | — | $ | 95,812,301 | ||||||||
|
|
|
|
|
|
|
| |||||||||
See accompanying notes to financial statements.
28
Table of Contents
State Street Global Equity ex-U.S. Index Portfolio
Portfolio Statistics (Unaudited)
December 31, 2015
Portfolio Composition* | December 31, 2015 | |||
Common Stocks | 97.3 | % | ||
Short-Term Investment | 2.1 | |||
Rights | 0.0 | ** | ||
Other Assets in Excess of Liabilities | 0.6 | |||
Total | 100.0 | % |
| ** | Less than 0.05% of net assets. |
Top Five Sectors (excluding short-term investment)* | December 31, 2015 | |||
Banks | 14.7 | % | ||
Pharmaceuticals | 7.5 | |||
Oil, Gas & Consumable Fuels | 5.8 | |||
Insurance | 6.4 | |||
Automobiles | 3.7 | |||
Total | 38.1 | % |
| * | As a percentage of net assets as of the date indicated. The Portfolio’s composition will vary over time. |
See accompanying notes to the financial statements.
29
Table of Contents
State Street Global Equity ex-U.S. Index Portfolio
December 31, 2015
Security Description | Shares | Value | ||||||
COMMON STOCKS – 97.3% | ||||||||
Australia – 5.0% | ||||||||
AGL Energy, Ltd.(a) | 4,657 | $ | 60,842 | |||||
Alumina, Ltd.(a) | 21,492 | 17,908 | ||||||
Amcor, Ltd.(a) | 7,827 | 75,921 | ||||||
AMP, Ltd.(a) | 21,038 | 88,503 | ||||||
APA Group(a) | 8,049 | 50,567 | ||||||
Aristocrat Leisure, Ltd.(a) | 4,203 | 30,986 | ||||||
Asciano, Ltd.(a) | 4,715 | 29,929 | ||||||
ASX, Ltd.(a) | 1,443 | 44,325 | ||||||
Aurizon Holdings, Ltd.(a) | 14,957 | 47,407 | ||||||
AusNet Services(a) | 15,829 | 17,014 | ||||||
Australia & New Zealand Banking Group, Ltd.(a) | 19,813 | 399,191 | ||||||
Bank of Queensland, Ltd.(a) | 2,945 | 29,661 | ||||||
Bendigo & Adelaide Bank, Ltd.(a) | 3,558 | 30,728 | ||||||
BHP Billiton PLC(a) | 14,675 | 163,620 | ||||||
BHP Billiton, Ltd.(a) | 22,164 | 284,791 | ||||||
Boral, Ltd.(a) | 6,119 | 26,121 | ||||||
Brambles, Ltd.(a) | 10,298 | 86,109 | ||||||
Caltex Australia, Ltd.(a) | 2,000 | 54,581 | ||||||
Challenger, Ltd.(a) | 3,817 | 24,018 | ||||||
CIMIC Group, Ltd.(a) | 882 | 15,447 | ||||||
Coca-Cola Amatil, Ltd.(a) | 4,443 | 29,912 | ||||||
Cochlear, Ltd.(a) | 446 | 30,815 | ||||||
Commonwealth Bank of Australia(a) | 11,377 | 702,267 | ||||||
Computershare, Ltd.(a) | 3,657 | 30,723 | ||||||
Crown Resorts, Ltd.(a) | 2,903 | 26,197 | ||||||
CSL, Ltd.(a) | 3,224 | 245,409 | ||||||
Dexus Property Group REIT(a) | 7,278 | 39,415 | ||||||
DUET Group(a) | 15,550 | 25,712 | ||||||
Flight Centre Travel Group, Ltd.(a) | 511 | 14,714 | ||||||
Fortescue Metals Group, Ltd.(a) | 12,753 | 17,135 | ||||||
Goodman Group REIT(a) | 12,547 | 56,766 | ||||||
GPT Group REIT(a) | 13,210 | 45,677 | ||||||
Harvey Norman Holdings, Ltd.(a) | 4,776 | 14,415 | ||||||
Healthscope, Ltd.(a) | 11,781 | 22,667 | ||||||
Iluka Resources, Ltd.(a) | 3,667 | 16,195 | ||||||
Incitec Pivot, Ltd.(a) | 12,827 | 36,594 | ||||||
Insurance Australia Group, Ltd.(a) | 17,460 | 70,009 | ||||||
LendLease Group(a) | 4,167 | 42,925 | ||||||
Macquarie Group, Ltd.(a) | 2,110 | 126,027 | ||||||
Medibank Pvt, Ltd.(a) | 21,491 | 33,458 | ||||||
Mirvac Group REIT(a) | 27,973 | 39,981 | ||||||
National Australia Bank, Ltd.(a) | 18,095 | 394,243 | ||||||
Newcrest Mining, Ltd.(a)(b) | 5,621 | 53,103 | ||||||
Oil Search, Ltd.(a) | 9,180 | 44,612 | ||||||
Orica, Ltd.(a) | 2,844 | 31,813 | ||||||
Origin Energy, Ltd.(a) | 12,926 | 43,656 | ||||||
Platinum Asset Management, Ltd.(a) | 1,125 | 6,563 | ||||||
Qantas Airways, Ltd.(a)(b) | 2,281 | 6,750 | ||||||
QBE Insurance Group, Ltd.(a) | 9,713 | 88,202 | ||||||
Ramsay Health Care, Ltd.(a) | 1,008 | 49,487 | ||||||
REA Group, Ltd.(a) | 458 | 18,194 | ||||||
Santos, Ltd.(a) | 11,235 | 29,877 | ||||||
Scentre Group REIT(a) | 37,585 | 113,821 | ||||||
SEEK, Ltd.(a) | 2,590 | 28,782 | ||||||
Sonic Healthcare, Ltd.(a) | 2,857 | 36,932 | ||||||
South32, Ltd.(a)(b)(c) | 10,757 | 8,277 | ||||||
South32, Ltd.(a)(b)(c) | 29,327 | 22,493 | ||||||
Stockland REIT(a) | 17,492 | 51,843 | ||||||
Suncorp Group, Ltd.(a) | 9,160 | 80,298 | ||||||
Sydney Airport(a) | 8,242 | 37,872 | ||||||
Tabcorp Holdings, Ltd.(a) | 5,788 | 19,676 | ||||||
Tatts Group, Ltd.(a) | 11,208 | 35,528 | ||||||
Telstra Corp., Ltd.(a) | 30,153 | 122,339 | ||||||
TPG Telecom, Ltd.(a) | 2,800 | 20,015 | ||||||
Transurban Group Stapled Security(a) | 13,599 | 102,917 | ||||||
Transurban Group(a)(b) | 755 | 5,751 | ||||||
Treasury Wine Estates, Ltd.(a) | 5,702 | 34,182 | ||||||
Vicinity Centres REIT(a) | 24,752 | 50,135 | ||||||
Wesfarmers, Ltd.(a) | 7,801 | 234,814 | ||||||
Westfield Corp.(a) | 13,978 | 96,016 | ||||||
Westpac Banking Corp.(a) | 22,256 | 538,629 | ||||||
Woodside Petroleum, Ltd.(a) | 4,908 | 102,092 | ||||||
Woolworths, Ltd.(a) | 8,852 | 156,809 | ||||||
|
| |||||||
| 5,910,403 | ||||||||
|
| |||||||
Austria – 0.1% | ||||||||
Andritz AG(a) | 764 | 37,167 | ||||||
Erste Group Bank AG(a)(b) | 1,906 | 59,614 | ||||||
OMV AG(a) | 1,408 | 39,950 | ||||||
Raiffeisen Bank International AG(a)(b) | 265 | 3,882 | ||||||
voestalpine AG(a) | 542 | 16,572 | ||||||
|
| |||||||
| 157,185 | ||||||||
|
| |||||||
Belgium – 1.0% | ||||||||
Ageas(a) | 1,349 | 62,586 | ||||||
Anheuser-Busch InBev SA(a) | 5,607 | 697,486 | ||||||
Colruyt SA(a) | 340 | 17,483 | ||||||
Delhaize Group(a) | 694 | 67,517 | ||||||
Groupe Bruxelles Lambert SA(a) | 590 | 50,464 | ||||||
KBC Groep NV(a) | 1,679 | 104,938 | ||||||
Proximus SADP(a) | 1,401 | 45,571 | ||||||
Solvay SA(a) | 542 | 57,823 | ||||||
Telenet Group Holding NV(a)(b) | 254 | 13,722 | ||||||
UCB SA(a) | 837 | 75,519 | ||||||
Umicore SA(a) | 460 | 19,283 | ||||||
|
| |||||||
| 1,212,392 | ||||||||
|
| |||||||
Brazil – 1.1% | ||||||||
Ambev SA(a) | 31,587 | 141,930 | ||||||
B2W Cia Digital(a)(b) | 1,200 | 4,603 | ||||||
Banco Bradesco SA(a) | 6,360 | 32,766 | ||||||
Banco Bradesco SA Preference Shares(a) | 15,480 | 74,903 | ||||||
Banco do Brasil SA(a) | 4,200 | 15,555 | ||||||
Banco Santander Brasil SA(a) | 2,000 | 8,060 | ||||||
BB Seguridade Participacoes SA(a) | 6,600 | 40,334 | ||||||
BM&FBovespa SA(a) | 15,900 | 43,475 | ||||||
BR Malls Participacoes SA(a) | 2,100 | 5,852 | ||||||
Braskem SA Class A, Preference Shares(a) | 1,800 | 12,509 | ||||||
BRF SA(a) | 4,300 | 59,978 | ||||||
CCR SA(a) | 5,100 | 16,114 | ||||||
CETIP SA – Mercados Organizados(a) | 900 | 8,505 | ||||||
Cia Brasileira de Distribuicao Preference Shares(a) | 600 | 6,318 | ||||||
Cia de Saneamento Basico do Estado de Sao Paulo(a) | 1,700 | 8,096 | ||||||
See accompanying notes to financial statements.
30
Table of Contents
State Street Global Equity ex-U.S. Index Portfolio
Schedule of Investments — (continued)
December 31, 2015
Security Description | Shares | Value | ||||||
COMMON STOCKS – (continued) | ||||||||
Brazil – (continued) | ||||||||
Cia Energetica de Minas Gerais Preference Shares(a) | 3,900 | $ | 6,013 | |||||
Cia Energetica de Sao Paulo Class B, Preference Shares(a) | 900 | 3,037 | ||||||
Cia Paranaense de Energia Preference Shares(a) | 900 | 5,497 | ||||||
Cia Siderurgica Nacional SA(a) | 3,400 | 3,407 | ||||||
Cielo SA(a) | 5,780 | 48,825 | ||||||
Cosan SA Industria e Comercio(a) | 1,100 | 6,968 | ||||||
CPFL Energia SA(a)(b) | 1,238 | 4,733 | ||||||
Duratex SA(a) | 3,200 | 4,761 | ||||||
EDP – Energias do Brasil SA(a) | 2,600 | 7,889 | ||||||
Embraer SA(a) | 3,800 | 28,877 | ||||||
Equatorial Energia SA(a) | 1,700 | 14,703 | ||||||
Estacio Participacoes SA(a) | 2,500 | 8,756 | ||||||
Fibria Celulose SA(a) | 2,600 | 34,132 | ||||||
Gerdau SA Preference Shares(a) | 6,200 | 7,222 | ||||||
Hypermarcas SA(a)(b) | 1,700 | 9,283 | ||||||
Itau Unibanco Holding SA Preference Shares(a) | 21,390 | 141,480 | ||||||
Itausa - Investimentos Itau SA Preference Shares(a) | 25,527 | 44,110 | ||||||
JBS SA(a) | 3,600 | 11,172 | ||||||
Klabin SA(a) | 5,797 | 34,298 | ||||||
Kroton Educacional SA(a) | 6,300 | 15,069 | ||||||
Localiza Rent a Car SA(a) | 1,800 | 11,237 | ||||||
Lojas Americanas SA Preference Shares(a) | 3,300 | 16,087 | ||||||
Lojas Americanas SA(a) | 1,100 | 3,451 | ||||||
Lojas Renner SA(a) | 5,000 | 21,479 | ||||||
M Dias Branco SA(a) | 300 | 5,038 | ||||||
Multiplan Empreendimentos Imobiliarios SA(a) | 400 | 3,823 | ||||||
Natura Cosmeticos SA(a) | 800 | 4,731 | ||||||
Odontoprev SA(a) | 2,400 | 5,722 | ||||||
Petroleo Brasileiro SA(a)(b) | 20,600 | 44,065 | ||||||
Petroleo Brasileiro SA Preference Shares(a)(b) | 26,300 | 44,022 | ||||||
Porto Seguro SA(a) | 500 | 3,631 | ||||||
Qualicorp SA(a) | 991 | 3,525 | ||||||
Raia Drogasil SA(a) | 1,000 | 8,948 | ||||||
Sul America SA(a) | 1,900 | 8,912 | ||||||
Suzano Papel e Celulose SA Class A, Preference Shares(a) | 1,600 | 7,556 | ||||||
Telefonica Brasil SA Preference Shares(a) | 3,885 | 34,949 | ||||||
Tim Participacoes SA(a) | 3,900 | 6,726 | ||||||
TOTVS SA(a) | 600 | 4,693 | ||||||
Tractebel Energia SA(a) | 1,900 | 16,021 | ||||||
Ultrapar Participacoes SA(a) | 2,600 | 39,511 | ||||||
Vale SA(a) | 12,200 | 39,748 | ||||||
Vale SA Preference Shares(a) | 14,100 | 36,124 | ||||||
WEG SA(a) | 2,800 | 10,572 | ||||||
|
| |||||||
| 1,299,801 | ||||||||
|
| |||||||
Canada – 5.7% | ||||||||
Agnico Eagle Mines, Ltd. | 1,600 | 41,892 | ||||||
Agrium, Inc. | 1,000 | 89,029 | ||||||
Alimentation Couche-Tard, Inc. Class B | 2,900 | 127,161 | ||||||
AltaGas, Ltd. | 1,000 | 22,245 | ||||||
ARC Resources, Ltd. | 2,300 | 27,651 | ||||||
Atco, Ltd. Class I | 600 | 15,420 | ||||||
Bank of Montreal | 4,500 | 252,941 | ||||||
Bank of Nova Scotia | 8,100 | 326,367 | ||||||
Barrick Gold Corp. | 7,900 | 58,236 | ||||||
BCE, Inc. | 979 | 37,677 | ||||||
BlackBerry, Ltd.(b) | 3,900 | 36,049 | ||||||
Bombardier, Inc. Class B | 13,300 | 12,830 | ||||||
Brookfield Asset Management, Inc. Class A | 6,050 | 190,110 | ||||||
CAE, Inc. | 2,200 | 24,311 | ||||||
Cameco Corp. | 3,000 | 36,866 | ||||||
Canadian Imperial Bank of Commerce | 2,800 | 183,811 | ||||||
Canadian National Railway Co. | 5,500 | 306,259 | ||||||
Canadian Natural Resources, Ltd. | 7,600 | 165,339 | ||||||
Canadian Oil Sands, Ltd. | 3,800 | 22,623 | ||||||
Canadian Pacific Railway, Ltd. | 1,100 | 139,949 | ||||||
Canadian Tire Corp., Ltd. Class A | 500 | 42,531 | ||||||
Canadian Utilities, Ltd. Class A | 1,000 | 22,993 | ||||||
CCL Industries, Inc. Class B | 200 | 32,304 | ||||||
Cenovus Energy, Inc. | 5,900 | 74,329 | ||||||
CGI Group, Inc. Class A(b) | 1,600 | 63,811 | ||||||
CI Financial Corp. | 1,600 | 35,246 | ||||||
Constellation Software, Inc. | 100 | 41,529 | ||||||
Crescent Point Energy Corp. | 3,700 | 42,937 | ||||||
Dollarama, Inc. | 900 | 51,793 | ||||||
Eldorado Gold Corp. | 6,000 | 17,709 | ||||||
Element Financial Corp. | 2,600 | 31,258 | ||||||
Empire Co., Ltd. | 1,300 | 24,089 | ||||||
Enbridge, Inc. | 6,000 | 198,690 | ||||||
Encana Corp. | 6,200 | 31,377 | ||||||
Fairfax Financial Holdings, Ltd. | 200 | 94,581 | ||||||
Finning International, Inc. | 1,400 | 18,827 | ||||||
First Capital Realty, Inc. | 800 | 10,568 | ||||||
First Quantum Minerals, Ltd. | 5,600 | 20,883 | ||||||
Fortis, Inc. | 1,900 | 51,169 | ||||||
Franco-Nevada Corp. | 1,100 | 50,126 | ||||||
George Weston, Ltd. | 400 | 30,794 | ||||||
Gildan Activewear, Inc. | 1,700 | 48,145 | ||||||
Goldcorp, Inc. | 6,000 | 69,066 | ||||||
Great-West Lifeco, Inc. | 2,100 | 52,201 | ||||||
H&R Real Estate Investment Trust | 1,200 | 17,321 | ||||||
Husky Energy, Inc. | 2,643 | 27,223 | ||||||
IGM Financial, Inc. | 800 | 20,353 | ||||||
Imperial Oil, Ltd. | 2,100 | 68,151 | ||||||
Industrial Alliance Insurance & Financial Services, Inc. | 800 | 25,415 | ||||||
Intact Financial Corp. | 1,000 | 63,840 | ||||||
Inter Pipeline, Ltd. | 2,500 | 39,972 | ||||||
Jean Coutu Group PJC, Inc. Class A | 800 | 10,315 | ||||||
Keyera Corp. | 1,300 | 37,678 | ||||||
Kinross Gold Corp.(b) | 9,700 | 17,527 | ||||||
Linamar Corp. | 300 | 16,139 | ||||||
Loblaw Cos., Ltd. | 1,600 | 75,260 | ||||||
Magna International, Inc. | 2,900 | 117,161 | ||||||
Manulife Financial Corp. | 13,700 | 204,548 | ||||||
MEG Energy Corp.(b) | 1,500 | 8,660 | ||||||
Methanex Corp. | 700 | 23,029 | ||||||
Metro, Inc. | 1,800 | 50,199 | ||||||
See accompanying notes to financial statements.
31
Table of Contents
State Street Global Equity ex-U.S. Index Portfolio
Schedule of Investments — (continued)
December 31, 2015
Security Description | Shares | Value | ||||||
COMMON STOCKS – (continued) | ||||||||
Canada – (continued) | ||||||||
National Bank of Canada | 2,400 | $ | 69,645 | |||||
Onex Corp. | 600 | 36,637 | ||||||
Open Text Corp. | 900 | 42,982 | ||||||
Pembina Pipeline Corp. | 2,500 | 54,262 | ||||||
Peyto Exploration & Development Corp. | 1,200 | 21,484 | ||||||
Potash Corp. of Saskatchewan, Inc. | 5,900 | 100,662 | ||||||
Power Corp. of Canada | 2,700 | 56,251 | ||||||
Power Financial Corp. | 1,800 | 41,219 | ||||||
PrairieSky Royalty, Ltd. | 1,200 | 18,936 | ||||||
Restaurant Brands International, Inc. | 1,446 | 53,870 | ||||||
RioCan Real Estate Investment Trust | 1,300 | 22,170 | ||||||
Rogers Communications, Inc. Class B | 2,600 | 89,318 | ||||||
Royal Bank of Canada | 9,900 | 528,461 | ||||||
Saputo, Inc. | 1,900 | 45,274 | ||||||
Seven Generations Energy, Ltd. Class A(b) | 1,100 | 10,675 | ||||||
Shaw Communications, Inc. Class B | 2,800 | 47,974 | ||||||
Silver Wheaton Corp. | 2,700 | 33,432 | ||||||
Smart Real Estate Investment Trust | 700 | 15,213 | ||||||
SNC-Lavalin Group, Inc. | 1,100 | 32,562 | ||||||
Sun Life Financial, Inc. | 4,300 | 133,572 | ||||||
Suncor Energy, Inc. | 10,000 | 257,145 | ||||||
Teck Resources, Ltd. Class B | 4,600 | 17,683 | ||||||
TELUS Corp. | 1,500 | 41,315 | ||||||
Toronto-Dominion Bank | 12,400 | 484,181 | ||||||
Tourmaline Oil Corp.(b) | 1,500 | 24,134 | ||||||
TransCanada Corp. | 5,000 | 162,659 | ||||||
Turquoise Hill Resources, Ltd.(b) | 8,100 | 20,467 | ||||||
Veresen, Inc. | 2,400 | 15,308 | ||||||
Vermilion Energy, Inc. | 900 | 24,368 | ||||||
West Fraser Timber Co., Ltd. | 600 | 22,690 | ||||||
Yamana Gold, Inc. | 8,300 | 15,356 | ||||||
|
| |||||||
| 6,636,418 | ||||||||
|
| |||||||
Chile – 0.2% | ||||||||
AES Gener SA | 12,812 | 5,685 | ||||||
Aguas Andinas SA Class A | 12,641 | 6,486 | ||||||
Antofagasta PLC(a) | 1,906 | 13,108 | ||||||
Banco de Chile | 104,977 | 10,693 | ||||||
Banco de Credito e Inversiones(a) | 161 | 6,051 | ||||||
Banco Santander Chile | 318,826 | 14,304 | ||||||
Cencosud SA | 9,119 | 18,210 | ||||||
Cia Cervecerias Unidas SA | 714 | 7,900 | ||||||
Colbun SA | 39,137 | 9,345 | ||||||
Corpbanca SA(a) | 658,104 | 5,274 | ||||||
Empresa Nacional de Electricidad SA | 26,443 | 32,787 | ||||||
Empresa Nacional de Telecomunicaciones SA | 572 | 5,119 | ||||||
Empresas CMPC SA | 6,042 | 13,036 | ||||||
Empresas COPEC SA | 4,449 | 38,194 | ||||||
Enersis SA | 116,837 | 28,207 | ||||||
Latam Airlines Group SA(a)(b) | 2,319 | 12,153 | ||||||
SACI Falabella | 4,707 | 29,998 | ||||||
Sociedad Quimica y Minera de Chile SA Class B, Preference Shares(a) | 466 | 8,721 | ||||||
SONDA SA | 2,316 | 4,104 | ||||||
|
| |||||||
| 269,375 | ||||||||
|
| |||||||
China – 5.4% | ||||||||
58.com, Inc. ADR(b) | 200 | 13,192 | ||||||
AAC Technologies Holdings, Inc.(a) | 5,500 | 35,637 | ||||||
Agricultural Bank of China, Ltd. Class H(a) | 166,000 | 67,553 | ||||||
Air China, Ltd. Class H(a) | 16,000 | 12,569 | ||||||
Alibaba Group Holding, Ltd. ADR(b) | 3,500 | 284,445 | ||||||
Alibaba Health Information Technology, Ltd.(a)(b) | 19,500 | 13,428 | ||||||
Aluminum Corp. of China, Ltd. Class H(a)(b) | 20,000 | 6,591 | ||||||
Anhui Conch Cement Co., Ltd. Class H(a) | 9,500 | 25,394 | ||||||
ANTA Sports Products, Ltd.(a) | 8,000 | 21,871 | ||||||
AviChina Industry & Technology Co., Ltd. Class H(a) | 12,000 | 9,376 | ||||||
Baidu, Inc. ADR(b) | 900 | 170,136 | ||||||
Bank of China, Ltd. Class H(a) | 550,000 | 244,039 | ||||||
Bank of Communications Co., Ltd. Class H(a) | 64,000 | 44,881 | ||||||
Beijing Capital International Airport Co., Ltd. Class H(a) | 8,000 | 8,592 | ||||||
Beijing Enterprises Holdings, Ltd.(a) | 3,500 | 21,121 | ||||||
Beijing Enterprises Water Group, Ltd.(a)(b) | 34,000 | 23,802 | ||||||
Belle International Holdings, | 35,000 | 26,187 | ||||||
Brilliance China Automotive Holdings, Ltd.(a) | 20,000 | 24,989 | ||||||
Byd Co., Ltd. Class H(a)(b) | 5,000 | 27,306 | ||||||
CAR, Inc.(a)(b) | 8,000 | 13,183 | ||||||
CGN Power Co., Ltd. Class H(a)(d) | 62,600 | 23,307 | ||||||
China Cinda Asset Management Co., Ltd. Class H(a) | 68,592 | 25,334 | ||||||
China CITIC Bank Corp., Ltd. Class H(a)(b) | 48,000 | 30,936 | ||||||
China Coal Energy Co., Ltd. Class H(a) | 20,000 | 7,612 | ||||||
China Communications Construction Co., Ltd. Class H(a) | 33,000 | 33,393 | ||||||
China Communications Services Corp., Ltd. Class H(a) | 20,000 | 7,507 | ||||||
China Conch Venture Holdings, Ltd.(a) | 10,000 | 20,662 | ||||||
China Construction Bank Corp. Class H(a) | 579,000 | 394,958 | ||||||
China COSCO Holdings Co., Ltd. Class H(a)(b) | 12,500 | 5,967 | ||||||
China Everbright Bank Co., Ltd. Class H(a) | 30,300 | 14,710 | ||||||
China Everbright International, Ltd.(a) | 19,000 | 24,270 | ||||||
China Everbright, Ltd.(a) | 8,000 | 18,292 | ||||||
See accompanying notes to financial statements.
32
Table of Contents
State Street Global Equity ex-U.S. Index Portfolio
Schedule of Investments — (continued)
December 31, 2015
Security Description | Shares | Value | ||||||
COMMON STOCKS – (continued) | ||||||||
China – (continued) | ||||||||
China Galaxy Securities Co., Ltd. Class H(a) | 25,800 | $ | 23,481 | |||||
China Huishan Dairy Holdings Co., Ltd.(a) | 52,000 | 19,886 | ||||||
China International Marine Containers Group Co., Ltd. Class H(a) | 4,400 | 8,009 | ||||||
China Jinmao Holdings Group, Ltd.(a) | 30,000 | 10,219 | ||||||
China Life Insurance Co., Ltd. Class H(a) | 52,000 | 167,261 | ||||||
China Longyuan Power Group Corp., Ltd. Class H(a) | 29,000 | 21,807 | ||||||
China Medical System Holdings, Ltd.(a) | 10,000 | 14,630 | ||||||
China Mengniu Dairy Co., Ltd.(a) | 21,000 | 34,090 | ||||||
China Merchants Bank Co., Ltd. Class H(a) | 32,500 | 76,159 | ||||||
China Merchants Holdings International Co., Ltd.(a) | 10,090 | 31,913 | ||||||
China Minsheng Banking Corp., Ltd. Class H(a) | 43,500 | 43,024 | ||||||
China Mobile, Ltd.(a) | 42,000 | 472,750 | ||||||
China National Building Material Co., Ltd. Class H(a) | 22,000 | 10,494 | ||||||
China Oilfield Services, Ltd. Class H(a) | 12,000 | 10,342 | ||||||
China Overseas Land & Investment, Ltd.(a) | 28,000 | 97,118 | ||||||
China Pacific Insurance Group Co., Ltd. Class H(a) | 17,400 | 71,095 | ||||||
China Petroleum & Chemical Corp. Class H(a) | 180,000 | 108,324 | ||||||
China Power International Development, Ltd.(a) | 28,000 | 16,154 | ||||||
China Railway Construction Corp., Ltd. Class H(a) | 16,000 | 19,733 | ||||||
China Railway Group, Ltd. Class H(a) | 31,000 | 23,459 | ||||||
China Resources Beer Holdings Co., Ltd.(a) | 10,041 | 21,450 | ||||||
China Resources Gas Group, | 8,000 | 23,791 | ||||||
China Resources Land, Ltd.(a) | 19,333 | 55,943 | ||||||
China Resources Power Holdings Co., Ltd.(a) | 14,055 | 27,084 | ||||||
China Shenhua Energy Co., Ltd. Class H(a) | 25,500 | 39,883 | ||||||
China Shipping Container Lines Co., Ltd. Class H(a)(b) | 28,000 | 7,743 | ||||||
China Southern Airlines Co., Ltd. Class H(a) | 10,000 | 7,709 | ||||||
China State Construction International Holdings, Ltd.(a) | 14,000 | 24,174 | ||||||
China Taiping Insurance Holdings Co., Ltd.(a)(b) | 12,000 | 36,910 | ||||||
China Telecom Corp., Ltd. Class H(a) | 100,000 | 46,646 | ||||||
China Unicom Hong Kong, Ltd.(a) | 42,000 | 50,789 | ||||||
China Vanke Co., Ltd. Class H(a) | 10,400 | 30,908 | ||||||
Chongqing Changan Automobile Co., Ltd. Class B(a) | 7,600 | 16,733 | ||||||
Chongqing Rural Commercial Bank Co., Ltd. Class H(a) | 23,000 | 13,844 | ||||||
CITIC Securities Co., Ltd. Class H(a) | 15,000 | 34,795 | ||||||
CITIC, Ltd.(a) | 32,000 | 56,505 | ||||||
CNOOC, Ltd.(a) | 125,000 | 130,095 | ||||||
COSCO Pacific, Ltd.(a) | 22,381 | 24,602 | ||||||
Country Garden Holdings Co., Ltd.(a) | 48,000 | 19,563 | ||||||
CRRC Corp., Ltd. Class H(a) | 31,350 | 38,552 | ||||||
CSPC Pharmaceutical Group, Ltd.(a) | 26,000 | 26,507 | ||||||
Ctrip.com International, Ltd. ADR(b) | 1,000 | 46,330 | ||||||
Dalian Wanda Commercial Properties Co., Ltd. Class H(a)(d) | 4,200 | 24,403 | ||||||
Datang International Power Generation Co., Ltd. Class H(a) | 14,000 | 4,256 | ||||||
Dongfeng Motor Group Co., Ltd. Class H(a) | 20,000 | 26,596 | ||||||
ENN Energy Holdings, Ltd.(a) | 6,000 | 31,673 | ||||||
Evergrande Real Estate Group, Ltd.(a) | 28,000 | 24,513 | ||||||
Far East Horizon, Ltd.(a) | 16,000 | 14,865 | ||||||
Fosun International, Ltd.(a) | 16,500 | 25,724 | ||||||
Geely Automobile Holdings, | 45,000 | 23,778 | ||||||
GF Securities Co., Ltd. | 10,600 | 26,520 | ||||||
GOME Electrical Appliances Holding, Ltd.(a) | 99,000 | 16,411 | ||||||
Great Wall Motor Co., Ltd. Class H(a) | 24,000 | 27,782 | ||||||
Guangdong Investment, Ltd.(a) | 22,000 | 30,955 | ||||||
Guangzhou Automobile Group Co., Ltd. Class H(a) | 18,000 | 15,992 | ||||||
Guangzhou R&F Properties Co., Ltd. Class H(a) | 8,800 | 10,790 | ||||||
Haitian International Holdings, Ltd.(a) | 3,000 | 4,429 | ||||||
Haitong Securities Co., Ltd. Class H(a) | 24,000 | 42,087 | ||||||
Hengan International Group Co., Ltd.(a) | 5,000 | 46,940 | ||||||
Huadian Power International Corp., Ltd. Class H(a) | 8,000 | 5,187 | ||||||
Huaneng Power International, Inc. Class H(a) | 26,000 | 22,297 | ||||||
Huaneng Renewables Corp., Ltd. Class H(a) | 18,629 | 5,529 | ||||||
Huatai Securities Co., Ltd. Class H(a)(b)(d) | 7,800 | 18,031 | ||||||
Industrial & Commercial Bank of China, Ltd. Class H(a) | 509,000 | 305,100 | ||||||
JD.com, Inc. ADR(b) | 1,100 | 35,491 | ||||||
Jiangsu Expressway Co., Ltd. Class H(a) | 10,000 | 13,421 | ||||||
Jiangxi Copper Co., Ltd. Class H(a) | 12,000 | 14,164 | ||||||
Kingsoft Corp., Ltd.(a) | 7,000 | 16,944 | ||||||
See accompanying notes to financial statements.
33
Table of Contents
State Street Global Equity ex-U.S. Index Portfolio
Schedule of Investments — (continued)
December 31, 2015
Security Description | Shares | Value | ||||||
COMMON STOCKS – (continued) | ||||||||
China – (continued) | ||||||||
Kunlun Energy Co., Ltd.(a) | 26,000 | $ | 23,085 | |||||
Lenovo Group, Ltd.(a) | 48,000 | 48,441 | ||||||
Longfor Properties Co., Ltd.(a) | 12,500 | 18,591 | ||||||
Luye Pharma Group, Ltd.(a)(b) | 6,500 | 6,763 | ||||||
NetEase, Inc. ADR | 300 | 54,372 | ||||||
New China Life Insurance Co., Ltd. Class H(a) | 6,100 | 25,569 | ||||||
New Oriental Education & Technology Group, Inc. ADR | 400 | 12,548 | ||||||
People’s Insurance Co. Group of China, Ltd. Class H(a) | 51,000 | 24,830 | ||||||
PetroChina Co., Ltd. Class H(a) | 148,000 | 97,076 | ||||||
PICC Property & Casualty Co., Ltd. Class H(a) | 25,800 | 50,982 | ||||||
Ping An Insurance Group Co. of China, Ltd. Class H(a) | 36,000 | 198,065 | ||||||
Qihoo 360 Technology Co., Ltd. ADR(b) | 300 | 21,843 | ||||||
Semiconductor Manufacturing International Corp.(a)(b) | 213,000 | 21,661 | ||||||
Shandong Weigao Group Medical Polymer Co., Ltd. Class H(a) | 16,000 | 11,022 | ||||||
Shanghai Electric Group Co., Ltd. Class H(a) | 14,000 | 7,374 | ||||||
Shanghai Fosun Pharmaceutical Group Co., Ltd. Class H(a) | 2,000 | 5,773 | ||||||
Shanghai Industrial Holdings, Ltd.(a) | 5,000 | 13,085 | ||||||
Shanghai Lujiazui Finance & Trade Zone Development Co., Ltd. Class B(a) | 3,400 | 13,774 | ||||||
Shanghai Pharmaceuticals Holding Co., Ltd. Class H(a) | 6,200 | 13,363 | ||||||
Shenzhou International Group Holdings, Ltd.(a) | 4,000 | 22,923 | ||||||
Shui On Land, Ltd.(a) | 32,500 | 8,882 | ||||||
Sino-Ocean Land Holdings, Ltd.(a) | 29,500 | 18,809 | ||||||
Sinopec Engineering Group Co., Ltd. Class H(a) | 10,500 | 8,932 | ||||||
Sinopec Shanghai Petrochemical Co., Ltd. Class H(a)(b) | 38,000 | 15,029 | ||||||
Sinopharm Group Co., Ltd. Class H(a) | 8,000 | 31,937 | ||||||
Sinotrans, Ltd. Class H(a) | 9,000 | 4,791 | ||||||
SOHO China, Ltd.(a) | 38,500 | 18,628 | ||||||
Sunac China Holdings, Ltd.(a) | 9,000 | 6,915 | ||||||
Tencent Holdings, Ltd.(a) | 34,600 | 678,347 | ||||||
Tingyi Cayman Islands Holding Corp.(a) | 12,000 | 17,110 | ||||||
TravelSky Technology, Ltd. Class H(a) | 10,000 | 16,424 | ||||||
Tsingtao Brewery Co., Ltd. Class H(a) | 4,000 | 18,019 | ||||||
Vipshop Holdings, Ltd. ADR(b) | 1,300 | 19,851 | ||||||
Want Want China Holdings, Ltd.(a) | 45,000 | 33,398 | ||||||
Weichai Power Co., Ltd. Class H(a) | 10,000 | 11,025 | ||||||
Yangzijiang Shipbuilding Holdings, Ltd.(a) | 14,000 | 10,810 | ||||||
Yanzhou Coal Mining Co., Ltd. Class H(a) | 8,000 | 3,710 | ||||||
Youku Tudou, Inc. ADR(b) | 600 | 16,278 | ||||||
Yuexiu Property Co., Ltd.(a) | 34,000 | 5,853 | ||||||
Zhejiang Expressway Co., Ltd. Class H(a) | 12,000 | 14,338 | ||||||
Zhuzhou CSR Times Electric Co., Ltd. Class H(a) | 4,000 | 23,092 | ||||||
Zijin Mining Group Co., Ltd. Class H(a) | 54,000 | 14,206 | ||||||
ZTE Corp. Class H(a) | 6,600 | 14,965 | ||||||
|
| |||||||
| 6,298,111 | ||||||||
|
| |||||||
Colombia – 0.1% | ||||||||
Bancolombia SA ADR | 500 | 13,375 | ||||||
Cementos Argos SA | 1,948 | 5,965 | ||||||
Corp. Financiera Colombiana | 3 | 33 | ||||||
Ecopetrol SA ADR | 700 | 4,907 | ||||||
Ecopetrol SA | 9,851 | 3,444 | ||||||
Grupo Argos SA | 1,404 | 7,165 | ||||||
Grupo Aval Acciones y Valores SA Preference Shares | 16,055 | 5,513 | ||||||
Grupo de Inversiones Suramericana SA Preference Shares | 463 | 5,075 | ||||||
Grupo de Inversiones Suramericana SA | 1,089 | 12,247 | ||||||
Interconexion Electrica SA ESP | 1,874 | 4,357 | ||||||
|
| |||||||
| 62,081 | ||||||||
|
| |||||||
Czech Republic – 0.0%(e) | ||||||||
CEZ A/S(a) | 1,178 | 20,999 | ||||||
Komercni banka A/S(a) | 73 | 14,487 | ||||||
|
| |||||||
| 35,486 | ||||||||
|
| |||||||
Denmark – 1.4% | ||||||||
AP Moeller – Maersk A/S Class B(a) | 47 | 61,279 | ||||||
AP Moeller – Maersk A/S Class A(a) | 30 | 38,617 | ||||||
Carlsberg A/S Class B(a) | 724 | 64,116 | ||||||
Chr Hansen Holding A/S(a) | 662 | 41,393 | ||||||
Coloplast A/S Class B(a) | 759 | 61,256 | ||||||
Danske Bank A/S(a) | 5,270 | 141,353 | ||||||
DSV A/S(a) | 1,260 | 49,579 | ||||||
ISS A/S(a) | 966 | 34,808 | ||||||
Novo Nordisk A/S Class B(a) | 13,639 | 789,375 | ||||||
Novozymes A/S Class B(a) | 1,543 | 73,849 | ||||||
Pandora A/S(a) | 716 | 90,242 | ||||||
TDC A/S(a) | 3,900 | 19,411 | ||||||
Tryg A/S(a) | 505 | 10,031 | ||||||
Vestas Wind Systems A/S(a) | 1,453 | 101,437 | ||||||
William Demant Holding A/S(a)(b) | 213 | 20,282 | ||||||
|
| |||||||
| 1,597,028 | ||||||||
|
| |||||||
Egypt – 0.0%(e) | ||||||||
Commercial International Bank Egypt SAE | 6,481 | 31,453 | ||||||
Global Telecom Holding SAE(a)(b) | 12,679 | 3,320 | ||||||
Talaat Moustafa Group(a) | 4,988 | 4,071 | ||||||
|
| |||||||
| 38,844 | ||||||||
|
| |||||||
Finland – 0.6% | ||||||||
Elisa Oyj(a) | 1,121 | 42,160 | ||||||
Fortum Oyj(a) | 3,249 | 48,931 | ||||||
See accompanying notes to financial statements.
34
Table of Contents
State Street Global Equity ex-U.S. Index Portfolio
Schedule of Investments — (continued)
December 31, 2015
Security Description | Shares | Value | ||||||
COMMON STOCKS – (continued) | ||||||||
Finland – (continued) | ||||||||
Kone Oyj Class B(a) | 2,257 | $ | 95,524 | |||||
Metso Oyj(a) | 545 | 12,203 | ||||||
Neste Oyj(a) | 620 | 18,497 | ||||||
Nokia Oyj(a) | 24,641 | 174,251 | ||||||
Nokian Renkaat Oyj(a) | 548 | 19,556 | ||||||
Orion Oyj Class B(a) | 487 | 16,842 | ||||||
Sampo Oyj Class A(a) | 3,147 | 159,746 | ||||||
Stora Enso Oyj Class R(a) | 4,327 | 39,109 | ||||||
UPM-Kymmene Oyj(a) | 3,567 | 66,195 | ||||||
Wartsila Oyj Abp(a) | 1,083 | 49,427 | ||||||
|
| |||||||
| 742,441 | ||||||||
|
| |||||||
France – 6.9% | ||||||||
Accor SA(a) | 1,512 | 65,457 | ||||||
Aeroports de Paris(a) | 232 | 26,986 | ||||||
Air Liquide SA(a) | 2,375 | 266,523 | ||||||
Airbus Group SE(a) | 4,083 | 275,029 | ||||||
Alcatel-Lucent(b) | 18,766 | 74,407 | ||||||
Alstom SA(a)(b) | 1,573 | 48,027 | ||||||
Arkema SA(a) | 506 | 35,405 | ||||||
Atos SE(a) | 605 | 50,770 | ||||||
AXA SA(a) | 13,484 | 368,278 | ||||||
BNP Paribas SA(a) | 7,288 | 412,165 | ||||||
Bollore SA(b) | 25 | 115 | ||||||
Bollore SA(a) | 5,542 | 25,813 | ||||||
Bouygues SA(a) | 1,476 | 58,500 | ||||||
Bureau Veritas SA(a) | 1,978 | 39,408 | ||||||
Cap Gemini SA(a) | 1,156 | 107,216 | ||||||
Carrefour SA(a) | 3,612 | 104,198 | ||||||
Casino Guichard Perrachon SA(a) | 450 | 20,665 | ||||||
Christian Dior SE(a) | 360 | 61,125 | ||||||
Cie de Saint-Gobain(a) | 3,411 | 147,755 | ||||||
Cie Generale des Etablissements Michelin(a) | 1,308 | 124,447 | ||||||
CNP Assurances(a) | 830 | 11,192 | ||||||
Credit Agricole SA(a) | 7,492 | 88,250 | ||||||
Danone SA(a) | 4,075 | 275,248 | ||||||
Dassault Systemes(a) | 852 | 68,073 | ||||||
Edenred(a) | 1,613 | 30,478 | ||||||
Electricite de France SA(a) | 1,866 | 27,470 | ||||||
Engie SA(a) | 10,175 | 180,157 | ||||||
Essilor International SA(a) | 1,429 | 178,031 | ||||||
Eurazeo SA(a) | 193 | 13,306 | ||||||
Eutelsat Communications SA(a) | 1,293 | 38,697 | ||||||
Fonciere Des Regions(a) | 144 | 12,874 | ||||||
Gecina SA(a) | 267 | 32,446 | ||||||
Groupe Eurotunnel SE(a) | 3,452 | 42,929 | ||||||
Hermes International(a) | 176 | 59,468 | ||||||
ICADE(a) | 179 | 12,010 | ||||||
Iliad SA(a) | 196 | 46,703 | ||||||
Imerys SA(a) | 166 | 11,591 | ||||||
Ingenico Group SA(a) | 405 | 51,098 | ||||||
JCDecaux SA(a) | 597 | 22,876 | ||||||
Kering(a) | 488 | 83,401 | ||||||
Klepierre(a) | 1,518 | 67,447 | ||||||
L’Oreal SA(a) | 1,739 | 292,387 | ||||||
Lagardere SCA(a) | 922 | 27,502 | ||||||
Legrand SA(a) | 1,877 | 106,129 | ||||||
LVMH Moet Hennessy Louis Vuitton SE(a) | 1,927 | 302,549 | ||||||
Natixis SA(a) | 6,973 | 39,431 | ||||||
Numericable-SFR SAS(a) | 825 | 29,958 | ||||||
Orange SA(a) | 13,760 | 230,051 | ||||||
Pernod Ricard SA(a) | 1,480 | 168,716 | ||||||
Peugeot SA(a)(b) | 3,226 | 56,525 | ||||||
Publicis Groupe SA(a) | 1,231 | 81,822 | ||||||
Remy Cointreau SA(a) | 216 | 15,465 | ||||||
Renault SA(a) | 1,348 | 134,873 | ||||||
Rexel SA(a) | 2,324 | 30,933 | ||||||
Safran SA(a) | 2,041 | 140,164 | ||||||
Sanofi(a) | 7,911 | 673,910 | ||||||
Schneider Electric SE(a) | 3,868 | 219,627 | ||||||
SCOR SE(a) | 1,137 | 42,526 | ||||||
Societe BIC SA(a) | 218 | 35,858 | ||||||
Societe Generale SA(a) | 5,026 | 231,513 | ||||||
Sodexo SA(a) | 651 | 63,574 | ||||||
Suez Environnement Co.(a) | 2,221 | 41,523 | ||||||
Technip SA(a) | 784 | 38,972 | ||||||
Thales SA(a) | 649 | 48,557 | ||||||
TOTAL SA(a) | 14,556 | 652,295 | ||||||
Unibail-Rodamco SE(a) | 467 | 118,537 | ||||||
Unibail-Rodamco SE REIT | 220 | 56,018 | ||||||
Valeo SA(a) | 566 | 87,227 | ||||||
Veolia Environnement SA(a) | 3,221 | 76,389 | ||||||
Vinci SA(a) | 3,320 | 212,706 | ||||||
Vivendi SA(a) | 8,097 | 173,828 | ||||||
Wendel SA(a) | 150 | 17,831 | ||||||
Zodiac Aerospace(a) | 1,532 | 36,462 | ||||||
|
| |||||||
| 8,149,892 | ||||||||
|
| |||||||
Germany – 6.5% | ||||||||
adidas AG(a) | 1,362 | 132,140 | ||||||
Allianz SE(a) | 3,061 | 539,364 | ||||||
Axel Springer SE(a) | 191 | 10,617 | ||||||
BASF SE(a) | 6,153 | 468,529 | ||||||
Bayer AG(a) | 5,762 | 719,320 | ||||||
Bayerische Motoren Werke AG(a) | 2,294 | 241,576 | ||||||
Bayerische Motoren Werke AG Preference Shares(a) | 417 | 34,874 | ||||||
Beiersdorf AG(a) | 675 | 61,326 | ||||||
Brenntag AG(a) | 1,040 | 54,170 | ||||||
Commerzbank AG(a)(b) | 7,202 | 74,284 | ||||||
Continental AG(a) | 766 | 185,226 | ||||||
Daimler AG(a) | 6,450 | 538,700 | ||||||
Deutsche Bank AG(a) | 9,550 | 231,822 | ||||||
Deutsche Boerse AG(a) | 1,357 | 119,232 | ||||||
Deutsche Lufthansa AG(a)(b) | 1,820 | 28,655 | ||||||
Deutsche Post AG(a) | 6,740 | 188,357 | ||||||
Deutsche Telekom AG(a) | 22,207 | 398,687 | ||||||
Deutsche Wohnen AG(a) | 2,251 | 62,218 | ||||||
E.ON SE(a) | 14,028 | 134,641 | ||||||
Evonik Industries AG(a) | 935 | 30,914 | ||||||
Fraport AG Frankfurt Airport Services Worldwide(a) | 179 | 11,411 | ||||||
Fresenius Medical Care AG & Co. KGaA(a) | 1,532 | 128,688 | ||||||
Fresenius SE & Co. KGaA(a) | 2,652 | 188,830 | ||||||
Fuchs Petrolub SE Preference Shares(a) | 336 | 15,815 | ||||||
GEA Group AG(a) | 1,316 | 53,146 | ||||||
Hannover Rueck SE(a) | 438 | 49,994 | ||||||
HeidelbergCement AG(a) | 933 | 76,006 | ||||||
See accompanying notes to financial statements.
35
Table of Contents
State Street Global Equity ex-U.S. Index Portfolio
Schedule of Investments — (continued)
December 31, 2015
Security Description | Shares | Value | ||||||
COMMON STOCKS – (continued) | ||||||||
Germany – (continued) | ||||||||
Henkel AG & Co. KGaA(a) | 746 | $ | 71,327 | |||||
Henkel AG & Co. KGaA Preference Shares(a) | 1,248 | 139,222 | ||||||
HUGO BOSS AG(a) | 386 | 31,835 | ||||||
Infineon Technologies AG(a) | 7,259 | 105,783 | ||||||
K S AG(a) | 1,478 | 37,660 | ||||||
Kabel Deutschland Holding AG(a) | 107 | 13,216 | ||||||
Lanxess AG(a) | 695 | 31,969 | ||||||
Linde AG(a) | 1,288 | 185,985 | ||||||
MAN SE(a) | 275 | 27,624 | ||||||
Merck KGaA(a) | 843 | 81,586 | ||||||
METRO AG(a) | 1,349 | 42,958 | ||||||
Muenchener Rueckversicherungs-Gesellschaft AG in Muenchen(a) | 1,157 | 230,422 | ||||||
OSRAM Licht AG(a) | 694 | 28,983 | ||||||
Porsche Automobil Holding SE Preference Shares(a) | 1,128 | 60,681 | ||||||
ProSiebenSat.1 Media SE(a) | 1,436 | 72,418 | ||||||
RWE AG(a) | 3,627 | 45,708 | ||||||
SAP SE(a) | 6,885 | 546,120 | ||||||
Siemens AG(a) | 5,556 | 537,297 | ||||||
Symrise AG(a) | 848 | 56,113 | ||||||
Telefonica Deutschland Holding AG(a) | 4,663 | 24,586 | ||||||
ThyssenKrupp AG(a) | 2,189 | 43,375 | ||||||
TUI AG(a) | 2,999 | 53,537 | ||||||
United Internet AG(a) | 909 | 49,955 | ||||||
Volkswagen AG(a) | 269 | 41,319 | ||||||
Volkswagen AG Preference Shares(a) | 1,243 | 179,389 | ||||||
Vonovia SE(a) | 3,297 | 101,812 | ||||||
Zalando SE(b)(d) | 693 | 27,402 | ||||||
|
| |||||||
| 7,646,824 | ||||||||
|
| |||||||
Greece – 0.1% | ||||||||
Alpha Bank AE(a)(b) | 9,400 | 25,181 | ||||||
Eurobank Ergasias SA(a)(b) | 17,778 | 19,908 | ||||||
Hellenic Telecommunications Organization SA(a) | 2,078 | 20,788 | ||||||
JUMBO SA(a)(b) | 493 | 5,180 | ||||||
National Bank of Greece SA(a)(b) | 790 | 292 | ||||||
OPAP SA(a) | 1,974 | 17,315 | ||||||
Piraeus Bank SA(a)(b) | 62,037 | 18,531 | ||||||
Titan Cement Co. SA(a) | 224 | 4,276 | ||||||
|
| |||||||
| 111,471 | ||||||||
|
| |||||||
Hong Kong – 2.4% | ||||||||
AIA Group, Ltd.(a) | 80,800 | 482,780 | ||||||
Alibaba Pictures Group, Ltd.(a)(b) | 50,000 | 12,196 | ||||||
ASM Pacific Technology, Ltd.(a) | 1,200 | 9,377 | ||||||
Bank of East Asia, Ltd.(a) | 6,436 | 23,874 | ||||||
BOC Hong Kong Holdings, Ltd.(a) | 24,000 | 72,878 | ||||||
Cathay Pacific Airways, Ltd.(a) | 6,000 | 10,324 | ||||||
Cheung Kong Infrastructure Holdings, Ltd.(a) | 5,000 | 46,129 | ||||||
Cheung Kong Property Holdings, Ltd.(a) | 18,524 | 120,662 | ||||||
China Gas Holdings, Ltd.(a) | 14,000 | 20,152 | ||||||
CK Hutchison Holdings, Ltd.(a) | 18,024 | 241,811 | ||||||
CLP Holdings, Ltd.(a) | 13,500 | 114,685 | ||||||
First Pacific Co., Ltd.(a) | 22,000 | 14,573 | ||||||
Galaxy Entertainment Group, Ltd.(a) | 18,000 | 56,399 | ||||||
GCL-Poly Energy Holdings, Ltd.(a) | 91,000 | 13,647 | ||||||
Goldin Properties Holdings, | 8,000 | 9,061 | ||||||
Haier Electronics Group Co., Ltd.(a) | 10,000 | 20,185 | ||||||
Hanergy Thin Film Power Group, Ltd.(b)(f) | 68,000 | – | ||||||
Hang Lung Properties, Ltd.(a) | 17,000 | 38,519 | ||||||
Hang Seng Bank, Ltd.(a) | 5,400 | 102,832 | ||||||
Henderson Land Development Co., Ltd.(a) | 8,543 | 52,112 | ||||||
HK Electric Investments & HK Electric Investments, Ltd.(a)(d) | 22,664 | 18,990 | ||||||
HKT Trust & HKT, Ltd. | 21,000 | 26,825 | ||||||
Hong Kong & China Gas Co., Ltd.(a) | 49,000 | 96,146 | ||||||
Hong Kong Exchanges and Clearing, Ltd.(a) | 7,940 | 202,267 | ||||||
Hongkong Land Holdings, Ltd.(a) | 4,000 | 27,931 | ||||||
Hysan Development Co., Ltd.(a) | 3,000 | 12,295 | ||||||
Imperial Pacific International Holdings, Ltd.(a)(b) | 376,000 | 8,223 | ||||||
Kerry Properties, Ltd.(a) | 5,500 | 15,003 | ||||||
Li & Fung, Ltd.(a) | 46,000 | 31,168 | ||||||
Link REIT(a) | 15,000 | 89,716 | ||||||
Melco Crown Entertainment, Ltd. ADR | 1,003 | 16,850 | ||||||
MTR Corp., Ltd.(a) | 10,550 | 52,161 | ||||||
New World China Land, Ltd.(a) | 22,000 | 17,578 | ||||||
New World Development Co., Ltd.(a) | 41,969 | 41,264 | ||||||
Nine Dragons Paper Holdings, Ltd.(a) | 8,000 | 4,698 | ||||||
Noble Group, Ltd.(a) | 21,000 | 5,867 | ||||||
NWS Holdings, Ltd.(a) | 7,373 | 10,930 | ||||||
PCCW, Ltd.(a) | 20,000 | 11,691 | ||||||
Power Assets Holdings, Ltd.(a) | 10,000 | 91,931 | ||||||
Sands China, Ltd.(a) | 16,400 | 55,389 | ||||||
Shangri-La Asia, Ltd.(a) | 4,000 | 3,905 | ||||||
Shimao Property Holdings, Ltd.(a) | 11,500 | 20,330 | ||||||
Sino Biopharmaceutical, Ltd.(a) | 34,000 | 30,652 | ||||||
Sino Land Co., Ltd.(a) | 22,181 | 32,369 | ||||||
SJM Holdings, Ltd.(a) | 10,000 | 7,112 | ||||||
Sun Art Retail Group, Ltd.(a) | 20,500 | �� | 15,424 | |||||
Sun Hung Kai Properties, Ltd.(a) | 12,000 | 144,464 | ||||||
Swire Pacific, Ltd. Class A(a) | 4,500 | 50,467 | ||||||
Swire Properties, Ltd.(a) | 9,200 | 26,453 | ||||||
Techtronic Industries Co., Ltd.(a) | 10,500 | 42,506 | ||||||
WH Group, Ltd.(a)(b)(d) | 39,500 | 21,933 | ||||||
Wharf Holdings, Ltd.(a) | 10,000 | 55,326 | ||||||
Wheelock & Co., Ltd.(a) | 7,000 | 29,508 | ||||||
Yue Yuen Industrial Holdings, Ltd.(a) | 3,500 | 11,834 | ||||||
|
| |||||||
| 2,791,402 | ||||||||
|
| |||||||
Hungary – 0.1% | ||||||||
MOL Hungarian Oil & Gas PLC(a) | 202 | 9,828 | ||||||
OTP Bank PLC(a) | 2,100 | 43,075 | ||||||
Richter Gedeon Nyrt(a) | 676 | 12,729 | ||||||
|
| |||||||
| 65,632 | ||||||||
|
| |||||||
See accompanying notes to financial statements.
36
Table of Contents
State Street Global Equity ex-U.S. Index Portfolio
Schedule of Investments — (continued)
December 31, 2015
Security Description | Shares | Value | ||||||
COMMON STOCKS – (continued) | ||||||||
India – 1.8% | ||||||||
Adani Ports & Special Economic Zone, Ltd.(a) | 5,808 | $ | 22,818 | |||||
Ambuja Cements, Ltd.(a) | 5,670 | 17,378 | ||||||
Apollo Hospitals Enterprise, Ltd.(a) | 698 | 15,410 | ||||||
Ashok Leyland, Ltd.(a) | 11,880 | 15,717 | ||||||
Asian Paints, Ltd.(a) | 2,029 | 26,999 | ||||||
Aurobindo Pharma, Ltd.(a) | 1,943 | 25,589 | ||||||
Bajaj Auto, Ltd.(a) | 628 | 24,044 | ||||||
Bharat Forge, Ltd.(a) | 1,020 | 13,692 | ||||||
Bharat Heavy Electricals, Ltd.(a) | 5,166 | 13,179 | ||||||
Bharat Petroleum Corp., Ltd.(a) | 1,416 | 19,012 | ||||||
Bharti Airtel, Ltd.(a) | 10,480 | 53,320 | ||||||
Bharti Infratel, Ltd.(a) | 4,072 | 26,119 | ||||||
Bosch, Ltd.(a) | 62 | 17,393 | ||||||
Cipla, Ltd.(a) | 2,496 | 24,579 | ||||||
Coal India, Ltd.(a) | 4,976 | 24,556 | ||||||
Dabur India, Ltd.(a) | 4,324 | 18,024 | ||||||
Divi’s Laboratories, Ltd.(a) | 939 | 16,307 | ||||||
Dr Reddy’s Laboratories, Ltd.(a) | 1,047 | 49,064 | ||||||
Eicher Motors, Ltd.(a) | 89 | 22,585 | ||||||
GAIL India, Ltd. GDR | 400 | 13,520 | ||||||
Glenmark Pharmaceuticals, Ltd.(a) | 1,135 | 15,731 | ||||||
Godrej Consumer Products, Ltd.(a) | 978 | 19,509 | ||||||
HCL Technologies, Ltd.(a) | 3,768 | 48,760 | ||||||
Hero MotoCorp, Ltd.(a) | 441 | 17,856 | ||||||
Hindalco Industries, Ltd.(a) | 13,190 | 16,805 | ||||||
Hindustan Unilever, Ltd.(a) | 5,264 | 68,479 | ||||||
Housing Development Finance Corp., Ltd.(a) | 10,032 | 190,769 | ||||||
ICICI Bank, Ltd. ADR | 3,576 | 28,000 | ||||||
Idea Cellular, Ltd.(a) | 8,548 | 18,465 | ||||||
Indiabulls Housing Finance, Ltd.(a) | 2,089 | 23,021 | ||||||
Infosys, Ltd.(a) | 2,131 | 35,561 | ||||||
Infosys, Ltd. ADR | 11,029 | 184,736 | ||||||
ITC, Ltd.(a) | 14,646 | 72,610 | ||||||
Larsen & Toubro, Ltd. GDR(a) | 1,370 | 26,464 | ||||||
Larsen & Toubro, Ltd. GDR | 750 | 14,550 | ||||||
LIC Housing Finance, Ltd.(a) | 2,368 | 18,208 | ||||||
Lupin, Ltd.(a) | 1,709 | 47,154 | ||||||
Mahindra & Mahindra, Ltd. GDR(a) | 1,651 | 31,550 | ||||||
Mahindra & Mahindra, Ltd.(a) | 954 | 18,207 | ||||||
Marico, Ltd.(a)(c) | 2,239 | 7,634 | ||||||
Marico, Ltd.(a)(c) | 2,239 | 7,654 | ||||||
Maruti Suzuki India, Ltd.(a) | 708 | 49,285 | ||||||
Nestle India, Ltd.(a) | 189 | 16,585 | ||||||
NTPC, Ltd.(a) | 9,531 | 20,866 | ||||||
Oil & Natural Gas Corp., Ltd.(a) | 6,380 | 23,094 | ||||||
Reliance Industries, Ltd. GDR(c)(d) | 1,500 | 45,900 | ||||||
Reliance Industries, Ltd. GDR(c)(d) | 1,942 | 59,425 | ||||||
Reliance Industries, Ltd.(a) | 1,286 | 19,609 | ||||||
Shree Cement, Ltd.(a) | 80 | 14,046 | ||||||
Shriram Transport Finance Co., Ltd.(a) | 1,238 | 16,031 | ||||||
Siemens, Ltd.(a) | 695 | 12,621 | ||||||
State Bank of India GDR | 1,020 | 34,425 | ||||||
Sun Pharmaceutical Industries, Ltd.(a) | 6,233 | 77,005 | ||||||
Tata Consultancy Services, Ltd.(a) | 3,557 | 130,400 | ||||||
Tata Motors, Ltd. ADR(b) | 1,078 | 31,769 | ||||||
Tata Motors, Ltd.(a)(b) | 3,923 | 17,106 | ||||||
Tata Steel, Ltd. GDR(a) | 1,300 | 5,124 | ||||||
Tech Mahindra, Ltd.(a) | 1,980 | 15,579 | ||||||
UltraTech Cement, Ltd.(a) | 347 | 14,516 | ||||||
United Spirits, Ltd.(a)(b) | 445 | 20,157 | ||||||
UPL, Ltd.(a) | 2,397 | 15,750 | ||||||
Vedanta, Ltd. ADR | 1,433 | 7,968 | ||||||
Wipro, Ltd. ADR | 2,938 | 33,905 | ||||||
Zee Entertainment Enterprises, Ltd.(a) | 4,134 | 27,310 | ||||||
|
| |||||||
| 2,079,504 | ||||||||
|
| |||||||
Indonesia – 0.5% | ||||||||
Astra International Tbk PT(a) | 136,500 | 58,798 | ||||||
Bank Central Asia Tbk PT(a) | 80,500 | 77,125 | ||||||
Bank Danamon Indonesia Tbk PT(a) | 16,000 | 3,700 | ||||||
Bank Mandiri Persero Tbk PT(a) | 72,500 | 48,143 | ||||||
Bank Negara Indonesia Persero Tbk PT(a) | 37,000 | 13,247 | ||||||
Bank Rakyat Indonesia Persero Tbk PT(a) | 75,000 | 61,553 | ||||||
Bumi Serpong Damai Tbk PT(a) | 75,500 | 9,738 | ||||||
Charoen Pokphand Indonesia Tbk PT(a) | 35,500 | 6,615 | ||||||
Gudang Garam Tbk PT(a) | 2,500 | 9,922 | ||||||
Hanjaya Mandala Sampoerna Tbk PT(a) | 3,500 | 23,824 | ||||||
Indocement Tunggal Prakarsa Tbk PT(a) | 6,500 | 10,423 | ||||||
Indofood CBP Sukses Makmur Tbk PT(a) | 5,500 | 5,321 | ||||||
Indofood Sukses Makmur Tbk PT(a) | 57,000 | 21,217 | ||||||
Jasa Marga Persero Tbk PT(a) | 5,500 | 2,069 | ||||||
Kalbe Farma Tbk PT(a) | 87,500 | 8,325 | ||||||
Lippo Karawaci Tbk PT(a) | 95,000 | 7,110 | ||||||
Matahari Department Store Tbk PT(a) | 25,000 | 31,648 | ||||||
Perusahaan Gas Negara Persero Tbk(a) | 58,000 | 11,436 | ||||||
Semen Indonesia Persero Tbk PT(a) | 21,500 | 17,617 | ||||||
Summarecon Agung Tbk PT(a) | 50,500 | 5,960 | ||||||
Surya Citra Media Tbk PT(a) | 28,500 | 6,355 | ||||||
Telekomunikasi Indonesia Persero Tbk PT(a) | 334,500 | 74,920 | ||||||
Tower Bersama Infrastructure Tbk PT(a)(b) | 9,500 | 4,019 | ||||||
Unilever Indonesia Tbk PT(a) | 14,500 | 38,707 | ||||||
United Tractors Tbk PT(a) | 8,000 | 9,741 | ||||||
|
| |||||||
| 567,533 | ||||||||
|
| |||||||
Ireland – 0.7% | ||||||||
Bank of Ireland(a)(b) | 182,414 | 66,764 | ||||||
CRH PLC(a) | 6,037 | 174,028 | ||||||
Experian PLC(a) | 6,835 | 120,780 | ||||||
James Hardie Industries PLC(a) | 3,353 | 42,208 | ||||||
Kerry Group PLC Class A(a) | 1,030 | 85,187 | ||||||
Shire PLC(a) | 4,092 | 280,684 | ||||||
|
| |||||||
| 769,651 | ||||||||
|
| |||||||
See accompanying notes to financial statements.
37
Table of Contents
State Street Global Equity ex-U.S. Index Portfolio
Schedule of Investments — (continued)
December 31, 2015
Security Description | Shares | Value | ||||||
COMMON STOCKS – (continued) | ||||||||
Israel – 0.5% | ||||||||
Azrieli Group(a) | 360 | $ | 13,411 | |||||
Bank Hapoalim BM(a) | 8,327 | 42,983 | ||||||
Bank Leumi Le-Israel BM(a)(b) | 11,088 | 38,445 | ||||||
Bezeq The Israeli Telecommunication Corp., Ltd.(a) | 18,578 | 40,896 | ||||||
Check Point Software Technologies, Ltd.(b) | 454 | 36,947 | ||||||
Delek Group, Ltd.(a) | 11 | 2,203 | ||||||
Israel Chemicals, Ltd.(a) | 2,151 | 8,732 | ||||||
Mizrahi Tefahot Bank, Ltd.(a) | 312 | 3,726 | ||||||
NICE-Systems, Ltd.(a) | 277 | 15,916 | ||||||
Teva Pharmaceutical Industries, Ltd.(a) | 6,440 | 420,146 | ||||||
|
| |||||||
| 623,405 | ||||||||
|
| |||||||
Italy – 1.5% | ||||||||
Assicurazioni Generali SpA(a) | 8,222 | 150,127 | ||||||
Atlantia SpA(a) | 2,710 | 71,673 | ||||||
Banca Monte dei Paschi di Siena SpA(a)(b) | 12,884 | 17,049 | ||||||
Banco Popolare SC(a)(b) | 2,859 | 39,382 | ||||||
Enel Green Power SpA(a) | 8,459 | 17,186 | ||||||
Enel SpA(a) | 47,244 | 198,026 | ||||||
Eni SpA(a) | 17,042 | 253,108 | ||||||
EXOR SpA(a) | 930 | 42,192 | ||||||
Finmeccanica SpA(a)(b) | 3,150 | 43,780 | ||||||
Intesa Sanpaolo SpA(a) | 84,973 | 282,078 | ||||||
Intesa Sanpaolo SpA(a) | 4,508 | 13,765 | ||||||
Luxottica Group SpA(a) | 1,104 | 71,912 | ||||||
Mediobanca SpA(a) | 5,057 | 48,457 | ||||||
Prysmian SpA(a) | 994 | 21,709 | ||||||
Saipem SpA(a)(b) | 1,280 | 10,342 | ||||||
Snam SpA(a) | 13,866 | 72,336 | ||||||
Telecom Italia SpA(a)(b) | 76,870 | 97,378 | ||||||
Telecom Italia SpA(a) | 43,871 | 45,007 | ||||||
Terna Rete Elettrica Nazionale SpA(a) | 10,775 | 55,392 | ||||||
UniCredit SpA(a) | 31,979 | 176,729 | ||||||
Unione di Banche Italiane SpA(a) | 6,303 | 42,096 | ||||||
UnipolSai SpA(a) | 4,400 | 11,189 | ||||||
|
| |||||||
| 1,780,913 | ||||||||
|
| |||||||
Japan – 16.6% | ||||||||
ABC-Mart, Inc.(a) | 100 | 5,469 | ||||||
Acom Co., Ltd.(a)(b) | 3,400 | 15,997 | ||||||
Aeon Co., Ltd.(a) | 4,400 | 67,737 | ||||||
AEON Financial Service Co., Ltd.(a) | 900 | 20,088 | ||||||
Aeon Mall Co., Ltd.(a) | 1,000 | 17,138 | ||||||
Air Water, Inc.(a) | 1,000 | 16,070 | ||||||
Aisin Seiki Co., Ltd.(a) | 1,300 | 55,903 | ||||||
Ajinomoto Co., Inc.(a) | 4,000 | 94,624 | ||||||
Alfresa Holdings Corp.(a) | 900 | 17,760 | ||||||
Alps Electric Co., Ltd.(a) | 1,300 | 35,224 | ||||||
Amada Holdings Co., Ltd.(a) | 1,700 | 16,209 | ||||||
ANA Holdings, Inc.(a) | 6,000 | 17,296 | ||||||
Aozora Bank, Ltd.(a) | 6,000 | 20,922 | ||||||
Asahi Glass Co., Ltd.(a) | 7,000 | 40,069 | ||||||
Asahi Group Holdings, Ltd.(a) | 2,500 | 78,196 | ||||||
Asahi Kasei Corp.(a) | 9,000 | 60,808 | ||||||
Asics Corp.(a) | 800 | 16,584 | ||||||
Astellas Pharma, Inc.(a) | 14,700 | 209,092 | ||||||
Bandai Namco Holdings, Inc.(a) | 1,400 | 29,553 | ||||||
Bank of Kyoto, Ltd.(a) | 2,000 | 18,532 | ||||||
Bank of Yokohama, Ltd.(a) | 8,000 | 48,996 | ||||||
Benesse Holdings, Inc.(a) | 200 | 5,755 | ||||||
Bridgestone Corp.(a) | 4,500 | 154,228 | ||||||
Brother Industries, Ltd.(a) | 1,100 | 12,626 | ||||||
Calbee, Inc.(a) | 500 | 21,097 | ||||||
Canon, Inc.(a) | 7,400 | 223,664 | ||||||
Casio Computer Co., Ltd.(a) | 1,500 | 35,036 | ||||||
Central Japan Railway Co.(a) | 1,000 | 177,386 | ||||||
Chiba Bank, Ltd.(a) | 4,000 | 28,361 | ||||||
Chubu Electric Power Co., Inc.(a) | 4,300 | 58,834 | ||||||
Chugai Pharmaceutical Co., Ltd.(a) | 1,600 | 55,724 | ||||||
Chugoku Bank, Ltd.(a) | 800 | 10,666 | ||||||
Chugoku Electric Power Co., Inc.(a) | 2,300 | 30,342 | ||||||
Citizen Holdings Co., Ltd.(a) | 2,300 | 16,517 | ||||||
Credit Saison Co., Ltd.(a) | 700 | 13,780 | ||||||
Dai Nippon Printing Co., Ltd.(a) | 3,000 | 29,641 | ||||||
Dai-ichi Life Insurance Co., Ltd.(a) | 7,000 | 116,367 | ||||||
Daicel Corp.(a) | 2,100 | 31,226 | ||||||
Daihatsu Motor Co., Ltd.(a) | 900 | 12,131 | ||||||
Daiichi Sankyo Co., Ltd.(a) | 4,200 | 86,615 | ||||||
Daikin Industries, Ltd.(a) | 1,500 | 109,142 | ||||||
Daito Trust Construction Co., Ltd.(a) | 500 | 57,707 | ||||||
Daiwa House Industry Co., Ltd.(a) | 4,200 | 120,634 | ||||||
Daiwa Securities Group, Inc.(a) | 11,000 | 67,195 | ||||||
Denso Corp.(a) | 3,400 | 162,336 | ||||||
Dentsu, Inc.(a) | 1,500 | 82,000 | ||||||
Don Quijote Holdings Co., Ltd.(a) | 900 | 31,581 | ||||||
East Japan Railway Co.(a) | 2,300 | 216,401 | ||||||
Eisai Co., Ltd.(a) | 1,700 | 112,363 | ||||||
Electric Power Development Co., Ltd.(a) | 1,100 | 39,146 | ||||||
FamilyMart Co., Ltd.(a) | 300 | 13,949 | ||||||
FANUC Corp.(a) | 1,300 | 223,791 | ||||||
Fast Retailing Co., Ltd.(a) | 400 | 139,808 | ||||||
Fuji Electric Co., Ltd.(a) | 3,000 | 12,571 | ||||||
Fuji Heavy Industries, Ltd.(a) | 4,100 | 168,764 | ||||||
FUJIFILM Holdings Corp.(a) | 3,000 | 125,093 | ||||||
Fujitsu, Ltd.(a) | 13,000 | 64,831 | ||||||
Fukuoka Financial Group, Inc.(a) | 4,000 | 19,818 | ||||||
GungHo Online Entertainment, Inc.(a)(b) | 900 | 2,443 | ||||||
Gunma Bank, Ltd.(a) | 2,000 | 11,619 | ||||||
Hachijuni Bank, Ltd.(a) | 2,000 | 12,230 | ||||||
Hakuhodo DY Holdings, Inc.(a) | 1,100 | 11,892 | ||||||
Hamamatsu Photonics KK(a) | 1,100 | 30,132 | ||||||
Hankyu Hanshin Holdings, Inc.(a) | 8,000 | 51,956 | ||||||
Hikari Tsushin, Inc.(a) | 200 | 13,609 | ||||||
Hino Motors, Ltd.(a) | 1,200 | 13,857 | ||||||
Hirose Electric Co., Ltd.(a) | 200 | 24,194 | ||||||
Hiroshima Bank, Ltd.(a) | 4,000 | 22,716 | ||||||
Hisamitsu Pharmaceutical Co., Inc.(a) | 300 | 12,584 | ||||||
Hitachi Chemical Co., Ltd.(a) | 500 | 7,926 | ||||||
Hitachi Construction Machinery Co., Ltd.(a) | 500 | 7,770 | ||||||
Hitachi High-Technologies Corp.(a) | 300 | 8,106 | ||||||
See accompanying notes to financial statements.
38
Table of Contents
State Street Global Equity ex-U.S. Index Portfolio
Schedule of Investments — (continued)
December 31, 2015
Security Description | Shares | Value | ||||||
COMMON STOCKS – (continued) | ||||||||
Japan – (continued) | ||||||||
Hitachi Metals, Ltd.(a) | 1,000 | $ | 12,328 | |||||
Hitachi, Ltd.(a) | 34,000 | 192,496 | ||||||
Hokuhoku Financial Group, Inc.(a) | 6,000 | 12,221 | ||||||
Hokuriku Electric Power Co.(a) | 1,300 | 19,196 | ||||||
Honda Motor Co., Ltd.(a) | 11,200 | 357,671 | ||||||
Hoshizaki Electric Co., Ltd.(a) | 300 | 18,634 | ||||||
Hoya Corp.(a) | 2,700 | 110,318 | ||||||
Hulic Co., Ltd.(a) | 2,400 | 21,056 | ||||||
Idemitsu Kosan Co., Ltd.(a) | 200 | 3,191 | ||||||
IHI Corp.(a) | 7,000 | 19,307 | ||||||
Iida Group Holdings Co., Ltd.(a) | 1,000 | 18,519 | ||||||
Inpex Corp.(a) | 6,800 | 66,237 | ||||||
Isetan Mitsukoshi Holdings, Ltd.(a) | 2,700 | 35,182 | ||||||
Isuzu Motors, Ltd.(a) | 4,300 | 46,284 | ||||||
ITOCHU Corp.(a) | 11,100 | 131,187 | ||||||
Itochu Techno-Solutions Corp.(a) | 200 | 3,982 | ||||||
Iyo Bank, Ltd.(a) | 1,200 | 11,649 | ||||||
J Front Retailing Co., Ltd.(a) | 1,900 | 27,598 | ||||||
Japan Airlines Co., Ltd.(a) | 1,000 | 35,763 | ||||||
Japan Airport Terminal Co., Ltd.(a) | 200 | 8,846 | ||||||
Japan Exchange Group, Inc.(a) | 3,700 | 57,789 | ||||||
Japan Post Bank Co., Ltd.(b) | 3,000 | 43,643 | ||||||
Japan Post Holdings Co., Ltd.(b) | 3,000 | 46,511 | ||||||
Japan Prime Realty Investment Corp.(a) | 4 | 13,648 | ||||||
Japan Real Estate Investment Corp.(a) | 10 | 48,487 | ||||||
Japan Retail Fund Investment Corp.(a) | 18 | 34,601 | ||||||
Japan Tobacco, Inc.(a) | 7,600 | 278,793 | ||||||
JFE Holdings, Inc.(a) | 3,500 | 54,913 | ||||||
JGC Corp.(a) | 1,000 | 15,294 | ||||||
Joyo Bank, Ltd.(a) | 3,000 | 14,175 | ||||||
JSR Corp.(a) | 900 | 14,014 | ||||||
JTEKT Corp.(a) | 1,600 | 26,167 | ||||||
JX Holdings, Inc.(a) | 15,200 | 63,743 | ||||||
Kajima Corp.(a) | 6,000 | 35,679 | ||||||
Kakaku.com, Inc.(a) | 700 | 13,757 | ||||||
Kamigumi Co., Ltd.(a) | 1,000 | 8,603 | ||||||
Kaneka Corp.(a) | 2,000 | 20,771 | ||||||
Kansai Electric Power Co., | 4,800 | 57,503 | ||||||
Kansai Paint Co., Ltd.(a) | 1,800 | 27,261 | ||||||
Kao Corp.(a) | 3,500 | 179,711 | ||||||
Kawasaki Heavy Industries, Ltd.(a) | 11,000 | 40,665 | ||||||
KDDI Corp.(a) | 12,100 | 313,978 | ||||||
Keihan Electric Railway Co., Ltd.(a) | 4,000 | 26,767 | ||||||
Keikyu Corp.(a) | 4,000 | 33,026 | ||||||
Keio Corp.(a) | 4,000 | 34,514 | ||||||
Keisei Electric Railway Co., Ltd.(a) | 2,000 | 25,495 | ||||||
Keyence Corp.(a) | 300 | 164,744 | ||||||
Kikkoman Corp.(a) | 1,000 | 34,619 | ||||||
Kintetsu Group Holdings Co., Ltd.(a) | 13,000 | 52,811 | ||||||
Kirin Holdings Co., Ltd.(a) | 5,400 | 73,256 | ||||||
Kobe Steel, Ltd.(a) | 24,000 | 26,055 | ||||||
Koito Manufacturing Co., Ltd.(a) | 800 | 32,779 | ||||||
Komatsu, Ltd.(a) | 5,900 | 96,458 | ||||||
Konami Holdings Corp.(a) | 800 | 19,028 | ||||||
Konica Minolta, Inc.(a) | 3,400 | 34,023 | ||||||
Kose Corp.(a) | 200 | 18,477 | ||||||
Kubota Corp.(a) | 8,000 | 123,486 | ||||||
Kuraray Co., Ltd.(a) | 2,700 | 32,677 | ||||||
Kurita Water Industries, Ltd.(a) | 500 | 10,462 | ||||||
Kyocera Corp.(a) | 2,100 | 97,444 | ||||||
Kyowa Hakko Kirin Co., Ltd.(a) | 2,000 | 31,443 | ||||||
Kyushu Electric Power Co., | 3,200 | 34,848 | ||||||
Kyushu Financial Group, Inc.(b) | 3,000 | 21,123 | ||||||
Lawson, Inc.(a) | 500 | 40,552 | ||||||
LIXIL Group Corp.(a) | 2,000 | 44,382 | ||||||
M3, Inc.(a) | 1,500 | 31,075 | ||||||
Mabuchi Motor Co., Ltd.(a) | 400 | 21,660 | ||||||
Makita Corp.(a) | 900 | 51,821 | ||||||
Marubeni Corp.(a) | 11,100 | 57,019 | ||||||
Marui Group Co., Ltd.(a) | 1,200 | 19,511 | ||||||
Maruichi Steel Tube, Ltd.(a) | 100 | 2,950 | ||||||
Mazda Motor Corp.(a) | 3,600 | 74,223 | ||||||
McDonald’s Holdings Co., Japan, Ltd.(a)(b) | 200 | 4,346 | ||||||
Medipal Holdings Corp.(a) | 1,100 | 18,733 | ||||||
MEIJI Holdings Co., Ltd.(a) | 800 | 66,025 | ||||||
Minebea Co., Ltd.(a) | 2,000 | 17,110 | ||||||
Miraca Holdings, Inc.(a) | 300 | 13,189 | ||||||
Mitsubishi Chemical Holdings Corp.(a) | 9,300 | 58,957 | ||||||
Mitsubishi Corp.(a) | 9,400 | 156,221 | ||||||
Mitsubishi Electric Corp.(a) | 13,000 | 136,346 | ||||||
Mitsubishi Estate Co., Ltd.(a) | 9,000 | 186,984 | ||||||
Mitsubishi Gas Chemical Co., Inc.(a) | 3,000 | 15,328 | ||||||
Mitsubishi Heavy Industries, Ltd.(a) | 21,000 | 91,746 | ||||||
Mitsubishi Logistics Corp.(a) | 1,000 | 13,165 | ||||||
Mitsubishi Materials Corp.(a) | 9,000 | 28,323 | ||||||
Mitsubishi Motors Corp.(a) | 4,800 | 40,577 | ||||||
Mitsubishi Tanabe Pharma Corp.(a) | 1,700 | 29,264 | ||||||
Mitsubishi UFJ Financial Group, Inc.(a) | 89,300 | 552,687 | ||||||
Mitsubishi UFJ Lease & Finance Co., Ltd.(a) | 2,400 | 12,341 | ||||||
Mitsui & Co., Ltd.(a) | 11,900 | 141,279 | ||||||
Mitsui Chemicals, Inc.(a) | 4,000 | 17,725 | ||||||
Mitsui Fudosan Co., Ltd.(a) | 7,000 | 175,539 | ||||||
Mitsui OSK Lines, Ltd.(a) | 9,000 | 22,682 | ||||||
Mixi, Inc.(a) | 200 | 7,474 | ||||||
Mizuho Financial Group, Inc.(a) | 162,400 | 324,530 | ||||||
MS&AD Insurance Group Holdings, Inc.(a) | 3,300 | 96,691 | ||||||
Murata Manufacturing Co., Ltd.(a) | 1,400 | 201,266 | ||||||
Nabtesco Corp.(a) | 600 | 12,179 | ||||||
Nagoya Railroad Co., Ltd.(a) | 7,000 | 29,111 | ||||||
NEC Corp.(a) | 18,000 | 56,986 | ||||||
Nexon Co., Ltd.(a) | 1,100 | 17,880 | ||||||
NGK Insulators, Ltd.(a) | 2,000 | 45,043 | ||||||
NGK Spark Plug Co., Ltd.(a) | 1,400 | 36,829 | ||||||
NH Foods, Ltd.(a) | 1,000 | 19,584 | ||||||
NHK Spring Co., Ltd.(a) | 400 | 4,007 | ||||||
Nidec Corp.(a) | 1,600 | 115,929 | ||||||
Nikon Corp.(a) | 2,600 | 34,794 | ||||||
Nintendo Co., Ltd.(a) | 700 | 96,177 | ||||||
Nippon Building Fund, Inc.(a) | 10 | 47,746 | ||||||
See accompanying notes to financial statements.
39
Table of Contents
State Street Global Equity ex-U.S. Index Portfolio
Schedule of Investments — (continued)
December 31, 2015
Security Description | Shares | Value | ||||||
COMMON STOCKS – (continued) | ||||||||
Japan – (continued) | ||||||||
Nippon Electric Glass Co., Ltd.(a) | 3,000 | $ | 15,108 | |||||
Nippon Express Co., Ltd.(a) | 6,000 | 28,172 | ||||||
Nippon Paint Holdings Co., Ltd.(a) | 1,000 | 24,182 | ||||||
Nippon Prologis REIT, Inc.(a) | 7 | 12,652 | ||||||
Nippon Steel & Sumitomo Metal Corp.(a) | 4,900 | 96,853 | ||||||
Nippon Telegraph & Telephone Corp.(a) | 5,200 | 206,778 | ||||||
Nippon Yusen KK(a) | 12,000 | 29,060 | ||||||
Nissan Motor Co., Ltd.(a) | 17,300 | 180,993 | ||||||
Nisshin Seifun Group, Inc.(a) | 1,700 | 27,746 | ||||||
Nissin Foods Holdings Co., Ltd.(a) | 500 | 26,510 | ||||||
Nitori Holdings Co., Ltd.(a) | 500 | 41,956 | ||||||
Nitto Denko Corp.(a) | 1,100 | 80,239 | ||||||
NOK Corp.(a) | 500 | 11,671 | ||||||
Nomura Holdings, Inc.(a) | 25,300 | 140,805 | ||||||
Nomura Real Estate Holdings, Inc.(a) | 1,000 | 18,537 | ||||||
Nomura Real Estate Master Fund, Inc.(b) | 27 | 33,533 | ||||||
Nomura Research Institute, Ltd.(a) | 900 | 34,535 | ||||||
NSK, Ltd.(a) | 2,700 | 29,314 | ||||||
NTT Data Corp.(a) | 900 | 43,475 | ||||||
NTT DOCOMO, Inc.(a) | 9,900 | 202,896 | ||||||
NTT Urban Development Corp.(a) | 300 | 2,880 | ||||||
Obayashi Corp.(a) | 5,000 | 46,098 | ||||||
Obic Co., Ltd.(a) | 400 | 21,156 | ||||||
Odakyu Electric Railway Co., Ltd.(a) | 5,000 | 53,789 | ||||||
Oji Holdings Corp.(a) | 4,000 | 16,063 | ||||||
Olympus Corp.(a) | 1,700 | 66,871 | ||||||
Omron Corp.(a) | 1,400 | 46,647 | ||||||
Ono Pharmaceutical Co., Ltd.(a) | 600 | 106,898 | ||||||
Oracle Corp. Japan(a) | 300 | 13,956 | ||||||
Oriental Land Co., Ltd.(a) | 1,400 | 84,625 | ||||||
ORIX Corp.(a) | 8,600 | 120,545 | ||||||
Osaka Gas Co., Ltd.(a) | 14,000 | 50,525 | ||||||
Otsuka Corp.(a) | 400 | 19,633 | ||||||
Otsuka Holdings Co., Ltd.(a) | 2,500 | 88,748 | ||||||
Panasonic Corp.(a) | 15,400 | 155,988 | ||||||
Park24 Co., Ltd.(a) | 800 | 19,366 | ||||||
Rakuten, Inc.(a)(b) | 6,600 | 75,954 | ||||||
Recruit Holdings Co., Ltd.(a) | 1,000 | 29,369 | ||||||
Resona Holdings, Inc.(a) | 14,500 | 70,357 | ||||||
Ricoh Co., Ltd.(a) | 4,900 | 50,412 | ||||||
Rinnai Corp.(a) | 300 | 26,559 | ||||||
Rohm Co., Ltd.(a) | 700 | 35,426 | ||||||
Ryohin Keikaku Co., Ltd.(a) | 200 | 40,469 | ||||||
Sankyo Co., Ltd.(a) | 400 | 14,919 | ||||||
Sanrio Co., Ltd.(a) | 100 | 2,347 | ||||||
Santen Pharmaceutical Co., Ltd.(a) | 2,800 | 46,059 | ||||||
SBI Holdings, Inc.(a) | 1,500 | 16,173 | ||||||
Secom Co., Ltd.(a) | 1,400 | 94,799 | ||||||
Sega Sammy Holdings, Inc.(a) | 900 | 8,411 | ||||||
Seibu Holdings, Inc.(a) | 1,000 | 20,405 | ||||||
Seiko Epson Corp.(a) | 2,200 | 33,850 | ||||||
Sekisui Chemical Co., Ltd.(a) | 3,100 | 40,441 | ||||||
Sekisui House, Ltd.(a) | 4,300 | 72,239 | ||||||
Seven & i Holdings Co., Ltd.(a) | 5,200 | 237,882 | ||||||
Seven Bank, Ltd.(a) | 2,900 | 12,707 | ||||||
Shikoku Electric Power Co., Inc.(a) | 900 | 14,047 | ||||||
Shimadzu Corp.(a) | 2,000 | 33,452 | ||||||
Shimamura Co., Ltd.(a) | 100 | 11,701 | ||||||
Shimano, Inc.(a) | 500 | 76,715 | ||||||
Shimizu Corp.(a) | 4,000 | 32,590 | ||||||
Shin-Etsu Chemical Co., Ltd.(a) | 2,900 | 157,530 | ||||||
Shinsei Bank, Ltd.(a) | 14,000 | 25,743 | ||||||
Shionogi & Co., Ltd.(a) | 2,000 | 90,385 | ||||||
Shiseido Co., Ltd.(a) | 2,400 | 49,755 | ||||||
Shizuoka Bank, Ltd.(a) | 3,000 | 29,070 | ||||||
Showa Shell Sekiyu KK(a) | 1,700 | 13,861 | ||||||
SMC Corp.(a) | 400 | 103,807 | ||||||
SoftBank Group Corp.(a) | 6,600 | 332,828 | ||||||
Sohgo Security Services Co., | 400 | 18,744 | ||||||
Sompo Japan Nipponkoa Holdings, Inc.(a) | 2,200 | 72,176 | ||||||
Sony Corp.(a) | 8,700 | 213,640 | ||||||
Sony Financial Holdings, Inc.(a) | 800 | 14,298 | ||||||
Stanley Electric Co., Ltd.(a) | 700 | 15,344 | ||||||
Sumitomo Chemical Co., Ltd.(a) | 10,000 | 57,383 | ||||||
Sumitomo Corp.(a) | 7,300 | 74,364 | ||||||
Sumitomo Dainippon Pharma Co., Ltd.(a) | 1,400 | 16,480 | ||||||
Sumitomo Electric Industries, Ltd.(a) | 5,000 | 70,545 | ||||||
Sumitomo Heavy Industries, Ltd.(a) | 3,000 | 13,437 | ||||||
Sumitomo Metal Mining Co., Ltd.(a) | 3,000 | 36,386 | ||||||
Sumitomo Mitsui Financial Group, Inc.(a) | 8,800 | 331,845 | ||||||
Sumitomo Mitsui Trust Holdings, Inc.(a) | 22,000 | 83,252 | ||||||
Sumitomo Realty & Development Co., Ltd.(a) | 3,000 | 85,557 | ||||||
Sumitomo Rubber Industries, Ltd.(a) | 800 | 10,394 | ||||||
Suntory Beverage & Food, Ltd.(a) | 1,000 | 43,740 | ||||||
Suruga Bank, Ltd.(a) | 900 | 18,532 | ||||||
Suzuken Co., Ltd.(a) | 500 | 18,985 | ||||||
Suzuki Motor Corp.(a) | 2,400 | 72,860 | ||||||
Sysmex Corp.(a) | 1,000 | 64,091 | ||||||
T&D Holdings, Inc.(a) | 4,000 | 52,730 | ||||||
Taiheiyo Cement Corp.(a) | 6,000 | 17,507 | ||||||
Taisei Corp.(a) | 8,000 | 52,652 | ||||||
Taisho Pharmaceutical Holdings Co., Ltd.(a) | 300 | 21,170 | ||||||
Taiyo Nippon Sanso Corp.(a) | 1,000 | 9,036 | ||||||
Takashimaya Co., Ltd.(a) | 2,000 | 17,996 | ||||||
Takeda Pharmaceutical Co., Ltd.(a) | 5,500 | 273,999 | ||||||
TDK Corp.(a) | 800 | 51,193 | ||||||
Teijin, Ltd.(a) | 5,000 | 17,025 | ||||||
Terumo Corp.(a) | 2,100 | 65,032 | ||||||
THK Co., Ltd.(a) | 500 | 9,259 | ||||||
Tobu Railway Co., Ltd.(a) | 8,000 | 39,427 | ||||||
Toho Co., Ltd.(a) | 900 | 24,884 | ||||||
Toho Gas Co., Ltd.(a) | 3,000 | 19,359 | ||||||
Tohoku Electric Power Co., Inc.(a) | 3,400 | 42,469 | ||||||
Tokio Marine Holdings, Inc.(a) | 4,700 | 181,385 | ||||||
Tokyo Electric Power Co., | 9,600 | 55,233 | ||||||
Tokyo Electron, Ltd.(a) | 1,100 | 66,588 | ||||||
See accompanying notes to financial statements.
40
Table of Contents
State Street Global Equity ex-U.S. Index Portfolio
Schedule of Investments — (continued)
December 31, 2015
Security Description | Shares | Value | ||||||
COMMON STOCKS – (continued) | ||||||||
Japan – (continued) | ||||||||
Tokyo Gas Co., Ltd.(a) | 15,000 | $ | 70,423 | |||||
Tokyo Tatemono Co., Ltd.(a) | 1,000 | 10,875 | ||||||
Tokyu Corp.(a) | 8,000 | 63,167 | ||||||
Tokyu Fudosan Holdings Corp.(a) | 4,000 | 25,051 | ||||||
TonenGeneral Sekiyu KK(a) | 2,000 | 16,870 | ||||||
Toppan Printing Co., Ltd.(a) | 3,000 | 27,617 | ||||||
Toray Industries, Inc.(a) | 10,000 | 92,848 | ||||||
Toshiba Corp.(a)(b) | 26,000 | 53,391 | ||||||
TOTO, Ltd.(a) | 1,000 | 35,103 | ||||||
Toyo Seikan Group Holdings, Ltd.(a) | 1,300 | 24,094 | ||||||
Toyo Suisan Kaisha, Ltd.(a) | 700 | 24,376 | ||||||
Toyoda Gosei Co., Ltd.(a) | 600 | 13,619 | ||||||
Toyota Industries Corp.(a) | 1,100 | 58,772 | ||||||
Toyota Motor Corp.(a) | 18,900 | 1,162,875 | ||||||
Toyota Tsusho Corp.(a) | 1,600 | 37,397 | ||||||
Trend Micro, Inc.(a)(b) | 800 | 32,435 | ||||||
Unicharm Corp.(a) | 2,600 | 53,052 | ||||||
United Urban Investment Corp.(a) | 21 | 28,485 | ||||||
USS Co., Ltd.(a) | 1,100 | 16,515 | ||||||
West Japan Railway Co.(a) | 1,100 | 75,972 | ||||||
Yahoo Japan Corp.(a) | 10,600 | 43,052 | ||||||
Yakult Honsha Co., Ltd.(a) | 700 | 34,233 | ||||||
Yamada Denki Co., Ltd.(a) | 4,200 | 18,127 | ||||||
Yamaguchi Financial Group, Inc.(a) | 1,000 | 11,837 | ||||||
Yamaha Corp.(a) | 1,300 | 31,375 | ||||||
Yamaha Motor Co., Ltd.(a) | 1,900 | 42,554 | ||||||
Yamato Holdings Co., Ltd.(a) | 2,500 | 52,926 | ||||||
Yamazaki Baking Co., Ltd.(a) | 1,000 | 22,467 | ||||||
Yaskawa Electric Corp.(a) | 1,100 | 14,955 | ||||||
Yokogawa Electric Corp.(a) | 1,000 | 12,016 | ||||||
Yokohama Rubber Co., Ltd.(a) | 500 | 7,673 | ||||||
|
| |||||||
| 19,555,533 | ||||||||
|
| |||||||
Luxembourg – 0.2% | ||||||||
ArcelorMittal(a) | 7,530 | 31,757 | ||||||
Millicom International Cellular SA(a) | 320 | 18,385 | ||||||
RTL Group SA(a) | 304 | 25,305 | ||||||
SES SA(a) | 2,350 | 65,091 | ||||||
Tenaris SA(a) | 3,658 | 43,298 | ||||||
|
| |||||||
| 183,836 | ||||||||
|
| |||||||
Macau – 0.0%(e) | ||||||||
MGM China Holdings, Ltd.(a) | 4,400 | 5,469 | ||||||
Wynn Macau, Ltd.(a) | 7,600 | 8,829 | ||||||
|
| |||||||
| 14,298 | ||||||||
|
| |||||||
Malaysia – 0.6% | ||||||||
Alliance Financial Group Bhd(a) | 5,200 | 4,305 | ||||||
AMMB Holdings Bhd(a) | 9,500 | 9,997 | ||||||
Astro Malaysia Holdings Bhd(a) | 7,500 | 4,807 | ||||||
Axiata Group Bhd(a) | 25,807 | 38,458 | ||||||
British American Tobacco Malaysia Bhd(a) | 600 | 7,826 | ||||||
CIMB Group Holdings Bhd(a) | 39,921 | 42,092 | ||||||
Dialog Group Bhd(a) | 16,800 | 6,244 | ||||||
DiGi.Com Bhd(a) | 28,600 | 35,909 | ||||||
Gamuda Bhd(a) | 8,500 | 9,207 | ||||||
Genting Bhd(a) | 22,300 | 38,033 | ||||||
Genting Malaysia Bhd(a) | 14,600 | 14,874 | ||||||
Hong Leong Bank Bhd(a) | 3,132 | 9,759 | ||||||
IHH Healthcare Bhd | 12,100 | 18,544 | ||||||
IJM Corp. Bhd(a) | 11,600 | 9,120 | ||||||
IOI Corp. Bhd(a) | 13,700 | 14,189 | ||||||
Kuala Lumpur Kepong Bhd(a) | 2,300 | 12,233 | ||||||
Lafarge Malaysia Bhd | 2,100 | 4,343 | ||||||
Malayan Banking Bhd(a) | 32,309 | 63,093 | ||||||
Malaysia Airports Holdings Bhd(a) | 4,024 | 5,241 | ||||||
Maxis Bhd(a) | 9,000 | 14,221 | ||||||
MISC Bhd(a) | 5,400 | 11,740 | ||||||
Petronas Chemicals Group Bhd(a) | 22,600 | 38,175 | ||||||
Petronas Dagangan Bhd | 1,200 | 6,948 | ||||||
Petronas Gas Bhd(a) | 3,100 | 16,398 | ||||||
PPB Group Bhd(a) | 2,300 | 8,491 | ||||||
Public Bank Bhd(a) | 17,300 | 74,542 | ||||||
RHB Capital Bhd(a) | 4,800 | 6,326 | ||||||
SapuraKencana Petroleum Bhd(a) | 15,300 | 7,178 | ||||||
Sime Darby Bhd(a) | 20,758 | 37,299 | ||||||
Telekom Malaysia Bhd(a) | 5,503 | 8,672 | ||||||
Tenaga Nasional Bhd(a) | 22,600 | 69,974 | ||||||
UMW Holdings Bhd(a) | 2,800 | 5,122 | ||||||
Westports Holdings Bhd(a) | 5,100 | 4,880 | ||||||
YTL Corp. Bhd(a) | 20,800 | 7,589 | ||||||
|
| |||||||
| 665,829 | ||||||||
|
| |||||||
Mexico – 0.9% | ||||||||
Alfa SAB de CV Class A | 21,900 | 43,277 | ||||||
America Movil SAB de CV Series L | 221,900 | 155,461 | ||||||
Arca Continental SAB de CV | 4,100 | 24,852 | ||||||
Cemex SAB de CV(b) | 90,196 | 49,090 | ||||||
Coca-Cola Femsa SAB de CV Series L | 2,800 | 19,989 | ||||||
Controladora Comercial Mexicana SAB de CV | 2,300 | 6,315 | ||||||
El Puerto de Liverpool SAB de CV Series C1 | 900 | 10,982 | ||||||
Fibra Uno Administracion SA de CV | 16,200 | 35,634 | ||||||
Fomento Economico Mexicano SAB de CV | 12,300 | 114,503 | ||||||
Fresnillo PLC(a) | 1,069 | 11,112 | ||||||
Gentera SAB de CV | 5,200 | 9,981 | ||||||
Gruma SAB de CV Class B | 800 | 11,232 | ||||||
Grupo Aeroportuario del Pacifico SAB de CV Class B | 1,500 | 13,222 | ||||||
Grupo Aeroportuario del Sureste SAB de CV Class B | 1,400 | 19,792 | ||||||
Grupo Bimbo SAB de CV Series A(b) | 9,800 | 25,971 | ||||||
Grupo Carso SAB de CV Series A1 | 5,000 | 20,844 | ||||||
Grupo Comercial Chedraui SA de CV | 3,100 | 8,190 | ||||||
Grupo Financiero Banorte SAB de CV Series O | 16,100 | 88,372 | ||||||
Grupo Financiero Inbursa SAB de CV Series O | 13,100 | 23,672 | ||||||
Grupo Financiero Santander Mexico SAB de CV Class B | 12,300 | 21,493 | ||||||
Grupo Lala SAB de CV | 3,000 | 6,927 | ||||||
See accompanying notes to financial statements.
41
Table of Contents
State Street Global Equity ex-U.S. Index Portfolio
Schedule of Investments — (continued)
December 31, 2015
Security Description | Shares | Value | ||||||
COMMON STOCKS – (continued) | ||||||||
Mexico – (continued) | ||||||||
Grupo Mexico SAB de CV Series B | 25,600 | $ | 54,532 | |||||
Grupo Televisa SAB Series CPO | 16,400 | 89,610 | ||||||
Industrias Penoles SAB de CV | 910 | 9,341 | ||||||
Kimberly-Clark de Mexico SAB de CV Class A | 12,500 | 29,102 | ||||||
Mexichem SAB de CV | 7,300 | 16,353 | ||||||
OHL Mexico SAB de CV(b) | 3,800 | 3,991 | ||||||
Promotora y Operadora de Infraestructura SAB de CV(b) | 2,200 | 25,848 | ||||||
Wal-Mart de Mexico SAB de CV | 34,100 | 85,886 | ||||||
|
| |||||||
| 1,035,574 | ||||||||
|
| |||||||
Netherlands – 2.5% | ||||||||
Aegon NV(a) | 12,994 | 73,457 | ||||||
AerCap Holdings NV(b) | 595 | 25,680 | ||||||
Akzo Nobel NV(a) | 1,747 | 116,684 | ||||||
Altice NV Class B(a)(b) | 950 | 13,841 | ||||||
Altice NV Class A(a)(b) | 2,596 | 37,282 | ||||||
ASML Holding NV(a) | 2,404 | 213,510 | ||||||
Boskalis Westminster(a) | 680 | 27,727 | ||||||
Gemalto NV(a) | 602 | 36,106 | ||||||
Heineken Holding NV(a) | 695 | 53,484 | ||||||
Heineken NV(a) | 1,612 | 137,313 | ||||||
ING Groep NV | 26,657 | 360,521 | ||||||
Koninklijke Ahold NV(a) | 5,864 | 123,641 | ||||||
Koninklijke DSM NV(a) | 1,306 | 65,463 | ||||||
Koninklijke KPN NV(a) | 22,798 | 86,194 | ||||||
Koninklijke Philips NV(a) | 6,634 | 169,258 | ||||||
Koninklijke Vopak NV(a) | 565 | 24,321 | ||||||
NN Group NV(a) | 1,654 | 58,334 | ||||||
NXP Semiconductors NV(b) | 801 | 67,484 | ||||||
OCI NV(a)(b) | 707 | 17,450 | ||||||
Randstad Holding NV(a) | 894 | 55,648 | ||||||
Royal Dutch Shell PLC Class B(a) | 16,348 | 372,510 | ||||||
Royal Dutch Shell PLC Class A(a) | 26,973 | 610,791 | ||||||
Steinhoff International Holdings NV | 18,718 | 94,837 | ||||||
TNT Express NV(a) | 3,792 | 32,063 | ||||||
Wolters Kluwer NV(a) | 2,162 | 72,577 | ||||||
|
| |||||||
| 2,946,176 | ||||||||
|
| |||||||
New Zealand – 0.1% | ||||||||
Auckland International Airport, Ltd.(a) | 4,604 | 18,079 | ||||||
Contact Energy, Ltd.(a) | 5,920 | 19,179 | ||||||
Fletcher Building, Ltd.(a) | 3,325 | 16,679 | ||||||
Meridian Energy, Ltd.(a) | 6,069 | 9,907 | ||||||
Mighty River Power, Ltd.(a) | 3,384 | 6,427 | ||||||
Ryman Healthcare, Ltd.(a) | 2,941 | 17,084 | ||||||
Spark New Zealand, Ltd.(a) | 8,869 | 19,989 | ||||||
|
| |||||||
| 107,344 | ||||||||
|
| |||||||
Norway – 0.4% | ||||||||
DNB ASA(a) | 6,361 | 78,378 | ||||||
Gjensidige Forsikring ASA(a) | 967 | 15,477 | ||||||
Norsk Hydro ASA(a) | 11,730 | 43,603 | ||||||
Orkla ASA(a) | 5,936 | 46,830 | ||||||
Schibsted ASA Class A(a) | 506 | 16,636 | ||||||
Schibsted ASA Class B(b) | 597 | 19,027 | ||||||
Statoil ASA(a) | 7,476 | 104,270 | ||||||
Telenor ASA(a) | 4,819 | 80,329 | ||||||
Yara International ASA(a) | 1,233 | 53,031 | ||||||
|
| |||||||
| 457,581 | ||||||||
|
| |||||||
Peru – 0.1% | ||||||||
Cia de Minas Buenaventura SAA ADR | 900 | 3,852 | ||||||
Credicorp, Ltd. | 400 | 38,928 | ||||||
Southern Copper Corp. | 1,500 | 39,180 | ||||||
|
| |||||||
| 81,960 | ||||||||
|
| |||||||
Philippines – 0.2% | ||||||||
Aboitiz Equity Ventures, Inc.(a) | 9,370 | 11,495 | ||||||
Aboitiz Power Corp. | 7,100 | 6,292 | ||||||
Alliance Global Group, Inc.(a) | 21,700 | 7,397 | ||||||
Ayala Corp.(a) | 1,050 | 16,828 | ||||||
Ayala Land, Inc.(a) | 48,300 | 35,306 | ||||||
Bank of the Philippine Islands(a) | 3,800 | 6,768 | ||||||
BDO Unibank, Inc.(a) | 7,460 | 16,583 | ||||||
DMCI Holdings, Inc.(a) | 19,230 | 5,623 | ||||||
Energy Development Corp.(a) | 45,300 | 5,950 | ||||||
Globe Telecom, Inc.(a) | 160 | 6,285 | ||||||
GT Capital Holdings, Inc.(a) | 390 | 10,926 | ||||||
International Container Terminal Services, Inc.(a) | 2,460 | 3,664 | ||||||
JG Summit Holdings, Inc.(a) | 24,600 | 38,282 | ||||||
Jollibee Foods Corp.(a) | 2,060 | 9,563 | ||||||
Megaworld Corp.(a) | 54,000 | 4,865 | ||||||
Metro Pacific Investments Corp. (a) | 57,000 | 6,288 | ||||||
Philippine Long Distance Telephone Co.(a) | 570 | 24,919 | ||||||
SM Investments Corp.(a) | 650 | 11,874 | ||||||
SM Prime Holdings, Inc.(a) | 56,400 | 25,936 | ||||||
Universal Robina Corp.(a) | 4,090 | 16,139 | ||||||
|
| |||||||
| 270,983 | ||||||||
|
| |||||||
Poland – 0.2% | ||||||||
Alior Bank SA(b) | 410 | 6,904 | ||||||
Bank Millennium SA(a)(b) | 3,024 | 4,255 | ||||||
Bank Pekao SA(a) | 778 | 28,226 | ||||||
Bank Zachodni WBK SA(a)(b) | 230 | 16,463 | ||||||
CCC SA(a) | 209 | 7,308 | ||||||
Cyfrowy Polsat SA(a)(b) | 927 | 4,895 | ||||||
Enea SA(a) | 1,101 | 3,138 | ||||||
Energa SA(a) | 1,052 | 3,364 | ||||||
Grupa Azoty SA(b) | 463 | 11,666 | ||||||
KGHM Polska Miedz SA(a) | 698 | 11,184 | ||||||
LPP SA(a) | 4 | 5,615 | ||||||
mBank SA(a)(b) | 71 | 5,632 | ||||||
Orange Polska SA | 3,172 | 5,269 | ||||||
PGE Polska Grupa Energetyczna SA(a) | 4,169 | 13,426 | ||||||
Polski Koncern Naftowy Orlen SA(a) | 2,862 | 48,939 | ||||||
Polskie Gornictwo Naftowe i Gazownictwo SA(a) | 8,556 | 11,093 | ||||||
Powszechna Kasa Oszczednosci Bank Polski SA(a)(b) | 6,798 | 46,902 | ||||||
Powszechny Zaklad Ubezpieczen SA(a) | 5,155 | 44,176 | ||||||
Tauron Polska Energia SA(a) | 17,518 | 12,749 | ||||||
|
| |||||||
| 291,204 | ||||||||
|
| |||||||
See accompanying notes to financial statements.
42
Table of Contents
State Street Global Equity ex-U.S. Index Portfolio
Schedule of Investments — (continued)
December 31, 2015
Security Description | Shares | Value | ||||||
COMMON STOCKS – (continued) |
| |||||||
Portugal – 0.1% | ||||||||
Banco Comercial Portugues | 170,282 | $ | 9,020 | |||||
EDP–Energias de Portugal SA(a) | 15,742 | 56,700 | ||||||
Galp Energia SGPS SA(a) | 3,557 | 41,488 | ||||||
Jeronimo Martins SGPS SA(a) | 1,217 | 15,830 | ||||||
|
| |||||||
| 123,038 | ||||||||
|
| |||||||
Qatar – 0.2% | ||||||||
Barwa Real Estate Co.(a) | 470 | 5,142 | ||||||
Commercial Bank QSC(a) | 1,526 | 19,171 | ||||||
Doha Bank QSC(a) | 1,139 | 13,881 | ||||||
Ezdan Holding Group QSC(a) | 4,907 | 21,343 | ||||||
Industries Qatar QSC(a) | 1,440 | 43,793 | ||||||
Masraf Al Rayan QSC(a) | 1,940 | 19,978 | ||||||
Ooredoo QSC | 387 | 7,969 | ||||||
Qatar Electricity & Water Co. QSC(a) | 133 | 7,905 | ||||||
Qatar Gas Transport Co., Ltd.(a) | 1,819 | 11,647 | ||||||
Qatar Insurance Co. SAQ | 730 | 16,435 | ||||||
Qatar Islamic Bank SAQ(a) | 286 | 8,355 | ||||||
Qatar National Bank SAQ(a) | 1,183 | 56,737 | ||||||
Vodafone Qatar QSC(a) | 1,635 | 5,680 | ||||||
|
| |||||||
| 238,036 | ||||||||
|
| |||||||
Romania – 0.0%(e) | ||||||||
New Europe Property Investments PLC | 1,500 | 17,212 | ||||||
|
| |||||||
Russia – 0.7% | ||||||||
AK Transneft OAO Preference Shares(b) | 8 | 21,294 | ||||||
Alrosa PAO(b) | 14,500 | 11,128 | ||||||
Gazprom PAO | 83,060 | 154,895 | ||||||
Lukoil PJSC ADR(a) | 1,831 | 59,272 | ||||||
Lukoil PJSC(b) | 2,010 | 64,807 | ||||||
Magnit PJSC GDR(a) | 1,697 | 68,240 | ||||||
MegaFon PJSC GDR(a) | 450 | 5,235 | ||||||
MMC Norilsk Nickel PJSC(b) | 377 | 47,237 | ||||||
Mobile TeleSystems PJSC ADR | 2,500 | 15,450 | ||||||
Moscow Exchange MICEX-RTS PJSC(b) | 13,013 | 16,314 | ||||||
Novatek OAO GDR(a) | 618 | 50,901 | ||||||
Rosneft OAO(b) | 7,810 | 27,188 | ||||||
Sberbank of Russia PJSC(b) | 69,130 | 96,101 | ||||||
Sberbank of Russia PJSC Preference Shares(b) | 28,500 | 29,782 | ||||||
Severstal PAO(b) | 1,640 | 13,729 | ||||||
Sistema JSFC GDR(a) | 1,855 | 10,921 | ||||||
Surgutneftegas OAO(b) | 51,000 | 23,753 | ||||||
Surgutneftegas OAO Preference Share(b) | 43,800 | 26,522 | ||||||
Tatneft PAO(b) | 10,160 | 43,910 | ||||||
VTB Bank PJSC(b) | 29,280,000 | 31,827 | ||||||
|
| |||||||
| 818,506 | ||||||||
|
| |||||||
Singapore – 0.8% | ||||||||
Ascendas Real Estate Investment Trust(a) | 10,000 | 16,018 | ||||||
CapitaLand Commercial Trust, Ltd.(a) | 10,000 | 9,483 | ||||||
CapitaLand Mall Trust(a) | 12,000 | 16,274 | ||||||
CapitaLand, Ltd.(a) | 19,000 | 44,636 | ||||||
City Developments, Ltd.(a) | 2,000 | 10,753 | ||||||
ComfortDelGro Corp., Ltd.(a) | 20,000 | 42,803 | ||||||
DBS Group Holdings, Ltd.(a) | 13,128 | 153,772 | ||||||
Genting Singapore PLC(a) | 29,000 | 15,639 | ||||||
Global Logistic Properties, Ltd.(a) | 29,000 | 43,771 | ||||||
Golden Agri-Resources, Ltd.(a) | 50,000 | 11,937 | ||||||
Hutchison Port Holdings Trust(a) | 27,000 | 14,267 | ||||||
Jardine Cycle & Carriage, Ltd.(a) | 1,111 | 27,146 | ||||||
Keppel Corp., Ltd.(a) | 10,000 | 45,658 | ||||||
Oversea-Chinese Banking Corp., Ltd.(a) | 19,637 | 121,340 | ||||||
Sembcorp Industries, Ltd.(a) | 5,000 | 10,712 | ||||||
Sembcorp Marine, Ltd.(a) | 2,000 | 2,460 | ||||||
Singapore Airlines, Ltd.(a) | 3,000 | 23,626 | ||||||
Singapore Exchange, Ltd.(a) | 4,000 | 21,622 | ||||||
Singapore Press Holdings, Ltd.(a) | 8,000 | 22,163 | ||||||
Singapore Technologies Engineering, Ltd.(a) | 8,000 | 16,902 | ||||||
Singapore Telecommunications, Ltd.(a) | 52,000 | 133,999 | ||||||
StarHub, Ltd.(a) | 3,000 | 7,803 | ||||||
Suntec Real Estate Investment Trust(a) | 12,000 | 13,062 | ||||||
United Overseas Bank, Ltd.(a) | 9,000 | 124,016 | ||||||
UOL Group, Ltd.(a) | 2,040 | 8,936 | ||||||
Wilmar International, Ltd.(a) | 19,000 | 39,182 | ||||||
|
| |||||||
| 997,980 | ||||||||
|
| |||||||
South Africa – 1.3% | ||||||||
Anglo American Platinum, | 261 | 3,137 | ||||||
AngloGold Ashanti, Ltd.(a) (b) | 1,769 | 12,108 | ||||||
Aspen Pharmacare Holdings, | 1,992 | 39,691 | ||||||
Barclays Africa Group, Ltd.(a) | 1,540 | 14,261 | ||||||
Barloworld, Ltd.(a) | 1,061 | 4,259 | ||||||
Bidvest Group, Ltd.(a) | 2,169 | 45,947 | ||||||
Brait SE(a)(b) | 1,637 | 17,626 | ||||||
Capitec Bank Holdings, Ltd.(a) | 173 | 6,004 | ||||||
Coronation Fund Managers, Ltd.(a) | 1,099 | 3,757 | ||||||
Discovery, Ltd.(a) | 1,722 | 14,740 | ||||||
Exxaro Resources, Ltd.(a) | 692 | 1,962 | ||||||
FirstRand, Ltd.(a) | 21,870 | 59,652 | ||||||
Fortress Income Fund, Ltd.(a) | 4,609 | 10,321 | ||||||
Foschini Group, Ltd.(a) | 838 | 6,572 | ||||||
Gold Fields, Ltd.(a) | 6,904 | 18,843 | ||||||
Growthpoint Properties, Ltd.(a) | 13,109 | 19,637 | ||||||
Hyprop Investments, Ltd.(a) | 1,213 | 8,103 | ||||||
Impala Platinum Holdings, | 2,581 | 4,167 | ||||||
Imperial Holdings, Ltd.(a) | 763 | 5,903 | ||||||
Investec PLC(a) | 4,252 | 29,975 | ||||||
Investec, Ltd.(a) | 1,235 | 8,707 | ||||||
Liberty Holdings, Ltd.(a) | 553 | 4,108 | ||||||
Life Healthcare Group Holdings, Ltd.(a) | 7,198 | 16,307 | ||||||
Massmart Holdings, Ltd.(a) | 525 | 3,392 | ||||||
Mediclinic International, Ltd.(a) | 3,874 | 29,740 | ||||||
MMI Holdings, Ltd.(a) | 4,341 | 6,144 | ||||||
Mondi PLC(a) | 2,595 | 50,854 | ||||||
Mondi, Ltd.(a) | 590 | 11,653 | ||||||
See accompanying notes to financial statements.
43
Table of Contents
State Street Global Equity ex-U.S. Index Portfolio
Schedule of Investments — (continued)
December 31, 2015
Security Description | Shares | Value | ||||||
COMMON STOCKS – (continued) | ||||||||
South Africa – (continued) | ||||||||
Mr Price Group, Ltd. | 1,504 | $ | 19,412 | |||||
MTN Group, Ltd.(a) | 10,479 | 90,092 | ||||||
Naspers, Ltd. Class N(a) | 2,815 | 384,009 | ||||||
Nedbank Group, Ltd.(a) | 1,555 | 18,958 | ||||||
Netcare, Ltd.(a) | 4,888 | 10,685 | ||||||
Pick n Pay Stores, Ltd.(a) | 2,239 | 9,386 | ||||||
Pioneer Foods Group, Ltd.(a) | 1,132 | 11,589 | ||||||
PSG Group, Ltd.(a) | 440 | 6,349 | ||||||
Rand Merchant Insurance Holdings, Ltd.(a) | 3,232 | 8,063 | ||||||
Redefine Properties, Ltd.(a) | 35,794 | 22,424 | ||||||
Remgro, Ltd.(a) | 3,209 | 50,697 | ||||||
Resilient REIT, Ltd.(a) | 1,241 | 9,215 | ||||||
RMB Holdings, Ltd.(a) | 5,831 | 20,865 | ||||||
Sanlam, Ltd.(a) | 11,610 | 45,325 | ||||||
Sappi, Ltd.(a)(b) | 2,617 | 10,974 | ||||||
Sasol, Ltd.(a) | 3,708 | 99,911 | ||||||
Shoprite Holdings, Ltd.(a) | 4,348 | 40,214 | ||||||
SPAR Group, Ltd.(a) | 721 | 8,562 | ||||||
Standard Bank Group, Ltd.(a) | 7,875 | 57,612 | ||||||
Telkom SA SOC, Ltd.(a) | 1,133 | 4,698 | ||||||
Tiger Brands, Ltd.(a) | 1,010 | 20,647 | ||||||
Truworths International, Ltd.(a) | 1,639 | 9,643 | ||||||
Vodacom Group, Ltd.(a) | 2,734 | 26,892 | ||||||
Woolworths Holdings, Ltd.(a) | 6,703 | 43,278 | ||||||
|
| |||||||
| 1,487,070 | ||||||||
|
| |||||||
South Korea – 2.9% | ||||||||
Amorepacific Corp.(a) | 230 | 80,713 | ||||||
Amorepacific Corp. Preference Shares(a) | 40 | 7,795 | ||||||
Amorepacific Group(a) | 216 | 26,985 | ||||||
BGF retail Co., Ltd.(a) | 80 | 11,582 | ||||||
BNK Financial Group, Inc.(a) | 1,770 | 12,609 | ||||||
Celltrion, Inc.(a)(b) | 405 | 28,894 | ||||||
Cheil Worldwide, Inc.(a)(b) | 390 | 6,821 | ||||||
CJ CheilJedang Corp.(a) | 34 | 10,875 | ||||||
CJ Corp.(a) | 70 | 14,869 | ||||||
CJ Korea Express Co., Ltd.(a)(b) | 75 | 12,150 | ||||||
Coway Co., Ltd.(a) | 410 | 29,193 | ||||||
Daelim Industrial Co., Ltd.(a) | 135 | 7,623 | ||||||
Daewoo International Corp.(a) | 400 | 5,508 | ||||||
Daewoo Securities Co., Ltd.(a) | 870 | 6,887 | ||||||
DGB Financial Group, Inc.(a) | 2,079 | 17,711 | ||||||
Dongbu Insurance Co., Ltd.(a) | 210 | 12,565 | ||||||
Doosan Heavy Industries & Construction Co., Ltd.(a) | 282 | 4,907 | ||||||
E-MART, Inc.(a) | 130 | 20,860 | ||||||
GS Engineering & Construction Corp.(a)(b) | 240 | 3,976 | ||||||
GS Holdings Corp.(a) | 247 | 10,584 | ||||||
GS Retail Co., Ltd.(a) | 260 | 11,845 | ||||||
Hana Financial Group, Inc.(a) | 1,700 | 33,971 | ||||||
Hankook Tire Co., Ltd.(a) | 360 | 14,359 | ||||||
Hanmi Pharm Co., Ltd.(a)(b) | 26 | 15,926 | ||||||
Hanmi Science Co., Ltd.(a)(b) | 132 | 14,311 | ||||||
Hanon Systems(a) | 180 | 7,905 | ||||||
Hanssem Co., Ltd.(a) | 50 | 9,797 | ||||||
Hanwha Chemical Corp.(a) | 510 | 11,620 | ||||||
Hanwha Corp.(a) | 460 | 15,252 | ||||||
Hanwha Life Insurance Co., Ltd. | 1,050 | 6,618 | ||||||
Hotel Shilla Co., Ltd.(a) | 140 | 9,167 | ||||||
Hyosung Corp.(a) | 110 | 10,879 | ||||||
Hyundai Department Store Co., Ltd.(a) | 74 | 7,931 | ||||||
Hyundai Development Co-Engineering & Construction(a) | 270 | 8,823 | ||||||
Hyundai Engineering & Construction Co., Ltd.(a) | 487 | 11,691 | ||||||
Hyundai Glovis Co., Ltd.(a) | 100 | 16,293 | ||||||
Hyundai Heavy Industries Co., Ltd.(a)(b) | 280 | 20,696 | ||||||
Hyundai Marine & Fire Insurance Co., Ltd.(a) | 300 | 9,192 | ||||||
Hyundai Mobis Co., Ltd.(a) | 438 | 91,643 | ||||||
Hyundai Motor Co. Preference Shares(a) | 290 | 25,812 | ||||||
Hyundai Motor Co. Preference Shares(a) | 115 | 10,055 | ||||||
Hyundai Motor Co.(a) | 998 | 125,871 | ||||||
Hyundai Steel Co.(a) | 388 | 16,350 | ||||||
Hyundai Wia Corp.(a) | 79 | 7,469 | ||||||
Industrial Bank of Korea(a) | 1,780 | 18,613 | ||||||
Kakao Corp.(a) | 257 | 25,179 | ||||||
Kangwon Land, Inc.(a) | 590 | 19,257 | ||||||
KB Financial Group, Inc.(a) | 2,520 | 70,998 | ||||||
KCC Corp.(a) | 24 | 8,466 | ||||||
KEPCO Plant Service & Engineering Co., Ltd.(a) | 100 | 7,564 | ||||||
Kia Motors Corp.(a) | 1,713 | 76,383 | ||||||
Korea Aerospace Industries, Ltd.(a) | 210 | 13,863 | ||||||
Korea Electric Power Corp.(a) | 1,680 | 71,177 | ||||||
Korea Gas Corp.(a) | 240 | 7,489 | ||||||
Korea Investment Holdings Co., Ltd.(a) | 190 | 7,940 | ||||||
Korea Zinc Co., Ltd.(a) | 41 | 16,330 | ||||||
Korean Air Lines Co., Ltd.(a)(b) | 169 | 3,967 | ||||||
KT&G Corp.(a) | 723 | 64,249 | ||||||
Kumho Petrochemical Co., Ltd.(a) | 68 | 2,981 | ||||||
LG Chem, Ltd.(a) | 301 | 83,101 | ||||||
LG Chem, Ltd. Preference Shares(a) | 65 | 13,580 | ||||||
LG Corp.(a) | 539 | 32,401 | ||||||
LG Display Co., Ltd.(a) | 1,770 | 36,661 | ||||||
LG Electronics, Inc.(a) | 814 | 37,008 | ||||||
LG Household & Health Care, Ltd.(a) | 68 | 60,383 | ||||||
LG Innotek Co., Ltd.(a) | 63 | 5,237 | ||||||
LG Uplus Corp.(a) | 1,030 | 9,095 | ||||||
Lotte Chemical Corp.(a) | 68 | 13,875 | ||||||
Lotte Confectionery Co., Ltd.(a) | 6 | 11,633 | ||||||
Lotte Shopping Co., Ltd.(a) | 48 | 9,443 | ||||||
Mirae Asset Securities Co., Ltd.(a) | 510 | 9,279 | ||||||
NAVER Corp.(a) | 180 | 100,375 | ||||||
NCSoft Corp.(a) | 139 | 25,058 | ||||||
NH Investment & Securities Co., Ltd.(a) | 680 | 5,754 | ||||||
OCI Co., Ltd.(a) | 81 | 5,107 | ||||||
Orion Corp.(a) | 34 | 33,584 | ||||||
Paradise Co., Ltd.(a)(b) | 409 | 6,086 | ||||||
POSCO(a) | 500 | 70,041 | ||||||
S-1 Corp. | 92 | 7,823 | ||||||
See accompanying notes to financial statements.
44
Table of Contents
State Street Global Equity ex-U.S. Index Portfolio
Schedule of Investments — (continued)
December 31, 2015
Security Description | Shares | Value | ||||||
COMMON STOCKS – (continued) | ||||||||
South Korea – (continued) | ||||||||
S-Oil Corp.(a) | 197 | $ | 13,196 | |||||
Samsung C&T Corp.(a)(b) | 551 | 65,038 | ||||||
Samsung Card Co., Ltd.(a) | 374 | 9,791 | ||||||
Samsung Electro-Mechanics Co., Ltd.(a) | 468 | 24,866 | ||||||
Samsung Electronics Co., Ltd.(a) | 768 | 819,135 | ||||||
Samsung Electronics Co., Ltd. Preference Shares(a) | 144 | 133,112 | ||||||
Samsung Fire & Marine Insurance Co., Ltd.(a) | �� | 255 | 66,659 | |||||
Samsung Heavy Industries Co., Ltd.(a) | 690 | 6,285 | ||||||
Samsung Life Insurance Co., | 550 | 51,397 | ||||||
Samsung SDI Co., Ltd.(a) | 412 | 39,608 | ||||||
Samsung SDS Co., Ltd.(a) | 190 | 40,866 | ||||||
Samsung Securities Co., Ltd.(a) | 263 | 9,230 | ||||||
Shinhan Financial Group Co., | 3,010 | 101,111 | ||||||
Shinsegae Co., Ltd.(a) | 59 | 11,479 | ||||||
SK Holdings Co., Ltd.(a) | 257 | 52,362 | ||||||
SK Hynix, Inc.(a) | 3,730 | 96,357 | ||||||
SK Innovation Co., Ltd.(a)(b) | 444 | 48,694 | ||||||
SK Telecom Co., Ltd.(a) | 47 | 8,602 | ||||||
Woori Bank(a) | 2,720 | 20,344 | ||||||
Yuhan Corp.(a) | 38 | 8,766 | ||||||
|
| |||||||
| 3,463,461 | ||||||||
|
| |||||||
Spain – 2.3% | ||||||||
Abertis Infraestructuras SA(a) | 3,900 | 60,968 | ||||||
ACS Actividades de Construccion y Servicios SA(a) | 1,371 | 40,095 | ||||||
Aena SA(a)(b)(d) | 493 | 56,430 | ||||||
Amadeus IT Holding SA Class A(a) | 3,082 | 135,782 | ||||||
Banco Bilbao Vizcaya Argentaria SA(a) | 43,935 | 320,891 | ||||||
Banco de Sabadell SA(a) | 36,365 | 64,423 | ||||||
Banco Popular Espanol SA(a) | 12,596 | 41,485 | ||||||
Banco Santander SA(a) | 96,837 | 476,180 | ||||||
Bankia SA(a) | 34,272 | 39,866 | ||||||
Bankinter SA(a) | 5,032 | 35,669 | ||||||
CaixaBank SA(a) | 18,844 | 65,561 | ||||||
Distribuidora Internacional de Alimentacion SA(a) (b) | 4,785 | 28,211 | ||||||
Enagas SA(a) | 1,531 | 43,168 | ||||||
Endesa SA(a) | 2,298 | 46,147 | ||||||
Ferrovial SA(a) | 2,646 | 59,810 | ||||||
Gas Natural SDG SA(a) | 2,517 | 51,306 | ||||||
Grifols SA(a) | 1,077 | 49,760 | ||||||
Iberdrola SA(a) | 37,273 | 264,118 | ||||||
Industria de Diseno Textil SA(a) | 7,545 | 259,094 | ||||||
Mapfre SA(a) | 8,670 | 21,693 | ||||||
Red Electrica Corp. SA(a) | 725 | 60,534 | ||||||
Repsol SA(a) | 7,458 | 82,073 | ||||||
Telefonica SA(a) | 30,189 | 334,776 | ||||||
Zardoya Otis SA(a) | 1,446 | 16,905 | ||||||
|
| |||||||
| 2,654,945 | ||||||||
|
| |||||||
Sweden – 2.1% | ||||||||
Alfa Laval AB(a) | 2,203 | 40,270 | ||||||
Assa Abloy AB Class B(a) | 7,016 | 147,053 | ||||||
Atlas Copco AB Class A(a) | 4,719 | 115,881 | ||||||
Atlas Copco AB Class B(a) | 2,608 | 60,036 | ||||||
Boliden AB(a) | 2,066 | 34,659 | ||||||
Electrolux AB Series B(a) | 1,744 | 42,132 | ||||||
Getinge AB Class B(a) | 1,510 | 39,606 | ||||||
Hennes & Mauritz AB Class B(a) | 6,575 | 234,176 | ||||||
Hexagon AB Class B(a) | 1,743 | 64,561 | ||||||
Husqvarna AB Class B(a) | 1,975 | 13,051 | ||||||
ICA Gruppen AB(a) | 625 | 22,727 | ||||||
Industrivarden AB Class C(a) | 794 | 13,601 | ||||||
Investment AB Kinnevik Class B(a) | 1,692 | 52,183 | ||||||
Investor AB Class B(a) | 3,204 | 117,899 | ||||||
Lundin Petroleum AB(a)(b) | 1,736 | 25,082 | ||||||
Nordea Bank AB(a) | 21,054 | 231,297 | ||||||
Sandvik AB(a) | 7,096 | 61,935 | ||||||
Securitas AB Class B(a) | 2,389 | 36,577 | ||||||
Skandinaviska Enskilda Banken AB Class A(a) | 10,707 | 112,745 | ||||||
Skanska AB Class B(a) | 2,731 | 53,032 | ||||||
SKF AB Class B(a) | 2,876 | 46,511 | ||||||
Svenska Cellulosa AB SCA Class B(a) | 4,145 | 120,277 | ||||||
Svenska Handelsbanken AB Class A(a) | 10,480 | 139,369 | ||||||
Swedbank AB Class A(a) | 6,338 | 139,765 | ||||||
Swedish Match AB(a) | 1,448 | 51,234 | ||||||
Tele2 AB Class B(a) | 2,536 | 25,323 | ||||||
Telefonaktiebolaget LM Ericsson Class B(a) | 21,153 | 204,205 | ||||||
TeliaSonera AB(a) | 16,800 | 83,534 | ||||||
Volvo AB Class B(a) | 10,136 | 94,107 | ||||||
|
| |||||||
| 2,422,828 | ||||||||
|
| |||||||
Switzerland – 7.0% | ||||||||
ABB, Ltd.(a)(b) | 15,199 | 271,428 | ||||||
Actelion, Ltd.(a)(b) | 662 | 92,036 | ||||||
Adecco SA(a)(b) | 1,107 | 75,811 | ||||||
Aryzta AG(a)(b) | 673 | 34,067 | ||||||
Baloise Holding AG(a) | 370 | 46,921 | ||||||
Barry Callebaut AG(a)(b) | 11 | 11,956 | ||||||
Chocoladefabriken Lindt & Spruengli AG(a)(b) | 7 | 43,739 | ||||||
Chocoladefabriken Lindt & Spruengli AG(b) | 1 | 74,545 | ||||||
Cie Financiere Richemont SA(a) | 3,608 | 258,390 | ||||||
Coca-Cola HBC AG(a)(b) | 1,515 | 32,256 | ||||||
Credit Suisse Group AG(a)(b) | 12,430 | 267,927 | ||||||
Dufry AG(a)(b) | 304 | 36,192 | ||||||
EMS-Chemie Holding AG(a) | 64 | 28,183 | ||||||
Galenica AG(a) | 26 | 40,703 | ||||||
Geberit AG(a) | 247 | 83,710 | ||||||
Givaudan SA(a)(b) | 65 | 118,043 | ||||||
Glencore PLC(a) | 85,963 | 113,889 | ||||||
Julius Baer Group, Ltd.(a)(b) | 1,475 | 71,399 | ||||||
Kuehne + Nagel International AG(a) | 387 | 53,050 | ||||||
LafargeHolcim, Ltd.(a)(b) | 2,109 | 105,671 | ||||||
LafargeHolcim, Ltd.(a)(b) | 852 | 43,081 | ||||||
Lonza Group AG(a)(b) | 366 | 59,560 | ||||||
Nestle SA(a) | 21,689 | 1,611,053 | ||||||
Novartis AG(a) | 15,491 | 1,333,323 | ||||||
Pargesa Holding SA(a) | 149 | 9,419 | ||||||
See accompanying notes to financial statements.
45
Table of Contents
State Street Global Equity ex-U.S. Index Portfolio
Schedule of Investments — (continued)
December 31, 2015
Security Description | Shares | Value | ||||||
COMMON STOCKS – (continued) | ||||||||
Switzerland – (continued) | ||||||||
Partners Group Holding AG(a) | 119 | $ | 42,822 | |||||
Roche Holding AG(a) | 4,784 | 1,326,481 | ||||||
Schindler Holding AG(a)(c) | 321 | 53,735 | ||||||
Schindler Holding AG(a)(c) | 161 | 27,167 | ||||||
SGS SA(a) | 36 | 68,459 | ||||||
Sika AG(a) | 15 | 54,239 | ||||||
Sonova Holding AG(a) | 386 | 49,072 | ||||||
STMicroelectronics NV(a) | 4,848 | 32,443 | ||||||
Sulzer AG(a) | 116 | 10,910 | ||||||
Swatch Group AG(a) | 202 | 70,190 | ||||||
Swatch Group AG(a) | 390 | 26,353 | ||||||
Swiss Life Holding AG(a)(b) | 229 | 61,718 | ||||||
Swiss Prime Site AG(a)(b) | 494 | 38,603 | ||||||
Swiss Re AG(a) | 2,441 | 238,546 | ||||||
Swisscom AG(a) | 168 | 84,118 | ||||||
Syngenta AG(a) | 644 | 252,215 | ||||||
UBS Group AG(a) | 24,493 | 475,436 | ||||||
Wolseley PLC(a) | 1,835 | 99,644 | ||||||
Zurich Insurance Group AG (a)(b) | 1,040 | 267,336 | ||||||
|
| |||||||
| 8,195,839 | ||||||||
|
| |||||||
Taiwan – 2.3% | ||||||||
Acer, Inc.(a)(b) | 13,000 | 4,762 | ||||||
Advanced Semiconductor Engineering, Inc.(a) | 44,000 | 50,544 | ||||||
Advantech Co., Ltd.(a) | 2,000 | 12,808 | ||||||
Asia Cement Corp.(a) | 9,000 | 7,489 | ||||||
Asustek Computer, Inc.(a) | 4,000 | 33,027 | ||||||
AU Optronics Corp.(a) | 40,000 | 11,793 | ||||||
Catcher Technology Co., Ltd.(a) | 5,000 | 41,682 | ||||||
Cathay Financial Holding Co., Ltd.(a) | 53,000 | 74,250 | ||||||
Chailease Holding Co., Ltd.(a) | 12,480 | 21,479 | ||||||
Chang Hwa Commercial Bank, Ltd.(a) | 21,400 | 10,191 | ||||||
Cheng Shin Rubber Industry Co., Ltd.(a) | 8,000 | 12,930 | ||||||
Chicony Electronics Co., Ltd.(a) | 2,010 | 4,397 | ||||||
China Airlines, Ltd.(a)(b) | 13,000 | 4,738 | ||||||
China Development Financial Holding Corp.(a) | 90,000 | 22,448 | ||||||
China Life Insurance Co., Ltd.(a) | 15,400 | 11,760 | ||||||
China Steel Corp.(a) | 85,000 | 46,340 | ||||||
Chunghwa Telecom Co., Ltd.(a) | 25,000 | 75,312 | ||||||
Compal Electronics, Inc.(a) | 17,000 | 9,513 | ||||||
CTBC Financial Holding Co., Ltd.(a) | 104,342 | 53,423 | ||||||
Delta Electronics, Inc.(a) | 12,630 | 59,406 | ||||||
E.Sun Financial Holding Co., Ltd.(a) | 68,608 | 39,833 | ||||||
Eclat Textile Co., Ltd.(a) | 1,000 | 13,741 | ||||||
Eva Airways Corp.(a)(b) | 9,000 | 5,083 | ||||||
Evergreen Marine Corp. Taiwan, Ltd.(a) | 17,170 | 6,905 | ||||||
Far Eastern New Century Corp.(a) | 31,620 | 24,703 | ||||||
Far EasTone Telecommunications Co., Ltd.(a) | 8,000 | 16,442 | ||||||
Feng TAY Enterprise Co., Ltd.(a) | 1,030 | 5,238 | ||||||
First Financial Holding Co., Ltd.(a) | 63,313 | 29,408 | ||||||
Formosa Chemicals & Fibre Corp.(a) | 23,000 | 51,594 | ||||||
Formosa Petrochemical Corp.(a) | 6,000 | 14,352 | ||||||
Formosa Plastics Corp.(a) | 28,000 | 65,364 | ||||||
Foxconn Technology Co., Ltd. (a) | 4,040 | 8,510 | ||||||
Fubon Financial Holding Co., Ltd.(a) | 44,000 | 59,850 | ||||||
Giant Manufacturing Co., Ltd.(a) | 1,000 | 6,629 | ||||||
Highwealth Construction Corp.(a) | 3,900 | 4,480 | ||||||
Hiwin Technologies Corp.(a) | 1,030 | 4,033 | ||||||
Hon Hai Precision Industry Co., Ltd.(a) | 96,500 | 236,164 | ||||||
Hotai Motor Co., Ltd.(a) | 1,000 | 11,501 | ||||||
HTC Corp.(a) | 3,000 | 7,088 | ||||||
Hua Nan Financial Holdings Co., Ltd.(a) | 31,860 | 14,748 | ||||||
Innolux Corp.(a) | 38,000 | 11,422 | ||||||
Inotera Memories, Inc.(a)(b) | 11,000 | 9,279 | ||||||
Inventec Corp.(a) | 11,000 | 7,171 | ||||||
Largan Precision Co., Ltd.(a) | 1,000 | 68,425 | ||||||
Lite-On Technology Corp.(a) | 9,045 | 8,723 | ||||||
MediaTek, Inc.(a) | 10,000 | 75,635 | ||||||
Mega Financial Holding Co., Ltd.(a) | 74,601 | 48,096 | ||||||
Merida Industry Co., Ltd.(a) | 1,000 | 5,363 | ||||||
Nan Ya Plastics Corp.(a) | 32,000 | 59,117 | ||||||
Novatek Microelectronics Corp.(a) | 2,000 | 7,786 | ||||||
OBI Pharma, Inc.(a)(b) | 1,000 | 19,862 | ||||||
Pegatron Corp.(a) | 14,000 | 30,450 | ||||||
Phison Electronics Corp.(a) | 1,000 | 7,023 | ||||||
Pou Chen Corp.(a) | 9,000 | 11,744 | ||||||
Powertech Technology, Inc.(a) | 7,000 | 13,803 | ||||||
President Chain Store Corp.(a) | 4,000 | 24,965 | ||||||
Quanta Computer, Inc.(a) | 16,000 | 25,668 | ||||||
Radiant Opto-Electronics Corp.(a) | 2,000 | 4,551 | ||||||
Realtek Semiconductor Corp. (a) | 2,000 | 4,761 | ||||||
Ruentex Development Co., Ltd.(a) | 5,280 | 6,860 | ||||||
Ruentex Industries, Ltd.(a) | 3,000 | 5,578 | ||||||
Shin Kong Financial Holding Co., Ltd.(a) | 39,551 | 8,568 | ||||||
Siliconware Precision Industries Co., Ltd.(a) | 17,135 | 27,059 | ||||||
Simplo Technology Co., Ltd. (a) | 1,000 | 3,176 | ||||||
SinoPac Financial Holdings Co., Ltd.(a) | 66,563 | 18,900 | ||||||
Synnex Technology International Corp.(a) | 6,000 | 5,821 | ||||||
Taishin Financial Holding Co., Ltd.(a) | 60,000 | 20,731 | ||||||
Taiwan Business Bank(a) (b) | 45,066 | 11,190 | ||||||
Taiwan Cement Corp.(a) | 15,000 | 12,418 | ||||||
Taiwan Cooperative Financial Holding Co., Ltd.(a) | 76,350 | 31,802 | ||||||
Taiwan Fertilizer Co., Ltd.(a) | 4,000 | 5,218 | ||||||
Taiwan Mobile Co., Ltd.(a) | 12,000 | 36,442 | ||||||
Taiwan Semiconductor Manufacturing Co., Ltd.(a) | 172,000 | 742,049 | ||||||
Teco Electric and Machinery Co., Ltd.(a) | 9,000 | 7,171 | ||||||
Uni-President Enterprises Corp.(a) | 32,880 | 54,809 | ||||||
United Microelectronics Corp.(a) | 82,000 | 29,966 | ||||||
See accompanying notes to financial statements.
46
Table of Contents
State Street Global Equity ex-U.S. Index Portfolio
Schedule of Investments — (continued)
December 31, 2015
Security Description | Shares | Value | ||||||
COMMON STOCKS – (continued) | ||||||||
Taiwan – (continued) | ||||||||
Vanguard International Semiconductor Corp.(a) | 4,000 | $ | 5,166 | |||||
Wistron Corp.(a) | 11,338 | 6,361 | ||||||
WPG Holdings, Ltd.(a) | 7,000 | 6,645 | ||||||
Yuanta Financial Holding Co., Ltd.(a) | 40,022 | 14,680 | ||||||
Yulon Motor Co., Ltd.(a) | 4,000 | 3,641 | ||||||
Zhen Ding Technology Holding, Ltd.(a) | 2,000 | 4,560 | ||||||
|
| |||||||
| 2,706,613 | ||||||||
|
| |||||||
Thailand – 0.4% | ||||||||
Advanced Info Service PCL | 5,900 | 24,921 | ||||||
Airports of Thailand PCL | 4,100 | 39,422 | ||||||
Bangkok Bank PCL NVDR(a) | 5,100 | 21,516 | ||||||
Bangkok Dusit Medical Services PCL | 15,000 | 9,296 | ||||||
BEC World PCL | 4,700 | 3,984 | ||||||
BTS Group Holdings PCL | 27,900 | 7,055 | ||||||
Bumrungrad Hospital PCL | 1,700 | 9,968 | ||||||
Central Pattana PCL | 5,900 | 7,706 | ||||||
Charoen Pokphand Foods PCL | 13,100 | 6,662 | ||||||
CP ALL PCL | 27,600 | 30,104 | ||||||
Delta Electronics Thailand PCL | 5,400 | 11,480 | ||||||
Glow Energy PCL | 2,500 | 5,141 | ||||||
Indorama Ventures PCL | 6,600 | 3,907 | ||||||
IRPC PCL | 48,400 | 5,783 | ||||||
Kasikornbank PCL(a) | 19,600 | 81,469 | ||||||
Krung Thai Bank PCL | 15,600 | 7,240 | ||||||
Minor International PCL | 8,250 | 8,311 | ||||||
PTT Exploration & Production PCL | 8,100 | 12,887 | ||||||
PTT Global Chemical PCL(a) | 20,700 | 28,080 | ||||||
PTT PCL | 8,400 | 56,957 | ||||||
Siam Cement PCL(a) | 2,000 | 25,242 | ||||||
Siam Commercial Bank PCL | 14,000 | 46,492 | ||||||
Thai Oil PCL | 3,900 | 7,153 | ||||||
Thai Union Group PCL | 9,200 | 4,397 | ||||||
TMB Bank PCL | 63,300 | 4,257 | ||||||
True Corp. PCL(b) | 34,300 | 6,386 | ||||||
|
| |||||||
| 475,816 | ||||||||
|
| |||||||
Turkey – 0.2% | ||||||||
Akbank TAS(a) | 13,031 | 29,855 | ||||||
Anadolu Efes Biracilik Ve Malt Sanayii A/S(a) | 1,002 | 6,484 | ||||||
Arcelik A/S(a) | 1,143 | 5,467 | ||||||
BIM Birlesik Magazalar A/S(a) | 1,296 | 22,793 | ||||||
Coca-Cola Icecek A/S(a) | 369 | 4,695 | ||||||
Emlak Konut Gayrimenkul Yatirim Ortakligi A/S(a) | 9,184 | 8,169 | ||||||
Enka Insaat ve Sanayi A/S(a) | 2,593 | 4,013 | ||||||
Eregli Demir ve Celik Fabrikalari TAS(a) | 6,767 | 7,036 | ||||||
Haci Omer Sabanci Holding A/S (a) | 7,057 | 19,989 | ||||||
KOC Holding A/S(a) | 6,204 | 23,216 | ||||||
TAV Havalimanlari | 790 | 4,920 | ||||||
Tupras Turkiye Petrol Rafinerileri A/S(a)(b) | 535 | 12,749 | ||||||
Turk Hava Yollari AO(a)(b) | 2,668 | 6,743 | ||||||
Turk Telekomunikasyon A/S(a) | 2,538 | 4,743 | ||||||
Turkcell Iletisim Hizmetleri A/S(a) | 4,027 | 13,639 | ||||||
Turkiye Garanti Bankasi A/S(a) | 16,453 | 40,049 | ||||||
Turkiye Halk Bankasi A/S(a) | 4,682 | 16,627 | ||||||
Turkiye Is Bankasi(a) | 12,616 | 19,835 | ||||||
Turkiye Sise ve Cam Fabrikalari A/S(a) | 3,298 | 3,601 | ||||||
Turkiye Vakiflar Bankasi TAO Class D(a) | 3,625 | 4,747 | ||||||
Ulker Biskuvi Sanayi A/S(a) | 744 | 4,487 | ||||||
Yapi ve Kredi Bankasi A/S(a) | 4,203 | 4,726 | ||||||
|
| |||||||
| 268,583 | ||||||||
|
| |||||||
United Arab Emirates – 0.2% |
| |||||||
Abu Dhabi Commercial Bank PJSC(a) | 13,495 | 24,077 | ||||||
Aldar Properties PJSC(a) | 15,203 | 9,510 | ||||||
Arabtec Holding PJSC(a)(b) | 10,931 | 3,672 | ||||||
DP World, Ltd.(a) | 798 | 16,187 | ||||||
Dubai Financial Market PJSC(a) | 23,678 | 7,848 | ||||||
Dubai Islamic Bank PJSC(a) | 4,778 | 7,996 | ||||||
Emaar Malls Group PJSC(a)(b) | 17,826 | 13,342 | ||||||
Emaar Properties PJSC(a) | 31,490 | 48,419 | ||||||
Emirates Telecommunications Group Co. PJSC | 11,652 | 51,075 | ||||||
First Gulf Bank PJSC(a) | 4,341 | 14,907 | ||||||
National Bank of Abu Dhabi PJSC | 3,273 | 7,093 | ||||||
|
| |||||||
| 204,126 | ||||||||
|
| |||||||
United Kingdom – 13.0% | ||||||||
3i Group PLC(a) | 7,006 | 49,619 | ||||||
Aberdeen Asset Management PLC(a) | 6,999 | 29,818 | ||||||
Admiral Group PLC(a) | 1,592 | 38,894 | ||||||
Aggreko PLC(a) | 1,238 | 16,662 | ||||||
Amec Foster Wheeler PLC(a) | 1,853 | 11,695 | ||||||
Anglo American PLC(a) | 10,067 | 44,157 | ||||||
ARM Holdings PLC(a) | 9,806 | 149,433 | ||||||
Ashtead Group PLC(a) | 3,486 | 57,360 | ||||||
Associated British Foods PLC (a) | 2,327 | 114,482 | ||||||
AstraZeneca PLC(a) | 8,466 | 571,739 | ||||||
Auto Trader Group PLC(a)(b)(d) | 5,029 | 32,782 | ||||||
Aviva PLC(a) | 28,093 | 213,196 | ||||||
Babcock International Group PLC(a) | 1,959 | 29,311 | ||||||
BAE Systems PLC(a) | 22,099 | 162,671 | ||||||
Barclays PLC(a) | 115,545 | 371,837 | ||||||
Barratt Developments PLC(a) | 6,639 | 61,164 | ||||||
BG Group PLC(a) | 23,552 | 341,336 | ||||||
BP PLC(a) | 122,515 | 636,542 | ||||||
British American Tobacco PLC(a) | 12,842 | 713,022 | ||||||
British Land Co. PLC(a) | 6,345 | 73,402 | ||||||
BT Group PLC(a) | 57,617 | 399,986 | ||||||
Bunzl PLC(a) | 2,252 | 62,467 | ||||||
Burberry Group PLC(a) | 3,002 | 52,806 | ||||||
Capita PLC(a) | 4,315 | 76,759 | ||||||
Centrica PLC(a) | 35,578 | 114,217 | ||||||
CNH Industrial NV(a) | 6,955 | 47,615 | ||||||
Cobham PLC(a) | 8,616 | 35,972 | ||||||
See accompanying notes to financial statements.
47
Table of Contents
State Street Global Equity ex-U.S. Index Portfolio
Schedule of Investments — (continued)
December 31, 2015
Security Description | Shares | Value | ||||||
COMMON STOCKS – (continued) |
| |||||||
United Kingdom – (continued) |
| |||||||
Compass Group PLC(a) | 11,469 | $ | 198,697 | |||||
Croda International PLC(a) | 1,009 | 45,199 | ||||||
Diageo PLC(a) | 17,609 | 480,764 | ||||||
Direct Line Insurance Group PLC(a) | 9,380 | 56,213 | ||||||
Dixons Carphone PLC(a) | 7,089 | 52,158 | ||||||
easyJet PLC(a) | 1,211 | 31,052 | ||||||
Fiat Chrysler Automobiles NV(a)(b) | 5,821 | 80,808 | ||||||
G4S PLC(a) | 11,589 | 38,488 | ||||||
GKN PLC(a) | 11,889 | 53,940 | ||||||
GlaxoSmithKline PLC(a) | 33,940 | 685,307 | ||||||
Hammerson PLC(a) | 5,677 | 50,177 | ||||||
Hargreaves Lansdown PLC(a) | 1,893 | 42,017 | ||||||
HSBC Holdings PLC(a) | 133,306 | 1,052,132 | ||||||
ICAP PLC(a) | 4,229 | 31,737 | ||||||
IMI PLC(a) | 2,117 | 26,858 | ||||||
Imperial Tobacco Group PLC(a) | 6,599 | 348,473 | ||||||
Inmarsat PLC(a) | 3,164 | 53,032 | ||||||
InterContinental Hotels Group PLC(a) | 1,589 | 61,924 | ||||||
International Consolidated Airlines Group SA(a) | 5,832 | 52,252 | ||||||
Intertek Group PLC(a) | 1,191 | 48,710 | ||||||
Intu Properties PLC(a) | 7,107 | 33,197 | ||||||
ITV PLC(a) | 24,582 | 100,062 | ||||||
J Sainsbury PLC(a) | 10,308 | 39,247 | ||||||
Johnson Matthey PLC(a) | 1,411 | 55,184 | ||||||
Kingfisher PLC(a) | 15,149 | 73,359 | ||||||
Land Securities Group PLC(a) | 5,583 | 96,762 | ||||||
Legal & General Group PLC(a) | 41,457 | 163,552 | ||||||
Lloyds Banking Group PLC(a) | 392,904 | 422,676 | ||||||
London Stock Exchange Group PLC(a) | 2,111 | 85,390 | ||||||
Marks & Spencer Group PLC(a) | 10,708 | 71,281 | ||||||
Meggitt PLC(a) | 5,903 | 32,585 | ||||||
Melrose Industries PLC(a) | 7,635 | 32,697 | ||||||
Merlin Entertainments PLC(a)(d) | 4,651 | 31,179 | ||||||
National Grid PLC(a) | 25,805 | 355,819 | ||||||
Next PLC(a) | 1,021 | 109,603 | ||||||
Old Mutual PLC(a) | 31,408 | 82,607 | ||||||
Pearson PLC(a) | 5,405 | 58,419 | ||||||
Persimmon PLC(a)(b) | 2,058 | 61,384 | ||||||
Petrofac, Ltd.(a) | 1,254 | 14,706 | ||||||
Provident Financial PLC(a) | 985 | 48,829 | ||||||
Prudential PLC(a) | 17,706 | 398,826 | ||||||
Randgold Resources, Ltd.(a) | 699 | 43,054 | ||||||
Reckitt Benckiser Group PLC(a) | 4,405 | 407,495 | ||||||
RELX NV(a) | 6,997 | 117,797 | ||||||
RELX PLC(a) | 7,302 | 128,751 | ||||||
Rexam PLC(a) | 5,229 | 46,631 | ||||||
Rio Tinto PLC(a) | 8,658 | 252,029 | ||||||
Rio Tinto, Ltd.(a) | 2,995 | 96,704 | ||||||
Rolls-Royce Holdings PLC(a)(b) | 11,647 | 98,635 | ||||||
Royal Bank of Scotland Group PLC(a)(b) | 24,439 | 108,611 | ||||||
Royal Mail PLC(a) | 5,175 | 33,889 | ||||||
RSA Insurance Group PLC(a) | 7,388 | 46,360 | ||||||
SABMiller PLC(a) | 6,683 | 399,722 | ||||||
Sage Group PLC(a) | 7,279 | 64,661 | ||||||
Schroders PLC(a) | 927 | 40,593 | ||||||
Segro PLC(a) | 5,643 | 35,704 | ||||||
Severn Trent PLC(a) | 1,639 | 52,383 | ||||||
Sky PLC(a) | 7,262 | 119,020 | ||||||
Smith & Nephew PLC(a) | 6,323 | 112,666 | ||||||
Smiths Group PLC(a) | 2,941 | 40,663 | ||||||
Sports Direct International PLC(a)(b) | 1,302 | 11,062 | ||||||
SSE PLC(a) | 6,938 | 155,752 | ||||||
St James’s Place PLC(a) | 3,816 | 56,548 | ||||||
Standard Chartered PLC(a) | 22,861 | 189,643 | ||||||
Standard Life PLC(a) | 12,800 | 73,284 | ||||||
Tate & Lyle PLC(a) | 3,567 | 31,413 | ||||||
Taylor Wimpey PLC(a) | 21,754 | 65,017 | ||||||
Tesco PLC(a)(b) | 56,905 | 125,010 | ||||||
Travis Perkins PLC(a) | 1,786 | 51,802 | ||||||
Unilever NV | 10,967 | 477,789 | ||||||
Unilever PLC(a) | 8,844 | 379,261 | ||||||
United Utilities Group PLC(a) | 4,528 | 62,335 | ||||||
Vodafone Group PLC(a) | 177,840 | 576,576 | ||||||
Weir Group PLC(a) | 1,669 | 24,511 | ||||||
Whitbread PLC(a) | 1,175 | 76,144 | ||||||
William Hill PLC(a) | 6,712 | 39,164 | ||||||
Wm Morrison Supermarkets PLC(a) | 16,634 | 36,236 | ||||||
WPP PLC(a) | 8,996 | 206,882 | ||||||
|
| |||||||
| 15,250,043 | ||||||||
|
| |||||||
United States – 0.4% | ||||||||
Carnival PLC(a) | 1,226 | 69,826 | ||||||
Mobileye NV(b) | 544 | 23,000 | ||||||
QIAGEN NV(a)(b) | 1,645 | 44,568 | ||||||
Thomson Reuters Corp. | 2,500 | 94,324 | ||||||
Transocean, Ltd.(a) | 2,729 | 34,134 | ||||||
Valeant Pharmaceuticals International, Inc.(b) | 2,300 | 232,732 | ||||||
|
| |||||||
| 498,584 | ||||||||
|
| |||||||
TOTAL COMMON STOCKS |
| 114,278,790 | ||||||
|
| |||||||
RIGHTS – 0.0%(e) | ||||||||
Brazil – 0.0%(e) | ||||||||
Banco Bradesco SA (expiring 2/5/16)(b) | 507 | 265 | ||||||
Banco Bradesco SA (expiring 2/5/16)(b) | 208 | 68 | ||||||
|
| |||||||
| 333 | ||||||||
|
| |||||||
Hong Kong – 0.0%(e) | ||||||||
GCL-Poly Energy Holdings, Ltd. (expiring 1/20/16)(b) | 18,200 | 94 | ||||||
|
| |||||||
Italy – 0.0%(e) | ||||||||
UBI Banca (expiring 1/12/16)(b) | 6,303 | 305 | ||||||
|
| |||||||
Singapore – 0.0%(e) | ||||||||
Ascendas Real Estate Investment Trust (expiring 1/13/16)(b) | 375 | 16 | ||||||
|
| |||||||
South Korea – 0.0%(e) | ||||||||
BNK Financial Group, Inc. (expiring 1/14/16)(b) | 387 | 439 | ||||||
|
| |||||||
Spain – 0.0%(e) | ||||||||
Repsol SA (expiring 1/14/16)(b) | 7,458 | 3,719 | ||||||
|
| |||||||
TOTAL RIGHTS |
| 4,906 | ||||||
|
| |||||||
See accompanying notes to financial statements.
48
Table of Contents
State Street Global Equity ex-U.S. Index Portfolio
Schedule of Investments — (continued)
December 31, 2015
Security Description | Shares | Value | ||||||
SHORT-TERM INVESTMENT – 2.1% |
| |||||||
State Street Institutional U.S. Government Money Market Fund, Premier Class 0.09%(g)(h)(i) | 2,440,800 | $ | 2,440,800 | |||||
|
| |||||||
TOTAL INVESTMENTS – 99.4% |
| 116,724,496 | ||||||
Other Assets in Excess of |
| 736,756 | ||||||
|
| |||||||
NET ASSETS – 100.0% | $ | 117,461,252 | ||||||
|
| |||||||
| (a) | Security is fair valued at year end by applying factors provided by an independent third party in accordance with Portfolio’s valuation policy and procedures. The independent fair value service takes into account multiple factors including, but not limited to, movements in the U.S. securities markets, certain depositary receipts, futures contracts and foreign currency exchange rates that have occurred subsequent to the close of foreign securities exchanges. The use of the independent fair value service or alternative fair valuation methods would result in the investments being classified within Level 2 of the fair value hierarchy. Total market value of such securities represent $102,099,336 and 86.9% of net assets of the Portfolio at December 31, 2015. |
| (b) | Non-income producing security |
| (c) | Reflects separate holdings of the issuer’s common stock traded on different securities exchanges. |
| (d) | Security subject to restrictions on resale under federal securities laws, which may only be resold upon registration under the Securities Act of 1933, as amended (“1933 Act”) or in transactions exempt from registration, including sales to qualified institutional buyers pursuant to Rule 144A of the 1933 Act. The Portfolio does not have the right to demand that this security be registered. The Portfolio’s investment manager has deemed this security to be liquid based upon procedures approved by the Board of Trustees. These securities represent 359,783 or 0.31% of net assets as of December 31, 2015. |
| (e) | Amount shown represents less than 0.05% of net assets. |
| (f) | Fair valued as determined in good faith by the Trust’s Oversight Committee in accordance with policy and procedures approved by the Board of Trustees. Security valued is determined based on Level 3 inputs. As of December 31, 2015, total aggregate fair value of security is $0, representing 0% of the Portfolio’s net assets. |
| (g) | The rate shown is the annualized seven-day yield at December 31, 2015. |
| (h) | Affiliated Fund managed by SSGA Funds Management, Inc. (Note 4). |
| (i) | All or part of this security has been designated as collateral for futures contracts. |
| ADR | American Depositary Receipt | |
| GDR | Global Depositary Receipt | |
| NVDR | Non Voting Depositary Receipt | |
| REIT | Real Estate Investment Trust |
At December 31, 2015, open futures contracts purchased were as follows:
Futures Contracts | Expiration Date | Number of Contracts | Notional Value | Unrealized Appreciation | ||||||||||||
Mini MSCI EAFE (long) | 03/18/2016 | 21 | $ | 1,783,110 | $ | 31,080 | ||||||||||
Mini MSCI Emerging Markets (long) | 03/18/2016 | 39 | 1,535,625 | 32,370 | ||||||||||||
|
| |||||||||||||||
Total unrealized appreciation on open futures contracts purchased |
| $ | 63,450 | |||||||||||||
|
| |||||||||||||||
Description | Level 1 – Quoted Prices | Level 2 – Other Significant Observable Inputs | Level 3 – Significant Unobservable Inputs | Total | ||||||||||||
Investments: | ||||||||||||||||
Common Stocks | $ | 12,179,454 | $ | 102,099,336 | $ | — | * | $ | 114,278,790 | |||||||
Rights | 4,158 | 748 | — | 4,906 | ||||||||||||
Short-Term Investment | 2,440,800 | — | — | 2,440,800 | ||||||||||||
Other Financial Instruments: | ||||||||||||||||
Futures Contracts** | 63,450 | — | — | 63,450 | ||||||||||||
|
|
|
|
|
|
|
| |||||||||
Total Investments | $ | 16,515,472 | $ | 100,272,474 | $ | — | $ | 116,787,946 | ||||||||
|
|
|
|
|
|
|
| |||||||||
| * | Fund held level 3 securities that were valued at $0 at December 31, 2015. |
| ** | Futures Contracts are valued at unrealized appreciation (depreciation). |
See accompanying notes to financial statements.
49
Table of Contents
State Street Small/Mid Cap Equity Index Portfolio
Portfolio Statistics (Unaudited)
Portfolio Composition* | December 31, 2015 | |||
Common Stocks | 96.6 | % | ||
Short-Term Investment | 3.5 | |||
Liabilities in Excess of Other Assets | (0.1 | ) | ||
Total | 100.0 | % |
Top Five Sectors (excluding short-term investment)* | December 31, 2015 | |||
Real Estate Investment Trusts (REITs) | 9.9 | % | ||
Banks | 5.7 | |||
Biotechnology | 4.8 | |||
Software | 4.5 | |||
Insurance | 4.4 | |||
Total | 29.3 | % |
| * | As a percentage of net assets as of the date indicated. The Portfolio’s composition will vary over time. |
See accompanying notes to financial statements.
50
Table of Contents
State Street Small/Mid Cap Equity Index Portfolio
Schedule of Investments
December 31, 2015
Security Description | Shares | Value | ||||||
COMMON STOCKS – 96.6% | ||||||||
Aerospace & Defense – 1.7% | ||||||||
AAR Corp. | 260 | $ | 6,835 | |||||
Aerojet Rocketdyne Holdings, Inc.(a) | 400 | 6,264 | ||||||
Aerovironment, Inc.(a) | 100 | 2,947 | ||||||
American Science & Engineering, Inc. | 39 | 1,614 | ||||||
Astronics Corp.(a) | 143 | 5,822 | ||||||
B/E Aerospace, Inc. | 701 | 29,701 | ||||||
BWX Technologies, Inc. | 695 | 22,080 | ||||||
Cubic Corp. | 200 | 9,450 | ||||||
Curtiss-Wright Corp. | 309 | 21,166 | ||||||
DigitalGlobe, Inc.(a) | 500 | 7,830 | ||||||
Ducommun, Inc.(a) | 100 | 1,622 | ||||||
Engility Holdings, Inc. | 100 | 3,248 | ||||||
Esterline Technologies Corp.(a) | 200 | 16,200 | ||||||
HEICO Corp. | 142 | 7,719 | ||||||
HEICO Corp. Class A | 259 | 12,743 | ||||||
Hexcel Corp. | 647 | 30,053 | ||||||
Huntington Ingalls Industries, Inc. | 333 | 42,241 | ||||||
KEYW Holding Corp.(a) | 200 | 1,204 | ||||||
KLX, Inc.(a) | 343 | 10,561 | ||||||
Kratos Defense & Security Solutions, Inc.(a) | 300 | 1,230 | ||||||
Moog, Inc. Class A(a) | 251 | 15,211 | ||||||
National Presto Industries, Inc. | 25 | 2,072 | ||||||
Orbital ATK, Inc. | 415 | 37,076 | ||||||
Sparton Corp.(a) | 100 | 1,999 | ||||||
Spirit AeroSystems Holdings, Inc. Class A(a) | 973 | 48,718 | ||||||
TASER International, Inc.(a) | 392 | 6,778 | ||||||
Teledyne Technologies, Inc.(a) | 230 | 20,401 | ||||||
TransDigm Group, Inc.(a) | 362 | 82,699 | ||||||
Triumph Group, Inc. | 345 | 13,714 | ||||||
Vectrus, Inc.(a) | 100 | 2,089 | ||||||
|
| |||||||
| 471,287 | ||||||||
|
| |||||||
Air Freight & Logistics – 0.2% |
| |||||||
Air Transport Services Group, Inc.(a) | 300 | 3,024 | ||||||
Atlas Air Worldwide Holdings, Inc.(a) | 182 | 7,524 | ||||||
Echo Global Logistics, Inc.(a) | 200 | 4,078 | ||||||
Forward Air Corp. | 200 | 8,602 | ||||||
Hub Group, Inc. Class A(a) | 259 | 8,534 | ||||||
Park-Ohio Holdings Corp. | 46 | 1,692 | ||||||
Radiant Logistics, Inc.(a) | 200 | 686 | ||||||
UTi Worldwide, Inc.(a) | 500 | 3,515 | ||||||
XPO Logistics, Inc.(a) | 500 | 13,625 | ||||||
|
| |||||||
| 51,280 | ||||||||
|
| |||||||
Airlines – 0.7% | ||||||||
Alaska Air Group, Inc. | 883 | 71,090 | ||||||
Allegiant Travel Co. | 87 | 14,601 | ||||||
Copa Holdings SA Class A | 233 | 11,245 | ||||||
Hawaiian Holdings, Inc.(a) | 300 | 10,599 | ||||||
JetBlue Airways Corp.(a) | 2,136 | 48,380 | ||||||
Republic Airways Holdings, Inc.(a) | 300 | 1,179 | ||||||
SkyWest, Inc. | 300 | 5,706 | ||||||
Spirit Airlines, Inc.(a) | 500 | 19,925 | ||||||
Virgin America, Inc.(a) | 185 | 6,662 | ||||||
|
| |||||||
| 189,387 | ||||||||
|
| |||||||
Auto Components – 0.9% | ||||||||
American Axle & Manufacturing Holdings, Inc.(a) | 500 | 9,470 | ||||||
Cooper Tire & Rubber Co. | 400 | 15,140 | ||||||
Cooper-Standard Holding, Inc.(a) | 100 | 7,759 | ||||||
Dana Holding Corp. | 994 | 13,717 | ||||||
Dorman Products, Inc.(a) | 193 | 9,162 | ||||||
Drew Industries, Inc. | 172 | 10,473 | ||||||
Federal-Mogul Holdings Corp.(a) | 200 | 1,370 | ||||||
Fox Factory Holding Corp.(a) | 100 | 1,653 | ||||||
Gentex Corp. | 1,966 | 31,476 | ||||||
Gentherm, Inc.(a) | 254 | 12,040 | ||||||
Horizon Global Corp.(a) | 174 | 1,804 | ||||||
Lear Corp. | 530 | 65,100 | ||||||
Metaldyne Performance Group, Inc. | 100 | 1,834 | ||||||
Modine Manufacturing Co.(a) | 383 | 3,466 | ||||||
Motorcar Parts of America, Inc.(a) | 100 | 3,381 | ||||||
Standard Motor Products, Inc. | 149 | 5,669 | ||||||
Stoneridge, Inc.(a) | 182 | 2,694 | ||||||
Strattec Security Corp. | 19 | 1,073 | ||||||
Superior Industries International, Inc. | 188 | 3,463 | ||||||
Tenneco, Inc.(a) | 435 | 19,971 | ||||||
Tower International, Inc. | 161 | 4,600 | ||||||
Visteon Corp.(a) | 278 | 31,831 | ||||||
|
| |||||||
| 257,146 | ||||||||
|
| |||||||
Automobiles – 0.6% | ||||||||
Tesla Motors, Inc.(a) | 661 | 158,647 | ||||||
Thor Industries, Inc. | 296 | 16,620 | ||||||
Winnebago Industries, Inc. | 200 | 3,980 | ||||||
|
| |||||||
| 179,247 | ||||||||
|
| |||||||
Banks – 5.7% | ||||||||
1st Source Corp. | 100 | 3,087 | �� | |||||
American National Bankshares, Inc. | 100 | 2,561 | ||||||
Ameris Bancorp | 200 | 6,798 | ||||||
Ames National Corp. | 100 | 2,429 | ||||||
Arrow Financial Corp. | 102 | 2,771 | ||||||
Associated Banc-Corp | 1,000 | 18,750 | ||||||
Banc of California, Inc. | 200 | 2,924 | ||||||
BancFirst Corp. | 38 | 2,228 | ||||||
Banco Latinoamericano de Comercio Exterior SA | 200 | 5,186 | ||||||
Bancorp, Inc.(a) | 200 | 1,274 | ||||||
BancorpSouth, Inc. | 670 | 16,073 | ||||||
Bank of Hawaii Corp. | 284 | 17,864 | ||||||
Bank of Marin Bancorp | 31 | 1,655 | ||||||
Bank of the Ozarks, Inc. | 507 | 25,076 | ||||||
BankUnited, Inc. | 672 | 24,232 | ||||||
Banner Corp. | 200 | 9,172 | ||||||
Bar Harbor Bankshares | 39 | 1,342 | ||||||
BBCN Bancorp, Inc. | 500 | 8,610 | ||||||
Berkshire Hills Bancorp, Inc. | 200 | 5,822 | ||||||
Blue Hills Bancorp, Inc. | 226 | 3,460 | ||||||
BNC Bancorp | 200 | 5,076 | ||||||
BOK Financial Corp. | 184 | 11,001 | ||||||
Boston Private Financial Holdings, Inc. | 600 | 6,804 | ||||||
Bridge Bancorp, Inc. | 100 | 3,043 | ||||||
Bryn Mawr Bank Corp. | 100 | 2,872 | ||||||
Camden National Corp. | 39 | 1,720 | ||||||
Capital Bank Financial Corp. Class A | 137 | 4,381 | ||||||
See accompanying notes to financial statements.
51
Table of Contents
State Street Small/Mid Cap Equity Index Portfolio
Schedule of Investments — (continued)
December 31, 2015
Security Description | Shares | Value | ||||||
COMMON STOCKS – (continued) | ||||||||
Banks – (continued) | ||||||||
Capital City Bank Group, Inc. | 100 | $ | 1,535 | |||||
Cardinal Financial Corp. | 200 | 4,550 | ||||||
Cascade Bancorp(a) | 301 | 1,827 | ||||||
Cathay General Bancorp | 554 | 17,357 | ||||||
CenterState Banks, Inc. | 300 | 4,695 | ||||||
Central Pacific Financial Corp. | 179 | 3,942 | ||||||
Century Bancorp, Inc. Class A | 36 | 1,565 | ||||||
Chemical Financial Corp. | 200 | 6,854 | ||||||
CIT Group, Inc. | 1,190 | 47,243 | ||||||
Citizens & Northern Corp. | 100 | 2,100 | ||||||
Citizens Financial Group, Inc. | 2,127 | 55,706 | ||||||
City Holding Co. | 100 | 4,564 | ||||||
CNB Financial Corp. | 100 | 1,803 | ||||||
CoBiz Financial, Inc. | 200 | 2,684 | ||||||
Columbia Banking System, Inc. | 400 | 13,004 | ||||||
Commerce Bancshares, Inc. | 575 | 24,478 | ||||||
Community Bank System, Inc. | 300 | 11,982 | ||||||
Community Trust Bancorp, Inc. | 100 | 3,496 | ||||||
CommunityOne Bancorp(a) | 123 | 1,657 | ||||||
ConnectOne Bancorp, Inc. | 200 | 3,738 | ||||||
CU Bancorp(a) | 100 | 2,536 | ||||||
Cullen/Frost Bankers, Inc. | 351 | 21,060 | ||||||
Customers Bancorp, Inc.(a) | 200 | 5,444 | ||||||
CVB Financial Corp. | 700 | 11,844 | ||||||
Eagle Bancorp, Inc.(a) | 200 | 10,094 | ||||||
East West Bancorp, Inc. | 985 | 40,937 | ||||||
Enterprise Bancorp, Inc. | 75 | 1,714 | ||||||
Enterprise Financial Services Corp. | 100 | 2,835 | ||||||
Farmers Capital Bank Corp.(a) | 49 | 1,328 | ||||||
FCB Financial Holdings, Inc. Class A(a) | 182 | 6,514 | ||||||
Fidelity Southern Corp. | 100 | 2,231 | ||||||
Financial Institutions, Inc. | 100 | 2,800 | ||||||
First Bancorp(a) | 600 | 1,950 | ||||||
First Bancorp | 100 | 1,874 | ||||||
First Bancorp, Inc. | 100 | 2,047 | ||||||
First Busey Corp. | 133 | 2,744 | ||||||
First Business Financial Services, Inc. | 100 | 2,501 | ||||||
First Citizens BancShares, Inc. Class A | 50 | 12,908 | ||||||
First Commonwealth Financial Corp. | 500 | 4,535 | ||||||
First Community Bancshares, Inc. | 100 | 1,863 | ||||||
First Connecticut Bancorp, Inc. | 100 | 1,741 | ||||||
First Financial Bancorp | 400 | 7,228 | ||||||
First Financial Bankshares, Inc. | 451 | 13,607 | ||||||
First Financial Corp. | 100 | 3,397 | ||||||
First Horizon National Corp. | 1,615 | 23,450 | ||||||
First Interstate BancSystem, Inc. Class A | 100 | 2,907 | ||||||
First Merchants Corp. | 278 | 7,067 | ||||||
First Midwest Bancorp, Inc. | 500 | 9,215 | ||||||
First NBC Bank Holding Co.(a) | 100 | 3,739 | ||||||
First Niagara Financial Group, Inc. | 2,450 | 26,582 | ||||||
First of Long Island Corp. | 100 | 3,000 | ||||||
First Republic Bank | 969 | 64,012 | ||||||
FirstMerit Corp. | 1,100 | 20,515 | ||||||
Flushing Financial Corp. | 200 | 4,328 | ||||||
FNB Corp. | 1,200 | 16,008 | ||||||
Franklin Financial Network, Inc.(a) | 55 | 1,726 | ||||||
Fulton Financial Corp. | 1,200 | 15,612 | ||||||
German American Bancorp, Inc. | 100 | 3,332 | ||||||
Glacier Bancorp, Inc. | 500 | 13,265 | ||||||
Great Southern Bancorp, Inc. | 68 | 3,078 | ||||||
Great Western Bancorp, Inc. | 300 | 8,706 | ||||||
Green Bancorp, Inc.(a) | 100 | 1,048 | ||||||
Guaranty Bancorp | 100 | 1,654 | ||||||
Hancock Holding Co. | 500 | 12,585 | ||||||
Hanmi Financial Corp. | 200 | 4,744 | ||||||
Heartland Financial USA, Inc. | 100 | 3,136 | ||||||
Heritage Commerce Corp. | 200 | 2,392 | ||||||
Heritage Financial Corp. | 200 | 3,768 | ||||||
Heritage Oaks Bancorp | 200 | 1,602 | ||||||
Hilltop Holdings, Inc.(a) | 500 | 9,610 | ||||||
Home BancShares, Inc. | 400 | 16,208 | ||||||
HomeTrust Bancshares, Inc.(a) | 100 | 2,025 | ||||||
Horizon Bancorp | 100 | 2,796 | ||||||
IBERIABANK Corp. | 247 | 13,602 | ||||||
Independent Bank Corp.(b) | 188 | 8,746 | ||||||
Independent Bank Corp.(b) | 100 | 1,523 | ||||||
Independent Bank Group, Inc. | 51 | 1,632 | ||||||
International Bancshares Corp. | 352 | 9,046 | ||||||
Investors Bancorp, Inc. | 2,300 | 28,612 | ||||||
Lakeland Bancorp, Inc. | 200 | 2,358 | ||||||
Lakeland Financial Corp. | 100 | 4,662 | ||||||
LegacyTexas Financial Group, Inc. | 348 | 8,707 | ||||||
MainSource Financial Group, Inc. | 170 | 3,890 | ||||||
MB Financial, Inc. | 500 | 16,185 | ||||||
Mercantile Bank Corp. | 100 | 2,454 | ||||||
Merchants Bancshares, Inc. | 51 | 1,606 | ||||||
Metro Bancorp, Inc. | 100 | 3,138 | ||||||
MidWestOne Financial Group, Inc. | 51 | 1,551 | ||||||
National Bank Holdings Corp. Class A | 200 | 4,274 | ||||||
National Bankshares, Inc. | 37 | 1,315 | ||||||
National Commerce Corp.(a) | 63 | 1,578 | ||||||
National Penn Bancshares, Inc. | 1,000 | 12,330 | ||||||
NBT Bancorp, Inc. | 300 | 8,364 | ||||||
NewBridge Bancorp | 200 | 2,436 | ||||||
OFG Bancorp | 200 | 1,464 | ||||||
Old National Bancorp | 800 | 10,848 | ||||||
Old Second Bancorp, Inc.(a) | 200 | 1,568 | ||||||
Opus Bank | 100 | 3,697 | ||||||
Pacific Continental Corp. | 100 | 1,488 | ||||||
Pacific Premier Bancorp, Inc.(a) | 100 | 2,125 | ||||||
PacWest Bancorp | 791 | 34,092 | ||||||
Park National Corp. | 85 | 7,691 | ||||||
Park Sterling Corp. | 200 | 1,464 | ||||||
Peapack Gladstone Financial Corp. | 100 | 2,062 | ||||||
Penns Woods Bancorp, Inc. | 47 | 1,996 | ||||||
Peoples Bancorp, Inc. | 100 | 1,884 | ||||||
Peoples Financial Services Corp. | 39 | 1,485 | ||||||
Pinnacle Financial Partners, Inc. | 252 | 12,943 | ||||||
Popular, Inc. | 700 | 19,838 | ||||||
Preferred Bank | 100 | 3,302 | ||||||
PrivateBancorp, Inc. | 511 | 20,961 | ||||||
Prosperity Bancshares, Inc. | 455 | 21,776 | ||||||
QCR Holdings, Inc. | 100 | 2,429 | ||||||
Renasant Corp. | 261 | 8,981 | ||||||
Republic Bancorp, Inc. Class A | 100 | 2,641 | ||||||
S&T Bancorp, Inc. | 253 | 7,797 | ||||||
Sandy Spring Bancorp, Inc. | 200 | 5,392 | ||||||
Seacoast Banking Corp. of Florida(a) | 100 | 1,498 | ||||||
See accompanying notes to financial statements.
52
Table of Contents
State Street Small/Mid Cap Equity Index Portfolio
Schedule of Investments — (continued)
December 31, 2015
Security Description | Shares | Value | ||||||
COMMON STOCKS – (continued) | ||||||||
Banks – (continued) | ||||||||
ServisFirst Bancshares, Inc. | 200 | $ | 9,506 | |||||
Sierra Bancorp | 100 | 1,765 | ||||||
Signature Bank(a) | 346 | 53,066 | ||||||
Simmons First National Corp. Class A | 200 | 10,272 | ||||||
South State Corp. | 157 | 11,296 | ||||||
Southside Bancshares, Inc. | 200 | 4,804 | ||||||
Southwest Bancorp, Inc. | 100 | 1,748 | ||||||
State Bank Financial Corp. | 200 | 4,206 | ||||||
Sterling Bancorp | 800 | 12,976 | ||||||
Stock Yards Bancorp, Inc. | 100 | 3,779 | ||||||
Stonegate Bank | 100 | 3,286 | ||||||
Suffolk Bancorp | 100 | 2,835 | ||||||
Sun Bancorp, Inc.(a) | 100 | 2,064 | ||||||
SVB Financial Group(a) | 351 | 41,734 | ||||||
Synovus Financial Corp. | 900 | 29,142 | ||||||
Talmer Bancorp, Inc. Class A | 300 | 5,433 | ||||||
TCF Financial Corp. | 1,100 | 15,532 | ||||||
Texas Capital Bancshares, Inc.(a) | 298 | 14,727 | ||||||
Tompkins Financial Corp. | 100 | 5,616 | ||||||
Towne Bank | 300 | 6,261 | ||||||
TriCo Bancshares | 176 | 4,829 | ||||||
TriState Capital Holdings, Inc.(a) | 100 | 1,399 | ||||||
Triumph Bancorp, Inc.(a) | 100 | 1,650 | ||||||
Trustmark Corp. | 477 | 10,990 | ||||||
UMB Financial Corp. | 256 | 11,917 | ||||||
Umpqua Holdings Corp. | 1,500 | 23,850 | ||||||
Union Bankshares Corp. | 300 | 7,572 | ||||||
United Bankshares, Inc. | 451 | 16,682 | ||||||
United Community Banks, Inc. | 385 | 7,504 | ||||||
Univest Corp. of Pennsylvania | 100 | 2,086 | ||||||
Valley National Bancorp | 1,600 | 15,760 | ||||||
Washington Trust Bancorp, Inc. | 100 | 3,952 | ||||||
Webster Financial Corp. | 600 | 22,314 | ||||||
WesBanco, Inc. | 250 | 7,505 | ||||||
West Bancorp, Inc. | 100 | 1,975 | ||||||
Westamerica Bancorp | 185 | 8,649 | ||||||
Western Alliance Bancorp(a) | 596 | 21,373 | ||||||
Wilshire Bancorp, Inc. | 400 | 4,620 | ||||||
Wintrust Financial Corp. | 308 | 14,944 | ||||||
Yadkin Financial Corp. | 200 | 5,034 | ||||||
|
| |||||||
| 1,616,917 | ||||||||
|
| |||||||
Beverages – 0.1% | ||||||||
Boston Beer Co., Inc. Class A(a) | 59 | 11,913 | ||||||
Coca-Cola Bottling Co. Consolidated | 35 | 6,388 | ||||||
MGP Ingredients, Inc. | 100 | 2,595 | ||||||
National Beverage Corp.(a) | 100 | 4,544 | ||||||
|
| |||||||
| 25,440 | ||||||||
|
| |||||||
Biotechnology – 4.8% | ||||||||
ACADIA Pharmaceuticals, Inc.(a) | 518 | 18,467 | ||||||
Acceleron Pharma, Inc.(a) | 200 | 9,752 | ||||||
Achillion Pharmaceuticals, Inc.(a) | 800 | 8,632 | ||||||
Acorda Therapeutics, Inc.(a) | 300 | 12,834 | ||||||
Adamas Pharmaceuticals, Inc.(a) | 100 | 2,832 | ||||||
Aduro Biotech, Inc.(a) | 54 | 1,520 | ||||||
Advaxis, Inc.(a) | 200 | 2,012 | ||||||
Aegerion Pharmaceuticals, Inc.(a) | 100 | 1,010 | ||||||
Affimed NV(a) | 100 | 712 | ||||||
Agenus, Inc.(a) | 400 | 1,816 | ||||||
Agios Pharmaceuticals, Inc.(a) | 168 | 10,907 | ||||||
Aimmune Therapeutics, Inc.(a) | 100 | 1,845 | ||||||
Akebia Therapeutics, Inc.(a) | 200 | 2,584 | ||||||
Alder Biopharmaceuticals, Inc.(a) | 152 | 5,021 | ||||||
Alkermes PLC(a) | 1,011 | 80,253 | ||||||
Alnylam Pharmaceuticals, Inc.(a) | 507 | 47,729 | ||||||
AMAG Pharmaceuticals, Inc.(a) | 200 | 6,038 | ||||||
Amicus Therapeutics, Inc.(a) | 841 | 8,158 | ||||||
Anacor Pharmaceuticals, Inc.(a) | 282 | 31,857 | ||||||
Anthera Pharmaceuticals, Inc.(a) | 200 | 928 | ||||||
Applied Genetic Technologies Corp.(a) | 87 | 1,775 | ||||||
Ardelyx, Inc.(a) | 100 | 1,812 | ||||||
Arena Pharmaceuticals, Inc.(a) | 1,200 | 2,280 | ||||||
ARIAD Pharmaceuticals, Inc.(a) | 1,200 | 7,500 | ||||||
Array BioPharma, Inc.(a) | 1,083 | 4,570 | ||||||
Arrowhead Research Corp.(a) | 300 | 1,845 | ||||||
Atara Biotherapeutics, Inc.(a) | 100 | 2,641 | ||||||
Avalanche Biotechnologies, Inc.(a) | 100 | 952 | ||||||
Axovant Sciences, Ltd.(a) | 137 | 2,470 | ||||||
Bellicum Pharmaceuticals, Inc.(a) | 82 | 1,662 | ||||||
BioCryst Pharmaceuticals, Inc.(a) | 400 | 4,128 | ||||||
BioMarin Pharmaceutical, Inc.(a) | 1,089 | 114,084 | ||||||
BioSpecifics Technologies Corp.(a) | 26 | 1,117 | ||||||
BioTime, Inc.(a) | 500 | 2,050 | ||||||
Bluebird Bio, Inc.(a) | 248 | 15,927 | ||||||
Blueprint Medicines Corp.(a) | 100 | 2,634 | ||||||
Cara Therapeutics, Inc.(a) | 100 | 1,686 | ||||||
Catalyst Pharmaceuticals, Inc.(a) | 400 | 980 | ||||||
Celldex Therapeutics, Inc.(a) | 700 | 10,976 | ||||||
Cellular Biomedicine Group, Inc.(a) | 100 | 2,149 | ||||||
Cepheid(a) | 500 | 18,265 | ||||||
ChemoCentryx, Inc.(a) | 300 | 2,430 | ||||||
Chimerix, Inc.(a) | 297 | 2,658 | ||||||
Clovis Oncology, Inc.(a) | 180 | 6,300 | ||||||
Coherus Biosciences, Inc.(a) | 200 | 4,592 | ||||||
Concert Pharmaceuticals, Inc.(a) | 100 | 1,897 | ||||||
CTI BioPharma Corp.(a) | 800 | 984 | ||||||
Curis, Inc.(a) | 600 | 1,746 | ||||||
Cytokinetics, Inc.(a) | 200 | 2,092 | ||||||
CytomX Therapeutics, Inc.(a) | 76 | 1,586 | ||||||
CytRx Corp.(a) | 657 | 1,741 | ||||||
Dicerna Pharmaceuticals, Inc.(a) | 100 | 1,187 | ||||||
Dyax Corp.(a) | 960 | 36,115 | ||||||
Dynavax Technologies Corp.(a) | 238 | 5,750 | ||||||
Eagle Pharmaceuticals, Inc.(a) | 64 | 5,675 | ||||||
Emergent BioSolutions, Inc.(a) | 200 | 8,002 | ||||||
Enanta Pharmaceuticals, Inc.(a) | 100 | 3,302 | ||||||
Epizyme, Inc.(a) | 238 | 3,813 | ||||||
Esperion Therapeutics, Inc.(a) | 100 | 2,226 | ||||||
Exact Sciences Corp.(a) | 704 | 6,498 | ||||||
Exelixis, Inc.(a) | 1,509 | 8,511 | ||||||
FibroGen, Inc.(a) | 300 | 9,141 | ||||||
Five Prime Therapeutics, Inc.(a) | 147 | 6,100 | ||||||
Flexion Therapeutics, Inc.(a) | 100 | 1,927 | ||||||
Foundation Medicine, Inc.(a) | 100 | 2,106 | ||||||
Galena Biopharma, Inc.(a) | 800 | 1,176 | ||||||
Genocea Biosciences, Inc.(a) | 100 | 527 | ||||||
Genomic Health, Inc.(a) | 100 | 3,520 | ||||||
Geron Corp.(a) | 1,183 | 5,726 | ||||||
Global Blood Therapeutics, Inc.(a) | 38 | 1,228 | ||||||
Halozyme Therapeutics, Inc.(a) | 752 | 13,032 | ||||||
Heron Therapeutics, Inc.(a) | 217 | 5,794 | ||||||
See accompanying notes to financial statements.
53
Table of Contents
State Street Small/Mid Cap Equity Index Portfolio
Schedule of Investments — (continued)
December 31, 2015
Security Description | Shares | Value | ||||||
COMMON STOCKS – (continued) | ||||||||
Biotechnology – (continued) | ||||||||
Idera Pharmaceuticals, Inc.(a) | 600 | $ | 1,854 | |||||
Ignyta, Inc.(a) | 100 | 1,340 | ||||||
Immune Design Corp.(a) | 100 | 2,008 | ||||||
ImmunoGen, Inc.(a) | 600 | 8,142 | ||||||
Immunomedics, Inc.(a) | 500 | 1,535 | ||||||
Incyte Corp.(a) | 1,062 | 115,174 | ||||||
Infinity Pharmaceuticals, Inc.(a) | 300 | 2,355 | ||||||
Inovio Pharmaceuticals, Inc.(a) | 400 | 2,688 | ||||||
Insmed, Inc.(a) | 400 | 7,260 | ||||||
Insys Therapeutics, Inc.(a) | 153 | 4,380 | ||||||
Intercept Pharmaceuticals, Inc.(a) | 111 | 16,578 | ||||||
Intrexon Corp.(a) | 341 | 10,281 | ||||||
Ionis Pharmaceuticals, Inc.(a) | 853 | 52,826 | ||||||
Ironwood Pharmaceuticals, Inc.(a) | 900 | 10,431 | ||||||
Juno Therapeutics, Inc.(a) | 100 | 4,397 | ||||||
Karyopharm Therapeutics, Inc.(a) | 100 | 1,325 | ||||||
Keryx Biopharmaceuticals, Inc.(a) | 803 | 4,055 | ||||||
Kite Pharma, Inc.(a) | 188 | 11,585 | ||||||
La Jolla Pharmaceutical Co.(a) | 100 | 2,700 | ||||||
Lexicon Pharmaceuticals, Inc.(a) | 321 | 4,272 | ||||||
Ligand Pharmaceuticals, Inc.(a) | 124 | 13,444 | ||||||
Lion Biotechnologies, Inc.(a) | 200 | 1,544 | ||||||
Loxo Oncology, Inc.(a) | 77 | 2,191 | ||||||
MacroGenics, Inc.(a) | 200 | 6,194 | ||||||
MannKind Corp.(a) | 1,300 | 1,885 | ||||||
Medivation, Inc.(a) | 1,075 | 51,965 | ||||||
Merrimack Pharmaceuticals, Inc.(a) | 805 | 6,359 | ||||||
MiMedx Group, Inc.(a) | 793 | 7,430 | ||||||
Mirati Therapeutics, Inc.(a) | 100 | 3,160 | ||||||
Momenta Pharmaceuticals, Inc.(a) | 400 | 5,936 | ||||||
Myriad Genetics, Inc.(a) | 451 | 19,465 | ||||||
Navidea Biopharmaceuticals, Inc.(a) | 800 | 1,064 | ||||||
Neurocrine Biosciences, Inc.(a) | 588 | 33,263 | ||||||
NewLink Genetics Corp.(a) | 158 | 5,750 | ||||||
Northwest Biotherapeutics, Inc.(a) | 200 | 640 | ||||||
Novavax, Inc.(a) | 1,800 | 15,102 | ||||||
Ocata Therapeutics, Inc.(a) | 300 | 2,526 | ||||||
OncoMed Pharmaceuticals, Inc.(a) | 100 | 2,254 | ||||||
Oncothyreon, Inc.(a) | 500 | 1,110 | ||||||
Ophthotech Corp.(a) | 154 | 12,094 | ||||||
OPKO Health, Inc.(a) | 2,023 | 20,331 | ||||||
Orexigen Therapeutics, Inc.(a) | 500 | 860 | ||||||
Organovo Holdings, Inc.(a) | 500 | 1,245 | ||||||
Osiris Therapeutics, Inc. | 100 | 1,038 | ||||||
Otonomy, Inc.(a) | 100 | 2,775 | ||||||
OvaScience, Inc.(a) | 100 | 977 | ||||||
PDL BioPharma, Inc. | 1,255 | 4,443 | ||||||
Peregrine Pharmaceuticals, Inc.(a) | 1,500 | 1,755 | ||||||
Pfenex, Inc.(a) | 100 | 1,238 | ||||||
Portola Pharmaceuticals, Inc.(a) | 341 | 17,544 | ||||||
Progenics Pharmaceuticals, Inc.(a) | 400 | 2,452 | ||||||
Prothena Corp. PLC(a) | 200 | 13,622 | ||||||
PTC Therapeutics, Inc.(a) | 200 | 6,480 | ||||||
Puma Biotechnology, Inc.(a) | 162 | 12,701 | ||||||
Radius Health, Inc.(a) | 215 | 13,231 | ||||||
Raptor Pharmaceutical Corp.(a) | 400 | 2,080 | ||||||
Regulus Therapeutics, Inc.(a) | 300 | 2,616 | ||||||
Repligen Corp.(a) | 200 | 5,658 | ||||||
Retrophin, Inc.(a) | 200 | 3,858 | ||||||
Rigel Pharmaceuticals, Inc.(a) | 700 | 2,121 | ||||||
Sage Therapeutics, Inc.(a) | 100 | 5,830 | ||||||
Sangamo BioSciences, Inc.(a) | 400 | 3,652 | ||||||
Sarepta Therapeutics, Inc.(a) | 300 | 11,574 | ||||||
Seattle Genetics, Inc.(a) | 700 | 31,416 | ||||||
Seres Therapeutics, Inc.(a) | 46 | 1,614 | ||||||
Sorrento Therapeutics, Inc.(a) | 100 | 871 | ||||||
Spark Therapeutics, Inc.(a) | 42 | 1,903 | ||||||
Spectrum Pharmaceuticals, Inc.(a) | 300 | 1,809 | ||||||
Synergy Pharmaceuticals, Inc.(a) | 500 | 2,835 | ||||||
TESARO, Inc.(a) | 149 | 7,796 | ||||||
TG Therapeutics, Inc.(a) | 200 | 2,386 | ||||||
Threshold Pharmaceuticals, Inc.(a) | 300 | 144 | ||||||
Trevena, Inc.(a) | 200 | 2,100 | ||||||
Trovagene, Inc.(a) | 200 | 1,080 | ||||||
Ultragenyx Pharmaceutical, Inc.(a) | 265 | 29,728 | ||||||
United Therapeutics Corp.(a) | 316 | 49,489 | ||||||
Vanda Pharmaceuticals, Inc.(a) | 200 | 1,862 | ||||||
Verastem, Inc.(a) | 200 | 372 | ||||||
Versartis, Inc.(a) | 100 | 1,239 | ||||||
Vitae Pharmaceuticals, Inc.(a) | 130 | 2,353 | ||||||
Vital Therapies, Inc.(a) | 100 | 1,152 | ||||||
Xencor, Inc.(a) | 185 | 2,705 | ||||||
Zafgen, Inc.(a) | 100 | 629 | ||||||
ZIOPHARM Oncology, Inc.(a) | 800 | 6,648 | ||||||
|
| |||||||
| 1,360,566 | ||||||||
|
| |||||||
Building Products – 1.1% | ||||||||
AAON, Inc. | 300 | 6,966 | ||||||
Advanced Drainage Systems, Inc. | 200 | 4,806 | ||||||
American Woodmark Corp.(a) | 83 | 6,638 | ||||||
AO Smith Corp. | 509 | 38,995 | ||||||
Apogee Enterprises, Inc. | 209 | 9,094 | ||||||
Armstrong World Industries, Inc.(a) | 255 | 11,661 | ||||||
Builders FirstSource, Inc.(a) | 400 | 4,432 | ||||||
Continental Building Products, Inc.(a) | 200 | 3,492 | ||||||
Fortune Brands Home & Security, Inc. | 1,087 | 60,329 | ||||||
Gibraltar Industries, Inc.(a) | 200 | 5,088 | ||||||
Griffon Corp. | 200 | 3,560 | ||||||
Insteel Industries, Inc. | 100 | 2,092 | ||||||
Lennox International, Inc. | 278 | 34,722 | ||||||
Masonite International Corp.(a) | 200 | 12,246 | ||||||
NCI Building Systems, Inc.(a) | 228 | 2,830 | ||||||
Nortek, Inc.(a) | 50 | 2,181 | ||||||
Owens Corning | 809 | 38,047 | ||||||
Patrick Industries, Inc.(a) | 100 | 4,350 | ||||||
PGT, Inc.(a) | 400 | 4,556 | ||||||
Ply Gem Holdings, Inc.(a) | 100 | 1,254 | ||||||
Quanex Building Products Corp. | 200 | 4,170 | ||||||
Simpson Manufacturing Co., Inc. | 300 | 10,245 | ||||||
Trex Co., Inc.(a) | 200 | 7,608 | ||||||
Universal Forest Products, Inc. | 131 | 8,956 | ||||||
USG Corp.(a) | 600 | 14,574 | ||||||
|
| |||||||
| 302,892 | ||||||||
|
| |||||||
Capital Markets – 1.7% | ||||||||
Arlington Asset Investment Corp. Class A | 100 | 1,323 | ||||||
Artisan Partners Asset Management, Inc. Class A | 255 | 9,195 | ||||||
Associated Capital Group, Inc. Class A(a) | 33 | 1,007 | ||||||
See accompanying notes to financial statements.
54
Table of Contents
State Street Small/Mid Cap Equity Index Portfolio
Schedule of Investments — (continued)
December 31, 2015
Security Description | Shares | Value | ||||||
COMMON STOCKS – (continued) | ||||||||
Capital Markets – (continued) | ||||||||
BGC Partners, Inc. Class A | 1,200 | $ | 11,772 | |||||
Calamos Asset Management, Inc. Class A | 100 | 968 | ||||||
Cohen & Steers, Inc. | 155 | 4,724 | ||||||
Cowen Group, Inc. Class A(a) | 600 | 2,298 | ||||||
Diamond Hill Investment Group, Inc. | 16 | 3,024 | ||||||
Eaton Vance Corp. | 800 | 25,944 | ||||||
Evercore Partners, Inc. Class A | 243 | 13,139 | ||||||
Federated Investors, Inc. Class B | 600 | 17,190 | ||||||
Financial Engines, Inc. | 366 | 12,323 | ||||||
GAMCO Investors, Inc. Class A | 33 | 1,024 | ||||||
Greenhill & Co., Inc. | 217 | 6,208 | ||||||
HFF, Inc. Class A | 246 | 7,643 | ||||||
Houlihan Lokey, Inc. | 100 | 2,621 | ||||||
Interactive Brokers Group, Inc. Class A | 400 | 17,440 | ||||||
INTL. FCStone, Inc.(a) | 100 | 3,346 | ||||||
Investment Technology Group, Inc. | 200 | 3,404 | ||||||
Janus Capital Group, Inc. | 1,000 | 14,090 | ||||||
KCG Holdings, Inc. Class A(a) | 200 | 2,462 | ||||||
Ladenburg Thalmann Financial Services, Inc.(a) | 500 | 1,380 | ||||||
Lazard, Ltd. Class A | 863 | 38,844 | ||||||
LPL Financial Holdings, Inc. | 550 | 23,458 | ||||||
Moelis & Co. Class A | 100 | 2,918 | ||||||
NorthStar Asset Management Group, Inc. | 1,300 | 15,782 | ||||||
OM Asset Management PLC | 100 | 1,533 | ||||||
Oppenheimer Holdings, Inc. Class A | 100 | 1,738 | ||||||
Piper Jaffray Cos.(a) | 100 | 4,040 | ||||||
Raymond James Financial, Inc. | 900 | 52,173 | ||||||
Safeguard Scientifics, Inc.(a) | 100 | 1,451 | ||||||
SEI Investments Co. | 952 | 49,885 | ||||||
Stifel Financial Corp.(a) | 454 | 19,231 | ||||||
TD Ameritrade Holding Corp. | 1,811 | 62,860 | ||||||
Virtu Financial, Inc. Class A | 100 | 2,264 | ||||||
Virtus Investment Partners, Inc. | 50 | 5,873 | ||||||
Waddell & Reed Financial, Inc. Class A | 539 | 15,448 | ||||||
Westwood Holdings Group, Inc. | 40 | 2,084 | ||||||
WisdomTree Investments, Inc. | 800 | 12,544 | ||||||
|
| |||||||
| 474,651 | ||||||||
|
| |||||||
Chemicals – 2.2% | ||||||||
A Schulman, Inc. | 190 | 5,822 | ||||||
Albemarle Corp. | 800 | 44,808 | ||||||
American Vanguard Corp. | 152 | 2,130 | ||||||
Ashland, Inc. | 432 | 44,366 | ||||||
Axalta Coating Systems, Ltd.(a) | 700 | 18,655 | ||||||
Axiall Corp. | 501 | 7,715 | ||||||
Balchem Corp. | 200 | 12,160 | ||||||
Cabot Corp. | 440 | 17,987 | ||||||
Calgon Carbon Corp. | 300 | 5,175 | ||||||
Celanese Corp. Series A | 1,044 | 70,293 | ||||||
Chase Corp. | 37 | 1,507 | ||||||
Chemours Co. | 1,300 | 6,968 | ||||||
Chemtura Corp.(a) | 471 | 12,844 | ||||||
Ferro Corp.(a) | 542 | 6,027 | ||||||
Flotek Industries, Inc.(a) | 300 | 3,432 | ||||||
FutureFuel Corp. | 200 | 2,700 | ||||||
Hawkins, Inc. | 100 | 3,577 | ||||||
HB Fuller Co. | 354 | 12,910 | ||||||
Huntsman Corp. | 1,400 | 15,918 | ||||||
Innophos Holdings, Inc. | 100 | 2,898 | ||||||
Innospec, Inc. | 174 | 9,450 | ||||||
Intrepid Potash, Inc.(a) | 300 | 885 | ||||||
KMG Chemicals, Inc. | 100 | 2,302 | ||||||
Koppers Holdings, Inc. | 100 | 1,825 | ||||||
Kraton Performance Polymers, Inc.(a) | 200 | 3,322 | ||||||
LSB Industries, Inc.(a) | 100 | 725 | ||||||
Minerals Technologies, Inc. | 243 | 11,144 | ||||||
NewMarket Corp. | 55 | 20,940 | ||||||
Olin Corp. | 1,100 | 18,986 | ||||||
OMNOVA Solutions, Inc.(a) | 200 | 1,226 | ||||||
Platform Specialty Products Corp.(a) | 900 | 11,547 | ||||||
PolyOne Corp. | 600 | 19,056 | ||||||
Quaker Chemical Corp. | 100 | 7,726 | ||||||
Rayonier Advanced Materials, Inc. | 200 | 1,958 | ||||||
RPM International, Inc. | 913 | 40,227 | ||||||
Scotts Miracle-Gro Co. Class A | 293 | 18,902 | ||||||
Senomyx, Inc.(a) | 200 | 754 | ||||||
Sensient Technologies Corp. | 304 | 19,097 | ||||||
Stepan Co. | 142 | 7,056 | ||||||
Trecora Resources(a) | 100 | 1,239 | ||||||
Tredegar Corp. | 207 | 2,819 | ||||||
Trinseo SA(a) | 100 | 2,820 | ||||||
Tronox, Ltd. Class A | 300 | 1,173 | ||||||
Valspar Corp. | 556 | 46,120 | ||||||
Westlake Chemical Corp. | 280 | 15,210 | ||||||
WR Grace & Co.(a) | 497 | 49,496 | ||||||
|
| |||||||
| 613,897 | ||||||||
|
| |||||||
Commercial Services & Supplies – 1.5% |
| |||||||
ABM Industries, Inc. | 400 | 11,388 | ||||||
ACCO Brands Corp.(a) | 816 | 5,818 | ||||||
ARC Document Solutions, Inc.(a) | 200 | 884 | ||||||
Brady Corp. Class A | 300 | 6,894 | ||||||
Brink’s Co. | 354 | 10,216 | ||||||
Casella Waste Systems, Inc. Class A(a) | 200 | 1,196 | ||||||
CECO Environmental Corp. | 156 | 1,198 | ||||||
Civeo Corp. | 600 | 852 | ||||||
Clean Harbors, Inc.(a) | 400 | 16,660 | ||||||
Copart, Inc.(a) | 860 | 32,689 | ||||||
Covanta Holding Corp. | 800 | 12,392 | ||||||
Deluxe Corp. | 345 | 18,816 | ||||||
Ennis, Inc. | 200 | 3,850 | ||||||
Essendant, Inc. | 249 | 8,095 | ||||||
G&K Services, Inc. Class A | 130 | 8,177 | ||||||
Healthcare Services Group, Inc. | 465 | 16,215 | ||||||
Heritage-Crystal Clean, Inc.(a) | 100 | 1,060 | ||||||
Herman Miller, Inc. | 400 | 11,480 | ||||||
HNI Corp. | 289 | 10,421 | ||||||
InnerWorkings, Inc.(a) | 200 | 1,500 | ||||||
Interface, Inc. | 400 | 7,656 | ||||||
KAR Auction Services, Inc. | 973 | 36,030 | ||||||
Kimball International, Inc. Class B | 200 | 1,954 | ||||||
Knoll, Inc. | 300 | 5,640 | ||||||
Matthews International Corp. Class A | 231 | 12,347 | ||||||
McGrath RentCorp | 200 | 5,038 | ||||||
Mobile Mini, Inc. | 300 | 9,339 | ||||||
MSA Safety, Inc. | 211 | 9,172 | ||||||
Multi-Color Corp. | 100 | 5,981 | ||||||
See accompanying notes to financial statements.
55
Table of Contents
State Street Small/Mid Cap Equity Index Portfolio
Schedule of Investments — (continued)
December 31, 2015
Security Description | Shares | Value | ||||||
COMMON STOCKS – (continued) | ||||||||
Commercial Services & Supplies – (continued) |
| |||||||
Quad/Graphics, Inc. | 100 | $ | 930 | |||||
Rollins, Inc. | 663 | 17,172 | ||||||
RR Donnelley & Sons Co. | 1,400 | 20,608 | ||||||
SP Plus Corp.(a) | 100 | 2,390 | ||||||
Steelcase, Inc. Class A | 600 | 8,940 | ||||||
Team, Inc.(a) | 157 | 5,018 | ||||||
Tetra Tech, Inc. | 400 | 10,408 | ||||||
TRC Cos., Inc.(a) | 100 | 925 | ||||||
UniFirst Corp. | 100 | 10,420 | ||||||
US Ecology, Inc. | 141 | 5,138 | ||||||
Viad Corp. | 154 | 4,347 | ||||||
Waste Connections, Inc. | 847 | 47,703 | ||||||
West Corp. | 373 | 8,046 | ||||||
|
| |||||||
| 415,003 | ||||||||
|
| |||||||
Communications Equipment – 1.4% |
| |||||||
ADTRAN, Inc. | 300 | 5,166 | ||||||
Alliance Fiber Optic Products, Inc. | 100 | 1,516 | ||||||
Applied Optoelectronics, Inc.(a) | 100 | 1,716 | ||||||
Arista Networks, Inc.(a) | 235 | 18,292 | ||||||
ARRIS Group, Inc.(a) | 1,200 | 36,684 | ||||||
Bel Fuse, Inc. Class B | 100 | 1,729 | ||||||
Black Box Corp. | 100 | 953 | ||||||
Brocade Communications Systems, Inc. | 2,800 | 25,704 | ||||||
CalAmp Corp.(a) | 200 | 3,986 | ||||||
Calix, Inc.(a) | 200 | 1,574 | ||||||
Ciena Corp.(a) | 800 | 16,552 | ||||||
Clearfield, Inc.(a) | 100 | 1,341 | ||||||
CommScope Holding Co., Inc.(a) | 726 | 18,796 | ||||||
Comtech Telecommunications Corp. | 100 | 2,009 | ||||||
Digi International, Inc.(a) | 200 | 2,276 | ||||||
EchoStar Corp. Class A(a) | 287 | 11,225 | ||||||
Extreme Networks, Inc.(a) | 500 | 2,040 | ||||||
Finisar Corp.(a) | 700 | 10,178 | ||||||
Harmonic, Inc.(a) | 500 | 2,035 | ||||||
Infinera Corp.(a) | 900 | 16,308 | ||||||
InterDigital, Inc. | 300 | 14,712 | ||||||
Ixia(a) | 400 | 4,972 | ||||||
KVH Industries, Inc.(a) | 166 | 1,564 | ||||||
Lumentum Holdings, Inc.(a) | 300 | 6,606 | ||||||
NETGEAR, Inc.(a) | 200 | 8,382 | ||||||
NetScout Systems, Inc.(a) | 600 | 18,420 | ||||||
Oclaro, Inc.(a) | 500 | 1,740 | ||||||
Palo Alto Networks, Inc.(a) | 493 | 86,837 | ||||||
Plantronics, Inc. | 248 | 11,760 | ||||||
Polycom, Inc.(a) | 900 | 11,331 | ||||||
Ruckus Wireless, Inc.(a) | 559 | 5,987 | ||||||
ShoreTel, Inc.(a) | 490 | 4,336 | ||||||
Sonus Networks, Inc.(a) | 300 | 2,139 | ||||||
Ubiquiti Networks, Inc.(a) | 200 | 6,338 | ||||||
ViaSat, Inc.(a) | 276 | 16,839 | ||||||
Viavi Solutions, Inc.(a) | 1,600 | 9,744 | ||||||
|
| |||||||
| 391,787 | ||||||||
|
| |||||||
Construction & Engineering – 0.5% |
| |||||||
AECOM(a) | 1,000 | 30,030 | ||||||
Aegion Corp.(a) | 200 | 3,862 | ||||||
Argan, Inc. | 100 | 3,240 | ||||||
Chicago Bridge & Iron Co. NV | 657 | 25,616 | ||||||
Comfort Systems USA, Inc. | 243 | 6,906 | ||||||
Dycom Industries, Inc.(a) | 235 | 16,441 | ||||||
EMCOR Group, Inc. | 407 | 19,552 | ||||||
Furmanite Corp.(a) | 200 | 1,332 | ||||||
Granite Construction, Inc. | 256 | 10,985 | ||||||
Great Lakes Dredge & Dock Corp.(a) | 300 | 1,188 | ||||||
KBR, Inc. | 1,000 | 16,920 | ||||||
MasTec, Inc.(a) | 400 | 6,952 | ||||||
MYR Group, Inc.(a) | 100 | 2,061 | ||||||
Primoris Services Corp. | 286 | 6,301 | ||||||
Tutor Perini Corp.(a) | 200 | 3,348 | ||||||
|
| |||||||
| 154,734 | ||||||||
|
| |||||||
Construction Materials – 0.1% |
| |||||||
Eagle Materials, Inc. | 345 | 20,849 | ||||||
Headwaters, Inc.(a) | 500 | 8,435 | ||||||
Summit Materials, Inc. Class A(a) | 203 | 4,068 | ||||||
US Concrete, Inc.(a) | 100 | 5,266 | ||||||
|
| |||||||
| 38,618 | ||||||||
|
| |||||||
Consumer Finance – 0.6% | ||||||||
Ally Financial, Inc.(a) | 3,230 | 60,207 | ||||||
Cash America International, Inc. | 200 | 5,990 | ||||||
Credit Acceptance Corp.(a) | 55 | 11,771 | ||||||
Encore Capital Group, Inc.(a) | 192 | 5,583 | ||||||
Enova International, Inc.(a) | 100 | 661 | ||||||
EZCORP, Inc. Class A(a) | 300 | 1,497 | ||||||
First Cash Financial Services, Inc.(a) | 206 | 7,711 | ||||||
Green Dot Corp. Class A(a) | 300 | 4,926 | ||||||
LendingClub Corp.(a) | 500 | 5,525 | ||||||
Nelnet, Inc. Class A | 154 | 5,170 | ||||||
OneMain Holdings, Inc.(a) | 362 | 15,037 | ||||||
PRA Group, Inc.(a) | 314 | 10,893 | ||||||
Regional Management Corp.(a) | 100 | 1,547 | ||||||
Santander Consumer USA Holdings, Inc.(a) | 600 | 9,510 | ||||||
SLM Corp.(a) | 2,800 | 18,256 | ||||||
World Acceptance Corp.(a) | 37 | 1,373 | ||||||
|
| |||||||
| 165,657 | ||||||||
|
| |||||||
Containers & Packaging – 0.9% |
| |||||||
AEP Industries, Inc.(a) | 21 | 1,620 | ||||||
AptarGroup, Inc. | 431 | 31,312 | ||||||
Bemis Co., Inc. | 655 | 29,272 | ||||||
Berry Plastics Group, Inc.(a) | 822 | 29,740 | ||||||
Crown Holdings, Inc.(a) | 952 | 48,266 | ||||||
Graphic Packaging Holding Co. | 2,200 | 28,226 | ||||||
Greif, Inc. Class A | 200 | 6,162 | ||||||
Multi Packaging Solutions International, Ltd.(a) | 100 | 1,735 | ||||||
Myers Industries, Inc. | 100 | 1,332 | ||||||
Packaging Corp. of America | 670 | 42,244 | ||||||
Silgan Holdings, Inc. | 284 | 15,256 | ||||||
Sonoco Products Co. | 695 | 28,405 | ||||||
|
| |||||||
| 263,570 | ||||||||
|
| |||||||
Distributors – 0.3% | ||||||||
Core-Mark Holding Co., Inc. | 162 | 13,274 | ||||||
LKQ Corp.(a) | 2,077 | 61,541 | ||||||
Pool Corp. | 282 | 22,780 | ||||||
Weyco Group, Inc. | 43 | 1,151 | ||||||
|
| |||||||
| 98,746 | ||||||||
|
| |||||||
See accompanying notes to financial statements.
56
Table of Contents
State Street Small/Mid Cap Equity Index Portfolio
Schedule of Investments — (continued)
December 31, 2015
Security Description | Shares | Value | ||||||
COMMON STOCKS – (continued) | ||||||||
Diversified Consumer Services – 0.7% |
| |||||||
2U, Inc.(a) | 205 | $ | 5,736 | |||||
American Public Education, Inc.(a) | 100 | 1,861 | ||||||
Apollo Education Group, Inc.(a) | 704 | 5,400 | ||||||
Ascent Capital Group, Inc. Class A(a) | 100 | 1,672 | ||||||
Bright Horizons Family Solutions, Inc.(a) | 242 | 16,166 | ||||||
Capella Education Co. | 100 | 4,622 | ||||||
Career Education Corp.(a) | 300 | 1,089 | ||||||
Carriage Services, Inc. | 100 | 2,410 | ||||||
Chegg, Inc.(a) | 400 | 2,692 | ||||||
DeVry Education Group, Inc. | 400 | 10,124 | ||||||
Graham Holdings Co. Class B | 23 | 11,154 | ||||||
Grand Canyon Education, Inc.(a) | 306 | 12,277 | ||||||
Houghton Mifflin Harcourt Co.(a) | 900 | 19,602 | ||||||
K12, Inc.(a) | 200 | 1,760 | ||||||
LifeLock, Inc.(a) | 600 | 8,610 | ||||||
Regis Corp.(a) | 307 | 4,344 | ||||||
Service Corp. International | 1,354 | 35,231 | ||||||
ServiceMaster Global Holdings, Inc.(a) | 668 | 26,212 | ||||||
Sotheby’s | 400 | 10,304 | ||||||
Strayer Education, Inc.(a) | 71 | 4,268 | ||||||
Weight Watchers International, Inc.(a) | 200 | 4,560 | ||||||
|
| |||||||
| 190,094 | ||||||||
|
| |||||||
Diversified Financial Services – 0.8% |
| |||||||
CBOE Holdings, Inc. | 572 | 37,123 | ||||||
FactSet Research Systems, Inc. | 286 | 46,495 | ||||||
FNFV Group(a) | 600 | 6,738 | ||||||
GAIN Capital Holdings, Inc. | 200 | 1,622 | ||||||
MarketAxess Holdings, Inc. | 257 | 28,679 | ||||||
Morningstar, Inc. | 136 | 10,936 | ||||||
MSCI, Inc. | 701 | 50,563 | ||||||
NewStar Financial, Inc.(a) | 100 | 898 | ||||||
PICO Holdings, Inc.(a) | 100 | 1,032 | ||||||
Tiptree Financial, Inc. Class A | 200 | 1,228 | ||||||
Voya Financial, Inc. | 1,450 | 53,519 | ||||||
|
| |||||||
| 238,833 | ||||||||
|
| |||||||
Diversified Telecommunication Services – 0.4% |
| |||||||
8x8, Inc.(a) | 600 | 6,870 | ||||||
Atlantic Tele-Network, Inc. | 67 | 5,241 | ||||||
Cincinnati Bell, Inc.(a) | 1,569 | 5,648 | ||||||
Cogent Communications Holdings, Inc. | 300 | 10,407 | ||||||
Consolidated Communications Holdings, Inc. | 300 | 6,285 | ||||||
FairPoint Communications, Inc.(a) | 100 | 1,607 | ||||||
General Communication, Inc. Class A(a) | 200 | 3,956 | ||||||
Globalstar, Inc.(a) | 3,400 | 4,896 | ||||||
Hawaiian Telcom Holdco, Inc.(a) | 100 | 2,486 | ||||||
IDT Corp. Class B | 100 | 1,166 | ||||||
inContact, Inc.(a) | 473 | 4,512 | ||||||
Inteliquent, Inc. | 200 | 3,554 | ||||||
Intelsat SA(a) | 147 | 612 | ||||||
Iridium Communications, Inc.(a) | 619 | 5,206 | ||||||
Lumos Networks Corp. | 100 | 1,120 | ||||||
ORBCOMM, Inc.(a) | 300 | 2,172 | ||||||
pdvWireless, Inc.(a) | 100 | 2,750 | ||||||
Straight Path Communications, Inc. Class B(a) | 100 | 1,714 | ||||||
Vonage Holdings Corp.(a) | 1,300 | 7,462 | ||||||
Windstream Holdings, Inc. | 758 | 4,882 | ||||||
Zayo Group Holdings, Inc.(a) | 933 | 24,809 | ||||||
|
| |||||||
| 107,355 | ||||||||
|
| |||||||
Electric Utilities – 1.1% | ||||||||
ALLETE, Inc. | 317 | 16,113 | ||||||
Avangrid, Inc.(a) | 400 | 15,360 | ||||||
Cleco Corp. | 393 | 20,519 | ||||||
El Paso Electric Co. | 263 | 10,125 | ||||||
Empire District Electric Co. | 300 | 8,421 | ||||||
Great Plains Energy, Inc. | 1,063 | 29,031 | ||||||
Hawaiian Electric Industries, Inc. | 698 | 20,207 | ||||||
IDACORP, Inc. | 327 | 22,236 | ||||||
ITC Holdings Corp. | 1,063 | 41,723 | ||||||
MGE Energy, Inc. | 246 | 11,414 | ||||||
OGE Energy Corp. | 1,369 | 35,991 | ||||||
Otter Tail Corp. | 276 | 7,350 | ||||||
PNM Resources, Inc. | 556 | 16,997 | ||||||
Portland General Electric Co. | 600 | 21,822 | ||||||
Unitil Corp. | 100 | 3,588 | ||||||
Westar Energy, Inc. | 967 | 41,010 | ||||||
|
| |||||||
| 321,907 | ||||||||
|
| |||||||
Electrical Equipment – 0.8% | ||||||||
Acuity Brands, Inc. | 296 | 69,205 | ||||||
Allied Motion Technologies, Inc. | 62 | 1,623 | ||||||
AZZ, Inc. | 184 | 10,225 | ||||||
Babcock & Wilcox Enterprises, Inc.(a) | 387 | 8,077 | ||||||
Encore Wire Corp. | 154 | 5,712 | ||||||
EnerSys | 289 | 16,164 | ||||||
Franklin Electric Co., Inc. | 349 | 9,433 | ||||||
FuelCell Energy, Inc.(a) | 116 | 575 | ||||||
Generac Holdings, Inc.(a) | 449 | 13,367 | ||||||
General Cable Corp. | 400 | 5,372 | ||||||
Hubbell, Inc. | 395 | 39,911 | ||||||
LSI Industries, Inc. | 200 | 2,438 | ||||||
Plug Power, Inc.(a) | 900 | 1,899 | ||||||
Powell Industries, Inc. | 100 | 2,603 | ||||||
PowerSecure International, Inc.(a) | 100 | 1,505 | ||||||
Regal Beloit Corp. | 291 | 17,029 | ||||||
SolarCity Corp.(a) | 400 | 20,408 | ||||||
Sunrun, Inc.(a) | 100 | 1,177 | ||||||
Thermon Group Holdings, Inc.(a) | 200 | 3,384 | ||||||
Vicor Corp.(a) | 170 | 1,550 | ||||||
|
| |||||||
| 231,657 | ||||||||
|
| |||||||
Electronic Equipment, Instruments & Components – 2.3% |
| |||||||
Agilysys, Inc.(a) | 157 | 1,568 | ||||||
Anixter International, Inc.(a) | 186 | 11,233 | ||||||
Arrow Electronics, Inc.(a) | 639 | 34,621 | ||||||
Avnet, Inc. | 930 | 39,841 | ||||||
AVX Corp. | 300 | 3,642 | ||||||
Badger Meter, Inc. | 100 | 5,859 | ||||||
Belden, Inc. | 276 | 13,160 | ||||||
Benchmark Electronics, Inc.(a) | 380 | 7,855 | ||||||
CDW Corp. | 904 | 38,004 | ||||||
Checkpoint Systems, Inc. | 200 | 1,254 | ||||||
Cognex Corp. | 566 | 19,114 | ||||||
Coherent, Inc.(a) | 170 | 11,069 | ||||||
Control4 Corp.(a) | 212 | 1,541 | ||||||
CTS Corp. | 200 | 3,528 | ||||||
Daktronics, Inc. | 200 | 1,744 | ||||||
See accompanying notes to financial statements.
57
Table of Contents
State Street Small/Mid Cap Equity Index Portfolio
Schedule of Investments — (continued)
December 31, 2015
Security Description | Shares | Value | ||||||
COMMON STOCKS – (continued) | ||||||||
Electronic Equipment, Instruments & Components – (continued) |
| |||||||
Dolby Laboratories, Inc. Class A | 351 | $ | 11,811 | |||||
DTS, Inc.(a) | 100 | 2,258 | ||||||
Electro Rent Corp. | 171 | 1,573 | ||||||
ePlus, Inc.(a) | 29 | 2,705 | ||||||
Fabrinet(a) | 200 | 4,764 | ||||||
FARO Technologies, Inc.(a) | 100 | 2,952 | ||||||
FEI Co. | 269 | 21,463 | ||||||
Fitbit, Inc. Class A(a) | 300 | 8,877 | ||||||
GSI Group, Inc.(a) | 200 | 2,724 | ||||||
II-VI, Inc.(a) | 384 | 7,127 | ||||||
Ingram Micro, Inc. Class A | 1,073 | 32,598 | ||||||
Insight Enterprises, Inc.(a) | 252 | 6,330 | ||||||
InvenSense, Inc.(a) | 575 | 5,882 | ||||||
IPG Photonics Corp.(a) | 225 | 20,061 | ||||||
Itron, Inc.(a) | 250 | 9,045 | ||||||
Jabil Circuit, Inc. | 1,300 | 30,277 | ||||||
Keysight Technologies, Inc.(a) | 1,161 | 32,891 | ||||||
Kimball Electronics, Inc.(a) | 244 | 2,682 | ||||||
Knowles Corp.(a) | 568 | 7,571 | ||||||
Littelfuse, Inc. | 146 | 15,623 | ||||||
Mercury Systems, Inc.(a) | 200 | 3,672 | ||||||
Mesa Laboratories, Inc. | 15 | 1,492 | ||||||
Methode Electronics, Inc. | 249 | 7,926 | ||||||
MTS Systems Corp. | 100 | 6,341 | ||||||
Multi-Fineline Electronix, Inc.(a) | 92 | 1,903 | ||||||
National Instruments Corp. | 772 | 22,149 | ||||||
Newport Corp.(a) | 303 | 4,809 | ||||||
OSI Systems, Inc.(a) | 129 | 11,437 | ||||||
Park Electrochemical Corp. | 100 | 1,506 | ||||||
PC Connection, Inc. | 100 | 2,264 | ||||||
Plexus Corp.(a) | 200 | 6,984 | ||||||
RealD, Inc.(a) | 200 | 2,110 | ||||||
Rofin-Sinar Technologies, Inc.(a) | 200 | 5,356 | ||||||
Rogers Corp.(a) | 136 | 7,013 | ||||||
Sanmina Corp.(a) | 510 | 10,496 | ||||||
ScanSource, Inc.(a) | 209 | 6,734 | ||||||
SYNNEX Corp. | 186 | 16,727 | ||||||
Tech Data Corp.(a) | 239 | 15,865 | ||||||
Trimble Navigation, Ltd.(a) | 1,778 | 38,138 | ||||||
TTM Technologies, Inc.(a) | 300 | 1,953 | ||||||
Universal Display Corp.(a) | 261 | 14,209 | ||||||
Vishay Intertechnology, Inc. | 900 | 10,845 | ||||||
Vishay Precision Group, Inc.(a) | 100 | 1,132 | ||||||
Zebra Technologies Corp. Class A(a) | 337 | 23,472 | ||||||
|
| |||||||
| 647,780 | ||||||||
|
| |||||||
Energy Equipment & Services – 1.0% |
| |||||||
Archrock, Inc. | 400 | 3,008 | ||||||
Atwood Oceanics, Inc. | 500 | 5,115 | ||||||
Basic Energy Services, Inc.(a) | 200 | 536 | ||||||
Bristow Group, Inc. | 200 | 5,180 | ||||||
C&J Energy Services, Ltd.(a) | 300 | 1,428 | ||||||
CARBO Ceramics, Inc. | 100 | 1,720 | ||||||
Dril-Quip, Inc.(a) | 253 | 14,985 | ||||||
Era Group, Inc.(a) | 100 | 1,115 | ||||||
Exterran Corp.(a) | 200 | 3,210 | ||||||
Fairmount Santrol Holdings, Inc.(a) | 300 | 705 | ||||||
Forum Energy Technologies, Inc.(a) | 439 | 5,470 | ||||||
Frank’s International NV | 200 | 3,338 | ||||||
Geospace Technologies Corp.(a) | 100 | 1,407 | ||||||
Gulfmark Offshore, Inc. Class A | 200 | 934 | ||||||
Helix Energy Solutions Group, Inc.(a) | 809 | 4,255 | ||||||
Hornbeck Offshore Services, Inc.(a) | 200 | 1,988 | ||||||
Matrix Service Co.(a) | 200 | 4,108 | ||||||
McDermott International, Inc.(a) | 1,700 | 5,695 | ||||||
Nabors Industries, Ltd. | 2,187 | 18,611 | ||||||
Natural Gas Services Group, Inc.(a) | 100 | 2,230 | ||||||
Newpark Resources, Inc.(a) | 400 | 2,112 | ||||||
Noble Corp. PLC | 1,600 | 16,880 | ||||||
Oceaneering International, Inc. | 681 | 25,551 | ||||||
Oil States International, Inc.(a) | 367 | 10,001 | ||||||
Parker Drilling Co.(a) | 600 | 1,092 | ||||||
Patterson-UTI Energy, Inc. | 1,000 | 15,080 | ||||||
PHI, Inc. NVDR(a) | 100 | 1,641 | ||||||
Pioneer Energy Services Corp.(a) | 500 | 1,085 | ||||||
RigNet, Inc.(a) | 100 | 2,069 | ||||||
Rowan Cos. PLC Class A | 800 | 13,560 | ||||||
RPC, Inc. | 432 | 5,163 | ||||||
SEACOR Holdings, Inc.(a) | 133 | 6,991 | ||||||
Seadrill, Ltd.(a) | 2,500 | 8,475 | ||||||
Superior Energy Services, Inc. | 1,000 | 13,470 | ||||||
Tesco Corp. | 200 | 1,448 | ||||||
TETRA Technologies, Inc.(a) | 518 | 3,895 | ||||||
Tidewater, Inc. | 300 | 2,088 | ||||||
Unit Corp.(a) | 300 | 3,660 | ||||||
US Silica Holdings, Inc. | 388 | 7,267 | ||||||
Weatherford International PLC(a) | 5,236 | 43,930 | ||||||
|
| |||||||
| 270,496 | ||||||||
|
| |||||||
Food & Staples Retailing – 0.7% |
| |||||||
Andersons, Inc. | 185 | 5,852 | ||||||
Casey’s General Stores, Inc. | 267 | 32,160 | ||||||
Chefs’ Warehouse, Inc.(a) | 100 | 1,668 | ||||||
Fresh Market, Inc.(a) | 300 | 7,026 | ||||||
Ingles Markets, Inc. Class A | 100 | 4,408 | ||||||
Natural Grocers by Vitamin Cottage, Inc.(a) | 100 | 2,037 | ||||||
Performance Food Group Co.(a) | 100 | 2,314 | ||||||
PriceSmart, Inc. | 127 | 10,540 | ||||||
Rite Aid Corp.(a) | 6,728 | 52,747 | ||||||
Smart & Final Stores, Inc.(a) | 195 | 3,551 | ||||||
SpartanNash Co. | 300 | 6,492 | ||||||
Sprouts Farmers Market, Inc.(a) | 1,000 | 26,590 | ||||||
SUPERVALU, Inc.(a) | 1,800 | 12,204 | ||||||
United Natural Foods, Inc.(a) | 348 | 13,697 | ||||||
Village Super Market, Inc. Class A | 69 | 1,818 | ||||||
Weis Markets, Inc. | 72 | 3,190 | ||||||
|
| |||||||
| 186,294 | ||||||||
|
| |||||||
Food Products – 1.6% | ||||||||
Amplify Snack Brands, Inc.(a) | 147 | 1,693 | ||||||
B&G Foods, Inc. | 400 | 14,008 | ||||||
Blue Buffalo Pet Products, Inc.(a) | 292 | 5,463 | ||||||
Boulder Brands, Inc.(a) | 300 | 3,294 | ||||||
Bunge, Ltd. | 978 | 66,778 | ||||||
Cal-Maine Foods, Inc. | 200 | 9,268 | ||||||
Calavo Growers, Inc. | 100 | 4,900 | ||||||
Darling Ingredients, Inc.(a) | 1,100 | 11,572 | ||||||
Dean Foods Co. | 600 | 10,290 | ||||||
Diamond Foods, Inc.(a) | 200 | 7,710 | ||||||
Farmer Brothers Co.(a) | 50 | 1,614 | ||||||
Flowers Foods, Inc. | 1,131 | 24,305 | ||||||
See accompanying notes to financial statements.
58
Table of Contents
State Street Small/Mid Cap Equity Index Portfolio
Schedule of Investments — (continued)
December 31, 2015
Security Description | Shares | Value | ||||||
COMMON STOCKS – (continued) | ||||||||
Food Products – (continued) | ||||||||
Fresh Del Monte Produce, Inc. | 239 | $ | 9,292 | |||||
Freshpet, Inc.(a) | 100 | 849 | ||||||
Hain Celestial Group, Inc.(a) | 679 | 27,425 | ||||||
Ingredion, Inc. | 487 | 46,674 | ||||||
J&J Snack Foods Corp. | 100 | 11,667 | ||||||
John B Sanfilippo & Son, Inc. | 43 | 2,323 | ||||||
Lancaster Colony Corp. | 121 | 13,971 | ||||||
Landec Corp.(a) | 100 | 1,183 | ||||||
Limoneira Co. | 100 | 1,494 | ||||||
Omega Protein Corp.(a) | 171 | 3,796 | ||||||
Pilgrim’s Pride Corp. | 400 | 8,836 | ||||||
Pinnacle Foods, Inc. | 800 | 33,968 | ||||||
Post Holdings, Inc.(a) | 425 | 26,223 | ||||||
Sanderson Farms, Inc. | 159 | 12,326 | ||||||
Seaboard Corp.(a) | 2 | 5,789 | ||||||
Seneca Foods Corp. Class A(a) | 49 | 1,420 | ||||||
Snyder’s-Lance, Inc. | 317 | 10,873 | ||||||
Tootsie Roll Industries, Inc. | 100 | 3,159 | ||||||
TreeHouse Foods, Inc.(a) | 297 | 23,303 | ||||||
WhiteWave Foods Co.(a) | 1,200 | 46,692 | ||||||
|
| |||||||
| 452,158 | ||||||||
|
| |||||||
Gas Utilities – 1.0% | ||||||||
Atmos Energy Corp. | 668 | 42,111 | ||||||
Chesapeake Utilities Corp. | 100 | 5,675 | ||||||
Laclede Group, Inc. | 280 | 16,635 | ||||||
National Fuel Gas Co. | 549 | 23,470 | ||||||
New Jersey Resources Corp. | 556 | 18,326 | ||||||
Northwest Natural Gas Co. | 197 | 9,970 | ||||||
ONE Gas, Inc. | 400 | 20,068 | ||||||
Piedmont Natural Gas Co., Inc. | 542 | 30,905 | ||||||
Questar Corp. | 1,200 | 23,376 | ||||||
South Jersey Industries, Inc. | 485 | 11,407 | ||||||
Southwest Gas Corp. | 304 | 16,768 | ||||||
UGI Corp. | 1,182 | 39,904 | ||||||
WGL Holdings, Inc. | 323 | 20,346 | ||||||
|
| |||||||
| 278,961 | ||||||||
|
| |||||||
Health Care Equipment & Supplies – 3.0% |
| |||||||
Abaxis, Inc. | 200 | 11,136 | ||||||
Abiomed, Inc.(a) | 288 | 26,001 | ||||||
Accuray, Inc.(a) | 400 | 2,700 | ||||||
Alere, Inc.(a) | 553 | 21,617 | ||||||
Align Technology, Inc.(a) | 540 | 35,559 | ||||||
Analogic Corp. | 81 | 6,691 | ||||||
AngioDynamics, Inc.(a) | 100 | 1,214 | ||||||
Anika Therapeutics, Inc.(a) | 100 | 3,816 | ||||||
Antares Pharma, Inc.(a) | 800 | 968 | ||||||
AtriCure, Inc.(a) | 200 | 4,488 | ||||||
Atrion Corp. | 7 | 2,668 | ||||||
Cantel Medical Corp. | 240 | 14,914 | ||||||
Cardiovascular Systems, Inc.(a) | 200 | 3,024 | ||||||
Cerus Corp.(a) | 500 | 3,160 | ||||||
ConforMIS, Inc.(a) | 100 | 1,729 | ||||||
CONMED Corp. | 201 | 8,854 | ||||||
Cooper Cos., Inc. | 330 | 44,286 | ||||||
CryoLife, Inc. | 200 | 2,156 | ||||||
Cutera, Inc.(a) | 100 | 1,279 | ||||||
Cynosure, Inc. Class A(a) | 200 | 8,934 | ||||||
DexCom, Inc.(a) | 543 | 44,472 | ||||||
Endologix, Inc.(a) | 523 | 5,178 | ||||||
Exactech, Inc.(a) | 100 | 1,815 | ||||||
GenMark Diagnostics, Inc.(a) | 200 | 1,552 | ||||||
Glaukos Corp.(a) | 68 | 1,679 | ||||||
Globus Medical, Inc. Class A(a) | 458 | 12,741 | ||||||
Greatbatch, Inc.(a) | 183 | 9,607 | ||||||
Haemonetics Corp.(a) | 366 | 11,800 | ||||||
Halyard Health, Inc.(a) | 300 | 10,023 | ||||||
HeartWare International, Inc.(a) | 100 | 5,040 | ||||||
Hill-Rom Holdings, Inc. | 368 | 17,686 | ||||||
Hologic, Inc.(a) | 1,698 | 65,696 | ||||||
ICU Medical, Inc.(a) | 100 | 11,278 | ||||||
IDEXX Laboratories, Inc.(a) | 640 | 46,669 | ||||||
Inogen, Inc.(a) | 100 | 4,009 | ||||||
Insulet Corp.(a) | 400 | 15,124 | ||||||
Integra LifeSciences Holdings Corp.(a) | 199 | 13,488 | ||||||
Invacare Corp. | 200 | 3,478 | ||||||
InVivo Therapeutics Holdings Corp.(a) | 100 | 720 | ||||||
K2M Group Holdings, Inc.(a) | 100 | 1,974 | ||||||
LDR Holding Corp.(a) | 136 | 3,415 | ||||||
LeMaitre Vascular, Inc. | 100 | 1,725 | ||||||
LivaNova PLC(a) | 287 | 17,039 | ||||||
Masimo Corp.(a) | 284 | 11,789 | ||||||
Meridian Bioscience, Inc. | 300 | 6,156 | ||||||
Merit Medical Systems, Inc.(a) | 300 | 5,577 | ||||||
Natus Medical, Inc.(a) | 234 | 11,244 | ||||||
Neogen Corp.(a) | 241 | 13,621 | ||||||
Nevro Corp.(a) | 100 | 6,751 | ||||||
Novocure, Ltd.(a) | 55 | 1,230 | ||||||
NuVasive, Inc.(a) | 314 | 16,990 | ||||||
NxStage Medical, Inc.(a) | 400 | 8,764 | ||||||
OraSure Technologies, Inc.(a) | 300 | 1,932 | ||||||
Orthofix International NV(a) | 140 | 5,489 | ||||||
Oxford Immunotec Global PLC(a) | 100 | 1,150 | ||||||
Penumbra, Inc.(a) | 41 | 2,206 | ||||||
Quidel Corp.(a) | 200 | 4,240 | ||||||
ResMed, Inc. | 962 | 51,650 | ||||||
Rockwell Medical, Inc.(a) | 300 | 3,072 | ||||||
RTI Surgical, Inc.(a) | 300 | 1,191 | ||||||
Second Sight Medical Products, Inc.(a) | 100 | 589 | ||||||
Sirona Dental Systems, Inc.(a) | 380 | 41,637 | ||||||
Spectranetics Corp.(a) | 322 | 4,849 | ||||||
STAAR Surgical Co.(a) | 200 | 1,428 | ||||||
STERIS PLC | 583 | 43,923 | ||||||
SurModics, Inc.(a) | 100 | 2,027 | ||||||
Tandem Diabetes Care, Inc.(a) | 100 | 1,181 | ||||||
Teleflex, Inc. | 285 | 37,463 | ||||||
Utah Medical Products, Inc. | 37 | 2,166 | ||||||
Vascular Solutions, Inc.(a) | 100 | 3,439 | ||||||
West Pharmaceutical Services, Inc. | 495 | 29,809 | ||||||
Wright Medical Group NV(a) | 609 | 14,726 | ||||||
Zeltiq Aesthetics, Inc.(a) | 200 | 5,706 | ||||||
|
| |||||||
| 853,397 | ||||||||
|
| |||||||
Health Care Providers & Services – 2.1% |
| |||||||
AAC Holdings, Inc.(a) | 100 | 1,906 | ||||||
Acadia Healthcare Co., Inc.(a) | 336 | 20,987 | ||||||
Aceto Corp. | 200 | 5,396 | ||||||
Addus HomeCare Corp.(a) | 67 | 1,560 | ||||||
Adeptus Health, Inc. Class A(a) | 32 | 1,745 | ||||||
Air Methods Corp.(a) | 255 | 10,692 | ||||||
Almost Family, Inc.(a) | 37 | 1,415 | ||||||
See accompanying notes to financial statements.
59
Table of Contents
State Street Small/Mid Cap Equity Index Portfolio
Schedule of Investments — (continued)
December 31, 2015
Security Description | Shares | Value | ||||||
COMMON STOCKS – (continued) | ||||||||
Health Care Providers & Services – (continued) |
| |||||||
Amedisys, Inc.(a) | 205 | $ | 8,061 | |||||
AMN Healthcare Services, Inc.(a) | 348 | 10,805 | ||||||
Amsurg Corp.(a) | 352 | 26,752 | ||||||
BioTelemetry, Inc.(a) | 100 | 1,168 | ||||||
Brookdale Senior Living, Inc.(a) | 1,260 | 23,260 | ||||||
Capital Senior Living Corp.(a) | 200 | 4,172 | ||||||
Centene Corp.(a) | 849 | 55,873 | ||||||
Chemed Corp. | 118 | 17,676 | ||||||
Civitas Solutions, Inc.(a) | 100 | 2,879 | ||||||
Community Health Systems, Inc.(a) | 767 | 20,349 | ||||||
CorVel Corp.(a) | 45 | 1,976 | ||||||
Cross Country Healthcare, Inc.(a) | 200 | 3,278 | ||||||
Diplomat Pharmacy, Inc.(a) | 263 | 9,000 | ||||||
Ensign Group, Inc. | 370 | 8,373 | ||||||
Envision Healthcare Holdings, Inc.(a) | 1,276 | 33,138 | ||||||
ExamWorks Group, Inc.(a) | 300 | 7,980 | ||||||
Genesis Healthcare, Inc.(a) | 200 | 694 | ||||||
Hanger, Inc.(a) | 200 | 3,290 | ||||||
Health Net, Inc.(a) | 529 | 36,215 | ||||||
HealthEquity, Inc.(a) | 263 | 6,593 | ||||||
HealthSouth Corp. | 600 | 20,886 | ||||||
Healthways, Inc.(a) | 200 | 2,574 | ||||||
Kindred Healthcare, Inc. | 600 | 7,146 | ||||||
Landauer, Inc. | 100 | 3,292 | ||||||
LHC Group, Inc.(a) | 100 | 4,529 | ||||||
LifePoint Health, Inc.(a) | 288 | 21,139 | ||||||
Magellan Health, Inc.(a) | 162 | 9,989 | ||||||
MEDNAX, Inc.(a) | 640 | 45,862 | ||||||
Molina Healthcare, Inc.(a) | 254 | 15,273 | ||||||
National HealthCare Corp. | 66 | 4,072 | ||||||
National Research Corp. Class A | 100 | 1,604 | ||||||
Owens & Minor, Inc. | 438 | 15,759 | ||||||
PharMerica Corp.(a) | 200 | 7,000 | ||||||
Premier, Inc. Class A(a) | 245 | 8,641 | ||||||
Providence Service Corp.(a) | 100 | 4,692 | ||||||
RadNet, Inc.(a) | 200 | 1,236 | ||||||
Select Medical Holdings Corp. | 700 | 8,337 | ||||||
Surgery Partners, Inc.(a) | 100 | 2,049 | ||||||
Surgical Care Affiliates, Inc.(a) | 163 | 6,489 | ||||||
Team Health Holdings, Inc.(a) | 468 | 20,541 | ||||||
Teladoc, Inc.(a) | 92 | 1,652 | ||||||
Triple-S Management Corp. Class B(a) | 189 | 4,519 | ||||||
Trupanion, Inc.(a) | 169 | 1,649 | ||||||
Universal American Corp. | 300 | 2,100 | ||||||
US Physical Therapy, Inc. | 100 | 5,368 | ||||||
VCA, Inc.(a) | 565 | 31,075 | ||||||
WellCare Health Plans, Inc.(a) | 285 | 22,290 | ||||||
|
| |||||||
| 604,996 | ||||||||
|
| |||||||
Health Care Technology – 0.6% |
| |||||||
Allscripts Healthcare Solutions, Inc.(a) | 1,200 | 18,456 | ||||||
athenahealth, Inc.(a) | 264 | 42,496 | ||||||
Castlight Health, Inc. Class B(a) | 200 | 854 | ||||||
Computer Programs & Systems, Inc. | 74 | 3,682 | ||||||
Evolent Health, Inc. Class A(a) | 100 | 1,211 | ||||||
HealthStream, Inc.(a) | 200 | 4,400 | ||||||
HMS Holdings Corp.(a) | 641 | 7,910 | ||||||
IMS Health Holdings, Inc.(a) | 900 | 22,923 | ||||||
Inovalon Holdings, Inc. Class A(a) | 200 | 3,400 | ||||||
MedAssets, Inc.(a) | 400 | 12,376 | ||||||
Medidata Solutions, Inc.(a) | 359 | 17,695 | ||||||
Omnicell, Inc.(a) | 264 | 8,205 | ||||||
Press Ganey Holdings, Inc.(a) | 100 | 3,155 | ||||||
Quality Systems, Inc. | 300 | 4,836 | ||||||
Veeva Systems, Inc. Class A(a) | 500 | 14,425 | ||||||
Vocera Communications, Inc.(a) | 134 | 1,635 | ||||||
|
| |||||||
| 167,659 | ||||||||
|
| |||||||
Hotels, Restaurants & Leisure – 3.3% |
| |||||||
Aramark | 1,345 | 43,376 | ||||||
Belmond, Ltd. Class A(a) | 700 | 6,650 | ||||||
Biglari Holdings, Inc.(a) | 10 | 3,258 | ||||||
BJ’s Restaurants, Inc.(a) | 200 | 8,694 | ||||||
Bloomin’ Brands, Inc. | 800 | 13,512 | ||||||
Bob Evans Farms, Inc. | 200 | 7,770 | ||||||
Boyd Gaming Corp.(a) | 500 | 9,935 | ||||||
Bravo Brio Restaurant Group, Inc.(a) | 100 | 900 | ||||||
Brinker International, Inc. | 397 | 19,036 | ||||||
Buffalo Wild Wings, Inc.(a) | 123 | 19,637 | ||||||
Caesars Acquisition Co. Class A(a) | 200 | 1,362 | ||||||
Caesars Entertainment Corp.(a) | 300 | 2,367 | ||||||
Carrols Restaurant Group, Inc.(a) | 200 | 2,348 | ||||||
Cheesecake Factory, Inc. | 317 | 14,617 | ||||||
Choice Hotels International, Inc. | 249 | 12,552 | ||||||
Churchill Downs, Inc. | 83 | 11,744 | ||||||
Chuy’s Holdings, Inc.(a) | 100 | 3,134 | ||||||
ClubCorp Holdings, Inc. | 300 | 5,481 | ||||||
Cracker Barrel Old Country Store, Inc. | 124 | 15,727 | ||||||
Dave & Buster’s Entertainment, Inc.(a) | 148 | 6,178 | ||||||
Del Frisco’s Restaurant Group, Inc.(a) | 100 | 1,602 | ||||||
Denny’s Corp.(a) | 600 | 5,898 | ||||||
Diamond Resorts International, Inc.(a) | 300 | 7,653 | ||||||
DineEquity, Inc. | 121 | 10,245 | ||||||
Domino’s Pizza, Inc. | 378 | 42,052 | ||||||
Dunkin’ Brands Group, Inc. | 626 | 26,661 | ||||||
El Pollo Loco Holdings, Inc.(a) | 100 | 1,263 | ||||||
Eldorado Resorts, Inc.(a) | 200 | 2,200 | ||||||
Extended Stay America, Inc. | 400 | 6,360 | ||||||
Fiesta Restaurant Group, Inc.(a) | 199 | 6,686 | ||||||
Habit Restaurants, Inc. Class A(a) | 100 | 2,306 | ||||||
Hilton Worldwide Holdings, Inc. | 3,517 | 75,264 | ||||||
Hyatt Hotels Corp. Class A(a) | 240 | 11,285 | ||||||
International Game Technology PLC | 600 | 9,708 | ||||||
International Speedway Corp. Class A | 206 | 6,946 | ||||||
Interval Leisure Group, Inc. | 299 | 4,667 | ||||||
Isle of Capri Casinos, Inc.(a) | 100 | 1,393 | ||||||
J Alexander’s Holdings, Inc.(a) | 69 | 753 | ||||||
Jack in the Box, Inc. | 242 | 18,564 | ||||||
Jamba, Inc.(a) | 100 | 1,349 | ||||||
Krispy Kreme Doughnuts, Inc.(a) | 500 | 7,535 | ||||||
La Quinta Holdings, Inc.(a) | 600 | 8,166 | ||||||
Las Vegas Sands Corp. | 2,450 | 107,408 | ||||||
Marcus Corp. | 100 | 1,897 | ||||||
Marriott Vacations Worldwide Corp. | 168 | 9,568 | ||||||
MGM Resorts International(a) | 2,995 | 68,046 | ||||||
Monarch Casino & Resort, Inc.(a) | 100 | 2,272 | ||||||
Noodles & Co.(a) | 100 | 969 | ||||||
Norwegian Cruise Line Holdings, Ltd.(a) | 897 | 52,564 | ||||||
Panera Bread Co. Class A(a) | 174 | 33,892 | ||||||
See accompanying notes to financial statements.
60
Table of Contents
State Street Small/Mid Cap Equity Index Portfolio
Schedule of Investments — (continued)
December 31, 2015
Security Description | Shares | Value | ||||||
COMMON STOCKS – (continued) | ||||||||
Hotels, Restaurants & Leisure – (continued) |
| |||||||
Papa John’s International, Inc. | 188 | $ | 10,504 | |||||
Penn National Gaming, Inc.(a) | 500 | 8,010 | ||||||
Pinnacle Entertainment, Inc.(a) | 400 | 12,448 | ||||||
Planet Fitness, Inc. Class A(a) | 100 | 1,563 | ||||||
Popeyes Louisiana Kitchen, Inc.(a) | 167 | 9,770 | ||||||
Potbelly Corp.(a) | 100 | 1,171 | ||||||
Red Robin Gourmet Burgers, Inc.(a) | 100 | 6,174 | ||||||
Ruby Tuesday, Inc.(a) | 300 | 1,653 | ||||||
Ruth’s Hospitality Group, Inc. | 200 | 3,184 | ||||||
Scientific Games Corp. Class A(a) | 300 | 2,691 | ||||||
SeaWorld Entertainment, Inc. | 490 | 9,648 | ||||||
Shake Shack, Inc. Class A(a) | 30 | 1,188 | ||||||
Six Flags Entertainment Corp. | 496 | 27,250 | ||||||
Sonic Corp. | 370 | 11,955 | ||||||
Speedway Motorsports, Inc. | 100 | 2,072 | ||||||
Texas Roadhouse, Inc. | 455 | 16,275 | ||||||
Vail Resorts, Inc. | 250 | 31,998 | ||||||
Wendy’s Co. | 1,327 | 14,292 | ||||||
Wingstop, Inc.(a) | 70 | 1,597 | ||||||
Zoe’s Kitchen, Inc.(a) | 100 | 2,798 | ||||||
|
| |||||||
| 919,691 | ||||||||
|
| |||||||
Household Durables – 1.4% | ||||||||
Bassett Furniture Industries, Inc. | 100 | 2,508 | ||||||
Beazer Homes USA, Inc.(a) | 200 | 2,298 | ||||||
CalAtlantic Group, Inc. | 500 | 18,960 | ||||||
Cavco Industries, Inc.(a) | 66 | 5,499 | ||||||
Century Communities, Inc.(a) | 100 | 1,771 | ||||||
CSS Industries, Inc. | 100 | 2,838 | ||||||
Ethan Allen Interiors, Inc. | 200 | 5,564 | ||||||
Flexsteel Industries, Inc. | 100 | 4,418 | ||||||
GoPro, Inc. Class A(a) | 600 | 10,806 | ||||||
Green Brick Partners, Inc.(a) | 100 | 720 | ||||||
Helen of Troy, Ltd.(a) | 184 | 17,342 | ||||||
Hooker Furniture Corp. | 100 | 2,524 | ||||||
Hovnanian Enterprises, Inc. Class A(a) | 600 | 1,086 | ||||||
Installed Building Products, Inc.(a) | 100 | 2,483 | ||||||
iRobot Corp.(a) | 200 | 7,080 | ||||||
Jarden Corp.(a) | 1,449 | 82,767 | ||||||
KB Home | 600 | 7,398 | ||||||
La-Z-Boy, Inc. | 333 | 8,132 | ||||||
LGI Homes, Inc.(a) | 100 | 2,433 | ||||||
Libbey, Inc. | 142 | 3,027 | ||||||
Lifetime Brands, Inc. | 100 | 1,326 | ||||||
M/I Homes, Inc.(a) | 200 | 4,384 | ||||||
MDC Holdings, Inc. | 300 | 7,659 | ||||||
Meritage Homes Corp.(a) | 258 | 8,769 | ||||||
NACCO Industries, Inc. Class A | 41 | 1,730 | ||||||
NVR, Inc.(a) | 27 | 44,361 | ||||||
Taylor Morrison Home Corp. Class A(a) | 200 | 3,200 | ||||||
Tempur Sealy International, Inc.(a) | 420 | 29,593 | ||||||
Toll Brothers, Inc.(a) | 1,159 | 38,595 | ||||||
TopBuild Corp.(a) | 252 | 7,754 | ||||||
TRI Pointe Group, Inc.(a) | 1,100 | 13,937 | ||||||
Tupperware Brands Corp. | 344 | 19,144 | ||||||
Universal Electronics, Inc.(a) | 100 | 5,135 | ||||||
WCI Communities, Inc.(a) | 100 | 2,228 | ||||||
William Lyon Homes Class A(a) | 100 | 1,650 | ||||||
ZAGG, Inc.(a) | 200 | 2,188 | ||||||
|
| |||||||
| 381,307 | ||||||||
|
| |||||||
Household Products – 0.2% | ||||||||
Central Garden & Pet Co. Class A(a) | 300 | 4,080 | ||||||
Energizer Holdings, Inc. | 404 | 13,761 | ||||||
HRG Group, Inc.(a) | 600 | 8,136 | ||||||
Oil-Dri Corp. of America | 48 | 1,768 | ||||||
Orchids Paper Products Co. | 60 | 1,855 | ||||||
Spectrum Brands Holdings, Inc. | 164 | 16,695 | ||||||
WD-40 Co. | 100 | 9,865 | ||||||
|
| |||||||
| 56,160 | ||||||||
|
| |||||||
Independent Power Producers & Energy Traders – 0.3% |
| |||||||
Abengoa Yield PLC | 300 | 5,787 | ||||||
Atlantic Power Corp. | 600 | 1,182 | ||||||
Calpine Corp.(a) | 2,554 | 36,956 | ||||||
Dynegy, Inc.(a) | 784 | 10,506 | ||||||
NRG Yield, Inc. Class A | 200 | 2,782 | ||||||
NRG Yield, Inc. Class C | 400 | 5,904 | ||||||
Ormat Technologies, Inc. | 242 | 8,826 | ||||||
Pattern Energy Group, Inc. | 400 | 8,364 | ||||||
Talen Energy Corp.(a) | 631 | 3,931 | ||||||
TerraForm Global, Inc. Class A | 200 | 1,118 | ||||||
TerraForm Power, Inc. Class A(a) | 400 | 5,032 | ||||||
Vivint Solar, Inc.(a) | 100 | 956 | ||||||
|
| |||||||
| 91,344 | ||||||||
|
| |||||||
Industrial Conglomerates – 0.2% |
| |||||||
Carlisle Cos., Inc. | 446 | 39,556 | ||||||
Raven Industries, Inc. | 200 | 3,120 | ||||||
|
| |||||||
| 42,676 | ||||||||
|
| |||||||
Insurance – 4.4% | ||||||||
Alleghany Corp.(a) | 109 | 52,094 | ||||||
Allied World Assurance Co. Holdings AG | 620 | 23,058 | ||||||
Ambac Financial Group, Inc.(a) | 300 | 4,227 | ||||||
American Equity Investment Life Holding Co. | 568 | 13,649 | ||||||
American Financial Group, Inc. | 474 | 34,166 | ||||||
American National Insurance Co. | 54 | 5,523 | ||||||
AMERISAFE, Inc. | 140 | 7,126 | ||||||
AmTrust Financial Services, Inc. | 285 | 17,550 | ||||||
Arch Capital Group, Ltd.(a) | 846 | 59,009 | ||||||
Argo Group International Holdings, Ltd. | 182 | 10,891 | ||||||
Arthur J Gallagher & Co. | 1,192 | 48,801 | ||||||
Aspen Insurance Holdings, Ltd. | 401 | 19,368 | ||||||
Assured Guaranty, Ltd. | 919 | 24,289 | ||||||
Atlas Financial Holdings, Inc.(a) | 100 | 1,990 | ||||||
Axis Capital Holdings, Ltd. | 669 | 37,611 | ||||||
Baldwin & Lyons, Inc. Class B | 100 | 2,403 | ||||||
Brown & Brown, Inc. | 753 | 24,171 | ||||||
Citizens, Inc.(a) | 300 | 2,229 | ||||||
CNA Financial Corp. | 199 | 6,995 | ||||||
CNO Financial Group, Inc. | 1,209 | 23,080 | ||||||
Crawford & Co. Class B | 291 | 1,545 | ||||||
eHealth, Inc.(a) | 100 | 998 | ||||||
EMC Insurance Group, Inc. | 100 | 2,530 | ||||||
Employers Holdings, Inc. | 200 | 5,460 | ||||||
Endurance Specialty Holdings, Ltd. | 405 | 25,916 | ||||||
Enstar Group, Ltd.(a) | 65 | 9,753 | ||||||
Erie Indemnity Co. Class A | 158 | 15,111 | ||||||
Everest Re Group, Ltd. | 303 | 55,476 | ||||||
FBL Financial Group, Inc. Class A | 50 | 3,182 | ||||||
See accompanying notes to financial statements.
61
Table of Contents
State Street Small/Mid Cap Equity Index Portfolio
Schedule of Investments — (continued)
December 31, 2015
Security Description | Shares | Value | ||||||
COMMON STOCKS – (continued) | ||||||||
Insurance – (continued) | ||||||||
Federated National Holding Co. | 100 | $ | 2,956 | |||||
Fidelity & Guaranty Life | 100 | 2,537 | ||||||
First American Financial Corp. | 748 | 26,853 | ||||||
FNF Group | 1,923 | 66,671 | ||||||
Genworth Financial, Inc. Class A(a) | 3,300 | 12,309 | ||||||
Global Indemnity PLC(a) | 54 | 1,567 | ||||||
Greenlight Capital Re, Ltd. Class A(a) | 200 | 3,742 | ||||||
Hallmark Financial Services, Inc.(a) | 141 | 1,648 | ||||||
Hanover Insurance Group, Inc. | 286 | 23,263 | ||||||
HCI Group, Inc. | 45 | 1,568 | ||||||
Heritage Insurance Holdings, Inc. | 200 | 4,364 | ||||||
Horace Mann Educators Corp. | 300 | 9,954 | ||||||
Infinity Property & Casualty Corp. | 75 | 6,167 | ||||||
James River Group Holdings, Ltd. | 100 | 3,354 | ||||||
Kemper Corp. | 283 | 10,542 | ||||||
Maiden Holdings, Ltd. | 300 | 4,473 | ||||||
Markel Corp.(a) | 95 | 83,918 | ||||||
MBIA, Inc.(a) | 800 | 5,184 | ||||||
Mercury General Corp. | 194 | 9,035 | ||||||
National General Holdings Corp. | 299 | 6,536 | ||||||
National Interstate Corp. | 46 | 1,228 | ||||||
National Western Life Group, Inc. Class A | 12 | 3,023 | ||||||
Navigators Group, Inc.(a) | 69 | 5,920 | ||||||
Old Republic International Corp. | 1,794 | 33,422 | ||||||
OneBeacon Insurance Group, Ltd. Class A | 100 | 1,241 | ||||||
PartnerRe, Ltd. | 326 | 45,555 | ||||||
Primerica, Inc. | 338 | 15,964 | ||||||
ProAssurance Corp. | 358 | 17,374 | ||||||
Reinsurance Group of America, Inc. | 454 | 38,840 | ||||||
RenaissanceRe Holdings, Ltd. | 316 | 35,768 | ||||||
RLI Corp. | 279 | 17,228 | ||||||
Safety Insurance Group, Inc. | 100 | 5,638 | ||||||
Selective Insurance Group, Inc. | 400 | 13,432 | ||||||
StanCorp Financial Group, Inc. | 290 | 33,025 | ||||||
State Auto Financial Corp. | 100 | 2,059 | ||||||
State National Cos., Inc. | 200 | 1,962 | ||||||
Stewart Information Services Corp. | 149 | 5,562 | ||||||
Symetra Financial Corp. | 500 | 15,885 | ||||||
Third Point Reinsurance, Ltd.(a) | 600 | 8,046 | ||||||
United Fire Group, Inc. | 153 | 5,862 | ||||||
United Insurance Holdings Corp. | 100 | 1,710 | ||||||
Universal Insurance Holdings, Inc. | 200 | 4,636 | ||||||
Validus Holdings, Ltd. | 550 | 25,460 | ||||||
White Mountains Insurance Group, Ltd. | 37 | 26,892 | ||||||
WR Berkley Corp. | 667 | 36,518 | ||||||
|
| |||||||
| 1,227,092 | ||||||||
|
| |||||||
Internet & Catalog Retail – 0.8% |
| |||||||
1-800-Flowers.com, Inc. Class A(a) | 200 | 1,456 | ||||||
Blue Nile, Inc.(a) | 100 | 3,713 | ||||||
Etsy, Inc.(a) | 100 | 826 | ||||||
Expedia, Inc. | 1 | 6 | ||||||
FTD Cos., Inc.(a) | 100 | 2,617 | ||||||
Groupon, Inc.(a) | 2,922 | 8,970 | ||||||
HSN, Inc. | 200 | 10,134 | ||||||
Lands’ End, Inc.(a) | 100 | 2,344 | ||||||
Liberty Interactive Corp. QVC Group Class A(a) | 3,336 | 91,139 | ||||||
Liberty TripAdvisor Holdings, Inc. Class A(a) | 500 | 15,170 | ||||||
Liberty Ventures Series A(a) | 997 | 44,975 | ||||||
Nutrisystem, Inc. | 151 | 3,268 | ||||||
Overstock.com, Inc.(a) | 100 | 1,228 | ||||||
PetMed Express, Inc. | 100 | 1,714 | ||||||
Shutterfly, Inc.(a) | 251 | 11,185 | ||||||
Travelport Worldwide, Ltd. | 700 | 9,030 | ||||||
Wayfair, Inc. Class A(a) | 151 | 7,191 | ||||||
|
| |||||||
| 214,966 | ||||||||
|
| |||||||
Internet Software & Services – 2.4% |
| |||||||
Actua Corp.(a) | 200 | 2,290 | ||||||
Angie’s List, Inc.(a) | 235 | 2,197 | ||||||
Bankrate, Inc.(a) | 500 | 6,650 | ||||||
Bazaarvoice, Inc.(a) | 300 | 1,314 | ||||||
Benefitfocus, Inc.(a) | 41 | 1,492 | ||||||
Blucora, Inc.(a) | 200 | 1,960 | ||||||
Box, Inc. Class A(a) | 100 | 1,396 | ||||||
Brightcove, Inc.(a) | 326 | 2,021 | ||||||
Carbonite, Inc.(a) | 100 | 980 | ||||||
ChannelAdvisor Corp.(a) | 100 | 1,385 | ||||||
Cimpress NV(a) | 227 | 18,419 | ||||||
comScore, Inc.(a) | 244 | 10,041 | ||||||
Constant Contact, Inc.(a) | 200 | 5,848 | ||||||
Cornerstone OnDemand, Inc.(a) | 351 | 12,120 | ||||||
CoStar Group, Inc.(a) | 222 | 45,885 | ||||||
Cvent, Inc.(a) | 152 | 5,306 | ||||||
Demandware, Inc.(a) | 217 | 11,712 | ||||||
DHI Group, Inc.(a) | 200 | 1,834 | ||||||
EarthLink Holdings Corp. | 700 | 5,201 | ||||||
Endurance International Group Holdings, Inc.(a) | 435 | 4,755 | ||||||
Envestnet, Inc.(a) | 252 | 7,522 | ||||||
Everyday Health, Inc.(a) | 100 | 602 | ||||||
Five9, Inc.(a) | 227 | 1,975 | ||||||
GoDaddy, Inc. Class A(a) | 153 | 4,905 | ||||||
Gogo, Inc.(a) | 410 | 7,298 | ||||||
GrubHub, Inc.(a) | 500 | 12,100 | ||||||
GTT Communications, Inc.(a) | 195 | 3,327 | ||||||
Hortonworks, Inc.(a) | 78 | 1,708 | ||||||
IAC/InterActiveCorp | 505 | 30,325 | ||||||
Internap Corp.(a) | 300 | 1,920 | ||||||
Intralinks Holdings, Inc.(a) | 200 | 1,814 | ||||||
j2 Global, Inc. | 333 | 27,413 | ||||||
LinkedIn Corp. Class A(a) | 742 | 167,009 | ||||||
Liquidity Services, Inc.(a) | 200 | 1,300 | ||||||
LivePerson, Inc.(a) | 300 | 2,025 | ||||||
LogMeIn, Inc.(a) | 160 | 10,736 | ||||||
Marketo, Inc.(a) | 200 | 5,742 | ||||||
Match Group, Inc.(a) | 200 | 2,710 | ||||||
Monster Worldwide, Inc.(a) | 500 | 2,865 | ||||||
New Relic, Inc.(a) | 31 | 1,129 | ||||||
NIC, Inc. | 400 | 7,872 | ||||||
OPOWER, Inc.(a) | 140 | 1,478 | ||||||
Pandora Media, Inc.(a) | 1,402 | 18,801 | ||||||
Q2 Holdings, Inc.(a) | 100 | 2,637 | ||||||
QuinStreet, Inc.(a) | 200 | 858 | ||||||
Quotient Technology, Inc.(a) | 300 | 2,046 | ||||||
Rackspace Hosting, Inc.(a) | 800 | 20,256 | ||||||
See accompanying notes to financial statements.
62
Table of Contents
State Street Small/Mid Cap Equity Index Portfolio
Schedule of Investments — (continued)
December 31, 2015
Security Description | Shares | Value | ||||||
COMMON STOCKS – (continued) | ||||||||
Internet Software & Services – (continued) |
| |||||||
Reis, Inc. | 100 | $ | 2,373 | |||||
RetailMeNot, Inc.(a) | 200 | 1,984 | ||||||
SciQuest, Inc.(a) | 226 | 2,931 | ||||||
Shutterstock, Inc.(a) | 150 | 4,851 | ||||||
SPS Commerce, Inc.(a) | 100 | 7,021 | ||||||
Stamps.com, Inc.(a) | 100 | 10,961 | ||||||
TechTarget, Inc.(a) | 200 | 1,606 | ||||||
Textura Corp.(a) | 100 | 2,158 | ||||||
TrueCar, Inc.(a) | 255 | 2,433 | ||||||
Twitter, Inc.(a) | 3,822 | 88,441 | ||||||
United Online, Inc.(a) | 100 | 1,179 | ||||||
Web.com Group, Inc.(a) | 300 | 6,003 | ||||||
WebMD Health Corp.(a) | 300 | 14,490 | ||||||
Wix.com, Ltd.(a) | 100 | 2,275 | ||||||
XO Group, Inc.(a) | 211 | 3,389 | ||||||
Yelp, Inc.(a) | 458 | 13,190 | ||||||
Zillow Group, Inc. Class A(a) | 329 | 8,567 | ||||||
Zillow Group, Inc. Class C(a) | 558 | 13,102 | ||||||
|
| |||||||
| 678,133 | ||||||||
|
| |||||||
It Services – 3.3% | ||||||||
Acxiom Corp.(a) | 500 | 10,460 | ||||||
Amdocs, Ltd. | 1,055 | 57,571 | ||||||
Black Knight Financial Services, Inc. Class A(a) | 158 | 5,224 | ||||||
Blackhawk Network Holdings, Inc.(a) | 353 | 15,606 | ||||||
Booz Allen Hamilton Holding Corp. | 700 | 21,595 | ||||||
Broadridge Financial Solutions, Inc. | 854 | 45,886 | ||||||
CACI International, Inc. Class A(a) | 156 | 14,474 | ||||||
Cardtronics, Inc.(a) | 292 | 9,826 | ||||||
Cass Information Systems, Inc. | 75 | 3,860 | ||||||
Ciber, Inc.(a) | 400 | 1,404 | ||||||
Computer Sciences Corp. | 954 | 31,177 | ||||||
Convergys Corp. | 642 | 15,979 | ||||||
CoreLogic, Inc.(a) | 600 | 20,316 | ||||||
CSG Systems International, Inc. | 200 | 7,196 | ||||||
Datalink Corp.(a) | 213 | 1,448 | ||||||
DST Systems, Inc. | 239 | 27,260 | ||||||
EPAM Systems, Inc.(a) | 318 | 25,001 | ||||||
Euronet Worldwide, Inc.(a) | 358 | 25,930 | ||||||
Everi Holdings, Inc.(a) | 300 | 1,317 | ||||||
EVERTEC, Inc. | 400 | 6,696 | ||||||
ExlService Holdings, Inc.(a) | 237 | 10,648 | ||||||
First Data Corp. Class A(a) | 1,200 | 19,224 | ||||||
FleetCor Technologies, Inc.(a) | 624 | 89,188 | ||||||
Forrester Research, Inc. | 100 | 2,848 | ||||||
Gartner, Inc.(a) | 553 | 50,157 | ||||||
Genpact, Ltd.(a) | 1,068 | 26,679 | ||||||
Global Payments, Inc. | 906 | 58,446 | ||||||
Hackett Group, Inc. | 190 | 3,053 | ||||||
Heartland Payment Systems, Inc. | 238 | 22,567 | ||||||
Jack Henry & Associates, Inc. | 560 | 43,714 | ||||||
Leidos Holdings, Inc. | 448 | 25,205 | ||||||
Lionbridge Technologies, Inc.(a) | 300 | 1,473 | ||||||
Luxoft Holding, Inc.(a) | 131 | 10,104 | ||||||
ManTech International Corp. Class A | 158 | 4,778 | ||||||
MAXIMUS, Inc. | 444 | 24,975 | ||||||
MoneyGram International, Inc.(a) | 153 | 959 | ||||||
NeuStar, Inc. Class A(a) | 400 | 9,588 | ||||||
Perficient, Inc.(a) | 200 | 3,424 | ||||||
PFSweb, Inc.(a) | 100 | 1,287 | ||||||
Sabre Corp. | 739 | 20,670 | ||||||
Science Applications International Corp. | 299 | 13,688 | ||||||
ServiceSource International, Inc.(a) | 300 | 1,383 | ||||||
Square, Inc. Class A(a) | 200 | 2,618 | ||||||
Sykes Enterprises, Inc.(a) | 253 | 7,787 | ||||||
Syntel, Inc.(a) | 200 | 9,050 | ||||||
TeleTech Holdings, Inc. | 100 | 2,791 | ||||||
Unisys Corp.(a) | 300 | 3,315 | ||||||
Vantiv, Inc. Class A(a) | 983 | 46,614 | ||||||
VeriFone Systems, Inc.(a) | 739 | 20,707 | ||||||
Virtusa Corp.(a) | 200 | 8,268 | ||||||
WEX, Inc.(a) | 250 | 22,100 | ||||||
|
| |||||||
| 915,534 | ||||||||
|
| |||||||
Leisure Equipment & Products – 0.4% |
| |||||||
Arctic Cat, Inc. | 100 | 1,638 | ||||||
Brunswick Corp. | 637 | 32,175 | ||||||
Callaway Golf Co. | 583 | 5,492 | ||||||
Escalade, Inc. | 100 | 1,325 | ||||||
JAKKS Pacific, Inc.(a) | 196 | 1,560 | ||||||
Malibu Boats, Inc. Class A(a) | 100 | 1,637 | ||||||
Nautilus, Inc.(a) | 200 | 3,344 | ||||||
Performance Sports Group, Ltd.(a) | 362 | 3,486 | ||||||
Polaris Industries, Inc. | 455 | 39,107 | ||||||
Smith & Wesson Holding Corp.(a) | 388 | 8,528 | ||||||
Sturm Ruger & Co., Inc. | 137 | 8,167 | ||||||
Vista Outdoor, Inc.(a) | 433 | 19,273 | ||||||
|
| |||||||
| 125,732 | ||||||||
|
| |||||||
Life Sciences Tools & Services – 1.1% |
| |||||||
Accelerate Diagnostics, Inc.(a) | 100 | 2,149 | ||||||
Affymetrix, Inc.(a) | 579 | 5,842 | ||||||
Albany Molecular Research, Inc.(a) | 196 | 3,891 | ||||||
Bio-Rad Laboratories, Inc. Class A(a) | 134 | 18,580 | ||||||
Bio-Techne Corp. | 240 | 21,600 | ||||||
Bruker Corp.(a) | 773 | 18,761 | ||||||
Cambrex Corp.(a) | 200 | 9,418 | ||||||
Charles River Laboratories International, Inc.(a) | 308 | 24,760 | ||||||
Fluidigm Corp.(a) | 244 | 2,638 | ||||||
INC Research Holdings, Inc. Class A(a) | 100 | 4,851 | ||||||
Luminex Corp.(a) | 300 | 6,417 | ||||||
Mettler-Toledo International, Inc.(a) | 191 | 64,774 | ||||||
NanoString Technologies, Inc.(a) | 100 | 1,471 | ||||||
NeoGenomics, Inc.(a) | 300 | 2,361 | ||||||
Pacific Biosciences of California, Inc.(a) | 300 | 3,939 | ||||||
PAREXEL International Corp.(a) | 359 | 24,455 | ||||||
PRA Health Sciences, Inc.(a) | 149 | 6,745 | ||||||
QIAGEN NV(a) | 1,608 | 44,461 | ||||||
Quintiles Transnational Holdings, Inc.(a) | 531 | 36,458 | ||||||
Sequenom, Inc.(a) | 600 | 984 | ||||||
VWR Corp.(a) | 200 | 5,662 | ||||||
|
| |||||||
| 310,217 | ||||||||
|
| |||||||
Machinery – 3.0% | ||||||||
Actuant Corp. Class A | 400 | 9,584 | ||||||
AGCO Corp. | 500 | 22,695 | ||||||
Alamo Group, Inc. | 50 | 2,605 | ||||||
See accompanying notes to financial statements.
63
Table of Contents
State Street Small/Mid Cap Equity Index Portfolio
Schedule of Investments — (continued)
December 31, 2015
Security Description | Shares | Value | ||||||
COMMON STOCKS – (continued) | ||||||||
Machinery – (continued) | ||||||||
Albany International Corp. Class A | 248 | $ | 9,064 | |||||
Allison Transmission Holdings, Inc. | 1,200 | 31,068 | ||||||
Altra Industrial Motion Corp. | 200 | 5,016 | ||||||
American Railcar Industries, Inc. | 49 | 2,268 | ||||||
Astec Industries, Inc. | 141 | 5,739 | ||||||
Barnes Group, Inc. | 356 | 12,599 | ||||||
Blount International, Inc.(a) | 385 | 3,777 | ||||||
Briggs & Stratton Corp. | 300 | 5,190 | ||||||
Chart Industries, Inc.(a) | 200 | 3,592 | ||||||
CIRCOR International, Inc. | 100 | 4,215 | ||||||
CLARCOR, Inc. | 348 | 17,289 | ||||||
Colfax Corp.(a) | 638 | 14,897 | ||||||
Columbus McKinnon Corp. | 100 | 1,890 | ||||||
Crane Co. | 313 | 14,974 | ||||||
Donaldson Co., Inc. | 900 | 25,794 | ||||||
Douglas Dynamics, Inc. | 177 | 3,729 | ||||||
EnPro Industries, Inc. | 145 | 6,357 | ||||||
ESCO Technologies, Inc. | 190 | 6,867 | ||||||
Federal Signal Corp. | 400 | 6,340 | ||||||
FreightCar America, Inc. | 100 | 1,943 | ||||||
Global Brass & Copper Holdings, Inc. | 100 | 2,130 | ||||||
Gorman-Rupp Co. | 100 | 2,673 | ||||||
Graco, Inc. | 404 | 29,116 | ||||||
Graham Corp. | 100 | 1,682 | ||||||
Greenbrier Cos., Inc. | 194 | 6,328 | ||||||
Harsco Corp. | 600 | 4,728 | ||||||
Hillenbrand, Inc. | 400 | 11,852 | ||||||
Hurco Cos., Inc. | 66 | 1,753 | ||||||
Hyster-Yale Materials Handling, Inc. | 49 | 2,570 | ||||||
IDEX Corp. | 534 | 40,910 | ||||||
ITT Corp. | 600 | 21,792 | ||||||
John Bean Technologies Corp. | 209 | 10,414 | ||||||
Joy Global, Inc. | 700 | 8,827 | ||||||
Kadant, Inc. | 100 | 4,061 | ||||||
Kennametal, Inc. | 500 | 9,600 | ||||||
LB Foster Co. Class A | 100 | 1,366 | ||||||
Lincoln Electric Holdings, Inc. | 500 | 25,945 | ||||||
Lindsay Corp. | 77 | 5,575 | ||||||
Lydall, Inc.(a) | 100 | 3,548 | ||||||
Manitowoc Co., Inc. | 900 | 13,815 | ||||||
Meritor, Inc.(a) | 700 | 5,845 | ||||||
Middleby Corp.(a) | 392 | 42,285 | ||||||
Milacron Holdings Corp.(a) | 100 | 1,251 | ||||||
Miller Industries, Inc. | 100 | 2,178 | ||||||
Mueller Industries, Inc. | 400 | 10,840 | ||||||
Mueller Water Products, Inc. Class A | 1,100 | 9,460 | ||||||
Navistar International Corp.(a) | 300 | 2,652 | ||||||
NN, Inc. | 216 | 3,443 | ||||||
Nordson Corp. | 419 | 26,879 | ||||||
Oshkosh Corp. | 508 | 19,832 | ||||||
Proto Labs, Inc.(a) | 152 | 9,681 | ||||||
RBC Bearings, Inc.(a) | 152 | 9,818 | ||||||
Rexnord Corp.(a) | 700 | 12,684 | ||||||
SPX Corp. | 200 | 1,866 | ||||||
SPX FLOW, Inc.(a) | 300 | 8,373 | ||||||
Standex International Corp. | 83 | 6,901 | ||||||
Sun Hydraulics Corp. | 148 | 4,696 | ||||||
Tennant Co. | 134 | 7,539 | ||||||
Terex Corp. | 700 | 12,936 | ||||||
Timken Co. | 500 | 14,295 | ||||||
Titan International, Inc. | 200 | 788 | ||||||
Toro Co. | 384 | 28,059 | ||||||
TriMas Corp.(a) | 300 | 5,595 | ||||||
Trinity Industries, Inc. | 1,069 | 25,677 | ||||||
Valmont Industries, Inc. | 152 | 16,115 | ||||||
Wabash National Corp.(a) | 500 | 5,915 | ||||||
WABCO Holdings, Inc.(a) | 374 | 38,245 | ||||||
Wabtec Corp. | 660 | 46,939 | ||||||
Watts Water Technologies, Inc. Class A | 183 | 9,090 | ||||||
Woodward, Inc. | 441 | 21,900 | ||||||
Xerium Technologies, Inc.(a) | 100 | 1,185 | ||||||
|
| |||||||
| 839,139 | ||||||||
|
| |||||||
Marine – 0.1% | ||||||||
Golden Ocean Group, Ltd. | 300 | 321 | ||||||
Kirby Corp.(a) | 363 | 19,101 | ||||||
Matson, Inc. | 282 | 12,021 | ||||||
Navios Maritime Holdings, Inc. | 400 | 700 | ||||||
Scorpio Bulkers, Inc.(a) | 133 | 1,319 | ||||||
|
| |||||||
| 33,462 | ||||||||
|
| |||||||
Media – 3.0% | ||||||||
AMC Entertainment Holdings, Inc. Class A | 100 | 2,400 | ||||||
AMC Networks, Inc. Class A(a) | 412 | 30,768 | ||||||
Cable One, Inc. | 23 | 9,974 | ||||||
Carmike Cinemas, Inc.(a) | 200 | 4,588 | ||||||
Central European Media Enterprises, Ltd. Class A(a) | 700 | 1,883 | ||||||
Charter Communications, Inc. Class A(a) | 509 | 93,198 | ||||||
Cinemark Holdings, Inc. | 760 | 25,407 | ||||||
Clear Channel Outdoor Holdings, Inc. Class A(a) | 200 | 1,118 | ||||||
Crown Media Holdings, Inc. Class A(a) | 300 | 1,683 | ||||||
Daily Journal Corp.(a) | 11 | 2,222 | ||||||
DISH Network Corp. Class A(a) | 1,515 | 86,628 | ||||||
DreamWorks Animation SKG, Inc. Class A(a) | 500 | 12,885 | ||||||
Entercom Communications Corp. Class A(a) | 200 | 2,246 | ||||||
Entravision Communications Corp. Class A | 300 | 2,313 | ||||||
Eros International PLC(a) | 147 | 1,345 | ||||||
EW Scripps Co. Class A | 400 | 7,600 | ||||||
Gannett Co., Inc. | 800 | 13,032 | ||||||
Global Eagle Entertainment, Inc.(a) | 300 | 2,961 | ||||||
Gray Television, Inc.(a) | 400 | 6,520 | ||||||
Harte-Hanks, Inc. | 400 | 1,296 | ||||||
Hemisphere Media Group, Inc.(a) | 100 | 1,475 | ||||||
IMAX Corp.(a) | 400 | 14,216 | ||||||
John Wiley & Sons, Inc. Class A | 301 | 13,554 | ||||||
Journal Media Group, Inc. | 200 | 2,404 | ||||||
Liberty Broadband Corp. Class A(a) | 187 | 9,659 | ||||||
Liberty Broadband Corp. Class C(a) | 446 | 23,130 | ||||||
Liberty Media Corp. Class A(a) | 745 | 29,241 | ||||||
Liberty Media Corp. Class C(a) | 1,403 | 53,426 | ||||||
Lions Gate Entertainment Corp. | 649 | 21,021 | ||||||
Live Nation Entertainment, Inc.(a) | 959 | 23,563 | ||||||
Loral Space & Communications, Inc.(a) | 100 | 4,071 | ||||||
See accompanying notes to financial statements.
64
Table of Contents
State Street Small/Mid Cap Equity Index Portfolio
Schedule of Investments — (continued)
December 31, 2015
Security Description | Shares | Value | ||||||
COMMON STOCKS – (continued) | ||||||||
Media – (continued) | ||||||||
Madison Square Garden Co. Class A(a) | 133 | $ | 21,519 | |||||
MDC Partners, Inc. Class A | 300 | 6,516 | ||||||
Media General, Inc.(a) | 700 | 11,305 | ||||||
Meredith Corp. | 300 | 12,975 | ||||||
MSG Networks, Inc. Class A(a) | 421 | 8,757 | ||||||
National CineMedia, Inc. | 400 | 6,284 | ||||||
New Media Investment Group, Inc. | 300 | 5,838 | ||||||
New York Times Co. Class A | 900 | 12,078 | ||||||
Nexstar Broadcasting Group, Inc. Class A | 200 | 11,740 | ||||||
Reading International, Inc. Class A(a) | 100 | 1,311 | ||||||
Regal Entertainment Group Class A | 600 | 11,322 | ||||||
Rentrak Corp.(a) | 100 | 4,753 | ||||||
Scholastic Corp. | 195 | 7,519 | ||||||
Sinclair Broadcast Group, Inc. Class A | 462 | 15,033 | ||||||
Sirius XM Holdings, Inc.(a) | 15,591 | 63,455 | ||||||
Starz Class A(a) | 599 | 20,066 | ||||||
Thomson Reuters Corp. | 2,243 | 84,898 | ||||||
Time, Inc. | 700 | 10,969 | ||||||
Tribune Media Co. Class A | 532 | 17,987 | ||||||
Tribune Publishing Co. | 100 | 922 | ||||||
World Wrestling Entertainment, Inc. Class A | 200 | 3,568 | ||||||
|
| |||||||
| 844,642 | ||||||||
|
| |||||||
Metals & Mining – 0.8% | ||||||||
AK Steel Holding Corp.(a) | 900 | 2,016 | ||||||
Allegheny Technologies, Inc. | 700 | 7,875 | ||||||
Carpenter Technology Corp. | 355 | 10,746 | ||||||
Century Aluminum Co.(a) | 300 | 1,326 | ||||||
Cliffs Natural Resources, Inc. | 800 | 1,264 | ||||||
Coeur Mining, Inc.(a) | 700 | 1,736 | ||||||
Commercial Metals Co. | 800 | 10,952 | ||||||
Compass Minerals International, Inc. | 233 | 17,538 | ||||||
Ferroglobe PLC | 500 | 5,375 | ||||||
Haynes International, Inc. | 100 | 3,669 | ||||||
Hecla Mining Co. | 2,784 | 5,262 | ||||||
Horsehead Holding Corp.(a) | 300 | 615 | ||||||
Kaiser Aluminum Corp. | 122 | 10,206 | ||||||
Materion Corp. | 155 | 4,340 | ||||||
Real Industry, Inc.(a) | 128 | 1,028 | ||||||
Reliance Steel & Aluminum Co. | 500 | 28,955 | ||||||
Royal Gold, Inc. | 438 | 15,974 | ||||||
Schnitzer Steel Industries, Inc. Class A | 172 | 2,471 | ||||||
Southern Copper Corp. | 742 | 19,381 | ||||||
Steel Dynamics, Inc. | 1,600 | 28,592 | ||||||
Stillwater Mining Co.(a) | 800 | 6,856 | ||||||
SunCoke Energy, Inc. | 300 | 1,041 | ||||||
Tahoe Resources, Inc. | 1,100 | 9,537 | ||||||
TimkenSteel Corp. | 200 | 1,676 | ||||||
United States Steel Corp. | 1,000 | 7,980 | ||||||
Worthington Industries, Inc. | 300 | 9,042 | ||||||
|
| |||||||
| 215,453 | ||||||||
|
| |||||||
Multi-Utilities – 0.5% | ||||||||
Alliant Energy Corp. | 772 | 48,211 | ||||||
Avista Corp. | 400 | 14,148 | ||||||
Black Hills Corp. | 345 | 16,018 | ||||||
MDU Resources Group, Inc. | 1,300 | 23,816 | ||||||
NorthWestern Corp. | 306 | 16,601 | ||||||
Vectren Corp. | 550 | 23,331 | ||||||
|
| |||||||
| 142,125 | ||||||||
|
| |||||||
Multiline Retail – 0.2% | ||||||||
Big Lots, Inc. | 345 | 13,296 | ||||||
Burlington Stores, Inc.(a) | 500 | 21,450 | ||||||
Dillard’s, Inc. Class A | 138 | 9,068 | ||||||
Fred’s, Inc. Class A | 200 | 3,274 | ||||||
JC Penney Co., Inc.(a) | 2,000 | 13,320 | ||||||
Ollie’s Bargain Outlet Holdings, Inc.(a) | 102 | 1,735 | ||||||
Sears Holdings Corp.(a) | 100 | 2,056 | ||||||
Tuesday Morning Corp.(a) | 200 | 1,300 | ||||||
|
| |||||||
| 65,499 | ||||||||
|
| |||||||
Oil, Gas & Consumable Fuels – 2.3% |
| |||||||
Alon USA Energy, Inc. | 200 | 2,968 | ||||||
Antero Resources Corp.(a) | 496 | 10,813 | ||||||
Ardmore Shipping Corp. | 100 | 1,272 | ||||||
Bill Barrett Corp.(a) | 300 | 1,179 | ||||||
Bonanza Creek Energy, Inc.(a) | 300 | 1,581 | ||||||
California Resources Corp. | 2,200 | 5,126 | ||||||
Callon Petroleum Co.(a) | 504 | 4,203 | ||||||
Carrizo Oil & Gas, Inc.(a) | 400 | 11,832 | ||||||
Cheniere Energy, Inc.(a) | 1,638 | 61,016 | ||||||
Clayton Williams Energy, Inc.(a) | 38 | 1,124 | ||||||
Clean Energy Fuels Corp.(a) | 400 | 1,440 | ||||||
Cloud Peak Energy, Inc.(a) | 600 | 1,248 | ||||||
Cobalt International Energy, Inc.(a) | 2,400 | 12,960 | ||||||
Concho Resources, Inc.(a) | 878 | 81,531 | ||||||
Continental Resources, Inc.(a) | 547 | 12,570 | ||||||
CVR Energy, Inc. | 100 | 3,935 | ||||||
Delek US Holdings, Inc. | 400 | 9,840 | ||||||
Denbury Resources, Inc. | 2,500 | 5,050 | ||||||
DHT Holdings, Inc. | 696 | 5,631 | ||||||
Diamondback Energy, Inc.(a) | 458 | 30,640 | ||||||
Dorian LPG, Ltd.(a) | 100 | 1,177 | ||||||
Eclipse Resources Corp.(a) | 400 | 728 | ||||||
Energen Corp. | 512 | 20,987 | ||||||
EP Energy Corp. Class A(a) | 200 | 876 | ||||||
EXCO Resources, Inc.(a) | 1,556 | 1,929 | ||||||
Frontline, Ltd. | 1,600 | 4,784 | ||||||
GasLog, Ltd. | 200 | 1,660 | ||||||
Gener8 Maritime, Inc.(a) | 100 | 945 | ||||||
Golar LNG, Ltd. | 600 | 9,474 | ||||||
Green Plains, Inc. | 247 | 5,656 | ||||||
Gulfport Energy Corp.(a) | 700 | 17,199 | ||||||
Halcon Resources Corp.(a) | 380 | 479 | ||||||
HollyFrontier Corp. | 1,249 | 49,823 | ||||||
Kosmos Energy, Ltd.(a) | 1,100 | 5,720 | ||||||
Laredo Petroleum, Inc.(a) | 800 | 6,392 | ||||||
Matador Resources Co.(a) | 500 | 9,885 | ||||||
Memorial Resource Development Corp.(a) | 600 | 9,690 | ||||||
Navios Maritime Acquisition Corp. | 400 | 1,204 | ||||||
Nordic American Tankers, Ltd. | 640 | 9,946 | ||||||
Northern Oil and Gas, Inc.(a) | 300 | 1,158 | ||||||
Oasis Petroleum, Inc.(a) | 900 | 6,633 | ||||||
Pacific Ethanol, Inc.(a) | 200 | 956 | ||||||
Panhandle Oil and Gas, Inc. Class A | 100 | 1,616 | ||||||
See accompanying notes to financial statements.
65
Table of Contents
State Street Small/Mid Cap Equity Index Portfolio
Schedule of Investments — (continued)
December 31, 2015
Security Description | Shares | Value | ||||||
COMMON STOCKS – (continued) | ||||||||
Oil, Gas & Consumable Fuels – (continued) |
| |||||||
Par Pacific Holdings, Inc.(a) | 100 | $ | 2,354 | |||||
Parsley Energy, Inc. Class A(a) | 604 | 11,144 | ||||||
PBF Energy, Inc. Class A | 649 | 23,890 | ||||||
PDC Energy, Inc.(a) | 260 | 13,879 | ||||||
Peabody Energy Corp. | 93 | 714 | ||||||
QEP Resources, Inc. | 1,200 | 16,080 | ||||||
Renewable Energy Group, Inc.(a) | 200 | 1,858 | ||||||
REX American Resources Corp.(a) | 34 | 1,838 | ||||||
Rice Energy, Inc.(a) | 527 | 5,744 | ||||||
Ring Energy, Inc.(a) | 200 | 1,410 | ||||||
RSP Permian, Inc.(a) | 461 | 11,244 | ||||||
Sanchez Energy Corp.(a) | 300 | 1,293 | ||||||
SandRidge Energy, Inc.(a) | 2,300 | 460 | ||||||
Scorpio Tankers, Inc. | 1,200 | 9,624 | ||||||
SemGroup Corp. Class A | 329 | 9,495 | ||||||
Ship Finance International, Ltd. | 400 | 6,628 | ||||||
SM Energy Co. | 452 | 8,886 | ||||||
Solazyme, Inc.(a) | 400 | 992 | ||||||
Stone Energy Corp.(a) | 300 | 1,287 | ||||||
Synergy Resources Corp.(a) | 700 | 5,964 | ||||||
Targa Resources Corp. | 400 | 10,824 | ||||||
Teekay Corp. | 343 | 3,385 | ||||||
Teekay Tankers, Ltd. Class A | 700 | 4,816 | ||||||
Ultra Petroleum Corp.(a) | 800 | 2,000 | ||||||
Western Refining, Inc. | 462 | 16,456 | ||||||
Westmoreland Coal Co.(a) | 100 | 588 | ||||||
Whiting Petroleum Corp.(a) | 1,400 | 13,216 | ||||||
World Fuel Services Corp. | 500 | 19,230 | ||||||
WPX Energy, Inc.(a) | 1,600 | 9,184 | ||||||
|
| |||||||
| 649,359 | ||||||||
|
| |||||||
Paper & Forest Products – 0.3% |
| |||||||
Boise Cascade Co.(a) | 300 | 7,659 | ||||||
Clearwater Paper Corp.(a) | 141 | 6,420 | ||||||
Deltic Timber Corp. | 71 | 4,180 | ||||||
Domtar Corp. | 414 | 15,297 | ||||||
KapStone Paper and Packaging Corp. | 598 | 13,509 | ||||||
Louisiana-Pacific Corp.(a) | 926 | 16,677 | ||||||
Neenah Paper, Inc. | 100 | 6,243 | ||||||
PH Glatfelter Co. | 300 | 5,532 | ||||||
Schweitzer-Mauduit International, Inc. | 200 | 8,398 | ||||||
Wausau Paper Corp. | 200 | 2,046 | ||||||
|
| |||||||
| 85,961 | ||||||||
|
| |||||||
Personal Products – 0.4% | ||||||||
Avon Products, Inc. | 3,000 | 12,150 | ||||||
Coty, Inc. Class A | 578 | 14,814 | ||||||
Edgewell Personal Care Co. | 427 | 33,464 | ||||||
Elizabeth Arden, Inc.(a) | 200 | 1,980 | ||||||
Herbalife, Ltd.(a) | 505 | 27,078 | ||||||
Inter Parfums, Inc. | 100 | 2,382 | ||||||
Medifast, Inc. | 100 | 3,038 | ||||||
Natural Health Trends Corp. | 51 | 1,710 | ||||||
Nature’s Sunshine Products, Inc. | 100 | 1,012 | ||||||
Nu Skin Enterprises, Inc. Class A | 400 | 15,156 | ||||||
Nutraceutical International Corp.(a) | 100 | 2,582 | ||||||
Revlon, Inc. Class A(a) | 100 | 2,784 | ||||||
USANA Health Sciences, Inc.(a) | 37 | 4,727 | ||||||
|
| |||||||
| 122,877 | ||||||||
|
| |||||||
Pharmaceuticals – 1.1% | ||||||||
Aclaris Therapeutics, Inc.(a) | 58 | 1,563 | ||||||
Aerie Pharmaceuticals, Inc.(a) | 100 | 2,435 | ||||||
Akorn, Inc.(a) | 544 | 20,297 | ||||||
Amphastar Pharmaceuticals, Inc.(a) | 200 | 2,846 | ||||||
ANI Pharmaceuticals, Inc.(a) | 41 | 1,850 | ||||||
Aratana Therapeutics, Inc.(a) | 200 | 1,116 | ||||||
Assembly Biosciences, Inc.(a) | 100 | 751 | ||||||
BioDelivery Sciences International, Inc.(a) | 200 | 958 | ||||||
Catalent, Inc.(a) | 582 | 14,567 | ||||||
Cempra, Inc.(a) | 200 | 6,226 | ||||||
Collegium Pharmaceutical, Inc.(a) | 67 | 1,842 | ||||||
Corcept Therapeutics, Inc.(a) | 300 | 1,494 | ||||||
Depomed, Inc.(a) | 400 | 7,252 | ||||||
Dermira, Inc.(a) | 100 | 3,461 | ||||||
Durect Corp.(a) | 600 | 1,326 | ||||||
Endocyte, Inc.(a) | 400 | 1,604 | ||||||
Foamix Pharmaceuticals, Ltd.(a) | 200 | 1,622 | ||||||
Heska Corp.(a) | 58 | 2,243 | ||||||
Impax Laboratories, Inc.(a) | 466 | 19,926 | ||||||
Intersect ENT, Inc.(a) | 100 | 2,250 | ||||||
Intra-Cellular Therapies, Inc.(a) | 192 | 10,328 | ||||||
Jazz Pharmaceuticals PLC(a) | 416 | 58,473 | ||||||
Lannett Co., Inc.(a) | 197 | 7,904 | ||||||
Medicines Co.(a) | 459 | 17,139 | ||||||
Nektar Therapeutics(a) | 900 | 15,165 | ||||||
Ocular Therapeutix, Inc.(a) | 100 | 937 | ||||||
Omeros Corp.(a) | 200 | 3,146 | ||||||
Pacira Pharmaceuticals, Inc.(a) | 237 | 18,199 | ||||||
Paratek Pharmaceuticals, Inc.(a) | 100 | 1,897 | ||||||
Phibro Animal Health Corp. Class A | 100 | 3,013 | ||||||
POZEN, Inc.(a) | 151 | 1,031 | ||||||
Prestige Brands Holdings, Inc.(a) | 400 | 20,592 | ||||||
Relypsa, Inc.(a) | 200 | 5,668 | ||||||
Revance Therapeutics, Inc.(a) | 100 | 3,416 | ||||||
Sagent Pharmaceuticals, Inc.(a) | 100 | 1,591 | ||||||
SciClone Pharmaceuticals, Inc.(a) | 300 | 2,760 | ||||||
Sucampo Pharmaceuticals, Inc. Class A(a) | 162 | 2,801 | ||||||
Supernus Pharmaceuticals, Inc.(a) | 200 | 2,688 | ||||||
Teligent, Inc.(a) | 200 | 1,780 | ||||||
Tetraphase Pharmaceuticals, Inc.(a) | 200 | 2,006 | ||||||
TherapeuticsMD, Inc.(a) | 900 | 9,333 | ||||||
Theravance Biopharma, Inc.(a) | 204 | 3,344 | ||||||
Theravance, Inc. | 600 | 6,324 | ||||||
XenoPort, Inc.(a) | 300 | 1,647 | ||||||
Zogenix, Inc.(a) | 100 | 1,474 | ||||||
|
| |||||||
| 298,285 | ||||||||
|
| |||||||
Professional Services – 1.2% | ||||||||
Acacia Research Corp. | 300 | 1,287 | ||||||
Advisory Board Co.(a) | 328 | 16,272 | ||||||
Barrett Business Services, Inc. | 39 | 1,698 | ||||||
CBIZ, Inc.(a) | 300 | 2,958 | ||||||
CEB, Inc. | 232 | 14,242 | ||||||
CRA International, Inc.(a) | 100 | 1,865 | ||||||
Exponent, Inc. | 187 | 9,341 | ||||||
Franklin Covey Co.(a) | 100 | 1,674 | ||||||
FTI Consulting, Inc.(a) | 270 | 9,358 | ||||||
GP Strategies Corp.(a) | 100 | 2,511 | ||||||
Heidrick & Struggles International, Inc. | 100 | 2,722 | ||||||
See accompanying notes to financial statements.
66
Table of Contents
State Street Small/Mid Cap Equity Index Portfolio
Schedule of Investments — (continued)
December 31, 2015
Security Description | Shares | Value | ||||||
COMMON STOCKS – (continued) | ||||||||
Professional Services – (continued) |
| |||||||
Huron Consulting Group, Inc.(a) | 167 | $ | 9,920 | |||||
ICF International, Inc.(a) | 148 | 5,263 | ||||||
IHS, Inc. Class A(a) | 470 | 55,662 | ||||||
Insperity, Inc. | 143 | 6,885 | ||||||
Kelly Services, Inc. Class A | 200 | 3,230 | ||||||
Kforce, Inc. | 200 | 5,056 | ||||||
Korn/Ferry International | 355 | 11,779 | ||||||
ManpowerGroup, Inc. | 504 | 42,482 | ||||||
Mistras Group, Inc.(a) | 100 | 1,909 | ||||||
Navigant Consulting, Inc.(a) | 300 | 4,818 | ||||||
On Assignment, Inc.(a) | 360 | 16,182 | ||||||
Pendrell Corp.(a) | 800 | 401 | ||||||
Resources Connection, Inc. | 200 | 3,268 | ||||||
RPX Corp.(a) | 300 | 3,300 | ||||||
Towers Watson & Co. Class A | 473 | 60,762 | ||||||
TransUnion(a) | 200 | 5,514 | ||||||
TriNet Group, Inc.(a) | 300 | 5,805 | ||||||
TrueBlue, Inc.(a) | 300 | 7,728 | ||||||
VSE Corp. | 40 | 2,487 | ||||||
WageWorks, Inc.(a) | 254 | 11,524 | ||||||
|
| |||||||
| 327,903 | ||||||||
|
| |||||||
Real Estate Investment Trusts (REITS) – 9.9% |
| |||||||
Acadia Realty Trust | 447 | 14,818 | ||||||
AG Mortgage Investment Trust, Inc. | 200 | 2,568 | ||||||
Agree Realty Corp. | 156 | 5,302 | ||||||
Alexander’s, Inc. | 16 | 6,146 | ||||||
Alexandria Real Estate Equities, Inc. | 493 | 44,548 | ||||||
Altisource Residential Corp. | 427 | 5,299 | ||||||
American Assets Trust, Inc. | 242 | 9,281 | ||||||
American Campus Communities, Inc. | 772 | 31,914 | ||||||
American Capital Agency Corp. | 2,393 | 41,495 | ||||||
American Capital Mortgage Investment Corp. | 300 | 4,188 | ||||||
American Homes 4 Rent Class A | 1,100 | 18,326 | ||||||
American Residential Properties, Inc. | 200 | 3,780 | ||||||
Annaly Capital Management, Inc. | 6,460 | 60,595 | ||||||
Anworth Mortgage Asset Corp. | 500 | 2,175 | ||||||
Apollo Commercial Real Estate Finance, Inc. | 400 | 6,892 | ||||||
Apollo Residential Mortgage, Inc. | 200 | 2,390 | ||||||
Apple Hospitality REIT, Inc. | 1,200 | 23,964 | ||||||
Ares Commercial Real Estate Corp. | 100 | 1,144 | ||||||
Armada Hoffler Properties, Inc. | 200 | 2,096 | ||||||
ARMOUR Residential REIT, Inc. | 300 | 6,528 | ||||||
Ashford Hospitality Prime, Inc. | 223 | 3,234 | ||||||
Ashford Hospitality Trust, Inc. | 651 | 4,108 | ||||||
BioMed Realty Trust, Inc. | 1,399 | 33,142 | ||||||
Bluerock Residential Growth REIT,Inc. | 100 | 1,185 | ||||||
Brandywine Realty Trust | 1,200 | 16,392 | ||||||
Brixmor Property Group, Inc. | 1,191 | 30,752 | ||||||
Camden Property Trust | 574 | 44,060 | ||||||
Campus Crest Communities, Inc. | 300 | 2,040 | ||||||
Capstead Mortgage Corp. | 710 | 6,205 | ||||||
Care Capital Properties, Inc. | 552 | 16,875 | ||||||
CareTrust REIT, Inc. | 400 | 4,380 | ||||||
CatchMark Timber Trust, Inc. Class A | 200 | 2,262 | ||||||
CBL & Associates Properties, Inc. | 1,100 | 13,607 | ||||||
Cedar Realty Trust, Inc. | 553 | 3,915 | ||||||
Chatham Lodging Trust | 283 | 5,796 | ||||||
Chesapeake Lodging Trust | 400 | 10,064 | ||||||
Chimera Investment Corp. | 1,315 | 17,937 | ||||||
Colony Capital, Inc. Class A | 782 | 15,233 | ||||||
Colony Starwood Homes | 283 | 6,407 | ||||||
Columbia Property Trust, Inc. | 869 | 20,404 | ||||||
Communications Sales & Leasing, Inc.(a) | 800 | 14,952 | ||||||
CorEnergy Infrastructure Trust, Inc. | 60 | 890 | ||||||
CoreSite Realty Corp. | 174 | 9,869 | ||||||
Corporate Office Properties Trust | 600 | 13,098 | ||||||
Corrections Corp. of America | 771 | 20,424 | ||||||
Cousins Properties, Inc. | 1,500 | 14,145 | ||||||
CubeSmart | 1,142 | 34,968 | ||||||
CyrusOne, Inc. | 446 | 16,703 | ||||||
CYS Investments, Inc. | 1,100 | 7,843 | ||||||
DCT Industrial Trust, Inc. | 600 | 22,422 | ||||||
DDR Corp. | 2,000 | 33,680 | ||||||
DiamondRock Hospitality Co. | 1,300 | 12,545 | ||||||
Digital Realty Trust, Inc. | 1,014 | 76,679 | ||||||
Douglas Emmett, Inc. | 961 | 29,964 | ||||||
Duke Realty Corp. | 2,358 | 49,565 | ||||||
DuPont Fabros Technology, Inc. | 400 | 12,716 | ||||||
Dynex Capital, Inc. | 300 | 1,905 | ||||||
Easterly Government Properties, Inc. | 100 | 1,718 | ||||||
EastGroup Properties, Inc. | 228 | 12,679 | ||||||
Education Realty Trust, Inc. | 396 | 15,000 | ||||||
Empire State Realty Trust, Inc. Class A | 724 | 13,083 | ||||||
EPR Properties | 372 | 21,743 | ||||||
Equity Commonwealth(a) | 843 | 23,376 | ||||||
Equity LifeStyle Properties, Inc. | 578 | 38,535 | ||||||
Equity One, Inc. | 500 | 13,575 | ||||||
Extra Space Storage, Inc. | 836 | 73,744 | ||||||
Federal Realty Investment Trust | 468 | 68,375 | ||||||
FelCor Lodging Trust, Inc. | 1,000 | 7,300 | ||||||
First Industrial Realty Trust, Inc. | 773 | 17,107 | ||||||
First Potomac Realty Trust | 446 | 5,084 | ||||||
Four Corners Property Trust, Inc.(a) | 300 | 7,248 | ||||||
Franklin Street Properties Corp. | 661 | 6,841 | ||||||
Gaming and Leisure Properties, Inc. | 560 | 15,568 | ||||||
GEO Group, Inc. | 500 | 14,455 | ||||||
Getty Realty Corp. | 205 | 3,516 | ||||||
Gladstone Commercial Corp. | 100 | 1,459 | ||||||
Government Properties Income Trust | 457 | 7,253 | ||||||
Gramercy Property Trust | 2,876 | 22,202 | ||||||
Hannon Armstrong Sustainable Infrastructure Capital, Inc. | 287 | 5,430 | ||||||
Hatteras Financial Corp. | 700 | 9,205 | ||||||
Healthcare Realty Trust, Inc. | 653 | 18,493 | ||||||
Healthcare Trust of America, Inc. Class A | 866 | 23,356 | ||||||
Hersha Hospitality Trust | 300 | 6,528 | ||||||
Highwoods Properties, Inc. | 648 | 28,253 | ||||||
Hospitality Properties Trust | 1,000 | 26,150 | ||||||
Hudson Pacific Properties, Inc. | 500 | 14,070 | ||||||
Independence Realty Trust, Inc. | 173 | 1,299 | ||||||
InfraREIT, Inc.(a) | 100 | 1,850 | ||||||
Inland Real Estate Corp. | 600 | 6,372 | ||||||
Invesco Mortgage Capital, Inc. | 800 | 9,912 | ||||||
Investors Real Estate Trust | 900 | 6,255 | ||||||
iStar, Inc.(a) | 600 | 7,038 | ||||||
See accompanying notes to financial statements.
67
Table of Contents
State Street Small/Mid Cap Equity Index Portfolio
Schedule of Investments — (continued)
December 31, 2015
Security Description | Shares | Value | ||||||
COMMON STOCKS – (continued) | ||||||||
Real Estate Investment Trusts (REITS) – (continued) |
| |||||||
Kilroy Realty Corp. | 604 | $ | 38,221 | |||||
Kite Realty Group Trust | 583 | 15,117 | ||||||
Ladder Capital Corp. | 200 | 2,484 | ||||||
Lamar Advertising Co. Class A | 541 | 32,449 | ||||||
LaSalle Hotel Properties | 776 | 19,524 | ||||||
Lexington Realty Trust | 1,400 | 11,200 | ||||||
Liberty Property Trust | 1,000 | 31,050 | ||||||
LTC Properties, Inc. | 254 | 10,958 | ||||||
Mack-Cali Realty Corp. | 600 | 14,010 | ||||||
Medical Properties Trust, Inc. | 1,577 | 18,151 | ||||||
MFA Financial, Inc. | 2,500 | 16,500 | ||||||
Mid-America Apartment Communities, Inc. | 500 | 45,405 | ||||||
Monmouth Real Estate Investment Corp. | 479 | 5,010 | ||||||
Monogram Residential Trust, Inc. | 1,100 | 10,736 | ||||||
National Health Investors, Inc. | 243 | 14,791 | ||||||
National Retail Properties, Inc. | 919 | 36,806 | ||||||
National Storage Affiliates Trust | 100 | 1,713 | ||||||
New Residential Investment Corp. | 1,500 | 18,240 | ||||||
New Senior Investment Group, Inc. | 600 | 5,916 | ||||||
New York Mortgage Trust, Inc. | 600 | 3,198 | ||||||
New York REIT, Inc. | 1,100 | 12,650 | ||||||
NexPoint Residential Trust, Inc. | 100 | 1,309 | ||||||
NorthStar Realty Europe Corp. | 400 | 4,724 | ||||||
NorthStar Realty Finance Corp. | 1,200 | 20,436 | ||||||
Omega Healthcare Investors, Inc. | 1,251 | 43,760 | ||||||
One Liberty Properties, Inc. | 100 | 2,146 | ||||||
Orchid Island Capital, Inc. | 100 | 993 | ||||||
Outfront Media, Inc. | 891 | 19,451 | ||||||
Paramount Group, Inc. | 1,200 | 21,720 | ||||||
Parkway Properties, Inc. | 600 | 9,378 | ||||||
Pebblebrook Hotel Trust | 500 | 14,010 | ||||||
Pennsylvania Real Estate Investment Trust | 492 | 10,760 | ||||||
PennyMac Mortgage Investment Trust | 541 | 8,256 | ||||||
Physicians Realty Trust | 600 | 10,116 | ||||||
Piedmont Office Realty Trust, Inc. Class A | 1,000 | 18,880 | ||||||
Post Properties, Inc. | 355 | 21,002 | ||||||
Potlatch Corp. | 300 | 9,072 | ||||||
Preferred Apartment Communities, Inc. Class A | 200 | 2,616 | ||||||
PS Business Parks, Inc. | 127 | 11,104 | ||||||
QTS Realty Trust, Inc. Class A | 202 | 9,112 | ||||||
RAIT Financial Trust | 400 | 1,080 | ||||||
Ramco-Gershenson Properties Trust | 500 | 8,305 | ||||||
Rayonier, Inc. | 862 | 19,136 | ||||||
Redwood Trust, Inc. | 600 | 7,920 | ||||||
Regency Centers Corp. | 645 | 43,937 | ||||||
Resource Capital Corp. | 175 | 2,233 | ||||||
Retail Opportunity Investments Corp. | 700 | 12,530 | ||||||
Retail Properties of America, Inc. Class A | 1,600 | 23,632 | ||||||
Rexford Industrial Realty, Inc. | 407 | 6,659 | ||||||
RLJ Lodging Trust | 900 | 19,467 | ||||||
Rouse Properties, Inc. | 200 | 2,912 | ||||||
Ryman Hospitality Properties, Inc. | 283 | 14,614 | ||||||
Sabra Health Care REIT, Inc. | 400 | 8,092 | ||||||
Saul Centers, Inc. | 51 | 2,615 | ||||||
Select Income REIT | 400 | 7,928 | ||||||
Senior Housing Properties Trust | 1,600 | 23,744 | ||||||
Silver Bay Realty Trust Corp. | 200 | 3,132 | ||||||
Sovran Self Storage, Inc. | 245 | 26,291 | ||||||
Spirit Realty Capital, Inc. | 2,900 | 29,058 | ||||||
STAG Industrial, Inc. | 400 | 7,380 | ||||||
Starwood Property Trust, Inc. | 1,600 | 32,896 | ||||||
STORE Capital Corp. | 300 | 6,960 | ||||||
Summit Hotel Properties, Inc. | 600 | 7,170 | ||||||
Sun Communities, Inc. | 343 | 23,506 | ||||||
Sunstone Hotel Investors, Inc. | 1,400 | 17,486 | ||||||
Tanger Factory Outlet Centers, Inc. | 658 | 21,517 | ||||||
Taubman Centers, Inc. | 425 | 32,606 | ||||||
Terreno Realty Corp. | 300 | 6,786 | ||||||
Two Harbors Investment Corp. | 2,400 | 19,440 | ||||||
UDR, Inc. | 1,765 | 66,311 | ||||||
UMH Properties, Inc. | 100 | 1,012 | ||||||
United Development Funding IV | 200 | 2,200 | ||||||
Universal Health Realty Income Trust | 100 | 5,001 | ||||||
Urban Edge Properties | 600 | 14,070 | ||||||
Urstadt Biddle Properties, Inc. Class A | 200 | 3,848 | ||||||
VEREIT, Inc. | 6,184 | 48,977 | ||||||
Washington Real Estate Investment Trust | 456 | 12,339 | ||||||
Weingarten Realty Investors | 853 | 29,497 | ||||||
Western Asset Mortgage Capital Corp. | 200 | 2,044 | ||||||
Whitestone REIT | 100 | 1,201 | ||||||
WP Carey, Inc. | 714 | 42,126 | ||||||
WP Glimcher, Inc. | 1,200 | 12,732 | ||||||
Xenia Hotels & Resorts, Inc. | 800 | 12,264 | ||||||
|
| |||||||
| 2,773,515 | ||||||||
|
| |||||||
Real Estate Management & Development – 0.7% |
| |||||||
Alexander & Baldwin, Inc. | 318 | 11,228 | ||||||
Altisource Portfolio Solutions SA(a) | 100 | 2,781 | ||||||
AV Homes, Inc.(a) | 100 | 1,281 | ||||||
Consolidated-Tomoka Land Co. | 23 | 1,212 | ||||||
Forest City Enterprises, Inc. Class A(a) | 1,501 | 32,917 | ||||||
Forestar Group, Inc.(a) | 200 | 2,188 | ||||||
FRP Holdings, Inc.(a) | 45 | 1,527 | ||||||
Howard Hughes Corp.(a) | 273 | 30,893 | ||||||
Jones Lang LaSalle, Inc. | 307 | 49,077 | ||||||
Kennedy-Wilson Holdings, Inc. | 600 | 14,448 | ||||||
Marcus & Millichap, Inc.(a) | 100 | 2,914 | ||||||
RE/MAX Holdings, Inc. Class A | 100 | 3,730 | ||||||
Realogy Holdings Corp.(a) | 1,025 | 37,587 | ||||||
RMR Group, Inc. Class A(a) | 46 | 663 | ||||||
St. Joe Co.(a) | 400 | 7,404 | ||||||
Tejon Ranch Co.(a) | 100 | 1,915 | ||||||
|
| |||||||
| 201,765 | ||||||||
|
| |||||||
Road & Rail – 0.7% | ||||||||
AMERCO | 47 | 18,307 | ||||||
ArcBest Corp. | 200 | 4,278 | ||||||
Avis Budget Group, Inc.(a) | 652 | 23,661 | ||||||
Celadon Group, Inc. | 100 | 989 | ||||||
Covenant Transportation Group, Inc. Class A(a) | 100 | 1,889 | ||||||
Genesee & Wyoming, Inc. Class A(a) | 393 | 21,100 | ||||||
Heartland Express, Inc. | 300 | 5,106 | ||||||
See accompanying notes to financial statements.
68
Table of Contents
State Street Small/Mid Cap Equity Index Portfolio
Schedule of Investments — (continued)
December 31, 2015
Security Description | Shares | Value | ||||||
COMMON STOCKS – (continued) | ||||||||
Road & Rail – (continued) | ||||||||
Hertz Global Holdings, Inc.(a) | 2,780 | $ | 39,559 | |||||
Knight Transportation, Inc. | 400 | 9,692 | ||||||
Landstar System, Inc. | 289 | 16,950 | ||||||
Marten Transport, Ltd. | 193 | 3,416 | ||||||
Old Dominion Freight Line, Inc.(a) | 481 | 28,413 | ||||||
Roadrunner Transportation Systems, Inc.(a) | 200 | 1,886 | ||||||
Saia, Inc.(a) | 200 | 4,450 | ||||||
Swift Transportation Co.(a) | 631 | 8,720 | ||||||
USA Truck, Inc.(a) | 100 | 1,745 | ||||||
Werner Enterprises, Inc. | 300 | 7,017 | ||||||
YRC Worldwide, Inc.(a) | 200 | 2,836 | ||||||
|
| |||||||
| 200,014 | ||||||||
|
| |||||||
Semiconductors & Semiconductor Equipment –2.2% |
| |||||||
Advanced Energy Industries, Inc.(a) | 300 | 8,469 | ||||||
Advanced Micro Devices, Inc.(a) | 4,400 | 12,628 | ||||||
Alpha & Omega Semiconductor, Ltd.(a) | 187 | 1,719 | ||||||
Ambarella, Inc.(a) | 200 | 11,148 | ||||||
Amkor Technology, Inc.(a) | 752 | 4,572 | ||||||
Applied Micro Circuits Corp.(a) | 400 | 2,548 | ||||||
Atmel Corp. | 2,800 | 24,108 | ||||||
Axcelis Technologies, Inc.(a) | 600 | 1,554 | ||||||
Brooks Automation, Inc. | 500 | 5,340 | ||||||
Cabot Microelectronics Corp.(a) | 181 | 7,924 | ||||||
Cascade Microtech, Inc.(a) | 100 | 1,625 | ||||||
Cavium, Inc.(a) | 360 | 23,656 | ||||||
CEVA, Inc.(a) | 100 | 2,336 | ||||||
Cirrus Logic, Inc.(a) | 440 | 12,993 | ||||||
Cohu, Inc. | 200 | 2,414 | ||||||
Cree, Inc.(a) | 700 | 18,669 | ||||||
Cypress Semiconductor Corp.(a) | 2,206 | 21,641 | ||||||
Diodes, Inc.(a) | 277 | 6,365 | ||||||
DSP Group, Inc.(a) | 100 | 944 | ||||||
Entegris, Inc.(a) | 1,000 | 13,270 | ||||||
Exar Corp.(a) | 200 | 1,226 | ||||||
Fairchild Semiconductor International, Inc.(a) | 800 | 16,568 | ||||||
FormFactor, Inc.(a) | 300 | 2,700 | ||||||
Inphi Corp.(a) | 249 | 6,728 | ||||||
Integrated Device Technology, Inc.(a) | 1,000 | 26,350 | ||||||
Intersil Corp. Class A | 900 | 11,484 | ||||||
IXYS Corp. | 130 | 1,642 | ||||||
Kopin Corp.(a) | 400 | 1,088 | ||||||
Lattice Semiconductor Corp.(a) | 880 | 5,694 | ||||||
M/A-COM Technology Solutions Holdings, Inc.(a) | 152 | 6,215 | ||||||
Marvell Technology Group, Ltd. | 3,000 | 26,460 | ||||||
Mattson Technology, Inc.(a) | 500 | 1,765 | ||||||
Maxim Integrated Products, Inc. | 1,951 | 74,138 | ||||||
MaxLinear, Inc. Class A(a) | 300 | 4,419 | ||||||
Microsemi Corp.(a) | 655 | 21,346 | ||||||
MKS Instruments, Inc. | 347 | 12,492 | ||||||
Monolithic Power Systems, Inc. | 257 | 16,373 | ||||||
Nanometrics, Inc.(a) | 100 | 1,514 | ||||||
NeoPhotonics Corp.(a) | 200 | 2,172 | ||||||
NVE Corp. | 26 | 1,461 | ||||||
OmniVision Technologies, Inc.(a) | 400 | 11,608 | ||||||
ON Semiconductor Corp.(a) | 2,800 | 27,440 | ||||||
PDF Solutions, Inc.(a) | 100 | 1,084 | ||||||
Photronics, Inc.(a) | 500 | 6,225 | ||||||
PMC-Sierra, Inc.(a) | 1,200 | 13,944 | ||||||
Power Integrations, Inc. | 200 | 9,726 | ||||||
Rambus, Inc.(a) | 800 | 9,272 | ||||||
Rudolph Technologies, Inc.(a) | 200 | 2,844 | ||||||
Semtech Corp.(a) | 432 | 8,173 | ||||||
Sigma Designs, Inc.(a) | 200 | 1,264 | ||||||
Silicon Laboratories, Inc.(a) | 329 | 15,970 | ||||||
SunEdison, Inc.(a) | 1,800 | 9,162 | ||||||
SunPower Corp.(a) | 355 | 10,654 | ||||||
Synaptics, Inc.(a) | 238 | 19,121 | ||||||
Teradyne, Inc. | 1,475 | 30,488 | ||||||
Tessera Technologies, Inc. | 342 | 10,263 | ||||||
Ultra Clean Holdings, Inc.(a) | 200 | 1,024 | ||||||
Ultratech, Inc.(a) | 222 | 4,400 | ||||||
Veeco Instruments, Inc.(a) | 301 | 6,189 | ||||||
Xcerra Corp.(a) | 300 | 1,815 | ||||||
|
| |||||||
| 626,424 | ||||||||
|
| |||||||
Software – 4.5% | ||||||||
A10 Networks, Inc.(a) | 200 | 1,312 | ||||||
ACI Worldwide, Inc.(a) | 800 | 17,120 | ||||||
American Software, Inc. Class A | 200 | 2,036 | ||||||
ANSYS, Inc.(a) | 612 | 56,610 | ||||||
Aspen Technology, Inc.(a) | 555 | 20,957 | ||||||
AVG Technologies NV(a) | 300 | 6,015 | ||||||
Barracuda Networks, Inc.(a) | 100 | 1,868 | ||||||
Blackbaud, Inc. | 305 | 20,087 | ||||||
Bottomline Technologies de, Inc.(a) | 300 | 8,919 | ||||||
BroadSoft, Inc.(a) | 212 | 7,496 | ||||||
Cadence Design Systems, Inc.(a) | 2,002 | 41,662 | ||||||
Callidus Software, Inc.(a) | 403 | 7,484 | ||||||
CDK Global, Inc. | 1,095 | 51,980 | ||||||
CommVault Systems, Inc.(a) | 294 | 11,569 | ||||||
Digimarc Corp.(a) | 40 | 1,460 | ||||||
Ebix, Inc. | 200 | 6,558 | ||||||
Ellie Mae, Inc.(a) | 190 | 11,444 | ||||||
EnerNOC, Inc.(a) | 200 | 770 | ||||||
Epiq Systems, Inc. | 200 | 2,614 | ||||||
Fair Isaac Corp. | 200 | 18,836 | ||||||
FireEye, Inc.(a) | 953 | 19,765 | ||||||
Fleetmatics Group PLC(a) | 300 | 15,237 | ||||||
Fortinet, Inc.(a) | 982 | 30,609 | ||||||
Gigamon, Inc.(a) | 200 | 5,314 | ||||||
Globant SA(a) | 100 | 3,751 | ||||||
Glu Mobile, Inc.(a) | 600 | 1,458 | ||||||
Guidewire Software, Inc.(a) | 483 | 29,057 | ||||||
HubSpot, Inc.(a) | 138 | 7,771 | ||||||
Imperva, Inc.(a) | 173 | 10,953 | ||||||
Infoblox, Inc.(a) | 417 | 7,669 | ||||||
Interactive Intelligence Group, Inc.(a) | 100 | 3,142 | ||||||
Jive Software, Inc.(a) | 250 | 1,020 | ||||||
King Digital Entertainment PLC | 523 | 9,351 | ||||||
Manhattan Associates, Inc.(a) | 506 | 33,482 | ||||||
Mentor Graphics Corp. | 700 | 12,894 | ||||||
MicroStrategy, Inc. Class A(a) | 60 | 10,757 | ||||||
MobileIron, Inc.(a) | 404 | 1,458 | ||||||
Model N, Inc.(a) | 200 | 2,232 | ||||||
Monotype Imaging Holdings, Inc. | 293 | 6,927 | ||||||
NetSuite, Inc.(a) | 277 | 23,440 | ||||||
Nuance Communications, Inc.(a) | 1,700 | 33,813 | ||||||
See accompanying notes to financial statements.
69
Table of Contents
State Street Small/Mid Cap Equity Index Portfolio
Schedule of Investments — (continued)
December 31, 2015
Security Description | Shares | Value | ||||||
COMMON STOCKS – (continued) | ||||||||
Software – (continued) | ||||||||
Park City Group, Inc.(a) | 100 | $ | 1,191 | |||||
Paycom Software, Inc.(a) | 200 | 7,526 | ||||||
Paylocity Holding Corp.(a) | 100 | 4,055 | ||||||
Pegasystems, Inc. | 261 | 7,177 | ||||||
Progress Software Corp.(a) | 300 | 7,200 | ||||||
Proofpoint, Inc.(a) | 256 | 16,643 | ||||||
PROS Holdings, Inc.(a) | 200 | 4,608 | ||||||
PTC, Inc.(a) | 793 | 27,462 | ||||||
QAD, Inc. Class A | 100 | 2,052 | ||||||
Qlik Technologies, Inc.(a) | 600 | 18,996 | ||||||
Qualys, Inc.(a) | 164 | 5,427 | ||||||
RealPage, Inc.(a) | 381 | 8,553 | ||||||
RingCentral, Inc. Class A(a) | 385 | 9,078 | ||||||
Rovi Corp.(a) | 500 | 8,330 | ||||||
Rubicon Project, Inc.(a) | 207 | 3,405 | ||||||
Sapiens International Corp. NV | 100 | 1,020 | ||||||
Seachange International, Inc.(a) | 200 | 1,348 | ||||||
ServiceNow, Inc.(a) | 1,046 | 90,542 | ||||||
Silver Spring Networks, Inc.(a) | 200 | 2,882 | ||||||
SolarWinds, Inc.(a) | 407 | 23,972 | ||||||
Solera Holdings, Inc. | 450 | 24,673 | ||||||
Splunk, Inc.(a) | 884 | 51,988 | ||||||
SS&C Technologies Holdings, Inc. | 557 | 38,026 | ||||||
Synchronoss Technologies, Inc.(a) | 252 | 8,878 | ||||||
Synopsys, Inc.(a) | 1,060 | 48,347 | ||||||
Tableau Software, Inc. Class A(a) | 341 | 32,129 | ||||||
Take-Two Interactive Software, Inc.(a) | 550 | 19,162 | ||||||
Tangoe, Inc.(a) | 200 | 1,678 | ||||||
TeleCommunication Systems, Inc. Class A(a) | 486 | 2,415 | ||||||
Telenav, Inc.(a) | 152 | 865 | ||||||
TiVo, Inc.(a) | 717 | 6,188 | ||||||
TubeMogul, Inc.(a) | 158 | 2,149 | ||||||
Tyler Technologies, Inc.(a) | 231 | 40,268 | ||||||
Ultimate Software Group, Inc.(a) | 196 | 38,320 | ||||||
Varonis Systems, Inc.(a) | 90 | 1,692 | ||||||
VASCO Data Security International, Inc.(a) | 200 | 3,346 | ||||||
Verint Systems, Inc.(a) | 429 | 17,400 | ||||||
VMware, Inc. Class A(a) | 547 | 30,944 | ||||||
Workday, Inc. Class A(a) | 724 | 57,688 | ||||||
Xura, Inc.(a) | 174 | 4,277 | ||||||
Zendesk, Inc.(a) | 387 | 10,232 | ||||||
Zix Corp.(a) | 300 | 1,524 | ||||||
Zynga, Inc. Class A(a) | 5,200 | 13,936 | ||||||
|
| |||||||
| 1,274,489 | ||||||||
|
| |||||||
Specialty Retail – 2.4% | ||||||||
Aaron’s, Inc. | 438 | 9,807 | ||||||
Abercrombie & Fitch Co. Class A | 496 | 13,392 | ||||||
America’s Car-Mart, Inc.(a) | 44 | 1,174 | ||||||
American Eagle Outfitters, Inc. | 1,300 | 20,150 | ||||||
Asbury Automotive Group, Inc.(a) | 177 | 11,937 | ||||||
Ascena Retail Group, Inc.(a) | 1,163 | 11,456 | ||||||
Barnes & Noble Education, Inc.(a) | 200 | 1,990 | ||||||
Barnes & Noble, Inc. | 300 | 2,613 | ||||||
Big 5 Sporting Goods Corp. | 100 | 999 | ||||||
Boot Barn Holdings, Inc.(a) | 100 | 1,229 | ||||||
Buckle, Inc. | 184 | 5,664 | ||||||
Build-A-Bear Workshop, Inc.(a) | 100 | 1,224 | ||||||
Cabela’s, Inc.(a) | 353 | 16,496 | ||||||
Caleres, Inc. | 300 | 8,046 | ||||||
Cato Corp. Class A | 200 | 7,364 | ||||||
Chico’s FAS, Inc. | 1,000 | 10,670 | ||||||
Children’s Place, Inc. | 151 | 8,335 | ||||||
Citi Trends, Inc. | 100 | 2,125 | ||||||
Conn’s, Inc.(a) | 143 | 3,356 | ||||||
Container Store Group, Inc.(a) | 100 | 820 | ||||||
CST Brands, Inc. | 500 | 19,570 | ||||||
Destination XL Group, Inc.(a) | 200 | 1,104 | ||||||
Dick’s Sporting Goods, Inc. | 600 | 21,210 | ||||||
DSW, Inc. Class A | 500 | 11,930 | ||||||
Express, Inc.(a) | 549 | 9,487 | ||||||
Finish Line, Inc. Class A | 300 | 5,424 | ||||||
Five Below, Inc.(a) | 354 | 11,363 | ||||||
Foot Locker, Inc. | 953 | 62,031 | ||||||
Francesca’s Holdings Corp.(a) | 275 | 4,788 | ||||||
Genesco, Inc.(a) | 172 | 9,775 | ||||||
GNC Holdings, Inc. Class A | 603 | 18,705 | ||||||
Group 1 Automotive, Inc. | 152 | 11,506 | ||||||
Guess?, Inc. | 400 | 7,552 | ||||||
Haverty Furniture Cos., Inc. | 100 | 2,144 | ||||||
Hibbett Sports, Inc.(a) | 134 | 4,052 | ||||||
Kirkland’s, Inc. | 100 | 1,450 | ||||||
Lithia Motors, Inc. Class A | 147 | 15,680 | ||||||
Lumber Liquidators Holdings, Inc.(a) | 176 | 3,055 | ||||||
MarineMax, Inc.(a) | 166 | 3,058 | ||||||
Mattress Firm Holding Corp.(a) | 151 | 6,739 | ||||||
Men’s Wearhouse, Inc. | 352 | 5,167 | ||||||
Michaels Cos., Inc.(a) | 400 | 8,844 | ||||||
Monro Muffler Brake, Inc. | 200 | 13,244 | ||||||
Murphy USA, Inc.(a) | 294 | 17,858 | ||||||
Office Depot, Inc.(a) | 3,600 | 20,304 | ||||||
Outerwall, Inc. | 134 | 4,896 | ||||||
Party City Holdco, Inc.(a) | 100 | 1,291 | ||||||
Penske Automotive Group, Inc. | 277 | 11,728 | ||||||
Pep Boys-Manny Moe & Jack(a) | 395 | 7,272 | ||||||
Pier 1 Imports, Inc. | 500 | 2,545 | ||||||
Rent-A-Center, Inc. | 300 | 4,491 | ||||||
Restoration Hardware Holdings, Inc.(a) | 229 | 18,194 | ||||||
Sally Beauty Holdings, Inc.(a) | 1,085 | 30,261 | ||||||
Select Comfort Corp.(a) | 376 | 8,050 | ||||||
Shoe Carnival, Inc. | 100 | 2,320 | ||||||
Sonic Automotive, Inc. Class A | 200 | 4,552 | ||||||
Sportsman’s Warehouse Holdings, Inc.(a) | 100 | 1,290 | ||||||
Stage Stores, Inc. | 200 | 1,822 | ||||||
Stein Mart, Inc. | 153 | 1,030 | ||||||
Tile Shop Holdings, Inc.(a) | 219 | 3,592 | ||||||
Ulta Salon Cosmetics & Fragrance, Inc.(a) | 437 | 80,845 | ||||||
Vitamin Shoppe, Inc.(a) | 200 | 6,540 | ||||||
West Marine, Inc.(a) | 182 | 1,545 | ||||||
Williams-Sonoma, Inc. | 629 | 36,740 | ||||||
Winmark Corp. | 12 | 1,116 | ||||||
Zumiez, Inc.(a) | 100 | 1,512 | ||||||
|
| |||||||
| 666,519 | ||||||||
|
| |||||||
Technology Hardware, Storage & Peripherals – 0.4% |
| |||||||
3D Systems Corp.(a) | 800 | 6,952 | ||||||
Avid Technology, Inc.(a) | 200 | 1,458 | ||||||
CPI Card Group, Inc.(a) | 169 | 1,801 | ||||||
See accompanying notes to financial statements.
70
Table of Contents
State Street Small/Mid Cap Equity Index Portfolio
Schedule of Investments — (continued)
December 31, 2015
Security Description | Shares | Value | ||||||
COMMON STOCKS – (continued) | ||||||||
Technology Hardware, Storage & Peripherals – (continued) |
| |||||||
Cray, Inc.(a) | 266 | $ | 8,632 | |||||
Diebold, Inc. | 451 | 13,570 | ||||||
Eastman Kodak Co.(a) | 100 | 1,254 | ||||||
Electronics For Imaging, Inc.(a) | 305 | 14,256 | ||||||
Immersion Corp.(a) | 235 | 2,740 | ||||||
Lexmark International, Inc. Class A | 400 | 12,980 | ||||||
NCR Corp.(a) | 1,167 | 28,545 | ||||||
Nimble Storage, Inc.(a) | 300 | 2,760 | ||||||
Pure Storage, Inc. Class A(a) | 200 | 3,114 | ||||||
QLogic Corp.(a) | 600 | 7,320 | ||||||
Quantum Corp.(a) | 1,100 | 1,023 | ||||||
Silicon Graphics International Corp.(a) | 333 | 1,965 | ||||||
Stratasys, Ltd.(a) | 365 | 8,570 | ||||||
Super Micro Computer, Inc.(a) | 272 | 6,667 | ||||||
|
| |||||||
| 123,607 | ||||||||
|
| |||||||
Textiles, Apparel & Luxury Goods – 0.7% |
| |||||||
Carter’s, Inc. | 361 | 32,140 | ||||||
Cherokee, Inc.(a) | 100 | 1,725 | ||||||
Columbia Sportswear Co. | 187 | 9,118 | ||||||
Crocs, Inc.(a) | 500 | 5,120 | ||||||
Culp, Inc. | 100 | 2,547 | ||||||
Deckers Outdoor Corp.(a) | 200 | 9,440 | ||||||
G-III Apparel Group, Ltd.(a) | 281 | 12,437 | ||||||
Iconix Brand Group, Inc.(a) | 300 | 2,049 | ||||||
Kate Spade & Co.(a) | 900 | 15,993 | ||||||
lululemon athletica, Inc.(a) | 800 | 41,976 | ||||||
Movado Group, Inc. | 100 | 2,571 | ||||||
Oxford Industries, Inc. | 100 | 6,382 | ||||||
Perry Ellis International, Inc.(a) | 100 | 1,842 | ||||||
Sequential Brands Group, Inc.(a) | 310 | 2,455 | ||||||
Skechers U.S.A., Inc. Class A(a) | 847 | 25,588 | ||||||
Steven Madden, Ltd.(a) | 400 | 12,088 | ||||||
Tumi Holdings, Inc.(a) | 412 | 6,852 | ||||||
Unifi, Inc.(a) | 100 | 2,815 | ||||||
Vera Bradley, Inc.(a) | 200 | 3,152 | ||||||
Wolverine World Wide, Inc. | 700 | 11,697 | ||||||
|
| |||||||
| 207,987 | ||||||||
|
| |||||||
Thrifts & Mortgage Finance – 1.1% |
| |||||||
Anchor BanCorp Wisconsin, Inc.(a) | 40 | 1,741 | ||||||
Astoria Financial Corp. | 600 | 9,510 | ||||||
Bank Mutual Corp. | 200 | 1,560 | ||||||
BankFinancial Corp. | 100 | 1,263 | ||||||
Beneficial Bancorp, Inc.(a) | 600 | 7,992 | ||||||
BofI Holding, Inc.(a) | 400 | 8,420 | ||||||
Brookline Bancorp, Inc. | 400 | 4,600 | ||||||
BSB Bancorp, Inc.(a) | 79 | 1,848 | ||||||
Capitol Federal Financial, Inc. | 1,000 | 12,560 | ||||||
Charter Financial Corp. | 100 | 1,321 | ||||||
Clifton Bancorp, Inc. | 220 | 3,155 | ||||||
Dime Community Bancshares, Inc. | 200 | 3,498 | ||||||
Essent Group, Ltd.(a) | 400 | 8,756 | ||||||
EverBank Financial Corp. | 700 | 11,186 | ||||||
Federal Agricultural Mortgage Corp. Class C | 100 | 3,157 | ||||||
First Defiance Financial Corp. | 48 | 1,813 | ||||||
Flagstar Bancorp, Inc.(a) | 100 | 2,311 | ||||||
Fox Chase Bancorp, Inc. | 100 | 2,029 | ||||||
Hingham Institution for Savings | 13 | 1,557 | ||||||
HomeStreet, Inc.(a) | 174 | 3,778 | ||||||
Impac Mortgage Holdings, Inc.(a) | 89 | 1,602 | ||||||
Kearny Financial Corp. | 700 | 8,869 | ||||||
LendingTree, Inc.(a) | 48 | 4,285 | ||||||
Meridian Bancorp, Inc. | 300 | 4,230 | ||||||
Meta Financial Group, Inc. | 36 | 1,654 | ||||||
MGIC Investment Corp.(a) | 2,300 | 20,309 | ||||||
Nationstar Mortgage Holdings, Inc.(a) | 200 | 2,674 | ||||||
New York Community Bancorp, Inc. | 3,223 | 52,599 | ||||||
NMI Holdings, Inc. Class A(a) | 300 | 2,031 | ||||||
Northfield Bancorp, Inc. | 300 | 4,776 | ||||||
Northwest Bancshares, Inc. | 700 | 9,373 | ||||||
OceanFirst Financial Corp. | 100 | 2,003 | ||||||
Ocwen Financial Corp.(a) | 800 | 5,576 | ||||||
Oritani Financial Corp. | 300 | 4,950 | ||||||
PennyMac Financial Services, Inc. Class A(a) | 100 | 1,536 | ||||||
PHH Corp.(a) | 300 | 4,860 | ||||||
Provident Financial Services, Inc. | 400 | 8,060 | ||||||
Radian Group, Inc. | 1,300 | 17,407 | ||||||
Territorial Bancorp, Inc. | 55 | 1,526 | ||||||
TFS Financial Corp. | 429 | 8,078 | ||||||
TrustCo Bank Corp. | 500 | 3,070 | ||||||
United Community Financial Corp. | 300 | 1,770 | ||||||
United Financial Bancorp, Inc. | 300 | 3,864 | ||||||
Walker & Dunlop, Inc.(a) | 200 | 5,762 | ||||||
Walter Investment Management Corp.(a) | 200 | 2,844 | ||||||
Washington Federal, Inc. | 600 | 14,298 | ||||||
Waterstone Financial, Inc. | 200 | 2,820 | ||||||
WSFS Financial Corp. | 200 | 6,472 | ||||||
|
| |||||||
| 299,353 | ||||||||
|
| |||||||
Tobacco – 0.1% | ||||||||
Universal Corp. | 141 | 7,907 | ||||||
Vector Group, Ltd. | 600 | 14,154 | ||||||
|
| |||||||
| 22,061 | ||||||||
|
| |||||||
Trading Companies & Distributors – 0.7% |
| |||||||
Air Lease Corp. | 700 | 23,436 | ||||||
Aircastle, Ltd. | 400 | 8,356 | ||||||
Applied Industrial Technologies, Inc. | 261 | 10,568 | ||||||
Beacon Roofing Supply, Inc.(a) | 349 | 14,372 | ||||||
BMC Stock Holdings, Inc.(a) | 300 | 5,025 | ||||||
CAI International, Inc.(a) | 100 | 1,008 | ||||||
DXP Enterprises, Inc.(a) | 100 | 2,280 | ||||||
GATX Corp. | 285 | 12,127 | ||||||
H&E Equipment Services, Inc. | 200 | 3,496 | ||||||
HD Supply Holdings, Inc.(a) | 1,170 | 35,135 | ||||||
Kaman Corp. | 199 | 8,121 | ||||||
MRC Global, Inc.(a) | 700 | 9,030 | ||||||
MSC Industrial Direct Co., Inc. Class A | 309 | 17,387 | ||||||
NOW, Inc.(a) | 700 | 11,074 | ||||||
Rush Enterprises, Inc. Class A(a) | 200 | 4,378 | ||||||
TAL International Group, Inc.(a) | 200 | 3,180 | ||||||
Textainer Group Holdings, Ltd. | 100 | 1,411 | ||||||
Titan Machinery, Inc.(a) | 100 | 1,093 | ||||||
Univar, Inc.(a) | 301 | 5,120 | ||||||
Veritiv Corp.(a) | 42 | 1,521 | ||||||
Watsco, Inc. | 168 | 19,678 | ||||||
WESCO International, Inc.(a) | 287 | 12,536 | ||||||
|
| |||||||
| 210,332 | ||||||||
|
| |||||||
See accompanying notes to financial statements.
71
Table of Contents
State Street Small/Mid Cap Equity Index Portfolio
Schedule of Investments — (continued)
December 31, 2015
Security Description | Shares | Value | ||||||
COMMON STOCKS – (continued) | ||||||||
Transportation Infrastructure – 0.1% |
| |||||||
Macquarie Infrastructure Corp. | 475 | $ | 34,485 | |||||
Wesco Aircraft Holdings, Inc.(a) | 400 | 4,788 | ||||||
|
| |||||||
| 39,273 | ||||||||
|
| |||||||
Water Utilities – 0.5% | ||||||||
American States Water Co. | 246 | 10,319 | ||||||
American Water Works Co., Inc. | 1,220 | 72,895 | ||||||
Aqua America, Inc. | 1,215 | 36,207 | ||||||
Artesian Resources Corp. Class A | 51 | 1,413 | ||||||
California Water Service Group | 300 | 6,981 | ||||||
Connecticut Water Service, Inc. | 100 | 3,801 | ||||||
Consolidated Water Co., Ltd. | 100 | 1,224 | ||||||
Middlesex Water Co. | 100 | 2,654 | ||||||
SJW Corp. | 100 | 2,965 | ||||||
York Water Co. | 100 | 2,494 | ||||||
|
| |||||||
| 140,953 | ||||||||
|
| |||||||
Wireless Telecommunication Services – 0.8% |
| |||||||
Boingo Wireless, Inc.(a) | 200 | 1,324 | ||||||
NTELOS Holdings Corp.(a) | 177 | 1,618 | ||||||
SBA Communications Corp. Class A(a) | 880 | 92,461 | ||||||
Shenandoah Telecommunications Co. | 175 | 7,534 | ||||||
Spok Holdings, Inc. | 100 | 1,832 | ||||||
Sprint Corp.(a) | 4,874 | 17,644 | ||||||
T-Mobile US, Inc.(a) | 1,860 | 72,763 | ||||||
Telephone & Data Systems, Inc. | 600 | 15,534 | ||||||
United States Cellular Corp.(a) | 100 | 4,081 | ||||||
|
| |||||||
| 214,791 | ||||||||
|
| |||||||
TOTAL COMMON STOCKS |
| 27,211,052 | ||||||
|
| |||||||
SHORT-TERM INVESTMENT – 3.5% |
| |||||||
State Street Institutional Liquid Reserves Fund, Premier | 976,457 | 976,457 | ||||||
|
| |||||||
TOTAL INVESTMENTS – 100.1%(e) |
| 28,187,509 | ||||||
Liabilities In Excess Of | (36,213 | ) | ||||||
|
| |||||||
NET ASSETS – 100.0% | $ | 28,151,296 | ||||||
|
| |||||||
| (a) | Non-income producing security. |
| (b) | Reflects separate holdings of the issuer’s common stock traded on different securities exchanges. |
| (c) | The rate shown is the annualized seven-day yield at period end. |
| (d) | Affiliated Fund managed by SSGA Funds Management, Inc. (Note 4). |
| (e) | Unless otherwise indicated, the values of the securities of the Portfolio are determined based on Level 1 inputs established by provisions surrounding fair value measurements and disclosures. (Note 2) |
| REIT | Real Estate Investment Trust | |
| NVDR | Non Voting Depositary Receipt |
At December 31, 2015, open futures contracts purchased were as follows:
Futures Contracts | Expiration Date | Number of Contracts | Notional Value | Unrealized Appreciation | ||||||||||||
S&P 400 (long) | 03/18/2016 | 5 | $ | 696,750 | $ | 10,179 | ||||||||||
Russell 2000 (long) | 03/18/2016 | 3 | 339,450 | 7,163 | ||||||||||||
|
| |||||||||||||||
Total unrealized appreciation on open futures contracts purchased |
| $ | 17,342 | |||||||||||||
|
| |||||||||||||||
Description | Level 1 – Quoted Prices | Level 2 – Other Significant Observable Inputs | Level 3 – Significant Unobservable Inputs | Total | ||||||||||||
Investments: | ||||||||||||||||
Common Stocks | $ | 27,211,052 | $ | – | $ | – | $ | 27,211,052 | ||||||||
Short-Term Investment | 976,457 | – | – | 976,457 | ||||||||||||
Other Financial Instruments: | ||||||||||||||||
Futures Contracts* | 17,342 | – | – | 17,342 | ||||||||||||
|
|
|
|
|
|
|
| |||||||||
Total Investments | $ | 28,204,851 | $ | – | $ | – | $ | 28,204,851 | ||||||||
|
|
|
|
|
|
|
| |||||||||
| * | Futures contracts are valued at unrealized appreciation (depreciation). |
See accompanying notes to financial statements.
72
Table of Contents
State Street Institutional Investment Trust
Statements of Assets and Liabilities
December 31, 2015
| State Street Aggregate Bond Index Portfolio | State Street Global Equity ex-U.S. Index Portfolio | State Street Small/Mid Cap Equity Index Portfolio | ||||||||||
Assets | ||||||||||||
Investments in unaffiliated issuers, at value (Note 2)* | $ | 82,494,761 | $ | 114,283,696 | $ | 27,211,052 | ||||||
Investments in non-controlled affiliated issuer, at value (Note 4)** | 13,317,540 | 2,440,800 | 976,457 | |||||||||
|
|
|
|
|
| |||||||
Total Investments | 95,812,301 | 116,724,496 | 28,187,509 | |||||||||
Cash | 53,375 | 20,620 | 6,884 | |||||||||
Foreign currency*** | – | 1,255,971 | – | |||||||||
Cash at broker | – | 139,500 | 49,732 | |||||||||
Receivable for when issued/delayed securities | 616,504 | – | – | |||||||||
Receivable for investment securities sold | 349,884 | 1,356 | 1,700 | |||||||||
Receivable for fund shares sold | 729,948 | 214,989 | 107,471 | |||||||||
Daily variation margin on futures contracts | – | 90,388 | – | |||||||||
Interest receivable | 436,045 | – | – | |||||||||
Dividend receivable from unaffiliated issuers | – | 190,857 | 37,640 | |||||||||
Dividend receivable from affiliated issuer | 2,242 | 276 | 147 | |||||||||
Prepaid expenses and other assets | 36,326 | 191,676 | 5,518 | |||||||||
|
|
|
|
|
| |||||||
Total assets | 98,036,625 | 118,830,129 | 28,396,601 | |||||||||
|
|
|
|
|
| |||||||
Liabilities | ||||||||||||
Payable for when issued/delayed securities | 13,524,040 | – | – | |||||||||
Investment securities purchased | 621,628 | 864,038 | 1,641 | |||||||||
Daily variation margin on futures contracts | – | – | 9,950 | |||||||||
Payable for fund shares repurchased | – | 383,354 | 202,879 | |||||||||
Deferred foreign taxes payable | – | 1,406 | – | |||||||||
Professional fees payable | 38,807 | 36,922 | 22,097 | |||||||||
Administration and custody fees payable (Note 4) | – | 65,549 | – | |||||||||
Management fees payable (Note 4) | 1,745 | 2,253 | 1,003 | |||||||||
Accrued expenses and other liabilities | 8,424 | 15,355 | 7,735 | |||||||||
|
|
|
|
|
| |||||||
Total liabilities | 14,194,644 | 1,368,877 | 245,305 | |||||||||
|
|
|
|
|
| |||||||
Net Assets | $ | 83,841,981 | $ | 117,461,252 | $ | 28,151,296 | ||||||
|
|
|
|
|
| |||||||
Net assets consist of: | ||||||||||||
Paid in capital | 84,836,518 | 132,400,571 | 29,978,835 | |||||||||
Undistributed (distributions in excess of) net investment income | (25,248 | ) | (74,567 | ) | (443 | ) | ||||||
Accumulated net realized loss on investments, foreign currency transactions, and futures | (128,969 | ) | (1,002,503 | ) | (109,487 | ) | ||||||
Unrealized appreciation (depreciation) on: | ||||||||||||
Investments | (840,320 | ) | (13,913,244 | ) | (1,734,951 | ) | ||||||
Futures | – | 63,450 | 17,342 | |||||||||
Foreign currency | – | (12,455 | ) | – | ||||||||
|
|
|
|
|
| |||||||
Net Assets | $ | 83,841,981 | $ | 117,461,252 | $ | 28,151,296 | ||||||
|
|
|
|
|
| |||||||
Net asset value, offering, and redemption price per share | $ | 9.89 | $ | 8.45 | $ | 9.30 | ||||||
Shares outstanding | 8,477,224 | 13,902,714 | 3,028,300 | |||||||||
* Investments in unaffiliated issuers, at cost (Note 2) | $ | 83,335,081 | $ | 128,196,940 | $ | 28,946,003 | ||||||
**Investments in non-controlled affiliated issuer, at cost (Note 4) | 13,317,540 | 2,440,800 | 976,457 | |||||||||
|
|
|
|
|
| |||||||
Total Cost of Investments | 96,652,621 | 130,637,740 | 29,922,460 | |||||||||
|
|
|
|
|
| |||||||
*** Foreign Currency, at cost | – | 1,267,897 | – | |||||||||
See accompanying notes to financial statements.
73
Table of Contents
State Street Institutional Investment Trust
Year Ended December 31, 2015
| State Street Aggregate Bond Index Portfolio | State Street Global Equity ex-U.S. Index Portfolio | State Street Small/Mid Cap Equity Index Portfolio* | ||||||||||
Investment Income | ||||||||||||
Interest | $ | 1,454,826 | $ | 57 | $ | – | ||||||
Dividend income (net of foreign taxes withheld of $259,275 and $294, respectively) | – | 2,529,428 | 161,824 | |||||||||
Dividend income from non-controlled affiliated issuer (Note 4) | 14,498 | 1,446 | 618 | |||||||||
|
|
|
|
|
| |||||||
Total investment income | 1,469,324 | 2,530,931 | 162,442 | |||||||||
|
|
|
|
|
| |||||||
Expenses | ||||||||||||
Administration and custody fees (Note 4) | 13,002 | 313,760 | 2,188 | |||||||||
Professional fees | 72,133 | 70,167 | 26,900 | |||||||||
Trustees’ fees (Note 5) | 11,647 | 11,351 | 3,750 | |||||||||
Interest expense | – | 45 | – | |||||||||
Printing fees | 14,480 | 14,099 | 2,500 | |||||||||
Other expenses | 14,051 | 24,123 | 5,263 | |||||||||
|
|
|
|
|
| |||||||
Total expenses | 125,313 | 433,545 | 40,601 | |||||||||
Less: Expenses waived/reimbursed by the Adviser (Note 4) | (106,859 | ) | (360,189 | ) | (37,591 | ) | ||||||
|
|
|
|
|
| |||||||
Total net expenses | 18,454 | 73,356 | 3,010 | |||||||||
|
|
|
|
|
| |||||||
Net Investment Income | 1,450,870 | 2,457,575 | 159,432 | |||||||||
|
|
|
|
|
| |||||||
Realized and Unrealized Gain (Loss) | ||||||||||||
Net realized gain (loss) on: | ||||||||||||
Investments | 516,297 | (616,060 | ) | (55,004 | ) | |||||||
Foreign currency | – | (31,526 | ) | – | ||||||||
Futures contracts | – | (351,647 | ) | (17,313 | ) | |||||||
|
|
|
|
|
| |||||||
Net realized gain (loss) | 516,297 | (999,233 | ) | (72,317 | ) | |||||||
|
|
|
|
|
| |||||||
Change in net unrealized appreciation (depreciation) on: | ||||||||||||
Investments | (1,351,934 | ) | (10,064,694 | ) | (1,734,951 | ) | ||||||
Foreign currency | – | (8,991 | ) | – | ||||||||
Futures contracts | – | 71,950 | 17,342 | |||||||||
|
|
|
|
|
| |||||||
Net change in unrealized appreciation (depreciation) | (1,351,934 | ) | (10,001,735 | ) | (1,717,609 | ) | ||||||
|
|
|
|
|
| |||||||
Net Increase (Decrease) in Net Assets Resulting from Operations | $ | 615,233 | $ | (8,543,393 | ) | $ | (1,630,494 | ) | ||||
|
|
|
|
|
| |||||||
| * | For the period from August 11, 2015 (inception date) to December 31, 2015. |
See accompanying notes to financial statements.
74
Table of Contents
State Street Institutional Investment Trust
Statements of Changes in Net Assets
| State Street Aggregate Bond Index Portfolio | State Street Global Equity ex-U.S. Index Portfolio | |||||||||||||||
| For the Year Ended December 31, 2015 | For the Period 9/19/14* to 12/31/14 | For the Year Ended December 31, 2015 | For the Period 9/17/14* to 12/31/14 | |||||||||||||
Increase (Decrease) in Net Assets From Operations: | ||||||||||||||||
Net investment income | $ | 1,450,870 | $ | 251,556 | $ | 2,457,575 | $ | 232,181 | ||||||||
Net realized gain (loss) on investments, foreign currency transactions, and futures contracts | 516,297 | 297,932 | (999,233 | ) | (17,014 | ) | ||||||||||
Net change in net unrealized appreciation (depreciation) on investments, foreign currency translations, and futures contracts | (1,351,934 | ) | 511,614 | (10,001,735 | ) | (3,860,514 | ) | |||||||||
|
|
|
|
|
|
|
| |||||||||
Net increase (decrease) in net assets from operations | 615,233 | 1,061,102 | (8,543,393 | ) | (3,645,347 | ) | ||||||||||
|
|
|
|
|
|
|
| |||||||||
Distributions From: | ||||||||||||||||
Net investment income | (1,321,087 | ) | (252,366 | ) | (2,500,924 | ) | (284,533 | ) | ||||||||
Net realized gain on investments | (939,187 | ) | (158,232 | ) | – | – | ||||||||||
Return of capital | (143,433 | ) | – | – | – | |||||||||||
|
|
|
|
|
|
|
| |||||||||
Total distributions | (2,403,707 | ) | (410,598 | ) | (2,500,924 | ) | (284,533 | ) | ||||||||
|
|
|
|
|
|
|
| |||||||||
Fund Shares Transactions: | ||||||||||||||||
Shares sold | 43,053,139 | 79,369,350 | 88,218,101 | 53,494,038 | ||||||||||||
Reinvestment of distributions | 2,403,707 | 410,598 | 2,500,924 | 284,533 | ||||||||||||
Shares redeemed | (39,871,948 | ) | (385,982 | ) | (11,674,037 | ) | (388,780 | ) | ||||||||
|
|
|
|
|
|
|
| |||||||||
Net increase (decrease) in net assets from fund share transactions | 5,584,898 | 79,393,966 | 79,044,988 | 53,389,791 | ||||||||||||
|
|
|
|
|
|
|
| |||||||||
Voluntary contribution from Adviser | 1,087 | – | 670 | – | ||||||||||||
Net Increase in net assets | 3,797,511 | 80,044,470 | 68,001,341 | 49,459,911 | ||||||||||||
Net Assets | ||||||||||||||||
Beginning of year | 80,044,470 | – | 49,459,911 | – | ||||||||||||
|
|
|
|
|
|
|
| |||||||||
End of year | $ | 83,841,981 | $ | 80,044,470 | $ | 117,461,252 | $ | 49,459,911 | ||||||||
|
|
|
|
|
|
|
| |||||||||
Undistributed (distributions in excess of) net investment income | $ | (25,248 | ) | $ | – | $ | (74,567 | ) | $ | (5,293 | ) | |||||
|
|
|
|
|
|
|
| |||||||||
Share Transactions: | ||||||||||||||||
Proceeds from shares sold | 4,249,283 | 7,892,207 | 9,497,332 | 5,407,432 | ||||||||||||
Reinvestment of distributions | 239,374 | 40,587 | 300,231 | 30,928 | ||||||||||||
Cost of redemptions | (3,906,083 | ) | (38,144 | ) | (1,291,303 | ) | (41,906 | ) | ||||||||
|
|
|
|
|
|
|
| |||||||||
Net increase in net assets from share transactions | 582,574 | 7,894,650 | 8,506,260 | 5,396,454 | ||||||||||||
|
|
|
|
|
|
|
| |||||||||
| * | Commencement of operations |
See accompanying notes to financial statements.
75
Table of Contents
State Street Institutional Investment Trust
Statements of Changes in Net Assets
| State Street Small/Mid Cap Equity Index Portfolio | ||||
| For the Period 8/11/15* to 12/31/15 | ||||
Increase (Decrease) in Net Assets From Operations: | ||||
Net investment income | $ | 159,432 | ||
Net realized loss on investments, foreign currency transactions, and futures contracts | (72,317 | ) | ||
Net change in net unrealized appreciation (depreciation) on investments, foreign currency translations, and futures contracts | (1,717,609 | ) | ||
|
| |||
Net increase (decrease) in net assets from operations | (1,630,494 | ) | ||
|
| |||
Distributions From: | ||||
Net investment income | (170,569 | ) | ||
Net realized gain on investments | (37,397 | ) | ||
|
| |||
Total distributions | (207,966 | ) | ||
|
| |||
Fund Share Transactions: | ||||
Shares sold | 32,157,103 | |||
Reinvestment of distributions | 207,966 | |||
Shares redeemed | (2,375,313 | ) | ||
|
| |||
Net increase (decrease) in net assets from fund share transactions | 29,989,756 | |||
|
| |||
Net Increase in net assets | 28,151,296 | |||
Net Assets | ||||
Beginning of year | – | |||
|
| |||
End of year | $ | 28,151,296 | ||
|
| |||
Undistributed (distributions in excess of) net investment income | $ | (443 | ) | |
|
| |||
Share Transactions: | ||||
Proceeds from shares sold | 3,259,393 | |||
Reinvestment of distributions | 22,778 | |||
Cost of redemptions | (253,871 | ) | ||
|
| |||
Net increase in net assets from share transactions | 3,028,300 | |||
|
| |||
| * | Inception date |
See accompanying notes to financial statements.
76
Table of Contents
State Street Institutional Investment Trust
| State Street Aggregate Bond Index Portfolio | State Street Global Equity ex-U.S. Index Portfolio | State Street Small/Mid Cap Equity Index Portfolio | ||||||||||||||||||
| Year Ended 12/31/15 | For the Period 9/19/14* – 12/31/14 | Year Ended 12/31/15 | For the Period 9/17/14* – 12/31/14 | For the Period 8/12/15* – 12/31/15 | ||||||||||||||||
Per Share Operating Performance: | ||||||||||||||||||||
Net asset value, beginning of period | $ | 10.14 | $ | 10.00 | $ | 9.17 | $ | 10.00 | $ | 10.00 | ||||||||||
|
|
|
|
|
|
|
|
|
| |||||||||||
Net investment income(a) | 0.20 | 0.04 | 0.25 | 0.05 | 0.06 | |||||||||||||||
Net realized and unrealized gain (loss) on investments | (0.13 | ) | 0.16 | (0.79 | ) | (0.82 | ) | (0.69 | ) | |||||||||||
|
|
|
|
|
|
|
|
|
| |||||||||||
Total from investment operations | 0.07 | 0.20 | (0.54 | ) | (0.77 | ) | (0.63 | ) | ||||||||||||
|
|
|
|
|
|
|
|
|
| |||||||||||
Voluntary contribution from Adviser | 0.00 | (g) | 0.00 | (g) | 0.00 | (g) | 0.00 | (g) | – | |||||||||||
|
|
|
|
|
|
|
|
|
| |||||||||||
Distributions from: | ||||||||||||||||||||
Net investment income | (0.19 | ) | (0.04 | ) | (0.18 | ) | (0.06 | ) | (0.06 | ) | ||||||||||
Net realized gain on investments | (0.11 | ) | (0.02 | ) | – | – | (0.01 | ) | ||||||||||||
Return of capital | (0.02 | ) | – | – | – | – | ||||||||||||||
|
|
|
|
|
|
|
|
|
| |||||||||||
Total distributions | (0.32 | ) | (0.06 | ) | (0.18 | ) | (0.06 | ) | (0.07 | ) | ||||||||||
|
|
|
|
|
|
|
|
|
| |||||||||||
Net increase (decrease) in net assets | (0.25 | ) | 0.14 | (0.72 | ) | (0.83 | ) | (0.70 | ) | |||||||||||
|
|
|
|
|
|
|
|
|
| |||||||||||
Net asset value, end of period | $ | 9.89 | $ | 10.14 | $ | 8.45 | $ | 9.17 | $ | 9.30 | ||||||||||
|
|
|
|
|
|
|
|
|
| |||||||||||
Total Return(b) | 0.65 | %(f) | 2.00 | %(c)(d) | (5.84 | )%(f) | (7.72 | )%(c)(d) | 6.30 | %(c) | ||||||||||
Ratios and Supplemental Data: | ||||||||||||||||||||
Net assets, end of period (000s) | $ | 83,842 | $ | 80,044 | $ | 117,461 | $ | 49,460 | $ | 28,151 | ||||||||||
Ratios to average net assets: | ||||||||||||||||||||
Gross expenses | 0.17 | % | 0.25 | %(e) | 0.48 | % | 0.73 | %(e) | 0.41 | %(e) | ||||||||||
Net expenses | 0.03 | % | 0.04 | %(e) | 0.08 | % | 0.31 | %(e) | 0.03 | %(e) | ||||||||||
Net investment income | 2.00 | % | 1.52 | %(e) | 2.73 | % | 1.77 | %(e) | 1.61 | %(e) | ||||||||||
Portfolio turnover | 62 | % | 16 | %(c) | 3 | % | 0 | %(c) | 8 | %(c) | ||||||||||
| * | Commencement of operations. |
| (a) | Net investment income per share is calculated using the average shares method. |
| (b) | Total return is calculated assuming a purchase of shares at net asset value on the first day and a sale at net asset value on the last day of each period reported. Distributions are assumed, for the purpose of this calculation, to be reinvested at net asset value per share on the respective payment dates. Results represent past performance and are not indicative of future results. |
| (c) | Not annualized. |
| (d) | If the Adviser had not made a voluntary contribution during the period ended 12/31/14, the total return would have decreased by less than 0.005%. |
| (e) | Annualized. |
| (f) | If the Adviser had not made a voluntary contribution during the year ended 12/31/15, the total return would have decreased by less than 0.005% |
| (g) | Amount is less than $0.005 per share. |
See accompanying notes to financial statements.
77
Table of Contents
State Street Institutional Investment Trust
December 31, 2015
| 1. | Organization |
State Street Institutional Investment Trust (the “Trust”) which is registered under the Investment Company Act of 1940, as amended (the “1940 Act”), is as an open-end management investment company, and was organized as a Massachusetts business trust on February 16, 2000. The Trust consists of forty-five (45) series and corresponding classes, each of which have the same rights and privileges, including the same voting rights (each, a “Fund”, and collectively, the “Funds”). The Declaration of Trust permits the Board of Trustees of the Trust (the “Board”) to authorize the issuance of an unlimited number of shares, with no par value. The financial statements herein relate to the following funds:
| Fund | Classes | Commencement of Operations: | ||
State Street Aggregate Bond Index Fund (diversified) | Class A Class I Class K Class C | September 19, 2014 September 19, 2014 September 19, 2014 Not commenced | ||
State Street Global Equity ex-U.S. Index Fund (diversified) | Class A Class I Class K Class C | September 17, 2014 September 17, 2014 September 17, 2014 Not commenced | ||
State Street Small/Mid Cap Equity Index Fund (diversified) | Class A Class I Class K Class C | October 16, 2015 October 16, 2015 August 12, 2015 Not commenced | ||
State Street Aggregate Bond Index Portfolio (diversified) | September 19, 2014 | |||
State Street Global Equity ex-U.S. Index Portfolio (diversified) | September 17, 2014 | |||
State Street Small/Mid Cap Equity Index Portfolio (diversified) | August 12, 2015 |
The financial statements of the State Street Aggregate Bond Index Portfolio, State Street Global Equity ex-U.S. Index Portfolio and the State Street Small/Mid Cap Equity Index Portfolio (each a “Portfolio” and collectively the “Portfolios”) including the Schedules of Investments on this report should be read in conjunction with these financial statements.
The State Street Aggregate Bond Index Fund, State Street Global Equity ex-U.S. Index Fund and State Street Small/Mid Cap Equity Index Fund (each a “Fund” and collectively the “Funds”) invests as part of a “master-feeder” structure, and currently seeks to achieve its investment objective by investing substantially all of its investable assets in its corresponding Portfolio. Each of the Portfolios is a separate mutual fund that has a substantially similar investment objective, investment policies, and risks as its corresponding Fund. The performance of each Fund is directly affected by the performance of its
78
Table of Contents
State Street Institutional Investment Trust
Notes to Financial Statements — (continued)
December 31, 2015
Portfolio. The following table discloses the Funds’ investment ownership percentages in their respective Portfolios.
| Feeder Fund | % Investment in Master | Master Fund | ||||
State Street Aggregate Bond Index Fund | 64.82 | % | State Street Aggregate Bond Index Portfolio | |||
State Street Global Equity ex-U.S. Index Fund | 48.78 | % | State Street Global Equity ex-U.S. Index Portfolio | |||
State Street Small/Mid Cap Equity Index Fund | 14.90 | % | State Street Small/Mid Cap Equity Index Portfolio | |||
Each Portfolio may hold portions of its assets in short-term debt instruments with remaining maturities of 397 days or less pending investment or to meet anticipated redemptions and day-to-day operating expenses. Each Portfolio’s shares are offered exclusively to investors (including without limitation, registered investment companies, private investment pools, bank collective funds, and investment separate accounts), like the Funds, that pay fees to SSGA Funds Management, Inc. (“SSGA FM” or the “Adviser”), a subsidiary of State Street Corporation and an affiliate of State Street Bank and Trust Company (“State Street”). Class A shares of the Funds are available to the general public for investment through transaction-based financial intermediaries.
Under the Trust’s organizational documents, its officers and trustees are indemnified against certain liabilities arising out of the performance of their duties to the Trust. Additionally, in the normal course of business, the Trust enters into contracts with service providers that contain general indemnification clauses. The Trust’s maximum exposure under these arrangements is unknown as this could involve future claims that may be made against the Trust that have not yet occurred.
| 2. | Summary of Significant Accounting Policies |
The following is a summary of significant accounting policies followed by the Trust in the preparation of its financial statements:
The preparation of financial statements in accordance with U.S. generally accepted accounting principles (“U.S. GAAP”) requires management to make estimates and assumptions that affect the reported amounts and disclosures in the financial statements. Actual results could differ from those estimates. Each Fund and Portfolio is an investment company under U.S. GAAP and follows the accounting and reporting guidance applicable to investment companies in Financial Accounting Standards Board (“FASB”) Accounting Standards Codification (“ASC”) 946, Financial Services Investment Companies (“ASC 946”).
Security Valuation
Each Fund records its investment in its respective Portfolio at fair value each business day (net asset value). Each Portfolio’s investments are valued at fair value each day that the Portfolio’s listing exchange is open and, for financial reporting purposes, as of the report date should the reporting period end on a day that the Portfolio’s listing exchange is not open. Fair value is generally defined as the price a fund would receive to sell an asset or pay to transfer a liability in an orderly transaction between market participants at the measurement date. By its nature, a fair value price is good faith estimate of the valuation in a current sale and may not reflect an actual market price. The investments of each Portfolio
79
Table of Contents
State Street Institutional Investment Trust
Notes to Financial Statements — (continued)
December 31, 2015
are valued pursuant to the policy and procedures developed by the Oversight Committee (the “Committee”) and approved by the Board. The Committee provides oversight of the valuation of investments for the Portfolios. The Board has responsibility for determining the fair value of investments. Valuation techniques used to value each Portfolio’s investments by major category are as follows:
| • | Equity investments (including registered investment companies that are exchange-traded funds) traded on a recognized securities exchange for which market quotations are readily available are valued at the last sale price or official closing price, as applicable, on the primary market or exchange on which they trade. Equity investments traded on a recognized exchange for which there were no sales on that day are valued at the last published sale price or at fair value. |
| • | Rights and warrants are valued at the last reported sale price obtained from independent pricing services or brokers on the valuation date. If no prices are obtained from pricing services or brokers, valuation will be based upon the intrinsic value, pursuant to the valuation policy and procedures approved by the Board. |
| • | Investments in registered investment companies (including money market funds) or other unitized pooled investment vehicles that are not traded on an exchange are valued at that day’s published net asset value per share or unit. Money market funds generally value portfolio investments using the amortized cost method as set forth in Rule 2a-7 under the 1940 Act and in accordance with their procedures to stabilize net asset value. |
| • | Debt obligations (both governmental and non-governmental) that are short term in nature (with a maturity of sixty days or less at purchase) and investment grade are valued using the amortized cost method as long as the amortized cost value of a particular portfolio instrument is reasonably determined to approximate the fair value of that investment established using market-based and issuer-specific factors or at a price obtained from an independent pricing service, pursuant to policy and procedures approved by the Board. |
| • | Debt obligations (both governmental and non-governmental) purchased with greater than sixty days to maturity and not investment grade are valued at last reported evaluated bid prices obtained from independent pricing services or brokers. In determining the value of a fixed income investment, pricing services may use certain information with respect to transactions in such investments, quotations from dealers, pricing matrixes, market transactions in comparable investments, various relationships observed in the market between investments, and calculated yield measures. |
| • | Exchange-traded futures contracts are valued at the settlement price on the primary market on which they are traded most extensively. Exchange-traded futures contracts traded on a recognized exchange for which there were no sales on that day are valued at the last reported sale price obtained from independent pricing services or brokers or at fair value. |
In the event prices or quotations are not readily available or that the application of these valuation methods results in a price for an investment that is deemed to be not representative of the fair value of such investment, fair value will be determined in good faith by the Committee, in accordance with the valuation policy and procedures approved by the Board.
80
Table of Contents
State Street Institutional Investment Trust
Notes to Financial Statements — (continued)
December 31, 2015
Fair value pricing could result in a difference between the prices used to calculate the Portfolio’s net asset value and the prices used by the Portfolio’s underlying indices, which in turn could result in a difference between the Portfolio’s performance and the performance of the Portfolios’ underlying indices. Various inputs are used in determining the value of the Portfolios’ investments. These inputs are categorized into a hierarchy consisting of three broad levels for financial reporting purposes.
The Portfolios’ value their assets and liabilities at fair value using a hierarchy that prioritizes the inputs to valuation techniques giving the highest priority to readily available unadjusted quoted prices in active markets for identical assets or liabilities (Level 1 measurements) and the lowest priority to unobservable inputs (Level 3 measurements) when market prices are not readily available or reliable. The categorization of a value determined for an investment within the hierarchy is based upon the pricing transparency of the investment and is not necessarily an indication of the risk associated with investing in it.
The three levels of the fair value hierarchy are as follows:
| • | Level 1 – Unadjusted quoted prices in active markets for identical assets or liabilities; |
| • | Level 2 – Inputs other than quoted prices included within Level 1 that are observable for the asset or liability either directly or indirectly, including quoted prices for similar assets or liabilities in active markets, quoted prices for identical or similar assets or liabilities in markets that are not considered to be active, inputs other than quoted prices that are observable for the asset or liability (such as exchange rates, financing terms, interest rates, yield curves, volatilities, prepayment speeds, loss severities, credit risks and default rates) or other market-corroborated inputs; and |
| • | Level 3 – Unobservable inputs for the asset or liability, including the Committee’s assumptions used in determining the fair value of investments. |
Changes in valuation techniques may result in transfers in or out of an assigned level within the fair value hierarchy. Transfers between different levels of the fair value hierarchy are recognized at the end of the reporting period. For the year ended December 31, 2015, there were no transfers between levels for the State Street Aggregate Bond Index Portfolio. The State Street Global Equity ex-U.S. Index Portfolio had transfers from Level 2 to Level 1 during the year ended December 31, 2015 in the amount of $1,252,278. At December 31, 2015 these investments were valued at exchange closing prices in accordance with the Portfolio’s valuation policy. At December 31, 2014 these investments applied factor prices provided by an independent third party in accordance with the Portfolio’s valuation policy and procedures. There were no material transfers between Level 1 and Level 2 on the State Street Global Equity ex-U.S. Index Portfolio for the year ended December 31, 2015.
Investment Transactions and Income Recognition
Investment transactions are accounted for on trade date for financial reporting purposes. Dividend income and capital gain distributions, if any, are recognized daily on the ex-dividend date, net of foreign taxes withheld at source, if any. Interest income is recorded daily on an accrual basis. All premiums and discounts are amortized/accreted for financial reporting purposes. Non-cash dividends received in the form of stock, if any, are recorded as dividend income at fair value. Distributions received by the Portfolios may include a return of capital that is estimated by management. Such amounts are recorded as a reduction of the cost of investments or reclassified to capital gains. Certain Portfolios invest in Real
81
Table of Contents
State Street Institutional Investment Trust
Notes to Financial Statements — (continued)
December 31, 2015
Estate Investment Trusts (REITs). REITs will determine the characterization of their income annually and may characterize a portion of their distributions as a return of capital or capital gain. The Portfolios’ policy is to record all REIT distributions as dividend income initially and redesignate the prior calendar year’s return of capital or capital gain distributions at year end. Realized gains and losses from the sale or disposition of investments and foreign exchange transactions are determined using the identified cost method.
Expenses
Certain expenses, which are directly identifiable to a specific Fund or Portfolio are applied to that Fund and Portfolio. Other expenses which cannot be attributed to a specific Fund or Portfolio are allocated in such a manner as deemed equitable, taking into consideration the nature and type of expense and the relative net assets of the Fund or Portfolio within the Trust. Class specific fees are borne by each class.
Foreign Currency Translation
The accounting records of the Funds and Portfolios are maintained in U.S. dollars. Foreign currencies as well as investment securities and other assets and liabilities denominated in a foreign currency are translated to U.S. dollars using exchange rates deemed appropriate pursuant to the valuation policy and procedures at period end. Purchases and sales of securities, income receipts and expense payments are translated into U.S. dollars on the respective dates of transactions. The Funds and Portfolios do not isolate the effect of fluctuations in foreign exchange from the effect of fluctuations in the market price of securities. Such fluctuations are reflected by the Funds and Portfolios as a component of realized and unrealized gains and losses from investments for financial reporting purposes.
Foreign Taxes
The Portfolios may be subject to foreign taxes (a portion of which may be reclaimable) on income, stock dividends, capital gains on investments or certain foreign currency transactions. All foreign taxes are recorded in accordance with applicable foreign tax regulations and rates that exist in the foreign jurisdictions in which the Portfolios invest. These foreign taxes, if any, are paid by the Portfolio and are reflected in the Statements of Operations, if applicable. Foreign taxes payable or deferred as of December 31, 2015, if any, are disclosed in the Portfolios’ Statements of Assets and Liabilities.
Futures
The State Street Global Equity ex-U.S. Index Portfolio and the State Street Small/Mid Cap Equity Index Portfolio may enter into futures contracts to meet each Portfolio’s objective. A futures contract is a standardized, exchange-traded agreement to buy or sell a financial instrument at a set price on a future date. Upon entering into a futures contract, the State Street Global Equity ex-U.S. Index Portfolio and the State Street Small/Mid Cap Equity Index are required to deposit with the broker, cash or securities in an amount equal to the minimum initial margin requirements of the clearing house. Variation margin payments are made or received by the State Street Global Equity ex-U.S. Index Portfolio and the State Street Small/Mid Cap Equity Index each day, depending on the daily fluctuations in the value of the underlying security or index. Such receipt or payment is recorded by the State Street Global Equity ex-U.S. Index Portfolio and the State Street Small/Mid Cap Equity Index Portfolio for financial statement purposes as part of unrealized gains or losses, and is recorded on the Statements of Assets and Liabilities
82
Table of Contents
State Street Institutional Investment Trust
Notes to Financial Statements — (continued)
December 31, 2015
as Receivable or Payable from broker – Daily variation margin on futures contracts. The Portfolios recognize a realized gain or loss when the contract is closed, which is recorded on the Statements of Operations. The risk of loss in trading futures contracts in some strategies is potentially unlimited.
Losses may arise if the value of a futures contract decreases due to unfavorable changes in the market rates or values of the underlying instrument during the term of the contract or if the counterparty does not perform under the contract. The use of futures contracts also involves the risk that the movements in the price of the futures contracts do not correlate the movement of the assets underlying such contracts.
For the period ended December 31, 2015, the State Street Global Equity ex-U.S. Index Portfolio and the State Street Small/Mid Cap Equity Index Portfolio entered into futures contracts for cash equalization and return enhancement.
The following table summarizes the value of the derivative instruments as of December 31, 2015, and the related location in the accompanying Schedule of Investments, Statements of Assets and Liabilities and Statements of Operations presented by primary underlying risk exposure:
Asset Derivatives(1)
| Equity Contracts | Total | |||||||
State Street Global Equity ex-U.S. Index Portfolio | $ | 63,450 | $ | 63,450 | ||||
| State Street Small/Mid Cap Equity Index Portfolio | 17,342 | 17,342 | ||||||
Realized Gain (Loss)(2)
Equity Contracts | Total | |||||||
State Street Global Equity ex-U.S. Index Portfolio | $ | (351,647 | ) | $ | (351,647 | ) | ||
| State Street Small/Mid Cap Equity Index Portfolio | (17,313 | ) | (17,313 | ) | ||||
Change in Appreciation (Depreciation)(3)
Equity Contracts | Total | |||||||
State Street Global Equity ex-U.S. Index Portfolio | $ | 71,950 | $ | 71,950 | ||||
| State Street Small/Mid Cap Equity Index Portfolio | 17,342 | 17,342 | ||||||
| (1) | Schedule of Investments: Unrealized appreciation (depreciation) on futures contracts. Only unsettled receivable/payable for variation margin is reported within Statements of Assets and Liabilities. |
| (2) | Statements of Operations location: Net realized gain (loss) on: Futures contracts |
| (3) | Statements of Operations location: Change in net unrealized appreciation (depreciation) on: Futures contracts |
The average notional of futures outstanding for State Street Global Equity ex-U.S. Index Portfolio and State Street Small/Mid Cap Equity Index Portfolio during the period ended December 31, 2015 were $2,246,366 and $226,306, respectively.
83
Table of Contents
State Street Institutional Investment Trust
Notes to Financial Statements — (continued)
December 31, 2015
When-Issued/Delayed Delivery Securities.
The State Street Aggregate Bond Index Portfolio may purchase or sell securities with delivery or payment to occur at a later date beyond the normal settlement period. At the time the State Street Aggregate Bond Index Portfolio enters into a commitment to purchase or sell a security, the transaction is recorded and the value of the transaction is reflected in the net asset value. The price of such security and the date when the security will be delivered and paid for are fixed at the time the transaction is negotiated. The value of the security may vary with market fluctuations. At the time the State Street Aggregate Bond Index Portfolio enters into a purchase transaction, it is required to segregate cash or other liquid assets at least equal to the amount of the commitment. Additionally, the State Street Aggregate Bond Index Portfolio may be required to post securities and/or cash collateral in accordance with the terms of the commitment.
Certain risks may arise upon entering into when-issued or delayed delivery transactions from the potential inability of counterparties to meet the terms of their contracts or if the issuer does not issue the securities due to political, economic or other factors. Additionally, losses may arise due to changes in the value of the underlying securities.
Mortgage Dollar Rolls
The State Street Aggregate Bond Index Portfolio may enter into mortgage dollar roll transactions with respect to mortgage-backed securities for delivery in the current month and simultaneously contract to repurchase similar, but not identical, securities on a fixed date.
The counterparty receives all principal and interest payments, including prepayments, made on the security while it is the holder. The State Street Aggregate Bond Index Portfolio receives compensation as consideration for entering into the commitment to repurchase.
The compensation is paid in the form of a lower price for the security upon its repurchase, or alternatively, a fee. Mortgage dollar rolls may be renewed with a new sale and repurchase price and a cash settlement made at each renewal without physical delivery of the securities subject to the contract. Certain risks may arise upon entering into mortgage dollar rolls from the potential inability of counterparties to meet the terms of their commitments.
Additionally, the value of such securities may change adversely before the State Street Aggregate Bond Index Portfolio is able to repurchase them. There can be no assurance that the State Street Aggregate Bond Index Portfolio’s use of the cash that it receives form a mortgage dollar roll will provide a return that exceeds its costs. The State Street Aggregate Bond Index Portfolio’s use of to-be announced (“TBA”) mortgage dollar rolls may cause the funds to experience higher transaction costs.
Federal Income Taxes
Each Fund and Portfolio has qualified and intends to continue to qualify for and elect treatment as “regulated investment companies” under Subchapter M of the Internal Revenue Code of 1986, as amended. By so qualifying and electing, each Fund and each Portfolio will not be subject to federal income taxes to the extent they distribute their taxable income, including any net realized capital gains, for each fiscal year. In addition, by distributing during each calendar year substantially all of their net investment income and capital gains, if any, the Funds and Portfolios will not be subject to federal excise tax. Income and capital gain distributions are determined in accordance with income tax
84
Table of Contents
State Street Institutional Investment Trust
Notes to Financial Statements — (continued)
December 31, 2015
regulations which may differ from U.S. GAAP. These book-tax differences are primarily due to differing treatments for foreign currencies and losses deferred due to wash sales.
Additionally, based on SSGA FM’s understanding of the tax rules and rates related to income, gains and transactions for the foreign jurisdictions in which the applicable Portfolios invest, the Portfolios will provide for foreign taxes and, where appropriate, deferred foreign taxes.
SSGA FM has reviewed the tax positions for the open tax years as of December 31, 2015 and has determined that no provision for income tax is required in the Funds’ and Portfolios’ financial statements. The Funds’ and the Portfolios’ federal tax returns for the prior three fiscal years, as applicable, remain subject to examination by the their major tax jurisdictions, which include the United States of America and the Commonwealth of Massachusetts. The Funds and Portfolios recognize interest and penalties, if any, related to tax liabilities as income tax expense in the Statements of Operations. No income tax returns are currently under examination. Management has analyzed tax laws and regulations and their applications to the Funds’ and the Portfolios’ facts and circumstances and does not believe there are any uncertain tax positions that require recognition of a tax liability.
For the year ended December 31, 2015, permanent differences identified and reclassified among the components of net assets were as follows:
| Fund | Paid-In Capital | Capital Accumulated Gain (Loss) | Undistributed Net Investment Income (Loss) | |||||||||
State Street Aggregate Bond Index Fund | $ | (389 | ) | $ | (520,984 | ) | $ | 521,373 | ||||
State Street Global Equity ex-U.S. Index Fund | – | 2,700 | (2,700 | ) | ||||||||
State Street Small/Mid Cap Equity Index Fund | – | (3,307 | ) | 3,307 | ||||||||
State Street Aggregate Bond Index Portfolio | – | 155,031 | (155,031 | ) | ||||||||
State Street Global Equity ex-U.S. Index Portfolio | (5,595 | ) | 31,520 | (25,925 | ) | |||||||
State Street Small/Mid Cap Equity Index Portfolio | (10,921 | ) | 227 | 10,694 | ||||||||
The tax character of distributions paid to shareholders during the period ended December 31, 2015 was as follows:
| Fund | Ordinary Income | Long-Term Capital Gain | Tax Return of Capital | Total | ||||||||||||
State Street Aggregate Bond Index Fund | $ | 2,255,223 | $ | 153 | $ | 94,809 | $ | 2,350,185 | ||||||||
State Street Global Equity ex-U.S. Index Fund | 1,175,011 | – | – | 1,175,011 | ||||||||||||
State Street Small/Mid cap Equity Index Fund | 26,008 | 1,624 | – | 27,632 | ||||||||||||
State Street Aggregate Bond Index Portfolio | 2,260,274 | – | 143,433 | 2,403,707 | ||||||||||||
State Street Global Equity ex-U.S. Index Portfolio | 2,495,329 | – | 5,595 | 2,500,924 | ||||||||||||
State Street Small/Mid Cap Equity Index Portfolio | 181,912 | 15,133 | 10,921 | 207,966 | ||||||||||||
85
Table of Contents
State Street Institutional Investment Trust
Notes to Financial Statements — (continued)
December 31, 2015
The tax character of distributions paid to shareholders during the period ended December 31, 2014 was as follows:
| Fund | Ordinary Income | Long-Term Capital Gain | Total | |||||||||
State Street Aggregate Bond Index Fund | $ | 385,601 | $ | – | $ | 385,601 | ||||||
State Street Global Equity ex-U.S. Index Fund | $ | 241,641 | $ | – | $ | 241,641 | ||||||
State Street Aggregate Bond Index Portfolio | $ | 410,598 | $ | – | $ | 410,598 | ||||||
State Street Global Equity ex-U.S. Index Portfolio | $ | 284,533 | $ | – | $ | 284,533 | ||||||
At December 31, 2015, the components of distributable earnings on a tax basis were as follows:
| Fund | Undistributed Ordinary Income | Undistributed Long-Term Capital Gains Income | Capital Loss Carryover | Unrealized Appreciation (Depreciation) | Late Year Ordinary and Post October Loss | Total | ||||||||||||||||||
State Street Aggregate Bond Index Fund | $ | – | $ | – | $ | – | $ | (978,744 | ) | $ | – | $ | (978,744 | ) | ||||||||||
State Street Global Equity ex-U.S. Index Fund | 280 | – | (843 | ) | (7,869,692 | ) | – | (7,870,255 | ) | |||||||||||||||
State Street Small/Mid Cap Equity Index Fund | – | 605 | – | (300,720 | ) | – | (300,115 | ) | ||||||||||||||||
State Street Aggregate Bond Index Portfolio | – | – | – | (841,273 | ) | (153,264 | ) | (994,537 | ) | |||||||||||||||
State Street Global Equity ex-U.S. Index Portfolio | – | – | (767,592 | ) | (14,145,725 | ) | (26,002 | ) | (14,939,319 | ) | ||||||||||||||
State Street Small/Mid Cap Equity Index Portfolio | – | – | – | (1,785,152 | ) | (42,387 | ) | (1,827,539 | ) | |||||||||||||||
Under current tax laws, certain capital and foreign currency losses realized after October 31 and ordinary income losses realized after December 31, may be deferred and treated as occurring on the first
86
Table of Contents
State Street Institutional Investment Trust
Notes to Financial Statements — (continued)
December 31, 2015
day of the following fiscal year. The Funds elected for federal income tax purposes to defer the following current year post October 31 and post December 31 losses, as applicable, as though the losses were incurred on the first day of the next fiscal year:
| Fund | Post October Capital Loss Deferrals | Late Year Ordinary Loss Deferrals | ||||||
State Street Aggregate Bond Index Fund | $ | – | $ | – | ||||
State Street Global Equity ex-U.S. Index Fund | – | – | ||||||
State Street Small/Mid Cap Equity Index Fund | – | – | ||||||
State Street Aggregate Bond Index Portfolio | (128,016 | ) | (25,248 | ) | ||||
State Street Global Equity ex-U.S. Index Portfolio | – | (26,002 | ) | |||||
State Street Small/Mid Cap Equity Index Portfolio | (42,387 | ) | – | |||||
At December 31, 2015, Funds had capital loss carryover in the amount of:
| Fund | Non-Expiring Short Term | Non-Expiring Long Term | Total | |||||||||
State Street Aggregate Bond Index Fund | $ | – | $ | – | $ | – | ||||||
State Street Global Equity ex-U.S. Index Fund | 843 | – | 843 | |||||||||
State Street Small/Mid Cap Equity Index Fund | – | – | – | |||||||||
State Street Aggregate Bond Index Portfolio | – | – | – | |||||||||
State Street Global Equity ex-U.S. Index Portfolio | 468,958 | 298,634 | 767,592 | |||||||||
State Street Small/Mid Cap Equity Index Portfolio | – | – | – | |||||||||
At December 31, 2015, gross unrealized appreciation and gross unrealized depreciation based on cost for federal income tax purpose were as follows:
| Fund | Tax Cost | Gross Unrealized Appreciation | Gross Unrealized Depreciation | Net Unrealized Appreciation (Depreciation) | ||||||||||||
State Street Aggregate Bond Index Fund | $ | 55,323,148 | $ | – | $ | 978,744 | $ | (978,744 | ) | |||||||
State Street Global Equity ex-U.S. Index Fund | $ | 65,166,653 | $ | – | $ | 7,869,692 | $ | (7,869,692 | ) | |||||||
State Street Small/Mid Cap Equity Index Fund | $ | 4,495,821 | $ | – | $ | 300,720 | $ | (300,720 | ) | |||||||
State Street Aggregate Bond Index Portfolio | $ | 96,653,574 | $ | 182,742 | $ | 1,024,015 | $ | (841,273 | ) | |||||||
State Street Global Equity ex-U.S. Index Portfolio | $ | 130,857,903 | $ | 3,108,426 | $ | 17,241,833 | $ | (14,133,407 | ) | |||||||
State Street Small/Mid Cap Equity Index Portfolio | $ | 29,972,661 | $ | 865,751 | $ | 2,650,903 | $ | (1,785,152 | ) | |||||||
87
Table of Contents
State Street Institutional Investment Trust
Notes to Financial Statements — (continued)
December 31, 2015
Distributions
Dividends from net investment income are declared and paid at least monthly by the State Street Aggregate Bond Index Fund and the State Street Aggregate Bond Index Portfolio and annually by the State Street Global Equity ex-U.S. Index Fund, the State Street Global Equity ex-U.S. Index Portfolio, the State Street Small/Mid Cap Equity Index Fund, and the State Street Small/Mid Cap Equity Index Portfolio. Net realized capital gains, if any, are distributed annually, unless additional distributions are required for compliance with applicable tax regulations. The amount and character of income and gains to be distributed are determined in accordance with federal tax regulations which may differ from net investment income and realized gains recognized for U.S. GAAP purposes.
| 3. | Investment Transactions |
For the period ended December 31, 2015, purchases and sales of investment securities (excluding short-term securities) by the Portfolios were as follows:
| U.S. Government Obligations | Other Securities | |||||||||||||||
| Fund | Purchases | Sales | Purchases | Sales | ||||||||||||
State Street Aggregate Bond Index Portfolio | $ | 39,695,637 | $ | 31,677,280 | $ | 8,111,398 | $ | 5,990,288 | ||||||||
State Street Global Equity ex-U.S. Index Portfolio | $ | – | $ | – | $ | 79,334,049 | $ | 2,678,763 | ||||||||
State Street Small/Mid Cap Equity Index Portfolio | $ | – | $ | – | $ | 31,055,385 | $ | 2,006,817 | ||||||||
| 4. | Fees and Compensation paid to Affiliates and other Related Party Transactions |
The Funds and Portfolios retained SSGA FM as their investment adviser. Each Fund has entered into an Investment Advisory Agreement with the Adviser. For its advisory services, each Fund pays the Adviser a fee accrued daily and paid monthly, based on a percentage of each Fund’s average daily net assets as shown in the following table:
| Fund | ||||
State Street Aggregate Bond Index Fund | 0.03 | % | ||
State Street Global Equity ex-U.S. Index Fund | 0.06 | % | ||
State Street Small/Mid Cap Equity Index Fund | 0.03 | % | ||
The Portfolios pay no investment advisory fees to SSGA FM.
SSGA FM is contractually obligated until April 30, 2016, to waive its management fee and/or to reimburse the State Street Aggregate Bond Index Fund and the State Street Global Equity ex-U.S. Index Fund for expenses to the extent that total expenses (exclusive of non-recurring account fees, extraordinary expenses, acquired fund fees, any class-specific expenses, such as distribution, shareholder servicing, sub-transfer agency and administration fees) exceed 0.04% and 0.10%, respectively, of average daily net assets on an annual basis.
SSGA FM is contractually obligated until April 30, 2016, to waive its management fee and/or to reimburse State Street Aggregate Bond Index Portfolio and the State Street Global Equity ex-U.S. Index Portfolio for expenses to the extent that total expenses (exclusive of non-recurring account fees,
88
Table of Contents
State Street Institutional Investment Trust
Notes to Financial Statements — (continued)
December 31, 2015
extraordinary expenses, acquired fund fees, distribution, shareholder services and sub transfer agency expenses) exceed 0.04% and 0.08%, respectively, of average daily net assets on an annual basis. These waivers and/or reimbursements may not be terminated during the relevant period except with the approval of the Funds’ and Portfolios’ Board.
SSGA FM is contractually obligated until April 30, 2017, to waive its management fee and/or to reimburse the State Street Small/Mid Cap Equity Index Fund and the State Street Small/Mid Cap Equity Index Portfolio for expenses to the extent that the total expenses (exclusive of non-recurring account fees, extraordinary expenses, acquired fund fees and expenses, and any class-specific expenses such as distribution, shareholder servicing, administration and sub-transfer agency fees) exceed 0.03% of average daily net assets on an annual basis. This waiver and/or reimbursement may not be terminated prior to April 30, 2017 except with the approval of the Fund’s and Portfolio’s Board of Trustees.
For the period ended December 31, 2015, SSGA FM reimbursed or waived the fees under these agreements as shown on the respective Statements of Operations.
During the year ended December 31, 2015, the Adviser made contributions of $1,087 and $670 to the State Street Aggregate Bond Index Portfolio and the State Street Global Equity ex-U.S. Index Portfolio in connection with a portfolio investment matter. These amounts can be found on the Statements of Changes in Net Assets.
SSGA FM serves as administrator and State Street serves as sub-administrator and custodian to the Funds. For its administration services, each Fund pays SSGA FM a fee at an annual rate of 0.05% of its average daily net assets. For its services as custodian, each Fund pays State Street an annual fee. SSGA FM pays State Street for its services as sub-administrator.
Effective June 1, 2015, SSGA FM serves as administrator and State Street serves as the sub-administrator, custodian, and transfer agent to the Portfolios. For its administration services each Portfolio pays SSGA FM an annual fee. SSGA FM compensates State Street for its services as sub-administrator, custodian, and transfer agent to the Portfolios.
Prior to June 1, 2015, State Street served as the administrator, custodian, transfer agent and dividend disbursing agent for the Portfolios. In compensation for these services, the Portfolios paid State Street an annual fee. The fee was accrued daily and payable monthly, and was calculated as the greater of an asset-based fee or a minimum fee. The minimum fee was calculated by multiplying the minimum per fund fee by the number of funds in the State Street Master Funds Trust plus the number of stand-alone funds in the State Street Institutional Investment Trust to arrive at the total minimum fee. The asset-based fee was calculated at the following rates:
| Asset Levels | Annual percentage of average aggregate monthly net assets | |||
First $400 million | 0.03% | |||
Next $15 billion | 0.02% | |||
Thereafter | 0.01% | |||
Minimum annual fee | $ | 150,000 | ||
Boston Financial Data Services (“BFDS”), a joint venture of DST Systems, Inc. and State Street Corporation, serves as transfer agent and dividend disbursing agent to the Funds. For these services, the
89
Table of Contents
State Street Institutional Investment Trust
Notes to Financial Statements — (continued)
December 31, 2015
Funds pay annual account services fees, activity-based fees, charges related to compliance and regulatory services.
State Street Global Markets LLC (“SSGM” or the “Distributor”) serves as the distributor of the Funds. SSGM is a wholly owned subsidiary of State Street Corporation. The Funds have adopted a distribution plan pursuant to Rule 12b-1 under the 1940 Act under which a Fund may compensate the Distributor (or others) for services in connection with the distribution of the Fund’s Class A shares and for services provided to Fund shareholders (the “Plan”). The Plan calls for payments at an annual rate (based on average daily net assets) of 0.25% of the Fund’s net assets attributable to its Class A shares. In addition to payments under the Plan, the Fund may reimburse SSGM or its affiliates for payments it makes to financial intermediaries that provide certain administrative, recordkeeping, and account maintenance services. The amount of the reimbursement and the manner in which it is calculated are reviewed by the Trustees periodically.
Class A shares impose a sales charge (as a percentage of offering price) and may be subject to a 1% contingent deferred sales charge (“CDSC”) if no initial sales charge was paid at the time of purchase of $1,000,000 or more and the shares are redeemed within 18 months of purchase. Class I and K shares are sold without a sales charge and only to certain eligible investors.
The Funds may also pay a sub-transfer agent fee at an annual rate of up to 0.20% of the Fund’s average daily net assets attributable to Class A and I for recordkeeping, shareholder servicing, or administrative services provided by financial intermediaries.
Investments in Portfolios are not subject to any sales load or redemption fees. Assets of the Portfolios are not subject to Rule 12b-1 fee.
Transactions with Affiliates
Certain investments made by the Portfolios were made in securities affiliated with SSGA FM. The Portfolios invested in the State Street Institutional Liquid Reserves Fund and State Street Institutional U.S. Government Money Market Fund. Transactions in affiliates for the period ending December 31, 2015 were as follows:
State Street Aggregate Bond Index Portfolio
Security Description | Number of shares held at 12/31/14 | Shares purchased for the year ended 12/31/15 | Shares sold for the year ended 12/31/15 | Number of shares held at 12/31/15 | Value at 12/31/15 | Income earned for the year ended 12/31/15 | Realized gain/loss on shares sold | |||||||||||||||||||||
State Street Institutional Liquid Reserves Fund, Premier Class | 19,953,875 | 89,682,502 | 96,318,837 | 13,317,540 | 13,317,540 | 14,498 | – | |||||||||||||||||||||
State Street Global Equity ex-U.S. Index Portfolio
Security Description | Number of shares held at 12/31/14 | Shares purchased for the year ended 12/31/15 | Shares sold for the year ended 12/31/15 | Number of shares held at 12/31/15 | Value at 12/31/15 | Income earned for the year ended 12/31/15 | Realized gain/loss on shares sold | |||||||||||||||||||||
State Street Institutional Liquid Reserves Fund, Premier Class | 597,024 | 50,626,183 | 51,223,207 | – | – | 1,170 | – | |||||||||||||||||||||
State Street Institutional U.S. Government Money Market Fund, Premier Class | – | 31,999,985 | 29,559,185 | 2,440,800 | 2,440,800 | 276 | – | |||||||||||||||||||||
90
Table of Contents
State Street Institutional Investment Trust
Notes to Financial Statements — (continued)
December 31, 2015
State Street Small/Mid Cap Equity Index Portfolio
Security Description | Number of shares held at 12/31/14 | Shares purchased for the period ended 12/31/15 | Shares sold for the period ended 12/31/15 | Number of shares held at 12/31/15 | Value at 12/31/15 | Income earned for the period ended 12/31/15 | Realized gain/loss on shares sold | |||||||||||||||||||||
State Street Institutional Liquid Reserves Fund, Premier Class | – | 28,824,899 | 27,848,442 | 976,457 | 976,457 | 618 | – | |||||||||||||||||||||
| 5. | Trustees’ Fees |
Independent Trustees are compensated on a calendar year basis. Any Trustee who is deemed to be an “interested person” (as defined in the 1940 Act) of the Funds and Portfolios does not receive compensation from the Funds and Portfolios for his or her service as a Trustee.
Each Independent Trustee receives for his or her services to the State Street Master Funds, State Street Institutional Investment Trust and SSGA Funds, a $141,500 annual base retainer in addition to $18,000 for each in-person meeting and $2,000 for each telephonic meeting from the Trust. Trustees’ fees and expenses are allocated among the Trusts and Funds overseen by the Trustees in a manner deemed equitable taking into consideration the relative net assets of the Funds and Portfolios, subject to a $15,000 minimum per Fund and Portfolio. The Co-Chairmen each receive an additional $44,000 annual retainer. The Independent Trustees are reimbursed for travel and other out-of- pocket expenses in connection with meeting attendance. Each trust will bear a pro-rata allocation based on the Trust’s average monthly assets. As of the date of these financial statements, the Trustees were not paid pension or retirement benefits as part of the Trust’s expenses.
| 6. | Concentration Risk |
Fixed income investments are subject to interest rate risk; their value will normally decline as interest rate rise. In addition when interest rates fall income may decline. The Funds’ assets may be concentrated in a particular state or geographic area, or in a particular industry, group of industries or sector. Because each Fund will generally concentrate its investments to approximately the same extent that its index is so concentrated, a Fund may be adversely affected by the performance of bonds of a particular state or geographic area, or in a particular industry, group of industries of sector, and its shares may be subject to increased price volatility. In addition, if a Fund concentrates in a single industry, group of industries or type of instrument, it may be more susceptible to any single economic, market, political or regulatory occurrence affecting that industry, group of industries or type of instrument.
| 7. | Foreign Investment Risks |
Investing in securities of foreign companies and foreign governments involves special risks and considerations not typically associated with investing in U.S. companies and securities of the U.S. government. These risks include revaluation of currencies and the risk of expropriation. Moreover, the marks for securities of many foreign companies and foreign governments may be less liquid and the prices of such securities may be more volatile than those of comparable U.S. companies and the U.S. government.
Some foreign markets in which the Portfolios invest are considered emerging markets. Investment in these emerging markets subjects a Portfolio to a greater risk of loss than investments in a developed market. This is due to, among other things, greater market volatility, lower trading volume, political and
91
Table of Contents
State Street Institutional Investment Trust
Notes to Financial Statements — (continued)
December 31, 2015
economic instability, higher levels of inflation, deflation or currency devaluation, greater risk of market shut down, and more governmental limitations on foreign investment policy than those typically found in a developed market.
| 8. | Line of Credit |
Effective October 15, 2015, the Portfolios and other affiliated funds (each a “Participant” and, collectively, the “Participants”) share in a $360 million revolving credit facility provided by a syndication of banks. The Participants may borrow for the purpose of meeting shareholder redemption requests that otherwise might require the untimely disposition of securities. The Participants are charged an annual commitment fee which is calculated based on the unused portion of the shared credit line. Commitment fees are allocated among each of the Participants based on relative net assets. Commitment fees are ordinary fund operating expenses and are paid by the Adviser. A Participant incurs and pays the interest expense related to its borrowing. Interest is calculated at a rate per annum equal to the sum of the New York Fed Bank Rate plus 1%. A Participant may borrow up to a maximum of 33% of its assets or a lower amount as may be set forth in the Portfolio’s prospectus. The Portfolios had no outstanding loans during the period ended December 31, 2015.
| 9. | Subsequent Events |
Management has evaluated the impact of all subsequent events on the Funds and the Portfolios through the date the financial statements were available to be issued and has determined that there were no subsequent events requiring adjustment or disclosure in the financial statements.
92
Table of Contents
Report of Independent Registered Public Accounting Firm
To the Board of Trustees and Shareholders of State Street Institutional Investment Trust:
We have audited the accompanying statements of assets and liabilities of State Street Aggregate Bond Index Fund, State Street Global Equity ex-U.S. Index Fund and State Street Small/Mid Cap Equity Index Fund (collectively, the “Funds”), and State Street Aggregate Bond Index Portfolio, State Street Global Equity ex-U.S. Index Portfolio and State Street Small/Mid Cap Equity Portfolio (collectively, the “Portfolios”) (six of the series constituting the State Street Institutional Investment Trust), including the schedules of investments of the Portfolios, as of December 31, 2015, and the related statements of operations, the statements of changes in net assets and the financial highlights for each of the years or periods indicated therein. These financial statements and financial highlights are the responsibility of the Funds’ and Portfolios’ management. Our responsibility is to express an opinion on these financial statements and financial highlights based on our audits.
We conducted our audits in accordance with the standards of the Public Company Accounting Oversight Board (United States). Those standards require that we plan and perform the audit to obtain reasonable assurance about whether the financial statements and financial highlights are free of material misstatement. We were not engaged to perform an audit of the Funds’ and Portfolios’ internal control over financial reporting. Our audits included consideration of internal control over financial reporting as a basis for designing audit procedures that are appropriate in the circumstances, but not for the purpose of expressing an opinion on the effectiveness of the Funds’ and Portfolios’ internal control over financial reporting. Accordingly, we express no such opinion. An audit also includes examining, on a test basis, evidence supporting the amounts and disclosures in the financial statements and financial highlights, assessing the accounting principles used and significant estimates made by management, and evaluating the overall financial statement presentation. Our procedures included confirmation of securities owned as of December 31, 2015, by correspondence with the custodian and others or by other appropriate auditing procedures where replies from others were not received. We believe that our audits provide a reasonable basis for our opinion.
In our opinion, the financial statements and financial highlights referred to above present fairly, in all material respects, the financial position of State Street Aggregate Bond Index Fund, State Street Global Equity ex-U.S. Index Fund, State Street Small/Mid Cap Equity Index Fund, State Street Aggregate Bond Index Portfolio, State Street Global Equity ex-U.S. Index Portfolio and State Street Small/Mid Cap Equity Portfolio (six of the series constituting State Street Institutional Investment Trust) at December 31, 2015, the results of their operations, the changes in their net assets and the financial highlights for each of the years or periods indicated therein, in conformity with U.S. generally accepted accounting principles.

Boston, Massachusetts
February 26, 2016
93
Table of Contents
State Street Institutional Investment Trust
December 31, 2015 (Unaudited)
Shareholder Expense Example
As a shareholder of a fund (the “Funds”), you incur ongoing costs, which include costs for administrative services and to the extent applicable, distribution (12b-1) fees, among others. This example is intended to help you understand your ongoing costs (in dollars) of investing in the Funds and to compare these costs with the ongoing costs of investing in other mutual funds. It is based on an investment of $1,000 made at the beginning of the period shown and held for the six months ended from July 1, 2015 to December 31, 2015.
| a. | Actual Expenses – This section helps you to estimate the actual expenses that you paid over the period. The “Ending Account Value” shown is derived from the Fund’s actual return, and the third column shows the dollar amount that would have been paid by an investor who started with $1,000 in the Fund. You may use the information here, together with the amount you invested, to estimate the expenses that you paid over the period. To do so, simply divide your account value by $1,000 (for example, an $8,600 account value divided by $1,000 = 8.6), then multiply the result by the number given for the Fund under the heading “Expenses Paid During Period”. |
| b. | Hypothetical Example for Comparison Purposes – This section is intended to help you compare your Fund’s costs with those of other mutual funds. It assumes that the Fund had a yearly return of 5% before expenses, but that the expense ratio is unchanged. In this case, because the return used is not the Fund’s actual return, the results do not apply to your investment. The example is useful in making comparisons because the Securities and Exchange Commission requires all mutual funds to calculate expenses based on a 5% return. You can assess your Fund’s costs by comparing this hypothetical example with the hypothetical examples that appear in shareholder reports of other funds. |
| Class A Shares | Beginning July 1, 2015 | Ending Account Value | Expenses Paid During | |||||||||
Based on Actual Fund Return | ||||||||||||
State Street Aggregate Bond Index Fund | $ | 1,000.00 | $ | 1,006.24 | $ | 1.48 | ||||||
State Street Global Equity ex-U.S. Index Fund | $ | 1,000.00 | $ | 899.99 | $ | 1.08 | ||||||
State Street Small/Mid Cap Equity Index Fund | $ | 1,000.00 | $ | 937.34 | $ | 0.61 | ||||||
| Based on Hypothetical (5% return before expenses) | Beginning January 1, 2015 | Ending Account Value December 31, 2015 | Expenses Paid During | |||||||||
State Street Aggregate Bond Index Fund | $ | 1,000.00 | $ | 1,023.72 | $ | 1.50 | ||||||
State Street Global Equity ex-U.S. Index Fund | $ | 1,000.00 | $ | 1,024.07 | $ | 1.15 | ||||||
State Street Small/Mid Cap Equity Index Fund | $ | 1,000.00 | $ | 1,024.38 | $ | 0.83 | ||||||
94
Table of Contents
State Street Institutional Investment Trust
Other Information — (continued)
December 31, 2015 (Unaudited)
Shareholder Expense Example — (continued)
| * | The calculations are based on expenses incurred in the most recent six month period of the Portfolios. Each Fund’s annualized expense ratio for the six months ended December 31, 2015 was as follows: |
State Street Aggregate Bond Index Fund | 0.29% | |||
State Street Global Equity ex-U.S. Index Fund | 0.23% | ** | ||
State Street Small/Mid Cap Equity Index Fund | 0.16% |
| ** | An expense adjustment was recorded in the Fund’s most recent six-month period. Had the adjustment been recorded throughout the entire fiscal year, the annualized expense ratio would have been 0.31%. |
| The dollar amounts shown as “Expenses Paid” are equal to the annualized expense ratio multiplied by the average account value over the period, multiplied by 184/365 (the most recent six month period). |
| Class I Shares | Beginning July 1, 2015 | Ending Account Value | Expenses Paid During | |||||||||
Based on Actual Fund Return | ||||||||||||
State Street Aggregate Bond Index Fund | $ | 1,000.00 | $ | 1,006.68 | $ | 0.15 | ||||||
State Street Global Equity ex-U.S. Index Fund | $ | 1,000.00 | $ | 901.27 | ($ | 0.12 | ) | |||||
State Street Small/Mid Cap Equity Index Fund | $ | 1,000.00 | $ | 938.23 | $ | 0.04 | ||||||
| Based on Hypothetical (5% return before expenses) | Beginning January 1, 2015 | Ending Account Value December 31, 2015 | Expenses Paid During | |||||||||
State Street Aggregate Bond Index Fund | $ | 1,000.00 | $ | 1,025.05 | $ | 0.16 | ||||||
State Street Global Equity ex-U.S. Index Fund | $ | 1,000.00 | $ | 1,025.33 | $ | (0.13 | ) | |||||
State Street Small/Mid Cap Equity Index Fund | $ | 1,000.00 | $ | 1,025.10 | $ | 0.11 | ||||||
| * | The calculations are based on expenses incurred in the most recent six month period of the Portfolios. Each Fund’s annualized expense ratio for the six months ended December 31, 2015 was as follows: |
State Street Aggregate Bond Index Fund | 0.03 | % | ||
State Street Global Equity ex-U.S. Index Fund | (0.02 | )%** | ||
State Street Small/Mid Cap Equity Index Fund | 0.02 | % |
| ** | An expense adjustment was recorded in the Fund’s most recent six-month period. Had the adjustment been recorded throughout the entire fiscal year, the annualized expense ratio would have been 0.06%. |
| The dollar amounts shown as “Expenses Paid” are equal to the annualized expense ratio multiplied by the average account value over the period, multiplied by 184/365 (the most recent six month period). |
| Class K Shares | Beginning July 1, 2015 | Ending Account Value | Expenses Paid During | |||||||||
Based on Actual Fund Return | ||||||||||||
State Street Aggregate Bond Index Fund | $ | 1,000.00 | $ | 1,006.69 | $ | 0.15 | ||||||
State Street Global Equity ex-U.S. Index Fund | $ | 1,000.00 | $ | 901.27 | $ | (0.09 | ) | |||||
State Street Small/Mid Cap Equity Index Fund | $ | 1,000.00 | $ | 936.22 | $ | 0.15 | ||||||
95
Table of Contents
State Street Institutional Investment Trust
Other Information — (continued)
December 31, 2015 (Unaudited)
Shareholder Expense Example — (continued)
| Class K Shares | Beginning January 1, 2015 | Ending Account Value December 31, 2015 | Expenses Paid During | |||||||||
Based on Hypothetical (5% return before expenses) | ||||||||||||
State Street Aggregate Bond Index Fund | $ | 1,000.00 | $ | 1,025.06 | $ | 0.15 | ||||||
State Street Global Equity ex-U.S. Index Fund | $ | 1,000.00 | $ | 1,025.30 | $ | (0.10 | ) | |||||
State Street Small/Mid Cap Equity Index Fund | $ | 1,000.00 | $ | 1,025.01 | $ | 0.20 | ||||||
| * | The calculations are based on expenses incurred in the most recent six month period of the Portfolios. Each Fund’s annualized expense ratio for the six months ended December 31, 2015 was as follows: |
State Street Aggregate Bond Index Fund | 0.03 | % | ||
State Street Global Equity ex-U.S. Index Fund | (0.02 | )%** | ||
State Street Small/Mid Cap Equity Index Fund | 0.04 | % |
| The dollar amounts shown as “Expenses Paid” are equal to the annualized expense ratio multiplied by the average account value over the period, multiplied by 184/365 (the most recent six month period). |
| ** | An expense adjustment was recorded in the Fund’s most recent six-month period. Had the adjustment been recorded throughout the entire fiscal year, the annualized expense ratio would have been 0.06% |
Six Months Ended December 31, 2015
Beginning July 1, 2015 | Ending Account Value | Expenses Paid During | ||||||||||
Based on Actual Portfolio Return | ||||||||||||
State Street Aggregate Bond Index Portfolio | $ | 1,000.00 | $ | 1,006.89 | $ | 0.06 | ||||||
State Street Global Equity ex-U.S. Index Portfolio | $ | 1,000.00 | $ | 901.34 | $ | 2.89 | ||||||
State Street Small/Mid Cap Equity Index Portfolio | $ | 1,000.00 | $ | 936.97 | $ | 0.10 | ||||||
| Based on Hypothetical (5% return before expenses) | Beginning January 1, 2015 | Ending Account Value December 31, 2015 | Expenses Paid During | |||||||||
State Street Aggregate Bond Index Portfolio | $ | 1,000.00 | $ | 1,025.14 | $ | 0.06 | ||||||
State Street Global Equity ex-U.S. Index Portfolio | $ | 1,000.00 | $ | 1,022.17 | $ | 3.07 | ||||||
State Street Small/Mid Cap Equity Index Portfolio | $ | 1,000.00 | $ | 1,025.07 | $ | 0.13 | ||||||
| * | The calculations are based on expenses incurred in the most recent six month period of the Portfolios. Each Portfolio’s annualized expense ratio for the six months ended December 31, 2015 was as follows: |
State Street Aggregate Bond Index Portfolio | 0.01% | |||
State Street Global Equity ex-U.S. Index Portfolio | 0.08% | |||
State Street Small/Mid Cap Equity Index Portfolio | 0.03% |
| The dollar amounts shown as “Expenses Paid” are equal to the annualized expense ratio multiplied by the average account value over the period, multiplied by 184/365 (the most recent six month period). |
96
Table of Contents
State Street Institutional Investment Trust
Other Information — (continued)
December 31, 2015 (Unaudited)
Dividend Received Deduction
For federal income tax purposes, the following information is furnished with respect to the distributions of the Trust for its fiscal period ended December 31, 2015.
Percentage of distributions which qualify for the corporate dividends received deduction:
| Fund | Percentage | |
State Street Aggregate Bond Index Fund | 0.00% | |
State Street Global Equity ex-U.S. Index Fund | 0.01 | |
State Street Small/Mid Cap Equity Index Fund | 56.25 | |
State Street Aggregate Bond Index Portfolio | 0.00 | |
State Street Global Equity ex-U.S. Index Portfolio | 0.01 | |
State Street Small/Mid Cap Equity Portfolio | 55.46 |
Qualified Dividend Income
A portion of dividends distributed by the Funds during the fiscal period ended December 31, 2015, are considered qualified dividend income, and are eligible for reduced tax rates. These lower rates range from 5% to 20% depending on the individual’s tax bracket. These amounts are noted below:
| Fund | Amount | |
State Street Global Equity ex-U.S. Index Fund | $1,060,833 | |
State Street Small/Mid Cap Equity Index Fund | 16,126 | |
State Street Global Equity ex-U.S. Index Portfolio | 2,400,603 | |
State Street Small/Mid Cap Equity Portfolio | 109,293 |
Foreign Tax Credit
The Trust has made an election under Internal Revenue Code Section 853 to pass through foreign taxes paid by a Fund to its shareholders. For the year ended December 31, 2015, the total amount of foreign taxes that will be passed through are:
| Fund | Amount | |
State Street Global Equity ex-U.S. Index Fund | $109,704 | |
State Street Global Equity ex-U.S. Index Portfolio | 227,310 |
The amount of foreign source income earned on the following Funds during the year ended December 31, 2015 were as follows:
| Fund | Amount | |
State Street Global Equity ex-U.S. Index Fund | $1,206,244 | |
State Street Global Equity ex-U.S. Index Portfolio | 2,788,465 |
97
Table of Contents
State Street Institutional Investment Trust
Other Information — (continued)
December 31, 2015 (Unaudited)
Long Term Capital Gains
Long term capital gains dividends were paid from the following Funds during the year ended December 31, 2015:
| Fund | Amount | |
State Street Aggregate Bond Index Fund | $153 | |
State Street Small/Mid Cap Equity Index Fund | 1,624 | |
State Street Small/Mid Cap Equity Portfolio | 15,133 |
General Tax Disclosure
Form 1099-DIV mailed to you in January 2016 will show the tax status of all distributions paid to your account in calendar year 2015.
Please consult a tax adviser for questions about federal or state income tax laws.
Proxy Voting Policies and Procedures and Record
The Portfolios have adopted the proxy voting policies of the Adviser. A description of the policies and procedures that the Portfolios have adopted to determine how to vote proxies relating to portfolio securities are contained in the Portfolios’ Statement of Additional Information, which is available (i) without charge, upon request, by calling the Portfolios at (800) 647-7327, (ii) on the U.S. Securities and Exchange Commission’s website at www.sec.gov, or (iii) at the U.S. Securities and Exchange Commission’s public reference room. Information on the operation of the public reference room may be obtained by calling 1-800-SEC-0330. Information regarding how the Portfolios voted proxies, if any, during the most recent 12-month period ended June 30 is available by August 31 of each year without charge (1) by calling 1-800-997-7327 (toll free), or (2) on the website of the Securities and Exchange Commission (“SEC”) at www.sec.gov.
Quarterly Portfolio Schedule
The Portfolios will file their complete schedules of investments with the U.S. Securities and Exchange Commission for the first and third quarters of each fiscal year on Form N-Q. For the second and fourth quarters, the complete schedules of investments are available in the Portfolios’ semi-annual and annual financial statements. The Portfolios’ Form N-Q is available (i) without charge, upon request, by calling the Portfolios at (800) 647-7327, (ii) on the Securities and Exchange Commission’s website at www.sec.gov, or (iii) at the Securities and Exchange Commission’s public reference room. Information on the operation of the public reference room may be obtained by calling 1-800-SEC-0330.
98
Table of Contents
State Street Institutional Investment Trust
Other Information — (continued)
December 31, 2015 (Unaudited)
State Street Small/Mid Cap Equity Index Fund
State Street Small/Mid Cap Equity Index Portfolio
Trustee Considerations in Approval of Investment Advisory Agreement
Overview of the Contract Review Process
Under the Investment Company Act of 1940, an investment advisory agreement between a mutual fund and its investment adviser must be approved by the fund’s board of trustees, including by a vote of a majority of those trustees who are not “interested persons” of the fund (the “Independent Trustees”) cast in-person at a meeting called for the purpose of considering such approval.
Consistent with these requirements, the Independent Trustees on the Board of Trustees (the “Board”) of the State Street Institutional Investment Trust (the “Trust”), met in-person on May 18-19, 2015 to consider proposals to approve, with respect to each of State Street Small/Mid Cap Equity Index Fund and State Street Small/Mid Cap Equity Index Portfolio, each a new series of the Trust (each, a “New Fund” and collectively, the “New Funds”), the investment advisory agreement (the “Advisory Agreement”) with SSGA Funds Management, Inc. (the “Adviser”). Prior to voting on the proposals, the Independent Trustees, as well as the Trustees who are “interested persons” of the Adviser, reviewed information furnished by the Adviser and others reasonably necessary to permit the Board to evaluate the proposals fully. The Independent Trustees were separately represented by co-counsel that is independent of the Adviser in connection with their consideration of approval of the Advisory Agreement with respect to the New Funds. The Independent Trustees considered, among other things, the following:
Information about Fees and Expenses
| • | A report prepared by an independent third-party provider of investment company data, which included for each New Fund (except for State Street Small/Mid Cap Equity Index Portfolio, which operates as a “master” fund in a master/feeder structure and does not pay a management fee to the Adviser): |
| • | Comparisons of each New Fund’s estimated expense ratio (with detail of component expenses) to the expense ratios of a group of comparable mutual funds selected by the independent third-party data provider; and |
| • | Comparisons of each New Fund’s contractual and estimated actual management fees to the contractual and actual management fees of comparable mutual funds. |
| • | Comparative information regarding fees charged by the Adviser for managing institutional accounts using investment strategies and techniques similar to those used in managing each New Fund, to the extent applicable. |
Information about Portfolio Management
| • | Descriptions of the investment management services to be provided by the Adviser, including its investment strategies and processes; |
| • | Information concerning the allocation of brokerage and the benefits to be received by the Adviser as a result of brokerage allocation, including information concerning the acquisition of any research through “soft dollar” benefits to be received in connection with each New Fund’s brokerage; and |
99
Table of Contents
State Street Institutional Investment Trust
Other Information — (continued)
December 31, 2015 (Unaudited)
Trustee Considerations in Approval of Investment Advisory Agreement — (continued)
| • | Information regarding the procedures and processes to be used to value the assets of each New Fund and the assistance to be provided by the Adviser to its affiliates in monitoring the effectiveness of such procedures and processes. |
Information about the Adviser
| • | Reports detailing the financial results and condition of the Adviser and its affiliates; |
| • | Descriptions of the qualifications, education and experience of the individual investment professionals who will be responsible for managing each New Fund; |
| • | A copy of the Code of Ethics adopted by the Adviser, together with information relating to compliance with and the administration of such Code; |
| • | A copy of the Adviser’s proxy voting policies and procedures; |
| • | Information concerning the resources devoted by the Adviser to overseeing compliance by each New Fund and its service providers, including the Adviser’s record of compliance with investment policies and restrictions and other operating policies of the other funds in the fund complex (the “Other Funds”); |
| • | A description of the business continuity and disaster recovery plans of the Adviser; and |
| • | Information regarding the Adviser’s risk management processes. |
Other Relevant Information
| • | Information concerning the nature, quality and cost of various non-investment management services to be provided to each New Fund by the Adviser in its role as administrator, and by affiliates of the Adviser, including the custodian, sub-administrator, fund accountant, transfer agent and securities lending agent of each New Fund, and the role of the Adviser in managing each New Fund’s relationship with these affiliated service providers; |
| • | Copies of the Advisory Agreement and agreements with other service providers of the New Funds; |
| • | Draft responses to the letter dated March 11, 2015 from Joseph P. Barri, LLC (co-counsel along with the law firm of Sullivan & Worcester LLP (together, “Independent Counsel”) to the Independent Trustees reviewed prior to such date by Independent Counsel, requesting specific information regarding the Other Funds, certain of which was applicable to the New Funds, from each of: |
| • | The Adviser, with respect to its operations relating to the Other Funds and its approximate profit margins before taxes from such operations for the Other Funds’ last fiscal year; and the relevant operations of other affiliated service providers to the Other Funds, together with their approximate profit margins from such relevant operations for the Other Funds’ last fiscal year; |
| • | State Street Bank and Trust Company (“State Street”), the sub-administrator, custodian, transfer agent, and securities lending agent for the Other Funds, with respect to its operations relating to the Other Funds; and |
| • | State Street Global Markets, LLC, the principal underwriter and distributor of the shares of the Other Funds (the “Distributor”), with respect to its operations relating to the Other Funds, together with the Other Funds’ related distribution plans and arrangements under SEC Rule 12b-1. |
100
Table of Contents
State Street Institutional Investment Trust
Other Information — (continued)
December 31, 2015 (Unaudited)
Trustee Considerations in Approval of Investment Advisory Agreement — (continued)
In addition to the information identified above, the Board considered information provided by the Adviser and other service providers of the New Funds throughout the year at meetings of the Board and its committees. At such meetings, the Trustees received, among other things, presentations by the portfolio managers and other investment professionals of the Adviser relating to the performance of the Other Funds and the investment strategies used in pursuing each Other Fund’s investment objective.
The Independent Trustees were assisted throughout the contract review process by their independent legal counsel. The Independent Trustees relied upon the advice of such counsel and their own business judgment in determining the material factors to be considered in evaluating the Advisory Agreement, and the weight to be given to each such factor. The conclusions reached with respect to the Advisory Agreement were based on a comprehensive evaluation of all the information provided and not any single factor. Moreover, each Trustee may have placed varying emphasis on particular factors in reaching conclusions with respect to the New Funds.
Results of the Process
Based on a consideration of the foregoing and such other information as deemed relevant, including the factors and conclusions described below, on May 18-19, 2015 the Board, including a majority of the Independent Trustees, voted to approve the Advisory Agreement with respect to each New Fund.
Nature, Extent and Quality of Services
In considering whether to approve the Advisory Agreement, the Board evaluated the nature, extent and quality of services to be provided to each New Fund by the Adviser.
The Board considered the Adviser’s management capabilities and investment process with respect to the types of investments to be held by each New Fund, including the education, experience and number of investment professionals and other personnel who will provide portfolio management, investment research, and similar services to each New Fund. The Board evaluated, where relevant, the abilities and experience of such investment personnel in analyzing particular markets, industries and specific issuers of securities in these markets and industries. The Board also took into account the compensation paid to recruit and retain investment personnel, and the time and attention to be devoted to the New Funds by senior management.
The Board reviewed the compliance programs of the Adviser and various affiliated service providers. Among other things, the Board considered compliance and reporting matters relating to personal trading by investment personnel, selective disclosure of portfolio holdings, late trading, frequent trading, portfolio valuation, business continuity, the allocation of investment opportunities and the voting of proxies. The Board also considered the role of the Adviser in monitoring the New Funds’ securities lending activities.
On the basis of the foregoing and other relevant information, the Board concluded that the Adviser can be expected to provide high quality investment management and related services for each New Fund.
101
Table of Contents
State Street Institutional Investment Trust
Other Information — (continued)
December 31, 2015 (Unaudited)
Trustee Considerations in Approval of Investment Advisory Agreement — (continued)
Fund Performance
Because the New Funds have not yet commenced operations, the Board noted that they could not draw any conclusions regarding the performance of the New Funds. The Board, however, considered, at this and at prior meetings, the performance of other comparable funds or accounts, if any, managed by the Adviser and the performance of their respective benchmarks and/or peer groups. The Board also noted that it reviews at its regularly scheduled meetings information about the performance of the Other Funds and is generally satisfied with the performance of these Other Funds.
Management Fees and Expenses
The Board reviewed the contractual management fee rate to be payable by the New Funds and the actual management fee rate to be payable by the New Funds, net of waivers (except for State Street Small/Mid Cap Equity Index Portfolio, which does not pay a management fee to the Adviser as such fee as paid at the “feeder” fund level). As part of its review, the Board considered each New Fund’s management fee and total expense ratio (both before and after giving effect to any expense caps), as compared to a group of similarly managed funds selected by an independent third-party provider of investment company data. The Board also considered the comparability of the fees to be charged and the services to be provided to the New Funds by the Adviser to the fees charged and services provided to other clients of the Adviser, including institutional accounts, to the extent applicable. In addition, the Board considered that the Adviser agreed to waive fees or pay expenses of the New Funds to limit the total expenses borne by the New Funds’ shareholders. Among other information, the Board considered the following expense information in its evaluation of the New Funds:
The Board considered that each New Fund’s contractual management fee was below the median of its respective Expense Group. The Board also considered that State Street Small/Mid Cap Equity Index Fund’s expected actual management fee was equal to the Expense Group median and below the Expense Universe median. The Board also considered that State Street Small/Mid Cap Equity Index Fund’s expected total expenses were below the medians of the Expense Group and Expense Universe.
Profitability
Because the New Funds have not yet commenced operations, the Board noted that they could not draw any conclusions regarding the profitability of the New Funds. The Board, however, reviewed the level of profits realized by the Adviser and its affiliates in providing investment advisory and other services to the Other Funds. The Board considered other direct and indirect benefits received by the Adviser and the affiliated service providers in connection with their relationships with the Other Funds, including the benefits of research services that may be available to the Adviser as a result of securities transactions effected for the Other Funds and other investment advisory clients, together with the ranges of profitability of each of the affiliated service providers with respect to their services to the Other Funds.
The Board concluded that the expected profitability of the Adviser with respect to New Funds, and the expected profitability range of each of the affiliated service providers with respect to its services to the New Funds, was expected to be reasonable in relation to the services provided.
102
Table of Contents
State Street Institutional Investment Trust
Other Information — (continued)
December 31, 2015 (Unaudited)
Trustee Considerations in Approval of Investment Advisory Agreement — (continued)
Economies of Scale
In reviewing expected management fees and anticipated profitability, the Board also considered the extent to which the Adviser and its affiliates, on the one hand, and the New Funds, on the other hand, can expect to realize benefits from economies of scale as the New Funds’ assets increase. The Board acknowledged the difficulty in accurately measuring the expected benefits resulting from the economies of scale with respect to the management of the New Funds in view of the fact that the New Funds have not yet commenced operations. The Board concluded that, in light of the fact that the New Funds have not yet commenced operations, and the comparatively low management fees and expense ratios of the New Funds, it does not appear that the Adviser or its affiliates are expected to realize benefits from economies of scale in managing the assets of the New Funds to such an extent that the proposed advisory fees should be reduced or that breakpoints in such fees should be implemented for the New Funds at this time.
Conclusions
In reaching its decision to approve the Advisory Agreement, the Board did not identify any single factor as being controlling, but based its recommendation on each of the factors it considered. Each Trustee may have contributed different weight to the various factors. Based upon the materials reviewed, the representations made and the considerations described above, and as part of their deliberations, the Board, including the Independent Trustees, concluded that the Adviser possesses the capability and resources to perform the duties required of it under the Advisory Agreement.
Further, based upon its review of the Advisory Agreement, the materials provided, and the considerations described above, the Board, including the Independent Trustees, concluded that (1) the terms of the Advisory Agreement are reasonable, fair, and in the best interests of the New Funds and their shareholders, and (2) the rates to be payable under the Advisory Agreement are fair and reasonable in light of the usual and customary charges made for services of the same nature and quality.
103
Table of Contents
State Street Institutional Investment Trust
Trustees and Officers Information
December 31, 2015 (Unaudited)
Name, Address, and Year of Birth | Position(s) Held | Term of Office Time Served | Principal Occupation During Past Five Years and Relevant Experience | Number of Funds in Fund Complex Overseen by Trustee | Other Directorships Held by Trustee During Past Five Years | |||||
Independent Trustees | ||||||||||
Michael F. Holland State Street Bank and Trust Company 100 Huntington Avenue, CPH 0326 Boston, MA 02116 YOB: 1944 | Trustee and Co-Chairman of the Board | Term: Indefinite Elected: 7/99 | Chairman, Holland & Company L.L.C. (investment adviser) (1995 – present). | 75 | Director, the Holland Series Fund, Inc.; Director, The China Fund, Inc.; Director, The Taiwan Fund, Inc.; Director, Reaves Utility Income Fund, Inc.; and Director, Blackstone/GSO Loan Funds. | |||||
Patrick J. Riley State Street Bank and Trust Company 100 Huntington Avenue, CPH 0326 Boston, MA 02116 YOB: 1948 | Trustee and Co-Chairman of the Board | Term: Indefinite Elected: 1/14 | 2002 to May 2010, Associate Justice of the Superior Court, Commonwealth of Massachusetts; 1985 to 2002, Partner, Riley, Burke & Donahue, L.L.P. (law firm); 1998 to Present, Independent Director, State Street Global Advisers Ireland, Ltd. (investment company); 1998 to Present, Independent Director, SSgA Liquidity plc (formerly, SSgA Cash Management Fund plc); January 2009 to Present, Independent Director, SSGA Fixed Income plc; and January 2009 to Present, Independent Director, SSGA Qualified Funds PLC. | 75 | Board Director and Chairman, SPDR Europe 1PLC Board (2011 – Present); Board Director and Chairman, SPDR Europe II, PLC (2013 – Present). | |||||
William L. Boyan State Street Bank and Trust Company 100 Huntington Avenue, CPH 0326 Boston, MA 02116 YOB: 1937 | Trustee and Co-Chairman of the Valuation Committee | Term: Indefinite Elected: 7/99 | President and Chief Operations Officer, John Hancock Financial Services (1959 – 1999). Mr. Boyan retired in 1999. Chairman Emeritus, Children’s Hospital, Boston, MA (1984 – 2011); Former Trustee of Old Mutual South Africa Master Trust (investments) (1995 – 2008); Former Chairman, Boston Plan For Excellence, Boston Public Schools (1995 – 2010); Member of Advisory Board of Florida Atlantic University Lifelong Learning Society. | 75 | Former Trustee of Old Mutual South Africa Master Trust. | |||||
William L. Marshall State Street Bank and Trust Company 100 Huntington Avenue, CPH 0326 Boston, MA 02116 YOB: 1942 | Trustee and Co-Chairman of the Audit Committee | Term: Indefinite Elected: 1/14 | April 2011 to Present, Chairman (until April 2011, Chief Executive Officer and President), Wm. L. Marshall Associates, Inc., Wm. L. Marshall Companies, Inc. and the Marshall Financial Group, Inc. (a registered investment adviser and provider of financial and related consulting services); Certified Financial Planner; Member, Financial Planners Association; 2015 to present, Board Member, The Doylestown Health Foundation Board. | 75 | Marshall Financial Group, Inc. | |||||
104
Table of Contents
State Street Institutional Investment Trust
Trustees and Officers Information — (continued)
December 31, 2015 (Unaudited)
Name, Address, and Year of Birth | Position(s) Held | Term of Office Time Served | Principal Occupation During Past Five Years and Relevant Experience | Number of Funds in Fund Complex Overseen by Trustee | Other Directorships Held by Trustee During Past Five Years | |||||
Independent Trustees (continued) | ||||||||||
Richard D. Shirk State Street Bank and Trust Company 100 Huntington Avenue, CPH 0326 Boston, MA 02116 YOB: 1945 | Trustee and Co-Chairman of the Qualified Legal and Compliance Committee | Term: Indefinite Elected: 1/14 | March 2001 to April 2002, Chairman (1996 to March 2001, President and Chief Executive Officer), Cerulean Companies, Inc. (holding company) (Retired); 1992 to March 2001, President and Chief Executive Officer, Blue Cross Blue Shield of Georgia (health insurer, managed healthcare); 1998 to December 2008, Chairman, Board Member and December 2008 to Present, Investment Committee Member, Healthcare Georgia Foundation (private foundation); September 2002 to 2012, Lead Director and Board Member, Amerigroup Corp. (managed health care); 1999 to 2013, Board Member and (since 2001) Investment Committee Member, Woodruff Arts Center; and 2003 to 2009, Trustee, Gettysburg College. | 75 | Board member, AeroCare Holdings (privately held healthcare services company) (February 2003 – Present); Board member, Regenesis Biomedical (health care services) (April 2012 – Present); Chairman (January 2014 – Present). | |||||
Rina K. Spence State Street Bank and Trust Company 100 Huntington Avenue, CPH 0326 Boston, MA 02116 YOB: 1948 | Trustee and Co-Chairman of the Qualified Legal and Compliance Committee and Co-Chairman of the Governance Committee | Term: Indefinite Elected: 7/99 | President of SpenceCare International LLC (international healthcare consulting) (1999 – present); Chief Executive Officer, IEmily.com (health internet company) (2000 – 2001); Chief Executive Officer of Consensus Pharmaceutical, Inc. (1998 – 1999); Founder, President and Chief Executive Officer of Spence Center for Women’s Health (1994 – 1998); President and CEO Emerson Hospital (1984 – 1994); Trustee, Eastern Enterprise (utilities) (1988 – 2000); Director, Berkshire Life Insurance Company of America (1993 – 2009); Honorary Consul for Monaco in Boston (2015 – present). | 75 | ||||||
Bruce D. Taber State Street Bank and Trust Company 100 Huntington Avenue, CPH 0326 Boston, MA 02116 YOB: 1943 | Trustee and Co-Chairman of the Valuation Committee and Co-Chairman of the Governance Committee | Term: Indefinite Elected: 1/14 | 1999 to Present, Partner, Zenergy LLC (a technology company providing Computer Modeling and System Analysis to the General Electric Power Generation Division); Until December 2008, Independent Director, SSGA Cash Management Fund plc; Until December 2008, Independent Director, State Street Global Advisers Ireland, Ltd. (investment companies); and Until August 1994, President, Alonzo B. Reed, Inc., (a Boston architect-engineering firm). | 75 | ||||||
105
Table of Contents
State Street Institutional Investment Trust
Trustees and Officers Information — (continued)
December 31, 2015 (Unaudited)
Name, Address, and Year of Birth | Position(s) Held | Term of Office Time Served | Principal Occupation During Past Five Years and Relevant Experience | Number of Funds in Fund Complex Overseen by Trustee | Other Directorships Held by Trustee During Past Five Years | |||||
Independent Trustees (continued) | ||||||||||
Douglas T. Williams State Street Bank and Trust Company 100 Huntington Avenue, CPH 0326 Boston, MA 02116 YOB: 1940 | Trustee and Co-Chairman of the Audit Committee | Term: Indefinite Elected: 7/99 | President, Oakmont Homeowners Association; President, Mariner Sands Chapel; Executive Vice President and member of Executive Committee, Chase Manhattan Bank (1987 – 1999); President, Boston Stock Exchange Depository Trust Company, 1981 – 1982; Treasurer, Nantucket Educational Trust, (2002 – 2007). | 75 | ||||||
Interested Trustee(1) | ||||||||||
James E. Ross SSGA Funds Management, Inc. State Street Financial Center One Lincoln Street Boston, MA 02111-2900 YOB: 1965 | Trustee | Term: Indefinite Elected Trustee: 2/07 | Chairman and Director, SSGA Funds Management, Inc. (2012 – present); President, SSGA Funds Management, Inc. (2005 – 2012); Executive Vice President and Senior Managing Director, State Street Global Advisors (2006 – Present); and Principal, State Street Global Advisors (2006 – present). | 290 | Trustee, SPDR Series Trust; Trustee, SPDR Index Shares Funds; Trustee, Select Sector SPDR Trust; Trustee, SSGA Active Trust; and Trustee, SSGA Master Trust. | |||||
| (1) | Mr. Ross is an Interested Trustee because of his employment by SSGA Funds Management, Inc., an affiliate of the Trust. |
106
Table of Contents
State Street Institutional Investment Trust
Trustees and Officers Information — (continued)
December 31, 2015 (Unaudited)
Name, Address, and Year of Birth | Position(s) Held | Term of Office Time Served | Principal Occupation During Past Five Years | |||
Officers: | ||||||
Ellen M. Needham SSGA Funds Management, Inc. State Street Financial Center One Lincoln Street Boston, MA 02111-2900 YOB: 1967 | President | Term: Indefinite Elected: 10/12 | President and Director, SSGA Funds Management, Inc. (June 2012 – present); Chief Operating Officer, SSGA Funds Management, Inc. (May 2010 – June 2012); Senior Managing Director, SSGA Funds Management, Inc. (1992-2012) and Senior Managing Director, State Street Global Advisors (1992 – present).* | |||
Bruce S. Rosenberg SSGA Funds Management, Inc. State Street Financial Center One Lincoln Street Boston, MA 02111 YOB: 1961 | Treasurer | Term: Indefinite Elected: 2/16 | Managing Director, State Street Global Advisors and SSGA Funds Management, Inc. (July 2015 – present); Director, Credit Suisse (April 2008 – July 2015). | |||
Ann M. Carpenter SSGA Funds Management, Inc. State Street Financial Center One Lincoln Street Boston, MA 02111-2900 YOB: 1966 | Vice President and Deputy Treasurer | Term: Indefinite Elected 10/12 Term: Indefinite Elected: 2/16 | Chief Operating Officer, SSGA Funds Management, Inc. (April 2014 – present); Vice President, State Street Global Advisors and SSGA Funds Management, Inc. (2005 – present).* | |||
Chad C. Hallett SSGA Funds Management, Inc. State Street Financial Center One Lincoln Street Boston, MA 02111 YOB: 1969 | Deputy Treasurer | Term: Indefinite Elected: 2/16 | Vice President, State Street Global Advisors and SSGA Funds Management, Inc. (November 2014 – present); Vice President, State Street Bank and Trust Company (2001 – November 2014).* | |||
Sujata Upreti SSGA Funds Management, Inc. State Street Financial Center One Lincoln Street Boston, MA 02111 YOB: 1974 | Assistant Treasurer | Term: Indefinite Elected: 2/16 | Vice President, State Street Global Advisors and SSGA Funds Management, Inc. (May 2015 – present); Assistant Director, Cambridge Associates, LLC (July 2014 – January 2015); Vice President, Bank of New York Mellon (July 2012 – August 2013); Manager, PricewaterhouseCoopers, LLP (September 2009 – July 2012). | |||
Daniel Foley SSGA Funds Management, Inc. State Street Financial Center One Lincoln Street Boston, MA 02111 YOB: 1972 | Assistant Treasurer | Term: Indefinite Elected: 2/16 | Vice President, State Street Global Advisors and SSGA Funds Management, Inc. (April 2014 – present); Principal, State Street Global Advisors and SSGA Funds Management, Inc. (April 2007 – April 2014). | |||
Brian Harris State Street Financial Center One Lincoln Street Boston, MA 02111 YOB: 1973 | Chief Compliance Officer | Term: Indefinite Elected: 11/13 | Vice President, State Street Global Advisors and SSGA Funds Management, Inc. (June 2013 – Present); Senior Vice President and Global Head of Investment Compliance, BofA Global Capital Management (September 2010 to May 2013); Director of Compliance, AARP Financial Inc. (July 2008 to August 2010). |
107
Table of Contents
State Street Institutional Investment Trust
Trustees and Officers Information — (continued)
December 31, 2015 (Unaudited)
Name, Address, and Year of Birth | Position(s) Held | Term of Office Time Served | Principal Occupation During Past Five Years | |||
Officers: (continued) | ||||||
Trevor Swanberg SSGA Funds Management, Inc. State Street Financial Center One Lincoln Street Boston, MA 02111 YOB: 1979 | Code of Ethics Compliance Officer | Term: Indefinite Elected:8/15 | Vice President, State Street Global Advisors and SSGA Funds Management, Inc. (January 2015-Present); Senior Manager-Mutual Fund Compliance, ICMA-Retirement Corporation (December 2011 – January 2015); Assistant Vice President, J.P. Morgan (September 2007 – December 2011). | |||
Joshua A. Weinberg SSGA Funds Management, Inc. State Street Financial Center One Lincoln Street Boston, MA 02111-2900 YOB: 1978 | Chief Legal Officer | Term: Indefinite Elected: 2/15 | Vice President and Managing Counsel, State Street Global Advisors (2011 –present); Clerk, SSGA Funds Management, Inc. (2013 – present); Associate, Financial Services Group, Dechert LLP (2006 – 2011). | |||
David K. James State Street Bank and Trust Company 100 Huntington Avenue, 3rd Floor Boston, MA 02116 YOB: 1970 | Secretary | Term: Indefinite Elected: 4/13 | Managing Director and Managing Counsel, State Street Bank and Trust Company (2009 – present); Vice President and Counsel, PNC Global Investment Servicing (US), Inc. (2006 – 2009). | |||
Kristin Schantz State Street Bank and Trust Company 100 Huntington Avenue, 3rd Floor Boston, MA 02116 YOB: 1979 | Assistant Secretary | Term: Indefinite Elected: 2/14 | Vice President and Counsel, State Street Bank and Trust Company (2013 –present); Vice President, Citi Fund Services Ohio, Inc. (2008 – 2013). |
| * | Served in various capacities and/or with various affiliated entities during noted time period. |
108
Table of Contents
Trustees
William L. Boyan
Michael F. Holland
William L. Marshall
Patrick J. Riley
James E. Ross
Richard D. Shirk
Rina K. Spence
Bruce D. Taber
Douglas T. Williams
Investment Adviser and Administrator
SSGA Funds Management, Inc.
State Street Financial Center
One Lincoln Street
Boston, MA 02111
Custodian, Sub-Administrator of the Funds and the Portfolios and Transfer Agent of the Portfolios
State Street Bank and Trust Company
State Street Financial Center
One Lincoln Street
Boston, MA 02111
Independent Registered Public Accounting Firm
Ernst & Young LLP
200 Clarendon Street
Boston, MA 02116
Legal Counsel
Ropes & Gray LLP
800 Boylston Street
Boston, MA 02119
Transfer Agent of the Funds
Boston Financial Data Services
2000 Crown Colony Drive
Quincy, MA 02169
Distributor
State Street Global Markets LLC
State Street Financial Center
One Lincoln Street
Boston, MA 02111
This report is for shareholder information. This is not a prospectus intended for use in the purchase or sale of shares of beneficial interest.
State Street Institutional Investment Trust State Street Bank and Trust Company P.O. Box 5049 Boston, MA 02206 | IBG-18499 |
Table of Contents
Annual Report
31 December 2015
State Street Institutional Investment Trust
State Street Emerging Markets Equity Index Fund

Table of Contents
State Street Institutional Investment Trust
State Street Emerging Markets Equity Index Fund
Annual Report
December 31, 2015
| 1 | ||||
| 2 | ||||
| 13 | ||||
| 14 | ||||
| 15 | ||||
| 16 | ||||
| 17 | ||||
| 28 | ||||
| 29 | ||||
| 32 | ||||
Trustee Consideration in Approval of Investment Advisory Agreement | 33 | |||
| 37 | ||||
Table of Contents
State Street Institutional Investment Trust
State Street Emerging Markets Equity Index Fund
Portfolio Statistics (Unaudited)
The Fund has less than six months of operations at reporting end and therefore does not have performance history to provide in this report.
Portfolio Composition* | December 31, 2015 | |||
Common Stocks | 90.1 | % | ||
Rights | 0.0 | ** | ||
Short-Term Investment | 9.4 | |||
Other Assets in Excess of Liabilities | 0.5 | |||
Total | 100.0 | % |
| ** | Less than 0.05% of net assets. |
Top Five Sectors (excluding short-term investment)* | December 31, 2015 | |||
Banks | 16.6 | % | ||
Oil, Gas & Consumable Fuels | 6.1 | |||
Internet Software & Services | 6.0 | |||
Technology Hardware, Storage & Peripherals | 5.3 | |||
Semiconductors & Semiconductor Equipment | 4.5 | |||
Total | 38.5 | % |
| * | As a percentage of net assets as of the date indicated. The Fund’s composition will vary over time. |
See accompanying notes to financial statements.
1
Table of Contents
State Street Institutional Investment Trust
State Street Emerging Markets Equity Index Fund
December 31, 2015
Security Description | Shares | Value | ||||||
COMMON STOCKS – 90.1% | ||||||||
Brazil – 5.4% | ||||||||
Ambev SA(a) | 225,435 | $ | 1,012,949 | |||||
B2W Cia Digital(a)(b) | 5,600 | 21,480 | ||||||
Banco Bradesco SA(a) | 36,200 | 186,496 | ||||||
Banco Bradesco SA Preference Shares(a) | 120,600 | 583,548 | ||||||
Banco do Brasil SA(a) | 41,100 | 152,218 | ||||||
Banco Santander Brasil SA(a) | 19,900 | 80,193 | ||||||
BB Seguridade Participacoes SA(a) | 33,400 | 204,116 | ||||||
BM&FBovespa SA(a) | 82,500 | 225,578 | ||||||
BR Malls Participacoes SA(a) | 21,000 | 58,515 | ||||||
Braskem SA Class A, Preference Shares(a) | 7,400 | 51,425 | ||||||
BRF SA(a) | 31,300 | 436,584 | ||||||
CCR SA(a) | 42,200 | 133,336 | ||||||
Centrais Eletricas Brasileiras SA Class B, Preference Shares(a) | 10,800 | 28,367 | ||||||
CETIP SA – Mercados Organizados(a) | 10,700 | 101,113 | ||||||
Cia Brasileira de Distribuicao Preference Shares(a) | 7,500 | 78,972 | ||||||
Cia de Saneamento Basico do Estado de Sao Paulo(a) | 16,400 | 78,106 | ||||||
Cia Energetica de Minas Gerais Preference Shares(a) | 36,000 | 55,503 | ||||||
Cia Energetica de Sao Paulo Class B, Preference Shares(a) | 9,000 | 30,367 | ||||||
Cia Paranaense de Energia Preference Shares(a) | 4,900 | 29,930 | ||||||
Cia Siderurgica Nacional SA(a) | 29,900 | 29,966 | ||||||
Cielo SA(a) | 40,600 | 342,955 | ||||||
Cosan SA Industria e Comercio(a) | 5,900 | 37,372 | ||||||
CPFL Energia SA(a)(b) | 9,500 | 36,323 | ||||||
Duratex SA(a) | 14,300 | 21,276 | ||||||
EDP – Energias do Brasil SA(a) | 11,400 | 34,590 | ||||||
Embraer SA(a) | 31,800 | 241,656 | ||||||
Equatorial Energia SA(a) | 8,500 | 73,517 | ||||||
Estacio Participacoes SA(a) | 13,600 | 47,631 | ||||||
Fibria Celulose SA(a) | 11,900 | 156,218 | ||||||
Gerdau SA Preference Shares(a) | 41,100 | 47,878 | ||||||
Hypermarcas SA(a)(b) | 16,700 | 91,195 | ||||||
Itau Unibanco Holding SA Preference Shares(a) | 145,200 | 960,399 | ||||||
Itausa – Investimentos Itau SA Preference Shares(a) | 169,200 | 292,376 | ||||||
JBS SA(a) | 35,200 | 109,237 | ||||||
Klabin SA(a) | 26,473 | 156,630 | ||||||
Kroton Educacional SA(a) | 66,100 | 158,108 | ||||||
Localiza Rent a Car SA(a) | 7,000 | 43,701 | ||||||
Lojas Americanas SA(a) | 7,500 | 23,529 | ||||||
Lojas Americanas SA Preference Shares(a) | 23,300 | 113,585 | ||||||
Lojas Renner SA(a) | 30,600 | 131,450 | ||||||
M Dias Branco SA(a) | 1,600 | 26,867 | ||||||
Multiplan Empreendimentos Imobiliarios SA(a) | 3,900 | 37,279 | ||||||
Natura Cosmeticos SA(a) | 8,200 | 48,488 | ||||||
Odontoprev SA(a) | 12,700 | 30,281 | ||||||
Petroleo Brasileiro SA(a)(b) | 142,300 | 304,389 | ||||||
Petroleo Brasileiro SA Preference Shares(a)(b) | 187,500 | 313,844 | ||||||
Porto Seguro SA(a) | 5,500 | 39,936 | ||||||
Qualicorp SA(a) | 10,492 | 37,318 | ||||||
Raia Drogasil SA(a) | 10,200 | 91,271 | ||||||
Sul America SA(a) | 8,400 | 39,399 | ||||||
Suzano Papel e Celulose SA Class A, Preference Shares(a) | 17,600 | 83,114 | ||||||
Telefonica Brasil SA Preference Shares(a) | 18,800 | 169,124 | ||||||
Tim Participacoes SA(a) | 40,500 | 69,850 | ||||||
TOTVS SA(a) | 5,900 | 46,144 | ||||||
Tractebel Energia SA(a) | 7,800 | 65,769 | ||||||
Transmissora Alianca de Energia Eletrica SA(a) | 4,600 | 19,453 | ||||||
Ultrapar Participacoes SA(a) | 17,300 | 262,901 | ||||||
Vale SA(a) | 61,500 | 200,366 | ||||||
Vale SA Preference Shares(a) | 92,100 | 235,961 | ||||||
WEG SA(a) | 27,000 | 101,943 | ||||||
|
| |||||||
| 8,922,085 | ||||||||
|
| |||||||
Chile – 1.2% | ||||||||
AES Gener SA | 120,485 | 53,465 | ||||||
Aguas Andinas SA Class A | 125,020 | 64,147 | ||||||
Banco de Chile | 1,148,973 | 117,038 | ||||||
Banco de Credito e Inversiones(a) | 1,589 | 59,723 | ||||||
Banco Santander Chile | 3,153,334 | 141,468 | ||||||
Cencosud SA | 62,155 | 124,117 | ||||||
Cia Cervecerias Unidas SA | 7,066 | 78,179 | ||||||
Colbun SA | 377,278 | 90,087 | ||||||
Corpbanca SA(a) | 7,322,567 | 58,678 | ||||||
Embotelladora Andina SA Class B, Preference Shares(a) | 12,445 | 37,002 | ||||||
Empresa Nacional de Electricidad SA | 156,849 | 194,481 | ||||||
Empresa Nacional de Telecomunicaciones SA | 5,653 | 50,587 | ||||||
Empresas CMPC SA | 59,761 | 128,942 | ||||||
Empresas COPEC SA | 21,751 | 186,728 | ||||||
Enersis SA | 938,841 | 226,655 | ||||||
Latam Airlines Group SA(a)(b) | 14,345 | 75,176 | ||||||
SACI Falabella | 23,278 | 148,354 | ||||||
Sociedad Quimica y Minera de Chile SA Class B, Preference Shares(a) | 4,605 | 86,177 | ||||||
SONDA SA | 22,905 | 40,590 | ||||||
|
| |||||||
| 1,961,594 | ||||||||
|
| |||||||
China – 25.5% | ||||||||
58.com, Inc. ADR(b) | 1,800 | 118,728 | ||||||
AAC Technologies Holdings, Inc.(a) | 35,000 | 226,784 | ||||||
Agricultural Bank of China, Ltd. Class H(a) | 1,102,000 | 448,454 | ||||||
Air China, Ltd. Class H(a) | 88,000 | 69,130 | ||||||
Alibaba Group Holding, Ltd. ADR(b) | 24,000 | 1,950,480 | ||||||
Alibaba Health Information Technology, Ltd.(a)(b) | 116,000 | 79,879 | ||||||
Aluminum Corp. of China, Ltd. Class H(a)(b) | 188,000 | 61,953 | ||||||
See accompanying notes to financial statements.
2
Table of Contents
State Street Institutional Investment Trust
State Street Emerging Markets Equity Index Fund
Schedule of Investments — (continued)
December 31, 2015
Security Description | Shares | Value | ||||||
COMMON STOCKS – (continued) |
| |||||||
China – (continued) | ||||||||
Anhui Conch Cement Co., Ltd. Class H(a) | 59,000 | $ | 157,710 | |||||
ANTA Sports Products, Ltd.(a) | 48,000 | 131,224 | ||||||
AviChina Industry & Technology Co., Ltd. Class H(a) | 104,000 | 81,262 | ||||||
Baidu, Inc. ADR(b) | 6,600 | 1,247,664 | ||||||
Bank of China, Ltd. Class H(a) | 3,798,000 | 1,685,201 | ||||||
Bank of Communications Co., Ltd. Class H(a) | 419,000 | 293,831 | ||||||
Beijing Capital International Airport Co., Ltd. Class H(a) | 72,000 | 77,331 | ||||||
Beijing Enterprises Holdings, Ltd.(a) | 25,000 | 150,865 | ||||||
Beijing Enterprises Water Group, Ltd.(a)(b) | 208,000 | 145,609 | ||||||
Belle International Holdings, Ltd.(a) | 222,000 | 166,100 | ||||||
Brilliance China Automotive Holdings, Ltd.(a) | 144,000 | 179,921 | ||||||
Byd Co., Ltd. Class H(a)(b) | 31,000 | 169,296 | ||||||
CAR, Inc.(a)(b) | 39,000 | 64,265 | ||||||
CGN Power Co., Ltd. Class H(a)(c) | 426,000 | 158,607 | ||||||
China Cinda Asset Management Co., Ltd. Class H(a) | 418,000 | 154,383 | ||||||
China CITIC Bank Corp., Ltd. Class H(a)(b) | 391,000 | 252,001 | ||||||
China Coal Energy Co., Ltd. Class H(a) | 128,000 | 48,715 | ||||||
China Communications Construction Co., Ltd. Class H(a) | 211,000 | 213,514 | ||||||
China Communications Services Corp., Ltd. Class H(a) | 116,000 | 43,540 | ||||||
China Conch Venture Holdings, Ltd.(a) | 64,500 | 133,272 | ||||||
China Construction Bank Corp. Class H(a) | 4,023,000 | 2,744,244 | ||||||
China COSCO Holdings Co., Ltd. Class H(a)(b) | 123,500 | 58,954 | ||||||
China Everbright Bank Co., Ltd. Class H(a) | 164,000 | 79,620 | ||||||
China Everbright International, Ltd.(a) | 118,000 | 150,731 | ||||||
China Everbright, Ltd.(a) | 44,000 | 100,609 | ||||||
China Galaxy Securities Co., Ltd. Class H(a) | 158,500 | 144,251 | ||||||
China Huishan Dairy Holdings Co., Ltd.(a) | 300,000 | 114,729 | ||||||
China International Marine Containers Group Co., Ltd. Class H(a) | 23,900 | 43,505 | ||||||
China Jinmao Holdings Group, Ltd.(a) | 178,000 | 60,630 | ||||||
China Life Insurance Co., Ltd. Class H(a) | 356,000 | 1,145,096 | ||||||
China Longyuan Power Group Corp., Ltd. Class H(a) | 152,000 | 114,299 | ||||||
China Medical System Holdings, Ltd.(a) | 53,000 | 77,538 | ||||||
China Mengniu Dairy Co., Ltd.(a) | 131,000 | 212,655 | ||||||
China Merchants Bank Co., Ltd. Class H(a) | 219,500 | 514,369 | ||||||
China Merchants Holdings International Co., Ltd.(a) | 56,000 | 177,118 | ||||||
China Minsheng Banking Corp., Ltd. Class H(a) | 282,000 | 278,913 | ||||||
China Mobile, Ltd.(a) | 293,500 | 3,303,622 | ||||||
China National Building Material Co., Ltd. Class H(a) | 136,000 | 64,870 | ||||||
China Oilfield Services, Ltd. Class H(a) | 88,000 | 75,845 | ||||||
China Overseas Land & Investment, Ltd.(a) | 188,000 | 652,081 | ||||||
China Pacific Insurance Group Co., Ltd. Class H(a) | 126,000 | 514,824 | ||||||
China Petroleum & Chemical Corp. Class H(a) | 1,220,000 | 734,196 | ||||||
China Power International Development, Ltd.(a) | 158,000 | 91,152 | ||||||
China Railway Construction Corp., Ltd. Class H(a) | 94,500 | 116,548 | ||||||
China Railway Group, Ltd. Class H(a) | 191,000 | 144,537 | ||||||
China Resources Beer Holdings Co., Ltd.(a) | 58,000 | 123,901 | ||||||
China Resources Gas Group, Ltd.(a) | 42,000 | 124,901 | ||||||
China Resources Land, Ltd.(a) | 132,000 | 381,964 | ||||||
China Resources Power Holdings Co., Ltd.(a) | 92,000 | 177,283 | ||||||
China Shenhua Energy Co., Ltd. Class H(a) | 162,500 | 254,157 | ||||||
China Shipping Container Lines Co., Ltd. Class H(a)(b) | 180,000 | 49,776 | ||||||
China Southern Airlines Co., Ltd. Class H(a) | 88,000 | 67,838 | ||||||
China State Construction International Holdings, Ltd.(a) | 88,000 | 151,951 | ||||||
China Taiping Insurance Holdings Co., Ltd.(a)(b) | 77,400 | 238,072 | ||||||
China Telecom Corp., Ltd. Class H(a) | 662,000 | 308,797 | ||||||
China Unicom Hong Kong, Ltd.(a) | 286,000 | 345,850 | ||||||
Chongqing Changan Automobile Co., Ltd. Class B(a) | 41,000 | 90,269 | ||||||
Chongqing Rural Commercial Bank Co., Ltd. Class H(a) | 120,000 | 72,227 | ||||||
CITIC Securities Co., Ltd. Class H(a) | 103,500 | 240,086 | ||||||
CITIC, Ltd.(a) | 208,000 | 367,284 | ||||||
CNOOC, Ltd.(a) | 854,000 | 888,811 | ||||||
COSCO Pacific, Ltd.(a) | 86,000 | 94,533 | ||||||
Country Garden Holdings Co., Ltd.(a) | 270,000 | 110,039 | ||||||
CRRC Corp., Ltd. Class H(a) | 209,000 | 257,013 | ||||||
See accompanying notes to financial statements.
3
Table of Contents
State Street Institutional Investment Trust
State Street Emerging Markets Equity Index Fund
Schedule of Investments — (continued)
December 31, 2015
Security Description | Shares | Value | ||||||
COMMON STOCKS – (continued) |
| |||||||
China – (continued) | ||||||||
CSPC Pharmaceutical Group, Ltd.(a) | 198,000 | $ | 201,860 | |||||
Ctrip.com International, Ltd. ADR(b) | 6,800 | 315,044 | ||||||
Dalian Wanda Commercial Properties Co., Ltd. Class H(a)(c) | 28,100 | 163,271 | ||||||
Datang International Power Generation Co., Ltd. Class H(a) | 134,000 | 40,738 | ||||||
Dongfeng Motor Group Co., Ltd. Class H(a) | 128,000 | 170,216 | ||||||
ENN Energy Holdings, Ltd.(a) | 36,000 | 190,040 | ||||||
Evergrande Real Estate Group, Ltd.(a) | 208,000 | 182,096 | ||||||
Far East Horizon, Ltd.(a) | 85,000 | 78,968 | ||||||
Fosun International, Ltd.(a) | 102,500 | 159,798 | ||||||
Geely Automobile Holdings, Ltd.(a) | 255,000 | 134,742 | ||||||
GF Securities Co., Ltd. Class H(a)(b) | 65,000 | 162,623 | ||||||
GOME Electrical Appliances Holding, Ltd.(a) | 568,000 | 94,154 | ||||||
Great Wall Motor Co., Ltd. Class H(a) | 148,500 | 171,899 | ||||||
Guangdong Investment, Ltd.(a) | 134,000 | 188,547 | ||||||
Guangzhou Automobile Group Co., Ltd. Class H(a) | 106,000 | 94,174 | ||||||
Guangzhou R&F Properties Co., Ltd. Class H(a) | 48,400 | 59,343 | ||||||
Haitian International Holdings, Ltd.(a) | 31,000 | 45,771 | ||||||
Haitong Securities Co., Ltd. Class H(a) | 154,800 | 271,464 | ||||||
Hengan International Group Co., Ltd.(a) | 35,000 | 328,580 | ||||||
Huadian Power International Corp., Ltd. Class H(a) | 78,000 | 50,571 | ||||||
Huaneng Power International, Inc. Class H(a) | 202,000 | 173,227 | ||||||
Huaneng Renewables Corp., Ltd. Class H(a) | 190,000 | 56,386 | ||||||
Huatai Securities Co., Ltd. Class H(a)(b)(c) | 49,200 | 113,735 | ||||||
Industrial & Commercial Bank of China, Ltd. Class H(a) | 3,527,000 | 2,114,121 | ||||||
JD.com, Inc. ADR(b) | 8,200 | 264,573 | ||||||
Jiangsu Expressway Co., Ltd. Class H(a) | 58,000 | 77,841 | ||||||
Jiangxi Copper Co., Ltd. Class H(a) | 64,000 | 75,539 | ||||||
Kingsoft Corp., Ltd.(a) | 41,000 | 99,245 | ||||||
Kunlun Energy Co., Ltd.(a) | 154,000 | 136,736 | ||||||
Lenovo Group, Ltd.(a) | 320,000 | 322,937 | ||||||
Longfor Properties Co., Ltd.(a) | 69,500 | 103,366 | ||||||
Luye Pharma Group, Ltd.(a)(b) | 63,500 | 66,066 | ||||||
NetEase, Inc. ADR | 1,900 | 344,356 | ||||||
New China Life Insurance Co., Ltd. Class H(a) | 37,100 | 155,511 | ||||||
New Oriental Education & Technology Group, Inc. ADR | 3,200 | 100,384 | ||||||
People’s Insurance Co. Group of China, Ltd. Class H(a) | 313,000 | 152,390 | ||||||
PetroChina Co., Ltd. Class H(a) | 1,008,000 | 661,168 | ||||||
PICC Property & Casualty Co., Ltd. Class H(a) | 186,000 | 367,545 | ||||||
Ping An Insurance Group Co. of China, Ltd. Class H(a) | 249,000 | 1,369,949 | ||||||
Qihoo 360 Technology Co., Ltd. ADR(b) | 2,300 | 167,463 | ||||||
Qunar Cayman Islands, Ltd. ADR(b) | 1,300 | 68,562 | ||||||
Semiconductor Manufacturing International Corp.(a)(b) | 1,266,000 | 128,744 | ||||||
Shandong Weigao Group Medical Polymer Co., Ltd. Class H(a) | 92,000 | 63,379 | ||||||
Shanghai Electric Group Co., Ltd. Class H(a) | 134,000 | 70,581 | ||||||
Shanghai Fosun Pharmaceutical Group Co., Ltd. Class H(a) | 19,500 | 56,288 | ||||||
Shanghai Industrial Holdings, Ltd.(a) | 24,000 | 62,807 | ||||||
Shanghai Lujiazui Finance & Trade Zone Development Co., Ltd. Class B(a) | 24,400 | 98,846 | ||||||
Shanghai Pharmaceuticals Holding Co., Ltd. Class H(a) | 32,900 | 70,912 | ||||||
Shenzhou International Group Holdings, Ltd.(a) | 27,000 | 154,729 | ||||||
Shui On Land, Ltd.(a) | 172,500 | 47,144 | ||||||
Sino-Ocean Land Holdings, Ltd.(a) | 161,500 | 102,973 | ||||||
Sinopec Engineering Group Co., Ltd. Class H(a) | 59,000 | 50,187 | ||||||
Sinopec Shanghai Petrochemical Co., Ltd. Class H(a)(b) | 166,000 | 65,653 | ||||||
Sinopharm Group Co., Ltd. Class H(a) | 57,200 | 228,352 | ||||||
Sinotrans, Ltd. Class H(a) | 87,000 | 46,310 | ||||||
SOHO China, Ltd.(a) | 99,000 | 47,901 | ||||||
SouFun Holdings, Ltd. ADR | 6,000 | 44,340 | ||||||
Sunac China Holdings, Ltd.(a) | 89,000 | 68,384 | ||||||
TAL Education Group ADR(b) | 1,000 | 46,470 | ||||||
Tencent Holdings, Ltd.(a) | 247,200 | 4,846,453 | ||||||
Tingyi Cayman Islands Holding Corp.(a) | 94,000 | 134,025 | ||||||
TravelSky Technology, Ltd. Class H(a) | 45,000 | 73,909 | ||||||
Tsingtao Brewery Co., Ltd. Class H(a) | 18,000 | 81,084 | ||||||
Vipshop Holdings, Ltd. ADR(b) | 9,500 | 145,065 | ||||||
Want Want China Holdings, Ltd.(a) | 283,000 | 210,036 | ||||||
Weichai Power Co., Ltd. Class H(a) | 47,000 | 51,819 | ||||||
Yanzhou Coal Mining Co., Ltd. Class H(a) | 90,000 | 41,733 | ||||||
Youku Tudou, Inc. ADR(b) | 2,900 | 78,677 | ||||||
Yuexiu Property Co., Ltd.(a) | 326,000 | 56,121 | ||||||
YY, Inc. ADR(b) | 700 | 43,729 | ||||||
See accompanying notes to financial statements.
4
Table of Contents
State Street Institutional Investment Trust
State Street Emerging Markets Equity Index Fund
Schedule of Investments — (continued)
December 31, 2015
Security Description | Shares | Value | ||||||
COMMON STOCKS – (continued) |
| |||||||
China – (continued) | ||||||||
Zhejiang Expressway Co., Ltd. Class H(a) | 70,000 | $ | 83,638 | |||||
Zhuzhou CSR Times Electric Co., Ltd. Class H(a) | 25,000 | 144,322 | ||||||
Zijin Mining Group Co., Ltd. Class H(a) | 276,000 | 72,609 | ||||||
ZTE Corp. Class H(a) | 36,200 | 82,083 | ||||||
|
| |||||||
| 42,263,709 | ||||||||
|
| |||||||
Colombia – 0.4% | ||||||||
Bancolombia SA Preference Shares | 20,535 | 139,725 | ||||||
Cementos Argos SA | 19,271 | 59,006 | ||||||
Corp. Financiera Colombiana SA | 3,967 | 48,086 | ||||||
Ecopetrol SA | 235,892 | 82,482 | ||||||
Grupo Argos SA | 13,886 | 70,862 | ||||||
Grupo Aval Acciones y Valores SA Preference Shares | 165,088 | 56,685 | ||||||
Grupo de Inversiones Suramericana SA | 11,212 | 126,089 | ||||||
Grupo de Inversiones Suramericana SA Preference Shares | 4,576 | 50,164 | ||||||
Interconexion Electrica SA ESP | 18,535 | 43,090 | ||||||
|
| |||||||
| 676,189 | ||||||||
|
| |||||||
Czech Republic – 0.2% | ||||||||
CEZ A/S(a) | 7,716 | 137,548 | ||||||
Komercni banka A/S(a) | 727 | 144,269 | ||||||
O2 Czech Republic A/S | 2,967 | 29,938 | ||||||
|
| |||||||
| 311,755 | ||||||||
|
| |||||||
Egypt – 0.2% | ||||||||
Commercial International Bank Egypt SAE | 49,356 | 239,530 | ||||||
Global Telecom Holding SAE(a)(b) | 125,397 | 32,837 | ||||||
Talaat Moustafa Group(a) | 49,329 | 40,254 | ||||||
|
| |||||||
| 312,621 | ||||||||
|
| |||||||
Greece – 0.5% | ||||||||
Alpha Bank AE(a)(b) | 66,129 | 177,144 | ||||||
Eurobank Ergasias SA(a)(b) | 88,835 | 99,480 | ||||||
FF Group(b) | 1,600 | 30,069 | ||||||
Hellenic Telecommunications Organization SA(a) | 11,717 | 117,216 | ||||||
JUMBO SA(a)(b) | 4,879 | 51,261 | ||||||
National Bank of Greece SA(a)(b) | 239,121 | 88,359 | ||||||
OPAP SA(a) | 10,676 | 93,646 | ||||||
Piraeus Bank SA(a)(b) | 281,021 | 83,944 | ||||||
Public Power Corp. SA(a) | 5,546 | 23,305 | ||||||
Titan Cement Co. SA(a) | 2,211 | 42,209 | ||||||
|
| |||||||
| 806,633 | ||||||||
|
| |||||||
Hong Kong – 0.6% | ||||||||
Alibaba Pictures Group, Ltd.(a)(b) | 480,000 | 117,079 | ||||||
China Gas Holdings, Ltd.(a) | 84,000 | 120,912 | ||||||
GCL-Poly Energy Holdings, Ltd.(a) | 518,000 | 77,681 | ||||||
Haier Electronics Group Co., Ltd.(a) | 61,000 | 123,127 | ||||||
Imperial Pacific International Holdings, Ltd.(a)(b) | 2,680,000 | 58,608 | ||||||
New World China Land, Ltd.(a) | 124,000 | 99,074 | ||||||
Nine Dragons Paper Holdings, Ltd.(a) | 78,000 | 45,803 | ||||||
Shimao Property Holdings, Ltd.(a) | 66,500 | 117,562 | ||||||
Sino Biopharmaceutical, Ltd.(a) | 216,000 | 194,733 | ||||||
Sun Art Retail Group, Ltd.(a) | 114,000 | 85,771 | ||||||
|
| |||||||
| 1,040,350 | ||||||||
|
| |||||||
Hungary – 0.3% | ||||||||
MOL Hungarian Oil & Gas PLC(a) | 1,749 | 85,098 | ||||||
OTP Bank PLC(a) | 10,710 | 219,682 | ||||||
Richter Gedeon Nyrt(a) | 6,683 | 125,835 | ||||||
|
| |||||||
| 430,615 | ||||||||
|
| |||||||
Indonesia – 2.5% | ||||||||
Adaro Energy Tbk PT(a) | 688,000 | 25,424 | ||||||
AKR Corporindo Tbk PT(a) | 85,000 | 43,955 | ||||||
Astra Agro Lestari Tbk PT(a) | 19,000 | 21,658 | ||||||
Astra International Tbk PT(a) | 968,000 | 416,968 | ||||||
Bank Central Asia Tbk PT(a) | 589,500 | 564,787 | ||||||
Bank Danamon Indonesia Tbk PT(a) | 160,000 | 37,001 | ||||||
Bank Mandiri Persero Tbk PT(a) | 446,000 | 296,162 | ||||||
Bank Negara Indonesia Persero Tbk PT(a) | 356,500 | 127,633 | ||||||
Bank Rakyat Indonesia Persero Tbk PT(a) | 531,000 | 435,792 | ||||||
Bumi Serpong Damai Tbk PT(a) | 368,000 | 47,467 | ||||||
Charoen Pokphand Indonesia Tbk PT(a) | 352,500 | 65,687 | ||||||
Global Mediacom Tbk PT(a) | 339,500 | 26,873 | ||||||
Gudang Garam Tbk PT(a) | 23,000 | 91,285 | ||||||
Hanjaya Mandala Sampoerna Tbk PT(a) | 18,000 | 122,525 | ||||||
Indocement Tunggal Prakarsa Tbk PT(a) | 70,500 | 113,054 | ||||||
Indofood CBP Sukses Makmur Tbk PT(a) | 55,500 | 53,691 | ||||||
Indofood Sukses Makmur Tbk PT(a) | 210,000 | 78,166 | ||||||
Jasa Marga Persero Tbk PT(a) | 97,500 | 36,679 | ||||||
Kalbe Farma Tbk PT(a) | 1,008,500 | 95,953 | ||||||
Lippo Karawaci Tbk PT(a) | 937,500 | 70,163 | ||||||
Matahari Department Store Tbk PT(a) | 111,500 | 141,152 | ||||||
Media Nusantara Citra Tbk PT(a) | 239,000 | 31,819 | ||||||
Perusahaan Gas Negara Persero Tbk(a) | 521,500 | 102,821 | ||||||
Semen Indonesia Persero Tbk PT(a) | 142,000 | 116,354 | ||||||
Summarecon Agung Tbk PT(a) | 482,500 | 56,944 | ||||||
Surya Citra Media Tbk PT(a) | 280,000 | 62,436 | ||||||
Telekomunikasi Indonesia Persero Tbk PT(a) | 2,409,500 | 539,673 | ||||||
Tower Bersama Infrastructure Tbk PT(a)(b) | 92,000 | 38,918 | ||||||
See accompanying notes to financial statements.
5
Table of Contents
State Street Institutional Investment Trust
State Street Emerging Markets Equity Index Fund
Schedule of Investments — (continued)
December 31, 2015
Security Description | Shares | Value | ||||||
COMMON STOCKS – (continued) |
| |||||||
Indonesia – (continued) | ||||||||
Unilever Indonesia Tbk PT(a) | 73,000 | $ | 194,867 | |||||
United Tractors Tbk PT(a) | 80,500 | 98,018 | ||||||
XL Axiata Tbk PT(a)(b) | 143,000 | 37,639 | ||||||
|
| |||||||
| 4,191,564 | ||||||||
|
| |||||||
Malaysia – 3.2% | ||||||||
AirAsia Bhd(a) | 59,800 | 17,890 | ||||||
Alliance Financial Group Bhd(a) | 51,800 | 42,889 | ||||||
AMMB Holdings Bhd(a) | 93,700 | 98,605 | ||||||
Astro Malaysia Holdings Bhd(a) | 74,600 | 47,812 | ||||||
Axiata Group Bhd(a) | 124,800 | 185,981 | ||||||
Berjaya Sports Toto Bhd | 32,300 | 22,945 | ||||||
British American Tobacco Malaysia Bhd(a) | 6,200 | 80,866 | ||||||
Bumi Armada Bhd(a)(b) | 112,200 | 26,588 | ||||||
CIMB Group Holdings Bhd(a) | 243,600 | 256,848 | ||||||
Dialog Group Bhd(a) | 182,500 | 67,828 | ||||||
DiGi.Com Bhd(a) | 167,300 | 210,053 | ||||||
Felda Global Ventures Holdings Bhd(a) | 61,000 | 24,184 | ||||||
Gamuda Bhd(a) | 80,600 | 87,308 | ||||||
Genting Bhd(a) | 107,400 | 183,172 | ||||||
Genting Malaysia Bhd(a) | 142,000 | 144,661 | ||||||
Genting Plantations Bhd | 11,100 | 27,404 | ||||||
HAP Seng Consolidated Bhd(a) | 26,900 | 40,528 | ||||||
Hartalega Holdings Bhd | 31,400 | 43,442 | ||||||
Hong Leong Bank Bhd(a) | 31,300 | 97,531 | ||||||
Hong Leong Financial Group Bhd(a) | 11,000 | 35,678 | ||||||
IHH Healthcare Bhd | 118,000 | 180,841 | ||||||
IJM Corp. Bhd(a) | 145,200 | 114,158 | ||||||
IOI Corp. Bhd(a) | 139,000 | 143,960 | ||||||
IOI Properties Group Bhd(a) | 72,200 | 37,748 | ||||||
Kuala Lumpur Kepong Bhd(a) | 20,400 | 108,505 | ||||||
Lafarge Malaysia Bhd | 18,300 | 37,849 | ||||||
Malayan Banking Bhd(a) | 228,000 | 445,241 | ||||||
Malaysia Airports Holdings Bhd(a) | 39,700 | 51,703 | ||||||
Maxis Bhd(a) | 89,800 | 141,890 | ||||||
MISC Bhd(a) | 53,400 | 116,093 | ||||||
Petronas Chemicals Group Bhd(a) | 133,800 | 226,009 | ||||||
Petronas Dagangan Bhd | 11,900 | 68,903 | ||||||
Petronas Gas Bhd(a) | 33,100 | 175,086 | ||||||
PPB Group Bhd(a) | 22,600 | 83,435 | ||||||
Public Bank Bhd(a) | 120,600 | 519,643 | ||||||
RHB Capital Bhd(a) | 29,700 | 39,141 | ||||||
SapuraKencana Petroleum Bhd(a) | 157,600 | 73,939 | ||||||
Sime Darby Bhd(a) | 148,400 | 266,650 | ||||||
Telekom Malaysia Bhd(a) | 53,900 | 84,935 | ||||||
Tenaga Nasional Bhd(a) | 161,900 | 501,273 | ||||||
UMW Holdings Bhd(a) | 27,900 | 51,037 | ||||||
Westports Holdings Bhd(a) | 48,900 | 46,789 | ||||||
YTL Corp. Bhd(a) | 206,400 | 75,307 | ||||||
YTL Power International Bhd(a) | 88,800 | 30,553 | ||||||
|
| |||||||
| 5,362,901 | ||||||||
|
| |||||||
Mexico – 4.4% | ||||||||
Alfa SAB de CV Class A | 135,000 | 266,777 | ||||||
America Movil SAB de CV Series L | 1,515,700 | 1,061,885 | ||||||
Arca Continental SAB de CV | 19,200 | 116,382 | ||||||
Cemex SAB de CV(b) | 643,800 | 350,395 | ||||||
Coca-Cola Femsa SAB de CV Series L | 23,800 | 169,910 | ||||||
Controladora Comercial Mexicana SAB de CV | 21,900 | 60,129 | ||||||
El Puerto de Liverpool SAB de CV Series C1 | 8,900 | 108,596 | ||||||
Fibra Uno Administracion SA de CV | 115,900 | 254,936 | ||||||
Fomento Economico Mexicano SAB de CV | 87,800 | 817,345 | ||||||
Gentera SAB de CV | 50,900 | 97,697 | ||||||
Gruma SAB de CV Class B | 9,300 | 130,568 | ||||||
Grupo Aeroportuario del Pacifico SAB de CV Class B | 14,800 | 130,458 | ||||||
Grupo Aeroportuario del Sureste SAB de CV Class B | 9,900 | 139,955 | ||||||
Grupo Bimbo SAB de CV Series A(b) | 78,700 | 208,562 | ||||||
Grupo Carso SAB de CV Series A1 | 27,200 | 113,391 | ||||||
Grupo Comercial Chedraui SA de CV | 16,200 | 42,800 | ||||||
Grupo Financiero Banorte SAB de CV Series O | 119,400 | 655,377 | ||||||
Grupo Financiero Inbursa SAB de CV Series O | 111,500 | 201,487 | ||||||
Grupo Financiero Santander Mexico SAB de CV Class B | 87,300 | 152,550 | ||||||
Grupo Lala SAB de CV | 29,600 | 68,348 | ||||||
Grupo Mexico SAB de CV Series B | 182,400 | 388,538 | ||||||
Grupo Televisa SAB Series CPO | 116,900 | 638,745 | ||||||
Industrias Penoles SAB de CV | 6,655 | 68,310 | ||||||
Kimberly-Clark de Mexico SAB de CV Class A | 73,100 | 170,189 | ||||||
Mexichem SAB de CV | 50,200 | 112,456 | ||||||
OHL Mexico SAB de CV(b) | 37,300 | 39,176 | ||||||
Promotora y Operadora de Infraestructura SAB de CV(b) | 11,800 | 138,639 | ||||||
Telesites SAB de CV(b) | 7,585 | 4,936 | ||||||
Wal-Mart de Mexico SAB de CV | 250,600 | 631,174 | ||||||
|
| |||||||
| 7,339,711 | ||||||||
|
| |||||||
Netherlands – 0.4% | ||||||||
Steinhoff International Holdings NV | 114,928 | 582,298 | ||||||
|
| |||||||
Peru – 0.3% | ||||||||
Cia de Minas Buenaventura SAA ADR | 9,100 | 38,948 | ||||||
Credicorp, Ltd. | 3,300 | 321,156 | ||||||
Southern Copper Corp. | 7,600 | 198,512 | ||||||
|
| |||||||
| 558,616 | ||||||||
|
| |||||||
See accompanying notes to financial statements.
6
Table of Contents
State Street Institutional Investment Trust
State Street Emerging Markets Equity Index Fund
Schedule of Investments — (continued)
December 31, 2015
Security Description | Shares | Value | ||||||
COMMON STOCKS – (continued) |
| |||||||
Philippines – 1.4% | ||||||||
Aboitiz Equity Ventures, Inc.(a) | 92,940 | $ | 114,012 | |||||
Aboitiz Power Corp. | 70,300 | 62,300 | ||||||
Alliance Global Group, Inc.(a) | 98,200 | 33,471 | ||||||
Ayala Corp.(a) | 10,370 | 166,197 | ||||||
Ayala Land, Inc.(a) | 351,300 | 256,791 | ||||||
Bank of the Philippine Islands(a) | 37,570 | 66,915 | ||||||
BDO Unibank, Inc.(a) | 77,040 | 171,248 | ||||||
DMCI Holdings, Inc.(a) | 190,400 | 55,675 | ||||||
Energy Development Corp.(a) | 448,200 | 58,871 | ||||||
Globe Telecom, Inc.(a) | 1,585 | 62,263 | ||||||
GT Capital Holdings, Inc.(a) | 3,750 | 105,058 | ||||||
International Container Terminal Services, Inc.(a) | 24,360 | 36,284 | ||||||
JG Summit Holdings, Inc.(a) | 119,900 | 186,588 | ||||||
Jollibee Foods Corp.(a) | 20,460 | 94,979 | ||||||
Megaworld Corp.(a) | 540,000 | 48,649 | ||||||
Metro Pacific Investments Corp.(a) | 627,000 | 69,170 | ||||||
Metropolitan Bank & Trust Co.(a) | 15,200 | 25,927 | ||||||
Philippine Long Distance Telephone Co.(a) | 4,650 | 203,289 | ||||||
Robinsons Land Corp.(a) | 78,300 | 45,771 | ||||||
SM Investments Corp.(a) | 7,680 | 140,294 | ||||||
SM Prime Holdings, Inc.(a) | 396,400 | 182,289 | ||||||
Universal Robina Corp.(a) | 41,720 | 164,629 | ||||||
|
| |||||||
| 2,350,670 | ||||||||
|
| |||||||
Poland – 1.3% | ||||||||
Alior Bank SA(b) | 2,432 | 40,955 | ||||||
Bank Handlowy w Warszawie SA(a) | 1,562 | 28,349 | ||||||
Bank Millennium SA(a)(b) | 29,000 | 40,804 | ||||||
Bank Pekao SA(a) | 6,275 | 227,654 | ||||||
Bank Zachodni WBK SA(a)(b) | 1,661 | 118,887 | ||||||
CCC SA(a) | 1,101 | 38,500 | ||||||
Cyfrowy Polsat SA(a)(b) | 9,173 | 48,435 | ||||||
Enea SA(a) | 10,553 | 30,081 | ||||||
Energa SA(a) | 9,898 | 31,652 | ||||||
Eurocash SA(a) | 3,978 | 48,696 | ||||||
Grupa Azoty SA(b) | 2,134 | 53,769 | ||||||
Grupa Lotos SA(a)(b) | 4,419 | 30,194 | ||||||
KGHM Polska Miedz SA(a) | 6,693 | 107,240 | ||||||
LPP SA(a) | 62 | 87,029 | ||||||
mBank SA(a)(b) | 706 | 56,006 | ||||||
Orange Polska SA | 31,371 | 52,114 | ||||||
PGE Polska Grupa Energetyczna SA(a) | 40,227 | 129,550 | ||||||
Polski Koncern Naftowy Orlen SA(a) | 15,337 | 262,257 | ||||||
Polskie Gornictwo Naftowe i Gazownictwo SA(a) | 84,622 | 109,710 | ||||||
Powszechna Kasa Oszczednosci Bank Polski SA(a)(b) | 41,833 | 288,622 | ||||||
Powszechny Zaklad Ubezpieczen SA(a) | �� | 26,835 | 229,963 | |||||
Synthos SA(a) | 25,306 | 24,321 | ||||||
Tauron Polska Energia SA(a) | 50,273 | 36,588 | ||||||
|
| |||||||
| 2,121,376 | ||||||||
|
| |||||||
Qatar – 1.0% | ||||||||
Barwa Real Estate Co.(a) | 4,651 | 50,883 | ||||||
Commercial Bank QSC(a) | 7,652 | 96,132 | ||||||
Doha Bank QSC(a) | 6,052 | 73,757 | ||||||
Ezdan Holding Group QSC(a) | 38,044 | 165,469 | ||||||
Industries Qatar QSC(a) | 7,231 | 219,910 | ||||||
Masraf Al Rayan QSC(a) | 17,571 | 180,950 | ||||||
Ooredoo QSC | 3,829 | 78,844 | ||||||
Qatar Electricity & Water Co. QSC(a) | 1,315 | 78,156 | ||||||
Qatar Gas Transport Co., Ltd.(a) | 12,979 | 83,107 | ||||||
Qatar Insurance Co. SAQ | 4,325 | 97,370 | ||||||
Qatar Islamic Bank SAQ(a) | 2,824 | 82,495 | ||||||
Qatar National Bank SAQ(a) | 8,363 | 401,093 | ||||||
Vodafone Qatar QSC(a) | 16,168 | 56,168 | ||||||
|
| |||||||
| 1,664,334 | ||||||||
|
| |||||||
Romania – 0.1% | ||||||||
New Europe Property Investments PLC | 10,707 | 122,862 | ||||||
|
| |||||||
Russia – 3.4% | ||||||||
AK Transneft OAO Preference Shares(b) | 74 | 196,969 | ||||||
Alrosa PAO(b) | 88,900 | 68,225 | ||||||
Gazprom PAO | 565,910 | 1,055,342 | ||||||
Lukoil PJSC(b) | 24,399 | 786,674 | ||||||
Magnit PJSC(b) | 2,977 | 456,404 | ||||||
MegaFon PJSC GDR(a) | 4,446 | 51,721 | ||||||
MMC Norilsk Nickel PJSC(b) | 2,648 | 331,784 | ||||||
Mobile TeleSystems PJSC ADR | 24,700 | 152,646 | ||||||
Moscow Exchange MICEX-RTS PJSC(b) | 54,470 | 68,286 | ||||||
Novatek OAO(b) | 44,750 | 362,179 | ||||||
Rosneft OAO(b) | 55,740 | 194,043 | ||||||
Rostelecom PJSC(b) | 38,290 | 47,693 | ||||||
Rushhydro PJSC(b) | 5,540,000 | 50,863 | ||||||
Sberbank of Russia PJSC(b) | 516,040 | 717,376 | ||||||
Severstal PAO(b) | 10,010 | 83,797 | ||||||
Sistema JSFC(b) | 202,100 | 48,840 | ||||||
Surgutneftegas OAO(b) | 341,600 | 159,095 | ||||||
Surgutneftegas OAO Preference Share(b) | 331,400 | 200,673 | ||||||
Tatneft PAO(b) | 67,710 | 292,636 | ||||||
VTB Bank PJSC(b) | 247,860,000 | 269,424 | ||||||
|
| |||||||
| 5,594,670 | ||||||||
|
| |||||||
South Africa – 6.3% | ||||||||
Anglo American Platinum, Ltd.(a)(b) | 2,579 | 31,000 | ||||||
AngloGold Ashanti, Ltd.(a)(b) | 19,362 | 132,527 | ||||||
Aspen Pharmacare Holdings, Ltd.(a)(b) | 16,363 | 326,039 | ||||||
Barclays Africa Group, Ltd.(a) | 16,212 | 150,124 | ||||||
Barloworld, Ltd.(a) | 10,505 | 42,173 | ||||||
Bidvest Group, Ltd.(a) | 15,222 | 322,454 | ||||||
Brait SE(a)(b) | 16,187 | 174,294 | ||||||
Capitec Bank Holdings, Ltd.(a) | 1,659 | 57,579 | ||||||
Coronation Fund Managers, Ltd.(a) | 10,870 | 37,156 | ||||||
Discovery, Ltd.(a) | 17,024 | 145,721 | ||||||
Exxaro Resources, Ltd.(a) | 6,848 | 19,416 | ||||||
FirstRand, Ltd.(a) | 160,912 | 438,900 | ||||||
See accompanying notes to financial statements.
7
Table of Contents
State Street Institutional Investment Trust
State Street Emerging Markets Equity Index Fund
Schedule of Investments — (continued)
December 31, 2015
Security Description | Shares | Value | ||||||
COMMON STOCKS – (continued) |
| |||||||
South Africa – (continued) | ||||||||
Fortress Income Fund, Ltd.(a) | 32,892 | $ | 73,656 | |||||
Fortress Income Fund, Ltd. Class A | 45,543 | 47,261 | ||||||
Foschini Group, Ltd.(a) | 9,682 | 75,930 | ||||||
Gold Fields, Ltd.(a) | 37,201 | 101,534 | ||||||
Growthpoint Properties, Ltd.(a) | 110,172 | 165,033 | ||||||
Hyprop Investments, Ltd.(a) | 11,630 | 77,685 | ||||||
Impala Platinum Holdings, Ltd.(a)(b) | 29,860 | 48,210 | ||||||
Imperial Holdings, Ltd.(a) | 8,725 | 67,500 | ||||||
Investec, Ltd.(a) | 11,841 | 83,483 | ||||||
Liberty Holdings, Ltd.(a) | 5,473 | 40,652 | ||||||
Life Healthcare Group Holdings, Ltd.(a) | 45,895 | 103,974 | ||||||
Massmart Holdings, Ltd.(a) | 5,191 | 33,539 | ||||||
Mediclinic International, Ltd.(a) | 23,405 | 179,675 | ||||||
MMI Holdings, Ltd.(a) | 52,608 | 74,456 | ||||||
Mondi, Ltd.(a) | 5,656 | 111,707 | ||||||
Mr. Price Group, Ltd. | 11,499 | 148,417 | ||||||
MTN Group, Ltd.(a) | 79,409 | 682,711 | ||||||
Naspers, Ltd. Class N(a) | 19,050 | 2,598,710 | ||||||
Nedbank Group, Ltd.(a) | 9,456 | 115,287 | ||||||
Netcare, Ltd.(a) | 45,236 | 98,880 | ||||||
Pick n Pay Stores, Ltd.(a) | 11,676 | 48,948 | ||||||
Pioneer Foods Group, Ltd.(a) | 6,120 | 62,653 | ||||||
PSG Group, Ltd.(a) | 4,242 | 61,206 | ||||||
Rand Merchant Insurance Holdings, Ltd.(a) | 31,964 | 79,746 | ||||||
Redefine Properties, Ltd.(a) | 204,580 | 128,166 | ||||||
Remgro, Ltd.(a) | 23,002 | 363,393 | ||||||
Resilient REIT, Ltd.(a) | 13,510 | 100,316 | ||||||
RMB Holdings, Ltd.(a) | 33,746 | 120,753 | ||||||
Sanlam, Ltd.(a) | 82,862 | 323,492 | ||||||
Sappi, Ltd.(a)(b) | 25,886 | 108,549 | ||||||
Sasol, Ltd.(a) | 26,464 | 713,064 | ||||||
Shoprite Holdings, Ltd.(a) | 21,910 | 202,642 | ||||||
SPAR Group, Ltd.(a) | 7,869 | 93,443 | ||||||
Standard Bank Group, Ltd.(a) | 58,011 | 424,397 | ||||||
Telkom SA SOC, Ltd.(a) | 11,337 | 47,009 | ||||||
Tiger Brands, Ltd.(a) | 7,806 | 159,577 | ||||||
Truworths International, Ltd.(a) | 20,526 | 120,763 | ||||||
Tsogo Sun Holdings, Ltd.(a) | 17,557 | 27,535 | ||||||
Vodacom Group, Ltd.(a) | 17,785 | 174,939 | ||||||
Woolworths Holdings, Ltd.(a) | 47,279 | 305,259 | ||||||
|
| |||||||
| 10,471,533 | ||||||||
|
| |||||||
South Korea – 15.3% | ||||||||
Amorepacific Corp.(a) | 1,537 | 539,375 | ||||||
Amorepacific Corp. Preference Shares(a) | 430 | 83,795 | ||||||
Amorepacific Group(a) | 1,334 | 166,658 | ||||||
BGF retail Co., Ltd.(a) | 420 | 60,804 | ||||||
BNK Financial Group, Inc.(a) | 12,680 | 90,332 | ||||||
Celltrion, Inc.(a)(b) | 3,310 | 236,150 | ||||||
Cheil Worldwide, Inc.(a)(b) | 3,850 | 67,335 | ||||||
CJ CheilJedang Corp. (a) | 377 | 120,586 | ||||||
CJ Corp.(a) | 697 | 148,048 | ||||||
CJ E&M Corp.(a)(b) | 907 | 61,911 | ||||||
CJ Korea Express Co., Ltd.(a)(b) | 327 | 52,975 | ||||||
Coway Co., Ltd.(a) | 2,580 | 183,701 | ||||||
Daelim Industrial Co., Ltd.(a) | 1,332 | 75,212 | ||||||
Daewoo Engineering & Construction Co., Ltd.(a)(b) | 4,970 | 23,506 | ||||||
Daewoo International Corp.(a) | 2,170 | 29,882 | ||||||
Daewoo Securities Co., Ltd.(a) | 8,590 | 67,998 | ||||||
DGB Financial Group, Inc.(a) | 8,090 | 68,919 | ||||||
Dongbu Insurance Co., Ltd.(a) | 2,030 | 121,458 | ||||||
Dongsuh Cos., Inc.(a) | 1,668 | 44,066 | ||||||
Doosan Corp.(a) | 356 | 26,749 | ||||||
Doosan Heavy Industries & Construction Co., Ltd.(a) | 2,284 | 39,743 | ||||||
E-MART, Inc.(a) | 999 | 160,299 | ||||||
GS Engineering & Construction Corp.(a)(b) | 2,376 | 39,367 | ||||||
GS Holdings Corp.(a) | 2,443 | 104,679 | ||||||
GS Retail Co., Ltd.(a) | 1,290 | 58,771 | ||||||
Hana Financial Group, Inc.(a) | 14,150 | 282,758 | ||||||
Hankook Tire Co., Ltd.(a) | 3,550 | 141,594 | ||||||
Hanmi Pharm Co., Ltd.(a)(b) | 248 | 151,911 | ||||||
Hanmi Science Co., Ltd.(a)(b) | 561 | 60,823 | ||||||
Hanon Systems(a) | 1,790 | 78,610 | ||||||
Hanssem Co., Ltd.(a) | 450 | 88,175 | ||||||
Hanwha Chemical Corp.(a) | 5,030 | 114,604 | ||||||
Hanwha Corp.(a) | 2,150 | 71,285 | ||||||
Hanwha Life Insurance Co., Ltd. | 10,380 | 65,420 | ||||||
Hotel Shilla Co., Ltd.(a) | 1,600 | 104,767 | ||||||
Hyosung Corp.(a) | 1,091 | 107,904 | ||||||
Hyundai Department Store Co., Ltd.(a) | 727 | 77,918 | ||||||
Hyundai Development Co-Engineering & Construction(a) | 2,700 | 88,231 | ||||||
Hyundai Engineering & Construction Co., Ltd.(a) | 3,727 | 89,471 | ||||||
Hyundai Glovis Co., Ltd.(a) | 897 | 146,150 | ||||||
Hyundai Heavy Industries Co., Ltd.(a)(b) | 1,998 | 147,679 | ||||||
Hyundai Marine & Fire Insurance Co., Ltd.(a) | 3,000 | 91,920 | ||||||
Hyundai Mobis Co., Ltd.(a) | 3,258 | 681,670 | ||||||
Hyundai Motor Co.(a) | 7,372 | 929,784 | ||||||
Hyundai Motor Co. Preference Shares(a) | 1,798 | 160,035 | ||||||
Hyundai Motor Co. Preference Shares(a) | 1,141 | 99,767 | ||||||
Hyundai Steel Co.(a) | 3,828 | 161,310 | ||||||
Hyundai Wia Corp.(a) | 780 | 73,749 | ||||||
Industrial Bank of Korea(a) | 13,300 | 139,071 | ||||||
Kakao Corp.(a) | 1,433 | 140,396 | ||||||
Kangwon Land, Inc.(a) | 5,630 | 183,754 | ||||||
KB Financial Group, Inc.(a) | 18,472 | 520,426 | ||||||
KCC Corp.(a) | 277 | 97,717 | ||||||
KEPCO Plant Service & Engineering Co., Ltd.(a) | 1,070 | 80,939 | ||||||
Kia Motors Corp.(a) | 12,597 | 561,700 | ||||||
Korea Aerospace Industries, Ltd.(a) | 2,090 | 137,967 | ||||||
Korea Electric Power Corp.(a) | 12,270 | 519,845 | ||||||
Korea Gas Corp.(a) | 1,320 | 41,187 | ||||||
Korea Investment Holdings Co., Ltd.(a) | 1,860 | 77,726 | ||||||
Korea Zinc Co., Ltd.(a) | 406 | 161,709 | ||||||
See accompanying notes to financial statements.
8
Table of Contents
State Street Institutional Investment Trust
State Street Emerging Markets Equity Index Fund
Schedule of Investments — (continued)
December 31, 2015
Security Description | Shares | Value | ||||||
COMMON STOCKS – (continued) |
| |||||||
South Korea – (continued) | ||||||||
Korean Air Lines Co., Ltd.(a)(b) | 1,741 | $ | 40,869 | |||||
KT Corp.(a)(b) | 1,500 | 35,945 | ||||||
KT&G Corp.(a) | 5,252 | 466,719 | ||||||
Kumho Petrochemical Co., Ltd.(a) | 656 | 28,756 | ||||||
LG Chem, Ltd.(a) | 2,218 | 612,352 | ||||||
LG Chem, Ltd. Preference Shares(a) | 365 | 76,256 | ||||||
LG Corp.(a) | 4,537 | 272,730 | ||||||
LG Display Co., Ltd.(a) | 11,120 | 230,321 | ||||||
LG Electronics, Inc.(a) | 5,086 | 231,233 | ||||||
LG Household & Health Care, Ltd.(a) | 448 | 397,816 | ||||||
LG Innotek Co., Ltd.(a) | 679 | 56,441 | ||||||
LG Uplus Corp.(a) | 10,230 | 90,334 | ||||||
Lotte Chemical Corp.(a) | 737 | 150,383 | ||||||
Lotte Chilsung Beverage Co., Ltd. | 30 | 56,774 | ||||||
Lotte Confectionery Co., Ltd.(a) | 34 | 65,919 | ||||||
Lotte Shopping Co., Ltd.(a) | 527 | 103,671 | ||||||
Mirae Asset Securities Co., Ltd.(a) | 2,820 | 51,308 | ||||||
NAVER Corp.(a) | 1,339 | 746,679 | ||||||
NCSoft Corp.(a) | 839 | 151,251 | ||||||
NH Investment & Securities Co., Ltd.(a) | 6,730 | 56,943 | ||||||
OCI Co., Ltd.(a) | 798 | 50,314 | ||||||
Orion Corp.(a) | 172 | 169,895 | ||||||
Ottogi Corp.(a) | 58 | 60,109 | ||||||
Paradise Co., Ltd.(a)(b) | 2,174 | 32,349 | ||||||
POSCO(a) | 3,335 | 467,171 | ||||||
S-1 Corp. | 909 | 77,291 | ||||||
S-Oil Corp.(a) | 2,153 | 144,221 | ||||||
Samsung C&T Corp.(a)(b) | 3,630 | 428,474 | ||||||
Samsung Card Co., Ltd.(a) | 1,662 | 43,511 | ||||||
Samsung Electro-Mechanics Co., Ltd.(a) | 2,857 | 151,799 | ||||||
Samsung Electronics Co., Ltd.(a) | 5,282 | 5,633,685 | ||||||
Samsung Electronics Co., Ltd. Preference Shares(a) | 982 | 907,749 | ||||||
Samsung Fire & Marine Insurance Co., Ltd.(a) | 1,699 | 444,129 | ||||||
Samsung Heavy Industries Co., Ltd.(a) | 7,170 | 65,311 | ||||||
Samsung Life Insurance Co., Ltd.(a) | 3,825 | 357,445 | ||||||
Samsung SDI Co., Ltd.(a) | 2,629 | 252,739 | ||||||
Samsung SDS Co., Ltd.(a) | 1,480 | 318,328 | ||||||
Samsung Securities Co., Ltd.(a) | 2,740 | 96,164 | ||||||
Shinhan Financial Group Co., Ltd.(a) | 20,400 | 685,272 | ||||||
Shinsegae Co., Ltd.(a) | 329 | 64,010 | ||||||
SK Holdings Co., Ltd.(a) | 1,682 | 342,699 | ||||||
SK Hynix, Inc.(a) | 27,840 | 719,189 | ||||||
SK Innovation Co., Ltd.(a)(b) | 3,095 | 339,432 | ||||||
SK Networks Co., Ltd.(a) | 5,340 | 24,772 | ||||||
SK Telecom Co., Ltd.(a) | 463 | 84,737 | ||||||
Woori Bank(a) | 16,160 | 120,865 | ||||||
Yuhan Corp.(a) | 373 | 86,048 | ||||||
|
| |||||||
| 25,440,699 | ||||||||
|
| |||||||
Taiwan – 12.0% | ||||||||
Acer, Inc.(a)(b) | 141,000 | 51,652 | ||||||
Advanced Semiconductor Engineering, Inc.(a) | 302,000 | 346,914 | ||||||
Advantech Co., Ltd.(a) | 15,000 | 96,057 | ||||||
Asia Cement Corp.(a) | 112,000 | 93,195 | ||||||
Asia Pacific Telecom Co., Ltd.(a)(b) | 91,000 | 32,099 | ||||||
Asustek Computer, Inc.(a) | 34,000 | 280,734 | ||||||
AU Optronics Corp.(a) | 414,000 | 122,053 | ||||||
Casetek Holdings, Ltd.(a) | 7,000 | 28,428 | ||||||
Catcher Technology Co., Ltd.(a) | 32,000 | 266,765 | ||||||
Cathay Financial Holding Co., Ltd.(a) | 390,000 | 546,367 | ||||||
Chailease Holding Co., Ltd.(a) | 49,000 | 84,331 | ||||||
Chang Hwa Commercial Bank, Ltd.(a) | 222,000 | 105,723 | ||||||
Cheng Shin Rubber Industry Co., Ltd.(a) | 77,000 | 124,451 | ||||||
Chicony Electronics Co., Ltd.(a) | 24,000 | 52,497 | ||||||
China Airlines, Ltd.(a)(b) | 128,000 | 46,653 | ||||||
China Development Financial Holding Corp.(a) | 653,000 | 162,876 | ||||||
China Life Insurance Co., Ltd.(a) | 152,000 | 116,072 | ||||||
China Steel Corp.(a) | 565,000 | 308,025 | ||||||
Chunghwa Telecom Co., Ltd.(a) | 182,000 | 548,274 | ||||||
Compal Electronics, Inc.(a) | 203,000 | 113,599 | ||||||
CTBC Financial Holding Co., Ltd.(a) | 733,000 | 375,297 | ||||||
Delta Electronics, Inc.(a) | 92,000 | 432,730 | ||||||
E.Sun Financial Holding Co., Ltd.(a) | 342,000 | 198,559 | ||||||
Eclat Textile Co., Ltd.(a) | 9,000 | 123,671 | ||||||
Eva Airways Corp.(a)(b) | 92,000 | 51,955 | ||||||
Evergreen Marine Corp. Taiwan, Ltd.(a) | 80,000 | 32,172 | ||||||
Far Eastern New Century Corp.(a) | 154,000 | 120,311 | ||||||
Far EasTone Telecommunications Co., Ltd.(a) | 76,000 | 156,196 | ||||||
Feng TAY Enterprise Co., Ltd.(a) | 14,000 | 71,197 | ||||||
First Financial Holding Co., Ltd.(a) | 439,000 | 203,906 | ||||||
Formosa Chemicals & Fibre Corp.(a) | 154,000 | 345,454 | ||||||
Formosa Petrochemical Corp.(a) | 55,000 | 131,557 | ||||||
Formosa Plastics Corp.(a) | 197,000 | 459,882 | ||||||
Formosa Taffeta Co., Ltd.(a) | 37,000 | 33,636 | ||||||
Foxconn Technology Co., Ltd.(a) | 44,000 | 92,687 | ||||||
Fubon Financial Holding Co., Ltd.(a) | 318,000 | 432,553 | ||||||
Giant Manufacturing Co., Ltd.(a) | 14,000 | 92,806 | ||||||
Hermes Microvision, Inc.(a) | 2,000 | 71,935 | ||||||
Highwealth Construction Corp.(a) | 37,000 | 42,499 | ||||||
Hiwin Technologies Corp.(a) | 10,000 | 39,153 | ||||||
Hon Hai Precision Industry Co., Ltd.(a) | 689,000 | 1,686,188 | ||||||
Hotai Motor Co., Ltd.(a) | 12,000 | 138,009 | ||||||
See accompanying notes to financial statements.
9
Table of Contents
State Street Institutional Investment Trust
State Street Emerging Markets Equity Index Fund
Schedule of Investments — (continued)
December 31, 2015
Security Description | Shares | Value | ||||||
COMMON STOCKS – (continued) |
| |||||||
Taiwan – (continued) | ||||||||
HTC Corp.(a) | 32,000 | $ | 75,609 | |||||
Hua Nan Financial Holdings Co., Ltd.(a) | 308,000 | 142,570 | ||||||
Innolux Corp.(a) | 405,000 | 121,731 | ||||||
Inotera Memories, Inc.(a)(b) | 110,000 | 92,785 | ||||||
Inventec Corp.(a) | 111,000 | 72,363 | ||||||
Largan Precision Co., Ltd.(a) | 5,000 | 342,124 | ||||||
Lite-On Technology Corp.(a) | 101,000 | 97,403 | ||||||
MediaTek, Inc.(a) | 71,000 | 537,008 | ||||||
Mega Financial Holding Co., Ltd.(a) | 515,000 | 332,027 | ||||||
Merida Industry Co., Ltd.(a) | 10,000 | 53,631 | ||||||
Nan Ya Plastics Corp.(a) | 227,000 | 419,363 | ||||||
Novatek Microelectronics Corp.(a) | 28,000 | 109,006 | ||||||
OBI Pharma, Inc.(a)(b) | 5,000 | 99,311 | ||||||
Pegatron Corp.(a) | 92,000 | 200,097 | ||||||
Phison Electronics Corp.(a) | 7,000 | 49,161 | ||||||
Pou Chen Corp.(a) | 105,000 | 137,017 | ||||||
Powertech Technology, Inc.(a) | 32,000 | 63,097 | ||||||
President Chain Store Corp.(a) | 28,000 | 174,754 | ||||||
Quanta Computer, Inc.(a) | 129,000 | 206,948 | ||||||
Radiant Opto-Electronics Corp.(a) | 21,000 | 47,789 | ||||||
Realtek Semiconductor Corp.(a) | 22,000 | 52,373 | ||||||
Ruentex Development Co., Ltd.(a) | 40,000 | 51,972 | ||||||
Ruentex Industries, Ltd.(a) | 25,000 | 46,482 | ||||||
Shin Kong Financial Holding Co., Ltd.(a) | 392,000 | 84,923 | ||||||
Siliconware Precision Industries Co., Ltd.(a) | 104,000 | 164,234 | ||||||
Simplo Technology Co., Ltd.(a) | 13,000 | 41,287 | ||||||
SinoPac Financial Holdings Co., Ltd.(a) | 461,000 | 130,896 | ||||||
Standard Foods Corp.(a) | 17,000 | 42,310 | ||||||
Synnex Technology International Corp.(a) | 64,000 | 62,094 | ||||||
Taishin Financial Holding Co., Ltd.(a) | 381,000 | 131,640 | ||||||
Taiwan Business Bank(a)(b) | 203,000 | 50,407 | ||||||
Taiwan Cement Corp.(a) | 159,000 | 131,629 | ||||||
Taiwan Cooperative Financial Holding Co., Ltd.(a) | 344,000 | 143,285 | ||||||
Taiwan Fertilizer Co., Ltd.(a) | 38,000 | 49,571 | ||||||
Taiwan Mobile Co., Ltd.(a) | 80,000 | 242,949 | ||||||
Taiwan Semiconductor Manufacturing Co., Ltd.(a) | 1,178,000 | 5,082,175 | ||||||
Teco Electric and Machinery Co., Ltd.(a) | 91,000 | 72,512 | ||||||
Transcend Information, Inc.(a) | 9,000 | 23,376 | ||||||
Uni-President Enterprises Corp.(a) | 231,000 | 385,062 | ||||||
United Microelectronics Corp.(a) | 579,000 | 211,588 | ||||||
Vanguard International Semiconductor Corp.(a) | 39,000 | 50,365 | ||||||
Wistron Corp.(a) | 116,000 | 65,080 | ||||||
WPG Holdings, Ltd.(a) | 71,000 | 67,401 | ||||||
Yuanta Financial Holding Co., Ltd.(a) | 423,000 | 155,159 | ||||||
Yulon Motor Co., Ltd.(a) | 42,000 | 38,233 | ||||||
Zhen Ding Technology Holding, Ltd.(a) | 19,000 | 43,321 | ||||||
|
| |||||||
| 19,853,236 | ||||||||
|
| |||||||
Thailand – 2.0% | ||||||||
Advanced Info Service PCL(a) | 49,700 | 209,105 | ||||||
Airports of Thailand PCL(a) | 19,000 | 181,652 | ||||||
Bangkok Bank PCL(a) | 11,900 | 50,814 | ||||||
Bangkok Dusit Medical Services PCL(a) | 185,100 | 114,360 | ||||||
Bangkok Metro PCL(b) | 790,000 | 48,737 | ||||||
Banpu PCL(a) | 49,400 | 21,847 | ||||||
BEC World PCL(a) | 46,800 | 39,464 | ||||||
BTS Group Holdings PCL(a) | 276,500 | 69,797 | ||||||
Bumrungrad Hospital PCL(a) | 17,100 | 99,848 | ||||||
Central Pattana PCL(a) | 59,100 | 76,792 | ||||||
Charoen Pokphand Foods PCL(a) | 148,000 | 74,767 | ||||||
CP ALL PCL(a) | 210,400 | 228,474 | ||||||
Delta Electronics Thailand PCL(a) | 23,800 | 50,291 | ||||||
Energy Absolute PCL(a) | 53,500 | 33,287 | ||||||
Glow Energy PCL(a) | 24,500 | 50,036 | ||||||
Home Product Center PCL(a) | 188,600 | 35,485 | ||||||
Indorama Ventures PCL(a) | 63,400 | 37,127 | ||||||
IRPC PCL(a) | 478,700 | 56,769 | ||||||
Kasikornbank PCL(a) | 83,500 | 347,076 | ||||||
Krung Thai Bank PCL(a) | 154,700 | 71,347 | ||||||
Minor International PCL(a) | 82,100 | 82,227 | ||||||
PTT Exploration & Production PCL(a) | 66,500 | 105,441 | ||||||
PTT Global Chemical PCL(a) | 99,100 | 137,082 | ||||||
PTT PCL(a) | 47,800 | 322,001 | ||||||
Siam Cement PCL(a) | 19,550 | 248,769 | ||||||
Siam Commercial Bank PCL(a) | 74,600 | 246,079 | ||||||
Thai Oil PCL(a) | 39,000 | 71,086 | ||||||
Thai Union Group PCL(a) | 91,300 | 43,372 | ||||||
TMB Bank PCL(a) | 627,500 | 41,955 | ||||||
True Corp. PCL(a)(b) | 411,800 | 76,217 | ||||||
|
| |||||||
| 3,271,304 | ||||||||
|
| |||||||
Turkey – 1.3% | ||||||||
Akbank TAS(a) | 105,182 | 240,982 | ||||||
Anadolu Efes Biracilik Ve Malt Sanayii A/S(a) | 9,908 | 64,117 | ||||||
Arcelik A/S(a) | 11,307 | 54,083 | ||||||
BIM Birlesik Magazalar A/S(a) | 10,160 | 178,687 | ||||||
Coca-Cola Icecek A/S(a) | 3,648 | 46,417 | ||||||
Emlak Konut Gayrimenkul Yatirim Ortakligi A/S(a) | 90,839 | 80,800 | ||||||
Enka Insaat ve Sanayi A/S(a) | 24,861 | 38,472 | ||||||
Eregli Demir ve Celik Fabrikalari TAS(a) | 66,933 | 69,593 | ||||||
Ford Otomotiv Sanayi A/S(a) | 3,356 | 34,782 | ||||||
Haci Omer Sabanci Holding A/S(a) | 43,898 | 124,338 | ||||||
KOC Holding A/S(a) | 30,310 | 113,423 | ||||||
Petkim Petrokimya Holding A/S(a)(b) | 19,123 | 30,034 | ||||||
TAV Havalimanlari Holding A/S(a) | 7,815 | 48,674 | ||||||
See accompanying notes to financial statements.
10
Table of Contents
State Street Institutional Investment Trust
State Street Emerging Markets Equity Index Fund
Schedule of Investments — (continued)
December 31, 2015
Security Description | Shares | Value | ||||||
COMMON STOCKS – (continued) |
| |||||||
Turkey – (continued) | ||||||||
Tofas Turk Otomobil Fabrikasi A/S(a) | 5,976 | $ | 38,763 | |||||
Tupras Turkiye Petrol Rafinerileri A/S(a)(b) | 5,987 | 142,672 | ||||||
Turk Hava Yollari AO(a)(b) | 26,391 | 66,697 | ||||||
Turk Telekomunikasyon A/S(a) | 21,754 | 40,651 | ||||||
Turkcell Iletisim Hizmetleri A/S(a) | 42,073 | 142,498 | ||||||
Turkiye Garanti Bankasi A/S(a) | 110,440 | 268,825 | ||||||
Turkiye Halk Bankasi A/S(a) | 29,881 | 106,115 | ||||||
Turkiye Is Bankasi(a) | 75,300 | 118,390 | ||||||
Turkiye Sise ve Cam Fabrikalari A/S(a) | 31,794 | 34,719 | ||||||
Turkiye Vakiflar Bankasi TAO Class D(a) | 35,858 | 46,954 | ||||||
Ulker Biskuvi Sanayi A/S(a) | 7,358 | 44,372 | ||||||
Yapi ve Kredi Bankasi A/S(a) | 41,567 | 46,739 | ||||||
|
| |||||||
| 2,221,797 | ||||||||
|
| |||||||
United Arab Emirates – 0.9% | ||||||||
Abu Dhabi Commercial Bank PJSC(a) | 93,632 | 167,053 | ||||||
Aldar Properties PJSC(a) | 150,364 | 94,053 | ||||||
Arabtec Holding PJSC(a)(b) | 108,115 | 36,319 | ||||||
DP World, Ltd.(a) | 7,936 | 160,980 | ||||||
Dubai Financial Market PJSC(a) | 95,619 | 31,692 | ||||||
Dubai Islamic Bank PJSC(a) | 47,257 | 79,088 | ||||||
Emaar Malls Group PJSC(a)(b) | 93,331 | 69,852 | ||||||
Emaar Properties PJSC(a) | 167,729 | 257,901 | ||||||
Emirates Telecommunications Group Co. PJSC | 83,158 | 364,510 | ||||||
First Gulf Bank PJSC(a) | 43,029 | 147,764 | ||||||
National Bank of Abu Dhabi PJSC | 32,380 | 70,173 | ||||||
|
| |||||||
| 1,479,385 | ||||||||
|
| |||||||
TOTAL COMMON STOCKS |
| 149,352,507 | ||||||
|
| |||||||
RIGHTS – 0.0%(d) | ||||||||
HONG KONG – 0.0%(d) | ||||||||
GCL-Poly Energy Holdings, Ltd. (expiring 1/20/16)(b) | 103,600 | 534 | ||||||
|
| |||||||
SHORT-TERM INVESTMENT – 9.4% |
| |||||||
State Street Institutional Liquid Reserves Fund, Premier Class 0.23%(e)(f) | 15,604,398 | 15,604,398 | ||||||
|
| |||||||
TOTAL INVESTMENTS – 99.5% |
| 164,957,439 | ||||||
Other Assets in Excess of Liabilities – 0.5% | 850,049 | |||||||
|
| |||||||
NET ASSETS – 100.0% | $ | 165,807,488 | ||||||
|
| |||||||
| (a) | Security is fair valued at year end by applying factors provided by independent third party in accordance with Fund’s valuation policy and procedures. The independent fair value service takes into account multiple factors including, but not limited to, movements in the U.S. securities markets, certain depositary receipts, futures contracts and foreign currency exchange rates that have occurred subsequent to the close of foreign securities exchanges. The use of the independent fair value service or alternative fair valuation methods would result in the investments being classified within Level 2 of the fair value hierarchy.Total market value of such securities represent 126,004,653 and 76.0% of net assets of the Fund at December 31, 2015. |
| (b) | Non-income producing security |
| (c) | Securities purchased pursuant to Rule 144A of the Securities Act of 1933. These Securities, which represent 0.3% of net assets as of December 31, 2015, are considered liquid and may be resold in transactions exempt from registration, normally to qualified institutional buyers. |
| (d) | Amount shown represents less than 0.05% of net assets. |
| (e) | Affiliated Fund managed by SSGA Funds Management, Inc. (Note 4). |
| (f) | The rate shown is the annualized seven-day yield at December 31, 2015. |
Abbreviations: | ||||
| ADR | American Depositary Receipt | |||
| GDR | Global Depositary Receipt | |||
| LIBOR | London Interbank Offered Rate | |||
| PJSC | Public Joint Stock Company | |||
| REIT | Real Estate Investment Trust | |||
See accompanying notes to financial statements.
11
Table of Contents
State Street Institutional Investment Trust
State Street Emerging Markets Equity Index Fund
Schedule of Investments — (continued)
December 31, 2015
OTC Total Return Swap
Pay/ Receive Floating Rate | Floating Rate Index | Fixed Rate | Maturity Date | Counterparty | Underlying Instrument | Notional Amount | Value | Upfront Premiums Paid/ (Received) | Unrealized Appreciation | |||||||||||||||||||||
Pay | 3M LIBOR | 1.232 | % | 12/16/2016 | Bank of America N.A. | MSCI India Net TR Index | $ | 13,999,793 | $ | 397,691 | $ | – | $ | 397,691 | ||||||||||||||||
At December 31, 2015, open futures contracts purchased were as follows:
Futures Contracts | Expiration Date | Number of Contracts | Notional Value | Unrealized Depreciation | ||||||||||||
Mini MSCI Emerging Markets (long) | 03/18/2016 | 47 | $ | 1,850,625 | $ | (5,297 | ) | |||||||||
Description | Level 1 – Quoted Prices | Level 2 – Other Significant Observable Inputs | Level 3 – Significant Unobservable Inputs | Total | ||||||||||||
Assets: | ||||||||||||||||
Investments: | ||||||||||||||||
Common Stocks | $ | 23,347,854 | $ | 126,004,653 | $ | – | $ | 149,352,507 | ||||||||
Rights | – | 534 | – | 534 | ||||||||||||
Short-Term Investment | 15,604,398 | – | – | 15,604,398 | ||||||||||||
Other Financial Instruments: | ||||||||||||||||
Total Return Swaps | – | 397,691 | – | 397,691 | ||||||||||||
|
|
|
|
|
|
|
| |||||||||
Total Investments | $ | 38,952,252 | $ | 126,402,878 | $ | – | $ | 165,355,130 | ||||||||
|
|
|
|
|
|
|
| |||||||||
Liabilities: | ||||||||||||||||
Other Financial Instruments: | ||||||||||||||||
Futures Contracts | $ | (5,297 | ) | $ | – | $ | – | $ | (5,297 | ) | ||||||
|
|
|
|
|
|
|
| |||||||||
Total Investments and Other Financial Instruments | $ | 38,946,955 | $ | 126,402,878 | $ | – | $ | 165,349,833 | ||||||||
|
|
|
|
|
|
|
| |||||||||
The Fund commenced operation during the period ended December 31, 2015, as such the Fund had no transfers between levels for the period ended December 31, 2015.
See accompanying notes to financial statements.
12
Table of Contents
State Street Institutional Investment Trust
State Street Emerging Markets Equity Index Fund
Statement of Assets and Liabilities
December 31, 2015
Assets | ||||
Investments in unaffiliated issuers, at value (Note 2) | $ | 149,353,041 | ||
Investments in affiliated issuers, at value (Note 4) | 15,604,398 | |||
|
| |||
Total Investments | 164,957,439 | |||
Cash at broker for futures contracts | 84,600 | |||
Foreign currency, at value | 64,044 | |||
Receivable from broker – variation margin for open futures contracts | 64,580 | |||
Dividends receivable from unaffiliated issuers | 345,134 | |||
Dividends receivable from affiliated issuers | 1,297 | |||
Receivable from Adviser (Note 4) | 33,405 | |||
Unrealized appreciation on swap contracts | 397,691 | |||
Miscellaneous Receivable | 158,318 | |||
|
| |||
Total assets | 166,106,508 | |||
|
| |||
Liabilities | ||||
Payable for investments purchased | 85,689 | |||
Due to custodian | 158,318 | |||
Advisory fees payable (Note 4) | 7,065 | |||
Custodian fees payable (Note 4) | 4,012 | |||
Professional fees payable | 24,959 | |||
Administration fees payable (Note 4) | 2,523 | |||
Deferred foreign taxes payable | 13,029 | |||
Accrued expenses and other liabilities | 3,425 | |||
|
| |||
Total liabilities | 299,020 | |||
|
| |||
Net Assets | $ | 165,807,488 | ||
|
| |||
Net Assets Consist of: | ||||
Paid-in capital | $ | 165,893,952 | ||
Distributions in excess of net investment income | (90,526 | ) | ||
Accumulated net realized gain | 4,515 | |||
Net unrealized appreciation (depreciation) on: | ||||
Investments (net of deferred tax liability for foreign capital gains tax of $13,029) | (390,394 | ) | ||
Foreign currency transactions | (2,453 | ) | ||
Futures contracts | (5,297 | ) | ||
Swap contracts | 397,691 | |||
|
| |||
Net Assets | $ | 165,807,488 | ||
|
| |||
Class K | ||||
Net Assets | $ | 165,807,488 | ||
Shares of beneficial interest outstanding | 16,589,395 | |||
|
| |||
Offering, net asset value, and redemption price per share | $ | 9.99 | ||
|
| |||
Investments in unaffiliated issuers, at cost | $ | 149,730,406 | ||
|
| |||
Investments in affiliated issuers, at cost | $ | 15,604,398 | ||
|
| |||
Foreign currency, at cost | $ | 80,266 |
See accompanying notes to financial statements.
13
Table of Contents
State Street Institutional Investment Trust
State Street Emerging Markets Equity Index Fund
Period Ended December 31, 2015*
Income | ||||
Dividend income (net of foreign taxes withheld of $93,094) | $ | 412,270 | ||
Dividend income – affiliated issuer (Note 4) | 1,297 | |||
|
| |||
| 413,567 | ||||
|
| |||
Expenses | ||||
Advisory fees (Note 4) | 7,065 | |||
Administration fees (Note 4) | 2,523 | |||
Custodian fees (Note 4) | 4,012 | |||
Professional fees | 24,959 | |||
Miscellaneous expenses | 3,425 | |||
|
| |||
Total expenses | 41,984 | |||
|
| |||
Less: Expenses waived/reimbursed by the Adviser (Note 4) | (33,405 | ) | ||
|
| |||
Net expenses | 8,579 | |||
|
| |||
Net Investment Income | $ | 404,988 | ||
|
| |||
Realized and Unrealized Gain (Loss) | ||||
Net realized gain (loss) on: | ||||
Investments | 38 | |||
Foreign currency transactions | (95,020 | ) | ||
Futures contracts | 4,477 | |||
|
| |||
Net realized (loss) | (90,505 | ) | ||
|
| |||
Change in unrealized appreciation (depreciation) on: | ||||
Investments (net of deferred taxes of $13,029) | (390,394 | ) | ||
Foreign currency transactions | (2,453 | ) | ||
Futures contracts | (5,297 | ) | ||
Swaps contracts | 397,691 | |||
|
| |||
Net change in unrealized depreciation | (453 | ) | ||
|
| |||
Net realized and unrealized loss | (90,958 | ) | ||
|
| |||
Net Increase in Net Assets from Operations | $ | 314,030 | ||
|
|
| * | For the period December 18, 2015 (inception date) through December 31, 2015. |
See accompanying notes to financial statements.
14
Table of Contents
State Street Institutional Investment Trust
State Street Emerging Markets Equity Index Fund
Statement of Changes in Net Assets
| For the Period 12/18/15* to 12/31/15 | ||||
Increase (Decrease) in Net Assets Resulting from: | ||||
Operations: | ||||
Net investment income | $ | 404,988 | ||
Net realized loss on investments, foreign currency related transactions, futures contracts and swap contracts | (90,505 | ) | ||
Net change in unrealized appreciation on investments, foreign currency related transactions, futures contracts and swap contracts | (453 | ) | ||
|
| |||
Net increase in net assets from operations | 314,030 | |||
|
| |||
Distributions to Shareholders from: | ||||
Net investment income | (400,494 | ) | ||
|
| |||
Net Increase (Decrease) from Capital Share Transactions: | ||||
Class K | ||||
Shares sold | 165,493,458 | |||
Reinvestment of distributions | 400,494 | |||
|
| |||
Total increase from capital share transactions | 165,893,952 | |||
|
| |||
Net Increase in Net Assets | 165,807,488 | |||
Net Assets | ||||
Beginning of period | – | |||
|
| |||
End of period | $ | 165,807,488 | ||
|
| |||
Distributions in excess of net investment income | $ | (90,526 | ) | |
|
| |||
Changes in Shares: | ||||
Class K | ||||
Shares sold | 16,549,346 | |||
Reinvestment of distributions | 40,049 | |||
|
| |||
Net increase in shares | 16,589,395 | |||
|
| |||
| * | Inception date |
See accompanying notes to financial statements.
15
Table of Contents
State Street Institutional Investment Trust
State Street Emerging Markets Equity Index Fund
| Period from 12/21/15* to 12/31/15 | ||||
Per Share Operating Performance: | ||||
Net Asset Value, Beginning of Period | $ | 10.00 | ||
|
| |||
Investment Operations: | ||||
Net investment income(a) | 0.02 | |||
Net realized and unrealized loss on investments | (0.01 | ) | ||
|
| |||
Total from investment operations | 0.01 | |||
|
| |||
Less Distributions From: | ||||
Net investment income | (0.02 | ) | ||
|
| |||
Total distributions | (0.02 | ) | ||
|
| |||
Net decrease in net assets | (0.01 | ) | ||
|
| |||
Net Asset Value, End of Period | $ | 9.99 | ||
|
| |||
Total Return(b) | 0.14 | % | ||
Ratios and Supplemental Data: | ||||
Net Assets, End of Period (000s) | $ | 165,807 | ||
Ratios to average net assets: | ||||
Expenses before waiver and payments by affiliates(c) | 0.83 | % | ||
Expenses net of waiver and payments by affiliates(c) | 0.17 | % | ||
Net investment income(c) | 8.03 | % | ||
Portfolio turnover rate(d) | 0.03 | % | ||
| * | Commencement of operations. |
| (a) | Net investment income per share is calculated using the average shares method. |
| (b) | Total return is calculated assuming a purchase of shares at net asset value on the first day and a sale at net asset value on the last day of each period reported. Distributions are assumed, for the purpose of this calculation, to be reinvested at net asset value per share on the respective payment dates of the Fund. Total return for periods of less than one year is not annualized. Results represent past performance and are not indicative of future results. |
| (c) | Annualized. |
| (d) | Not annualized. |
See accompanying notes to financial statements.
16
Table of Contents
State Street Institutional Investment Trust
State Street Emerging Markets Equity Index Fund
December 31, 2015
| 1. | Organization |
State Street Institutional Investment Trust (the “Trust”) which is registered under the Investment Company Act of 1940, as amended (the “1940 Act”), is as an open-end management investment company, and was organized as a Massachusetts business trust on February 16, 2000. The Trust consists of forty-five (45) series and corresponding classes, each of which have the same rights and privileges, including the same voting rights. The financial statements herein relate only to the State Street Emerging Markets Equity Index Fund (the “Fund”). The Fund has registered Class A, C, I and Class K Shares. Class A, Class C and Class I were not operational at December 31, 2015.
The Fund’s Class K was formed on December 18, 2015 and commenced operation on December 21, 2015.
The Fund is authorized to issue an unlimited number of shares, with no par value.
The investment objective of the Fund is to seek to provide investment results that, before fees and expenses, correspond generally to the total return of an index that tracks the performance of emerging market equity securities.
The Fund is classified as a diversified investment company under the 1940 Act.
Under the Trust’s organizational documents, its officers and trustees are indemnified against certain liabilities arising out of the performance of their duties to the Trust. Additionally, in the normal course of business, the Trust enters into contracts with service providers that contain general indemnification clauses. The Trust’s maximum exposure under these arrangements is unknown as this could involve future claims that may be made against the Trust that have not yet occurred.
| 2. | Summary of Significant Accounting Policies |
The following is a summary of significant accounting policies followed by the Trust in the preparation of its financial statements:
The preparation of financial statements in accordance with U.S. generally accepted accounting principles (“U.S. GAAP”) requires management to make estimates and assumptions that affect the reported amounts and disclosures in the financial statements. Actual results could differ from those estimates. The Fund is an investment company under U.S. GAAP and follows the accounting and reporting guidance applicable to investment companies in Financial Accounting Standards Board (“FASB”) Accounting Standards Codification (“ASC”) 946, Financial Services Investment Companies (“ASC 946”).
Security Valuation
The Fund’s investments are valued at fair value each day that the Fund’s listing exchange is open and, for financial reporting purposes, as of the report date should the reporting period end on a day that the Fund’s listing exchange is not open. Fair value is generally defined as the price a fund would receive to sell an asset or pay to transfer a liability in an orderly transaction between market participants at the measurement date. By its nature, a fair value price is a good faith estimate of the valuation in a current sale and may not reflect an actual market price. The investments of the Fund are valued pursuant to policy and procedures developed by the Oversight Committee (the “Committee”) and approved by the
17
Table of Contents
State Street Institutional Investment Trust
State Street Emerging Markets Equity Index Fund
Notes to Financial Statements — (continued)
December 31, 2015
Board of Trustees of the Trust (the “Board”). The Committee provides oversight of the valuation of investments for the Fund. The Board has responsibility for determining the fair value of investments.
Valuation techniques used to value the Fund’s investments by major category are as follows:
| • | Equity investments (including preferred stocks and registered investment companies) traded on a recognized securities exchange for which market quotations are readily available are valued at the last sale price or official closing price, as applicable, on the primary market or exchange on which they trade. Equity investments traded on a recognized exchange for which there were no sales on that day are valued at the last published sale price or at fair value. |
| • | Rights and warrants are valued at the last reported sale price obtained from independent pricing services or brokers on the valuation date. If no price is obtained from pricing services or brokers, valuation will be based upon the intrinsic value pursuant to the valuation policy and procedures approved by the Board. |
| • | Investments in registered investment companies (including money market funds) or other unitized pooled investment vehicles that are not traded on an exchange are valued at that day’s published net asset value per share or unit. Money market funds generally value portfolio investments using the amortized cost method as set forth in Rule 2a-7 under the 1940 Act and in accordance with Fund procedures to stabilize net asset value. |
| • | Exchange-traded futures contracts are valued at the settlement price on the primary market on which they are traded most extensively. Exchange-traded futures contracts traded on a recognized exchange for which there were no sales on that day are valued at the last reported sale price obtained from independent pricing services or brokers or at fair value. |
| • | Swap agreements are valued daily based upon prices supplied by Board approved pricing vendors or through brokers. Depending on the product and terms of transaction, the value of agreements is determined using a series of techniques including valuation models that incorporate a number of market data factors, such as discounted cash flows, yields, curves, trades and values of the underlying reference instruments. In the event the advisor is unable to obtain an independent, third–party valuation on the settlement date of the swap agreements, the agreements will be fair valued. |
In the event prices or quotations are not readily available or that the application of these valuation methods results in a price for an investment that is deemed to be not representative of the fair value of such investment, fair value will be determined in good faith by the Committee, in accordance with the valuation policy and procedures approved by the Board.
Fair value pricing could result in a difference between the prices used to calculate the Fund’s net asset value and the prices used by the Fund’s underlying index, which in turn could result in a difference between the Fund’s performance and the performance of the Fund’s underlying index. Various inputs are used in determining the value of the Fund’s investments. These inputs are categorized into a hierarchy consisting of three broad levels for financial reporting purposes.
The Fund values its assets and liabilities at fair value using a hierarchy that prioritizes the inputs to valuation techniques giving the highest priority to readily available unadjusted quoted prices in active
18
Table of Contents
State Street Institutional Investment Trust
State Street Emerging Markets Equity Index Fund
Notes to Financial Statements — (continued)
December 31, 2015
markets for identical assets or liabilities (Level 1 measurements) and the lowest priority to unobservable inputs (Level 3 measurements) when market prices are not readily available or reliable. The categorization of a value determined for an investment within the hierarchy is based upon the pricing transparency of the investment and is not necessarily an indication of the risk associated with investing in it.
The three levels of the fair value hierarchy are as follows:
| • | Level 1 – Unadjusted quoted prices in active markets for identical assets or liabilities; |
| • | Level 2 – Inputs other than quoted prices included within Level 1 that are observable for the asset or liability either directly or indirectly, including quoted prices for similar assets or liabilities in active markets, quoted prices for identical or similar assets or liabilities in markets that are not considered to be active, inputs other than quoted prices that are observable for the asset or liability (such as exchange rates, financing terms, interest rates, yield curves, volatilities, prepayment speeds, loss severities, credit risks and default rates) or other market-corroborated inputs; and |
| • | Level 3 – Unobservable inputs for the asset or liability, including the Committee’s assumptions used in determining the fair value of investments. |
Changes in valuation techniques may result in transfers in or out of an assigned level within the fair value hierarchy. Transfers between different levels of the fair value hierarchy are recognized at the end of the reporting period.
Investment Transactions and Income Recognition
Investment transactions are accounted for on trade date for financial reporting purposes. Dividend income and capital gain distributions, if any, are recognized daily on the ex-dividend date, net of foreign taxes withheld at source, if any. Non-cash dividends received in the form of stock, if any, are recorded as dividend income at fair value. Distributions received by the Fund may include a return of capital that is estimated by management. Such amounts are recorded as a reduction of the cost of investments or reclassified to capital gains. Realized gains and losses from the sale or disposition of investments and foreign exchange transactions are determined using the identified cost method.
Expenses
Advisory fees and other expenses, which are directly identifiable to a specific fund, are applied to the fund within the Trust. Trustees’ fees and other expenses which cannot be attributed to a specific fund are allocated in such a manner as deemed equitable, taking into consideration the nature and type of expense and the relative net assets of the funds. Class specific fees and expenses are borne by each class.
Foreign Currency Translation
The accounting records of the Fund are maintained in U.S. dollars. Foreign currencies as well as investment securities and other assets and liabilities denominated in a foreign currency are translated to U.S. dollars using exchange rates deemed appropriate pursuant to the valuation policy and procedures at period end. Purchases and sales of securities, income receipts and expense payments are translated into U.S. dollars on the respective dates of transactions. The Fund does not isolate the effect of fluctuations
19
Table of Contents
State Street Institutional Investment Trust
State Street Emerging Markets Equity Index Fund
Notes to Financial Statements — (continued)
December 31, 2015
in foreign exchange from the effect of fluctuations in the market price of securities. Such fluctuations are reflected by the Fund as a component of realized and unrealized gains and losses from investments for financial reporting purposes.
Foreign Taxes
The Fund may be subject to foreign taxes (a portion of which may be reclaimable) on income, stock dividends, capital gains on investments or certain foreign currency transactions. All foreign taxes are recorded in accordance with applicable foreign tax regulations and rates that exist in the foreign jurisdictions in which the Fund invests. These foreign taxes, if any, are paid by the Fund and are reflected in the Statement of Operations, if applicable. Foreign taxes payable or deferred as of December 31, 2015, if any, are disclosed in the Fund’s Statement of Assets and Liabilities.
Futures
The Fund may enter into futures contracts to meet its objectives. A futures contract is a standardized, exchange-traded agreement to buy or sell a financial instrument at a set price on a future date. Upon entering into a futures contract, the Fund is required to deposit with the broker, cash or securities in an amount equal to the minimum initial margin requirements of the clearing house. Variation margin payments are made or received by the Fund each day, depending on the daily fluctuations in the value of the underlying security or index. Such receipt or payment is recorded by the Fund for financial statement purposes as part of unrealized gains or losses, and is recorded on the Statement of Assets and Liabilities as Receivable or Payable from broker – variation margin on open futures contracts. The Fund recognizes a realized gain or loss when a contract is closed, which is recorded on the Statement of Operations. The risk of loss in trading futures contracts in some strategies is potentially unlimited.
Losses may arise if the value of a futures contract decreases due to unfavorable changes in the market rates or values of the underlying instrument during the term of the contract or if the counterparty does not perform under the contract. The use of futures contracts also involves the risk that the movements in the price of the futures contracts do not correlate the movement of the assets underlying such contracts.
For the period ended December 31, 2015, the Fund entered into futures contracts for cash equalization and return enhancement.
Swaps
The Fund may enter into swap agreements, in which the Fund and counterparty agree either to make periodic net payments on a specified notional amount or a net payment upon termination. Swap agreements are privately negotiated in the OTC market and may be entered into as a bilateral contract (“BL OTC”) or centrally cleared (“centrally cleared swaps”). Swaps are marked-to-market daily and changes in value are recorded as unrealized appreciation (depreciation).
A BL OTC swap is a transaction between a fund and dealer counterparty where cash flows are exchanged between the two parties for the life of the swap. For BL OTC swaps, any upfront premiums paid are recorded as assets and any upfront fees received are recorded as liabilities and are shown as credit default swap contracts premiums paid and credit default swap contracts premiums received, respectively, in the Statement of Assets and Liabilities and amortized to realized gain/loss ratably over the term of the BL OTC swap. Payments received or made by the Fund for BL OTC swaps are recorded
20
Table of Contents
State Street Institutional Investment Trust
State Street Emerging Markets Equity Index Fund
Notes to Financial Statements — (continued)
December 31, 2015
in the Statement of Operations as realized gains or losses, respectively. When a BL OTC swap is terminated, the Fund will record a realized gain or loss equal to the difference between the proceeds from (or cost of) the closing transaction and the Fund’s basis in the contract, if any. Generally, the basis of the contracts is the premium received or paid.
A centrally cleared OTC swap is a transaction executed between a fund and a dealer counterparty, then cleared by a futures commission merchant (FCM) through a clearinghouse. Once cleared, the clearinghouse serves as a central counterparty (“CCP”), with whom a fund exchanges cash flows for the life of the transaction, similar to transactions in futures contracts. The Fund is required to interface with the CCP through a broker. Upon entering into a centrally cleared swap, the Fund is required to deposit initial margin with the broker in the form of cash or securities in an amount that varies depending on the size and risk profile of the particular swap. Securities deposited as initial margin if any, are designated on the Schedule of Investments and cash deposited is segregated and recorded on the Statement of Assets and Liabilities as Due from broker. The daily change in valuation of centrally cleared swaps is recorded as a receivable or payable for variation margin in the Statement of Assets and Liabilities. Payments received from (paid to) the counterparty, including at termination, are recorded as realized gain (loss) in the Statement of Operations. For both bi-lateral OTC and centrally cleared swaps, payments are exchanged at specified intervals, accrued daily commencing with the effective date of the contract and recorded as realized gain or (loss). Some swaps may be terminated prior to the effective date and realize a gain or loss upon termination.
Total Return Swaps
The Fund enters into total return swaps to obtain investment exposures that the Adviser expects to correlate closely with the Index or a portion of the Index. Total return swaps are agreements in which there is an exchange of cash flows whereby one party commits to make payments on the total return (coupon plus capital gains/losses) of an underlying instrument in exchange for fixed or floating rate interest payments. To the extent the total return of the instrument or index underlying the transaction exceeds or falls short of the offsetting interest rate obligation, the Fund will receive a payment or make a payment to the counterparty. The Fund entered into total return swaps contracts to obtain investment exposure in situations where it intends to sell a position of the stocks of its portfolio but the sale has not been completed.
Risks associated with Derivatives
Derivative transactions can create investment leverage and may be highly volatile. Use of derivatives other than for hedging purposes may be considered speculative. When the Fund invests in a derivative instrument, the future exposure is potentially unlimited. The value of a derivative instrument will depend on the ability and the willingness of the Fund’s derivative counterparty to perform its obligations under the transaction. A liquid secondary market may not always exist for the Fund’s derivative positions at any time and may impact the Fund’s ability to establish fair market value of a derivative transaction and close out derivative positions. Although the use of derivatives is intended to complement the Fund’s performance, it may instead reduce returns and increase volatility. The measurement of the risks associated with derivative instruments is meaningful only when all related and offsetting transactions are considered. The Fund must set aside liquid assets or engage in other appropriate measures to cover its obligations under these derivative instruments.
21
Table of Contents
State Street Institutional Investment Trust
State Street Emerging Markets Equity Index Fund
Notes to Financial Statements — (continued)
December 31, 2015
Regulations recently adopted or proposed by regulators in the U.S. and other countries may substantially affect the markets in which derivatives are traded, including requiring central clearing and reporting of transactions that may not have been previously required to be reported or cleared. These regulations may require, among other things, that the Fund post greater amounts of collateral or margin than the amounts currently posted by the Fund on a bilateral basis with its derivatives counterparties or with derivatives clearing organizations. In addition, the regulations may make certain types of derivatives uneconomical or unavailable to the Fund, and they may substantially reduce the liquidity for some derivatives. The full extent of the new regulations and their effects on the derivatives markets are not known at this time.
Certain derivatives, including forward foreign currency contracts and some swap contracts, as applicable, are entered into OTC under the terms and conditions of an ISDA Master Agreement, which are separately negotiated with each counterparty. An ISDA Master Agreement is a bilateral agreement between the Fund and a counterparty that governs certain OTC derivatives and typically contains, among other things, collateral posting terms and netting provisions in the event of a default and/or termination event. Under an ISDA Master Agreement, the Fund may, under certain circumstances, offset with the counterparty certain derivative financial instruments’ payables and/or receivables with collateral held and/or posted and create one single net payment. The provisions of the ISDA Master Agreement typically permit a single net payment in the event of default including the bankruptcy or insolvency of the counterparty. Bankruptcy or insolvency laws of a particular jurisdiction may restrict or prohibit the right of offset in bankruptcy, insolvency or other events. In addition, certain ISDA Master Agreements allow counterparties to terminate derivative contracts prior to maturity in the event a Fund’s net assets decline by a stated percentage or the Fund fails to meet the terms of its ISDA Master Agreements. The result would cause the Fund to accelerate payment of any net liability owed to the counterparty.
For derivatives traded under an ISDA Master Agreement, the collateral requirements are typically calculated by netting the mark-to-market amount for each transaction under such agreement and comparing that amount to the value of any collateral currently pledged by the Fund and the counterparty. Cash collateral that has been pledged to cover obligations of the Fund and cash collateral received from the counterparty, if any, is reported separately on the Statement of Assets and Liabilities as cash pledged as collateral and cash received as collateral, respectively. Non-cash collateral pledged by the Fund, if any, is noted in the Schedule of Investments. Notional principal amounts are one component used to calculate the amount of exposure to the underlying instrument, but is not the amount delivered under the contract. Accordingly, credit risk is limited to any amounts receivable from the counterparty. To reduce credit risk from potential counterparty default, the Fund enters into swap contracts with counterparties whose creditworthiness has been approved by the Trustees. The Fund bears the market risk arising from any change in index or security values or interest rates.
The following table discloses the amounts related to the Fund’s use of derivative instruments and hedging activities at December 31, 2015:
Asset Derivatives
Equity Contracts Risk | Credit Contracts Risk | Total | ||||||||||
Swap Contracts(1) | $ | – | $ | 397,691 | $ | 397,691 | ||||||
22
Table of Contents
State Street Institutional Investment Trust
State Street Emerging Markets Equity Index Fund
Notes to Financial Statements — (continued)
December 31, 2015
Liability Derivatives
Equity Contracts Risk | Credit Contracts Risk | Total | ||||||||||
Futures Contracts(2) | $ | (5,297 | ) | $ | – | $ | (5,297 | ) | ||||
Realized Gain (Loss)
Equity Contracts Risk | Credit Contracts Risk | Total | ||||||||||
Futures Contracts(3) | $ | 4,477 | $ | – | $ | 4,477 | ||||||
Swap Contracts(4) | – | – | – | |||||||||
Change in Unrealized Appreciation (Depreciation)
Equity Contracts Risk | Credit Contracts Risk | Total | ||||||||||
Futures Contracts(5) | $ | (5,297 | ) | $ | – | $ | (5,297 | ) | ||||
Swap Contracts(6) | – | 397,691 | 397,691 | |||||||||
| (1) | Schedule of Investments: Unrealized appreciation on swap contracts |
| (2) | Schedule of Investments: Unrealized appreciation (depreciation) of futures contracts. Only unsettled receivable/payable for variation margin is reported within Statements of Assets and Liabilities. |
| (3) | Statement of Operations location: Net realized gain (loss) on: Futures contracts |
| (4) | Statement of Operations location: Net realized gain (loss) on: Swap contracts |
| (5) | Statement of Operations location: Change in net unrealized appreciation (depreciation) on: Futures contracts |
| (6) | Statement of Operations location: Change in net unrealized appreciation (depreciation) on: Swaps contracts |
The average notional value of futures contracts outstanding during the period ended December 31, 2015, was $1,855,814.
The average notional value of swap contracts outstanding during the period ended December 31, 2015, was $13,999,793.
Offsetting of Financial Assets and Derivative Assets
| Counterparty | Gross Amounts of Assets | Amount Eligible to Offset | Collateral (Received)/ Pledged | Net Amount | ||||||||||||
Bank of America N.A. | $ | 397,691 | $ | – | $ | – | $ | 397,691 | ||||||||
Amounts presented on the Schedule of Investments and Statement of Assets and Liabilities are not net settlement amounts but gross.
Distributions
Dividends from net investment income are declared and paid quarterly. Net realized capital gains, if any, are distributed annually, unless additional distributions are required for compliance with applicable tax regulations. The amount and character of income and gains to be distributed are determined in accordance with federal tax regulations which may differ from net investment income and realized gains recognized for U.S. GAAP purposes.
23
Table of Contents
State Street Institutional Investment Trust
State Street Emerging Markets Equity Index Fund
Notes to Financial Statements — (continued)
December 31, 2015
Federal Income Tax
The Fund has qualified and intends to continue to qualify for and elect treatment as a “regulated investment company” under Subchapter M of the Internal Revenue Code of 1986, as amended. By so qualifying and electing, the Fund will not be subject to federal income taxes to the extent it distributes its taxable income, including any net realized capital gains, for each fiscal year. In addition, by distributing during each calendar year substantially all of its net investment income and capital gains, if any, the Fund will not be subject to federal excise tax. Income and capital gain distributions, if any, are determined in accordance with income tax regulation which may differ from U.S. GAAP. These book-tax differences are primarily due to differing treatments for foreign currency gains and losses, passive foreign investment companies and total return swaps.
Additionally, based on the SSGA Funds Management, Inc. ( the “Adviser” or “SSGA FM”) understanding of the tax rules and rates related to income, gains and transactions for the foreign jurisdictions in which the Fund invests, the Fund will provide for foreign taxes and, where appropriate, deferred foreign taxes.
SSGA FM has reviewed the Fund’s tax positions for the open tax year as of December 31, 2015, and has determined that no provision for income tax is required in the Fund’s financial statements. The Fund’s federal tax return for the initial fiscal year remains subject to examination by the Fund’s major tax jurisdictions, which include the United States of America and the Commonwealth of Massachusetts. The Fund recognizes interest and penalties, if any, related to tax liabilities as income tax expense in the Statement of Operations. No income tax returns are currently under examination. Management has analyzed tax laws and regulations and their applications to the Fund’s facts and circumstances and does not believe there are any uncertain tax positions that require recognition of a tax liability.
For the period ended December 31, 2015, permanent differences identified and reclassified among the components of net assets were as follows:
| Paid-In Capital | Accumulated Gain (Loss) | Undistributed Net Investment Income (Loss) | ||||||||
| $– | $ | 95,020 | $ | (95,020 | ) | |||||
These differences were primarily attributable to distribution redesignations. Net investment income (loss), net realized gains (losses), and net assets were not affected by this reclassification.
As of December 31, 2015, Fund had $782 of capital loss carryforwards.
The tax character of distributions paid to shareholders during the period ended December 31, 2015, was as follows:
| Ordinary Income | Long-Term Capital Gain | Tax Return of Capital | Total | |||||||||||
| $400,494 | $ | – | $ | – | $ | 400,494 | ||||||||
24
Table of Contents
State Street Institutional Investment Trust
State Street Emerging Markets Equity Index Fund
Notes to Financial Statements — (continued)
December 31, 2015
At December 31, 2015, the components of distributable earnings on a tax basis were as follows:
| Undistributed Ordinary Income | Capital Loss Carryover | Unrealized Appreciation (Depreciation) | Total | |||||||||||
| $ | 333,735 | $ | (782 | ) | $ | (419,417 | ) | $ | (86,464 | ) | ||||
At December 31, 2015, gross unrealized appreciation and gross unrealized depreciation of investments based on cost for federal income tax purpose were as follows:
| Tax Cost | Gross Unrealized Appreciation | Gross Unrealized Depreciation | Net Unrealized Appreciation (Depreciation) | |||||||||||
| $ | 165,354,664 | $ | 1,616,055 | $ | (2,013,280 | ) | $ | (397,225 | ) | |||||
| 3. | Investment Transactions |
Purchases and sales of investments (excluding short-term securities) for the period ended December 31, 2015, were $149,724,631 and $51,963, respectively.
| 4. | Related Party and Other Fees |
The Trust, on behalf of the Fund, has entered into an Investment Advisory Agreement with SSGA FM. For its advisory services, the Fund pays the Adviser a management fee at an annual rate of 0.14% of its average daily net assets. The fees are accrued daily and paid monthly.
The Adviser is contractually obligated until April 30, 2017, to waive its management fee and/or to reimburse the fund for expenses to the extent that total expenses (exclusive of non-recurring account fees, extraordinary expenses, acquired fund fees, and any class-specific expenses, such as distribution, shareholder servicing, administration and sub-transfer agency fees) exceed 0.12% of average daily net assets on an annual basis. This waiver and/or reimbursement may not be terminated prior to April 30, 2017 except with the approval of the Board. For the period ended December 31, 2015, fees waived and expenses reimbursed by the Adviser, pursuant to the agreement, were $33,405.
SSGA FM serves as administrator and State Street Bank and Trust Company (“State Street”) serves as sub-administrator and custodian to the Fund. For its administration services, the Fund pays SSGA FM at an annual rate of 0.05% of its average daily net assets. For its services as custodian, the Fund pays State Street an annual fee. SSGA FM pays State Street for its services as sub-administrator.
Boston Financial Data Services (“BFDS”), a joint venture of DST Systems, Inc. and State Street Corporation, serves as transfer agent and dividend disbursing agent to the Fund. For these services, the Fund pays annual account services fees, activity-based fees, charges related to compliance and regulatory services.
25
Table of Contents
State Street Institutional Investment Trust
State Street Emerging Markets Equity Index Fund
Notes to Financial Statements — (continued)
December 31, 2015
Transactions with Affiliates
Certain investments made by the Fund were securities affiliated with SSGA FM. The Fund invested in the State Street Institutional Liquid Reserves Fund. Transactions in affiliates for the period ending December 31, 2015, were as follows:
Security Description | Number of shares held at 12/21/15* | Shares purchased for the period ended 12/31/15 | Shares sold for the period ended 12/31/15 | Number of shares held at 12/31/15 | Value at 12/31/15 | Income earned for the period ended 12/31/15 | Realized gain/loss on shares sold | |||||||||||||||||||||
State Street Institutional Liquid Reserves Fund, Premier Class | – | 37,621,069 | 22,016,671 | 15,604,398 | $ | 15,604,398 | $ | 1,297 | $ | – | ||||||||||||||||||
| * | Commencement of operations. |
| 5. | Trustees’ Fees |
Independent Trustees are compensated on a calendar year basis. Any Trustee who is deemed to be an “interested person” (as defined in the 1940 Act) of the Fund does not receive compensation from the Fund for his or her service as a Trustee.
Each Independent Trustee receives for his or her services to the Trust, the State Street Master Funds and SSGA Funds, a $141,500 annual base retainer in addition to $18,000 for each in-person meeting and $2,000 for each telephonic meeting from the Trust. The Co-Chairmen each receive an additional $44,000 annual retainer. The Independent Trustees are reimbursed for travel and other out-of-pocket expenses in connection with meeting attendance. Trustees’ fees and expenses are allocated among the Trusts and Funds overseen by the Trustees in a manner deemed equitable taking into consideration the relative net assets of the Funds, subject to a $15,000 minimum per Fund. As of the date of these financial statements, the Trustees were not paid pension or retirement benefits as part of the Trust’s expenses.
| 6. | Concentration Risk |
The Fund’s assets may be concentrated in a particular industry, group of industries or sector. Because the Fund will generally concentrate its investments to approximately the same extent that its index is so concentrated, the Fund may be adversely affected by the performance of a particular industry, group of industries or sector, and its shares may be subject to increased price volatility. In addition, if the Fund concentrates in a single industry or group of industries, it may be more susceptible to any single economic, market, political or regulatory occurrence affecting that industry or group of industries.
| 7. | Foreign Investment Risks |
Investing in securities of foreign companies and foreign governments involves special risks and considerations not typically associated with investing in U.S. companies and securities of the U.S. government. These risks include revaluation of currencies and the risk of expropriation. Moreover, the markets for securities of many foreign companies and foreign governments may be less liquid and the prices of such securities may be more volatile than those of comparable U.S. companies and the U.S. government.
26
Table of Contents
State Street Institutional Investment Trust
State Street Emerging Markets Equity Index Fund
Notes to Financial Statements — (continued)
December 31, 2015
Some foreign markets in which the Fund invests are considered emerging markets. Investment in these emerging markets subjects the Fund to a greater risk of loss than investments in a developed market. This is due to, among other things, greater market volatility, lower trading volume, political and economic instability, higher levels of inflation, deflation or currency devaluation, greater risk of market shut down, and more governmental limitations on foreign investment policy than those typically found in a developed market.
| 8. | Line of Credit |
Effective October 15, 2015, certain Funds and other affiliated funds (each a “Participant” and, collectively, the “Participants”) share in a $360 million revolving credit facility provided by a syndication of banks. The Participants may borrow for the purpose of meeting shareholder redemption requests that otherwise might require the untimely disposition of securities. The Participants are charged an annual commitment fee which is calculated based on the unused portion of the shared credit line. Commitment fees are allocated among each of the Participants based on relative net assets. Commitment fees are ordinary fund operating expenses and are paid by the Adviser. A Participant incurs and pays the interest expense related to its borrowing. Interest is calculated at a rate per annum equal to the sum of the New York Fed Bank Rate plus 1%. A Participant may borrow up to a maximum of 33% of its assets or a lower amount as may be set forth in the Fund’s prospectus. The Fund had no outstanding loans during the year ended December 31, 2015.
| 9. | Subsequent Events |
Management has evaluated the impact of all subsequent events on the Fund through the date the financial statements were available to be issued and has determined that there were no subsequent events requiring adjustment or disclosure in the financial statements.
27
Table of Contents
Report of Independent Registered Public Accounting Firm
To the Board of Trustees and Shareholders of State Street Institutional Investment Trust:
We have audited the accompanying statement of assets and liabilities, including the schedule of investments, of State Street Emerging Markets Equity Index Fund (one of the funds constituting State Street Institutional Investment Trust) (the “Fund”) as of December 31, 2015, and the related statement of operations, statement of changes in net assets, and the financial highlights for the period from December 21, 2015 (commencement of operations) to December 31, 2015. These financial statements and financial highlights are the responsibility of the Fund’s management. Our responsibility is to express an opinion on these financial statements and financial highlights based on our audit.
We conducted our audit in accordance with the standards of the Public Company Accounting Oversight Board (United States). Those standards require that we plan and perform the audit to obtain reasonable assurance about whether the financial statements and financial highlights are free of material misstatement. We were not engaged to perform an audit of the Fund’s internal control over financial reporting. Our audit included consideration of internal control over financial reporting as a basis for designing audit procedures that are appropriate in the circumstances, but not for the purpose of expressing an opinion on the effectiveness of the Fund’s internal control over financial reporting. Accordingly, we express no such opinion. An audit also includes examining, on a test basis, evidence supporting the amounts and disclosures in the financial statements and financial highlights, assessing the accounting principles used and significant estimates made by management, and evaluating the overall financial statement presentation. Our procedures included confirmation of securities owned as of December 31, 2015, by correspondence with the custodian and others or by other appropriate auditing procedures where replies from others were not received. We believe that our audit provides a reasonable basis for our opinion.
In our opinion, the financial statements and financial highlights referred to above present fairly, in all material respects, the financial position of State Street Emerging Markets Equity Index Fund (one of the funds constituting State Street Institutional Investment Trust) at December 31, 2015, and the results of its operations, the changes in its net assets and the financial highlights for the period from December 21, 2015 (commencement of operations) to December 31, 2015, in conformity with U.S. generally accepted accounting principles.

Boston, Massachusetts
February 26, 2016
28
Table of Contents
State Street Institutional Investment Trust
State Street Emerging Markets Equity Index Fund
December 31, 2015 (Unaudited)
Shareholder Expense Example
As a shareholder of the Fund, you incur (1) transaction costs, including sales charges (loads) on purchase payments, reinvested dividends, or other distributions, and (2) ongoing costs, including management fees and to the extent applicable, distribution (12b-1) or service fees, among others. This example is intended to help you understand your ongoing costs (in dollars) of investing in the Fund and to compare these costs with the ongoing costs of investing in other mutual funds. It is based on an investment of $1,000 made at the beginning of the period shown and held for the six months ended from July 1, 2015 to December 31, 2015.
The table below illustrates your Fund’s costs in two ways:
Actual Expenses
| • | Based on actual fund return – This section helps you to estimate the actual expenses that you paid over the period. The “Ending Account Value” shown is derived from the Fund’s actual return, and the third column shows the dollar amount that would have been paid by an investor who started with $1,000 in the Fund. You may use the information here, together with the amount you invested, to estimate the expenses that you paid over the period. To do so, simply divide your account value by $1,000 (for example, an $8,600 account value divided by $1,000 = 8.6), then multiply the result by the number given for the Fund under the heading “Expenses Paid During Period”. |
Hypothetical Example for Comparison Purposes
| • | Based on hypothetical 5% return – This section is intended to help you compare your Fund’s costs with those of other mutual funds. It assumes that the Fund had a yearly return of 5% before expenses, but that the expense ratio is unchanged. In this case, because the return used is not the Fund’s actual return, the results do not apply to your investment. The example is useful in making comparisons because the U.S. Securities and Exchange Commission requires all mutual funds to calculate expenses based on a 5% return. You can assess your Fund’s costs by comparing this hypothetical example with the hypothetical examples that appear in shareholder reports of other funds. |
Please note that the expenses shown in the table are meant to highlight your ongoing costs only and do not reflect any transaction costs, such as sales charges (loads). Therefore, the hypothetical 5% return section of the table is useful in comparing ongoing costs only, and will not help you determine the relative total costs of owning different funds. In addition, if these transaction costs were included, your costs would have been higher.
29
Table of Contents
State Street Institutional Investment Trust
State Street Emerging Markets Equity Index Fund
Other Information — (continued)
December 31, 2015 (Unaudited)
Six Months Ended December 31, 2015
Beginning Account Value July 1, 2015 | Ending Account Value December 31, 2015 | Expenses Paid During Period* | ||||||||||
Based on Actual Class Return** | ||||||||||||
Class K | $ | 1,000.00 | $ | 1,001.40 | $ | 0.86 | ||||||
Based on Hypothetical | ||||||||||||
Class K | $ | 1,000.00 | $ | 1,024.35 | $ | 0.87 | ||||||
| * | The calculations are based on expenses incurred in the most recent six month period of the Fund. The Class K Shares annualized expense ratios for the period ended December 31, 2015 was 0.17%. |
| ** | Actual period is from commencement of operations December 21, 2015. Hypothetical period is from July 1, 2015. |
Tax Information
Dividend Received Deduction
For federal income tax purposes, the following information is furnished with respect to the distributions of the Trust for its fiscal period ended December 31, 2015.
Percentage of distributions which qualify for the corporate dividends received deduction:
| Fund | Percentage | |||
State Street Emerging Markets Equity Index Fund | 0.00 | % | ||
Qualified Dividend Income
A portion of dividends distributed by the Funds during the fiscal period ended December 31, 2015, are considered qualified dividend income, and are eligible for reduced tax rates. These lower rates range from 5% to 20% depending on the individual’s tax bracket. These amounts are noted below:
| Fund | Amount | |||
State Street Emerging Markets Equity Index Fund | $ | 474,050 | ||
Foreign Tax Credit
The Trust has made an election under Internal Revenue Code Section 853 to pass through foreign taxes paid by a Fund to its shareholders. For the year ended December 31, 2015, the total amount of foreign taxes that will be passed through are:
| Fund | Amount | |||
State Street Emerging Markets Equity Index Fund | $ | 93,094 | ||
30
Table of Contents
State Street Institutional Investment Trust
State Street Emerging Markets Equity Index Fund
Other Information — (continued)
December 31, 2015 (Unaudited)
The amount of foreign source income earned on the following Funds during the year ended December 31, 2015 were as follows:
| Fund | Amount | |||
State Street Emerging Markets Equity Index Fund | $ | 505,364 | ||
31
Table of Contents
State Street Institutional Investment Trust
State Street Emerging Markets Equity Index Fund
Shareholder Requests for Additional Information
December 31, 2015
Proxy Voting Policies and Procedures
The Fund has adopted the proxy voting policies of the Adviser. A description of the policies and procedures that the Fund has adopted to determine how to vote proxies relating to portfolio securities is contained in the Fund’s Statement of Additional Information, which is available (i) without charge, upon request, by calling the Fund at 1-877-251-4083, (ii) on the U.S. Securities and Exchange Commission’s website at www.sec.gov, or (iii) at the U.S. Securities and Exchange Commission’s public reference room. Information on the operation of the public reference room may be obtained by calling 1-800-SEC-0330. Information regarding how the Fund voted proxies, if any, during the most recent 12-month period ended June 30 is available by August 31 of each year without charge (1) by calling 1-877-251-4083 (toll free), or (2) on the website of the Securities and Exchange Commission (“SEC”) at www.sec.gov.
Quarterly Portfolio Schedule
The Fund files a complete schedule of portfolio holdings with the SEC for the first and third quarters of each fiscal year on Form N-Q. The Fund’s Forms N-Q are available on the SEC’s website at www.sec.gov and may be reviewed and copied at the SEC’s Public Reference Room in Washington, DC. Information on the operation of the Public Reference Room may be obtained by calling 1-800-SEC-0330. The information on Form N-Q is available upon request, without charge, by calling 1-877-521-4083 (toll-free).
32
Table of Contents
State Street Institutional Investment Trust
State Street Emerging Markets Equity Index Fund
Trustee Considerations in Approval of Investment Advisory Agreement
December 31, 2015
Overview of the Contract Review Process
Under the Investment Company Act of 1940, an investment advisory agreement between a mutual fund and its investment adviser must be approved by the fund’s board of trustees, including by a vote of a majority of those trustees who are not “interested persons” of the fund (the “Independent Trustees”) cast in-person at a meeting called for the purpose of considering such approval.
Consistent with these requirements, the Independent Trustees on the Board of Trustees (the “Board”) of the State Street Institutional Investment Trust (the “Trust”), met in-person on May 18-19, 2015 to consider proposals to approve, with respect to State Street Emerging Markets Equity Index Fund, a new series of the Trust (the “New Fund”), the investment advisory agreement (the “Advisory Agreement”) with SSGA Funds Management, Inc. (the “Adviser”). Prior to voting on the proposals, the Independent Trustees, as well as the Trustees who are “interested persons” of the Adviser, reviewed information furnished by the Adviser and others reasonably necessary to permit the Board to evaluate the proposals fully. The Independent Trustees were separately represented by co-counsel that is independent of the Adviser in connection with their consideration of approval of the Advisory Agreement with respect to the New Fund. The Independent Trustees considered, among other things, the following:
Information about Fees and Expenses
| • | A report prepared by an independent third-party provider of investment company data, which included for the New Fund: |
| • | Comparisons of the New Fund’s estimated expense ratio (with detail of component expenses) to the expense ratios of a group of comparable mutual funds selected by the independent third-party data provider; and |
| • | Comparisons of the New Fund’s contractual and estimated actual management fees to the contractual and actual management fees of comparable mutual funds. |
| • | Comparative information regarding fees charged by the Adviser for managing institutional accounts using investment strategies and techniques similar to those used in managing the New Fund, to the extent applicable. |
Information about Portfolio Management
| • | Descriptions of the investment management services to be provided by the Adviser, including its investment strategies and processes; |
| • | Information concerning the allocation of brokerage and the benefits to be received by the Adviser as a result of brokerage allocation, including information concerning the acquisition of any research through “soft dollar” benefits to be received in connection with the New Fund’s brokerage; and |
| • | Information regarding the procedures and processes to be used to value the assets of the New Fund and the assistance to be provided by the Adviser to its affiliates in monitoring the effectiveness of such procedures and processes. |
Information about the Adviser
| • | Reports detailing the financial results and condition of the Adviser and its affiliates; |
| • | Descriptions of the qualifications, education and experience of the individual investment professionals who will be responsible for managing the New Fund; |
33
Table of Contents
State Street Institutional Investment Trust
State Street Emerging Markets Equity Index Fund
Trustee Considerations in Approval of Investment Advisory Agreement — (continued)
December 31, 2015
| • | A copy of the Code of Ethics adopted by the Adviser, together with information relating to compliance with and the administration of such Code; |
| • | A copy of the Adviser’s proxy voting policies and procedures; |
| • | Information concerning the resources devoted by the Adviser to overseeing compliance by the New Fund and its service providers, including the Adviser’s record of compliance with investment policies and restrictions and other operating policies of the other funds in the fund complex (the “Other Funds”); |
| • | A description of the business continuity and disaster recovery plans of the Adviser; and |
| • | Information regarding the Adviser’s risk management processes. |
Other Relevant Information
| • | Information concerning the nature, quality and cost of various non-investment management services to be provided to the New Fund by the Adviser in its role as administrator, and by affiliates of the Adviser, including the custodian, sub-administrator, fund accountant, transfer agent and securities lending agent of the New Fund, and the role of the Adviser in managing the New Fund’s relationship with these affiliated service providers; |
| • | Copies of the Advisory Agreement and agreements with other service providers of the New Funds; |
| • | Draft responses to the letter dated March 11, 2015 from Joseph P. Barri, LLC (co-counsel along with the law firm of Sullivan & Worcester LLP (together, “Independent Counsel”) to the Independent Trustees reviewed prior to such date by Independent Counsel, requesting specific information regarding the Other Funds, certain of which was applicable to the New Funds, from each of: |
| • | The Adviser, with respect to its operations relating to the Other Funds and its approximate profit margins before taxes from such operations for the Other Funds’ last fiscal year; and the relevant operations of other affiliated service providers to the Other Funds, together with their approximate profit margins from such relevant operations for the Other Funds’ last fiscal year; |
| • | State Street Bank and Trust Company (“State Street”), the sub-administrator, custodian, transfer agent, and securities lending agent for the Other Funds, with respect to its operations relating to the Other Funds; and |
| • | State Street Global Markets, LLC, the principal underwriter and distributor of the shares of the Other Funds (the “Distributor”), with respect to its operations relating to the Other Funds, together with the Other Funds’ related distribution plans and arrangements under SEC Rule 12b-1. |
In addition to the information identified above, the Board considered information provided by the Adviser and other service providers of the New Fund throughout the year at meetings of the Board and its committees. At such meetings, the Trustees received, among other things, presentations by the portfolio managers and other investment professionals of the Adviser relating to the performance of the Other Funds and the investment strategies used in pursuing the Other Fund’s investment objective.
The Independent Trustees were assisted throughout the contract review process by their independent legal counsel. The Independent Trustees relied upon the advice of such counsel and their own business judgment in determining the material factors to be considered in evaluating the Advisory Agreement, and the weight to be given to each such factor. The conclusions reached with respect to the Advisory Agreement were based on a comprehensive evaluation of all the information provided and not any single
34
Table of Contents
State Street Institutional Investment Trust
State Street Emerging Markets Equity Index Fund
Trustee Considerations in Approval of Investment Advisory Agreement — (continued)
December 31, 2015
factor. Moreover, each Trustee may have placed varying emphasis on particular factors in reaching conclusions with respect to the New Fund.
Results of the Process
Based on a consideration of the foregoing and such other information as deemed relevant, including the factors and conclusions described below, on May 18-19, 2015 the Board, including a majority of the Independent Trustees, voted to approve the Advisory Agreement with respect to the New Fund.
Nature, Extent and Quality of Services
In considering whether to approve the Advisory Agreement, the Board evaluated the nature, extent and quality of services to be provided to the New Fund by the Adviser.
The Board considered the Adviser’s management capabilities and investment process with respect to the types of investments to be held by the New Fund, including the education, experience and number of investment professionals and other personnel who will provide portfolio management, investment research, and similar services to the New Fund. The Board evaluated, where relevant, the abilities and experience of such investment personnel in analyzing particular markets, industries and specific issuers of securities in these markets and industries. The Board also took into account the compensation paid to recruit and retain investment personnel, and the time and attention to be devoted to the New Fund by senior management.
The Board reviewed the compliance programs of the Adviser and various affiliated service providers. Among other things, the Board considered compliance and reporting matters relating to personal trading by investment personnel, selective disclosure of portfolio holdings, late trading, frequent trading, portfolio valuation, business continuity, the allocation of investment opportunities and the voting of proxies. The Board also considered the role of the Adviser in monitoring the New Fund’s securities lending activities.
On the basis of the foregoing and other relevant information, the Board concluded that the Adviser can be expected to provide high quality investment management and related services for the New Fund.
Fund Performance
Because the New Fund has not yet commenced operations, the Board noted that they could not draw any conclusions regarding the performance of the New Fund. The Board, however, considered, at this and at prior meetings, the performance of other comparable funds or accounts, if any, managed by the Adviser and the performance of their respective benchmarks and/or peer groups. The Board also noted that it reviews at its regularly scheduled meetings information about the performance of the Other Funds and is generally satisfied with the performance of these Other Funds.
Management Fees and Expenses
The Board reviewed the contractual management fee rate to be payable by the New Fund and the actual management fee rate to be payable by the New Fund, net of waivers. As part of its review, the Board considered the New Fund’s management fee and total expense ratio (both before and after giving effect to any expense caps), as compared to a group of similarly managed funds selected by an independent third-party provider of investment company data. The Board also considered the comparability of the fees to be charged and the services to be provided to the New Fund by the Adviser to the fees charged and services provided to other clients of the Adviser, including institutional accounts, to the extent applicable. In addition, the Board considered that the Adviser agreed to waive fees or pay expenses of
35
Table of Contents
State Street Institutional Investment Trust
State Street Emerging Markets Equity Index Fund
Trustee Considerations In Approval of Investment Advisory Agreement — (continued)
December 31, 2015
the New Fund to limit the total expenses borne by the New Fund’s shareholders. Among other information, the Board considered the following expense information in its evaluation of the New Fund:
The Board considered that the New Fund’s contractual management fee was below the median of its respective Expense Group. The Board also considered that State Street Emerging Markets Equity Index Fund’s expected actual management fee was below the medians of the Expense Group and Expense Universe. The Board also considered that State Street Emerging Markets Equity Index Fund’s expected total expenses were above the median of the Expense Group and below the median of the Expense Universe.
Profitability
Because the New Fund has not yet commenced operations, the Board noted that they could not draw any conclusions regarding the profitability of the New Fund. The Board, however, reviewed the level of profits realized by the Adviser and its affiliates in providing investment advisory and other services to the Other Funds. The Board considered other direct and indirect benefits received by the Adviser and the affiliated service providers in connection with their relationships with the Other Funds, including the benefits of research services that may be available to the Adviser as a result of securities transactions effected for the Other Funds and other investment advisory clients, together with the ranges of profitability of each of the affiliated service providers with respect to their services to the Other Funds.
The Board concluded that the expected profitability of the Adviser with respect to New Fund, and the expected profitability range of each of the affiliated service providers with respect to its services to the New Fund, was expected to be reasonable in relation to the services provided.
Economies of Scale
In reviewing expected management fees and anticipated profitability, the Board also considered the extent to which the Adviser and its affiliates, on the one hand, and the New Fund, on the other hand, can expect to realize benefits from economies of scale as the New Fund’s assets increase. The Board acknowledged the difficulty in accurately measuring the expected benefits resulting from the economies of scale with respect to the management of the New Fund in view of the fact that the New Fund has not yet commenced operations. The Board concluded that, in light of the fact that the New Fund has not yet commenced operations, and the comparatively low management fees and expense ratios of the New Fund, it does not appear that the Adviser or its affiliates are expected to realize benefits from economies of scale in managing the assets of the New Fund to such an extent that the proposed advisory fees should be reduced or that breakpoints in such fees should be implemented for the New Fund at this time.
Conclusions
In reaching its decision to approve the Advisory Agreement, the Board did not identify any single factor as being controlling, but based its recommendation on each of the factors it considered. Each Trustee may have contributed different weight to the various factors. Based upon the materials reviewed, the representations made and the considerations described above, and as part of their deliberations, the Board, including the Independent Trustees, concluded that the Adviser possesses the capability and resources to perform the duties required of it under the Advisory Agreement.
Further, based upon its review of the Advisory Agreement, the materials provided, and the considerations described above, the Board, including the Independent Trustees, concluded that (1) the terms of the Advisory Agreement are reasonable, fair, and in the best interests of the New Fund and its shareholders, and (2) the rates to be payable under the Advisory Agreement are fair and reasonable in light of the usual and customary charges made for services of the same nature and quality.
36
Table of Contents
State Street Institutional Investment Trust
State Street Emerging Markets Equity Index Fund
Disclosure of Information about Fund Trustees and Officers
December 31, 2015 (Unaudited)
Name, Address, and Year of Birth | Position(s) Held | Term of Office | Principal Occupation During Past Five Years and Relevant Experience | Number of Funds in Fund Complex Overseen by Trustee | Other Directorships | |||||
Independent Trustees | ||||||||||
Michael F. Holland State Street Bank and 100 Huntington Avenue, CPH 0326 Boston, MA 02116 YOB: 1944 | Trustee and Co-Chairman of the Board | Term: Indefinite Elected: 7/99 | Chairman, Holland & Company L.L.C. (investment adviser) (1995 – present). | 75 | Director, the Holland Series Fund, Inc.; Director, The China Fund, Inc.; Director, The Taiwan Fund, Inc.; Director, Reaves Utility Income Fund, Inc.; and Director, Blackstone/GSO Loan Funds. | |||||
Patrick J. Riley State Street Bank and 100 Huntington Avenue, CPH 0326 Boston, MA 02116 YOB: 1948 | Trustee and Co-Chairman of the Board | Term: Indefinite Elected: 1/14 | 2002 to May 2010, Associate Justice of the Superior Court, Commonwealth of Massachusetts; 1985 to 2002, Partner, Riley, Burke & Donahue, L.L.P. (law firm); 1998 to Present, Independent Director, State Street Global Advisers Ireland, Ltd. (investment company); 1998 to Present, Independent Director, SSGA Liquidity plc (formerly, SSGA Cash Management Fund plc); January 2009 to Present, Independent Director, SSGA Fixed Income plc; and January 2009 to Present, Independent Director, SSGA Qualified Funds PLC. | 75 | Board Director and Chairman, SPDR Europe 1PLC Board (2011 – Present); Board Director and Chairman, SPDR Europe II, PLC (2013 – Present). | |||||
William L. Boyan State Street Bank and 100 Huntington Avenue, CPH 0326 Boston, MA 02116 YOB: 1937 | Trustee and Co-Chairman of the Valuation Committee | Term: Indefinite Elected: 7/99 | President and Chief Operations Officer, John Hancock Financial Services (1959 – 1999). Mr. Boyan retired in 1999. Chairman Emeritus, Children’s Hospital, Boston, MA (1984 – 2011); Former Trustee of Old Mutual South Africa Master Trust (investments) (1995 – 2008); Former Chairman, Boston Plan For Excellence, Boston Public Schools (1995 – 2010); Member of Advisory Board of Florida Atlantic University Lifelong Learning Society. | 75 | Former Trustee of Old Mutual South Africa Master Trust. | |||||
William L. Marshall State Street Bank and 100 Huntington Avenue, CPH 0326 Boston, MA 02116 YOB: 1942 | Trustee and Co-Chairman of the Audit Committee | Term: Indefinite Elected: 1/14 | April 2011 to Present, Chairman (until April 2011, Chief Executive Officer and President), Wm. L. Marshall Associates, Inc., Wm. L. Marshall Companies, Inc. and the Marshall Financial Group, Inc. (a registered investment adviser and provider of financial and related consulting services); Certified Financial Planner; Member, Financial Planners Association; 2015 to present, Board Member, The Doylestown Health Foundation Board. | 75 | Marshall Financial Group, Inc. |
37
Table of Contents
State Street Institutional Investment Trust
State Street Emerging Markets Equity Index Fund
Disclosure of Information about Fund Trustees and Officers — (continued)
December 31, 2015 (Unaudited)
Name, Address, and Year of Birth | Position(s) Held | Term of Office | Principal Occupation During Past Five Years and Relevant Experience | Number of Funds in Fund Complex Overseen by Trustee | Other Directorships | |||||
Independent Trustees (continued) | ||||||||||
Richard D. Shirk State Street Bank and 100 Huntington Avenue, CPH 0326 Boston, MA 02116 YOB: 1945 | Trustee and Co-Chairman of the Qualified Legal and Compliance Committee | Term: Indefinite Elected: 1/14 | March 2001 to April 2002, Chairman (1996 to March 2001, President and Chief Executive Officer), Cerulean Companies, Inc. (holding company) (Retired); 1992 to March 2001, President and Chief Executive Officer, Blue Cross Blue Shield of Georgia (health insurer, managed healthcare); 1998 to December 2008, Chairman, Board Member and December 2008 to Present, Investment Committee Member, Healthcare Georgia Foundation (private foundation); September 2002 to 2012, Lead Director and Board Member, Amerigroup Corp. (managed health care); 1999 to 2013, Board Member and (since 2001) Investment Committee Member, Woodruff Arts Center; and 2003 to 2009, Trustee, Gettysburg College. | 75 | Board member, AeroCare Holdings (privately held healthcare services company) (February 2003 – Present); Board member, Regenesis Biomedical (health care services) (April 2012 – Present); Chairman (January 2014 – Present). | |||||
Rina K. Spence State Street Bank and 100 Huntington Avenue, CPH 0326 Boston, MA 02116 YOB: 1948 | Trustee and Co-Chairman of the Qualified Legal and Compliance Committee and Co-Chairman of the Governance Committee | Term: Indefinite Elected: 7/99 | President of SpenceCare International LLC (international healthcare consulting) (1999 – present); Chief Executive Officer, IEmily.com (health internet company) (2000 – 2001); Chief Executive Officer of Consensus Pharmaceutical, Inc. (1998 – 1999); Founder, President and Chief Executive Officer of Spence Center for Women’s Health (1994 – 1998); President and CEO Emerson Hospital (1984 – 1994); Trustee, Eastern Enterprise (utilities) (1988 – 2000); Director, Berkshire Life Insurance Company of America (1993 – 2009); Honorary Consul for Monaco in Boston (2015 – present). | 75 | ||||||
Bruce D. Taber State Street Bank and 100 Huntington Avenue, CPH 0326 Boston, MA 02116 YOB: 1943 | Trustee and Co-Chairman of the Valuation Committee and Co-Chairman of the Governance Committee | Term: Indefinite Elected: 1/14 | 1999 to Present, Partner, Zenergy LLC (a technology company providing Computer Modeling and System Analysis to the General Electric Power Generation Division); Until December 2008, Independent Director, SSGA Cash Management Fund plc; Until December 2008, Independent Director, State Street Global Advisers Ireland, Ltd. (investment companies); and Until August 1994, President, Alonzo B. Reed, Inc., (a Boston architect-engineering firm). | 75 | ||||||
38
Table of Contents
State Street Institutional Investment Trust
State Street Emerging Markets Equity Index Fund
Disclosure of Information about Fund Trustees and Officers — (continued)
December 31, 2015 (Unaudited)
Name, Address, and Year of Birth | Position(s) Held | Term of Office | Principal Occupation During Past Five Years and Relevant Experience | Number of Funds in Fund Complex Overseen by Trustee | Other Directorships | |||||
Independent Trustees (continued) | ||||||||||
Douglas T. Williams State Street Bank and Trust Company 100 Huntington Avenue, CPH 0326 Boston, MA 02116 YOB: 1940 | Trustee and Co-Chairman of the Audit Committee | Term: Indefinite Elected: 7/99 | President, Oakmont Homeowners Association; President, Mariner Sands Chapel; Executive Vice President and member of Executive Committee, Chase Manhattan Bank (1987 – 1999); President, Boston Stock Exchange Depository Trust Company, 1981 – 1982; Treasurer, Nantucket Educational Trust, (2002 – 2007). | 75 | ||||||
Interested Trustee(1) | ||||||||||
James E. Ross SSGA Funds Management, Inc. State Street Financial Center One Lincoln Street Boston, MA 02111 YOB: 1965 | Trustee | Term: Indefinite Elected Trustee: 2/07 | Chairman and Director, SSGA Funds Management, Inc. (2012 – present); President, SSGA Funds Management, Inc. (2005 – 2012); Executive Vice President and Senior Managing Director, State Street Global Advisors (2006 – present); and Principal, State Street Global Advisors (2006 – present). | 290 | Trustee, SPDR Series Trust; Trustee, SPDR Index Shares Funds; Trustee, Select Sector SPDR Trust; Trustee, SSGA Active Trust; and Trustee, SSGA Master Trust. | |||||
| (1) | Mr. Ross is an Interested Trustee because of his employment by SSGA Funds Management, Inc., an affiliate of the Trust. |
Name, Address, and Year of Birth | Position(s) Held | Term of Office | Principal Occupation | |||
Officers: | ||||||
Ellen M. Needham SSGA Funds Management, Inc. State Street Financial Center One Lincoln Street Boston, MA 02111 YOB: 1967 | President | Term: Indefinite Elected: 10/12 | President and Director, SSGA Funds Management, Inc. (June 2012 – present); Chief Operating Officer, SSGA Funds Management, Inc. (May 2010 – June 2012); Senior Managing Director, SSGA Funds Management, Inc. (1992 – 2012) and Senior Managing Director, State Street Global Advisors (1992 – present).* | |||
Bruce S. Rosenberg SSGA Funds Management, Inc. State Street Financial Center One Lincoln Street Boston, MA 02111 YOB: 1961 | Treasurer | Term: Indefinite Elected: 2/16 | Managing Director, State Street Global Advisors and SSGA Funds Management, Inc. (July 2015 – present); Director, Credit Suisse (April 2008 – July 2015). | |||
Ann M. Carpenter SSGA Funds Management, Inc. State Street Financial Center One Lincoln Street Boston, MA 02111 YOB: 1966 | Vice President
Deputy Treasurer | Term: Indefinite Elected: 10/12
Term: Indefinite Elected: 2/16 | Chief Operating Officer, SSGA Funds Management, Inc. (April 2014 – present); Vice President, SSGA Funds Management, Inc. (2008 – present); Principal, State Street Global Advisors and SSGA Funds Management, Inc. (2005 – present).* | |||
Chad C. Hallett SSGA Funds Management, Inc. State Street Financial Center One Lincoln Street Boston, MA 02111 YOB: 1969 | Deputy Treasurer | Term: Indefinite Elected: 2/16 | Vice President, State Street Global Advisors and SSGA Funds Management, Inc. (November 2014 – present); Vice President, State Street Bank and Trust Company (2001 – November 2014).* |
39
Table of Contents
State Street Institutional Investment Trust
State Street Emerging Markets Equity Index Fund
Disclosure of Information about Fund Trustees and Officers — (continued)
December 31, 2015 (Unaudited)
Name, Address, and Year of Birth | Position(s) Held | Term of Office | Principal Occupation | |||
Officers: (continued) | ||||||
Sujata Upreti SSGA Funds Management, Inc. State Street Financial Center One Lincoln Street Boston, MA 02111 YOB: 1974 | Assistant Treasurer | Term: Indefinite Elected: 2/16 | Vice President, State Street Global Advisors and SSGA Funds Management, Inc. (May 2015 – present); Assistant Director, Cambridge Associates, LLC (July 2014 – January 2015); Vice President, Bank of New York Mellon (July 2012 – August 2013); Manager, PricewaterhouseCoopers, LLP (September 2009 – July 2012). | |||
Daniel Foley SSGA Funds Management, Inc. State Street Financial Center One Lincoln Street Boston, MA 02111 YOB: 1972 | Assistant Treasurer | Term: Indefinite Elected: 2/16 | Vice President, State Street Global Advisors and SSGA Funds Management, Inc. (April 2014 – present); Principal, State Street Global Advisors and SSGA Funds Management, Inc. (April 2007 – April 2014). | |||
Brian Harris SSGA Funds Management, Inc. State Street Financial Center One Lincoln Street Boston, MA 02111 YOB: 1973 | Chief Compliance Officer | Term: Indefinite Elected: 11/13 | Vice President, State Street Global Advisors and SSGA Funds Management, Inc.( June 2013 – Present); Senior Vice President and Global Head of Investment Compliance, BofA Global Capital Management (September 2010 to May 2013); Director of Compliance, AARP Financial Inc. (July 2008 to August 2010). | |||
Trevor Swanberg SSGA Funds Management, Inc. State Street Financial Center One Lincoln Street Boston, MA 02111 YOB: 1979 | Code of Ethics Compliance Officer | Term: Indefinite Elected: 8/15 | Vice President, State Street Global Advisors and SSGA Funds Management, Inc. (January 2015 – Present); Senior Manager-Mutual Fund Compliance, ICMA-Retirement Corporation (December 2011 – January 2015); Assistant Vice President, J.P. Morgan (September 2007 – December 2011). | |||
Joshua A. Weinberg SSGA Funds Management, Inc. State Street Financial Center One Lincoln Street Boston, MA 02111 YOB: 1978 | Chief Legal Officer | Term: Indefinite Elected: 2/15 | Vice President and Managing Counsel, State Street Global Advisors (2011 – present); Clerk, SSGA Funds Management, Inc. (2013 – present); Associate, Financial Services Group, Dechert LLP (2006 – 2011). | |||
David K. James State Street Bank and Trust Company 100 Huntington Avenue, 3rd Floor Boston, MA 02116 YOB: 1970 | Secretary | Term: Indefinite Elected: 4/13 | Managing Director and Managing Counsel, State Street Bank and Trust Company (2009 – present); Vice President and Counsel, PNC Global Investment Servicing (US), Inc. (2006 – 2009). | |||
Kristin Schantz State Street Bank and Trust Company 100 Huntington Avenue, 3rd Floor Boston, MA 02116 YOB: 1979 | Assistant Secretary | Term: Indefinite Elected: 2/14 | Vice President and Counsel, State Street Bank and Trust Company (2013 – present); Vice President, Citi Fund Services Ohio, Inc. (2008 – 2013). |
| * | Served in various capacities and/or with various affiliated entities during noted time period. |
40
Table of Contents
Trustees
William L. Boyan
Michael F. Holland
William L. Marshall
Patrick J. Riley
James E. Ross
Richard D. Shirk
Rina K. Spence
Bruce D. Taber
Douglas T. Williams
Investment Adviser and Administrator
SSGA Funds Management, Inc.
State Street Financial Center
One Lincoln Street
Boston, MA 02111
Custodian and Sub-Administrator
State Street Bank and Trust Company
State Street Financial Center
One Lincoln Street
Boston, MA 02111
Independent Registered Public Accounting Firm
Ernst & Young LLP
200 Clarendon Street
Boston, MA 02116
Legal Counsel
Ropes & Gray LLP
800 Boylston Street
Boston, MA 02199
Transfer Agent
Boston Financial Data Services
2000 Crown Colony Drive
Quincy, MA 02169
Distributor
State Street Global Markets LLC
State Street Financial Center
One Lincoln Street
Boston, MA 02111
This report is for shareholder information. This is not a prospectus intended for use in the purchase or sale of shares of beneficial interest.
State Street Institutional Investment Trust State Street Bank and Trust Company P.O. Box 5049 Boston, MA 02206 | IBG-18498 |
Table of Contents
Annual Report
31 December 2015
State Street Institutional Investment Trust
State Street Hedged International Developed Equity Index Fund

Table of Contents
State Street Institutional Investment Trust
State Street Hedged International Developed Equity Index Fund
Annual Report
December 31, 2015
| 1 | ||||
| 3 | ||||
| 4 | ||||
| 20 | ||||
| 21 | ||||
| 22 | ||||
| 23 | ||||
| 24 | ||||
| 36 | ||||
| 37 | ||||
| 39 | ||||
| 40 | ||||
Table of Contents
State Street Hedged International Developed Equity Index Fund
MANAGEMENT DISCUSSION OF FUND PERFORMANCE
The State Street Hedged International Developed Equity Index Fund (the “Fund”) seeks to provide investment results that, before fees and expenses, correspond generally to the total return performance of the MSCI EAFE (Europe, Australasia, Far East) 100% Hedged to USD Index (the “Index”), a broad-based developed market (ex-U.S. and Canada) large and mid-capitalization equity index, hedged to the U.S. dollar, over the long term.
For the period from May 29, 2015 (inception) to December 31, 2015 (the “Reporting Period”), the total return for the Fund was –9.01%, and the total return for the Index was –7.55%. The Fund and Index returns reflect the reinvestment of dividends and other income. The Fund’s performance reflects the expenses of managing the Fund, including brokerage and advisory expenses. The Index is unmanaged and Index returns do not reflect fees and expenses of any kind, which would have a negative impact on returns. The cumulative effect of small weight differences between the securities in the Fund and the Index, the Fund’s cash flows and fair value pricing contributed to the difference between the Fund’s performance and that of the Index.
The Fund underperformed the Index during the Reporting Period. The Fund had negative performance in June and during the third calendar quarter. The underperformance of the Fund and the Index was driven by several factors including concerns about a global economic slowdown, disappointing macro data, Chinese Yuan devaluations and uncertainty around the direction the U.S. Federal Reserve (the “Fed”) will take on interest rates. The markets were also weighed down by Volkswagen’s emissions scandal, coordinated Islamic terrorist attacks across four countries and scrutiny by U.S. lawmakers regarding the pricing practices of drug makers. Positive factors like a Greek bailout plan, a nuclear deal with Iran and positive macro and earnings data could not offset the negative factors. Both the Fund and the Index had positive performance during the fourth calendar quarter with contributing factors being accommodative monetary policy (a Chinese interest rate cut, quantitative easing by the European Central Bank and a gradual pace of interest rate increases by the Fed) and good earnings reports from companies in key industries. These factors helped push positive performance despite the plunge in oil prices and the terrorist attacks in Paris.
On an individual security level, the top positive contributors to the Fund’s performance were SABMiller PLC, Allianz SE, and SAP SE. The top negative contributors to the Fund’s performance were Novartis AG, Banco Santander SA, and Glencore PLC.
The views expressed above reflect those of the Fund’s portfolio manager only through the Reporting Period and do not necessarily represent the views of the Adviser as a whole. Any such views are subject to change at any time based upon market or other conditions, and the Adviser disclaims any responsibility to update such views. These views may not be relied on as investment advice and, because investment decisions for a fund are based on numerous factors, may not be relied on as an indication of trading intent on behalf of any fund.
1
Table of Contents
State Street Hedged International Developed Equity Index Fund
Class K
Growth of a $10,000 Investment (a)
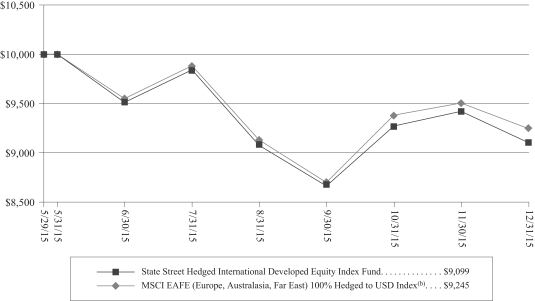
Investment Performance (a)
For the Year Ended December 31, 2015
| Total Return Six Months Ended December 31, 2015 | Total Return Cumulative Inception to Date December 31, 2015 | |||||||
State Street Hedged International Developed Equity Index Fund Class K | –4.32 | % | –9.01 | % | ||||
MSCI EAFE 100% Hedged to USD Index(b) | –3.18 | % | –7.55 | % | ||||
| (a) | Total returns and performance graph information represent past performance and are not indicative of future results, which may be lower or higher than performance data quoted. Investment return and principal value of an investment will fluctuate so that an investor’s share, when redeemed, may be worth more or less than its original cost. The graph and table above do not reflect the deduction of taxes that a shareholder would pay on fund distributions, sales, or the redemption of fund shares. |
| (b) | The MSCI EAFE (Europe, Australasia, Far East) 100% Hedged to USD Index represents a close estimation of the performance that can be achieved by hedging the currency exposures of its parent index, the MSCI EAFE Index, to the USD, the “home” currency for the hedged index. The index is 100% hedged to the USD by selling each foreign currency forward at the one-month Forward weight. The parent index is composed of large and mid cap stocks across 21 developed markets countries and its local performance is calculated in 13 different currencies, including the Euro. |
2
Table of Contents
State Street Institutional Investment Trust
State Street Hedged International Developed Equity Index Fund
Portfolio Statistics (Unaudited)
Portfolio Composition* | December 31, 2015 | |||
Common Stocks | 93.5 | % | ||
Rights | 0.0 | ** | ||
Short-Term Investment | 3.2 | |||
Other Assets in Excess of Liabilities | 3.3 | |||
Total | 100.0 | % |
| ** | Less than 0.05% of net assets. |
Top Five Sectors (excluding short-term investment)* | December 31, 2015 | |||
Banks | 12.0 | % | ||
Pharmaceuticals | 9.2 | |||
Insurance | 6.0 | |||
Oil, Gas & Consumable Fuels | 4.1 | |||
Automobiles | 4.2 | |||
Total | 35.5 | % |
| * | As a percentage of net assets as of the date indicated. The Portfolio’s composition will vary over time. |
See accompanying notes to financial statements.
3
Table of Contents
State Street Institutional Investment Trust
State Street Hedged International Developed Equity Index Fund
December 31, 2015
Security Description | Shares | Value | ||||||
COMMON STOCKS – 93.5% | ||||||||
Australia – 6.4% | ||||||||
AGL Energy, Ltd.(a) | 52,798 | $ | 689,778 | |||||
Alumina, Ltd.(a) | 208,096 | 173,391 | ||||||
Amcor, Ltd.(a) | 90,931 | 882,022 | ||||||
AMP, Ltd.(a) | 209,671 | 882,050 | ||||||
APA Group(a) | 88,028 | 553,030 | ||||||
Aristocrat Leisure, Ltd.(a) | 41,151 | 303,375 | ||||||
Asciano, Ltd.(a) | 38,623 | 245,166 | ||||||
ASX, Ltd.(a) | 13,143 | 403,713 | ||||||
Aurizon Holdings, Ltd.(a) | 141,671 | 449,038 | ||||||
AusNet Services(a) | 155,716 | 167,372 | ||||||
Australia & New Zealand Banking Group, Ltd.(a) | 210,775 | 4,246,680 | ||||||
Bank of Queensland, Ltd.(a) | 23,954 | 241,258 | ||||||
Bendigo & Adelaide Bank, Ltd.(a) | 38,352 | 331,215 | ||||||
BHP Billiton PLC(a) | 150,786 | 1,681,195 | ||||||
BHP Billiton, Ltd.(a) | 236,441 | 3,038,090 | ||||||
Boral, Ltd.(a) | 54,063 | 230,784 | ||||||
Brambles, Ltd.(a) | 119,169 | 996,453 | ||||||
Caltex Australia, Ltd.(a) | 19,267 | 525,808 | ||||||
Challenger, Ltd.(a) | 34,708 | 218,398 | ||||||
CIMIC Group, Ltd.(a) | 9,421 | 165,000 | ||||||
Coca-Cola Amatil, Ltd.(a) | 45,593 | 306,946 | ||||||
Cochlear, Ltd.(a) | 3,492 | 241,270 | ||||||
Commonwealth Bank of Australia(a) | 123,892 | 7,647,471 | ||||||
Computershare, Ltd.(a) | 37,057 | 311,325 | ||||||
Crown Resorts, Ltd.(a) | 25,600 | 231,013 | ||||||
CSL, Ltd.(a) | 34,296 | 2,610,589 | ||||||
Dexus Property Group REIT(a) | 62,741 | 339,781 | ||||||
DUET Group(a) | 141,408 | 233,823 | ||||||
Flight Centre Travel Group, Ltd.(a) | 2,958 | 85,176 | ||||||
Fortescue Metals Group, Ltd.(a) | 101,947 | 136,978 | ||||||
Goodman Group REIT(a) | 125,820 | 569,247 | ||||||
GPT Group REIT(a) | 119,819 | 414,302 | ||||||
Harvey Norman Holdings, Ltd.(a) | 43,022 | 129,847 | ||||||
Healthscope, Ltd.(a) | 105,702 | 203,370 | ||||||
Iluka Resources, Ltd.(a) | 20,227 | 89,331 | ||||||
Incitec Pivot, Ltd.(a) | 132,647 | 378,432 | ||||||
Insurance Australia Group, Ltd.(a) | 172,929 | 693,389 | ||||||
LendLease Group(a) | 42,024 | 432,900 | ||||||
Macquarie Group, Ltd.(a) | 22,546 | 1,346,639 | ||||||
Medibank Pvt, Ltd.(a) | 228,612 | 355,915 | ||||||
Mirvac Group REIT(a) | 264,118 | 377,499 | ||||||
National Australia Bank, Ltd.(a) | 192,502 | 4,194,114 | ||||||
Newcrest Mining, Ltd.(a)(b) | 52,171 | 492,875 | ||||||
Oil Search, Ltd.(a) | 103,204 | 501,537 | ||||||
Orica, Ltd.(a) | 29,191 | 326,531 | ||||||
Origin Energy, Ltd.(a) | 134,369 | 453,817 | ||||||
Platinum Asset Management, Ltd.(a) | 15,476 | 90,290 | ||||||
Qantas Airways, Ltd.(a)(b) | 27,696 | 81,963 | ||||||
QBE Insurance Group, Ltd.(a) | 96,303 | 874,511 | ||||||
Ramsay Health Care, Ltd.(a) | 10,075 | 494,628 | ||||||
REA Group, Ltd.(a) | 4,571 | 181,584 | ||||||
Santos, Ltd.(a) | 138,560 | 368,467 | ||||||
Scentre Group REIT(a) | 403,588 | 1,222,209 | ||||||
SEEK, Ltd.(a) | 22,909 | 254,578 | ||||||
Sonic Healthcare, Ltd.(a) | 26,969 | 348,621 | ||||||
South32, Ltd.(a)(b) | 330,544 | 253,523 | ||||||
Stockland REIT(a) | 169,292 | 501,747 | ||||||
Suncorp Group, Ltd.(a) | 98,538 | 863,798 | ||||||
Sydney Airport(a) | 84,099 | 386,440 | ||||||
Tabcorp Holdings, Ltd.(a) | 50,104 | 170,326 | ||||||
Tatts Group, Ltd.(a) | 102,495 | 324,896 | ||||||
Telstra Corp., Ltd.(a) | 321,485 | 1,304,355 | ||||||
TPG Telecom, Ltd.(a) | 16,124 | 115,260 | ||||||
Transurban Group(b)(c) | 6,250 | 47,609 | ||||||
Transurban Group Stapled Security(a)(c) | 137,870 | 1,043,400 | ||||||
Treasury Wine Estates, Ltd.(a) | 58,425 | 350,238 | ||||||
Vicinity Centres REIT(a) | 268,021 | 542,870 | ||||||
Wesfarmers, Ltd.(a) | 83,007 | 2,498,552 | ||||||
Westfield Corp.(a) | 143,306 | 984,377 | ||||||
Westpac Banking Corp.(a) | 242,794 | 5,875,983 | ||||||
Woodside Petroleum, Ltd.(a) | 56,016 | 1,165,193 | ||||||
Woolworths, Ltd.(a) | 90,551 | 1,604,067 | ||||||
|
| |||||||
| 61,477,418 | ||||||||
|
| |||||||
Austria – 0.2% | ||||||||
Andritz AG(a) | 5,484 | 266,786 | ||||||
Erste Group Bank AG(a)(b) | 21,831 | 682,811 | ||||||
OMV AG(a) | 11,287 | 320,251 | ||||||
Raiffeisen Bank International AG(a)(b) | 10,655 | 156,087 | ||||||
Voestalpine AG(a) | 6,955 | 212,653 | ||||||
|
| |||||||
| 1,638,588 | ||||||||
|
| |||||||
Belgium – 1.3% | ||||||||
Ageas(a) | 15,545 | 721,205 | ||||||
Anheuser-Busch InBev SA(a) | 58,662 | 7,297,296 | ||||||
Colruyt SA(a) | 5,609 | 288,426 | ||||||
Delhaize Group(a) | 7,334 | 713,497 | ||||||
Groupe Bruxelles Lambert SA(a) | 5,764 | 493,006 | ||||||
KBC Groep NV(a) | 19,013 | 1,188,318 | ||||||
Proximus SADP(a) | 10,402 | 338,350 | ||||||
Solvay SA(a) | 5,796 | 618,346 | ||||||
Telenet Group Holding NV(a)(b) | 2,978 | 160,877 | ||||||
UCB SA(a) | 9,671 | 872,573 | ||||||
Umicore SA(a) | 6,161 | 258,262 | ||||||
|
| |||||||
| 12,950,156 | ||||||||
|
| |||||||
Chile – 0.0%(d) | ||||||||
Antofagasta PLC(a) | 23,448 | 161,261 | ||||||
|
| |||||||
China – 0.0%(d) | ||||||||
Yangzijiang Shipbuilding Holdings, Ltd.(a) | 101,000 | 77,989 | ||||||
|
| |||||||
Denmark – 1.8% | ||||||||
AP Moeller – Maersk A/S Class A(a) | 240 | 308,934 | ||||||
AP Moeller – Maersk A/S Class B(a) | 497 | 647,994 | ||||||
Carlsberg A/S Class B(a) | 8,254 | 730,959 | ||||||
Chr Hansen Holding A/S(a) | 7,451 | 465,886 | ||||||
Coloplast A/S Class B(a) | 8,618 | 695,529 | ||||||
Danske Bank A/S(a) | 52,878 | 1,418,301 | ||||||
DSV A/S(a) | 12,939 | 509,134 | ||||||
ISS A/S(a) | 11,524 | 415,245 | ||||||
See accompanying notes to financial statements.
4
Table of Contents
State Street Institutional Investment Trust
State Street Hedged International Developed Equity Index Fund
Schedule of Investments — (continued)
December 31, 2015
Security Description | Shares | Value | ||||||
COMMON STOCKS – (continued) |
| |||||||
Denmark – (continued) |
| |||||||
Novo Nordisk A/S Class B(a) | 142,843 | $ | 8,267,224 | |||||
Novozymes A/S Class B(a) | 16,374 | 783,671 | ||||||
Pandora A/S(a) | 8,004 | 1,008,793 | ||||||
TDC A/S(a) | 63,200 | 314,556 | ||||||
Tryg A/S(a) | 9,323 | 185,193 | ||||||
Vestas Wind Systems A/S(a) | 16,999 | 1,186,740 | ||||||
William Demant Holding A/S(a)(b) | 1,568 | 149,302 | ||||||
|
| |||||||
| 17,087,461 | ||||||||
|
| |||||||
Finland – 0.8% | ||||||||
Elisa Oyj(a) | 10,089 | 379,440 | ||||||
Fortum Oyj(a) | 32,968 | 496,504 | ||||||
Kone Oyj Class B(a) | 25,477 | 1,078,277 | ||||||
Metso Oyj(a) | 6,873 | 153,893 | ||||||
Neste Oyj(a) | 9,786 | 291,951 | ||||||
Nokia Oyj(a) | 275,331 | 1,947,027 | ||||||
Nokian Renkaat Oyj(a) | 7,047 | 251,483 | ||||||
Orion Oyj Class B(a) | 8,154 | 281,997 | ||||||
Sampo Oyj Class A(a) | 31,914 | 1,619,993 | ||||||
Stora Enso Oyj Class R(a) | 35,871 | 324,216 | ||||||
UPM-Kymmene Oyj(a) | 38,386 | 712,353 | ||||||
Wartsila Oyj Abp(a) | 10,605 | 484,002 | ||||||
|
| |||||||
| 8,021,136 | ||||||||
|
| |||||||
France – 9.1% | ||||||||
Accor SA(a) | 15,131 | 655,051 | ||||||
Aeroports de Paris(a) | 1,846 | 214,727 | ||||||
Air Liquide SA(a) | 25,340 | 2,843,656 | ||||||
Airbus Group SE(a) | 43,480 | 2,928,788 | ||||||
Alcatel-Lucent(b) | 194,764 | 772,238 | ||||||
Alstom SA(a)(b) | 14,697 | 448,732 | ||||||
Arkema SA(a) | 4,233 | 296,181 | ||||||
Atos SE(a) | 5,902 | 495,282 | ||||||
AXA SA(a) | 143,440 | 3,917,668 | ||||||
BNP Paribas SA(a) | 77,570 | 4,386,886 | ||||||
Bollore SA(a)(c) | 67,759 | 315,601 | ||||||
Bollore SA(b)(c) | 131 | 602 | ||||||
Bouygues SA(a) | 13,917 | 551,589 | ||||||
Bureau Veritas SA(a) | 21,446 | 427,272 | ||||||
Cap Gemini SA(a) | 11,625 | 1,078,186 | ||||||
Carrefour SA(a) | 41,679 | 1,202,341 | ||||||
Casino Guichard Perrachon SA(a) | 3,362 | 154,388 | ||||||
Christian Dior SE(a) | 4,241 | 720,088 | ||||||
Cie de Saint-Gobain(a) | 36,381 | 1,575,928 | ||||||
Cie Generale des Etablissements Michelin(a) | 14,084 | 1,339,996 | ||||||
CNP Assurances(a) | 12,048 | 162,452 | ||||||
Credit Agricole SA(a) | 80,832 | 952,141 | ||||||
Danone SA(a) | 43,398 | 2,931,340 | ||||||
Dassault Systemes(a) | 9,814 | 784,116 | ||||||
Edenred(a) | 17,518 | 331,006 | ||||||
Electricite de France SA(a) | 19,792 | 291,366 | ||||||
Engie SA(a) | 108,466 | 1,920,486 | ||||||
Essilor International SA(a) | 15,375 | 1,915,483 | ||||||
Eurazeo SA(a) | 2,708 | 186,691 | ||||||
Eutelsat Communications SA(a) | 13,777 | 412,319 | ||||||
Fonciere Des Regions(a) | 1,960 | 175,232 | ||||||
Gecina SA(a) | 2,437 | 296,147 | ||||||
Groupe Eurotunnel SE(a) | 34,599 | 430,271 | ||||||
Hermes International(a) | 1,839 | 621,370 | ||||||
ICADE(a) | 2,572 | 172,561 | ||||||
Iliad SA(a) | 1,976 | 470,840 | ||||||
Imerys SA(a) | 2,578 | 180,002 | ||||||
Ingenico Group SA(a) | 4,156 | 524,357 | ||||||
JCDecaux SA(a) | 5,041 | 193,166 | ||||||
Kering(a) | 5,272 | 901,007 | ||||||
Klepierre(a) | 15,573 | 691,930 | ||||||
L’Oreal SA(a) | 18,522 | 3,114,200 | ||||||
Lagardere SCA(a) | 7,798 | 232,607 | ||||||
Legrand SA(a) | 18,743 | 1,059,764 | ||||||
LVMH Moet Hennessy Louis Vuitton SE(a) | 20,541 | 3,225,044 | ||||||
Natixis SA(a) | 76,016 | 429,851 | ||||||
Numericable-SFR SAS(a) | 10,042 | 364,654 | ||||||
Orange SA(a) | 146,720 | 2,452,982 | ||||||
Pernod Ricard SA(a) | 15,788 | 1,799,788 | ||||||
Peugeot SA(a)(b) | 32,230 | 564,723 | ||||||
Publicis Groupe SA(a) | 13,279 | 882,626 | ||||||
Remy Cointreau SA(a) | 1,303 | 93,289 | ||||||
Renault SA(a) | 14,376 | 1,438,377 | ||||||
Rexel SA(a) | 25,334 | 337,202 | ||||||
Safran SA(a) | 22,357 | 1,535,351 | ||||||
Sanofi(a) | 86,151 | 7,338,899 | ||||||
Schneider Electric SE(a) | 41,252 | 2,342,306 | ||||||
SCOR SE(a) | 10,163 | 380,119 | ||||||
Societe BIC SA(a) | 2,190 | 360,226 | ||||||
Societe Generale SA(a) | 53,546 | 2,466,493 | ||||||
Sodexo SA(a) | 7,286 | 711,525 | ||||||
Suez Environnement Co.(a) | 20,309 | 379,688 | ||||||
Technip SA(a) | 8,569 | 425,962 | ||||||
Thales SA(a) | 7,414 | 554,706 | ||||||
TOTAL SA(a) | 158,544 | 7,104,803 | ||||||
Unibail-Rodamco SE(a) | 7,325 | 1,859,275 | ||||||
Valeo SA(a) | 6,048 | 932,062 | ||||||
Veolia Environnement SA(a) | 34,494 | 818,058 | ||||||
Vinci SA(a) | 35,387 | 2,267,182 | ||||||
Vivendi SA(a) | 86,411 | 1,855,084 | ||||||
Wendel SA(a) | 2,477 | 294,454 | ||||||
Zodiac Aerospace(a) | 16,457 | 391,684 | ||||||
|
| |||||||
| 86,882,467 | ||||||||
|
| |||||||
Germany – 8.6% | ||||||||
adidas AG(a) | 15,629 | 1,516,308 | ||||||
Allianz SE(a) | 33,387 | 5,882,958 | ||||||
Axel Springer SE(a) | 3,116 | 173,211 | ||||||
BASF SE(a) | 67,181 | 5,115,597 | ||||||
Bayer AG(a) | 60,314 | 7,529,518 | ||||||
Bayerische Motoren Werke AG(a) | 24,428 | 2,572,461 | ||||||
Bayerische Motoren Werke AG Preference Shares(a) | 3,630 | 303,579 | ||||||
Beiersdorf AG(a) | 7,801 | 708,750 | ||||||
Brenntag AG(a) | 12,049 | 627,586 | ||||||
Commerzbank AG(a)(b) | 81,475 | 840,358 | ||||||
Continental AG(a) | 8,213 | 1,985,983 | ||||||
Daimler AG(a) | 70,348 | 5,875,421 | ||||||
Deutsche Bank AG(a) | 101,877 | 2,473,023 | ||||||
Deutsche Boerse AG(a) | 14,510 | 1,274,917 | ||||||
Deutsche Lufthansa AG(a)(b) | 19,552 | 307,837 | ||||||
Deutsche Post AG(a) | 72,314 | 2,020,902 | ||||||
See accompanying notes to financial statements.
5
Table of Contents
State Street Institutional Investment Trust
State Street Hedged International Developed Equity Index Fund
Schedule of Investments — (continued)
December 31, 2015
Security Description | Shares | Value | ||||||
COMMON STOCKS – (continued) |
| |||||||
Germany – (continued) |
| |||||||
Deutsche Telekom AG(a) | 236,282 | $ | 4,242,021 | |||||
Deutsche Wohnen AG(a) | 24,273 | 670,915 | ||||||
E.ON SE(a) | 149,780 | 1,437,592 | ||||||
Evonik Industries AG(a) | 10,728 | 354,703 | ||||||
Fraport AG Frankfurt Airport Services Worldwide(a) | 2,721 | 173,452 | ||||||
Fresenius Medical Care AG & Co. KGaA(a) | 16,382 | 1,376,085 | ||||||
Fresenius SE & Co. KGaA(a) | 28,482 | 2,027,995 | ||||||
Fuchs Petrolub SE Preference Shares(a) | 5,588 | 263,010 | ||||||
GEA Group AG(a) | 13,354 | 539,289 | ||||||
Hannover Rueck SE(a) | 4,381 | 500,057 | ||||||
HeidelbergCement AG(a) | 10,777 | 877,935 | ||||||
Henkel AG & Co. KGaA(a) | 7,384 | 706,006 | ||||||
Henkel AG & Co. KGaA Preference Shares(a) | 13,317 | 1,485,588 | ||||||
HUGO BOSS AG(a) | 5,029 | 414,766 | ||||||
Infineon Technologies AG(a) | 81,380 | 1,185,924 | ||||||
Kabel Deutschland Holding AG(a) | 1,324 | 163,531 | ||||||
KS AG(a) | 12,680 | 323,094 | ||||||
Lanxess AG(a) | 6,598 | 303,496 | ||||||
Linde AG(a) | 13,780 | 1,989,812 | ||||||
MAN SE(a) | 2,872 | 288,493 | ||||||
Merck KGaA(a) | 9,184 | 888,834 | ||||||
METRO AG(a) | 14,323 | 456,103 | ||||||
Muenchener Rueckversicherungs-Gesellschaft AG in Muenchen(a) | 12,315 | 2,452,588 | ||||||
OSRAM Licht AG(a) | 7,082 | 295,756 | ||||||
Porsche Automobil Holding SE Preference Shares(a) | 11,981 | 644,519 | ||||||
ProSiebenSat.1 Media SE(a) | 15,061 | 759,533 | ||||||
RWE AG(a) | 36,480 | 459,727 | ||||||
SAP SE(a) | 71,822 | 5,696,940 | ||||||
Siemens AG(a) | 57,949 | 5,604,003 | ||||||
Symrise AG(a) | 9,674 | 640,138 | ||||||
Telefonica Deutschland Holding AG(a) | 46,316 | 244,201 | ||||||
ThyssenKrupp AG(a) | 26,697 | 529,005 | ||||||
TUI AG(a) | 37,001 | 660,521 | ||||||
United Internet AG(a) | 9,076 | 498,784 | ||||||
Volkswagen AG(a) | 2,665 | 409,352 | ||||||
Volkswagen AG Preference Shares(a) | 13,853 | 1,999,260 | ||||||
Vonovia SE(a) | 32,528 | 1,004,474 | ||||||
Zalando SE(b)(e) | 5,262 | 208,067 | ||||||
|
| |||||||
| 81,983,978 | ||||||||
|
| |||||||
Hong Kong – 2.9% | ||||||||
AIA Group, Ltd.(a) | 880,800 | 5,262,782 | ||||||
ASM Pacific Technology, Ltd.(a) | 12,100 | 94,547 | ||||||
Bank of East Asia, Ltd.(a) | 78,443 | 290,979 | ||||||
BOC Hong Kong Holdings, Ltd.(a) | 282,500 | 857,829 | ||||||
Cathay Pacific Airways, Ltd.(a) | 112,000 | 192,711 | ||||||
Cheung Kong Infrastructure Holdings, Ltd.(a) | 43,000 | 396,713 | ||||||
Cheung Kong Property Holdings, Ltd.(a) | 202,265 | 1,317,518 | ||||||
CK Hutchison Holdings, Ltd.(a) | 199,000 | 2,669,792 | ||||||
CLP Holdings, Ltd.(a) | 142,500 | 1,210,566 | ||||||
First Pacific Co., Ltd.(a) | 184,000 | 121,887 | ||||||
Galaxy Entertainment Group, Ltd.(a) | 158,000 | 495,058 | ||||||
Hang Lung Properties, Ltd.(a) | 155,000 | 351,203 | ||||||
Hang Seng Bank, Ltd.(a) | 57,800 | 1,100,688 | ||||||
Henderson Land Development Co., Ltd.(a) | 83,335 | 508,338 | ||||||
HK Electric Investments & HK Electric Investments, Ltd.(a)(e) | 161,490 | 135,313 | ||||||
HKT Trust & HKT, Ltd. | 214,000 | 273,362 | ||||||
Hong Kong & China Gas Co., Ltd.(a) | 526,000 | 1,032,098 | ||||||
Hong Kong Exchanges and Clearing, Ltd.(a) | 84,800 | 2,160,234 | ||||||
Hongkong Land Holdings, Ltd.(a) | 36,000 | 251,380 | ||||||
Hysan Development Co., Ltd.(a) | 43,000 | 176,235 | ||||||
Kerry Properties, Ltd.(a) | 40,500 | 110,475 | ||||||
Li & Fung, Ltd.(a) | 390,000 | 264,249 | ||||||
Link REIT(a) | 158,000 | 945,010 | ||||||
Melco Crown Entertainment, Ltd. ADR | 5,796 | 97,373 | ||||||
MTR Corp., Ltd.(a) | 104,327 | 515,811 | ||||||
New World Development Co., Ltd.(a) | 347,605 | 341,768 | ||||||
Noble Group, Ltd.(a) | 290,000 | 81,017 | ||||||
NWS Holdings, Ltd.(a) | 88,764 | 131,586 | ||||||
PCCW, Ltd.(a) | 341,000 | 199,331 | ||||||
Power Assets Holdings, Ltd.(a) | 106,000 | 974,473 | ||||||
Sands China, Ltd.(a) | 188,400 | 636,299 | ||||||
Shangri-La Asia, Ltd.(a) | 82,000 | 80,052 | ||||||
Sino Land Co., Ltd.(a) | 240,000 | 350,232 | ||||||
SJM Holdings, Ltd.(a) | 121,000 | 86,055 | ||||||
Sun Hung Kai Properties, Ltd.(a) | 129,000 | 1,552,990 | ||||||
Swire Pacific, Ltd. Class A(a) | 47,000 | 527,096 | ||||||
Swire Properties, Ltd.(a) | 68,800 | 197,821 | ||||||
Techtronic Industries Co., Ltd.(a) | 104,000 | 421,012 | ||||||
WH Group, Ltd.(a)(b)(e) | 393,000 | 218,224 | ||||||
Wharf Holdings, Ltd.(a) | 96,000 | 531,133 | ||||||
Wheelock & Co., Ltd.(a) | 61,000 | 257,140 | ||||||
Yue Yuen Industrial Holdings, Ltd.(a) | 39,500 | 133,551 | ||||||
|
| |||||||
| 27,551,931 | ||||||||
|
| |||||||
Ireland – 0.9% | ||||||||
Bank of Ireland(a)(b) | 1,905,286 | 697,340 | ||||||
CRH PLC(a) | 61,158 | 1,763,001 | ||||||
Experian PLC(a) | 73,089 | 1,291,542 | ||||||
James Hardie Industries PLC(a) | 36,495 | 459,400 | ||||||
Kerry Group PLC Class A(a) | 11,228 | 928,617 | ||||||
Ryanair Holdings PLC ADR | 2,065 | 178,540 | ||||||
Shire PLC(a) | 43,601 | 2,990,742 | ||||||
|
| |||||||
| 8,309,182 | ||||||||
|
| |||||||
See accompanying notes to financial statements.
6
Table of Contents
State Street Institutional Investment Trust
State Street Hedged International Developed Equity Index Fund
Schedule of Investments — (continued)
December 31, 2015
Security Description | Shares | Value | ||||||
COMMON STOCKS – (continued) |
| |||||||
Israel – 0.7% | ||||||||
Azrieli Group(a) | 1,922 | $ | 71,599 | |||||
Bank Hapoalim BM(a) | 72,373 | 373,585 | ||||||
Bank Leumi Le-Israel BM(a)(b) | 97,035 | 336,446 | ||||||
Bezeq The Israeli Telecommunication Corp., Ltd.(a) | 136,448 | 300,367 | ||||||
Check Point Software Technologies, Ltd.(b) | 5,142 | 418,456 | ||||||
Delek Group, Ltd.(a) | 399 | 79,901 | ||||||
Israel Chemicals, Ltd.(a) | 38,864 | 157,759 | ||||||
Mizrahi Tefahot Bank, Ltd.(a) | 12,796 | 152,827 | ||||||
NICE-Systems, Ltd.(a) | 4,506 | 258,910 | ||||||
Teva Pharmaceutical Industries, Ltd.(a) | 66,915 | 4,365,538 | ||||||
|
| |||||||
| 6,515,388 | ||||||||
|
| |||||||
Italy – 2.0% | ||||||||
Assicurazioni Generali SpA(a) | 83,482 | 1,524,308 | ||||||
Atlantia SpA(a) | 31,589 | 835,448 | ||||||
Banca Monte dei Paschi di Siena SpA(a)(b) | 207,518 | 274,601 | ||||||
Banco Popolare SC(a)(b) | 29,462 | 405,827 | ||||||
Enel Green Power SpA(a) | 113,314 | 230,223 | ||||||
Enel SpA(a) | 521,804 | 2,187,176 | ||||||
Eni SpA(a) | 187,469 | 2,784,296 | ||||||
EXOR SpA(a) | 7,564 | 343,163 | ||||||
Finmeccanica SpA(a)(b) | 27,529 | 382,612 | ||||||
Intesa Sanpaolo SpA(a)(c) | 932,715 | 3,096,263 | ||||||
Intesa Sanpaolo SpA(a)(c) | 53,094 | 162,121 | ||||||
Luxottica Group SpA(a) | 12,961 | 844,255 | ||||||
Mediobanca SpA(a) | 37,469 | 359,031 | ||||||
Prysmian SpA(a) | 13,740 | 300,083 | ||||||
Saipem SpA(a)(b) | 18,417 | 148,799 | ||||||
Snam SpA(a) | 160,755 | 838,623 | ||||||
Telecom Italia SpA(a)(b)(c) | 801,328 | 1,015,112 | ||||||
Telecom Italia SpA(a)(c) | 444,293 | 455,801 | ||||||
Terna Rete Elettrica Nazionale SpA(a) | 103,698 | 533,086 | ||||||
UniCredit SpA(a) | 356,462 | 1,969,952 | ||||||
Unione di Banche Italiane SpA(a) | 59,534 | 397,608 | ||||||
UnipolSai SpA(a) | 73,026 | 185,709 | ||||||
|
| |||||||
| 19,274,097 | ||||||||
|
| |||||||
Japan – 21.6% | ||||||||
ABC-Mart, Inc.(a) | 1,500 | 82,039 | ||||||
Acom Co., Ltd.(a)(b) | 27,700 | 130,331 | ||||||
Aeon Co., Ltd.(a) | 50,300 | 774,358 | ||||||
AEON Financial Service Co., Ltd.(a) | 7,600 | 169,633 | ||||||
Aeon Mall Co., Ltd.(a) | 7,600 | 130,248 | ||||||
Air Water, Inc.(a) | 10,000 | 160,699 | ||||||
Aisin Seiki Co., Ltd.(a) | 14,900 | 640,739 | ||||||
Ajinomoto Co., Inc.(a) | 41,000 | 969,898 | ||||||
Alfresa Holdings Corp.(a) | 13,700 | 270,354 | ||||||
Alps Electric Co., Ltd.(a) | 12,300 | 333,274 | ||||||
Amada Holdings Co., Ltd.(a) | 21,800 | 207,858 | ||||||
ANA Holdings, Inc.(a) | 91,000 | 262,326 | ||||||
Aozora Bank, Ltd.(a) | 82,000 | 285,927 | ||||||
Asahi Glass Co., Ltd.(a) | 62,000 | 354,894 | ||||||
Asahi Group Holdings, Ltd.(a) | 27,400 | 857,028 | ||||||
Asahi Kasei Corp.(a) | 94,000 | 635,109 | ||||||
Asics Corp.(a) | 9,600 | 199,010 | ||||||
Astellas Pharma, Inc.(a) | 157,300 | 2,237,423 | ||||||
Bandai Namco Holdings, Inc.(a) | 10,600 | 223,761 | ||||||
Bank of Kyoto, Ltd.(a) | 28,000 | 259,446 | ||||||
Bank of Yokohama, Ltd.(a) | 89,000 | 545,081 | ||||||
Benesse Holdings, Inc.(a) | 4,400 | 126,606 | ||||||
Bridgestone Corp.(a) | 46,400 | 1,590,262 | ||||||
Brother Industries, Ltd.(a) | 20,000 | 229,564 | ||||||
Calbee, Inc.(a) | 5,000 | 210,970 | ||||||
Canon, Inc.(a) | 78,800 | 2,381,720 | ||||||
Casio Computer Co., Ltd.(a) | 14,600 | 341,017 | ||||||
Central Japan Railway Co.(a) | 10,700 | 1,898,033 | ||||||
Chiba Bank, Ltd.(a) | 49,000 | 347,426 | ||||||
Chubu Electric Power Co., Inc.(a) | 47,900 | 655,385 | ||||||
Chugai Pharmaceutical Co., Ltd.(a) | 15,800 | 550,277 | ||||||
Chugoku Bank, Ltd.(a) | 12,400 | 165,325 | ||||||
Chugoku Electric Power Co., Inc.(a) | 21,000 | 277,040 | ||||||
Citizen Holdings Co., Ltd.(a) | 19,500 | 140,035 | ||||||
Credit Saison Co., Ltd.(a) | 9,000 | 177,172 | ||||||
Dai Nippon Printing Co., Ltd.(a) | 44,000 | 434,738 | ||||||
Dai-ichi Life Insurance Co., Ltd.(a) | 81,400 | 1,353,181 | ||||||
Daicel Corp.(a) | 22,400 | 333,077 | ||||||
Daihatsu Motor Co., Ltd.(a) | 14,700 | 198,138 | ||||||
Daiichi Sankyo Co., Ltd.(a) | 46,400 | 956,886 | ||||||
Daikin Industries, Ltd.(a) | 17,700 | 1,287,872 | ||||||
Daito Trust Construction Co., Ltd.(a) | 5,600 | 646,321 | ||||||
Daiwa House Industry Co., Ltd.(a) | 45,100 | 1,295,382 | ||||||
Daiwa Securities Group, Inc.(a) | 115,000 | 702,490 | ||||||
Denso Corp.(a) | 34,700 | 1,656,778 | ||||||
Dentsu, Inc.(a) | 15,800 | 863,734 | ||||||
Don Quijote Holdings Co., Ltd.(a) | 9,800 | 343,878 | ||||||
East Japan Railway Co.(a) | 24,700 | 2,323,964 | ||||||
Eisai Co., Ltd.(a) | 18,900 | 1,249,210 | ||||||
Electric Power Development Co., Ltd.(a) | 10,800 | 384,340 | ||||||
FamilyMart Co., Ltd.(a) | 3,600 | 167,386 | ||||||
FANUC Corp.(a) | 14,400 | 2,478,912 | ||||||
Fast Retailing Co., Ltd.(a) | 4,000 | 1,398,082 | ||||||
Fuji Electric Co., Ltd.(a) | 41,000 | 171,806 | ||||||
Fuji Heavy Industries, Ltd.(a) | 41,900 | 1,724,689 | ||||||
FUJIFILM Holdings Corp.(a) | 34,700 | 1,446,914 | ||||||
Fujitsu, Ltd.(a) | 138,000 | 688,202 | ||||||
Fukuoka Financial Group, Inc.(a) | 50,000 | 247,725 | ||||||
GungHo Online Entertainment, Inc.(a)(b) | 23,000 | 62,431 | ||||||
Gunma Bank, Ltd.(a) | 28,000 | 162,663 | ||||||
Hachijuni Bank, Ltd.(a) | 28,000 | 171,217 | ||||||
Hakuhodo DY Holdings, Inc.(a) | 17,100 | 184,861 | ||||||
Hamamatsu Photonics KK(a) | 10,900 | 298,577 | ||||||
Hankyu Hanshin Holdings, Inc.(a) | 81,000 | 526,053 | ||||||
See accompanying notes to financial statements.
7
Table of Contents
State Street Institutional Investment Trust
State Street Hedged International Developed Equity Index Fund
Schedule of Investments — (continued)
December 31, 2015
Security Description | Shares | Value | ||||||
COMMON STOCKS – (continued) |
| |||||||
Japan – (continued) | ||||||||
Hikari Tsushin, Inc.(a) | 1,300 | $ | 88,456 | |||||
Hino Motors, Ltd.(a) | 15,700 | 181,301 | ||||||
Hirose Electric Co., Ltd.(a) | 1,900 | 229,846 | ||||||
Hiroshima Bank, Ltd.(a) | 29,000 | 164,692 | ||||||
Hisamitsu Pharmaceutical Co., Inc.(a) | 3,300 | 138,428 | ||||||
Hitachi Chemical Co., Ltd.(a) | 7,900 | 125,227 | ||||||
Hitachi Construction Machinery Co., Ltd.(a) | 4,800 | 74,589 | ||||||
Hitachi High-Technologies Corp.(a) | 3,600 | 97,274 | ||||||
Hitachi Metals, Ltd.(a) | 11,700 | 144,237 | ||||||
Hitachi, Ltd.(a) | 361,000 | 2,043,859 | ||||||
Hokuhoku Financial Group, Inc.(a) | 73,000 | 148,690 | ||||||
Hokuriku Electric Power Co.(a) | 10,700 | 157,998 | ||||||
Honda Motor Co., Ltd.(a) | 119,600 | 3,819,419 | ||||||
Hoshizaki Electric Co., Ltd.(a) | 2,400 | 149,073 | ||||||
Hoya Corp.(a) | 31,500 | 1,287,045 | ||||||
Hulic Co., Ltd.(a) | 18,100 | 158,796 | ||||||
Idemitsu Kosan Co., Ltd.(a) | 4,700 | 74,983 | ||||||
IHI Corp.(a) | 83,000 | 228,931 | ||||||
Iida Group Holdings Co., Ltd.(a) | 11,000 | 203,704 | ||||||
Inpex Corp.(a) | 70,600 | 687,700 | ||||||
Isetan Mitsukoshi Holdings, Ltd.(a) | 22,500 | 293,179 | ||||||
Isuzu Motors, Ltd.(a) | 39,600 | 426,242 | ||||||
ITOCHU Corp.(a) | 118,300 | 1,398,142 | ||||||
Itochu Techno-Solutions Corp.(a) | 3,200 | 63,705 | ||||||
Iyo Bank, Ltd.(a) | 14,600 | 141,731 | ||||||
J Front Retailing Co., Ltd.(a) | 17,100 | 248,386 | ||||||
Japan Airlines Co., Ltd.(a) | 10,000 | 357,631 | ||||||
Japan Airport Terminal Co., Ltd.(a) | 2,800 | 123,850 | ||||||
Japan Exchange Group, Inc.(a) | 38,500 | 601,322 | ||||||
Japan Post Bank Co., Ltd.(b) | 26,800 | 389,875 | ||||||
Japan Post Holdings Co., Ltd.(b) | 35,400 | 548,826 | ||||||
Japan Prime Realty Investment Corp.(a) | 54 | 184,252 | ||||||
Japan Real Estate Investment Corp.(a) | 100 | 484,869 | ||||||
Japan Retail Fund Investment Corp.(a) | 182 | 349,854 | ||||||
Japan Tobacco, Inc.(a) | 80,900 | 2,967,674 | ||||||
JFE Holdings, Inc.(a) | 34,700 | 544,420 | ||||||
JGC Corp.(a) | 16,000 | 244,696 | ||||||
Joyo Bank, Ltd.(a) | 41,000 | 193,722 | ||||||
JSR Corp.(a) | 16,700 | 260,042 | ||||||
JTEKT Corp.(a) | 13,600 | 222,421 | ||||||
JX Holdings, Inc.(a) | 173,500 | 727,588 | ||||||
Kajima Corp.(a) | 56,000 | 333,004 | ||||||
Kakaku.com, Inc.(a) | 11,200 | 220,116 | ||||||
Kamigumi Co., Ltd.(a) | 12,000 | 103,232 | ||||||
Kaneka Corp.(a) | 16,000 | 166,170 | ||||||
Kansai Electric Power Co., Inc.(a)(b) | 47,100 | 564,250 | ||||||
Kansai Paint Co., Ltd.(a) | 17,200 | 260,497 | ||||||
Kao Corp.(a) | 35,900 | 1,843,322 | ||||||
Kawasaki Heavy Industries, Ltd.(a) | 115,000 | 425,134 | ||||||
KDDI Corp.(a) | 128,500 | 3,334,394 | ||||||
Keihan Electric Railway Co., Ltd.(a) | 40,000 | 267,667 | ||||||
Keikyu Corp.(a) | 37,000 | 305,486 | ||||||
Keio Corp.(a) | 43,000 | 371,027 | ||||||
Keisei Electric Railway Co., Ltd.(a) | 22,000 | 280,448 | ||||||
Keyence Corp.(a) | 3,400 | 1,867,104 | ||||||
Kikkoman Corp.(a) | 12,000 | 415,423 | ||||||
Kintetsu Group Holdings Co., Ltd.(a) | 129,000 | 524,051 | ||||||
Kirin Holdings Co., Ltd.(a) | 56,600 | 767,828 | ||||||
Kobe Steel, Ltd.(a) | 222,000 | 241,006 | ||||||
Koito Manufacturing Co., Ltd.(a) | 7,600 | 311,397 | ||||||
Komatsu, Ltd.(a) | 65,700 | 1,074,119 | ||||||
Konami Holdings Corp.(a) | 5,900 | 140,330 | ||||||
Konica Minolta, Inc.(a) | 33,500 | 335,229 | ||||||
Kose Corp.(a) | 1,700 | 157,053 | ||||||
Kubota Corp.(a) | 84,000 | 1,296,607 | ||||||
Kuraray Co., Ltd.(a) | 24,000 | 290,466 | ||||||
Kurita Water Industries, Ltd.(a) | 9,000 | 188,316 | ||||||
Kyocera Corp.(a) | 22,800 | 1,057,963 | ||||||
Kyowa Hakko Kirin Co., Ltd.(a) | 16,000 | 251,545 | ||||||
Kyushu Electric Power Co., Inc.(a)(b) | 31,600 | 344,125 | ||||||
Kyushu Financial Group, Inc.(b) | 22,000 | 154,903 | ||||||
Lawson, Inc.(a) | 4,800 | 389,297 | ||||||
LIXIL Group Corp.(a) | 17,900 | 397,223 | ||||||
M3, Inc.(a) | 13,600 | 281,750 | ||||||
Mabuchi Motor Co., Ltd.(a) | 3,800 | 205,769 | ||||||
Makita Corp.(a) | 8,100 | 466,388 | ||||||
Marubeni Corp.(a) | 123,000 | 631,829 | ||||||
Marui Group Co., Ltd.(a) | 14,500 | 235,757 | ||||||
Maruichi Steel Tube, Ltd.(a) | 3,100 | 91,441 | ||||||
Mazda Motor Corp.(a) | 37,500 | 773,160 | ||||||
McDonald’s Holdings Co., Japan, Ltd.(a)(b) | 3,500 | 76,050 | ||||||
Medipal Holdings Corp.(a) | 9,800 | 166,892 | ||||||
MEIJI Holdings Co., Ltd.(a) | 8,700 | 718,019 | ||||||
Minebea Co., Ltd.(a) | 26,000 | 222,426 | ||||||
Miraca Holdings, Inc.(a) | 4,500 | 197,842 | ||||||
Mitsubishi Chemical Holdings Corp.(a) | 105,300 | 667,543 | ||||||
Mitsubishi Corp.(a) | 100,700 | 1,673,562 | ||||||
Mitsubishi Electric Corp.(a) | 144,000 | 1,510,289 | ||||||
Mitsubishi Estate Co., Ltd.(a) | 89,000 | 1,849,068 | ||||||
Mitsubishi Gas Chemical Co., Inc.(a) | 20,000 | 102,185 | ||||||
Mitsubishi Heavy Industries, Ltd.(a) | 212,000 | 926,200 | ||||||
Mitsubishi Logistics Corp.(a) | 8,000 | 105,322 | ||||||
Mitsubishi Materials Corp.(a) | 95,000 | 298,968 | ||||||
Mitsubishi Motors Corp.(a) | 51,500 | 435,355 | ||||||
Mitsubishi Tanabe Pharma Corp.(a) | 17,100 | 294,365 | ||||||
Mitsubishi UFJ Financial Group, Inc.(a) | 931,700 | 5,766,384 | ||||||
Mitsubishi UFJ Lease & Finance Co., Ltd.(a) | 35,800 | 184,082 | ||||||
See accompanying notes to financial statements.
8
Table of Contents
State Street Institutional Investment Trust
State Street Hedged International Developed Equity Index Fund
Schedule of Investments — (continued)
December 31, 2015
Security Description | Shares | Value | ||||||
COMMON STOCKS – (continued) |
| |||||||
Japan – (continued) | ||||||||
Mitsui & Co., Ltd.(a) | 122,200 | $ | 1,450,778 | |||||
Mitsui Chemicals, Inc.(a) | 52,000 | 230,429 | ||||||
Mitsui Fudosan Co., Ltd.(a) | 67,000 | 1,680,160 | ||||||
Mitsui OSK Lines, Ltd.(a) | 76,000 | 191,534 | ||||||
Mixi, Inc.(a) | 2,300 | 85,956 | ||||||
Mizuho Financial Group, Inc.(a) | 1,729,800 | 3,456,724 | ||||||
MS&AD Insurance Group Holdings, Inc.(a) | 36,100 | 1,057,741 | ||||||
Murata Manufacturing Co., Ltd.(a) | 15,100 | 2,170,800 | ||||||
Nabtesco Corp.(a) | 8,900 | 180,654 | ||||||
Nagoya Railroad Co., Ltd.(a) | 65,000 | 270,312 | ||||||
NEC Corp.(a) | 203,000 | 642,675 | ||||||
Nexon Co., Ltd.(a) | 10,200 | 165,793 | ||||||
NGK Insulators, Ltd.(a) | 20,000 | 450,429 | ||||||
NGK Spark Plug Co., Ltd.(a) | 13,500 | 355,138 | ||||||
NH Foods, Ltd.(a) | 15,000 | 293,754 | ||||||
NHK Spring Co., Ltd.(a) | 8,300 | 83,149 | ||||||
Nidec Corp.(a) | 16,800 | 1,217,256 | ||||||
Nikon Corp.(a) | 23,800 | 318,499 | ||||||
Nintendo Co., Ltd.(a) | 8,000 | 1,099,166 | ||||||
Nippon Building Fund, Inc.(a) | 103 | 491,781 | ||||||
Nippon Electric Glass Co., Ltd.(a) | 20,000 | 100,720 | ||||||
Nippon Express Co., Ltd.(a) | 52,000 | 244,156 | ||||||
Nippon Paint Holdings Co., Ltd.(a) | 9,000 | 217,637 | ||||||
Nippon Prologis REIT, Inc.(a) | 93 | 168,091 | ||||||
Nippon Steel & Sumitomo Metal Corp.(a) | 55,000 | 1,087,125 | ||||||
Nippon Telegraph & Telephone Corp.(a) | 55,900 | 2,222,865 | ||||||
Nippon Yusen KK(a) | 102,000 | 247,011 | ||||||
Nissan Motor Co., Ltd.(a) | 176,900 | 1,850,734 | ||||||
Nisshin Seifun Group, Inc.(a) | 18,300 | 298,673 | ||||||
Nissin Foods Holdings Co., Ltd.(a) | 3,800 | 201,474 | ||||||
Nitori Holdings Co., Ltd.(a) | 5,600 | 469,907 | ||||||
Nitto Denko Corp.(a) | 11,400 | 831,573 | ||||||
NOK Corp.(a) | 7,800 | 182,063 | ||||||
Nomura Holdings, Inc.(a) | 259,800 | 1,445,897 | ||||||
Nomura Real Estate Holdings, Inc.(a) | 7,900 | 146,441 | ||||||
Nomura Real Estate Master Fund, Inc.(b) | 280 | 347,745 | ||||||
Nomura Research Institute, Ltd.(a) | 7,800 | 299,300 | ||||||
NSK, Ltd.(a) | 29,800 | 323,535 | ||||||
NTT Data Corp.(a) | 9,300 | 449,245 | ||||||
NTT DOCOMO, Inc.(a) | 106,600 | 2,184,717 | ||||||
NTT Urban Development Corp.(a) | 8,900 | 85,443 | ||||||
Obayashi Corp.(a) | 49,000 | 451,757 | ||||||
Obic Co., Ltd.(a) | 3,900 | 206,273 | ||||||
Odakyu Electric Railway Co., Ltd.(a) | 48,000 | 516,377 | ||||||
Oji Holdings Corp.(a) | 62,000 | 248,970 | ||||||
Olympus Corp.(a) | 19,700 | 774,918 | ||||||
Omron Corp.(a) | 14,200 | 473,132 | ||||||
Ono Pharmaceutical Co., Ltd.(a) | 6,200 | 1,104,613 | ||||||
Oracle Corp. Japan(a) | 3,400 | 158,172 | ||||||
Oriental Land Co., Ltd.(a) | 15,200 | 918,782 | ||||||
ORIX Corp.(a) | 99,100 | 1,389,065 | ||||||
Osaka Gas Co., Ltd.(a) | 137,000 | 494,424 | ||||||
Otsuka Corp.(a) | 3,600 | 176,698 | ||||||
Otsuka Holdings Co., Ltd.(a) | 29,500 | 1,047,232 | ||||||
Panasonic Corp.(a) | 157,600 | 1,596,343 | ||||||
Park24 Co., Ltd.(a) | 6,300 | 152,506 | ||||||
Rakuten, Inc.(a)(b) | 66,500 | 765,294 | ||||||
Recruit Holdings Co., Ltd.(a) | 9,000 | 264,324 | ||||||
Resona Holdings, Inc.(a) | 169,200 | 820,992 | ||||||
Ricoh Co., Ltd.(a) | 50,600 | 520,585 | ||||||
Rinnai Corp.(a) | 3,000 | 265,589 | ||||||
Rohm Co., Ltd.(a) | 7,100 | 359,322 | ||||||
Ryohin Keikaku Co., Ltd.(a) | 1,800 | 364,217 | ||||||
Sankyo Co., Ltd.(a) | 2,600 | 96,971 | ||||||
Sanrio Co., Ltd.(a) | 1,900 | 44,600 | ||||||
Santen Pharmaceutical Co., Ltd.(a) | 25,300 | 416,178 | ||||||
SBI Holdings, Inc.(a) | 13,700 | 147,712 | ||||||
Secom Co., Ltd.(a) | 14,800 | 1,002,159 | ||||||
Sega Sammy Holdings, Inc.(a) | 10,700 | 99,998 | ||||||
Seibu Holdings, Inc.(a) | 9,000 | 183,648 | ||||||
Seiko Epson Corp.(a) | 22,200 | 341,577 | ||||||
Sekisui Chemical Co., Ltd.(a) | 29,800 | 388,753 | ||||||
Sekisui House, Ltd.(a) | 42,800 | 719,030 | ||||||
Seven & i Holdings Co., Ltd.(a) | 55,600 | 2,543,505 | ||||||
Seven Bank, Ltd.(a) | 40,600 | 177,903 | ||||||
Shikoku Electric Power Co., Inc.(a) | 10,700 | 167,009 | ||||||
Shimadzu Corp.(a) | 16,000 | 267,616 | ||||||
Shimamura Co., Ltd.(a) | 1,300 | 152,115 | ||||||
Shimano, Inc.(a) | 5,700 | 874,556 | ||||||
Shimizu Corp.(a) | 41,000 | 334,046 | ||||||
Shin-Etsu Chemical Co., Ltd.(a) | 29,300 | 1,591,594 | ||||||
Shinsei Bank, Ltd.(a) | 154,000 | 283,169 | ||||||
Shionogi & Co., Ltd.(a) | 22,600 | 1,021,353 | ||||||
Shiseido Co., Ltd.(a) | 24,000 | 497,553 | ||||||
Shizuoka Bank, Ltd.(a) | 35,000 | 339,149 | ||||||
Showa Shell Sekiyu KK(a) | 8,200 | 66,858 | ||||||
SMC Corp.(a) | 3,800 | 986,168 | ||||||
SoftBank Group Corp.(a) | 70,500 | 3,555,205 | ||||||
Sohgo Security Services Co., Ltd.(a) | 3,700 | 173,382 | ||||||
Sompo Japan Nipponkoa Holdings, Inc.(a) | 25,500 | 836,588 | ||||||
Sony Corp.(a) | 93,300 | 2,291,108 | ||||||
Sony Financial Holdings, Inc.(a) | 14,200 | 253,788 | ||||||
Stanley Electric Co., Ltd.(a) | 8,500 | 186,314 | ||||||
Sumitomo Chemical Co., Ltd.(a) | 105,000 | 602,523 | ||||||
Sumitomo Corp.(a) | 82,300 | 838,377 | ||||||
Sumitomo Dainippon Pharma Co., Ltd.(a) | 11,600 | 136,551 | ||||||
Sumitomo Electric Industries, Ltd.(a) | 57,800 | 815,505 | ||||||
Sumitomo Heavy Industries, Ltd.(a) | 38,000 | 170,207 | ||||||
Sumitomo Metal Mining Co., Ltd.(a) | 40,000 | 485,153 | ||||||
Sumitomo Mitsui Financial Group, Inc.(a) | 93,400 | 3,522,082 | ||||||
See accompanying notes to financial statements.
9
Table of Contents
State Street Institutional Investment Trust
State Street Hedged International Developed Equity Index Fund
Schedule of Investments — (continued)
December 31, 2015
Security Description | Shares | Value | ||||||
COMMON STOCKS – (continued) |
| |||||||
Japan – (continued) | ||||||||
Sumitomo Mitsui Trust Holdings, Inc.(a) | 235,000 | $ | 889,283 | |||||
Sumitomo Realty & Development Co., Ltd.(a) | 26,000 | 741,493 | ||||||
Sumitomo Rubber Industries, Ltd.(a) | 12,000 | 155,911 | ||||||
Suntory Beverage & Food, Ltd.(a) | 10,000 | 437,397 | ||||||
Suruga Bank, Ltd.(a) | 15,300 | 315,049 | ||||||
Suzuken Co., Ltd.(a) | 5,100 | 193,650 | ||||||
Suzuki Motor Corp.(a) | 27,900 | 847,003 | ||||||
Sysmex Corp.(a) | 10,200 | 653,731 | ||||||
T&D Holdings, Inc.(a) | 41,100 | 541,803 | ||||||
Taiheiyo Cement Corp.(a) | 96,000 | 280,116 | ||||||
Taisei Corp.(a) | 75,000 | 493,612 | ||||||
Taisho Pharmaceutical Holdings Co., Ltd.(a) | 2,000 | 141,134 | ||||||
Taiyo Nippon Sanso Corp.(a) | 12,000 | 108,435 | ||||||
Takashimaya Co., Ltd.(a) | 18,000 | 161,964 | ||||||
Takeda Pharmaceutical Co., Ltd.(a) | 58,200 | 2,899,408 | ||||||
TDK Corp.(a) | 8,600 | 550,320 | ||||||
Teijin, Ltd.(a) | 58,000 | 197,492 | ||||||
Terumo Corp.(a) | 23,400 | 724,643 | ||||||
THK Co., Ltd.(a) | 10,000 | 185,187 | ||||||
Tobu Railway Co., Ltd.(a) | 76,000 | 374,552 | ||||||
Toho Co., Ltd.(a) | 7,200 | 199,074 | ||||||
Toho Gas Co., Ltd.(a) | 32,000 | 206,492 | ||||||
Tohoku Electric Power Co., Inc.(a) | 34,400 | 429,687 | ||||||
Tokio Marine Holdings, Inc.(a) | 48,500 | 1,871,736 | ||||||
Tokyo Electric Power Co., Inc.(a)(b) | 104,100 | 598,936 | ||||||
Tokyo Electron, Ltd.(a) | 12,100 | 732,467 | ||||||
Tokyo Gas Co., Ltd.(a) | 157,000 | 737,097 | ||||||
Tokyo Tatemono Co., Ltd.(a) | 13,200 | 143,547 | ||||||
Tokyu Corp.(a) | 87,000 | 686,936 | ||||||
Tokyu Fudosan Holdings Corp.(a) | 29,400 | 184,122 | ||||||
TonenGeneral Sekiyu KK(a) | 17,000 | 143,395 | ||||||
Toppan Printing Co., Ltd.(a) | 43,000 | 395,837 | ||||||
Toray Industries, Inc.(a) | 112,000 | 1,039,897 | ||||||
Toshiba Corp.(a)(b) | 272,000 | 558,556 | ||||||
TOTO, Ltd.(a) | 10,500 | 368,579 | ||||||
Toyo Seikan Group Holdings, Ltd.(a) | 9,900 | 183,484 | ||||||
Toyo Suisan Kaisha, Ltd.(a) | 7,000 | 243,765 | ||||||
Toyoda Gosei Co., Ltd.(a) | 4,300 | 97,602 | ||||||
Toyota Industries Corp.(a) | 12,700 | 678,548 | ||||||
Toyota Motor Corp.(a) | 199,000 | 12,244,027 | ||||||
Toyota Tsusho Corp.(a) | 14,000 | 327,227 | ||||||
Trend Micro, Inc.(a)(b) | 8,000 | 324,347 | ||||||
Unicharm Corp.(a) | 26,300 | 536,644 | ||||||
United Urban Investment Corp.(a) | 224 | 303,840 | ||||||
USS Co., Ltd.(a) | 18,700 | 280,749 | ||||||
West Japan Railway Co.(a) | 11,400 | 787,347 | ||||||
Yahoo Japan Corp.(a) | 109,200 | 443,518 | ||||||
Yakult Honsha Co., Ltd.(a) | 6,700 | 327,657 | ||||||
Yamada Denki Co., Ltd.(a) | 43,400 | 187,312 | ||||||
Yamaguchi Financial Group, Inc.(a) | 14,000 | 165,723 | ||||||
Yamaha Corp.(a) | 10,500 | 253,410 | ||||||
Yamaha Motor Co., Ltd.(a) | 21,000 | 470,330 | ||||||
Yamato Holdings Co., Ltd.(a) | 22,800 | 482,687 | ||||||
Yamazaki Baking Co., Ltd.(a) | 7,000 | 157,270 | ||||||
Yaskawa Electric Corp.(a) | 16,000 | 217,526 | ||||||
Yokogawa Electric Corp.(a) | 15,300 | 183,844 | ||||||
Yokohama Rubber Co., Ltd.(a) | 5,300 | 81,329 | ||||||
|
| |||||||
| 207,259,223 | ||||||||
|
| |||||||
Luxembourg – 0.2% | ||||||||
ArcelorMittal(a) | 69,481 | 293,033 | ||||||
Millicom International Cellular SA(a) | 3,914 | 224,875 | ||||||
RTL Group SA(a) | 2,453 | 204,190 | ||||||
SES SA(a) | 23,187 | 642,238 | ||||||
Tenaris SA(a) | 38,001 | 449,797 | ||||||
|
| |||||||
| 1,814,133 | ||||||||
|
| |||||||
Macau – 0.0%(d) | ||||||||
MGM China Holdings, Ltd.(a) | 98,400 | 122,297 | ||||||
Wynn Macau, Ltd.(a) | 115,200 | 133,836 | ||||||
|
| |||||||
| 256,133 | ||||||||
|
| |||||||
Mexico – 0.0%(d) | ||||||||
Fresnillo PLC(a) | 18,592 | 193,264 | ||||||
|
| |||||||
Netherlands – 3.1% | ||||||||
Aegon NV(a) | 124,940 | 706,301 | ||||||
AerCap Holdings NV(b) | 5,412 | 233,582 | ||||||
Akzo Nobel NV(a) | 18,616 | 1,243,381 | ||||||
Altice NV Class A(a)(b) | 25,291 | 363,213 | ||||||
Altice NV Class B(a)(b) | 7,029 | 102,408 | ||||||
ASML Holding NV(a) | 25,630 | 2,276,321 | ||||||
Boskalis Westminster(a) | 6,244 | 254,601 | ||||||
Gemalto NV(a) | 6,560 | 393,450 | ||||||
Heineken Holding NV(a) | 7,114 | 547,457 | ||||||
Heineken NV(a) | 16,515 | 1,406,774 | ||||||
ING Groep NV | 283,885 | 3,839,384 | ||||||
Koninklijke Ahold NV(a) | 62,993 | 1,328,188 | ||||||
Koninklijke DSM NV(a) | 13,458 | 674,578 | ||||||
Koninklijke KPN NV(a) | 227,989 | 861,980 | ||||||
Koninklijke Philips NV(a) | 70,797 | 1,806,292 | ||||||
Koninklijke Vopak NV(a) | 4,965 | 213,728 | ||||||
NN Group NV(a) | 18,584 | 655,426 | ||||||
NXP Semiconductors NV(b) | 9,495 | 799,954 | ||||||
OCI NV(a)(b) | 6,946 | 171,436 | ||||||
Randstad Holding NV(a) | 8,766 | 545,645 | ||||||
Royal Dutch Shell PLC Class A(a) | 286,138 | 6,479,465 | ||||||
Royal Dutch Shell PLC Class B(a) | 178,985 | 4,078,403 | ||||||
TNT Express NV(a) | 25,716 | 217,437 | ||||||
Wolters Kluwer NV(a) | 23,212 | 779,218 | ||||||
|
| |||||||
| 29,978,622 | ||||||||
|
| |||||||
New Zealand – 0.1% | ||||||||
Auckland International Airport, Ltd.(a) | 76,813 | 301,632 | ||||||
Contact Energy, Ltd.(a) | 45,646 | 147,881 | ||||||
Fletcher Building, Ltd.(a) | 44,941 | 225,434 | ||||||
Meridian Energy, Ltd.(a) | 91,140 | 148,771 | ||||||
Mighty River Power, Ltd.(a) | 44,790 | 85,067 | ||||||
See accompanying notes to financial statements.
10
Table of Contents
State Street Institutional Investment Trust
State Street Hedged International Developed Equity Index Fund
Schedule of Investments — (continued)
December 31, 2015
Security Description | Shares | Value | ||||||
COMMON STOCKS – (continued) |
| |||||||
New Zealand – (continued) |
| |||||||
Ryman Healthcare, Ltd.(a) | 26,363 | $ | 153,144 | |||||
Spark New Zealand, Ltd.(a) | 144,751 | 326,240 | ||||||
|
| |||||||
| 1,388,169 | ||||||||
|
| |||||||
Norway – 0.5% | ||||||||
DNB ASA(a) | 74,903 | 922,928 | ||||||
Gjensidige Forsikring ASA(a) | 12,108 | 193,797 | ||||||
Norsk Hydro ASA(a) | 92,895 | 345,312 | ||||||
Orkla ASA(a) | 59,646 | 470,558 | ||||||
Schibsted ASA Class A(a) | 4,606 | 151,435 | ||||||
Schibsted ASA Class B(b) | 5,428 | 172,995 | ||||||
Statoil ASA(a) | 84,121 | 1,173,255 | ||||||
Telenor ASA(a) | 54,734 | 912,368 | ||||||
Yara International ASA(a) | 12,232 | 526,095 | ||||||
|
| |||||||
| 4,868,743 | ||||||||
|
| |||||||
Portugal – 0.1% | ||||||||
Banco Comercial Portugues SA(a)(b) | 3,035,422 | 160,787 | ||||||
EDP – Energias de Portugal SA(a) | 182,111 | 655,936 | ||||||
Galp Energia SGPS SA(a) | 26,628 | 310,585 | ||||||
Jeronimo Martins SGPS SA(a) | 19,462 | 253,142 | ||||||
|
| |||||||
| 1,380,450 | ||||||||
|
| |||||||
Singapore – 1.1% | ||||||||
Ascendas Real Estate Investment Trust(a) | 132,000 | 211,439 | ||||||
CapitaLand Commercial Trust, Ltd.(a) | 106,000 | 100,517 | ||||||
CapitaLand Mall Trust(a) | 143,000 | 193,933 | ||||||
CapitaLand, Ltd.(a) | 176,000 | 413,467 | ||||||
City Developments, Ltd.(a) | 29,000 | 155,926 | ||||||
ComfortDelGro Corp., Ltd.(a) | 165,000 | 353,123 | ||||||
DBS Group Holdings, Ltd.(a) | 131,000 | 1,534,443 | ||||||
Genting Singapore PLC(a) | 371,000 | 200,077 | ||||||
Global Logistic Properties, Ltd.(a) | 207,000 | 312,438 | ||||||
Golden Agri-Resources, Ltd.(a) | 331,000 | 79,022 | ||||||
Hutchison Port Holdings Trust(a) | 388,000 | 205,027 | ||||||
Jardine Cycle & Carriage, Ltd.(a) | 8,333 | 203,611 | ||||||
Keppel Corp., Ltd.(a) | 97,000 | 442,879 | ||||||
Oversea-Chinese Banking Corp., Ltd.(a) | 227,839 | 1,407,852 | ||||||
Sembcorp Industries, Ltd.(a) | 63,000 | 134,968 | ||||||
Sembcorp Marine, Ltd.(a) | 47,000 | 57,800 | ||||||
Singapore Airlines, Ltd.(a) | 38,000 | 299,262 | ||||||
Singapore Exchange, Ltd.(a) | 66,000 | 356,767 | ||||||
Singapore Press Holdings, Ltd.(a) | 120,000 | 332,439 | ||||||
Singapore Technologies Engineering, Ltd.(a) | 135,000 | 285,224 | ||||||
Singapore Telecommunications, Ltd.(a) | 570,000 | 1,468,833 | ||||||
StarHub, Ltd.(a) | 32,000 | 83,232 | ||||||
Suntec Real Estate Investment Trust(a) | 155,000 | 168,716 | ||||||
United Overseas Bank, Ltd.(a) | 97,000 | 1,336,613 | ||||||
UOL Group, Ltd.(a) | 42,000 | 183,974 | ||||||
Wilmar International, Ltd.(a) | 141,000 | 290,776 | ||||||
|
| |||||||
| 10,812,358 | ||||||||
|
| |||||||
South Africa – 0.1% | ||||||||
Investec PLC(a) | 41,649 | 293,607 | ||||||
Mondi PLC(a) | 24,518 | 480,473 | ||||||
|
| |||||||
| 774,080 | ||||||||
|
| |||||||
Spain – 2.9% | ||||||||
Abertis Infraestructuras SA(a) | 40,830 | 638,292 | ||||||
ACS Actividades de Construccion y Servicios SA(a) | 15,255 | 446,138 | ||||||
Aena SA(a)(b)(e) | 4,642 | 531,332 | ||||||
Amadeus IT Holding SA Class A(a) | 32,838 | 1,446,723 | ||||||
Banco Bilbao Vizcaya Argentaria SA(a) | 468,147 | 3,419,233 | ||||||
Banco de Sabadell SA(a) | 358,912 | 635,833 | ||||||
Banco Popular Espanol SA(a) | 137,744 | 453,662 | ||||||
Banco Santander SA(a) | 1,057,149 | 5,198,354 | ||||||
Bankia SA(a) | 306,268 | 356,262 | ||||||
Bankinter SA(a) | 44,415 | 314,830 | ||||||
CaixaBank SA(a) | 204,017 | 709,810 | ||||||
Distribuidora Internacional de Alimentacion SA(a)(b) | 43,653 | 257,363 | ||||||
Enagas SA(a) | 15,780 | 444,937 | ||||||
Endesa SA(a) | 21,548 | 432,712 | ||||||
Ferrovial SA(a) | 31,250 | 706,371 | ||||||
Gas Natural SDG SA(a) | 25,335 | 516,423 | ||||||
Grifols SA(a) | 10,597 | 489,609 | ||||||
Iberdrola SA(a) | 396,913 | 2,812,539 | ||||||
Industria de Diseno Textil SA(a) | 80,373 | 2,760,000 | ||||||
Mapfre SA(a) | 72,082 | 180,358 | ||||||
Red Electrica Corp. SA(a) | 8,381 | 699,772 | ||||||
Repsol SA(a) | 73,333 | 807,008 | ||||||
Telefonica SA(a) | 330,786 | 3,668,195 | ||||||
Zardoya Otis SA(a) | 11,521 | 134,687 | ||||||
|
| |||||||
| 28,060,443 | ||||||||
|
| |||||||
Sweden – 2.7% | ||||||||
Alfa Laval AB(a) | 19,373 | 354,129 | ||||||
Assa Abloy AB Class B(a) | 74,791 | 1,567,593 | ||||||
Atlas Copco AB Class A(a) | 50,504 | 1,240,194 | ||||||
Atlas Copco AB Class B(a) | 28,998 | 667,533 | ||||||
Boliden AB(a) | 20,076 | 336,790 | ||||||
Electrolux AB Series B(a) | 19,423 | 469,230 | ||||||
Getinge AB Class B(a) | 14,678 | 384,989 | ||||||
Hennes & Mauritz AB Class B(a) | 70,096 | 2,496,543 | ||||||
Hexagon AB Class B(a) | 20,045 | 742,475 | ||||||
Husqvarna AB Class B(a) | 25,996 | 171,779 | ||||||
ICA Gruppen AB(a) | 4,915 | 178,724 | ||||||
Industrivarden AB Class C(a) | 9,677 | 165,767 | ||||||
Investment AB Kinnevik Class B(a) | 18,531 | 571,513 | ||||||
Investor AB Class B(a) | 34,235 | 1,259,761 | ||||||
Lundin Petroleum AB(a)(b) | 13,540 | 195,625 | ||||||
Nordea Bank AB(a) | 224,339 | 2,464,560 | ||||||
Sandvik AB(a) | 77,636 | 677,624 | ||||||
Securitas AB Class B(a) | 21,664 | 331,689 | ||||||
See accompanying notes to financial statements.
11
Table of Contents
State Street Institutional Investment Trust
State Street Hedged International Developed Equity Index Fund
Schedule of Investments — (continued)
December 31, 2015
Security Description | Shares | Value | ||||||
COMMON STOCKS – (continued) |
| |||||||
Sweden – (continued) | ||||||||
Skandinaviska Enskilda Banken AB Class A(a) | 114,436 | $ | 1,205,014 | |||||
Skanska AB Class B(a) | 26,859 | 521,563 | ||||||
SKF AB Class B(a) | 31,619 | 511,345 | ||||||
Svenska Cellulosa AB SCA Class B(a) | 44,259 | 1,284,281 | ||||||
Svenska Handelsbanken AB Class A(a) | 111,947 | 1,488,735 | ||||||
Swedbank AB Class A(a) | 67,700 | 1,492,914 | ||||||
Swedish Match AB(a) | 14,340 | 507,390 | ||||||
Tele2 AB Class B(a) | 21,448 | 214,165 | ||||||
Telefonaktiebolaget LM Ericsson Class B(a) | 226,767 | 2,189,142 | ||||||
TeliaSonera AB(a) | 189,269 | 941,098 | ||||||
Volvo AB Class B(a) | 117,271 | 1,088,801 | ||||||
|
| |||||||
| 25,720,966 | ||||||||
|
| |||||||
Switzerland – 9.2% | ||||||||
ABB, Ltd.(a)(b) | 161,950 | 2,892,152 | ||||||
Actelion, Ltd.(a)(b) | 7,772 | 1,080,516 | ||||||
Adecco SA(a)(b) | 12,151 | 832,146 | ||||||
Aryzta AG(a)(b) | 5,874 | 297,337 | ||||||
Baloise Holding AG(a) | 3,741 | 474,412 | ||||||
Barry Callebaut AG(a)(b) | 155 | 168,465 | ||||||
Chocoladefabriken Lindt & Spruengli AG(a)(b)(c) | 78 | 487,379 | ||||||
Chocoladefabriken Lindt & Spruengli AG(b)(c) | 7 | 521,818 | ||||||
Cie Financiere Richemont SA(a) | 38,470 | 2,755,061 | ||||||
Coca-Cola HBC AG(a)(b) | 16,525 | 351,839 | ||||||
Credit Suisse Group AG(a)(b) | 132,299 | 2,851,689 | ||||||
Dufry AG(a)(b) | 2,979 | 354,661 | ||||||
EMS-Chemie Holding AG(a) | 646 | 284,473 | ||||||
Galenica AG(a) | 294 | 460,253 | ||||||
Geberit AG(a) | 2,683 | 909,283 | ||||||
Givaudan SA(a)(b) | 694 | 1,260,338 | ||||||
Glencore PLC(a) | 922,670 | 1,222,405 | ||||||
Julius Baer Group, Ltd.(a)(b) | 15,463 | 748,504 | ||||||
Kuehne + Nagel International AG(a) | 3,914 | 536,536 | ||||||
LafargeHolcim, Ltd.(a)(b)(c) | 4,070 | 205,795 | ||||||
LafargeHolcim, Ltd.(a)(b)(c) | 27,604 | 1,383,094 | ||||||
Lonza Group AG(a)(b) | 3,793 | 617,244 | ||||||
Nestle SA(a) | 233,359 | 17,333,843 | ||||||
Novartis AG(a) | 166,630 | 14,341,982 | ||||||
Pargesa Holding SA(a) | 1,554 | 98,234 | ||||||
Partners Group Holding AG(a) | 1,283 | 461,687 | ||||||
Roche Holding AG(a) | 51,537 | 14,289,895 | ||||||
Schindler Holding AG(a)(c) | 3,473 | 581,377 | ||||||
Schindler Holding AG(a)(c) | 1,633 | 275,552 | ||||||
SGS SA(a) | 421 | 800,590 | ||||||
Sika AG(a) | 157 | 567,706 | ||||||
Sonova Holding AG(a) | 3,955 | 502,798 | ||||||
STMicroelectronics NV(a) | 47,355 | 316,899 | ||||||
Sulzer AG(a) | 1,526 | 143,520 | ||||||
Swatch Group AG(a)(c) | 2,269 | 788,416 | ||||||
Swatch Group AG(a)(c) | 4,293 | 290,083 | ||||||
Swiss Life Holding AG(a)(b) | 2,297 | 619,067 | ||||||
Swiss Prime Site AG(a)(b) | 4,345 | 339,534 | ||||||
Swiss Re AG(a) | 25,979 | 2,538,794 | ||||||
Swisscom AG(a) | 1,886 | 944,328 | ||||||
Syngenta AG(a) | 6,855 | 2,684,676 | ||||||
UBS Group AG(a) | 267,406 | 5,190,642 | ||||||
Wolseley PLC(a) | 19,798 | 1,075,068 | ||||||
Zurich Insurance Group AG(a)(b) | 11,079 | 2,847,899 | ||||||
|
| |||||||
| 87,727,990 | ||||||||
|
| |||||||
United Kingdom – 17.0% |
| |||||||
3i Group PLC(a) | 69,532 | 492,451 | ||||||
Aberdeen Asset Management PLC(a) | 71,850 | 306,107 | ||||||
Admiral Group PLC(a) | 14,933 | 364,823 | ||||||
Aggreko PLC(a) | 15,764 | 212,167 | ||||||
Amec Foster Wheeler PLC(a) | 35,323 | 222,937 | ||||||
Anglo American PLC(a) | 98,150 | 430,517 | ||||||
ARM Holdings PLC(a) | 100,418 | 1,530,262 | ||||||
Ashtead Group PLC(a) | 35,335 | 581,419 | ||||||
Associated British Foods PLC(a) | 26,911 | 1,323,943 | ||||||
AstraZeneca PLC(a) | 92,312 | 6,234,159 | ||||||
Auto Trader Group PLC(a)(b)(e) | 61,388 | 400,159 | ||||||
Aviva PLC(a) | 299,200 | 2,270,607 | ||||||
Babcock International Group PLC(a) | 19,250 | 288,020 | ||||||
BAE Systems PLC(a) | 225,721 | 1,661,535 | ||||||
Barclays PLC(a) | 1,230,204 | 3,958,936 | ||||||
Barratt Developments PLC(a) | 73,923 | 681,041 | ||||||
BG Group PLC(a) | 250,945 | 3,636,918 | ||||||
BP PLC(a) | 1,334,899 | 6,935,632 | ||||||
British American Tobacco PLC(a) | 135,978 | 7,549,865 | ||||||
British Land Co. PLC(a) | 69,138 | 799,824 | ||||||
BT Group PLC(a) | 613,405 | 4,258,356 | ||||||
Bunzl PLC(a) | 23,878 | 662,344 | ||||||
Burberry Group PLC(a) | 34,726 | 610,846 | ||||||
Capita PLC(a) | 46,758 | 831,773 | ||||||
Centrica PLC(a) | 380,381 | 1,221,145 | ||||||
CNH Industrial NV(a) | 69,290 | 474,366 | ||||||
Cobham PLC(a) | 75,167 | 313,824 | ||||||
Compass Group PLC(a) | 122,061 | 2,114,668 | ||||||
Croda International PLC(a) | 10,381 | 465,025 | ||||||
Diageo PLC(a) | 184,029 | 5,024,394 | ||||||
Direct Line Insurance Group PLC(a) | 107,728 | 645,602 | ||||||
Dixons Carphone PLC(a) | 77,516 | 570,331 | ||||||
easyJet PLC(a) | 11,298 | 289,701 | ||||||
Fiat Chrysler Automobiles NV(a)(b) | 68,822 | 955,394 | ||||||
G4S PLC(a) | 126,057 | 418,649 | ||||||
GKN PLC(a) | 117,556 | 533,345 | ||||||
GlaxoSmithKline PLC(a) | 355,091 | 7,169,899 | ||||||
Hammerson PLC(a) | 55,650 | 491,866 | ||||||
Hargreaves Lansdown PLC(a) | 18,344 | 407,165 | ||||||
HSBC Holdings PLC(a) | 1,436,037 | 11,334,072 | ||||||
ICAP PLC(a) | 44,082 | 330,816 | ||||||
IMI PLC(a) | 23,193 | 294,242 | ||||||
Imperial Tobacco Group PLC(a) | 70,246 | 3,709,472 | ||||||
Inmarsat PLC(a) | 31,781 | 532,682 | ||||||
InterContinental Hotels Group PLC(a) | 17,538 | 683,467 | ||||||
International Consolidated Airlines Group SA(a) | 63,912 | 572,618 | ||||||
Intertek Group PLC(a) | 11,493 | 470,043 | ||||||
See accompanying notes to financial statements.
12
Table of Contents
State Street Institutional Investment Trust
State Street Hedged International Developed Equity Index Fund
Schedule of Investments — (continued)
December 31, 2015
Security Description | Shares | Value | ||||||
COMMON STOCKS – (continued) |
| |||||||
United Kingdom – (continued) | ||||||||
Intu Properties PLC(a) | 70,346 | $ | 328,584 | |||||
ITV PLC(a) | 269,835 | 1,098,369 | ||||||
J Sainsbury PLC(a) | 87,286 | 332,335 | ||||||
Johnson Matthey PLC(a) | 16,076 | 628,731 | ||||||
Kingfisher PLC(a) | 163,877 | 793,574 | ||||||
Land Securities Group PLC(a) | 59,866 | 1,037,567 | ||||||
Legal & General Group PLC(a) | 442,340 | 1,745,075 | ||||||
Lloyds Banking Group PLC(a) | 4,181,759 | 4,498,630 | ||||||
London Stock Exchange Group PLC(a) | 22,295 | 901,829 | ||||||
Marks & Spencer Group PLC(a) | 115,725 | 770,363 | ||||||
Meggitt PLC(a) | 54,476 | 300,715 | ||||||
Melrose Industries PLC(a) | 69,730 | 298,623 | ||||||
Merlin Entertainments PLC(a)(e) | 47,277 | 316,930 | ||||||
National Grid PLC(a) | 274,656 | 3,787,168 | ||||||
Next PLC(a) | 10,939 | 1,174,291 | ||||||
Old Mutual PLC(a) | 353,168 | 928,876 | ||||||
Pearson PLC(a) | 58,611 | 633,482 | ||||||
Persimmon PLC(a)(b) | 22,768 | 679,107 | ||||||
Petrofac, Ltd.(a) | 15,783 | 185,092 | ||||||
Provident Financial PLC(a) | 10,443 | 517,686 | ||||||
Prudential PLC(a) | 188,415 | 4,244,030 | ||||||
Randgold Resources, Ltd.(a) | 6,190 | 381,268 | ||||||
Reckitt Benckiser Group PLC(a) | 46,879 | 4,336,656 | ||||||
RELX NV(a) | 74,808 | 1,259,417 | ||||||
RELX PLC(a) | 83,529 | 1,472,810 | ||||||
Rexam PLC(a) | 53,783 | 479,620 | ||||||
Rio Tinto PLC(a) | 92,476 | 2,691,915 | ||||||
Rio Tinto, Ltd.(a) | 29,932 | 966,459 | ||||||
Rolls-Royce Holdings PLC(a)(b) | 138,493 | 1,172,855 | ||||||
Royal Bank of Scotland Group PLC(a)(b) | 244,753 | 1,087,721 | ||||||
Royal Mail PLC(a) | 60,998 | 399,448 | ||||||
RSA Insurance Group PLC(a) | 75,377 | 472,996 | ||||||
SABMiller PLC(a) | 71,112 | 4,253,338 | ||||||
Sage Group PLC(a) | 79,789 | 708,786 | ||||||
Schroders PLC(a) | 8,489 | 371,734 | ||||||
Segro PLC(a) | 50,517 | 319,630 | ||||||
Severn Trent PLC(a) | 15,855 | 506,727 | ||||||
Sky PLC(a) | 77,574 | 1,271,392 | ||||||
Smith & Nephew PLC(a) | 67,925 | 1,210,318 | ||||||
Smiths Group PLC(a) | 26,610 | 367,912 | ||||||
Sports Direct International PLC(a)(b) | 14,393 | 122,288 | ||||||
SSE PLC(a) | 70,952 | 1,592,814 | ||||||
St James’s Place PLC(a) | 37,005 | 548,364 | ||||||
Standard Chartered PLC(a) | 249,887 | 2,072,929 | ||||||
Standard Life PLC(a) | 140,799 | 806,123 | ||||||
Tate & Lyle PLC(a) | 32,672 | 287,727 | ||||||
Taylor Wimpey PLC(a) | 240,666 | 719,291 | ||||||
Tesco PLC(a)(b) | 610,282 | 1,340,684 | ||||||
Travis Perkins PLC(a) | 17,103 | 496,065 | ||||||
Unilever NV | 119,154 | 5,191,071 | ||||||
Unilever PLC(a) | 94,117 | 4,036,059 | ||||||
United Utilities Group PLC(a) | 53,003 | 729,666 | ||||||
Vodafone Group PLC(a) | 1,938,989 | 6,286,410 | ||||||
Weir Group PLC(a) | 18,709 | 274,757 | ||||||
Whitbread PLC(a) | 14,000 | 907,246 | ||||||
William Hill PLC(a) | 60,611 | 353,659 | ||||||
Wm Morrison Supermarkets PLC(a) | 181,769 | 395,972 | ||||||
WPP PLC(a) | 95,871 | 2,204,754 | ||||||
|
| |||||||
| 162,565,365 | ||||||||
|
| |||||||
United States – 0.2% | ||||||||
Carnival PLC(a) | 13,104 | 746,332 | ||||||
Mobileye NV(b) | 4,950 | 209,286 | ||||||
QIAGEN NV(a)(b) | 17,799 | 482,227 | ||||||
Taro Pharmaceutical Industries, Ltd.(b) | 457 | 70,629 | ||||||
Transocean, Ltd.(a) | 23,107 | 289,022 | ||||||
|
| |||||||
| 1,797,496 | ||||||||
|
| |||||||
TOTAL COMMON STOCKS |
| 896,528,487 | ||||||
|
| |||||||
RIGHTS – 0.0%(d) | ||||||||
Italy – 0.0%(d) | ||||||||
UBI Banca (expiring 1/12/16)(b) | 48,215 | 2,333 | ||||||
|
| |||||||
Singapore – 0.0%(d) | ||||||||
Ascendas Real Estate Investment Trust (expiring 1/13/16)(b) | 4,950 | 216 | ||||||
|
| |||||||
Spain – 0.0%(d) | ||||||||
Repsol SA (expiring 1/14/16)(b) | 73,333 | 36,565 | ||||||
|
| |||||||
TOTAL RIGHTS | 39,114 | |||||||
|
| |||||||
SHORT-TERM INVESTMENT – 3.2% |
| |||||||
State Street Institutional Liquid Reserves Fund, Premier Class 0.23%(f)(g) | 30,478,470 | 30,478,470 | ||||||
|
| |||||||
TOTAL INVESTMENTS – 96.7% |
| 927,046,071 | ||||||
Other Assets in Excess of Liabilities – 3.3% | 31,497,603 | |||||||
|
| |||||||
NET ASSETS – 100.0% | $ | 958,543,674 | ||||||
|
| |||||||
| (a) | Security is fair valued at year end by applying factors provided by independent third party in accordance with Fund’s valuation policy and procedures. The independent fair value service takes into account multiple factors including, but not limited to, movements in the U.S. securities markets, certain depositary receipts, futures contracts and foreign currency exchange rates that have occurred subsequent to the close of foreign securities exchanges. The use of the independent fair value service or alternative fair valuation methods would result in the investments being classified within Level 2 of the fair value hierarchy.Total market value of such securities represent $882,052,172 and 92.0% of net assets of the Fund at December 31, 2015. |
| (b) | Non-income producing security |
| (c) | Reflects separate holdings of the issuer’s common stock traded on different securities exchanges. |
| (d) | Amount shown represents less than 0.05% of net assets. |
| (e) | Securities purchased pursuant to Rule 144A of the Securities Act of 1933. Securities, which represent 0.2% of net assets as of December 31, 2015, securities considered liquid based upon procedures approved by the Board of Trustees and may be resold in |
See accompanying notes to financial statements.
13
Table of Contents
State Street Institutional Investment Trust
State Street Hedged International Developed Equity Index Fund
Schedule of Investments — (continued)
December 31, 2015
transactions exempt from registration, normally to qualified institutional buyers. |
| (f) | Affiliated Fund managed by SSGA Funds Management, Inc. (Note 4). |
| (g) | The rate shown is the annualized seven-day yield at December 31, 2015. |
Abbreviations: | ||
| ADR | American Depositary Receipt | |
| REIT | Real Estate Investment Trust | |
See accompanying notes to financial statements.
14
Table of Contents
State Street Institutional Investment Trust
State Street Hedged International Developed Equity Index Fund
Schedule of Investments — (continued)
December 31, 2015
At December 31, 2015, open forward foreign currency contracts were as follows:
Counterparty | Amount Sold | Amount Bought | Settlement Date | Net Unrealized Appreciation/ (Depreciation) | ||||||||||||||||
BNP Paribas SA | USD | 113,743,938 | JPY | 13,682,485,805 | 01/06/2016 | $ | 203 | |||||||||||||
BNP Paribas SA | AUD | 484,000 | USD | 352,825 | 01/06/2016 | 708 | ||||||||||||||
BNP Paribas SA | ILS | 2,075,000 | USD | 536,511 | 01/06/2016 | 3,231 | ||||||||||||||
BNP Paribas SA | GBP | 719,000 | USD | 1,063,707 | 01/06/2016 | 3,969 | ||||||||||||||
BNP Paribas SA | EUR | 1,572,000 | USD | 1,715,643 | 01/06/2016 | 7,937 | ||||||||||||||
BNP Paribas SA | JPY | 11,056,855,805 | USD | 89,807,345 | 01/06/2016 | (2,109,619 | ) | |||||||||||||
BNP Paribas SA | NZD | 179,000 | USD | 117,652 | 01/07/2016 | (4,883 | ) | |||||||||||||
BNP Paribas SA | JPY | 13,682,485,805 | USD | 113,803,824 | 02/03/2016 | (9,388 | ) | |||||||||||||
Bank of America | USD | 28,361,445 | HKD | 219,804,035 | 01/06/2016 | 63 | ||||||||||||||
Bank of America | USD | 16,891,873 | DKK | 116,039,566 | 01/06/2016 | (84 | ) | |||||||||||||
Bank of America | USD | 4,809,368 | NOK | 42,569,520 | 01/06/2016 | (25 | ) | |||||||||||||
Bank of America | ILS | 377,000 | USD | 96,741 | 01/06/2016 | (149 | ) | |||||||||||||
Bank of America | SGD | 261,000 | USD | 185,798 | 01/06/2016 | 1,827 | ||||||||||||||
Bank of America | AUD | 385,000 | USD | 278,478 | 01/06/2016 | (1,616 | ) | |||||||||||||
Bank of America | CHF | 402,000 | USD | 405,459 | 01/06/2016 | 3,844 | ||||||||||||||
Bank of America | HKD | 3,494,000 | USD | 450,700 | 01/06/2016 | (134 | ) | |||||||||||||
Bank of America | GBP | 562,000 | USD | 843,354 | 01/06/2016 | 15,019 | ||||||||||||||
Bank of America | AUD | 1,347,000 | USD | 973,485 | 01/06/2016 | (6,479 | ) | |||||||||||||
Bank of America | JPY | 435,083,000 | USD | 3,600,333 | 01/06/2016 | (16,564 | ) | |||||||||||||
Bank of America | NOK | 36,364,520 | USD | 4,186,615 | 01/06/2016 | 78,290 | ||||||||||||||
Bank of America | DKK | 91,192,566 | USD | 12,930,347 | 01/06/2016 | (344,483 | ) | |||||||||||||
Bank of America | HKD | 191,145,035 | USD | 24,660,853 | 01/06/2016 | (2,759 | ) | |||||||||||||
Bank of America | SEK | 1,066,000 | USD | 125,388 | 01/07/2016 | (1,063 | ) | |||||||||||||
Bank of America | USD | 10,276,888 | JPY | 1,235,360,000 | 02/03/2016 | (956 | ) | |||||||||||||
Bank of America | HKD | 2,338,000 | USD | 301,733 | 02/03/2016 | (24 | ) | |||||||||||||
Bank of America | AUD | 2,795,000 | USD | 2,030,445 | 02/03/2016 | (183 | ) | |||||||||||||
Bank of America | NOK | 42,569,520 | USD | 4,807,915 | 02/03/2016 | (50 | ) | |||||||||||||
Bank of America | DKK | 116,039,566 | USD | 16,904,300 | 02/03/2016 | (509 | ) | |||||||||||||
Bank of America | HKD | 219,804,035 | USD | 28,368,583 | 02/03/2016 | (708 | ) | |||||||||||||
Bank of America | NZD | 300,000 | USD | 204,990 | 02/04/2016 | (18 | ) | |||||||||||||
Bank of Montreal | USD | 113,747,248 | JPY | 13,682,485,805 | 01/06/2016 | (3,107 | ) | |||||||||||||
Bank of Montreal | USD | 11,185,493 | SGD | 15,868,299 | 01/06/2016 | (428 | ) | |||||||||||||
Bank of Montreal | HKD | 690,000 | USD | 89,039 | 01/06/2016 | 8 | ||||||||||||||
Bank of Montreal | DKK | 736,000 | USD | 108,275 | 01/06/2016 | 1,136 | ||||||||||||||
Bank of Montreal | SGD | 186,000 | USD | 131,558 | 01/06/2016 | 453 | ||||||||||||||
Bank of Montreal | NOK | 1,559,000 | USD | 178,620 | 01/06/2016 | 2,490 | ||||||||||||||
Bank of Montreal | HKD | 1,377,000 | USD | 177,661 | 01/06/2016 | (14 | ) | |||||||||||||
Bank of Montreal | HKD | 2,493,000 | USD | 321,690 | 01/06/2016 | 16 | ||||||||||||||
Bank of Montreal | AUD | 530,000 | USD | 384,112 | 01/06/2016 | (1,471 | ) | |||||||||||||
Bank of Montreal | NOK | 3,665,000 | USD | 421,945 | 01/06/2016 | 7,887 | ||||||||||||||
Bank of Montreal | CHF | 563,000 | USD | 569,982 | 01/06/2016 | 7,521 | ||||||||||||||
Bank of Montreal | DKK | 3,921,000 | USD | 571,882 | 01/06/2016 | 1,105 | ||||||||||||||
Bank of Montreal | AUD | 961,000 | USD | 702,092 | 01/06/2016 | 2,949 | ||||||||||||||
See accompanying notes to financial statements.
15
Table of Contents
State Street Institutional Investment Trust
State Street Hedged International Developed Equity Index Fund
Schedule of Investments — (continued)
December 31, 2015
Counterparty | Amount Sold | Amount Bought | Settlement Date | Net Unrealized Appreciation/ (Depreciation) | ||||||||||||||||
Bank of Montreal | GBP | 788,000 | USD | 1,172,512 | 01/06/2016 | $ | 11,076 | |||||||||||||
Bank of Montreal | DKK | 9,484,000 | USD | 1,344,532 | 01/06/2016 | (36,046 | ) | |||||||||||||
Bank of Montreal | JPY | 171,443,000 | USD | 1,425,010 | 01/06/2016 | (216 | ) | |||||||||||||
Bank of Montreal | EUR | 1,724,000 | USD | 1,892,538 | 01/06/2016 | 19,710 | ||||||||||||||
Bank of Montreal | JPY | 310,401,000 | USD | 2,517,439 | 01/06/2016 | (62,962 | ) | |||||||||||||
Bank of Montreal | GBP | 1,923,000 | USD | 2,894,952 | 01/06/2016 | 60,633 | ||||||||||||||
Bank of Montreal | CHF | 3,001,000 | USD | 3,023,242 | 01/06/2016 | 25,116 | ||||||||||||||
Bank of Montreal | GBP | 4,196,000 | USD | 6,240,862 | 01/06/2016 | 56,359 | ||||||||||||||
Bank of Montreal | EUR | 9,175,000 | USD | 9,986,602 | 01/06/2016 | 19,551 | ||||||||||||||
Bank of Montreal | SGD | 14,157,299 | USD | 10,034,589 | 01/06/2016 | 55,554 | ||||||||||||||
Bank of Montreal | JPY | 11,056,855,805 | USD | 89,798,228 | 01/06/2016 | (2,118,737 | ) | |||||||||||||
Bank of Montreal | USD | 28,201,730 | SEK | 237,733,531 | 01/07/2016 | (1,266 | ) | |||||||||||||
Bank of Montreal | SEK | 1,494,000 | USD | 178,322 | 01/07/2016 | 1,101 | ||||||||||||||
Bank of Montreal | SEK | 7,952,000 | USD | 940,611 | 01/07/2016 | (2,672 | ) | |||||||||||||
Bank of Montreal | SEK | 8,074,000 | USD | 926,977 | 01/07/2016 | (30,779 | ) | |||||||||||||
Bank of Montreal | SEK | 195,168,531 | USD | 22,408,181 | 01/07/2016 | (743,131 | ) | |||||||||||||
Bank of Montreal | SGD | 15,868,299 | USD | 11,171,633 | 02/03/2016 | (2,780 | ) | |||||||||||||
Bank of Montreal | SEK | 237,733,531 | USD | 28,220,309 | 02/03/2016 | (2,513 | ) | |||||||||||||
Bank of Montreal | JPY | 13,682,485,805 | USD | 113,803,067 | 02/03/2016 | (10,145 | ) | |||||||||||||
Citibank N.A. | USD | 61,641,520 | AUD | 84,728,050 | 01/06/2016 | (534 | ) | |||||||||||||
Citibank N.A. | HKD | 1,256,000 | USD | 162,063 | 01/06/2016 | – | ||||||||||||||
Citibank N.A. | JPY | 156,382,000 | USD | 1,297,938 | 01/06/2016 | (2,085 | ) | |||||||||||||
Citibank N.A. | EUR | 1,230,000 | USD | 1,339,405 | 01/06/2016 | 3,222 | ||||||||||||||
Citibank N.A. | EUR | 1,860,000 | USD | 2,012,410 | 01/06/2016 | (8,158 | ) | |||||||||||||
Citibank N.A. | AUD | 71,816,050 | USD | 51,938,445 | 01/06/2016 | (308,859 | ) | |||||||||||||
Citibank N.A. | AUD | 84,728,050 | USD | 61,550,692 | 02/03/2016 | (6,065 | ) | |||||||||||||
Deutsche Bank AG | DKK | 788,000 | USD | 115,415 | 01/06/2016 | 706 | ||||||||||||||
Deutsche Bank AG | HKD | 1,473,000 | USD | 190,024 | 01/06/2016 | (39 | ) | |||||||||||||
Deutsche Bank AG | AUD | 567,000 | USD | 407,109 | 01/06/2016 | (5,393 | ) | |||||||||||||
Deutsche Bank AG | CHF | 514,000 | USD | 517,705 | 01/06/2016 | 4,197 | ||||||||||||||
Deutsche Bank AG | CHF | 603,000 | USD | 608,396 | 01/06/2016 | 5,973 | ||||||||||||||
Deutsche Bank AG | GBP | 843,000 | USD | 1,254,873 | 01/06/2016 | 12,371 | ||||||||||||||
Deutsche Bank AG | JPY | 183,422,000 | USD | 1,516,356 | 01/06/2016 | (8,453 | ) | |||||||||||||
Deutsche Bank AG | EUR | 1,844,000 | USD | 2,015,256 | 01/06/2016 | 12,069 | ||||||||||||||
Deutsche Bank AG | SEK | 1,362,000 | USD | 162,435 | 01/07/2016 | 871 | ||||||||||||||
Deutsche Bank AG | SEK | 1,598,000 | USD | 188,247 | 01/07/2016 | (1,311 | ) | |||||||||||||
Goldman Sachs Capital Markets L.P. | SGD | 125,000 | USD | 88,642 | 01/06/2016 | 533 | ||||||||||||||
Goldman Sachs Capital Markets L.P. | HKD | 1,679,000 | USD | 216,649 | 01/06/2016 | 6 | ||||||||||||||
Goldman Sachs Capital Markets L.P. | CHF | 282,000 | USD | 282,914 | 01/06/2016 | 1,184 | ||||||||||||||
Goldman Sachs Capital Markets L.P. | CHF | 345,000 | USD | 335,453 | 01/06/2016 | (9,217 | ) | |||||||||||||
Goldman Sachs Capital Markets L.P. | AUD | 647,000 | USD | 463,673 | 01/06/2016 | (7,029 | ) | |||||||||||||
Goldman Sachs Capital Markets L.P. | GBP | 395,000 | USD | 596,656 | 01/06/2016 | 14,464 | ||||||||||||||
Goldman Sachs Capital Markets L.P. | GBP | 489,000 | USD | 736,060 | 01/06/2016 | 15,321 | ||||||||||||||
Goldman Sachs Capital Markets L.P. | EUR | 1,040,000 | USD | 1,102,527 | 01/06/2016 | (27,253 | ) | |||||||||||||
Goldman Sachs Capital Markets L.P. | JPY | 209,038,000 | USD | 1,720,316 | 01/06/2016 | (17,442 | ) | |||||||||||||
See accompanying notes to financial statements.
16
Table of Contents
State Street Institutional Investment Trust
State Street Hedged International Developed Equity Index Fund
Schedule of Investments — (continued)
December 31, 2015
Counterparty | Amount Sold | Amount Bought | Settlement Date | Net Unrealized Appreciation/ (Depreciation) | ||||||||||||||||
Goldman Sachs Capital Markets L.P. | EUR | 10,434,000 | USD | 11,031,639 | 01/06/2016 | $ | (303,099 | ) | ||||||||||||
Goldman Sachs Capital Markets L.P. | SEK | 906,000 | USD | 103,841 | 01/07/2016 | (3,631 | ) | |||||||||||||
HSBC Bank USA | USD | 5,741,948 | ILS | 22,341,174 | 01/06/2016 | (213 | ) | |||||||||||||
HSBC Bank USA | ILS | 18,246,174 | USD | 4,717,712 | 01/06/2016 | 28,401 | ||||||||||||||
HSBC Bank USA | ILS | 22,341,174 | USD | 5,743,232 | 02/03/2016 | (984 | ) | |||||||||||||
JP Morgan Chase Bank, N.A. | USD | 89,924,402 | CHF | 90,008,571 | 01/06/2016 | (2,028 | ) | |||||||||||||
JP Morgan Chase Bank, N.A. | AUD | 266,000 | USD | 194,948 | 01/06/2016 | 1,429 | ||||||||||||||
JP Morgan Chase Bank, N.A. | AUD | 333,000 | USD | 238,961 | 01/06/2016 | (3,301 | ) | |||||||||||||
JP Morgan Chase Bank, N.A. | CHF | 74,348,571 | USD | 72,522,809 | 01/06/2016 | (1,754,562 | ) | |||||||||||||
JP Morgan Chase Bank, N.A. | CHF | 90,008,571 | USD | 90,016,943 | 02/03/2016 | (15,187 | ) | |||||||||||||
Morgan Stanley Bank, N.A. | SGD | 345,000 | USD | 244,819 | 01/06/2016 | 1,639 | ||||||||||||||
Morgan Stanley Bank, N.A. | HKD | 4,615,000 | USD | 595,378 | 01/06/2016 | (99 | ) | |||||||||||||
Morgan Stanley Bank, N.A. | JPY | 85,983,000 | USD | 698,751 | 01/06/2016 | (16,036 | ) | |||||||||||||
Morgan Stanley Bank, N.A. | AUD | 1,779,000 | USD | 1,300,216 | 01/06/2016 | 5,966 | ||||||||||||||
Morgan Stanley Bank, N.A. | CHF | 2,361,000 | USD | 2,303,100 | 01/06/2016 | (55,639 | ) | |||||||||||||
Morgan Stanley Bank, N.A. | JPY | 574,556,000 | USD | 4,682,084 | 01/06/2016 | (94,269 | ) | |||||||||||||
Royal Bank of Canada | USD | 149,464,383 | EUR | 137,586,157 | 01/06/2016 | (804 | ) | |||||||||||||
Royal Bank of Canada | ILS | 354,000 | USD | 91,815 | 01/06/2016 | 836 | ||||||||||||||
Royal Bank of Canada | DKK | 1,334,000 | USD | 189,376 | 01/06/2016 | (4,813 | ) | |||||||||||||
Royal Bank of Canada | ILS | 791,000 | USD | 203,424 | 01/06/2016 | 135 | ||||||||||||||
Royal Bank of Canada | DKK | 1,755,000 | USD | 259,636 | 01/06/2016 | 4,162 | ||||||||||||||
Royal Bank of Canada | DKK | 1,869,000 | USD | 274,794 | 01/06/2016 | 2,725 | ||||||||||||||
Royal Bank of Canada | SGD | 549,000 | USD | 390,408 | 01/06/2016 | 3,435 | ||||||||||||||
Royal Bank of Canada | HKD | 7,329,000 | USD | 945,743 | 01/06/2016 | 76 | ||||||||||||||
Royal Bank of Canada | CHF | 1,021,000 | USD | 994,766 | 01/06/2016 | (25,256 | ) | |||||||||||||
Royal Bank of Canada | CHF | 1,343,000 | USD | 1,370,212 | 01/06/2016 | 28,499 | ||||||||||||||
Royal Bank of Canada | CHF | 1,431,000 | USD | 1,449,325 | 01/06/2016 | 19,696 | ||||||||||||||
Royal Bank of Canada | AUD | 2,825,000 | USD | 2,040,817 | 01/06/2016 | (14,415 | ) | |||||||||||||
Royal Bank of Canada | GBP | 1,427,000 | USD | 2,133,092 | 01/06/2016 | 29,831 | ||||||||||||||
Royal Bank of Canada | GBP | 1,878,000 | USD | 2,839,731 | 01/06/2016 | 71,739 | ||||||||||||||
Royal Bank of Canada | GBP | 2,000,000 | USD | 2,965,638 | 01/06/2016 | 17,829 | ||||||||||||||
Royal Bank of Canada | EUR | 3,121,000 | USD | 3,303,535 | 01/06/2016 | (86,892 | ) | |||||||||||||
Royal Bank of Canada | EUR | 4,106,000 | USD | 4,531,320 | 01/06/2016 | 70,861 | ||||||||||||||
Royal Bank of Canada | EUR | 4,375,000 | USD | 4,801,147 | 01/06/2016 | 48,466 | ||||||||||||||
Royal Bank of Canada | JPY | 912,489,000 | USD | 7,544,062 | 01/06/2016 | (41,568 | ) | |||||||||||||
Royal Bank of Canada | EUR | 112,040,657 | USD | 118,467,309 | 01/06/2016 | (3,245,499 | ) | |||||||||||||
Royal Bank of Canada | SEK | 2,705,000 | USD | 311,509 | 01/07/2016 | (9,364 | ) | |||||||||||||
Royal Bank of Canada | SEK | 3,559,000 | USD | 420,205 | 01/07/2016 | (1,971 | ) | |||||||||||||
Royal Bank of Canada | SEK | 3,791,000 | USD | 450,224 | 01/07/2016 | 527 | ||||||||||||||
Royal Bank of Canada | USD | 16,361,592 | EUR | 15,050,000 | 02/03/2016 | (1,089 | ) | |||||||||||||
Royal Bank of Canada | USD | 4,901,462 | GBP | 3,325,000 | 02/03/2016 | (340 | ) | |||||||||||||
Royal Bank of Canada | USD | 2,704,009 | CHF | 2,703,000 | 02/03/2016 | (301 | ) | |||||||||||||
Royal Bank of Canada | USD | 1,646,429 | SEK | 13,867,000 | 02/03/2016 | (191 | ) | |||||||||||||
Royal Bank of Canada | NOK | 2,671,000 | USD | 301,640 | 02/03/2016 | (33 | ) | |||||||||||||
Royal Bank of Canada | SGD | 622,000 | USD | 437,886 | 02/03/2016 | (125 | ) | |||||||||||||
See accompanying notes to financial statements.
17
Table of Contents
State Street Institutional Investment Trust
State Street Hedged International Developed Equity Index Fund
Schedule of Investments — (continued)
December 31, 2015
Counterparty | Amount Sold | Amount Bought | Settlement Date | Net Unrealized Appreciation/ (Depreciation) | ||||||||||||||||
Royal Bank of Canada | DKK | 4,934,000 | USD | 718,696 | 02/03/2016 | $ | (96 | ) | ||||||||||||
Royal Bank of Canada | ILS | 5,336,000 | USD | 1,371,323 | 02/03/2016 | (635 | ) | |||||||||||||
Royal Bank of Canada | EUR | 137,586,157 | USD | 149,560,968 | 02/03/2016 | (5,731 | ) | |||||||||||||
Societe Generale | NOK | 981,000 | USD | 113,416 | 01/06/2016 | 2,586 | ||||||||||||||
Societe Generale | DKK | 795,000 | USD | 115,265 | 01/06/2016 | (462 | ) | |||||||||||||
Societe Generale | HKD | 982,000 | USD | 126,706 | 01/06/2016 | (2 | ) | |||||||||||||
Societe Generale | ILS | 498,000 | USD | 128,582 | 01/06/2016 | 594 | ||||||||||||||
Societe Generale | DKK | 898,000 | USD | 131,452 | 01/06/2016 | 731 | ||||||||||||||
Societe Generale | HKD | 1,486,000 | USD | 191,692 | 01/06/2016 | (48 | ) | |||||||||||||
Societe Generale | AUD | 378,000 | USD | 272,190 | 01/06/2016 | (2,811 | ) | |||||||||||||
Societe Generale | DKK | 2,469,000 | USD | 351,912 | 01/06/2016 | (7,498 | ) | |||||||||||||
Societe Generale | AUD | 572,000 | USD | 406,690 | 01/06/2016 | (9,449 | ) | |||||||||||||
Societe Generale | CHF | 608,000 | USD | 610,448 | 01/06/2016 | 3,030 | ||||||||||||||
Societe Generale | CHF | 687,000 | USD | 693,519 | 01/06/2016 | 7,177 | ||||||||||||||
Societe Generale | EUR | 864,000 | USD | 939,950 | 01/06/2016 | 1,363 | ||||||||||||||
Societe Generale | JPY | 122,338,000 | USD | 995,638 | 01/06/2016 | (21,373 | ) | |||||||||||||
Societe Generale | GBP | 850,000 | USD | 1,265,319 | 01/06/2016 | 12,500 | ||||||||||||||
Societe Generale | GBP | 961,000 | USD | 1,445,978 | 01/06/2016 | 29,556 | ||||||||||||||
Societe Generale | CHF | 1,889,000 | USD | 1,838,980 | 01/06/2016 | (48,211 | ) | |||||||||||||
Societe Generale | EUR | 2,102,000 | USD | 2,296,540 | 01/06/2016 | 13,080 | ||||||||||||||
Societe Generale | GBP | 2,642,000 | USD | 3,981,890 | 01/06/2016 | 87,835 | ||||||||||||||
Societe Generale | EUR | 5,777,000 | USD | 6,139,045 | 01/06/2016 | (136,667 | ) | |||||||||||||
Societe Generale | SEK | 1,612,000 | USD | 188,184 | 01/07/2016 | (3,035 | ) | |||||||||||||
Societe Generale | SEK | 1,821,000 | USD | 214,422 | 01/07/2016 | (1,589 | ) | |||||||||||||
Societe Generale | SEK | 5,007,000 | USD | 576,518 | 01/07/2016 | (17,423 | ) | |||||||||||||
Standard Chartered Bank | USD | 92,732,502 | GBP | 62,915,773 | 01/06/2016 | (663 | ) | |||||||||||||
Standard Chartered Bank | USD | 499,715 | HKD | 3,873,000 | 01/06/2016 | 21 | ||||||||||||||
Standard Chartered Bank | HKD | 887,000 | USD | 114,462 | 01/06/2016 | 12 | ||||||||||||||
Standard Chartered Bank | JPY | 102,685,000 | USD | 836,906 | 01/06/2016 | (16,727 | ) | |||||||||||||
Standard Chartered Bank | JPY | 185,003,000 | USD | 1,507,623 | 01/06/2016 | (30,330 | ) | |||||||||||||
Standard Chartered Bank | JPY | 1,208,338,000 | USD | 9,813,900 | 01/06/2016 | (231,158 | ) | |||||||||||||
Standard Chartered Bank | GBP | 52,652,774 | USD | 79,271,384 | 01/06/2016 | 1,666,225 | ||||||||||||||
Standard Chartered Bank | GBP | 62,915,773 | USD | 92,736,277 | 02/03/2016 | (2,947 | ) | |||||||||||||
Toronto Dominion Bank | USD | 92,732,125 | GBP | 62,915,774 | 01/06/2016 | (286 | ) | |||||||||||||
Toronto Dominion Bank | GBP | 52,652,773 | USD | 79,270,751 | 01/06/2016 | 1,665,594 | ||||||||||||||
Toronto Dominion Bank | USD | 1,240,137 | NZD | 1,811,581 | 01/07/2016 | (10 | ) | |||||||||||||
Toronto Dominion Bank | NZD | 1,632,581 | USD | 1,073,112 | 01/07/2016 | (44,481 | ) | |||||||||||||
Toronto Dominion Bank | GBP | 62,915,774 | USD | 92,736,152 | 02/03/2016 | (3,073 | ) | |||||||||||||
Toronto Dominion Bank | NZD | 1,811,581 | USD | 1,237,925 | 02/04/2016 | (38 | ) | |||||||||||||
Westpac Banking Corp. | USD | 149,463,970 | EUR | 137,586,157 | 01/06/2016 | (391 | ) | |||||||||||||
Westpac Banking Corp. | DKK | 798,000 | USD | 116,355 | 01/06/2016 | 191 | ||||||||||||||
Westpac Banking Corp. | SGD | 245,000 | USD | 173,750 | 01/06/2016 | 1,057 | ||||||||||||||
Westpac Banking Corp. | HKD | 1,491,000 | USD | 192,380 | 01/06/2016 | (5 | ) | |||||||||||||
Westpac Banking Corp. | AUD | 574,000 | USD | 413,930 | 01/06/2016 | (3,664 | ) | |||||||||||||
Westpac Banking Corp. | HKD | 3,280,000 | USD | 423,202 | 01/06/2016 | (19 | ) | |||||||||||||
Westpac Banking Corp. | CHF | 610,000 | USD | 613,985 | 01/06/2016 | 4,570 | ||||||||||||||
See accompanying notes to financial statements.
18
Table of Contents
State Street Institutional Investment Trust
State Street Hedged International Developed Equity Index Fund
Schedule of Investments — (continued)
December 31, 2015
Counterparty | Amount Sold | Amount Bought | Settlement Date | Net Unrealized Appreciation/ (Depreciation) | ||||||||||||||||
Westpac Banking Corp. | AUD | 1,264,000 | USD | 914,043 | 01/06/2016 | $ | (5,537 | ) | ||||||||||||
Westpac Banking Corp. | GBP | 853,000 | USD | 1,268,246 | 01/06/2016 | 11,005 | ||||||||||||||
Westpac Banking Corp. | JPY | 185,690,000 | USD | 1,535,563 | 01/06/2016 | (8,100 | ) | |||||||||||||
Westpac Banking Corp. | EUR | 1,867,000 | USD | 2,031,231 | 01/06/2016 | 3,058 | ||||||||||||||
Westpac Banking Corp. | JPY | 408,409,000 | USD | 3,386,757 | 01/06/2016 | (8,396 | ) | |||||||||||||
Westpac Banking Corp. | EUR | 112,040,657 | USD | 118,466,189 | 01/06/2016 | (3,246,620 | ) | |||||||||||||
Westpac Banking Corp. | SEK | 1,618,000 | USD | 191,093 | 01/07/2016 | (838 | ) | |||||||||||||
Westpac Banking Corp. | EUR | 137,586,157 | USD | 149,563,032 | 02/03/2016 | (3,667 | ) | |||||||||||||
|
| |||||||||||||||||||
| $ | (11,156,378 | ) | ||||||||||||||||||
|
| |||||||||||||||||||
At December 31, 2015, open futures contracts purchased were as follows:
Futures Contracts | Expiration | Number of | Notional | Unrealized | ||||||||||||
Mini MSCI EAFE (long) | 03/18/2016 | 323 | $ | 27,425,930 | $ | 54,909 | ||||||||||
Total | $ | 54,909 | ||||||||||||||
|
| |||||||||||||||
Abbreviations:
| AUD | – Australian Dollar | |
| CHF | – Swiss Franc | |
| DKK | – Danish Krone | |
| EUR | – Euro | |
| GBP | – British Pound | |
| HKD | – Hong Kong Dollar | |
| ILS | – Israeli New Shekel | |
| JPY | – Japanese Yen | |
| NOK | – Norwegian Krone | |
| NZD | – New Zealand Dollar | |
| SEK | – Swedish Krona | |
| SGD | – Singapore Dollar | |
| USD | – U.S. Dollar |
The following table summarizes the calue if the Fund’s investments according to the fair value hierarchy as of December 31, 2015:
Description | Level 1 — Quoted Prices | Level 2 — Other Significant Observable Inputs | Level 3 — Significant Unobservable Inputs | Total | ||||||||||||
Assets: | ||||||||||||||||
Investments: | ||||||||||||||||
Common Stocks | $ | 14,428,706 | $ | 882,099,781 | $ | – | $ | 896,528,487 | ||||||||
Rights | 36,565 | 2,549 | – | 39,114 | ||||||||||||
Short-Term Investment | 30,478,470 | – | – | 30,478,470 | ||||||||||||
Other Financial Instruments: | ||||||||||||||||
Futures Contracts | 54,909 | – | – | 54,909 | ||||||||||||
Forward Foreign Currency Contracts | – | 4,305,110 | – | 4,305,110 | ||||||||||||
|
|
|
|
|
|
|
| |||||||||
Total Investments | $ | 44,998,650 | $ | 886,407,440 | $ | – | $ | 931,406,090 | ||||||||
|
|
|
|
|
|
|
| |||||||||
Liabilities: | ||||||||||||||||
Other Financial Instruments*: | ||||||||||||||||
Forward Foreign Currency Contracts | $ | – | $ | (15,461,488 | ) | $ | – | $ | (15,461,488 | ) | ||||||
|
|
|
|
|
|
|
| |||||||||
Total Investments and Other Financial Instruments | $ | 44,998,650 | $ | 870,945,952 | $ | – | $ | 915,944,602 | ||||||||
|
|
|
|
|
|
|
| |||||||||
| * | Other financial instruments are derivative instruments not reflected in the schedule of investments such as futures and forward foreign currency contracts. |
See accompanying notes to financial statements.
19
Table of Contents
State Street Institutional Investment Trust
State Street Hedged International Developed Equity Index Fund
Statement of Assets and Liabilities
December 31, 2015
Assets |
| |||
Investments in securities of unaffiliated issuers, at value (Note 2) | $ | 896,567,601 | ||
Investments in securities of affiliated issuers, at value (Notes 2 and 4) | 30,478,470 | |||
|
| |||
Total Investments | 927,046,071 | |||
|
| |||
Cash | 87,652 | |||
Cash held at broker for futures contracts | 1,065,900 | |||
Foreign currency, at value | 1,780,659 | |||
Receivable for investments sold | 13,510 | |||
Receivable for fund shares sold | 45,674,243 | |||
Dividends receivable from unaffiliated issuers | 760,459 | |||
Dividends receivable from affiliated funds | 4,389 | |||
Receivable for foreign taxes recoverable | 167,139 | |||
Unrealized appreciation on forward currency contracts | 4,305,110 | |||
Receivable from broker – variation margin receivable for open futures contracts | 338,025 | |||
Receivable from Adviser (Note 4) | 54,829 | |||
Prepaid Expenses | 2,912 | |||
|
| |||
Total assets | 981,300,898 | |||
|
| |||
Liabilities | ||||
Payable for investments purchased | $ | 4,823,350 | ||
Payable for fund shares repurchased | 2,071,793 | |||
Unrealized depreciation on forward currency contracts | 15,461,488 | |||
Advisory fees payable (Note 4) | 100,944 | |||
Custodian fees payable (Note 4) | 121,716 | |||
Registration and filing fees payable | 100,321 | |||
Administration fees payable (Note 4) | 40,892 | |||
Professional fees payable | 25,535 | |||
Transfer agent fees payable | 1,521 | |||
Printing fees payable | 7,911 | |||
Accrued expenses and other liabilities | 1,753 | |||
|
| |||
Total liabilities | 22,757,224 | |||
|
| |||
Net Assets | $ | 958,543,674 | ||
|
| |||
Net Assets Consist of: | ||||
Paid-in capital | $ | 994,240,177 | ||
Distributions in excess of net investment income | (77,503 | ) | ||
Accumulated net realized gain | 19,817,806 | |||
Net unrealized appreciation (depreciation) on: | ||||
Investments | (44,316,144 | ) | ||
Futures contracts | 54,909 | |||
Foreign currency transactions | (11,175,571 | ) | ||
|
| |||
Net Assets | $ | 958,543,674 | ||
|
| |||
Class K | ||||
Net Assets | $ | 958,543,674 | ||
Shares of beneficial interest outstanding | 106,448,520 | |||
|
| |||
Offering, net asset value, and redemption price per share | $ | 9.00 | ||
|
| |||
Investments in securities of unaffiliated issuers, at cost | $ | 940,883,745 | ||
|
| |||
Investments in securities of affiliated issuers, at cost | $ | 30,478,470 | ||
|
| |||
Foreign currency, at cost | $ | 1,791,371 | ||
See accompanying notes to financial statements.
20
Table of Contents
State Street Institutional Investment Trust
State Street Hedged International Developed Equity Index Fund
Period Ended December 31, 2015*
Income |
| |||
Dividend income | $ | 6,061,320 | ||
Interest income | 15,633 | |||
Foreign taxes withheld | (380,049 | ) | ||
|
| |||
| 5,696,904 | ||||
|
| |||
Expenses | ||||
Advisory fees (Note 4) | 442,375 | |||
Administration fees (Note 4) | 157,991 | |||
Custodian and accounting fees (Note 4) | 435,708 | |||
Trustees’ fees and expenses (Note 5) | 7,528 | |||
Registration and filing fees | 100,659 | |||
Professional fees | 27,974 | |||
Transfer agent fees (Note 4) | 7,182 | |||
Printing fees | 20,860 | |||
Insurance fees | 3,640 | |||
Miscellaneous expenses | 8,771 | |||
|
| |||
Total expenses | 1,212,688 | |||
|
| |||
Less: Expenses waived/reimbursed by the Adviser (Note 4) | (567,455 | ) | ||
|
| |||
Net expenses | 645,233 | |||
|
| |||
Net Investment Income | $ | 5,051,671 | ||
|
| |||
Realized and Unrealized Gain (Loss) | ||||
Net realized gain (loss) on: | ||||
Investments | (622,444 | ) | ||
Foreign currency transactions | 27,330,456 | |||
Futures contracts | (3,900,965 | ) | ||
Swap contracts | (382 | ) | ||
|
| |||
Net realized gain (loss) | 22,806,665 | |||
|
| |||
Change in unrealized appreciation (depreciation) on: | ||||
Investments | (44,316,144 | ) | ||
Forwards and foreign currency transactions | (11,175,571 | ) | ||
Futures contracts | 54,909 | |||
|
| |||
Net change in unrealized appreciation (depreciation) | (55,436,806 | ) | ||
|
| |||
Net realized and unrealized loss | (32,630,141 | ) | ||
|
| |||
Net Increase (Decrease) in Net Assets from Operations | $ | (27,578,470 | ) | |
|
| |||
| * | For the period from May 29, 2015 (inception date and commencement of operations) to December 31, 2015. |
See accompanying notes to financial statements.
21
Table of Contents
State Street Institutional Investment Trust
State Street Hedged International Developed Equity Index Fund
Statements of Changes in Net Assets
| For the Period from 5/29/15* to 12/31/15 | ||||
Increase (Decrease) in Net Assets Resulting from: | ||||
Operations: | ||||
Net investment income | $ | 5,051,671 | ||
Net realized gain on investments, foreign currency transactions, futures contracts and swap contracts | 22,806,665 | |||
Change in net unrealized appreciation (depreciation) on investments, forwards and foreign currency transactions and futures contracts | (55,436,806 | ) | ||
|
| |||
Net decrease in net assets from operations | (27,578,470 | ) | ||
|
| |||
Distributions to Shareholders from: | ||||
Net investment income | ||||
Class K | (5,281,836 | ) | ||
Net realized gain on investments | ||||
Class K | (2,836,197 | ) | ||
|
| |||
Total distributions | (8,118,033 | ) | ||
|
| |||
Net Increase (Decrease) from Capital Share Transactions: | ||||
Class K | ||||
Shares sold | 1,035,865,022 | |||
Reinvestment of distributions | 8,118,033 | |||
Shares redeemed | (49,742,878 | ) | ||
|
| |||
Net increase from Capital share transactions | 994,240,177 | |||
|
| |||
Net Increase in Net Assets | 958,543,674 | |||
Net Assets | ||||
Beginning of period | – | |||
|
| |||
End of period | $ | 958,543,674 | ||
|
| |||
Distributions in excess of net investment income | $ | (77,503 | ) | |
|
| |||
Changes in Shares: | ||||
Class K | ||||
Shares sold | 110,940,307 | |||
Reinvestment of distributions | 916,257 | |||
Shares redeemed | (5,408,044 | ) | ||
|
| |||
Net increase in shares | 106,448,520 | |||
|
| |||
| * | Inception date and commencement of operations |
See accompanying notes to financial statements.
22
Table of Contents
State Street Institutional Investment Trust
State Street Hedged International Developed Equity Index Fund
Selected data for a Class K Share of beneficial interest outstanding throughout each year is presented below:
| Period from 5/29/15 – 12/31/15* | ||||
Per Share Operating Performance: | ||||
Net Asset Value, Beginning of Period | $ | 10.00 | ||
|
| |||
Investment Operations: | ||||
Net investment income(a) | 0.09 | |||
Net realized and unrealized loss on investments | (1.00 | ) | ||
|
| |||
Total from investment operations | (0.91 | ) | ||
|
| |||
Less Distributions From: | ||||
Net investment income | (0.06 | ) | ||
Net realized gains | (0.03 | ) | ||
|
| |||
Total distributions | (0.09 | ) | ||
|
| |||
Net decrease in net assets | (1.00 | ) | ||
|
| |||
Net Asset Value, End of Period | $ | 9.00 | ||
|
| |||
Total Return(b) | (9.01 | )% | ||
Ratios and Supplemental Data: | ||||
Net Assets, End of Period (000s) | $ | 958,544 | ||
Ratios to average net assets: | ||||
Expenses before waiver and payments by affiliates(c) | 0.38 | % | ||
Expenses net of waivers and payments by affiliates(c) | 0.20 | % | ||
Net investment income(c) | 1.60 | % | ||
Portfolio turnover rate(d) | 1 | % | ||
| * | Inception date and commencement of operations. |
| (a) | Net investment income per share is calculated using the average shares method. |
| (b) | Total return is calculated assuming a purchase of shares at net asset value on the first day and a sale at net asset value on the last day of each period reported. Distributions are assumed, for the purpose of this calculation, to be reinvested at net asset value per share on the respective payment dates. Total return for periods of less than one year are not annualized. Results represent past performance and are not indicative of future results. |
| (c) | Annualized. |
| (d) | Not annualized. |
See accompanying notes to financial statements.
23
Table of Contents
State Street Institutional Investment Trust
State Street Hedged International Developed Equity Index Fund
December 31, 2015
| 1. | Organization |
State Street Institutional Investment Trust (the “Trust”) which is registered under the Investment Company Act of 1940, as amended (the “1940 Act”), is as an open-end management investment company, and was organized as a Massachusetts business trust on February 16, 2000. The Trust consists of forty-five (45) series and corresponding classes, each of which have the same rights and privileges, including the same voting rights. The financial statements herein relate only to the State Street Hedged International Developed Equity Index Fund (the “Fund”). The Fund has registered Class A, Class C, Class K, and Class I Shares. The Fund’s Class K was formed and commenced operations on May 29, 2015. Class A, Class C and Class I Shares were not operational at December 31, 2015.
The Fund is authorized to issue an unlimited number of shares, with no par value.
The investment objective of the Fund is to seek to provide investment results that, before fees and expenses, correspond generally to the total return performance of a broad-based developed market (ex-U.S. and Canada) large and mid-capitalization equity index, hedged to the U.S. dollar, over the long term. The Fund is classified as a diversified investment company under the 1940 Act.
Under the Trust’s organizational documents, its officers and trustees are indemnified against certain liabilities arising out of the performance of their duties to the Trust. Additionally, in the normal course of business, the Trust enters into contracts with service providers that contain general indemnification clauses. The Trust’s maximum exposure under these arrangements is unknown as this could involve future claims that may be made against the Trust that have not yet occurred.
| 2. | Summary of Significant Accounting Policies |
The following is a summary of significant accounting policies followed by the Trust in the preparation of its financial statements:
The preparation of financial statements in accordance with U.S. generally accepted accounting principles (“U.S. GAAP”) requires management to make estimates and assumptions that affect the reported amounts and disclosures in the financial statements. Actual results could differ from those estimates. The Fund is an investment company under U.S. GAAP and follows the accounting and reporting guidance applicable to investment companies in Financial Accounting Standards Board (“FASB”) Accounting Standards Codification (“ASC”) 946, Financial Services Investment Companies (“ASC 946”).
Security Valuation
The Fund’s investments are valued at fair value each day that the Fund’s listing exchange is open and, for financial reporting purposes, as of the report date should the reporting period end on a day that the Fund’s listing exchange is not open. Fair value is generally defined as the price a fund would receive to sell an asset or pay to transfer a liability in an orderly transaction between market participants at the measurement date. By its nature, a fair value price is a good faith estimate of the valuation in a current sale and may not reflect an actual market price. The investments of the Fund are valued pursuant to policy and procedures developed by the Oversight Committee (the “Committee”) and approved by the Board of Trustees of the Trust (the “Board”). The Committee provides oversight of the valuation of
24
Table of Contents
State Street Institutional Investment Trust
State Street Hedged International Developed Equity Index Fund
Notes to Financial Statements — (continued)
December 31, 2015
investments for the Fund. The Board has responsibility for determining the fair value of investments Valuation techniques used to value the Fund’s investments by major category are as follows:
| • | Equity investments (including preferred stocks and registered investment companies that are exchange traded) traded on a recognized securities exchange for which market quotations are readily available are valued at the last sale price or official closing price, as applicable, on the primary market or exchange on which they trade. Equity investments traded on a recognized exchange for which there were no sales on that day are valued at the last published sale price or at fair value. |
| • | Rights and warrants are valued at the last reported sale price obtained from independent pricing services or brokers on the valuation date. If no prices are obtained from pricing services or brokers, valuation will be based upon the intrinsic value pursuant to the valuation policy and procedures approved by the Board. |
| • | Investments in registered investment companies (including money market funds) or other unitized pooled investment vehicles that are not traded on an exchange are valued at that day’s published net asset value per share or unit. Money market funds generally value portfolio investments using the amortized cost method as set forth in Rule 2a-7 under the 1940 Act and in accordance with Fund procedures to stabilize net asset value. |
| • | Exchange-traded futures contracts are valued at the closing settlement price on the primary market on which they are traded most extensively. Exchange-traded futures contracts traded on a recognized exchange for which there were no sales on that day are valued at the last reported sale price obtained from independent pricing services or brokers or at fair value. |
| • | Forward foreign currency contracts are valued based on that day’s prevailing forward exchange rate for the underlying currencies. The rates are obtained from independent pricing services in accordance with the valuation policy and procedures approved by the Board. |
In the event prices or quotations are not readily available or that application of these valuation methods results in a price for an investment that is deemed to be not representative of the fair value of such investment, fair value will be determined in good faith by the Committee, in accordance with the valuation policy and procedures approved by the Board.
Fair value pricing could result in a difference between the prices used to calculate the Fund’s net asset value and the prices used by the Fund’s underlying index, which in turn could result in a difference between the Fund’s performance and the performance of the Fund’s underlying index. Various inputs are used in determining the value of the Fund’s investments. These inputs are categorized into a hierarchy consisting of three broad levels for financial reporting purposes.
The Fund values its assets and liabilities at fair value using a hierarchy that prioritizes the inputs to valuation techniques, giving the highest priority to readily available unadjusted quoted prices in active markets for identical assets or liabilities (Level 1 measurements) and the lowest priority to unobservable inputs (Level 3 measurements) when market prices are not readily available or reliable. The categorization of a value determined for an investment within the hierarchy is based upon the pricing transparency of the investment and is not necessarily an indication of the risk associated with investing in it.
25
Table of Contents
State Street Institutional Investment Trust
State Street Hedged International Developed Equity Index Fund
Notes to Financial Statements — (continued)
December 31, 2015
The three levels of the fair value hierarchy are as follows:
| • | Level 1 – Unadjusted quoted prices in active markets for identical assets or liabilities; |
| • | Level 2 – Inputs other than quoted prices included within Level 1 that are observable for the asset or liability, either directly or indirectly, including quoted prices for similar assets or liabilities in active markets, quoted prices for identical or similar assets or liabilities in markets that are not considered to be active, inputs other than quoted prices that are observable for the asset or liability (such as exchange rates, financing terms, interest rates, yield curves, volatilities, prepayment speeds, loss severities, credit risks and default rates) or other market-corroborated inputs; and |
| • | Level 3 – Unobservable inputs for the asset or liability, including the Committee’s assumptions used in determining the fair value of investments. |
Changes in valuation techniques may result in transfers in or out of an assigned level within the fair value hierarchy. Transfers between different levels of the fair value hierarchy are recognized at the end of the reporting period. The Fund commenced operation during the period ended December 31, 2015, as such the Fund had no significant transfers between levels for the period ended December 31, 2015.
Investment Transactions and Income Recognition
Investment transactions are accounted for on the trade date for financial reporting purposes. Dividend income and capital gain distributions, if any, are recognized daily on the ex-dividend date, net of foreign taxes withheld at source, if any. Non-cash dividends received in the form of stock, if any, are received as dividend income at fair value. Distributions received by the Fund may include a return of capital that is estimated by management. Such amounts, if any, are recorded as a reduction of the cost of investments or reclassified to capital gains. Realized gains and losses from the sale or disposition of investments are recorded on the identified cost basis.
Expenses
Advisory fees and other expenses which are directly identifiable to a specific fund are applied to that fund within the Trust. Trustees’ fees and other expenses which can not be attributed to a specific fund are allocated in such a manner as deemed equitable, taking into consideration the nature and type of expense and the relative net assets of the funds. Class specific fees and expenses are borne by each class.
Foreign Currency Translation
The accounting records of the Fund are maintained in U.S. dollars. Foreign currencies as well as investment securities and other assets and liabilities denominated in a foreign currency are translated to U.S. dollars using exchange rates deemed appropriate pursuant to the valuation policy and procedures at period end. Purchases and sales of securities, income receipts and expense payments are translated into U.S. dollars at the prevailing exchange rate on the respective dates of transactions. The Fund does not isolate the effect of changes in foreign exchange from the effect of fluctuations in the market price of securities. Such fluctuations are reflected by the Fund as a component of realized and unrealized gains and losses on investments and for financial reporting purposes.
26
Table of Contents
State Street Institutional Investment Trust
State Street Hedged International Developed Equity Index Fund
Notes to Financial Statements — (continued)
December 31, 2015
Foreign Taxes
The Fund may be subject to foreign taxes (a portion of which may be reclaimable) on income, stock dividends, capital gains on investments or certain foreign currency transactions. All foreign taxes are recorded in accordance with applicable foreign tax regulations and rates that exist in the foreign jurisdictions in which the Fund invests. These foreign taxes, if any, are paid by the Fund and are reflected in the Statement of Operations, if applicable. Foreign taxes payable or deferred as of December 31, 2015, if any, are disclosed in the Fund’s Statement of Assets and Liabilities.
Futures
The Fund may enter into futures contracts to meet its objectives. A futures contract is a standardized, exchange-traded agreement to buy or sell a financial instrument at a set price on a future date. Upon entering into a futures contract, the Fund is required to deposit with the broker, cash or securities in an amount equal to the minimum initial margin requirements of the clearing house. Variation margin payments are made or received by the Fund each day, depending on the daily fluctuations in the value of the underlying security or index. Such receipt or payment is recorded by the Fund for financial statement purposes as part of unrealized gains or losses, and is recorded on the Statement of Assets and Liabilities as Daily variation margin receivable for futures contracts. The Fund recognizes a realized gain or loss when a contract is closed, which is recorded on the Statement of Operations. The risk of loss in trading futures contracts in some strategies is potentially unlimited.
Losses may arise if the value of a futures contract decreases due to unfavorable changes in the market rates or values of the underlying instrument during the term of the contract or if the counterparty does not perform under the contract. The use of futures contracts also involves the risk that the movements in the price of the futures contracts do not correlate the movement of the assets underlying such contracts.
For the period ended December 31, 2015, the Fund entered into futures contracts to hedge non US currency exposure in a manner intended to replicate the currency hedged reflected in the Index.
Forward Foreign Currency Contracts
The Fund may engage in forward foreign currency contracts to acquire exposure to foreign currencies or to hedge the Fund’s investments against currency fluctuations. A forward foreign currency contract is a commitment to purchase or sell a foreign currency at the settlement date at a negotiated rate. Forward foreign currency contracts are valued based on that day’s prevailing forward exchange rate for the underlying currencies and are marked-to-market daily. The change in market value is recorded by the Fund as an unrealized gain or loss. When the contract is closed, the Fund recognizes a realized gain or loss equal to the difference between the value of the contract at the time it was opened and the value at the time it was closed.
Certain risks may arise upon entering into forward foreign currency contracts from the potential inability of counterparties to meet the terms of their contracts and are generally limited to the amount of unrealized gains on appreciated contracts, if any. Additionally, when utilizing forward foreign currency contracts to hedge, the Fund gives up the opportunity to profit from favorable exchange rate movements during the term of the contract.
27
Table of Contents
State Street Institutional Investment Trust
State Street Hedged International Developed Equity Index Fund
Notes to Financial Statements — (continued)
December 31, 2015
For the period ended December 31, 2015, the Fund entered into forward foreign currency exchange contracts to offset the Fund’s exposure to the component currencies.
Swaps
Certain funds may enter into swap agreements, in which a Fund and counterparty agree either to make periodic net payments on a specified notional amount or a net payment upon termination. Swap agreements are privately negotiated in the OTC market and may be entered into as a bilateral contract (“BL OTC”) or centrally cleared (“centrally cleared swaps”). Swaps are marked-to-market daily and changes in value are recorded as unrealized appreciation (depreciation).
A BL OTC swap is a transaction between a fund and dealer counterparty where cash flows are exchanged between the two parties for the life of the swap. For BL OTC swaps, any upfront premiums paid are recorded as assets and any upfront fees received are recorded as liabilities and are shown as credit default swap contracts premiums paid and credit default swap contracts premiums received, respectively, in the Statements of Assets and Liabilities and amortized to realized gain/loss ratably over the term of the BL OTC swap. Payments received or made by the Fund for BL OTC swaps are recorded in the Statements of Operations as realized gains or losses, respectively. When a BL OTC swap is terminated, a Fund will record a realized gain or loss equal to the difference between the proceeds from (or cost of) the closing transaction and the Fund’s basis in the contract, if any. Generally, the basis of the contracts is the premium received or paid.
A centrally cleared OTC swap is a transaction executed between a fund and a dealer counterparty, then cleared by a futures commission merchant (FCM) through a clearinghouse. Once cleared, the clearinghouse serves as a central counterparty (“CCP”), with whom a fund exchanges cash flows for the life of the transaction, similar to transactions in futures contracts. A Fund is required to interface with the CCP through a broker. Upon entering into a centrally cleared swap, the Fund is required to deposit initial margin with the broker in the form of cash or securities in an amount that varies depending on the size and risk profile of the particular swap. Securities deposited as initial margin if any, are designated on the Schedule of Investments and cash deposited is segregated and recorded on the Statements of Assets and Liabilities as Due from broker. The daily change in valuation of centrally cleared swaps is recorded as a receivable or payable for variation margin in the Statements of Assets and Liabilities. Payments received from (paid to) the counterparty, including at termination, are recorded as realized gain (loss) in the Statements of Operations. For both bi-lateral and centrally cleared OTC swaps, payments are exchanged at specified intervals, accrued daily commencing with the effective date of the contract and recorded as realized gain or (loss). Some swaps may be terminated prior to the effective date and realize a gain or loss upon termination.
Total Return Swaps
The Fund enters into total return swaps to obtain investment exposures that the Adviser expects to correlate closely with the Index or a portion of the Index. Total return swaps are agreements in which there is an exchange of cash flows whereby one party commits to make payments on the total return (coupon plus capital gains/losses) of an underlying instrument in exchange for fixed or floating rate interest payments. To the extent the total return of the instrument or index underlying the transaction exceeds or falls short of the offsetting interest rate obligation, the Fund will receive a payment or make a payment to the counterparty. As of December 31, 2015, the Fund held no total return swap agreements.
28
Table of Contents
State Street Institutional Investment Trust
State Street Hedged International Developed Equity Index Fund
Notes to Financial Statements — (continued)
December 31, 2015
Risks associated with Derivatives
Derivative transactions can create investment leverage and may be highly volatile. Use of derivatives other than for hedging purposes may be considered speculative. When the Fund invests in a derivative instrument, the future exposure is potentially unlimited. The value of a derivative instrument will depend on the ability and the willingness of the Fund’s derivative counterparty to perform its obligations under the transaction. A liquid secondary market may not always exist for the Fund’s derivative positions at any time and may impact the Fund’s ability to establish fair market value of a derivative transaction and close out derivative positions. Although the use of derivatives is intended to complement the Fund’s performance, it may instead reduce returns and increase volatility. The measurement of the risks associated with derivative instruments is meaningful only when all related and offsetting transactions are considered. The Fund must set aside liquid assets or engage in other appropriate measures to cover its obligations under these derivative instruments.
Regulations recently adopted or proposed by regulators in the U.S. and other countries may substantially affect the markets in which derivatives are traded, including requiring central clearing and reporting of transactions that may not have been previously required to be reported or cleared. These regulations may require, among other things, that the Fund post greater amounts of collateral or margin than the amounts currently posted by the Fund on a bilateral basis with its derivatives counterparties or with derivatives clearing organizations. In addition, the regulations may make certain types of derivatives uneconomical or unavailable to the Fund, and they may substantially reduce the liquidity for some derivatives. The full extent of the new regulations and their effects on the derivatives markets are not known at this time.
Certain derivatives, including forward foreign currency contracts and some swap contracts, as applicable, are entered into OTC under the terms and conditions of an ISDA Master Agreement, which are separately negotiated with each counterparty. An ISDA Master Agreement is a bilateral agreement between each Fund and a counterparty that governs certain OTC derivatives and typically contains, among other things, collateral posting terms and netting provisions in the event of a default and/or termination event. Under an ISDA Master Agreement, each Fund may, under certain circumstances, offset with the counterparty certain derivative financial instruments’ payables and/or receivables with collateral held and/or posted and create one single net payment. The provisions of the ISDA Master Agreement typically permit a single net payment in the event of default including the bankruptcy or insolvency of the counterparty. Bankruptcy or insolvency laws of a particular jurisdiction may restrict or prohibit the right of offset in bankruptcy, insolvency or other events. In addition, certain ISDA Master Agreements allow counterparties to terminate derivative contracts prior to maturity in the event a Fund’s net assets decline by a stated percentage or the Fund fails to meet the terms of its ISDA Master Agreements. The result would cause the Fund to accelerate payment of any net liability owed to the counterparty.
For derivatives traded under an ISDA Master Agreement, the collateral requirements are typically calculated by netting the mark-to-market amount for each transaction under such agreement and comparing that amount to the value of any collateral currently pledged by the Fund and the counterparty. Cash collateral that has been pledged to cover obligations of a Fund and cash collateral received from the counterparty, if any, is reported separately on the Statements of Assets and Liabilities as cash pledged as collateral and cash received as collateral, respectively. Non-cash collateral pledged
29
Table of Contents
State Street Institutional Investment Trust
State Street Hedged International Developed Equity Index Fund
Notes to Financial Statements — (continued)
December 31, 2015
by the Fund, if any, is noted in the Schedule of Investments. Notional principal amounts are one component used to calculate the amount of exposure to the underlying instrument, but is not the amount delivered under the contract. Accordingly, credit risk is limited to any amounts receivable from the counterparty. To reduce credit risk from potential counterparty default, the Fund enters into swap contracts with counterparties whose creditworthiness has been approved by the Trustees. The Fund bears the market risk arising from any change in index or security values or interest rates.
The following tables summarize the value of the Fund’s derivative instruments as of December 31, 2015, and the related location in the accompanying Statement of Assets and Liabilities and Statement of Operations, presented by primary underlying risk exposure:
Asset Derivatives
| Foreign Exchange Contracts Risk | Equity Contracts Risk | Total | ||||||||||
Forwards Contracts(1) | $ | 4,305,110 | $ | – | $ | 4,305,110 | ||||||
Futures Contracts(2) | $ | – | $ | 54,909 | $ | 54,909 | ||||||
Liability Derivatives
| Foreign Exchange Contracts Risk | Total | |||||
Forwards Contracts(3) | $(15,461,488) | $ | (15,461,488 | ) | ||
Transactions in derivative instruments during the period ended December 31, 2015, were as follows:
Net Realized Gain (Loss)
| Foreign Exchange Contracts Risk | Equity Contracts Risk | Total | ||||||||||
Forwards Contracts(4) | $ | 27,330,456 | $ | – | $ | 27,330,456 | ||||||
Futures Contracts(5) | $ | – | $ | (3,900,965 | ) | $ | (3,900,965 | ) | ||||
Swap Contracts(6) | $ | – | $ | (382 | ) | $ | (382 | ) | ||||
Change in Unrealized Appreciation (Depreciation)
| Foreign Exchange Contracts Risk | Equity Contracts Risk | Total | ||||||||||
Forwards Contracts(7) | $ | (11,175,571 | ) | $ | – | $ | (11,175,571 | ) | ||||
Futures Contracts(8) | $ | – | $ | 54,909 | $ | 54,909 | ||||||
| (1) | Statement of Assets and Liabilities: Unrealized appreciation on forward currency contracts |
| (2) | Portfolio of Investments: Unrealized appreciation (depreciation) of futures contracts. Only unsettled receivable/payable for variation margin amounting to $338,025 is reported within Statement of Assets and Liabilities. |
| (3) | Statement of Assets and Liabilities: Unrealized depreciation on forward currency contracts |
| (4) | Statement of Operations location: Net realized gain (loss) on: Forward currency contracts |
| (5) | Statement of Operations location: Net realized gain (loss) on: Futures contracts |
| (6) | Statement of Operations location: Net realized gain (loss) on: Swaps |
30
Table of Contents
State Street Institutional Investment Trust
State Street Hedged International Developed Equity Index Fund
Notes to Financial Statements – (continued)
December 31, 2015
| (7) | Statement of Operations location: Net change in unrealized appreciation (depreciation) on: Foreign currency transactions |
| (8) | Statement of Operations location: Net change in unrealized appreciation (depreciation) on: Futures contracts |
The average notional of futures outstanding during the period ended December 31, 2015 was $25,709,808.
Offsetting of Financial Assets and Derivative Assets |
| |||||||||||||||
| Foreign Currency Exchange Contracts | ||||||||||||||||
| Counterparty | Gross Amounts of Assets | Amount | Collateral (Received)/ Pledged | Net Amount | ||||||||||||
Bank of America | $ | 99,043 | $ | (99,043 | ) | $ | – | $ | – | |||||||
Bank of Montreal | 272,665 | (272,665 | ) | – | – | |||||||||||
BNP Paribas SA | 16,048 | (16,048 | ) | – | – | |||||||||||
Citibank N.A. | 3,222 | (3,222 | ) | – | – | |||||||||||
Deutsche Bank AG | 36,187 | (15,196 | ) | – | 20,991 | |||||||||||
Goldman Sachs Capital Markets L.P. | 31,508 | (31,508 | ) | – | – | |||||||||||
HSBC Bank USA | 28,401 | (1,197 | ) | – | 27,204 | |||||||||||
JP Morgan Chase Bank, N.A. | 1,429 | (1,429 | ) | – | – | |||||||||||
Morgan Stanley Bank, N.A. | 7,605 | (7,605 | ) | – | – | |||||||||||
Royal Bank of Canada | 298,817 | (298,817 | ) | – | – | |||||||||||
Societe Generale | 158,452 | (158,452 | ) | – | – | |||||||||||
Standard Chartered Bank | 1,666,258 | (281,825 | ) | – | 1,384,433 | |||||||||||
Toronto Dominion Bank | 1,665,594 | (47,888 | ) | – | 1,617,706 | |||||||||||
Westpac Banking Corp. | 19,881 | (19,881 | ) | – | – | |||||||||||
| $ | 4,305,110 | $ | (1,254,776 | ) | $ | – | $ | 3,050,334 | ||||||||
Offsetting of Financial Liabilities and Derivative Liabilities |
| |||||||||||||||
| Foreign Currency Exchange Contracts | ||||||||||||||||
| Counterparty | Gross Amounts of Liabilities | Amount | Collateral (Received)/ Pledged | Net Amount | ||||||||||||
Bank of America | $ | (375,804 | ) | $ | 99,043 | $ | – | $ | (276,761 | ) | ||||||
Bank of Montreal | (3,016,267 | ) | 272,665 | – | (2,743,602 | ) | ||||||||||
BNP Paribas SA | (2,123,890 | ) | 16,048 | – | (2,107,842 | ) | ||||||||||
Citibank N.A. | (325,701 | ) | 3,222 | – | (322,479 | ) | ||||||||||
Deutsche Bank AG | (15,196 | ) | 15,196 | – | – | |||||||||||
Goldman Sachs Capital Markets L.P. | (367,671 | ) | 31,508 | – | (336,163 | ) | ||||||||||
HSBC Bank USA | (1,197 | ) | 1,197 | – | – | |||||||||||
JP Morgan Chase Bank, N.A. | (1,775,078 | ) | 1,429 | – | (1,773,649 | ) | ||||||||||
Morgan Stanley Bank, N.A. | (166,043 | ) | 7,605 | – | (158,438 | ) | ||||||||||
Royal Bank of Canada | (3,439,123 | ) | 298,817 | – | (3,140,306 | ) | ||||||||||
Societe Generale | (248,568 | ) | 158,452 | – | (90,116 | ) | ||||||||||
Standard Chartered Bank | (281,825 | ) | 281,825 | – | – | |||||||||||
Toronto Dominion Bank | (47,888 | ) | 47,888 | – | – | |||||||||||
Westpac Banking Corp. | (3,277,237 | ) | 19,881 | – | (3,257,356 | ) | ||||||||||
| $ | (15,461,488 | ) | $ | 1,254,776 | $ | – | $ | (14,206,712 | ) | |||||||
| (a) | The actual collateral received and/or pledged may be more than the amount shown. |
Amounts presented on the Schedule of Investments and Statement of Assets and Liabilities are not net settlement amounts but gross.
31
Table of Contents
State Street Institutional Investment Trust
State Street Hedged International Developed Equity Index Fund
Notes to Financial Statements — (continued)
December 31, 2015
Federal Income Tax
The Fund intends to qualify for and elect treatment as a “regulated investment company” under Subchapter M of the Internal Revenue Code of 1986, as amended. By so qualifying and electing, the Fund will not be subject to federal income taxes to the extent it distribute its taxable income, including any net realized capital gains, for each fiscal year. In addition, by distributing during each calendar year substantially all of its net investment income and capital gains, if any, the Fund will not be subject to federal excise tax. Income and capital gain distributions are determined in accordance with income tax regulations which may differ from U.S. GAAP. These book-tax differences are primarily due to differing treatments for foreign currencies and losses deferred due to wash sales.
Additionally, based on SSGA Funds Management, Inc. (“SSGA FM or the “Adviser”) understanding of the tax rules and rates related to income, gains and transactions for the foreign jurisdictions in which the Fund invests, the Fund will provide for foreign taxes and, where appropriate, deferred foreign taxes.
SSGA FM has reviewed the tax positions for the open tax year as of December 31, 2015 and has determined that no provision for income tax is required in the Fund’s financial statements. The Fund’s federal tax return for the initial fiscal year remains subject to examination by the Fund’s major tax jurisdictions, which include the United States of America and the Commonwealth of Massachusetts. The Fund recognizes interest and penalties, if any, related to tax liabilities as income tax expense in the Statement of Operations.
No income tax returns are currently under examination. Management has analyzed tax laws and regulations and their applications to the Fund’s facts and circumstances and does not believe there are any uncertain tax positions that require recognition of a tax liability.
The tax character of distributions paid to shareholders during the period ended December 31, 2015, was as follows:
| Fund | Ordinary Income | Long-Term Capital Gain | Total | |||||||||
State Street Hedged International Developed Equity Index Fund | $ | 6,565,099 | $ | 1,552,934 | $ | 8,118,033 | ||||||
At December 31, 2015, the components of distributable earnings on a tax basis were as follows:
| Fund | Undistributed Ordinary Income | Undistributed Capital Gains | Unrealized Appreciation (Depreciation) | Total | ||||||||||||
State Street Hedged International Developed Equity Index Fund | $ | 4,164,676 | $ | 5,386,265 | $ | (45,247,444 | ) | $ | (35,696,503 | ) | ||||||
32
Table of Contents
State Street Institutional Investment Trust
State Street Hedged International Developed Equity Index Fund
Notes to Financial Statements — (continued)
December 31, 2015
For the period ended December 31, 2015, permanent differences identified and reclassified among the components of net assets were as follows:
| Fund | Paid-In Capital | Accumulated Gain (Loss) | Undistributed Net Investment Income (Loss) | |||||||||
State Street Hedged International Developed Equity Index Fund | $ | – | $ | (152,662 | ) | $ | 152,662 | |||||
These differences were primarily attributable to distribution redesignations. Net investment income (loss), net realized gains (losses), and net assets were not affected by this reclassification.
At December 31, 2015, the gross unrealized appreciation and gross unrealized depreciation of investments based on cost for federal income tax purpose were as follows:
| Fund | Tax Cost | Gross Unrealized Appreciation | Gross Unrealized Depreciation | Net Unrealized Depreciation | ||||||||||||
State Street Hedged International Developed Equity Index Fund | $ | 971,952,158 | $ | 15,224,528 | $ | (60,130,615 | ) | $ | (44,906,087 | ) | ||||||
Distributions
Dividends from net investment income, if any, are declared and paid at least annually. Net realized capital gains, if any, are distributed annually, unless additional distributions are required for compliance with applicable tax regulations. The amount and character of income and gains to be distributed are determined in accordance with federal tax regulations which may differ from net investment income and realized gains recognized for U.S. GAAP purposes.
3. Investment Transactions
Purchases and sales of investments (excluding short-term securities) for the period ended December 31, 2015, were $944,101,235 and $2,835,174, respectively.
4. Related Party and Other Fees
The Trust, on behalf of the Fund, has entered into an Investment Advisory Agreement with the Adviser. For its advisory services to the Fund, the Fund pays the Adviser a management fee at an annual rate of 0.14% of its average daily net assets.
The Adviser is contractually obligated until April 30, 2017, to waive its management fee and/or to reimburse the Fund for expenses to the extent that total expenses (exclusive of non-recurring account fees, extraordinary expenses, acquired fund fees and expenses, and any class specific expenses, such as distribution, shareholder servicing, administration, and sub-transfer agency fees) exceed 0.15% of average daily net assets on an annual basis. This waiver and/or reimbursement may not be terminated during the relevant period except with the approval of the Board. For the period ended December 31, 2015, SSGA FM reimbursed or waived the fees under these agreements as shown on the respective Statements of Operations.
33
Table of Contents
State Street Institutional Investment Trust
State Street Hedged International Developed Equity Index Fund
Notes to Financial Statements — (continued)
December 31, 2015
SSGA FM serves as administrator and State Street serves as sub-administrator and custodian. Pursuant to the Administration Agreement between the Trust, on behalf of the Fund, and SSGA FM, the Fund pays a fee at an annual rate of 0.05% of the Fund’s average daily net assets. The fees are accrued daily and paid monthly. For the period ended December 31, 2015, the administration fees incurred are shown on the Statement of Operations. The fund pays State Street for custody and accounting services. SSGA FM pays State Street for its services as sub-administrator.
Boston Financial Data Services (“BFDS”), a joint venture of DST Systems, Inc. and State Street Corporation, serves as transfer agent and dividend disbursing agent to the Fund. For these services, the Fund pays annual account services fees, activity-based fees, charges related to compliance and regulatory services.
Transactions with Affiliates
Certain investments made by the Fund were securities affiliated with SSGA FM. The Fund invested in the State Street Institutional Liquid Reserves Fund. Transactions in affiliates for the period ending December 31, 2015, were as follows:
Security | Number of shares held at 5/29/15* | Shares purchased for the period ended 12/31/15 | Shares sold for the period ended 12/31/15 | Number of shares held at 12/31/15 | Value at 12/31/15 | Income earned for the period ended 12/31/15 | ||||||||||||||||||
State Street Institutional | – | 211,222,294 | 180,743,824 | 30,478,470 | $ | 30,478,470 | $ | 17,484 | ||||||||||||||||
| * | Commencement of operations. |
5. Trustees’ Fees
Independent Trustees are compensated on a calendar year basis. Any Trustee who is deemed to be an “interested person” (as defined in the 1940 Act) of the Fund does not receive compensation from the Fund for his or her service as a Trustee.
Each Independent Trustee receives for his or her services to the Trust, the State Street Master Funds, and SSGA Funds, a $141,500 annual base retainer in addition to $18,000 for each in-person meeting and $2,000 for each telephonic meeting from the Trusts. The Co-Chairmen each receive an additional $44,000 annual retainer. The Independent Trustees are reimbursed for travel and other out-of- pocket expenses in connection with meeting attendance. Trustees’ fees and expenses are allocated among the Trusts and Funds overseen by the Trustees in a manner deemed equitable taking into consideration the relative net assets of the Funds, subject to a $15,000 minimum per Fund. As of the date of these financial statements, the Trustees were not paid pension or retirement benefits as part of the Trust’s expenses.
6. Concentration Risk
The Fund’s assets may be concentrated in a particular state or geographic area, or in a particular industry, group of industries or sector. Because the Fund will generally concentrate its investments to approximately the same extent that its index is so concentrated, a Fund may be adversely affected by the performance of investments of a particular state or geographic area, or in a particular industry, group of industries or sector, and its shares may be subject to increased price volatility. In addition, if the Fund
34
Table of Contents
State Street Institutional Investment Trust
State Street Hedged International Developed Equity Index Fund
Notes to Financial Statements — (continued)
December 31, 2015
concentrates in a single industry, group of industries or type of instrument, it may be more susceptible to any single economic, market, political or regulatory occurrence affecting that industry, group of industries or type of instrument.
7. Foreign Investment Risks
Investing in securities of foreign companies and foreign governments involves special risks and considerations not typically associated with investing in U.S. companies and securities of the U.S. government. These risks include revaluation of currencies and the risk of expropriation. Moreover, the markets for securities of many foreign companies and foreign governments may be less liquid and the prices of such securities may be more volatile than those of comparable U.S. companies and the U.S. government.
Some foreign markets in which the Fund invests are considered emerging markets. Investment in these emerging markets subjects the Fund to a greater risk of loss than investments in a developed market. This is due to, among other things, greater market volatility, lower trading volume, political and economic instability, higher levels of inflation, deflation or currency devaluation, greater risk of market shut down, and more governmental limitations on foreign investment policy than those typically found in a developed market.
8. Line of Credit
Effective October 15, 2015, certain Funds and other affiliated funds (each a “Participant” and, collectively, the “Participants”) share in a $360 million revolving credit facility provided by a syndication of banks. The Participants may borrow for the purpose of meeting shareholder redemption requests that otherwise might require the untimely disposition of securities. The Participants are charged an annual commitment fee which is calculated based on the unused portion of the shared credit line. Commitment fees are allocated among each of the Participants based on relative net assets. Commitment fees are ordinary fund operating expenses and are paid by the Adviser. A Participant incurs and pays the interest expense related to its borrowing. Interest is calculated at a rate per annum equal to the sum of the New York Fed Bank Rate plus 1%. A Participant may borrow up to a maximum of 33% of its assets or a lower amount as may be set forth in the Fund’s prospectus. The Fund had no outstanding loans during the year ended December 31, 2015.
9. Subsequent Events
Management has evaluated the impact of all subsequent events on the Fund through the date the financial statements were available to be issued and has determined that there were no subsequent events requiring adjustment or disclosure in the financial statements.
35
Table of Contents
Report of Independent Registered Public Accounting Firm
To the Board of Trustees and Shareholders of State Street Institutional Investment Trust:
We have audited the accompanying statement of assets and liabilities, including the schedule of investments, of State Street Hedged International Developed Equity Index Fund (one of the funds constituting State Street Institutional Investment Trust) (the “Fund”) as of December 31, 2015, and the related statement of operations, statement of changes in net assets, and the financial highlights for the period from May 29, 2015 (commencement of operations) to December 31, 2015. These financial statements and financial highlights are the responsibility of the Fund’s management. Our responsibility is to express an opinion on these financial statements and financial highlights based on our audit.
We conducted our audit in accordance with the standards of the Public Company Accounting Oversight Board (United States). Those standards require that we plan and perform the audit to obtain reasonable assurance about whether the financial statements and financial highlights are free of material misstatement. We were not engaged to perform an audit of the Fund’s internal control over financial reporting. Our audit included consideration of internal control over financial reporting as a basis for designing audit procedures that are appropriate in the circumstances, but not for the purpose of expressing an opinion on the effectiveness of the Fund’s internal control over financial reporting. Accordingly, we express no such opinion. An audit also includes examining, on a test basis, evidence supporting the amounts and disclosures in the financial statements and financial highlights, assessing the accounting principles used and significant estimates made by management, and evaluating the overall financial statement presentation. Our procedures included confirmation of securities owned as of December 31, 2015, by correspondence with the custodian and others or by other appropriate auditing procedures where replies from others were not received. We believe that our audit provides a reasonable basis for our opinion.
In our opinion, the financial statements and financial highlights referred to above present fairly, in all material respects, the financial position of State Street Hedged International Developed Equity Index Fund (one of the funds constituting State Street Institutional Investment Trust) at December 31, 2015, and the results of its operations, the changes in its net assets and the financial highlights for the period from May 29, 2015 (commencement of operations) to December 31, 2015, in conformity with U.S. generally accepted accounting principles.

Boston, Massachusetts
February 26, 2016
36
Table of Contents
State Street Institutional Investment Trust
State Street Hedged International Developed Equity Index Fund
December 31, 2015 (Unaudited)
Shareholder Expense Example
As a shareholder of the Fund, you incur two types of costs: (1) transaction costs, including sales charges (loads) on purchase payments, reinvested dividends or other distributions, and (2) ongoing costs, including management fees and to the extent applicable, distribution (12b-1) or service fees, among others. This example is intended to help you understand your ongoing costs (in dollars) of investing in the Fund and to compare these costs with the ongoing costs of investing in other mutual funds. It is based on an investment of $1,000 invested at the beginning of the period shown and held for the entire period from July 1, 2015 to December 31, 2015.
The table below illustrates your Fund’s costs in two ways:
Actual Expenses
| • | Based on actual fund return – This section helps you to estimate the actual expenses that you paid over the period. The “Ending Account Value” shown is derived from the Fund’s actual return, and the third column shows the dollar amount that would have been paid by an investor who started with $1,000 in the Fund. You may use the information here, together with the amount you invested, to estimate the expenses that you paid over the period. To do so, simply divide your account value by $1,000 (for example, an $8,600 account value divided by $1,000 = 8.6), then multiply the result by the number given for the Fund under the heading “Expenses Paid During Period”. |
Hypothetical Example for Comparison Purposes
| • | Based on hypothetical 5% return – This section is intended to help you compare your Fund’s costs with those of other mutual funds. It assumes that the Fund had a yearly return of 5% before expenses, but that the expense ratio is unchanged. In this case, because the return used is not the Fund’s actual return, the results do not apply to your investment. The example is useful in making comparisons because the U.S. Securities and Exchange Commission requires all mutual funds to calculate expenses based on a 5% return. You can assess your Fund’s costs by comparing this hypothetical example with the hypothetical examples that appear in shareholder reports of other funds. |
Please note that the expenses shown in the table are meant to highlight your ongoing costs only and do not reflect any transaction costs, such as sales charges (loads). Therefore, the hypothetical 5% return section of the table is useful in comparing ongoing costs only, and will not help you determine the relative total costs of owning different funds. In addition, if these transaction costs were included, your costs would have been higher.
Six Months Ended December 31, 2015
| Beginning Account Value July 1, 2015 | Ending Account Value December 31, 2015 | Expenses Paid During Period * | ||||||||||
Based on Actual Fund Return | ||||||||||||
| $ | 1,000.00 | $ | 956.74 | $ | 1.63 | |||||||
Based on Hypothetical (5% return before expenses) | ||||||||||||
| $ | 1,000.00 | $ | 1,023.54 | $ | 1.68 | |||||||
| * | The calculations are based on expenses incurred in the most recent six month period of the Fund. The Fund’s Class K Shares’ annualized expense ratio as of December 31, 2015 was 0.33%. |
37
Table of Contents
State Street Institutional Investment Trust
State Street Hedged International Developed Equity Index Fund
Other Information — (continued)
December 31, 2015 (Unaudited)
Tax Information
Dividend Received Deduction
For federal income tax purposes, the following information is furnished with respect to the distributions of the Trust for its period ended December 31, 2015.
Percentage of distributions which qualify for the corporate dividends received deduction:
| Fund | Percentage | |||
State Street Hedged International Developed Equity Index Fund | 0.00 | % | ||
Qualified Dividend Income
A portion of dividends distributed by the Funds during the fiscal period ended December 31, 2015, are considered qualified dividend income, and are eligible for reduced tax rates. These lower rates range from 5% to 20% depending on the individual’s tax bracket. These amounts are noted below:
| Fund | Amount | |||
State Street Hedged International Developed Equity Index Fund | $ | 5,485,428 | ||
Long Term Capital Gains
Long term capital gains dividends were paid from the following Funds during the period ended December 31, 2015:
| Fund | Amount | |||
State Street Hedged International Developed Equity Index Fund | $ | 1,552,934 | ||
Foreign Tax Credit
The Trust has made an election under Internal Revenue Code Section 853 to pass through foreign taxes paid by a Fund to its shareholders. For the period ended December 31, 2015, the total amount of foreign taxes that will be passed through are:
| Fund | Amount | |||
State Street Hedged International Developed Equity Index Fund | $ | 357,106 | ||
The amount of foreign source income earned on the following Funds during the period ended December 31, 2015 were as follows:
| Fund | Amount | |||
State Street Hedged International Developed Equity Index Fund | $ | 6,061,319 | ||
38
Table of Contents
State Street Institutional Investment Trust
State Street Hedged International Developed Equity Index Fund
Shareholder Requests for Additional Information
December 31, 2015 (Unaudited)
Proxy Voting Policies and Procedures
Information regarding the Fund’s proxy voting policies and procedures, as well as information regarding how the Fund voted proxies, if any, during the most recent 12-month period ended June 30 is available without charge (1) by calling 1-877-521-4083 (toll free), or (2) on the website of the Securities and Exchange Commission (“SEC”) at www.sec.gov.
Quarterly Portfolio Schedule
The Fund files a complete schedule of investments with the SEC for the first and third quarters of each fiscal year on Form N-Q. For the second and fourth quarters, the complete schedules of investments are available in the Fund’s semi-annual and annual financial statements. The Fund’s Forms N-Q are available (i) without charge, upon request, by calling the Funds at (877) 521-4083, (ii) on the Fund’s website at www.SSGAfunds.com, (iii) on the Securities and Exchange Commission’s website at www.sec.gov, or (iv) at the Securities and Exchange Commission’s public reference room. Information on the operation of the public reference room may be obtained by calling 1-800-SEC-0330.
39
Table of Contents
State Street Institutional Investment Trust
State Street Hedged International Developed Equity Index Fund
Disclosure of Information about Fund Trustees and Officers
December 31, 2015 (Unaudited)
Name, Address, | Position(s) Held | Term of Office | Principal Occupation and Relevant Experience | Number of Funds in Fund Complex Overseen by Trustee | Other Directorships | |||||
Independent Trustees | ||||||||||
Michael F. Holland State Street Bank and 100 Huntington Avenue, CPH 0326 Boston, MA 02116 YOB: 1944 | Trustee and Co-Chairman of the Board | Term: Indefinite Elected: 7/99 | Chairman, Holland & Company L.L.C. (investment adviser) (1995 – present). | 75 | Director, the Holland Series Fund, Inc.; Director, The China Fund, Inc.; Director, The Taiwan Fund, Inc.; Director, Reaves Utility Income Fund, Inc.; and Director, Blackstone/GSO Loan Funds. | |||||
Patrick J. Riley State Street Bank and 100 Huntington Avenue, CPH 0326 Boston, MA 02116 YOB: 1948 | Trustee and Co-Chairman of the Board | Term: Indefinite Elected: 1/14 | 2002 to May 2010, Associate Justice of the Superior Court, Commonwealth of Massachusetts; 1985 to 2002, Partner, Riley, Burke & Donahue, L.L.P. (law firm); 1998 to Present, Independent Director, State Street Global Advisers Ireland, Ltd. (investment company); 1998 to Present, Independent Director, SSgA Liquidity plc (formerly, SSgA Cash Management Fund plc); January 2009 to Present, Independent Director, SSGA Fixed Income plc; and January 2009 to Present, Independent Director, SSGA Qualified Funds PLC. | 75 | Board Director and Chairman, SPDR Europe 1PLC Board (2011 – Present); Board Director and Chairman, SPDR Europe II, PLC (2013 – Present). | |||||
William L. Boyan State Street Bank and 100 Huntington Avenue, CPH 0326 Boston, MA 02116 YOB: 1937 | Trustee and Co-Chairman of the Valuation Committee | Term: Indefinite Elected: 7/99 | President and Chief Operations Officer, John Hancock Financial Services (1959 – 1999). Mr. Boyan retired in 1999. Chairman Emeritus, Children’s Hospital, Boston, MA (1984 – 2011); Former Trustee of Old Mutual South Africa Master Trust (investments) (1995 – 2008); Former Chairman, Boston Plan For Excellence, Boston Public Schools (1995 – 2010); Member of Advisory Board of Florida Atlantic University Lifelong Learning Society. | 75 | Former Trustee of Old Mutual South Africa Master Trust. | |||||
William L. Marshall State Street Bank and 100 Huntington Avenue, CPH 0326 Boston, MA 02116 YOB: 1942 | Trustee and Co-Chairman of the Audit Committee | Term: Indefinite Elected: 1/14 | April 2011 to Present, Chairman (until April 2011, Chief Executive Officer and President), Wm. L. Marshall Associates, Inc., Wm. L. Marshall Companies, Inc. and the Marshall Financial Group, Inc. (a registered investment adviser and provider of financial and related consulting services); Certified Financial Planner; Member, Financial Planners Association; 2015 to present, Board Member, The Doylestown Health Foundation Board. | 75 | Marshall Financial Group, Inc. | |||||
40
Table of Contents
State Street Institutional Investment Trust
State Street Hedged International Developed Equity Index Fund
Disclosure of Information about Fund Trustees and Officers — (continued)
December 31, 2015 (Unaudited)
Name, Address, | Position(s) Held | Term of Office | Principal Occupation and Relevant Experience | Number of Funds in Fund Complex Overseen by Trustee | Other Directorships | |||||
Independent Trustees (continued) | ||||||||||
Richard D. Shirk State Street Bank and 100 Huntington Avenue, CPH 0326 Boston, MA 02116 YOB: 1945 | Trustee and Co-Chairman of the Qualified Legal and Compliance Committee | Term: Indefinite Elected: 1/14 | March 2001 to April 2002, Chairman (1996 to March 2001, President and Chief Executive Officer), Cerulean Companies, Inc. (holding company) (Retired); 1992 to March 2001, President and Chief Executive Officer, Blue Cross Blue Shield of Georgia (health insurer, managed healthcare); 1998 to December 2008, Chairman, Board Member and December 2008 to Present, Investment Committee Member, Healthcare Georgia Foundation (private foundation); September 2002 to 2012, Lead Director and Board Member, Amerigroup Corp. (managed health care); 1999 to 2013, Board Member and (since 2001) Investment Committee Member, Woodruff Arts Center; and 2003 to 2009, Trustee, Gettysburg College. | 75 | Board member, AeroCare Holdings (privately held healthcare services company) (February 2003 – Present); Board member, Regenesis Biomedical (health care services) (April 2012 – Present); Chairman (January 2014 – Present). | |||||
Rina K. Spence State Street Bank and 100 Huntington Avenue, CPH 0326 Boston, MA 02116 YOB: 1948 | Trustee and Co-Chairman of the Qualified Legal and Compliance Committee and Co-Chairman of the Governance Committee | Term: Indefinite Elected: 7/99 | President of SpenceCare International LLC (international healthcare consulting) (1999 – present); Chief Executive Officer, IEmily.com (health internet company) (2000 – 2001); Chief Executive Officer of Consensus Pharmaceutical, Inc. (1998 – 1999); Founder, President and Chief Executive Officer of Spence Center for Women’s Health (1994 – 1998); President and CEO Emerson Hospital (1984 – 1994); Trustee, Eastern Enterprise (utilities) (1988 – 2000); Director, Berkshire Life Insurance Company of America (1993 – 2009); Honorary Consul for Monaco in Boston (2015 – present). | 75 | ||||||
41
Table of Contents
State Street Institutional Investment Trust
State Street Hedged International Developed Equity Index Fund
Disclosure of Information about Fund Trustees and Officers — (continued)
December 31, 2015 (Unaudited)
Name, Address, | Position(s) Held | Term of Office | Principal Occupation and Relevant Experience | Number of Funds in Fund Complex Overseen by Trustee | Other Directorships | |||||
Independent Trustees (continued) | ||||||||||
Bruce D. Taber State Street Bank and 100 Huntington Avenue, CPH 0326 Boston, MA 02116 YOB: 1943 | Trustee and Co-Chairman of the Valuation Committee and Co-Chairman of the Governance Committee | Term: Indefinite Elected: 1/14 | 1999 to Present, Partner, Zenergy LLC (a technology company providing Computer Modeling and System Analysis to the General Electric Power Generation Division); Until December 2008, Independent Director, SSGA Cash Management Fund plc; Until December 2008, Independent Director, State Street Global Advisers Ireland, Ltd. (investment companies); and Until August 1994, President, Alonzo B. Reed, Inc., (a Boston architect-engineering firm). | 75 | ||||||
Douglas T. Williams State Street Bank and 100 Huntington Avenue, CPH 0326 Boston, MA 02116 YOB: 1940 | Trustee and Co-Chairman of the Audit Committee | Term: Indefinite Elected: 7/99 | President, Oakmont Homeowners Association; President, Mariner Sands Chapel; Executive Vice President and member of Executive Committee, Chase Manhattan Bank (1987 – 1999); President, Boston Stock Exchange Depository Trust Company, 1981 – 1982; Treasurer, Nantucket Educational Trust, (2002 – 2007). | 75 | ||||||
Interested Trustee(1) | ||||||||||
James E. Ross SSGA Funds Management, Inc. State Street Financial Center One Lincoln Street Boston, MA 02111 YOB: 1965 | Trustee | Term: Indefinite Elected Trustee: 2/07 | Chairman and Director, SSGA Funds Management, Inc. (2012 – present); President, SSGA Funds Management, Inc. (2005 – 2012); Executive Vice President and Senior Managing Director, State Street Global Advisors (2006 – present); and Principal, State Street Global Advisors (2006 – present). | 290 | Trustee, SPDR Series Trust; Trustee, SPDR Index Shares Funds; Trustee, Select Sector SPDR Trust; Trustee, SSGA Active Trust; and Trustee, SSGA Master Trust. | |||||
| (1) | Mr. Ross is an Interested Trustee because of his employment by SSGA Funds Management, Inc., an affiliate of the Trust. |
Name, Address, | Position(s) Held | Term of Office | Principal Occupation | |||
Officers: | ||||||
Ellen M. Needham SSGA Funds Management, Inc. State Street Financial Center One Lincoln Street Boston, MA 02111 YOB: 1967 | President | Term: Indefinite Elected: 10/12 | President and Director, SSGA Funds Management, Inc. (June 2012 – present); Chief Operating Officer, SSGA Funds Management, Inc. (May 2010 – June 2012); Senior Managing Director, SSGA Funds Management, Inc. (1992 – 2012) and Senior Managing Director, State Street Global Advisors (1992 – present).* |
42
Table of Contents
State Street Institutional Investment Trust
State Street Hedged International Developed Equity Index Fund
Disclosure of Information about Fund Trustees and Officers — (continued)
December 31, 2015 (Unaudited)
Name, Address, | Position(s) Held | Term of Office | Principal Occupation | |||
Officers: (continued) | ||||||
Bruce S. Rosenberg SSGA Funds Management, Inc. State Street Financial Center One Lincoln Street Boston, MA 02111 YOB: 1961 | Treasurer | Term: Indefinite Elected: 2/16 | Managing Director, State Street Global Advisors and SSGA Funds Management, Inc. (July 2015 – present); Director, Credit Suisse (April 2008 – July 2015). | |||
Ann M. Carpenter SSGA Funds Management, Inc. State Street Financial Center One Lincoln Street Boston, MA 02111 YOB: 1966 | Vice President Deputy Treasurer | Term: Indefinite Elected: 10/12 Term: Indefinite Elected: 2/16 | Chief Operating Officer, SSGA Funds Management, Inc. (April 2014 – present); Vice President, SSGA Funds Management, Inc. (2008 – present); Principal, State Street Global Advisors and SSGA Funds Management, Inc. (2005 – present).* | |||
Chad C. Hallett SSGA Funds Management, Inc. State Street Financial Center One Lincoln Street Boston, MA 02111 YOB: 1969 | Deputy Treasurer | Term: Indefinite Elected: 2/16 | Vice President, State Street Global Advisors and SSGA Funds Management, Inc. (November 2014 – present); Vice President, State Street Bank and Trust Company (2001 – November 2014).* | |||
Sujata Upreti SSGA Funds Management, Inc. State Street Financial Center One Lincoln Street Boston, MA 02111 YOB: 1974 | Assistant Treasurer | Term: Indefinite Elected: 2/16 | Vice President, State Street Global Advisors and SSGA Funds Management, Inc. (May 2015 – present); Assistant Director, Cambridge Associates, LLC (July 2014 – January 2015); Vice President, Bank of New York Mellon (July 2012 – August 2013); Manager, PricewaterhouseCoopers, LLP (September 2009 – July 2012). | |||
Daniel Foley SSGA Funds Management, Inc. State Street Financial Center One Lincoln Street Boston, MA 02111 YOB: 1972 | Assistant Treasurer | Term: Indefinite Elected: 2/16 | Vice President, State Street Global Advisors and SSGA Funds Management, Inc. (April 2014 – present); Principal, State Street Global Advisors and SSGA Funds Management, Inc. (April 2007 – April 2014). | |||
Brian Harris State Street Financial Center One Lincoln Street Boston, MA 02111 YOB: 1973 | Chief Compliance Officer | Term: Indefinite Elected: 11/13 | Vice President, State Street Global Advisors and SSGA Funds Management, Inc.( June 2013 – Present); Senior Vice President and Global Head of Investment Compliance, BofA Global Capital Management (September 2010 to May 2013); Director of Compliance, AARP Financial Inc. (July 2008 to August 2010). | |||
Trevor Swanberg SSGA Funds Management, Inc. State Street Financial Center One Lincoln Street Boston, MA 02111 YOB: 1979 | Code of Ethics Compliance Officer | Term: Indefinite Elected: 8/15 | Vice President, State Street Global Advisors and SSGA Funds Management, Inc. (January 2015 – Present); Senior Manager-Mutual Fund Compliance, ICMA-Retirement Corporation (December 2011 – January 2015); Assistant Vice President, J.P. Morgan (September 2007 – December 2011). | |||
Joshua A. Weinberg SSGA Funds Management, Inc. State Street Financial Center One Lincoln Street Boston, MA 02111 YOB: 1978 | Chief Legal Officer | Term: Indefinite Elected: 2/15 | Vice President and Managing Counsel, State Street Global Advisors (2011 – present); Clerk, SSGA Funds Management, Inc. (2013 – present); Associate, Financial Services Group, Dechert LLP (2006 – 2011). |
43
Table of Contents
State Street Institutional Investment Trust
State Street Hedged International Developed Equity Index Fund
Disclosure of Information about Fund Trustees and Officers — (continued)
December 31, 2015 (Unaudited)
Name, Address, | Position(s) Held | Term of Office | Principal Occupation | |||
Officers: (continued) | ||||||
David K. James State Street Bank and Trust Company 100 Huntington Avenue, 3rd Floor Boston, MA 02116 YOB: 1970 | Secretary | Term: Indefinite Elected: 4/13 | Managing Director and Managing Counsel, State Street Bank and Trust Company (2009 – present); Vice President and Counsel, PNC Global Investment Servicing (US), Inc. (2006 – 2009). | |||
Kristin Schantz State Street Bank and Trust Company 100 Huntington Avenue, 3rd Floor Boston, MA 02116 YOB: 1979 | Assistant Secretary | Term: Indefinite Elected: 2/14 | Vice President and Counsel, State Street Bank and Trust Company (2013 – present); Vice President, Citi Fund Services Ohio, Inc. (2008 – 2013). |
| * | Served in various capacities and/or with various affiliated entities during noted time period. |
44
Table of Contents
Trustees
William L. Boyan
Michael F. Holland
William L. Marshall
Patrick J. Riley
James E. Ross
Richard D. Shirk
Rina K. Spence
Bruce D. Taber
Douglas T. Williams
Investment Adviser and Administrator
SSGA Funds Management, Inc.
State Street Financial Center
One Lincoln Street
Boston, MA 02111
Custodian and Sub-Administrator
State Street Bank and Trust Company
State Street Financial Center
One Lincoln Street
Boston, MA 02111
Independent Registered Public Accounting Firm
Ernst & Young LLP
200 Clarendon Street
Boston, MA 02116
Legal Counsel
Ropes & Gray LLP
800 Boylston Street
Boston, MA 02199
Transfer Agent
Boston Financial Data Services
2000 Crown Colony Drive
Quincy, MA 02169
Distributor
State Street Global Markets LLC
State Street Financial Center
One Lincoln Street
Boston, MA 02111
This report is for shareholder information. This is not a prospectus intended for use in the purchase or sale of shares of beneficial interest.
State Street Institutional Investment Trust State Street Bank and Trust Company P.O. Box 5049 Boston, MA 02206 | IBG-18452 |
Table of Contents
Annual Report
31 December 2015
State Street Institutional Investment Trust
State Street Target Retirement Fund
State Street Target Retirement 2015 Fund
State Street Target Retirement 2020 Fund
State Street Target Retirement 2025 Fund
State Street Target Retirement 2030 Fund
State Street Target Retirement 2035 Fund
State Street Target Retirement 2040 Fund
State Street Target Retirement 2045 Fund
State Street Target Retirement 2050 Fund
State Street Target Retirement 2055 Fund
State Street Target Retirement 2060 Fund

Table of Contents
State Street Institutional Investment Trust
Target Retirement Funds
Annual Report
December 31, 2015
| 1 | ||||
| 23 | ||||
| 27 | ||||
| 38 | ||||
| 43 | ||||
| 46 | ||||
| 58 | ||||
| 70 | ||||
| 84 | ||||
| 85 | ||||
| 93 | ||||
Table of Contents
State Street Target Retirement Fund
MANAGEMENT’S DISCUSSION OF FUND PERFORMANCE
The State Street Target Retirement Fund (the “Fund”) seeks current income and, secondarily, capital growth. The Fund’s benchmark is the Barclays U.S. Aggregate Index (the “Index”).
For the 12-month period ended December 31, 2015 (the “Reporting Period”), the total return for Class K of the Fund was -0.49%, and the total return for the Index was 0.55%. The total return for the Fund’s secondary benchmark index, the State Street Target Retirement Composite Index* (the “Secondary Index”), was -0.43% for the Reporting Period. The returns of the Fund and both the Index and Secondary Index reflect the reinvestment of dividends and other income. The Fund’s performance reflects the expenses of managing the Fund, including brokerage and advisory expenses. Both the Index and the Secondary Index are unmanaged and their returns do not reflect fees and expenses of any kind, which would have a negative impact on returns.
The Fund is a “fund of funds” that invests in a wide variety of asset classes. During the Reporting Period, the Fund’s diversified investment exposures contributed to its underperformance relative to the Index, which is a fixed income only index. U.S. equities faced significant headwinds in their effort to earn positive returns during the Reporting Period. Contributing to this lackluster outcome for 2015 was a challenging environment for U.S. companies’ ability to earn a profit, evidenced by a decline in year over year earnings of issuers included in the S&P 500 Index. The dollar strengthened significantly over the period, which provided a headwind to the performance of non-U.S. developed market equities. 2015 was the weakest year for developed global market equities since 2011. Continued volatility in China’s equity markets, and growing concerns surrounding emerging market growth prospects more generally led to a double-digit selloff in the emerging markets. Results were mixed in the fixed income space. In U.S. credit markets, the fourth quarter punctuated an unsettlingly steady rise in both investment grade and speculative grade credit spreads throughout 2015. In the speculative U.S. high yield space, much of the spread widening was attributable to the impact of sharply lower global oil prices on the energy sector, which represents more than 15% of the Barclays U.S. High Yield Index. Evidence that credit conditions in the U.S. tightened throughout the Reporting Period for reasons beyond energy prices comes from the coincident rise in investment grade credit spreads.
The top positive contributors to the Fund’s performance were S&P 500 Index, Barclays 1-5 Year U.S. Treasury Index and Barclays U.S. Aggregate Index. The top negative contributors to the Fund’s performance were MSCI ACWI ex USA Index, Barclays High Yield Very Liquid Index and Russell Small Cap Completeness Index.
The views expressed above reflect those of the Fund’s portfolio manager only through the Reporting Period and do not necessarily represent the views of the Adviser as a whole. Any such views are subject to change at any time based upon market or other conditions, and the Adviser disclaims any responsibility to update such views. These views may not be relied on as investment advice and, because investment decisions for a fund are based on numerous factors, may not be relied on as an indication of trading intent on behalf of any fund.
| * | The State Street Target Retirement Composite Index consists of several different indexes, and is designed to provide exposure to a variety of asset classes. The State Street Target Retirement Composite Index will contain one or more of the following indexes: S&P 500 Index, Russell Small Cap Completeness® Index, MSCI ACWI ex USA Index, Barclays U.S. Aggregate Index, Barclays U.S. Government Inflation-linked Bond Index, Barclays 1-10 Year Government Inflation-linked Bond Index, Barclays High Yield Very Liquid Index, Dow Jones Global Select Real Estate Securities Index, Barclays Long U.S. Treasury Index, Barclays 1-5 Year U.S. Treasury Index and / or Barclays U.S. 1-3 Year Corporate Bond Index. |
1
Table of Contents
State Street Target Retirement Fund
Class K
Growth of a $10,000 Investment (a)
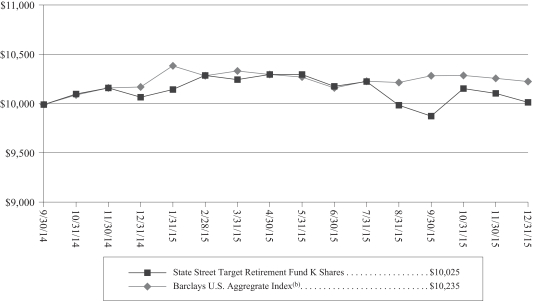
Investment Performance (a)
For the Year Ended December 31, 2015
| Total Return One Year Ended December 31, 2015 | Average Annual Total Return Inception to Date December 31, 2015 | |||||||
State Street Target Retirement Fund Class A | -0.64 | % | -0.01 | % | ||||
State Street Target Retirement Fund Class I | -0.39 | % | 0.24 | % | ||||
State Street Target Retirement Fund Class K | -0.49 | % | 0.20 | % | ||||
Barclays U.S. Aggregate Index(b) | 0.55 | % | 2.35 | % | ||||
| (a) | Total returns and performance graph information represent past performance and are not indicative of future results, which may be lower or higher than performance data quoted. Investment return and principal value of an investment will fluctuate so that an investor’s share, when redeemed, may be worth more or less than its original cost. The graph and table above do not reflect the deduction of taxes that a shareholder would pay on fund distributions, sales, or the redemption of fund shares. |
| (b) | The Barclays U.S. Aggregate Index provides a measure of the performance of the U.S. dollar denominated investment grade bond market, which includes investment grade (must be Baa3/BBB- or higher using the middle rating of Moody’s Investor Service, Inc., Standard & Poor’s, and Fitch Inc.) |
2
Table of Contents
State Street Target Retirement 2015 Fund
MANAGEMENT’S DISCUSSION OF FUND PERFORMANCE
The State Street Target Retirement 2015 Fund (the “Fund”) seeks capital growth and income over the long term. The Fund’s benchmark is the S&P 500 Index (the “Index”).
For the 12-month period ended December 31, 2015 (the “Reporting Period”), the total return for Class K of the Fund was -0.74%, and the total return for the Index was 1.38%. The total return of the Fund’s secondary benchmark index, the State Street Target Retirement 2015 Composite Index* (the “Secondary Index”) was -0.77% for the Reporting Period. The returns of the Fund and both the Index and the Secondary Index reflect the reinvestment of dividends and other income. The Fund’s performance reflects the expenses of managing the Fund, including brokerage and advisory expenses. Both the Index and the Secondary Index are unmanaged and their returns do not reflect fees and expenses of any kind, which would have a negative impact on returns.
The Fund is a “fund of funds” that invests in a wide variety of asset classes. During the Reporting Period, the Fund’s diversified investment exposures contributed to its underperformance relative to the Index, which is an equity only index. U.S. equities faced significant headwinds in their effort to earn positive returns during the Reporting Period. Contributing to this lackluster outcome for 2015 was a challenging environment for U.S. companies’ ability to earn a profit, evidenced by a decline in year over year earnings of issuers included in the S&P 500 Index. The dollar strengthened significantly over the period, which provided a headwind to the performance of non-U.S. developed market equities. 2015 was the weakest year for developed global market equities since 2011. Continued volatility in China’s equity markets and growing concerns surrounding emerging market growth prospects more generally led to a double digit selloff in the emerging markets. Results were mixed in the fixed income space. In U.S. credit markets, the fourth quarter punctuated an unsettlingly steady rise in both investment grade and speculative grade credit spreads throughout 2015. In the speculative U.S. high yield space, much of the spread widening was attributable to the impact of sharply lower global oil prices on the energy sector, which represents more than 15% of the Barclays U.S. High Yield Index. Evidence that credit conditions in the U.S. tightened throughout the Reporting Period for reasons beyond energy prices comes from the coincident rise in investment grade credit spreads.
The top positive contributors to the Fund’s performance were S&P 500 Index, Barclays U.S. Aggregate Index and Dow Jones Global Select Real Estate Securities Index. The top negative contributors to the Fund’s performance were MSCI ACWI ex USA Index, Barclays High Yield Very Liquid Index and Russell Small Cap Completeness Index.
The views expressed above reflect those of the Fund’s portfolio manager only through the Reporting Period and do not necessarily represent the views of the Adviser as a whole. Any such views are subject to change at any time based upon market or other conditions, and the Adviser disclaims any responsibility to update such views. These views may not be relied on as investment advice and, because investment decisions for a fund are based on numerous factors, may not be relied on as an indication of trading intent on behalf of any fund.
| * | The State Street Target Retirement 2015 Composite Index consists of several different indexes, and is designed to provide exposure to a variety of asset classes. The State Street Target Retirement 2015 Composite Index will contain one or more of the following indexes: S&P 500 Index, Russell Small Cap Completeness® Index, MSCI ACWI ex USA Index, Barclays U.S. Aggregate Index, Barclays U.S. Government Inflation-linked Bond Index, Barclays 1-10 Year Government Inflation-linked Bond Index, Barclays High Yield Very Liquid Index, Dow Jones Global Select Real Estate Securities Index, Barclays Long U.S. Treasury Index, Barclays 1-5 Year U.S. Treasury Index and / or Barclays U.S. 1-3 Year Corporate Bond Index. |
3
Table of Contents
State Street Target Retirement 2015
Class K
Growth of a $10,000 Investment (a)
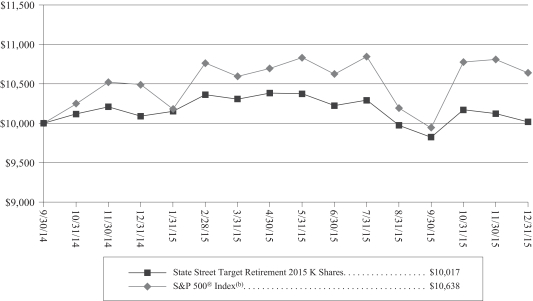
Investment Performance (a)
For the Year Ended December 31, 2015
| Total Return One Year Ended December 31, 2015 | Average Annual Total Return Inception December 31, 2015 | |||||||
State Street Target Retirement 2015 Fund Class A | -1.00 | % | -0.16 | % | ||||
State Street Target Retirement 2015 Fund Class I | -0.75 | % | 0.09 | % | ||||
State Street Target Retirement 2015 Fund Class K | -0.74 | % | 0.14 | % | ||||
S&P 500® Index(b) | 1.38 | % | 5.07 | % | ||||
| (a) | Total returns and performance graph information represent past performance and are not indicative of future results, which may be lower or higher than performance data quoted. Investment return and principal value of an investment will fluctuate so that an investor’s share, when redeemed, may be worth more or less than its original cost. The graph and table above do not reflect the deduction of taxes that a shareholder would pay on fund distributions, sales, or the redemption of fund shares. |
| (b) | The Standard & Poor’s 500 Composite Stock Price Index (“S&P 500® Index”) is an unmanaged capitalization-weighted index of 500 widely held stocks recognized by investors to be representative of the U.S. stock market in general. It is not possible to invest directly in the S&P 500® Index. |
4
Table of Contents
State Street Target Retirement 2020 Fund
MANAGEMENT’S DISCUSSION OF FUND PERFORMANCE
The State Street Target Retirement 2020 Fund (the “Fund”) seeks capital growth and income over the long term. The Fund’s benchmark is the S&P 500 Index (the “Index”).
For the 12-month period ended December 31, 2015 (the “Reporting Period”), the total return for Class K of the Fund was -1.57%, and the total return for the Index was 1.38%. The total return of the Fund’s secondary benchmark index, the State Street Target Retirement 2020 Composite Index* (the “Secondary Index”) was -1.23% for the Reporting Period. The returns of the Fund and both the Index and the Secondary Index reflect the reinvestment of dividends and other income. The Fund’s performance reflects the expenses of managing the Fund, including brokerage and advisory expenses. Both the Index and the Secondary Index are unmanaged and their returns do not reflect fees and expenses of any kind, which would have a negative impact on returns.
The Fund is a “fund of funds” that invests in a wide variety of asset classes. During the Reporting Period, the Fund’s diversified investment exposures contributed to its underperformance relative to the Index, which is an equity only index. U.S. equities faced significant headwinds in their effort to earn positive returns during the Reporting Period. Contributing to this lackluster outcome for 2015 was a challenging environment for U.S. companies’ ability to earn a profit, evidenced by a decline in year over year earnings of issuers included in the S&P 500 Index. The dollar strengthened significantly over the period, which provided a headwind to the performance of non-U.S. developed market equities. 2015 was the weakest year for developed global market equities since 2011. Continued volatility in China’s equity markets and growing concerns surrounding emerging market growth prospects more generally led to a double digit selloff in the emerging markets. Results were mixed in the fixed income space. In U.S. credit markets, the fourth quarter punctuated an unsettlingly steady rise in both investment grade and speculative grade credit spreads throughout 2015. In the speculative U.S. high yield space, much of the spread widening was attributable to the impact of sharply lower global oil prices on the energy sector, which represents more than 15% of the Barclays U.S. High Yield Index. Evidence that credit conditions in the U.S. tightened throughout the Reporting Period for reasons beyond energy prices comes from the coincident rise in investment grade credit spreads.
The top positive contributors to the Fund’s performance were S&P 500 Index, Barclays U.S. Aggregate Index and Dow Jones Global Select Real Estate Securities Index. The top negative contributors to the Fund’s performance were MSCI ACWI ex USA Index, Barclays High Yield Very Liquid Index and Russell Small Cap Completeness Index.
The views expressed above reflect those of the Fund’s portfolio manager only through the Reporting Period and do not necessarily represent the views of the Adviser as a whole. Any such views are subject to change at any time based upon market or other conditions, and the Adviser disclaims any responsibility to update such views. These views may not be relied on as investment advice and, because investment decisions for a fund are based on numerous factors, may not be relied on as an indication of trading intent on behalf of any fund.
| * | The State Street Target Retirement 2020 Composite Index consists of several different indexes, and is designed to provide exposure to a variety of asset classes. The State Street Target Retirement 2020 Composite Index will contain one or more of the following indexes: S&P 500 Index, Russell Small Cap Completeness® Index, MSCI ACWI ex USA Index, Barclays U.S. Aggregate Index, Barclays U.S. Government Inflation-linked Bond Index, Barclays 1-10 Year Government Inflation-linked Bond Index, Barclays High Yield Very Liquid Index, Dow Jones Global Select Real Estate Securities Index, Barclays Long U.S. Treasury Index, Barclays 1-5 Year U.S. Treasury Index and / or Barclays U.S. 1-3 Year Corporate Bond Index. |
5
Table of Contents
State Street Target Retirement 2020 Fund
Class K
Growth of a $10,000 Investment (a)

Investment Performance (a)
For the Year Ended December 31, 2015
| Total Return One Year Ended December 31, 2015 | Average Annual Total Return Inception to Date December 31, 2015 | |||||||
State Street Target Retirement 2020 Fund Class A | -1.71 | % | -0.06 | % | ||||
State Street Target Retirement 2020 Fund Class I | -1.56 | % | 0.11 | % | ||||
State Street Target Retirement 2020 Fund Class K | -1.57 | % | 0.07 | % | ||||
S&P 500® Index(b) | 1.38 | % | 5.07 | % | ||||
| (a) | Total returns and performance graph information represent past performance and are not indicative of future results, which may be lower or higher than performance data quoted. Investment return and principal value of an investment will fluctuate so that an investor’s share, when redeemed, may be worth more or less than its original cost. The graph and table above do not reflect the deduction of taxes that a shareholder would pay on fund distributions, sales, or the redemption of fund shares. |
| (b) | The Standard & Poor’s 500 Composite Stock Price Index (“S&P 500® Index”) is an unmanaged capitalization-weighted index of 500 widely held stocks recognized by investors to be representative of the U.S. stock market in general. It is not possible to invest directly in the S&P 500® Index. |
6
Table of Contents
State Street Target Retirement 2025 Fund
MANAGEMENT’S DISCUSSION OF FUND PERFORMANCE
The State Street Target Retirement 2025 Fund (the “Fund”) seeks capital growth and income over the long term. The Fund’s benchmark is the S&P 500 Index (the “Index”).
For the 12-month period ended December 31, 2015 (the “Reporting Period”), the total return for Class K of the Fund was -1.77%, and the total return for the Index was 1.38%. The total return of the Fund’s secondary benchmark index, the State Street Target Retirement 2025 Composite Index* (the “Secondary Index”) was -1.44% for the Reporting Period. The returns of the Fund and both the Index and the Secondary Index reflect the reinvestment of dividends and other income. The Fund’s performance reflects the expenses of managing the Fund, including brokerage and advisory expenses. Both the Index and the Secondary Index are unmanaged and their returns do not reflect fees and expenses of any kind, which would have a negative impact on returns.
The Fund is a “fund of funds” that invests in a wide variety of asset classes. During the Reporting Period, the Fund’s diversified investment exposures contributed to its underperformance relative to the Index, which is an equity only index. U.S. equities faced significant headwinds in their effort to earn positive returns during the Reporting Period. Contributing to this lackluster outcome for 2015 was a challenging environment for U.S. companies’ ability to earn a profit, evidenced by a decline in year over year earnings of issuers included in the S&P 500 Index. The dollar strengthened significantly over the period, which provided a headwind to the performance of non-U.S. developed market equities. 2015 was the weakest year for developed global market equities since 2011. Continued volatility in China’s equity markets and growing concerns surrounding emerging market growth prospects more generally led to a double digit selloff in the emerging markets. Results were mixed in the fixed income space. In U.S. credit markets, the fourth quarter punctuated an unsettlingly steady rise in both investment grade and speculative grade credit spreads throughout 2015. In the speculative U.S. high yield space, much of the spread widening was attributable to the impact of sharply lower global oil prices on the energy sector, which represents more than 15% of the Barclays U.S. High Yield Index. Evidence that credit conditions in the U.S. tightened throughout the Reporting Period for reasons beyond energy prices comes from the coincident rise in investment grade credit spreads.
The top positive contributors to the Fund’s performance were S&P 500 Index and Barclays U.S. Aggregate Index. The top negative contributors to the Fund’s performance were MSCI ACWI ex USA Index, Russell Small Cap Completeness Index and Barclays High Yield Very Liquid Index.
The views expressed above reflect those of the Fund’s portfolio manager only through the Reporting Period and do not necessarily represent the views of the Adviser as a whole. Any such views are subject to change at any time based upon market or other conditions, and the Adviser disclaims any responsibility to update such views. These views may not be relied on as investment advice and, because investment decisions for a fund are based on numerous factors, may not be relied on as an indication of trading intent on behalf of any fund.
| * | The State Street Target Retirement 2025 Composite Index consists of several different indexes, and is designed to provide exposure to a variety of asset classes. The State Street Target Retirement 2025 Composite Index will contain one or more of the following indexes: S&P 500 Index, Russell Small Cap Completeness® Index, MSCI ACWI ex USA Index, Barclays U.S. Aggregate Index, Barclays U.S. Government Inflation-linked Bond Index, Barclays 1-10 Year Government Inflation-linked Bond Index, Barclays High Yield Very Liquid Index, Dow Jones Global Select Real Estate Securities Index, Barclays Long U.S. Treasury Index, Barclays 1-5 Year U.S. Treasury Index and / or Barclays U.S. 1-3 Year Corporate Bond Index. |
7
Table of Contents
State Street Target Retirement 2025
Class K
Growth of a $10,000 Investment (a)
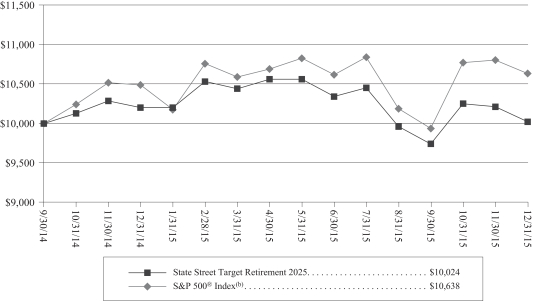
Investment Performance (a)
For the Year Ended December 31, 2015
| Total Return One Year Ended December 31, 2015 | Average Annual Total Return Inception to Date December 31, 2015 | |||||||
State Street Target Retirement 2025 Fund Class A | -2.11 | % | -0.18 | % | ||||
State Street Target Retirement 2025 Fund Class I | -1.87 | % | 0.07 | % | ||||
State Street Target Retirement 2025 Fund Class K | -1.77 | % | 0.19 | % | ||||
S&P 500® Index(b) | 1.38 | % | 5.07 | % | ||||
| (a) | Total returns and performance graph information represent past performance and are not indicative of future results, which may be lower or higher than performance data quoted. Investment return and principal value of an investment will fluctuate so that an investor’s share, when redeemed, may be worth more or less than its original cost. The graph and table above do not reflect the deduction of taxes that a shareholder would pay on fund distributions, sales, or the redemption of fund shares. |
| (b) | The Standard & Poor’s 500 Composite Stock Price Index (“S&P 500® Index”) is an unmanaged capitalization-weighted index of 500 widely held stocks recognized by investors to be representative of the U.S. stock market in general. It is not possible to invest directly in the S&P 500® Index. |
8
Table of Contents
State Street Target Retirement 2030 Fund
MANAGEMENT’S DISCUSSION OF FUND PERFORMANCE
The State Street Target Retirement 2030 Fund (the “Fund”) seeks capital growth and income over the long term. The Fund’s benchmark is the S&P 500 Index (the “Index”).
For the 12-month period ended December 31, 2015 (the “Reporting Period”), the total return for Class K of the Fund was -1.83%, and the total return for the Index was 1.38%. The total return of the Fund’s secondary benchmark index, the State Street Target Retirement 2030 Composite Index* (the “Secondary Index”) was -1.48% for the Reporting Period. The returns the Fund and both the Index and the Secondary Index reflect the reinvestment of dividends and other income. The Fund’s performance reflects the expenses of managing the Fund, including brokerage and advisory expenses. Both the Index and the Secondary Index are unmanaged and their returns do not reflect fees and expenses of any kind, which would have a negative impact on returns.
The Fund is a “fund of funds” that invests in a wide variety of asset classes. During the Reporting Period, the Fund’s diversified investment exposures contributed to its underperformance relative to the Index, which is an equity only index. U.S. equities faced significant headwinds in their effort to earn positive returns during the Reporting Period. Contributing to this lackluster outcome for 2015 was a challenging environment for U.S. companies’ ability to earn a profit, evidenced by a decline in year over year earnings of issuers included in the S&P 500 Index. The dollar strengthened significantly over the period, which provided a headwind to the performance of non-U.S. developed market equities. 2015 was the weakest year for developed global market equities since 2011. Continued volatility in China’s equity markets and growing concerns surrounding emerging market growth prospects more generally led to a double digit selloff in the emerging markets. Results were mixed in the fixed income space. In U.S. credit markets, the fourth quarter punctuated an unsettlingly steady rise in both investment grade and speculative grade credit spreads throughout 2015. In the speculative U.S. high yield space, much of the spread widening was attributable to the impact of sharply lower global oil prices on the energy sector, which represents more than 15% of the Barclays U.S. High Yield Index. Evidence that credit conditions in the U.S. tightened throughout the Reporting Period for reasons beyond energy prices comes from the coincident rise in investment grade credit spreads.
The top positive contributors to the Fund’s performance were S&P 500 Index and Barclays U.S. Aggregate Index. The top negative contributors to the Fund’s performance were MSCI ACWI ex USA Index, Russell Small Cap Completeness Index and Barclays Long U.S. Treasury Index.
The views expressed above reflect those of the Fund’s portfolio manager only through the Reporting Period and do not necessarily represent the views of the Adviser as a whole. Any such views are subject to change at any time based upon market or other conditions, and the Adviser disclaims any responsibility to update such views. These views may not be relied on as investment advice and, because investment decisions for a fund are based on numerous factors, may not be relied on as an indication of trading intent on behalf of any fund.
| * | The State Street Target Retirement 2030 Composite Index consists of several different indexes, and is designed to provide exposure to a variety of asset classes. The State Street Target Retirement 2030 Composite Index will contain one or more of the following indexes: S&P 500 Index, Russell Small Cap Completeness® Index, MSCI ACWI ex USA Index, Barclays U.S. Aggregate Index, Barclays U.S. Government Inflation-linked Bond Index, Barclays 1-10 Year Government Inflation-linked Bond Index, Barclays High Yield Very Liquid Index, Dow Jones Global Select Real Estate Securities Index, Barclays Long U.S. Treasury Index, Barclays 1-5 Year U.S. Treasury Index and / or Barclays U.S. 1-3 Year Corporate Bond Index. |
9
Table of Contents
State Street Target Retirement 2030 Fund
Class K
Growth of a $10,000 Investment (a)
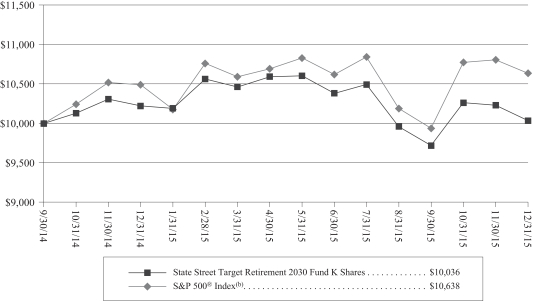
Investment Performance (a)
For the Year Ended December 31, 2015
| Total Return One Year Ended December 31, 2015 | Average Annual Total Return Inception to Date December 31, 2015 | |||||||
State Street Target Retirement 2030 Fund Class A | -2.07 | % | 0.00 | % | ||||
State Street Target Retirement 2030 Fund Class I | -1.83 | % | 0.25 | % | ||||
State Street Target Retirement 2030 Fund Class K | -1.83 | % | 0.29 | % | ||||
S&P 500® Index(b) | 1.38 | % | 5.07 | % | ||||
| (a) | Total returns and performance graph information represent past performance and are not indicative of future results, which may be lower or higher than performance data quoted. Investment return and principal value of an investment will fluctuate so that an investor’s share, when redeemed, may be worth more or less than its original cost. The graph and table above do not reflect the deduction of taxes that a shareholder would pay on fund distributions, sales, or the redemption of fund shares. |
| (b) | The Standard & Poor’s 500 Composite Stock Price Index (“S&P 500® Index”) is an unmanaged capitalization-weighted index of 500 widely held stocks recognized by investors to be representative of the U.S. stock market in general. It is not possible to invest directly in the S&P 500® Index. |
10
Table of Contents
State Street Target Retirement 2035 Fund
MANAGEMENT’S DISCUSSION OF FUND PERFORMANCE
The State Street Target Retirement 2035 Fund (the “Fund”) seeks capital growth and income over the long term. The Fund’s benchmark is the S&P 500 Index (the “Index”).
For the 12-month period ended December 31, 2015 (the “Reporting Period”), the total return for Class K of the Fund was -1.90%, and the total return for the Index was 1.38%. The total return of the Fund’s secondary benchmark index, the State Street Target Retirement 2035 Composite Index* (the “Secondary Index”) was -1.61% for the Reporting Period. The returns of the Fund and both the Index and the Secondary Index reflect the reinvestment of dividends and other income. The Fund’s performance reflects the expenses of managing the Fund, including brokerage and advisory expenses. Both the Index and the Secondary Index are unmanaged and their returns do not reflect fees and expenses of any kind, which would have a negative impact on returns.
The Fund is a “fund of funds” that invests in a wide variety of asset classes. During the Reporting Period, the Fund’s diversified investment exposures contributed to its underperformance relative to the Index, which is an equity only index. U.S. equities faced significant headwinds in their effort to earn positive returns during the Reporting Period. Contributing to this lackluster outcome for 2015 was a challenging environment for U.S. companies’ ability to earn a profit, evidenced by a decline in year over year earnings of issuers included in the S&P 500 Index. The dollar strengthened significantly over the period, which provided a headwind to the performance of non-U.S. developed market equities. 2015 was the weakest year for developed global market equities since 2011. Continued volatility in China’s equity markets and growing concerns surrounding emerging market growth prospects more generally led to a double digit selloff in the emerging markets. Results were mixed in the fixed income space. In U.S. credit markets, the fourth quarter punctuated an unsettlingly steady rise in both investment grade and speculative grade credit spreads throughout 2015. In the speculative U.S. high yield space, much of the spread widening was attributable to the impact of sharply lower global oil prices on the energy sector, which represents more than 15% of the Barclays U.S. High Yield Index. Evidence that credit conditions in the U.S. tightened throughout the Reporting Period for reasons beyond energy prices comes from the coincident rise in investment grade credit spreads.
The top positive contributors to the Fund’s performance were S&P 500 Index and Barclays U.S. Aggregate Index. The top negative contributors to the Fund’s performance were MSCI ACWI ex USA Index, Russell Small Cap Completeness Index and Barclays Long U.S. Treasury Index.
The views expressed above reflect those of the Fund’s portfolio manager only through the Reporting Period and do not necessarily represent the views of the Adviser as a whole. Any such views are subject to change at any time based upon market or other conditions, and the Adviser disclaims any responsibility to update such views. These views may not be relied on as investment advice and, because investment decisions for a fund are based on numerous factors, may not be relied on as an indication of trading intent on behalf of any fund.
| * | The State Street Target Retirement 2035 Composite Index consists of several different indexes, and is designed to provide exposure to a variety of asset classes. The State Street Target Retirement 2035 Composite Index will contain one or more of the following indexes: S&P 500 Index, Russell Small Cap Completeness® Index, MSCI ACWI ex USA Index, Barclays U.S. Aggregate Index, Barclays U.S. Government Inflation-linked Bond Index, Barclays 1-10 Year Government Inflation-linked Bond Index, Barclays High Yield Very Liquid Index, Dow Jones Global Select Real Estate Securities Index, Barclays Long U.S. Treasury Index, Barclays 1-5 Year U.S. Treasury Index and / or Barclays U.S. 1-3 Year Corporate Bond Index. |
11
Table of Contents
State Street Target Retirement 2035 Fund
Class K
Growth of a $10,000 Investment (a)

Investment Performance (a)
For the Year Ended December 31, 2015
| Total Return One Year Ended December 31, 2015 | Average Annual Total Return Inception to Date December 31, 2015 | |||||||
State Street Target Retirement 2035 Fund Class A | -2.15 | % | -0.05 | % | ||||
State Street Target Retirement 2035 Fund Class I | -2.00 | % | 0.12 | % | ||||
State Street Target Retirement 2035 Fund Class K | -1.90 | % | 0.24 | % | ||||
S&P 500® Index(b) | 1.38 | % | 5.07 | % | ||||
| (a) | Total returns and performance graph information represent past performance and are not indicative of future results, which may be lower or higher than performance data quoted. Investment return and principal value of an investment will fluctuate so that an investor’s share, when redeemed, may be worth more or less than its original cost. The graph and table above do not reflect the deduction of taxes that a shareholder would pay on fund distributions, sales, or the redemption of fund shares. |
| (b) | The Standard & Poor’s 500 Composite Stock Price Index (“S&P 500® Index”) is an unmanaged capitalization-weighted index of 500 widely held stocks recognized by investors to be representative of the U.S. stock market in general. It is not possible to invest directly in the S&P 500® Index. |
12
Table of Contents
State Street Target Retirement 2040 Fund
MANAGEMENT’S DISCUSSION OF FUND PERFORMANCE
The State Street Target Retirement 2040 Fund (the “Fund”) seeks capital growth and income over the long term. The Fund’s benchmark is to the S&P 500 Index (the “Index”).
For the 12-month period ended December 31, 2015 (the “Reporting Period”), the total return for Class K of the Fund was -2.18%, and the total return for the Index was 1.38%. The total return of the Fund’s secondary benchmark index, the State Street Target Retirement 2040 Composite Index* (the “Secondary Index”), was -1.84% for the Reporting Period. The returns of the Fund and both the Index and the Secondary Index reflect the reinvestment of dividends and other income. The Fund’s performance reflects the expenses of managing the Fund, including brokerage and advisory expenses. Both the Index and the Secondary Index are unmanaged and their returns do not reflect fees and expenses of any kind, which would have a negative impact on returns.
The Fund is a “fund of funds” that invests in a wide variety of asset classes. During the Reporting Period, the Fund’s diversified investment exposures contributed to its underperformance relative to the Index, which is an equity only index. U.S. equities faced significant headwinds in their effort to earn positive returns during the Reporting Period. Contributing to this lackluster outcome for 2015 was a challenging environment for U.S. companies’ ability to earn a profit, evidenced by a decline in year over year earnings of issuers included in the S&P 500 Index. The dollar strengthened significantly over the period, which provided a headwind to the performance of non-U.S. developed market equities. 2015 was the weakest year for developed global market equities since 2011. Continued volatility in China’s equity markets and growing concerns surrounding emerging market growth prospects more generally led to a double digit selloff in the emerging markets. Results were mixed in the fixed income space. In U.S. credit markets, the fourth quarter punctuated an unsettlingly steady rise in both investment grade and speculative grade credit spreads throughout 2015. In the speculative U.S. high yield space, much of the spread widening was attributable to the impact of sharply lower global oil prices on the energy sector, which represents more than 15% of the Barclays U.S. High Yield Index. Evidence that credit conditions in the U.S. tightened throughout the Reporting Period for reasons beyond energy prices comes from the coincident rise in investment grade credit spreads.
The top positive contributor to the Fund’s performance was S&P 500 Index. The top negative contributors to the Fund’s performance were MSCI ACWI ex USA Index, Russell Small Cap Completeness Index and Barclays Long U.S. Treasury Index.
The views expressed above reflect those of the Fund’s portfolio manager only through the Reporting Period and do not necessarily represent the views of the Adviser as a whole. Any such views are subject to change at any time based upon market or other conditions, and the Adviser disclaims any responsibility to update such views. These views may not be relied on as investment advice and, because investment decisions for a fund are based on numerous factors, may not be relied on as an indication of trading intent on behalf of any fund.
| * | The State Street Target Retirement 2040 Composite Index consists of several different indexes, and is designed to provide exposure to a variety of asset classes. The State Street Target Retirement 2040 Composite Index will contain one or more of the following indexes: S&P 500 Index, Russell Small Cap Completeness® Index, MSCI ACWI ex USA Index, Barclays U.S. Aggregate Index, Barclays U.S. Government Inflation-linked Bond Index, Barclays 1-10 Year Government Inflation-linked Bond Index, Barclays High Yield Very Liquid Index, Dow Jones Global Select Real Estate Securities Index, Barclays Long U.S. Treasury Index, Barclays 1-5 Year U.S. Treasury Index and / or Barclays U.S. 1-3 Year Corporate Bond Index. |
13
Table of Contents
State Street Target Retirement 2040 Fund
Class K
Growth of a $10,000 Investment (a)
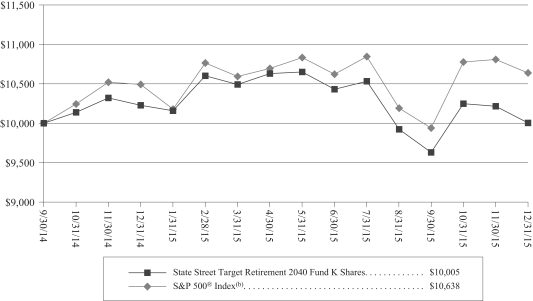
Investment Performance (a)
For the Year Ended December 31, 2015
| Total Return One Year Ended December 31, 2015 | Average Annual Total Return Inception to Date December 31, 2015 | |||||||
State Street Target Retirement 2040 Fund Class A | -2.53 | % | -0.33 | % | ||||
State Street Target Retirement 2040 Fund Class I | -2.28 | % | -0.08 | % | ||||
State Street Target Retirement 2040 Fund Class K | -2.18 | % | 0.04 | % | ||||
S&P 500® Index(b) | 1.38 | % | 5.07 | % | ||||
| (a) | Total returns and performance graph information represent past performance and are not indicative of future results, which may be lower or higher than performance data quoted. Investment return and principal value of an investment will fluctuate so that an investor’s share, when redeemed, may be worth more or less than its original cost. The graph and table above do not reflect the deduction of taxes that a shareholder would pay on fund distributions, sales, or the redemption of fund shares. |
| (b) | The Standard & Poor’s 500 Composite Stock Price Index (“S&P 500® Index”) is an unmanaged capitalization-weighted index of 500 widely held stocks recognized by investors to be representative of the U.S. stock market in general. It is not possible to invest directly in the S&P 500® Index. |
14
Table of Contents
State Street Target Retirement 2045 Fund
MANAGEMENT’S DISCUSSION OF FUND PERFORMANCE
The State Street Target Retirement 2045 Fund (the “Fund”) seeks capital growth and income over the long term. The Fund’s benchmark is the S&P 500 Index (the “Index”).
For the 12-month period ended December 31, 2015 (the “Reporting Period”), the total return for Class K of the Fund was -2.40%, and the total return for the Index was 1.38%. The total return of the Fund’s secondary benchmark index, the State Street Target Retirement 2045 Composite Index* (the “Secondary Index”) was -1.96% for the Reporting Period. The returns of the Fund and both the Index and the Secondary Index reflect the reinvestment of dividends and other income. The Fund’s performance reflects the expenses of managing the Fund, including brokerage and advisory expenses. Both the Index and the Secondary Index are unmanaged and their returns do not reflect fees and expenses of any kind, which would have a negative impact on returns.
The Fund is a “fund of funds” that invests in a wide variety of asset classes. During the Reporting Period, the Fund’s diversified investment exposures contributed to its underperformance relative to the Index, which is an equity only index. U.S. equities faced significant headwinds in their effort to earn positive returns during the Reporting Period. Contributing to this lackluster outcome for 2015 was a challenging environment for U.S. companies’ ability to earn a profit, evidenced by a decline in year over year earnings of issuers included in the S&P 500 Index. The dollar strengthened significantly over the period, which provided a headwind to the performance of non-U.S. developed market equities. 2015 was the weakest year for developed global market equities since 2011. Continued volatility in China’s equity markets and growing concerns surrounding emerging market growth prospects more generally led to a double digit selloff in the emerging markets. Results were mixed in the fixed income space. In U.S. credit markets, the fourth quarter punctuated an unsettlingly steady rise in both investment grade and speculative grade credit spreads throughout 2015. In the speculative U.S. high yield space, much of the spread widening was attributable to the impact of sharply lower global oil prices on the energy sector, which represents more than 15% of the Barclays U.S. High Yield Index. Evidence that credit conditions in the U.S. tightened throughout the Reporting Period for reasons beyond energy prices comes from the coincident rise in investment grade credit spreads.
The top positive contributor to the Fund’s performance was S&P 500 Index. The top negative contributors to the Fund’s performance were MSCI ACWI ex USA Index, Russell Small Cap Completeness Index and Barclays Long U.S. Treasury Index.
The views expressed above reflect those of the Fund’s portfolio manager only through the Reporting Period and do not necessarily represent the views of the Adviser as a whole. Any such views are subject to change at any time based upon market or other conditions, and the Adviser disclaims any responsibility to update such views. These views may not be relied on as investment advice and, because investment decisions for a fund are based on numerous factors, may not be relied on as an indication of trading intent on behalf of any fund.
| * | The State Street Target Retirement 2045 Composite Index consists of several different indexes, and is designed to provide exposure to a variety of asset classes. The State Street Target Retirement 2045 Composite Index will contain one or more of the following indexes: S&P 500 Index, Russell Small Cap Completeness® Index, MSCI ACWI ex USA Index, Barclays U.S. Aggregate Index, Barclays U.S. Government Inflation-linked Bond Index, Barclays 1-10 Year Government Inflation-linked Bond Index, Barclays High Yield Very Liquid Index, Dow Jones Global Select Real Estate Securities Index, Barclays Long U.S. Treasury Index, Barclays 1-5 Year U.S. Treasury Index and / or Barclays U.S. 1-3 Year Corporate Bond Index. |
15
Table of Contents
State Street Target Retirement 2045 Fund
Class K
Growth of a $10,000 Investment (a)

Investment Performance (a)
For the Year Ended December 31, 2015
| Total Return One Year Ended December 31, 2015 | Average Annual Total Return Inception to Date December 31, 2015 | |||||||
State Street Target Retirement 2045 Fund Class A | -2.64 | % | -0.45 | % | ||||
State Street Target Retirement 2045 Fund Class I | -2.40 | % | -0.20 | % | ||||
State Street Target Retirement 2045 Fund Class K | -2.40 | % | -0.16 | % | ||||
S&P 500® Index(b) | 1.38 | % | 5.07 | % | ||||
| (a) | Total returns and performance graph information represent past performance and are not indicative of future results, which may be lower or higher than performance data quoted. Investment return and principal value of an investment will fluctuate so that an investor’s share, when redeemed, may be worth more or less than its original cost. The graph and table above do not reflect the deduction of taxes that a shareholder would pay on fund distributions, sales, or the redemption of fund shares. |
| (b) | The Standard & Poor’s 500 Composite Stock Price Index (“S&P 500® Index”) is an unmanaged capitalization-weighted index of 500 widely held stocks recognized by investors to be representative of the U.S. stock market in general. It is not possible to invest directly in the S&P 500® Index. |
16
Table of Contents
State Street Target Retirement 2050 Fund
MANAGEMENT’S DISCUSSION OF FUND PERFORMANCE
The State Street Target Retirement 2050 Fund (the “Fund”) seeks capital growth and income over the long term. The Fund’s benchmark is the S&P 500 Index (the “Index”).
For the 12-month period ended December 31, 2015 (the “Reporting Period”), the total return for Class K of the Fund was -2.71%, and the total return for the Index was 1.38%. The total return of the Fund’s secondary benchmark index, the State Street Target Retirement 2050 Composite Index* (the “Secondary Index”) was -1.96% for the Reporting Period. The returns of the Fund and both the Index and the Secondary Index reflect the reinvestment of dividends and other income. The Fund’s performance reflects the expenses of managing the Fund, including brokerage and advisory expenses. Both the Index and the Secondary Index are unmanaged and their returns do not reflect fees and expenses of any kind, which would have a negative impact on returns.
The Fund is a “fund of funds” that invests in a wide variety of asset classes. During the Reporting Period, the Fund’s diversified investment exposures contributed to its underperformance relative to the Index, which is an equity only index. U.S. equities faced significant headwinds in their effort to earn positive returns during the Reporting Period. Contributing to this lackluster outcome for 2015 was a challenging environment for U.S. companies’ ability to earn a profit, evidenced by a decline in year over year earnings of issuers included in the S&P 500 Index. The dollar strengthened significantly over the period, which provided a headwind to the performance of non-U.S. developed market equities. 2015 was the weakest year for developed global market equities since 2011. Continued volatility in China’s equity markets and growing concerns surrounding emerging market growth prospects more generally led to a double digit selloff in the emerging markets. Results were mixed in the fixed income space. In U.S. credit markets, the fourth quarter punctuated an unsettlingly steady rise in both investment grade and speculative grade credit spreads throughout 2015. In the speculative U.S. high yield space, much of the spread widening was attributable to the impact of sharply lower global oil prices on the energy sector, which represents more than 15% of the Barclays U.S. High Yield Index. Evidence that credit conditions in the U.S. tightened throughout the Reporting Period for reasons beyond energy prices comes from the coincident rise in investment grade credit spreads.
The top positive contributor to the Fund’s performance was S&P 500 Index. The top negative contributors to the Fund’s performance were MSCI ACWI ex USA Index, Russell Small Cap Completeness Index and Barclays Long U.S. Treasury Index.
The views expressed above reflect those of the Fund’s portfolio manager only through the Reporting Period and do not necessarily represent the views of the Adviser as a whole. Any such views are subject to change at any time based upon market or other conditions, and the Adviser disclaims any responsibility to update such views. These views may not be relied on as investment advice and, because investment decisions for a fund are based on numerous factors, may not be relied on as an indication of trading intent on behalf of any fund.
| * | The State Street Target Retirement 2050 Composite Index consists of several different indexes, and is designed to provide exposure to a variety of asset classes. The State Street Target Retirement 2050 Composite Index will contain one or more of the following indexes: S&P 500 Index, Russell Small Cap Completeness® Index, MSCI ACWI ex USA Index, Barclays U.S. Aggregate Index, Barclays U.S. Government Inflation-linked Bond Index, Barclays 1-10 Year Government Inflation-linked Bond Index, Barclays High Yield Very Liquid Index, Dow Jones Global Select Real Estate Securities Index, Barclays Long U.S. Treasury Index, Barclays 1-5 Year U.S. Treasury Index and / or Barclays U.S. 1-3 Year Corporate Bond Index. |
17
Table of Contents
State Street Target Retirement 2050 Fund
Class K
Growth of a $10,000 Investment (a)
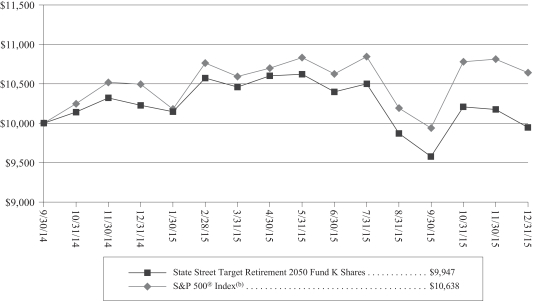
Investment Performance (a)
For the Year Ended December 31, 2015
| Total Return One Year Ended December 31, 2015 | Average Annual Total Return Inception to Date December 31, 2015 | |||||||
State Street Target Retirement 2050 Fund Class A | -2.85 | % | -0.62 | % | ||||
State Street Target Retirement 2050 Fund Class I | -2.61 | % | -0.38 | % | ||||
State Street Target Retirement 2050 Fund Class K | -2.71 | % | -0.42 | % | ||||
S&P 500® Index(b) | 1.38 | % | 5.07 | % | ||||
| (a) | Total returns and performance graph information represent past performance and are not indicative of future results, which may be lower or higher than performance data quoted. Investment return and principal value of an investment will fluctuate so that an investor’s share, when redeemed, may be worth more or less than its original cost. The graph and table above do not reflect the deduction of taxes that a shareholder would pay on fund distributions, sales, or the redemption of fund shares. |
| (b) | The Standard & Poor’s 500 Composite Stock Price Index (“S&P 500® Index”) is an unmanaged capitalization-weighted index of 500 widely held stocks recognized by investors to be representative of the U.S. stock market in general. It is not possible to invest directly in the S&P 500® Index. |
18
Table of Contents
State Street Target Retirement 2055 Fund
MANAGEMENT’S DISCUSSION OF FUND PERFORMANCE
The State Street Target Retirement 2055 Fund (the “Fund”) seeks capital growth and income over the long term. The Fund’s benchmark is the S&P 500 Index (the “Index”).
For the 12-month period ended December 31, 2015 (the “Reporting Period”), the total return for Class K of the Fund was -2.75%, and the total return for the Index was 1.38%. The total return of the Fund’s secondary benchmark index, the State Street Target Retirement 2055 Composite Index* (the “Secondary Index”) was -1.96% for the Reporting Period. The returns of the Fund and both the Index and the Secondary Index reflect the reinvestment of dividends and other income. The Fund’s performance reflects the expenses of managing the Fund, including brokerage and advisory expenses. Both the Index and the Secondary Index are unmanaged and their returns do not reflect fees and expenses of any kind, which would have a negative impact on returns.
The Fund is a “fund of funds” that invests in a wide variety of asset classes. During the Reporting Period, the Fund’s diversified investment exposures contributed to its underperformance relative to the Index, which is an equity only index. U.S. equities faced significant headwinds in their effort to earn positive returns during the Reporting Period. Contributing to this lackluster outcome for 2015 was a challenging environment for U.S. companies’ ability to earn a profit, evidenced by a decline in year over year earnings of issuers included in the S&P 500 Index. The dollar strengthened significantly over the period, which provided a headwind to the performance of non-U.S. developed market equities. 2015 was the weakest year for developed global market equities since 2011. Continued volatility in China’s equity markets and growing concerns surrounding emerging market growth prospects more generally led to a double digit selloff in the emerging markets. Results were mixed in the fixed income space. In U.S. credit markets, the fourth quarter punctuated an unsettlingly steady rise in both investment grade and speculative grade credit spreads throughout 2015. In the speculative U.S. high yield space, much of the spread widening was attributable to the impact of sharply lower global oil prices on the energy sector, which represents more than 15% of the Barclays U.S. High Yield Index. Evidence that credit conditions in the U.S. tightened throughout the Reporting Period for reasons beyond energy prices comes from the coincident rise in investment grade credit spreads.
The top positive contributor to the Fund’s performance was S&P 500 Index. The top negative contributors to the Fund’s performance were MSCI ACWI ex USA Index, Russell Small Cap Completeness Index and Barclays Long U.S. Treasury Index.
The views expressed above reflect those of the Fund’s portfolio manager only through the Reporting Period and do not necessarily represent the views of the Adviser as a whole. Any such views are subject to change at any time based upon market or other conditions, and the Adviser disclaims any responsibility to update such views. These views may not be relied on as investment advice and, because investment decisions for a fund are based on numerous factors, may not be relied on as an indication of trading intent on behalf of any fund.
| * | The State Street Target Retirement 2055 Composite Index consists of several different indexes, and is designed to provide exposure to a variety of asset classes. The State Street Target Retirement 2055 Composite Index will contain one or more of the following indexes: S&P 500 Index, Russell Small Cap Completeness® Index, MSCI ACWI ex USA Index, Barclays U.S. Aggregate Index, Barclays U.S. Government Inflation-linked Bond Index, Barclays 1-10 Year Government Inflation-linked Bond Index, Barclays High Yield Very Liquid Index, Dow Jones Global Select Real Estate Securities Index, Barclays Long U.S. Treasury Index, Barclays 1-5 Year U.S. Treasury Index and / or Barclays U.S. 1-3 Year Corporate Bond Index. |
19
Table of Contents
State Street Target Retirement 2055 Fund
Class K
Growth of a $10,000 Investment (a)

Investment Performance (a)
For the Year Ended December 31, 2015
| Total Return One Year Ended December 31, 2015 | Average Annual Total Return Inception to Date December 31, 2015 | |||||||
State Street Target Retirement 2055 Fund Class A | -2.90 | % | -0.66 | % | ||||
State Street Target Retirement 2055 Fund Class I | -2.65 | % | -0.41 | % | ||||
State Street Target Retirement 2055 Fund Class K | -2.75 | % | -0.45 | % | ||||
S&P 500® Index(b) | 1.38 | % | 5.07 | % | ||||
| (a) | Total returns and performance graph information represent past performance and are not indicative of future results, which may be lower or higher than performance data quoted. Investment return and principal value of an investment will fluctuate so that an investor’s share, when redeemed, may be worth more or less than its original cost. The graph and table above do not reflect the deduction of taxes that a shareholder would pay on fund distributions, sales, or the redemption of fund shares. |
| (b) | The Standard & Poor’s 500 Composite Stock Price Index (“S&P 500® Index”) is an unmanaged capitalization-weighted index of 500 widely held stocks recognized by investors to be representative of the U.S. stock market in general. It is not possible to invest directly in the S&P 500® Index. |
20
Table of Contents
State Street Target Retirement 2060 Fund
MANAGEMENT’S DISCUSSION OF FUND PERFORMANCE
The State Street Target Retirement 2060 Fund (the “Fund”) seeks capital growth and income over the long term. The Fund’s benchmark is the S&P 500 Index (the “Index”).
For the 12-month period ended December 31, 2015 (the “Reporting Period”), the total return for Class K of the Fund was -2.53%, and the total return for the Index was 1.38%. The total return of the Fund’s secondary benchmark index, the State Street Target Retirement 2060 Composite Index* (the “Secondary Index”) was -1.96% for the Reporting Period. The returns of the Fund and both the Index and the Secondary Index reflect the reinvestment of dividends and other income. The Fund’s performance reflects the expenses of managing the Fund, including brokerage and advisory expenses. Both the Index and the Secondary Index are unmanaged and their returns do not reflect fees and expenses of any kind, which would have a negative impact on returns.
The Fund is a “fund of funds” that invests in a wide variety of asset classes. During the Reporting Period, the Fund’s diversified investment exposures contributed to its underperformance relative to the Index, which is an equity only index. U.S. equities faced significant headwinds in their effort to earn positive returns during the Reporting Period. Contributing to this lackluster outcome for 2015 was a challenging environment for U.S. companies’ ability to earn a profit, evidenced by a decline in year over year earnings of issuers included in the S&P 500 Index. The dollar strengthened significantly over the period, which provided a headwind to the performance of non-U.S. developed market equities. 2015 was the weakest year for developed global market equities since 2011. Continued volatility in China’s equity markets and growing concerns surrounding emerging market growth prospects more generally led to a double digit selloff in the emerging markets. Results were mixed in the fixed income space. In U.S. credit markets, the fourth quarter punctuated an unsettlingly steady rise in both investment grade and speculative grade credit spreads throughout 2015. In the speculative U.S. high yield space, much of the spread widening was attributable to the impact of sharply lower global oil prices on the energy sector, which represents more than 15% of the Barclays U.S. High Yield Index. Evidence that credit conditions in the U.S. tightened throughout the Reporting Period for reasons beyond energy prices comes from the coincident rise in investment grade credit spreads.
The top positive contributor to the Fund’s performance was S&P 500 Index. The top negative contributors to the Fund’s performance were MSCI ACWI ex USA Index, Russell Small Cap Completeness Index and Barclays Long U.S. Treasury Index.
The views expressed above reflect those of the Fund’s portfolio manager only through the Reporting Period and do not necessarily represent the views of the Adviser as a whole. Any such views are subject to change at any time based upon market or other conditions, and the Adviser disclaims any responsibility to update such views. These views may not be relied on as investment advice and, because investment decisions for a fund are based on numerous factors, may not be relied on as an indication of trading intent on behalf of any fund.
| * | The State Street Target Retirement 2060 Composite Index consists of several different indexes, and is designed to provide exposure to a variety of asset classes. The State Street Target Retirement 2060 Composite Index will contain one or more of the following indexes: S&P 500 Index, Russell Small Cap Completeness® Index, MSCI ACWI ex USA Index, Barclays U.S. Aggregate Index, Barclays U.S. Government Inflation-linked Bond Index, Barclays 1-10 Year Government Inflation-linked Bond Index, Barclays High Yield Very Liquid Index, Dow Jones Global Select Real Estate Securities Index, Barclays Long U.S. Treasury Index, Barclays 1-5 Year U.S. Treasury Index and / or Barclays U.S. 1-3 Year Corporate Bond Index. |
21
Table of Contents
State Street Target Retirement 2060 Fund
Class K
Growth of a $10,000 Investment (a)
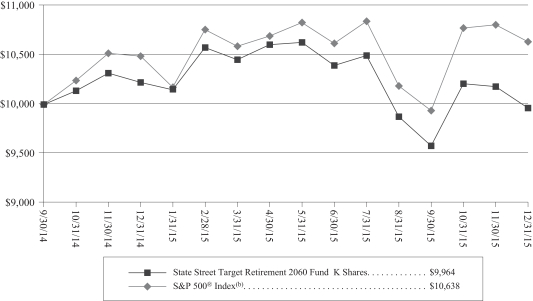
Investment Performance (a)
For the Year Ended December 31, 2015
| Total Return One Year Ended December 31, 2015 | Average Annual Total Return Inception to Date December 31, 2015 | |||||||
State Street Target Retirement 2060 Fund Class A | -2.78 | % | -0.57 | % | ||||
State Street Target Retirement 2060 Fund Class I | -2.53 | % | -0.32 | % | ||||
State Street Target Retirement 2060 Fund Class K | -2.53 | % | -0.28 | % | ||||
S&P 500® Index(b) | 1.38 | % | 5.07 | % | ||||
| (a) | Total returns and performance graph information represent past performance and are not indicative of future results, which may be lower or higher than performance data quoted. Investment return and principal value of an investment will fluctuate so that an investor’s share, when redeemed, may be worth more or less than its original cost. The graph and table above do not reflect the deduction of taxes that a shareholder would pay on fund distributions, sales, or the redemption of fund shares. |
| (b) | The Standard & Poor’s 500 Composite Stock Price Index (“S&P 500® Index”) is an unmanaged capitalization-weighted index of 500 widely held stocks recognized by investors to be representative of the U.S. stock market in general. It is not possible to invest directly in the S&P 500® Index. |
22
Table of Contents
State Street Target Retirement Series (Unaudited)
Target Retirement Fund, Target Retirement 2015 Fund, Target Retirement 2020 Fund, Target Retirement 2025 Fund, Target Retirement 2030 Fund, Target Retirement 2035 Fund, Target Retirement 2040 Fund, Target Retirement 2045 Fund, Target Retirement 2050 Fund, Target Retirement 2055 Fund and Target Retirement 2060 Fund are referred to individually as a “Fund” and collectively as the “Target Retirement Funds” or the “Funds”.
SSGA Funds Management, Inc. (“SSGA FM” or the “Adviser”) invests the assets of each Target Retirement Fund into underlying funds according to a proprietary asset allocation strategy. Each Fund’s name refers to the approximate retirement year of the investors for whom the Fund’s asset allocation strategy is intended. As the target date for a Fund approaches, the Adviser will adjust the asset allocation and risk profile of the Fund – its glide path – to what is generally seen to be a more conservative approach to reduce (but not eliminate) risk by increasing the allocation to asset classes that have historically been subject to lower levels of volatility. For example, a Fund with a target retirement date far into the future will typically invest a greater portion of its assets in asset classes with higher risk profiles and the potential for higher returns than a Fund that is intended for investors who are in their retirement years.
State Street Target Retirement Fund (Unaudited)
Asset Allocation as of December 31, 2015 (as a percentage of Net Assets)
Domestic Equity Funds | 19.7 | % | ||
Domestic Fixed Income Funds | 65.2 | % | ||
International Equity Funds | 10.0 | % | ||
Real Estate Funds | 4.9 | % | ||
Short-Term Investment | 0.2 | % | ||
Liabilities in Excess of Other Assets | (0.0 | )%* | ||
| 100.0 | % |
| * | Amount shown represents less than 0.05% of net assets. |
State Street Target Retirement 2015 Fund (Unaudited)
Asset Allocation as of December 31, 2015 (as a percentage of Net Assets)
Domestic Equity Funds | 25.7 | % | ||
Domestic Fixed Income Funds | 55.2 | % | ||
International Equity Funds | 14.0 | % | ||
Real Estate Funds | 5.0 | % | ||
Short-Term Investment | 0.1 | % | ||
Other Assets in Excess of Liabilities | 0.0 | %* | ||
| 100.0 | % |
| * | Amount shown represents less than 0.05% of net assets. |
23
Table of Contents
State Street Target Retirement 2020 Fund (Unaudited)
Asset Allocation as of December 31, 2015 (as a percentage of Net Assets)
Domestic Equity Funds | 34.2 | % | ||
Domestic Fixed Income Funds | 42.7 | % | ||
International Equity Funds | 20.0 | % | ||
Real Estate Funds | 3.0 | % | ||
Short-Term Investment | 0.1 | % | ||
Other Assets in Excess of Liabilities | 0.0 | %* | ||
| 100.0 | % |
| * | Amount shown represents less than 0.05% of net assets. |
State Street Target Retirement 2025 Fund (Unaudited)
Asset Allocation as of December 31, 2015 (as a percentage of Net Assets)
Domestic Equity Funds | 41.8 | % | ||
Domestic Fixed Income Funds | 32.1 | % | ||
International Equity Funds | 25.5 | % | ||
Real Estate Funds | 0.5 | % | ||
Short-Term Investment | 0.2 | % | ||
Liabilities in Excess of Other Assets | (0.1 | )% | ||
| 100.0 | % |
State Street Target Retirement 2030 Fund (Unaudited)
Asset Allocation as of December 31, 2015 (as a percentage of Net Assets)
Domestic Equity Funds | 46.6 | % | ||
Domestic Fixed Income Funds | 24.6 | % | ||
International Equity Funds | 28.7 | % | ||
Short-Term Investment | 0.1 | % | ||
Liabilities in Excess of Other Assets | (0.0 | )%* | ||
| 100.0 | % |
| * | Amount shown represents less than 0.05% of net assets. |
24
Table of Contents
State Street Target Retirement 2035 Fund (Unaudited)
Asset Allocation as of December 31, 2015 (as a percentage of Net Assets)
Domestic Equity Funds | 50.6 | % | ||
Domestic Fixed Income Funds | 18.0 | % | ||
International Equity Funds | 31.4 | % | ||
Short-Term Investment | 0.1 | % | ||
Liabilities in Excess of Other Assets | (0.1 | )% | ||
| 100.0 | % |
State Street Target Retirement 2040 Fund (Unaudited)
Asset Allocation as of December 31, 2015 (as a percentage of Net Assets)
Domestic Equity Funds | 53.6 | % | ||
Domestic Fixed Income Funds | 13.0 | % | ||
International Equity Funds | 33.3 | % | ||
Short-Term Investment | 0.1 | % | ||
Liabilities in Excess of Other Assets | (0.0 | )%* | ||
| 100.0 | % |
| * | Amount shown represents less than 0.05% of net assets. |
State Street Target Retirement 2045 Fund (Unaudited)
Asset Allocation as of December 31, 2015 (as a percentage of Net Assets)
Domestic Equity Funds | 55.5 | % | ||
Domestic Fixed Income Funds | 9.8 | % | ||
International Equity Funds | 34.7 | % | ||
Short-Term Investment | 0.2 | % | ||
Liabilities in Excess of Other Assets | (0.2 | )% | ||
| 100.0 | % |
State Street Target Retirement 2050 Fund (Unaudited)
Asset Allocation as of December 31, 2015 (as a percentage of Net Assets)
Domestic Equity Funds | 55.6 | % | ||
Domestic Fixed Income Funds | 9.8 | % | ||
International Equity Funds | 34.7 | % | ||
Short-Term Investment | 0.1 | % | ||
Liabilities in Excess of Other Assets | (0.2 | )% | ||
| 100.0 | % |
25
Table of Contents
State Street Target Retirement 2055 Fund (Unaudited)
Asset Allocation as of December 31, 2015 (as a percentage of Net Assets)
Domestic Equity Funds | 55.8 | % | ||
Domestic Fixed Income Funds | 9.8 | % | ||
International Equity Funds | 34.8 | % | ||
Short-Term Investment | 0.1 | % | ||
Liabilities in Excess of Other Assets | (0.5 | )% | ||
| 100.0 | % |
State Street Target Retirement 2060 Fund (Unaudited)
Asset Allocation as of December 31, 2015 (as a percentage of Net Assets)
Domestic Equity Funds | 57.7 | % | ||
Domestic Fixed Income Funds | 10.0 | % | ||
International Equity Funds | 36.0 | % | ||
Short-Term Investment | 0.8 | % | ||
Liabilities in Excess of Other Assets | (4.5 | )% | ||
| 100.0 | % |
26
Table of Contents
State Street Target Retirement Fund
December 31, 2015
Security Description | Shares | Value | ||||||
MUTUAL FUNDS AND EXCHANGE TRADED PRODUCTS – 99.8%(a) |
| |||||||
Domestic Equity – 19.7% | ||||||||
State Street Equity 500 Index II Portfolio | 375,107 | $ | 3,871,104 | |||||
State Street Small/Mid Cap Equity Index Portfolio | 78,596 | 730,947 | ||||||
|
| |||||||
| 4,602,051 | ||||||||
|
| |||||||
Domestic Fixed Income – 65.2% |
| |||||||
SPDR Barclays 1-10 Year TIPS ETF | 221,217 | 4,242,942 | ||||||
SPDR Barclays High Yield Bond ETF | 48,169 | 1,633,411 | ||||||
SPDR Barclays Short Term Corporate Bond ETF | 30,696 | 933,159 | ||||||
SPDR Barclays Short Term Treasury ETF | 123,343 | 3,712,624 | ||||||
State Street Aggregate Bond Index Portfolio | 472,975 | 4,677,727 | ||||||
|
| |||||||
| 15,199,863 | ||||||||
|
| |||||||
International Equity – 10.0% |
| |||||||
State Street Global Equity ex-U.S. Index Portfolio | 276,385 | 2,335,452 | ||||||
|
| |||||||
Real Estate – 4.9% | ||||||||
SPDR Dow Jones Global Real Estate ETF | 24,707 | 1,156,288 | ||||||
|
| |||||||
TOTAL MUTUAL FUNDS AND EXCHANGE TRADED PRODUCTS |
| 23,293,654 | ||||||
|
| |||||||
SHORT-TERM INVESTMENT – 0.2% |
| |||||||
Money Market Fund – 0.2% |
| |||||||
State Street Institutional Liquid Reserves Fund, Premier Class 0.23%(a)(b) | 42,203 | 42,203 | ||||||
|
| |||||||
TOTAL INVESTMENTS – 100.0%(c) |
| 23,335,857 | ||||||
Liabilities in Excess of Other | (10,259 | ) | ||||||
|
| |||||||
NET ASSETS – 100.0% | $ | 23,325,598 | ||||||
|
| |||||||
| (a) | Affiliated Funds managed by SSGA Funds Management, Inc. (Note 4). |
| (b) | The rate shown is the annualized seven-day yield at December 31, 2015. |
| (c) | Unless otherwise indicated, the values of the securities of the Fund are determined based on Level 1 inputs. |
| (d) | Amount shown represents less than 0.05% of net assets. |
See accompanying notes to the financial statements.
27
Table of Contents
State Street Target Retirement 2015 Fund
Schedule of Investments
December 31, 2015
Security Description | Shares | Value | ||||||
MUTUAL FUNDS AND EXCHANGE TRADED PRODUCTS – 99.9%(a) |
| |||||||
Domestic Equity – 25.7% |
| |||||||
State Street Equity 500 Index II Portfolio | 111,971 | $ | 1,155,545 | |||||
State Street Small/Mid Cap Equity Index Portfolio | 23,068 | 214,531 | ||||||
|
| |||||||
| 1,370,076 | ||||||||
|
| |||||||
Domestic Fixed Income – 55.2% |
| |||||||
SPDR Barclays 1-10 Year TIPS ETF | 53,475 | 1,025,651 | ||||||
SPDR Barclays High Yield Bond ETF | 11,031 | 374,061 | ||||||
SPDR Barclays Short Term Corporate Bond ETF | 1,757 | 53,413 | ||||||
SPDR Barclays Short Term Treasury ETF | 6,590 | 198,359 | ||||||
State Street Aggregate Bond Index Portfolio | 129,905 | 1,284,764 | ||||||
|
| |||||||
| 2,936,248 | ||||||||
|
| |||||||
International Equity – 14.0% |
| |||||||
State Street Global Equity ex-U.S. Index Portfolio | 88,277 | 745,943 | ||||||
|
| |||||||
Real Estate – 5.0% |
| |||||||
SPDR Dow Jones Global Real Estate ETF | 5,658 | 264,794 | ||||||
|
| |||||||
TOTAL MUTUAL FUNDS AND EXCHANGE TRADED PRODUCTS |
| 5,317,061 | ||||||
|
| |||||||
SHORT-TERM INVESTMENT – 0.1% |
| |||||||
Money Market Fund – 0.1% |
| |||||||
State Street Institutional Liquid Reserves Fund, Premier Class 0.23%(a)(b) | 5,195 | 5,195 | ||||||
|
| |||||||
TOTAL INVESTMENTS – 100.0%(c) |
| 5,322,256 | ||||||
Other Assets in Excess of | 249 | |||||||
|
| |||||||
NET ASSETS – 100.0% | $ | 5,322,505 | ||||||
|
| |||||||
| (a) | Affiliated Funds managed by SSGA Funds Management, Inc. (Note 4). |
| (b) | The rate shown is the annualized seven-day yield at December 31, 2015. |
| (c) | Unless otherwise indicated, the values of the securities of the Fund are determined based on Level 1 inputs. |
| (d) | Amount shown represents less than 0.05% of net assets. |
See accompanying notes to the financial statements.
28
Table of Contents
State Street Target Retirement 2020 Fund
Schedule of Investments
December 31, 2015
Security Description | Shares | Value | ||||||
MUTUAL FUNDS AND EXCHANGE TRADED PRODUCTS – 99.9%(a) |
| |||||||
Domestic Equity – 34.2% |
| |||||||
State Street Equity 500 Index II Portfolio | 1,466,126 | $ | 15,130,420 | |||||
State Street Small/Mid Cap Equity Index Portfolio | 368,793 | 3,429,773 | ||||||
|
| |||||||
| 18,560,193 | ||||||||
|
| |||||||
Domestic Fixed Income – 42.7% |
| |||||||
SPDR Barclays 1-10 Year TIPS ETF | 85,938 | 1,648,291 | ||||||
SPDR Barclays High Yield Bond ETF | 96,236 | 3,263,363 | ||||||
SPDR Barclays Long Term Treasury ETF | 30,708 | 2,145,875 | ||||||
SPDR Barclays TIPS ETF | 84,566 | 4,619,841 | ||||||
State Street Aggregate Bond Index Portfolio | 1,158,674 | 11,459,287 | ||||||
|
| |||||||
| 23,136,657 | ||||||||
|
| |||||||
International Equity – 20.0% |
| |||||||
State Street Global Equity ex-U.S. Index Portfolio | 1,283,147 | 10,842,592 | ||||||
|
| |||||||
Real Estate – 3.0% |
| |||||||
SPDR Dow Jones Global Real Estate ETF | 34,554 | 1,617,127 | ||||||
|
| |||||||
TOTAL MUTUAL FUNDS AND EXCHANGE TRADED PRODUCTS |
| 54,156,569 | ||||||
|
| |||||||
SHORT-TERM INVESTMENT – 0.1% |
| |||||||
Money Market Fund – 0.1% |
| |||||||
State Street Institutional Liquid Reserves Fund, Premier Class 0.23%(a)(b) | 59,223 | 59,223 | ||||||
|
| |||||||
TOTAL INVESTMENTS – 100.0%(c) |
| 54,215,792 | ||||||
Other Assets in Excess of Liabilities – 0.0%(d) | 24,111 | |||||||
|
| |||||||
NET ASSETS – 100.0% | $ | 54,239,903 | ||||||
|
| |||||||
| (a) | Affiliated Funds managed by SSGA Funds Management, Inc. (Note 4). |
| (b) | The rate shown is the annualized seven-day yield at December 31, 2015. |
| (c) | Unless otherwise indicated, the values of the securities of the Fund are determined based on Level 1 inputs. |
| (d) | Amount shown represents less than 0.05% of net assets. |
See accompanying notes to the financial statements.
29
Table of Contents
State Street Target Retirement 2025 Fund
Schedule of Investments
December 31, 2015
Security Description | Shares | Value | ||||||
MUTUAL FUNDS AND EXCHANGE TRADED PRODUCTS – 99.9%(a) |
| |||||||
Domestic Equity – 41.8% | ||||||||
State Street Equity 500 Index II Portfolio | 806,639 | $ | 8,324,515 | |||||
State Street Small/Mid Cap Equity Index Portfolio | 240,898 | 2,240,347 | ||||||
|
| |||||||
| 10,564,862 | ||||||||
|
| |||||||
Domestic Fixed Income – 32.1% |
| |||||||
SPDR Barclays High Yield Bond ETF | 35,195 | 1,193,463 | ||||||
SPDR Barclays Long Term Treasury ETF | 32,230 | 2,252,232 | ||||||
SPDR Barclays TIPS ETF | 19,973 | 1,091,125 | ||||||
State Street Aggregate Bond Index Portfolio | 360,531 | 3,565,649 | ||||||
|
| |||||||
| 8,102,469 | ||||||||
|
| |||||||
International Equity – 25.5% |
| |||||||
State Street Global Equity ex-U.S. Index Portfolio | 761,307 | 6,433,045 | ||||||
|
| |||||||
Real Estate – 0.5% | ||||||||
SPDR Dow Jones Global Real Estate ETF | 2,689 | 125,845 | ||||||
|
| |||||||
TOTAL MUTUAL FUNDS AND EXCHANGE TRADED PRODUCTS |
| 25,226,221 | ||||||
|
| |||||||
SHORT-TERM INVESTMENT – 0.2% |
| |||||||
Money Market Fund – 0.2% | ||||||||
State Street Institutional Liquid Reserves Fund, Premier Class 0.23%(a)(b) | 58,469 | 58,469 | ||||||
|
| |||||||
TOTAL INVESTMENTS – 100.1%(c) |
| 25,284,690 | ||||||
Liabilities in Excess of Other | (17,949 | ) | ||||||
|
| |||||||
NET ASSETS – 100.0% | $ | 25,266,741 | ||||||
|
| |||||||
| (a) | Affiliated Funds managed by SSGA Funds Management, Inc. (Note 4). |
| (b) | The rate shown is the annualized seven-day yield at December 31, 2015. |
| (c) | Unless otherwise indicated, the values of the securities of the Fund are determined based on Level 1 inputs. |
See accompanying notes to the financial statements.
30
Table of Contents
State Street Target Retirement 2030 Fund
Schedule of Investments
December 31, 2015
Security Description | Shares | Value | ||||||
MUTUAL FUNDS AND EXCHANGE TRADED PRODUCTS – 99.9%(a) |
| |||||||
Domestic Equity – 46.6% |
| |||||||
State Street Equity 500 Index II Portfolio | 1,734,874 | $ | 17,903,899 | |||||
State Street Small/Mid Cap Equity Index Portfolio | 596,282 | 5,545,426 | ||||||
|
| |||||||
| 23,449,325 | ||||||||
|
| |||||||
Domestic Fixed Income – 24.6% |
| |||||||
SPDR Barclays High Yield Bond ETF | 26,115 | 885,559 | ||||||
SPDR Barclays Long Term Treasury ETF | 71,969 | 5,029,194 | ||||||
SPDR Barclays TIPS ETF | 11,571 | 632,124 | ||||||
State Street Aggregate Bond Index Portfolio | 590,423 | 5,839,285 | ||||||
|
| |||||||
| 12,386,162 | ||||||||
|
| |||||||
International Equity – 28.7% |
| |||||||
State Street Global Equity ex-U.S. Index Portfolio | 1,710,901 | 14,457,117 | ||||||
|
| |||||||
TOTAL MUTUAL FUNDS AND EXCHANGE TRADED PRODUCTS |
| 50,292,604 | ||||||
|
| |||||||
SHORT-TERM INVESTMENT – 0.1% |
| |||||||
Money Market Fund – 0.1% |
| |||||||
State Street Institutional Liquid Reserves Fund, Premier Class 0.23%(a)(b) | 61,616 | 61,616 | ||||||
|
| |||||||
TOTAL INVESTMENTS – 100.0%(c) |
| 50,354,220 | ||||||
Liabilities in Excess of Other | (14,695 | ) | ||||||
|
| |||||||
NET ASSETS – 100.0% |
| $ | 50,339,525 | |||||
|
| |||||||
| (a) | Affiliated Funds managed by SSGA Funds Management, Inc. (Note 4). |
| (b) | The rate shown is the annualized seven-day yield at December 31, 2015. |
| (c) | Unless otherwise indicated, the values of the securities of the Fund are determined based on Level 1 inputs. |
| (d) | Amount shown represents less than 0.05% of net assets. |
See accompanying notes to the financial statements.
31
Table of Contents
State Street Target Retirement 2035 Fund
Schedule of Investments
December 31, 2015
Security Description | Shares | Value | ||||||
MUTUAL FUNDS AND EXCHANGE TRADED PRODUCTS – 100.0%(a) |
| |||||||
Domestic Equity – 50.6% | ||||||||
State Street Equity 500 Index II Portfolio | 690,403 | $ | 7,124,961 | |||||
State Street Small/Mid Cap Equity Index Portfolio | 274,432 | 2,552,213 | ||||||
|
| |||||||
| 9,677,174 | ||||||||
|
| |||||||
Domestic Fixed Income – 18.0% |
| |||||||
SPDR Barclays Long Term Treasury ETF | 27,142 | 1,896,683 | ||||||
State Street Aggregate Bond Index Portfolio | 156,435 | 1,547,145 | ||||||
|
| |||||||
| 3,443,828 | ||||||||
|
| |||||||
International Equity – 31.4% |
| |||||||
State Street Global Equity ex-U.S. Index Portfolio | 710,580 | 6,004,397 | ||||||
|
| |||||||
TOTAL MUTUAL FUNDS AND EXCHANGE TRADED PRODUCTS |
| 19,125,399 | ||||||
|
| |||||||
SHORT-TERM INVESTMENT – 0.1% |
| |||||||
Money Market Fund – 0.1% | ||||||||
State Street Institutional Liquid Reserves Fund, Premier Class 0.23%(a)(b) | 29,072 | 29,072 | ||||||
|
| |||||||
TOTAL INVESTMENTS – 100.1%(c) |
| 19,154,471 | ||||||
Liabilities in Excess of Other | (26,472 | ) | ||||||
|
| |||||||
NET ASSETS – 100.0% | $ | 19,127,999 | ||||||
|
| |||||||
| (a) | Affiliated Funds managed by SSGA Funds Management, Inc. (Note 4). |
| (b) | The rate shown is the annualized seven-day yield at December 31, 2015. |
| (c) | Unless otherwise indicated, the values of the securities of the Fund are determined based on Level 1 inputs. |
See accompanying notes to the financial statements.
32
Table of Contents
State Street Target Retirement 2040 Fund
Schedule of Investments
December 31, 2015
Security Description | Shares | Value | ||||||
MUTUAL FUNDS AND EXCHANGE TRADED PRODUCTS – 99.9%(a) |
| |||||||
Domestic Equity – 53.6% | ||||||||
State Street Equity 500 Index II Portfolio | 1,360,079 | $ | 14,036,017 | |||||
State Street Small/Mid Cap Equity Index Portfolio | 622,013 | 5,784,718 | ||||||
|
| |||||||
| 19,820,735 | ||||||||
|
| |||||||
Domestic Fixed Income – 13.0% |
| |||||||
SPDR Barclays Long Term Treasury ETF | 52,863 | 3,694,067 | ||||||
State Street Aggregate Bond Index Portfolio | 113,396 | 1,121,488 | ||||||
|
| |||||||
| 4,815,555 | ||||||||
|
| |||||||
International Equity – 33.3% |
| |||||||
State Street Global Equity ex-U.S. Index Portfolio | 1,461,063 | 12,345,985 | ||||||
|
| |||||||
TOTAL MUTUAL FUNDS AND EXCHANGE TRADED PRODUCTS |
| 36,982,275 | ||||||
|
| |||||||
SHORT-TERM INVESTMENT – 0.1% |
| |||||||
Money Market Fund – 0.1% | ||||||||
State Street Institutional Liquid Reserves Fund, Premier Class 0.23%(a)(b) | 31,888 | 31,888 | ||||||
|
| |||||||
TOTAL INVESTMENTS – 100.0%(c) |
| 37,014,163 | ||||||
Liabilities in Excess of Other | (13,238 | ) | ||||||
|
| |||||||
NET ASSETS – 100.0% | $ | 37,000,925 | ||||||
|
| |||||||
| (a) | Affiliated Funds managed by SSGA Funds Management, Inc. (Note 4). |
| (b) | The rate shown is the annualized seven-day yield at December 31, 2015. |
| (c) | Unless otherwise indicated, the values of the securities of the Fund are determined based on Level 1 inputs. |
| (d) | Amount shown represents less than 0.05% of net assets. |
See accompanying notes to the financial statements.
33
Table of Contents
State Street Target Retirement 2045 Fund
Schedule of Investments
December 31, 2015
Security Description | Shares | Value | ||||||
MUTUAL FUNDS AND EXCHANGE TRADED PRODUCTS – 100.0%(a) |
| |||||||
Domestic Equity – 55.5% | ||||||||
State Street Equity 500 Index II Portfolio | 352,592 | $ | 3,638,753 | |||||
State Street Small/Mid Cap Equity Index Portfolio | 174,812 | 1,625,748 | ||||||
|
| |||||||
| 5,264,501 | ||||||||
|
| |||||||
Domestic Fixed Income – 9.8% |
| |||||||
SPDR Barclays Long Term Treasury ETF | 13,291 | 928,775 | ||||||
|
| |||||||
International Equity – 34.7% | ||||||||
State Street Global Equity ex-U.S. Index Portfolio | 389,014 | 3,287,166 | ||||||
|
| |||||||
TOTAL MUTUAL FUNDS AND EXCHANGE TRADED PRODUCTS |
| 9,480,442 | ||||||
|
| |||||||
SHORT-TERM INVESTMENT – 0.2% |
| |||||||
Money Market Fund – 0.2% | ||||||||
State Street Institutional Liquid Reserves Fund, Premier Class 0.23%(a)(b) | 14,605 | 14,605 | ||||||
|
| |||||||
TOTAL INVESTMENTS – 100.2%(c) |
| 9,495,047 | ||||||
Liabilities in Excess of Other | (17,277 | ) | ||||||
|
| |||||||
NET ASSETS – 100.0% | $ | 9,477,770 | ||||||
|
| |||||||
| (a) | Affiliated Funds managed by SSGA Funds Management, Inc. (Note 4). |
| (b) | The rate shown is the annualized seven-day yield at December 31, 2015. |
| (c) | Unless otherwise indicated, the values of the securities of the Fund are determined based on Level 1 inputs. |
See accompanying notes to the financial statements.
34
Table of Contents
State Street Target Retirement 2050 Fund
Schedule of Investments
December 31, 2015
Security Description | Shares | Value | ||||||
MUTUAL FUNDS AND EXCHANGE TRADED PRODUCTS – 100.1%(a) |
| |||||||
Domestic Equity – 55.6% | ||||||||
State Street Equity 500 Index II Portfolio | 249,153 | $ | 2,571,264 | |||||
State Street Small/Mid Cap Equity Index Portfolio | 123,526 | 1,148,791 | ||||||
|
| |||||||
| 3,720,055 | ||||||||
|
| |||||||
Domestic Fixed Income – 9.8% | ||||||||
SPDR Barclays Long Term Treasury ETF | 9,374 | 655,055 | ||||||
|
| |||||||
International Equity – 34.7% | ||||||||
State Street Global Equity ex-U.S. Index Portfolio | 274,892 | 2,322,840 | ||||||
|
| |||||||
TOTAL MUTUAL FUNDS AND EXCHANGE TRADED PRODUCTS |
| 6,697,950 | ||||||
|
| |||||||
SHORT-TERM INVESTMENT – 0.1% |
| |||||||
Money Market Fund – 0.1% | ||||||||
State Street Institutional Liquid Reserves Fund, Premier Class 0.23%(a)(b) | 9,103 | 9,103 | ||||||
|
| |||||||
TOTAL INVESTMENTS – 100.2%(c) |
| 6,707,053 | ||||||
Liabilities in Excess of Other | (15,254 | ) | ||||||
|
| |||||||
NET ASSETS – 100.0% | $ | 6,691,799 | ||||||
|
| |||||||
| (a) | Affiliated Funds managed by SSGA Funds Management, Inc. (Note 4). |
| (b) | The rate shown is the annualized seven-day yield at December 31, 2015. |
| (c) | Unless otherwise indicated, the values of the securities of the Fund are determined based on Level 1 inputs. |
See accompanying notes to the financial statements.
35
Table of Contents
State Street Target Retirement 2055 Fund
Schedule of Investments
December 31, 2015
Security Description | Shares | Value | ||||||
MUTUAL FUNDS AND EXCHANGE TRADED PRODUCTS – 100.4%(a) |
| |||||||
Domestic Equity – 55.8% | ||||||||
State Street Equity 500 Index II Portfolio | 128,106 | $ | 1,322,051 | |||||
State Street Small/Mid Cap Equity Index Portfolio | 63,513 | 590,671 | ||||||
|
| |||||||
| 1,912,722 | ||||||||
|
| |||||||
Domestic Fixed Income – 9.8% | ||||||||
SPDR Barclays Long Term Treasury ETF | 4,795 | 335,075 | ||||||
|
| |||||||
International Equity – 34.8% | ||||||||
State Street Global Equity ex-U.S. Index Portfolio | 141,338 | 1,194,305 | ||||||
|
| |||||||
TOTAL MUTUAL FUNDS AND EXCHANGE TRADED PRODUCTS |
| 3,442,102 | ||||||
|
| |||||||
SHORT-TERM INVESTMENT – 0.1% |
| |||||||
Money Market Fund – 0.1% | ||||||||
State Street Institutional Liquid Reserves Fund, Premier Class 0.23%(a)(b) | 2,406 | 2,406 | ||||||
|
| |||||||
TOTAL INVESTMENTS – 100.5%(c) |
| 3,444,508 | ||||||
Liabilities in Excess of Other | (18,616 | ) | ||||||
|
| |||||||
NET ASSETS – 100.0% | $ | 3,425,892 | ||||||
|
| |||||||
| (a) | Affiliated Funds managed by SSGA Funds Management, Inc. (Note 4). |
| (b) | The rate shown is the annualized seven-day yield at December 31, 2015. |
| (c) | Unless otherwise indicated, the values of the securities of the Fund are determined based on Level 1 inputs. |
See accompanying notes to the financial statements.
36
Table of Contents
State Street Target Retirement 2060 Fund
Schedule of Investments
December 31, 2015
Security Description | Shares | Value | ||||||
MUTUAL FUNDS AND EXCHANGE TRADED PRODUCTS – 103.7%(a) |
| |||||||
Domestic Equity – 57.7% | ||||||||
State Street Equity 500 Index II Portfolio | 22,757 | $ | 234,850 | |||||
State Street Small/Mid Cap Equity Index Portfolio | 11,281 | 104,915 | ||||||
|
| |||||||
| 339,765 | ||||||||
|
| |||||||
Domestic Fixed Income – 10.0% | ||||||||
SPDR Barclays Long Term Treasury ETF | 843 | 58,909 | ||||||
|
| |||||||
International Equity – 36.0% | ||||||||
State Street Global Equity ex-U.S. Index Portfolio | 25,103 | 212,124 | ||||||
|
| |||||||
TOTAL MUTUAL FUNDS AND EXCHANGE TRADED PRODUCTS |
| 610,798 | ||||||
|
| |||||||
SHORT-TERM INVESTMENT – 0.8% |
| |||||||
Money Market Fund – 0.8% | ||||||||
State Street Institutional Liquid Reserves Fund, Premier Class 0.23%(a)(b) | 4,933 | 4,933 | ||||||
|
| |||||||
TOTAL INVESTMENTS – 104.5%(c) |
| 615,731 | ||||||
Liabilities in Excess of Other | (26,745 | ) | ||||||
|
| |||||||
NET ASSETS – 100.0% | $ | 588,986 | ||||||
|
| |||||||
| (a) | Affiliated Funds managed by SSGA Funds Management, Inc. (Note 4). |
| (b) | The rate shown is the annualized seven-day yield at December 31, 2015. |
| (c) | Unless otherwise indicated, the values of the securities of the Fund are determined based on Level 1 inputs. |
See accompanying notes to the financial statements.
37
Table of Contents
State Street Institutional Investment Trust
Statements of Assets and Liabilities
December 31, 2015
| State Street Target Retirement Fund | State Street Target Retirement 2015 Fund | State Street Target Retirement 2020 Fund | State Street Target Retirement 2025 Fund | |||||||||||||
Assets | ||||||||||||||||
Investments in securities of affiliated funds, at value | $ | 23,335,857 | $ | 5,322,256 | $ | 54,215,792 | $ | 25,284,690 | ||||||||
Cash | 198,965 | 6,666 | 490,781 | 150,497 | ||||||||||||
Receivable for investments sold | 22,449 | 126,701 | 735,888 | 194,796 | ||||||||||||
Receivable for fund shares sold | 29,538 | 2,877 | 113,885 | 46,510 | ||||||||||||
Dividends receivable from affiliated funds (Note 4) | 16,120 | 2,824 | 29,587 | 12,700 | ||||||||||||
Receivable from Adviser (Note 4) | 20,319 | 23,270 | 40,872 | 27,617 | ||||||||||||
Prepaid Expenses | 131 | 96 | 157 | 1,255 | ||||||||||||
|
|
|
|
|
|
|
| |||||||||
Total assets | 23,623,379 | 5,484,690 | 55,626,962 | 25,718,065 | ||||||||||||
|
|
|
|
|
|
|
| |||||||||
Liabilities | ||||||||||||||||
Payable for investments purchased | 244,225 | 111,070 | 1,326,485 | 394,742 | ||||||||||||
Payable for fund shares repurchased | 200 | – | 200 | 1,129 | ||||||||||||
Advisory fees payable (Note 4) | 1,004 | 220 | 2,372 | 1,112 | ||||||||||||
Custodian fees payable (Note 4) | 7,290 | 7,331 | 7,289 | 7,392 | ||||||||||||
Professional fees payable | 28,989 | 29,002 | 28,967 | 28,993 | ||||||||||||
Registration and filing fees payable | 8,743 | 6,428 | 9,343 | 8,760 | ||||||||||||
Administration fees payable (Note 4) | 5,346 | 4,626 | 6,925 | 5,605 | ||||||||||||
Transfer agent fees payable | 312 | 1,895 | 1,894 | 1,894 | ||||||||||||
Sub-Transfer Agent fees payable (Note 4) | 422 | 590 | 835 | 677 | ||||||||||||
Distribution fees payable (Note 4) | 64 | 87 | 75 | – | ||||||||||||
Accrued expenses and other liabilities | 1,186 | 936 | 2,674 | 1,020 | ||||||||||||
|
|
|
|
|
|
|
| |||||||||
Total liabilities | 297,781 | 162,185 | 1,387,059 | 451,324 | ||||||||||||
|
|
|
|
|
|
|
| |||||||||
Net Assets | $ | 23,325,598 | $ | 5,322,505 | $ | 54,239,903 | $ | 25,266,741 | ||||||||
|
|
|
|
|
|
|
| |||||||||
Net Assets Consist of: | ||||||||||||||||
Paid-in capital | $ | 24,338,836 | $ | 5,545,282 | $ | 57,772,714 | $ | 26,670,188 | ||||||||
Accumulated net realized gain (loss) | (54,313 | ) | (20,775 | ) | (251,657 | ) | (89,240 | ) | ||||||||
Net unrealized appreciation (depreciation) on investments | (958,925 | ) | (202,002 | ) | (3,281,154 | ) | (1,314,207 | ) | ||||||||
|
|
|
|
|
|
|
| |||||||||
Net Assets | $ | 23,325,598 | $ | 5,322,505 | $ | 54,239,903 | $ | 25,266,741 | ||||||||
|
|
|
|
|
|
|
| |||||||||
Class A | ||||||||||||||||
Net Assets | $ | 407,771 | $ | 585,448 | $ | 125,299 | $ | 159,348 | ||||||||
Shares of beneficial interest outstanding | 41,667 | 60,225 | 12,840 | 16,365 | ||||||||||||
|
|
|
|
|
|
|
| |||||||||
Net asset value and redemption price per share | $ | 9.79 | $ | 9.72 | $ | 9.76 | $ | 9.74 | ||||||||
|
|
|
|
|
|
|
| |||||||||
Maximum Sales Charge | 4.50 | % | 4.50 | % | 4.50 | % | 4.50 | % | ||||||||
Maximum offering price per share | $ | 10.25 | $ | 10.18 | $ | 10.22 | $ | 10.20 | ||||||||
|
|
|
|
|
|
|
| |||||||||
See accompanying notes to the financial statements.
38
Table of Contents
State Street Institutional Investment Trust
Statements of Assets and Liabilities — (continued)
| State Street Target Retirement Fund | State Street Target Retirement 2015 Fund | State Street Target Retirement 2020 Fund | State Street Target Retirement 2025 Fund | |||||||||||||
Class I | ||||||||||||||||
Net Assets | $ | 653,052 | $ | 1,029,810 | $ | 1,811,234 | $ | 3,292,827 | ||||||||
Shares of beneficial interest outstanding | 66,739 | 105,935 | 185,740 | 338,012 | ||||||||||||
|
|
|
|
|
|
|
| |||||||||
Offering, net asset value, and redemption price per share | $ | 9.79 | $ | 9.72 | $ | 9.75 | $ | 9.74 | ||||||||
|
|
|
|
|
|
|
| |||||||||
Class K | ||||||||||||||||
Net Assets | $ | 22,264,775 | $ | 3,707,247 | $ | 52,303,370 | $ | 21,814,566 | ||||||||
Shares of beneficial interest outstanding | 2,275,827 | 381,509 | 5,367,570 | 2,238,026 | ||||||||||||
|
|
|
|
|
|
|
| |||||||||
Offering, net asset value, and redemption price per share | $ | 9.78 | $ | 9.72 | $ | 9.74 | $ | 9.75 | ||||||||
|
|
|
|
|
|
|
| |||||||||
Investments in securities of affiliated funds, at cost | $ | 24,294,782 | $ | 5,524,258 | $ | 57,496,946 | $ | 26,598,897 | ||||||||
|
|
|
|
|
|
|
| |||||||||
See accompanying notes to the financial statements.
39
Table of Contents
State Street Institutional Investment Trust
Statements of Assets and Liabilities — (continued)
December 31, 2015
| State Street Target Retirement 2030 Fund | State Street Target Retirement 2035 Fund | State Street Target Retirement 2040 Fund | State Street Target Retirement 2045 Fund | |||||||||||||
Assets | ||||||||||||||||
Investments in securities of affiliated funds, at value | $ | 50,354,220 | $ | 19,154,471 | $ | 37,014,163 | $ | 9,495,047 | ||||||||
Cash | 70,264 | 6,746 | 6,747 | 6,687 | ||||||||||||
Receivable for investments sold | 206,177 | 241,926 | 111,104 | 100,718 | ||||||||||||
Receivable for fund shares sold | 109,170 | 50,535 | 109,862 | 57,375 | ||||||||||||
Dividends receivable from affiliated funds (Note 4) | 16,169 | 3,907 | 8,153 | 1,916 | ||||||||||||
Receivable from Adviser (Note 4) | 32,265 | 10,882 | 21,910 | 9,242 | ||||||||||||
Prepaid Expenses | 4,127 | 66 | 123 | 78 | ||||||||||||
|
|
|
|
|
|
|
| |||||||||
Total assets | 50,792,392 | 19,468,533 | 37,272,062 | 9,671,063 | ||||||||||||
|
|
|
|
|
|
|
| |||||||||
Liabilities | ||||||||||||||||
Payable for investments purchased | 393,376 | 273,549 | 197,868 | 141,794 | ||||||||||||
Payable for fund shares repurchased | – | 13,944 | 15,691 | 32 | ||||||||||||
Advisory fees payable (Note 4) | 2,164 | 783 | 1,586 | 393 | ||||||||||||
Custodian fees payable (Note 4) | 7,383 | 7,299 | 7,359 | 7,323 | ||||||||||||
Professional fees payable | 28,974 | 28,998 | 28,984 | 29,001 | ||||||||||||
Registration and filing fees payable | 9,572 | 9,195 | 9,635 | 8,477 | ||||||||||||
Administration fees payable (Note 4) | 6,625 | 5,175 | 5,956 | 4,687 | ||||||||||||
Transfer agent fees payable | 1,894 | 308 | 1,894 | 447 | ||||||||||||
Sub-Transfer Agent fees payable (Note 4) | 677 | 508 | 508 | 338 | ||||||||||||
Distribution fees payable (Note 4) | – | 78 | 58 | 51 | ||||||||||||
Accrued expenses and other liabilities | 2,202 | 697 | 1,598 | 750 | ||||||||||||
|
|
|
|
|
|
|
| |||||||||
Total liabilities | 452,867 | 340,534 | 271,137 | 193,293 | ||||||||||||
|
|
|
|
|
|
|
| |||||||||
Net Assets | $ | 50,339,525 | $ | 19,127,999 | $ | 37,000,925 | $ | 9,477,770 | ||||||||
|
|
|
|
|
|
|
| |||||||||
Net Assets Consist of: | ||||||||||||||||
Paid-in capital | $ | 53,668,861 | $ | 20,107,877 | $ | 39,551,981 | $ | 10,038,277 | ||||||||
Accumulated net realized gain (loss) | (38,357 | ) | 51,210 | (40,602 | ) | 32,231 | ||||||||||
Net unrealized appreciation (depreciation) on investments | (3,290,979 | ) | (1,031,088 | ) | (2,510,454 | ) | (592,738 | ) | ||||||||
|
|
|
|
|
|
|
| |||||||||
Net Assets | $ | 50,339,525 | $ | 19,127,999 | $ | 37,000,925 | $ | 9,477,770 | ||||||||
|
|
|
|
|
|
|
| |||||||||
Class A | ||||||||||||||||
Net Assets | $ | 158,738 | $ | 488,884 | $ | 140,778 | $ | 321,324 | ||||||||
Shares of beneficial interest outstanding | 16,264 | 50,000 | 14,503 | 33,334 | ||||||||||||
|
|
|
|
|
|
|
| |||||||||
Net asset value and redemption price per share | $ | 9.76 | $ | 9.78 | $ | 9.71 | $ | 9.64 | ||||||||
|
|
|
|
|
|
|
| |||||||||
Maximum Sales Charge | 4.50 | % | 4.50 | % | 4.50 | % | 4.50 | % | ||||||||
Maximum offering price per share | $ | 10.22 | $ | 10.24 | $ | 10.17 | $ | 10.09 | ||||||||
|
|
|
|
|
|
|
| |||||||||
See accompanying notes to the financial statements.
40
Table of Contents
State Street Institutional Investment Trust
Statements of Assets and Liabilities — (continued)
| State Street Target Retirement 2030 Fund | State Street Target Retirement 2035 Fund | State Street Target Retirement 2040 Fund | State Street Target Retirement 2045 Fund | |||||||||||||
Class I | ||||||||||||||||
Net Assets | $ | 2,066,396 | $ | 1,416,443 | $ | 1,501,275 | $ | 782,452 | ||||||||
Shares of beneficial interest outstanding | 211,800 | 144,938 | 154,583 | 81,168 | ||||||||||||
|
|
|
|
|
|
|
| |||||||||
Offering, net asset value, and redemption price per share | $ | 9.76 | $ | 9.77 | $ | 9.71 | $ | 9.64 | ||||||||
|
|
|
|
|
|
|
| |||||||||
Class K | ||||||||||||||||
Net Assets | $ | 48,114,391 | $ | 17,222,672 | $ | 35,358,872 | $ | 8,373,994 | ||||||||
Shares of beneficial interest outstanding | 4,930,112 | 1,760,887 | 3,639,214 | 869,136 | ||||||||||||
|
|
|
|
|
|
|
| |||||||||
Offering, net asset value, and redemption price per share | $ | 9.76 | $ | 9.78 | $ | 9.72 | $ | 9.63 | ||||||||
|
|
|
|
|
|
|
| |||||||||
Investments in securities of affiliated funds, at cost | $ | 53,645,199 | $ | 20,185,559 | $ | 39,524,617 | $ | 10,087,785 | ||||||||
|
|
|
|
|
|
|
| |||||||||
See accompanying notes to the financial statements.
41
Table of Contents
State Street Institutional Investment Trust
Statements of Assets and Liabilities — (continued)
December 31, 2015
| State Street Target Retirement 2050 Fund | State Street Target Retirement 2055 Fund | State Street Target Retirement 2060 Fund | ||||||||||
Assets | ||||||||||||
Investments in securities of affiliated funds, at value | $ | 6,707,053 | $ | 3,444,508 | $ | 615,731 | ||||||
Cash | 6,689 | 6,696 | 6,594 | |||||||||
Receivable for investments sold | 72,368 | 39,205 | 8,926 | |||||||||
Receivable for fund shares sold | 62,133 | 46,249 | 4,628 | |||||||||
Dividends receivable from affiliated funds (Note 4) | 1,352 | 687 | 115 | |||||||||
Receivable from Adviser (Note 4) | 11,086 | 10,714 | 13,678 | |||||||||
Prepaid Expenses | 23 | 100 | 111 | |||||||||
|
|
|
|
|
| |||||||
Total assets | 6,860,704 | 3,548,159 | 649,783 | |||||||||
|
|
|
|
|
| |||||||
Liabilities | ||||||||||||
Payable for investments purchased | 113,052 | 72,342 | 10,594 | |||||||||
Payable for fund shares repurchased | 5,810 | – | – | |||||||||
Advisory fees payable (Note 4) | 274 | 142 | 25 | |||||||||
Custodian fees payable (Note 4) | 7,317 | 7,229 | 7,274 | |||||||||
Professional fees payable | 29,002 | 29,003 | 29,005 | |||||||||
Registration and filing fees payable | 7,948 | 7,637 | 7,271 | |||||||||
Administration fees payable (Note 4) | 4,506 | 4,373 | 4,256 | |||||||||
Transfer agent fees payable | 449 | 447 | 383 | |||||||||
Sub-Transfer Agent fees payable (Note 4) | 169 | 165 | 169 | |||||||||
Distribution fees payable (Note 4) | 25 | 25 | 25 | |||||||||
Accrued expenses and other liabilities | 353 | 904 | 1,795 | |||||||||
|
|
|
|
|
| |||||||
Total liabilities | 168,905 | 122,267 | 60,797 | |||||||||
|
|
|
|
|
| |||||||
Net Assets | $ | 6,691,799 | $ | 3,425,892 | $ | 588,986 | ||||||
|
|
|
|
|
| |||||||
Net Assets Consist of: | ||||||||||||
Paid-in capital | $ | 7,091,399 | $ | 3,647,931 | $ | 631,010 | ||||||
Accumulated net realized gain (loss) | 23,541 | 11,374 | (4,569 | ) | ||||||||
Net unrealized appreciation (depreciation) on investments | (423,141 | ) | (233,413 | ) | (37,455 | ) | ||||||
|
|
|
|
|
| |||||||
Net Assets | $ | 6,691,799 | $ | 3,425,892 | $ | 588,986 | ||||||
|
|
|
|
|
| |||||||
Class A | ||||||||||||
Net Assets | $ | 160,356 | $ | 160,017 | $ | 158,274 | ||||||
Shares of beneficial interest outstanding | 16,667 | 16,667 | 16,667 | |||||||||
|
|
|
|
|
| |||||||
Net asset value and redemption price per share | $ | 9.62 | $ | 9.60 | $ | 9.50 | ||||||
|
|
|
|
|
| |||||||
Maximum Sales Charge | 4.50 | % | 4.50 | % | 4.50 | % | ||||||
Maximum offering price per share | $ | 10.07 | $ | 10.05 | $ | 9.95 | ||||||
|
|
|
|
|
| |||||||
Class I | ||||||||||||
Net Assets | $ | 795,012 | $ | 222,383 | $ | 161,667 | ||||||
Shares of beneficial interest outstanding | 82,682 | 23,165 | 17,024 | |||||||||
|
|
|
|
|
| |||||||
Offering, net asset value, and redemption price per share | $ | 9.62 | $ | 9.60 | $ | 9.50 | ||||||
|
|
|
|
|
| |||||||
Class K | ||||||||||||
Net Assets | $ | 5,736,431 | $ | 3,043,492 | $ | 269,045 | ||||||
Shares of beneficial interest outstanding | 596,664 | 317,223 | 28,340 | |||||||||
|
|
|
|
|
| |||||||
Offering, net asset value, and redemption price per share | $ | 9.61 | $ | 9.59 | $ | 9.49 | ||||||
|
|
|
|
|
| |||||||
Investments in securities of affiliated funds, at cost | $ | 7,130,194 | $ | 3,677,921 | $ | 653,186 | ||||||
|
|
|
|
|
| |||||||
See accompanying notes to the financial statements.
42
Table of Contents
State Street Institutional Investment Trust
Year Ended December 31, 2015
| State Street Target Retirement Fund | State Street Target Retirement 2015 Fund | State Street Target Retirement 2020 Fund | State Street Target Retirement 2025 Fund | |||||||||||||
Income | ||||||||||||||||
Dividend income from affiliated funds (Note 4) | $ | 391,704 | $ | 85,486 | $ | 1,079,570 | $ | 472,995 | ||||||||
|
|
|
|
|
|
|
| |||||||||
Expenses | ||||||||||||||||
Advisory fees (Note 4) | 9,818 | 1,949 | 23,094 | 7,947 | ||||||||||||
Administration fees (Note 4) | 6,796 | 1,336 | 15,977 | 5,623 | ||||||||||||
Custodian fees (Note 4) | 48,724 | 48,248 | 48,780 | 48,788 | ||||||||||||
Distribution fees (Note 4) | ||||||||||||||||
Class A | 1,053 | 1,503 | 2,089 | 1,680 | ||||||||||||
Trustees’ fees and expenses | 12,737 | 12,730 | 12,720 | 12,672 | ||||||||||||
Registration and filing fees | 40,052 | 46,672 | 49,845 | 48,058 | ||||||||||||
Professional fees | 32,980 | 32,980 | 32,980 | 32,980 | ||||||||||||
Transfer agent fees (Note 4) | 48,118 | 42,982 | 44,593 | 37,148 | ||||||||||||
Printing fees | 17,837 | 1,642 | 18,394 | 5,272 | ||||||||||||
Insurance fees | 4,703 | 4,709 | 4,718 | 4,752 | ||||||||||||
Miscellaneous expenses | 4,398 | 4,436 | 4,728 | 4,324 | ||||||||||||
|
|
|
|
|
|
|
| |||||||||
Total expenses | 227,216 | 199,187 | 257,918 | 209,244 | ||||||||||||
|
|
|
|
|
|
|
| |||||||||
Less: Expenses waived/reimbursed by the Adviser (Note 4) | (223,943 | ) | (196,859 | ) | (250,623 | ) | (202,613 | ) | ||||||||
|
|
|
|
|
|
|
| |||||||||
Net expenses | 3,273 | 2,328 | 7,295 | 6,631 | ||||||||||||
|
|
|
|
|
|
|
| |||||||||
Net Investment Income | $ | 388,431 | $ | 83,158 | $ | 1,072,275 | $ | 466,364 | ||||||||
|
|
|
|
|
|
|
| |||||||||
Realized and Unrealized Gain (Loss) | ||||||||||||||||
Net realized gain (loss) on: | ||||||||||||||||
Affiliated funds (Note 4) | (95,416 | ) | (18,913 | ) | (448,097 | ) | (159,757 | ) | ||||||||
Capital gain distributions from affiliated funds (Note 4) | 116,918 | 32,088 | 379,762 | 180,291 | ||||||||||||
Change in unrealized appreciation (depreciation) on: | ||||||||||||||||
Affiliated funds (Note 4) | (951,858 | ) | (191,735 | ) | (3,275,754 | ) | (1,307,490 | ) | ||||||||
|
|
|
|
|
|
|
| |||||||||
Total realized and unrealized loss | (930,356 | ) | (178,560 | ) | (3,344,089 | ) | (1,286,956 | ) | ||||||||
|
|
|
|
|
|
|
| |||||||||
Net Increase (Decrease) in Net Assets Resulting from Operations | $ | (541,925 | ) | $ | (95,402 | ) | $ | (2,271,814 | ) | $ | (820,592 | ) | ||||
|
|
|
|
|
|
|
| |||||||||
See accompanying notes to the financial statements.
43
Table of Contents
State Street Institutional Investment Trust
Statements of Operations — (continued)
Year Ended December 31, 2015
| State Street Target Retirement 2030 Fund | State Street Target Retirement 2035 Fund | State Street Target Retirement 2040 Fund | State Street Target Retirement 2045 Fund | |||||||||||||
Income | ||||||||||||||||
Dividend income from affiliated funds (Note 4) | $ | 962,252 | $ | 317,479 | $ | 688,538 | $ | 163,386 | ||||||||
|
|
|
|
|
|
|
| |||||||||
Expenses | ||||||||||||||||
Advisory fees (Note 4) | 19,292 | 5,136 | 13,575 | 2,783 | ||||||||||||
Administration fees (Note 4) | 13,518 | 3,653 | 9,525 | 2,015 | ||||||||||||
Custodian fees (Note 4) | 48,759 | 48,816 | 48,681 | 48,247 | ||||||||||||
Distribution fees (Note 4) | ||||||||||||||||
Class A | 1,678 | 1,282 | 1,258 | 845 | ||||||||||||
Trustees’ fees and expenses (Note 5) | 12,705 | 12,687 | 12,719 | 12,710 | ||||||||||||
Registration and filing fees | 40,823 | 39,801 | 40,978 | 39,243 | ||||||||||||
Professional fees | 32,980 | 32,980 | 32,980 | 32,980 | ||||||||||||
Transfer agent fees (Note 4) | 35,204 | 32,486 | 36,008 | 32,370 | ||||||||||||
Printing fees | 15,069 | 3,160 | 10,622 | 1,597 | ||||||||||||
Insurance fees | 4,728 | 4,740 | 4,718 | 4,725 | ||||||||||||
Miscellaneous expenses | 4,619 | 4,252 | 4,467 | 4,209 | ||||||||||||
|
|
|
|
|
|
|
| |||||||||
Total expenses | 229,375 | 188,993 | 215,531 | 181,724 | ||||||||||||
|
|
|
|
|
|
|
| |||||||||
Less: Expenses waived/reimbursed by the Adviser (Note 4) | (215,645 | ) | (184,520 | ) | (208,517 | ) | (180,255 | ) | ||||||||
|
|
|
|
|
|
|
| |||||||||
Net expenses | 13,730 | 4,473 | 7,014 | 1,469 | ||||||||||||
|
|
|
|
|
|
|
| |||||||||
Net Investment Income | $ | 948,522 | $ | 313,006 | $ | 681,524 | $ | 161,917 | ||||||||
|
|
|
|
|
|
|
| |||||||||
Realized and Unrealized Gain (Loss) | ||||||||||||||||
Net realized gain (loss) on: | ||||||||||||||||
Affiliated funds (Note 4) | (308,559 | ) | (11,139 | ) | (252,329 | ) | (14,359 | ) | ||||||||
Capital gain distributions from affiliated funds (Note 4) | 353,018 | 123,355 | 237,613 | 55,895 | ||||||||||||
Change in unrealized appreciation (depreciation) on: | ||||||||||||||||
Affiliated funds (Note 4) | (3,292,644 | ) | (1,033,263 | ) | (2,515,873 | ) | (597,567 | ) | ||||||||
|
|
|
|
|
|
|
| |||||||||
Total realized and unrealized loss | (3,248,185 | ) | (921,047 | ) | (2,530,589 | ) | (556,031 | ) | ||||||||
|
|
|
|
|
|
|
| |||||||||
Net Increase (Decrease) in Net Assets Resulting from Operations | $ | (2,299,663 | ) | $ | (608,041 | ) | $ | (1,849,065 | ) | $ | (394,114 | ) | ||||
|
|
|
|
|
|
|
| |||||||||
See accompanying notes to the financial statements.
44
Table of Contents
State Street Institutional Investment Trust
Statements of Operations — (continued)
Year Ended December 31, 2015
| State Street Target Retirement 2050 Fund | State Street Target Retirement 2055 Fund | State Street Target Retirement 2060 Fund | ||||||||||
Income | ||||||||||||
Dividend income from affiliated funds (Note 4) | $ | 116,698 | $ | 61,476 | $ | 11,768 | ||||||
|
|
|
|
|
| |||||||
Expenses | ||||||||||||
Advisory fees (Note 4) | 1,996 | 1,194 | 304 | |||||||||
Administration fees (Note 4) | 1,452 | 852 | 181 | |||||||||
Custodian fees (Note 4) | 48,209 | 48,194 | 47,998 | |||||||||
Distribution fees (Note 4) | ||||||||||||
Class A | 422 | 422 | 422 | |||||||||
Trustees’ fees and expenses (Note 5) | 12,730 | 12,736 | 12,746 | |||||||||
Registration and filing fees | 39,030 | 38,829 | 38,634 | |||||||||
Professional fees | 32,980 | 32,980 | 32,980 | |||||||||
Transfer agent fees (Note 4) | 32,553 | 32,547 | 32,430 | |||||||||
Printing fees | 7,771 | 7,474 | 6,578 | |||||||||
Insurance fees | 4,783 | 4,703 | 4,694 | |||||||||
Miscellaneous expenses | 4,190 | 4,172 | 4,247 | |||||||||
|
|
|
|
|
| |||||||
Total expenses | 186,116 | 184,103 | 181,214 | |||||||||
|
|
|
|
|
| |||||||
Less: Expenses waived/reimbursed by the Adviser | (184,847 | ) | (183,172 | ) | (180,664 | ) | ||||||
|
|
|
|
|
| |||||||
Net expenses | 1,269 | 931 | 550 | |||||||||
|
|
|
|
|
| |||||||
Net Investment Income | $ | 115,429 | $ | 60,545 | $ | 11,218 | ||||||
|
|
|
|
|
| |||||||
Realized and Unrealized Gain (Loss) | ||||||||||||
Net realized gain (loss) on: | ||||||||||||
Affiliated funds (Note 4) | (11,951 | ) | (3,536 | ) | (2,005 | ) | ||||||
Capital gain distributions from affiliated funds (Note 4) | 39,894 | 20,619 | 3,722 | |||||||||
Change in unrealized appreciation (depreciation) on: | ||||||||||||
Affiliated funds (Note 4) | (425,274 | ) | (235,545 | ) | (39,623 | ) | ||||||
|
|
|
|
|
| |||||||
Total realized and unrealized loss | (397,331 | ) | (218,462 | ) | (37,906 | ) | ||||||
|
|
|
|
|
| |||||||
Net Increase (Decrease) in Net Assets Resulting from Operations | $ | (281,902 | ) | $ | (157,917 | ) | $ | (26,688 | ) | |||
|
|
|
|
|
| |||||||
See accompanying notes to the financial statements.
45
Table of Contents
State Street Institutional Investment Trust
Statements of Changes in Net Assets
| State Street Target Retirement Fund | State Street Target Retirement 2015 Fund | |||||||||||||||
| For the year December 31, 2015 | For the Period 9/30/14* to 12/31/14 | For the year December 31, 2015 | For the Period 9/30/14* to 12/31/14 | |||||||||||||
Increase (Decrease) in Net Assets Resulting from: | ||||||||||||||||
Operations: | ||||||||||||||||
Net investment income | $ | 388,431 | $ | 7,577 | $ | 83,158 | $ | 10,948 | ||||||||
Net realized gain on investments | 21,502 | 5,878 | 13,175 | 14,292 | ||||||||||||
Change in net unrealized appreciation (depreciation) on investments | (951,858 | ) | (7,067 | ) | (191,735 | ) | (10,267 | ) | ||||||||
|
|
|
|
|
|
|
| |||||||||
Net increase (decrease) in net assets from operations | (541,925 | ) | 6,388 | (95,402 | ) | 14,973 | ||||||||||
|
|
|
|
|
|
|
| |||||||||
Distributions to Shareholders from: | ||||||||||||||||
Net investment income | ||||||||||||||||
Class A | (6,875 | ) | (1,400 | ) | (9,575 | ) | (2,993 | ) | ||||||||
Class I | (12,572 | ) | (1,667 | ) | (19,256 | ) | (3,366 | ) | ||||||||
Class K | (423,184 | ) | (6,970 | ) | (68,746 | ) | (10,826 | ) | ||||||||
|
|
|
|
|
|
|
| |||||||||
Total distributions from net investment income | (442,631 | ) | (10,037 | ) | (97,577 | ) | (17,185 | ) | ||||||||
|
|
|
|
|
|
|
| |||||||||
Net realized gain on investments | ||||||||||||||||
Class A | (446 | ) | (8 | ) | (3,082 | ) | (6 | ) | ||||||||
Class I | (708 | ) | (8 | ) | (5,356 | ) | (6 | ) | ||||||||
Class K | (23,832 | ) | (31 | ) | (19,119 | ) | (17 | ) | ||||||||
|
|
|
|
|
|
|
| |||||||||
Total distributions from net realized gain on investments | (24,986 | ) | (47 | ) | (27,557 | ) | (29 | ) | ||||||||
|
|
|
|
|
|
|
| |||||||||
Total distributions | (467,617 | ) | (10,084 | ) | (125,134 | ) | (17,214 | ) | ||||||||
|
|
|
|
|
|
|
| |||||||||
Net Increase (Decrease) from Capital Share Transactions: | ||||||||||||||||
Class A | ||||||||||||||||
Shares sold | – | 416,668 | 19,093 | 583,334 | ||||||||||||
Reinvestment of distributions | – | – | 389 | – | ||||||||||||
Shares redeemed | – | – | – | – | ||||||||||||
|
|
|
|
|
|
|
| |||||||||
Net increase (decrease) from Capital share transactions | – | 416,668 | 19,482 | 583,334 | ||||||||||||
|
|
|
|
|
|
|
| |||||||||
Class I | ||||||||||||||||
Shares sold | 263,364 | 416,666 | 478,703 | 583,333 | ||||||||||||
Reinvestment of distributions | 4,918 | – | 10,886 | – | ||||||||||||
Shares redeemed | (14,601 | ) | – | (10,053 | ) | – | ||||||||||
|
|
|
|
|
|
|
| |||||||||
Net increase from Capital share transactions | 253,681 | 416,666 | 479,536 | 583,333 | ||||||||||||
|
|
|
|
|
|
|
| |||||||||
See accompanying notes to the financial statements.
46
Table of Contents
State Street Institutional Investment Trust
Statements of Changes in Net Assets — (continued)
| State Street Target Retirement Fund | State Street Target Retirement 2015 Fund | |||||||||||||||
| For the year December 31, 2015 | For the Period 9/30/14* to 12/31/14 | For the year December 31, 2015 | For the Period 9/30/14* to 12/31/14 | |||||||||||||
Class K | ||||||||||||||||
Shares sold | $ | 25,201,323 | $ | 1,625,168 | $ | 3,479,044 | $ | 2,428,746 | ||||||||
Reinvestment of distributions | 446,730 | 5,118 | 74,140 | 7,179 | ||||||||||||
Shares redeemed | (3,960,380 | ) | (66,138 | ) | (1,419,489 | ) | (690,023 | ) | ||||||||
|
|
|
|
|
|
|
| |||||||||
Net increase from Capital share transactions | 21,687,673 | 1,564,148 | 2,133,695 | 1,745,902 | ||||||||||||
|
|
|
|
|
|
|
| |||||||||
Total increase from Capital share transactions | 21,941,354 | 2,397,482 | 2,632,713 | 2,912,569 | ||||||||||||
|
|
|
|
|
|
|
| |||||||||
Net Increase in Net Assets | 20,931,812 | 2,393,786 | 2,412,177 | 2,910,328 | ||||||||||||
Net Assets | ||||||||||||||||
Beginning of year | 2,393,786 | – | 2,910,328 | – | ||||||||||||
|
|
|
|
|
|
|
| |||||||||
End of year | $ | 23,325,598 | $ | 2,393,786 | $ | 5,322,505 | $ | 2,910,328 | ||||||||
|
|
|
|
|
|
|
| |||||||||
Changes in Shares: | ||||||||||||||||
Class A | ||||||||||||||||
Shares sold | – | 41,667 | 1,851 | 58,334 | ||||||||||||
Reinvestment of distributions | – | – | 40 | – | ||||||||||||
Shares redeemed | – | – | – | – | ||||||||||||
|
|
|
|
|
|
|
| |||||||||
Net increase (decrease) in shares | – | 41,667 | 1,891 | 58,334 | ||||||||||||
|
|
|
|
|
|
|
| |||||||||
Class I | ||||||||||||||||
Shares sold | 26,040 | 41,666 | 47,498 | 58,333 | ||||||||||||
Reinvestment of distributions | 503 | – | 1,119 | – | ||||||||||||
Shares redeemed | (1,470 | ) | – | (1,015 | ) | – | ||||||||||
|
|
|
|
|
|
|
| |||||||||
Net increase (decrease) in shares | 25,073 | 41,666 | 47,602 | 58,333 | ||||||||||||
|
|
|
|
|
|
|
| |||||||||
Class K | ||||||||||||||||
Shares sold | 2,466,852 | 161,439 | 341,849 | 240,505 | ||||||||||||
Reinvestment of distributions | 45,677 | 507 | 7,628 | 709 | ||||||||||||
Shares redeemed | (392,094 | ) | (6,554 | ) | (141,333 | ) | (67,849 | ) | ||||||||
|
|
|
|
|
|
|
| |||||||||
Net increase (decrease) in shares | 2,120,435 | 155,392 | 208,144 | 173,365 | ||||||||||||
|
|
|
|
|
|
|
| |||||||||
| * | Commencement of operations |
See accompanying notes to the financial statements.
47
Table of Contents
State Street Institutional Investment Trust
Statements of Changes in Net Assets — (continued)
| State Street Target Retirement 2020 Fund | State Street Target Retirement 2025 Fund | |||||||||||||||
| For the year December 31, 2015 | For the Period 9/30/14* to 12/31/14 | For the year December 31, 2015 | For the Period 9/30/14* to 12/31/14 | |||||||||||||
Increase (Decrease) in Net Assets Resulting from: | ||||||||||||||||
Operations: | ||||||||||||||||
Net investment income | $ | 1,072,275 | $ | 16,017 | $ | 466,364 | $ | 15,220 | ||||||||
Net realized gain (loss) on investments | (68,335 | ) | 20,500 | 20,534 | 23,854 | |||||||||||
Change in net unrealized appreciation (depreciation) on investments | (3,275,754 | ) | (5,400 | ) | (1,307,490 | ) | (6,717 | ) | ||||||||
|
|
|
|
|
|
|
| |||||||||
Net increase (decrease) in net assets from operations | (2,271,814 | ) | 31,117 | (820,592 | ) | 32,357 | ||||||||||
|
|
|
|
|
|
|
| |||||||||
Distributions to Shareholders from: | ||||||||||||||||
Net investment income | ||||||||||||||||
Class A | (2,535 | ) | (2,183 | ) | (2,911 | ) | (2,207 | ) | ||||||||
Class I | (40,101 | ) | (2,708 | ) | (66,791 | ) | (2,633 | ) | ||||||||
Class K | (1,165,963 | ) | (23,668 | ) | (443,353 | ) | (24,759 | ) | ||||||||
|
|
|
|
|
|
|
| |||||||||
Total distributions from net investment income | (1,208,599 | ) | (28,559 | ) | (513,055 | ) | (29,599 | ) | ||||||||
|
|
|
|
|
|
|
| |||||||||
Net realized gain on investments | ||||||||||||||||
Class A | (130 | ) | (8 | ) | (469 | ) | – | |||||||||
Class I | (1,820 | ) | (8 | ) | (9,439 | ) | – | |||||||||
Class K | (52,927 | ) | (63 | ) | (62,650 | ) | – | |||||||||
|
|
|
|
|
|
|
| |||||||||
Total distributions from net realized gain on investments | (54,877 | ) | (79 | ) | (72,558 | ) | – | |||||||||
|
|
|
|
|
|
|
| |||||||||
Total distributions | (1,263,476 | ) | (28,638 | ) | (585,613 | ) | (29,599 | ) | ||||||||
|
|
|
|
|
|
|
| |||||||||
Net Increase (Decrease) from Capital Share Transactions: | ||||||||||||||||
Class A | ||||||||||||||||
Shares sold | – | 833,334 | – | 666,668 | ||||||||||||
Reinvestment of distributions | – | – | – | – | ||||||||||||
Shares redeemed | (700,000 | ) | – | (500,000 | ) | – | ||||||||||
|
|
|
|
|
|
|
| |||||||||
Net increase (decrease) from Capital share transactions | (700,000 | ) | 833,334 | (500,000 | ) | 666,668 | ||||||||||
|
|
|
|
|
|
|
| |||||||||
Class I | ||||||||||||||||
Shares sold | 2,095,038 | 833,333 | 3,545,478 | 666,666 | ||||||||||||
Reinvestment of distributions | 41,240 | – | 74,740 | – | ||||||||||||
Shares redeemed | (1,074,819 | ) | – | (819,957 | ) | – | ||||||||||
|
|
|
|
|
|
|
| |||||||||
Net increase from Capital share transactions | 1,061,459 | 833,333 | 2,800,261 | 666,666 | ||||||||||||
|
|
|
|
|
|
|
| |||||||||
See accompanying notes to the financial statements.
48
Table of Contents
State Street Institutional Investment Trust
Statements of Changes in Net Assets — (continued)
| State Street Target Retirement 2020 Fund | State Street Target Retirement 2025 Fund | |||||||||||||||
| For the year December 31, 2015 | For the Period 9/30/14* to 12/31/14 | For the year December 31, 2015 | For the Period 9/30/14* to 12/31/14 | |||||||||||||
Class K | ||||||||||||||||
Shares sold | $ | 54,305,605 | $ | 6,398,928 | $ | 20,290,732 | $ | 5,872,425 | ||||||||
Reinvestment of distributions | 1,218,209 | 20,590 | 504,513 | 21,786 | ||||||||||||
Shares redeemed | (6,198,744 | ) | – | (3,374,698 | ) | (278,165 | ) | |||||||||
|
|
|
|
|
|
|
| |||||||||
Net increase from Capital share transactions | 49,325,070 | 6,419,518 | 17,420,547 | 5,616,046 | ||||||||||||
|
|
|
|
|
|
|
| |||||||||
Total increase from Capital share transactions | 49,686,529 | 8,086,185 | 19,720,808 | 6,949,380 | ||||||||||||
|
|
|
|
|
|
|
| |||||||||
Net Increase in Net Assets | 46,151,239 | 8,088,664 | 18,314,603 | 6,952,138 | ||||||||||||
Net Assets | ||||||||||||||||
Beginning of year | 8,088,664 | – | 6,952,138 | – | ||||||||||||
|
|
|
|
|
|
|
| |||||||||
End of year | $ | 54,239,903 | $ | 8,088,664 | $ | 25,266,741 | $ | 6,952,138 | ||||||||
|
|
|
|
|
|
|
| |||||||||
Changes in Shares: | ||||||||||||||||
Class A | ||||||||||||||||
Shares sold | – | 83,333 | – | 66,667 | ||||||||||||
Reinvestment of distributions | – | – | – | – | ||||||||||||
Shares redeemed | (70,493 | ) | – | (50,302 | ) | – | ||||||||||
|
|
|
|
|
|
|
| |||||||||
Net increase (decrease) in shares | (70,493 | ) | 83,333 | (50,302 | ) | 66,667 | ||||||||||
|
|
|
|
|
|
|
| |||||||||
Class I | ||||||||||||||||
Shares sold | 205,910 | 83,333 | 346,239 | 66,666 | ||||||||||||
Reinvestment of distributions | 4,212 | – | 7,627 | – | ||||||||||||
Shares redeemed | (107,715 | ) | – | (82,520 | ) | – | ||||||||||
|
|
|
|
|
|
|
| |||||||||
Net increase (decrease) in shares | 102,407 | 83,333 | 271,346 | 66,666 | ||||||||||||
|
|
|
|
|
|
|
| |||||||||
Class K | ||||||||||||||||
Shares sold | 5,221,705 | 629,480 | 1,964,901 | 576,019 | ||||||||||||
Reinvestment of distributions | 124,434 | 2,017 | 51,429 | 2,125 | ||||||||||||
Shares redeemed | (610,066 | ) | – | (329,310 | ) | (27,138 | ) | |||||||||
|
|
|
|
|
|
|
| |||||||||
Net increase (decrease) in shares | 4,736,073 | 631,497 | 1,687,020 | 551,006 | ||||||||||||
|
|
|
|
|
|
|
| |||||||||
| * | Commencement of operations |
See accompanying notes to the financial statements.
49
Table of Contents
State Street Institutional Investment Trust
Statements of Changes in Net Assets — (continued)
| State Street Target Retirement 2030 Fund | State Street Target Retirement 2035 Fund | |||||||||||||||
| For the year December 31, 2015 | For the Period 9/30/14* to 12/31/14 | For the year December 31, 2015 | For the Period 9/30/14* to 12/31/14 | |||||||||||||
Increase (Decrease) in Net Assets Resulting from: | ||||||||||||||||
Operations: | ||||||||||||||||
Net investment income | $ | 948,522 | $ | 13,928 | $ | 313,006 | $ | 9,220 | ||||||||
Net realized gain on investments | 44,459 | 24,817 | 112,216 | 16,757 | ||||||||||||
Change in net unrealized appreciation (depreciation) on investments | (3,292,644 | ) | 1,665 | (1,033,263 | ) | 2,175 | ||||||||||
|
|
|
|
|
|
|
| |||||||||
Net increase (decrease) in net assets from operations | (2,299,663 | ) | 40,410 | (608,041 | ) | 28,152 | ||||||||||
|
|
|
|
|
|
|
| |||||||||
Distributions to Shareholders from: | ||||||||||||||||
Net investment income | ||||||||||||||||
Class A | (2,903 | ) | (4,160 | ) | (7,505 | ) | (2,195 | ) | ||||||||
Class I | (41,975 | ) | (4,580 | ) | (24,736 | ) | (2,515 | ) | ||||||||
Class K | (980,918 | ) | (23,450 | ) | (302,182 | ) | (17,579 | ) | ||||||||
|
|
|
|
|
|
|
| |||||||||
Total distributions from net investment income | (1,025,796 | ) | (32,190 | ) | (334,423 | ) | (22,289 | ) | ||||||||
|
|
|
|
|
|
|
| |||||||||
Net realized gain on investments | ||||||||||||||||
Class A | (39 | ) | – | (1,130 | ) | – | ||||||||||
Class I | (495 | ) | – | (3,189 | ) | – | ||||||||||
Class K | (11,563 | ) | – | (38,958 | ) | – | ||||||||||
|
|
|
|
|
|
|
| |||||||||
Total distributions from net realized gain on investments | (12,097 | ) | – | (43,277 | ) | – | ||||||||||
|
|
|
|
|
|
|
| |||||||||
Total distributions | (1,037,893 | ) | (32,190 | ) | (377,700 | ) | (22,289 | ) | ||||||||
|
|
|
|
|
|
|
| |||||||||
Net Increase (Decrease) from Capital Share Transactions: | ||||||||||||||||
Class A | ||||||||||||||||
Shares sold | – | 666,668 | – | 500,000 | ||||||||||||
Reinvestment of distributions | – | – | – | – | ||||||||||||
Shares redeemed | (500,000 | ) | – | – | – | |||||||||||
|
|
|
|
|
|
|
| |||||||||
Net increase (decrease) from Capital share transactions | (500,000 | ) | 666,668 | – | 500,000 | |||||||||||
|
|
|
|
|
|
|
| |||||||||
Class I | ||||||||||||||||
Shares sold | 2,100,119 | 666,666 | 1,448,614 | 500,000 | ||||||||||||
Reinvestment of distributions | 41,171 | – | 18,030 | – | ||||||||||||
Shares redeemed | (635,900 | ) | – | (470,339 | ) | – | ||||||||||
|
|
|
|
|
|
|
| |||||||||
Net increase from Capital share transactions | 1,505,390 | 666,666 | 996,305 | 500,000 | ||||||||||||
|
|
|
|
|
|
|
| |||||||||
See accompanying notes to the financial statements.
50
Table of Contents
State Street Institutional Investment Trust
Statements of Changes in Net Assets — (continued)
| State Street Target Retirement 2030 Fund | State Street Target Retirement 2035 Fund | |||||||||||||||
| For the year December 31, 2015 | For the Period 9/30/14* to 12/31/14 | For the year December 31, 2015 | For the Period 9/30/14* to 12/31/14 | |||||||||||||
Class K | ||||||||||||||||
Shares sold | $ | 50,162,805 | $ | 3,587,243 | $ | 16,271,335 | $ | 3,243,252 | ||||||||
Reinvestment of distributions | 991,182 | 18,530 | 331,244 | 14,813 | ||||||||||||
Shares redeemed | (3,078,374 | ) | (351,249 | ) | (1,709,612 | ) | (39,460 | ) | ||||||||
|
|
|
|
|
|
|
| |||||||||
Net increase from Capital share transactions | 48,075,613 | 3,254,524 | 14,892,967 | 3,218,605 | ||||||||||||
|
|
|
|
|
|
|
| |||||||||
Total increase from Capital share transactions | 49,081,003 | 4,587,858 | 15,889,272 | 4,218,605 | ||||||||||||
|
|
|
|
|
|
|
| |||||||||
Net Increase in Net Assets | 45,743,447 | 4,596,078 | 14,903,531 | 4,224,468 | ||||||||||||
Net Assets | ||||||||||||||||
Beginning of year | 4,596,078 | – | 4,224,468 | – | ||||||||||||
|
|
|
|
|
|
|
| |||||||||
End of year | $ | 50,339,525 | $ | 4,596,078 | $ | 19,127,999 | $ | 4,224,468 | ||||||||
|
|
|
|
|
|
|
| |||||||||
Changes in Shares: | ||||||||||||||||
Class A | ||||||||||||||||
Shares sold | – | 66,667 | – | 50,000 | ||||||||||||
Reinvestment of distributions | – | – | – | – | ||||||||||||
Shares redeemed | (50,403 | ) | – | – | – | |||||||||||
|
|
|
|
|
|
|
| |||||||||
Net increase (decrease) in shares | (50,403 | ) | 66,667 | – | 50,000 | |||||||||||
|
|
|
|
|
|
|
| |||||||||
Class I | ||||||||||||||||
Shares sold | 204,851 | 66,666 | 141,478 | 50,000 | ||||||||||||
Reinvestment of distributions | (63,910 | ) | – | 1,832 | – | |||||||||||
Shares redeemed | 4,193 | – | (48,372 | ) | – | |||||||||||
|
|
|
|
|
|
|
| |||||||||
Net increase (decrease) in shares | 145,134 | 66,666 | 94,938 | 50,000 | ||||||||||||
|
|
|
|
|
|
|
| |||||||||
Class K | ||||||||||||||||
Shares sold | 4,813,095 | 351,981 | 1,577,668 | 317,876 | ||||||||||||
Reinvestment of distributions | 100,832 | 1,808 | 33,629 | 1,442 | ||||||||||||
Shares redeemed | (303,369 | ) | (34,235 | ) | (165,886 | ) | (3,842 | ) | ||||||||
|
|
|
|
|
|
|
| |||||||||
Net increase (decrease) in shares | 4,610,558 | 319,554 | 1,445,411 | 315,476 | ||||||||||||
|
|
|
|
|
|
|
| |||||||||
| * | Commencement of operations |
See accompanying notes to the financial statements.
51
Table of Contents
State Street Institutional Investment Trust
Statements of Changes in Net Assets — (continued)
| State Street Target Retirement 2040 Fund | State Street Target Retirement 2045 Fund | |||||||||||||||
| For the year December 31, 2015 | For the Period 9/30/14* to 12/31/14 | For the year December 31, 2015 | For the Period 9/30/14* to 12/31/14 | |||||||||||||
Increase (Decrease) in Net Assets Resulting from: | ||||||||||||||||
Operations: | ||||||||||||||||
Net investment income | $ | 681,524 | $ | 8,993 | $ | 161,917 | $ | 5,855 | ||||||||
Net realized gain (loss) on investments | (14,716 | ) | 16,878 | 41,536 | 11,479 | |||||||||||
Change in net unrealized appreciation (depreciation) on investments | (2,515,873 | ) | 5,419 | (597,567 | ) | 4,829 | ||||||||||
|
|
|
|
|
|
|
| |||||||||
Net increase (decrease) in net assets from operations | (1,849,065 | ) | 31,290 | (394,114 | ) | 22,163 | ||||||||||
|
|
|
|
|
|
|
| |||||||||
Distributions to Shareholders from: | ||||||||||||||||
Net investment income | ||||||||||||||||
Class A | (2,389 | ) | (4,395 | ) | (4,950 | ) | (5,183 | ) | ||||||||
Class I | (28,489 | ) | (4,715 | ) | (13,746 | ) | (5,397 | ) | ||||||||
Class K | (675,956 | ) | (14,728 | ) | (146,988 | ) | (5,567 | ) | ||||||||
|
|
|
|
|
|
|
| |||||||||
Total distributions from net investment income | (706,834 | ) | (28,838 | ) | (165,684 | ) | (16,147 | ) | ||||||||
|
|
|
|
|
|
|
| |||||||||
Net realized gain on investments | ||||||||||||||||
Class A | (10 | ) | – | (233 | ) | – | ||||||||||
Class I | (105 | ) | – | (555 | ) | – | ||||||||||
Class K | (2,494 | ) | – | (5,937 | ) | – | ||||||||||
|
|
|
|
|
|
|
| |||||||||
Total distributions from net realized gain on investments | (2,609 | ) | – | (6,725 | ) | – | ||||||||||
|
|
|
|
|
|
|
| |||||||||
Total distributions | (709,443 | ) | (23,838 | ) | (172,409 | ) | (16,147 | ) | ||||||||
|
|
|
|
|
|
|
| |||||||||
Net Increase (Decrease) from Capital Share Transactions: | ||||||||||||||||
Class A | ||||||||||||||||
Shares sold | – | 500,000 | – | 333,334 | ||||||||||||
Reinvestment of distributions | – | – | – | – | ||||||||||||
Shares redeemed | (350,000 | ) | – | – | – | |||||||||||
|
|
|
|
|
|
|
| |||||||||
Net increase (decrease) from Capital share transactions | (350,000 | ) | 500,000 | – | 333,334 | |||||||||||
|
|
|
|
|
|
|
| |||||||||
Class I | ||||||||||||||||
Shares sold | 1,480,464 | 500,000 | 522,915 | 333,333 | ||||||||||||
Reinvestment of distributions | 26,782 | – | 8,291 | – | ||||||||||||
Shares redeemed | (442,151 | ) | – | (49,329 | ) | – | ||||||||||
|
|
|
|
|
|
|
| |||||||||
Net increase from Capital share transactions | 1,065,095 | 500,000 | 481,877 | 333,333 | ||||||||||||
|
|
|
|
|
|
|
| |||||||||
See accompanying notes to the financial statements.
52
Table of Contents
State Street Institutional Investment Trust
Statements of Changes in Net Assets — (continued)
| State Street Target Retirement 2040 Fund | State Street Target Retirement 2045 Fund | |||||||||||||||
| For the year December 31, 2015 | For the Period 9/30/14* to 12/31/14 | For the year December 31, 2015 | For the Period 9/30/14* to 12/31/14 | |||||||||||||
Class K | ||||||||||||||||
Shares sold | $ | 38,333,743 | $ | 1,506,928 | $ | 8,858,523 | $ | 333,333 | ||||||||
Reinvestment of distributions | 676,639 | 9,763 | 146,915 | – | ||||||||||||
Shares redeemed | (2,690,187 | ) | – | (449,038 | ) | – | ||||||||||
|
|
|
|
|
|
|
| |||||||||
Net increase from Capital share transactions | 36,320,195 | 1,516,691 | 8,556,400 | 333,333 | ||||||||||||
|
|
|
|
|
|
|
| |||||||||
Total increase from Capital share transactions | 37,035,290 | 2,516,691 | 9,038,277 | 1,000,000 | ||||||||||||
|
|
|
|
|
|
|
| |||||||||
Net Increase in Net Assets | 34,476,782 | 2,524,143 | 8,471,754 | 1,006,016 | ||||||||||||
Net Assets | ||||||||||||||||
Beginning of year | 2,524,143 | – | 1,006,016 | – | ||||||||||||
|
|
|
|
|
|
|
| |||||||||
End of year | $ | 37,000,925 | $ | 2,524,143 | $ | 9,477,770 | $ | 1,006,016 | ||||||||
|
|
|
|
|
|
|
| |||||||||
Changes in Shares: | ||||||||||||||||
Class A | ||||||||||||||||
Shares sold | – | 50,000 | – | 33,334 | ||||||||||||
Reinvestment of distributions | – | – | – | – | ||||||||||||
Shares redeemed | (35,497 | ) | – | – | – | |||||||||||
|
|
|
|
|
|
|
| |||||||||
Net increase (decrease) in shares | (35,497 | ) | 50,000 | – | 33,334 | |||||||||||
|
|
|
|
|
|
|
| |||||||||
Class I | ||||||||||||||||
Shares sold | 146,414 | 50,000 | 51,774 | 33,333 | ||||||||||||
Reinvestment of distributions | 2,736 | – | 854 | – | ||||||||||||
Shares redeemed | (44,567 | ) | – | (4,793 | ) | – | ||||||||||
|
|
|
|
|
|
|
| |||||||||
Net increase (decrease) in shares | 104,583 | 50,000 | 47,835 | 33,333 | ||||||||||||
|
|
|
|
|
|
|
| |||||||||
Class K | ||||||||||||||||
Shares sold | 3,684,709 | 148,319 | 865,612 | 33,333 | ||||||||||||
Reinvestment of distributions | 69,115 | 953 | 15,130 | – | ||||||||||||
Shares redeemed | (263,882 | ) | – | (44,939 | ) | – | ||||||||||
|
|
|
|
|
|
|
| |||||||||
Net increase (decrease) in shares | 3,489,942 | 149,272 | 835,803 | 33,333 | ||||||||||||
|
|
|
|
|
|
|
| |||||||||
| * | Commencement of operations |
See accompanying notes to the financial statements.
53
Table of Contents
State Street Institutional Investment Trust
Statements of Changes in Net Assets — (continued)
| State Street Target Retirement 2050 Fund | State Street Target Retirement 2055 Fund | |||||||||||||||
| For the year December 31, 2015 | For the Period 9/30/14* to 12/31/14 | For the year December 31, 2015 | For the Period 9/30/14* to 12/31/14 | |||||||||||||
Increase (Decrease) in Net Assets Resulting from: | ||||||||||||||||
Operations: | ||||||||||||||||
Net investment income | $ | 115,429 | $ | 2,871 | $ | 60,545 | $ | 2,873 | ||||||||
Net realized gain on investments | 27,943 | 6,022 | 17,083 | 6,022 | ||||||||||||
Change in net unrealized appreciation (depreciation) on investments | (425,274 | ) | 2,133 | (235,545 | ) | 2,132 | ||||||||||
|
|
|
|
|
|
|
| |||||||||
Net increase (decrease) in net assets from operations | (281,902 | ) | 11,026 | (157,917 | ) | 11,027 | ||||||||||
|
|
|
|
|
|
|
| |||||||||
Distributions to Shareholders from: | ||||||||||||||||
Net investment income | ||||||||||||||||
Class A | (2,505 | ) | (2,548 | ) | (2,587 | ) | (2,549 | ) | ||||||||
Class I | (13,951 | ) | (2,653 | ) | (4,139 | ) | (2,653 | ) | ||||||||
Class K | (101,651 | ) | (2,738 | ) | (55,216 | ) | (2,738 | ) | ||||||||
|
|
|
|
|
|
|
| |||||||||
Total distributions from net investment income | (118,107 | ) | (7,939 | ) | (61,942 | ) | (7,940 | ) | ||||||||
|
|
|
|
|
|
|
| |||||||||
Net realized gain on investments | ||||||||||||||||
Class A | (63 | ) | (35 | ) | (248 | ) | (35 | ) | ||||||||
Class I | (303 | ) | (35 | ) | (343 | ) | (35 | ) | ||||||||
Class K | (2,207 | ) | (35 | ) | (4,571 | ) | (35 | ) | ||||||||
|
|
|
|
|
|
|
| |||||||||
Total distributions from net realized gain on investments | (2,573 | ) | (105 | ) | (5,162 | ) | (105 | ) | ||||||||
|
|
|
|
|
|
|
| |||||||||
Total distributions | (120,680 | ) | (8,044 | ) | (67,104 | ) | (8,045 | ) | ||||||||
|
|
|
|
|
|
|
| |||||||||
Net Increase (Decrease) from Capital Share Transactions: | ||||||||||||||||
Class A | ||||||||||||||||
Shares sold | – | 166,668 | – | 166,668 | ||||||||||||
Reinvestment of distributions | – | – | – | – | ||||||||||||
Shares redeemed | – | – | – | – | ||||||||||||
|
|
|
|
|
|
|
| |||||||||
Net increase (decrease) from Capital share transactions | – | 166,668 | – | 166,668 | ||||||||||||
|
|
|
|
|
|
|
| |||||||||
Class I | ||||||||||||||||
Shares sold | 652,035 | 166,666 | 68,422 | 166,666 | ||||||||||||
Reinvestment of distributions | 11,274 | – | 1,233 | – | ||||||||||||
Shares redeemed | (6,801 | ) | – | (3,942 | ) | – | ||||||||||
|
|
|
|
|
|
|
| |||||||||
Net increase from Capital share transactions | 656,508 | 166,666 | 65,713 | 166,666 | ||||||||||||
|
|
|
|
|
|
|
| |||||||||
See accompanying notes to the financial statements.
54
Table of Contents
State Street Institutional Investment Trust
Statements of Changes in Net Assets — (continued)
| State Street Target Retirement 2050 Fund | State Street Target Retirement 2055 Fund | |||||||||||||||
| For the year December 31, 2015 | For the Period 9/30/14* to 12/31/14 | For the year December 31, 2015 | For the Period 9/30/14* to 12/31/14 | |||||||||||||
Class K | ||||||||||||||||
Shares sold | $ | 6,095,771 | $ | 166,666 | $ | 3,219,778 | $ | 166,666 | ||||||||
Reinvestment of distributions | 100,879 | – | 56,539 | – | ||||||||||||
Shares redeemed | (261,759 | ) | – | (194,099 | ) | – | ||||||||||
|
|
|
|
|
|
|
| |||||||||
Net increase from Capital share transactions | 5,934,891 | 166,666 | 3,082,218 | 166,666 | ||||||||||||
|
|
|
|
|
|
|
| |||||||||
Total increase from Capital share transactions | 6,591,399 | 500,000 | 3,147,931 | 500,000 | ||||||||||||
|
|
|
|
|
|
|
| |||||||||
Net Increase in Net Assets | 6,188,817 | 502,982 | 2,922,910 | 502,982 | ||||||||||||
Net Assets | ||||||||||||||||
Beginning of year | 502,982 | – | 502,982 | – | ||||||||||||
|
|
|
|
|
|
|
| |||||||||
End of year | $ | 6,691,799 | $ | 502,982 | $ | 3,425,892 | $ | 502,982 | ||||||||
|
|
|
|
|
|
|
| |||||||||
Changes in Shares: | ||||||||||||||||
Class A | ||||||||||||||||
Shares sold | – | 16,667 | – | 16,667 | ||||||||||||
Reinvestment of distributions | – | – | – | – | ||||||||||||
Shares redeemed | – | – | – | – | ||||||||||||
|
|
|
|
|
|
|
| |||||||||
Net increase (decrease) in shares | – | 16,667 | – | 16,667 | ||||||||||||
|
|
|
|
|
|
|
| |||||||||
Class I | ||||||||||||||||
Shares sold | 65,536 | 16,666 | 6,774 | 16,666 | ||||||||||||
Reinvestment of distributions | 1,164 | – | 128 | – | ||||||||||||
Shares redeemed | (684 | ) | – | (403 | ) | – | ||||||||||
|
|
|
|
|
|
|
| |||||||||
Net increase (decrease) in shares | 66,016 | 16,666 | 6,499 | 16,666 | ||||||||||||
|
|
|
|
|
|
|
| |||||||||
Class K | ||||||||||||||||
Shares sold | 595,396 | 16,667 | 314,049 | 16,667 | ||||||||||||
Reinvestment of distributions | 10,411 | – | 5,847 | – | ||||||||||||
Shares redeemed | (25,810 | ) | – | (19,340 | ) | – | ||||||||||
|
|
|
|
|
|
|
| |||||||||
Net increase (decrease) in shares | 579,997 | 16,667 | 300,556 | 16,667 | ||||||||||||
|
|
|
|
|
|
|
| |||||||||
| * | Commencement of operations |
See accompanying notes to the financial statements.
55
Table of Contents
State Street Institutional Investment Trust
Statements of Changes in Net Assets — (continued)
| State Street Target Retirement 2060 Fund | ||||||||
| For the year December 31, 2015 | For the Period 9/30/14* to 12/31/14 | |||||||
Increase (Decrease) in Net Assets Resulting from: | ||||||||
Operations: | ||||||||
Net investment income | $ | 11,218 | $ | 2,880 | ||||
Net realized gain on investments | 1,717 | 5,990 | ||||||
Change in net unrealized appreciation (depreciation) on investments | (39,623 | ) | 2,168 | |||||
|
|
|
| |||||
Net increase (decrease) in net assets from operations | (26,688 | ) | 11,038 | |||||
|
|
|
| |||||
Distributions to Shareholders from: | ||||||||
Net investment income | ||||||||
Class A | (2,828 | ) | (2,538 | ) | ||||
Class I | (3,305 | ) | (2,643 | ) | ||||
Class K | (5,351 | ) | (2,728 | ) | ||||
|
|
|
| |||||
Total distributions from net investment income | (11,484 | ) | (7,909 | ) | ||||
|
|
|
| |||||
Net realized gain on investments | ||||||||
Class A | (1,880 | ) | (27 | ) | ||||
Class I | (1,917 | ) | (27 | ) | ||||
Class K | (3,103 | ) | (27 | ) | ||||
|
|
|
| |||||
Total distributions from net realized gain on investments | (6,900 | ) | (81 | ) | ||||
|
|
|
| |||||
Total distributions | (18,384 | ) | (7,990 | ) | ||||
|
|
|
| |||||
Net Increase (Decrease) from Capital Share Transactions: | ||||||||
Class A | ||||||||
Shares sold | – | 166,668 | ||||||
Reinvestment of distributions | – | – | ||||||
Shares redeemed | – | – | ||||||
|
|
|
| |||||
Net increase (decrease) from Capital share transactions | – | 166,668 | ||||||
|
|
|
| |||||
Class I | ||||||||
Shares sold | 3,454 | 166,666 | ||||||
Reinvestment of distributions | 101 | – | ||||||
Shares redeemed | (3 | ) | – | |||||
|
|
|
| |||||
Net increase from Capital share transactions | 3,552 | 166,666 | ||||||
|
|
|
| |||||
Class K | ||||||||
Shares sold | 227,182 | 166,666 | ||||||
Reinvestment of distributions | 3,332 | – | ||||||
Shares redeemed | (103,056 | ) | – | |||||
|
|
|
| |||||
Net increase from Capital share transactions | 127,458 | 166,666 | ||||||
|
|
|
| |||||
Total increase from Capital share transactions | 131,010 | 500,000 | ||||||
|
|
|
| |||||
Net Increase in Net Assets | 85,938 | 503,048 | ||||||
Net Assets | ||||||||
Beginning of year | 503,048 | – | ||||||
|
|
|
| |||||
End of year | $ | 588,986 | $ | 503,048 | ||||
|
|
|
| |||||
See accompanying notes to the financial statements.
56
Table of Contents
State Street Institutional Investment Trust
Statements of Changes in Net Assets — (continued)
| State Street Target Retirement 2060 Fund | ||||||||
| For the year December 31, 2015 | For the Period 9/30/14* to 12/31/14 | |||||||
Changes in Shares: | ||||||||
Class A | ||||||||
Shares sold | $ | – | $ | 16,667 | ||||
Reinvestment of distributions | – | – | ||||||
Shares redeemed | – | – | ||||||
|
|
|
| |||||
Net increase (decrease) in shares | – | 16,667 | ||||||
|
|
|
| |||||
Class I | ||||||||
Shares sold | 347 | 16,666 | ||||||
Reinvestment of distributions | 11 | – | ||||||
Shares redeemed | – | – | ||||||
|
|
|
| |||||
Net increase (decrease) in shares | 358 | 16,666 | ||||||
|
|
|
| |||||
Class K | ||||||||
Shares sold | 22,197 | 16,667 | ||||||
Reinvestment of distributions | 348 | – | ||||||
Shares redeemed | (10,872 | ) | – | |||||
|
|
|
| |||||
Net increase (decrease) in shares | 11,673 | 16,667 | ||||||
|
|
|
| |||||
| * | Commencement of operations |
See accompanying notes to the financial statements.
57
Table of Contents
State Street Institutional Investment Trust
Selected data for a Class A Share of beneficial interest outstanding throughout each period is presented below:
| State Street Target Retirement Fund | State Street Target Retirement 2015 Fund | State Street Target Retirement 2020 Fund | ||||||||||||||||||||||
| Year Ended 12/31/15 | For the Period 9/30/14* - 12/31/14 | Year Ended 12/31/15 | For the Period 9/30/14* - 12/31/14 | Year Ended 12/31/15 | For the Period 9/30/14* - 12/31/14 | |||||||||||||||||||
Per Share Operating Performance: | ||||||||||||||||||||||||
Net Asset Value, Beginning of Period | $ | 10.03 | $ | 10.00 | $ | 10.03 | $ | 10.00 | $ | 10.14 | $ | 10.00 | ||||||||||||
|
|
|
|
|
|
|
|
|
|
|
| |||||||||||||
Investment Operations: | ||||||||||||||||||||||||
Net investment income(a) | 0.15 | 0.05 | 0.17 | 0.05 | 0.24 | 0.05 | ||||||||||||||||||
Net realized and unrealized gain (loss) on investments | (0.21 | ) | 0.01 | (0.27 | ) | 0.03 | (0.41 | ) | 0.12 | |||||||||||||||
|
|
|
|
|
|
|
|
|
|
|
| |||||||||||||
Total from investment operations | (0.06 | ) | 0.06 | (0.10 | ) | 0.08 | (0.17 | ) | 0.17 | |||||||||||||||
|
|
|
|
|
|
|
|
|
|
|
| |||||||||||||
Less Distributions From: | ||||||||||||||||||||||||
Net investment income | (0.17 | ) | (0.03 | ) | (0.16 | ) | (0.05 | ) | (0.20 | ) | (0.03 | ) | ||||||||||||
Net realized gains | (0.01 | ) | (0.00 | )(b) | (0.05 | ) | (0.00 | )(b) | (0.01 | ) | (0.00 | )(b) | ||||||||||||
|
|
|
|
|
|
|
|
|
|
|
| |||||||||||||
Total distributions | (0.18 | ) | (0.03 | ) | (0.21 | ) | (0.05 | ) | (0.21 | ) | (0.03 | ) | ||||||||||||
|
|
|
|
|
|
|
|
|
|
|
| |||||||||||||
Net increase (decrease) in net assets | (0.24 | ) | 0.03 | (0.31 | ) | 0.03 | (0.38 | ) | 0.14 | |||||||||||||||
|
|
|
|
|
|
|
|
|
|
|
| |||||||||||||
Net Asset Value, End of Period | $ | 9.79 | $ | 10.03 | $ | 9.72 | $ | 10.03 | $ | 9.76 | $ | 10.14 | ||||||||||||
|
|
|
|
|
|
|
|
|
|
|
| |||||||||||||
Total Return(c) | (0.64 | )% | 0.64 | % | (1.00 | )% | 0.81 | % | (1.71 | )% | 1.66 | % | ||||||||||||
Ratios and Supplemental Data: | ||||||||||||||||||||||||
Net Assets, End of Period (000s) | $ | 408 | $ | 418 | $ | 585 | $ | 585 | $ | 125 | $ | 845 | ||||||||||||
Ratios to average net assets: | ||||||||||||||||||||||||
Expenses before waiver and payments by affiliates | 1.40 | % | 21.65 | %(d) | 5.32 | % | 15.05 | %(d) | 0.80 | % | 9.36 | %(d) | ||||||||||||
Expenses net of waiver and payments by affiliates | 0.26 | % | 0.62 | %(d) | 0.27 | % | 0.62 | %(d) | 0.26 | % | 0.62 | %(d) | ||||||||||||
Net investment income | 1.48 | % | 1.82 | %(d) | 1.65 | % | 2.06 | %(d) | 2.30 | % | 2.32 | %(d) | ||||||||||||
Portfolio turnover rate | 31 | % | 8 | %(e) | 55 | % | 39 | %(e) | 39 | % | 5 | %(e) | ||||||||||||
| (a) | Net investment income per share is calculated using the average shares method. |
| (b) | Amount is less than $0.005 per share. |
| (c) | Total return is calculated assuming a purchase of shares at net asset value on the first day and a sale at net asset value on the last day of each period reported. Distributions are assumed, for the purpose of this calculation, to be reinvested at net asset value per share on the respective payment dates of each Fund. Total return for periods of less than one year is not annualized. Results represent past performance and are not indicative of future results. |
| (d) | Annualized. |
| (e) | Not annualized. |
| * | Commencement of operations |
See accompanying notes to the financial statements.
58
Table of Contents
State Street Institutional Investment Trust
Financial Highlights — (continued)
Selected data for a Class A Share of beneficial interest outstanding throughout each year is presented below:
| State Street Target Retirement 2025 Fund | State Street Target Retirement 2030 Fund | State Street Target Retirement 2035 Fund | ||||||||||||||||||||||
| Year Ended 12/31/15 | For the Period 9/30/14* - 12/31/14 | Year Ended 12/31/15 | For the Period 9/30/14* - 12/31/14 | Year Ended 12/31/15 | For the Period 9/30/14* - 12/31/14 | |||||||||||||||||||
Per Share Operating Performance: | ||||||||||||||||||||||||
Net Asset Value, Beginning of Period | $ | 10.16 | $ | 10.00 | $ | 10.15 | $ | 10.00 | $ | 10.17 | $ | 10.00 | ||||||||||||
|
|
|
|
|
|
|
|
|
|
|
| |||||||||||||
Investment Operations: | ||||||||||||||||||||||||
Net investment income(a) | 0.23 | 0.06 | 0.23 | 0.05 | 0.17 | 0.06 | ||||||||||||||||||
Net realized and unrealized gain (loss) on investments | (0.44 | ) | 0.13 | (0.44 | ) | 0.16 | (0.39 | ) | 0.15 | |||||||||||||||
|
|
|
|
|
|
|
|
|
|
|
| |||||||||||||
Total from investment operations | (0.21 | ) | 0.19 | (0.21 | ) | 0.21 | (0.22 | ) | 0.21 | |||||||||||||||
|
|
|
|
|
|
|
|
|
|
|
| |||||||||||||
Less Distributions From: | ||||||||||||||||||||||||
Net investment income | (0.18 | ) | (0.03 | ) | (0.18 | ) | (0.06 | ) | (0.15 | ) | (0.04 | ) | ||||||||||||
Net realized gains | (0.03 | ) | – | (0.00 | )(b) | – | (0.02 | ) | – | |||||||||||||||
|
|
|
|
|
|
|
|
|
|
|
| |||||||||||||
Total distributions | (0.21 | ) | (0.03 | ) | (0.18 | ) | (0.06 | ) | (0.17 | ) | (0.04 | ) | ||||||||||||
|
|
|
|
|
|
|
|
|
|
|
| |||||||||||||
Net increase (decrease) in net assets | (0.42 | ) | 0.16 | (0.39 | ) | 0.15 | (0.39 | ) | 0.17 | |||||||||||||||
|
|
|
|
|
|
|
|
|
|
|
| |||||||||||||
Net Asset Value, End of Period | $ | 9.74 | $ | 10.16 | $ | 9.76 | $ | 10.15 | $ | 9.78 | $ | 10.17 | ||||||||||||
|
|
|
|
|
|
|
|
|
|
|
| |||||||||||||
Total Return(c) | (2.11 | )% | 1.93 | % | (2.07 | )% | 2.12 | % | (2.15 | )% | 2.13 | % | ||||||||||||
Ratios and Supplemental Data: | ||||||||||||||||||||||||
Net Assets, End of Period (000s) | $ | 159 | $ | 677 | $ | 159 | $ | 676 | $ | 489 | $ | 508 | ||||||||||||
Ratios to average net assets: | ||||||||||||||||||||||||
Expenses before waiver and payments by affiliates | 1.56 | % | 10.90 | %(d) | 0.84 | % | 12.85 | %(d) | 2.08 | % | 17.04 | %(d) | ||||||||||||
Expenses net of waiver and payments by affiliates | 0.28 | % | 0.62 | %(d) | 0.28 | % | 0.62 | %(d) | 0.28 | % | 0.62 | %(d) | ||||||||||||
Net investment income | 2.27 | % | 2.38 | %(d) | 2.21 | % | 2.05 | %(d) | 1.65 | % | 2.53 | %(d) | ||||||||||||
Portfolio turnover rate | 51 | % | 13 | %(e) | 33 | % | 18 | %(e) | 38 | % | 7 | %(e) | ||||||||||||
| (a) | Net investment income per share is calculated using the average shares method. |
| (b) | Amount is less than $0.005 per share. |
| (c) | Total return is calculated assuming a purchase of shares at net asset value on the first day and a sale at net asset value on the last day of each period reported. Distributions are assumed, for the purpose of this calculation, to be reinvested at net asset value per share on the respective payment dates of each Fund. Total return for periods of less than one year is not annualized. Results represent past performance and are not indicative of future results. |
| (d) | Annualized. |
| (e) | Not annualized. |
| * | Commencement of operations |
See accompanying notes to the financial statements.
59
Table of Contents
State Street Institutional Investment Trust
Financial Highlights — (continued)
Selected data for a Class A Share of beneficial interest outstanding throughout each year is presented below:
| State Street Target Retirement 2040 Fund | State Street Target Retirement 2045 Fund | State Street Target Retirement 2050 Fund | ||||||||||||||||||||||
| Year Ended 12/31/15 | For the Period 9/30/14* - 12/31/14 | Year Ended 12/31/15 | For the Period 9/30/14* - 12/31/14 | Year Ended 12/31/15 | For the Period 9/30/14* - 12/31/14 | |||||||||||||||||||
Per Share Operating Performance: | ||||||||||||||||||||||||
Net Asset Value, Beginning of Period | $ | 10.13 | $ | 10.00 | $ | 10.06 | $ | 10.00 | $ | 10.06 | $ | 10.00 | ||||||||||||
|
|
|
|
|
|
|
|
|
|
|
| |||||||||||||
Investment Operations: | ||||||||||||||||||||||||
Net investment income(a) | 0.21 | 0.06 | 0.17 | 0.05 | 0.16 | 0.05 | ||||||||||||||||||
Net realized and unrealized gain (loss) on investments | (0.47 | ) | 0.16 | (0.43 | ) | 0.17 | (0.45 | ) | 0.16 | |||||||||||||||
|
|
|
|
|
|
|
|
|
|
|
| |||||||||||||
Total from investment operations | (0.26 | ) | 0.22 | (0.26 | ) | 0.22 | (0.29 | ) | 0.21 | |||||||||||||||
|
|
|
|
|
|
|
|
|
|
|
| |||||||||||||
Less Distributions From: | ||||||||||||||||||||||||
Net investment income | (0.16 | ) | (0.09 | ) | (0.15 | ) | (0.16 | ) | (0.15 | ) | (0.15 | ) | ||||||||||||
Net realized gains | (0.00 | )(b) | – | (0.01 | ) | – | (0.00 | )(b) | (0.00 | )(b) | ||||||||||||||
|
|
|
|
|
|
|
|
|
|
|
| |||||||||||||
Total distributions | (0.16 | ) | (0.09 | ) | (0.16 | ) | (0.16 | ) | (0.15 | ) | (0.15 | ) | ||||||||||||
|
|
|
|
|
|
|
|
|
|
|
| |||||||||||||
Net increase (decrease) in net assets | (0.42 | ) | 0.13 | (0.42 | ) | 0.06 | (0.44 | ) | 0.06 | |||||||||||||||
|
|
|
|
|
|
|
|
|
|
|
| |||||||||||||
Net Asset Value, End of Period | $ | 9.71 | $ | 10.13 | $ | 9.64 | $ | 10.06 | $ | 9.62 | $ | 10.06 | ||||||||||||
|
|
|
|
|
|
|
|
|
|
|
| |||||||||||||
Total Return(c) | (2.53 | )% | 2.17 | % | (2.64 | )% | 2.14 | % | (2.85 | )% | 2.13 | % | ||||||||||||
Ratios and Supplemental Data: | ||||||||||||||||||||||||
Net Assets, End of Period (000s) | $ | 141 | $ | 506 | $ | 321 | $ | 335 | $ | 160 | $ | 168 | ||||||||||||
Ratios to average net assets: | ||||||||||||||||||||||||
Expenses before waiver and payments by affiliates | 1.04 | % | 18.29 | %(d) | 3.50 | % | 30.47 | %(d) | 4.90 | % | 59.96 | %(d) | ||||||||||||
Expenses net of waiver and payments by affiliates | 0.27 | % | 0.62 | %(d) | 0.26 | % | 0.62 | %(d) | 0.27 | % | 0.62 | %(d) | ||||||||||||
Net investment income | 2.07 | % | 2.28 | %(d) | 1.63 | % | 2.07 | %(d) | 1.61 | % | 2.03 | %(d) | ||||||||||||
Portfolio turnover rate | 38 | % | 5 | %(e) | 35 | % | 5 | %(e) | 35 | % | 7 | %(e) | ||||||||||||
| (a) | Net investment income per share is calculated using the average shares method. |
| (b) | Amount is less than $0.005 per share. |
| (c) | Total return is calculated assuming a purchase of shares at net asset value on the first day and a sale at net asset value on the last day of each period reported. Distributions are assumed, for the purpose of this calculation, to be reinvested at net asset value per share on the respective payment dates of each Fund. Total return for periods of less than one year is not annualized. Results represent past performance and are not indicative of future results. |
| (d) | Annualized. |
| (e) | Not annualized. |
| * | Commencement of operations |
See accompanying notes to the financial statements.
60
Table of Contents
State Street Institutional Investment Trust
Financial Highlights — (continued)
Selected data for a Class A Share of beneficial interest outstanding throughout each year is presented below:
| State Street Target Retirement 2055 Fund | State Street Target Retirement 2060 Fund | |||||||||||||||
| Year Ended 12/31/15 | For the Period 9/30/14* - 12/31/14 | Year Ended 12/31/15 | For the Period 9/30/14* - 12/31/14 | |||||||||||||
Per Share Operating Performance: | ||||||||||||||||
Net Asset Value, Beginning of Period | $ | 10.06 | $ | 10.00 | $ | 10.06 | $ | 10.00 | ||||||||
|
|
|
|
|
|
|
| |||||||||
Investment Operations: | ||||||||||||||||
Net investment income(a) | 0.16 | 0.05 | 0.17 | 0.05 | ||||||||||||
Net realized and unrealized gain (loss) on investments | (0.45 | ) | 0.16 | (0.45 | ) | 0.16 | ||||||||||
|
|
|
|
|
|
|
| |||||||||
Total from investment operations | (0.29 | ) | 0.21 | (0.28 | ) | 0.21 | ||||||||||
|
|
|
|
|
|
|
| |||||||||
Less Distributions From: | ||||||||||||||||
Net investment income | (0.16 | ) | (0.15 | ) | (0.17 | ) | (0.15 | ) | ||||||||
Net realized gains | (0.01 | ) | (0.00 | )(b) | (0.11 | ) | (0.00 | )(b) | ||||||||
|
|
|
|
|
|
|
| |||||||||
Total distributions | (0.17 | ) | (0.15 | ) | (0.28 | ) | (0.15 | ) | ||||||||
|
|
|
|
|
|
|
| |||||||||
Net increase (decrease) in net assets | (0.46 | ) | 0.06 | (0.56 | ) | 0.06 | ||||||||||
|
|
|
|
|
|
|
| |||||||||
Net Asset Value, End of Period | $ | 9.60 | $ | 10.06 | $ | 9.50 | $ | 10.06 | ||||||||
|
|
|
|
|
|
|
| |||||||||
Total Return(c) | (2.90 | )% | 2.13 | % | (2.78 | )% | 2.12 | % | ||||||||
Ratios and Supplemental Data: | ||||||||||||||||
Net Assets, End of Period (000s) | $ | 160 | $ | 168 | $ | 158 | $ | 168 | ||||||||
Ratios to average net assets: | ||||||||||||||||
Expenses before waiver and payments by affiliates(d) | 7.94 | % | 59.87 | %(d) | 30.01 | % | 59.73 | %(d) | ||||||||
Expenses net of waiver and payments by affiliates(d) | 0.27 | % | 0.62 | %(d) | 0.27 | % | 0.62 | %(d) | ||||||||
Net investment income(d) | 1.62 | % | 2.03 | %(d) | 1.68 | % | 2.04 | %(d) | ||||||||
Portfolio turnover rate | 40 | % | 7 | %(e) | 73 | % | 7 | %(e) | ||||||||
| (a) | Net investment income per share is calculated using the average shares method. |
| (b) | Amount is less than $0.005 per share. |
| (c) | Total return is calculated assuming a purchase of shares at net asset value on the first day and a sale at net asset value on the last day of each period reported. Distributions are assumed, for the purpose of this calculation, to be reinvested at net asset value per share on the respective payment dates of each Fund. Total return for periods of less than one year is not annualized. Results represent past performance and are not indicative of future results. |
| (d) | Annualized. |
| (e) | Not annualized. |
| * | Commencement of operations |
See accompanying notes to the financial statements.
61
Table of Contents
State Street Institutional Investment Trust
Financial Highlights — (continued)
Selected data for a Class I Share of beneficial interest outstanding throughout each period is presented below:
| State Street Target Retirement Fund | State Street Target Retirement 2015 Fund | State Street Target Retirement 2020 Fund | ||||||||||||||||||||||
| Year Ended 12/31/15 | For the Period 9/30/14* - 12/31/14 | Year Ended 12/31/15 | For the Period 9/30/14* - 12/31/14 | Year Ended 12/31/15 | For the Period 9/30/14* - 12/31/14 | |||||||||||||||||||
Per Share Operating Performance: | ||||||||||||||||||||||||
Net Asset Value, Beginning of Period | $ | 10.03 | $ | 10.00 | $ | 10.03 | $ | 10.00 | $ | 10.14 | $ | 10.00 | ||||||||||||
|
|
|
|
|
|
|
|
|
|
|
| |||||||||||||
Investment Operations: | ||||||||||||||||||||||||
Net investment income (loss)(a) | 0.19 | 0.05 | 0.23 | 0.06 | 0.33 | 0.06 | ||||||||||||||||||
Net realized and unrealized gain (loss) on investments | (0.23 | ) | 0.02 | (0.31 | ) | 0.03 | (0.49 | ) | 0.11 | |||||||||||||||
|
|
|
|
|
|
|
|
|
|
|
| |||||||||||||
Total from investment operations | (0.04 | ) | 0.07 | (0.08 | ) | 0.09 | (0.16 | ) | 0.17 | |||||||||||||||
|
|
|
|
|
|
|
|
|
|
|
| |||||||||||||
Less Distributions From: | ||||||||||||||||||||||||
Net investment income | (0.19 | ) | (0.04 | ) | (0.18 | ) | (0.06 | ) | (0.22 | ) | (0.03 | ) | ||||||||||||
Net realized gains | (0.01 | ) | (0.00 | )(b) | (0.05 | ) | (0.00 | )(b) | (0.01 | ) | (0.00 | )(b) | ||||||||||||
|
|
|
|
|
|
|
|
|
|
|
| |||||||||||||
Total distributions | (0.20 | ) | (0.04 | ) | (0.23 | ) | (0.06 | ) | (0.23 | ) | (0.03 | ) | ||||||||||||
|
|
|
|
|
|
|
|
|
|
|
| |||||||||||||
Net increase (decrease) in net assets | (0.24 | ) | 0.03 | (0.31 | ) | 0.03 | (0.39 | ) | 0.14 | |||||||||||||||
|
|
|
|
|
|
|
|
|
|
|
| |||||||||||||
Net Asset Value, End of Period | $ | 9.79 | $ | 10.03 | $ | 9.72 | $ | 10.03 | $ | 9.75 | $ | 10.14 | ||||||||||||
|
|
|
|
|
|
|
|
|
|
|
| |||||||||||||
Total Return(c) | (0.39 | )% | 0.70 | % | (0.75 | )% | 0.87 | % | (1.56 | )% | 1.72 | % | ||||||||||||
Ratios and Supplemental Data: | ||||||||||||||||||||||||
Net Assets, End of Period (000s) | $ | 653 | $ | 418 | $ | 1,030 | $ | 585 | $ | 1,811 | $ | 845 | ||||||||||||
Ratios to average net assets: | ||||||||||||||||||||||||
Expenses before waiver and payments by affiliates | 1.15 | % | 21.40 | %(d) | 5.07 | % | 14.80 | %(d) | 0.55 | % | 9.11 | %(d) | ||||||||||||
Expenses net of waiver and payments by affiliates | 0.01 | % | 0.37 | %(d) | 0.02 | % | 0.37 | %(d) | 0.01 | % | 0.37 | %(d) | ||||||||||||
Net investment income | 1.94 | % | 2.07 | %(d) | �� | 2.32 | % | 2.31 | %(d) | 3.28 | % | 2.57 | %(d) | |||||||||||
Portfolio turnover rate | 31 | % | 8 | %(e) | 55 | % | 39 | %(e) | 39 | % | 5 | %(e) | ||||||||||||
| (a) | Net investment income per share is calculated using the average shares method. |
| (b) | Amount is less than $0.005 per share. |
| (c) | Total return is calculated assuming a purchase of shares at net asset value on the first day and a sale at net asset value on the last day of each period reported. Distributions are assumed, for the purpose of this calculation, to be reinvested at net asset value per share on the respective payment dates of each Fund. Total return for periods of less than one year is not annualized. Results represent past performance and are not indicative of future results. |
| (d) | Annualized. |
| (e) | Not annualized. |
| * | Commencement of operations |
See accompanying notes to the financial statements.
62
Table of Contents
State Street Institutional Investment Trust
Financial Highlights — (continued)
Selected data for a Class I Share of beneficial interest outstanding throughout each period is presented below:
| State Street Target Retirement 2025 Fund | State Street Target Retirement 2030 Fund | State Street Target Retirement 2035 Fund | ||||||||||||||||||||||
| Year Ended 12/31/15 | For the Period 9/30/14* - 12/31/14 | Year Ended 12/31/15 | For the Period 9/30/14* - 12/31/14 | Year Ended 12/31/15 | For the Period 9/30/14* - 12/31/14 | |||||||||||||||||||
Per Share Operating Performance: | ||||||||||||||||||||||||
Net Asset Value, Beginning of Period | $ | 10.16 | $ | 10.00 | $ | 10.15 | $ | 10.00 | $ | 10.17 | $ | 10.00 | ||||||||||||
|
|
|
|
|
|
|
|
|
|
|
| |||||||||||||
Investment Operations: | ||||||||||||||||||||||||
Net investment income (loss)(a) | 0.37 | 0.06 | 0.35 | 0.06 | 0.31 | 0.07 | ||||||||||||||||||
Net realized and unrealized gain (loss) on investments | (0.56 | ) | 0.14 | (0.54 | ) | 0.16 | (0.51 | ) | 0.15 | |||||||||||||||
|
|
|
|
|
|
|
|
|
|
|
| |||||||||||||
Total from investment operations | (0.19 | ) | 0.20 | (0.19 | ) | 0.22 | (0.20 | ) | 0.22 | |||||||||||||||
|
|
|
|
|
|
|
|
|
|
|
| |||||||||||||
Less Distributions From: | ||||||||||||||||||||||||
Net investment income | (0.20 | ) | (0.04 | ) | (0.20 | ) | (0.07 | ) | (0.18 | ) | (0.05 | ) | ||||||||||||
Net realized gains | (0.03 | ) | – | (0.00 | )(b) | – | (0.02 | ) | – | |||||||||||||||
|
|
|
|
|
|
|
|
|
|
|
| |||||||||||||
Total distributions | (0.23 | ) | (0.04 | ) | (0.20 | ) | (0.07 | ) | (0.20 | ) | (0.05 | ) | ||||||||||||
|
|
|
|
|
|
|
|
|
|
|
| |||||||||||||
Net increase (decrease) in net assets | (0.42 | ) | 0.16 | (0.39 | ) | 0.15 | (0.40 | ) | 0.17 | |||||||||||||||
|
|
|
|
|
|
|
|
|
|
|
| |||||||||||||
Net Asset Value, End of Period | $ | 9.74 | $ | 10.16 | $ | 9.76 | $ | 10.15 | $ | 9.77 | $ | 10.17 | ||||||||||||
|
|
|
|
|
|
|
|
|
|
|
| |||||||||||||
Total Return(c) | (1.87 | )% | 1.99 | % | (1.83 | )% | 2.18 | % | (2.00 | )% | 2.20 | % | ||||||||||||
Ratios and Supplemental Data: | ||||||||||||||||||||||||
Net Assets, End of Period (000s) | $ | 3,293 | $ | 677 | $ | 2,066 | $ | 676 | $ | 1,416 | $ | 508 | ||||||||||||
Ratios to average net assets: | ||||||||||||||||||||||||
Expenses before waiver and payments by affiliates | 1.31 | % | 10.65 | %(d) | 0.59 | % | 12.59 | %(d) | 1.83 | % | 16.79 | %(d) | ||||||||||||
Expenses net of waiver and payments by affiliates | 0.03 | % | 0.37 | %(d) | 0.03 | % | 0.37 | %(d) | 0.03 | % | 0.37 | %(d) | ||||||||||||
Net investment income | 3.71 | % | 2.63 | %(d) | 3.52 | % | 2.30 | %(d) | 3.07 | % | 2.78 | %(d) | ||||||||||||
Portfolio turnover rate | 51 | % | 13 | %(e) | 33 | % | 18 | %(e) | 38 | % | 7 | %(e) | ||||||||||||
| (a) | Net investment income per share is calculated using the average shares method. |
| (b) | Amount is less than $0.005 per share. |
| (c) | Total return is calculated assuming a purchase of shares at net asset value on the first day and a sale at net asset value on the last day of each period reported. Distributions are assumed, for the purpose of this calculation, to be reinvested at net asset value per share on the respective payment dates of each Fund. Total return for periods of less than one year is not annualized. Results represent past performance and are not indicative of future results. |
| (d) | Annualized. |
| (e) | Not annualized. |
| * | Commencement of operations. |
See accompanying notes to the financial statements.
63
Table of Contents
State Street Institutional Investment Trust
Financial Highlights — (continued)
Selected data for a Class I Share of beneficial interest outstanding throughout each period is presented below:
| State Street Target Retirement 2040 Fund | State Street Target Retirement 2045 Fund | State Street Target Retirement 2050 Fund | ||||||||||||||||||||||
| Year Ended 12/31/15 | For the Period 9/30/14* - 12/31/14 | Year Ended 12/31/15 | For the Period 9/30/14* - 12/31/14 | Year Ended 12/31/15 | For the Period 9/30/14* - 12/31/14 | |||||||||||||||||||
Per Share Operating Performance: | ||||||||||||||||||||||||
Net Asset Value, Beginning of Period | $ | 10.13 | $ | 10.00 | $ | 10.06 | $ | 10.00 | $ | 10.06 | $ | 10.00 | ||||||||||||
|
|
|
|
|
|
|
|
|
|
|
| |||||||||||||
Investment Operations: | ||||||||||||||||||||||||
Net investment income (loss)(a) | 0.40 | 0.06 | 0.30 | 0.06 | 0.43 | 0.06 | ||||||||||||||||||
Net realized and unrealized gain (loss) on investments | (0.63 | ) | 0.16 | (0.54 | ) | 0.16 | (0.69 | ) | 0.16 | |||||||||||||||
|
|
|
|
|
|
|
|
|
|
|
| |||||||||||||
Total from investment operations | (0.23 | ) | 0.22 | (0.24 | ) | 0.22 | (0.26 | ) | 0.22 | |||||||||||||||
|
|
|
|
|
|
|
|
|
|
|
| |||||||||||||
Less Distributions From: | ||||||||||||||||||||||||
Net investment income | (0.19 | ) | (0.09 | ) | (0.17 | ) | (0.16 | ) | (0.18 | ) | (0.16 | ) | ||||||||||||
Net realized gains | (0.00 | )(b) | – | (0.01 | ) | – | (0.00 | )(b) | (0.00 | )(b) | ||||||||||||||
|
|
|
|
|
|
|
|
|
|
|
| |||||||||||||
Total distributions | (0.19 | ) | (0.09 | ) | (0.18 | ) | (0.16 | ) | (0.18 | ) | (0.16 | ) | ||||||||||||
|
|
|
|
|
|
|
|
|
|
|
| |||||||||||||
Net increase (decrease) in net assets | (0.42 | ) | 0.13 | (0.42 | ) | 0.06 | (0.44 | ) | 0.06 | |||||||||||||||
|
|
|
|
|
|
|
|
|
|
|
| |||||||||||||
Net Asset Value, End of Period | $ | 9.71 | $ | 10.13 | $ | 9.64 | $ | 10.06 | $ | 9.62 | $ | 10.06 | ||||||||||||
|
|
|
|
| �� |
|
|
|
|
|
| |||||||||||||
Total Return(c) | (2.28 | )% | 2.23 | % | (2.40 | )% | 2.20 | % | (2.61 | )% | 2.20 | % | ||||||||||||
Ratios and Supplemental Data: | ||||||||||||||||||||||||
Net Assets, End of Period (000s) | $ | 1,501 | $ | 506 | $ | 782 | $ | 335 | $ | 795 | $ | 168 | ||||||||||||
Ratios to average net assets: | ||||||||||||||||||||||||
Expenses before waiver and payments by affiliates | 0.79 | % | 18.04 | %(d) | 3.25 | % | 30.22 | %(d) | 4.65 | % | 59.71 | %(d) | ||||||||||||
Expenses net of waiver and payments by affiliates | 0.02 | % | 0.37 | %(d) | 0.01 | % | 0.37 | %(d) | 0.02 | % | 0.37 | %(d) | ||||||||||||
Net investment income | 4.02 | % | 2.53 | %(d) | 2.97 | % | 2.32 | %(d) | 4.40 | % | 2.28 | %(d) | ||||||||||||
Portfolio turnover rate | 38 | % | 5 | %(e) | 35 | % | 5 | %(e) | 35 | % | 7 | %(e) | ||||||||||||
| (a) | Net investment income per share is calculated using the average shares method. |
| (b) | Amount is less than $0.005 per share. |
| (c) | Total return is calculated assuming a purchase of shares at net asset value on the first day and a sale at net asset value on the last day of each period reported. Distributions are assumed, for the purpose of this calculation, to be reinvested at net asset value per share on the respective payment dates of each Fund. Total return for periods of less than one year is not annualized. Results represent past performance and are not indicative of future results. |
| (d) | Annualized. |
| (e) | Not annualized. |
| * | Commencement of operations. |
See accompanying notes to the financial statements.
64
Table of Contents
State Street Institutional Investment Trust
Financial Highlights — (continued)
Selected data for a Class I Share of beneficial interest outstanding throughout each period is presented below:
| State Street Target Retirement 2055 Fund | State Street Target Retirement 2060 Fund | |||||||||||||||
| Year Ended 12/31/15 | For the Period 9/30/14* - 12/31/14 | Year Ended 12/31/15 | For the Period 9/30/14* - 12/31/14 | |||||||||||||
Per Share Operating Performance: | ||||||||||||||||
Net Asset Value, Beginning of Period | $ | 10.06 | $ | 10.00 | $ | 10.06 | $ | 10.00 | ||||||||
|
|
|
|
|
|
|
| |||||||||
Investment Operations: | ||||||||||||||||
Net investment income (loss)(a) | 0.22 | 0.06 | 0.20 | 0.06 | ||||||||||||
Net realized and unrealized gain (loss) on investments | (0.49 | ) | 0.16 | (0.46 | ) | 0.16 | ||||||||||
|
|
|
|
|
|
|
| |||||||||
Total from investment operations | (0.27 | ) | 0.22 | (0.26 | ) | 0.22 | ||||||||||
|
|
|
|
|
|
|
| |||||||||
Less Distributions From: | ||||||||||||||||
Net investment income | (0.18 | ) | (0.16 | ) | (0.19 | ) | (0.16 | ) | ||||||||
Net realized gains | (0.01 | ) | (0.00 | )(b) | (0.11 | ) | (0.00 | )(b) | ||||||||
|
|
|
|
|
|
|
| |||||||||
Total distributions | (0.19 | ) | (0.16 | ) | (0.30 | ) | (0.16 | ) | ||||||||
|
|
|
|
|
|
|
| |||||||||
Net increase (decrease) in net assets | (0.46 | ) | 0.06 | (0.56 | ) | 0.06 | ||||||||||
|
|
|
|
|
|
|
| |||||||||
Net Asset Value, End of Period | $ | 9.60 | $ | 10.06 | $ | 9.50 | $ | 10.06 | ||||||||
|
|
|
|
|
|
|
| |||||||||
Total Return(c) | (2.65 | )% | 2.20 | % | (2.53 | )% | 2.18 | % | ||||||||
Ratios and Supplemental Data: | ||||||||||||||||
Net Assets, End of Period (000s) | $ | 222 | $ | 168 | $ | 162 | $ | 168 | ||||||||
Ratios to average net assets: | ||||||||||||||||
Expenses before waiver and payments by affiliates | 7.69 | % | 59.62 | %(d) | 29.76 | % | 59.48 | %(d) | ||||||||
Expenses net of waiver and payments by affiliates | 0.02 | % | 0.37 | %(d) | 0.02 | % | 0.37 | %(d) | ||||||||
Net investment income | 2.20 | % | 2.28 | %(d) | 1.96 | % | 2.29 | %(d) | ||||||||
Portfolio turnover rate | 40 | % | 7 | %(e) | 73 | % | 7 | %(e) | ||||||||
| (a) | Net investment income per share is calculated using the average shares method. |
| (b) | Amount is less than $0.005 per share. |
| (c) | Total return is calculated assuming a purchase of shares at net asset value on the first day and a sale at net asset value on the last day of each period reported. Distributions are assumed, for the purpose of this calculation, to be reinvested at net asset value per share on the respective payment dates of each Fund. Total return for periods of less than one year is not annualized. Results represent past performance and are not indicative of future results. |
| (d) | Annualized. |
| (e) | Not annualized. |
| * | Commencement of operations. |
See accompanying notes to the financial statements.
65
Table of Contents
State Street Institutional Investment Trust
Financial Highlights — (continued)
Selected data for a Class K Share of beneficial interest outstanding throughout each period is presented below:
| State Street Target Retirement Fund | State Street Target Retirement 2015 Fund | State Street Target Retirement 2020 Fund | ||||||||||||||||||||||
| Year Ended 12/31/15 | For the Period 9/30/14* - 12/31/14 | Year Ended 12/31/15 | For the Period 9/30/14* - 12/31/14 | Year Ended 12/31/15 | For the Period 9/30/14* - 12/31/14 | |||||||||||||||||||
Per Share Operating Performance: | ||||||||||||||||||||||||
Net Asset Value, Beginning of Period | $ | 10.03 | $ | 10.00 | $ | 10.03 | $ | 10.00 | $ | 10.13 | $ | 10.00 | ||||||||||||
|
|
|
|
|
|
|
|
|
|
|
| |||||||||||||
Investment Operations: | ||||||||||||||||||||||||
Net investment income(a) | 0.20 | 0.06 | 0.22 | 0.06 | 0.23 | 0.04 | ||||||||||||||||||
Net realized and unrealized gain (loss) on investments | (0.25 | ) | 0.02 | (0.30 | ) | 0.03 | (0.39 | ) | 0.13 | |||||||||||||||
|
|
|
|
|
|
|
|
|
|
|
| |||||||||||||
Total from investment operations | (0.05 | ) | 0.08 | (0.08 | ) | 0.09 | (0.16 | ) | 0.17 | |||||||||||||||
|
|
|
|
|
|
|
|
|
|
|
| |||||||||||||
Less Distributions From: | ||||||||||||||||||||||||
Net investment income | (0.19 | ) | (0.05 | ) | (0.18 | ) | (0.06 | ) | (0.22 | ) | (0.04 | ) | ||||||||||||
Net realized gains | (0.01 | ) | (0.00 | )(b) | (0.05 | ) | (0.00 | )(b) | (0.01 | ) | (0.00 | )(b) | ||||||||||||
|
|
|
|
|
|
|
|
|
|
|
| |||||||||||||
Total distributions | (0.20 | ) | (0.05 | ) | (0.23 | ) | (0.06 | ) | (0.23 | ) | (0.04 | ) | ||||||||||||
|
|
|
|
|
|
|
|
|
|
|
| |||||||||||||
Net increase (decrease) in net assets | (0.25 | ) | 0.03 | (0.31 | ) | 0.03 | (0.39 | ) | 0.13 | |||||||||||||||
|
|
|
|
|
|
|
|
|
|
|
| |||||||||||||
Net Asset Value, End of Period | $ | 9.78 | $ | 10.03 | $ | 9.72 | $ | 10.03 | $ | 9.74 | $ | 10.13 | ||||||||||||
|
|
|
|
|
|
|
|
|
|
|
| |||||||||||||
Total Return(c) | (0.49 | )% | 0.75 | % | (0.74 | )% | 0.92 | % | (1.57 | )% | 1.67 | % | ||||||||||||
Ratios and Supplemental Data: | ||||||||||||||||||||||||
Net Assets, End of Period (000s) | $ | 22,265 | $ | 1,558 | $ | 3,707 | $ | 1,740 | $ | 52,303 | $ | 6,399 | ||||||||||||
Ratios to average net assets: | ||||||||||||||||||||||||
Expenses before waiver and payments by affiliates | 1.15 | % | 25.06 | %(d) | 5.07 | % | 18.68 | %(d) | 0.55 | % | 11.13 | %(d) | ||||||||||||
Expenses net of waiver and payments by affiliates | 0.01 | % | 0.17 | %(d) | 0.02 | % | 0.17 | %(d) | 0.01 | % | 0.17 | %(d) | ||||||||||||
Net investment income | 1.99 | % | 2.59 | %(d) | 2.19 | % | 2.50 | %(d) | 2.29 | % | 1.62 | %(d) | ||||||||||||
Portfolio turnover rate | 31 | % | 8 | %(e) | 55 | % | 39 | %(e) | 39 | % | 5 | %(e) | ||||||||||||
| (a) | Net investment income per share is calculated using the average shares method. |
| (b) | Amount is less than $0.005 per share. |
| (c) | Total return is calculated assuming a purchase of shares at net asset value on the first day and a sale at net asset value on the last day of each period reported. Distributions are assumed, for the purpose of this calculation, to be reinvested at net asset value per share on the respective payment dates of each Fund. Total return for periods of less than one year is not annualized. Results represent past performance and are not indicative of future results. |
| (d) | Annualized. |
| (e) | Not annualized. |
| * | Commencement of operations. |
See accompanying notes to the financial statements.
66
Table of Contents
State Street Institutional Investment Trust
Financial Highlights — (continued)
Selected data for a Class K Share of beneficial interest outstanding throughout each period is presented below:
| State Street Target Retirement 2025 Fund | State Street Target Retirement 2030 Fund | State Street Target Retirement 2035 Fund | ||||||||||||||||||||||
| Year Ended 12/31/15 | For the Period 9/30/14* - 12/31/14 | Year Ended 12/31/15 | For the Period 9/30/14* - 12/31/14 | Year Ended 12/31/15 | For the Period 9/30/14* - 12/31/14 | |||||||||||||||||||
Per Share Operating Performance: | ||||||||||||||||||||||||
Net Asset Value, Beginning of Period | $ | 10.16 | $ | 10.00 | $ | 10.15 | $ | 10.00 | $ | 10.17 | $ | 10.00 | ||||||||||||
|
|
|
|
|
|
|
|
|
|
|
| |||||||||||||
Investment Operations: | ||||||||||||||||||||||||
Net investment income(a) | 0.29 | 0.05 | 0.25 | 0.07 | 0.32 | 0.03 | ||||||||||||||||||
Net realized and unrealized gain (loss) on investments | (0.47 | ) | 0.15 | (0.44 | ) | 0.15 | (0.51 | ) | 0.20 | |||||||||||||||
|
|
|
|
|
|
|
|
|
|
|
| |||||||||||||
Total from investment operations | (0.18 | ) | 0.20 | (0.19 | ) | 0.22 | (0.19 | ) | 0.23 | |||||||||||||||
|
|
|
|
|
|
|
|
|
|
|
| |||||||||||||
Less Distributions From: | ||||||||||||||||||||||||
Net investment income | (0.20 | ) | (0.04 | ) | (0.20 | ) | (0.07 | ) | (0.18 | ) | (0.06 | ) | ||||||||||||
Net realized gains | (0.03 | ) | – | (0.00 | )(b) | – | (0.02 | ) | – | |||||||||||||||
|
|
|
|
|
|
|
|
|
|
|
| |||||||||||||
Total distributions | (0.23 | ) | (0.04 | ) | (0.20 | ) | (0.07 | ) | (0.20 | ) | (0.06 | ) | ||||||||||||
|
|
|
|
|
|
|
|
|
|
|
| |||||||||||||
Net increase (decrease) in net assets | (0.41 | ) | 0.16 | (0.39 | ) | 0.15 | (0.39 | ) | 0.17 | |||||||||||||||
|
|
|
|
|
|
|
|
|
|
|
| |||||||||||||
Net Asset Value, End of Period | $ | 9.75 | $ | 10.16 | $ | 9.76 | $ | 10.15 | $ | 9.78 | $ | 10.17 | ||||||||||||
|
|
|
|
|
|
|
|
|
|
|
| |||||||||||||
Total Return(c) | (1.77 | )% | 2.04 | % | (1.83 | )% | 2.23 | % | (1.90 | )% | 2.25 | % | ||||||||||||
Ratios and Supplemental Data: | ||||||||||||||||||||||||
Net Assets, End of Period (000s) | $ | 21,815 | $ | 5,597 | $ | 48,114 | $ | 3,243 | $ | 17,223 | $ | 3,208 | ||||||||||||
Ratios to average net assets: | ||||||||||||||||||||||||
Expenses before waiver and payments by affiliates | 1.31 | % | 11.75 | %(d) | 0.59 | % | 14.05 | %(d) | 1.83 | % | 17.89 | %(d) | ||||||||||||
Expenses net of waiver and payments by affiliates | 0.03 | % | 0.17 | %(d) | 0.03 | % | 0.17 | %(d) | 0.03 | % | 0.17 | %(d) | ||||||||||||
Net investment income | 2.86 | % | 2.19 | %(d) | 2.42 | % | 2.64 | %(d) | 3.12 | % | 1.28 | %(d) | ||||||||||||
Portfolio turnover rate | 51 | % | 13 | %(e) | 33 | % | 18 | %(e) | 38 | % | 7 | %(e) | ||||||||||||
| (a) | Net investment income per share is calculated using the average shares method. |
| (b) | Amount is less than $0.005 per share. |
| (c) | Total return is calculated assuming a purchase of shares at net asset value on the first day and a sale at net asset value on the last day of each period reported. Distributions are assumed, for the purpose of this calculation, to be reinvested at net asset value per share on the respective payment dates of each Fund. Total return for periods of less than one year is not annualized. Results represent past performance and are not indicative of future results. |
| (d) | Annualized. |
| (e) | Not annualized. |
| * | Commencement of operations. |
See accompanying notes to the financial statements.
67
Table of Contents
State Street Institutional Investment Trust
Financial Highlights — (continued)
Selected data for a Class K Share of beneficial interest outstanding throughout each period is presented below:
| State Street Target Retirement 2040 Fund | State Street Target Retirement 2045 Fund | State Street Target Retirement 2050 Fund | ||||||||||||||||||||||
| Year Ended 12/31/15 | For the Period 9/30/14* - 12/31/14 | Year Ended 12/31/15 | For the Period 9/30/14* - 12/31/14 | Year Ended 12/31/15 | For the Period 9/30/14* - 12/31/14 | |||||||||||||||||||
Per Share Operating Performance: | ||||||||||||||||||||||||
Net Asset Value, Beginning of Period | $ | 10.13 | $ | 10.00 | $ | 10.06 | $ | 10.00 | $ | 10.06 | $ | 10.00 | ||||||||||||
|
|
|
|
|
|
|
|
|
|
|
| |||||||||||||
Investment Operations: | ||||||||||||||||||||||||
Net investment income(a) | 0.25 | 0.05 | 0.30 | 0.06 | 0.28 | 0.06 | ||||||||||||||||||
Net realized and unrealized gain (loss) on investments | (0.47 | ) | 0.18 | (0.55 | ) | 0.17 | (0.55 | ) | 0.16 | |||||||||||||||
|
|
|
|
|
|
|
|
|
|
|
| |||||||||||||
Total from investment operations | (0.22 | ) | 0.23 | (0.25 | ) | 0.23 | (0.27 | ) | 0.22 | |||||||||||||||
|
|
|
|
|
|
|
|
|
|
|
| |||||||||||||
Less Distributions From: | ||||||||||||||||||||||||
Net investment income | (0.19 | ) | (0.10 | ) | (0.17 | ) | (0.17 | ) | (0.18 | ) | (0.16 | ) | ||||||||||||
Net realized gains | (0.00 | )(b) | – | (0.01 | ) | – | (0.00 | )(b) | (0.00 | )(b) | ||||||||||||||
|
|
|
|
|
|
|
|
|
|
|
| |||||||||||||
Total distributions | (0.19 | ) | (0.10 | ) | (0.18 | ) | (0.17 | ) | (0.18 | ) | (0.16 | ) | ||||||||||||
|
|
|
|
|
|
|
|
|
|
|
| |||||||||||||
Net increase (decrease) in net assets | (0.41 | ) | 0.13 | (0.43 | ) | 0.06 | (0.45 | ) | 0.06 | |||||||||||||||
|
|
|
|
|
|
|
|
|
|
|
| |||||||||||||
Net Asset Value, End of Period | $ | 9.72 | $ | 10.13 | $ | 9.63 | $ | 10.06 | $ | 9.61 | $ | 10.06 | ||||||||||||
|
|
|
|
|
|
|
|
|
|
|
| |||||||||||||
Total Return(c) | (2.18 | )% | 2.28 | % | (2.40 | )% | 2.25 | % | (2.71 | )% | 2.25 | % | ||||||||||||
Ratios and Supplemental Data: | ||||||||||||||||||||||||
Net Assets, End of Period (000s) | $ | 35,359 | $ | 1,512 | $ | 8,374 | $ | 335 | $ | 5,736 | $ | 168 | ||||||||||||
Ratios to average net assets: | ||||||||||||||||||||||||
Expenses before waiver and payments by affiliates | 0.79 | % | 20.53 | %(d) | 3.25 | % | 30.02 | %(d) | 4.65 | % | 59.52 | %(d) | ||||||||||||
Expenses net of waiver and payments by affiliates | 0.02 | % | 0.17 | %(d) | 0.01 | % | 0.17 | %(d) | 0.02 | % | 0.17 | %(d) | ||||||||||||
Net investment income | 2.47 | % | 1.90 | %(d) | 2.99 | % | 2.53 | %(d) | 2.82 | % | 2.48 | %(d) | ||||||||||||
Portfolio turnover rate | 38 | % | 5 | %(e) | 35 | % | 5 | %(e) | 35 | % | 7 | %(e) | ||||||||||||
| (a) | Net investment income per share is calculated using the average shares method. |
| (b) | Amount is less than $0.005 per share. |
| (c) | Total return is calculated assuming a purchase of shares at net asset value on the first day and a sale at net asset value on the last day of each period reported. Distributions are assumed, for the purpose of this calculation, to be reinvested at net asset value per share on the respective payment dates of each Fund. Total return for periods of less than one year is not annualized. Results represent past performance and are not indicative of future results. |
| (d) | Annualized. |
| (e) | Not annualized. |
| * | Commencement of operations. |
See accompanying notes to the financial statements.
68
Table of Contents
State Street Institutional Investment Trust
Financial Highlights — (continued)
Selected data for a Class K Share of beneficial interest outstanding throughout each period is presented below:
| State Street Target Retirement 2055 Fund | State Street Target Retirement 2060 Fund | |||||||||||||||
| Year Ended 12/31/15 | For the Period 9/30/14* - 12/31/14 | Year Ended 12/31/15 | For the Period 9/30/14* - 12/31/14 | |||||||||||||
Per Share Operating Performance: | ||||||||||||||||
Net Asset Value, Beginning of Period | $ | 10.06 | $ | 10.00 | $ | 10.06 | $ | 10.00 | ||||||||
|
|
|
|
|
|
|
| |||||||||
Investment Operations: | ||||||||||||||||
Net investment income(a) | 0.27 | 0.06 | 0.19 | 0.06 | ||||||||||||
Net realized and unrealized gain (loss) on investments | (0.55 | ) | 0.16 | (0.45 | ) | 0.16 | ||||||||||
|
|
|
|
|
|
|
| |||||||||
Total from investment operations | (0.28 | ) | 0.22 | (0.26 | ) | 0.22 | ||||||||||
|
|
|
|
|
|
|
| |||||||||
Less Distributions From: | ||||||||||||||||
Net investment income | (0.18 | ) | (0.16 | ) | (0.20 | ) | (0.16 | ) | ||||||||
Net realized gains | (0.01 | ) | (0.00 | )(b) | (0.11 | ) | (0.00 | )(b) | ||||||||
|
|
|
|
|
|
|
| |||||||||
Total distributions | (0.19 | ) | (0.16 | ) | (0.31 | ) | (0.16 | ) | ||||||||
|
|
|
|
|
|
|
| |||||||||
Net increase (decrease) in net assets | (0.47 | ) | 0.06 | (0.57 | ) | 0.06 | ||||||||||
|
|
|
|
|
|
|
| |||||||||
Net Asset Value, End of Period | $ | 9.59 | $ | 10.06 | $ | 9.49 | $ | 10.06 | ||||||||
|
|
|
|
|
|
|
| |||||||||
Total Return(c) | (2.75 | )% | 2.25 | % | (2.53 | )% | 2.24 | % | ||||||||
Ratios and Supplemental Data: | ||||||||||||||||
Net Assets, End of Period (000s) | $ | 3,043 | $ | 168 | $ | 269 | $ | 168 | ||||||||
Ratios to average net assets: | ||||||||||||||||
Expenses before waiver and payments by affiliates | 7.69 | % | 59.42 | %(d) | 29.76 | % | 59.28 | %(d) | ||||||||
Expenses net of waiver and payments by affiliates | 0.02 | % | 0.17 | %(d) | 0.02 | % | 0.17 | %(d) | ||||||||
Net investment income | 2.64 | % | 2.48 | %(d) | 1.88 | % | 2.49 | %(d) | ||||||||
Portfolio turnover rate | 40 | % | 7 | %(e) | 73 | % | 7 | %(e) | ||||||||
| (a) | Net investment income per share is calculated using the average shares method. |
| (b) | Amount is less than $0.005 per share. |
| (c) | Total return is calculated assuming a purchase of shares at net asset value on the first day and a sale at net asset value on the last day of each period reported. Distributions are assumed, for the purpose of this calculation, to be reinvested at net asset value per share on the respective payment dates of each Fund. Total return for periods of less than one year is not annualized. Results represent past performance and are not indicative of future results. |
| (d) | Annualized. |
| (e) | Not annualized. |
| * | Commencement of operations. |
See accompanying notes to the financial statements.
69
Table of Contents
State Street Institutional Investment Trust
December 31, 2015
| 1. | Organization |
State Street Institutional Investment Trust (the “Trust”) which is registered under the Investment Company Act of 1940, as amended (the “1940 Act”), is an open-end management investment company, and was organized as a Massachusetts business trust on February 16, 2000. The Trust consists of forty-five (45) series and corresponding classes, each of which have the same rights and privileges, including the same voting rights. The Target Retirement Funds (the “Funds” and each a “Fund”) are authorized to issue an unlimited number of shares, with no par value. Each Target Retirement Fund operates as a diversified investment company. Each Target Retirement Fund has registered Class A, Class C, Class I and Class K shares. Each Target Retirement Fund’s Class C shares were not operational at December 31, 2015. The financial statements herein relate to the following Funds:
| Fund | Classes | Commencement of Operations: | ||
State Street Target Retirement Fund | Class A Class I Class K | September 30, 2014 September 30, 2014 September 30, 2014 | ||
State Street Target Retirement 2015 Fund | Class A Class I Class K | September 30, 2014 September 30, 2014 September 30, 2014 | ||
State Street Target Retirement 2020 Fund | Class A Class I Class K | September 30, 2014 September 30, 2014 September 30, 2014 | ||
State Street Target Retirement 2025 Fund | Class A Class I Class K | September 30, 2014 September 30, 2014 September 30, 2014 | ||
State Street Target Retirement 2030 Fund | Class A Class I Class K | September 30, 2014 September 30, 2014 September 30, 2014 | ||
State Street Target Retirement 2035 Fund | Class A Class I Class K | September 30, 2014 September 30, 2014 September 30, 2014 | ||
State Street Target Retirement 2040 Fund | Class A Class I Class K | September 30, 2014 September 30, 2014 September 30, 2014 | ||
State Street Target Retirement 2045 Fund | Class A Class I Class K | September 30, 2014 September 30, 2014 September 30, 2014 | ||
State Street Target Retirement 2050 Fund | Class A Class I Class K | September 30, 2014 September 30, 2014 September 30, 2014 | ||
State Street Target Retirement 2055 Fund | Class A Class I Class K | September 30, 2014 September 30, 2014 September 30, 2014 |
70
Table of Contents
State Street Institutional Investment Trust
Notes to Financial Statements — (continued)
December 31, 2015
| Fund | Classes | Commencement of Operations: | ||
State Street Target Retirement 2060 Fund | Class A Class I Class K | September 30, 2014 September 30, 2014 September 30, 2014 |
The Target Retirement Funds retained SSGA Funds Management, Inc. (“SSGA FM” or the “Adviser”), a subsidiary of State Street Corporation and an affiliate of State Street Bank and Trust Company (“State Street”), as their investment adviser. The Adviser manages the Funds using a proprietary asset allocation strategy. Each Fund is a “fund of funds” that invests in a combination of mutual funds and exchange traded funds (“ETFs”) sponsored by the Adviser or its affiliates (“Underlying Funds”). The Underlying Funds may invest in a wide variety of asset classes, including equity and fixed-income securities of issuers anywhere in the world, including emerging markets investments, and including, among others, high yield, commodity, and real estate investments. The Underlying Funds may invest in obligations of domestic U.S. issuers, non-U.S. issuers, or both.
Class A shares are available to the general public for investment through transaction-based financial intermediaries. Class A shares impose a 4.50% sales charge (as a percentage of offering price) and may be subject to a 1% CDSC if no initial sales charge was paid at the time of purchase as part of an investment of $1,000,000 or more and the shares are redeemed within 18 months of purchase. Class I and K shares are sold without a sales charge and only to certain eligible investors.
Under the Trust’s organizational documents, its officers and trustees are indemnified against certain liabilities arising out of the performance of their duties to the Trust. Additionally, in the normal course of business, the Trust enters into contracts with service providers that contain general indemnification clauses. The Trust’s maximum exposure under these arrangements is unknown as this could involve future claims that may be made against the Trust that have not yet occurred.
| 2. | Summary of Significant Accounting Policies |
The following is a summary of significant accounting policies followed by the Trust in the preparation of its financial statements:
The preparation of financial statements in accordance with U.S. generally accepted accounting principles (“U.S. GAAP”) requires management to make estimates and assumptions that affect the reported amounts and disclosures in the financial statements. Actual results could differ from those estimates. Each Fund is an investment company under U.S. GAAP and follows the accounting and reporting guidance applicable to investment companies in Financial Accounting Standards Board (“FASB”) Accounting Standards Codification (“ASC”) 946, Financial Services Investment Companies (“ASC 946”).
Security Valuation – Each Fund’s investments are valued at fair value each day that the Fund’s listing exchange is open and, for financial reporting purposes, as of the report date should the reporting period end on a day that the Fund’s listing exchange is not open. Fair value is generally defined as the price a fund would receive to sell an asset or pay to transfer a liability in an orderly transaction between market participants at the measurement date. By its nature, a fair value price is a good faith estimate of the valuation in a current sale and may not reflect an actual market price. The investments of each Fund are valued pursuant to the policy and procedures developed by the Oversight Committee (the “Committee”)
71
Table of Contents
State Street Institutional Investment Trust
Notes to Financial Statements — (continued)
December 31, 2015
and approved by the Board of Trustees of the Trust (the “Board”). The Committee provides oversight of the valuation of investments for the Funds. The Board has responsibility for determining the fair value of investments. Valuation techniques used to value each Fund’s investments by major category are as follows:
| • | Investments in registered investment companies (including money market funds) or other unitized pooled investment vehicles that are not traded on an exchange are valued at that day’s published net asset value per share or unit. Money market funds generally value portfolio investments using the amortized cost method as set forth in Rule 2a-7 under the 1940 Act and in accordance with Fund procedures to stabilize net asset value. |
| • | Equity investments (including preferred stocks and registered investment companies that are exchange-traded funds) traded on a recognized securities exchange for which market quotations are readily available are valued at the last sale price or official closing price, as applicable, on the primary market or exchange on which they trade. Equity investments traded on a recognized exchange for which there were no sales on that day are valued at the last published sale price or at fair value. |
In the event prices or quotations are not readily available or application of these valuation methods results in a price for an investment that is deemed to be not representative of the fair value of such investment, fair value will be determined in good faith by the Committee, in accordance with the valuation policy and procedures approved by the Board.
Fair value pricing could result in a difference between the prices used to calculate the Funds’ net asset value and the prices used by the Funds’ underlying indices, which in turn could result in a difference between the Funds’ performance and the performance of the Funds’ underlying indices. Various inputs are used in determining the value of the Funds’ investments. These inputs are categorized into a hierarchy consisting of the three broad levels for financial reporting purposes.
The Funds value their assets and liabilities at fair value using a hierarchy that prioritizes the inputs to valuation techniques giving the highest priority to readily available unadjusted quoted prices in active markets for identical assets or liabilities (Level 1 measurements) and the lowest priority to unobservable inputs (Level 3 measurements) when market prices are not readily available or reliable. The categorization of a value determined for an investment within the hierarchy is based upon the pricing transparency of the investment and is not necessarily an indication of the risk associated with investing in it.
The three levels of the fair value hierarchy are as follows:
| • | Level 1 – Unadjusted quoted prices in active markets for identical assets or liabilities; |
| • | Level 2 – Inputs other than quoted prices included within Level 1 that are observable for the asset or liability either directly or indirectly, including quoted prices for similar assets or liabilities in active markets, quoted prices for identical or similar assets or liabilities in markets that are not considered to be active, inputs other than quoted prices that are observable for the asset or liability (such as exchange rates, financing terms, interest rates, yield curves, volatilities, prepayment speeds, loss severities, credit risks and default rates) or other market-corroborated inputs; and |
72
Table of Contents
State Street Institutional Investment Trust
Notes to Financial Statements — (continued)
December 31, 2015
| • | Level 3 – Unobservable inputs for the asset or liability, including the Committee’s assumptions used in determining the fair value of investments. |
Changes in valuation techniques may result in transfers in or out of an assigned level within the fair value hierarchy. Transfers between different levels of the fair value hierarchy are recognized at the end of the reporting period. The Funds had no transfers between levels for year ended December 31, 2015. Unless otherwise indicated on the Schedule of Investments, the values of the securities of the Funds are determined based on Level 1 inputs.
Investment Transactions and Income Recognition – Investment transactions are accounted for on trade date for financial reporting purposes. Dividend income and capital gain distributions, if any, are recognized daily on the ex-dividend dates. Interest income, if any, is recorded daily on an accrual basis. Realized gains and losses from the sale or disposition of investments are recorded on the identified cost method.
Expenses – Advisory fees and other expenses, which are directly identifiable to a specific Fund, are applied to that Fund within the Trust. Trustees’ fees and other expenses which cannot be attributed to a specific Fund are allocated in such a manner as deemed equitable, taking into consideration the nature and type of expense and the relative net assets of the Funds. Class specific fees are borne by each class.
Federal Income Taxes – The Funds have qualified and intend to continue to qualify for and elect treatment as “regulated investment companies” under Subchapter M of the Internal Revenue Code of 1986, as amended. By so qualifying and electing, the Funds will not be subject to federal income taxes to the extent they distribute their taxable income, including any net realized capital gains, for each fiscal year. In addition, by distributing during each calendar year substantially all of their net investment income and capital gains, if any, the Funds will not be subject to federal excise tax. Income and capital gain distributions are determined in accordance with income tax regulations which may differ from U.S. GAAP. These differences were primarily attributable to distribution redesignations.
SSGA FM has reviewed the tax positions for the open tax years as of December 31, 2015, and has determined that no provision for income tax is required in the Funds’ financial statements. The Funds’ federal tax returns for the prior fiscal year remains subject to examination by the Funds’ major tax jurisdictions, which include the United States of America and the Commonwealth of Massachusetts. The Funds recognize interest and penalties, if any, related to tax liabilities as income tax expense in the Statements of Operations. No income tax returns are currently under examination. Management has analyzed tax laws and regulations and their applications to the Funds’ facts and circumstances and does not believe there are any uncertain tax positions that require recognition of tax liability.
73
Table of Contents
State Street Institutional Investment Trust
Notes to Financial Statements — (continued)
December 31, 2015
For the year ended December 31, 2015, permanent differences identified and reclassified among the components of net assets were as follows:
| Fund | Paid-In Capital | Accumulated Gain (Loss) | Undistributed Net Investment Income (Loss) | |||||||||
State Street Target Retirement Fund | $ | – | $ | (54,200 | ) | $ | 54,200 | |||||
State Street Target Retirement 2015 Fund | – | (14,419 | ) | 14,419 | ||||||||
State Street Target Retirement 2020 Fund | – | (136,324 | ) | 136,324 | ||||||||
State Street Target Retirement 2025 Fund | – | (46,691 | ) | 46,691 | ||||||||
State Street Target Retirement 2030 Fund | – | (77,274 | ) | 77,274 | ||||||||
State Street Target Retirement 2035 Fund | – | (21,417 | ) | 21,417 | ||||||||
State Street Target Retirement 2040 Fund | – | (25,310 | ) | 25,310 | ||||||||
State Street Target Retirement 2045 Fund | – | (3,767 | ) | 3,767 | ||||||||
State Street Target Retirement 2050 Fund | – | (2,678 | ) | 2,678 | ||||||||
State Street Target Retirement 2055 Fund | – | (1,397 | ) | 1,397 | ||||||||
State Street Target Retirement 2060 Fund | – | (266 | ) | 266 | ||||||||
The tax character of distributions paid to shareholders during the year ended December 31, 2015, was as follows:
| Fund | Ordinary Income | Long-Term Capital Gain | Tax Return of Capital | Total | ||||||||||||
State Street Target Retirement Fund | $ | 448,046 | $ | 19,571 | $ | – | $ | 467,617 | ||||||||
State Street Target Retirement 2015 Fund | 119,908 | 5,226 | – | 125,134 | ||||||||||||
State Street Target Retirement 2020 Fund | 1,223,102 | 40,374 | – | 1,263,476 | ||||||||||||
State Street Target Retirement 2025 Fund | 561,814 | 23,799 | – | 585,613 | ||||||||||||
State Street Target Retirement 2030 Fund | 1,000,231 | 37,662 | – | 1,037,893 | ||||||||||||
State Street Target Retirement 2035 Fund | 365,537 | 12,163 | – | 377,700 | ||||||||||||
State Street Target Retirement 2040 Fund | 689,472 | 19,971 | – | 709,443 | ||||||||||||
State Street Target Retirement 2045 Fund | 166,683 | 5,726 | – | 172,409 | ||||||||||||
State Street Target Retirement 2050 Fund | 116,785 | 3,895 | – | 120,680 | ||||||||||||
State Street Target Retirement 2055 Fund | 64,572 | 2,532 | – | 67,104 | ||||||||||||
State Street Target Retirement 2060 Fund | 17,136 | 1,248 | – | 18,384 | ||||||||||||
74
Table of Contents
State Street Institutional Investment Trust
Notes to Financial Statements — (continued)
December 31, 2015
The tax character of distributions paid to shareholders during the period ended December 31, 2014, was as follows:
| Fund | Ordinary Income | Long-Term Capital Gain | Total | |||||||||
State Street Target Retirement Fund | $ | 10,084 | $ | – | $ | 10,084 | ||||||
State Street Target Retirement 2015 Fund | 17,214 | – | 17,214 | |||||||||
State Street Target Retirement 2020 Fund | 28,000 | 638 | 28,638 | |||||||||
State Street Target Retirement 2025 Fund | 29,599 | – | 29,599 | |||||||||
State Street Target Retirement 2030 Fund | 32,190 | – | 32,190 | |||||||||
State Street Target Retirement 2035 Fund | 18,802 | 3,487 | 22,289 | |||||||||
State Street Target Retirement 2040 Fund | 17,563 | 6,275 | 23,838 | |||||||||
State Street Target Retirement 2045 Fund | 11,761 | 4,386 | 16,147 | |||||||||
State Street Target Retirement 2050 Fund | 6,168 | 1,876 | 8,044 | |||||||||
State Street Target Retirement 2055 Fund | 6,170 | 1,875 | 8,045 | |||||||||
State Street Target Retirement 2060 Fund | 6,141 | 1,849 | 7,990 | |||||||||
At December 31, 2015, the components of distributable earnings on a tax basis were as follows:
| Fund | Undistributed Ordinary Income | Undistributed Long-Term Capital Gains | Net Unrealized Appreciation (Depreciation) | |||||||||
State Street Target Retirement Fund | $ | – | $ | 46,915 | $ | (1,060,153 | ) | |||||
State Street Target Retirement 2015 Fund | – | 16,282 | (239,060 | ) | ||||||||
State Street Target Retirement 2020 Fund | – | 221,461 | (3,671,207 | ) | ||||||||
State Street Target Retirement 2025 Fund | – | 120,072 | (1,517,159 | ) | ||||||||
State Street Target Retirement 2030 Fund | – | 259,613 | (3,588,949 | ) | ||||||||
State Street Target Retirement 2035 Fund | – | 99,884 | (1,079,763 | ) | ||||||||
State Street Target Retirement 2040 Fund | – | 201,270 | (2,752,326 | ) | ||||||||
State Street Target Retirement 2045 Fund | – | 55,883 | (616,391 | ) | ||||||||
State Street Target Retirement 2050 Fund | – | 36,682 | (436,282 | ) | ||||||||
State Street Target Retirement 2055 Fund | – | 21,327 | (243,367 | ) | ||||||||
State Street Target Retirement 2060 Fund | – | 4,021 | (46,044 | ) | ||||||||
Under current tax laws, certain capital and foreign currency losses realized after October 31 and ordinary income losses realized after December 31, may be deferred and treated as occurring on the first day of the following fiscal year. The Funds elected for federal income tax purposes to defer the following current year post October 31 and post December 31 losses, as applicable, as though the losses were incurred on the first day of the next fiscal year:
| Fund | Post October Capital Loss Defferals | |||
State Street Target Retirement Fund | $ | – | ||
State Street Target Retirement 2015 Fund | – | |||
State Street Target Retirement 2020 Fund | (83,065 | ) | ||
75
Table of Contents
State Street Institutional Investment Trust
Notes to Financial Statements — (continued)
December 31, 2015
| Fund | Post October Capital Loss Defferals | |||
State Street Target Retirement 2025 Fund | $ | (6,362 | ) | |
State Street Target Retirement 2030 Fund | – | |||
State Street Target Retirement 2035 Fund | – | |||
State Street Target Retirement 2040 Fund | – | |||
State Street Target Retirement 2045 Fund | – | |||
State Street Target Retirement 2050 Fund | – | |||
State Street Target Retirement 2055 Fund | – | |||
State Street Target Retirement 2060 Fund | – | |||
At December 31, 2015, gross unrealized appreciation and gross unrealized depreciation based on cost for federal income tax purpose were as follows:
| Fund | Tax Cost | Gross Unrealized Appreciation | Gross Unrealized (Depreciation) | Net Unrealized Appreciation (Depreciation) | ||||||||||||
State Street Target Retirement Fund | $ | 24,396,010 | $ | – | $ | (1,060,153 | ) | $ | (1,060,153 | ) | ||||||
State Street Target Retirement 2015 Fund | 5,561,316 | – | (239,060 | ) | (239,060 | ) | ||||||||||
State Street Target Retirement 2020 Fund | 57,886,999 | 1,336 | (3,672,543 | ) | (3,671,207 | ) | ||||||||||
State Street Target Retirement 2025 Fund | 26,801,849 | 554 | (1,517,713 | ) | (1,517,159 | ) | ||||||||||
State Street Target Retirement 2030 Fund | 53,943,169 | – | (3,588,949 | ) | (3,588,949 | ) | ||||||||||
State Street Target Retirement 2035 Fund | 20,234,234 | – | (1,079,763 | ) | (1,079,763 | ) | ||||||||||
State Street Target Retirement 2040 Fund | 39,766,489 | – | (2,752,326 | ) | (2,752,326 | ) | ||||||||||
State Street Target Retirement 2045 Fund | 10,111,438 | – | (616,391 | ) | (616,391 | ) | ||||||||||
State Street Target Retirement 2050 Fund | 7,143,335 | – | (436,282 | ) | (436,282 | ) | ||||||||||
State Street Target Retirement 2055 Fund | 3,687,875 | – | (243,367 | ) | (243,367 | ) | ||||||||||
State Street Target Retirement 2060 Fund | 661,775 | – | (46,044 | ) | (46,044 | ) | ||||||||||
Distributions – Dividends from net investment income, if any, are declared and paid at least annually. Net realized capital gains, if any, are distributed annually, unless additional distributions are required for compliance with applicable tax regulations. The amount and character of income and capital gain to be distributed are determined in accordance with federal tax regulations which may differ from net investment income and realized gains recognized for U.S. GAAP purposes.
| 3. | Investment Transactions |
Purchases and sales of investments (excluding short term investments) for the year ended December 31, 2015, were as follows:
| Fund | Purchases | Sales | ||||||
State Street Target Retirement Fund | $ | 28,050,400 | $ | 6,075,030 | ||||
State Street Target Retirement 2015 Fund | 4,822,345 | 2,171,451 | ||||||
State Street Target Retirement 2020 Fund | 67,950,789 | 18,109,961 | ||||||
State Street Target Retirement 2025 Fund | 28,171,500 | 8,393,337 | ||||||
76
Table of Contents
State Street Institutional Investment Trust
Notes to Financial Statements — (continued)
December 31, 2015
| Fund | Purchases | Sales | ||||||
State Street Target Retirement 2030 Fund | $ | 62,419,532 | $ | 13,085,878 | ||||
State Street Target Retirement 2035 Fund | 20,147,196 | 4,172,537 | ||||||
State Street Target Retirement 2040 Fund | 47,916,348 | 10,661,037 | ||||||
State Street Target Retirement 2045 Fund | 11,152,687 | 2,045,779 | ||||||
State Street Target Retirement 2050 Fund | 8,090,494 | 1,439,538 | ||||||
State Street Target Retirement 2055 Fund | 4,172,564 | 975,601 | ||||||
State Street Target Retirement 2060 Fund | 611,484 | 444,125 | ||||||
| 4. | Fees and Compensation paid to Affiliates and other Related Party Transactions |
The Trust, on behalf of each Fund, has entered into an Investment Advisory Agreement with SSGA FM. For its advisory services to the Funds, facilities furnished and expenses borne by the Funds, each Fund pays the Adviser a management fee accrued daily and paid quarterly at an annual rate of 0.05% of its average daily net assets.
The Adviser is contractually obligated until April 30, 2016, to waive its management fee and/or to reimburse the Funds for expenses to the extent that total annual operating expenses (inclusive of acquired fund fees and expenses, but exclusive of nonrecurring account fees, extraordinary expenses, distribution, shareholder servicing, and sub-transfer agency fees) exceed 0.17% of average daily net assets on an annual basis. This waiver and/or reimbursement may not be terminated during the relevant period except with the approval of the Board. Fees waived or expenses reimbursed by SSGA FM under this agreement are shown on the Statements of Operations.
Pursuant to the Custody Agreement between the Trust on behalf of the Funds and State Street, State Street serves as the custodian to the Funds. In compensation for custody and accounting services, each Fund pays an annual fee of $25,000 to State Street.
Effective June 1, 2015, SSGA FM serves as administrator and State Street serves as sub-administrator. For its administration services to the Funds, each Fund pays SSGA FM a fee at the annual rate of 0.05% of average daily net assets. The fees are accrued daily and paid monthly. SSGA FM pays State Street for its services as sub-administrator. Prior to June 1, 2015, each Fund paid an annual fee of $50,000 to State Street for administration services.
Boston Financial Data Services (“BFDS”), a joint venture of DST Systems, Inc. and State Street Corporation, serves as transfer agent and dividend disbursing agent for the Funds. For these services, the Funds pay annual account services fees, activity-based fees, charges related to compliance and regulatory services.
State Street Global Markets LLC (“SSGM” or the “Distributor”) serves as the distributor of the Funds. SSGM is a wholly owned subsidiary of State Street Corporation. The Funds have adopted a distribution plan pursuant to Rule 12b-1 under the 1940 Act under which a Fund may compensate the Distributor (or others) for services in connection with the distribution of the Fund’s Class A shares and for services provided to Fund shareholders in that class (the “Plan”). The Plan calls for payments at an annual rate (based on average daily net assets) of 0.25% of the Fund’s net assets attributable to its Class A shares. In addition to payments under the Plan, the Fund may reimburse SSGM or its affiliates for payments it makes to financial intermediaries that provide certain administrative, recordkeeping, and account maintenance services. The amount of the reimbursement and the manner in which it is calculated are reviewed by the Trustees periodically.
77
Table of Contents
State Street Institutional Investment Trust
Notes to Financial Statements — (continued)
December 31, 2015
The Funds may also pay a sub-transfer agent fee at an annual rate of up to 0.20% of the Fund’s average daily net assets attributable to Class A and Class I for recordkeeping, shareholder servicing, or administrative services provided by financial intermediaries.
| Transactions | with Affiliates |
The Funds invest in Underlying Funds affiliated with the Adviser. Amounts related to investments in affiliated Underlying Funds for the year January 1, 2015, through December 31, 2015, are:
State Street Target | Number of Shares Held at 12/31/14 | Value at 12/31/14 | Purchased | Sold | Number of Shares Held at 12/31/15 | Value at 12/31/15 | Dividend Income | Realized Gain (Loss) | ||||||||||||||||||||||||||||||||
| Cost | Shares | Proceeds | Shares | |||||||||||||||||||||||||||||||||||||
SPDR Russell Small Cap Completeness ETF | 890 | $ | 75,098 | $ | 724,449 | 8,303 | $ | 789,338 | 9,193 | – | $ | – | $ | 4,539 | $ | (9,163 | ) | |||||||||||||||||||||||
State Street Equity 500 Index II Portfolio | 37,233 | 392,859 | 4,674,728 | 434,348 | 1,025,680 | 96,474 | 375,107 | 3,871,104 | 78,126 | 57,728 | ||||||||||||||||||||||||||||||
State Street Small/Mid Cap Equity Index Portfolio | – | – | 867,535 | 87,884 | 88,124 | 9,288 | 78,596 | 730,947 | 4,595 | (3,743 | ) | |||||||||||||||||||||||||||||
SPDR Barclays 1-10 Year TIPS ETF | 22,381 | 426,582 | 4,800,864 | 248,477 | 948,687 | 49,641 | 221,217 | 4,242,942 | 2,716 | (13,635 | ) | |||||||||||||||||||||||||||||
SPDR Barclays High Yield Bond ETF | 4,317 | 166,679 | 1,993,915 | 51,370 | 275,178 | 7,518 | 48,169 | 1,633,411 | 89,249 | (22,722 | ) | |||||||||||||||||||||||||||||
SPDR Barclays Short Term Corporate Bond ETF | 3,128 | 95,686 | 1,042,739 | 33,964 | 195,147 | 6,396 | 30,696 | 933,159 | 12,236 | (1,163 | ) | |||||||||||||||||||||||||||||
SPDR Barclays Short Term Treasury ETF | 12,501 | 376,030 | 4,185,951 | 138,554 | 837,165 | 27,712 | 123,343 | 3,712,624 | 28,331 | 1,247 | ||||||||||||||||||||||||||||||
State Street Aggregate Bond Index Portfolio | 47,100 | 477,546 | 5,424,403 | 531,973 | 1,068,417 | 106,098 | 472,975 | 4,677,727 | 85,678 | 42,879 | ||||||||||||||||||||||||||||||
State Street Global Equity ex-U.S. Index Portfolio | 25,905 | 237,423 | 2,974,525 | 314,540 | 587,339 | 64,060 | 276,385 | 2,335,452 | 51,676 | (25,527 | ) | |||||||||||||||||||||||||||||
SPDR Dow Jones Global Real Estate ETF | 2,465 | 117,654 | 132,282 | 27,719 | 18,826 | 5,477 | 24,707 | 1,156,288 | 34,395 | (4,399 | ) | |||||||||||||||||||||||||||||
State Street Institutional Liquid Reserves Fund, Premier Class | 3,627 | 3,627 | 13,474,757 | 13,474,757 | 13,436,181 | 13,436,181 | 42,203 | 42,203 | 163 | – | ||||||||||||||||||||||||||||||
State Street Target | Number of Shares Held at 12/31/14 | Value at 12/31/14 | Purchased | Sold | Number of Shares Held at 12/31/15 | Value at 12/31/15 | Dividend Income | Realized Gain (Loss) | ||||||||||||||||||||||||||||||||
| Cost | Shares | Proceeds | Shares | |||||||||||||||||||||||||||||||||||||
SPDR Russell Small Cap Completeness ETF | 1,539 | $ | 129,861 | $ | 92,758 | 1,055 | $ | 222,917 | 2,594 | – | $ | – | $ | 1,031 | $ | 1,921 | ||||||||||||||||||||||||
State Street Equity 500 Index II Portfolio | 62,133 | 655,588 | 1,012,711 | 94,622 | 471,196 | 44,784 | 111,971 | 1,155,545 | 22,276 | 21,801 | ||||||||||||||||||||||||||||||
State Street Small/Mid Cap Equity Index Portfolio | – | – | 276,985 | 28,277 | 48,991 | 5,209 | 23,068 | 214,531 | 1,298 | (2,815 | ) | |||||||||||||||||||||||||||||
SPDR Barclays 1-10 Year TIPS ETF | 27,190 | 518,241 | 811,335 | 42,209 | 305,129 | 15,924 | 53,475 | 1,025,651 | 632 | (4,392 | ) | |||||||||||||||||||||||||||||
SPDR Barclays High Yield Bond ETF | 5,270 | 203,475 | 328,717 | 8,809 | 112,855 | 3,048 | 11,031 | 374,061 | 16,849 | (8,112 | ) | |||||||||||||||||||||||||||||
SPDR Barclays Short Term Corporate Bond ETF | 477 | 14,591 | 50,097 | 1,638 | 10,938 | 358 | 1,757 | 53,413 | 429 | (36 | ) | |||||||||||||||||||||||||||||
SPDR Barclays Short Term Treasury ETF | 1,696 | 51,016 | 191,566 | 6,331 | 43,470 | 1,437 | 6,590 | 198,359 | 927 | 211 | ||||||||||||||||||||||||||||||
State Street Aggregate Bond Index Portfolio | 71,783 | 727,820 | 1,093,577 | 108,287 | 507,895 | 50,165 | 129,905 | 1,284,764 | 19,511 | 16,656 | ||||||||||||||||||||||||||||||
State Street Global Equity ex-U.S. Index Portfolio | 47,201 | 432,604 | 728,604 | 78,500 | 338,715 | 37,424 | 88,277 | 745,943 | 15,903 | (13,651 | ) | |||||||||||||||||||||||||||||
78
Table of Contents
State Street Institutional Investment Trust
Notes to Financial Statements — (continued)
December 31, 2015
State Street Target | Number of Shares Held at 12/31/14 | Value at 12/31/14 | Purchased | Sold | Number of Shares Held at 12/31/15 | Value at 12/31/15 | Dividend Income | Realized Gain (Loss) | ||||||||||||||||||||||||||||||||
| Cost | Shares | Proceeds | Shares | |||||||||||||||||||||||||||||||||||||
SPDR Dow Jones Global Real Estate ETF | 3,009 | $ | 143,620 | $ | 235,995 | 4,966 | $ | 109,346 | 2,317 | 5,658 | $ | 264,794 | $ | 6,604 | $ | 1,592 | ||||||||||||||||||||||||
State Street Institutional Liquid Reserves Fund, Premier Class | 4,002 | 4,002 | 1,435,693 | 1,435,693 | 1,434,500 | 1,434,500 | 5,195 | 5,195 | 26 | – | ||||||||||||||||||||||||||||||
State Street Target | Number of Shares Held at 12/31/14 | Value at 12/31/14 | Purchased | Sold | Number of Shares Held at 12/31/15 | Value at 12/31/15 | Dividend Income | Realized Gain (Loss) | ||||||||||||||||||||||||||||||||
| Cost | Shares | Proceeds | Shares | |||||||||||||||||||||||||||||||||||||
SPDR Russell Small Cap Completeness ETF | 6,532 | $ | 551,170 | $ | 3,495,376 | 40,042 | $ | 3,997,513 | 46,574 | – | $ | – | $ | 22,601 | $ | (42,487 | ) | |||||||||||||||||||||||
State Street Equity 500 Index II Portfolio | 223,079 | 2,353,794 | 17,268,180 | 1,598,885 | 3,751,059 | 355,838 | 1,466,126 | 15,130,420 | 308,470 | 216,569 | ||||||||||||||||||||||||||||||
State Street Small/Mid Cap Equity Index Portfolio | – | – | 4,228,143 | 427,098 | 544,445 | 58,305 | 368,793 | 3,429,773 | 21,976 | (33,788 | ) | |||||||||||||||||||||||||||||
SPDR Barclays 1-10 Year TIPS ETF | – | – | 1,833,789 | 95,583 | 183,046 | 9,645 | 85,938 | 1,648,291 | 793 | (3,789 | ) | |||||||||||||||||||||||||||||
SPDR Barclays High Yield Bond ETF | 12,408 | 479,073 | 3,861,365 | 99,897 | 570,923 | 16,069 | 96,236 | 3,263,363 | 177,890 | (61,966 | ) | |||||||||||||||||||||||||||||
SPDR Barclays Long Term Treasury ETF | 5,229 | 381,016 | 2,976,053 | 40,577 | 1,080,798 | 15,098 | 30,708 | 2,145,875 | 55,310 | (27,636 | ) | |||||||||||||||||||||||||||||
SPDR Barclays TIPS ETF | 14,377 | 804,825 | 5,877,839 | 104,160 | 1,877,904 | 33,971 | 84,566 | 4,619,841 | 6,649 | (39,710 | ) | |||||||||||||||||||||||||||||
State Street Aggregate Bond Index Portfolio | 153,272 | 1,554,043 | 12,983,979 | 1,276,576 | 2,722,892 | 271,174 | 1,158,674 | 11,459,287 | 198,319 | 95,404 | ||||||||||||||||||||||||||||||
State Street Global Equity ex-U.S. Index Portfolio | 187,497 | 1,718,452 | 13,589,935 | 1,433,050 | 3,035,674 | 337,400 | 1,283,147 | 10,842,592 | 243,896 | (165,698 | ) | |||||||||||||||||||||||||||||
SPDR Dow Jones Global Real Estate ETF | 4,132 | 197,220 | 1,836,130 | 37,700 | 345,708 | 7,278 | 34,554 | 1,617,127 | 43,408 | (5,234 | ) | |||||||||||||||||||||||||||||
State Street Institutional Liquid Reserves Fund, Premier Class | 16,109 | 16,109 | 18,613,522 | 18,613,522 | 18,570,408 | 18,570,408 | 59,223 | 59,223 | 258 | – | ||||||||||||||||||||||||||||||
State Street Target | Number of Shares Held at 12/31/14 | Value at 12/31/14 | Purchased | Sold | Number of Shares Held at 12/31/15 | Value at 12/31/15 | Dividend Income | Realized Gain (Loss) | ||||||||||||||||||||||||||||||||
| Cost | Shares | Proceeds | Shares | |||||||||||||||||||||||||||||||||||||
SPDR Russell Small Cap Completeness ETF | 7,671 | $ | 647,279 | $ | 1,125,164 | 12,849 | $ | 1,763,221 | 20,520 | – | $ | – | $ | 8,919 | $ | (2,681 | ) | |||||||||||||||||||||||
State Street Equity 500 Index II Portfolio | 220,882 | 2,330,622 | 8,319,294 | 772,170 | 1,956,554 | 186,413 | 806,639 | 8,324,515 | 169,893 | 133,712 | ||||||||||||||||||||||||||||||
State Street Small/Mid Cap Equity Index Portfolio | – | – | 2,746,156 | 280,927 | 372,291 | 40,029 | 240,898 | 2,240,347 | 14,309 | (24,869 | ) | |||||||||||||||||||||||||||||
SPDR Barclays High Yield Bond ETF | 7,349 | 283,745 | 1,290,395 | 34,768 | 245,302 | 6,922 | 35,195 | 1,193,463 | 45,491 | (26,519 | ) | |||||||||||||||||||||||||||||
SPDR Barclays Long Term Treasury ETF | 9,304 | 677,945 | 2,607,582 | 36,445 | 968,083 | 13,519 | 32,230 | 2,252,232 | 40,296 | (9,183 | ) | |||||||||||||||||||||||||||||
SPDR Barclays TIPS ETF | 3,614 | 202,312 | 1,134,089 | 20,394 | 222,448 | 4,035 | 19,973 | 1,091,125 | 1,305 | (3,861 | ) | |||||||||||||||||||||||||||||
State Street Aggregate Bond Index Portfolio | 93,539 | 948,398 | 3,786,290 | 374,654 | 1,080,405 | 107,662 | 360,531 | 3,565,649 | 46,473 | 31,469 | ||||||||||||||||||||||||||||||
79
Table of Contents
State Street Institutional Investment Trust
Notes to Financial Statements — (continued)
December 31, 2015
State Street Target | Number of Shares Held at 12/31/14 | Value at 12/31/14 | Purchased | Sold | Number of Shares Held at 12/31/15 | Value at 12/31/15 | Dividend Income | Realized Gain (Loss) | ||||||||||||||||||||||||||||||||
| Cost | Shares | Proceeds | Shares | |||||||||||||||||||||||||||||||||||||
State Street Global Equity ex-U.S. Index Portfolio | 199,123 | $ | 1,825,003 | $ | 7,009,686 | 758,828 | $ | 1,758,630 | 196,644 | 761,307 | $ | 6,433,045 | $ | 144,746 | $ | (76,385 | ) | |||||||||||||||||||||||
SPDR Dow Jones Global Real Estate ETF | – | – | 152,842 | 3,255 | 26,403 | 566 | 2,689 | 125,845 | 1,440 | (1,149 | ) | |||||||||||||||||||||||||||||
State Street Institutional Liquid Reserves Fund, Premier Class | 13,242 | 13,242 | 6,585,638 | 6,585,638 | 6,540,411 | 6,540,411 | 58,469 | 58,469 | 123 | – | ||||||||||||||||||||||||||||||
State Street Target | Number of Shares Held at 12/31/14 | Value at 12/31/14 | Purchased | Sold | Number of Shares Held at 12/31/15 | Value at 12/31/15 | Dividend Income | Realized Gain (Loss) | ||||||||||||||||||||||||||||||||
| Cost | Shares | Proceeds | Shares | |||||||||||||||||||||||||||||||||||||
SPDR Russell Small Cap Completeness ETF | 6,143 | $ | 518,346 | $ | 4,923,988 | 56,428 | $ | 5,367,687 | 62,571 | – | $ | – | $ | 31,054 | $ | (69,714 | ) | |||||||||||||||||||||||
State Street Equity 500 Index II Portfolio | 156,596 | 1,652,311 | 19,512,939 | 1,806,452 | 2,401,255 | 228,174 | 1,734,874 | 17,903,899 | 350,497 | 266,791 | ||||||||||||||||||||||||||||||
State Street Small/Mid Cap Equity Index Portfolio | – | – | 6,441,142 | 652,247 | 522,520 | 55,965 | 596,282 | 5,545,426 | 33,861 | (29,706 | ) | |||||||||||||||||||||||||||||
SPDR Barclays High Yield Bond ETF | 1,351 | 52,162 | 1,040,669 | 27,624 | 100,927 | 2,860 | 26,115 | 885,559 | 36,244 | (12,246 | ) | |||||||||||||||||||||||||||||
SPDR Barclays Long Term Treasury ETF | 6,096 | 444,191 | 6,104,170 | 83,749 | 1,276,079 | 17,876 | 71,969 | 5,029,194 | 104,364 | (32,582 | ) | |||||||||||||||||||||||||||||
SPDR Barclays TIPS ETF | 694 | 38,850 | 677,406 | 12,083 | 66,303 | 1,206 | 11,571 | 632,124 | 784 | (1,588 | ) | |||||||||||||||||||||||||||||
State Street Aggregate Bond Index Portfolio | 50,392 | 510,932 | 6,621,745 | 651,252 | 1,117,730 | 111,221 | 590,423 | 5,839,285 | 93,847 | 49,632 | ||||||||||||||||||||||||||||||
State Street Global Equity ex-U.S. Index Portfolio | 146,572 | 1,343,361 | 17,097,474 | 1,812,869 | 2,233,378 | 248,540 | 1,710,901 | 14,457,117 | 311,428 | (126,128 | ) | |||||||||||||||||||||||||||||
State Street Institutional Liquid Reserves Fund, Premier Class | 18,347 | 18,347 | 12,664,713 | 12,664,713 | 12,621,444 | 12,621,444 | 61,616 | 61,616 | 173 | – | ||||||||||||||||||||||||||||||
State Street Target | Number of Shares Held at 12/31/14 | Value at 12/31/14 | Purchased | Sold | Number of Shares Held at 12/31/15 | Value at 12/31/15 | Dividend Income | Realized Gain (Loss) | ||||||||||||||||||||||||||||||||
| Cost | Shares | Proceeds | Shares | |||||||||||||||||||||||||||||||||||||
SPDR Russell Small Cap Completeness ETF | 6,860 | $ | 578,847 | $ | 1,068,074 | 12,207 | $ | 1,636,946 | $ | 19,067 | – | $ | – | $ | 8,161 | $ | (2,758 | ) | ||||||||||||||||||||||
State Street Equity 500 Index II Portfolio | 148,828 | 1,570,347 | 6,865,371 | 637,954 | 1,013,794 | 96,379 | 690,403 | 7,124,961 | 130,118 | 114,801 | ||||||||||||||||||||||||||||||
State Street Small/Mid Cap Equity Index Portfolio | – | – | 2,798,430 | 286,544 | 114,209 | 12,112 | 274,432 | 2,552,213 | 14,528 | (3,734 | ) | |||||||||||||||||||||||||||||
SPDR Barclays Long Term Treasury ETF | 5,668 | 413,004 | 1,939,512 | 27,116 | 406,230 | 5,642 | 27,142 | 1,896,683 | 27,726 | 6,704 | ||||||||||||||||||||||||||||||
State Street Aggregate Bond Index Portfolio | 29,433 | 298,421 | 1,517,535 | 150,219 | 235,214 | 23,217 | 156,435 | 1,547,145 | 16,265 | 16,578 | ||||||||||||||||||||||||||||||
State Street Global Equity ex-U.S. Index Portfolio | 145,607 | 1,334,522 | 5,958,274 | 647,912 | 766,145 | 82,939 | 710,580 | 6,004,397 | 120,644 | (19,375 | ) | |||||||||||||||||||||||||||||
State Street Institutional Liquid Reserves Fund, Premier Class | 15,127 | 15,127 | 3,013,174 | 3,013,174 | 2,999,229 | 2,999,229 | 29,072 | 29,072 | 37 | – | ||||||||||||||||||||||||||||||
80
Table of Contents
State Street Institutional Investment Trust
Notes to Financial Statements — (continued)
December 31, 2015
State Street Target | Number of Shares Held at 12/31/14 | Value at 12/31/14 | Purchased | Sold | Number of Shares Held at 12/31/15 | Value at 12/31/15 | Dividend Income | Realized Gain (Loss) | ||||||||||||||||||||||||||||||||
| Cost | Shares | Proceeds | Shares | |||||||||||||||||||||||||||||||||||||
SPDR Russell Small Cap Completeness ETF | 4,762 | $ | 401,818 | $ | 4,940,403 | 56,626 | $ | 5,268,172 | $ | 61,388 | – | $ | – | $ | 30,721 | $ | (67,880 | ) | ||||||||||||||||||||||
State Street Equity 500 Index II Portfolio | 90,269 | 952,462 | 15,603,765 | 1,444,887 | 1,850,428 | 175,077 | 1,360,079 | 14,036,017 | 271,551 | 211,961 | ||||||||||||||||||||||||||||||
State Street Small/Mid Cap Equity Index Portfolio | – | – | 6,720,587 | 681,615 | 558,694 | 59,602 | 622,013 | 5,784,718 | 34,944 | (29,663 | ) | |||||||||||||||||||||||||||||
SPDR Barclays Long Term Treasury ETF | 3,349 | 244,028 | 4,620,046 | 63,462 | 994,704 | 13,948 | 52,863 | 3,694,067 | 73,824 | (29,439 | ) | |||||||||||||||||||||||||||||
State Street Aggregate Bond Index Portfolio | 5,009 | 50,785 | 1,257,470 | 124,161 | 157,683 | 15,774 | 113,396 | 1,121,488 | 14,344 | 8,178 | ||||||||||||||||||||||||||||||
State Street Global Equity ex-U.S. Index Portfolio | 92,313 | 846,072 | 14,774,078 | 1,571,283 | 1,831,356 | 202,533 | 1,461,063 | 12,345,985 | 263,025 | (107,873 | ) | |||||||||||||||||||||||||||||
State Street Institutional Liquid Reserves Fund, Premier Class | 17,599 | 17,599 | 10,111,156 | 10,111,156 | 10,096,867 | 10,096,867 | 31,888 | 31,888 | 129 | – | ||||||||||||||||||||||||||||||
State Street Target | Number of Shares Held at 12/31/14 | Value at 12/31/14 | Purchased | Sold | Number of Shares Held at 12/31/15 | Value at 12/31/15 | Dividend Income | Realized Gain (Loss) | ||||||||||||||||||||||||||||||||
| Cost | Shares | Proceeds | Shares | |||||||||||||||||||||||||||||||||||||
SPDR Russell Small Cap Completeness ETF | 2,038 | $ | 171,966 | $ | 946,820 | 10,833 | $ | 1,104,421 | 12,871 | – | $ | – | $ | 5,963 | $ | (10,909 | ) | |||||||||||||||||||||||
State Street Equity 500 Index II Portfolio | 35,570 | 375,313 | 3,827,421 | 355,567 | 407,365 | 38,545 | 352,592 | 3,638,753 | 66,862 | 65,554 | ||||||||||||||||||||||||||||||
State Street Small/Mid Cap Equity Index Portfolio | – | – | 1,769,283 | 180,700 | 55,884 | 5,888 | 174,812 | 1,625,748 | 9,253 | (973 | ) | |||||||||||||||||||||||||||||
SPDR Barclays Long Term Treasury ETF | 1,348 | 98,223 | 1,027,039 | 14,229 | 163,823 | 2,286 | 13,291 | 928,775 | 14,961 | 2,461 | ||||||||||||||||||||||||||||||
State Street Global Equity ex-U.S. Index Portfolio | 37,092 | 339,958 | 3,582,124 | 385,967 | 314,286 | 34,045 | 389,014 | 3,287,166 | 66,321 | (14,597 | ) | |||||||||||||||||||||||||||||
State Street Institutional Liquid Reserves Fund, Premier Class | 11,094 | 11,094 | 2,074,796 | 2,074,796 | 2,071,285 | 2,071,285 | 14,605 | 14,605 | 26 | – | ||||||||||||||||||||||||||||||
State Street Target | Number of Shares Held at 12/31/14 | Value at 12/31/14 | Purchased | Sold | Number of Shares Held at 12/31/15 | Value at 12/31/15 | Dividend Income | Realized Gain (Loss) | ||||||||||||||||||||||||||||||||
| Cost | Shares | Proceeds | Shares | |||||||||||||||||||||||||||||||||||||
SPDR Russell Small Cap Completeness ETF | 995 | $ | 83,958 | $ | 746,904 | 8,549 | $ | 818,955 | 9,544 | – | $ | – | $ | 4,314 | $ | (10,320 | ) | |||||||||||||||||||||||
State Street Equity 500 Index II Portfolio | 17,491 | 184,559 | 2,772,571 | 257,747 | 275,963 | 26,085 | 249,153 | 2,571,264 | 47,718 | 42,306 | ||||||||||||||||||||||||||||||
State Street Small/Mid Cap Equity Index Portfolio | – | – | 1,225,107 | 125,141 | 15,408 | 1,615 | 123,526 | 1,148,791 | 6,616 | 704 | ||||||||||||||||||||||||||||||
SPDR Barclays Long Term Treasury ETF | 666 | 48,529 | 742,759 | 10,269 | 112,236 | 1,561 | 9,374 | 655,055 | 10,723 | 128 | ||||||||||||||||||||||||||||||
State Street Global Equity ex-U.S. Index Portfolio | 18,240 | 167,174 | 2,603,153 | 279,654 | 216,976 | 23,002 | 274,892 | 2,322,840 | 47,304 | (4,875 | ) | |||||||||||||||||||||||||||||
State Street Institutional Liquid Reserves Fund, Premier Class | 5,420 | 5,420 | 1,594,855 | 1,594,855 | 1,591,172 | 1,591,172 | 9,103 | 9,103 | 23 | – | ||||||||||||||||||||||||||||||
81
Table of Contents
State Street Institutional Investment Trust
Notes to Financial Statements — (continued)
December 31, 2015
State Street Target | Number of Shares Held at 12/31/14 | Value at 12/31/14 | Purchased | Sold | Number of Shares Held at 12/31/15 | Value at 12/31/15 | Dividend Income | Realized Gain (Loss) | ||||||||||||||||||||||||||||||||
| Cost | Shares | Proceeds | Shares | |||||||||||||||||||||||||||||||||||||
SPDR Russell Small Cap Completeness ETF | 995 | $ | 83,958 | $ | 423,496 | 4,849 | $ | 501,280 | 5,844 | – | $ | – | $ | 2,606 | $ | (4,587 | ) | |||||||||||||||||||||||
State Street Equity 500 Index II Portfolio | 17,491 | 184,559 | 1,393,618 | 129,532 | 200,834 | 18,917 | 128,106 | 1,322,051 | 24,664 | 26,519 | ||||||||||||||||||||||||||||||
State Street Small/Mid Cap Equity Index Portfolio | – | – | 648,220 | 65,815 | 22,150 | 2,302 | 63,513 | 590,671 | 3,414 | (127 | ) | |||||||||||||||||||||||||||||
SPDR Barclays Long Term Treasury ETF | 666 | 48,529 | 381,291 | 5,260 | 81,375 | 1,131 | 4,795 | 335,075 | 6,291 | 1,331 | ||||||||||||||||||||||||||||||
State Street Global Equity ex-U.S. Index Portfolio | 18,240 | 167,174 | 1,325,940 | 141,365 | 169,962 | 18,267 | 141,338 | 1,194,305 | 24,490 | (6,053 | ) | |||||||||||||||||||||||||||||
State Street Institutional Liquid Reserves Fund, Premier Class | 5,420 | 5,420 | 942,596 | 942,596 | 945,610 | 945,610 | 2,406 | 2,406 | 11 | – | ||||||||||||||||||||||||||||||
State Street Target | Number of Shares Held at 12/31/14 | Value at 12/31/14 | Purchased | Sold | Number of Shares Held at 12/31/15 | Value at 12/31/15 | Dividend Income | Realized Gain (Loss) | ||||||||||||||||||||||||||||||||
| Cost | Shares | Proceeds | Shares | |||||||||||||||||||||||||||||||||||||
SPDR Russell Small Cap Completeness ETF | 996 | $ | 84,042 | $ | 62,943 | 721 | $ | 147,517 | 1,717 | – | $ | – | $ | 708 | $ | 2,139 | ||||||||||||||||||||||||
State Street Equity 500 Index II Portfolio | 17,526 | 184,927 | 179,270 | 16,748 | 120,036 | 11,517 | 22,757 | 234,850 | 4,449 | 6,024 | ||||||||||||||||||||||||||||||
State Street Small/Mid Cap Equity Index Portfolio | – | – | 132,282 | 13,359 | 18,826 | 2,078 | 11,281 | 104,915 | 627 | (1,819 | ) | |||||||||||||||||||||||||||||
SPDR Barclays Long Term Treasury ETF | 667 | 48,602 | 63,009 | 877 | 50,529 | 701 | 843 | 58,909 | 1,489 | 2,584 | ||||||||||||||||||||||||||||||
State Street Global Equity ex-U.S. Index Portfolio | 18,275 | 167,497 | 173,981 | 18,674 | 107,218 | 11,846 | 25,103 | 212,124 | 4,495 | (7,211 | ) | |||||||||||||||||||||||||||||
State Street Institutional Liquid Reserves Fund, Premier Class | 5,435 | 5,435 | 313,236 | 313,236 | 313,738 | 313,738 | 4,933 | 4,933 | – | – | ||||||||||||||||||||||||||||||
| 5. | Trustees’ Fees |
Independent Trustees are compensated on a calendar year basis. Any Trustee who is deemed to be an “interested person” (as defined in the 1940 Act) of the Funds does not receive compensation from the Funds for his or her service as a Trustee.
Each Independent Trustee receives for his or her services to the Trust, State Street Master Funds and SSGA Funds, a $141,500 annual base retainer in addition to $18,000 for each in-person meeting and $2,000 for each telephonic meeting from the Trust. The Co-Chairmen each receive an additional $44,000 annual retainer. The Independent Trustees are reimbursed for travel and other out-of pocket expenses in connection with meeting attendance. Trustees’ fees and expenses are allocated among the Trusts and Funds overseen by the Trustees in a manner deemed equitable taking into consideration the relative net assets of the Funds, subject to a $15,000 minimum per Fund. As of the date these financial statements, the Trustees were not paid pension or retirement benefits as part of the Trust’s expenses.
The Trust’s officers are compensated by the Adviser and its affiliates.
| 6. | Beneficial Interest |
The Funds do not invest in the Underlying Funds for the purpose of exercising management or control; however, investments within the set limits may represent 5% or more of an Underlying Fund’s
82
Table of Contents
State Street Institutional Investment Trust
Notes to Financial Statements — (continued)
December 31, 2015
outstanding shares. At December 31, 2015, State Street Target Retirement Fund, State Street Target Retirement 2015 Fund, State Street Target Retirement 2020 Fund, State Street Target Retirement 2025 Fund, State Street Target Retirement 2030 Fund, State Street Target Retirement 2035 Fund, State Street Target Retirement 2040 Fund and State Street Target Retirement 2045 Fund held 5% or greater of an Underlying Fund’s outstanding shares.
| 7. | Concentration of Ownership |
From time to time, the Funds may have a concentration of one or more accounts constituting a significant percentage of shares outstanding. Investment activities by holders of such accounts could have material impacts on the Funds. As of December 31, 2015, based on management’s evaluation of the shareholder account base, the Funds had accounts representing controlling ownership of more than 10% of a Fund’s total outstanding shares. The number of such accounts, based on accounts that represent more than 10% of an individual class of shares, and the aggregate percentage of net assets represented by such holdings were as follows:
| Fund | Number of 10% Affiliated Account Holders | Percentage of Affiliated Ownership | ||||||
State Street Target Retirement Fund 2015 | 1 | 32 | % | |||||
State Street Target Retirement Fund 2045 | 1 | 10 | % | |||||
State Street Target Retirement Fund 2055 | 1 | 14 | % | |||||
State Street Target Retirement Fund 2060 | 1 | 81 | % | |||||
| 8. | Line of Credit |
Effective October 15, 2015, certain Funds and other affiliated funds (each a “Participant” and, collectively, the “Participants”) share in a $360 million revolving credit facility provided by a syndication of banks. The Participants may borrow for the purpose of meeting shareholder redemption requests that otherwise might require the untimely disposition of securities. The Participants are charged an annual commitment fee which is calculated based on the unused portion of the shared credit line. Commitment fees are allocated among each of the Participants based on relative net assets. Commitment fees are ordinary fund operating expenses and are paid by the Adviser. A Participant incurs and pays the interest expense related to its borrowing. Interest is calculated at a rate per annum equal to the sum of the New York Fed Bank Rate plus 1%. A Participant may borrow up to a maximum of 33 percent of its assets or a lower amount as may be set forth in the Fund’s prospectus.
The Funds had no outstanding loans during the year ended December 31, 2015.
| 9. | Subsequent Events |
Management has evaluated the impact of all subsequent events on the Funds through the date the financial statements were available to be issued and has determined that there were no subsequent events requiring adjustment or disclosure in the financial statements.
83
Table of Contents
Report of Independent Registered Public Accounting Firm
To the Board of Trustees and Shareholders of State Street Institutional Investment Trust:
We have audited the accompanying statements of assets and liabilities, including the schedules of investments, of State Street Target Retirement Fund, State Street Target Retirement 2015 Fund, State Street Target Retirement 2020 Fund, State Street Target Retirement 2025 Fund, State Street Target Retirement 2030 Fund, State Street Target Retirement 2035 Fund, State Street Target Retirement 2040 Fund, State Street Target Retirement 2045 Fund, State Street Target Retirement 2050 Fund, State Street Target Retirement 2055 Fund and State Street Target Retirement 2060 Fund (eleven of the funds constituting State Street Institutional Investment Trust) (the “Funds”) as of December 31, 2015, and the related statements of operations for the year then ended and the statements of changes in net assets and the financial highlights for the periods indicated therein. These financial statements and financial highlights are the responsibility of the Funds’ management. Our responsibility is to express an opinion on these financial statements and financial highlights based on our audits.
We conducted our audits in accordance with the standards of the Public Company Accounting Oversight Board (United States). Those standards require that we plan and perform the audit to obtain reasonable assurance about whether the financial statements and financial highlights are free of material misstatement. We were not engaged to perform an audit of the Funds’ internal control over financial reporting. Our audits included consideration of internal control over financial reporting as a basis for designing audit procedures that are appropriate in the circumstances, but not for the purpose of expressing an opinion on the effectiveness of the Funds’ internal control over financial reporting. Accordingly, we express no such opinion. An audit also includes examining, on a test basis, evidence supporting the amounts and disclosures in the financial statements and financial highlights, assessing the accounting principles used and significant estimates made by management, and evaluating the overall financial statement presentation. Our procedures included confirmation of securities owned as of December 31, 2015, by correspondence with the custodian and others or by other appropriate auditing procedures where replies from others were not received. We believe that our audits provide a reasonable basis for our opinion.
In our opinion, the financial statements and financial highlights referred to above present fairly, in all material respects, the financial position of State Street Target Retirement Fund, State Street Target Retirement 2015 Fund, State Street Target Retirement 2020 Fund, State Street Target Retirement 2025 Fund, State Street Target Retirement 2030 Fund, State Street Target Retirement 2035 Fund, State Street Target Retirement 2040 Fund, State Street Target Retirement 2045 Fund, State Street Target Retirement 2050 Fund, State Street Target Retirement 2055 Fund and State Street Target Retirement 2060 Fund (eleven of the funds constituting State Street Institutional Investment Trust) at December 31, 2015, the results of their operations for the year then ended and the changes in their net assets and the financial highlights for the periods indicated therein, in conformity with U.S. generally accepted accounting principles.

Boston, Massachusetts
February 26, 2016
84
Table of Contents
State Street Institutional Investment Trust
December 31, 2015 (Unaudited)
Shareholder Expense Example
As a shareholder of a Fund, you incur (1) transaction costs, including sales charges (loads) on purchase payments, reinvested dividends, or other distributions and (2) ongoing costs, including management fees and to the extent applicable, distribution (12b-1) or service fees, among others. This example is intended to help you understand your ongoing costs (in dollars) of investing in the Fund and to compare these costs with the ongoing costs of investing in other mutual funds. It is based on an investment of $1,000 made at the beginning of the period shown and held for the entire period from July 1, 2015 to December 31, 2015.
The table below illustrates your Fund’s costs in two ways:
| • | Actual Expenses – This section helps you to estimate the actual expenses that you paid over the period. The “Ending Account Value” shown is derived from each Fund’s actual return, and the third column shows the dollar amount that would have been paid by an investor who started with $1,000 in the Fund. You may use the information here, together with the amount you invested, to estimate the expenses that you paid over the period. To do so, simply divide your account value by $1,000 (for example, an $8,600 account value divided by $1,000 = 8.6), then multiply the result by the number given for the Fund under the heading “Expenses Paid During Period”. |
| • | Hypothetical Example for Comparison Purposes – This section is intended to help you compare your Fund’s costs with those of other mutual funds. It assumes that the Fund had a yearly return of 5% before expenses, but that the expense ratio is unchanged. In this case, because the return used is not the Fund’s actual return, the results do not apply to your investment. The example is useful in making comparisons because the Securities and Exchange Commission requires all mutual funds to calculate expenses based on a 5% return. You can assess your Fund’s costs by comparing this hypothetical example with the hypothetical examples that appear in shareholder reports of other funds. |
Please note that the expenses shown in the table are meant to highlight your ongoing costs only and do not reflect any transaction costs, such as sales charges (loads). Therefore, the hypothetical 5% return section of the table is useful in comparing ongoing costs only, and will not help you determine the relative total costs of owning different funds. In addition, if these transaction costs were included, your costs would have been higher.
85
Table of Contents
State Street Institutional Investment Trust
Other Information — (continued)
December 31, 2015 (Unaudited)
| Annualized Expense Ratio | Beginning Account Value July 1, 2015 | Ending Account Value December 31, 2015 | Expenses Paid During the Period* | |||||||||||||
State Street Target Retirement Fund | ||||||||||||||||
Class A | 0.26 | % | ||||||||||||||
Actual | $ | 1,000.00 | $ | 984.80 | $ | 1.30 | ||||||||||
Hypothetical** | $ | 1,000.00 | $ | 1,023.89 | $ | 1.33 | ||||||||||
Class I | 0.01 | % | ||||||||||||||
Actual | $ | 1,000.00 | $ | 985.30 | $ | 0.05 | ||||||||||
Hypothetical** | $ | 1,000.00 | $ | 1,025.16 | $ | 0.05 | ||||||||||
Class K | 0.01 | % | ||||||||||||||
Actual | $ | 1,000.00 | $ | 984.3 | $ | 0.05 | ||||||||||
Hypothetical** | $ | 1,000.00 | $ | 1,025.16 | $ | 0.05 | ||||||||||
State Street Target Retirement 2015 Fund | �� | |||||||||||||||
Class A | 0.27 | % | ||||||||||||||
Actual | $ | 1,000.00 | $ | 978.30 | $ | 1.35 | ||||||||||
Hypothetical** | $ | 1,000.00 | $ | 1,023.84 | $ | 1.38 | ||||||||||
Class I | 0.02 | % | ||||||||||||||
Actual | $ | 1,000.00 | $ | 979.80 | $ | 0.10 | ||||||||||
Hypothetical** | $ | 1,000.00 | $ | 1,025.10 | $ | 0.10 | ||||||||||
Class K | 0.02 | % | ||||||||||||||
Actual | $ | 1,000.00 | $ | 979.90 | $ | 0.10 | ||||||||||
Hypothetical** | $ | 1,000.00 | $ | 1,025.10 | $ | 0.10 | ||||||||||
State Street Target Retirement 2020 Fund | ||||||||||||||||
Class A | 0.26 | % | ||||||||||||||
Actual | $ | 1,000.00 | $ | 972.40 | $ | 1.29 | ||||||||||
Hypothetical** | $ | 1,000.00 | $ | 1,023.89 | $ | 1.33 | ||||||||||
Class I | 0.01 | % | ||||||||||||||
Actual | $ | 1,000.00 | $ | 972.90 | $ | 0.05 | ||||||||||
Hypothetical** | $ | 1,000.00 | $ | 1,025.16 | $ | 0.05 | ||||||||||
Class K | 0.01 | % | ||||||||||||||
Actual | $ | 1,000.00 | $ | 972.80 | $ | 0.05 | ||||||||||
Hypothetical** | $ | 1,000.00 | $ | 1,025.16 | $ | 0.05 | ||||||||||
86
Table of Contents
State Street Institutional Investment Trust
Other Information — (continued)
December 31, 2015 (Unaudited)
| Annualized Expense Ratio | Beginning Account Value July 1, 2015 | Ending Account Value December 31, 2015 | Expenses Paid During the Period* | |||||||||||||
State Street Target Retirement 2025 Fund | ||||||||||||||||
Class A | 0.28 | % | ||||||||||||||
Actual | $ | 1,000.00 | $ | 966.50 | $ | 1.39 | ||||||||||
Hypothetical** | $ | 1,000.00 | $ | 1,023.79 | $ | 1.43 | ||||||||||
Class I | 0.03 | % | ||||||||||||||
Actual | $ | 1,000.00 | $ | 968.00 | $ | 0.15 | ||||||||||
Hypothetical** | $ | 1,000.00 | $ | 1,025.05 | $ | 0.15 | ||||||||||
Class K | 0.03 | % | ||||||||||||||
Actual | $ | 1,000.00 | $ | 969.00 | $ | 0.15 | ||||||||||
Hypothetical** | $ | 1,000.00 | $ | 1,025.05 | $ | 0.15 | ||||||||||
State Street Target Retirement 2030 Fund | ||||||||||||||||
Class A | 0.28 | % | ||||||||||||||
Actual | $ | 1,000.00 | $ | 965.90 | $ | 1.39 | ||||||||||
Hypothetical** | $ | 1,000.00 | $ | 1,023.79 | $ | 1.43 | ||||||||||
Class I | 0.03 | % | ||||||||||||||
Actual | $ | 1,000.00 | $ | 966.50 | $ | 0.15 | ||||||||||
Hypothetical** | $ | 1,000.00 | $ | 1,025.05 | $ | 0.15 | ||||||||||
Class K | 0.03 | % | ||||||||||||||
Actual | $ | 1,000.00 | $ | 966.50 | $ | 0.15 | ||||||||||
Hypothetical** | $ | 1,000.00 | $ | 1,025.05 | $ | 0.15 | ||||||||||
State Street Target Retirement 2035 Fund | ||||||||||||||||
Class A | 0.28 | % | ||||||||||||||
Actual | $ | 1,000.00 | $ | 962.40 | $ | 1.38 | ||||||||||
Hypothetical** | $ | 1,000.00 | $ | 1,023.79 | $ | 1.43 | ||||||||||
Class I | 0.03 | % | ||||||||||||||
Actual | $ | 1,000.00 | $ | 962.90 | $ | 0.15 | ||||||||||
Hypothetical** | $ | 1,000.00 | $ | 1,025.05 | $ | 0.15 | ||||||||||
Class K | 0.03 | % | ||||||||||||||
Actual | $ | 1,000.00 | $ | 963.90 | $ | 0.15 | ||||||||||
Hypothetical** | $ | 1,000.00 | $ | 1,025.05 | $ | 0.15 | ||||||||||
87
Table of Contents
State Street Institutional Investment Trust
Other Information — (continued)
December 31, 2015 (Unaudited)
| Annualized Expense Ratio | Beginning Account Value July 1, 2015 | Ending Account Value December 31, 2015 | Expenses Paid During the Period* | |||||||||||||
State Street Target Retirement 2040 Fund | ||||||||||||||||
Class A | 0.27 | % | ||||||||||||||
Actual | $ | 1,000.00 | $ | 957.70 | $ | 1.33 | ||||||||||
Hypothetical** | $ | 1,000.00 | $ | 1,023.84 | $ | 1.38 | ||||||||||
Class I | 0.02 | % | ||||||||||||||
Actual | $ | 1,000.00 | $ | 959.20 | $ | 0.10 | ||||||||||
Hypothetical** | $ | 1,000.00 | $ | 1,025.10 | $ | 0.10 | ||||||||||
Class K | 0.02 | % | ||||||||||||||
Actual | $ | 1,000.00 | $ | 959.20 | $ | 0.10 | ||||||||||
Hypothetical** | $ | 1,000.00 | $ | 1,025.10 | $ | 0.10 | ||||||||||
State Street Target Retirement 2045 Fund | ||||||||||||||||
Class A | 0.26 | % | ||||||||||||||
Actual | $ | 1,000.00 | $ | 956.50 | $ | 1.28 | ||||||||||
Hypothetical** | $ | 1,000.00 | $ | 1,023.89 | $ | 1.33 | ||||||||||
Class I | 0.01 | % | ||||||||||||||
Actual | $ | 1,000.00 | $ | 957.00 | $ | 0.05 | ||||||||||
Hypothetical** | $ | 1,000.00 | $ | 1,025.16 | $ | 0.05 | ||||||||||
Class K | 0.01 | % | ||||||||||||||
Actual | $ | 1,000.00 | $ | 958.00 | $ | 0.05 | ||||||||||
Hypothetical** | $ | 1,000.00 | $ | 1,025.16 | $ | 0.05 | ||||||||||
State Street Target Retirement 2050 Fund | ||||||||||||||||
Class A | 0.27 | % | ||||||||||||||
Actual | $ | 1,000.00 | $ | 956.20 | $ | 1.33 | ||||||||||
Hypothetical** | $ | 1,000.00 | $ | 1,023.84 | $ | 1.38 | ||||||||||
Class I | 0.02 | % | ||||||||||||||
Actual | $ | 1,000.00 | $ | 957.70 | $ | 0.10 | ||||||||||
Hypothetical** | $ | 1,000.00 | $ | 1,025.10 | $ | 0.10 | ||||||||||
Class K | 0.02 | % | ||||||||||||||
Actual | $ | 1,000.00 | $ | 956.70 | $ | 0.10 | ||||||||||
Hypothetical** | $ | 1,000.00 | $ | 1,025.10 | $ | 0.10 | ||||||||||
88
Table of Contents
State Street Institutional Investment Trust
Other Information — (continued)
December 31, 2015 (Unaudited)
| Annualized Expense Ratio | Beginning Account Value July 1, 2015 | Ending Account Value December 31, 2015 | Expenses Paid During the Period* | |||||||||||||
State Street Target Retirement 2055 Fund | ||||||||||||||||
Class A | 0.27 | % | ||||||||||||||
Actual | $ | 1,000.00 | $ | 955.80 | $ | 1.33 | ||||||||||
Hypothetical** | $ | 1,000.00 | $ | 1,023.84 | $ | 1.38 | ||||||||||
Class I | 0.02 | % | ||||||||||||||
Actual | $ | 1,000.00 | $ | 957.30 | $ | 0.10 | ||||||||||
Hypothetical** | $ | 1,000.00 | $ | 1,025.10 | $ | 0.10 | ||||||||||
Class K | 0.02 | % | ||||||||||||||
Actual | $ | 1,000.00 | $ | 956.30 | $ | 0.10 | ||||||||||
Hypothetical** | $ | 1,000.00 | $ | 1,025.10 | $ | 0.10 | ||||||||||
State Street Target Retirement 2060 Fund | ||||||||||||||||
Class A | 0.27 | % | ||||||||||||||
Actual | $ | 1,000.00 | $ | 957.00 | $ | 1.33 | ||||||||||
Hypothetical** | $ | 1,000.00 | $ | 1,023.84 | $ | 1.38 | ||||||||||
Class I | 0.02 | % | ||||||||||||||
Actual | $ | 1,000.00 | $ | 958.50 | $ | 0.10 | ||||||||||
Hypothetical** | $ | 1,000.00 | $ | 1,025.10 | $ | 0.10 | ||||||||||
Class K | 0.02 | % | ||||||||||||||
Actual | $ | 1,000.00 | $ | 958.50 | $ | 0.10 | ||||||||||
Hypothetical** | $ | 1,000.00 | $ | 1,025.10 | $ | 0.10 | ||||||||||
| * | Expenses are equal to the Fund’s annualized expense ratio (representing the six month period annualized), multiplied by the average account value over the period, multiplied by 184/365 (to reflect the one-half year period). Includes amounts waived, reimbursed and/or other credits. Without the waiver, reimbursement and/or other credits, expenses would have been higher. |
| ** | 5% return per year before expenses |
89
Table of Contents
State Street Institutional Investment Trust
Other Information — (continued)
December 31, 2015 (Unaudited)
Tax Information
For federal tax income tax purposes, the following information is furnished with respect to the distributions from the Funds for the fiscal year ended December 31, 2015.
Percentage of distributions which qualify for the corporate dividends received deduction:
| Percentage | ||||
State Street Target Retirement Fund | 17.40 | % | ||
State Street Target Retirement 2015 Fund | 18.18 | % | ||
State Street Target Retirement 2020 Fund | 25.03 | % | ||
State Street Target Retirement 2025 Fund | 30.09 | % | ||
State Street Target Retirement 2030 Fund | 35.43 | % | ||
State Street Target Retirement 2035 Fund | 36.08 | % | ||
State Street Target Retirement 2040 Fund | 40.53 | % | ||
State Street Target Retirement 2045 Fund | 41.10 | % | ||
State Street Target Retirement 2050 Fund | 40.93 | % | ||
State Street Target Retirement 2055 Fund | 39.13 | % | ||
State Street Target Retirement 2060 Fund | 27.11 | % | ||
Qualified Dividend Income
A portion of dividends distributed by the Funds during the fiscal year ended December 31, 2015, are considered qualified dividend income, and are eligible for reduced tax rates. These lower rates range from 5% to 20% depending on the individual’s tax bracket. These amounts are noted below:
| Amount | ||||
State Street Target Retirement Fund | $ | 131,628 | ||
State Street Target Retirement 2015 Fund | 37,940 | |||
State Street Target Retirement 2020 Fund | 544,777 | |||
State Street Target Retirement 2025 Fund | 305,440 | |||
State Street Target Retirement 2030 Fund | 649,177 | |||
State Street Target Retirement 2035 Fund | 245,231 | |||
State Street Target Retirement 2040 Fund | 530,677 | |||
State Street Target Retirement 2045 Fund | 131,743 | |||
State Street Target Retirement 2050 Fund | 94,039 | |||
State Street Target Retirement 2055 Fund | 48,809 | |||
State Street Target Retirement 2060 Fund | 8,981 | |||
90
Table of Contents
State Street Institutional Investment Trust
Other Information — (continued)
December 31, 2015 (Unaudited)
Long term capital gains dividends were paid from the following Funds during the year ended December 31, 2015:
| Amount | ||||
State Street Target Retirement Fund | $ | 19,571 | ||
State Street Target Retirement 2015 Fund | 5,226 | |||
State Street Target Retirement 2020 Fund | 40,374 | |||
State Street Target Retirement 2025 Fund | 23,799 | |||
State Street Target Retirement 2030 Fund | 37,662 | |||
State Street Target Retirement 2035 Fund | 12,163 | |||
State Street Target Retirement 2040 Fund | 19,971 | |||
State Street Target Retirement 2045 Fund | 5,726 | |||
State Street Target Retirement 2050 Fund | 3,895 | |||
State Street Target Retirement 2055 Fund | 2,532 | |||
State Street Target Retirement 2060 Fund | 1,248 | |||
Foreign Tax Credit
The Funds have made an election under Internal Revenue Code Section 853 to pass through foreign taxes paid by the Funds to its shareholders. For the year ended December 31, 2015, the total amount of foreign taxes that will be passed through are:
| Amount | ||||
State Street Target Retirement Fund | $ | 4,697 | ||
State Street Target Retirement 2015 Fund | 1,445 | |||
State Street Target Retirement 2020 Fund | 22,168 | |||
State Street Target Retirement 2025 Fund | 13,156 | |||
State Street Target Retirement 2030 Fund | 28,306 | |||
State Street Target Retirement 2035 Fund | 10,965 | |||
State Street Target Retirement 2040 Fund | 23,906 | |||
State Street Target Retirement 2045 Fund | 6,028 | |||
State Street Target Retirement 2050 Fund | 4,299 | |||
State Street Target Retirement 2055 Fund | 2,226 | |||
State Street Target Retirement 2060 Fund | 409 | |||
91
Table of Contents
State Street Institutional Investment Trust
Other Information — (continued)
December 31, 2015 (Unaudited)
The amount of foreign source income earned on the following Funds during the year ended December 31, 2015 were as follows:
| Amount | ||||
State Street Target Retirement Fund | $ | 50,942 | ||
State Street Target Retirement 2015 Fund | 15,676 | |||
State Street Target Retirement 2020 Fund | 240,435 | |||
State Street Target Retirement 2025 Fund | 142,692 | |||
State Street Target Retirement 2030 Fund | 307,009 | |||
State Street Target Retirement 2035 Fund | 118,932 | |||
State Street Target Retirement 2040 Fund | 259,293 | |||
State Street Target Retirement 2045 Fund | 65,380 | |||
State Street Target Retirement 2050 Fund | 46,633 | |||
State Street Target Retirement 2055 Fund | 24,143 | |||
State Street Target Retirement 2060 Fund | 4,431 | |||
Proxy Voting Policies and Procedures and Record
Information regarding each Fund’s proxy voting policies and procedures, as well as information regarding how the Fund voted proxies, if any, during the most recent 12-month period ended June 30 is available without charge (1) by calling 1-877-521-4083 (toll free), or (2) on the website of the Securities and Exchange Commission (“SEC”) at www.sec.gov.
Quarterly Portfolio Schedule
The Funds file a complete schedule of investments with the SEC for the first and third quarters of each fiscal year on Form N-Q. Each Fund’s Forms N-Q are available on the SEC’s website at www.sec.gov and may be reviewed and copied at the SEC’s Public Reference Room in Washington, DC. Information on the operation of the Public Reference Room may be obtained by calling 1-800-SEC-0330. The information on Form N-Q is available upon request, without charge, by calling 1-877-521-4083 (toll-free).
92
Table of Contents
State Street Institutional Investment Trust
Disclosure of Information about Fund Trustees and Officers
December 31, 2015 (Unaudited)
Name, Address, and Year of Birth | Position(s) Held with Trust | Term of Office and Length of Time Served | Principal Occupation During Past Five Years and Relevant Experience | Number of Funds in Fund Complex Overseen by Trustee | Other Directorships Held by Trustee During Past Five Years | |||||
Independent Trustees | ||||||||||
Michael F. Holland State Street Bank and Trust Company 100 Huntington Avenue, CPH 0326 Boston, MA 02116 YOB: 1944 | Trustee and Co-Chairman of the Board | Term: Indefinite Elected: 7/99 | Chairman, Holland & Company L.L.C. (investment adviser) (1995 – present). | 75 | Director, the Holland Series Fund, Inc.; Director, The China Fund, Inc.; Director, The Taiwan Fund, Inc.; Director, Reaves Utility Income Fund, Inc.; and Director, Blackstone/GSO Loan Funds. | |||||
Patrick J. Riley State Street Bank and Trust Company 100 Huntington Avenue, CPH 0326 Boston, MA 02116 YOB: 1948 | Trustee and Co-Chairman of the Board | Term: Indefinite Elected:1/14 | 2002 to May 2010, Associate Justice of the Superior Court, Commonwealth of Massachusetts; 1985 to 2002, Partner, Riley, Burke & Donahue, L.L.P. (law firm); 1998 to Present, Independent Director, State Street Global Advisers Ireland, Ltd. (investment company); 1998 to Present, Independent Director, SSGA Liquidity plc (formerly, SSGA Cash Management Fund plc); January 2009 to Present, Independent Director, SSGA Fixed Income plc; and January 2009 to Present, Independent Director, SSGA Qualified Funds PLC. | 75 | Board Director and Chairman, SPDR Europe 1PLC Board (2011 – Present); Board Director and Chairman, SPDR Europe II, PLC (2013 – Present). | |||||
William L. Boyan State Street Bank and Trust Company 100 Huntington Avenue, CPH 0326 Boston, MA 02116 YOB: 1937 | Trustee and Co-Chairman of the Valuation Committee | Term: Indefinite Elected: 7/99 | President and Chief Operations Officer, John Hancock Financial Services (1959 – 1999). Mr. Boyan retired in 1999. Chairman Emeritus, Children’s Hospital, Boston, MA (1984 – 2011); Former Trustee of Old Mutual South Africa Master Trust (investments) (1995 – 2008); Former Chairman, Boston Plan For Excellence, Boston Public Schools (1995 – 2010); Member of Advisory Board of Florida Atlantic University Lifelong Learning Society. | 75 | Former Trustee of Old Mutual South Africa Master Trust. | |||||
William L. Marshall State Street Bank and Trust Company 100 Huntington Avenue, CPH 0326 Boston, MA 02116 YOB: 1942 | Trustee and Co-Chairman of the Audit Committee | Term: Indefinite Elected: 1/14 | April 2011 to Present, Chairman (until April 2011, Chief Executive Officer and President), Wm. L. Marshall Associates, Inc., Wm. L. Marshall Companies, Inc. and the Marshall Financial Group, Inc. (a registered investment adviser and provider of financial and related consulting services); Certified Financial Planner; Member, Financial Planners Association; 2015 to present, Board Member, The Doylestown Health Foundation Board. | 75 | Marshall Financial Group, Inc. | |||||
93
Table of Contents
State Street Institutional Investment Trust
Disclosure of Information about Fund Trustees and Officers — (continued)
December 31, 2015 (Unaudited)
Name, Address, and Year of Birth | Position(s) Held with Trust | Term of Office and Length of Time Served | Principal Occupation During Past Five Years and Relevant Experience | Number of Funds in Fund Complex Overseen by Trustee | Other Directorships Held by Trustee During Past Five Years | |||||
Richard D. Shirk State Street Bank and Trust Company 100 Huntington Avenue, CPH 0326 Boston, MA 02116 YOB: 1945 | Trustee and Co-Chairman of the Qualified Legal and Compliance Committee | Term: Indefinite Elected: 1/14 | March 2001 to April 2002, Chairman (1996 to March 2001, President and Chief Executive Officer), Cerulean Companies, Inc. (holding company) (Retired); 1992 to March 2001, President and Chief Executive Officer, Blue Cross Blue Shield of Georgia (health insurer, managed healthcare); 1998 to December 2008, Chairman, Board Member and December 2008 to Present, Investment Committee Member, Healthcare Georgia Foundation (private foundation); September 2002 to 2012, Lead Director and Board Member, Amerigroup Corp. (managed health care); 1999 to 2013, Board Member and (since 2001) Investment Committee Member, Woodruff Arts Center; and 2003 to 2009, Trustee, Gettysburg College. | 75 | Board member, AeroCare Holdings (privately held healthcare services company) (February 2003 – Present); Board member, Regenesis Biomedical (health care services) (April 2012 – Present); Chairman (January 2014 – Present). | |||||
Rina K. Spence State Street Bank and Trust Company 100 Huntington Avenue, CPH 0326 Boston, MA 02116 YOB: 1948 | Trustee and Co-Chairman of the Qualified Legal and Compliance Committee and Co-Chairman of the Governance Committee | Term: Indefinite Elected: 7/99 | President of SpenceCare International LLC (international healthcare consulting) (1999 –present); Chief Executive Officer, IEmily.com (health internet company) (2000 – 2001); Chief Executive Officer of Consensus Pharmaceutical, Inc. (1998 – 1999); Founder, President and Chief Executive Officer of Spence Center for Women’s Health (1994 – 1998); President and CEO Emerson Hospital (1984 – 1994); Trustee, Eastern Enterprise (utilities) (1988 – 2000); Director, Berkshire Life Insurance Company of America (1993 – 2009); Honorary Consul for Monaco in Boston (2015 – present). | 75 | ||||||
Bruce D. Taber State Street Bank and Trust Company 100 Huntington Avenue, CPH 0326 Boston, MA 02116 YOB: 1943 | Trustee and Co-Chairman of the Valuation Committee and Co-Chairman of the Governance Committee | Term: Indefinite Elected: 1/14 | 1999 to Present, Partner, Zenergy LLC (a technology company providing Computer Modeling and System Analysis to the General Electric Power Generation Division); Until December 2008, Independent Director, SSGA Cash Management Fund plc; Until December 2008, Independent Director, State Street Global Advisers Ireland, Ltd. (investment companies); and Until August 1994, President, Alonzo B. Reed, Inc., (a Boston architect-engineering firm). | 75 |
94
Table of Contents
State Street Institutional Investment Trust
Disclosure of Information about Fund Trustees and Officers — (continued)
December 31, 2015 (Unaudited)
Name, Address, and Year of Birth | Position(s) Held with Trust | Term of Office and Length of Time Served | Principal Occupation During Past Five Years and Relevant Experience | Number of Funds in Fund Complex Overseen by Trustee | Other Directorships Held by Trustee During Past Five Years | |||||
Douglas T. Williams State Street Bank and Trust Company 100 Huntington Avenue, CPH 0326 Boston, MA 02116 YOB: 1940 | Trustee and Co-Chairman of the Audit Committee | Term: Indefinite Elected: 7/99 | President, Oakmont Homeowners Association; President, Mariner Sands Chapel; Executive Vice President and member of Executive Committee, Chase Manhattan Bank (1987 – 1999); President, Boston Stock Exchange Depository Trust Company, 1981 – 1982; Treasurer, Nantucket Educational Trust, (2002 – 2007). | 75 | ||||||
Interested Trustee(1) | ||||||||||
James E. Ross SSGA Funds Management, Inc. State Street Financial Center One Lincoln Street Boston, MA 02111-2900 YOB: 1965 | Trustee | Term: Indefinite Elected Trustee: 2/07 | Chairman and Director, SSGA Funds Management, Inc. (2012 – present); President, SSGA Funds Management, Inc. (2005 – 2012); Executive Vice President and Senior Managing Director, State Street Global Advisors (2006 – present); and Principal, State Street Global Advisors (2006 – present). | 290 | Trustee, SPDR Series Trust; Trustee, SPDR Index Shares Funds; Trustee, Select Sector SPDR Trust; Trustee, SSGA Active Trust; and Trustee, SSGA Master Trust. | |||||
| (1) | Mr. Ross is an Interested Trustee because of his employment by SSGA Funds Management, Inc., an affiliate of the Trust. |
Name, Address, and Year of Birth | Position(s) Held with Trust | Term of Office and Length of Time Served | Principal Occupation During Past Five Years | |||
Officers: | ||||||
Ellen M. Needham SSGA Funds Management, Inc. State Street Financial Center One Lincoln Street Boston, MA 02111 YOB: 1967 | President | Term: Indefinite Elected: 10/12 | President and Director, SSGA Funds Management, Inc. (June 2012 – present); Chief Operating Officer, SSGA Funds Management, Inc. (May 2010 – June 2012); Senior Managing Director, SSGA Funds Management, Inc. (1992 – 2012) and Senior Managing Director, State Street Global Advisors (1992-present).* | |||
Bruce S. Rosenberg SSGA Funds Management, Inc. State Street Financial Center One Lincoln Street Boston, MA 02111 YOB: 1961 | Treasurer | Term: Indefinite Elected: 2/16 | Managing Director, State Street Global Advisors and SSGA Funds Management, Inc. (July 2015 – present); Director, Credit Suisse (April 2008 – July 2015). | |||
Ann M. Carpenter SSGA Funds Management, Inc. State Street Financial Center One Lincoln Street Boston, MA 02111 YOB: 1966 | Vice President; Deputy Treasurer | Term: Indefinite Elected: 10/12 Term: Indefinite Elected: 2/16 | Chief Operating Officer, SSGA Funds Management, Inc. (April 2014- present); Vice President, State Street Global Advisors and SSGA Funds Management, Inc. (2005 –present).* | |||
Chad C. Hallett SSGA Funds Management, Inc. State Street Financial Center One Lincoln Street Boston, MA 02111 YOB: 1969 | Deputy Treasurer | Term: Indefinite Elected: 2/16 | Vice President, State Street Global Advisors and SSGA Funds Management, Inc. (November 2014 – present); Vice President, State Street Bank and Trust Company (2001 – November 2014).* |
95
Table of Contents
State Street Institutional Investment Trust
Disclosure of Information about Fund Trustees and Officers — (continued)
December 31, 2015 (Unaudited)
Name, Address, and Year of Birth | Position(s) Held with Trust | Term of Office and Length of Time Served | Principal Occupation During Past Five Years | |||
Sujata Upreti SSGA Funds Management, Inc. State Street Financial Center One Lincoln Street Boston, MA 02111 YOB: 1974 | Assistant Treasurer | Term: Indefinite Elected: 2/16 | Vice President, State Street Global Advisors and SSGA Funds Management, Inc. (May 2015 – present); Assistant Director, Cambridge Associates, LLC (July 2014 – January 2015); Vice President, Bank of New York Mellon (July 2012 – August 2013); Manager, PricewaterhouseCoopers, LLP (September 2009- July 2012). | |||
Daniel Foley SSGA Funds Management, Inc. State Street Financial Center One Lincoln Street Boston, MA 02111 YOB: 1972 | Assistant Treasurer | Term: Indefinite Elected: 2/16 | Vice President, State Street Global Advisors and SSGA Funds Management, Inc. (April 2014 – present); Principal, State Street Global Advisors and SSGA Funds Management, Inc. (April 2007 – April 2014). | |||
Brian Harris SSGA Funds Management, Inc. State Street Financial Center One Lincoln Street Boston, MA 02111 YOB: 1973 | Chief Compliance Officer | Term: Indefinite Elected: 11/13 | Vice President, State Street Global Advisors and SSGA Funds Management, Inc.( June 2013 – Present); Senior Vice President and Global Head of Investment Compliance, BofA Global Capital Management (September 2010 to May 2013); Director of Compliance, AARP Financial Inc. (July 2008 to August 2010). | |||
Trevor Swanberg SSGA Funds Management, Inc. State Street Financial Center One Lincoln Street Boston, MA 02111 YOB: 1979 | Code of Ethics Compliance Officer | Term: Indefinite Elected:8/15 | Vice President, State Street Global Advisors and SSGA Funds Management, Inc. (January 2015 – Present); Senior Manager- Mutual Fund Compliance, ICMA-Retirement Corporation (December 2011 – January 2015); Assistant Vice President, J.P. Morgan (September 2007 – December 2011). | |||
Joshua A. Weinberg SSGA Funds Management, Inc. State Street Financial Center One Lincoln Street Boston, MA 02111-2900 YOB: 1978 | Chief Legal Officer | Term: Indefinite Elected: 2/15 | Vice President and Managing Counsel, State Street Global Advisors (2011 – present); Clerk, SSGA Funds Management, Inc. (2013 – present); Associate, Financial Services Group, Dechert LLP (2006 – 2011). | |||
David K. James State Street Bank and Trust Company 100 Huntington Avenue, 3rd Floor Boston, MA 02116 YOB: 1970 | Secretary | Term: Indefinite Elected: 4/13 | Managing Director and Managing Counsel, State Street Bank and Trust Company (2009 – present); Vice President and Counsel, PNC Global Investment Servicing (US), Inc. (2006 – 2009). | |||
Kristin Schantz State Street Bank and Trust Company 100 Huntington Avenue, 3rd Floor Boston, MA 02116 YOB: 1979 | Assistant Secretary | Term: Indefinite Elected: 2/14 | Vice President and Counsel, State Street Bank and Trust Company (2013 – present); Vice President, Citi Fund Services Ohio, Inc. (2008 – 2013). |
| * | Served in various capacities and/or with various affiliated entities during noted time period. |
96
Table of Contents
Trustees
William L. Boyan
Michael F. Holland
William L. Marshall
Patrick J. Riley
James E. Ross
Richard D. Shirk
Rina K. Spence
Bruce D. Taber
Douglas T. Williams
Investment Adviser and Administrator
SSGA Funds Management, Inc.
State Street Financial Center
One Lincoln Street
Boston, MA 02111
Custodian and Sub-Administrator
State Street Bank and Trust Company
State Street Financial Center
One Lincoln Street
Boston, MA 02111
Independent Registered Public Accounting Firm
Ernst & Young LLP
200 Clarendon Street
Boston, MA 02116
Legal Counsel
Ropes & Gray LLP
800 Boylston Street
Boston, MA 02199
Transfer Agent
Boston Financial Data Services
2000 Crown Colony Drive
North Quincy, MA 02169
Distributor
State Street Global Markets LLC
State Street Financial Center
One Lincoln Street
Boston, MA 02111
This report is for shareholder information. This is not a prospectus intended for use in the purchase or sale of Fund shares.
State Street Institutional Investment Trust | ||
State Street Bank and Trust Company | ||
P.O. Box 5049 | ||
Boston, MA 02206 | IBG-18467 |
Table of Contents
Item 2. Code of Ethics.
As of the end of the period covered by this report, State Street Institutional Investment Trust (the “Trust” or “Registrant”) has adopted a code of ethics, as defined in Item 2(b) of Form N-CSR, that applies to the Registrant’s principal executive officer, principal financial officer, principal accounting officer or controller, or persons performing similar functions, regardless of whether these individuals are employed by the registrant or a third party (the “Code”). That Code comprises written standards that are reasonably designed to deter wrongdoing and to promote: (1) honest and ethical conduct, including the ethical handling of actual or apparent conflicts of interest between personal and professional relationships; (2) full, fair, accurate, timely and understandable disclosure in reports and documents that a Registrant files with, or submits to, the U.S. Securities Exchange Commission (the “SEC”) and in other public communications made by a Registrant; (3) compliance with applicable laws and governmental rules and regulations; (4) the prompt internal reporting to an appropriate person or persons identified in the Code of violations of the Code; and (5) accountability for adherence to the Code. As of the end of the period covered by the report, the Code was combined with other mutual funds advised by SSGA Funds Management, Inc. (“SSGA FM”). The Registrant has not granted any waivers from any provisions of the Code during the covered period. A copy of the Registrant’s Code is filed as Exhibit 12(a)(1) to this Form N-CSR.
Item 3. Audit Committee Financial Expert.
The Trust’s Board of Trustees (the “Board”) has determined that the Trust has the following “audit committee financial experts” as defined in Item 3(b) of Form N-CSR serving on its Audit Committee: Messrs. Michael F. Holland, William L. Boyan and Mr. Richard D. Shirk. Each of the audit committee financial experts is “independent” as that term is defined in Item 3(a)(2) of Form N-CSR.
An “audit committee financial expert” is not an “expert” for any purpose, including for purposes of Section 11 of the Securities Act of 1933, as a result of being designated as an “audit committee financial expert.” Further, the designation of a person as an “audit committee financial expert” does not mean that the person has any greater duties, obligations, or liability than those imposed on the person without the “audit committee financial expert” designation. Similarly, the designation of a person as an “audit committee financial expert” does not affect the duties, obligations, or liability of any other member of the Audit Committee or Board of Trustees.
Item 4. Principal Accountant Fees and Services.
| (a) | Audit Fees |
For the fiscal years ended December 31, 2015 and December 31, 2014, the aggregate audit fees billed for professional services rendered by Ernst & Young LLP (“E&Y”), the Trust’s principal accountant, for the audit of the Trust’s annual financial statements or services normally provided by E&Y in connection with the Trust’s statutory and regulatory filings and engagements were $504,725 and $285,425, respectively.
Table of Contents
| (b) | Audit-Related Fees |
For the fiscal years ended December 31, 2015 and December 31, 2014, there were no fees for assurance and related services by E&Y reasonably related to the performance of the audit of the Trust’s financial statements that were not reported under paragraph (a) of this Item.
| (c) | Tax Fees |
The aggregate tax fees billed for professional services rendered by E&Y for tax compliance, tax advice, and tax planning in the form of preparation of excise filings and income tax returns for the last two fiscal years ended December 31, 2015 and December 31, 2014 were $232,141 and $150,891, respectively.
| (d) | All Other Fees |
For the fiscal years ended December 31, 2015 and December 31, 2014, there were no fees billed for professional services rendered by E&Y for products and services provided by E&Y to the Trust, other than the services reported in paragraphs (a) through (c).
For the fiscal years ended December 31, 2015 and December 31, 2014, the aggregate fees for professional services rendered by E&Y for products and services provided by E&Y to SSGA Funds Management, Inc. (the “Adviser”) and any entity controlling, controlled by, or under common control with the Adviser that provides ongoing services to the Trust that (i) relate directly to the operations and financial reporting of the Trust and (ii) were pre-approved by the Trust’s audit committee were approximately $8,024,882 and $7,886,395, respectively.
| (e)(1) | Audit Committee Pre-Approval Policies and Procedures |
The Trust’s Audit Committee Charter states the following with respect to pre-approval procedures:
The Audit Committee shall have the following duties and powers:
| • | To pre-approve engagements by a Trust’s independent auditor for non-audit services to be rendered to the Fund’s investment adviser (not including any subadviser whose role is primarily portfolio management and is subcontracted with or overseen by another investment adviser), and any entity controlling, controlled by, or under common control with the investment adviser that provides ongoing services to the Fund, if the engagement relates directly to the operations and financial reporting of the Fund; |
Table of Contents
| • | To establish, if deemed necessary or appropriate as an alternative to Audit Committee pre-approval of services to be provided by the independent auditor as required by paragraph (b) above, policies and procedures to permit such services to be pre-approved by other means, such as by action of a designated member or members of the Audit Committee, subject to the requirement that the decision of any member to whom authority is delegated to pre-approve an activity shall be presented to the full Audit Committee at its next scheduled meeting; |
Alternate Pre-Approval Procedure:
| • | The Chairperson, or a Co-Chairperson, of the Audit Committee is authorized to pre-approve any engagement involving the Trust’s independent auditors to the same extent as the Audit Committee. Any pre-approval decision by the Chairperson, or a Co-Chairperson, under the foregoing authority shall be presented to the Audit Committee at its next scheduled meeting. |
| (e)(2) | Percentages of Services |
None of the services described in paragraphs (b) through (d) of this Item were performed in reliance on paragraph (c)(7)(i)(C) of Rule 2-01 of Regulation S-X during the period of time for which such rule was effective.
| (f) | Not applicable. |
| (g) | Total Fees Paid By Adviser and Certain Affiliates |
For the fiscal years ended December 31, 2015 and December 31, 2014, the aggregate non-audit fees billed by E&Y for services rendered to the Trust and the Adviser and any entity controlling, controlled by, or under common control with the Adviser that provided ongoing services to the Trust were approximately $26,000,000 and $22,200,000, respectively.
| (h) | E&Y notified the Trust’s Audit Committee of all non-audit services that were rendered by E&Y to the Adviser and any entity controlling, controlled by, or under common control with the Adviser that provides services to the Trust, which services were not required to be pre-approved pursuant to paragraph (c)(7)(ii) of Rule 2-01 of Regulation S-X, allowing the Trust’s Audit Committee to consider whether such services were compatible with maintaining E&Y’s independence. |
Item 5. Audit Committees of Listed Registrants.
Not applicable to the Registrant.
Table of Contents
Item 6. Schedule of Investments.
(a) Schedule of Investments is included as part of Item 1 of this Form N-CSR.
(b) Not applicable.
Item 7. Disclosure of Proxy Voting Policies and Procedures for Closed-End Management Investment Companies.
Not applicable to the Registrant.
Item 8. Portfolio Managers of Closed-End Management Investment Companies.
Not applicable to the Registrant.
Item 9. Purchases of Equity Securities by Closed-End Management Investment Company and Affiliated Purchasers.
Not applicable to the Registrant.
Item 10. Submission of Matters to a Vote of Security Holders.
The Board of Trustees approved an Amended and Restated Nominating Committee Charter (the “Charter”) at their February 13, 2014 Board Meeting. The Charter contains procedures related to how shareholders are to submit recommendations for Trustee candidates to the Trusts. Those procedures are as follows:
Procedures for Shareholders to Submit Nominee Candidates
(As of February 13, 2014)
A shareholder of the Trust, or of any series thereof, if applicable, must follow the following procedures in order to submit properly a nominee recommendation for the Nominating Committee’s consideration.
| 1. | The shareholder must submit any such recommendation (a “Shareholder Recommendation”) in writing to the Trust, to the attention of the Trust’s Secretary, at the address of the principal executive offices of the Trust. |
| 2. | The Shareholder Recommendation must be delivered to, or mailed and received at, the principal executive offices of the Trust not less than sixty (60) calendar days nor more than ninety (90) calendar days prior to the date of the Board or shareholder meeting at which the nominee candidate would be considered for election. Shareholder Recommendations will be kept on file for two years after receipt of the Shareholder Recommendation. A Shareholder Recommendation considered by the Nominating Committee in connection with the Nominating Committee’s nomination of any candidate(s) for appointment or election as an independent Trustee need not be considered again by the Nominating Committee in connection with any subsequent nomination(s). |
| 3. | The Shareholder Recommendation must include: (i) a statement in writing setting forth (A) the name, age, date of birth, business address, residence address and nationality of the person |
Table of Contents
| recommended by the shareholder (the “candidate”), and the names and addresses of at least three professional references; (B) the number of all shares of the Trust (including the series and class, if applicable) owned of record or beneficially by the candidate, the date such shares were acquired and the investment intent of such acquisition(s), as reported to such shareholder by the candidate; (C) any other information regarding the candidate called for with respect to director nominees by paragraphs (a), (d), (e) and (f) of Item 401 of Regulation S-K or paragraph (b) of Item 22 of Rule 14a-101 (Schedule 14A) under the Securities Exchange Act of 1934, as amended (the “Exchange Act”), adopted by the Securities and Exchange Commission (or the corresponding provisions of any applicable regulation or rule subsequently adopted by the Securities and Exchange Commission or any successor agency with jurisdiction related to the Trust); (D) any other information regarding the candidate that would be required to be disclosed if the candidate were a nominee in a proxy statement or other filing required to be made in connection with solicitation of proxies for election of directors pursuant to Section 14 of the Exchange Act and the rules and regulations promulgated thereunder or any other applicable law or regulation; and (E) whether the recommending shareholder believes that the candidate is or will be an “interested person” of the Trust (as defined in the Investment Company Act of 1940, as amended) and, if not an “interested person,” information regarding the candidate that will be sufficient, in the discretion of the Board or the Nominating Committee, for the Trust to make such determination; (ii) the written and signed consent of the candidate to be named as a nominee and to serve as a Trustee if elected; (iii) the recommending shareholder’s name as it appears on the Trust’s books; (iv) the number of all shares of the Trust (including the series and class, if applicable) owned beneficially and of record by the recommending shareholder; (v) a complete description of all arrangements or understandings between the recommending shareholder and the candidate and any other person or persons (including their names) pursuant to which the recommendation is being made by the recommending shareholder including, without limitation, all direct and indirect compensation and other material monetary agreements, arrangements and understandings between the candidate and recommending shareholder during the past three years, and (vi) a brief description of the candidate’s relevant background and experience for membership on the Board, such as qualification as an audit committee financial expert. |
| 4. | The Nominating Committee may require the recommending shareholder to furnish such other information as it may reasonably require or deem necessary to verify any information furnished pursuant to paragraph 3 above or to determine the eligibility of the candidate to serve as a Trustee of the Trust or to satisfy applicable law. If the recommending shareholder fails to provide such other information in writing within seven days of receipt of a written request from the Nominating Committee, the recommendation of such candidate as a nominee will be deemed not properly submitted for consideration, and the Nominating Committee will not be required to consider such candidate. |
Item 11. Controls and Procedures.
(a) The Trust’s principal executive officer and principal financial officer have concluded that the Trust’s disclosure controls and procedures (as defined in Rule 30a-3(c) under the Investment Company Act of 1940, as amended (the “1940 Act”)) are effective to provide reasonable assurance that information required to be disclosed by the registrant on Form N-CSR is recorded, processed, summarized and reported as of a date within 90 days of the filing date of this report, that includes the disclosure required by this paragraph, based on their evaluation of these controls and procedures required by Rule 30a-3(b) under the 1940 Act and Rules 13a-15(b) or 15d-15(b) under the Securities Exchange Act of 1934.
Table of Contents
(b) There were no changes in the Trust’s internal control over financial reporting (as defined in Rule 30a-3(d) under the 1940 Act) that occurred during the Trust’s second fiscal quarter of the period covered by this Form N-CSR filing that has materially affected, or is reasonably likely to materially affect, the Trust’s internal control over financial reporting.
Item 12. Exhibits.
(a)(1) Code of Ethics pursuant to Item 2 of Form N-CSR is attached hereto.
(a)(2) Certifications of principal executive officer and principal financial and accounting officer of the Trust as required by Rule 30a-2(a) under the 1940 Act are attached hereto.
(a)(3) Not applicable to the Registrant.
(b) Certifications of principal executive officer and principal financial and accounting officer of the Trust as required by Rule 30a-2(b) under the 1940 Act and Section 906 of the Sarbanes-Oxley Act of 2002 are attached hereto.
Table of Contents
SIGNATURES
Pursuant to the requirements of the Securities Exchange Act of 1934 and the Investment Company Act of 1940, the Registrant has duly caused this report to be signed on its behalf by the undersigned, thereunto duly authorized.
| Registrant: | STATE STREET INSTITUTIONAL INVESTMENT TRUST | |
| By: | /s/ Ellen M. Needham | |
| Ellen M. Needham | ||
| President | ||
| Date: | March 4, 2016 | |
Pursuant to the requirements of the Securities Exchange Act of 1934 and the Investment Company Act of 1940, this report has been signed below by the following persons on behalf of the Registrant and in the capacities and on the dates indicated.
| By: | /s/ Ellen M. Needham | |
| Ellen M. Needham | ||
| President (Principal Executive Officer) | ||
| Date: | March 4, 2016 | |
| By: | /s/ Bruce S. Rosenberg | |
| Bruce S. Rosenberg | ||
| Treasurer (Principal Financial and Accounting Officer) | ||
| Date: | March 4, 2016 | |