 Earnings Conference Call 3 Quarter 2014 October 29, 2014 rd Exhibit 99.2 |
 Cautionary Statements Regarding Forward-Looking Information This presentation contains certain forward-looking statements within the meaning of the Private Securities Litigation Reform Act of 1995, that are subject to risks and uncertainties. The factors that could cause actual results to differ materially from the forward-looking statements made by Exelon Corporation, Commonwealth Edison Company, PECO Energy Company, Baltimore Gas and Electric Company and Exelon Generation Company, LLC (Registrants) include those factors discussed herein, as well as the items discussed in (1) Exelon’s 2013 Annual Report on Form 10-K in (a) ITEM 1A. Risk Factors, (b) ITEM 7. Management’s Discussion and Analysis of Financial Condition and Results of Operations and (c) ITEM 8. Financial Statements and Supplementary Data: Note 22; (2) Exelon’s Third Quarter 2014 Quarterly Report on Form 10-Q (to be filed on October 29, 2014) in (a) Part II, Other Information, ITEM 1A. Risk Factors; (b) Part 1, Financial Information, ITEM 2. Management’s Discussion and Analysis of Financial Condition and Results of Operations and (c) Part I, Financial Information, ITEM 1. Financial Statements: Note 18; and (3) other factors discussed in filings with the SEC by the Registrants. Readers are cautioned not to place undue reliance on these forward-looking statements, which apply only as of the date of this presentation. None of the Registrants undertakes any obligation to publicly release any revision to its forward-looking statements to reflect events or circumstances after the date of this presentation. 1 2014 3Q Earnings Release Slides |
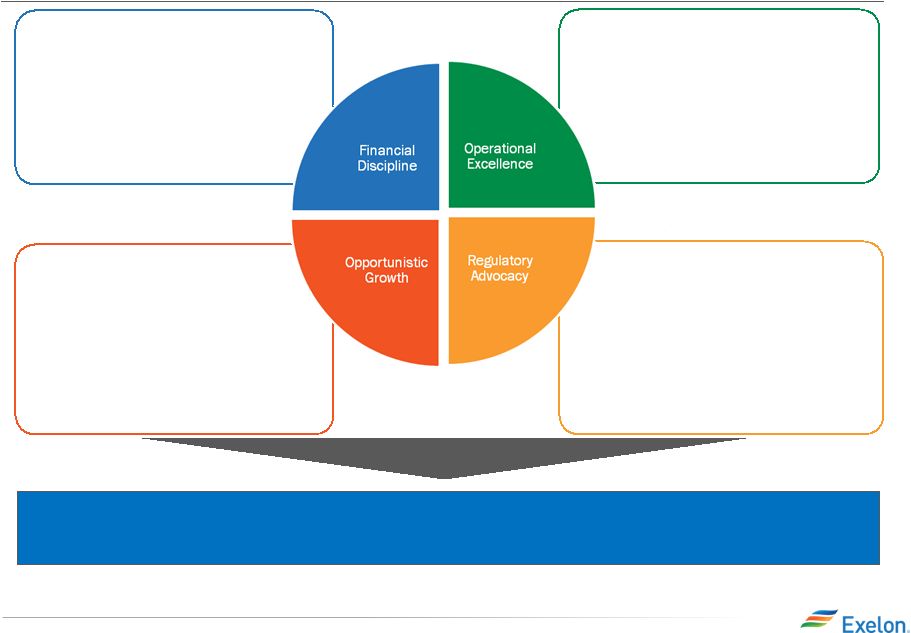 • Texas combined cycle new build • Integrys Energy Services acquisition • Pepco Holdings Inc. acquisition • Virginia approval received • Nuclear capacity factor of 96.5% (2) • Power dispatch match of 98.8% and renewables energy capture of 94.9% • PJM Capacity Performance proposal • NEI Report on the economic impact of nuclear plants in Illinois • ComEd and BGE rate cases 2014 3Q Earnings Release Slides 2 • Delivered Q3 adjusted operating earnings of $0.78 per share, exceeding our guidance range (1) • ExGen Texas Power, LLC financing • Divested three power plants Q3 2014 in Review (1) Represents adjusted (non-GAAP) operating EPS. Refer to the Earnings Release Attachments for additional details and to the Appendix for a reconciliation of adjusted (non-GAAP) operating EPS to GAAP EPS (2) Exelon operated plants at ownership The integrated business model allows us to invest in each of our businesses driving shareholder value |
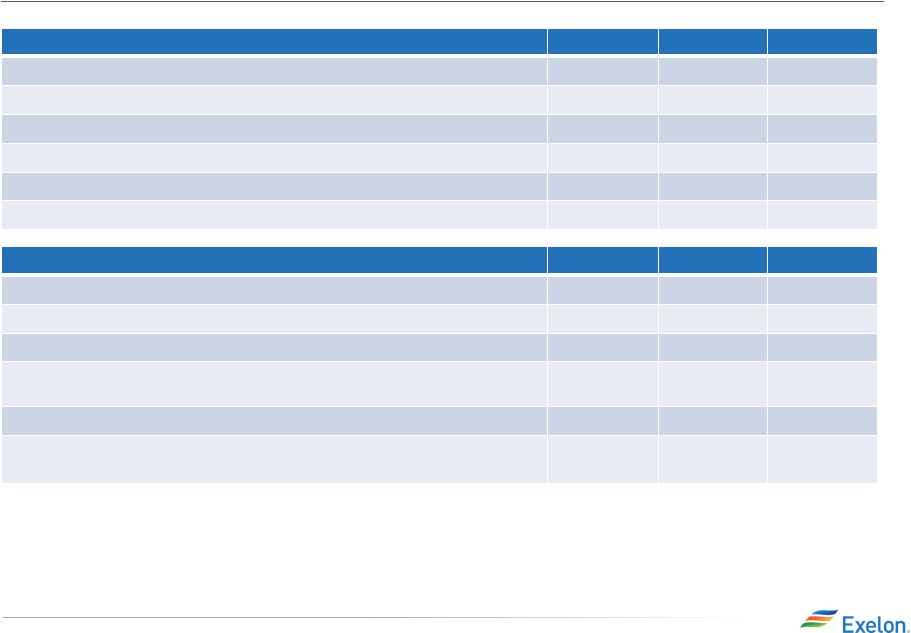
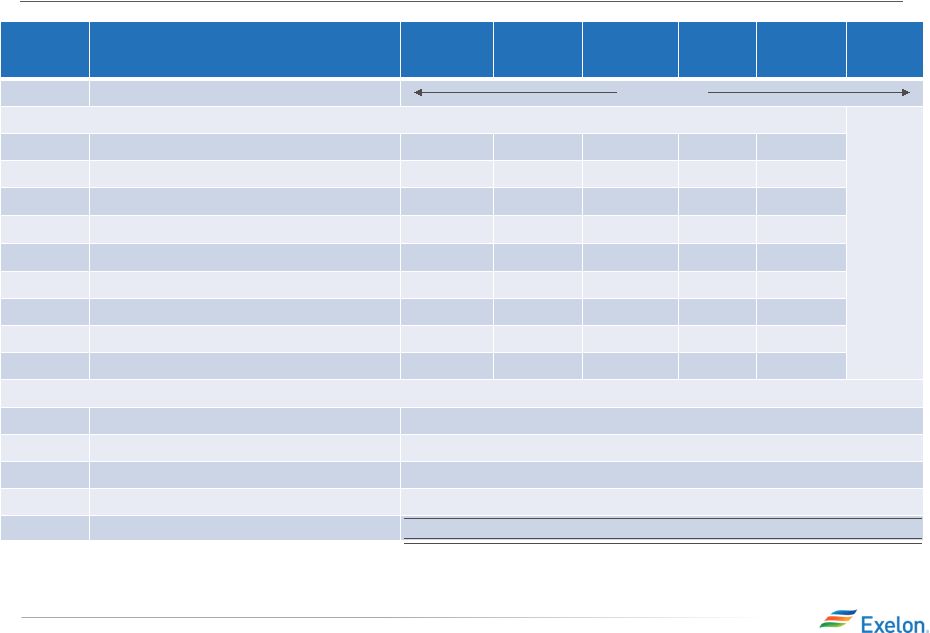
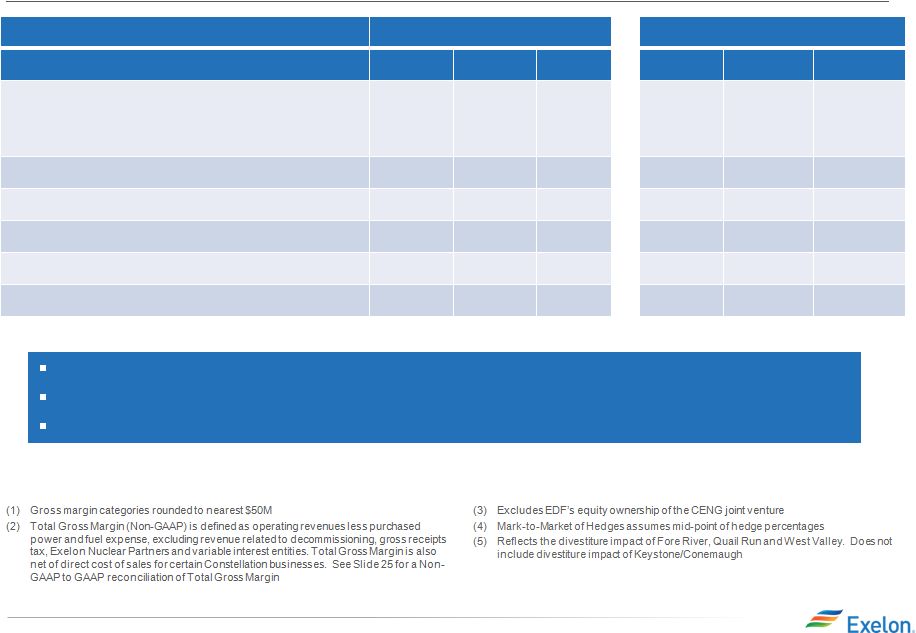 Exelon Generation: Gross Margin Update September 30, 2014 Change from June 30, 2014 Gross Margin Category ($M) (1) 2014 2015 2016 2014 2015 2016 Open Gross Margin (3,5) (including South, West, Canada hedged gross margin) 7,300 6,750 6,500 (200) (50) (350) Mark-to-Market of Hedges (3,4) (350) - 150 350 (50) 100 Power New Business / To Go 50 400 550 (100) (100) - Non-Power Margins Executed 350 100 50 50 - - Non-Power New Business / To Go 50 300 350 (50) - - Total Gross Margin (2) 7,400 7,550 7,600 50 (200) (250) 2014 3Q Earnings Release Slides 3 Gross Margin decreased in 2015 and 2016 mainly due to divestitures Q3 defined by mild summer weather leading to low demand and strong natural gas storage injections Behind ratable hedge percentage in the Midwest is reflective of our bullish view in 2016/2017 |
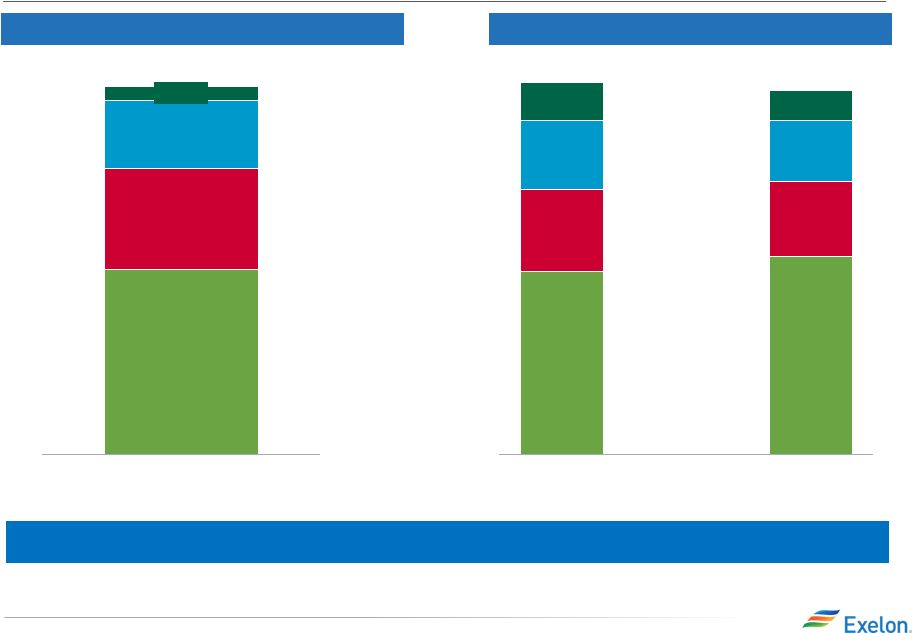 Key Financial Messages 2014 3Q Earnings Release Slides 4 ExGen ComEd PECO BGE $0.78 $0.50 $0.15 $0.09 $0.05 3Q 2014 Adjusted Operating EPS (1,3) Narrowing 2014 Full-Year Guidance ComEd 2014 Revised Guidance $0.35 - $0.45 $0.15 - $0.25 2014 Initial Guidance $2.25 - $2.55 (1) $1.10 - $1.30 $0.50 - $0.60 $0.40 - $0.50 $0.20 - $0.30 $2.30 - $2.50 (1) PECO PECO ExGen ComEd BGE BGE ExGen $1.25 - $1.35 $0.45 - $0.55 Narrowing 2014 full-year guidance to $2.30 to $2.50 per share (2) Refer to the Earnings Release Attachments for additional details and to the Appendix for a reconciliation of adjusted (non-GAAP) operating EPS to GAAP EPS 2014 earnings guidance based on expected average outstanding shares of ~860M Amounts may not add due to rounding (1) (2) (3) |
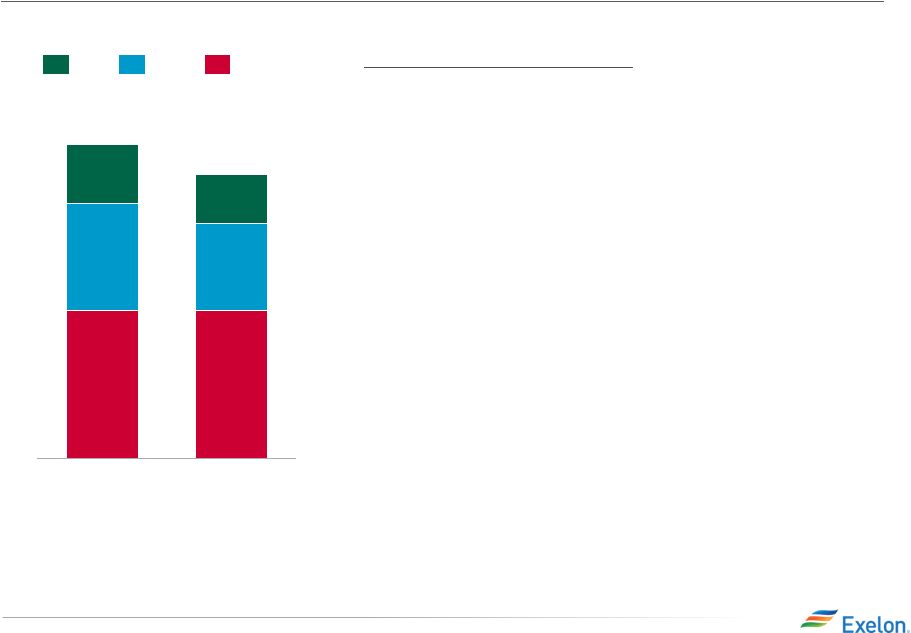 Exelon Utilities Adjusted Operating EPS Contribution (1) Key Drivers – 3Q14 vs. 3Q13: BGE (-0.01): • Increased O&M, primarily due to increased storm, labor, and contracting costs: $(0.02) • Higher distribution revenue pursuant to increased rates effective December 2013: $0.01 PECO (-0.02): • Unfavorable weather conditions included in revenue, net of purchased power and fuel: $(0.01) • Increased O&M costs, primarily due to increased storm costs: $(0.01) ComEd (+0.00): • Increased transmission and distribution (2) earnings due to increased capital investments: $0.02 • Unfavorable weather conditions (2) : $(0.02) 2014 3Q Earnings Release Slides 3Q 2014 $0.29 $0.15 $0.09 $0.05 3Q 2013 $0.32 $0.15 $0.11 $0.06 ComEd BGE PECO Numbers may not add due to rounding. (1) Refer to the Earnings Release Attachments for additional details and to the Appendix for a reconciliation of adjusted (non-GAAP) operating EPS to GAAP EPS. (2) Due to the distribution formula rate, changes in ComEd’s earnings are driven primarily by changes inclusive of 30-year U.S. Treasury rates (allowed ROE), rate base and capital structure in addition to weather, load and changes in customer mix. 5 |
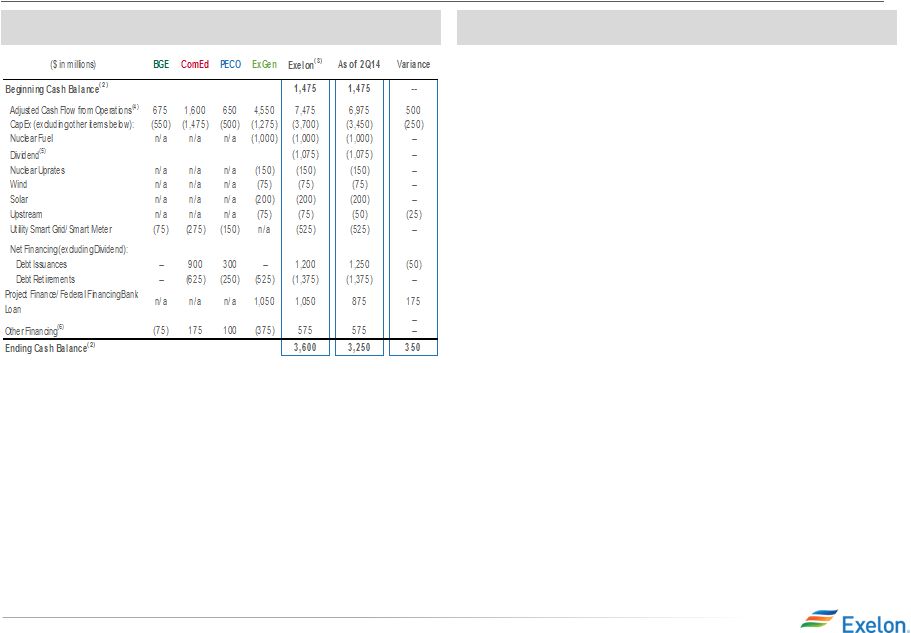 DRAFT 2014 Projected Sources and Uses of Cash Key Messages (1) • Cash from Operations is projected to be $7,475M vs. 2Q14E of $6,975M for a $500M variance. This variance is driven by: - $625M Net proceeds from divestitures - $175M Income taxes - $125M Reclassification of PHI preferred stock purchase - ($325M) Integrys acquisition, including working capital - ($100M) Working capital at Utilities • Cash from Financing activities is projected to be $375M vs. 2Q14E of $250M for a $125M variance. This variance is driven by: - $175M Incremental project financing at ExGen - ($50M) Decreased ComEd LTD requirements - ($25M) Decrease in projected commercial paper financings • Cash from Investing activities is projected to be ($5,725M) vs. 2Q14E of ($5,450M) for a ($275M) variance. This variance is driven by: - ($125M) ExGen development - ($125M) Reclassification of PHI preferred stock purchase - ($25M) Upstream Projected Sources & Uses (1) (1) All amounts rounded to the nearest $25M. (2) Excludes counterparty collateral of $134 million at 12/31/2013. In addition, the 12/31/2014 ending cash balance does not include collateral. (3) Includes cash flow activity from Holding Company, eliminations, and other corporate entities. CapEx for Exelon is shown net of $325M CPS early lease termination fee, and ($125M) purchase of PHI preferred stock. (4) Adjusted Cash Flow from Operations (non-GAAP) primarily includes net cash flows from operating activities and net cash flows from investing activities excluding capital expenditures of $5.7B for 2014. (5) Dividends are subject to declaration by the Board of Directors. (6) “Other Financing” primarily includes CENG distribution to EDF, expected changes in short-term debt, and proceeds from issuance of mandatory convertible units. 6 2014 3Q Earnings Release Slides |
 APPENDIX 2014 3Q Earnings Release Slides 7 |
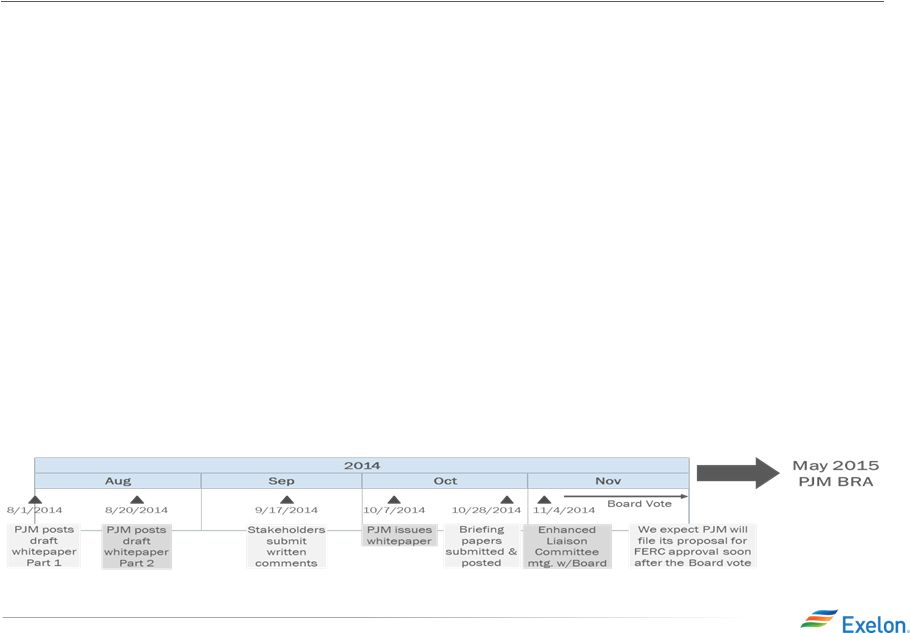 PJM’s Proposed Solution - Capacity Performance Proposal • Exelon has been working with PJM and other stakeholders since the spring • PJM now recognizes that generation resources procured through its existing forward capacity market (RPM) may not be sufficient to meet future load conditions, especially at winter peak o Additionally, current revenues and penalty structures are insufficient to incent necessary investment to maintain highly available capacity • PJM released a revised “Capacity Performance” proposal October 7, 2014 revamping initial reform concepts suggested in August o The Capacity Performance concept reforms are intended to encourage commitment of capacity resources that have secure fuel and other performance characteristics to provide PJM confidence that units will be available when dispatched to meet peak summer and winter load o PJM proposes to increase the capacity market offer cap to Net CONE, but to substantially raise penalties for performance failure o PJM suggests transition mechanisms for delivery years in which it has already made forward capacity procurements (2015-16, 2016-17, and 2017-18) o PJM proposed a method of integrating “wholesale” demand response through PJM Load Serving Entities in a manner that would clear by adjusting the RPM demand curve 2014 3Q Earnings Release Slides 8 |
 Exelon Generation Disclosures September 30, 2014 2014 3Q Earnings Release Slides 9 |
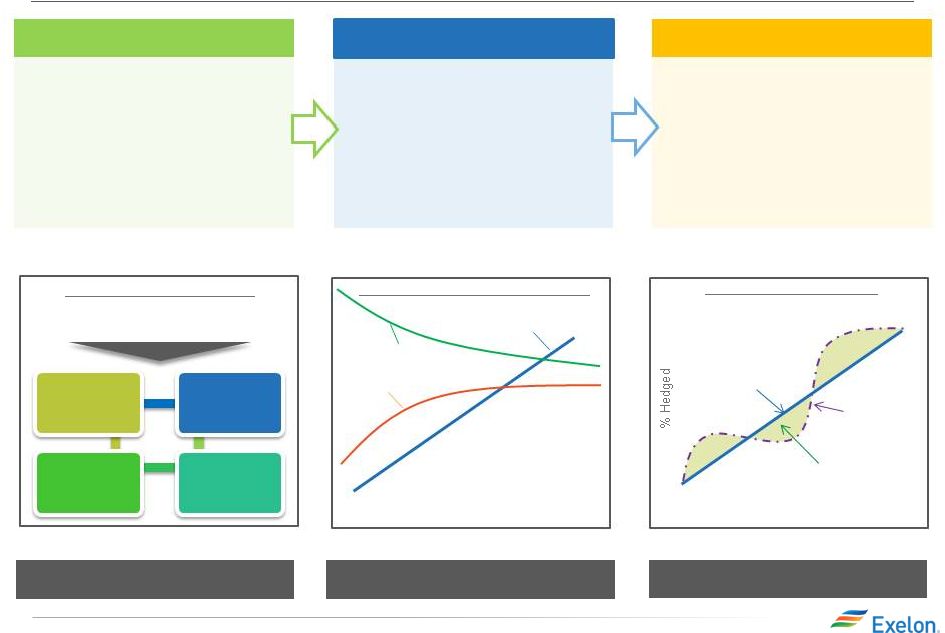 Portfolio Management Strategy Protect Balance Sheet Ensure Earnings Stability Create Value 2014 3Q Earnings Release Slides 10 Note: Hedge strategy has not changed as a result of recent and pending asset divestitures Exercising Market Views Portfolio Management Over Time Align Hedging & Financials Establishing Minimum Hedge Targets Purely ratable Actual hedge % Market views on timing, product allocation and regional spreads reflected in actual hedge % High End of Profit Low End of Profit % Hedged Open Generation with LT Contracts Portfolio Management & Optimization Dividend Capital Structure Credit Rating Capital & Operating Expenditure •Aligns hedging program with financial policies and financial outlook •Establish minimum hedge targets to meet financial objectives of the company (dividend, credit rating) •Hedge enough commodity risk to meet future cash requirements under a stress scenario Strategic Policy Alignment Three-Year Ratable Hedging •Ensure stability in near-term cash flows and earnings •Disciplined approach to hedging •Tenor aligns with customer preferences and market liquidity •Multiple channels to market that allow us to maximize margins •Large open position in outer years to benefit from price upside Bull / Bear Program •Ability to exercise fundamental market views to create value within the ratable framework •Modified timing of hedges versus purely ratable •Cross-commodity hedging (heat rate positions, options, etc.) •Delivery locations, regional and zonal spread relationships |
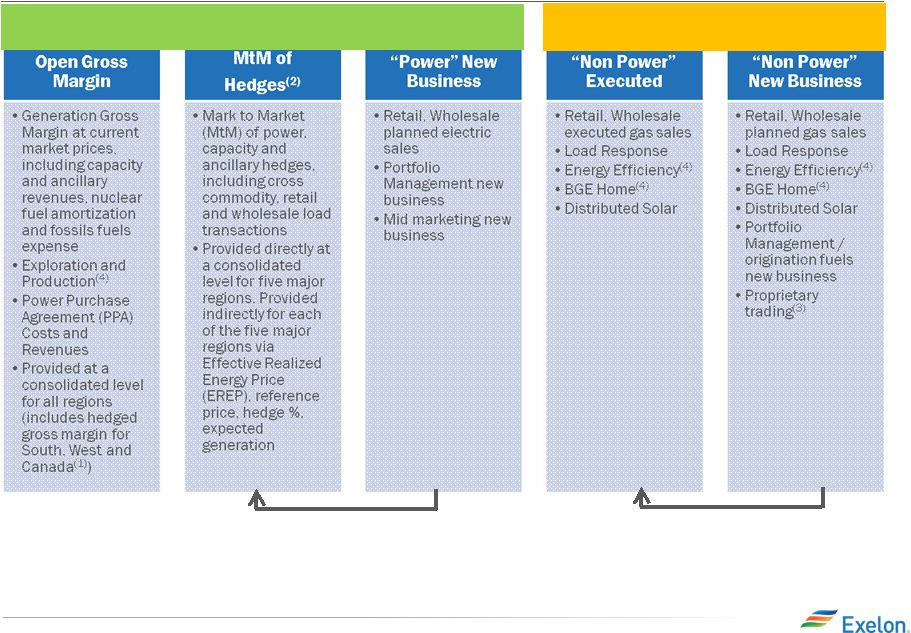 Components of Gross Margin Categories Margins move from new business to MtM of hedges over the course of the year as sales are executed (5) Margins move from “Non power new business” to “Non power executed” over the course of the year Gross margin linked to power production and sales Gross margin from other business activities (1) Hedged gross margins for South, West and Canada region will be included with Open Gross Margin, and no expected generation, hedge %, EREP or reference prices provided for this region (2) MtM of hedges provided directly for the five larger regions. MtM of hedges is not provided directly at the regional level but can be easily estimated using EREP, reference price and hedged MWh (3) Proprietary trading gross margins will generally remain within “Non Power” New Business category and only move to “Non Power” Executed category upon management discretion (4) Gross margin for these businesses are net of direct “cost of sales” (5) Margins for South, West & Canada regions and optimization of fuel and PPA activities captured in Open Gross Margin 2014 3Q Earnings Release Slides 11 |
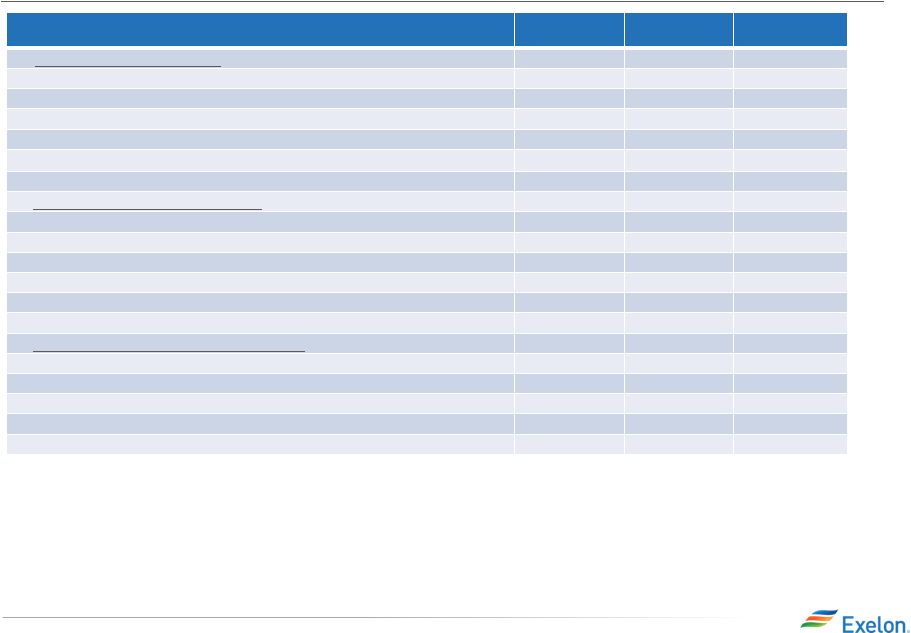
 ExGen Disclosures Gross Margin Category ($M) (1,6) 2014 2015 2016 Open Gross Margin (including South, West & Canada hedged GM) (3) 7,300 6,750 6,500 Mark to Market of Hedges (3,4) (350) - 150 Power New Business / To Go 50 400 550 Non-Power Margins Executed 350 100 50 Non-Power New Business / To Go 50 300 350 Total Gross Margin (2) 7,400 7,550 7,600 Reference Prices (5) 2014 2015 2016 Henry Hub Natural Gas ($/MMbtu) $4.44 $4.00 $4.08 Midwest: NiHub ATC prices ($/MWh) $39.45 $33.70 $33.21 Mid-Atlantic: PJM-W ATC prices ($/MWh) $51.38 $42.75 $40.69 ERCOT-N ATC Spark Spread ($/MWh) HSC Gas, 7.2HR, $2.50 VOM $3.02 $6.47 $6.14 New York: NY Zone A ($/MWh) $49.00 $42.14 $38.94 New England: Mass Hub ATC Spark Spread($/MWh) ALQN Gas, 7.5HR, $0.50 VOM $3.04 $8.95 $7.64 2014 3Q Earnings Release Slides 12 (1) Gross margin categories rounded to nearest $50M (2) Total Gross Margin (Non-GAAP) is defined as operating revenues less purchased power and fuel expense, excluding revenue related to decommissioning, gross receipts tax, Exelon Nuclear Partners and variable interest entities. Total Gross Margin is also net of direct cost of sales for certain Constellation businesses. See Slide 25 for a Non-GAAP to GAAP reconciliation of Total Gross Margin (3) Excludes EDF’s equity ownership of the CENG joint venture (4) Mark to Market of Hedges assumes mid-point of hedge percentages (5) Based on September 30, 2014 market conditions (6) Reflects the divestiture impact of Fore River, Quail Run and West Valley. Does not include divestiture impact of Keystone/Conemaugh |
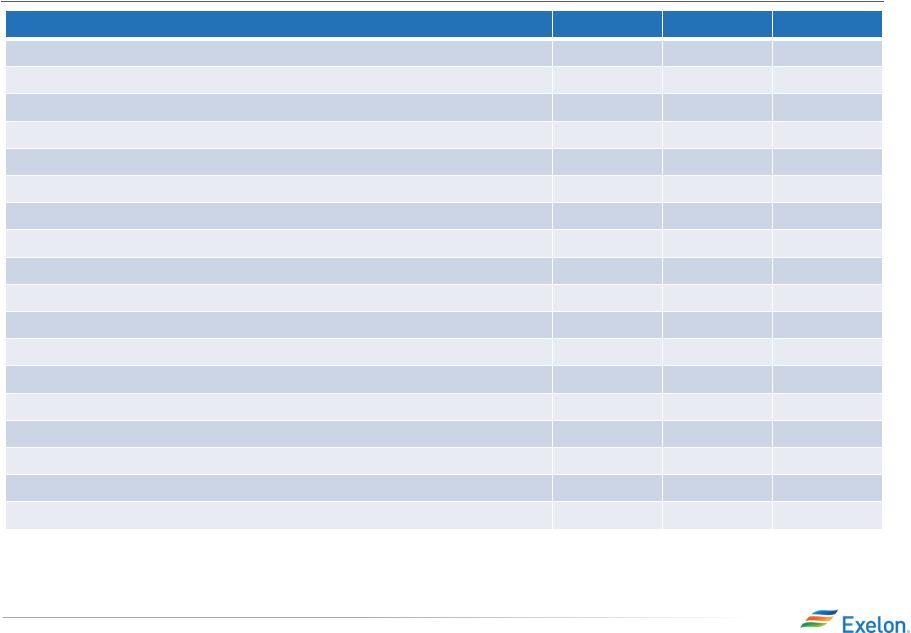
 ExGen Disclosures Generation and Hedges (6) 2014 2015 2016 Expected Generation (GWh) (1) 205,300 200,800 202,200 Midwest 97,000 96,600 97,500 Mid-Atlantic (2) 74,300 71,300 72,100 ERCOT 11,400 16,400 16,900 New York (2) 12,700 9,400 9,300 New England 9,900 7,100 6,400 % of Expected Generation Hedged (3) 98-101% 86-89% 55-58% Midwest 97-100% 83-86% 49-52% Mid-Atlantic (2) 98-101% 88-91% 55-58% ERCOT 101-104% 99-102% 82-85% New York (2) 98-101% 87-90% 62-65% New England 102-105% 82-85% 62-65% Effective Realized Energy Price ($/MWh) (4) Midwest $36.50 $33.50 $34.50 Mid-Atlantic (2) $48.50 $42.50 $43.00 ERCOT (5) $20.00 $8.50 $5.50 New York (2) $42.50 $42.50 $40.00 New England (5) $6.00 $11.50 $4.50 2014 3Q Earnings Release Slides 13 (1) Expected generation is the volume of energy that best represents our financial exposure through owned or contracted for capacity. Expected generation is based upon a simulated dispatch model that makes assumptions regarding future market conditions, which are calibrated to market quotes for power, fuel, load following products, and options. Expected generation assumes 14 refueling outages in 2014 and 2015, and 12 in 2016 at Exelon-operated nuclear plants, and Salem. Expected generation assumes capacity factors of 93.6%, 93.5%, and 94.1% in 2014, 2015, and 2016 respectively at Exelon-operated nuclear plants, at ownership. These estimates of expected generation in 2015 and 2016 do not represent guidance or a forecast of future results as Exelon has not completed its planning or optimization processes for those years. (2) Excludes EDF’s equity ownership share of CENG Joint Venture. (3) Percent of expected generation hedged is the amount of equivalent sales divided by expected generation. Includes all hedging products, such as wholesale and retail sales of power, options and swaps. (4) Effective realized energy price is representative of an all-in hedged price, on a per MWh basis, at which expected generation has been hedged. It is developed by considering the energy revenues and costs associated with our hedges and by considering the fossil fuel that has been purchased to lock in margin. It excludes uranium costs and RPM capacity revenue, but includes the mark-to-market value of capacity contracted at prices other than RPM clearing prices including our load obligations. It can be compared with the reference prices used to calculate open gross margin in order to determine the mark-to-market value of Exelon Generation's energy hedges. (5) Spark spreads shown for ERCOT and New England. (6) Reflects the divestiture impact of Fore River, Quail Run and West Valley. Does not include divestiture impact of Keystone/Conemaugh |
 ExGen Hedged Gross Margin Sensitivities (1) Based on September 30, 2014 market conditions and hedged position. Gas price sensitivities are based on an assumed gas-power relationship derived from an internal model that is updated periodically. Power prices sensitivities are derived by adjusting the power price assumption while keeping all other price inputs constant. Due to correlation of the various assumptions, the hedged gross margin impact calculated by aggregating individual sensitivities may not be equal to the hedged gross margin impact calculated when correlations between the various assumptions are also considered. (2) Sensitivities based on commodity exposure which includes open generation and all committed transactions. (3) Excludes EDF’s equity ownership share of the CENG Joint Venture. (4) Reflects the divestiture impact of Fore River, Quail Run and West Valley. Does not include divestiture of impact of Keystone/Conemaugh Gross Margin Sensitivities (With Existing Hedges) (1,2,4) 2014 2015 2016 Henry Hub Natural Gas ($/Mmbtu) + $1/Mmbtu $15 $120 $440 - $1/Mmbtu $10 $(60) $(400) NiHub ATC Energy Price + $5/MWh $- $85 $265 - $5/MWh $- $(85) $(260) PJM-W ATC Energy Price + $5/MWh $(5) $30 $165 - $5/MWh $5 $(25) $(155) NYPP Zone A ATC Energy Price + $5/MWh $- $5 $15 - $5/MWh $- $(10) $(20) Nuclear Capacity Factor (3) +/- 1% +/- $15 +/- $50 +/- $45 2014 3Q Earnings Release Slides 14 |
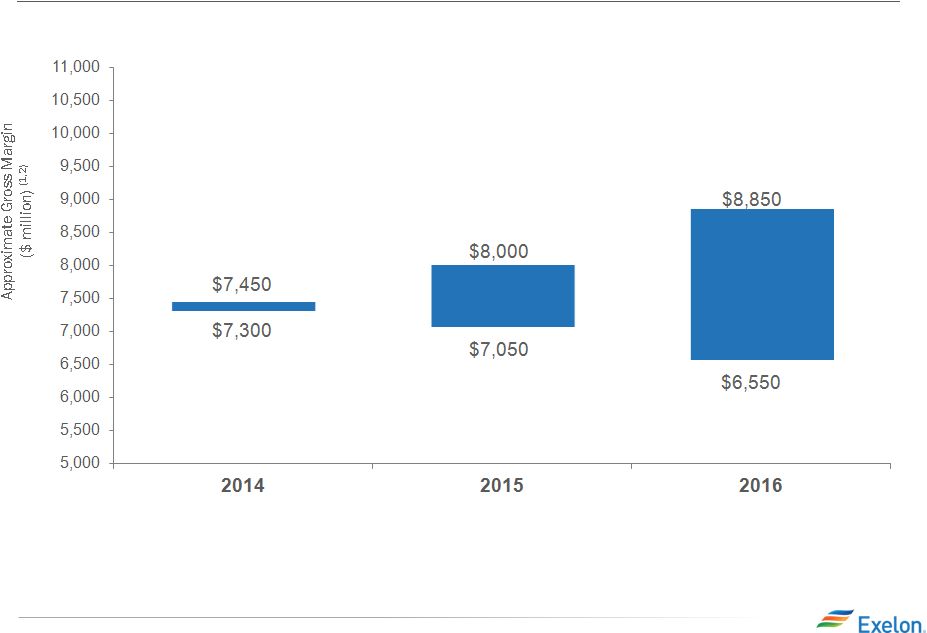 ExGen Hedged Gross Margin Upside/Risk 15 2014 3Q Earnings Release Slides Note: Reflects the divestiture impact of Fore River, Quail Run and West Valley. Does not include divestiture impact of Keystone/Conemaugh (1) Represents an approximate range of expected gross margin, taking into account hedges in place, between the 5th and 95th percent confidence levels assuming all unhedged supply is sold into the spot market. Approximate gross margin ranges are based upon an internal simulation model and are subject to change based upon market inputs, future transactions and potential modeling changes. These ranges of approximate gross margin in 2015 and 2016 do not represent earnings guidance or a forecast of future results as Exelon has not completed its planning or optimization processes for those years. The price distributions that generate this range are calibrated to market quotes for power, fuel, load following products, and options as of September 30, 2014 (2) Gross Margin Upside/Risk based on commodity exposure which includes open generation and all committed transactions. |
 (1) Mark-to-market rounded to the nearest $5 million. (2) Total Gross Margin (Non-GAAP) is defined as operating revenues less purchased power and fuel expense, excluding revenue related to decommissioning, gross receipts tax, Exelon Nuclear Partners and variable interest entities. Total Gross Margin is also net of direct cost of sales for certain Constellation businesses. See Slide 25 for a Non-GAAP to GAAP reconciliation of Total Gross Margin. Note: Reflects the divestiture impact of Fore River, Quail Run and West Valley. Does not include divestiture impact of Keystone/Conemaugh Illustrative Example of Modeling Exelon Generation 2015 Gross Margin Row Item Midwest Mid- Atlantic ERCOT New York New England South, West & Canada (A) Start with fleet-wide open gross margin $6.75 billion (B) Expected Generation (TWh) 97.0 71.3 16.4 9.4 7.1 (C) Hedge % (assuming mid-point of range) 84.5% 89.5% 100.5% 88.5% 83.5% (D=B*C) Hedged Volume (TWh) 82.0 63.8 16.4 8.3 5.9 (E) Effective Realized Energy Price ($/MWh) $33.50 $42.50 $8.50 $42.50 $11.50 (F) Reference Price ($/MWh) $33.70 $42.75 $6.47 $42.14 $8.95 (G=E-F) Difference ($/MWh) $(0.20) $(0.25) $2.03 $0.36 $2.55 (H=D*G) Mark-to-market value of hedges ($ million) (1) $(15) million $(15) million $30 million $5 million $15 million (I=A+H) Hedged Gross Margin ($ million) $6,750 million (J) Power New Business / To Go ($ million) $400 million (K) Non-Power Margins Executed ($ million) $100 million (L) Non- Power New Business / To Go ($ million) $300 million (N=I+J+K+L) Total Gross Margin (2) $7,550 million 2014 3Q Earnings Release Slides 16 |
 Additional Disclosures 2014 3Q Earnings Release Slides 17 |
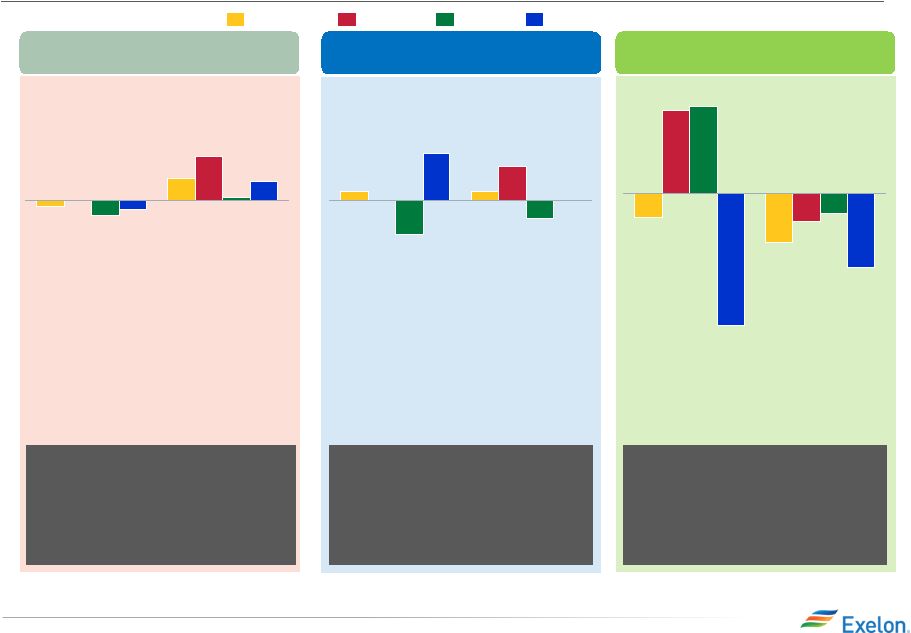 BGE 2014 load growth is weaker than 2013, driven by Large C&I. Weaker economic conditions and continued energy efficiency impacts are offset by steady customer growth. Exelon Utilities Weather-Normalized Load 2014E 0.6% 0.1% 1.4% 0.7% 2013 -0.3% -0.5% 0.0% -0.2% Large C&I Small C&I Residential All Customers ComEd 2014 overall load growth is greater than 2013. All three customer classes have positive growth due to slowly improving economic conditions partially mitigated by energy efficiency. 2014E 0.0% -0.6% 1.1% 0.3% 2013 1.5% -1.1% 0.0% 0.3% PECO 2014 load growth is driven primarily by Residential partially offset by C&I. Slowly improving economic conditions and moderate customer growth are partially offset by energy efficiency. -0.5% -0.7% -1.2% 2013 -3.2% 2.1% 2.0% -0.6% 2014E -1.8% Chicago GMP 1.7% Chicago Unemployment 6.3% Philadelphia GMP 1.2% Philadelphia Unemployment 5.9% Baltimore GMP 2.6% Baltimore Unemployment 6.0% Notes: Data is not adjusted for leap year. Source of economic outlook data is IHS Economics (September 2014). Assumes 2014 GDP of 2.2% and U.S unemployment of 5.9%. ComEd has the ROE collar as part of the distribution formula rate and BGE is decoupled which mitigates the load risk. QTD and YTD actual data can be found in earnings release tables. BGE amounts have been adjusted for true-up load from prior quarters. . 18 2014 3Q Earnings Release Slides |
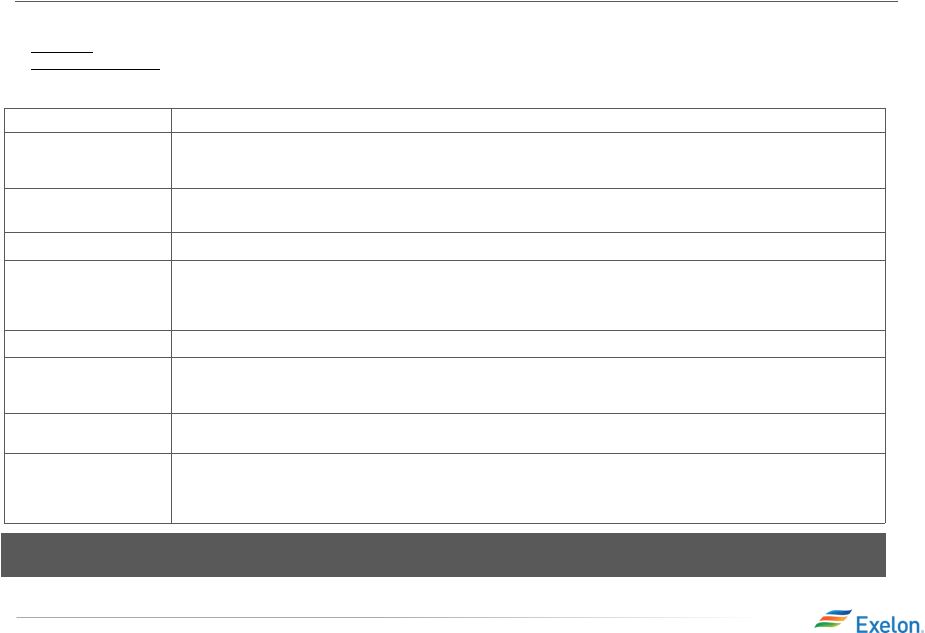 2014 3Q Earnings Release Slides 19 ComEd April 2014 Distribution Formula Rate Docket # 14-0312 Filing Year 2013 Calendar Year Actual Costs and 2014 Projected Net Plant Additions are used to set the rates for calendar year 2015. Rates currently in effect (docket 13-0318) for calendar year 2014 were based on 2012 actual costs and 2013 projected net plant additions Reconciliation Year Reconciles Revenue Requirement reflected in rates during 2013 to 2013 Actual Costs Incurred. Revenue requirement for 2013 is based on docket 13-0386 filed in June 2013 and reflect the impacts of PA 98-0015 (SB9) Common Equity Ratio ~ 46% for both the filing and reconciliation year ROE 9.25% for the filing year (2013 30-yr Treasury Yield of 3.45% + 580 basis point risk premium) and 9.20% for the reconciliation year (2013 30-yr Treasury Yield of 3.45% + 580 basis point risk premium – 5 basis points performance metrics penalty). For 2014 and 2015, the actual allowed ROE reflected in net income will ultimately be based on the average of the 30-year Treasury Yield during the respective years plus 580 basis point spread, absent any metric penalties Requested Rate of Return ~ 7% for the both the filing and reconciliation Year Rate Base (1) $7,369 million– Filing year (represents projected year-end rate base using 2013 actual plus 2014 projected capital additions). 2014 and 2015 earnings will reflect 2014 and 2015 year-end rate base respectively. $6,596 million - Reconciliation year (represents year-end rate base for 2013) Revenue Requirement Increase (1) $269M ($96M is due to the 2013 reconciliation, $173M relates to the filing year). The 2013 reconciliation impact on net income was recorded in 2013 as a regulatory asset. Timeline (1) Amounts represent ComEd’s position filed in rebuttal testimony on July 23, 2014. Note: Disallowance of any items in the 2014 distribution formula rate filing could impact 2014 earnings in the form of a regulatory asset adjustment. Given the retroactive ratemaking provision in the EIMA legislation, ComEd net income during the year will be based on actual costs with a regulatory asset/liability recorded to reflect any under/over recovery reflected in rates. Revenue Requirement in rate filings impacts cash flow. The 2014 distribution formula rate filing establishes the net revenue requirement used to set the rates that will take effect in January 2015 after the ICC’s review. There are two components to the annual distribution formula rate filing: • Filing Year: Based on prior year costs (2013) and current year (2014) projected plant additions. • Annual Reconciliation: For the prior calendar year (2013), this amount reconciles the revenue requirement reflected in rates during the prior year (2013) in effect to the actual costs for that year. The annual reconciliation impacts cash flow in the following year (2015) but the earnings impact has been recorded in the prior year (2013) as a regulatory asset. • 04/16/14 Filing Date • 240 Day Proceeding • ALJ Proposed Order issued on 10/15/14 proposes a $239M revenue requirement increase • ICC order expected by December 12, 2014 |
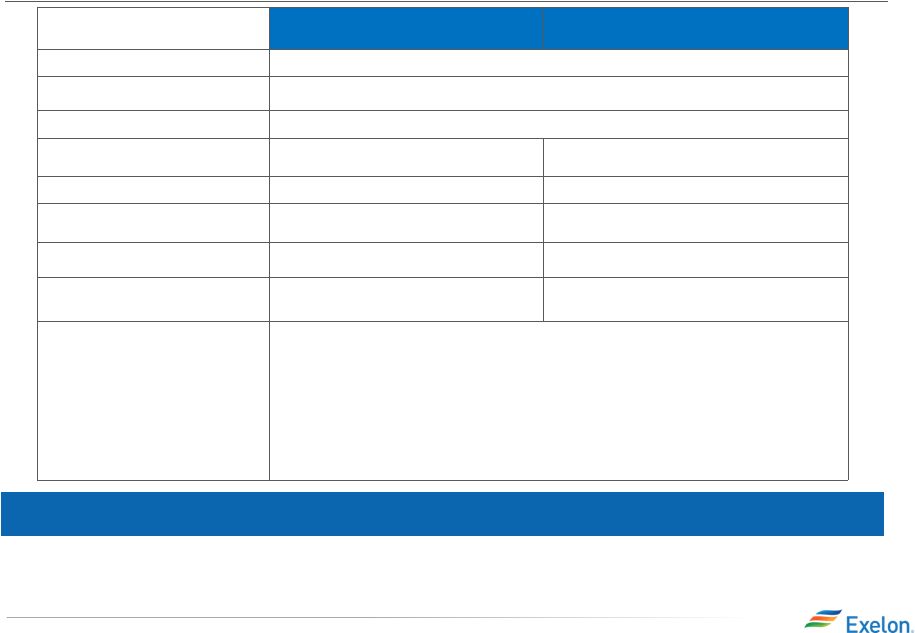 2014 3Q Earnings Release Slides 20 BGE Rate Case Settlement Electric Gas Docket # 9355 Test Year September 2013 - August 2014 Common Equity Ratio (1)(2) 52.3% Authorized Returns (1)(3) ROE: 9.75%; ROR: 7.46% ROE: 9.65%; ROR: 7.41% Requested Rate of Return 7.93% 7.88% Proposed Rate Base (adjusted) (1)(4) $2.9B $1.2B Revenue Requirement Increase $22.0M $38.0M Distribution Increase as % of overall bill 1% 5% Timeline (1) Due to the “black box” nature of the settlement, the Common Equity Ratio, Authorized Returns, and Proposed Rate Base (adjusted) were not agreed upon by the parties in determining the ultimate revenue requirement increase. (2) Reflects BGE’s actual capital structure as of 8/31/2014 (3) ROE and ROR stated in the settlement only apply to AFUDC and carrying costs on regulatory assets (4) BGE’s Proposed Adjusted rate base. First BGE rate case settlement agreement since 1999 • 07/02/14 BGE filed application with the MDPSC seeking increases in electric & gas distribution base rates • 210 Day Proceeding • 7/08/14 – Case delegated to the Public Utility Law Judge Division • 10/17/14 – BGE filed unanimous “black box” settlement with MD PSC • Settlement must be approved by the MD PSC • If approved, new rates are expected to be effective no sooner than the middle of December, 2014 |
 Appendix Reconciliation of Non-GAAP Measures 2014 3Q Earnings Release Slides 21 |
 3Q GAAP EPS Reconciliation Three Months Ended September 30, 2014 ExGen ComEd PECO BGE Other Exelon 2014 Adjusted (non-GAAP) Operating Earnings (Loss) Per Share $0.50 $0.15 $0.09 $0.05 $(0.01) $0.78 Mark-to-market impact of economic hedging activities 0.19 - - - - 0.18 Unrealized losses related to NDT fund investments (0.03) - - - - (0.03) Asset retirement obligation 0.02 - - - - 0.02 Plant retirements and divestitures 0.23 - - - - 0.23 Long-lived asset impairment (0.03) - - - - (0.03) Merger and integration costs (0.05) - - - (0.02) (0.07) Amortization of commodity contract intangibles 0.01 - - - - 0.01 Tax settlements 0.08 - - - - 0.08 Noncontrolling interest (0.02) - - - - (0.02) 3Q 2014 GAAP Earnings (Loss) Per Share $0.90 $0.15 $0.09 $0.05 $(0.03) $1.15 NOTE: All amounts shown are per Exelon share and represent contributions to Exelon's EPS. Amounts may not add due to rounding. 2014 3Q Earnings Release Slides 22 Three Months Ended September 30, 2013 ExGen ComEd PECO BGE Other Exelon 2013 Adjusted (non-GAAP) Operating Earnings (Loss) Per Share $0.47 $0.15 $0.11 $0.06 $(0.02) $0.78 Mark-to-market impact of economic hedging activities 0.18 - - - - 0.17 Unrealized gains related to NDT fund investments 0.03 - - - - 0.03 Asset retirement obligation (0.01) - - - - (0.01) Long-lived asset impairment (0.03) - - - - (0.03) Merger and integration costs (0.02) - - - - (0.03) Amortization of commodity contract intangibles (0.05) - - - - (0.05) 3Q 2013 GAAP Earnings (Loss) Per Share $0.57 $0.15 $0.11 $0.06 $(0.02) $0.86 |
 3Q YTD GAAP EPS Reconciliation Nine Months Ended September 30, 2014 ExGen ComEd PECO BGE Other Exelon 2014 Adjusted (non-GAAP) Operating Earnings (Loss) Per Share $1.07 $0.39 $0.30 $0.17 $(0.02) $1.91 Mark-to-market impact of economic hedging activities (0.34) - - - - (0.34) Unrealized gains related to NDT fund investments 0.07 - - - - 0.07 Asset retirement obligation 0.02 - - - - 0.02 Plant retirements and divestitures 0.23 - - - - 0.23 Long-lived asset impairment (0.10) - - - (0.02) (0.11) Gain on CENG integration 0.18 - - - - 0.18 Merger and integration costs (0.09) - - - (0.03) (0.12) Amortization of commodity contract intangibles (0.05) - - - - (0.06) Tax settlements 0.12 - - - - 0.12 Noncontrolling interest (0.04) - - - - (0.04) 3Q 2014 GAAP Earnings (Loss) Per Share $1.07 $0.39 $0.30 $0.17 $(0.07) $1.86 NOTE: All amounts shown are per Exelon share and represent contributions to Exelon's EPS. Amounts may not add due to rounding. 2014 3Q Earnings Release Slides 23 Nine Months Ended September 30, 2013 ExGen ComEd PECO BGE Other Exelon 2013 Adjusted (non-GAAP) Operating Earnings (Loss) Per Share $1.18 $0.36 $0.34 $0.16 $(0.06) $2.00 Mark-to-market impact of economic hedging activities 0.20 - - - (0.00) 0.21 Unrealized gains related to NDT fund investments 0.04 - - - - 0.04 Asset retirement obligation (0.01) - - - - (0.01) Plant retirements and divestiture 0.02 - - - - 0.01 Long-lived asset impairment (0.12) - - - (0.01) (0.13) Merger and integration costs (0.07) - (0.01) 0.00 (0.00) (0.08) Amortization of commodity contract intangibles (0.32) - - - - (0.32) Remeasurement of like kind exchange tax position - (0.20) - - (0.11) (0.31) Amortization of the fair value of certain debt 0.01 - - - - 0.01 3Q 2013 GAAP Earnings (Loss) Per Share $0.93 $0.16 $0.33 $0.17 $(0.18) $1.42 |
 GAAP to Operating Adjustments NOTE: All amounts shown are per Exelon share and represent contributions to Exelon's EPS. Amounts may not add due to rounding. 2014 3Q Earnings Release Slides 24 • Exelon’s 2014 adjusted (non-GAAP) operating earnings excludes the earnings effects of the following: - Mark-to-market adjustments from economic hedging activities - Unrealized gains and losses from NDT fund investments to the extent not offset by contractual accounting as described in the notes to the consolidated financial statements - Financial impacts associated with the increase and decrease in certain decommissioning obligations - Financial impacts associated with the sale of interests in generating stations - Non-cash charge to earnings related to the cancellation of previously capitalized nuclear uprate projects and the impairment of certain wind generating assets and certain assets held for sale - Gain recorded upon consolidation of CENG - Certain costs incurred associated with the Constellation and Pepco Holdings, Inc. mergers and integration initiatives. Also includes costs to integrate CENG - Non-cash amortization of intangible assets, net, related to commodity contracts recorded at fair value at the merger date for 2014 - Favorable settlements of certain income tax positions on Constellation’s 2009-2012 tax returns - CENG interest not owned by Generation, where applicable |
 ExGen Total Gross Margin Reconciliation to GAAP Total Gross Margin Reconciliation (in $M) (5) 2014 2015 2016 Revenue Net of Purchased Power and Fuel Expense (1)(6) $7,800 $8,150 $8,150 Non-cash amortization of intangible assets, net, related to commodity contracts recorded at fair value at the merger date (2) $100 - - Other Revenues (3) $(200) $(250) $(250) Direct cost of sales incurred to generate revenues for certain Constellation businesses (4) $(300) $(350) $(300) Total Gross Margin (Non-GAAP, as shown on slide 14) $7,400 $7,550 $7,600 2014 3Q Earnings Release Slides 25 (1) Revenue net of purchased power and fuel expense (RNF), a non-GAAP measure, is calculated as the GAAP measure of operating revenue less the GAAP measure of purchased power and fuel expense. ExGen does not forecast the GAAP components of RNF separately. RNF excludes EDF’s equity ownership share of CENG (2) The exclusion from operating earnings for activities related to the merger with Constellation ends after 2014 (3) Reflects revenues from Exelon Nuclear Partners, variable interest entities, funds collected through revenues for decommissioning the former PECO nuclear plants through regulated rates and gross receipts tax revenues (4) Reflects the cost of sales and depreciation expense of certain Constellation businesses of Generation (5) All amounts rounded to the nearest $50M (6) Excludes the impact of the operating exclusion for mark-to-market due to the volatility and unpredictability of the future changes to power prices. Mark-to- market losses were ~$500 million for the nine months ended September 30, 2014 |