Dear Shareholder,
“The longer the bull market lasts the more severely investors will be affected with amnesia; after five years or so, many people no longer believe that bear markets are possible.”
− Benjamin Graham and David L. Dodd, Security Analysis, 1934
The Hussman Funds continue to adhere to a historically-informed, value-conscious investment discipline focused on the complete market cycle. While our commitment to that investment discipline remains as strong as it was in market cycles prior to the advancing half-cycle that began in 2009, the current segment of this market cycle has remained challenging, because it reflects unusual tension between what can properly be considered investment and what can only be considered speculation.
Performance horizons that capture a trough-to-peak movement in the major indices are typically unkind to hedged-equity strategies, both because the performance of value-oriented stocks can lag the market during mature bull market advances, particularly at extreme valuations, and also because any hedging against downside risk will not have been rewarded.
The one-year period ended June 30, 2017 featured an extension of already extreme market valuations, coupled with generally tepid market action among value-oriented stocks. This combination was difficult for our hedged equity strategies, with losses of -15.53% in Strategic Growth Fund (also partially attributable to decay in the time-value of index put options), -2.32% in Strategic Value Fund, and -4.24% in Strategic International Fund. Meanwhile, both Treasury bonds and precious metals shares declined during this period, contributing to a -3.50% loss in Strategic Total Return Fund.
Our patience with the discomfort of not participating, and even losing value, during the recent market advance can only be understood in the context of the historical consequences of similar speculative episodes (and the returns that were often possible by avoiding them). It is a discipline that we have needed to exercise before, and it is a rather lonely place to be, at least at similar points in the market cycle. As I observed in our June 30, 2007 Annual Report, shortly before the Standard & Poor’s 500 Index lost more than -55% of its value:
“My unwillingness to speculate by accepting market risk in these richly valued and overextended conditions has demanded your patience, for which I am apologetic, and your trust, for which I am grateful. I believe that it remains the correct action to adhere to a disciplined, well-tested, value- conscious investment strategy... It is appropriate to
5
The Hussman Funds |
Letter to Shareholders (continued) |
avoid speculative risk in environments where speculative risk has historically produced poor average returns, even if speculative risk turns out to be rewarding in a specific instance. Similarly, it is appropriate to avoid the purchase of investments whose price is not well supported by an expected and reasonably predictable stream of cash flows, even if such investments turn out to be rewarding in a speculative environment. There are many speculative vehicles available for investors who choose to accept such risks. There is little reason to add the Hussman Funds to that list.”
Evidence from a century of market cycles suggests that investors should be skeptical about score-keeping at points where market valuations deviate dramatically from historical norms. When valuations are deeply depressed, past market returns typically appear dismal, and encourage investors to abandon market risk exactly when they should embrace it. Conversely, when valuations are extremely elevated, past returns typically appear glorious, and encourage investors to embrace market risk exactly when they should abandon it.
Prospective market losses over the complete cycle
“Investors have turned the market into a carnival, where everybody ‘knows’ that the new rides are the good rides, and the old rides just don’t work. Where the carnival barkers seem to hand out free money for just showing up. Unfortunately, this business is not that kind - it has always been true that in every pyramid, in every easy-money sure-thing, the first ones to get out are the only ones to get out... One of the things that you may have noticed is that our downside targets for the market don’t simply slide up in parallel with the market. Most analysts have an ingrained ‘15% correction’ mentality, such that no matter how high prices advance, the probable maximum downside risk is just 15% or so (and that would be considered bad). Factually speaking, however, that’s not the way it works... The inconvenient fact is that valuation ultimately matters. That has led to the rather peculiar risk projections that have appeared in this letter in recent months. Trend uniformity helps to postpone that reality, but in the end, there it is... Over time, price/revenue ratios come back into line. Currently, that would require an 83% plunge in tech stocks (recall the 1969-70 tech massacre). The plunge may be muted to about 65% given several years of revenue growth. If you understand values and market history, you know we’re not joking.”
− John P. Hussman, Ph.D., Hussman Econometrics, March 7, 2000
There is no assurance that my concerns about current extremes will be validated as strongly as those I expressed in 2000 or 2007, nor do we require a market collapse as a prerequisite for a constructive or aggressive market outlook. Still, the most reliable measures of valuation we identify (those most strongly correlated with
6
The Hussman Funds |
Letter to Shareholders (continued) |
actual subsequent 10-12 year market returns) currently stand between 140-170% above historical norms that have been approached or breached by the completion of nearly every market cycle in history, including the most recent cycle that ended with the 2009 lows.
Across numerous valuation measures we have studied over time, the most reliable ones share a common feature: they focus on identifying “sufficient statistics” for the very, very long-term stream of cash flows that stocks can be expected to deliver into the hands of investors over time. Because profit margins vary considerably over time (largely reflecting shorter-run differences between productivity growth and real wage growth), market valuation measures that are linked to revenues typically show a stronger correlation with actual subsequent market returns than measures based on current or year-ahead earnings.
The price/revenue ratio of the S&P 500 currently stands at the highest level ever observed, with the exception of the 2000 market peak. Notably, the median price/revenue ratio across individual S&P 500 component stocks has already surpassed every prior top, extending more than 50% beyond its peak in 2000, and over 40% beyond its peak in 2007. This elevation reflects a profoundly broad valuation extreme compared with the 2000 and 2007 peaks and extends far beyond any narrow subset of stocks. Grouping S&P 500 component stocks into deciles according to their price/revenue ratios, we find that over the completion of prior market cycles, the median loss of stocks in each decile has been closely related to the median price/revenue ratio of that decile, relative to its own respective norm.
For example, at the March 2000 bubble peak, the extreme valuation of the S&P 500 Index was largely driven by a single decile of stocks, primarily comprising large-capitalization companies in the technology industry. At that time, an understanding of market history (including the outcomes of prior speculative episodes) enabled the seemingly preposterous but accurate estimate that large-cap technology stocks faced potential losses of approximately -83% over the completion of the market cycle. At the same time, however, the prospective loss for the least expensive half of S&P 500 component stocks was only about -25%. That difference allowed investors to mitigate much of the damage from the 2000-2002 market collapse, provided they were not heavily invested in technology stocks, and were willing to deviate considerably from a capitalization-weighted portfolio.
At the 2007 market peak, by contrast, stocks were generally overvalued enough to indicate prospective losses of about -55% for all but the very lowest price/revenue decile. That risk was realized in the form of widespread and indiscriminate losses
7
The Hussman Funds |
Letter to Shareholders (continued) |
across all sectors during the market collapse that followed, even though financial stocks were hardest hit. By the 2009 market low, all ten price/revenue deciles ended the cycle at multiples below their respective historical norms.
In my view, investors are vastly underestimating the prospects for market losses over the completion of this cycle; are overestimating the availability of “safe” stocks or sectors that might avoid the damage; and are overestimating both the likelihood and the need for some recognizable “catalyst” to emerge before severe market losses unfold. We presently estimate median losses of about -63% in S&P 500 component stocks over the completion of the current market cycle. There is not a single decile of stocks for which we expect market losses of less than about -54% over the completion of the current market cycle, and we estimate that the richest deciles could lose about -67% to -69% of their market capitalization. As in 2000 and 2007, I believe that investors are mistaking a wildly reckless world for a permanently changed one, and that their reeducation in the concept that valuations matter is likely to be predictably brutal.
Even a brief return to historically run-of-the-mill valuations would presently require a market loss in the S&P 500 Index on the order of -63%. No market cycle in history, including those featuring very low interest rates, has failed to bring these valuation measures to about 60% of present levels or lower, implying that a -40% market loss expectation would be conservative. Neither outcome would bring the S&P 500 Index below its historical valuation norms on the most reliable measures we identify. I believe that investors should allow for a decline in the S&P 500 Index to less than half of its current level over the completion of the current market cycle, quite possibly moving below the 1000 level. While my corresponding estimates of likely market losses for the major indices in 2000 and 2007 may have appeared equally preposterous, they were ultimately accurate.
Investment merit and speculative merit
One of the central lessons from market cycles across history is that valuation – the price of a security relative to the stream of future cash flows expected to be delivered into investors’ hands over time – is the primary driver of long-term and full-cycle investment returns. Indeed, we observe correlations near 90% between several reliable measures of valuation and actual subsequent 10-12 year total returns in the S&P 500 Index. Based on the consensus of these measures, current equity market valuations now exceed every point in history except the extreme reached during the single week of March 24, 2000, at the peak of the technology bubble.
8
The Hussman Funds |
Letter to Shareholders (continued) |
Among scores of valuation measures we have tested or introduced over time, the ratio of nonfinancial market capitalization to corporate gross value-added, including estimated foreign revenues (MarketCap/GVA), has a stronger relationship with subsequent market returns than any alternative we have examined, including popular measures such as market capitalization/GDP, Robert Shiller’s cyclically-adjusted price/earnings ratio, the S&P 500 price/earnings ratio using forward operating earnings, and the S&P 500 forward operating earnings yield divided by the 10-year Treasury yield (the so called “Fed Model”). Based on this measure, we currently estimate prospective S&P 500 nominal total returns averaging just 0.3% annually over the coming-12 year period.
Put simply, valuations exert an enormous impact on the full-cycle and long-term returns that investors can expect from equity market investments.
At the same time, value-conscious investors also need to recognize the tendency for speculation to dominate market behavior over shorter segments of the market cycle. Confronted with this fact during the late-1990’s technology bubble, many investors appeared to discard valuations entirely. I believed that a better question was “what distinguishes an overvalued market that continues to advance from an overvalued market that drops like a rock?” Examining market cycles across history, the distinction between those two outcomes had little to do with the level valuation, and instead typically depended on certain features of market action; particularly what I termed the “uniformity” of price behavior across a wide range of securities, industries, sectors, and security-types. Essentially, when investors are inclined to speculate, they tend to be indiscriminate about it. In contrast, when an overvalued market shows signs of dispersion across various sectors and security-types, it typically becomes most vulnerable to steep losses.
The respected value investor Ben Graham once observed, “The distinction between investment and speculation in common stocks has always been a useful one and its disappearance is a cause for concern.” I believe that it remains useful to make that distinction explicit. Investment merit is based on valuation, while speculative merit is based on market action, including the uniformity of internals across a wide range of securities, which we take as a signal of the psychological preference of investors to speculate. We find that stocks have historically become vulnerable to steep losses when our measures of both valuation and market action are unfavorable. In contrast, we find that the strongest market return/risk profiles in market cycles across history typically emerge when a material retreat in valuations is joined by an early improvement in our measures of market action.
9
The Hussman Funds |
Letter to Shareholders (continued) |
Why “this time” was different
The distinction between the “investment merit” of favorable valuation, and “speculative merit” of favorable market action served us well until 2009. While we anticipated the 2007-2009 market downturn, the severe economic fallout during the crisis was wholly “out of sample” from the standpoint of post-war data on which our existing methods were based. This led me to insist on stress-testing our methods of classifying market return/risk profiles against Depression-era data. The period since then has been unusually challenging for our investment discipline. While we can’t go back in time and repeat this period with the lessons we’ve drawn from it, my impression is that the best way to explain our enthusiasm and commitment toward our investment discipline is to discuss this period, and its implications for future market cycles.
As we worked to increase the robustness of our methods in Depression-era data, I discussed the effort as our “two data sets problem,” and in the midst of that ambiguity, we missed a substantial market rebound that both our pre-2009 methods and our current methods could have captured. The resulting “ensemble” methods performed better across every data set than our existing methods, and strengthened our confidence in the usefulness of combining valuations and market action when classifying return/risk conditions. But they also captured a historical regularity that turned out to be our Achilles Heel in the face of the Federal Reserve’s zero interest rate policy.
In prior market cycles across history, extreme “overvalued, overbought, overbullish” features of market action were regularly accompanied or quickly followed by a shift toward risk-aversion among investors (which we infer from the uniformity of internals across a wide range of securities and security types). Because of that overlap, these “overvalued, overbought, overbullish” syndromes, in and of themselves, could historically be taken as reliable warnings of likely air-pockets, panics, or crashes.
Unfortunately, the Federal Reserve’s zero interest rate policies disrupted that overlap. With the relentless encouragement of the Fed, investors came to believe that there was no alternative to speculating in stocks, and even obscene valuations and overextended conditions were followed by further speculation, without any shift toward risk-aversion. In the face of zero interest rates, it was necessary to wait until market internals deteriorated explicitly before adopting a hard-negative market outlook.
Clearly, our persistent defensiveness in response to overvalued, overbought, overbullish conditions was wrong in the face of zero interest rate policy. Still, correcting that wrong revealed a great deal about the underlying truth. The lesson to be learned was not that the Fed’s policies of quantitative easing and zero interest rates were omnipotent in supporting stock prices. The lesson was not that valuations were
10
The Hussman Funds |
Letter to Shareholders (continued) |
irrelevant, or that “this time was different” in ways that investors could not comprehend. The lesson was not that low interest rates made stocks “cheap” at any price. Rather, the lesson was that in the presence of zero interest rates, yield-seeking speculation could persist even in the face of obscene valuations and recklessly overextended conditions. In the presence of zero interest rates, one can take a neutral market outlook, but one has to defer a negative market outlook until the uniformity of market internals deteriorates explicitly.
We implemented that restriction to our approach in 2014. It is a fair question, then, to ask why our challenges in this half-cycle have continued beyond 2014. Part of the answer relates to what we view as an extended, late-stage top formation in stocks. While the major indices experienced a moderate correction in early-2016, fresh rounds of speculation followed both the British vote to exit the European Union and the U.S. election results, extending the bull market advance to what is now the second-longest in history. Market action during this period has recruited far less uniformity among market internals than was observed prior to mid-2014; a situation that continues to leave recent gains vulnerable to steep and abrupt losses.
Still, one of the principal challenges for value-conscious investment strategies since mid-2104, including our own, has emerged not because of extreme valuations, but because of an exodus among investors to “passive indexing” strategies, focused on replicating the portfolio composition of the S&P 500 Index, regardless of the valuation of the underlying components. This has been coupled with a concentration of gains among a small number of large-capitalization companies in the internet sector.
As I observed approaching the 2007 market peak, performance gaps between value-centric portfolios and the major indices tend to occur when the major indices themselves are at points of steep overvaluation and record highs. This tendency has recently been evident in our own stock-selection disciplines as well. In Strategic Growth Fund, for example, excluding the impact of hedging transactions, the portfolio of stocks held by the Fund enjoyed a total return of 266.78% in the period from July 24, 2000 through June 30, 2014, compared with a total return of 75.21% in the S&P 500. However, from June 30, 2014 through June 30, 2017, the stock-selections of the Fund had a total return of just 12.64%, compared with a total return of 31.70% in the S&P 500. Since Strategic Growth Fund typically hedges market risk with offsetting short sales in a combination of market indices, this difference in performance contributed to a loss for the Fund. The same tendency has been true in Strategic Value Fund, where the cumulative total return of stocks held by the Fund since June 30, 2014 has been 10.76%, lagging the performance of the S&P 500, which is the Fund’s primary hedging vehicle.
11
The Hussman Funds |
Letter to Shareholders (continued) |
While this behavior has clearly created challenges for value-conscious investors, I believe that it can also create opportunities. In our study of numerous effective stock-selection approaches across history, all of them have experienced periods when their performance has lagged the performance of the major indices, sometimes for a span of a few years. The reversal of these performance gaps is not assured, but they can often represent opportunities for disciplined investors. Indeed, the primary driver of strong performance in Strategic Growth Fund during the 2000-2002 market collapse was its value-conscious focus on stocks that did not closely mirror the composition of the major indices.
Extremes in two pendulums
There are two conclusions to be drawn from our experience in the advancing half-cycle since 2009. First, much of our difficulty prior to mid-2014 was an inadvertent consequence of our 2009 stress-testing efforts, coupled with extraordinary Federal Reserve policies that encouraged persistent speculation well after the emergence of “overvalued, overbought, overbullish” syndromes, which had reliably signaled heightened risk in prior market cycles across history. This difficulty was addressed by the adaptations that we introduced in 2014. In the presence of zero interest rate conditions, even the most extreme overvalued, overbought, overbullish conditions must be joined by an explicit deterioration in our measures of market internals before adopting a strongly negative market outlook. I believe that our 2014 adaptations will likely enable us better to navigate the Funds through future market cycles, even if similarly extraordinary monetary policies become a regular feature of the financial markets.
Second, the challenges since mid-2014 have been due partly to extremely overvalued market conditions that have not yet resolved (despite the present dispersion we observe in market internals), and partly to what appears to be valuation-insensitive performance-chasing in capitalization-weighted indices such as the S&P 500. While we can’t identify the point when this behavior will reverse, we’ve observed similar periods of transitory underperformance in numerous historically effective stock-selection approaches. Our adherence to a value-conscious stock selection approach remains grounded in historically-informed discipline rather than any specific expectation for a near-term reversal.
I believe that our pre-2014 challenges have been addressed, and that the more recent ones will prove transitory, as they have in prior market cycles. On both fronts, I remain convinced that our investment discipline is well-suited to navigate the completion of the current market cycle and future ones, combining value-conscious stock selection with pursuit of strong full-cycle market returns and reduced exposure to
12
The Hussman Funds |
Letter to Shareholders (continued) |
major market downturns. The effectiveness of our investment discipline in navigating complete market cycles was clearly evident prior to the advancing half-cycle that began in 2009. Our challenges since then have reflected extremes in two pendulums, one relating to general market valuations, and the other relating to performance-chasing in capitalization-weighted indices.
Profit margins, interest rates, and economic growth
Three considerations regarding the financial and economic landscape are worth noting. The first relates to profit margins. Despite the notion that recent record profit margins will be sustained indefinitely, it is useful to recognize that fluctuations in U.S. profit margins move hand-in-hand with fluctuations in real unit labor costs, which essentially measure the cost of labor as a fraction of the price per unit of output. Notably, the sustained trend toward falling labor costs quietly reversed several years ago, as did the sustained ascent of nonfinancial profit margins in the U.S. economy. Operating profit margins for the S&P 500 Index also peaked in the third quarter of 2014. Profit margins are likely to remain elevated only to the extent that the sum of price inflation and productivity growth materially outpaces wage inflation. In a tightening labor market with chronically low productivity growth, this prospect has diminished.
The second consideration relates to interest rates. While Wall Street has placed a great deal of faith in the notion that low interest rates “justify” elevated market valuations, we observe precious little analysis to quantify this impact. Investors often misinterpret the form, reliability, and magnitude of the relationship between valuations and interest rates, and become confused about when interest rate information is needed and when it is not. Specifically, given a set of expected future cash flows and the current price of the security, one does not need any information about interest rates at all to estimate the long-term return on that security. The price of the security and the cash flows are sufficient statistics to estimate the expected return. At that point, we can compare it with competing returns on bonds, to judge whether we think it is adequate, but no knowledge of interest rates is required to “adjust” the arithmetic.
On the other hand, given a set of expected cash flows, the level of interest rates can be used to help investors decide what level of returns to demand, and to then calculate the price they are willing to pay. Consider the effect of a given departure of interest rates from normal levels. Suppose investors believe that market valuations should be tightly related to the level of interest rates (the correlation actually goes the wrong way outside of the 1970-1998 period, but suppose we assume otherwise). One can show using any discounted cash flow approach that if interest rates are expected to be say, 3% below average for the entire decade ahead, then market
13
The Hussman Funds |
Letter to Shareholders (continued) |
valuations ought to be roughly 30% higher than historical norms (essentially 3% x 10 years), in order to reduce market returns commensurately. Unfortunately, the most reliable valuation measures (those most tightly correlated with actual subsequent market returns in cycles across history) are currently between 140-170% above their respective historical norms.
The third consideration relates to economic growth. Even in the absence of a recession, demographic and savings-investment conditions limit the likely trend of U.S. real GDP growth to less than 2% annually in years ahead, even in the absence of an outright recession. Real GDP growth is driven by the sum of labor force growth and productivity. As of July 2017, the U.S. labor force stood at 160.5 million workers. Based on population and demographic factors, the U.S. Bureau of Labor Statistics projects that the U.S. labor force will reach 163.8 million workers by 2024. Even if the unemployment rate remains at its current level of just 4.3%, the resulting contribution to GDP growth would average just 0.3% annually. Any further increase in GDP must come from productivity growth. Over the past decade, productivity growth has declined from a post-war average of 2% to a growth rate of just 1% annually, with growth of just 0.6% annually over the past 5 years.
These considerations highlight the difficulty with current valuation levels. As matter of asset pricing, lower interest rates “justify” higher valuation multiples for stocks only if the growth rate of future cash flows is held constant. The effect of a higher valuation multiple is to reduce the prospective future return on stocks to a level more aligned with interest rates. However, if lower interest rates are matched by lower growth rates, the prospective future returns of the market fall, in alignment with those lower interest rates, but no increase in valuation multiples is required.
If lower interest rates are matched by lower growth rates, it is profoundly mistaken to drive valuation multiples higher, because future market returns are then effectively penalized twice. This is my impression of what investors have actually done. Worse, because investors are paying rich multiples of earnings that are already elevated by cyclically-high profit margins, we presently expect negative S&P 500 nominal annual total returns over the coming decade, with total returns averaging just 0.3% annually over the coming 12-year horizon, and interim losses on the order of -63%.
Meanwhile, although many international markets presently appear less steeply overvalued than the U.S. markets, international stocks tend to amplify, rather than diversify, portfolio losses during periods where the U.S. markets decline. In Strategic International Fund, we expect to remove or reduce our hedges against international equity market risk at the point where the estimated return/risk profile for U.S. markets becomes at least somewhat more constructive.
14
The Hussman Funds |
Letter to Shareholders (continued) |
With the 10-year Treasury bond yield at 2.2%, even a modest further normalization of short–term interest rates would be expected to produce similar returns from a sequence of Treasury bill investments over the coming decade. Accordingly, Strategic Total Return Fund currently maintains a fairly short duration of about 2 years in its bond holdings. As usual, the Fund tends to boost its exposure to long-term bonds opportunistically, in response to higher yields and other factors such as indications of economic weakness. The Fund’s allocation to stocks of companies in the precious metals industry was recently increased to slightly more than 12% of net assets in response to price weakness in these stocks, coupled with other factors including a decline in the value of the U.S. dollar.
Fund Performance
For the fiscal year ended June 30, 2017, Strategic Growth Fund lost -15.53%, attributable to a difference in performance of the stocks held by the Fund, compared with the capitalization-weighted indices the Fund uses to hedge, combined with decay in the time-value of index put options held by the Fund. Strategic Total Return Fund lost -3.50% for the same period, attributable to price declines in both the Treasury bond and precious metals markets. Strategic International Fund lost -4.24% for the same period, and Strategic Value Fund lost -2.32% for the same period, both attributable to modest underperformance of the stocks held by these Funds, relative to the capitalization-weighted indices used to hedge market risk.
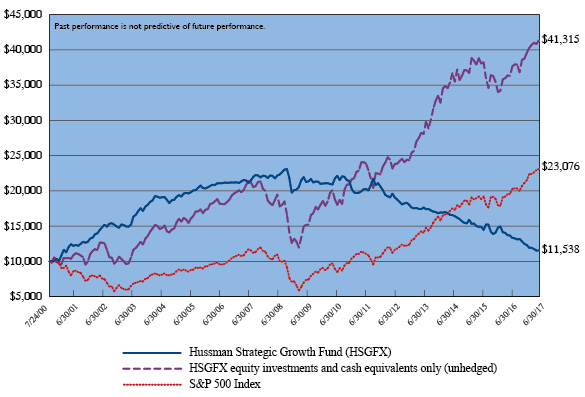
From the inception of Strategic Growth Fund on July 24, 2000 through June 30, 2017, the Fund had an average annual total return of 0.85%, compared with an average annual total return of 5.06% for the S&P 500 Index. An initial $10,000 investment in the Fund on July 24, 2000 would have grown to $11,538, compared with $23,076 for the same investment in the S&P 500 Index. The deepest loss experienced by the Fund since inception was -51.27%. The majority of this loss occurred after the Federal Reserve expanded its policy of quantitative easing (mid-2010) and when we adapted our investment methods to reduce our defensive response to “overvalued, overbought, overbullish” conditions in periods of zero interest rates where market internals had not deteriorated explicitly (mid-2014). The deepest loss experienced by the S&P 500 Index since the inception of the Fund was -55.25%.
From the inception of Strategic Total Return Fund on September 12, 2002 through June 30, 2017, the Fund had an average annual total return of 4.63%, compared with an average annual total return of 4.29% for the Bloomberg Barclays U.S. Aggregate Bond Index. An initial $10,000 investment in the Fund on September 12, 2002 would have grown to $19,539, compared with $18,629 for the same investment in the Bloomberg Barclays U.S. Aggregate Bond Index. The deepest loss
15
The Hussman Funds |
Letter to Shareholders (continued) |
experienced by the Fund since inception was -11.52%, compared with a maximum loss of -5.08% for the Bloomberg Barclays U.S. Aggregate Bond Index during the same period.
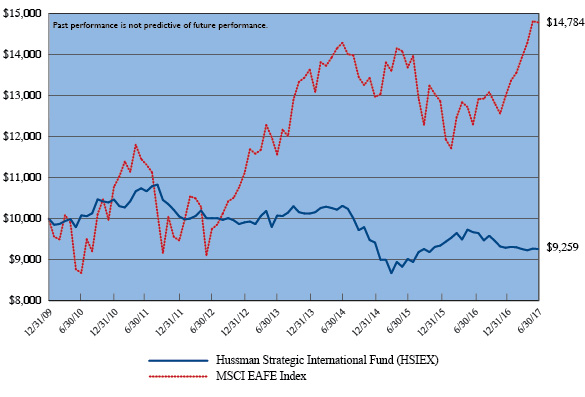
From the inception of Strategic International Fund on December 31, 2009 through June 30, 2017, the Fund had an average annual total return of -1.02%, compared with an average annual total return of 5.35% for the MSCI EAFE Index. An initial $10,000 investment in the Fund on December 31, 2009 would be worth $9,259, compared with $14,784 for the same investment in the MSCI EAFE Index. The deepest loss experienced by the Fund since inception was -21.77%, compared with a maximum loss of -26.48% for the MSCI EAFE Index during the same period.
From the inception of Strategic Value Fund on February 6, 2012 through June 30, 2017, the Fund had an average annual total return of -0.40%, compared with an average annual total return of 13.95% for the S&P 500 Index. An initial $10,000 investment in the Fund on February 6, 2012 would be worth $9,787, compared with $20,239 for the same investment in the S&P 500 Index. The deepest loss experienced by the Fund since inception was -12.20%, compared with a maximum loss of -12.96% for the S&P 500 Index during the same period.
Portfolio Notes
Strategic Growth Fund
The stock selection approach of Strategic Growth Fund has outperformed the S&P 500 Index by an average of 3.67% (367 basis points) annually since the inception of the Fund. During the fiscal year ended June 30, 2017, the stock market displayed substantial dispersion across individual stocks and sectors and the Fund’s stock selections gained 13.81%. The indices that the Fund uses to hedge also displayed strong performance, with the S&P 500 Index, Russell 2000 Index, and Nasdaq 100 Index achieving total returns of 17.90%, 24.60%, and 25.86%, respectively.
Market action during the past year has featured continued dispersion in market internals, as measured by price behavior across a wide range of individual stocks, industries, sectors, and security types, including debt securities of varying credit risk. As this internal dispersion has persisted, the performance of capitalization-weighted indices has become dominated by a handful of the very largest stocks in those indices; a characteristic that was also evident at the 2000 and 2007 market peaks. The Fund was fully-hedged during the past year, and in the face of extreme valuations coupled with deteriorating market internals, the Fund held higher-strike put options as part of its hedge, typically with a less aggressive hedge when various trend-following
16
The Hussman Funds |
Letter to Shareholders (continued) |
measures were favorable (even if our broader measures of market internals were not). We expect that the most reasonable opportunity to reduce hedges and establish a more constructive investment stance will emerge at the point that a material retreat in market valuations is coupled with a firming of market action after such a retreat.
Strategic Total Return Fund
During the fiscal year ended June 30, 2017, Strategic Total Return Fund held a relatively conservative position in bonds, with a duration typically ranging between 1-4 years (meaning that a 100 basis point move in interest rates would be expected to affect Fund value by about 1-4% on the basis of bond price fluctuations). The -3.50% loss during this period was attributable to general market declines in the prices of Treasury bonds and shares of companies engaged in the mining of precious metals.
Strategic International Fund
During the fiscal year ended June 30, 2017, Strategic International Fund was fully hedged against the impact of general market fluctuations. The Fund’s -4.24% loss during this period was attributable to underperformance of stocks held by the Fund, relative to the MSCI EAFE Index. Because of high correlations that occur between international equity markets during steep declines in U.S. markets, we expect the Fund to maintain a relatively defensive stance until our assessment of U.S. market risk becomes more favorable than is presently the case. In the absence of extreme market risk, the Fund will have substantially greater opportunity to establish a constructive investment stance based on valuation, market action and other investment considerations specific to the equity markets of individual countries.
Strategic Value Fund
During the fiscal year ended June 30, 2017, Strategic Value Fund was fully hedged against the impact of general market fluctuations. The Fund’s -2.32% loss during this period was attributable to underperformance of stocks held by the Fund, relative to the S&P 500 Index. As noted above, the largest peak-to-trough drawdown in Strategic Value to date has been -12.20%, compared with a loss of -12.96% in the S&P 500 Index. The volatility of the Fund’s returns (based on daily standard deviation) has been 4.56%, versus 12.40% for that benchmark. Much of this lower drawdown and volatility can be attributed to the hedge held by the Fund against the impact of market fluctuations. The companies in the Fund’s portfolio also tend to have lower variability in sales, earnings, and profit margins, combined with an emphasis on balance sheet stability,
17
The Hussman Funds |
Letter to Shareholders (continued) |
dividend coverage, and favorable estimated valuations relative to the general market. In our view, these characteristics have contributed to lower volatility in the Fund’s stock holdings relative to the S&P 500 Index.
Portfolio Composition
As of June 30, 2017, Strategic Growth Fund had net assets of $375,466,515, and held 113 stocks in a wide variety of industries. The largest sector holdings as a percent of net assets were information technology (37.6%), health care (14.1%), industrials (10.7%), consumer discretionary (10.5%), consumer staples (10.0%), materials (5.5%) and energy (4.6%). The smallest sector weights were in financials (3.6%), utilities (2.6%) and telecommunications (1.2%).
Strategic Growth Fund’s holdings of individual stocks as of June 30, 2017 were valued at $376,935,366. Against these stock positions, the Fund also held 1,000 option combinations (long put option/short call option) on the S&P 500 Index, 500 option combinations on the Russell 2000 Index and 100 option combinations on the Nasdaq 100 Index. Each option combination behaves as a short sale on the underlying index, with a notional value of $100 times the index value. On June 30, 2017, the S&P 500 Index closed at 2,423.41, while the Russell 2000 Index and the Nasdaq 100 Index closed at 1,415.359 and 5,646.918, respectively. The Fund’s total hedge therefore represented a short position of $369,578,120, thereby hedging 98.0% of the dollar value of the Fund’s long investment positions in individual stocks.
Though the performance of Strategic Growth Fund’s diversified portfolio cannot be attributed to any narrow group of stocks, the following equity holdings achieved gains in excess of $5 million during the year ended June 30, 2017: Masimo, NVIDIA, Ulta Beauty, Cirrus Logic, II-VI, Universal Forest Products, Ebix and Mastec, Barrick Gold, Amazon, Newmont Mining and Inphi. Equity holdings with losses in excess of $3 million during this same period were Depomed, Express and First Solar.
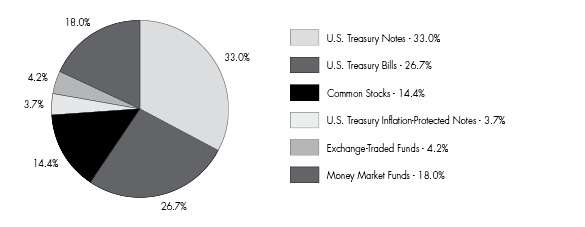
As of June 30, 2017, Strategic Total Return Fund had net assets of $372,501,795. Treasury bills, Treasury notes, Treasury Inflation-Protected Securities (TIPS) and investments in money market funds represented 81.4% of the Fund’s net assets. Shares of exchange-traded funds, precious metals shares and utility shares accounted for 4.2%, 14.1% and 0.3% of net assets, respectively.
In Strategic Total Return Fund, during the year ended June 30, 2017, portfolio gains in excess of $2 million were achieved in U.S. Treasury Inflation-Protected Note (2.50%, due 1/15/2029), U.S. Treasury Note (2.50%, due 8/15/2023), U.S. Treasury
18
The Hussman Funds |
Letter to Shareholders (continued) |
Note (2.50%, due 5/15/2024) and U.S. Treasury Note (1.50%, due 1/31/2019). Holdings with losses in excess of $1 million during this same period were U.S. Treasury Note (1.50%, due 8/15/2026) and U.S. Treasury Note (1.625%, due 5/15/2026).
As of June 30, 2017, Strategic International Fund had net assets of $30,493,884 and held 68 stocks in a wide variety of industries. The largest sector holdings as a percent of net assets were in consumer discretionary (25.4%), information technology (15.5%), industrials (14.8%), financials (14.6%), health care (6.4%), energy (4.8%) and materials (3.9%). The smallest sector weights were in telecommunication services (2.0%), consumer staples (1.3%) and utilities (1.1%). Investments in money market funds accounted for 2.0% of net assets.
In order to hedge the impact of general market fluctuations, as of June 30, 2017, Strategic International Fund was short 285 futures on the Mini MSCI EAFE Index. The notional value of this hedge was $26,926,800, hedging 98.3% of the dollar value of equity investments held by the Fund. When the Fund is in a hedged investment position, the primary driver of Fund returns is the difference in performance between the stocks owned by the Fund and the indices that are used to hedge.
While the investment portfolio of Strategic International Fund is widely diversified and its performance is affected by numerous investment positions, the hedging strategy of the Fund was primarily responsible for the reduced sensitivity of the Fund to market fluctuations from the Fund’s inception through June 30, 2017. Individual equity holdings having portfolio gains in excess of $500,000 during the year ended June 30, 2017 included ABC-Mart and Fujitsu General. The only equity holding with a portfolio loss in excess of $200,000 during this period was Enagas S.A.
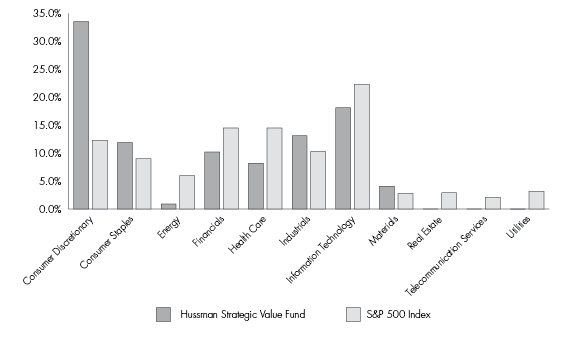
As of June 30, 2017, Strategic Value Fund had net assets of $6,882,792, and held 77 stocks in a wide variety of industries. The largest sector holdings as a percent of net assets were consumer discretionary (32.9%), information technology (17.7%), industrials (12.8%), consumer staples (11.7%), financials (10.0%) and health care (8.0%). The smallest sector weight was in materials (4.0%) and energy (0.9%). The Fund held no investments in the utility or telecommunications sectors.
Strategic Value Fund’s holdings of individual stocks as of June 30, 2017 were valued at $6,747,241. Against these stock positions, the Fund also held 27 option combinations (long put option/short call option) on the S&P 500 Index. The notional value of this hedge was $6,543,207, hedging 97.0% of the dollar value of equity investments held by the Fund.
19
The Hussman Funds |
Letter to Shareholders (continued) |
In Strategic Value Fund, during the year ended June 30, 2017, an individual equity portfolio gain in excess of $100,000 was achieved in Intel. Equity holdings with portfolio losses in excess of $100,000 during this same period were Kinder Morgan, Gap and Staples.
Supplementary information including quarterly returns and equity-only performance of the Funds is available on the Hussman Funds website: www.hussmanfunds.com.
Current Outlook
I recognize how frustrating our performance during the advancing half-cycle since 2009 has been, particularly for our strategic equity funds. From a full-cycle perspective, I remain convinced that the adaptations we made in 2014 addressed the underlying issue in a way that will allow us to navigate future cycles without the same challenges. Both our present and pre-2009 methods of classifying market return/risk profiles could have effectively navigated this half-cycle without the inadvertent detour that followed our 2009 stress-testing efforts. Still, neither method encourages us to embrace market risk in the current environment. Given the similarity of current market conditions to 2000 and 2007, this should not be a surprise.
The stark contrast between our performance during the recent half-cycle and our performance in prior market cycles is a source of disappointment, but I believe it is also a basis for optimism. Having addressed the primary source of difficulty in this half-cycle, we have retained a value-conscious, historically-informed discipline that has supported all of our most effective investment decisions over time, and has been adapted to avoid our least effective ones. Our experience in this half-cycle certainly weakened our inclination to respond to “overvalued, overbought, overbullish” features of market action in isolation, but it has markedly strengthened our confidence in other features of market action. Our ongoing research has also allowed us to construct increasingly effective measures of valuation. I believe that all of these will prove useful in identifying major opportunities and risks in the market cycles ahead.
Meanwhile, it is important to emphasize that the Hussman Funds are investment vehicles that adhere to specific investment objectives and strategies. As such, they are not intended to pursue, speculate, or capitalize on market outcomes that are inconsistent with those investment disciplines. For example, if an investor believes that the value-insensitive exodus into passive indexes will continue indefinitely, the Funds may not be suitable investments, because they will continue to adhere to a value-conscious stock-selection discipline. Likewise, if an investor believes that extreme valuations will persist forever, and that the markets have become immune to future downturns, the Funds may not be suitable investments, because their historically-informed, full-cycle investment discipline is inconsistent with those expectations. Investors should choose holdings that are aligned with their own
20
The Hussman Funds |
Letter to Shareholders (continued) |
goals, perspectives, and tolerance for risk. For my part, nearly all of my investments remain in the Hussman Funds. Amid opposing extremes that I view as temporary both for the market and our own discipline, I am looking forward to the years ahead.
I remain grateful, as always, for your trust.
Sincerely,
John P. Hussman, Ph.D.
Past performance is not predictive of future performance. Investment results and principal value will fluctuate so that shares of the Funds, when redeemed, may be worth more or less than their original cost. Current performance may be higher or lower than the performance data quoted.
Weekly updates regarding market conditions and investment strategy, as well as special reports, analysis, and performance data current to the most recent month end, are available at the Hussman Funds website www.hussmanfunds.com.
An investor should consider the investment objectives, risks, charges and expenses of the Funds carefully before investing. The Funds’ prospectuses contain this and other important information. To obtain a copy of the Hussman Funds’ prospectuses please visit our website at www.hussmanfunds.com or call 1-800-487-7626 and a copy will be sent to you free of charge. Please read the prospectus carefully before you invest. The Hussman Funds are distributed by Ultimus Fund Distributors, LLC.
Estimates of prospective return and risk for equities, bonds, and other financial markets are forward-looking statements based on the analysis and reasonable beliefs of Hussman Strategic Advisors. They are not a guarantee of future performance, and are not indicative of the prospective returns of any of the Hussman Funds. Actual returns may differ substantially from the estimates provided. Estimates of prospective long-term returns for the S&P 500 Index reflect valuation methods focusing on the relationship between current market prices and earnings, dividends and other fundamentals, adjusted for variability over the economic cycle.
This Letter to Shareholders seeks to describe some of the adviser’s current opinions and views of the financial markets. Although the adviser believes it has a reasonable basis for any opinions or views expressed, actual results may differ, sometimes significantly so, from those expected or expressed. The securities held by the Funds that are discussed in this Letter to Shareholders were held during the period covered by this Report. They do not comprise the entire investment portfolios of the Funds, may be sold at any time and may no longer be held by the Funds. The opinions of the Funds’ adviser with respect to those securities may change at any time.
21
Hussman Strategic Growth Fund Portfolio Information |
| June 30, 2017 (Unaudited) |
Sector Allocation (% of Common Stocks)
Hussman Strategic Total Return Fund Portfolio Information |
| June 30, 2017 (Unaudited) |
Asset Allocation (% of Net Assets)
22
Hussman Strategic International Fund
Portfolio Information |
| June 30, 2017 (Unaudited) |
Sector Allocation (% of Common Stocks)
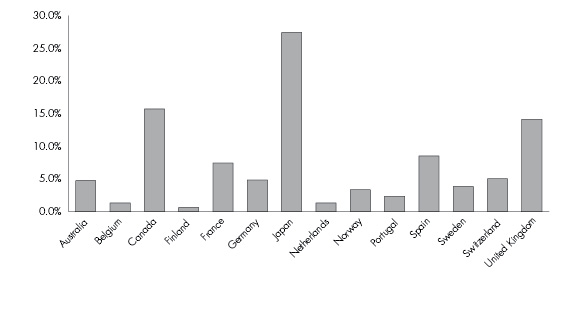
Country Allocation (% of Common Stocks)
23
Hussman Strategic Value Fund
Portfolio Information |
| June 30, 2017 (Unaudited) |
Sector Allocation (% of Common Stocks)
24
Hussman Strategic Growth Fund Schedule of Investments |
| June 30, 2017 |
| COMMON STOCKS — 100.4% | | Shares | | | Value | |
| Consumer Discretionary — 10.5% | | | | | | |
| Auto Components — 2.0% | | | | | | |
| Gentex Corp. | | | 200,000 | | | $ | 3,794,000 | |
| Lear Corp. | | | 25,000 | | | | 3,552,000 | |
| | | | | | | | 7,346,000 | |
| Hotels, Restaurants & Leisure — 1.5% | | | | | | | | |
Chipotle Mexican Grill, Inc. (a) | | | 7,500 | | | | 3,120,750 | |
| Jack in the Box, Inc. | | | 25,000 | | | | 2,462,500 | |
| | | | | | | | 5,583,250 | |
| Household Durables — 1.9% | | | | | | | | |
| Garmin Ltd. | | | 50,000 | | | | 2,551,500 | |
| KB Home | | | 200,000 | | | | 4,794,000 | |
| | | | | | | | 7,345,500 | |
| Leisure Products — 0.3% | | | | | | | | |
| Mattel, Inc. | | | 50,000 | | | | 1,076,500 | |
| | | | | | | | | |
| Media — 3.9% | | | | | | | | |
| CBS Corp. - Class B | | | 100,000 | | | | 6,378,000 | |
| Comcast Corp. - Class A | | | 75,000 | | | | 2,919,000 | |
| Regal Entertainment Group - Class A | | | 150,000 | | | | 3,069,000 | |
| Sirius XM Holdings, Inc. | | | 400,000 | | | | 2,188,000 | |
| | | | | | | | 14,554,000 | |
| Specialty Retail — 0.9% | | | | | | | | |
| Aaron's, Inc. | | | 88,000 | | | | 3,423,200 | |
| | | | | | | | | |
| Consumer Staples — 10.0% | | | | | | | | |
| Food & Staples Retailing — 4.6% | | | | | | | | |
United Natural Foods, Inc. (a) | | | 150,000 | | | | 5,505,000 | |
| Walgreens Boots Alliance, Inc. | | | 50,000 | | | | 3,915,500 | |
| Wal-Mart Stores, Inc. | | | 50,000 | | | | 3,784,000 | |
| Whole Foods Market, Inc. | | | 100,000 | | | | 4,211,000 | |
| | | | | | | | 17,415,500 | |
| Food Products — 4.2% | | | | | | | | |
| Archer-Daniels-Midland Co. | | | 150,000 | | | | 6,207,000 | |
| Bunge Ltd. | | | 50,000 | | | | 3,730,000 | |
| Sanderson Farms, Inc. | | | 50,000 | | | | 5,782,500 | |
| | | | | | | | 15,719,500 | |
| Household Products — 1.2% | | | | | | | | |
| Procter & Gamble Co. (The) | | | 50,000 | | | | 4,357,500 | |
25
Hussman Strategic Growth Fund Schedule of Investments (continued) |
| June 30, 2017 |
| COMMON STOCKS — 100.4% (continued) | | Shares | | | Value | |
| Energy — 4.6% | | | | | | |
| Energy Equipment & Services — 1.1% | | | | | | |
| Halliburton Co. | | | 75,000 | | | $ | 3,203,250 | |
| Nabors Industries Ltd. | | | 100,000 | | | | 814,000 | |
| | | | | | | | 4,017,250 | |
| Oil, Gas & Consumable Fuels — 3.5% | | | | | | | | |
| Apache Corp. | | | 50,000 | | | | 2,396,500 | |
| Boardwalk Pipeline Partners, L.P. | | | 32,000 | | | | 576,320 | |
| Chevron Corp. | | | 50,000 | | | | 5,216,500 | |
| Cosan Ltd. - Class A | | | 250,000 | | | | 1,602,500 | |
| Devon Energy Corp. | | | 50,000 | | | | 1,598,500 | |
| Golar LNG Partners, L.P. | | | 100,000 | | | | 2,007,000 | |
| | | | | | | | 13,397,320 | |
| Financials — 3.6% | | | | | | | | |
| Capital Markets — 1.2% | | | | | | | | |
| State Street Corp. | | | 50,000 | | | | 4,486,500 | |
| | | | | | | | | |
| Consumer Finance — 1.7% | | | | | | | | |
| American Express Co. | | | 75,000 | | | | 6,318,000 | |
| | | | | | | | | |
| Insurance — 0.7% | | | | | | | | |
| Prudential Financial, Inc. | | | 25,000 | | | | 2,703,500 | |
| | | | | | | | | |
| Health Care — 14.1% | | | | | | | | |
| Biotechnology — 2.1% | | | | | | | | |
Biogen, Inc. (a) | | | 10,000 | | | | 2,713,600 | |
| Gilead Sciences, Inc. | | | 25,000 | | | | 1,769,500 | |
United Therapeutics Corp. (a) | | | 25,000 | | | | 3,243,250 | |
| | | | | | | | 7,726,350 | |
| Health Care Equipment & Supplies — 2.8% | | | | | | | | |
| Baxter International, Inc. | | | 50,000 | | | | 3,027,000 | |
Cardiovascular Systems, Inc. (a) | | | 200,000 | | | | 6,446,000 | |
Varex Imaging Corp. (a) | | | 4,000 | | | | 135,200 | |
Varian Medical Systems, Inc. (a) | | | 10,000 | | | | 1,031,900 | |
| | | | | | | | 10,640,100 | |
| Health Care Providers & Services — 8.2% | | | | | | | | |
Centene Corp. (a) | | | 50,000 | | | | 3,994,000 | |
HCA Healthcare, Inc. (a) | | | 75,000 | | | | 6,540,000 | |
| HealthSouth Corp. | | | 150,000 | | | | 7,260,000 | |
| Quest Diagnostics, Inc. | | | 75,000 | | | | 8,337,000 | |
26
Hussman Strategic Growth Fund Schedule of Investments (continued) |
| June 30, 2017 |
| COMMON STOCKS — 100.4% (continued) | | Shares | | | Value | |
| Health Care — 14.1% (continued) | | | | | | |
| Health Care Providers & Services — 8.2% (continued) | | | | | | |
| UnitedHealth Group, Inc. | | | 25,000 | | | $ | 4,635,500 | |
| | | | | | | | 30,766,500 | |
| Life Sciences Tools & Services — 0.6% | | | | | | | | |
| Luminex Corp. | | | 70,000 | | | | 1,478,400 | |
QIAGEN N.V. (a) | | | 25,000 | | | | 838,250 | |
| | | | | | | | 2,316,650 | |
| Pharmaceuticals — 0.4% | | | | | | | | |
Depomed, Inc. (a) | | | 150,000 | | | | 1,611,000 | |
| | | | | | | | | |
| Industrials — 10.7% | | | | | | | | |
| Aerospace & Defense — 0.7% | | | | | | | | |
DigitalGlobe, Inc. (a) | | | 75,000 | | | | 2,497,500 | |
| | | | | | | | | |
| Air Freight & Logistics — 0.8% | | | | | | | | |
| Expeditors International of Washington, Inc. | | | 50,000 | | | | 2,824,000 | |
| | | | | | | | | |
| Airlines — 0.4% | | | | | | | | |
| Delta Air Lines, Inc. | | | 25,000 | | | | 1,343,500 | |
| | | | | | | | | |
| Commercial Services & Supplies — 2.5% | | | | | | | | |
| Cintas Corp. | | | 25,000 | | | | 3,151,000 | |
Copart, Inc. (a) | | | 200,000 | | | | 6,358,000 | |
| | | | | | | | 9,509,000 | |
| Construction & Engineering — 0.8% | | | | | | | | |
| Argan, Inc. | | | 25,000 | | | | 1,500,000 | |
Quanta Services, Inc. (a) | | | 50,000 | | | | 1,646,000 | |
| | | | | | | | 3,146,000 | |
| Industrial Conglomerates — 0.6% | | | | | | | | |
| Siemens AG - ADR | | | 34,000 | | | | 2,351,100 | |
| | | | | | | | | |
| Machinery — 1.5% | | | | | | | | |
| Donaldson Co., Inc. | | | 75,000 | | | | 3,415,500 | |
| Trinity Industries, Inc. | | | 75,000 | | | | 2,102,250 | |
| | | | | | | | 5,517,750 | |
| Professional Services — 0.2% | | | | | | | | |
FTI Consulting, Inc. (a) | | | 25,000 | | | | 874,000 | |
27
Hussman Strategic Growth Fund Schedule of Investments (continued) |
| June 30, 2017 |
| COMMON STOCKS — 100.4% (continued) | | Shares | | | Value | |
| Industrials — 10.7% (continued) | | | | | | |
| Road & Rail — 2.2% | | | | | | |
| Landstar System, Inc. | | | 50,000 | | | $ | 4,280,000 | |
Swift Transportation Co. (a) | | | 150,000 | | | | 3,975,000 | |
| | | | | | | | 8,255,000 | |
| Trading Companies & Distributors — 1.0% | | | | | | | | |
| GATX Corp. | | | 60,000 | | | | 3,856,200 | |
| | | | | | | | | |
| Information Technology — 37.6% | | | | | | | | |
| Communications Equipment — 9.8% | | | | | | | | |
| ADTRAN, Inc. | | | 100,000 | | | | 2,065,000 | |
| Cisco Systems, Inc. | | | 200,000 | | | | 6,260,000 | |
F5 Networks, Inc. (a) | | | 35,000 | | | | 4,447,100 | |
Finisar Corp. (a) | | | 225,000 | | | | 5,845,500 | |
| InterDigital, Inc. | | | 50,000 | | | | 3,865,000 | |
| Juniper Networks, Inc. | | | 50,000 | | | | 1,394,000 | |
NetScout Systems, Inc. (a) | | | 50,000 | | | | 1,720,000 | |
Oclaro, Inc. (a) | | | 200,000 | | | | 1,868,000 | |
| Plantronics, Inc. | | | 75,000 | | | | 3,923,250 | |
Ubiquiti Networks, Inc. (a) | | | 100,000 | | | | 5,197,000 | |
| | | | | | | | 36,584,850 | |
| Electronic Equipment, Instruments & Components — 9.2% | | | | | | | | |
| Corning, Inc. | | | 250,000 | | | | 7,512,500 | |
| Dolby Laboratories, Inc. - Class A | | | 75,000 | | | | 3,672,000 | |
II-VI, Inc. (a) | | | 100,000 | | | | 3,430,000 | |
| Jabil, Inc. | | | 100,000 | | | | 2,919,000 | |
Sanmina Corp. (a) | | | 100,000 | | | | 3,810,000 | |
ScanSource, Inc. (a) | | | 50,000 | | | | 2,015,000 | |
TTM Technologies, Inc. (a) | | | 200,000 | | | | 3,472,000 | |
Zebra Technologies Corp. - Class A (a) | | | 75,000 | | | | 7,539,000 | |
| | | | | | | | 34,369,500 | |
| Internet Software & Services — 3.2% | | | | | | | | |
Akamai Technologies, Inc. (a) | | | 50,000 | | | | 2,490,500 | |
Baidu, Inc. - ADR (a) | | | 10,000 | | | | 1,788,600 | |
eBay, Inc. (a) | | | 100,000 | | | | 3,492,000 | |
| LogMeIn, Inc. | | | 12,888 | | | | 1,346,796 | |
Yelp, Inc. (a) | | | 100,000 | | | | 3,002,000 | |
| | | | | | | | 12,119,896 | |
| IT Services — 1.6% | | | | | | | | |
| International Business Machines Corp. | | | 40,000 | | | | 6,153,200 | |
28
Hussman Strategic Growth Fund Schedule of Investments (continued) |
| June 30, 2017 |
| COMMON STOCKS — 100.4% (continued) | | Shares | | | Value | |
| Information Technology — 37.6% (continued) | | | | | | |
| Semiconductors & Semiconductor Equipment — 6.0% | | | | | | |
Amkor Technology, Inc. (a) | | | 300,000 | | | $ | 2,931,000 | |
Cirrus Logic, Inc. (a) | | | 50,000 | | | | 3,136,000 | |
Lattice Semiconductor Corp. (a) | | | 400,000 | | | | 2,664,000 | |
Qorvo, Inc. (a) | | | 25,000 | | | | 1,583,000 | |
| QUALCOMM, Inc. | | | 100,000 | | | | 5,522,000 | |
| Skyworks Solutions, Inc. | | | 20,000 | | | | 1,919,000 | |
| Xilinx, Inc. | | | 75,000 | | | | 4,824,000 | |
| | | | | | | | 22,579,000 | |
| Software — 5.7% | | | | | | | | |
Cadence Design Systems, Inc. (a) | | | 75,000 | | | | 2,511,750 | |
Citrix Systems, Inc. (a) | | | 50,000 | | | | 3,979,000 | |
Gigamon, Inc. (a) | | | 50,000 | | | | 1,967,500 | |
| Microsoft Corp. | | | 50,000 | | | | 3,446,500 | |
Qualys, Inc. (a) | | | 25,000 | | | | 1,020,000 | |
Varonis Systems, Inc. (a) | | | 50,000 | | | | 1,860,000 | |
VMware, Inc. - Class A (a) | | | 75,000 | | | | 6,557,250 | |
| | | | | | | | 21,342,000 | |
| Technology Hardware, Storage & Peripherals — 2.1% | | | | | | | | |
| NetApp, Inc. | | | 100,000 | | | | 4,005,000 | |
| Seagate Technology plc | | | 100,000 | | | | 3,875,000 | |
| | | | | | | | 7,880,000 | |
| Materials — 5.5% | | | | | | | | |
| Chemicals — 3.4% | | | | | | | | |
| Braskem S.A. - ADR | | | 300,000 | | | | 6,216,000 | |
| FMC Corp. | | | 25,000 | | | | 1,826,250 | |
| Monsanto Co. | | | 25,000 | | | | 2,959,000 | |
| Westlake Chemical Corp. | | | 25,000 | | | | 1,655,250 | |
| | | | | | | | 12,656,500 | |
| Metals & Mining — 2.1% | | | | | | | | |
| Agnico Eagle Mines Ltd. | | | 50,000 | | | | 2,256,000 | |
| Barrick Gold Corp. | | | 150,000 | | | | 2,386,500 | |
| Newmont Mining Corp. | | | 100,000 | | | | 3,239,000 | |
| | | | | | | | 7,881,500 | |
| Telecommunication Services — 1.2% | | | | | | | | |
| Diversified Telecommunication Services — 1.2% | | | | | | | | |
| AT&T, Inc. | | | 125,000 | | | | 4,716,250 | |
29
Hussman Strategic Growth Fund Schedule of Investments (continued) |
| June 30, 2017 |
| COMMON STOCKS — 100.4% (continued) | | Shares | | | Value | |
| Utilities — 2.6% | | | | | | |
| Electric Utilities — 1.0% | | | | | | |
| Exelon Corp. | | | 100,000 | | | $ | 3,607,000 | |
| | | | | | | | | |
| Independent Power and Renewable Electricity Producers — 1.6% | | | | | | | | |
| AES Corp. | | | 150,000 | | | | 1,666,500 | |
| Ormat Technologies, Inc. | | | 75,000 | | | | 4,401,000 | |
| | | | | | | | 6,067,500 | |
| | | | | | | | | |
Total Common Stocks (Cost $355,719,079) | | | | | | $ | 376,935,366 | |
| PUT OPTION CONTRACTS — 1.8% | | Contracts | | | Value | |
| Nasdaq 100 Index Option, 09/15/2017 at $5,650 | | | 100 | | | $ | 1,681,000 | |
| Russell 2000 Index Option, 09/15/2017 at $1,400 | | | 500 | | | | 1,533,000 | |
| S&P 500 Index Option, 09/15/2017 at $2,400 | | | 1,000 | | | | 3,750,000 | |
Total Put Option Contracts (Cost $7,007,342) | | | | | | $ | 6,964,000 | |
| | | | | | | | | |
Total Investments at Value — 102.2% (Cost $362,726,421) | | | | | | $ | 383,899,366 | |
| MONEY MARKET FUNDS — 51.9% | | Shares | | | Value | |
Federated U.S. Treasury Cash Reserves Fund - Institutional Shares, 0.76% (b) | | | 63,051,928 | | | $ | 63,051,928 | |
First American Treasury Obligations Fund - Class Y, 0.57% (b) | | | 131,776,167 | | | | 131,776,167 | |
Total Money Market Funds (Cost $194,828,095) | | | | | | $ | 194,828,095 | |
| | | | | | | | | |
| Total Investments and Money Market Funds at Value — 154.1% | | | | | | | | |
| (Cost $557,554,516) | | | | | | $ | 578,727,461 | |
| | | | | | | | | |
| Written Call Option Contracts — (54.2%) | | | | | | | (203,614,700 | ) |
| | | | | | | | | |
| Other Assets in Excess of Liabilities — 0.1% | | | | | | | 353,754 | |
| | | | | | | | | |
| Net Assets — 100.0% | | | | | | $ | 375,466,515 | |
| ADR - American Depositary Receipt. |
| |
(a) | Non-income producing security. |
(b) | The rate shown is the 7-day effective yield as of June 30, 2017. |
| | |
| See accompanying notes to financial statements. |
30
Hussman Strategic Growth Fund Schedule of Open Written Option Contracts |
| June 30, 2017 |
| WRITTEN CALL OPTION CONTRACTS | | Contracts | | | Value of Options | | | Premiums Received | |
| Nasdaq 100 Index Option, | | | | | | | | | |
| 09/15/2017 at $3,000 | | | 100 | | | $ | (26,429,700 | ) | | $ | (28,738,852 | ) |
| Russell 2000 Index Option, | | | | | | | | | | | | |
| 09/15/2017 at $700 | | | 500 | | | | (35,628,000 | ) | | | (34,887,133 | ) |
| S&P 500 Index Option, | | | | | | | | | | | | |
| 09/15/2017 at $1,000 | | | 1,000 | | | | (141,557,000 | ) | | | (138,698,657 | ) |
| Total Written Call Option Contracts | | | | | | $ | (203,614,700 | ) | | $ | (202,324,642 | ) |
| See accompanying notes to financial statements. |
31
Hussman Strategic Total Return Fund
Schedule of Investments |
| June 30, 2017 |
| COMMON STOCKS — 14.4% | | Shares | | | Value | |
Energy — 0.0% (a) | | | | | | |
Oil, Gas & Consumable Fuels — 0.0% (a) | | | | | | |
| NuStar Energy, L.P. | | | 1,000 | | | $ | 46,630 | |
| ONEOK Partners, L.P. | | | 1,000 | | | | 51,070 | |
| Williams Partners, L.P. | | | 866 | | | | 34,735 | |
| | | | | | | | 132,435 | |
| Materials — 14.1% | | | | | | | | |
| Metals & Mining — 14.1% | | | | | | | | |
| Agnico Eagle Mines Ltd. | | | 150,000 | | | | 6,768,000 | |
| AngloGold Ashanti Ltd. - ADR | | | 450,000 | | | | 4,374,000 | |
| Barrick Gold Corp. | | | 900,000 | | | | 14,319,000 | |
Coeur Mining, Inc. (b) | | | 25,000 | | | | 214,500 | |
| Compania de Minas Buenaventura S.A. - ADR | | | 25,000 | | | | 287,500 | |
| Goldcorp, Inc. | | | 450,000 | | | | 5,809,500 | |
| Newmont Mining Corp. | | | 450,000 | | | | 14,575,500 | |
| Pan American Silver Corp. | | | 5,000 | | | | 84,100 | |
| Randgold Resources Ltd. - ADR | | | 50,000 | | | | 4,423,000 | |
| Royal Gold, Inc. | | | 10,000 | | | | 781,700 | |
| Sibanye Gold Ltd. - ADR | | | 171,475 | | | | 793,929 | |
| Wheaton Precious Metals Corp | | | 5,000 | | | | 99,450 | |
| | | | | | | | 52,530,179 | |
| Utilities — 0.3% | | | | | | | | |
| Electric Utilities — 0.2% | | | | | | | | |
| American Electric Power Co., Inc. | | | 1,000 | | | | 69,470 | |
| Duke Energy Corp. | | | 333 | | | | 27,836 | |
| Edison International | | | 1,000 | | | | 78,190 | |
| Entergy Corp. | | | 1,000 | | | | 76,770 | |
| Exelon Corp. | | | 1,000 | | | | 36,070 | |
| FirstEnergy Corp. | | | 1,000 | | | | 29,160 | |
| NextEra Energy, Inc. | | | 1,000 | | | | 140,130 | |
| Pinnacle West Capital Corp. | | | 1,000 | | | | 85,160 | |
| PPL Corp. | | | 1,000 | | | | 38,660 | |
| | | | | | | | 581,446 | |
| Multi-Utilities — 0.1% | | | | | | | | |
| Ameren Corp. | | | 1,000 | | | | 54,670 | |
| Dominion Energy, Inc. | | | 1,000 | | | | 76,630 | |
| DTE Energy Co. | | | 1,000 | | | | 105,790 | |
| PG&E Corp. | | | 1,000 | | | | 66,370 | |
| Public Service Enterprise Group, Inc. | | | 1,000 | | | | 43,010 | |
32
Hussman Strategic Total Return Fund
Schedule of Investments (continued) |
| June 30, 2017 |
| COMMON STOCKS — 14.4% (continued) | | Shares | | | Value | |
| Utilities — 0.3% (continued) | | | | | | |
| Multi-Utilities — 0.1% (continued) | | | | | | |
| SCANA Corp. | | | 1,000 | | | $ | 67,010 | |
| | | | | | | | 413,480 | |
| | | | | | | | | |
Total Common Stocks (Cost $57,457,364) | | | | | | $ | 53,657,540 | |
| U.S. TREASURY OBLIGATIONS — 63.4% | | Par Value | | | Value | |
U.S. Treasury Bills (c) — 26.7% | | | | | | |
| 0.89%, due 09/28/2017 | | $ | 50,000,000 | | | $ | 49,878,550 | |
| 1.02%, due 03/29/2018 | | | 50,000,000 | | | | 49,582,150 | |
| | | | | | | | 99,460,700 | |
| U.S. Treasury Inflation-Protected Notes — 3.7% | | | | | | | | |
| 2.50%, due 01/15/2029 | | | 11,388,000 | | | | 13,707,041 | |
| | | | | | | | | |
| U.S. Treasury Notes — 33.0% | | | | | | | | |
| 0.75%, due 10/31/2018 | | | 50,000,000 | | | | 49,619,150 | |
| 1.50%, due 08/15/2026 | | | 25,000,000 | | | | 23,388,675 | |
| 2.25%, due 02/15/2027 | | | 50,000,000 | | | | 49,776,350 | |
| | | | | | | | 122,784,175 | |
| | | | | | | | | |
Total U.S. Treasury Obligations (Cost $233,843,225) | | | | | | $ | 235,951,916 | |
| EXCHANGE-TRADED FUNDS — 4.2% | | Shares | | | Value | |
CurrencyShares British Pound Sterling Trust (b) | | | 50,000 | | | $ | 6,341,000 | |
CurrencyShares Euro Trust (b) | | | 50,000 | | | | 5,524,000 | |
CurrencyShares Japanese Yen Trust (b) | | | 1,000 | | | | 85,530 | |
CurrencyShares Swedish Krona Trust (b) | | | 10,000 | | | | 1,138,383 | |
CurrencyShares Swiss Franc Trust (b) | | | 15,000 | | | | 1,484,550 | |
iShares 1-3 Year International Treasury Bond ETF (b) | | | 1,000 | | | | 81,810 | |
iShares Gold Trust (b) | | | 25,000 | | | | 298,500 | |
| iShares International Treasury Bond ETF | | | 1,000 | | | | 95,680 | |
| SPDR Bloomberg Barclays International Treasury Bond ETF | | | 2,000 | | | | 55,260 | |
SPDR Bloomberg Barclays Short Term International Treasury Bond ETF (b) | | | 1,000 | | | | 31,360 | |
| SPDR Citi International Government Inflation-Protected Bond ETF | | | 1,000 | | | | 55,560 | |
SPDR Gold Shares (b) | | | 5,000 | | | | 590,100 | |
Total Exchange-Traded Funds (Cost $15,396,347) | | | | | | | 15,781,733 | |
| | | | | | | | | |
Total Investments at Value — 82.0% (Cost $306,696,936) | | | | | | $ | 305,391,189 | |
33
Hussman Strategic Total Return Fund
Schedule of Investments (continued) |
| June 30, 2017 |
| MONEY MARKET FUNDS — 18.0% | | Shares | | | Value | |
Federated U.S. Treasury Cash Reserves Fund - Institutional Shares, 0.76% (d) | | | 20,259,904 | | | $ | 20,259,904 | |
First American Treasury Obligations Fund - Class Y, 0.57% (d) | | | 46,932,874 | | | | 46,932,874 | |
Total Money Market Funds (Cost $67,192,778) | | | | | | $ | 67,192,778 | |
| | | | | | | | | |
| Total Investments and Money Market Funds at Value — 100.0% | | | | | | | | |
| (Cost $373,889,714) | | | | | | $ | 372,583,967 | |
| | | | | | | | | |
Liabilities in Excess of Other Assets — (0.0%)(a) | | | | | | | (82,172 | ) |
| | | | | | | | | |
| Net Assets — 100.0% | | | | | | $ | 372,501,795 | |
| ADR - American Depositary Receipt |
| |
(a) | Percentage rounds to less than 0.1%. |
(b) | Non-income producing security. |
(c) | Rate shown is the annualized yield at time of purchase, not a coupon rate. |
(d) | The rate shown is the 7-day effective yield as of June 30, 2017. |
| | |
| See accompanying notes to financial statements. |
34
Hussman Strategic International Fund Schedule of Investments |
| June 30, 2017 |
| COMMON STOCKS — 89.8% | | Shares | | | Value | |
| Australia — 4.2% | | | | | | |
Crown Resorts Ltd. (a) | | | 50,000 | | | $ | 471,888 | |
JB Hi-Fi Ltd. (a) | | | 23,000 | | | | 413,107 | |
SEEK Ltd. (a) | | | 30,000 | | | | 389,855 | |
| | | | | | | | 1,274,850 | |
| Belgium — 1.2% | | | | | | | | |
AGFA-Gevaert NV (b) | | | 75,000 | | | | 364,934 | |
| | | | | | | | | |
| Canada — 14.1% | | | | | | | | |
Air Canada (b) | | | 30,000 | | | | 402,085 | |
Celestica, Inc. (b) | | | 40,000 | | | | 543,517 | |
CGI Group, Inc. - Class A (b) | | | 6,000 | | | | 306,584 | |
| IGM Financial, Inc. | | | 18,000 | | | | 558,292 | |
| Industrial Alliance Insurance and Financial Services, Inc. | | | 13,000 | | | | 564,015 | |
| Manulife Financial Corp. | | | 29,000 | | | | 543,663 | |
| Power Corp. of Canada | | | 23,000 | | | | 524,654 | |
| Royal Bank of Canada | | | 7,500 | | | | 544,597 | |
| ShawCor Ltd. | | | 15,000 | | | | 306,307 | |
| | | | | | | | 4,293,714 | |
| Finland — 0.5% | | | | | | | | |
| Tikkurila Oyj | | | 7,200 | | | | 155,678 | |
| | | | | | | | | |
| France — 6.6% | | | | | | | | |
Edenred (a) | | | 23,000 | | | | 599,987 | |
Elecnor S.A. (a) | | | 2,163 | | | | 29,969 | |
Eutelsat Communications S.A. (a) | | | 9,000 | | | | 229,645 | |
| IPSOS | | | 15,000 | | | | 562,821 | |
Neopost S.A. (a) | | | 13,000 | | | | 603,737 | |
| | | | | | | | 2,026,159 | |
| Germany — 4.4% | | | | | | | | |
Hugo Boss AG (a) | | | 4,500 | | | | 315,475 | |
| SAP SE - ADR | | | 6,000 | | | | 628,020 | |
SHW AG (a) | | | 9,000 | | | | 383,190 | |
| | | | | | | | 1,326,685 | |
| Japan — 24.6% | | | | | | | | |
CyberAgent, Inc. (a) | | | 16,000 | | | | 496,927 | |
Daiwabo Holdings Co. Ltd. (a) | | | 175,000 | | | | 609,889 | |
en-japan, Inc. (a) | | | 19,000 | | | | 495,112 | |
EPS Holdings, Inc. (a) | | | 30,000 | | | | 470,560 | |
Fudo Tetra Corp. (a) | | | 175,000 | | | | 280,573 | |
35
Hussman Strategic International Fund Schedule of Investments (continued) |
| June 30, 2017 |
| COMMON STOCKS — 89.8% (continued) | | Shares | | | Value | |
| Japan — 24.6% (continued) | | | | | | |
Fujibo Holdings, Inc. (a),(b) | | | 13,000 | | | $ | 365,189 | |
Isuzu Motors Ltd. (a) | | | 28,000 | | | | 347,702 | |
Kanagawa Chuo Kotsu Co. Ltd. (a) | | | 62,000 | | | | 405,040 | |
Kurimoto Ltd. (a) | | | 15,000 | | | | 272,324 | |
Misawa Homes Co. Ltd. (a) | | | 42,000 | | | | 377,687 | |
Mixi, Inc. (a) | | | 10,000 | | | | 556,518 | |
NuFlare Technology, Inc. (a)(b) | | | 6,000 | | | | 358,577 | |
Panasonic Corp. (a) | | | 30,000 | | | | 408,776 | |
SBI Holdings, Inc. (a) | | | 25,000 | | | | 339,981 | |
Shinnihon Corp. (a) | | | 52,000 | | | | 423,345 | |
SoftBank Group Corp. (a) | | | 7,500 | | | | 609,703 | |
SRG Takamiya Co. Ltd. (a) | | | 25,000 | | | | 125,969 | |
Toshiba Corp. (a) | | | 230,000 | | | | 557,179 | |
| | | | | | | | 7,501,051 | |
| Netherlands — 1.2% | | | | | | | | |
PostNL NV (a) | | | 75,000 | | | | 350,020 | |
| | | | | | | | | |
| Norway — 2.9% | | | | | | | | |
Ocean Yield ASA (a) | | | 25,000 | | | | 195,424 | |
Statoil ASA (a) | | | 27,000 | | | | 447,690 | |
| Stolt-Nielsen Ltd. | | | 18,000 | | | | 253,316 | |
| | | | | | | | 896,430 | |
| Portugal — 2.0% | | | | | | | | |
Altri SGPS S.A. (a) | | | 50,000 | | | | 230,288 | |
Jeronimo Martins SGPS S.A. (a) | | | 20,000 | | | | 390,494 | |
| | | | | | | | 620,782 | |
| Spain — 7.6% | | | | | | | | |
Amadeus IT Group S.A. (a) | | | 8,000 | | | | 478,229 | |
Endesa S.A. (a) | | | 15,000 | | | | 346,045 | |
Grupo Catalana Occidente S.A. (a) | | | 10,000 | | | | 421,564 | |
| Mapfre S.A. | | | 100,000 | | | | 349,286 | |
| Miquel y Costas & Miquel S.A. | | | 6,000 | | | | 219,303 | |
Tecnicas Reunidas S.A. (a) | | | 13,000 | | | | 503,767 | |
| | | | | | | | 2,318,194 | |
| Sweden — 3.4% | | | | | | | | |
Concentric AB (a) | | | 5,813 | | | | 94,980 | |
Granges AB (a) | | | 35,000 | | | | 321,940 | |
Modern Times Group MTG AB - Class B (a) | | | 18,000 | | | | 619,439 | |
| | | | | | | | 1,036,359 | |
36
Hussman Strategic International Fund Schedule of Investments (continued) |
| June 30, 2017 |
| COMMON STOCKS — 89.8% (continued) | | Shares | | | Value | |
| Switzerland — 4.5% | | | | | | |
Kudelski S.A. (a) | | | 25,000 | | | $ | 426,678 | |
Sonova Holding AG (a) | | | 3,500 | | | | 569,333 | |
| Tamedia AG | | | 2,324 | | | | 370,312 | |
| | | | | | | | 1,366,323 | |
| United Kingdom — 12.6% | | | | | | | | |
Burberry Group plc (a) | | | 28,000 | | | | 605,942 | |
| esure Group plc | | | 150,000 | | | | 589,481 | |
GlaxoSmithKline plc (a) | | | 26,000 | | | | 553,522 | |
Hays plc (a) | | | 200,000 | | | | 432,462 | |
| J.D. Wetherspoon plc | | | 50,000 | | | | 635,331 | |
Merlin Entertainments plc (a) | | | 40,000 | | | | 250,419 | |
Pagegroup plc (a)(b) | | | 50,000 | | | | 310,372 | |
| Smart Metering Systems plc | | | 29,310 | | | | 201,392 | |
| SThree plc | | | 65,484 | | | | 262,717 | |
| Utilitywise plc | | | 13,861 | | | | 12,909 | |
| | | | | | | | 3,854,547 | |
| | | | | | | | | |
Total Investments at Value — 89.8% (Cost $23,807,606) | | | | | | $ | 27,385,726 | |
| MONEY MARKET FUNDS — 2.0% | | Shares | | | Value | |
Northern Institutional Treasury Portfolio, 0.86% (c) (Cost $596,961) | | | 596,961 | | | $ | 596,961 | |
| | | | | | | | | |
| Total Investments and Money Market Funds at Value — 91.8% | | | | | | | | |
| (Cost $24,404,567) | | | | | | $ | 27,982,687 | |
| | | | | | | | | |
| Other Assets in Excess of Liabilities — 8.2% | | | | | | | 2,511,197 | |
| | | | | | | | | |
| Net Assets — 100.0% | | | | | | $ | 30,493,884 | |
| ADR - American Depositary Receipt |
| |
(a) | Foreign fair value priced (Note 1). Foreign fair valued securities totaled $18,486,512 at June 30, 2017, representing 60.6% of net assets. |
(b) | Non-income producing security. |
(c) | The rate shown is the 7-day effective yield as of June 30, 2017. |
| | |
| See accompanying notes to financial statements. |
37
Hussman Strategic International Fund Schedule of Investments (continued) |
| June 30, 2017 |
| Sector/Industry | % of Net Assets |
| Consumer Discretionary — 25.4% | |
| Auto Components | 2.6% |
| Automobiles | 1.1% |
| Hotels, Restaurants & Leisure | 4.4% |
| Household Durables | 2.6% |
| Media | 9.1% |
| Specialty Retail | 1.4% |
| Textiles, Apparel & Luxury Goods | 4.2% |
| Consumer Staples — 1.3% | |
| Food & Staples Retailing | 1.3% |
| Energy — 4.8% | |
| Energy Equipment & Services | 3.3% |
| Oil, Gas & Consumable Fuels | 1.5% |
| Financials — 14.6% | |
| Banks | 1.8% |
| Capital Markets | 3.0% |
| Insurance | 9.8% |
| Health Care — 6.4% | |
| Health Care Equipment & Supplies | 1.9% |
| Health Care Technology | 1.2% |
| Pharmaceuticals | 3.3% |
| Industrials — 14.8% | |
| Air Freight & Logistics | 1.2% |
| Airlines | 1.3% |
| Commercial Services & Supplies | 2.0% |
| Construction & Engineering | 2.4% |
| Industrial Conglomerates | 1.8% |
| Machinery | 0.3% |
| Marine | 0.8% |
| Professional Services | 4.6% |
| Trading Companies & Distributors | 0.4% |
| Information Technology — 15.5% | |
| Electronic Equipment, Instruments & Components | 5.8% |
| Internet Software & Services | 1.8% |
| IT Services | 2.6% |
| Semiconductors & Semiconductor Equipment | 1.2% |
| Software | 2.1% |
| Technology Hardware, Storage & Peripherals | 2.0% |
38
Hussman Strategic International Fund Schedule of Investments (continued) |
| June 30, 2017 |
| Sector/Industry | % of Net Assets |
| Materials — 3.9% | |
| Chemicals | 0.5% |
| Metals & Mining | 1.9% |
| Paper & Forest Products | 1.5% |
| Telecommunication Services — 2.0% | |
| Wireless Telecommunication Services | 2.0% |
| Utilities — 1.1% | |
| Electric Utilities | 1.1% |
| | 89.8% |
| See accompanying notes to financial statements. |
39
Hussman Strategic International Fund Schedule of Futures Contracts Sold Short |
| June 30, 2017 |
FUTURES CONTRACTS SOLD SHORT | Expiration Date | | Contracts | | | Aggregate Market Value of Contracts | | | Unrealized Appreciation | |
| Mini MSCI EAFE Index Future | 09/15/2017 | | | 285 | | | $ | 26,915,400 | | | $ | 117,218 | |
| See accompanying notes to financial statements. |
40
Hussman Strategic Value Fund Schedule of Investments |
| June 30, 2017 |
| COMMON STOCKS — 98.0% | | Shares | | | Value | |
| Consumer Discretionary — 32.9% | | | | | | |
| Auto Components — 4.5% | | | | | | |
American Axle & Manufacturing Holdings, Inc. (a) | | | 3,700 | | | $ | 57,720 | |
| Gentex Corp. | | | 6,500 | | | | 123,305 | |
| Lear Corp. | | | 500 | | | | 71,040 | |
| Tenneco, Inc. | | | 1,000 | | | | 57,830 | |
| | | | | | | | 309,895 | |
| Automobiles — 3.0% | | | | | | | | |
| Harley-Davidson, Inc. | | | 1,800 | | | | 97,236 | |
| Winnebago Industries, Inc. | | | 3,000 | | | | 105,000 | |
| | | | | | | | 202,236 | |
| Hotels, Restaurants & Leisure — 2.5% | | | | | | | | |
| Cheesecake Factory, Inc. (The) | | | 1,200 | | | | 60,360 | |
| Wynn Resorts Ltd. | | | 800 | | | | 107,296 | |
| | | | | | | | 167,656 | |
| Household Durables — 4.9% | | | | | | | | |
| Garmin Ltd. | | | 2,550 | | | | 130,126 | |
| KB Home | | | 4,700 | | | | 112,659 | |
William Lyon Homes - Class A (a) | | | 4,000 | | | | 96,560 | |
| | | | | | | | 339,345 | |
| Leisure Products — 1.4% | | | | | | | | |
| Mattel, Inc. | | | 4,400 | | | | 94,732 | |
| | | | | | | | | |
| Media — 4.0% | | | | | | | | |
| John Wiley & Sons, Inc. - Class A | | | 2,100 | | | | 110,775 | |
| Regal Entertainment Group - Class A | | | 4,800 | | | | 98,208 | |
| Scripps Networks Interactive, Inc. - Class A | | | 1,000 | | | | 68,310 | |
| | | | | | | | 277,293 | |
| Specialty Retail — 10.8% | | | | | | | | |
| Aaron's, Inc. | | | 2,500 | | | | 97,250 | |
America's Car-Mart, Inc. (a) | | | 2,200 | | | | 85,580 | |
| Best Buy Co., Inc. | | | 2,200 | | | | 126,126 | |
| Children's Place, Inc. (The) | | | 600 | | | | 61,260 | |
| Dick's Sporting Goods, Inc. | | | 2,000 | | | | 79,660 | |
Murphy USA, Inc. (a) | | | 2,000 | | | | 148,220 | |
| Pier 1 Imports, Inc. | | | 10,000 | | | | 51,900 | |
| Tiffany & Co. | | | 1,000 | | | | 93,870 | |
| | | | | | | | 743,866 | |
| Textiles, Apparel & Luxury Goods — 1.8% | | | | | | | | |
| Wolverine World Wide, Inc. | | | 4,500 | | | | 126,045 | |
41
Hussman Strategic Value Fund Schedule of Investments (continued) |
| June 30, 2017 |
| COMMON STOCKS — 98.0% (continued) | | Shares | | | Value | |
| Consumer Staples — 11.7% | | | | | | |
| Beverages — 1.8% | | | | | | |
| Coca-Cola Co. (The) | | | 2,800 | | | $ | 125,580 | |
| | | | | | | | | |
| Food & Staples Retailing — 3.6% | | | | | | | | |
United Natural Foods, Inc. (a) | | | 1,500 | | | | 55,050 | |
| Wal-Mart Stores, Inc. | | | 1,700 | | | | 128,656 | |
| Whole Foods Market, Inc. | | | 1,500 | | | | 63,165 | |
| | | | | | | | 246,871 | |
| Food Products — 4.5% | | | | | | | | |
Darling Ingredients, Inc. (a) | | | 6,000 | | | | 94,440 | |
Lifeway Foods, Inc. (a) | | | 6,000 | | | | 56,040 | |
| Sanderson Farms, Inc. | | | 800 | | | | 92,520 | |
Seneca Foods Corp. - Class A (a) | | | 2,000 | | | | 62,100 | |
| | | | | | | | 305,100 | |
| Personal Products — 1.8% | | | | | | | | |
| Nu Skin Enterprises, Inc. - Class A | | | 2,000 | | | | 125,680 | |
| | | | | | | | | |
| Energy — 0.9% | | | | | | | | |
| Oil, Gas & Consumable Fuels — 0.9% | | | | | | | | |
Chesapeake Energy Corp. (a) | | | 13,000 | | | | 64,610 | |
| | | | | | | | | |
| Financials — 10.0% | | | | | | | | |
| Capital Markets — 1.3% | | | | | | | | |
| State Street Corp. | | | 1,000 | | | | 89,730 | |
| | | | | | | | | |
| Consumer Finance — 1.6% | | | | | | | | |
| American Express Co. | | | 1,300 | | | | 109,512 | |
| | | | | | | | | |
| Insurance — 7.1% | | | | | | | | |
| Aflac, Inc. | | | 1,650 | | | | 128,172 | |
| Everest Re Group Ltd. | | | 500 | | | | 127,295 | |
| First American Financial Corp. | | | 2,000 | | | | 89,380 | |
| Progressive Corp. (The) | | | 3,200 | | | | 141,088 | |
| | | | | | | | 485,935 | |
| Health Care — 8.0% | | | | | | | | |
| Biotechnology — 0.5% | | | | | | | | |
United Therapeutics Corp. (a) | | | 250 | | | | 32,433 | |
42
Hussman Strategic Value Fund Schedule of Investments (continued) |
| June 30, 2017 |
| COMMON STOCKS — 98.0% (continued) | | Shares | | | Value | |
| Health Care — 8.0% (continued) | | | | | | |
| Health Care Equipment & Supplies — 1.5% | | | | | | |
Varex Imaging Corp. (a) | | | 360 | | | $ | 12,168 | |
Varian Medical Systems, Inc. (a) | | | 900 | | | | 92,871 | |
| | | | | | | | 105,039 | |
| Health Care Providers & Services — 5.0% | | | | | | | | |
HCA Healthcare, Inc. (a) | | | 800 | | | | 69,760 | |
| HealthSouth Corp. | | | 2,400 | | | | 116,160 | |
Laboratory Corp. of America Holdings (a) | | | 500 | | | | 77,070 | |
Select Medical Holdings Corp. (a) | | | 5,500 | | | | 84,425 | |
| | | | | | | | 347,415 | |
| Pharmaceuticals — 1.0% | | | | | | | | |
| AstraZeneca plc - ADR | | | 2,000 | | | | 68,180 | |
| | | | | | | | | |
| Industrials — 12.8% | | | | | | | | |
| Air Freight & Logistics — 1.5% | | | | | | | | |
| Expeditors International of Washington, Inc. | | | 1,800 | | | | 101,664 | |
| | | | | | | | | |
| Commercial Services & Supplies — 0.9% | | | | | | | | |
| Knoll, Inc. | | | 3,000 | | | | 60,150 | |
| | | | | | | | | |
| Construction & Engineering — 1.0% | | | | | | | | |
Quanta Services, Inc. (a) | | | 2,200 | | | | 72,424 | |
| | | | | | | | | |
| Machinery — 2.1% | | | | | | | | |
| Greenbrier Cos, Inc. (The) | | | 1,500 | | | | 69,375 | |
| Trinity Industries, Inc. | | | 2,700 | | | | 75,681 | |
| | | | | | | | 145,056 | |
| Professional Services — 1.3% | | | | | | | | |
| Dun & Bradstreet Corp. (The) | | | 800 | | | | 86,520 | |
| | | | | | | | | |
| Road & Rail — 2.9% | | | | | | | | |
| Landstar System, Inc. | | | 1,400 | | | | 119,840 | |
Swift Transportation Co. (a) | | | 3,000 | | | | 79,500 | |
| | | | | | | | 199,340 | |
| Trading Companies & Distributors — 3.1% | | | | | | | | |
| Fastenal Co. | | | 2,400 | | | | 104,472 | |
| MSC Industrial Direct Co., Inc. - Class A | | | 1,300 | | | | 111,748 | |
| | | | | | | | 216,220 | |
43
Hussman Strategic Value Fund Schedule of Investments (continued) |
| June 30, 2017 |
| COMMON STOCKS — 98.0% (continued) | | Shares | | | Value | |
| Information Technology — 17.7% | | | | | | |
| Communications Equipment — 3.7% | | | | | | |
| Cisco Systems, Inc. | | | 3,500 | | | $ | 109,550 | |
| Juniper Networks, Inc. | | | 2,500 | | | | 69,700 | |
| Plantronics, Inc. | | | 1,400 | | | | 73,234 | |
| | | | | | | | 252,484 | |
| Electronic Equipment, Instruments & Components — 2.7% | | | | | | | | |
| Corning, Inc. | | | 3,000 | | | | 90,150 | |
ScanSource, Inc. (a) | | | 2,400 | | | | 96,720 | |
| | | | | | | | 186,870 | |
| IT Services — 3.2% | | | | | | | | |
| International Business Machines Corp. | | | 700 | | | | 107,681 | |
Net 1 UEPS Technologies, Inc. (a) | | | 5,000 | | | | 49,300 | |
| Western Union Co. (The) | | | 3,400 | | | | 64,770 | |
| | | | | | | | 221,751 | |
| Semiconductors & Semiconductor Equipment — 2.5% | | | | | | | | |
| Intel Corp. | | | 1,800 | | | | 60,732 | |
| QUALCOMM, Inc. | | | 2,000 | | | | 110,440 | |
| | | | | | | | 171,172 | |
| Technology Hardware, Storage & Peripherals — 5.6% | | | | | | | | |
| Apple, Inc. | | | 900 | | | | 129,618 | |
| HP, Inc. | | | 6,500 | | | | 113,620 | |
| NetApp, Inc. | | | 1,200 | | | | 48,060 | |
| Seagate Technology plc | | | 2,500 | | | | 96,875 | |
| | | | | | | | 388,173 | |
| Materials — 4.0% | | | | | | | | |
| Chemicals — 1.9% | | | | | | | | |
| BASF SE - ADR | | | 1,450 | | | | 135,271 | |
| | | | | | | | | |
| Paper & Forest Products — 2.1% | | | | | | | | |
Boise Cascade Co. (a) | | | 2,600 | | | | 79,040 | |
| KapStone Paper & Packaging Corp. | | | 3,100 | | | | 63,953 | |
| | | | | | | | 142,993 | |
| | | | | | | | | |
Total Common Stocks (Cost $6,238,400) | | | | | | $ | 6,747,241 | |
44
Hussman Strategic Value Fund Schedule of Investments (continued) |
| June 30, 2017 |
| PUT OPTION CONTRACTS — 0.1% | | Contracts | | | Value | |
| S&P 500 Index Option, 09/15/2017 at $1,500 | | | 20 | | | $ | 740 | |
| S&P 500 Index Option, 09/15/2017 at $2,000 | | | 7 | | | | 2,324 | |
Total Put Option Contracts (Cost $4,357) | | | | | | $ | 3,064 | |
| | | | | | | | | |
Total Investments at Value — 98.1% (Cost $6,242,757) | | | | | | $ | 6,750,305 | |
| MONEY MARKET FUNDS — 32.4% | | Shares | | | Value | |
Federated U.S. Treasury Cash Reserves Fund - Institutional Shares, 0.76% (b) | | | 668,937 | | | $ | 668,937 | |
First American Treasury Obligations Fund - Class Y, 0.57% (b) | | | 1,560,853 | | | | 1,560,853 | |
Total Money Market Funds (Cost $2,229,790) | | | | | | $ | 2,229,790 | |
| | | | | | | | | |
Total Investments and Money Market Funds at Value — 130.5% | | | | | | | | |
| (Cost $8,472,547) | | | | | | $ | 8,980,095 | |
| | | | | | | | | |
| Written Call Option Contracts — (30.9%) | | | | | | | (2,128,477 | ) |
| | | | | | | | | |
| Other Assets in Excess of Liabilities — 0.4% | | | | | | | 31,174 | |
| | | | | | | | | |
| Net Assets — 100.0% | | | | | | $ | 6,882,792 | |
| ADR - American Depositary Receipt |
| |
(a) | Non-income producing security. |
(b) | The rate shown is the 7-day effective yield as of June 30, 2017. |
| | |
| See accompanying notes to financial statements. |
45
Hussman Strategic Value Fund Schedule of Open Written Option Contracts |
| June 30, 2017 |
| WRITTEN CALL OPTION CONTRACTS | | Contracts | | | Value of Options | | | Premiums Received | |
| S&P 500 Index Option, | | | | | | | | | |
| 09/15/2017 at $1,500 | | | 20 | | | $ | (1,833,840 | ) | | $ | (1,862,193 | ) |
| S&P 500 Index Option, | | | | | | | | | | | | |
| 09/15/2017 at $2,000 | | | 7 | | | | (294,637 | ) | | | (303,091 | ) |
| Total Written Call Option Contracts | | | | | | $ | (2,128,477 | ) | | $ | (2,165,284 | ) |
| See accompanying notes to financial statements. |
46
Hussman Investment Trust Statements of Assets and Liabilities |
| June 30, 2017 |
| | | Hussman Strategic
Growth Fund | | | Hussman Strategic Total Return Fund | |
| ASSETS | | | | | | |
| Investments in securities: | | | | | | |
| At acquisition cost | | $ | 362,726,421 | | | $ | 306,696,936 | |
| At value (Note 1) | | $ | 383,899,366 | | | $ | 305,391,189 | |
| Investments in money market funds | | | 194,828,095 | | | | 67,192,778 | |
| Cash | | | 25,500 | | | | — | |
| Dividends and interest receivable | | | 286,783 | | | | 792,470 | |
| Receivable for investment securities sold | | | 461,616 | | | | — | |
| Receivable for capital shares sold | | | 98,030 | | | | 62,429 | |
| Other assets | | | 64,613 | | | | 48,258 | |
| Total Assets | | | 579,664,003 | | | | 373,487,124 | |
| | | | | | | | | |
| LIABILITIES | | | | | | | | |
| Distributions payable | | | — | | | | 21,868 | |
| Written call options, at value (Notes 1 and 4) (premiums received $202,324,642) | | | 203,614,700 | | | | — | |
| Payable for capital shares redeemed | | | 157,095 | | | | 693,204 | |
| Accrued investment advisory fees (Note 3) | | | 267,230 | | | | 156,808 | |
| Payable to administrator (Note 3) | | | 37,900 | | | | 35,200 | |
| Other accrued expenses and liabilities | | | 120,563 | | | | 78,249 | |
| Total Liabilities | | | 204,197,488 | | | | 985,329 | |
CONTINGENCIES AND COMMITMENTS (NOTES 8 & 9) | | | — | | | | — | |
| NET ASSETS | | $ | 375,466,515 | | | $ | 372,501,795 | |
| | | | | | | | | |
| Net assets consist of: | | | | | | | | |
| Paid-in capital | | $ | 2,437,095,225 | | | $ | 453,565,644 | |
| Undistributed net investment income | | | 384,113 | | | | 126,790 | |
| Accumulated net realized losses from investments and option contracts | | | (2,081,895,710 | ) | | | (79,884,892 | ) |
| Net unrealized appreciation (depreciation) on investments and option contracts: | | | 19,882,887 | | | | (1,305,747 | ) |
| NET ASSETS | | $ | 375,466,515 | | | $ | 372,501,795 | |
| | | | | | | | | |
| Shares of beneficial interest outstanding (unlimited number of shares authorized, no par value) | | | 56,188,486 | | | | 31,099,092 | |
| | | | | | | | | |
Net asset value, offering price and redemption price per share (a) (Note 1) | | $ | 6.68 | | | $ | 11.98 | |
(a) | Redemption fee may apply to redemptions of shares held for 60 days or less. |
| | |
| See accompanying notes to financial statements. |
47
Hussman Investment Trust Statements of Assets and Liabilities (continued) |
| June 30, 2017 |
| | | Hussman Strategic International Fund | | | Hussman Strategic Value Fund | |
| ASSETS | | | | | | |
| Investments in securities: | | | | | | |
| At acquisition cost | | $ | 23,807,606 | | | $ | 6,242,757 | |
| At value (Note 1) | | $ | 27,385,726 | | | $ | 6,750,305 | |
| Investments in money market funds | | | 596,961 | | | $ | 2,229,790 | |
| Cash | | | — | | | | 1,301 | |
| Foreign currency, at value (Cost $278,981) | | | 278,981 | | | | — | |
| Dividends receivable | | | 20,758 | | | | 8,269 | |
| Reclaims receivable | | | 135,671 | | | | 527 | |
| Receivable for investment securities sold | | | — | | | | 137,118 | |
| Receivable from Adviser (Note 3) | | | — | | | | 35,095 | |
| Margin deposits for futures contracts (Notes 1 and 4) | | | 2,426,043 | | | | — | |
| Other assets | | | 32,606 | | | | 39,233 | |
| Total Assets | | | 30,876,746 | | | | 9,201,638 | |
| | | | | | | | | |
| LIABILITIES | | | | | | | | |
| Distributions payable | | | — | | | | 83 | |
| Written call options, at value (Notes 1 and 4) (premiums received $2,165,284) | | | — | | | | 2,128,477 | |
| Payable for investment securities purchased | | | 278,839 | | | | 139,973 | |
| Payable for capital shares redeemed | | | — | | | | 300 | |
| Accrued investment advisory fees (Note 3) | | | 17,706 | | | | — | |
| Payable to administrator (Note 3) | | | 7,300 | | | | 6,460 | |
| Variation margin payable (Notes 1 and 4) | | | 11,032 | | | | — | |
| Other accrued expenses | | | 67,985 | | | | 43,553 | |
| Total Liabilities | | | 382,862 | | | | 2,318,846 | |
| CONTINGENCIES AND COMMITMENTS (NOTE 8) | | | — | | | | — | |
| NET ASSETS | | $ | 30,493,884 | | | $ | 6,882,792 | |
| | | | | | | | | |
| Net assets consist of: | | | | | | | | |
| Paid-in capital | | $ | 44,477,272 | | | $ | 7,539,991 | |
| Undistributed net investment income | | | 152,051 | | | | 2,578 | |
| Accumulated net realized losses from investments, option and futures contracts | | | (17,825,088 | ) | | | (1,204,132 | ) |
| Net unrealized appreciation on investments, foreign currencies, option and futures contracts: | | | 3,689,649 | | | | 544,355 | |
| NET ASSETS | | $ | 30,493,884 | | | $ | 6,882,792 | |
| | | | | | | | | |
| Shares of beneficial interest outstanding (unlimited number of shares authorized, no par value) | | | 3,464,029 | | | | 823,526 | |
| | | | | | | | | |
Net asset value, offering price and redemption price per share (a) (Note 1) | | $ | 8.80 | | | $ | 8.36 | |
(a) | Redemption fee may apply to redemptions of shares held for 60 days or less. |
| | |
| See accompanying notes to financial statements. |
48
Hussman Investment Trust Statements of Operations |
For the Year Ended June 30, 2017 |
| | | Hussman Strategic
Growth Fund | | | Hussman Strategic Total Return Fund | |
| INVESTMENT INCOME | | | | | | |
| Dividends | | $ | 6,163,691 | | | $ | 466,597 | |
| Foreign withholding taxes on dividends | | | (13,206 | ) | | | (22,362 | ) |
| Interest | | | — | | | | 3,021,792 | |
| Total Income | | | 6,150,485 | | | | 3,466,027 | |
| | | | | | | | | |
| EXPENSES | | | | | | | | |
| Investment advisory fees (Note 3) | | | 4,254,024 | | | | 2,062,514 | |
| Transfer agent, account maintenance and shareholder services fees (Note 3) | | | 379,252 | | | | 255,309 | |
| Administration fees (Note 3) | | | 325,819 | | | | 289,034 | |
| Professional fees | | | 141,933 | | | | 105,285 | |
| Trustees’ fees and expenses (Note 3) | | | 84,469 | | | | 84,470 | |
| Fund accounting fees (Note 3) | | | 76,077 | | | | 71,319 | |
| Custodian fees | | | 97,556 | | | | 44,674 | |
| Insurance expense | | | 69,525 | | | | 51,741 | |
| Postage and supplies | | | 48,949 | | | | 40,501 | |
| Registration and filing fees | | | 41,108 | | | | 34,773 | |
| Printing of shareholder reports | | | 43,009 | | | | 28,026 | |
| Compliance service fees (Note 3) | | | 22,421 | | | | 20,514 | |
| Pricing fees | | | 9,917 | | | | 1,919 | |
| Other expenses | | | 13,436 | | | | 15,154 | |
| Total Expenses | | | 5,607,495 | | | | 3,105,233 | |
| Less fee reductions by the Adviser (Note 3) | | | (347,554 | ) | | | (138,941 | ) |
| Net Expenses | | | 5,259,941 | | | | 2,966,292 | |
| | | | | | | | | |
| NET INVESTMENT INCOME | | | 890,544 | | | | 499,735 | |
| | | | | | | | | |
| REALIZED AND UNREALIZED GAINS (LOSSES) ON INVESTMENTS AND OPTION CONTRACTS | | | | | | | | |
| Net realized gains (losses) from: | | | | | | | | |
| Investments | | | 39,268,337 | | | | 3,106,213 | |
| Written option contracts (Note 4) | | | (89,511,949 | ) | | | — | |
| Net change in unrealized appreciation (depreciation) on: | | | | | | | | |
| Investments | | | (26,315,440 | ) | | | (18,545,460 | ) |
| Written option contracts (Note 4) | | | (4,734,097 | ) | | | — | |
| | | | | | | | | |
| NET REALIZED AND UNREALIZED LOSSES ON INVESTMENTS AND OPTION CONTRACTS | | | (81,293,149 | ) | | | (15,439,247 | ) |
| | | | | | | | | |
| NET DECREASE IN NET ASSETS RESULTING FROM OPERATIONS | | $ | (80,402,605 | ) | | $ | (14,939,512 | ) |
| See accompanying notes to financial statements. |
49
Hussman Investment Trust Statements of Operations (continued) |
For the Year Ended June 30, 2017 |
| | | Hussman Strategic International Fund | | | Hussman Strategic Value Fund | |
| INVESTMENT INCOME | | | | | | |
| Dividend income | | $ | 875,761 | | | $ | 158,915 | |
| Foreign withholding taxes on dividends | | | (116,028 | ) | | | (750 | ) |
| Total Income | | | 759,733 | | | | 158,165 | |
| | | | | | | | | |
| EXPENSES | | | | | | | | |
| Investment advisory fees (Note 3) | | | 320,618 | | | | 63,060 | |
| Professional fees | | | 110,410 | | | | 106,993 | |
| Trustees' fees and expenses (Note 3) | | | 84,469 | | | | 84,470 | |
| Fund accounting fees (Note 3) | | | 39,436 | | | | 30,703 | |
| Custodian fees | | | 50,261 | | | | 8,053 | |
| Transfer agent, account maintenance and shareholder services fees (Note 3) | | | 36,852 | | | | 19,013 | |
| Registration and filing fees | | | 25,757 | | | | 25,749 | |
| Administration fees (Note 3) | | | 24,711 | | | | 24,000 | |
| Pricing fees | | | 24,367 | | | | 2,742 | |
| Postage and supplies | | | 16,598 | | | | 9,134 | |
| Printing of shareholder reports | | | 8,901 | | | | 6,941 | |
| Compliance service fees (Note 3) | | | 5,796 | | | | 4,763 | |
| Insurance expense | | | 5,188 | | | | 1,225 | |
| Other expenses | | | 11,331 | | | | 10,786 | |
| Total Expenses | | | 764,695 | | | | 397,632 | |
| Less fee reductions and expense reimbursements by the Adviser (Note 3) | | | (89,143 | ) | | | (310,048 | ) |
| Net Expenses | | | 675,552 | | | | 87,584 | |
| | | | | | | | | |
| NET INVESTMENT INCOME | | | 84,181 | | | | 70,581 | |
| | | | | | | | | |
| REALIZED AND UNREALIZED GAINS (LOSSES) ON INVESTMENTS, FOREIGN CURRENCIES, OPTION AND FUTURES CONTRACTS | | | | | | | | |
| Net realized gains (losses) from: | | | | | | | | |
| Investments | | | 1,809,021 | | | | 5,848 | |
| Written option contracts (Note 4) | | | — | | | | (1,044,265 | ) |
| Futures contracts (Note 4) | | | (3,701,411 | ) | | | — | |
| Foreign currency transactions | | | (34,241 | ) | | | — | |
| Net change in unrealized appreciation (depreciation) on: | | | | | | | | |
| Investments | | | 1,417,219 | | | | 754,731 | |
| Written option contracts (Note 4) | | | — | | | | 37,575 | |
| Futures contracts (Note 4) | | | (1,146,373 | ) | | | — | |
| Foreign currency translation | | | 8,948 | | | | — | |
| | | | | | | | | |
| NET REALIZED AND UNREALIZED LOSSES ON INVESTMENTS AND OPTION AND FUTURES CONTRACTS | | | (1,646,837 | ) | | | (246,111 | ) |
| | | | | | | | | |
| NET DECREASE IN NET ASSETS RESULTING FROM OPERATIONS | | $ | (1,562,656 | ) | | $ | (175,530 | ) |
| See accompanying notes to financial statements. |
50
Hussman Strategic Growth Fund Statements of Changes in Net Assets |
| |
| | | Year Ended
June 30, 2017 | | | Year Ended
June 30, 2016 | |
| FROM OPERATIONS | | | | | | |
| Net investment income | | $ | 890,544 | | | $ | 2,206,982 | |
| Net realized gains (losses) from: | | | | | | | | |
| Investments | | | 39,268,337 | | | | (2,111,360 | ) |
| Written option contracts | | | (89,511,949 | ) | | | (26,072,655 | ) |
| Net change in unrealized appreciation (depreciation) on: | | | | | | | | |
| Investments | | | (26,315,440 | ) | | | (16,122,924 | ) |
| Written option contracts | | | (4,734,097 | ) | | | (18,570,521 | ) |
| Net decrease in net assets resulting from operations | | | (80,402,605 | ) | | | (60,670,478 | ) |
| | | | | | | | | |
| DISTRIBUTIONS TO SHAREHOLDERS | | | | | | | | |
| From net investment income | | | (1,248,630 | ) | | | (3,386,901 | ) |
| | | | | | | | | |
| FROM CAPITAL SHARE TRANSACTIONS | | | | | | | | |
| Proceeds from shares sold | | | 38,718,384 | | | | 158,308,547 | |
| Net asset value of shares issued in reinvestment of distributions to shareholders | | | 1,150,794 | | | | 3,100,300 | |
| Proceeds from redemption fees collected (Note 1) | | | 26,544 | | | | 213,465 | |
| Payments for shares redeemed | | | (163,281,251 | ) | | | (273,965,571 | ) |
| Net decrease in net assets from capital share transactions | | | (123,385,529 | ) | | | (112,343,259 | ) |
| | | | | | | | | |
| TOTAL DECREASE IN NET ASSETS | | | (205,036,764 | ) | | | (176,400,638 | ) |
| | | | | | | | | |
| NET ASSETS | | | | | | | | |
| Beginning of year | | | 580,503,279 | | | | 756,903,917 | |
| End of year | | $ | 375,466,515 | | | $ | 580,503,279 | |
| | | | | | | | | |
| UNDISTRIBUTED NET INVESTMENT INCOME | | $ | 384,113 | | | $ | 760,767 | |
| | | | | | | | | |
| CAPITAL SHARE ACTIVITY | | | | | | | | |
| Shares sold | | | 5,330,686 | | | | 18,483,873 | |
| Shares reinvested | | | 159,389 | | | | 379,010 | |
| Shares redeemed | | | (22,466,413 | ) | | | (32,699,235 | ) |
| Net decrease in shares outstanding | | | (16,976,338 | ) | | | (13,836,352 | ) |
| Shares outstanding at beginning of year | | | 73,164,824 | | | | 87,001,176 | |
| Shares outstanding at end of year | | | 56,188,486 | | | | 73,164,824 | |
| See accompanying notes to financial statements. |
51
Hussman Strategic Total Return Fund Statements of Changes in Net Assets |
| |
| | | Year Ended
June 30, 2017 | | | Year Ended
June 30, 2016 | |
| FROM OPERATIONS | | | | | | |
| Net investment income | | $ | 499,735 | | | $ | 1,551,855 | |
| Net realized gains from investments | | | 3,106,213 | | | | 24,029,717 | |
| Net change in unrealized appreciation (depreciation) on investments | | | (18,545,460 | ) | | | 14,878,203 | |
| Net increase (decrease) in net assets resulting from operations | | | (14,939,512 | ) | | | 40,459,775 | |
| | | | | | | | | |
| DISTRIBUTIONS TO SHAREHOLDERS | | | | | | | | |
| From net investment income | | | (821,242 | ) | | | (1,670,975 | ) |
| | | | | | | | | |
| FROM CAPITAL SHARE TRANSACTIONS | | | | | | | | |
| Proceeds from shares sold | | | 65,405,910 | | | | 73,834,265 | |
| Net asset value of shares issued in reinvestment of distributions to shareholders | | | 759,564 | | | | 1,555,246 | |
| Proceeds from redemption fees collected (Note 1) | | | 29,889 | | | | 8,998 | |
| Payments for shares redeemed | | | (141,436,295 | ) | | | (135,698,684 | ) |
| Net decrease in net assets from capital share transactions | | | (75,240,932 | ) | | | (60,300,175 | ) |
| | | | | | | | | |
| TOTAL DECREASE IN NET ASSETS | | | (91,001,686 | ) | | | (21,511,375 | ) |
| | | | | | | | | |
| NET ASSETS | | | | | | | | |
| Beginning of year | | | 463,503,481 | | | | 485,014,856 | |
| End of year | | $ | 372,501,795 | | | $ | 463,503,481 | |
| | | | | | | | | |
| UNDISTRIBUTED NET INVESTMENT INCOME | | $ | 126,790 | | | $ | 498,701 | |
| | | | | | | | | |
| CAPITAL SHARE ACTIVITY | | | | | | | | |
| Shares sold | | | 5,394,179 | | | | 6,333,875 | |
| Shares reinvested | | | 62,319 | | | | 136,920 | |
| Shares redeemed | | | (11,628,457 | ) | | | (12,064,293 | ) |
| Net decrease in shares outstanding | | | (6,171,959 | ) | | | (5,593,498 | ) |
| Shares outstanding at beginning of year | | | 37,271,051 | | | | 42,864,549 | |
| Shares outstanding at end of year | | | 31,099,092 | | | | 37,271,051 | |
| See accompanying notes to financial statements. |
52
Hussman Strategic International Fund Statements of Changes in Net Assets |
| |
| | | Year Ended
June 30, 2017 | | | Year Ended
June 30, 2016 | |
| FROM OPERATIONS | | | | | | |
| Net investment income (loss) | | $ | 84,181 | | | $ | (20,157 | ) |
| Net realized gains (losses) from: | | | | | | | | |
| Investments | | | 1,809,021 | | | | 656,763 | |
| Futures contracts | | | (3,701,411 | ) | | | 1,893,430 | |
| Foreign currency transactions | | | (34,241 | ) | | | (179,777 | ) |
| Net change in unrealized appreciation (depreciation) on: | | | | | | | | |
| Investments | | | 1,417,219 | | | | (172,337 | ) |
| Futures contracts | | | (1,146,373 | ) | | | 557,696 | |
| Foreign currency translation | | | 8,948 | | | | 31,157 | |
| Net increase (decrease) in net assets resulting from operations | | | (1,562,656 | ) | | | 2,766,775 | |
| | | | | | | | | |
| FROM CAPITAL SHARE TRANSACTIONS | | | | | | | | |
| Proceeds from shares sold | | | 792,929 | | | | 1,455,493 | |
| Proceeds from redemption fees collected (Note 1) | | | 1,327 | | | | 1,662 | |
| Payments for shares redeemed | | | (6,382,914 | ) | | | (8,904,199 | ) |
| Net decrease in net assets from capital share transactions | | | (5,588,658 | ) | | | (7,447,044 | ) |
| | | | | | | | | |
| TOTAL DECREASE IN NET ASSETS | | | (7,151,314 | ) | | | (4,680,269 | ) |
| | | | | | | | | |
| NET ASSETS | | | | | | | | |
| Beginning of year | | | 37,645,198 | | | | 42,325,467 | |
| End of year | | $ | 30,493,884 | | | $ | 37,645,198 | |
| | | | | | | | | |
| ACCUMULATED NET INVESTMENT INCOME (LOSS) | | $ | 152,051 | | | $ | (30,648 | ) |
| | | | | | | | | |
| CAPITAL SHARE ACTIVITY | | | | | | | | |
| Shares sold | | | 89,117 | | | | 164,741 | |
| Shares redeemed | | | (720,303 | ) | | | (1,008,059 | ) |
| Net decrease in shares outstanding | | | (631,186 | ) | | | (843,318 | ) |
| Shares outstanding at beginning of year | | | 4,095,215 | | | | 4,938,533 | |
| Shares outstanding at end of year | | | 3,464,029 | | | | 4,095,215 | |
| See accompanying notes to financial statements. |
53
Hussman Strategic Value Fund Statements of Changes in Net Assets |
| |
| | | Year Ended
June 30, 2017 | | | Year Ended
June 30, 2016 | |
| FROM OPERATIONS | | | | | | |
| Net investment income | | $ | 70,581 | | | $ | 135,346 | |
| Net realized gains (losses) from: | | | | | | | | |
| Investments | | | 5,848 | | | | 217,339 | |
| Written option contracts | | | (1,044,265 | ) | | | (194,613 | ) |
| Net change in unrealized appreciation (depreciation) on: | | | | | | | | |
| Investments | | | 754,731 | | | | (371,938 | ) |
| Written option contracts | | | 37,575 | | | | (190,095 | ) |
| Net decrease in net assets resulting from operations | | | (175,530 | ) | | | (403,961 | ) |
| | | | | | | | | |
| DISTRIBUTIONS TO SHAREHOLDERS | | | | | | | | |
| From net investment income | | | (74,064 | ) | | | (128,065 | ) |
| From net realized gains | | | — | | | | (75,053 | ) |
| Decrease in net assets from distributions to shareholders | | | (74,064 | ) | | | (203,118 | ) |
| | | | | | | | | |
| FROM CAPITAL SHARE TRANSACTIONS | | | | | | | | |
| Proceeds from shares sold | | | 792,230 | | | | 866,308 | |
| Net asset value of shares issued in reinvestment of distributions to shareholders | | | 73,498 | | | | 195,450 | |
| Proceeds from redemption fees collected (Note 1) | | | 394 | | | | — | |
| Payments for shares redeemed | | | (742,628 | ) | | | (2,315,266 | ) |
| Net increase (decrease) in net assets from capital share transactions | | | 123,494 | | | | (1,253,508 | ) |
| | | | | | | | | |
| TOTAL DECREASE IN NET ASSETS | | | (126,100 | ) | | | (1,860,587 | ) |
| | | | | | | | | |
| NET ASSETS | | | | | | | | |
| Beginning of year | | | 7,008,892 | | | | 8,869,479 | |
| End of year | | $ | 6,882,792 | | | $ | 7,008,892 | |
| | | | | | | | | |
| UNDISTRIBUTED NET INVESTMENT INCOME | | $ | 2,578 | | | $ | 6,061 | |
| | | | | | | | | |
| CAPITAL SHARE ACTIVITY | | | | | | | | |
| Shares sold | | | 91,257 | | | | 97,090 | |
| Shares reinvested | | | 8,530 | | | | 22,246 | |
| Shares redeemed | | | (86,386 | ) | | | (262,508 | ) |
| Net increase (decrease) in shares outstanding | | | 13,401 | | | | (143,172 | ) |
| Shares outstanding at beginning of year | | | 810,125 | | | | 953,297 | |
| Shares outstanding at end of year | | | 823,526 | | | | 810,125 | |
| See accompanying notes to financial statements. |
54
Hussman Strategic Growth Fund Financial Highlights |
Selected Per Share Data and Ratios for a Share Outstanding Throughout Each Year |
| | | Year Ended
June 30, 2017 | | | Year Ended
June 30, 2016 | | | Year Ended
June 30, 2015 | | | Year Ended
June 30, 2014 | | | Year Ended
June 30, 2013 | |
| Net asset value at beginning of year | | $ | 7.93 | | | $ | 8.70 | | | $ | 9.74 | | | $ | 10.49 | | | $ | 11.49 | |
| | | | | | | | | | | | | | | | | | | | | |
| Income (loss) from investment operations: | | | | | | | | | | | | | | | | | | | | |
| Net investment income | | | 0.02 | | | | 0.03 | | | | 0.08 | | | | 0.08 | | | | 0.15 | |
| Net realized and unrealized losses on investments and option contracts | | | (1.25 | ) | | | (0.75 | ) | | | (1.05 | ) | | | (0.72 | ) | | | (1.00 | ) |
| Total from investment operations | | | (1.23 | ) | | | (0.72 | ) | | | (0.97 | ) | | | (0.64 | ) | | | (0.85 | ) |
| | | | | | | | | | | | | | | | | | | | | |
| Less distributions: | | | | | | | | | | | | | | | | | | | | |
| Dividends from net investment income | | | (0.02 | ) | | | (0.05 | ) | | | (0.07 | ) | | | (0.11 | ) | | | (0.15 | ) |
| | | | | | | | | | | | | | | | | | | | | |
| Proceeds from redemption fees collected (Note 1) | | | 0.00 | (a) | | | 0.00 | (a) | | | 0.00 | (a) | | | 0.00 | (a) | | | 0.00 | (a) |
| | | | | | | | | | | | | | | | | | | | | |
| Net asset value at end of year | | $ | 6.68 | | | $ | 7.93 | | | $ | 8.70 | | | $ | 9.74 | | | $ | 10.49 | |
| | | | | | | | | | | | | | | | | | | | | |
Total return (b) | | | (15.53 | %) | | | (8.34 | %) | | | (9.99 | %) | | | (6.11 | %) | | | (7.41 | %) |
| | | | | | | | | | | | | | | | | | | | | |
| Net assets at end of year (000’s) | | $ | 375,467 | | | $ | 580,503 | | | $ | 756,904 | | | $ | 1,137,305 | | | $ | 2,038,923 | |
| | | | | | | | | | | | | | | | | | | | | |
| Ratio of total expenses to average net assets | | | 1.19 | % | | | 1.15 | % | | | 1.12 | % | | | 1.12 | % | | | 1.09 | % |
| | | | | | | | | | | | | | | | | | | | | |
Ratio of net expenses to average net assets (c) | | | 1.12 | % | | | 1.09 | % | | | 1.07 | % | | | 1.07 | % | | | 1.08 | % |
| | | | | | | | | | | | | | | | | | | | | |
Ratio of net investment income to average net assets (c) | | | 0.19 | % | | | 0.34 | % | | | 0.79 | % | | | 0.43 | % | | | 1.08 | % |
| | | | | | | | | | | | | | | | | | | | | |
| Portfolio turnover rate | | | 209 | % | | | 161 | % | | | 107 | % | | | 141 | % | | | 125 | % |
(a) | Amount rounds to less than $0.01 per share. |
(b) | Total return is a measure of the change in value of an investment in the Fund over the period covered, which assumes any dividends or capital gains distributions are reinvested in shares of the Fund. Returns do not reflect the deduction of taxes a shareholder would pay on Fund distributions or the redemption of Fund shares. |
(c) | Ratio was determined after advisory fee reductions (Note 3). |
| | |
| See accompanying notes to financial statements. |
55
Hussman Strategic Total Return Fund Financial Highlights |
Selected Per Share Data and Ratios for a Share Outstanding Throughout Each Year |
| | | Year Ended
June 30, 2017 | | | Year Ended
June 30, 2016 | | | Year Ended
June 30, 2015 | | | Year Ended
June 30, 2014 | | | Year Ended
June 30, 2013 | |
| Net asset value at beginning of year | | $ | 12.44 | | | $ | 11.32 | | | $ | 11.63 | | | $ | 11.09 | | | $ | 12.38 | |
| | | | | | | | | | | | | | | | | | | | | |
| Income (loss) from investment operations: | | | | | | | | | | | | | | | | | | | | |
| Net investment income | | | 0.02 | | | | 0.04 | | | | 0.05 | | | | 0.16 | | | | 0.10 | |
| Net realized and unrealized gains (losses) on investments | | | (0.46 | ) | | | 1.13 | | | | (0.27 | ) | | | 0.52 | | | | (1.03 | ) |
| Total from investment operations | | | (0.44 | ) | | | 1.17 | | | | (0.22 | ) | | | 0.68 | | | | (0.93 | ) |
| | | | | | | | | | | | | | | | | | | | | |
| Less distributions: | | | | | | | | | | | | | | | | | | | | |
| Dividends from net investment income | | | (0.02 | ) | | | (0.05 | ) | | | (0.09 | ) | | | (0.14 | ) | | | (0.09 | ) |
| Distributions from net realized gains | | | — | | | | — | | | | — | | | | — | | | | (0.27 | ) |
| Total distributions | | | (0.02 | ) | | | (0.05 | ) | | | (0.09 | ) | | | (0.14 | ) | | | (0.36 | ) |
| | | | | | | | | | | | | | | | | | | | | |
| Proceeds from redemption fees collected (Note 1) | | | 0.00 | (a) | | | 0.00 | (a) | | | 0.00 | (a) | | | 0.00 | (a) | | | 0.00 | (a) |
| | | | | | | | | | | | | | | | | | | | | |
| Net asset value at end of year | | $ | 11.98 | | | $ | 12.44 | | | $ | 11.32 | | | $ | 11.63 | | | $ | 11.09 | |
| | | | | | | | | | | | | | | | | | | | | |
Total return (b) | | | (3.50 | %) | | | 10.33 | % | | | (1.86 | %) | | | 6.19 | % | | | (7.71 | %) |
| | | | | | | | | | | | | | | | | | | | | |
| Net assets at end of year (000’s) | | $ | 372,502 | | | $ | 463,503 | | | $ | 485,015 | | | $ | 622,494 | | | $ | 1,199,224 | |
| | | | | | | | | | | | | | | | | | | | | |
| Ratio of total expenses to average net assets | | | 0.75 | % | | | 0.75 | % | | | 0.73 | % | | | 0.72 | % | | | 0.65 | % |
| | | | | | | | | | | | | | | | | | | | | |
Ratio of net expenses to average net assets (c) | | | 0.72 | % | | | 0.69 | % | | | 0.66 | % | | | 0.63 | % | | | 0.64 | % |
| | | | | | | | | | | | | | | | | | | | | |
Ratio of net investment income to average net assets (c) | | | 0.12 | % | | | 0.36 | % | | | 0.38 | % | | | 1.26 | % | | | 0.62 | % |
| | | | | | | | | | | | | | | | | | | | | |
| Portfolio turnover rate | | | 341 | % | | | 129 | % | | | 196 | % | | | 216 | % | | | 114 | % |
(a) | Amount rounds to less than $0.01 per share. |
(b) | Total return is a measure of the change in value of an investment in the Fund over the period covered, which assumes any dividends or capital gains distributions are reinvested in shares of the Fund. Returns do not reflect the deduction of taxes a shareholder would pay on Fund distributions or the redemption of Fund shares. |
(c) | Ratio was determined after advisory fee reductions (Note 3). |
| | |
| See accompanying notes to financial statements. |
56
Hussman Strategic International Fund Financial Highlights |
Selected Per Share Data and Ratios for a Share Outstanding Throughout Each Year |
| | | Year Ended
June 30, 2017 | | | Year Ended
June 30, 2016 | | | Year Ended
June 30, 2015 | | | Year Ended
June 30, 2014 | | | Year Ended
June 30, 2013 | |
| Net asset value at beginning of year | | $ | 9.19 | | | $ | 8.57 | | | $ | 9.90 | | | $ | 9.74 | | | $ | 9.68 | |
| | | | | | | | | | | | | | | | | | | | | |
| Income (loss) from investment operations: | | | | | | | | | | | | | | | | | | | | |
| Net investment income (loss) | | | 0.01 | | | | (0.05 | ) | | | 0.17 | | | | 0.05 | | | | 0.07 | |
| Net realized and unrealized gains (losses) on investments, foreign currencies, option and futures contracts | | | (0.40 | ) | | | 0.67 | | | | (1.41 | ) | | | 0.18 | | | | (0.01 | ) |
| Total from investment operations | | | (0.39 | ) | | | 0.62 | | | | (1.24 | ) | | | 0.23 | | | | 0.06 | |
| | | | | | | | | | | | | | | | | | | | | |
| Less distributions: | | | | | | | | | | | | | | | | | | | | |
| Dividends from net investment income | | | — | | | | — | | | | (0.09 | ) | | | (0.07 | ) | | | — | |
| | | | | | | | | | | | | | | | | | | | | |
| Proceeds from redemption fees collected (Note 1) | | | 0.00 | (a) | | | 0.00 | (a) | | | 0.00 | (a) | | | 0.00 | (a) | | | 0.00 | (a) |
| | | | | | | | | | | | | | | | | | | | | |
| Net asset value at end of year | | $ | 8.80 | | | $ | 9.19 | | | $ | 8.57 | | | $ | 9.90 | | | $ | 9.74 | |
| | | | | | | | | | | | | | | | | | | | | |
Total return (b) | | | (4.24 | %) | | | 7.23 | % | | | (12.56 | %) | | | 2.36 | % | | | 0.62 | % |
| | | | | | | | | | | | | | | | | | | | | |
| Net assets at end of year (000's) | | $ | 30,494 | | | $ | 37,645 | | | $ | 42,325 | | | $ | 104,970 | | | $ | 88,300 | |
| | | | | | | | | | | | | | | | | | | | | |
| Ratio of total expenses to average net assets | | | 2.26 | % | | | 2.03 | % | | | 1.61 | % | | | 1.48 | % | | | 1.60 | % |
| | | | | | | | | | | | | | | | | | | | | |
Ratio of net expenses to average net assets (c) | | | 2.00 | % | | | 2.00 | % | | | 1.61 | % | | | 1.48 | % | | | 1.60 | % |
| | | | | | | | | | | | | | | | | | | | | |
Ratio of net investment income (loss) to average net assets (c) | | | 0.25 | % | | | (0.05 | %) | | | 0.98 | % | | | 0.68 | % | | | 0.69 | % |
| | | | | | | | | | | | | | | | | | | | | |
| Portfolio turnover rate | | | 102 | % | | | 107 | % | | | 62 | % | | | 59 | % | | | 58 | % |
(a) | Amount rounds to less than $0.01 per share. |
(b) | Total return is a measure of the change in value of an investment in the Fund over the period covered, which assumes any dividends or capital gains distributions are reinvested in shares of the Fund. Returns do not reflect the deduction of taxes a shareholder would pay on Fund distributions or the redemption of Fund shares. |
(c) | Ratio was determined after advisory fee reductions (Note 3). |
| | |
| See accompanying notes to financial statements. |
57
Hussman Strategic Value Fund Financial Highlights |
Selected Per Share Data and Ratios for a Share Outstanding Throughout Each Year |
| | | Year Ended
June 30, 2017 | | | Year Ended
June 30, 2016 | | | Year Ended
June 30, 2015 | | | Year Ended
June 30, 2014 | | | Year Ended
June 30, 2013 | |
| Net asset value at beginning of year | | $ | 8.65 | | | $ | 9.30 | | | $ | 10.62 | | | $ | 10.43 | | | $ | 9.92 | |
| | | | | | | | | | | | | | | | | | | | | |
| Income (loss) from investment operations: | | | | | | | | | | | | | | | | | | | | |
| Net investment income | | | 0.09 | | | | 0.15 | | | | 0.17 | | | | 0.13 | | | | 0.03 | |
| Net realized and unrealized gains (losses) on investments and option contracts | | | (0.29 | ) | | | (0.57 | ) | | | (0.46 | ) | | | 0.18 | | | | 0.51 | |
| Total from investment operations | | | (0.20 | ) | | | (0.42 | ) | | | (0.29 | ) | | | 0.31 | | | | 0.54 | |
| | | | | | | | | | | | | | | | | | | | | |
| Less distributions: | | | | | | | | | | | | | | | | | | | | |
| Dividends from net investment income | | | (0.09 | ) | | | (0.15 | ) | | | (0.18 | ) | | | (0.12 | ) | | | (0.03 | ) |
| Distributions from net realized gains | | | — | | | | (0.08 | ) | | | (0.85 | ) | | | — | | | | — | |
| Total distributions | | | (0.09 | ) | | | (0.23 | ) | | | (1.03 | ) | | | (0.12 | ) | | | (0.03 | ) |
| | | | | | | | | | | | | | | | | | | | | |
| Proceeds from redemption fees collected (Note 1) | | | 0.00 | (a) | | | — | | | | 0.00 | (a) | | | 0.00 | (a) | | | 0.00 | (a) |
| | | | | | | | | | | | | | | | | | | | | |
| Net asset value at end of year | | $ | 8.36 | | | $ | 8.65 | | | $ | 9.30 | | | $ | 10.62 | | | $ | 10.43 | |
| | | | | | | | | | | | | | | | | | | | | |
Total return (b) | | | (2.32 | %) | | | (4.60 | %) | | | (2.83 | %) | | | 2.96 | % | | | 5.42 | % |
| | | | | | | | | | | | | | | | | | | | | |
| Net assets at end of year (000's) | | $ | 6,883 | | | $ | 7,009 | | | $ | 8,869 | | | $ | 10,799 | | | $ | 32,534 | |
| | | | | | | | | | | | | | | | | | | | | |
| Ratio of total expenses to average net assets | | | 5.67 | % | | | 4.71 | % | | | 3.99 | % | | | 2.09 | % | | | 2.85 | % |
| | | | | | | | | | | | | | | | | | | | | |
Ratio of net expenses to average net assets (c) | | | 1.25 | % | | | 1.25 | % | | | 1.25 | % | | | 1.25 | % | | | 1.25 | % |
| | | | | | | | | | | | | | | | | | | | | |
Ratio of net investment income to average net assets (c) | | | 1.01 | % | | | 1.70 | % | | | 1.70 | % | | | 0.86 | % | | | 0.25 | % |
| | | | | | | | | | | | | | | | | | | | | |
| Portfolio turnover rate | | | 118 | % | | | 118 | % | | | 106 | % | | | 100 | % | | | 57 | % |
(a) | Amount rounds to less than $0.01 per share. |
(b) | Total return is a measure of the change in value of an investment in the Fund over the period covered, which assumes any dividends or capital gains distributions are reinvested in shares of the Fund. Returns do not reflect the deduction of taxes a shareholder would pay on Fund distributions or the redemption of Fund shares. |
(c) | Ratio was determined after advisory fee reductions and expense reimbursements (Note 3). |
| | |
| See accompanying notes to financial statements. |
58
Hussman Investment Trust
Notes to Financial Statements |
|
1. ORGANIZATION AND SIGNIFICANT ACCOUNTING POLICIES
Hussman Strategic Growth Fund, Hussman Strategic Total Return Fund, Hussman Strategic International Fund and Hussman Strategic Value Fund (formerly, Hussman Strategic Dividend Value Fund) (each, a “Fund,” and collectively, the “Funds”), are diversified, separate series of Hussman Investment Trust (the “Trust”), which is registered under the Investment Company Act of 1940 as an open-end management investment company. Each Fund is authorized to issue an unlimited number of shares. Hussman Strategic Growth Fund commenced operations on July 24, 2000. Hussman Strategic Total Return Fund commenced operations on September 12, 2002. Hussman Strategic International Fund commenced operations on December 31, 2009. Hussman Strategic Value Fund commenced operations on February 6, 2012.
Hussman Strategic Growth Fund’s investment objective is to provide long-term capital appreciation, with added emphasis on protection of capital during unfavorable market conditions.
Hussman Strategic Total Return Fund’s investment objective is to provide long-term total return from income and capital appreciation, with added emphasis on protection of capital during unfavorable market conditions.
Hussman Strategic International Fund’s investment objective is to provide long-term capital appreciation, with added emphasis on the protection of capital during unfavorable market conditions. The Fund invests primarily in equity securities of non-U.S. issuers.
Hussman Strategic Value Fund’s investment objective is to provide total return through a combination of dividend income and capital appreciation, with added emphasis on protection of capital during unfavorable market conditions.
In October 2016, the U.S. Securities and Exchange Commission (the “SEC”) adopted amendments to Regulation S-X which will impact financial statement presentation, particularly the presentation of derivative investments. Many of the Regulation S-X amendments are generally consistent with the Funds’ current financial statement presentation; therefore, management has evaluated the new standards and is in a position to be able to comply with the amendments effective August 1, 2017.
59
Hussman Investment Trust
Notes to Financial Statements (continued) |
|
The following is a summary of significant accounting policies followed by the Funds. The policies are in conformity with U.S. generally accepted accounting principles (“GAAP”). As an investment company, as defined in Financial Accounting Standards Board (“FASB”) Accounting Standards Update 2013-08, each Fund follows accounting and reporting guidance under FASB Accounting Standards Codification Topic 946 “Financial Services – Investment Companies.”
Securities, Options and Futures Valuation — The Funds’ portfolio securities are valued at market value as of the close of regular trading on the New York Stock Exchange (“NYSE”) (normally, 4:00 p.m. Eastern time) on each business day the NYSE is open. Securities listed on the NYSE or other exchanges, other than options, are valued on the basis of their last sale prices on the exchanges on which they are primarily traded. However, if the last sale price on the NYSE is different than the last sale price on any other exchange, the NYSE price will be used. If there are no sales on that day, the securities are valued at the last bid price on the NYSE or other primary exchange for that day. Securities quoted by NASDAQ are valued at the NASDAQ Official Closing Price. If there are no sales on that day, the securities are valued at the last bid price as reported by NASDAQ. Securities traded in over-the-counter markets, other than NASDAQ quoted securities, are valued at the last sales price, or if there are no sales on that day, at the mean of the closing bid and ask prices. Securities traded on a foreign stock exchange are valued at their closing prices on the principal exchange where they are traded; however, on days when the value of securities traded on foreign stock exchanges may be materially affected by events occurring before the Funds’ pricing time, but after the close of the primary markets or exchanges on which such securities are traded, such securities will be valued at their fair value as determined by an independent pricing service approved by the Board of Trustees where such value is believed to reflect the market values of such securities as of the time of computation of net asset values of the Funds. As a result, the prices of foreign securities used to calculate a Fund’s net asset value may differ from quoted or published prices for these securities. Values of foreign securities are translated from the local currency into U.S. dollars using currency exchange rates supplied by an independent pricing quotation service.
Pursuant to procedures approved by the Board of Trustees, options traded on a national securities exchange are valued at prices between the closing bid and ask prices determined by Hussman Strategic Advisors, Inc. (the “Adviser”) to most closely reflect market value as of the time of computation of net asset value. As of June 30, 2017, all options held by Hussman Strategic Growth Fund and Hussman Strategic Value Fund have been valued in this manner. Options not traded on a national securities exchange or board of trade, but for which over-the-counter market
60
Hussman Investment Trust
Notes to Financial Statements (continued) |
|
quotations are readily available, are valued at the mean of their closing bid and ask prices. Futures contracts and options thereon, which are traded on commodities exchanges, are valued at their last sale prices as of the close of regular trading on the NYSE or, if not available, at the mean their bid and ask prices.
Fixed income securities not traded or dealt in upon any securities exchange, but for which over-the-counter market quotations are readily available, generally are valued at the mean of their closing bid and ask prices. Fixed income securities may also be valued on the basis of prices provided by an independent pricing service.
Investments representing shares of other open-end investment companies are valued at their net asset values per share as reported by such companies.
In the event that market quotations are not readily available or are determined by the Adviser to not be reflective of fair market value due to market events or developments, securities and other financial instruments will be valued at fair value as determined by the Adviser in accordance with procedures adopted by the Board of Trustees. Such methods of fair valuation may include, but are not limited to: multiple of earnings, multiple of book value, discount from market of a similar freely traded security, purchase price of security, subsequent private transactions in the security or related securities, or a combination of these and other factors.
GAAP establishes a single authoritative definition of fair value, sets out a framework for measuring fair value and requires additional disclosures about fair value measurements.
Various inputs are used in determining the values of the Funds’ investments. These inputs are summarized in the three broad levels listed below:
| | ● | Level 1 – quoted unadjusted prices for identical instruments in active markets to which the Fund has access at the date of measurement. |
| | ● | Level 2 – quoted prices for similar instruments in active markets; quoted prices for identical or similar instruments in markets that are not active; and model-derived valuations in which all significant inputs and significant value drivers are observable in active markets. Level 2 inputs are those in markets for which there are few transactions, the prices are not current, little public information exists or instances where prices vary substantially over time or among market makers. |
61
Hussman Investment Trust
Notes to Financial Statements (continued) |
|
| | ● | Level 3 – model-derived valuations in which one or more significant inputs or significant value drivers are unobservable. Unobservable inputs are those inputs that reflect the Fund’s own assumptions that market participants would use to price the asset or liability based on the best available information. |
Option contracts purchased or written by Hussman Strategic Growth Fund and Hussman Strategic Value Fund are classified as Level 2 since they are valued using “other significant observable inputs” at prices between the closing bid and ask prices determined by the Adviser to most closely reflect market value. U.S. Treasury obligations held by Hussman Strategic Total Return Fund are classified as Level 2 since values are based on prices provided by an independent pricing service that utilizes various “other significant observable inputs” including bid and ask quotations, prices of similar securities and interest rates, among other factors. Non-U.S. equity securities actively traded in foreign markets held by Hussman Strategic International Fund may be classified as Level 2 despite the availability of closing prices because such securities are typically valued at their fair value as determined by an independent pricing service. The Trust uses an independent pricing service to determine the fair value of foreign portfolio securities when the value of such securities may be materially affected by events occurring before a Fund’s pricing time, but after the close of the primary markets or exchanges on which such foreign securities are traded. These intervening events might be: country-specific (e.g., natural disaster, economic or political developments, interest rate change); issuer specific (e.g., earnings report, merger announcement); or U.S. markets-specific (such as a significant movement in the U.S. markets that is deemed likely to affect the value of foreign securities). The pricing service uses an automated system incorporating a model based on multiple parameters, including a security’s local closing price, relevant general and sector indices, currency fluctuations, trading in depositary receipts and futures, if applicable, and/or research valuations by its staff, in determining what it believes is the fair value of the securities. The frequency of use of their procedure will depend on market events and thus cannot be predicted. However, the procedure may be utilized to a significant extent by Hussman Strategic International Fund. Determining the fair value of portfolio securities involves reliance on judgment, and a security’s fair value may differ depending on the method used for determining value. With respect to a portfolio security that has been valued at fair value, there can be no assurance that a Fund could purchase or sell that security at a price equal to the fair value of such security used in calculating the Fund’s net asset value. Because of the inherent uncertainty in fair valuations and the various factors considered in determining fair value, there can be significant deviations between the fair value at which a portfolio
62
Hussman Investment Trust
Notes to Financial Statements (continued) |
|
security is being carried and the price at which it can be sold. Moreover, to the extent Hussman Strategic International Fund has significant holdings of foreign securities, fair valuation may be used more frequently than for the other Funds.
The inputs or methodology used for valuing securities are not necessarily an indication of the risks associated with investing in those securities. The inputs used to measure the value of a particular security may fall into more than one level of the fair value hierarchy. In such cases, for disclosure purposes, the level in the fair value hierarchy within which the fair value measurement of that security is determined to fall in its entirety is the lowest level input that is significant to the fair value measurement.
The following is a summary of the inputs used to value each Fund’s investments and other financial instruments as of June 30, 2017 by security type:
Hussman Strategic Growth Fund
| | | Level 1 | | | Level 2 | | | Level 3 | | | Total | |
| Investments in Securities and Money Market Funds: | | | | | | | | | | | | |
| Common Stocks | | $ | 376,935,366 | | | $ | — | | | $ | — | | | $ | 376,935,366 | |
| Put Option Contracts | | | — | | | | 6,964,000 | | | | — | | | | 6,964,000 | |
| Money Market Funds | | | 194,828,095 | | | | — | | | | — | | | | 194,828,095 | |
| Total Investments in Securities and Money Market Funds | | $ | 571,763,461 | | | $ | 6,964,000 | | | $ | — | | | $ | 578,727,461 | |
| | | | | | | | | | | | | | | | | |
| Other Financial Instruments: | | | | | | | | | | | | | | | | |
| Written Call Option Contracts | | $ | — | | | $ | (203,614,700 | ) | | $ | — | | | $ | (203,614,700 | ) |
| Total Other Financial Instruments | | $ | — | | | $ | (203,614,700 | ) | | $ | — | | | $ | (203,614,700 | ) |
Hussman Strategic Total Return Fund
| | | Level 1 | | | Level 2 | | | Level 3 | | | Total | |
| Investments in Securities and Money Market Funds: | | | | | | | | | | | | |
| Common Stocks | | $ | 53,657,540 | | | $ | — | | | $ | — | | | $ | 53,657,540 | |
| U.S. Treasury Obligations | | | — | | | | 235,951,916 | | | | — | | | | 235,951,916 | |
| Exchange-Traded Funds | | | 15,781,733 | | | | — | | | | — | | | | 15,781,733 | |
| Money Market Funds | | | 67,192,778 | | | | — | | | | — | | | | 67,192,778 | |
| Total Investments in Securities and Money Market Funds | | $ | 136,632,051 | | | $ | 235,951,916 | | | $ | — | | | $ | 372,583,967 | |
63
Hussman Investment Trust
Notes to Financial Statements (continued) |
|
Hussman Strategic International Fund
| | | Level 1 | | | Level 2 | | | Level 3 | | | Total | |
| Investments in Securities and Money Market Funds: | | | | | | | | | | | | |
| Common Stocks | | $ | 8,899,214 | | | $ | 18,486,512 | | | $ | — | | | $ | 27,385,726 | |
| Money Market Funds | | | 596,961 | | | | — | | | | — | | | | 596,961 | |
| Total Investments in Securities and Money Market Funds | | $ | 9,496,175 | | | $ | 18,486,512 | | | $ | — | | | $ | 27,982,687 | |
| | | | | | | | | | | | | | | | | |
| Other Financial Instruments: | | | | | | | | | | | | | | | | |
| Futures Contracts Sold Short | | $ | 117,218 | | | $ | — | | | $ | — | | | $ | 117,218 | |
| Total Other Financial Instruments | | $ | 117,218 | | | $ | — | | | $ | — | | | $ | 117,218 | |
Hussman Strategic Value Fund
| | | Level 1 | | | Level 2 | | | Level 3 | | | Total | |
| Investments in Securities and Money Market Funds: | | | | | | | | | | | | |
| Common Stocks | | $ | 6,747,241 | | | $ | — | | | $ | — | | | $ | 6,747,241 | |
| Put Option Contracts | | | — | | | | 3,064 | | | | — | | | | 3,064 | |
| Money Market Funds | | | 2,229,790 | | | | — | | | | — | | | | 2,229,790 | |
| Total Investments in Securities and Money Market Funds | | $ | 8,977,031 | | | $ | 3,064 | | | $ | — | | | $ | 8,980,095 | |
| | | | | | | | | | | | | | | | | |
| Other Financial Instruments: | | | | | | | | | | | | | | | | |
| Written Call Option Contracts | | $ | — | | | $ | (2,128,477 | ) | | $ | — | | | $ | (2,128,477 | ) |
| Total Other Financial Instruments | | $ | — | | | $ | (2,128,477 | ) | | $ | — | | | $ | (2,128,477 | ) |
Each Fund’s Schedule of Investments identifies the specific securities (by type of security and industry type or geographical region) that comprise that Fund’s holdings within the Level 1 and Level 2 categories shown in the tables above. As of June 30, 2017, the Funds did not have any transfers in or out of any Level.
In addition, the Funds did not have any assets or liabilities that were measured at fair value on a recurring basis using significant unobservable inputs (Level 3) as of June 30, 2017. It is the Funds’ policy to recognize transfers into and out of any Level at the end of the reporting period.
Futures Contracts and Option Transactions — Hussman Strategic Growth Fund, Hussman Strategic International Fund and Hussman Strategic Value Fund may purchase and write call and put options on broad-based stock indices and may also
64
Hussman Investment Trust
Notes to Financial Statements (continued) |
|
purchase and write call and put option contracts on individual securities. Each of the Funds may use financial futures contracts and related option contracts to hedge against changes in the market value of its portfolio securities. Hussman Strategic Total Return Fund and Hussman Strategic International Fund may also purchase foreign currency options to manage their exposure to foreign currencies, and Hussman Strategic Total Return Fund may purchase interest rate futures contracts to protect against a decline in the value of its portfolio resulting from rising interest rates. Hussman Strategic International Fund may enter into forward foreign currency contracts to hedge against the adverse impact of changes in foreign exchange rates on the U.S. dollar value of its investments or the prices at which it effects transactions in foreign securities.
Hussman Strategic Growth Fund, Hussman Strategic International Fund and Hussman Strategic Value Fund may each use futures and option contracts on stock indices for the purpose of seeking to reduce the market risk that would otherwise be associated with the securities in which it invests. For example, these Funds may sell a stock index futures contract to hedge the risk of a general market or market sector decline that might adversely affect prices of the Funds’ portfolio securities. To the extent there is a correlation between a Fund’s portfolio and a particular stock index, the sale of futures contracts on that index could reduce the Fund’s exposure to general market risk.
When a Fund writes an index option, an amount equal to the net premium (the premium less the commission) received by the Fund is recorded as a liability in the Fund’s Statement of Assets and Liabilities and is subsequently marked-to market daily. If an index option written by the Fund expires unexercised on the stipulated expiration date or if the Fund enters into a closing purchase transaction, it will realize a gain or a loss depending on whether the cost of a closing purchase transaction is less than or exceeds the net premium received when the option was sold and the liability related to such option will be eliminated. If an index option written by the Fund is exercised, the Fund will be required to pay the difference between the closing index value and the exercise price of the option. In this event, the proceeds of the sale will be increased by the net premium originally received and the Fund will realize a gain or loss.
When a Fund purchases or sells a stock index futures contract, no price is paid to or received by the Fund upon the purchase or sale of the futures contract. Instead, the Fund is required to deposit in a segregated asset account an amount of cash or qualifying securities currently ranging from 2% to 11% of the contract amount. This is called “initial margin.” Subsequent payments, known as “variation margin,” are made or received by the Fund each day, depending on the daily fluctuations in the value of the underlying stock index. The Fund recognizes an unrealized gain or loss
65
Hussman Investment Trust
Notes to Financial Statements (continued) |
|
equal to the daily variation margin. If general market movements are not as expected, the Fund may not achieve the anticipated benefits of the futures contracts and may realize a loss. In addition to the possibility that there may be an imperfect correlation or no correlation at all between the movements in the stock index futures and the portion of the portfolio being hedged, the price of the stock index futures may not correlate perfectly with movements in the stock index due to certain market distortions.
Foreign Currency Translation — Amounts and securities denominated in or expected to settle in foreign currencies are translated into U.S. dollars based on exchange rates on the following basis:
| | A. | The values of investment securities and other assets and liabilities are translated as of the close of the NYSE each day. |
| | B. | Purchases and sales of investment securities and income and expenses are translated at the rate of exchange prevailing as of 4:00 p.m. on the respective date of such transactions. |
| | C. | The Funds do not isolate that portion of the results of operations caused by changes in foreign exchange rates on investments from those caused by changes in market prices of securities held. Such fluctuations are included with the net realized and unrealized gains or losses on investments. |
Reported net realized foreign exchange gains or losses arise from: (1) purchases and sales of foreign currencies; (2) currency gains or losses realized between the trade and settlement dates on securities transactions; and (3) the difference between the amounts of dividends, interest and foreign withholding taxes recorded on the Fund’s books and the U.S. dollar equivalent of the amounts actually received or paid. Reported net unrealized foreign exchange gains and losses arise from changes in the value of assets and liabilities that result from changes in exchange rates.
Share Valuation and Redemption Fees — The net asset value per share of each Fund is calculated as of the close of regular trading on the NYSE (normally 4:00 p.m., Eastern time) on each day that the NYSE is open for business. The net asset value per share of each Fund is calculated by dividing the total value of the Fund’s assets, less its liabilities, by the number of its shares outstanding. The offering price and redemption price per share of each Fund is equal to the net asset value per share. However, a redemption fee of 1.5%, payable to the applicable Fund, generally will apply to shares that are redeemed 60 days or less from the date of purchase. During the years ended June 30, 2017 and 2016, proceeds from redemption fees, recorded in capital, totaled: $26,544 and $213,465, respectively, for Hussman Strategic
66
Hussman Investment Trust
Notes to Financial Statements (continued) |
|
Growth Fund; $29,889 and $8,998, respectively, for Hussman Strategic Total Return Fund; $1,327 and $1,662, respectively, for Hussman Strategic International Fund; and $394 and $0, respectively, for Hussman Strategic Value Fund.
Investment Income — Interest income is accrued as earned. Dividend income is recorded on the ex-dividend date. Discounts and premiums on fixed income securities are amortized using the effective interest method. Withholding taxes on foreign dividends have been recorded in accordance with the Funds’ understanding of the appropriate country’s rules and tax rates.
Distributions to Shareholders — Dividends from net investment income, if any, are declared and paid annually to shareholders of Hussman Strategic Growth Fund and Hussman Strategic International Fund and are declared and paid quarterly to shareholders of Hussman Strategic Total Return Fund and Hussman Strategic Value Fund. Net realized short-term capital gains, if any, may be distributed throughout the year and net realized long-term capital gains, if any, are generally distributed annually. The amount of distributions from net investment income and net realized capital gains are determined in accordance with federal income tax regulations, which may differ from GAAP. These “book/tax” differences are either temporary or permanent in nature and are primarily due to timing differences in the recognition of capital gains or losses on option and futures transactions, losses deferred due to wash sales and treatment of foreign currency transactions. The tax character of distributions paid by each Fund during the years ended June 30, 2017 and 2016 was as follows:
| | Year
Ended | | Ordinary
Income | | | Long-Term
Capital Gains | | | Total
Distributions | |
| Hussman Strategic Growth Fund | 6/30/17 | | $ | 1,248,630 | | | $ | — | | | $ | 1,248,630 | |
| 6/30/16 | | $ | 3,386,901 | | | $ | — | | | $ | 3,386,901 | |
| Hussman Strategic Total Return Fund | 6/30/17 | | $ | 821,242 | | | $ | — | | | $ | 821,242 | |
| 6/30/16 | | $ | 1,670,975 | | | $ | — | | | $ | 1,670,975 | |
| Hussman Strategic Value Fund | 6/30/17 | | $ | 74,064 | | | $ | — | | | $ | 74,064 | |
| 6/30/16 | | $ | 128,065 | | | $ | 75,053 | | | $ | 203,118 | |
Hussman Strategic International Fund did not pay any distributions during the years ended June 30, 2017 and 2016.
Securities Transactions — Securities transactions are accounted for on trade date for financial reporting purposes. Realized gains and losses on securities sold are determined on a specific identification basis.
67
Hussman Investment Trust
Notes to Financial Statements (continued) |
|
Common Expenses — Expenses of the Trust not attributable solely to one of the Funds are allocated among the Funds based on relative net assets of each Fund or based on the nature of the expense and its relative applicability to each Fund.
Accounting Estimates — The preparation of financial statements in conformity with GAAP requires management to make estimates and assumptions that affect the reported amounts of assets and liabilities and the disclosure of contingent assets and liabilities as of the date of the financial statements and the reported amounts of income and expenses during the reporting period. Actual results could differ from these estimates.
Federal Income Tax — Each Fund has qualified and intends to continue to qualify each year as a “regulated investment company“ under Subchapter M of the Internal Revenue Code of 1986 (the “Code”). By so qualifying, a Fund will not be subject to federal income taxes to the extent that it distributes its net investment income and any net realized capital gains in accordance with the Code. Accordingly, no provision for income taxes has been made.
In order to avoid imposition of a federal excise tax applicable to regulated investment companies, it is each Fund’s intention to declare and pay as dividends in each calendar year at least 98% of its net investment income (earned during the calendar year) and 98.2% of its net realized capital gains (earned during the twelve months ended October 31) plus undistributed amounts from prior years.
The tax character of accumulated deficit at June 30, 2017 was as follows:
| | | Hussman Strategic
Growth Fund | | | Hussman Strategic Total Return Fund | | | Hussman Strategic International Fund | | | Hussman Strategic
Value Fund | |
| Net unrealized appreciation (depreciation) | | $ | 21,132,976 | | | $ | (5,203,876 | ) | | $ | 3,572,431 | | | $ | 508,841 | |
| Undistributed ordinary income | | | 384,113 | | | | 47,955 | | | | 152,051 | | | | 2,661 | |
| Capital loss carryforwards | | | (2,083,145,799 | ) | | | (75,886,060 | ) | | | (17,707,870 | ) | | | (1,168,618 | ) |
| Other temporary differences | | | — | | | | (21,868 | ) | | | — | | | | (83 | ) |
| Total accumulated deficit | | $ | (2,061,628,710 | ) | | $ | (81,063,849 | ) | | $ | (13,983,388 | ) | | $ | (657,199 | ) |
68
Hussman Investment Trust
Notes to Financial Statements (continued) |
|
The following information is based upon the federal income tax cost of investment securities as of June 30, 2017:
| | | Hussman Strategic
Growth Fund | | | Hussman Strategic Total Return Fund | | | Hussman Strategic
International Fund | | | Hussman Strategic
Value Fund | |
| Cost of investments and money market funds | | $ | 557,594,485 | | | $ | 377,787,841 | | | $ | 24,404,567 | | | $ | 8,471,254 | |
| Gross unrealized appreciation | | $ | 38,783,306 | | | $ | 3,914,635 | | | $ | 4,060,907 | | | $ | 815,723 | |
| Gross unrealized depreciation | | | (17,650,330 | ) | | | (9,118,511 | ) | | | (482,787 | ) | | | (306,882 | ) |
| Net unrealized appreciation (depreciation) | | $ | 21,132,976 | | | $ | (5,203,876 | ) | | $ | 3,578,120 | | | $ | 508,841 | |
The difference between the federal income tax cost of portfolio investments and the financial statement cost of portfolio investments for each Fund is due to certain timing differences in the recognition of capital gains or losses under income tax regulations and GAAP. These “book/tax” differences are temporary in nature and are primarily due to losses deferred due to wash sales and adjustments to basis on publicly traded partnerships and grantor trusts.
During the year ended June 30, 2017, Hussman Strategic Total Return Fund utilized $5,678,337 of capital loss carryforwards to offset current year gains.
As of June 30, 2017, the Funds had the following capital loss carryforwards (“CLCFs”) for federal income tax purposes:
| | | Hussman Strategic
Growth Fund | | | Hussman Strategic Total Return Fund | | | Hussman Strategic
International Fund | | | Hussman Strategic
Value Fund | |
| Expires June 30, 2018 – short-term | | $ | 375,427,325 | | | $ | — | | | $ | — | | | $ | — | |
| Expires June 30, 2019 – short-term | | | 824,973,031 | | | | — | | | | — | | | | — | |
| No expiration – short-term | | | 666,300,413 | | | | 64,355,836 | | | | 16,337,022 | | | | 479,582 | |
| No expiration – long-term | | | 216,445,030 | | | | 11,530,224 | | | | 1,370,848 | | | | 689,036 | |
| | | $ | 2,083,145,799 | | | $ | 75,886,060 | | | $ | 17,707,870 | | | $ | 1,168,618 | |
These CLCFs may be utilized in future years to offset net realized capital gains, if any, prior to distributing such gains to shareholders.
69
Hussman Investment Trust
Notes to Financial Statements (continued) |
|
Given the current net assets of Hussman Strategic Growth Fund, it is unlikely that the Fund will be able to utilize the portion of its CLCFs that expire in 2018 and 2019. Such CLCFs cannot be utilized prior to the utilization of new CLCFs created after December 31, 2010, which have no expiration date.
For the year ended June 30, 2017, the following reclassifications were made as a result of permanent differences between the financial statement and income tax reporting requirements due to adjustments for publicly traded partnerships, grantor trusts, passive foreign investment companies and losses on foreign currency transactions:
| | | Hussman Strategic
Growth Fund | | | Hussman Strategic Total Return Fund | | | Hussman Strategic
International Fund | | | Hussman Strategic
Value Fund | |
| Undistributed net investment income | | $ | (18,568 | ) | | $ | (50,404 | ) | | $ | 98,518 | | | $ | — | |
| Accumulated net realized losses from investments, option and futures contracts | | $ | 18,608 | | | $ | 50,476 | | | $ | (98,518 | ) | | $ | — | |
| Paid-in-capital | | $ | (40 | ) | | $ | (72 | ) | | $ | — | | | $ | — | |
Such reclassifications have no effect on each Fund’s total net assets or its net asset value per share.
Each Fund recognizes the tax benefits or expenses of uncertain tax positions only when the position is “more likely than not” to be sustained assuming examination by tax authorities. Management has reviewed each Fund’s tax positions taken on federal income tax returns for all open tax years (tax years ended June 30, 2014 through June 30, 2017) and all major jurisdictions and has concluded that no provision for unrecognized tax benefits or expenses is required in these financial statements. Therefore, no additional tax expense, including interest and penalties, was recorded in the current year and no adjustments were made to the prior periods. To the extent the Funds recognize interest and penalties, they are included in interest expense and other expenses, respectively, in the Statements of Operations.
2. INVESTMENT TRANSACTIONS
During the year ended June 30, 2017, cost of purchases and proceeds from sales and maturities of investment securities, other than short-term investments and U.S. government securities, amounted to: $994,819,032 and $1,269,696,678, respectively, for Hussman Strategic Growth Fund; $175,495,648 and $157,821,179,
70
Hussman Investment Trust
Notes to Financial Statements (continued) |
|
respectively, for Hussman Strategic Total Return Fund; $29,339,430 and $36,548,339, respectively, for Hussman Strategic International Fund; and $8,007,459 and $9,017,216, respectively, for Hussman Strategic Value Fund.
3. TRANSACTIONS WITH AFFILIATES
Advisory Agreement
Under the terms of an Advisory Agreement between the Trust and the Adviser, Hussman Strategic Growth Fund pays the Adviser a fee, which is computed and accrued daily and paid monthly, at annual rates of 0.90% of the first $2 billion of the Fund’s average daily net assets; 0.85% of the next $3 billion of such assets; and 0.80% of such assets over $5 billion, less any fee reductions. Under the terms of a separate Advisory Agreement between the Trust and the Adviser, Hussman Strategic Total Return Fund pays the Adviser a fee, which is computed and accrued daily and paid monthly, at annual rates of 0.50% of the first $1 billion of the Fund’s average daily net assets; 0.45% of the next $1.5 billion of such assets; and 0.40% of such assets over $2.5 billion, less any fee reductions. Under the terms of a separate Advisory Agreement between the Trust and the Adviser, Hussman Strategic International Fund pays the Adviser a fee, which is computed and accrued daily and paid monthly, at annual rates of 0.95% of the first $2 billion of the Fund’s average daily net assets; 0.90% of the next $3 billion of such assets; and 0.85% of such assets over $5 billion, less any fee reductions. Under the terms of a separate Advisory Agreement between the Trust and the Adviser, Hussman Strategic Value Fund pays the Adviser a fee, which is computed and accrued daily and paid monthly, at annual rates of 0.90% of the first $2 billion of the Fund’s average daily net assets; 0.85% of the next $3 billion of such assets; and 0.80% of such assets over $5 billion, less any fee reductions.
The Adviser has contractually agreed to reduce its advisory fees or to absorb operating expenses to the extent necessary so that ordinary operating expenses of Hussman Strategic Growth Fund, Hussman Strategic Total Return Fund, Hussman Strategic International Fund and Hussman Strategic Value Fund do not exceed annually an amount equal to 1.13%, 0.73%, 2.00% and 1.25%, respectively, of such Fund’s average daily net assets. These Expense Limitation Agreements remain in effect until at least November 1, 2017. Prior to November 1, 2016, the expense limit was 1.10% of average daily net assets with respect to Hussman Strategic Growth Fund and the expense limit was 0.70% of average daily net assets with respect to Hussman Strategic Total Return Fund. During the year ended June 30, 2017, the Adviser reduced its advisory fees or reimbursed expenses in the amount of $347,554, $138,941, $89,143 and $310,048 with respect to Hussman Strategic
71
Hussman Investment Trust
Notes to Financial Statements (continued) |
|
Growth Fund, Hussman Strategic Total Return Fund, Hussman Strategic International Fund and Hussman Strategic Value Fund, respectively. As of June 30, 2017, the Advisor owed $35,095 to Hussman Strategic Value Fund.
Fee reductions and expense reimbursements by the Adviser pursuant to these contractual arrangements are subject to future repayment by the Funds provided that such repayment does not result in Hussman Strategic Growth Fund’s, Hussman Strategic Total Return Fund’s, Hussman Strategic International Fund’s or Hussman Strategic Value Fund’s annual ordinary operating expenses exceeding an amount equal to 1.07%, 0.63%, 2.00% and 1.25%, respectively, of such Fund’s average daily net assets, and provided further that the fee reductions or expenses which are the subject of the repayment were reduced or incurred (as applicable) within three years of such repayment. As of June 30, 2017, the amount of fee reductions and expense reimbursements available for possible recovery by the Adviser from Hussman Strategic Growth Fund, Hussman Strategic Total Return Fund, Hussman Strategic International Fund and Hussman Strategic Value Fund is $1,132,565, $786,331, $102,596 and $845,504, respectively. The portions of these amounts that the Adviser may recover expire as of the following dates:
| | | June 30, 2018 | | | June 30, 2019 | | | June 30, 2020 | |
| Hussman Strategic Growth Fund | | $ | 423,991 | | | $ | 361,020 | | | $ | 347,554 | |
| Hussman Strategic Total Return Fund | | $ | 381,335 | | | $ | 266,055 | | | $ | 138,941 | |
| Hussman Strategic International Fund | | $ | — | | | $ | 13,453 | | | $ | 89,143 | |
| Hussman Strategic Value Fund | | $ | 261,151 | | | $ | 274,305 | | | $ | 310,048 | |
Certain officers of the Trust are also officers of the Adviser.
Other Service Providers
Ultimus Fund Solutions, LLC (“Ultimus”) provides administration, fund accounting, compliance and transfer agency services to the Funds. The Funds pay Ultimus fees for its services in accordance with various servicing agreements. In addition, the Funds pay certain out-of-pocket expenses, including, but not limited to, postage, supplies and costs of pricing the Funds’ portfolio securities. Certain officers of the Trust are also officers of Ultimus, or of Ultimus Fund Distributors, LLC (the “Distributor”), the principal underwriter of the Funds. The Distributor is a wholly-owned subsidiary of Ultimus.
72
Hussman Investment Trust
Notes to Financial Statements (continued) |
|
The Funds compensate certain financial intermediaries for providing account maintenance and shareholder services to shareholder accounts held through such intermediaries. During the year ended June 30, 2017, Hussman Strategic Growth Fund, Hussman Strategic Total Return Fund, Hussman Strategic International Fund and Hussman Strategic Value Fund paid $259,655, $179,592, $18,852 and $1,013, respectively, to financial intermediaries for such services. These amounts are included in transfer agent, account maintenance and shareholder services fees on the Statements of Operations.
Trustee Compensation
Trustees and officers affiliated with the Adviser or Ultimus are not compensated by the Funds for their services. Each Trustee who is not an affiliated person of the Adviser or Ultimus receives from the Trust an annual retainer of $60,000, payable quarterly; a fee of $10,000 for attendance at each in-person meeting of the Board of Trustees (except that such fee is $15,000 with respect to the annual meeting of the Board) and a fee of $4,000 for attendance at each telephone meeting of the Board of Trustees; a fee of $3,000 for attendance at each meeting of any committee of the Board; a fee of $1,500 for participation in each informal monthly telephone conference call of the Board; plus reimbursement of travel and other expenses incurred in attending meetings.
4. DERIVATIVES TRANSACTIONS
Transactions in option contracts written by Hussman Strategic Growth Fund and Hussman Strategic Value Fund during the year ended June 30, 2017 were as follows:
Hussman Strategic Growth Fund
| | | Written Option
Contracts | | | Written Option
Premiums | |
| Options outstanding at beginning of year | | | 3,250 | | | $ | 286,149,139 | |
| Options written | | | 9,100 | | | | 1,001,098,464 | |
| Options cancelled in a closing purchase transaction | | | (10,750 | ) | | | (1,084,922,961 | ) |
| Options outstanding at end of year | | | 1,600 | | | $ | 202,324,642 | |
73
Hussman Investment Trust
Notes to Financial Statements (continued) |
|
Hussman Strategic Value Fund
| | | Written Option
Contracts | | | Written Option
Premiums | |
| Options outstanding at beginning of year | | | 32 | | | $ | 2,072,882 | |
| Options written | | | 116 | | | | 9,207,518 | |
| Options cancelled in a closing purchase transaction | | | (121 | ) | | | (9,115,116 | ) |
| Options outstanding at end of year | | | 27 | | | $ | 2,165,284 | |
During the fiscal year ended June 30, 2017, Hussman Strategic Total Return Fund and Hussman Strategic International Fund did not write any options.
The locations in the Statements of Assets and Liabilities of the derivative positions of Hussman Strategic Growth Fund, Hussman Strategic International Fund and Hussman Strategic Value Fund are as follows:
Hussman Strategic Growth Fund
| | | | | Fair Value | | | | |
| Type of Derivative | Risk | Location | | Asset
Derivatives | | | Liability Derivatives | | | Average Monthly Notional Amount
During Year Ended June 30, 2017* | |
| Index put options purchased | Equity | Investments in securities at value | | $ | 6,964,000 | | | $ | — | | | $ | 466,967,037 | |
| Index call options written | Equity | Written call options, at value | | | — | | | | (203,614,700 | ) | | | (466,967,037 | ) |
Hussman Strategic International Fund
| | | | | Fair Value | | | | |
| Type of Derivative | Risk | Location | | Asset
Derivatives | | | Liability Derivatives | | | Average Monthly Notional Amount
During Year Ended
June 30, 2017* | |
| Futures contracts sold short | Equity | Variation margin payable | | $ | — | | | $ | (11,032 | ) | | $ | (28,193,523 | ) |
74
Hussman Investment Trust
Notes to Financial Statements (continued) |
|
Hussman Strategic Value Fund
| | | | | Fair Value | | | | |
| Type of Derivative | Risk | Location | | Asset
Derivatives | | | Liability Derivatives | | | Average Monthly Notional Amount During Year Ended
June 30, 2017* | |
| Index put options purchased | Equity | Investments in securities at value | | $ | 3,064 | | | $ | — | | | $ | 6,642,248 | |
| Index call options written | Equity | Written call options, at value | | | — | | | | (2,128,477 | ) | | | (6,642,248 | ) |
| * | The average monthly notional amount generally represents the derivative contracts activity throughout the year for the Fund. |
Realized and unrealized gains and losses associated with transactions in derivative instruments for Hussman Strategic Growth Fund, Hussman Strategic International Fund and Hussman Strategic Value Fund during the year ended June 30, 2017 are recorded in the following locations in the Statements of Operations:
Hussman Strategic Growth Fund
| Type of Derivative | Risk | Location | | Realized
Gains (Losses) | | Location | | Change in
Unrealized
Gains (Losses) | |
| Index put options purchased | Equity | Net realized gains (losses) from investments | | $ | (57,500,583 | ) | Net change in unrealized appreciation (depreciation) on option contracts | | $ | 4,743,902 | |
| Index call options purchased | Equity | Net realized gains (losses) from investments | | | 61,404 | | Net change in unrealized appreciation (depreciation) on option contracts | | | — | |
| Index call options written | Equity | Net realized gains (losses) from written option contracts | | | (89,511,949 | ) | Net change in unrealized appreciation (depreciation) on option contracts | | | (4,734,097 | ) |
75
Hussman Investment Trust
Notes to Financial Statements (continued) |
|
Hussman Strategic International Fund
| Type of Derivative | Risk | Location | | Realized
Gains (Losses) | | Location | | Change in Unrealized Gains (Losses) | |
| Futures contracts sold short | Equity | Net realized gains (losses) from futures contracts | | $ | (3,701,411 | ) | Net change in unrealized appreciation (depreciation) on futures contracts | | $ | (1,146,373 | ) |
Hussman Strategic Value Fund
| Type of Derivative | Risk | Location | | Realized
Gains (Losses) | | Location | | Change in Unrealized Gains (Losses) | |
| Index put options purchased | Equity | Net realized gains (losses) from investments | | $ | (53,374 | ) | Net change in unrealized appreciation (depreciation) on option contracts | | $ | 1,700 | |
| Index call options written | Equity | Net realized gains (losses) from written option contracts | | | (1,044,265 | ) | Net change in unrealized appreciation (depreciation) on option contracts | | | 37,575 | |
Hussman Strategic Total Return Fund had no transactions in derivative instruments during the year ended June 30, 2017.
In the ordinary course of business, Hussman Strategic Growth Fund, Hussman Strategic International Fund and Hussman Strategic Value Fund may enter into transactions subject to enforceable netting agreements or other similar arrangements (“netting agreements”). Generally, the right to offset in netting agreements allows each Fund to offset the exposure it has on any transaction with a specific counterparty with any collateral it has received or delivered in connection with other transactions with that counterparty. Generally, the Funds manage their cash collateral and securities collateral on a counterparty basis.
76
Hussman Investment Trust
Notes to Financial Statements (continued) |
|
The offsetting of financial liabilities and derivative liabilities as of June 30, 2017 are as follows:
Hussman Strategic Growth Fund
| Description | | Gross Amounts of Recognized Liabilities | | | Gross Amounts Offset in Statements of Assets and Liabilities | | | Net Amounts of Liabilities Presented in Statements of Assets and Liabilities | | | Collateral Pledged | | | Net Amount | |
| Written options at market value | | $ | 203,614,700 | | | $ | — | | | $ | 203,614,700 | | | $ | — | | | $ | 203,614,700 | |
| Total subject to a master netting or similar arrangement | | $ | 203,614,700 | | | $ | — | | | $ | 203,614,700 | | | $ | — | | | $ | 203,614,700 | |
Hussman Strategic International Fund
| Description | | Gross Amounts of Recognized Liabilities | | | Gross Amounts Offset in Statements of Assets and Liabilities | | | Net Amounts of Liabilities Presented in Statements of Assets and Liabilities | | | Collateral Pledged* | | | Net Amount | |
| Variation margin payable - futures contracts | | $ | 11,032 | | | $ | — | | | $ | 11,032 | | | $ | (11,032 | ) | | $ | — | |
| Total subject to a master netting or similar arrangement | | $ | 11,032 | | | $ | — | | | $ | 11,032 | | | $ | (11,032 | ) | | $ | — | |
| * | Amounts in cash collateral pledged in the table above are limited to the net amounts of liabilities presented in the Statements of Assets and Liabilities. |
77
Hussman Investment Trust
Notes to Financial Statements (continued) |
|
Hussman Strategic Value Fund
| Description | | Gross Amounts of Recognized Liabilities | | | Gross Amounts Offset in Statements of Assets and Liabilities | | | Net Amounts of Liabilities Presented in Statements of Assets and Liabilities | | | Collateral Pledged | | | Net Amount | |
| Written options at market value | | $ | 2,128,477 | | | $ | — | | | $ | 2,128,477 | | | $ | — | | | $ | 2,128,477 | |
| Total subject to a master netting or similar arrangement | | $ | 2,128,477 | | | $ | — | | | $ | 2,128,477 | | | $ | — | | | $ | 2,128,477 | |
5. CERTAIN INVESTMENTS AND RISKS
The securities in which the Funds invest, as well as the risks associated with these securities and with the investment programs of the Funds, are described in the Funds’ Prospectuses. Among these risks are those associated with investments in derivative instruments, investments in shares of money market funds, concentration of investments within a particular business sector and, in the case of Hussman Strategic International Fund, investments in foreign securities.
Risks of Derivative Instruments — The purchase and sale of derivative instruments, including options and futures contracts, and other derivative transactions involve risks different from those involved with direct investments in securities and also require different skills from the Adviser in managing each Fund’s portfolio of investments. While utilization of options, futures contracts and similar instruments may be advantageous to the Funds, if the Adviser is not successful in employing such instruments in managing a Fund’s investments or in anticipating general market movements, the Fund’s performance will be worse than if the Fund did not make such investments. It is possible that there will be imperfect correlation, or even no correlation, between price movements of the investments held by the Funds and the options, futures or other derivative instruments used to hedge those investments. It is also possible that a Fund may be unable to close out or liquidate its hedges during unusual periods of illiquidity in the options, futures or other markets. In addition, a Fund will pay commissions and other costs in connection with its transactions in such instruments, which may increase its expenses and reduce its investment performance.
78
Hussman Investment Trust
Notes to Financial Statements (continued) |
|
Investments in Money Market Funds — In order to maintain sufficient liquidity to implement investment strategies, or for temporary defensive purposes, each Fund may at times invest a significant portion of its assets in shares of one or more money market funds. As of June 30, 2017, Hussman Strategic Growth Fund and Hussman Strategic Value Fund had 51.9% and 32.4%, respectively, of the value of their net assets invested in shares of money market funds registered under the Investment Company Act of 1940, including 35.1% and 22.7%, respectively, of the value of their net assets invested in shares of a single money market fund. An investment in a money market fund is not insured or guaranteed by the Federal Deposit Insurance Corporation or any other governmental agency, entity or person. While investor losses in money market funds have been rare, they are possible. The Funds incur additional indirect expenses due to acquired fund fees and expenses to the extent they invest in shares of money market funds.
Sector Risk — If a Fund has significant investments in the securities of issuers in industries within a particular business sector, any development generally affecting that sector will have a greater impact on the value of the net assets of the Fund than would be the case if the Fund did not have significant investments in that sector. This may increase the risk of loss of an investment in a Fund and increase the volatility of a Fund’s net asset value per share. From time to time, circumstances may affect a particular sector and the companies within such sector. For instance, economic or market factors, regulation or deregulation, and technological or other developments may negatively impact all companies in a particular sector and therefore the value of a Fund’s portfolio could be adversely affected. As of June 30, 2017, Hussman Strategic Growth Fund had 37.6% of the value of its net assets invested in stocks within the Information Technology sector and Hussman Strategic International Fund and Hussman Strategic Value Fund had 25.4% and 32.9%, respectively, of the value of their net assets invested in stocks within the Consumer Discretionary sector.
Foreign Investment Risk — Compared with investing in the United States, investing in foreign markets involves a greater degree and variety of risks. Investors in foreign markets may face delayed settlements, currency controls and adverse economic developments as well as higher overall transaction costs. In addition, fluctuations in the U.S. dollar’s value versus other currencies may erode or reverse gains from investments denominated in foreign currencies or increase losses. Foreign governments may expropriate assets, impose capital or currency controls, impose punitive taxes, impose limits on ownership or nationalize a company or industry. Any of these actions could have a severe effect on security prices and impair an investor’s ability to bring its capital or income back to the U.S. Exchange rate fluctuations also may impair an issuer’s ability to repay U.S. dollar denominated debt, thereby increasing
79
Hussman Investment Trust
Notes to Financial Statements (continued) |
|
credit risk associated with investment in such debt. The value of foreign securities may be affected by incomplete, less frequent or inaccurate financial information about their issuers, social upheavals or political actions ranging from tax code changes to government collapse. Foreign companies may also receive less coverage than U.S. companies by market analysts and may be subject to reporting standards or regulatory requirements, that differ from than those applicable to U.S. companies.
As of June 30, 2017, investments by Hussman Strategic International Fund in issuers in the United Kingdom represented 12.6% of the value of the Fund’s net assets and investments by the Fund in issuers in countries within the European Union (the “EU”) (including the United Kingdom) represented 39.5% of the value of the Fund’s net assets. Voters in the United Kingdom, in a referendum conducted on June 23, 2016, opted to leave the EU. In March 2017, the United Kingdom triggered the withdrawal procedures of Article 50 of the Treaty of Lisbon and, as a result, there will be a period of two years (or longer) during which the terms of the United Kingdom’s exit from the EU will be negotiated. As a consequence of this vote and the withdrawal process, there may be an extended period of political and economic uncertainty and market volatility in the United Kingdom, other EU countries, the European Economic Area and globally. The longer term impact on securities markets of the United Kingdom’s exit from the EU is not clear. However, the impact could be significant, and the value and liquidity of the Fund’s investments in issuers based in the United Kingdom, the EU and elsewhere could be negatively affected. In addition, if one or more other EU countries abandon the euro (the common currency of the EU) or seek to withdraw from the EU, the value of the Fund’s investments linked to the euro and the value of its investments in issuers with significant operations in the EU could be adversely impacted.
As of June 30, 2017, Hussman Strategic International Fund had 27.4% of the value of its stock portfolio invested in stocks of companies domiciled in Japan. At times, the Japanese economy has been negatively affected by government intervention and protectionism, an unstable financial services sector, a heavy reliance on international trade, and natural disasters. These factors, as well as other adverse political developments, increases in government debt, and changes to fiscal monetary or trade policies, may negatively affect Japanese markets and the prices of stocks of Japenese companies.
80
Hussman Investment Trust
Notes to Financial Statements (continued) |
|
6. FORWARD FOREIGN CURRENCY EXCHANGE CONTRACTS
Hussman Strategic International Fund is subject to foreign currency exchange rate risk in the normal course of pursuing its investment objective. Hussman Strategic International Fund may (but is not required to) enter into contracts for the purchase or sale of a specific foreign currency at a fixed price on a future date as a hedge or cross-hedge against either specific transactions or portfolio positions generally. The purpose of Hussman Strategic International Fund’s foreign currency hedging transactions is to reduce the risk that the U.S. dollar value of the Fund’s securities denominated in foreign currency will decline in value due to changes in foreign currency exchange rates. All foreign currency exchange contracts are “marked-to-market” daily at the applicable translation rates resulting in unrealized gains or losses. Realized and unrealized gains or losses from transactions in foreign currency exchange contracts are included in the Fund’s Statement of Assets and Liabilities and Statement of Operations. Risks associated with these contracts include the potential inability of counterparties to meet the terms of their contracts and unanticipated movements in the value of a foreign currency relative to the U.S. dollar. Hussman Strategic International Fund, as previously noted, may also purchase foreign currency options to manage foreign currency exposures.
As of June 30, 2017, Hussman Strategic International Fund had no forward currency exchange contracts outstanding.
7. BANK LINE OF CREDIT
Hussman Strategic Growth Fund has an unsecured bank line of credit with its custodian bank in the amount of $10,000,000. Hussman Strategic Total Return Fund has an unsecured bank line of credit with its custodian bank in the amount of $2,000,000. Borrowings under these arrangements bear interest at a rate determined by the lending bank at the time of borrowing. During the year ended June 30, 2017, the Funds did not borrow under their respective lines of credit. Neither Hussman Strategic International Fund nor Hussman Strategic Value Fund currently has a bank line of credit.
8. CONTINGENCIES AND COMMITMENTS
The Trust’s officers and Trustees are entitled to indemnification from the Funds for certain liabilities to which they may become subject in connection with the performance of their duties to the Funds. Additionally, in the normal course of business, the Funds enter into contracts that contain a variety of representations and warranties and which may require the Funds to indemnify the other parties to the contracts in the event of
81
Hussman Investment Trust
Notes to Financial Statements (continued) |
|
certain losses. The Funds’ maximum exposure under these arrangements is unknown, as this would involve potential claims for indemnification for losses that may or may not be incurred in the future. However, based on experience, the Trust believes the risk of loss to be remote.
9. LEGAL PROCEEDINGS
Several lawsuits have been filed relating to Hussman Strategic Growth Fund’s investment in Tribune Company common stock in connection with Tribune Company’s Chapter 11 bankruptcy. The lawsuits stem from a leveraged buyout by which Tribune Company converted to a privately-held company in 2007. The Trust, Hussman Strategic Growth Fund, and the Adviser were named as defendants and putative members of the proposed defendant class of shareholders in an adversary proceeding brought by The Official Committee of Unsecured Creditors of Tribune Company in the U.S. Bankruptcy Court for the District of Delaware in 2010. That action was subsequently transferred to the U.S. District Court for the Southern District of New York by order of the Judicial Panel on Multidistrict Litigation, and Marc S. Kirschner, the Litigation Trustee for the Tribune Litigation Trust, became successor plaintiff to the Creditors Committee on December 31, 2012, the effective date of Tribune Company’s plan of reorganization. The Trust and Hussman Strategic Growth Fund were also named as defendants in a lawsuit filed by the indenture trustees of certain noteholders of Tribune Company in the U.S. District Court for the Southern District of Ohio in 2011. Hussman Strategic Growth Fund and the Adviser were named as defendants in a similar action in the U.S. District Court for the District of Maryland in 2011. Both of those actions have been transferred to the U.S. District Court for the Southern District of New York for coordinated proceedings with many other similar lawsuits brought by individual creditors against former Tribune Company shareholders and the action currently prosecuted by the Tribune Litigation Trustee. The Trust, Hussman Strategic Growth Fund, and the Adviser may also be putative defendant class members in some of these actions. The plaintiffs in all these lawsuits seek to recover amounts paid to shareholders of Tribune Company in connection with the leveraged buyout, plus interest and attorneys’ fees and expenses.
An omnibus motion to dismiss the actions filed by the individual creditors (but not the action prosecuted by the Litigation Trustee for the Tribune Litigation Trust) was filed in November 2012. On September 23, 2013, the U.S. District Court Judge issued a decision and order dismissing those actions in full. The plaintiffs in those actions appealed that decision to the U.S. Court of Appeals for the Second Circuit and certain shareholder defendants, including the Hussman entities, cross-appealed. The Second Circuit heard oral argument on November 5, 2014 and unanimously affirmed the lower court on March 29, 2016. The individual creditors filed a petition for rehearing or rehearing en
82
Hussman Investment Trust
Notes to Financial Statements (continued) |
|
banc in the Second Circuit on April 12, 2016, and the Second Circuit denied that petition on July 22, 2016. The individual creditors filed a petition for a writ of certiorari in the United States Supreme Court on September 9, 2016. That petition remains pending.
On August 2, 2013, with the District Court’s permission, the Litigation Trustee filed an amended complaint that named Hussman Strategic Growth Fund as one of the class representatives for the putative class of shareholder defendants. The Court issued a protocol regarding a global motion to dismiss on behalf of all shareholder defendants on April 24, 2014. Briefing on the global motion to dismiss was completed on July 2, 2014, and the District Court issued an opinion and order granting the shareholder defendants’ motion to dismiss on January 6, 2017. The Litigation Trustee sought leave to appeal the District Court’s decision, and the District Court has indicated that it will certify an interlocutory appeal after it resolves all other pending motions to dismiss.
On July 18, 2017, the Litigation Trustee requested a pre-motion conference in the District Court on a proposed motion to amend his complaint to conditionally add a new claim against the shareholder defendants, pending the Supreme Court’s decision in Merit Management Group, LP v. FTI Consulting, Inc., No. 16-784 (U.S.) (“Merit Management”). The shareholder defendants have opposed the Litigation Trustee’s request. The request remains pending.
The lawsuits allege no misconduct by the Trust, Hussman Strategic Growth Fund, or the Adviser, and all the Hussman entities intend to defend themselves vigorously in the lawsuits. If the lawsuits were to be decided or settled in a manner adverse to Hussman Strategic Growth Fund, the payment of such judgments or settlements could adversely affect the Fund’s net asset value per share. The adverse impact to Hussman Strategic Growth Fund is not expected to exceed materially the value of the proceeds received by the Fund in connection with the leveraged buyout, which was $29,432,814 (which constitutes, as of June 30, 2017, approximately 7.8% of the Fund’s net assets), plus interest.
10. SUBSEQUENT EVENTS
The Funds are required to recognize in their financial statements the effects of all subsequent events that provide additional evidence about conditions that existed as of the date of the Statements of Assets and Liabilities. For non-recognized subsequent events that must be disclosed to keep the financial statements from being misleading, the Funds are required to disclose the nature of the event as well as an estimate of its financial effect, or a statement that such an estimate cannot be made. Management has evaluated subsequent events through the date of issuance of these financial statements and has noted no such events.
83
Hussman Investment Trust |
Report of Independent Registered
Public Accounting Firm |
To the Shareholders and Board of Trustees of
Hussman Investment Trust
We have audited the accompanying statements of assets and liabilities of Hussman Investment Trust (comprising, respectively, Hussman Strategic Growth Fund, Hussman Strategic Total Return Fund, Hussman Strategic International Fund and Hussman Strategic Value Fund) (collectively the “Funds”) including the schedule of investments and the schedule of open written option contracts for Hussman Strategic Growth Fund, the schedule of investments for Hussman Strategic Total Return Fund, the schedule of investments and the schedule of futures contracts sold short for Hussman Strategic International Fund, and the schedule of investments and the schedule of open written option contracts for Hussman Strategic Value Fund, as of June 30, 2017, and the related statements of operations for the year then ended, the statements of changes in net assets for each of the two years in the period then ended and the financial highlights for each of the five years in the period then ended. These financial statements and financial highlights are the responsibility of the Funds’ management. Our responsibility is to express an opinion on these financial statements and financial highlights based on our audits.
We conducted our audits in accordance with the standards of the Public Company Accounting Oversight Board (United States). Those standards require that we plan and perform the audit to obtain reasonable assurance about whether the financial statements and financial highlights are free of material misstatement. We were not engaged to perform an audit of the Funds’ internal control over financial reporting. Our audits included consideration of internal control over financial reporting as a basis for designing audit procedures that are appropriate in the circumstances, but not for the purpose of expressing an opinion on the effectiveness of the Funds’ internal control over financial reporting. Accordingly, we express no such opinion. An audit also includes examining, on a test basis, evidence supporting the amounts and disclosures in the financial statements and financial highlights, assessing the accounting principles used and significant estimates made by management, and evaluating the overall financial statement presentation. Our procedures included confirmation of securities owned as of June 30, 2017, by correspondence with the custodians and brokers and appropriate auditing procedures where replies from custodians and brokers were not received. We believe that our audits provide a reasonable basis for our opinion.
In our opinion, the financial statements and financial highlights referred to above present fairly, in all material respects, the financial position of each of the respective Funds constituting Hussman Investment Trust as of June 30, 2017, the results of their operations for the year then ended, the changes in their net assets for each of the two years in the period then ended and the financial highlights for each of the five years in the period then ended in conformity with U.S. generally accepted accounting principles.
Cincinnati, Ohio
August 25, 2017
84
Hussman Investment Trust
About Your Funds’ Expenses (Unaudited) |
|
We believe it is important for you to understand the impact of costs on your investment. As a shareholder of the Funds, you incur two types of costs: (1) transaction costs, which may include redemption fees; and (2) ongoing costs, including management fees and other Fund expenses. The following examples are intended to help you understand your ongoing costs (in dollars) of investing in the Funds and to compare these costs with the ongoing costs of investing in other mutual funds. A mutual fund’s ongoing costs are expressed as a percentage of its average net assets. This figure is known as the expense ratio.
The examples below are based on an investment of $1,000 made at the beginning of the period shown and held for the entire period (January 1, 2017 – June 30, 2017).
The table on the following page illustrates each Fund’s ongoing costs in two ways:
Actual fund return – This section helps you to estimate the actual expenses that you paid over the period. The “Ending Account Value” shown is derived from each Fund’s actual return, and the fourth column shows the dollar amount of operating expenses that would have been paid by an investor who started the period with $1,000 invested in that Fund. You may use that information, together with the amount of your investment, to estimate the expenses that you paid over the period.
To do so, simply divide your account value by $1,000 (for example, an $8,600 account value divided by $1,000 = 8.6), and then multiply the result by the number given for the applicable Fund under the heading “Expenses Paid During Period.”
Hypothetical 5% return – This section is intended to help you compare each Fund’s ongoing costs with those of other mutual funds. It assumes that each Fund had an annual return of 5% before expenses during the period shown. In this case, because the return used is not each Fund’s actual return, the results do not illustrate the actual expenses associated with your investment. However, the example is useful in making comparisons because the SEC requires all mutual funds to provide an example of fund expenses based on a 5% annual return. You can assess each Fund’s ongoing costs by comparing this hypothetical example with the hypothetical examples that appear in shareholder reports of other mutual funds.
Note that expenses shown in the table are meant to highlight and help you compare ongoing costs only. The expense ratios used in computing annual expenses in the tables are the expense ratios of the Funds during the six-month period ended June 30, 2017, annualized, after fee reductions. Actual expenses of the Funds in
85
Hussman Investment Trust
About Your Funds’ Expenses (Unaudited) (continued) |
|
future periods may differ. The calculations assume no shares were bought or sold during the period. Your actual costs may have been higher or lower, depending on the amount of your investment and the timing of any purchases or redemptions.
More information about each Fund’s expenses, including annual expense ratios, can be found elsewhere in this report. For additional information on operating expenses and other shareholder costs, please refer to each Fund’s prospectus.
| | Beginning
Account Value
January 1, 2017 | Ending
Account Value
June 30, 2017 | Net
Expense
Ratio(a) | Expenses
Paid During
Period(b) |
| Hussman Strategic Growth Fund |
| Based on Actual Fund Return | $ 1,000.00 | $ 925.20 | 1.13% | $ 5.39 |
| Based on Hypothetical 5% Return (before expenses) | $ 1,000.00 | $ 1,019.19 | 1.13% | $ 5.66 |
| Hussman Strategic Total Return Fund |
| Based on Actual Fund Return | $ 1,000.00 | $ 1,005.00 | 0.73% | $ 3.63 |
| Based on Hypothetical 5% Return (before expenses) | $ 1,000.00 | $ 1,021.17 | 0.73% | $ 3.66 |
| Hussman Strategic International Fund |
| Based on Actual Fund Return | $ 1,000.00 | $ 996.60 | 2.00% | $ 9.90 |
| Based on Hypothetical 5% Return (before expenses) | $ 1,000.00 | $ 1,014.88 | 2.00% | $ 9.99 |
| Hussman Strategic Value Fund |
| Based on Actual Fund Return | $ 1,000.00 | $ 966.70 | 1.25% | $ 6.10 |
| Based on Hypothetical 5% Return (before expenses) | $ 1,000.00 | $ 1,018.60 | 1.25% | $ 6.26 |
(a) | Annualized, based on the Fund’s most recent one-half year expenses. |
(b) | Expenses are equal to each Fund’s annualized net expense ratio multiplied by the average account value over the period, multiplied by 181/365 (to reflect the one-half year period). |
86
Hussman Investment Trust
Board of Trustees and Officers (Unaudited) |
|
Overall responsibility for supervision of management of the Funds rests with the Board of Trustees. The Trustees serve during the lifetime of the Trust and until its termination, or until death, resignation, retirement or removal. The Trustees, in turn, elect the officers of the Trust to supervise the day-to-day operations of the Funds. The officers are elected for annual terms. The following are the Trustees and executive officers of the Trust:
| Trustee | Address | Age | Position Held with the Trust | Length of Time Served |
| *John P. Hussman, Ph. D. | 6021 University Boulevard, Suite 490
Ellicott City, MD 21043 | 54 | President and Trustee | Since
June 2000 |
| David C. Anderson | 225 Pictoria Drive
Cincinnati, OH 45246 | 66 | Trustee | Since
June 2000 |
| Jody T. Foster | 225 Pictoria Drive
Cincinnati, OH 45246 | 48 | Trustee | Since
June 2016 |
| William H. Vanover | 225 Pictoria Drive
Cincinnati, OH 45246 | 70 | Trustee | Since
June 2000 |
| Robert G. Dorsey | 225 Pictoria Drive
Cincinnati, OH 45246 | 60 | Vice President | Since
June 2000 |
| Mark J. Seger | 225 Pictoria Drive
Cincinnati, OH 45246 | 55 | Treasurer | Since
June 2000 |
| John F. Splain | 225 Pictoria Drive
Cincinnati, OH 45246 | 60 | Secretary and Chief Compliance Officer | Since
June 2000 |
| * | Dr. Hussman, as an affiliated person of the Adviser, is an “interested person” of the Trust within the meaning of Section 2(a)(19) of the Investment Company Act of 1940. |
Each Trustee oversees four portfolios of the Trust. The principal occupations during the past five years of the Trustees and executive officers of the Trust and public directorships (if any) currently held by the Trustees are set forth below:
John P. Hussman, Ph.D. is Chairman, President and Treasurer of the Adviser.
David C. Anderson is Network Administrator for Hephzibah Children’s Association (a child welfare organization).
Jody T. Foster is President of Symphony Consulting LLC (a provider of compliance, finance, marketing, operations and human resources services to public and private fund advisers).
87
Hussman Investment Trust
Board of Trustees and Officers (Unaudited) (continued) |
|
William H. Vanover is an investment counselor with Planning Alternatives, Ltd. (a registered investment adviser).
Robert G. Dorsey is Chief Executive Officer - Managing Director of Ultimus Fund Solutions, LLC (the Trust’s administrator and transfer agent) and Ultimus Fund Distributors, LLC (the Trust’s principal underwriter).
Mark J. Seger is President, Chief Financial Officer, Treasurer and Secretary - Managing Director of Ultimus Fund Solutions, LLC and Ultimus Fund Distributors, LLC.
John F. Splain is an Executive Vice President of Ultimus Fund Solutions, LLC.
Additional information about members of the Board of Trustees and executive officers is available in the Statement of Additional Information (“SAI”) of each Fund. To obtain a free copy of the SAI, please call 1-800-487-7626.
Federal Tax Information (Unaudited) |
|
In accordance with federal tax requirements, the following provides shareholders with information concerning distributions from ordinary income made by the Funds during the fiscal year ended June 30, 2017. Certain dividends paid by the Funds may be subject to a maximum tax rate of 23.8%. Hussman Strategic Growth Fund, Hussman Strategic Total Return Fund and Hussman Strategic Value Fund intend to designate up to a maximum amount of $1,248,630, $821,242 and $74,064, respectively, as taxed at a maximum rate of 23.8%. For the fiscal year ended June 30, 2017, 100%, 23% and 100%, respectively, of the dividends paid from ordinary income by Hussman Strategic Growth Fund, Hussman Strategic Total Return Fund and Hussman Strategic Value Fund qualified for the dividends received deduction for corporations.
As required by federal regulations, complete information regarding dividends and other distributions will be computed and reported in conjunction with your 2017 Form 1099-DIV.
88
Hussman Investment Trust
Other Information (Unaudited) |
|
A description of the policies and procedures the Funds use to determine how to vote proxies relating to portfolio securities is available without charge upon request by calling toll-free 1-800-HUSSMAN (1-800-487-7626), or on the SEC’s website at http://www.sec.gov. Information regarding how the Funds voted proxies relating to portfolio securities during the most recent 12-month period ended June 30 is also available without charge upon request by calling toll-free 1-800-HUSSMAN, or on the SEC’s website at http://www.sec.gov.
The Trust files a complete listing of portfolio holdings for each Fund with the SEC as of the end of the first and third quarters of each fiscal year on Form N-Q. The filings are available upon request, by calling 1-800-HUSSMAN (1-800-487-7626). You may also obtain copies of these filings on the SEC’s website at http://www.sec.gov. The Trust’s Forms N-Q may also be reviewed and copied at the SEC’s Public Reference Room in Washington, DC, and information on the operation of the Public Reference Room may be obtained by calling 1-800-SEC-0330.
89
Hussman Investment Trust
Approval of Investment Advisory Agreements |
|
At a meeting held in person on June 1, 2017, the Board of Trustees of Hussman Investment Trust, including the Trustees who are not “interested persons,” as defined by the Investment Company Act of 1940, of the Trust (the “Independent Trustees”) voting separately, reviewed and unanimously approved the continuance of each Fund’s Advisory Agreement with the Adviser for an additional annual period.
In determining whether to approve continuances of the Advisory Agreements, the Independent Trustees requested and received from the Adviser such information as the Independent Trustees deemed reasonably necessary to evaluate the terms of the Advisory Agreements and to assess whether the Advisory Agreements continue to be in the best interests of the Funds and their shareholders. In addition to reviewing and considering this information, the Independent Trustees considered information relating to the Funds and the Adviser that was provided to them in connection with meetings of the Board held throughout the year. They reviewed and considered, among other things: (i) the nature, extent and quality of the services provided by the Adviser to each of the Funds; (ii) the investment performance of each of the Funds; (iii) the Adviser’s costs of providing services to the Funds and the profits realized by the Adviser from its relationship with the Funds; (iv) the extent to which economies of scale in the Adviser’s costs of providing services have been realized from growth of the Funds’ assets; and (v) whether the fees payable by each Fund reflect an appropriate sharing of any such economies with such Fund for the benefit of the Fund and its shareholders. The Independent Trustees also reviewed the background, qualifications, education and experience of the Adviser’s investment professionals and support personnel, and discussed and considered: (i) the quality of shareholder communications, administrative functions and other services provided by the Adviser to the Trust and each of the Funds; (ii) the quality of the Adviser’s compliance program; (iii) the Adviser’s role in coordinating and supervising services provided to the Trust; and (iv) indirect benefits that the Adviser may derive from its relationship with the Funds. The Independent Trustees were advised and supported in this process by independent legal counsel and, prior to voting, met with and asked questions of representatives of the Adviser, including Dr. John Hussman, and met separately with their counsel.
The Adviser provided the Independent Trustees with extensive information to assist them in analyzing both the absolute and risk-adjusted returns of the Funds over various periods. The returns of each Fund were compared to the returns of relevant indices and to the average returns of one or more selected peer groups of other mutual funds. These analyses and comparisons showed that, since its inception on July 24, 2000 through April 30, 2017, Hussman Strategic Growth Fund generated an average annual total return of 0.96%, compared with an average annual total return of 4.98% for the S&P 500 Index. These analyses also showed that, since
90
Hussman Investment Trust
Approval of Investment Advisory Agreements |
|
inception, Hussman Strategic Growth Fund’s hedging strategies have been successful in reducing the volatility of an investment in the Fund as compared to the volatility of relevant securities indices. Information provided to the Board indicated that the Adviser’s stock selection record for Hussman Strategic Growth Fund has over the long term been acceptable, and that the underperformance by the Fund in recent years is largely attributable to the Fund’s use of hedging techniques and the nature of the Fund’s alternative investment approach, which is not intended to track general market movements. In evaluating the Fund’s investment performance, the Independent Trustees recognized that the use of hedging is an integral part of the Fund’s investment program and that, although this has caused significant underperformance, the Adviser has consistently managed the investment portfolio of Hussman Strategic Growth Fund in a manner consistent with the Fund’s investment objective and policies, as described in the Fund’s prospectus. The Independent Trustees also recognized that the Adviser has adapted and refined the models and analytics it uses in managing the Fund in seeking to address the Fund’s underperformance and noted that several years ago the Adviser implemented additional restrictions in its hedging approach with the goals of improving the selectivity of its use of hedging and reducing the cost of hedging in generally unfavorable, but still-advancing, market conditions. The Independent Trustees observed that, although the Fund has underperformed the S&P 500 Index from 2009 to date, this period represents only half of a full market cycle and that the Fund’s outperformance of the Index prior to 2009 was substantial.
In reviewing the performance of Hussman Strategic Total Return Fund, the Independent Trustees took note of the fact that the Fund underperformed the Barclays U.S. Aggregate Bond Index during the one year period ended April 30, 2017, returning –1.47% versus a return of 0.83% for the Index. They also considered that the Fund’s average annual total return of 4.74% since its inception on September 12, 2002 through April 30, 2017 compares favorably to the 4.29% average annual total return of the Barclays U.S. Aggregate Bond Index during the same period. The Independent Trustees noted that the primary driver of Hussman Strategic Total Return Fund’s underperformance during certain recent periods (1 year and 5 years) was its exposure to gold stocks which, while generally modest, caused a significant drag on the Fund’s investment performance due to a severe drop in the price of gold and the prices of gold stocks.
With respect to Hussman Strategic International Fund, the Independent Trustees took note of the fact that the Fund underperformed the MSCI Europe, Australasia, Far East (“EAFE”) Index during the one year period ended April 30, 2017, returning –2.77% versus a return of 11.29% for the Index. They also considered the fact that the Fund’s average annual total return of –1.09% since its inception on December 31, 2009
91
Hussman Investment Trust
Approval of Investment Advisory Agreements |
|
through April 30, 2017 lagged the 4.98% average annual total return of the MSCI EAFE Index during the same period. In their evaluation of the investment performance of Hussman Strategic International Fund, the Independent Trustees observed that, since its inception, the Fund has maintained a defensive investment position in which it has been substantially fully hedged against the impact of general market fluctuations. They also observed, however, that the Fund has experienced less downside risk since its inception than would have resulted from use of a passive investment approach and noted that the Fund has not been in existence for a full market cycle, making it difficult to evaluate the Fund’s long-term investment performance relative to its investment objective.
With respect to Hussman Strategic Value Fund, the Independent Trustees took note of the fact that the Fund underperformed the S&P 500 Index during the one year period ended April 30, 2017, returning –3.31% versus a return of 17.92% for the Index. They also noted that the Fund’s average annual total return of –0.22% since its inception on February 6, 2012 through April 30, 2017 significantly lagged the 13.98% average annual total return of the S&P 500 Index during the same period. In their evaluation of the investment performance of Hussman Strategic Value Fund, the Independent Trustees observed that the Fund has maintained a defensive stance since its inception (with between 50% and 100% of the Fund’s stock portfolio hedged against general market fluctuations). They also observed, however, that the Fund has experienced less downside risk than would have resulted from use of a passive investment approach and noted that (similar to Hussman Strategic International Fund) the Fund has not been in existence for a full market cycle, making it difficult to evaluate the Fund’s long-term investment performance relative to its investment objective.
In evaluating the advisory fees payable by the Funds and the Funds’ expense ratios, the Independent Trustees reviewed comparative expense and advisory fee information for peer groups of mutual funds based on investment style.
With respect to advisory fee rates, the Independent Trustees concluded that the advisory fee rate of 0.90% for Hussman Strategic Growth Fund, based on the Fund’s current asset level, compares favorably to the average advisory fees payable by other “long-short” or “market neutral” mutual funds, as categorized by Morningstar and that, when compared to the advisory compensation payable by hedge funds offering similar investment programs, Hussman Strategic Growth Fund is much less expensive. The Independent Trustees also concluded that the advisory fee rates of 0.50% for Hussman Strategic Total Return Fund and 0.95% for Hussman Strategic International Fund, based upon current asset levels of those Funds, compare favorably to the average advisory fees of other funds of similar size investing in similar securities and
92
Hussman Investment Trust
Approval of Investment Advisory Agreements |
|
that the advisory fee rate for Hussman Strategic International Fund is less than the average advisory fee rate for peer group funds. Although the advisory fee rate for Hussman Strategic Value Fund currently is higher than the advisory fee rates of many other mutual funds within the Fund’s peer group, such fee is within the range of the advisory fees of peer group funds. Under these circumstances and in light of the investment strategy of Hussman Strategic Value Fund, which incorporates risk management and hedging techniques that are not typically employed by the peer group funds, the Independent Trustees concluded that the advisory fee payable by the Fund is appropriate. They also concluded that breakpoints in the advisory fee schedule of Hussman Strategic Value Fund will allow shareholders to benefit from a lower advisory fee rate to the extent the Fund experiences future asset growth. The Independent Trustees determined with respect to each of the Funds that the fees payable to the Adviser appropriately reflect the nature and scope of services provided by the Adviser (which are broader than the norm) and the value to the Funds of the Adviser’s experience, expertise and analytic capabilities. They also determined that the advisory fee schedules of each of the Funds, which include advisory fee breakpoints, allow the Funds and their shareholders to participate in economies of scale in the Adviser’s costs of providing services that may be associated with potential future growth of the Funds’ assets.
With respect to the total expenses of the Funds, the Independent Trustees considered the fact that the expense ratios of Hussman Strategic Growth Fund and Hussman Strategic Total Return Fund, both before and after advisory fee reductions, are considerably less than the averages for their respective peer group funds. They noted in this regard that Hussman Strategic Growth Fund has one of the lowest expense ratios among mutual funds classified by Morningstar as “long-short” or “market neutral” funds, and that the expense ratio of Hussman Strategic Total Return Fund is considerably less than the average expense ratio of “tactical allocation” or “multi-sector bond” mutual funds tracked by Morningstar. The Independent Trustees also noted that, from time to time since each such Fund’s inception, its expense ratio was reduced through the introduction of advisory fee breakpoints. In addition, the Independent Trustees considered the fact that, since March 2013, the Adviser has contractually been reducing its fees to reduce the total ordinary operating expenses of these Funds and has agreed, until at least November 1, 2017, to reduce its advisory fees or to absorb operating expenses of these Funds to the extent necessary to limit the total annual ordinary operating expenses of Hussman Strategic Growth Fund and Hussman Strategic Total Return Fund to 1.13% and 0.73%, respectively, of average daily net assets.
93
Hussman Investment Trust
Approval of Investment Advisory Agreements |
|
The Independent Trustees also reviewed comparative information relating to the total expenses of Hussman Strategic International Fund and Hussman Strategic Value Fund. They noted that the expense ratios of those Funds are higher than many other mutual funds that have similar investment strategies. However, the Independent Trustees considered the fact that these higher expense ratios are attributable, in part, to the small size of these Funds and took into consideration expense limitation arrangements under which the Adviser agreed, until at least November 1, 2017, to reduce its advisory fees or to absorb operating expenses of these Funds to the extent necessary to limit total annual ordinary operating expenses of Hussman Strategic International Fund and Hussman Strategic Value Fund to 2.00% and 1.25%, respectively, of average daily net assets. The Independent Trustees also considered the fact that the Adviser agreed several years ago to new advisory fee schedules which resulted in an immediate reduction in the effective advisory fee rates for Hussman Strategic International Fund and Hussman Strategic Value Fund of 0.05% and 0.10%, respectively, of average daily net assets based on then current asset levels. They concluded that these Funds have benefited and continue to benefit from reductions in advisory fee rates and expense limitation arrangements that have enabled them to maintain expense ratios within the range of expense ratios of their respective peer group funds.
The Independent Trustees also reviewed recent financial statements of the Adviser, and schedules showing the Adviser’s estimated revenues, expenses and profitability with respect to each of the Funds for calendar years 2014, 2015 and 2016. They noted that the Adviser has reduced its fees, thereby reducing its profitability, pursuant to expense limitation agreements. They recognized that the Adviser has realized significant profits from its advisory relationships with Hussman Strategic Growth Fund, Hussman Strategic Total Return Fund and Hussman Strategic International Fund, and that the Adviser’s profit margins associated with providing services to these Funds have been significant over the years, but concluded that the Adviser’s profitability with respect to each of these Funds was not excessive when viewed in light of the quality and scope of services provided by the Adviser over the long term and the Adviser’s adherence to its stated investment philosophy and the investment programs of the Funds. The Independent Trustees also recognized that the Adviser’s profitability with respect to these Funds has declined in recent years as a consequence of declines in the total net assets of these Funds. In evaluating the Adviser’s profitability, the Independent Trustees considered the broad and unique skill set and talent of the Adviser that is of value to the Funds and has enabled the Adviser to pursue and to adhere to the Funds’ well-defined and disciplined investment programs, which has been a primary attraction of the Funds to investors. They also considered whether
94
Hussman Investment Trust
Approval of Investment Advisory Agreements |
|
declines in profitability might adversely affect services provided to the Funds and determined, based on the financial information provided to them and representations of the Adviser, that the Adviser has the financial resources needed to continue to provide all required services to the Funds, without diminution of service quality.
Based on a careful review of the investment performance and risk characteristics of the Funds and consideration of the factors and information discussed above, the Independent Trustees concluded that the Adviser has provided all required services to the Funds and has provided services of appropriate quality. They determined that this conclusion is supported by the nature and scope of advisory services required by the Funds, which are broader and more sophisticated than those required by many other mutual funds due to the nature of the Funds’ investment programs and which involve extensive use of risk-management techniques. The Independent Trustees also considered the fact that the Adviser has generally achieved lower volatility of investment returns for the Funds than would have resulted from use of a passive investment approach. They recognized that challenges associated with the Adviser’s hedging approach have reduced returns in the period since 2009, but noted that the Adviser has implemented meaningful changes in its methodologies since 2009 that may operate to reduce the frequency of similar challenges in future market cycles while maintaining the favorable attributes that the Adviser’s hedging strategies exhibited in the years prior to 2009. In this regard, the Independent Trustees specifically considered the fact that the investment performance of each of the Funds in recent years generally has been disappointing and considered whether, under such circumstances, it would be appropriate and consistent with their duties and the interests of the Funds to approve the continuance of each of the Advisory Agreements, as proposed.
The Independent Trustees concluded that the Adviser has consistently taken a proactive stance with regard to shareholder protections, service quality and ethical standards. Among other things, they noted that the Adviser: (i) does not derive any material indirect benefits from its relationship with the Funds; (ii) does not derive any economic benefit in connection with transactions in shares of the Funds; and (iii) adheres to a brokerage placement policy which seeks to obtain best execution and low commissions on all of the Funds’ brokerage transactions and does not direct transactions to obtain “soft dollar” services, which has resulted in significant savings to the Funds and their shareholders by reducing transaction costs (which are not reflected in the expense ratios of the Funds) and has operated to increase the Funds’ investment performance after expenses. The Independent Trustees thought it was significant that Dr. John Hussman maintains a substantial personal investment in each of the Funds, which helps to align the interests of the portfolio manager with the interests of shareholders.
95
Hussman Investment Trust
Approval of Investment Advisory Agreements |
|
After evaluating all pertinent factors and information (including but not limited to the factors and information discussed above), the Board determined that the fees payable by each Fund pursuant to the Advisory Agreements were appropriate in view of the nature, scope and quality of services provided by the Adviser and determined that continuances of the Advisory Agreements would be in the best interests of the Funds and their shareholders. Accordingly, the Board voted unanimously to approve the continuance of each of the Advisory Agreements for an additional annual period. No single factor was considered in isolation or to be determinative to this decision.
96
THIS PAGE INTENTIONALLY LEFT BLANK.
INVESTMENT ADVISER
Hussman Strategic Advisors, Inc.
6021 University Boulevard, Suite 490
Ellicott City, Maryland 21043
www.hussmanfunds.com
1-800-HUSSMAN (1-800-487-7626)
ADMINISTRATOR/TRANSFER AGENT
Ultimus Fund Solutions, LLC
225 Pictoria Drive, Suite 450
Cincinnati, Ohio 45246
CUSTODIANS
U.S. Bank, N.A.
425 Walnut Street
Cincinnati, Ohio 45202
The Northern Trust Company
50 South LaSalle Street
Chicago, Illinois 60675
INDEPENDENT REGISTERED
PUBLIC ACCOUNTING FIRM
Ernst & Young LLP
1900 Scripps Center
312 Walnut Street
Cincinnati, Ohio 45202
LEGAL COUNSEL
Schulte Roth & Zabel LLP
919 Third Avenue
New York, New York 10022
This Report is authorized for
distribution only if accompanied or preceded
by a current Prospectus of the Funds.
Item 2. Code of Ethics.
As of the end of the period covered by this report, the registrant has adopted a code of ethics that applies to the registrant’s principal executive officer, principal financial officer, principal accounting officer or controller, or persons performing similar functions, regardless of whether these individuals are employed by the registrant or a third party. Pursuant to Item 12(a)(1), a copy of registrant’s code of ethics is filed as an exhibit to this Form N-CSR. During the period covered by this report, the code of ethics has not been amended, and the registrant has not granted any waivers, including implicit waivers, from the provisions of the code of ethics.
Item 3. Audit Committee Financial Expert.
The registrant’s board of trustees has determined that the registrant does not have an audit committee financial expert serving on its audit committee. The audit committee determined that, although none of its members meet the technical definition of an audit committee financial expert, the members have sufficient financial expertise to address any issues that are likely to come before the committee. After evaluation of the accounting environment within which the registrant operates, it was the consensus of the audit committee members that it is not necessary at the present time for the committee to seek to recruit an additional trustee who would qualify as an audit committee financial expert. It was the view of the committee that, if novel issues ever arise, it will hire an expert to assist it as needed.
Item 4. Principal Accountant Fees and Services.
| (a) | Audit Fees. The aggregate fees billed for professional services rendered by the principal accountant for the audit of the registrant’s annual financial statements or for services that are normally provided by the accountant in connection with statutory and regulatory filings or engagements were $141,300 and $138,200 with respect to the registrant’s fiscal years ended June 30, 2017 and 2016, respectively. |
| (b) | Audit-Related Fees. No fees were billed during the fiscal years ended June 30, 2017 and 2016 for assurance and related services by the principal accountant that are reasonably related to the performance of the audit of the registrant’s financial statements and are not reported under paragraph (a) of this Item. |
| (c) | Tax Fees. The aggregate fees billed for professional services rendered by the principal accountant for tax compliance, tax advice, and tax planning were $34,600 and $33,600 with respect to the registrant’s fiscal years ended June 30, 2017 and 2016, respectively. The services comprising these fees are the computation of required distributions and the preparation of the registrant’s federal income and excise tax returns. |
| (d) | All Other Fees. No fees were billed in either of the last two fiscal years for products and services provided by the principal accountant, other than the services reported in paragraphs (a) through (c) of this Item. |
| | (e)(1) | The audit committee has adopted pre-approval policies and procedures described in paragraph (c)(7) of Rule 2-01 of Regulation S-X. Pursuant to the pre-approval policies and procedures, the audit committee has pre-approved certain audit, audit-related and tax services and has established, with respect to each fiscal year of the registrant, the following maximum fee levels for services covered under the pre-approval policies and procedures: |
| · | Services associated with SEC registration statements filed by the registrant with the SEC or other documents issued by the registrant in connection with securities offerings and assistance in responding to SEC comment letters – $6,000 |
| · | Consultations with management of the registrant as to the accounting or disclosure treatment of transactions or events and/or the actual or potential impact of final or proposed rules, standards or interpretations by the SEC, FASB or other regulatory or standard setting bodies – $6,000 |
| · | All additional tax services provided to the registrant in the aggregate – $6,000 |
| | (e)(2) | None of the services described in paragraph (b) through (d) of this Item were approved by the audit committee pursuant to paragraph (c)(7)(i)(C) of Rule 2-01 of Regulation S-X. |
| (f) | Less than 50% of hours expended on the principal accountant’s engagement to audit the registrant’s financial statements for the most recent fiscal year were attributed to work performed by persons other than the principal accountant’s full-time, permanent employees. |
| | (g) | During the fiscal years ended June 30, 2017 and 2016, aggregate non-audit fees of $34,600 and $33,600, respectively, were billed by the registrant’s principal accountant for services rendered to the registrant. No non-audit fees were billed in either of the last two fiscal years by the registrant’s principal accountant for services rendered to the registrant’s investment adviser (not including any sub-adviser whose role is primarily portfolio management and is subcontracted with or overseen by another investment adviser), and any entity controlling, controlled by, or under common control with the adviser that provides ongoing services to the registrant. |
| (h) | The principal accountant has not provided any non-audit services to the registrant’s investment adviser (not including any sub-adviser whose role is primarily portfolio management and is subcontracted with or overseen by another investment adviser), and any entity controlling, controlled by, or under common control with the investment adviser that provides ongoing services to the registrant. |
Item 5. Audit Committee of Listed Registrants.
Not applicable
Item 6. Investments.
| (a) | Not applicable [schedule filed with Item 1] |
Item 7. Disclosure of Proxy Voting Policies and Procedures for Closed-End Management Investment Companies.
Not applicable
Item 8. Portfolio Managers of Closed-End Management Investment Companies
Not applicable
Item 9. Purchases of Equity Securities by Closed-End Management Investment Company and Affiliated Purchasers.
Not applicable
Item 10. Submission of Matters to a Vote of Security Holders.
The registrant has not adopted procedures by which shareholders may recommend nominees to the registrant’s board of trustees.
Item 11. Controls and Procedures.
(a) Based on their evaluation of the registrant’s disclosure controls and procedures (as defined in Rule 30a-3(c) under the Investment Company Act of 1940) as of a date within 90 days of the filing date of this report, the registrant’s principal executive officer and principal financial officer have concluded that such disclosure controls and procedures are reasonably designed and are operating effectively to ensure that material information relating to the registrant, including its consolidated subsidiaries, is made known to them by others within those entities, particularly during the period in which this report is being prepared, and that the information required in filings on Form N-CSR is recorded, processed, summarized, and reported on a timely basis.
(b) There were no changes in the registrant’s internal control over financial reporting (as defined in Rule 30a-3(d) under the Investment Company Act of 1940) that occurred during the second fiscal quarter of the period covered by this report that have materially affected, or are reasonably likely to materially affect, the registrant’s internal control over financial reporting.
Item 12. Exhibits.
File the exhibits listed below as part of this Form. Letter or number the exhibits in the sequence indicated.
(a)(1) Any code of ethics, or amendment thereto, that is the subject of the disclosure required by Item 2, to the extent that the registrant intends to satisfy the Item 2 requirements through filing of an exhibit: Attached hereto
(a)(2) A separate certification for each principal executive officer and principal financial officer of the registrant as required by Rule 30a-2(a) under the Act (17 CFR 270.30a-2(a)): Attached hereto
(a)(3) Any written solicitation to purchase securities under Rule 23c-1 under the Act (17 CFR 270.23c-1) sent or given during the period covered by the report by or on behalf of the registrant to 10 or more persons: Not applicable
(b) Certifications required by Rule 30a-2(b) under the Act (17 CFR 270.30a-2(b)): Attached hereto
| Exhibit 99.CODE ETH | Code of Ethics |
| Exhibit 99.CERT | Certifications required by Rule 30a-2(a) under the Act |
| Exhibit 99.906CERT | Certifications required by Rule 30a-2(b) under the Act |
SIGNATURES
Pursuant to the requirements of the Securities Exchange Act of 1934 and the Investment Company Act of 1940, the registrant has duly caused this report to be signed on its behalf by the undersigned, thereunto duly authorized.
| (Registrant) | Hussman Investment Trust | |
| | | |
| By (Signature and Title)* | /s/ John P. Hussman | |
| | John P. Hussman, President | |
| | | |
| Date | August 29, 2017 | |
Pursuant to the requirements of the Securities Exchange Act of 1934 and the Investment Company Act of 1940, this report has been signed below by the following persons on behalf of the registrant and in the capacities and on the dates indicated.
| By (Signature and Title)* | /s/ John P. Hussman | |
| | John P. Hussman, President | |
| | | |
| Date | August 29, 2017 | |
| By (Signature and Title)* | /s/ Mark J. Seger | |
| | Mark J. Seger, Treasurer | |
| | | |
| Date | August 29, 2017 | |
* | Print the name and title of each signing officer under his or her signature. |