| | OMB APPROVAL |
| | OMB Number: 3235-0570
Expires: July 31, 2022
Estimated average burden hours per response: 20.6 |
UNITED STATES
SECURITIES AND EXCHANGE COMMISSION
Washington, D.C. 20549
FORM N-CSR
CERTIFIED SHAREHOLDER REPORT OF REGISTERED
MANAGEMENT INVESTMENT COMPANIES
| Investment Company Act file number | 811-09911 | |
| Hussman Investment Trust |
| (Exact name of registrant as specified in charter) |
| 6021 University Boulevard, Suite 490 Ellicott City, Maryland | 21043 |
| (Address of principal executive offices) | (Zip code) |
John F. Splain
| Ultimus Fund Solutions, LLC 225 Pictoria Drive, Suite 450 Cincinnati, Ohio 45246 |
| (Name and address of agent for service) |
| Registrant's telephone number, including area code: | (513) 587-3400 | |
| Date of fiscal year end: | June 30, 2020 | |
| | | |
| Date of reporting period: | June 30, 2020 | |
Form N-CSR is to be used by management investment companies to file reports with the Commission not later than 10 days after the transmission to stockholders of any report that is required to be transmitted to stockholders under Rule 30e-1 under the Investment Company Act of 1940 (17 CFR 270.30e-1). The Commission may use the information provided on Form N-CSR in its regulatory, disclosure review, inspection, and policymaking roles.
A registrant is required to disclose the information specified by Form N-CSR, and the Commission will make this information public. A registrant is not required to respond to the collection of information contained in Form N-CSR unless the Form displays a currently valid Office of Management and Budget ("OMB") control number. Please direct comments concerning the accuracy of the information collection burden estimate and any suggestions for reducing the burden to Secretary, Securities and Exchange Commission, 450 Fifth Street, NW, Washington, DC 20549-0609. The OMB has reviewed this collection of information under the clearance requirements of 44 U.S.C. § 3507.
| Item 1. | Reports to Stockholders. |

HUSSMAN INVESTMENT TRUST
HUSSMAN STRATEGIC GROWTH FUND
HUSSMAN STRATEGIC ALLOCATION FUND
HUSSMAN STRATEGIC TOTAL RETURN FUND
HUSSMAN STRATEGIC INTERNATIONAL FUND
ANNUAL REPORT
June 30, 2020
Beginning on January 1, 2021, and as permitted by a rule adopted by the U.S. Securities and Exchange Commission, paper copies of the Funds’ shareholder reports like this one will no longer be sent to you by mail, unless you specifically request that the Funds or your financial intermediary (i.e., the broker-dealer or bank through which you own your shares) send you paper copies. Instead, shareholder reports will be made available on a website, and you will be notified by mail each time a report is posted and provided with a website link to access the report.
If you have already elected to receive shareholder reports electronically, you will not be affected by this change and need not take any action. You may elect to receive electronic delivery of shareholder reports and other communications from the Funds by contacting the Funds at 1-800-487-7626 or, if you own your shares through a financial intermediary, by contacting your financial intermediary.
You may elect to receive all future shareholder reports of the Funds in paper free of charge. You can inform the Funds that you wish to continue receiving paper copies of your shareholder reports by contacting the Funds at 1-800-487-7626. If you own shares through a financial intermediary, you may contact your financial intermediary or follow instructions included with this document to elect to continue to receive paper copies of your shareholder reports. Your election to receive reports in paper will apply to the reports of each of the Funds and, if you own shares through a financial intermediary, to the reports of each of the Funds and all other funds that you own through your financial intermediary.
Table of Contents
| | |
Performance Information | |
Hussman Strategic Growth Fund | 1 |
Hussman Strategic Allocation Fund | 2 |
Hussman Strategic Total Return Fund | 3 |
Hussman Strategic International Fund | 4 |
Letter to Shareholders | 5 |
Portfolio Information | 19 |
Schedules of Investments | |
Hussman Strategic Growth Fund | 22 |
Hussman Strategic Allocation Fund | 33 |
Hussman Strategic Total Return Fund | 41 |
Hussman Strategic International Fund | 45 |
Statements of Assets and Liabilities | 51 |
Statements of Operations | 53 |
Statements of Changes in Net Assets | |
Hussman Strategic Growth Fund | 55 |
Hussman Strategic Allocation Fund | 56 |
Hussman Strategic Total Return Fund | 57 |
Hussman Strategic International Fund | 58 |
Financial Highlights | |
Hussman Strategic Growth Fund | 59 |
Hussman Strategic Allocation Fund | 60 |
Hussman Strategic Total Return Fund | 61 |
Hussman Strategic International Fund | 62 |
Notes to Financial Statements | 63 |
Report of Independent Registered Public Accounting Firm | 89 |
About Your Funds’ Expenses | 91 |
Board of Trustees and Officers | 93 |
Other Information | 95 |
Federal Tax Information | 95 |
Approval of Investment Advisory Agreements | 96 |
Discussion of Liquidity Risk Management Program | 104 |

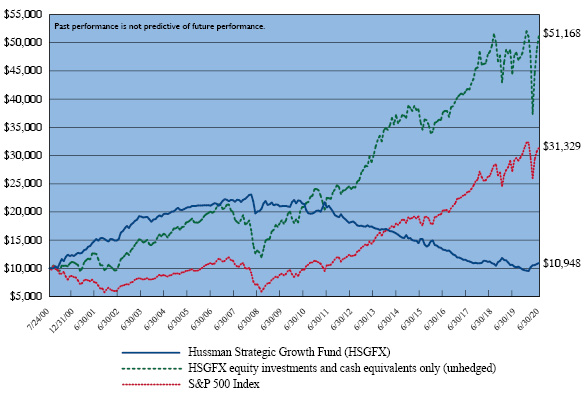
Hussman Strategic Growth Fund
Comparison of the Change in Value of a $10,000 Investment in
Hussman Strategic Growth Fund versus the S&P 500 Index(a) (Unaudited)
Average Annual Total Returns For Periods Ended June 30, 2020 |
| | 1 Year | 3 Years | 5 Years | 10 Years | Since
Inception(b) | |
Hussman Strategic Growth Fund(c)(d) | 6.17% | (1.73%) | (5.98%) | (6.80%) | 0.46% | |
S&P 500 Index | 7.51% | 10.73% | 10.73% | 13.99% | 5.90% | |
(a) | Hussman Strategic Growth Fund invests primarily in stocks listed on the New York, American, and NASDAQ exchanges and varies its investment exposure to market fluctuations depending on market conditions. The S&P 500 Index is an index of large capitalization stocks. However, the Fund may invest in securities that are not included in the S&P 500 Index and there are no restrictions as to the market capitalization of companies in which the Fund invests. “HSGFX equity investments and cash equivalents only (unhedged)” reflects the performance of the Fund’s stock investments and modest day-to-day cash balances, after fees and expenses, and does not reflect the impact of hedging transactions on the Fund’s overall investment performance. The Fund’s unhedged equity investments do not represent a separately available portfolio, and their performance is presented solely for purposes of comparison and performance attribution. |
(b) | The Fund commenced operations on July 24, 2000. |
(c) | Returns do not reflect the deduction of taxes a shareholder would pay on Fund distributions or the redemption of Fund shares. |
(d) | The Adviser has contractually agreed to waive its investment advisory fees and/or absorb Fund expenses until at least November 1, 2020 to the extent necessary to limit the Fund’s annual ordinary operating expenses to an amount not exceeding 1.15% annually of the Fund’s average daily net assets. Absent this arrangement, the expense ratio of the Fund for the year ended June 30, 2020 would have been 1.26%. |

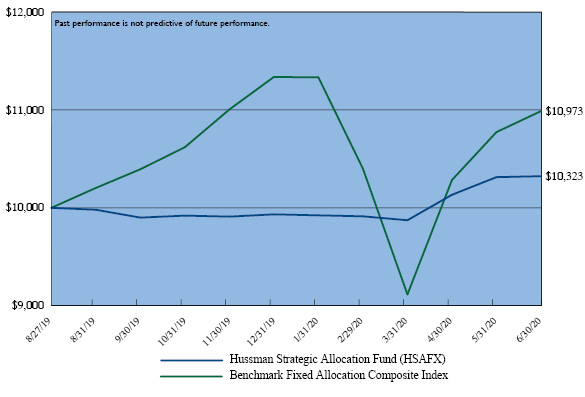
Hussman Strategic Allocation Fund
Comparison of the Change in Value of a $10,000 Investment in Hussman Strategic Allocation Fund
versus Benchmark Fixed Allocation Composite(a) (Unaudited)
Total Returns For Period Ended June 30, 2020 |
| | Since
Inception(b) | |
Hussman Strategic Allocation Fund(c)(d) | 3.23% | |
Benchmark Fixed Allocation Composite | 9.73% | |
(a) | Benchmark Fixed Allocation Composite represents the gross investment performance of a portfolio that is invested in securities included in three separate indices, weighted as follows: 60% S&P 500 Index, 30% Bloomberg Barclays U.S. Treasury Unhedged Index and 10% Bloomberg Barclays Treasury Bills Index and represents an investment approach that invests a fixed percentage of assets in stocks, bonds, and money-market securities, with little or no variation. The Fund may invest in securities that are not included in the indices that comprise the composite. |
(b) | The Fund commenced operations on August 27, 2019. |
(c) | Returns do no reflect the deduction of taxes a shareholder would pay on Fund distributions or the redemptions of Fund shares. |
(d) | The Advisor has contractually agreed to waive its investment advisory fees and/or absorb Fund expenses until at least November 1, 2022 to the extent necessary to limit the Fund’s annual ordinary operating expenses to an amount not exceeding 1.25% annually of the Fund’s average daily net assets. Absent this arrangement, the expense ratio of the Fund (annualized) for the period ended June 30, 2020 would have been 4.67%. |

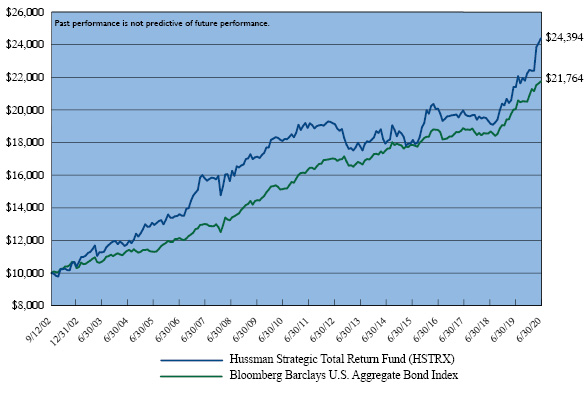
Hussman Strategic Total Return Fund
Comparison of the Change in Value of a $10,000 Investment in Hussman Strategic Total Return Fund
versus the Bloomberg Barclays U.S. Aggregate Bond Index(a) (Unaudited)
Average Annual Total Returns For Periods Ended June 30, 2020 |
| | 1 Year | 3 Years | 5 Years | 10 Years | Since
Inception(b) | |
Hussman Strategic Total Return Fund(c)(d) | 14.00% | 7.68% | 5.86% | 3.26% | 5.14% | |
Bloomberg Barclays U.S. Aggregate Bond Index | 8.74% | 5.32% | 4.30% | 3.82% | 4.47% | |
(a) | The Bloomberg Barclays U.S. Aggregate Bond Index covers the U.S. investment grade fixed rate bond market, with index components for U.S. government, agency and corporate securities. The Fund does not invest solely in securities included in the Bloomberg Barclays U.S. Aggregate Bond Index and may invest in other types of bonds, as well as common stocks, exchange-traded funds and other securities. |
(b) | The Fund commenced operations on September 12, 2002. |
(c) | Returns do not reflect the deduction of taxes a shareholder would pay on Fund distributions or the redemption of Fund shares. |
(d) | The Adviser has contractually agreed to waive its investment advisory fees and/or absorb Fund expenses until at least November 1, 2020 to the extent necessary to limit the Fund’s annual ordinary operating expenses to an amount not exceeding 0.75% annually of the Fund’s average daily net assets. Absent this arrangement, the expense ratio of the Fund for the year ended June 30, 2020 would have been 0.81%. |

Hussman Strategic International Fund
Comparison of the Change in Value of a $10,000 Investment in
Hussman Strategic International Fund versus the MSCI EAFE Index(a) (Unaudited)

Average Annual Total Returns For Periods Ended June 30, 2020 |
| | 1 Year | 3 Years | 5 Years | 10 Years | Since
Inception(b) | |
Hussman Strategic International Fund(c)(d) | 1.08% | (1.18%) | (0.18%) | (1.20%) | (1.07%) | |
MSCI EAFE Index | (5.13%) | 0.81% | 2.05% | 5.73% | 4.04% | |
(a) | The MSCI EAFE (Europe, Australasia, and Far East) Index is a free float-adjusted weighted capitalization index that is designed to measure the equity market performance of developed markets, excluding the U.S. and Canada. As of June 30, 2020, the MSCI EAFE Index consisted of the following 21 developed market country indices: Australia, Austria, Belgium, Denmark, Finland, France, Germany, Hong Kong, Ireland, Israel, Italy, Japan, the Netherlands, New Zealand, Norway, Portugal, Singapore, Spain, Sweden, Switzerland and the United Kingdom. The Fund is not required to invest in each of the countries represented in the MSCI EAFE Index and may invest in securities that are not included in the MSCI EAFE Index. In addition, the Fund varies its exposure to market fluctuations depending on market conditions. |
(b) | The Fund commenced operations on December 31, 2009. |
(c) | Returns do not reflect the deduction of taxes a shareholder would pay on Fund distributions or the redemption of Fund shares. |
(d) | The Adviser has contractually agreed to waive its investment advisory fees and/or absorb Fund expenses until at least November 1, 2020 to the extent necessary to limit the Fund’s annual ordinary operating expenses to an amount not exceeding 2.00% annually of the Fund’s average daily net assets. Absent this arrangement, the expense ratio of the Fund for the year ended June 30, 2020 would have been 3.43%. |
The Hussman Funds
|
Letter to Shareholders | August 14, 2020 |
Dear Shareholder,
“It’s useful to remember that long-term returns represent not only trough-to-peak advances, but peak-to-trough resolutions as well. Buy-and-hold investors don’t get the trough-to-peak return. They get the full cycle return. Not surprisingly, the higher the valuation at the bull market peak, the longer the subsequent period of disappointing returns, in several instances extending more than a decade, though not without intermittent failure-prone bull market rallies to add excitement. This is what I often call ‘going nowhere in an interesting way.’”
– John P. Hussman, Ph.D., Risk Management is Generous, December 2004
From May 1995 through March 2009, despite two intervening speculative bubbles, the total return of the Standard & Poor’s 500 Index lagged the total return of risk-free Treasury bills. This was also true for the period from August 1959 through August 1982, as well as the period from August 1929 to August 1945. Indeed, during the 80-year period from 1929 to 2009, the S&P 500 took three long, interesting trips to nowhere, accounting for 53 of those years (1929-1945, 1959-1982, and 1995-2009), underperforming risk-free Treasury bills after all was said and done.
The singular feature of these very long trips to nowhere is that they either begin from elevated valuations, end at depressed valuations, or both. Periods that begin at extremely elevated valuations are particularly notable, because this defining feature is already in place and can be readily observed in real-time. Not surprisingly, the total return of the S&P 500 lagged the total return of risk-free Treasury bills for more than 13 years following the March 24, 2000 bubble peak. That outcome was consistent with estimates I published at the time, along with a projection of an 83% loss in technology stocks over the completion of the market cycle; which was subsequently realized by the technology-heavy Nasdaq 100 Index. No precision in “catching” the 2000 peak was necessary. By March 2009, the total return of the S&P 500 had lagged Treasury bills all the way back to May 1995.
Presently, the market valuation measures that we find most strongly correlated with actual subsequent S&P 500 total returns are again at extremes that rival or exceed the 1929 and 2000 extremes. This is not a statement about near-term returns or immediate market direction, but it is a rather emphatic statement about the likely long-term investment prospects for passive investors in U.S. stocks, and the potential depth of market losses over the completion of the current market cycle.
Investors sometimes assume that if the market continues to advance despite rich valuations, then valuations must somehow be failing. This is not how valuations work. If overvaluation itself was enough to drive prices lower, one could never observe
The Hussman Funds
|
Letter to Shareholders (continued) |
extremes like 1929, 2000, and today, because the market would have been weighed down by far lesser extremes. The importance of valuations is that they strongly inform our expectations about long-term market returns and the extent of potential market losses over the completion of the market cycle.
When it comes to overvalued assets, investors cannot have their cake and eat it too. If investors hope to preserve overvalued prices, they also have to accept meager long-term returns. This is the situation that we presently observe in the U.S. equity market. Based on our most reliable valuation measures, we presently estimate that the nominal total returns of the S&P 500 are likely to be negative on a 12-year horizon.
Fortunately, this extended period of uninspiring long-term S&P 500 total returns is likely to include a wide range of market fluctuations over shorter segments of the market cycle, including alternating periods of speculation and risk-aversion, and alternating periods of extreme valuations and run-of-the-mill or depressed ones. This is the “interesting” part of markets that go “nowhere in an interesting way.” Not every one of these fluctuations will provide an investment opportunity, but we expect a wide range of opportunities to emerge over time, as we have observed across a century of market history.
In the face of a U.S. unemployment rate that remains higher than the worst levels of the 2008-2009 global financial crisis, and a steep economic downturn in which credit strains have been addressed largely by boosting investor confidence and deferring payment obligations, it seems perplexing that the S&P 500 has recently recovered to the most extreme level in history, and to valuations that again rival the 1929 and 2000 extremes. A large part of this recovery reflects extraordinary confidence among investors that Federal Reserve actions will defend them against any material market loss in the future. It also reflects extraordinary confidence in a “V-shaped economic recovery” driven by federal deficit spending (outlays in excess of receipts) in an amount exceeding 40% of real U.S. second-quarter GDP.
As we observed early in both the 2000-2002 and 2007-2009 market collapses, the ingrained “buy the dip” mentality of investors, despite clear economic headwinds and emerging credit strains, is likely to be disastrous. Still, we have absolutely no need to make predictions or to rule out the possibility that everything will come up roses. What is necessary is simply to align our investment outlook with observable market conditions as they change over time.
While our investment discipline considers a broad range of factors, two considerations are most important:
| | 1) | Valuations, which drive our expectations for long-term market returns; |
The Hussman Funds
|
Letter to Shareholders (continued) |
| | 2) | Market action, largely reflecting the behavior of prices and trading volume, and in particular, the uniformity or divergence of this behavior across thousands of individual securities, sectors, industries, and security-types, including debt securities of varying creditworthiness. |
The central lesson to draw from both our successes (particularly navigating complete market cycles prior to 2010) and our challenges (particularly in the period between 2010 and 2017), is that it is best to identify and flexibly respond to prevailing conditions as they change over time, without assuming that there is any well-defined “limit” to either the speculative exuberance or the risk-averse fear of investors.
Over any limited segment of the market cycle, it does not appear to matter whether the beliefs of investors are well-informed or wildly misguided. Over short horizons, it is important to consider whether investor psychology is inclined toward speculation or toward risk-aversion, and we find that this is best gauged by the uniformity or divergence of market internals. Put simply, when investors are inclined toward speculation, they tend to be indiscriminate about it. When they are inclined toward risk-aversion, they tend to be selective and tenuous.
In contrast, over the long-term, and over complete market cycles, an understanding of valuations is critical. Human nature is subject to both optimism and pessimism; to both greed and fear. As a result, periods of extreme overvaluation at one point in time eventually give way to periods of normal or depressed valuations at other points in time.
Both valuations and the analysis of market internals are essential components of our value-conscious, full-cycle investment discipline. These factors help to shape our investment outlook, and also place certain limits on our investment stance.
The ability to properly value securities, to estimate the long-term returns embedded into their prices, and to gauge the potential downside risk of the market over the completion of a given cycle, affects how aggressively or conservatively we respond to shorter waves of speculation or risk-aversion. Likewise, the ability to gauge investor psychology affects how aggressively or conservatively we respond to valuations and changes in long-term expected returns.
Since late-2017, our investment discipline has required explicit deterioration in market internals in order to establish or amplify a negative market outlook. In sufficiently overvalued markets, we may adopt a neutral outlook, but a bearish one requires unfavorable internals, indicating that investors have become inclined toward risk-aversion.
The Hussman Funds
|
Letter to Shareholders (continued) |
Conversely, in markets that are undervalued, we believe that fully invested, unhedged, or leveraged investment positions are best confined to periods when our measures of market internals are uniformly favorable, indicating that investors have become inclined toward speculation. In my view, the most favorable market conditions are those that combine reasonable or attractive valuations with emerging improvement in market internals.
Because the gap between current valuation extremes and run-of-the-mill valuations is as wide as it was in 1929 and 2000, I expect the S&P 500 to lose roughly two-thirds of its value at some point over the completion of the current market cycle. Still, it is wholly unnecessary to make such projections. It is enough to align our investment outlook with the observable conditions that prevail at each point in time.
The most negative market conditions we identify are those that combine extremely rich valuations with ragged or divergent market internals, particularly if the market has also enjoyed an overextended short-term advance. This is a combination that we observed in both May 2001 and May 2008, and one that currently prevails as of early-August 2020. My previous comments during the 2000-2002 and 2007-2009 bear markets capture those concerns.
“In an overvalued market lacking trend uniformity, investors are skittish. The market may very well rally strongly for a while, but the underlying structure of the market is vulnerable. In that kind of environment, seemingly irrelevant items of news can cause large and sudden price declines. In historical data, we’ve seen too many examples of seemingly powerful bear market rallies suddenly launching into vertical declines. We do believe that the U.S. is already in recession, and that stocks remain in a bear market likely to generate much more serious losses.” – May 14, 2001
“Overbought conditions in unfavorable Market Climates tend to be rare. The steepest bear market losses tend to follow immediately on the heels of such overbought conditions.” – December 10, 2007
“In recent weeks, investors have chased stock prices higher (on relatively dull volume and narrow, cyclical leadership) like kids riding their bikes up a board they’ve laid over a pile of bricks to take a sweet jump. Once in the air, the question is ‘what now?’” – May 19, 2008
The Hussman Funds
|
Letter to Shareholders (continued) |
Fund Performance
Strategic Growth Fund
In the fiscal year ended June 30, 2020, Strategic Growth Fund gained 6.17%. During the same period, the S&P 500 gained 7.51%. The hedging stance of the Fund has varied between a strongly defensive position (particularly before mid-March 2020) and a more neutral near-term outlook (particularly after the mid-March 2020 market low). In recent months, the Fund has maintained a flexible response to market conditions, particularly valuations and measures of market internals. During the 2020 fiscal year, the hedging strategy of the Fund contributed notably to a reduction in overall risk, as the deepest interim loss experienced by the Fund during this period was -12.76%, compared with an interim loss of -33.79% for the S&P 500 Index.
The stock selection approach of Strategic Growth Fund has outperformed the S&P 500 Index by an average of 2.63% (263 basis points) annually since the inception of the Fund. During the fiscal year ended June 30, 2020, the performance of the Fund’s stock selections, excluding the impact of hedging, slightly lagged the index, realizing a gain of 7.18% versus a 7.51% gain in the S&P 500 Index, largely reflecting our continued emphasis of value-conscious selection. As at other market extremes such as 2000, this approach periodically avoids large holdings in high-weight components of the S&P 500 that we consider to be overvalued speculative “glamour” stocks.
From the inception of Strategic Growth Fund on July 24, 2000 through June 30, 2020, the Fund had an average annual total return of 0.46%, compared with an average annual total return of 5.90% for the S&P 500 Index. An initial $10,000 investment in the Fund at its inception on July 24, 2000 would have grown to $10,948, compared with $31,329 for the same investment in the S&P 500 Index. The deepest loss experienced by the Fund since inception was -60.36%. The deepest loss experienced by the S&P 500 Index since the inception of the Fund was -55.25%.
In late-2017, largely in response to novel Federal Reserve policies that have the effect of amplifying yield-seeking speculation, we adapted our investment discipline to limit the defensiveness of the Fund when our measures of market internals are uniformly favorable. It is notable that from the inception of the Fund on July 24, 2000 through the market low on March 9, 2009, Strategic Growth Fund gained 105.57% (an 8.71% average annual total return) compared with a -45.99% loss in the S&P 500 (a -6.89% average annual loss). The deepest loss experienced by the Fund during this period was -21.45%, compared with a -55.25% loss in the S&P 500.
The Hussman Funds
|
Letter to Shareholders (continued) |
While there is no assurance that the future performance of the Fund, relative to the S&P 500, will be similar to that of the 2000-2009 period, we believe that the late-2017 adaptation to our investment discipline fully addressed the main challenge that we faced during the 2009-2017 segment of the recent market cycle, which was responsible for the departure of the Fund’s performance from our full-cycle expectations.
Strategic Total Return Fund
In the fiscal year ended June 30, 2020, Strategic Total Return Fund had a total return of 14.00%. During the same period, the Bloomberg Barclay’s U.S. Aggregate Bond Index had a total return of 8.74%. Strategic Total Return Fund held a moderately constructive position in long-term bonds, during this period, with a duration typically ranging between 2-3 years (meaning that a 100 basis point move in interest rates would be expected to affect Fund value by about 2-3% on the basis of bond price fluctuations). The Fund benefited from holdings in shares of companies engaged in the mining of precious metals, as well as utilities, largely by varying the size of its investment positions in response to periods of strength and weakness in these sectors. The deepest interim loss experienced by the Fund during this period was -7.18%, compared with an interim loss of -6.30% for the Bloomberg Barclay’s U.S. Aggregate Bond Index.
From the inception of Strategic Total Return Fund on September 12, 2002 through June 30, 2020, the Fund had an average annual total return of 5.14%, compared with an average annual total return of 4.47% for the Bloomberg Barclay’s U.S. Aggregate Bond Index. An initial $10,000 investment in the Fund on September 12, 2002 would have grown to $24,394, compared with $21,764 for the same investment in the Bloomberg Barclays U.S. Aggregate Bond Index. The deepest loss experienced by the Fund since inception was -11.52%, compared with a maximum loss of -6.30% for the Bloomberg Barclay’s U.S. Aggregate Bond Index during the same period.
Strategic International Fund
In the fiscal year ended June 30, 2020, Strategic International Fund had a total return of 1.08%. During the same period, the MSCI EAFE Index lost -5.13%. Strategic International Fund remained fully hedged against the impact of general market fluctuations during the 2020 fiscal year. While the equity positions and cash equivalents of the Fund lost -3.68% during this period, the Fund’s hedging strategy contributed 4.76%, resulting in the Fund’s overall gain during this period. The deepest interim loss in Strategic International Equity Fund during this period was -10.26%, compared with an interim loss of -33.90% for the MSCI EAFE Index.
The Hussman Funds
|
Letter to Shareholders (continued) |
Because international stock markets tend to become highly correlated during steep declines in the U.S. stock market, the downside risk that we observe in the U.S. market exists in international equity markets as well. A material improvement in U.S. conditions, particularly in our measures of market internals, would likely encourage a constructive stance in the international markets as well. Without the elevated level of market risk that we currently observe, the Fund will have substantially greater opportunity to establish a constructive investment stance based on individual country valuations, market action and other local considerations.
From the inception of Strategic International Fund on December 31, 2009 through June 30, 2020, the Fund had an average annual total return of -1.07%, compared with an average annual total return of 4.04% for the MSCI EAFE Index. An initial $10,000 investment in the Fund on December 31, 2009 would be worth $8,936, compared with $15,147 for the same investment in the MSCI EAFE Index. The deepest loss experienced by the Fund since inception was -22.87%, compared with a maximum loss of -34.12% for the MSCI EAFE Index during the same period.
Strategic Allocation Fund
In August 2019, we launched Hussman Strategic Allocation Fund. The Fund seeks to achieve total return through a combination of income and capital appreciation. It pursues this objective by investing its assets primarily in stocks, bonds, and cash equivalents in consideration of prevailing valuations and estimated expected returns in these markets, with added emphasis on risk-management to adjust the Fund’s investment exposure in market conditions that, in the view of the investment adviser, suggest risk-aversion or speculation by market participants. From the inception of Strategic Allocation Fund on August 27, 2019 through June 30, 2020, the total return of the Fund was 3.23%, reflecting a portfolio that was largely hedged against market fluctuations during this period.
Portfolio Composition
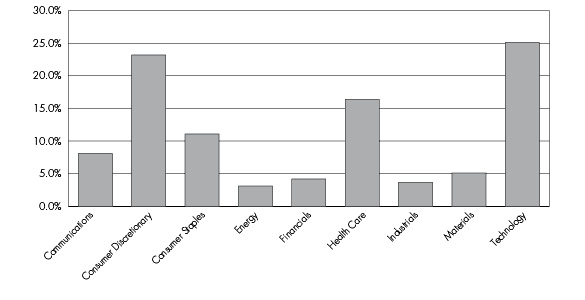
As of June 30, 2020, Strategic Growth Fund had net assets of $308,774,101, and held 206 stocks in a wide variety of industries. The largest sector holdings as a percent of net assets were consumer discretionary (24.1%), technology (22.2%), health care (18.2%), communications (7.8%), consumer staples (7.5%) industrials (6.3%) and materials (5.3%). The smallest sector holdings were in energy (4.9%), financials (4.6%) and utilities (0.7%).
The Hussman Funds
|
Letter to Shareholders (continued) |
Strategic Growth Fund’s holdings of individual stocks as of June 30, 2020 were valued at $313,647,074. Against these stock positions, the Fund also held 575 option combinations (long put option/short call option) on the S&P 500 Index and 900 option combinations on the Russell 2000 Index. Each option combination behaves as a short sale on the underlying index, with a notional value of $100 times the index value. On June 30, 2020, the S&P 500 Index closed at 3,100.29, while the Russell 2000 Index closed at 1,441.365. The Fund’s total hedge therefore represented a short position of $307,989,525, thereby hedging 98.2% of the dollar value of the Fund’s long investment positions in individual stocks.
Although the performance of Strategic Growth Fund’s diversified portfolio cannot be attributed to any narrow group of stocks, the following equity holdings achieved gains in excess of $1.5 million during the fiscal year ended June 30, 2020: Vaxart, Newmont, SolarEdge Technologies, Barrick Gold and Generac Holdings. Equity holdings with a loss in excess of $1.5 million during this same period were Discover Financial Services, ANI Pharmaceuticals, Lantheus Holdings and AMC Networks.
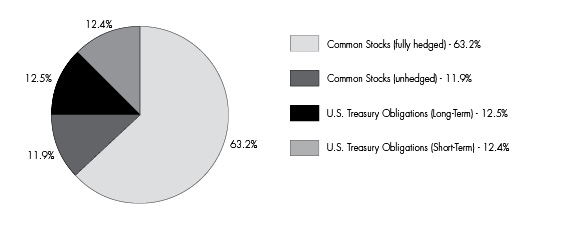
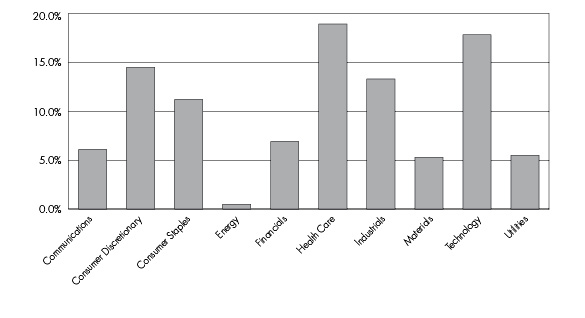
As of June 30, 2020, Strategic Allocation Fund had net assets of $8,093,059 and held 139 stocks in a wide variety of industries. The largest sector holdings as a percent of net assets were technology (18.9%), consumer discretionary (17.4%), health care (12.3%), consumer staples (8.4%) and communications (6.1%). The smallest sector weights were materials (3.8%), financials (3.1%), industrials (2.8%) and energy (2.3%). Treasury notes, Treasury bills and investments in money market funds represented 45.4% of the Fund’s net assets.
Strategic Allocation Fund’s holdings of individual stocks as of June 30, 2020 were valued at $6,077,368. Against these stock positions, the Fund also held 10 option combinations (long put option/short call option) on the S&P 500 and 14 option combinations on the Russell 2000 Index. The notional value of this hedge was $5,118,201, hedging 84.2% of the value of equity investments held by the Fund.
In Strategic Allocation Fund, during the period ended June 30, 2020, individual equity portfolio gains in excess of $30,000 were achieved in 10x Genomics, Installed Building Products and Amazon. Individual equity portfolio losses in excess of $30,000 during this same period were recognized in Ulta Beauty, J2 Global and Discover Financial Services.
The Hussman Funds
|
Letter to Shareholders (continued) |
As of June 30, 2020, Strategic Total Return Fund had net assets of $290,129,187. Treasury notes, Treasury Inflation-Protected Securities (TIPS) and investments in money market funds represented 80.1% of the Fund’s net assets. Shares of exchange-traded funds, precious metals shares and energy and utilities shares accounted for 3.2%, 15.0% and 6.8% of net assets, respectively.
In Strategic Total Return Fund, during the fiscal year ended June 30, 2020, portfolio gains in excess of $1.5 million were achieved in Newmont, Barrick Gold, U.S Treasury Note (1.50%, due 8/15/2026) and Agnico Eagle Mines. The only portfolio loss in excess of $1 million during this same period was United States Oil Fund LP.
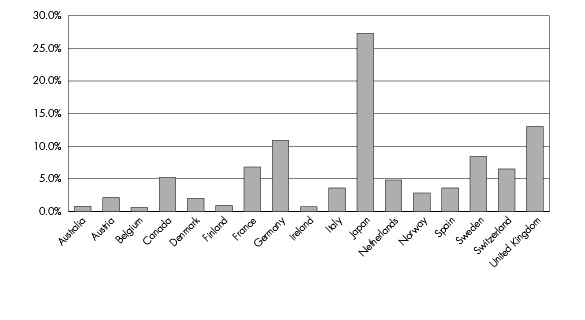
As of June 30, 2020, Strategic International Fund had net assets of $14,994,565 and held 94 stocks in a wide variety of industries. The largest sector holdings as a percent of net assets were in health care (15.2%), technology (14.3%), consumer discretionary (11.7%), industrials (10.7%), consumer staples (9.0%) and financials (5.6%). The smallest sector holdings were in communications (4.9%), utilities (4.4%), materials (4.3%) and energy (0.4%).
In order to hedge the impact of general market fluctuations, as of June 30, 2020, Strategic International Fund was short 90 futures on the Mini MSCI EAFE Index and long 12 puts on the S&P 500 Index. The notional value of this hedge was $11,723,148, hedging 98.1% of the dollar value of equity investments held by the Fund. When the Fund is in a hedged investment position, the primary driver of Fund returns is the difference in performance between the stocks owned by the Fund and the indices that are used to hedge.
While the investment portfolio of Strategic International Fund is widely diversified and its performance is affected by numerous investment positions, the hedging strategy of the Fund was primarily responsible for the reduced sensitivity of the Fund to market fluctuations from the Fund’s inception through June 30, 2020. Individual equity holdings having a portfolio gain in excess of $100,000 during the fiscal year ended June 30, 2020 were achieved in Advantest, Nuflare Technology, Ingenico Group and Mycronic. Only one equity holding, Granges AB, recognized a portfolio loss in excess of $100,000 during this period.
Supplementary information including quarterly returns and equity-only performance of the Funds is available on the Hussman Funds website: www.hussmanfunds.com.
The Hussman Funds
|
Letter to Shareholders (continued) |
Current Outlook
Over the completion of every market cycle, there is a very strong tendency for reliable valuation measures to retreat to levels near or below their long-term historical norms. This tendency was the basis on which we projected the likely extent of the 2000-2002 and 2007-2009 collapses in the S&P 500 Index (in both cases, the market proved us to be slightly optimistic). A similar retreat to run-of-the-mill historical valuation norms would presently require a decline in the S&P 500 Index of about -65%, resulting in a loss in the index of roughly two-thirds from August 2020 levels.
Arguably, the current low level of interest rates should be associated with similarly dismal long-term expected returns on stocks, which is why Wall Street analysts often argue that low interest rates “justify” higher valuation multiples than those observed across history. The higher valuation multiples, in this argument, are precisely what is required to produce those dismal long-term expected returns.
However, this argument assumes that the growth rate of corporate cash flows has been held constant. Instead, there is strong evidence to suggest that the level of interest rates largely mirrors the growth rate of nominal GDP and nominal corporate revenues. This means that today’s lower-than-normal interest rates are already matched by lower than normal growth rates in corporate cash flows.
Indeed, over the past 12 years, the average yield on U.S. Treasury securities has been about 3% lower than historical norms, but so too has been the average annual growth rate of nominal GDP and S&P 500 revenues. This is important, because it means that higher valuation levels are not required in order to make stocks “competitive” with bonds. Low nominal growth rates in corporate cash flows already reduce the long-term expected return of stocks, even without any valuation premium.
When Wall Street analysts say “well, stock valuations are high, but high valuations are justified by low interest rates,” they are actually arguing that passive investors face the worst of all possible worlds. The statement amounts to saying “well, future stock returns are likely to be dismal, but dismal returns on stocks are justified because you’re going to get dismal returns on bonds too.” Saying that extreme stock market valuations are “justified” by low interest rates is like saying that poking yourself in the eye is “justified” by smashing your thumb with a hammer.
Unfortunately, all of this leaves us in a situation where current S&P 500 valuations are three times their relevant historical norms, and long-term expected returns on stocks would be somewhat below-average even if those norms were restored.
The Hussman Funds
|
Letter to Shareholders (continued) |
Emphatically, nothing in our investment discipline requires the market to approach or breach these norms. Appropriate valuation levels simply create greater opportunities. Even at the low of the initial market retreat in March 2020, in response to the emerging SARS-CoV-2 epidemic, our most reliable valuation measures stood at levels remained over twice their historical norms, bringing our estimate of likely 10-year S&P 500 total returns to just 2.6%. The subsequent rebound has driven that estimate back below zero. Still, the opportunity was sufficient, even without an improvement in our measures of market internals, to modify our investment stance in a way that enabled all of the Hussman Funds to achieve and retain positive returns in the fiscal year ended June 30, 2020.
Part of the current enthusiasm of investors seems to be the idea that the stock market typically reaches its low before the economy does (although this was certainly not true of the 2001 recession). On the idea that the second quarter of 2020 was the low point for the economy, there is a superficial sensibility in “looking over the valley.” The problem is that post-recession bull markets typically begin at below-average valuations that are less than one-third of those we observe at present. As a result of the recent market rebound, our most reliable measures of stock market valuation again rival levels that marked the 1929 and 2000 market peaks.
Frankly, my view is that investors have become overconfident in the idea that easy money can support extreme market valuations, regardless of the surrounding economic environment. U.S. equity market capitalization exceeds $40 trillion. The U.S. Treasury has allocated $25 billion of CARES economic support funds for the Federal Reserve to purchase outstanding, uncollateralized corporate bonds from private investors. Even if the Fed was to “leverage” this amount, in violation of CARES 4003(c)(3)(B) “terms and conditions” relating to collateral requirements and taxpayer protection, and even if these funds were entirely diverted to stock purchases, the Fed could absorb less than 1% of U.S. equity market capitalization.
To address the human and economic aspects of the SARS-CoV-2 (COVID-19) epidemic, I’ve included extended public health notes since February in my monthly comments at www.hussmanfunds.com, along with a discussion of economic policy responses. With regard to the implications of the epidemic for the financial markets, there is little reason to believe that the very long-term stream of corporate cash flows will be affected, despite the likelihood of additional “cyclical” economic challenges. Still, the same has typically been true for recessions in general. Recessions don’t dramatically alter the likely stream of very long-term corporate cash flows, which is why we find that corporate revenues have historically been more reliable measures of market valuation than corporate earnings.
The Hussman Funds
|
Letter to Shareholders (continued) |
The larger issue for both stocks and corporate bonds is that the epidemic creates significant potential for near-term economic disruption and credit defaults, in a market that is priced for neither. These “cyclical” disruptions, and the anxiety they produce, are why U.S. economic recessions, large or small, have historically driven our most reliable measures of S&P 500 valuation to less than half of their present levels. Extraordinary Federal Reserve interventions have certainly blunted the concern of investors, by creating a perception that large investment losses will somehow “not be allowed.” My impression is that this is a credulous article of faith.
Still, it is worth repeating that it does not matter, in the short run, whether the beliefs of investors are well-informed or wildly misguided. Over any given segment of the market cycle, it is important to consider whether investors are inclined toward speculation or risk-aversion. If our measures of market internals improve, our near-term outlook will also shift to a more neutral outlook. While current valuation extremes would require some sort of hedge in order to provide a safety net against extended market losses, sufficient improvements relating to market internals, economic data, public health, and other factors could even encourage a moderately constructive outlook, despite our long-term and full-cycle concerns.
For now, both our immediate and full-cycle investment outlooks remain negative.
The current situation is reminiscent of May 2008, after Bear Stearns had already failed, after strains in the subprime loan market were fully recognized, and after the Federal Reserve and the U.S. Treasury had already launched unprecedented interventions. The S&P 500 advanced within 9% of its October 2007 peak on the notion that all of the bad news had been “discounted,” yet lost 53% of its value from that point.
On March 17, 2008, the Associated Press published an article discussing the extraordinary interventions by the Federal Reserve in response to the failure of Bear Stearns. Those interventions included Fed Chair Ben Bernanke’s creation of “Maiden Lane” shell companies to absorb bad mortgage-backed debt (which at least represented collateralized debt, unlike the uncollateralized corporate debt the Fed is purchasing today). The article quoted Richard Fuld, who argued that Fed intervention, “from my perspective, takes the liquidity issue for the entire industry off the table.” At that time, Fuld was the CEO of Lehman Brothers.
It is sometimes said that “risk happens fast.��� Yet the underlying damage often has a long and quiet incubation period, which is why Hemingway, in The Sun Also Rises, described bankruptcy as occurring “gradually and then suddenly.” It is also why early
The Hussman Funds
|
Letter to Shareholders (continued) |
in 2008, AIG admitted that it could not “reliably quantify” its losses, leading me to title one of my commentaries “How canst thou know thy counterparty when thou knowest not thine self?”
The same sort of slow incubation characterized the financial markets in May 2001. An economic recession had already started two months earlier, and the S&P 500 had been in a bear market for over a year. But as the S&P 500 rebounded within 14% of the March 2000 bubble peak, the Wall Street Journal observed “Though economists are expecting this year to be the economy’s worst since 1991, only a tiny percentage think the economy is in a recession.” The S&P 500 would lose an additional 40% of its value by October 2002, and the technology-heavy Nasdaq 100 would lose an additional 60% of its value, bringing its overall bear market loss to 83%.
Despite the recent rebound in economic activity (supported by the highest quarterly federal deficit as a share of GDP in history), my sense is that further economic disruptions will emerge “gradually and then suddenly.” It is important to allow for that possibility, but nothing in our investment discipline relies on that outcome. It is enough to simply align our investment stance with prevailing, observable conditions – primarily valuations and market internals – and to shift our outlook as the evidence shifts.
I remain grateful, as always, for your trust.
Sincerely,
John P. Hussman, Ph.D.
Past performance is not predictive of future performance. Investment results and principal value will fluctuate so that shares of the Funds, when redeemed, may be worth more or less than their original cost. Current performance may be higher or lower than the performance data quoted.
Weekly updates regarding market conditions and investment strategy, as well as special reports, analysis, and performance data current to the most recent month end, are available at the Hussman Funds website: www.hussmanfunds.com.
An investor should consider the investment objectives, risks, charges and expenses of the Funds carefully before investing. The Funds’ prospectuses contain this and other important information. To obtain a copy of the Hussman Funds’ prospectuses please visit our website at www.hussmanfunds.com or call 1-800-487-7626 and a copy will be sent to you free of charge. Please read the prospectus carefully before you invest. The Hussman Funds are distributed by Ultimus Fund Distributors, LLC.
The Hussman Funds
|
Letter to Shareholders (continued) |
Estimates of prospective return and risk for equities, bonds, and other financial markets are forward-looking statements based on the analysis and reasonable beliefs of Hussman Strategic Advisors. They are not a guarantee of future performance, and are not indicative of the prospective returns of any of the Hussman Funds. Actual returns may differ substantially from the estimates provided. Estimates of prospective long-term returns for the S&P 500 Index reflect valuation methods focusing on the relationship between current market prices and earnings, dividends and other fundamentals, adjusted for variability over the economic cycle.
This Letter to Shareholders seeks to describe some of the adviser’s current opinions and views of the financial markets. Although the adviser believes it has a reasonable basis for any opinions or views expressed, actual results may differ, sometimes significantly, from those expected or expressed. The securities held by the Funds that are discussed in this Letter to Shareholders were held during the period covered by this Report. They do not comprise the entire investment portfolios of the Funds, may be sold at any time and may no longer be held by the Funds. The opinions of the Funds’ adviser with respect to those securities may change at any time.
Hussman Strategic Growth Fund
Portfolio Information |
June 30, 2020 (Unaudited) |
Sector Allocation (% of Common Stocks)

Hussman Strategic Allocation Fund
Portfolio Information |
June 30, 2020 (Unaudited) |
Asset Allocation (% of Net Assets)
Hussman Strategic Allocation Fund
Portfolio Information (continued) |
June 30, 2020 (Unaudited) |
Sector Allocation* (% of Common Stocks)
* | As of June 30, 2020, the Fund held no securities in the Utilities sector. |
Hussman Strategic Total Return Fund
Portfolio Information |
June 30, 2020 (Unaudited) |
Asset Allocation (% of Net Assets)

Hussman Strategic International Fund
Portfolio Information |
June 30, 2020 (Unaudited) |
Sector Allocation (% of Common Stocks)
Country Allocation (% of Common Stocks)
Hussman Strategic Growth Fund
Schedule of Investments |
June 30, 2020 |
COMMON STOCKS — 101.6% | | Shares | | | Value | |
Communications — 7.8% | | | | | | | | |
Media — 5.8% | | | | | | | | |
Alphabet, Inc. - Class C (a) | | | 1,000 | | | $ | 1,413,610 | |
AMC Entertainment Holdings, Inc. - Class A | | | 75,000 | | | | 321,750 | |
AMC Networks, Inc. - Class A (a) | | | 60,000 | | | | 1,403,400 | |
Cardlytics, Inc. (a) | | | 10,000 | | | | 699,800 | |
Comcast Corporation - Class A | | | 50,000 | | | | 1,949,000 | |
Facebook, Inc. - Class A (a) | | | 5,000 | | | | 1,135,350 | |
Gray Television, Inc. (a) | | | 175,000 | | | | 2,441,250 | |
Meredith Corporation | | | 35,000 | | | | 509,250 | |
Shutterstock, Inc. | | | 30,000 | | | | 1,049,100 | |
Sirius XM Holdings, Inc. | | | 400,000 | | | | 2,348,000 | |
Stamps.com, Inc. (a) | | | 15,000 | | | | 2,755,350 | |
TEGNA, Inc. | | | 50,000 | | | | 557,000 | |
Twitter, Inc. (a) | | | 15,000 | | | | 446,850 | |
Yelp, Inc. (a) | | | 35,000 | | | | 809,550 | |
| | | | | | | | 17,839,260 | |
Telecom — 2.0% | | | | | | | | |
AT&T, Inc. | | | 100,000 | | | | 3,023,000 | |
CenturyLink, Inc. | | | 60,000 | | | | 601,800 | |
Switch, Inc. - Class A | | | 75,000 | | | | 1,336,500 | |
Verizon Communications, Inc. | | | 25,000 | | | | 1,378,250 | |
| | | | | | | | 6,339,550 | |
Consumer Discretionary — 24.1% | | | | | | | | |
Apparel & Textile Products — 0.8% | | | | | | | | |
Gildan Activewear, Inc. | | | 50,000 | | | | 774,500 | |
Hanesbrands, Inc. | | | 150,000 | | | | 1,693,500 | |
| | | | | | | | 2,468,000 | |
Automotive — 1.2% | | | | | | | | |
Gentex Corporation | | | 100,000 | | | | 2,577,000 | |
Methode Electronics, Inc. | | | 35,000 | | | | 1,094,100 | |
| | | | | | | | 3,671,100 | |
Commercial Services — 1.2% | | | | | | | | |
ASGN, Inc. (a) | | | 15,000 | | | | 1,000,200 | |
Cimpress plc (a) | | | 30,000 | | | | 2,290,200 | |
H&R Block, Inc. | | | 35,000 | | | | 499,800 | |
| | | | | | | | 3,790,200 | |
Consumer Services — 0.9% | | | | | | | | |
2U, Inc. (a) | | | 60,000 | | | | 2,277,600 | |
Hussman Strategic Growth Fund
Schedule of Investments (continued) |
June 30, 2020 |
COMMON STOCKS — 101.6% (continued) | | Shares | | | Value | |
Consumer Discretionary — 24.1% (continued) | | | | | | | | |
Consumer Services — 0.9% (continued) | | | | | | | | |
WW International, Inc. (a) | | | 25,000 | | | $ | 634,500 | |
| | | | | | | | 2,912,100 | |
Distributors — 0.2% | | | | | | | | |
LKQ Corporation (a) | | | 25,000 | | | | 655,000 | |
| | | | | | | | | |
Gaming, Lodging & Restaurants — 3.6% | | | | | | | | |
Brinker International, Inc. | | | 75,000 | | | | 1,800,000 | |
Denny’s Corporation (a) | | | 50,000 | | | | 505,000 | |
Domino’s Pizza, Inc. | | | 3,000 | | | | 1,108,320 | |
Dunkin’ Brands Group, Inc. | | | 35,000 | | | | 2,283,050 | |
InterContinental Hotels Group plc - ADR | | | 25,000 | | | | 1,109,000 | |
Starbucks Corporation | | | 40,000 | | | | 2,943,600 | |
Waitr Holdings, Inc. (a) | | | 500,000 | | | | 1,315,000 | |
| | | | | | | | 11,063,970 | |
Home & Office Products — 1.8% | | | | | | | | |
ACCO Brands Corporation | | | 75,000 | | | | 532,500 | |
Century Communities, Inc. (a) | | | 75,000 | | | | 2,299,500 | |
Taylor Morrison Home Corporation (a) | | | 75,000 | | | | 1,446,750 | |
Toll Brothers, Inc. | | | 35,000 | | | | 1,140,650 | |
| | | | | | | | 5,419,400 | |
Hotels, Restaurants & Leisure — 0.6% | | | | | | | | |
Bloomin’ Brands, Inc. | | | 100,000 | | | | 1,066,000 | |
Ruth’s Hospitality Group, Inc. | | | 75,000 | | | | 612,000 | |
| | | | | | | | 1,678,000 | |
Household Durables — 1.6% | | | | | | | | |
D.R. Horton, Inc. | | | 25,000 | | | | 1,386,250 | |
LGI Homes, Inc. (a) | | | 15,000 | | | | 1,320,450 | |
Turtle Beach Corporation (a) | | | 150,000 | | | | 2,208,000 | |
| | | | | | | | 4,914,700 | |
Leisure Products — 0.7% | | | | | | | | |
Malibu Boats, Inc. - Class A (a) | | | 15,000 | | | | 779,250 | |
YETI Holdings, Inc. (a) | | | 35,000 | | | | 1,495,550 | |
| | | | | | | | 2,274,800 | |
Multiline Retail — 1.2% | | | | | | | | |
Big Lots, Inc. | | | 70,000 | | | | 2,940,000 | |
Nordstrom, Inc. | | | 50,000 | | | | 774,500 | |
| | | | | | | | 3,714,500 | |
Hussman Strategic Growth Fund
Schedule of Investments (continued) |
June 30, 2020 |
COMMON STOCKS — 101.6% (continued) | | Shares | | | Value | |
Consumer Discretionary — 24.1% (continued) | | | | | | | | |
Passenger Transportation — 0.3% | | | | | | | | |
Southwest Airlines Company | | | 30,000 | | | $ | 1,025,400 | |
| | | | | | | | | |
Retail - Consumer Staples — 0.6% | | | | | | | | |
Target Corporation | | | 15,000 | | | | 1,798,950 | |
| | | | | | | | | |
Retail - Discretionary — 7.8% | | | | | | | | |
Amazon.com, Inc. (a) | | | 200 | | | | 551,764 | |
American Eagle Outfitters, Inc. | | | 100,000 | | | | 1,090,000 | |
Designer Brands, Inc. - Class A | | | 50,000 | | | | 338,500 | |
Dick’s Sporting Goods, Inc. | | | 75,000 | | | | 3,094,500 | |
eBay, Inc. | | | 30,000 | | | | 1,573,500 | |
Group 1 Automotive, Inc. | | | 35,000 | | | | 2,308,950 | |
Hibbett Sports, Inc. (a) | | | 125,000 | | | | 2,617,500 | |
Home Depot, Inc. (The) | | | 10,000 | | | | 2,505,100 | |
Kohl’s Corporation | | | 75,000 | | | | 1,557,750 | |
Sleep Number Corporation (a) | | | 60,000 | | | | 2,498,400 | |
Ulta Beauty, Inc. (a) | | | 12,500 | | | | 2,542,750 | |
Urban Outfitters, Inc. (a) | | | 25,000 | | | | 380,500 | |
Williams-Sonoma, Inc. | | | 15,000 | | | | 1,230,150 | |
Zumiez, Inc. (a) | | | 65,000 | | | | 1,779,700 | |
| | | | | | | | 24,069,064 | |
Specialty Retail — 1.1% | | | | | | | | |
Gap, Inc. (The) | | | 100,000 | | | | 1,262,000 | |
L Brands, Inc. | | | 60,000 | | | | 898,200 | |
Sally Beauty Holdings, Inc. (a) | | | 100,000 | | | | 1,253,000 | |
| | | | | | | | 3,413,200 | |
Textiles, Apparel & Luxury Goods — 0.5% | | | | | | | | |
PVH Corporation | | | 10,000 | | | | 480,500 | |
Skechers U.S.A., Inc. - Class A (a) | | | 35,000 | | | | 1,098,300 | |
| | | | | | | | 1,578,800 | |
Consumer Staples — 7.5% | | | | | | | | |
Consumer Products — 1.9% | | | | | | | | |
B&G Foods, Inc. | | | 50,000 | | | | 1,219,000 | |
Campbell Soup Company | | | 25,000 | | | | 1,240,750 | |
General Mills, Inc. | | | 10,000 | | | | 616,500 | |
Kellogg Company | | | 30,000 | | | | 1,981,800 | |
PepsiCo, Inc. | | | 5,000 | | | | 661,300 | |
| | | | | | | | 5,719,350 | |
Hussman Strategic Growth Fund
Schedule of Investments (continued) |
June 30, 2020 |
COMMON STOCKS — 101.6% (continued) | | Shares | | | Value | |
Consumer Staples — 7.5% (continued) | | | | | | | | |
Food & Staples Retailing — 3.2% | | | | | | | | |
Kroger Company (The) | | | 75,000 | | | $ | 2,538,750 | |
PriceSmart, Inc. | | | 35,000 | | | | 2,111,550 | |
Rite Aid Corporation (a) | | | 150,000 | | | | 2,559,000 | |
United Natural Foods, Inc. (a) | | | 150,000 | | | | 2,731,500 | |
| | | | | | | | 9,940,800 | |
Retail - Consumer Staples — 2.4% | | | | | | | | |
Ingles Markets, Inc. - Class A | | | 65,000 | | | | 2,799,550 | |
Sprouts Farmers Market, Inc. (a) | | | 100,000 | | | | 2,559,000 | |
Walgreens Boots Alliance, Inc. | | | 50,000 | | | | 2,119,500 | |
| | | | | | | | 7,478,050 | |
Energy — 4.9% | | | | | | | | |
Oil, Gas & Coal — 1.0% | | | | | | | | |
Cosan Ltd. - Class A | | | 75,000 | | | | 1,129,500 | |
Marathon Petroleum Corporation | | | 50,000 | | | | 1,869,000 | |
| | | | | | | | 2,998,500 | |
Renewable Energy — 3.9% | | | | | | | | |
Canadian Solar, Inc. (a) | | | 150,000 | | | | 2,890,500 | |
First Solar, Inc. (a) | | | 20,000 | | | | 990,000 | |
FuelCell Energy, Inc. (a) | | | 200,000 | | | | 452,000 | |
JinkoSolar Holding Company Ltd. - ADR (a) | | | 125,000 | | | | 2,213,750 | |
Plug Power, Inc. (a) | | | 150,000 | | | | 1,231,500 | |
SolarEdge Technologies, Inc. (a) | | | 10,000 | | | | 1,387,800 | |
SunPower Corporation (a) | | | 375,000 | | | | 2,872,500 | |
| | | | | | | | 12,038,050 | |
Financials — 4.6% | | | | | | | | |
Asset Management — 0.6% | | | | | | | | |
Federated Hermes, Inc. | | | 80,000 | | | | 1,896,000 | |
| | | | | | | | | |
Banking — 0.6% | | | | | | | | |
Fifth Third Bancorp | | | 35,000 | | | | 674,800 | |
Signature Bank | | | 10,000 | | | | 1,069,200 | |
| | | | | | | | 1,744,000 | |
Insurance — 0.5% | | | | | | | | |
Principal Financial Group, Inc. | | | 35,000 | | | | 1,453,900 | |
| | | | | | | | | |
Real Estate — 0.3% | | | | | | | | |
Sabra Health Care REIT, Inc. | | | 75,000 | | | | 1,082,250 | |
Hussman Strategic Growth Fund
Schedule of Investments (continued) |
June 30, 2020 |
COMMON STOCKS — 101.6% (continued) | | Shares | | | Value | |
Financials — 4.6% (continued) | | | | | | | | |
Specialty Finance — 2.6% | | | | | | | | |
AerCap Holdings N.V. (a) | | | 20,000 | | | $ | 616,000 | |
Air Lease Corporation | | | 10,000 | | | | 292,900 | |
American Express Company | | | 20,000 | | | | 1,904,000 | |
Discover Financial Services | | | 50,000 | | | | 2,504,500 | |
Navient Corporation | | | 75,000 | | | | 527,250 | |
Synchrony Financial | | | 100,000 | | | | 2,216,000 | |
| | | | | | | | 8,060,650 | |
Health Care — 18.2% | | | | | | | | |
Biotech & Pharma — 11.8% | | | | | | | | |
10X Genomics, Inc. - Class A (a) | | | 20,000 | | | | 1,786,200 | |
AbbVie, Inc. | | | 25,000 | | | | 2,454,500 | |
Agenus, Inc. (a) | | | 150,000 | | | | 589,500 | |
Alexion Pharmaceuticals, Inc. (a) | | | 10,000 | | | | 1,122,400 | |
ANI Pharmaceuticals, Inc. (a) | | | 35,000 | | | | 1,131,900 | |
Arena Pharmaceuticals, Inc. (a) | | | 15,000 | | | | 944,250 | |
Arrowhead Pharmaceuticals, Inc. (a) | | | 60,000 | | | | 2,591,400 | |
Biogen, Inc. (a) | | | 17,500 | | | | 4,682,125 | |
Corcept Therapeutics, Inc. (a) | | | 175,000 | | | | 2,943,500 | |
CRISPR Therapeutics AG (a) | | | 15,000 | | | | 1,102,350 | |
Editas Medicine, Inc. (a) | | | 100,000 | | | | 2,958,000 | |
Exelixis, Inc. (a) | | | 75,000 | | | | 1,780,500 | |
ImmunoGen, Inc. (a) | | | 100,000 | | | | 460,000 | |
Ionis Pharmaceuticals, Inc. (a) | | | 25,000 | | | | 1,474,000 | |
Jazz Pharmaceuticals plc (a) | | | 20,000 | | | | 2,206,800 | |
Lannett Company, Inc. (a) | | | 7,500 | | | | 54,450 | |
Mylan N.V. (a) | | | 60,000 | | | | 964,800 | |
Neurocrine Biosciences, Inc. (a) | | | 10,000 | | | | 1,220,000 | |
Organogenesis Holdings, Inc. (a) | | | 200,000 | | | | 768,000 | |
Pulmatrix, Inc. (a) | | | 200,000 | | | | 344,000 | |
Regeneron Pharmaceuticals, Inc. (a) | | | 4,000 | | | | 2,494,600 | |
Selecta Biosciences, Inc. (a) | | | 75,000 | | | | 213,000 | |
Supernus Pharmaceuticals, Inc. (a) | | | 15,000 | | | | 356,250 | |
Vaxart, Inc. (a) | | | 200,000 | | | | 1,770,000 | |
| | | | | | | | 36,412,525 | |
Hussman Strategic Growth Fund
Schedule of Investments (continued) |
June 30, 2020 |
COMMON STOCKS — 101.6% (continued) | | Shares | | | Value | |
Health Care — 18.2% (continued) | | | | | | | | |
Health Care Facilities & Services — 0.6% | | | | | | | | |
NeoGenomics, Inc. (a) | | | 20,000 | | | $ | 619,600 | |
Syneos Health, Inc. (a) | | | 20,000 | | | | 1,165,000 | |
| | | | | | | | 1,784,600 | |
Health Care Providers & Services — 3.5% | | | | | | | | |
AmerisourceBergen Corporation | | | 20,000 | | | | 2,015,400 | |
Cigna Corporation | | | 10,000 | | | | 1,876,500 | |
CVS Health Corporation | | | 50,000 | | | | 3,248,500 | |
Owens & Minor, Inc. | | | 125,000 | | | | 952,500 | |
Select Medical Holdings Corporation (a) | | | 125,000 | | | | 1,841,250 | |
Tenet Healthcare Corporation (a) | | | 50,000 | | | | 905,500 | |
| | | | | | | | 10,839,650 | |
Medical Equipment & Devices — 2.3% | | | | | | | | |
Alpha Pro Tech Ltd. (a) | | | 75,000 | | | | 1,327,500 | |
Exact Sciences Corporation (a) | | | 10,000 | | | | 869,400 | |
Inogen, Inc. (a) | | | 50,000 | | | | 1,776,000 | |
Lantheus Holdings, Inc. (a) | | | 150,000 | | | | 2,145,000 | |
Luminex Corporation | | | 35,000 | | | | 1,138,550 | |
| | | | | | | | 7,256,450 | |
Industrials — 6.3% | | | | | | | | |
Aerospace & Defense — 0.4% | | | | | | | | |
TransDigm Group, Inc. | | | 2,500 | | | | 1,105,125 | |
| | | | | | | | | |
Commercial Services & Supplies — 0.1% | | | | | | | | |
Herman Miller, Inc. | | | 20,000 | | | | 472,200 | |
| | | | | | | | | |
Electrical Equipment — 2.2% | | | | | | | | |
Allegion plc | | | 25,000 | | | | 2,555,500 | |
Atkore International Group, Inc. (a) | | | 65,000 | | | | 1,777,750 | |
Generac Holdings, Inc. (a) | | | 20,000 | | | | 2,438,600 | |
| | | | | | | | 6,771,850 | |
Engineering & Construction Services — 2.3% | | | | | | | | |
frontdoor, inc. (a) | | | 25,000 | | | | 1,108,250 | |
MasTec, Inc. (a) | | | 65,000 | | | | 2,916,550 | |
Quanta Services, Inc. | | | 75,000 | | | | 2,942,250 | |
| | | | | | | | 6,967,050 | |
Home & Office Products — 0.5% | | | | | | | | |
Fortune Brands Home & Security, Inc. | | | 25,000 | | | | 1,598,250 | |
Hussman Strategic Growth Fund
Schedule of Investments (continued) |
June 30, 2020 |
COMMON STOCKS — 101.6% (continued) | | Shares | | | Value | |
Industrials — 6.3% (continued) | | | | | | | | |
Industrial Services — 0.2% | | | | | | | | |
Fastenal Company | | | 15,000 | | | $ | 642,600 | |
| | | | | | | | | |
Machinery — 0.2% | | | | | | | | |
Proto Labs, Inc. (a) | | | 6,000 | | | | 674,820 | |
| | | | | | | | | |
Transportation & Logistics — 0.4% | | | | | | | | |
United Parcel Service, Inc. - Class B | | | 10,000 | | | | 1,111,800 | |
| | | | | | | | | |
Materials — 5.3% | | | | | | | | |
Chemicals — 0.8% | | | | | | | | |
Livent Corporation (a) | | | 100,000 | | | | 616,000 | |
Valvoline, Inc. | | | 100,000 | | | | 1,933,000 | |
| | | | | | | | 2,549,000 | |
Containers & Packaging — 0.6% | | | | | | | | |
Greif, Inc. - Class A | | | 25,000 | | | | 860,250 | |
Packaging Corporation of America | | | 10,000 | | | | 998,000 | |
| | | | | | | | 1,858,250 | |
Metals & Mining — 3.9% | | | | | | | | |
Agnico Eagle Mines Ltd. | | | 25,000 | | | | 1,601,500 | |
AngloGold Ashanti Ltd. - ADR | | | 35,000 | | | | 1,032,150 | |
Barrick Gold Corporation | | | 125,000 | | | | 3,367,500 | |
Compass Minerals International, Inc. | | | 20,000 | | | | 975,000 | |
Kinross Gold Corporation (a) | | | 100,000 | | | | 722,000 | |
Newmont Corporation | | | 55,000 | | | | 3,395,700 | |
Royal Gold, Inc. | | | 6,000 | | | | 745,920 | |
| | | | | | | | 11,839,770 | |
Technology — 22.2% | | | | | | | | |
Design, Manufacturing & Distribution — 1.5% | | | | | | | | |
Fabrinet (a) | | | 15,000 | | | | 936,300 | |
Jabil, Inc. | | | 75,000 | | | | 2,406,000 | |
SYNNEX Corporation | | | 10,000 | | | | 1,197,700 | |
| | | | | | | | 4,540,000 | |
Hardware — 5.8% | | | | | | | | |
Apple, Inc. | | | 1,000 | | | | 364,800 | |
Ciena Corporation (a) | | | 40,000 | | | | 2,166,400 | |
F5 Networks, Inc. (a) | | | 10,000 | | | | 1,394,800 | |
Infinera Corporation (a) | | | 200,000 | | | | 1,184,000 | |
Hussman Strategic Growth Fund
Schedule of Investments (continued) |
June 30, 2020 |
COMMON STOCKS — 101.6% (continued) | | Shares | | | Value | |
Technology — 22.2% (continued) | | | | | | | | |
Hardware — 5.8% (continued) | | | | | | | | |
Lumentum Holdings, Inc. (a) | | | 15,000 | | | $ | 1,221,450 | |
Maxar Technologies, Inc. | | | 150,000 | | | | 2,694,000 | |
Seagate Technology plc | | | 50,000 | | | | 2,420,500 | |
Super Micro Computer, Inc. (a) | | | 75,000 | | | | 2,129,250 | |
TTM Technologies, Inc. (a) | | | 100,000 | | | | 1,186,000 | |
Ubiquiti, Inc. | | | 17,500 | | | | 3,054,800 | |
| | | | | | | | 17,816,000 | |
Semiconductors — 5.4% | | | | | | | | |
Amkor Technology, Inc. (a) | | | 100,000 | | | | 1,231,000 | |
Applied Materials, Inc. | | | 50,000 | | | | 3,022,500 | |
Cirrus Logic, Inc. (a) | | | 20,000 | | | | 1,235,600 | |
Intel Corporation | | | 50,000 | | | | 2,991,500 | |
KLA Corporation | | | 10,000 | | | | 1,944,800 | |
Lam Research Corporation | | | 500 | | | | 161,730 | |
Photronics, Inc. (a) | | | 100,000 | | | | 1,113,000 | |
Power Integrations, Inc. | | | 20,000 | | | | 2,362,600 | |
QUALCOMM, Inc. | | | 20,000 | | | | 1,824,200 | |
Rambus, Inc. (a) | | | 65,000 | | | | 988,000 | |
| | | | | | | | 16,874,930 | |
Software — 4.5% | | | | | | | | |
Akamai Technologies, Inc. (a) | | | 25,000 | | | | 2,677,250 | |
Citrix Systems, Inc. | | | 15,000 | | | | 2,218,650 | |
GlobalSCAPE, Inc. | | | 60,000 | | | | 585,000 | |
j2 Global, Inc. (a) | | | 30,000 | | | | 1,896,300 | |
Microsoft Corporation | | | 1,000 | | | | 203,510 | |
Oracle Corporation | | | 20,000 | | | | 1,105,400 | |
Schrodinger, Inc. (a) | | | 5,000 | | | | 457,850 | |
VMware, Inc. - Class A (a) | | | 20,000 | | | | 3,097,200 | |
Xperi Holding Corporation | | | 125,000 | | | | 1,845,000 | |
| | | | | | | | 14,086,160 | |
Technology Services — 5.0% | | | | | | | | |
Cognizant Technology Solutions Corporation - Class A | | | 25,000 | | | | 1,420,500 | |
CSG Systems International, Inc. | | | 50,000 | | | | 2,069,500 | |
EVERTEC, Inc. | | | 25,000 | | | | 702,500 | |
Genpact Ltd. | | | 75,000 | | | | 2,739,000 | |
Infosys Ltd. - ADR | | | 250,000 | | | | 2,415,000 | |
International Business Machines Corporation | | | 5,000 | | | | 603,850 | |
Hussman Strategic Growth Fund
Schedule of Investments (continued) |
June 30, 2020 |
COMMON STOCKS — 101.6% (continued) | | Shares | | | Value | |
Technology — 22.2% (continued) | | | | | | | | |
Technology Services — 5.0% (continued) | | | | | | | | |
MAXIMUS, Inc. | | | 25,000 | | | $ | 1,761,250 | |
NIC, Inc. | | | 100,000 | | | | 2,296,000 | |
Sykes Enterprises, Inc. (a) | | | 50,000 | | | | 1,383,000 | |
| | | | | | | | 15,390,600 | |
Utilities — 0.7% | | | | | | | | |
Utilities — 0.7% | | | | | | | | |
Ormat Technologies, Inc. | | | 10,000 | | | | 634,900 | |
TerraForm Power, Inc. - Class A | | | 75,000 | | | | 1,383,000 | |
| | | | | | | | 2,017,900 | |
| | | | | | | | | |
Total Common Stocks (Cost $311,689,423) (b) | | | | | | $ | 313,647,074 | |
EXCHANGE-TRADED PUT OPTION CONTRACTS — 3.0% | | Contracts | | | Notional
Amount | | | Value | |
Russell 2000 Index Option, 08/21/2020 at $1,350 | | | 900 | | | $ | 129,722,850 | | | $ | 4,114,800 | |
S&P 500 Index Option, 08/21/2020 at $3,000 | | | 575 | | | | 178,266,675 | | | | 5,042,750 | |
Total Put Option Contracts (Premiums paid $14,494,001) | | | | | | $ | 307,989,525 | | | $ | 9,157,550 | |
| | | | | | | | | | | | | |
Total Investments at Value — 104.6% (Cost $326,183,424) | | | | | | | | | | $ | 322,804,624 | |
Hussman Strategic Growth Fund
Schedule of Investments (continued) |
June 30, 2020 |
MONEY MARKET FUNDS — 45.3% | | Shares | | | Value | |
Invesco Short-Term Investments Trust - Treasury Portfolio - Institutional Class, 0.08% (c) (Cost $139,965,391) | | | 139,965,391 | | | $ | 139,965,391 | |
| | | | | | | | | |
Total Investments and Money Market Funds at Value — 149.9% (Cost $466,148,815) | | | | | | $ | 462,770,015 | |
| | | | | | | | | |
Written Call Option Contracts — (51.0%) | | | | | | | (157,564,000 | ) |
| | | | | | | | | |
Other Assets in Excess of Liabilities — 1.1% | | | | | | | 3,568,086 | |
| | | | | | | | | |
Net Assets — 100.0% | | | | | | $ | 308,774,101 | |
ADR - American Depositary Receipt. |
(a) | Non-income producing security. |
(b) | Common stocks owned by the Fund are held in escrow by the Fund’s custodian (or by a securities depository) to secure the Fund’s obligations to settle outstanding call option contracts it has written (Note 1). |
(c) | The rate shown is the 7-day effective yield as of June 30, 2020. |
See accompanying notes to financial statements. |
Hussman Strategic Growth Fund
Schedule of Open Written Option Contracts |
June 30, 2020 |
EXCHANGE-TRADED WRITTEN CALL OPTION CONTRACTS | | Contracts | | | Notional
Amount | | | Strike
Price | | | Expiration
Date | | | Value of
Options | |
Call Option Contracts |
Russell 2000 Index Option | | | 900 | | | $ | 129,722,850 | | | $ | 700 | | | | 09/18/2020 | | | $ | 66,334,500 | |
S&P 500 Index Option | | | 575 | | | | 178,266,675 | | | | 1,500 | | | | 09/18/2020 | | | | 91,229,500 | |
Total Written Call Option Contracts (Premiums received $125,519,812) | | | | | | $ | 307,989,525 | | | | | | | | | | | $ | 157,564,000 | |
See accompanying notes to financial statements. |
Hussman Strategic Allocation Fund
Schedule of Investments |
June 30, 2020 |
COMMON STOCKS — 75.1% | | Shares | | | Value | |
Communications — 6.1% | | | | | | | | |
Media — 3.8% | | | | | | | | |
Alphabet, Inc. - Class C (a) | | | 20 | | | $ | 28,272 | |
Comcast Corporation - Class A | | | 1,200 | | | | 46,776 | |
Facebook, Inc. - Class A (a) | | | 100 | | | | 22,707 | |
Gray Television, Inc. (a) | | | 4,000 | | | | 55,800 | |
Shutterstock, Inc. | | | 1,000 | | | | 34,970 | |
Sirius XM Holdings, Inc. | | | 8,000 | | | | 46,960 | |
Stamps.com, Inc. (a) | | | 300 | | | | 55,107 | |
Twitter, Inc. (a) | | | 500 | | | | 14,895 | |
| | | | | | | | 305,487 | |
Telecom — 2.3% | | | | | | | | |
AT&T, Inc. | | | 3,000 | | | | 90,690 | |
CenturyLink, Inc. | | | 2,000 | | | | 20,060 | |
Switch, Inc. - Class A | | | 2,000 | | | | 35,640 | |
Verizon Communications, Inc. | | | 750 | | | | 41,348 | |
| | | | | | | | 187,738 | |
Consumer Discretionary — 17.4% | | | | | | | | |
Apparel & Textile Products — 0.1% | | | | | | | | |
Hanesbrands, Inc. | | | 1,000 | | | | 11,290 | |
| | | | | | | | | |
Automotive — 0.7% | | | | | | | | |
Gentex Corporation | | | 1,000 | | | | 25,770 | |
Methode Electronics, Inc. | | | 1,000 | | | | 31,260 | |
| | | | | | | | 57,030 | |
Commercial Services — 0.8% | | | | | | | | |
Cimpress plc (a) | | | 800 | | | | 61,072 | |
| | | | | | | | | |
Consumer Services — 1.0% | | | | | | | | |
2U, Inc. (a) | | | 1,500 | | | | 56,940 | |
WW International, Inc. (a) | | | 1,000 | | | | 25,380 | |
| | | | | | | | 82,320 | |
Distributors — 0.3% | | | | | | | | |
LKQ Corporation (a) | | | 1,000 | | | | 26,200 | |
| | | | | | | | | |
Gaming, Lodging & Restaurants — 1.9% | | | | | | | | |
Brinker International, Inc. | | | 1,500 | | | | 36,000 | |
Dunkin’ Brands Group, Inc. | | | 500 | | | | 32,615 | |
Starbucks Corporation | | | 750 | | | | 55,192 | |
Hussman Strategic Allocation Fund
Schedule of Investments (continued) |
June 30, 2020 |
COMMON STOCKS — 75.1% (continued) | | Shares | | | Value | |
Consumer Discretionary — 17.4% (continued) | | | | | | | | |
Gaming, Lodging & Restaurants — 1.9% (continued) | | | | | | | | |
Waitr Holdings, Inc. (a) | | | 10,000 | | | $ | 26,300 | |
| | | | | | | | 150,107 | |
Home & Office Products — 1.0% | | | | | | | | |
ACCO Brands Corporation | | | 2,000 | | | | 14,200 | |
Century Communities, Inc. (a) | | | 2,250 | | | | 68,985 | |
| | | | | | | | 83,185 | |
Hotels, Restaurants & Leisure — 0.6% | | | | | | | | |
Bloomin’ Brands, Inc. | | | 3,000 | | | | 31,980 | |
Ruth’s Hospitality Group, Inc. | | | 2,000 | | | | 16,320 | |
| | | | | | | | 48,300 | |
Household Durables — 0.9% | | | | | | | | |
LGI Homes, Inc. (a) | | | 350 | | | | 30,811 | |
Turtle Beach Corporation (a) | | | 3,000 | | | | 44,160 | |
| | | | | | | | 74,971 | |
Multiline Retail — 1.3% | | | | | | | | |
Big Lots, Inc. | | | 2,000 | | | | 84,000 | |
Nordstrom, Inc. | | | 1,500 | | | | 23,235 | |
| | | | | | | | 107,235 | |
Passenger Transportation — 0.3% | | | | | | | | |
Southwest Airlines Company | | | 750 | | | | 25,635 | |
| | | | | | | | | |
Retail - Consumer Staples — 0.7% | | | | | | | | |
Target Corporation | | | 500 | | | | 59,965 | |
| | | | | | | | | |
Retail - Discretionary — 6.5% | | | | | | | | |
Amazon.com, Inc. (a) | | | 10 | | | | 27,588 | |
Dick’s Sporting Goods, Inc. | | | 2,000 | | | | 82,520 | |
eBay, Inc. | | | 750 | | | | 39,338 | |
Group 1 Automotive, Inc. | | | 750 | | | | 49,478 | |
Hibbett Sports, Inc. (a) | | | 2,500 | | | | 52,350 | |
Home Depot, Inc. (The) | | | 250 | | | | 62,627 | |
Kohl’s Corporation | | | 1,000 | | | | 20,770 | |
Sleep Number Corporation (a) | | | 1,250 | | | | 52,050 | |
Ulta Beauty, Inc. (a) | | | 300 | | | | 61,026 | |
Williams-Sonoma, Inc. | | | 400 | | | | 32,804 | |
Zumiez, Inc. (a) | | | 1,500 | | | | 41,070 | |
| | | | | | | | 521,621 | |
Hussman Strategic Allocation Fund
Schedule of Investments (continued) |
June 30, 2020 |
COMMON STOCKS — 75.1% (continued) | | Shares | | | Value | |
Consumer Discretionary — 17.4% (continued) | | | | | | | | |
Specialty Retail — 1.1% | | | | | | | | |
Gap, Inc. (The) | | | 2,000 | | | $ | 25,240 | |
L Brands, Inc. | | | 1,500 | | | | 22,455 | |
Sally Beauty Holdings, Inc. (a) | | | 3,000 | | | | 37,590 | |
| | | | | | | | 85,285 | |
Textiles, Apparel & Luxury Goods — 0.2% | | | | | | | | |
PVH Corporation | | | 300 | | | | 14,415 | |
| | | | | | | | | |
Consumer Staples — 8.4% | | | | | | | | |
Consumer Products — 2.6% | | | | | | | | |
B&G Foods, Inc. | | | 1,500 | | | | 36,570 | |
Campbell Soup Company | | | 1,000 | | | | 49,630 | |
General Mills, Inc. | | | 500 | | | | 30,825 | |
Kellogg Company | | | 750 | | | | 49,545 | |
PepsiCo, Inc. | | | 300 | | | | 39,678 | |
| | | | | | | | 206,248 | |
Food & Staples Retailing — 3.4% | | | | | | | | |
Kroger Company (The) | | | 2,000 | | | | 67,700 | |
Natural Grocers by Vitamin Cottage, Inc. | | | 500 | | | | 7,440 | |
PriceSmart, Inc. | | | 1,000 | | | | 60,330 | |
Rite Aid Corporation (a) | | | 4,000 | | | | 68,240 | |
United Natural Foods, Inc. (a) | | | 4,000 | | | | 72,840 | |
| | | | | | | | 276,550 | |
Retail - Consumer Staples — 2.4% | | | | | | | | |
Ingles Markets, Inc. - Class A | | | 1,650 | | | | 71,066 | |
Sprouts Farmers Market, Inc. (a) | | | 2,750 | | | | 70,372 | |
Walgreens Boots Alliance, Inc. | | | 1,250 | | | | 52,987 | |
| | | | | | | | 194,425 | |
Energy — 2.3% | | | | | | | | |
Renewable Energy — 2.3% | | | | | | | | |
Canadian Solar, Inc. (a) | | | 3,600 | | | | 69,372 | |
First Solar, Inc. (a) | | | 400 | | | | 19,800 | |
JinkoSolar Holding Company Ltd. - ADR (a) | | | 3,000 | | | | 53,130 | |
SolarEdge Technologies, Inc. (a) | | | 150 | | | | 20,817 | |
SunPower Corporation (a) | | | 3,500 | | | | 26,810 | |
| | | | | | | | 189,929 | |
Hussman Strategic Allocation Fund
Schedule of Investments (continued) |
June 30, 2020 |
COMMON STOCKS — 75.1% (continued) | | Shares | | | Value | |
Financials — 3.1% | | | | | | | | |
Asset Management — 0.5% | | | | | | | | |
Federated Hermes, Inc. | | | 1,750 | | | $ | 41,475 | |
| | | | | | | | | |
Banking — 0.2% | | | | | | | | |
Fifth Third Bancorp | | | 1,000 | | | | 19,280 | |
| | | | | | | | | |
Insurance — 0.5% | | | | | | | | |
Principal Financial Group, Inc. | | | 1,000 | | | | 41,540 | |
| | | | | | | | | |
Specialty Finance — 1.9% | | | | | | | | |
American Express Company | | | 500 | | | | 47,600 | |
Discover Financial Services | | | 1,150 | | | | 57,604 | |
Synchrony Financial | | | 2,000 | | | | 44,320 | |
| | | | | | | | 149,524 | |
Health Care — 12.3% | | | | | | | | |
Biotech & Pharma — 8.5% | | | | | | | | |
10X Genomics, Inc. - Class A (a) | | | 600 | | | | 53,586 | |
AbbVie, Inc. | | | 500 | | | | 49,090 | |
Alexion Pharmaceuticals, Inc. (a) | | | 300 | | | | 33,672 | |
ANI Pharmaceuticals, Inc. (a) | | | 500 | | | | 16,170 | |
Arena Pharmaceuticals, Inc. (a) | | | 400 | | | | 25,180 | |
Arrowhead Pharmaceuticals, Inc. (a) | | | 1,500 | | | | 64,785 | |
Biogen, Inc. (a) | | | 450 | | | | 120,398 | |
Corcept Therapeutics, Inc. (a) | | | 5,000 | | | | 84,100 | |
CRISPR Therapeutics AG (a) | | | 350 | | | | 25,721 | |
Editas Medicine, Inc. (a) | | | 2,000 | | | | 59,160 | |
Exelixis, Inc. (a) | | | 1,500 | | | | 35,610 | |
Jazz Pharmaceuticals plc (a) | | | 250 | | | | 27,585 | |
Mylan N.V. (a) | | | 2,000 | | | | 32,160 | |
Regeneron Pharmaceuticals, Inc. (a) | | | 100 | | | | 62,365 | |
| | | | | | | | 689,582 | |
Health Care Providers & Services — 3.0% | | | | | | | | |
AmerisourceBergen Corporation | | | 500 | | | | 50,385 | |
Cigna Corporation | | | 300 | | | | 56,295 | |
CVS Health Corporation | | | 850 | | | | 55,224 | |
Select Medical Holdings Corporation (a) | | | 3,500 | | | | 51,555 | |
Tenet Healthcare Corporation (a) | | | 1,500 | | | | 27,165 | |
| | | | | | | | 240,624 | |
Hussman Strategic Allocation Fund
Schedule of Investments (continued) |
June 30, 2020 |
COMMON STOCKS — 75.1% (continued) | | Shares | | | Value | |
Health Care — 12.3% (continued) | | | | | | | | |
Medical Equipment & Devices — 0.8% | | | | | | | | |
Inogen, Inc. (a) | | | 650 | | | $ | 23,088 | |
Lantheus Holdings, Inc. (a) | | | 3,000 | | | | 42,900 | |
| | | | | | | | 65,988 | |
Industrials — 2.8% | | | | | | | | |
Electrical Equipment — 1.9% | | | | | | | | |
Allegion plc | | | 400 | | | | 40,888 | |
Atkore International Group, Inc. (a) | | | 2,000 | | | | 54,700 | |
Generac Holdings, Inc. (a) | | | 500 | | | | 60,965 | |
| | | | | | | | 156,553 | |
Engineering & Construction Services — 0.5% | | | | | | | | |
Quanta Services, Inc. | | | 1,000 | | | | 39,230 | |
| | | | | | | | | |
Industrial Services — 0.2% | | | | | | | | |
Fastenal Company | | | 300 | | | | 12,852 | |
| | | | | | | | | |
Machinery — 0.2% | | | | | | | | |
Proto Labs, Inc. (a) | | | 150 | | | | 16,871 | |
| | | | | | | | | |
Materials — 3.8% | | | | | | | | |
Chemicals — 0.8% | | | | | | | | |
Livent Corporation (a) | | | 3,000 | | | | 18,480 | |
Valvoline, Inc. | | | 2,500 | | | | 48,325 | |
| | | | | | | | 66,805 | |
Containers & Packaging — 0.2% | | | | | | | | |
Greif, Inc. - Class A | | | 500 | | | | 17,205 | |
| | | | | | | | | |
Metals & Mining — 2.8% | | | | | | | | |
Agnico Eagle Mines Ltd. | | | 600 | | | | 38,436 | |
AngloGold Ashanti Ltd. - ADR | | | 750 | | | | 22,117 | |
Barrick Gold Corporation | | | 2,500 | | | | 67,350 | |
Kinross Gold Corporation (a) | | | 1,750 | | | | 12,635 | |
Newmont Corporation | | | 1,000 | | | | 61,740 | |
Royal Gold, Inc. | | | 175 | | | | 21,756 | |
| | | | | | | | 224,034 | |
Technology — 18.9% | | | | | | | | |
Design, Manufacturing & Distribution — 0.8% | | | | | | | | |
Jabil, Inc. | | | 2,000 | | | | 64,160 | |
Hussman Strategic Allocation Fund
Schedule of Investments (continued) |
June 30, 2020 |
COMMON STOCKS — 75.1% (continued) | | Shares | | | Value | |
Technology — 18.9% (continued) | | | | | | | | |
Hardware — 4.7% | | | | | | | | |
Apple, Inc. | | | 100 | | | $ | 36,480 | |
Ciena Corporation (a) | | | 1,500 | | | | 81,240 | |
Maxar Technologies, Inc. | | | 2,600 | | | | 46,696 | |
Seagate Technology plc | | | 1,400 | | | | 67,774 | |
Super Micro Computer, Inc. (a) | | | 1,250 | | | | 35,488 | |
TTM Technologies, Inc. (a) | | | 2,000 | | | | 23,720 | |
Ubiquiti, Inc. | | | 500 | | | | 87,280 | |
| | | | | | | | 378,678 | |
Semiconductors — 5.1% | | | | | | | | |
Applied Materials, Inc. | | | 1,000 | | | | 60,450 | |
Cirrus Logic, Inc. (a) | | | 750 | | | | 46,335 | |
Impinj, Inc. (a) | | | 1,000 | | | | 27,470 | |
Intel Corporation | | | 1,250 | | | | 74,787 | |
KLA Corporation | | | 350 | | | | 68,068 | |
Power Integrations, Inc. | | | 600 | | | | 70,878 | |
QUALCOMM, Inc. | | | 500 | | | | 45,605 | |
Rambus, Inc. (a) | | | 1,000 | | | | 15,200 | |
| | | | | | | | 408,793 | |
Software — 4.8% | | | | | | | | |
Akamai Technologies, Inc. (a) | | | 750 | | | | 80,318 | |
Citrix Systems, Inc. | | | 350 | | | | 51,768 | |
GlobalSCAPE, Inc. | | | 2,000 | | | | 19,500 | |
j2 Global, Inc. (a) | | | 1,000 | | | | 63,210 | |
Microsoft Corporation | | | 100 | | | | 20,351 | |
Oracle Corporation | | | 1,000 | | | | 55,270 | |
VMware, Inc. - Class A (a) | | | 400 | | | | 61,944 | |
Xperi Corporation | | | 2,500 | | | | 36,900 | |
| | | | | | | | 389,261 | |
Technology Services — 3.5% | | | | | | | | |
Cognizant Technology Solutions Corporation - Class A | | | 1,000 | | | | 56,820 | |
CSG Systems International, Inc. | | | 1,000 | | | | 41,390 | |
Genpact Ltd. | | | 1,650 | | | | 60,258 | |
Infosys Ltd. - ADR | | | 6,000 | | | | 57,960 | |
International Business Machines Corporation | | | 100 | | | | 12,077 | |
NIC, Inc. | | | 2,500 | | | | 57,400 | |
| | | | | | | | 285,905 | |
| | | | | | | | | |
Total Common Stocks (Cost $5,985,688) (b) | | | | | | $ | 6,077,368 | |
Hussman Strategic Allocation Fund
Schedule of Investments (continued) |
June 30, 2020 |
U.S. TREASURY OBLIGATIONS — 24.9% | | Par Value | | | Value | |
U.S. Treasury Bills (c) — 12.4% | | | | | | | | |
1.69%, due 08/13/2020 | | $ | 1,000,000 | | | $ | 999,839 | |
| | | | | | | | | |
U.S. Treasury Notes — 12.5% | | | | | | | | |
1.50%, due 08/31/2021 | | | 1,000,000 | | | | 1,015,274 | |
| | | | | | | | | |
Total U.S. Treasury Obligations (Cost $1,997,953) | | | | | | $ | 2,015,113 | |
EXCHANGE-TRADED PUT OPTION CONTRACTS — 0.4% | | Contracts | | | Notional
Amount | | | Value | |
Russell 2000 Index Option, 09/18/2020 at $1,100 | | | 14 | | | $ | 2,017,911 | | | $ | 23,422 | |
S&P 500 Index Option, 09/18/2020 at $1,800 | | | 10 | | | | 3,100,290 | | | | 4,600 | |
Total Put Option Contracts (Premiums paid $120,796) | | | | | | $ | 5,118,201 | | | $ | 28,022 | |
| | | | | | | | | | | | | |
Total Investments at Value — 100.4% (Cost $8,104,437) | | | | | | | | | | $ | 8,120,503 | |
MONEY MARKET FUNDS — 20.5% | | Shares | | | Value | |
Invesco Short-Term Investments Trust - Treasury Portfolio - Institutional Class, 0.08% (d) (Cost $1,662,185) | | | 1,662,185 | | | $ | 1,662,185 | |
| | | | | | | | | |
Total Investments and Money Market Funds at Value — 120.9% (Cost $9,766,622) | | | | | | $ | 9,782,688 | |
| | | | | | | | | |
Written Call Option Contracts — (22.0%) | | | | | | | (1,782,344 | ) |
| | | | | | | | | |
Other Assets in Excess of Liabilities — 1.1% | | | | | | | 92,715 | |
| | | | | | | | | |
Net Assets — 100.0% | | | | | | $ | 8,093,059 | |
ADR - American Depositary Receipt. |
(a) | Non-income producing security. |
(b) | Common stocks owned by the Fund are held in escrow by the Fund’s custodian (or by a securities depository) to secure the Fund’s obligations to settle outstanding call option contracts it has written (Note 1). |
(c) | Rate shown is the annualized yield at time of purchase, not a coupon rate. |
(d) | The rate shown is the 7-day effective yield as of June 30, 2020. |
See accompanying notes to financial statements. |
Hussman Strategic Allocation Fund
Schedule of Open Written Option Contracts |
June 30, 2020 |
EXCHANGE-TRADED WRITTEN CALL OPTION CONTRACTS | | Contracts | | | Notional
Amount | | | Strike
Price | | | Expiration
Date | | | Value of
Options | |
Call Option Contracts |
Russell 2000 Index Option | | | 14 | | | $ | 2,017,911 | | | $ | 1,100 | | | | 09/18/2020 | | | $ | 493,444 | |
S&P 500 Index Option | | | 10 | | | | 3,100,290 | | | | 1,800 | | | | 09/18/2020 | | | | 1,288,900 | |
Total Written Call Option Contracts (Premiums received $1,337,857) | | | | | | $ | 5,118,201 | | | | | | | | | | | $ | 1,782,344 | |
See accompanying notes to financial statements. |
Hussman Strategic Total Return Fund
Schedule of Investments |
June 30, 2020 |
COMMON STOCKS — 21.8% | | Shares | | | Value | |
Energy — 1.3% | | | | | | | | |
Oil, Gas & Coal — 1.3% | | | | | | | | |
Cheniere Energy Partners, L.P. | | | 20,000 | | | $ | 699,600 | |
CNX Midstream Partners, L.P. | | | 60,000 | | | | 399,000 | |
Halliburton Company | | | 35,000 | | | | 454,300 | |
Helmerich & Payne, Inc. | | | 25,000 | | | | 487,750 | |
NuStar Energy, L.P. | | | 31,000 | | | | 442,680 | |
ONEOK, Inc. | | | 985 | | | | 32,722 | |
PBF Energy, Inc. - Class A | | | 35,000 | | | | 358,400 | |
Valero Energy Corporation | | | 15,000 | | | | 882,300 | |
Williams Companies, Inc. (The) | | | 1,293 | | | | 24,593 | |
| | | | | | | | 3,781,345 | |
Renewable Energy — 0.0% (a) | | | | | | | | |
Envision Solar International, Inc. (b) | | | 2,500 | | | | 24,925 | |
| | | | | | | | | |
Materials — 15.0% | | | | | | | | |
Construction Materials — 0.3% | | | | | | | | |
MDU Resources Group, Inc. | | | 35,000 | | | | 776,300 | |
| | | | | | | | | |
Metals & Mining — 14.7% | | | | | | | | |
Agnico Eagle Mines Ltd. | | | 60,000 | | | | 3,843,600 | |
Alamos Gold, Inc. - Class A | | | 100,000 | | | | 938,000 | |
AngloGold Ashanti Ltd. - ADR | | | 90,000 | | | | 2,654,100 | |
B2Gold Corporation | | | 250,000 | | | | 1,422,500 | |
Barrick Gold Corporation | | | 425,000 | | | | 11,449,500 | |
Coeur Mining, Inc. (b) | | | 25,000 | | | | 127,000 | |
Compania de Minas Buenaventura S.A.A. - ADR | | | 100,000 | | | | 914,000 | |
Kinross Gold Corporation (b) | | | 300,000 | | | | 2,166,000 | |
Newmont Corporation | | | 190,000 | | | | 11,730,600 | |
Novagold Resources, Inc. (b) | | | 50,000 | | | | 459,000 | |
Pan American Silver Corporation | | | 50,000 | | | | 1,519,500 | |
Royal Gold, Inc. | | | 17,500 | | | | 2,175,600 | |
Wheaton Precious Metals Corporation | | | 50,000 | | | | 2,202,500 | |
Yamana Gold, Inc. | | | 200,000 | | | | 1,092,000 | |
| | | | | | | | 42,693,900 | |
Hussman Strategic Total Return Fund
Schedule of Investments (continued) |
June 30, 2020 |
COMMON STOCKS — 21.8% (continued) | | Shares | | | Value | |
Utilities — 5.5% | | | | | | | | |
Utilities — 5.5% | | | | | | | | |
AES Corporation (The) | | | 75,000 | | | $ | 1,086,750 | |
ALLETE, Inc. | | | 15,000 | | | | 819,150 | |
Ameren Corporation | | | 500 | | | | 35,180 | |
American Electric Power Company, Inc. | | | 5,000 | | | | 398,200 | |
Avangrid, Inc. | | | 20,000 | | | | 839,600 | |
Avista Corporation | | | 10,000 | | | | 363,900 | |
Black Hills Corporation | | | 10,000 | | | | 566,600 | |
Consolidated Edison, Inc. | | | 10,000 | | | | 719,300 | |
Dominion Energy, Inc. | | | 5,000 | | | | 405,900 | |
DTE Energy Company | | | 2,000 | | | | 215,000 | |
Duke Energy Corporation | | | 7,500 | | | | 599,175 | |
Edison International | | | 10,000 | | | | 543,100 | |
Entergy Corporation | | | 500 | | | | 46,905 | |
Exelon Corporation | | | 30,000 | | | | 1,088,700 | |
FirstEnergy Corporation | | | 15,000 | | | | 581,700 | |
Global Water Resources, Inc. (b) | | | 1,000 | | | | 10,540 | |
Hawaiian Electric Industries, Inc. | | | 10,000 | | | | 360,600 | |
NextEra Energy, Inc. | | | 250 | | | | 60,042 | |
NorthWestern Corporation | | | 10,000 | | | | 545,200 | |
NRG Energy, Inc. | | | 20,000 | | | | 651,200 | |
Ormat Technologies, Inc. | | | 10,000 | | | | 634,900 | |
Otter Tail Corporation | | | 10,000 | | | | 387,900 | |
Pinnacle West Capital Corporation | | | 5,000 | | | | 366,450 | |
Portland General Electric Company | | | 20,000 | | | | 836,200 | |
PPL Corporation | | | 35,000 | | | | 904,400 | |
Public Service Enterprise Group, Inc. | | | 10,000 | | | | 491,600 | |
Southern Company (The) | | | 20,000 | | | | 1,037,000 | |
Spark Energy, Inc. - Class A | | | 2,500 | | | | 17,675 | |
TerraForm Power, Inc. - Class A | | | 25,000 | | | | 461,000 | |
UGI Corporation | | | 25,000 | | | | 795,000 | |
| | | | | | | | 15,868,867 | |
| | | | | | | | | |
Total Common Stocks (Cost $58,347,050) | | | | | | $ | 63,145,337 | |
Hussman Strategic Total Return Fund
Schedule of Investments (continued) |
June 30, 2020 |
U.S. TREASURY OBLIGATIONS — 70.1% | | Par Value | | | Value | |
U.S. Treasury Bills (c) — 17.2% | | | | | | | | |
0.37%, due 08/25/2020 | | $ | 50,000,000 | | | $ | 49,990,069 | |
| | | | | | | | | |
U.S. Treasury Inflation-Protected Notes — 9.0% | | | | | | | | |
2.50%, due 01/15/2029 | | | 11,944,400 | | | | 15,314,967 | |
0.125%, due 01/15/2030 | | | 9,967,500 | | | | 10,773,037 | |
| | | | | | | | 26,088,004 | |
U.S. Treasury Notes — 43.9% | | | | | | | | |
1.75%, due 06/15/2022 | | | 10,000,000 | | | | 10,310,937 | |
1.50%, due 08/15/2022 | | | 25,000,000 | | | | 25,710,938 | |
2.00%, due 05/31/2024 | | | 25,000,000 | | | | 26,738,769 | |
1.375%, due 01/31/2025 | | | 15,000,000 | | | | 15,762,305 | |
2.125%, due 05/31/2026 | | | 10,000,000 | | | | 11,014,063 | |
1.50%, due 08/15/2026 | | | 25,000,000 | | | | 26,638,683 | |
2.25%, due 11/15/2027 | | | 10,000,000 | | | | 11,264,648 | |
| | | | | | | | 127,440,343 | |
| | | | | | | | | |
Total U.S. Treasury Obligations (Cost $191,150,436) | | | | | | $ | 203,518,416 | |
EXCHANGE-TRADED FUNDS — 3.2% | | Shares | | | Value | |
Invesco CurrencyShares British Pound Sterling Trust (b) | | | 20,000 | | | $ | 2,399,600 | |
Invesco CurrencyShares Euro Currency Trust (b) | | | 20,000 | | | | 2,119,800 | |
Invesco CurrencyShares Japanese Yen Trust (b) | | | 1,000 | | | | 87,710 | |
Invesco CurrencyShares Swiss Franc Trust (b) | | | 5,000 | | | | 483,818 | |
iShares Gold Trust (b) | | | 125,000 | | | | 2,123,750 | |
SPDR Gold Shares (b) | | | 12,500 | | | | 2,092,125 | |
Total Exchange-Traded Funds (Cost $8,808,016) | | | | | | $ | 9,306,803 | |
| | | | | | | | | |
Total Investments at Value — 95.1% (Cost $258,305,502) | | | | | | $ | 275,970,556 | |
Hussman Strategic Total Return Fund
Schedule of Investments (continued) |
June 30, 2020 |
MONEY MARKET FUNDS — 10.0% | | Shares | | | Value | |
Invesco Short-Term Investments Trust - Treasury Portfolio - Institutional Class, 0.08% (d) (Cost $29,107,618) | | | 29,107,618 | | | $ | 29,107,618 | |
| | | | | | | | | |
Total Investments and Money Market Funds at Value — 105.1% (Cost $287,413,120) | | | | | | $ | 305,078,174 | |
| | | | | | | | | |
Liabilities in Excess of Other Assets — (5.1%) | | | | | | | (14,948,987 | ) |
| | | | | | | | | |
Net Assets — 100.0% | | | | | | $ | 290,129,187 | |
ADR - American Depositary Receipt. |
(a) | Percentage rounds to less than 0.1%. |
(b) | Non-income producing security. |
(c) | Rate shown is the annualized yield at time of purchase, not a coupon rate. |
(d) | The rate shown is the 7-day effective yield as of June 30, 2020. |
See accompanying notes to financial statements. |
Hussman Strategic International Fund
Schedule of Investments |
June 30, 2020 |
COMMON STOCKS — 80.5% | | Shares | | | Value | |
Australia — 0.6% | | | | | | | | |
Coca-Cola Amatil Ltd. (a) | | | 16,000 | | | $ | 96,380 | |
| | | | | | | | | |
Austria — 1.7% | | | | | | | | |
ams AG (b) | | | 9,000 | | | | 133,508 | |
EVN AG (a) | | | 7,026 | | | | 118,772 | |
| | | | | | | | 252,280 | |
Belgium — 0.5% | | | | | | | | |
Melexis N.V. (a) (b) | | | 1,000 | | | | 76,083 | |
| | | | | | | | | |
Canada — 4.2% | | | | | | | | |
Canadian Utilities Ltd. - Class A | | | 3,000 | | | | 74,692 | |
Dollarama, Inc. | | | 6,000 | | | | 199,591 | |
iA Financial Corporation, Inc. | | | 2,500 | | | | 83,715 | |
IGM Financial, Inc. | | | 5,500 | | | | 133,653 | |
Sun Life Financial, Inc. | | | 3,800 | | | | 139,647 | |
| | | | | | | | 631,298 | |
Denmark — 1.6% | | | | | | | | |
Novo Nordisk A/S - Class B (a) | | | 2,700 | | | | 175,880 | |
Vestas Wind Systems A/S (a) | | | 600 | | | | 61,435 | |
| | | | | | | | 237,315 | |
Finland — 0.7% | | | | | | | | |
Stora Enso OYJ - R Shares (a) | | | 9,000 | | | | 107,745 | |
| | | | | | | | | |
France — 5.5% | | | | | | | | |
Albioma S.A. (a) | | | 3,000 | | | | 124,038 | |
Alten S.A. (a) (b) | | | 1,800 | | | | 155,564 | |
Atos SE (a) (b) | | | 1,500 | | | | 128,625 | |
Iliad S.A. (a) | | | 600 | | | | 117,149 | |
Ingenico Group S.A. (a) | | | 500 | | | | 80,353 | |
Legrand S.A. (a) | | | 900 | | | | 68,398 | |
Sanofi (a) | | | 1,400 | | | | 142,807 | |
Television Francaise 1 S.A. (a) (b) | | | 1,000 | | | | 5,427 | |
| | | | | | | | 822,361 | |
Germany — 8.7% | | | | | | | | |
Bayer AG (a) | | | 1,800 | | | | 133,449 | |
Dermapharm Holding SE (a) | | | 2,000 | | | | 99,326 | |
Deutsche Post AG (a) | | | 5,000 | | | | 183,636 | |
Dialog Semiconductor plc (a) (b) | | | 4,500 | | | | 205,729 | |
Hussman Strategic International Fund
Schedule of Investments (continued) |
June 30, 2020 |
COMMON STOCKS — 80.5% (continued) | | Shares | | | Value | |
Germany — 8.7% (continued) | | | | | | | | |
Fresenius Medical Care AG & Company KGaA (a) | | | 2,000 | | | $ | 172,094 | |
Hornbach Holding AG & Company KGaA (a) | | | 2,250 | | | | 186,583 | |
Siltronic AG (a) | | | 2,200 | | | | 225,641 | |
United Internet AG (a) | | | 2,500 | | | | 106,238 | |
| | | | | | | | 1,312,696 | |
Ireland — 0.6% | | | | | | | | |
C&C Group plc (a) | | | 30,000 | | | | 85,515 | |
| | | | | | | | | |
Italy — 2.9% | | | | | | | | |
ACEA SpA (a) | | | 8,500 | | | | 163,468 | |
Azimut Holdings SpA (a) | | | 6,500 | | | | 111,585 | |
Moncler S.p.A. (a) (b) | | | 4,000 | | | | 153,845 | |
| | | | | | | | 428,898 | |
Japan — 22.0% | | | | | | | | |
Advantest Corporation (a) | | | 3,000 | | | | 171,208 | |
Astellas Pharma, Inc. (a) | | | 8,000 | | | | 133,594 | |
C.I. Takiron Corporation (a) | | | 11,100 | | | | 72,258 | |
IBJ, Inc. (a) | | | 9,000 | | | | 62,450 | |
ITOCHU Corporation (a) | | | 4,000 | | | | 86,550 | |
Kakaku.com, Inc. (a) | | | 4,800 | | | | 122,274 | |
Kanagawa Chuo Kotsu Company Ltd. (a) | | | 5,000 | | | | 190,952 | |
M&A Capital Partners Company Ltd. (a) (b) | | | 5,000 | | | | 185,859 | |
Marvelous, Inc. (a) | | | 25,000 | | | | 162,885 | |
Meidensha Corporation (a) | | | 4,000 | | | | 65,029 | |
Nihon Chouzai Company Ltd. (a) | | | 8,000 | | | | 118,323 | |
Nippon Telegraph and Telephone Corporation (a) | | | 5,000 | | | | 116,495 | |
Optorun Company Ltd. (a) | | | 5,000 | | | | 117,189 | |
Panasonic Corporation (a) (b) | | | 13,000 | | | | 113,996 | |
RAIZNEXT Corporation (a) | | | 15,000 | | | | 169,521 | |
RS Technologies Company Ltd. (a) | | | 2,000 | | | | 64,531 | |
Sawai Pharmaceutical Company Ltd. (a) | | | 3,000 | | | | 154,192 | |
SCSK Corporation (a) | | | 2,500 | | | | 122,310 | |
Square Enix Holdings Company Ltd. | | | 2,300 | | | | 116,525 | |
Sugi Holdings Company Ltd. (a) | | | 2,500 | | | | 169,532 | |
SUMCO Corporation (a) | | | 8,500 | | | | 130,678 | |
Sundrug Company Ltd. (a) | | | 4,000 | | | | 132,380 | |
TDK Corporation (a) | | | 1,200 | | | | 119,459 | |
Tokyo Seimitsu Company Ltd. (a) | | | 3,300 | | | | 105,853 | |
Hussman Strategic International Fund
Schedule of Investments (continued) |
June 30, 2020 |
COMMON STOCKS — 80.5% (continued) | | Shares | | | Value | |
Japan — 22.0% (continued) | | | | | | | | |
Torii Pharmaceutical Company Ltd. (a) | | | 3,500 | | | $ | 100,577 | |
Toyota Motor Corporation (a) | | | 3,000 | | | | 188,649 | |
| | | | | | | | 3,293,269 | |
Netherlands — 3.8% | | | | | | | | |
Aalberts N.V. (a) | | | 2,500 | | | | 81,993 | |
Cementir Holding N.V. (a) | | | 14,662 | | | | 104,714 | |
Euronext N.V. (a) | | | 1,000 | | | | 100,674 | |
Koninklijke Ahold Delhaize N.V. (a) | | | 6,000 | | | | 163,557 | |
STMicroelectronics N.V. (a) | | | 4,500 | | | | 122,958 | |
| | | | | | | | 573,896 | |
Norway — 2.3% | | | | | | | | |
Borregaard ASA (a) | | | 16,800 | | | | 179,110 | |
Entra ASA (a) | | | 6,600 | | | | 84,612 | |
Norway Royal Salmon ASA (a) | | | 3,032 | | | | 79,463 | |
| | | | | | | | 343,185 | |
Spain — 2.9% | | | | | | | | |
EDP Renovàveis S.A. | | | 5,000 | | | | 69,109 | |
Faes Farma S.A. (a) | | | 35,000 | | | | 142,729 | |
Grifols S.A. (a) (b) | | | 4,000 | | | | 121,656 | |
Industria de Diseno Textil S.A. (a) | | | 4,000 | | | | 106,155 | |
| | | | | | | | 439,649 | |
Sweden — 6.8% | | | | | | | | |
Clas Ohlson AB - B Shares (a) | | | 10,000 | | | | 112,058 | |
Hennes & Mauritz AB - B Shares (a) | | | 6,000 | | | | 87,565 | |
Hexpol AB (a) (b) | | | 15,000 | | | | 111,912 | |
ICA Gruppen AB (a) | | | 4,000 | | | | 190,110 | |
Mycronic AB (a) | | | 11,250 | | | | 213,254 | |
SKF AB - B Shares (a) | | | 10,500 | | | | 196,252 | |
Swedish Orphan Biovitrum AB (a) (b) | | | 4,500 | | | | 104,324 | |
| | | | | | | | 1,015,475 | |
Switzerland — 5.2% | | | | | | | | |
Geberit AG (a) | | | 300 | | | | 150,518 | |
Novartis AG (a) | | | 2,000 | | | | 174,238 | |
Roche Holdings AG (a) | | | 500 | | | | 173,221 | |
Sonova Holding AG (a) (b) | | | 758 | | | | 151,630 | |
Swisscom AG (a) | | | 250 | | | | 131,097 | |
| | | | | | | | 780,704 | |
Hussman Strategic International Fund
Schedule of Investments (continued) |
June 30, 2020 |
COMMON STOCKS — 80.5% (continued) | | Shares | | | Value | |
United Kingdom — 10.5% | | | | | | | | |
Ashtead Group plc (a) | | | 5,600 | | | $ | 188,902 | |
Domino’s Pizza Group plc (a) | | | 30,000 | | | | 115,151 | |
Dunelm Group plc (a) | | | 6,000 | | | | 88,393 | |
GlaxoSmithKline plc (a) | | | 9,100 | | | | 183,814 | |
Howden Joinery Group plc (a) | | | 14,000 | | | | 95,845 | |
Mediclinic International plc (a) | | | 35,000 | | | | 114,977 | |
Moneysupermarket.com Group plc (a) | | | 20,000 | | | | 80,227 | |
National Grid plc (a) | | | 9,000 | | | | 109,802 | |
Next plc (a) | | | 2,900 | | | | 175,578 | |
Pets at Home Group plc (a) | | | 40,000 | | | | 118,339 | |
Softcat plc (a) | | | 10,000 | | | | 135,249 | |
SThree plc | | | 50,000 | | | | 167,276 | |
| | | | | | | | 1,573,553 | |
| | | | | | | | | |
Total Common Stocks (Cost $11,005,026) | | | | | | $ | 12,070,302 | |
| PUT OPTION CONTRACTS — 1.2% | | Contracts | | | Notional
Amount | | | Value | |
| S&P 500 Index Option, 08/21/2020 at $3,150 (Premiums paid $192,628) | | 12 | | | $ | 3,720,348 | | | $ | 170,640 | |
| | | | | | | | | | | | |
| Total Investments at Value — 81.7% (Cost $11,197,654) | | | | | | | | | $ | 12,240,942 | |
MONEY MARKET FUNDS — 5.1% | | Shares | | | Value | |
Northern Institutional Treasury Portfolio, 0.10% (c) (Cost $770,075) | | | 770,075 | | | $ | 770,075 | |
| | | | | | | | | |
Total Investments and Money Market Funds at Value — 86.8% (Cost $11,967,729) | | | | | | $ | 13,011,017 | |
| | | | | | | | | |
Other Assets in Excess of Liabilities — 13.2% | | | | | | | 1,983,548 | |
| | | | | | | | | |
Net Assets — 100.0% | | | | | | $ | 14,994,565 | |
(a) | Level 2 Security (Note 1). |
(b) | Non-income producing security. |
(c) | The rate shown is the 7-day effective yield as of June 30, 2020. |
See accompanying notes to financial statements. |
Hussman Strategic International Fund
Schedule of Investments (continued) |
June 30, 2020 |
Common Stocks by Sector/Industry | % of Net
Assets |
Communications — 4.9% | |
Media | 1.8% |
Telecom | 3.1% |
Consumer Discretionary — 11.7% | |
Automotive | 1.2% |
Commercial Services | 1.5% |
Gaming, Lodging & Restaurants | 0.8% |
Household Durables | 0.8% |
Passenger Transportation | 1.3% |
Retail - Discretionary | 5.1% |
Textiles, Apparel & Luxury Goods | 1.0% |
Consumer Staples — 9.0% | |
Consumer Products | 1.7% |
Food & Staples Retailing | 2.0% |
Retail - Consumer Staples | 5.3% |
Energy — 0.4% | |
Renewable Energy | 0.4% |
Financials — 5.6% | |
Asset Management | 0.9% |
Capital Markets | 2.6% |
Insurance | 1.5% |
Real Estate | 0.6% |
Health Care — 15.2% | |
Biotech & Pharma | 12.3% |
Health Care Equipment & Supplies | 1.0% |
Health Care Providers & Services | 1.9% |
Industrials — 10.7% | |
Air Freight & Logistics | 1.2% |
Building Products | 1.0% |
Electrical Equipment | 1.2% |
Engineering & Construction Services | 2.2% |
Industrial Services | 1.3% |
Machinery | 1.3% |
Manufactured Goods | 1.3% |
Trading Companies & Distributors | 1.2% |
Hussman Strategic International Fund
Schedule of Investments (continued) |
June 30, 2020 |
Common Stocks by Sector/Industry (continued) | % of Net
Assets |
Materials — 4.3% | |
Chemicals | 2.9% |
Construction Materials | 0.7% |
Paper & Forest Products | 0.7% |
Technology — 14.3% | |
Hardware | 1.3% |
Semiconductors | 8.5% |
Software | 1.9% |
Technology Services | 2.6% |
Utilities — 4.4% | |
Utilities | 4.4% |
| | 80.5% |
See accompanying notes to financial statements. |
Hussman Strategic International Fund
Schedule of Futures Contracts Sold Short |
June 30, 2020 |
FUTURES CONTRACTS SOLD SHORT | | Contracts | | | Expiration
Date | | | Notional
Amount | | | Value/
Unrealized
Appreciation
(Depreciation)* | |
FINANCIAL FUTURES | | | | | | | | | | | | | | | | |
Mini MSCI EAFE Index Futures | | | 90 | | | | 09/18/2020 | | | $ | 8,002,800 | | | $ | (66,935 | ) |
* | Includes cumulative appreciation (depreciation) of futures contracts from the date that contracts were opened through June 30, 2020. Only current day variation margin is reported on the Statements of Assets and Liabilities. |
See accompanying notes to financial statements. |
Hussman Investment Trust
Statements of Assets and Liabilities |
June 30, 2020 |
| | | Hussman
Strategic
Growth Fund | | | Hussman
Strategic
Allocation Fund | |
ASSETS | | | | | | | | |
Investments in securities: | | | | | | | | |
At cost | | $ | 326,183,424 | | | $ | 8,104,437 | |
At value (Note 1) | | $ | 322,804,624 | | | $ | 8,120,503 | |
Investments in money market funds | | | 139,965,391 | | | | 1,662,185 | |
Cash | | | — | | | | 128 | |
Receivable for capital shares sold | | | 578,758 | | | | — | |
Receivable for investment securities sold | | | 7,413,506 | | | | 94,467 | |
Receivable from Adviser (Note 3) | | | — | | | | 25,924 | |
Dividends receivable | | | 172,847 | | | | 8,000 | |
Tax reclaims receivable | | | 8,509 | | | | — | |
Other assets | | | 48,016 | | | | 12,732 | |
Total Assets | | | 470,991,651 | | | | 9,923,939 | |
| | | | | | | | | |
LIABILITIES | | | | | | | | |
Written call options, at value (Notes 1 and 4) (premiums received $125,519,812 and $1,337,857) | | | 157,564,000 | | | | 1,782,344 | |
Payable for capital shares redeemed | | | 438,013 | | | | — | |
Payable for investment securities purchased | | | 3,875,033 | | | | — | |
Accrued investment advisory fees (Note 3) | | | 212,414 | | | | — | |
Payable to administrator (Note 3) | | | 31,900 | | | | 4,945 | |
Accrued audit fees | | | 50,400 | | | | 35,400 | |
Accrued custodian fees | | | 12,300 | | | | 2,080 | |
Other accrued expenses | | | 33,490 | | | | 6,111 | |
Total Liabilities | | | 162,217,550 | | | | 1,830,880 | |
CONTINGENCIES AND COMMITMENTS (NOTES 8 & 9) | | | — | | | | — | |
NET ASSETS | | $ | 308,774,101 | | | $ | 8,093,059 | |
| | | | | | | | | |
Net assets consist of: | | | | | | | | |
Paid-in capital | | $ | 1,204,594,615 | | | $ | 7,848,614 | |
Accumulated earnings (deficit) | | | (895,820,514 | ) | | | 244,445 | |
NET ASSETS | | $ | 308,774,101 | | | $ | 8,093,059 | |
| | | | | | | | | |
Shares of beneficial interest outstanding (unlimited number of shares authorized, no par value) | | | 50,488,095 | | | | 783,835 | |
| | | | | | | | | |
Net asset value, offering price and redemption price per share (a) (Note 1) | | $ | 6.12 | | | $ | 10.32 | |
(a) | Redemption fee may apply to redemptions of shares held for 60 days or less. |
See accompanying notes to financial statements. |
Hussman Investment Trust
Statements of Assets and Liabilities (continued) |
June 30, 2020 |
| | | Hussman
Strategic Total
Return Fund | | | Hussman
Strategic
International Fund | |
ASSETS | | | | | | | | |
Investments in securities: | | | | | | | | |
At cost | | $ | 258,305,502 | | | $ | 11,197,654 | |
At value (Note 1) | | $ | 275,970,556 | | | $ | 12,240,942 | |
Investments in money market funds | | | 29,107,618 | | | | 770,075 | |
Cash | | | 1,275 | | | | — | |
Foreign currency, at value (Cost $28,402) | | | — | | | | 28,278 | |
Receivable for capital shares sold | | | 563,151 | | | | 213 | |
Receivable for investment securities sold | | | — | | | | 121,598 | |
Variation margin receivable (Notes 1 and 4) | | | — | | | | 14,965 | |
Margin deposits for futures contracts (Note 1) | | | — | | | | 1,948,586 | |
Receivable from Adviser (Note 3) | | | — | | | | 8,059 | |
Dividends and interest receivable | | | 626,823 | | | | 25,175 | |
Tax reclaims receivable | | | — | | | | 34,909 | |
Other assets | | | 56,776 | | | | 22,539 | |
Total Assets | | | 306,326,199 | | | | 15,215,339 | |
| | | | | | | | | |
LIABILITIES | | | | | | | | |
Distributions payable | | | 17,729 | | | | — | |
Payable for capital shares redeemed | | | 78,135 | | | | 65 | |
Payable for investment securities purchased | | | 15,890,510 | | | | 132,471 | |
Accrued investment advisory fees (Note 3) | | | 114,975 | | | | — | |
Payable to administrator (Note 3) | | | 27,100 | | | | 7,175 | |
Accrued audit fees | | | 42,400 | | | | 43,600 | |
Accrued custodian fees | | | 5,000 | | | | 25,000 | |
Other accrued expenses and liabilities | | | 21,163 | | | | 12,463 | |
Total Liabilities | | | 16,197,012 | | | | 220,774 | |
CONTINGENCIES AND COMMITMENTS (NOTE 8) | | | — | | | | — | |
NET ASSETS | | $ | 290,129,187 | | | $ | 14,994,565 | |
| | | | | | | | | |
Net assets consist of: | | | | | | | | |
Paid-in capital | | $ | 328,728,877 | | | $ | 30,120,462 | |
Accumulated deficit | | | (38,599,690 | ) | | | (15,125,897 | ) |
NET ASSETS | | $ | 290,129,187 | | | $ | 14,994,565 | |
| | | | | | | | | |
Shares of beneficial interest outstanding (unlimited number of shares authorized, no par value) | | | 20,013,518 | | | | 1,789,439 | |
| | | | | | | | | |
Net asset value, offering price and redemption price per share (a) (Note 1) | | $ | 14.50 | | | $ | 8.38 | |
(a) | Redemption fee may apply to redemptions of shares held for 60 days or less. |
See accompanying notes to financial statements. |
Hussman Investment Trust
Statements of Operations |
For the Year Ended June 30, 2020 (a) |
| | | Hussman
Strategic
Growth Fund | | | Hussman
Strategic
Allocation Fund | |
INVESTMENT INCOME | | | | | | | | |
Dividends | | $ | 5,602,511 | | | $ | 60,831 | |
Foreign withholding taxes on dividends | | | — | | | | (293 | ) |
Interest | | | — | | | | 35,661 | |
Total Income | | | 5,602,511 | | | | 96,199 | |
| | | | | | | | | |
EXPENSES | | | | | | | | |
Investment advisory fees (Note 3) | | | 2,493,421 | | | | 45,423 | |
Transfer agent, account maintenance and shareholder services fees (Note 3) | | | 234,669 | | | | 9,006 | |
Administration fees (Note 3) | | | 194,090 | | | | 12,000 | |
Trustees’ fees and expenses (Note 3) | | | 76,671 | | | | 76,010 | |
Legal fees | | | 91,433 | | | | 36,950 | |
Audit fees | | | 46,332 | | | | 37,520 | |
Custodian fees | | | 70,011 | | | | 9,707 | |
Fund accounting fees (Note 3) | | | 57,684 | | | | 15,360 | |
Insurance expense | | | 63,749 | | | | 1,312 | |
Registration and filing fees | | | 42,774 | | | | 15,517 | |
Postage and supplies | | | 41,354 | | | | 6,813 | |
Compliance service fees (Note 3) | | | 32,078 | | | | 4,333 | |
Printing of shareholder reports | | | 23,934 | | | | 6,715 | |
Pricing fees | | | 10,378 | | | | 1,060 | |
Other expenses | | | 11,086 | | | | 5,905 | |
Total Expenses | | | 3,489,664 | | | | 283,631 | |
Less fee waivers and Fund expenses absorbed by the Adviser (Note 3) | | | (308,062 | ) | | | (207,969 | ) |
Net Expenses | | | 3,181,602 | | | | 75,662 | |
| | | | | | | | | |
NET INVESTMENT INCOME | | | 2,420,909 | | | | 20,537 | |
| | | | | | | | | |
REALIZED AND UNREALIZED GAINS (LOSSES) ON INVESTMENTS AND WRITTEN OPTION CONTRACTS | | | | | | | | |
Net realized gains (losses) from: | | | | | | | | |
Investments | | | 56,420,650 | | | | 765,618 | |
Written option contracts (Note 4) | | | (21,469,390 | ) | | | (111,168 | ) |
Net change in unrealized appreciation (depreciation) on: | | | | | | | | |
Investments | | | (2,099,222 | ) | | | 16,066 | |
Written option contracts (Note 4) | | | (19,902,704 | ) | | | (444,487 | ) |
| | | | | | | | | |
NET REALIZED AND UNREALIZED GAINS ON INVESTMENTS AND WRITTEN OPTION CONTRACTS | | | 12,949,334 | | | | 226,029 | |
| | | | | | | | | |
NET INCREASE IN NET ASSETS RESULTING FROM OPERATIONS | | $ | 15,370,243 | | | $ | 246,566 | |
(a) | Except for Hussman Strategic Allocation Fund, which represents the period from the commencement of operations (August 27, 2019) through June 30, 2020. |
See accompanying notes to financial statements. |
Hussman Investment Trust
Statements of Operations (continued) |
For the Year Ended June 30, 2020 |
| | | Hussman
Strategic Total
Return Fund | | | Hussman
Strategic
International Fund | |
INVESTMENT INCOME | | | | | | | | |
Dividend income | | $ | 968,206 | | | $ | 390,626 | |
Foreign withholding taxes on dividends | | | (27,213 | ) | | | (54,531 | ) |
Interest | | | 2,838,637 | | | | 16,061 | |
Total Income | | | 3,779,630 | | | | 352,156 | |
| | | | | | | | | |
EXPENSES | | | | | | | | |
Investment advisory fees (Note 3) | | | 1,170,028 | | | | 162,557 | |
Administration fees (Note 3) | | | 164,206 | | | | 24,000 | |
Transfer agent, account maintenance and shareholder services fees (Note 3) | | | 131,029 | | | | 34,409 | |
Trustees’ fees and expenses (Note 3) | | | 76,671 | | | | 76,671 | |
Legal fees | | | 61,915 | | | | 58,736 | |
Fund accounting fees (Note 3) | | | 53,401 | | | | 37,669 | |
Audit fees | | | 38,862 | | | | 39,852 | |
Custodian fees | | | 25,415 | | | | 51,548 | |
Registration and filing fees | | | 31,079 | | | | 33,158 | |
Insurance expense | | | 51,718 | | | | 4,666 | |
Postage and supplies | | | 24,820 | | | | 15,131 | |
Compliance service fees (Note 3) | | | 27,395 | | | | 6,619 | |
Pricing fees | | | 2,557 | | | | 28,292 | |
Printing of shareholder reports | | | 15,721 | | | | 4,073 | |
Interest expense (Note 7) | | | 222 | | | | — | |
Other expenses | | | 11,892 | | | | 7,311 | |
Total Expenses | | | 1,886,931 | | | | 584,692 | |
Less fee waivers and Fund expenses absorbed by the Adviser (Note 3) | | | (132,809 | ) | | | (243,317 | ) |
Net Expenses | | | 1,754,122 | | | | 341,375 | |
| | | | | | | | | |
NET INVESTMENT INCOME | | | 2,025,508 | | | | 10,781 | |
| | | | | | | | | |
REALIZED AND UNREALIZED GAINS (LOSSES) ON INVESTMENTS, FUTURES CONTRACTS AND FOREIGN CURRENCIES | | | | | | | | |
Net realized gains (losses) from: | | | | | | | | |
Investments | | | 22,766,794 | | | | (1,396,802 | ) |
Futures contracts (Note 4) | | | — | | | | 967,625 | |
Foreign currency transactions | | | (2,867 | ) | | | 29,634 | |
Net change in unrealized appreciation (depreciation) on: | | | | | | | | |
Investments | | | 5,904,223 | | | | 381,644 | |
Futures contracts (Note 4) | | | — | | | | 245,115 | |
Foreign currency translation | | | — | | | | (778 | ) |
| | | | | | | | | |
NET REALIZED AND UNREALIZED GAINS ON INVESTMENTS, FUTURES CONTRACTS AND FOREIGN CURRENCIES | | | 28,668,150 | | | | 226,438 | |
| | | | | | | | | |
NET INCREASE IN NET ASSETS RESULTING FROM OPERATIONS | | $ | 30,693,658 | | | $ | 237,219 | |
See accompanying notes to financial statements. |
Hussman Strategic Growth Fund
Statements of Changes in Net Assets |
|
| | | Year Ended
June 30,
2020 | | | Year Ended
June 30,
2019 | |
FROM OPERATIONS | | | | | | | | |
Net investment income | | $ | 2,420,909 | | | $ | 5,268,722 | |
Net realized gains (losses) from: | | | | | | | | |
Investments | | | 56,420,650 | | | | 10,688,703 | |
Written option contracts | | | (21,469,390 | ) | | | (15,608,054 | ) |
Net change in unrealized appreciation (depreciation) on: | | | | | | | | |
Investments | | | (2,099,222 | ) | | | (17,070,666 | ) |
Written option contracts | | | (19,902,704 | ) | | | (10,639,338 | ) |
Net increase (decrease) in net assets resulting from operations | | | 15,370,243 | | | | (27,360,633 | ) |
| | | | | | | | | |
DISTRIBUTIONS TO SHAREHOLDERS (Note 1) | | | (4,497,796 | ) | | | (4,057,363 | ) |
| | | | | | | | | |
FROM CAPITAL SHARE TRANSACTIONS | | | | | | | | |
Proceeds from shares sold | | | 96,065,262 | | | | 66,168,829 | |
Net asset value of shares issued in reinvestment of distributions to shareholders | | | 4,209,892 | | | | 3,847,274 | |
Proceeds from redemption fees collected (Note 1) | | | 76,103 | | | | 21,431 | |
Payments for shares redeemed | | | (96,355,492 | ) | | | (68,716,182 | ) |
Net increase in net assets from capital share transactions | | | 3,995,765 | | | | 1,321,352 | |
| | | | | | | | | |
TOTAL INCREASE (DECREASE) IN NET ASSETS | | | 14,868,212 | | | | (30,096,644 | ) |
| | | | | | | | | |
NET ASSETS | | | | | | | | |
Beginning of year | | | 293,905,889 | | | | 324,002,533 | |
End of year | | $ | 308,774,101 | | | $ | 293,905,889 | |
| | | | | | | | | |
CAPITAL SHARE ACTIVITY | | | | | | | | |
Shares sold | | | 16,263,829 | | | | 10,267,145 | |
Shares reinvested | | | 783,965 | | | | 570,812 | |
Shares redeemed | | | (16,627,560 | ) | | | (10,960,536 | ) |
Net increase (decrease) in shares outstanding | | | 420,234 | | | | (122,579 | ) |
Shares outstanding at beginning of year | | | 50,067,861 | | | | 50,190,440 | |
Shares outstanding at end of year | | | 50,488,095 | | | | 50,067,861 | |
See accompanying notes to financial statements. |
Hussman Strategic Allocation Fund
Statement of Changes in Net Assets |
|
| | | Period Ended
June 30,
2020 (a) | |
FROM OPERATIONS | | | | |
Net investment income | | $ | 20,537 | |
Net realized gains (losses) from: | | | | |
Investments | | | 765,618 | |
Written option contracts | | | (111,168 | ) |
Net change in unrealized appreciation (depreciation) on: | | | | |
Investments | | | 16,066 | |
Written option contracts | | | (444,487 | ) |
Net increase in net assets resulting from operations | | | 246,566 | |
| | | | | |
DISTRIBUTIONS TO SHAREHOLDERS (Note 1) | | | (2,121 | ) |
| | | | | |
FROM CAPITAL SHARE TRANSACTIONS | | | | |
Proceeds from shares sold | | | 7,864,751 | |
Net asset value of shares issued in reinvestment of distributions to shareholders | | | 2,120 | |
Proceeds from redemption fees collected (Note 1) | | | 232 | |
Payments for shares redeemed | | | (18,489 | ) |
Net increase in net assets from capital share transactions | | | 7,848,614 | |
| | | | | |
TOTAL INCREASE IN NET ASSETS | | | 8,093,059 | |
| | | | | |
NET ASSETS | | | | |
Beginning of period | | | — | |
End of period | | $ | 8,093,059 | |
| | | | | |
CAPITAL SHARE ACTIVITY | | | | |
Shares sold | | | 785,509 | |
Shares reinvested | | | 214 | |
Shares redeemed | | | (1,888 | ) |
Net increase in shares outstanding | | | 783,835 | |
Shares outstanding at beginning of period | | | — | |
Shares outstanding at end of period | | | 783,835 | |
(a) | Represents the period from the commencement of operations (August 27, 2019) through June 30, 2020. |
See accompanying notes to financial statements. |
Hussman Strategic Total Return Fund
Statements of Changes in Net Assets |
|
| | | Year Ended
June 30,
2020 | | | Year Ended
June 30,
2019 | |
FROM OPERATIONS | | | | | | | | |
Net investment income | | $ | 2,025,508 | | | $ | 3,154,501 | |
Net realized gains (losses) from: | | | | | | | | |
Investments | | | 22,766,794 | | | | 2,340,572 | |
Foreign currency transactions | | | (2,867 | ) | | | — | |
Net change in unrealized appreciation (depreciation) on investments | | | 5,904,223 | | | | 13,936,087 | |
Net increase in net assets resulting from operations | | | 30,693,658 | | | | 19,431,160 | |
| | | | | | | | | |
DISTRIBUTIONS TO SHAREHOLDERS (Note 1) | | | (1,974,954 | ) | | | (3,195,796 | ) |
| | | | | | | | | |
FROM CAPITAL SHARE TRANSACTIONS | | | | | | | | |
Proceeds from shares sold | | | 93,237,623 | | | | 26,725,419 | |
Net asset value of shares issued in reinvestment of distributions to shareholders | | | 1,856,942 | | | | 2,992,151 | |
Proceeds from redemption fees collected (Note 1) | | | 78,782 | | | | 6,430 | |
Payments for shares redeemed | | | (54,998,030 | ) | | | (99,326,617 | ) |
Net increase (decrease) in net assets from capital share transactions | | | 40,175,317 | | | | (69,602,617 | ) |
| | | | | | | | | |
TOTAL INCREASE (DECREASE) IN NET ASSETS | | | 68,894,021 | | | | (53,367,253 | ) |
| | | | | | | | | |
NET ASSETS | | | | | | | | |
Beginning of year | | | 221,235,166 | | | | 274,602,419 | |
End of year | | $ | 290,129,187 | | | $ | 221,235,166 | |
| | | | | | | | | |
CAPITAL SHARE ACTIVITY | | | | | | | | |
Shares sold | | | 6,769,222 | | | | 2,194,486 | |
Shares reinvested | | | 139,474 | | | | 244,901 | |
Shares redeemed | | | (4,140,034 | ) | | | (8,341,021 | ) |
Net increase (decrease) in shares outstanding | | | 2,768,662 | | | | (5,901,634 | ) |
Shares outstanding at beginning of year | | | 17,244,856 | | | | 23,146,490 | |
Shares outstanding at end of year | | | 20,013,518 | | | | 17,244,856 | |
See accompanying notes to financial statements. |
Hussman Strategic International Fund
Statements of Changes in Net Assets |
|
| | | Year Ended
June 30,
2020 | | | Year Ended
June 30,
2019 | |
FROM OPERATIONS | | | | | | | | |
Net investment income | | $ | 10,781 | | | $ | 144,380 | |
Net realized gains (losses) from: | | | | | | | | |
Investments | | | (1,396,802 | ) | | | (509,815 | ) |
Futures contracts | | | 967,625 | | | | 1,248,082 | |
Foreign currency transactions | | | 29,634 | | | | (28,655 | ) |
Net change in unrealized appreciation (depreciation) on: | | | | | | | | |
Investments | | | 381,644 | | | | (1,386,234 | ) |
Futures contracts | | | 245,115 | | | | (962,844 | ) |
Foreign currency translation | | | (778 | ) | | | 3,353 | |
Net increase (decrease) in net assets resulting from operations | | | 237,219 | | | | (1,491,733 | ) |
| | | | | | | | | |
DISTRIBUTIONS TO SHAREHOLDERS (Note 1) | | | (119,506 | ) | | | (17,482 | ) |
| | | | | | | | | |
FROM CAPITAL SHARE TRANSACTIONS | | | | | | | | |
Proceeds from shares sold | | | 388,907 | | | | 948,919 | |
Net asset value of shares issued in reinvestment of distributions to shareholders | | | 116,458 | | | | 16,890 | |
Proceeds from redemption fees collected (Note 1) | | | 333 | | | | 90 | |
Payments for shares redeemed | | | (7,562,951 | ) | | | (4,495,398 | ) |
Net decrease in net assets from capital share transactions | | | (7,057,253 | ) | | | (3,529,499 | ) |
| | | | | | | | | |
TOTAL DECREASE IN NET ASSETS | | | (6,939,540 | ) | | | (5,038,714 | ) |
| | | | | | | | | |
NET ASSETS | | | | | | | | |
Beginning of year | | | 21,934,105 | | | | 26,972,819 | |
End of year | | $ | 14,994,565 | | | $ | 21,934,105 | |
| | | | | | | | | |
CAPITAL SHARE ACTIVITY | | | | | | | | |
Shares sold | | | 46,702 | | | | 111,988 | |
Shares reinvested | | | 13,464 | | | | 1,996 | |
Shares redeemed | | | (898,341 | ) | | | (526,121 | ) |
Net decrease in shares outstanding | | | (838,175 | ) | | | (412,137 | ) |
Shares outstanding at beginning of year | | | 2,627,614 | | | | 3,039,751 | |
Shares outstanding at end of year | | | 1,789,439 | | | | 2,627,614 | |
See accompanying notes to financial statements. |
Hussman Strategic Growth Fund
Financial Highlights |
Selected Per Share Data and Ratios for a Share Outstanding Throughout Each Year |
| | Year
Ended
June 30,
2020 | | | Year
Ended
June 30,
2019 | | | Year
Ended
June 30,
2018 | | | Year
Ended
June 30,
2017 | | | Year
Ended
June 30,
2016 | |
Net asset value at beginning of year | | $ | 5.87 | | | $ | 6.46 | | | $ | 6.68 | | | $ | 7.93 | | | $ | 8.70 | |
| | | | | | | | | | | | | | | | | | | | | |
Income (loss) from investment operations: | | | | | | | | | | | | | | | | | | | | |
Net investment income | | | 0.06 | | | | 0.10 | | | | 0.06 | | | | 0.02 | | | | 0.03 | |
Net realized and unrealized gains (losses) on investments and written option contracts | | | 0.29 | | | | (0.61 | ) | | | (0.25 | ) | | | (1.25 | ) | | | (0.75 | ) |
Total from investment operations | | | 0.35 | | | | (0.51 | ) | | | (0.19 | ) | | | (1.23 | ) | | | (0.72 | ) |
| | | | | | | | | | | | | | | | | | | | | |
Less distributions: | | | | | | | | | | | | | | | | | | | | |
Dividends from net investment income | | | (0.10 | ) | | | (0.08 | ) | | | (0.03 | ) | | | (0.02 | ) | | | (0.05 | ) |
| | | | | | | | | �� | | | | | | | | | | | | |
Proceeds from redemption fees collected (Note 1) | | | 0.00 | (a) | | | 0.00 | (a) | | | 0.00 | (a) | | | 0.00 | (a) | | | 0.00 | (a) |
| | | | | | | | | | | | | | | | | | | | | |
Net asset value at end of year | | $ | 6.12 | | | $ | 5.87 | | | $ | 6.46 | | | $ | 6.68 | | | $ | 7.93 | |
| | | | | | | | | | | | | | | | | | | | | |
Total return (b) | | | 6.17 | % | | | (8.05 | %) | | | (2.81 | %) | | | (15.53 | %) | | | (8.34 | %) |
| | | | | | | | | | | | | | | | | | | | | |
Net assets at end of year (000’s) | | $ | 308,774 | | | $ | 293,906 | | | $ | 324,003 | | | $ | 375,467 | | | $ | 580,503 | |
| | | | | | | | | | | | | | | | | | | | | |
Ratio of total expenses to average net assets | | | 1.26 | % | | | 1.24 | % | | | 1.23 | % | | | 1.19 | % | | | 1.15 | % |
| | | | | | | | | | | | | | | | | | | | | |
Ratio of net expenses to average net assets (c) | | | 1.15 | % | | | 1.14 | % | | | 1.13 | % | | | 1.12 | % | | | 1.09 | % |
| | | | | | | | | | | | | | | | | | | | | |
Ratio of net investment income to average net assets (c) | | | 0.87 | % | | | 1.66 | % | | | 0.82 | % | | | 0.19 | % | | | 0.34 | % |
| | | | | | | | | | | | | | | | | | | | | |
Portfolio turnover rate | | | 167 | % | | | 124 | % | | | 142 | % | | | 209 | % | | | 161 | % |
(a) | Amount rounds to less than $0.01 per share. |
(b) | Total return is a measure of the change in value of an investment in the Fund over the period covered, which assumes any dividends or capital gains distributions are reinvested in shares of the Fund. Returns do not reflect the deduction of taxes a shareholder would pay on Fund distributions or the redemption of Fund shares. |
(c) | Ratio was determined after advisory fee waivers (Note 3). |
See accompanying notes to financial statements. |
Hussman Strategic Allocation Fund
Financial Highlights |
Selected Per Share Data and Ratios for a Share Outstanding Throughout the Period |
| | | Period Ended
June 30,
2020 (a) | |
Net asset value at beginning of period | | $ | 10.00 | |
| | | | | |
Income from investment operations: | | | | |
Net investment income | | | 0.03 | |
Net realized and unrealized gains on investments and written option contracts | | | 0.29 | |
Total from investment operations | | | 0.32 | |
| | | | | |
Less distributions: | | | | |
Dividends from net investment income | | | (0.00 | )(b) |
| | | | | |
Proceeds from redemption fees collected (Note 1) | | | 0.00 | (b) |
| | | | | |
Net asset value at end of period | | $ | 10.32 | |
| | | | | |
Total return (c) | | | 3.23 | %(d) |
| | | | | |
Net assets at end of period (000’s) | | $ | 8,093 | |
| | | | | |
Ratio of total expenses to average net assets | | | 4.67 | %(e) |
| | | | | |
Ratio of net expenses to average net assets (f) | | | 1.25 | %(e) |
| | | | | |
Ratio of net investment income to average net assets (f) | | | 0.34 | %(e) |
| | | | | |
Portfolio turnover rate | | | 94 | %(d) |
(a) | Represents the period from the commencement of operations (August 27, 2019) through June 30, 2020. |
(b) | Amount rounds to less than $0.01 per share. |
(c) | Total return is a measure of the change in value of an investment in the Fund over the period covered, which assumes any dividends or capital gains distributions are reinvested in shares of the Fund. The return shown does not reflect the deduction of taxes a shareholder would pay on Fund distributions or the redemption of Fund shares. |
(d) | Not annualized. |
(e) | Annualized. |
(f) | Ratio was determined after advisory fee waivers and absorption of Fund expenses by the Adviser (Note 3). |
See accompanying notes to financial statements. |
Hussman Strategic Total Return Fund
Financial Highlights |
Selected Per Share Data and Ratios for a Share Outstanding Throughout Each Year |
| | | Year
Ended
June 30,
2020 | | | Year
Ended
June 30,
2019 | | | Year
Ended
June 30,
2018 | | | Year
Ended
June 30,
2017 | | | Year
Ended
June 30,
2016 | |
Net asset value at beginning of year | | $ | 12.83 | | | $ | 11.86 | | | $ | 11.98 | | | $ | 12.44 | | | $ | 11.32 | |
| | | | | | | | | | | | | | | | | | | | | |
Income (loss) from investment operations: | | | | | | | | | | | | | | | | | | | | |
Net investment income | | | 0.13 | | | | 0.19 | | | | 0.10 | | | | 0.02 | | | | 0.04 | |
Net realized and unrealized gains (losses) on investments and foreign currencies | | | 1.66 | | | | 0.95 | | | | (0.12 | ) | | | (0.46 | ) | | | 1.13 | |
Total from investment operations | | | 1.79 | | | | 1.14 | | | | (0.02 | ) | | | (0.44 | ) | | | 1.17 | |
| | | | | | | | | | | | | | | | | | | | | |
Less distributions: | | | | | | | | | | | | | | | | | | | | |
Dividends from net investment income | | | (0.12 | ) | | | (0.17 | ) | | | (0.10 | ) | | | (0.02 | ) | | | (0.05 | ) |
| | | | | | | | | | | | | | | | | | | | | |
Proceeds from redemption fees collected (Note 1) | | | 0.00 | (a) | | | 0.00 | (a) | | | 0.00 | (a) | | | 0.00 | (a) | | | 0.00 | (a) |
| | | | | | | | | | | | | | | | | | | | | |
Net asset value at end of year | | $ | 14.50 | | | $ | 12.83 | | | $ | 11.86 | | | $ | 11.98 | | | $ | 12.44 | |
| | | | | | | | | | | | | | | | | | | | | |
Total return (b) | | | 14.00 | % | | | 9.72 | % | | | (0.18 | %) | | | (3.50 | %) | | | 10.33 | % |
| | | | | | | | | | | | | | | | | | | | | |
Net assets at end of year (000’s) | | $ | 290,129 | | | $ | 221,235 | | | $ | 274,602 | | | $ | 372,502 | | | $ | 463,503 | |
| | | | | | | | | | | | | | | | | | | | | |
Ratio of total expenses to average net assets | | | 0.81 | % | | | 0.81 | % | | | 0.77 | % | | | 0.75 | % | | | 0.75 | % |
| | | | | | | | | | | | | | | | | | | | | |
Ratio of net expenses to average net assets (c) | | | 0.75 | % | | | 0.74 | % | | | 0.73 | % | | | 0.72 | % | | | 0.69 | % |
| | | | | | | | | | | | | | | | | | | | | |
Ratio of net investment income to average net assets (c) | | | 0.87 | % | | | 1.36 | % | | | 0.76 | % | | | 0.12 | % | | | 0.36 | % |
| | | | | | | | | | | | | | | | | | | | | |
Portfolio turnover rate | | | 88 | % | | | 61 | % | | | 63 | % | | | 341 | % | | | 129 | % |
(a) | Amount rounds to less than $0.01 per share. |
(b) | Total return is a measure of the change in value of an investment in the Fund over the period covered, which assumes any dividends or capital gains distributions are reinvested in shares of the Fund. Returns do not reflect the deduction of taxes a shareholder would pay on Fund distributions or the redemption of Fund shares. |
(c) | Ratio was determined after advisory fee waivers (Note 3). |
See accompanying notes to financial statements. |
Hussman Strategic International Fund
Financial Highlights |
Selected Per Share Data and Ratios for a Share Outstanding Throughout Each Year |
| | | Year
Ended
June 30,
2020 | | | Year
Ended
June 30,
2019 | | | Year
Ended
June 30,
2018 | | | Year
Ended
June 30,
2017 | | | Year
Ended
June 30,
2016 | |
Net asset value at beginning of year | | $ | 8.35 | | | $ | 8.87 | | | $ | 8.80 | | | $ | 9.19 | | | $ | 8.57 | |
| | | | | | | | | | | | | | | | | | | | | |
Income (loss) from investment operations: | | | | | | | | | | | | | | | | | | | | |
Net investment income (loss) | | | 0.04 | | | | 0.06 | | | | 0.02 | | | | 0.01 | | | | (0.05 | ) |
Net realized and unrealized gains (losses) on investments, futures contracts and foreign currencies | | | 0.05 | | | | (0.57 | ) | | | 0.10 | | | | (0.40 | ) | | | 0.67 | |
Total from investment operations | | | 0.09 | | | | (0.51 | ) | | | 0.12 | | | | (0.39 | ) | | | 0.62 | |
| | | | | | | | | | | | | | | | | | | | | |
Less distributions: | | | | | | | | | | | | | | | | | | | | |
Dividends from net investment income | | | (0.06 | ) | | | (0.01 | ) | | | (0.05 | ) | | | — | | | | — | |
| | | | | | | | | | | | | | | | | | | | | |
Proceeds from redemption fees collected (Note 1) | | | 0.00 | (a) | | | 0.00 | (a) | | | 0.00 | (a) | | | 0.00 | (a) | | | 0.00 | (a) |
| | | | | | | | | | | | | | | | | | | | | |
Net asset value at end of year | | $ | 8.38 | | | $ | 8.35 | | | $ | 8.87 | | | $ | 8.80 | | | $ | 9.19 | |
| | | | | | | | | | | | | | | | | | | | | |
Total return (b) | | | 1.08 | % | | | (5.79 | %) | | | 1.34 | % | | | (4.24 | %) | | | 7.23 | % |
| | | | | | | | | | | | | | | | | | | | | |
Net assets at end of year (000’s) | | $ | 14,995 | | | $ | 21,934 | | | $ | 26,973 | | | $ | 30,494 | | | $ | 37,645 | |
| | | | | | | | | | | | | | | | | | | | | |
Ratio of total expenses to average net assets | | | 3.43 | % | | | 2.72 | % | | | 2.42 | % | | | 2.26 | % | | | 2.03 | % |
| | | | | | | | | | | | | | | | | | | | | |
Ratio of net expenses to average net assets (c) | | | 2.00 | % | | | 2.00 | % | | | 2.00 | % | | | 2.00 | % | | | 2.00 | % |
| | | | | | | | | | | | | | | | | | | | | |
Ratio of net investment income (loss) to average net assets (c) | | | 0.06 | % | | | 0.61 | % | | | 0.18 | % | | | 0.25 | % | | | (0.05 | %) |
| | | | | | | | | | | | | | | | | | | | | |
Portfolio turnover rate | | | 115 | % | | | 58 | % | | | 61 | % | | | 102 | % | | | 107 | % |
(a) | Amount rounds to less than $0.01 per share. |
(b) | Total return is a measure of the change in value of an investment in the Fund over the period covered, which assumes any dividends or capital gains distributions are reinvested in shares of the Fund. Returns do not reflect the deduction of taxes a shareholder would pay on Fund distributions or the redemption of Fund shares. |
(c) | Ratio was determined after advisory fee waivers and absorption of Fund expenses by the Adviser (Note 3). |
See accompanying notes to financial statements. |
Hussman Investment Trust
Notes to Financial Statements |
June 30, 2020 |
1. ORGANIZATION AND SIGNIFICANT ACCOUNTING POLICIES
Hussman Strategic Growth Fund, Hussman Strategic Allocation Fund, Hussman Strategic Total Return Fund and Hussman Strategic International Fund (each, a “Fund,” and collectively, the “Funds”) are diversified, separate series of Hussman Investment Trust (the “Trust”), which is registered under the Investment Company Act of 1940, as amended (the “1940 Act”), as an open-end management investment company. Each Fund is authorized to issue an unlimited number of shares.
Hussman Strategic Growth Fund’s investment objective is to provide long-term capital appreciation, with added emphasis on protection of capital during unfavorable market conditions.
Hussman Strategic Allocation Fund’s investment objective is to provide total return through a combination of income and capital appreciation.
Hussman Strategic Total Return Fund’s investment objective is to provide long-term total return from income and capital appreciation.
Hussman Strategic International Fund’s investment objective is to provide long-term capital appreciation, with added emphasis on the protection of capital during unfavorable market conditions. The Fund invests primarily in equity securities of non-U.S. issuers.
The following is a summary of significant accounting policies followed by the Funds. The policies are in conformity with accounting principles generally accepted in the United States of America (“GAAP”). Each Fund follows accounting and reporting guidance under Financial Accounting Standards Board Accounting Standards Codification Topic 946 “Financial Services – Investment Companies.”
Securities, Options and Futures Valuation — The Funds’ portfolio securities are valued at market value as of the close of regular trading on the New York Stock Exchange (“NYSE”) (normally, 4:00 p.m. Eastern time) on each business day the NYSE is open. Securities listed on the NYSE or other exchanges, other than options, are valued on the basis of their last sale prices on the exchanges on which they are primarily traded. However, if the last sale price on the NYSE is different than the last sale price on any other exchange, the NYSE price will be used. If there are no sales on that day, the securities are valued at the last bid price on the NYSE or other primary exchange for that day. Securities quoted by NASDAQ are valued at the NASDAQ Official Closing Price. If there are no sales on that day, the securities are valued at the last bid price as reported by NASDAQ. Securities traded in over-the-counter markets, other than NASDAQ quoted securities, are valued at the last sales price, or if there
Hussman Investment Trust
Notes to Financial Statements (continued) |
June 30, 2020 |
are no sales on that day, at the mean of the closing bid and ask prices. Securities traded on a foreign stock exchange are valued at their closing prices on the principal exchange where they are traded; however, on days when the value of securities traded on foreign stock exchanges may be materially affected by events occurring before the Funds’ pricing time, but after the close of the primary markets or exchanges on which such securities are traded, such securities typically will be valued at their fair value as determined by an independent pricing service approved by the Board of Trustees where such value is believed to reflect the market values of such securities as of the time of computation of the net asset values (“NAVs”) of the Funds. As a result, the prices of foreign securities used to calculate a Fund’s NAV may differ from quoted or published prices for these securities. Values of foreign securities denominated in or expected to settle in a foreign currency are translated from the local currency into U.S. dollars using prevailing currency exchange rates as of the close of the NYSE, as supplied by an independent pricing service.
Pursuant to procedures approved by the Board of Trustees, options traded on a national securities exchange are valued at prices between the closing bid and ask prices determined by Hussman Strategic Advisors, Inc. (the “Adviser”) to most closely reflect market value as of the time of computation of NAV. As of June 30, 2020, all options held by Hussman Strategic Growth Fund, Hussman Strategic Allocation Fund and Hussman Strategic International Fund have been valued in this manner. Options not traded on a national securities exchange or board of trade, but for which over-the-counter market quotations are readily available, are valued at the mean between their closing bid and ask prices. Futures contracts and options thereon, which are traded on commodities exchanges, are valued at their last sale prices as of the close of regular trading on the NYSE or, if not available, at the mean between their bid and ask prices.
Fixed income securities traded over-the-counter and not traded or dealt in upon any securities exchange, but for which market quotations are readily available, generally are valued at the mean of their closing bid and ask prices. Fixed income securities may also be valued on the basis of prices provided by an independent pricing service. Debt securities with remaining maturities of 60 days or less may be valued at amortized cost if the Adviser, under the supervision of the Board of Trustees, determines that the amortized cost value of the security represents fair value.
Investments in shares of other open-end investment companies, other than shares of exchange-traded funds, are valued at their NAVs per share as reported by such companies.
Hussman Investment Trust
Notes to Financial Statements (continued) |
June 30, 2020 |
In the event that market quotations are not readily available or are determined by the Adviser to not be reflective of fair market value due to market events or developments, securities and other financial instruments will be valued at fair value as determined by the Adviser in accordance with procedures adopted by the Board of Trustees. Methods used to determine fair value may include, but are not limited to: multiple of earnings, multiple of book value, discount from market of a similar freely traded security, purchase price of the security, subsequent private transactions in the security or related securities, or a combination of these and other factors.
GAAP establishes a single authoritative definition of fair value, sets out a framework for measuring fair value and requires additional disclosures about fair value measurements.
Various inputs are used in determining the values of the Funds’ investments. These inputs are summarized in the three broad levels listed below:
| | ● | Level 1 – quoted unadjusted prices for identical instruments in active markets to which the Fund has access at the date of measurement. |
| | ● | Level 2 – quoted prices for similar instruments in active markets; quoted prices for identical or similar instruments in markets that are not active; and model-derived valuations in which all significant inputs and significant value drivers are observable in active markets. Level 2 inputs are those in markets for which there are few transactions, the prices are not current, little public information exists or instances where prices vary substantially over time or among market makers. |
| | ● | Level 3 – model-derived valuations in which one or more significant inputs or significant value drivers are unobservable. Unobservable inputs are those inputs that reflect the Fund’s own assumptions that market participants would use to price the asset or liability based on the best available information. |
Option contracts purchased or written by Hussman Strategic Growth Fund, Hussman Strategic Allocation Fund and Hussman Strategic International Fund are classified as Level 2 since they are valued using “other significant observable inputs” at prices between the closing bid and ask prices determined by the Adviser to most closely reflect fair value. U.S. Treasury obligations held by Hussman Strategic Allocation Fund and Hussman Strategic Total Return Fund are classified as Level 2 since values are based on prices provided by an independent pricing service that utilizes various “other significant observable inputs,” including bid and ask quotations, prices of similar securities and interest rates, among other factors. Non-U.S. equity securities actively traded in foreign markets held by Hussman Strategic International
Hussman Investment Trust
Notes to Financial Statements (continued) |
June 30, 2020 |
Fund may be classified as Level 2 despite the availability of closing prices because such securities are typically valued at their fair value as determined by an independent pricing service, as described below.
The Trust uses an independent pricing service to determine the fair value of portfolio securities traded on a foreign securities exchange when the value of such securities may be materially affected by events occurring before a Fund’s pricing time, but after the close of the primary markets or exchanges on which such securities are traded. These intervening events might be: country-specific (e.g., natural disaster, economic or political developments, interest rate change); issuer specific (e.g., earnings report, merger announcement); or U.S. markets-specific (such as a significant movement in the U.S. markets that is deemed likely to affect the value of foreign securities). The pricing service uses an automated system incorporating a model based on multiple parameters, including a security’s local closing price, relevant general and sector indices, currency fluctuations, trading in depositary receipts and futures, if applicable, and/or research valuations by its staff, in determining what it believes is the fair value of the securities. The frequency of use of this procedure depends on market and other events and thus cannot be predicted. However, the procedure may be utilized to a significant extent by Hussman Strategic International Fund.
Determining the fair value of portfolio securities involves reliance on judgment, and a security’s fair value may differ depending on the method used for determining value. With respect to a portfolio security that has been valued at fair value, there can be no assurance that a Fund could purchase or sell that security at a price equal to the fair value of such security used in calculating the Fund’s NAV. Because of the inherent uncertainty in determining fair value and the various factors considered in making such determinations, there can be significant deviations between the fair value at which a portfolio security is being carried and the price at which it can be sold. To the extent Hussman Strategic International Fund has significant holdings of foreign securities, fair value determinations will be used more frequently for this Fund than for the other Funds.
The inputs or methodology used for valuing securities are not necessarily an indication of the risks associated with investing in those securities. The inputs used to measure the value of a particular security may fall into more than one level of the fair value hierarchy. In such cases, for disclosure purposes, the level in the fair value hierarchy within which the fair value measurement of that security is determined to fall in its entirety is the lowest level input that is significant to the fair value measurement.
Hussman Investment Trust
Notes to Financial Statements (continued) |
June 30, 2020 |
The following is a summary of the inputs used to value each Fund’s investments and other financial instruments as of June 30, 2020 by security type:
Hussman Strategic Growth Fund
| | | Level 1 | | | Level 2 | | | Level 3 | | | Total | |
Investments in Securities and Money Market Funds: | | | | | | | | | | | | | | | | |
Common Stocks | | $ | 313,647,074 | | | $ | — | | | $ | — | | | $ | 313,647,074 | |
Put Option Contracts | | | — | | | | 9,157,550 | | | | — | | | | 9,157,550 | |
Money Market Funds | | | 139,965,391 | | | | — | | | | — | | | | 139,965,391 | |
Total Investments in Securities and Money Market Funds | | $ | 453,612,465 | | | $ | 9,157,550 | | | $ | — | | | $ | 462,770,015 | |
| | | | | | | | | | | | | | | | | |
Other Financial Instruments: | | | | | | | | | | | | | | | | |
Written Call Option Contracts | | $ | — | | | $ | (157,564,000 | ) | | $ | — | | | $ | (157,564,000 | ) |
Total Other Financial Instruments | | $ | — | | | $ | (157,564,000 | ) | | $ | — | | | $ | (157,564,000 | ) |
Hussman Strategic Allocation Fund
| | | Level 1 | | | Level 2 | | | Level 3 | | | Total | |
Investments in Securities and Money Market Funds: | | | | | | | | | | | | | | | | |
Common Stocks | | $ | 6,077,368 | | | $ | — | | | $ | — | | | $ | 6,077,368 | |
U.S. Treasury Obligations | | | — | | | | 2,015,113 | | | | — | | | | 2,015,113 | |
Put Option Contracts | | | — | | | | 28,022 | | | | — | | | | 28,022 | |
Money Market Funds | | | 1,662,185 | | | | — | | | | — | | | | 1,662,185 | |
Total Investments in Securities and Money Market Funds | | $ | 7,739,553 | | | $ | 2,043,135 | | | $ | — | | | $ | 9,782,688 | |
| | | | | | | | | | | | | | | | | |
Other Financial Instruments: | | | | | | | | | | | | | | | | |
Written Call Option Contracts | | $ | — | | | $ | (1,782,344 | ) | | $ | — | | | $ | (1,782,344 | ) |
Total Other Financial Instruments | | $ | — | | | $ | (1,782,344 | ) | | $ | — | | | $ | (1,782,344 | ) |
Hussman Investment Trust
Notes to Financial Statements (continued) |
June 30, 2020 |
Hussman Strategic Total Return Fund
| | | Level 1 | | | Level 2 | | | Level 3 | | | Total | |
Investments in Securities and Money Market Funds: | | | | | | | | | | | | | | | | |
Common Stocks | | $ | 63,145,337 | | | $ | — | | | $ | — | | | $ | 63,145,337 | |
U.S. Treasury Obligations | | | — | | | | 203,518,416 | | | | — | | | | 203,518,416 | |
Exchange-Traded Funds | | | 9,306,803 | | | | — | | | | — | | | | 9,306,803 | |
Money Market Funds | | | 29,107,618 | | | | — | | | | — | | | | 29,107,618 | |
Total Investments in Securities and Money Market Funds | | $ | 101,559,758 | | | $ | 203,518,416 | | | $ | — | | | $ | 305,078,174 | |
Hussman Strategic International Fund
| | | Level 1 | | | Level 2 | | | Level 3 | | | Total | |
Investments in Securities and Money Market Funds: | | | | | | | | | | | | | | | | |
Common Stocks | | $ | 1,001,191 | | | $ | 11,069,111 | | | $ | — | | | $ | 12,070,302 | |
Put Option Contracts | | | — | | | | 170,640 | | | | — | | | | 170,640 | |
Money Market Funds | | | 770,075 | | | | — | | | | — | | | | 770,075 | |
Total Investments in Securities and Money Market Funds | | $ | 1,771,266 | | | $ | 11,239,751 | | | $ | — | | | $ | 13,011,017 | |
| | | | | | | | | | | | | | | | | |
Other Financial Instruments: | | | | | | | | | | | | | | | | |
Futures Contracts Sold Short | | $ | (66,935 | ) | | $ | — | | | $ | — | | | $ | (66,935 | ) |
Total Other Financial Instruments | | $ | (66,935 | ) | | $ | — | | | $ | — | | | $ | (66,395 | ) |
Each Fund’s Schedule of Investments identifies the specific securities (by type of security and sector and industry type or geographical region) that comprise that Fund’s holdings within the Level 1 and Level 2 categories shown in the tables above.
The Funds did not have any assets or liabilities that were measured at fair value on a recurring basis using significant unobservable inputs (Level 3) as of June 30, 2020.
Futures Contracts and Option Transactions — Hussman Strategic Growth Fund, Hussman Strategic Allocation Fund and Hussman Strategic International Fund may purchase and write call and put options on broad-based stock indices and also may purchase and write call and put option contracts on individual securities. Each of the Funds may use financial futures contracts and related option contracts to hedge against changes in the market value of its portfolio securities. Hussman Strategic Total Return Fund and Hussman Strategic International Fund may also purchase foreign
Hussman Investment Trust
Notes to Financial Statements (continued) |
June 30, 2020 |
currency options to manage their exposures to foreign currencies. Hussman Strategic Allocation Fund and Hussman Strategic Total Return Fund may purchase interest rate futures contracts to protect against a decline in the value of its portfolio resulting from rising interest rates. Hussman Strategic International Fund may enter into forward foreign currency contracts to hedge against the adverse impact of changes in foreign exchange rates on the U.S. dollar value of its investments or changes in the prices at which it effects transactions in foreign securities.
Hussman Strategic Growth Fund, Hussman Strategic Allocation Fund and Hussman Strategic International Fund may use futures and option contracts on stock indices for the purpose of seeking to reduce the market risk that would otherwise be associated with the securities in which it invests. For example, these Funds may sell a stock index futures contract to hedge the risk of a general market or market sector decline that might adversely affect prices of the Funds’ portfolio securities. To the extent there is a correlation between a Fund’s portfolio and a particular stock index, the sale of futures contracts on that index could reduce the Fund’s exposure to general market risk.
When a Fund writes an index option, an amount equal to the net premium (the premium less the commission) received by the Fund is recorded as a liability on the Fund’s Statement of Assets and Liabilities and is subsequently marked-to market daily. If an index option written by a Fund expires unexercised on the stipulated expiration date or if a Fund enters into a closing purchase transaction, it will realize a gain or a loss depending on whether the cost of a closing purchase transaction is less than or exceeds the net premium received when the option was sold and the liability related to such option will be eliminated. If an index option written by a Fund is exercised, the Fund will be required to pay the difference between the closing index value and the exercise price of the option. In this event, the proceeds of the sale will be increased by the net premium originally received and the Fund will realize a gain or loss. To secure the obligation of a Fund to settle index options it has written, common stocks owned by the Fund are held in escrow by the Fund’s custodian bank (or by a securities depository acting for the custodian bank) for the benefit of the Options Clearing Corporation (the “OCC”). Stocks are released from escrow by the OCC (thus, enabling the Fund to sell the stocks) only when options expire unexercised or when the Fund enters into a closing purchase transaction.
When a Fund purchases or sells a stock index futures contract, no price is paid to or received by the Fund upon the purchase or sale of the futures contract. Instead, the Fund is required to deposit in a segregated account with its custodian an amount of cash or qualifying securities currently ranging from 2% to 11% of the contract amount. This is called “initial margin.” Subsequent payments, known as “variation
Hussman Investment Trust
Notes to Financial Statements (continued) |
June 30, 2020 |
margin,” are made or received by the Fund to or from the separate account each day, depending on the daily fluctuations in the value of the underlying stock index. The Fund recognizes an unrealized gain or loss equal to the daily variation margin. If general market movements are not as expected, the Fund may not achieve the anticipated benefits from the use of futures contracts and may realize a loss. In addition to the possibility that there may be an imperfect correlation or no correlation at all between the movements in the stock index futures and the portion of the portfolio being hedged, the price of the stock index futures may not correlate perfectly with movements in the stock index due to certain market distortions.
Foreign Currency Translation — Investment securities and other assets and liabilities denominated in or expected to settle in foreign currencies are translated into U.S. dollars based on exchange rates on the following basis:
| | A. | The values of investment securities and other assets and liabilities are translated as of the close of the NYSE each day. |
| | B. | Purchases and sales of investment securities and income and expenses are translated at the rate of exchange prevailing as of 4:00 p.m. on the respective date of such transactions. |
| | C. | The Funds do not isolate that portion of the results of operations caused by changes in foreign exchange rates on investments from those caused by changes in market prices of securities held. Such fluctuations are included with the net realized and unrealized gains or losses on investments. |
Reported net realized foreign exchange gains or losses arise from: (1) purchases and sales of foreign currencies; (2) currency gains or losses realized between the trade and settlement dates on securities transactions; and (3) the difference between the amounts of dividends, interest and foreign withholding taxes recorded on a Fund’s books and the U.S. dollar equivalent of the amounts actually received or paid. Reported net unrealized foreign exchange gains and losses arise from changes in the U.S. dollar value of assets and liabilities that result from changes in exchange rates.
Share Valuation and Redemption Fees — The NAV per share of each Fund is calculated as of the close of regular trading on the NYSE (normally 4:00 p.m., Eastern time) on each day that the NYSE is open for business. NAV per share of a Fund is calculated by dividing the total value of the Fund’s assets, less its liabilities, by the number of its shares outstanding. The offering price and redemption price per share of each Fund is equal to the NAV per share next computed after receipt of an order to purchase or to redeem shares. However, a redemption fee of 1.5%, payable to the applicable Fund, generally will apply to shares that are redeemed 60 days or
Hussman Investment Trust
Notes to Financial Statements (continued) |
June 30, 2020 |
less from the date of purchase. During the periods ended June 30, 2020 and 2019, proceeds from redemption fees, recorded in capital, totaled: $76,103 and $21,431, respectively, for Hussman Strategic Growth Fund; $232 and $—, respectively, for Hussman Strategic Allocation Fund; $78,782 and $6,430, respectively, for Hussman Strategic Total Return Fund; and $333 and $90, respectively, for Hussman Strategic International Fund.
Investment Income — Interest income is accrued as earned. Dividend income is recorded on the ex-dividend date. Non-cash dividends included in dividend income, if any, are recorded at the value of the security received. Discounts and premiums on fixed income securities are amortized using the effective interest method. Withholding taxes on foreign dividends have been recorded in accordance with the Trust’s understanding of the applicable country’s rules and tax rates.
Distributions to Shareholders — Dividends from net investment income, if any, are declared and paid annually to shareholders of Hussman Strategic Growth Fund and Hussman Strategic International Fund and are declared and paid quarterly to shareholders of Hussman Strategic Allocation Fund and Hussman Strategic Total Return Fund. Net realized short-term capital gains, if any, may be distributed throughout the year and net realized long-term capital gains, if any, are generally distributed annually. The amount of distributions from net investment income and net realized capital gains are determined in accordance with federal income tax regulations, which may differ from GAAP. These “book/tax” differences are either temporary or permanent in nature and are primarily due to timing differences in the recognition of capital gains or losses on options and futures transactions, losses deferred due to wash sales and the treatment of foreign currency transactions. The tax character of distributions paid by each Fund during the periods ended June 30, 2020 and 2019 was ordinary income.
Investment Transactions — Investment transactions are accounted for on trade date for financial reporting purposes. Realized gains and losses on investments sold are determined on a specific identification basis.
Common Expenses — Expenses of the Trust not attributable solely to one of the Funds are allocated among the Funds based on the relative net assets of each Fund or based on the nature of the expense and its relative applicability to each Fund.
Accounting Estimates — The preparation of financial statements in conformity with GAAP requires management to make estimates and assumptions that affect the reported amounts of assets and liabilities and the disclosure of contingent assets and liabilities as of the date of the financial statements and the reported amounts of income and expenses during the reporting period. Actual results could differ from these estimates.
Hussman Investment Trust
Notes to Financial Statements (continued) |
June 30, 2020 |
Federal Income Tax — Each Fund has qualified and intends to continue to qualify each year as a “regulated investment company” under Subchapter M of the Internal Revenue Code of 1986, as amended (the “Code”). By so qualifying, a Fund generally will not be subject to federal income taxes to the extent that it distributes its net investment income and any net realized capital gains in accordance with the Code. Accordingly, no provision for income taxes has been made.
In order to avoid imposition of a federal excise tax applicable to regulated investment companies, it is each Fund’s intention to declare and pay as dividends in each calendar year at least 98% of its net investment income (earned during the calendar year) and 98.2% of its net realized capital gains (earned during the twelve months ended October 31) plus undistributed amounts from prior years.
The tax character of accumulated earnings (deficit) as of June 30, 2020 was as follows:
| | | Hussman
Strategic
Growth Fund | | | Hussman
Strategic
Allocation Fund | | | Hussman
Strategic Total
Return Fund | | | Hussman
Strategic
International
Fund | |
Net unrealized appreciation | | $ | 158,313 | | | $ | 86,719 | | | $ | 16,107,878 | | | $ | 1,063,419 | |
Undistributed ordinary income | | | 330,339 | | | | 157,726 | | | | — | | | | 193,604 | |
Accumulated capital and other losses | | | (896,309,166 | ) | | | — | | | | (54,689,839 | ) | | | (16,382,920 | ) |
Other temporary differences | | | — | | | | — | | | | (17,729 | ) | | | — | |
Accumulated earnings (deficit) | | $ | (895,820,514 | ) | | $ | 244,445 | | | $ | (38,599,690 | ) | | $ | (15,125,897 | ) |
The following information is based upon the federal income tax cost of investment securities as of June 30, 2020:
| | | Hussman
Strategic
Growth Fund | | | Hussman
Strategic
Allocation Fund | | | Hussman
Strategic Total
Return Fund | | | Hussman
Strategic
International
Fund | |
Cost of investments, money market funds and foreign currencies | | $ | 467,948,156 | | | $ | 9,788,743 | | | $ | 288,970,296 | | | $ | 11,969,522 | |
Gross unrealized appreciation | | $ | 34,726,672 | | | $ | 522,876 | | | $ | 19,685,099 | | | $ | 1,520,469 | |
Gross unrealized depreciation | | | (34,568,359 | ) | | | (436,157 | ) | | | (3,577,221 | ) | | | (456,985 | ) |
Net unrealized appreciation | | $ | 158,313 | | | $ | 86,719 | | | $ | 16,107,878 | | | $ | 1,063,484 | |
Hussman Investment Trust
Notes to Financial Statements (continued) |
June 30, 2020 |
The difference between the federal income tax cost of portfolio investments and the financial statement cost of portfolio investments for each Fund is due to certain timing differences in the recognition of capital gains or losses under income tax regulations and GAAP. These “book/tax” differences are temporary in nature and are primarily due to losses deferred due to wash sales, derivatives and adjustments to basis on publicly traded partnerships and grantor trusts.
During the year ended June 30, 2020, Hussman Strategic Growth Fund and Hussman Strategic Total Return Fund utilized $11,599,795 and $21,547,040, respectively, of capital loss carryforwards to offset current year gains.
As of June 30, 2020, the Funds had the following capital loss carryforwards for federal income tax purposes:
| | | Hussman
Strategic
Growth Fund | | | Hussman
Strategic Total
Return Fund | | | Hussman
Strategic
International
Fund | |
Short-term loss carryforwards | | $ | 648,053,124 | | | $ | 48,173,836 | | | $ | 16,382,920 | |
Long-term loss carryforwards | | | 248,256,042 | | | | 6,436,050 | | | | — | |
Total | | $ | 896,309,166 | | | $ | 54,609,886 | | | $ | 16,382,920 | |
These capital loss carryforwards, which do not expire, may be utilized by the Funds in future years to offset their net realized capital gains, if any.
Qualified late year losses represent late year ordinary losses, consisting of ordinary losses incurred after December 31, 2019 and any specified losses incurred after October 31, 2019, and any post-October capital losses incurred after October 31, 2019. These losses are deemed to arise on the first day of a fund’s next taxable year. For the year ended June 30, 2020, Hussman Strategic Total Return Fund deferred $79,954 of late year ordinary losses to July 1, 2020 for federal income tax purposes.
For the year ended June 30, 2020, the following reclassifications were made as a result of permanent differences between the financial statement and income tax reporting requirements due to adjustments for nondeductible expenses from publicly traded partnerships and distributions in excess of earnings and profits:
| | | Hussman
Strategic
Growth Fund | | | Hussman
Strategic
Allocation Fund | | | Hussman
Strategic Total
Return Fund | | | Hussman
Strategic
International
Fund | |
Paid-in capital | | $ | (93 | ) | | $ | — | | | $ | (22,667 | ) | | $ | — | |
Accumulated earnings (deficit) | | $ | 93 | | | $ | — | | | $ | 22,667 | | | $ | — | |
Hussman Investment Trust
Notes to Financial Statements (continued) |
June 30, 2020 |
Such reclassifications have no effect on each Fund’s total net assets or its net asset value per share.
Each Fund recognizes the tax benefits or expenses of uncertain tax positions only when the position is “more likely than not” to be sustained assuming examination by tax authorities. Management has reviewed each Fund’s tax positions taken on federal income tax returns for all open tax years (generally filed within the past three years) and all major jurisdictions and has concluded that no provision for unrecognized tax benefits or expenses is required in these financial statements. Therefore, no tax expense (including interest and penalties) was recorded in the current year and no adjustments were made to prior periods.
2. INVESTMENT TRANSACTIONS
During the period ended June 30, 2020, cost of purchases and proceeds from sales and maturities of investment securities, other than short-term investments and U.S. government securities, amounted to: $489,711,677 and $526,812,807, respectively, for Hussman Strategic Growth Fund; $11,270,883 and $4,713,687, respectively, for Hussman Strategic Allocation Fund; $183,961,230 and $197,172,799, respectively, for Hussman Strategic Total Return Fund; and $15,207,378 and $16,367,625, respectively, for Hussman Strategic International Fund.
3. TRANSACTIONS WITH AFFILIATES
Advisory Agreement
Under the terms of an Advisory Agreement between the Trust and the Adviser, Hussman Strategic Growth Fund pays the Adviser a fee, which is computed and accrued daily and paid monthly, at annual rates of 0.90% of the first $2 billion of the Fund’s average daily net assets; 0.85% of the next $3 billion of such assets; and 0.80% of such assets over $5 billion. Under the terms of a separate Advisory Agreement between the Trust and the Adviser, Hussman Strategic Allocation Fund pays the Adviser a fee, which is computed and accrued daily and paid monthly, at annual rates of 0.75% of the first $2 billion of the Fund’s average daily net assets; 0.70% of the next $3 billion of such assets; and 0.65% of such assets over $5 billion. Under the terms of a separate Advisory Agreement between the Trust and the Adviser, Hussman Strategic Total Return Fund pays the Adviser a fee, which is computed and accrued daily and paid monthly, at annual rates of 0.50% of the first $1 billion of the Fund’s average daily net assets; 0.45% of the next $1.5 billion of such assets; and 0.40%
Hussman Investment Trust
Notes to Financial Statements (continued) |
June 30, 2020 |
of such assets over $2.5 billion. Under the terms of a separate Advisory Agreement between the Trust and the Adviser, Hussman Strategic International Fund pays the Adviser a fee, which is computed and accrued daily and paid monthly, at annual rates of 0.95% of the first $2 billion of the Fund’s average daily net assets; 0.90% of the next $3 billion of such assets; and 0.85% of such assets over $5 billion.
The Adviser has contractually agreed that, until November 1, 2020 (or until November 1, 2022 with respect to Hussman Strategic Allocation Fund), it will waive its advisory fees and/or absorb operating expenses of each Fund to the extent necessary so that operating expenses of Hussman Strategic Growth Fund, Hussman Strategic Allocation Fund, Hussman Strategic Total Return Fund and Hussman Strategic International Fund (excluding fees and expenses incurred on investments in other investment companies and pooled investment vehicles, brokerage commissions, taxes, interest expense and any extraordinary expenses) do not exceed annually an amount equal to 1.15%, 1.25%, 0.75%, and 2.00%, respectively, of such Fund’s average daily net assets. During the period ended June 30, 2020, the Adviser waived advisory fees in the amount of $308,062, $45,423, $132,809 and $162,557 with respect to Hussman Strategic Growth Fund, Hussman Strategic Allocation Fund, Hussman Strategic Total Return Fund and Hussman Strategic International Fund, respectively. Additionally, during the period ended June 30, 2020, the Adviser absorbed operating expenses of $162,546 and $80,760 with respect to Hussman Strategic Allocation Fund and Hussman Strategic International Fund, respectively.
Pursuant to the Expense Limitation Agreements governing these arrangements, each Fund is obligated to reimburse the Adviser the amount of advisory fees previously waived and expenses previously absorbed by the Adviser for a period of three years from the date such fees or expenses were waived or absorbed, but only if such reimbursement does not cause the Fund’s operating expenses (after the reimbursement is taken into account) to exceed the lesser of: (i) the expense limitation in effect at the time such fees and expenses were waived or absorbed; and (ii) the expense limitation in effect at the time the Adviser seeks reimbursement of such fees and expenses. The Expense Limitation Agreements may not be terminated by the Adviser without the approval of the Board of Trustees. As of June 30, 2020, the amount of fee waivers and expense reimbursements available for possible recovery by the Adviser from Hussman Strategic Growth Fund, Hussman Strategic Allocation Fund, Hussman
Hussman Investment Trust
Notes to Financial Statements (continued) |
June 30, 2020 |
Strategic Total Return Fund and Hussman Strategic International Fund is $940,763, $207,969, $425,443 and $535,771, respectively. The portions of these amounts that the Adviser may recover expire as of the following dates:
| | | June 30,
2021 | | | June 30,
2022 | | | June 30,
2023 | |
Hussman Strategic Growth Fund | | $ | 319,215 | | | $ | 313,486 | | | $ | 308,062 | |
Hussman Strategic Allocation Fund | | $ | — | | | $ | — | | | $ | 207,969 | |
Hussman Strategic Total Return Fund | | $ | 125,652 | | | $ | 166,982 | | | $ | 132,809 | |
Hussman Strategic International Fund | | $ | 121,185 | | | $ | 171,269 | | | $ | 243,317 | |
The Adviser may agree to continue after November 1, 2020 (or in the case of Hussman Strategic Allocation Fund, November 1, 2022) the current arrangement to limit the Funds’ expenses or to implement a similar arrangement, but it is not obligated to do so.
Certain officers of the Trust are also officers of the Adviser.
Other Service Providers
Ultimus Fund Solutions, LLC (“Ultimus”) provides administration, fund accounting, compliance and transfer agency services to the Funds. The Funds pay Ultimus fees for these services in accordance with various servicing agreements. In addition, the Funds reimburse Ultimus for certain out-of-pocket expenses incurred in providing services to the Funds, including, but not limited to, postage, supplies and costs related to the pricing of the Funds’ portfolio securities. Certain officers of the Trust are also officers of Ultimus, or of Ultimus Fund Distributors, LLC (the “Distributor”), the principal underwriter of the Funds. The Distributor is a wholly-owned subsidiary of Ultimus.
The Funds compensate certain financial intermediaries for providing account maintenance and shareholder services to shareholder accounts held through such intermediaries. During the period ended June 30, 2020, Hussman Strategic Growth Fund, Hussman Strategic Allocation Fund, Hussman Strategic Total Return Fund and Hussman Strategic International Fund paid $161,519, $31, $88,058 and $16,409, respectively, to financial intermediaries for such services. These amounts are included in transfer agent, account maintenance and shareholder services fees on the Statements of Operations.
Hussman Investment Trust
Notes to Financial Statements (continued) |
June 30, 2020 |
Trustee Compensation
Trustees and officers affiliated with the Adviser or Ultimus are not compensated by the Funds for their services. Each Trustee who is not an “interested person,” as defined by the 1940 Act, of the Trust or an affiliated person of the Adviser or Ultimus (an “Independent Trustee”) receives from the Trust: an annual retainer of $50,000, payable quarterly; a fee of $10,000 for attendance at each in-person meeting of the Board of Trustees (except that such fee is $15,000 with respect to the annual meeting of the Board) and a fee of $4,000 for attendance at each telephone meeting of the Board of Trustees; a fee of $3,000 for attendance at each meeting of any committee of the Board if not held on the same day as a Board meeting; a fee of $1,500 for participation in each informal monthly telephone conference call of the Board; and reimbursement of travel and other expenses incurred in attending meetings. Each Fund pays its proportionate share of the Independent Trustees’ fees and expenses.
4. DERIVATIVES TRANSACTIONS
The locations in the Statements of Assets and Liabilities of the derivative positions of Hussman Strategic Growth Fund, Hussman Strategic Allocation Fund and Hussman Strategic International Fund are as follows:
Hussman Strategic Growth Fund
| | | | | Fair Value | | | Average Monthly | |
Type of
Derivative | Risk | Location | | Asset
Derivatives | | | Liability
Derivatives | | | Notional Value
During the
Year Ended
June 30, 2020** | |
Index put options purchased | Equity | Investments in securities at value | | $ | 9,157,550 | | | $ | — | | | $ | 285,632,379 | |
Index call options written | Equity | Written call options, at value | | | — | | | | (157,564,000 | ) | | | (284,418,867 | ) |
The average monthly notional value of index call options purchased during the year ended June 30, 2020 for Hussman Strategic Growth Fund was $20,362,452. The Fund had no outstanding index call options purchased outstanding as of June 30, 2020.
Hussman Investment Trust
Notes to Financial Statements (continued) |
June 30, 2020 |
Hussman Strategic Allocation Fund
| | | | | Fair Value | | | Average Monthly | |
Type of
Derivative | Risk | Location | | Asset
Derivatives | | | Liability
Derivatives | | | Notional Value
During the
Period Ended
June 30, 2020* | |
Index put options purchased | Equity | Investments in securities at value | | $ | 28,022 | | | $ | — | | | $ | 3,477,671 | |
Index call options written | Equity | Written call options, at value | | | — | | | | (1,782,344 | ) | | | (3,679,115 | ) |
Hussman Strategic International Fund
| | | | | Fair Value | | | Average Monthly | |
Type of
Derivative | Risk | Location | | Asset
Derivatives | | | Liability
Derivatives | | | Notional Value
During the
Year Ended
June 30, 2020* | |
Index put options purchased | Equity | Investments in securities at value | | $ | 170,640 | | | $ | — | | | $ | 614,460 | |
Futures contracts sold short** | Equity | Variation margin payable | | | — | | | | (66,935 | ) | | | (12,136,016 | ) |
* | The average monthly notional value generally represents the Fund’s derivative activity throughout the period. |
** | Includes cumulative appreciation (depreciation) of futures contracts from the date the contracts were opened through June 30, 2020. Only current day variation margin is reported on the Statements of Assets and Liabilities. |
Hussman Investment Trust
Notes to Financial Statements (continued) |
June 30, 2020 |
Realized and unrealized gains and losses associated with transactions in derivative instruments for Hussman Strategic Growth Fund, Hussman Strategic Allocation Fund and Hussman Strategic International Fund during the period ended June 30, 2020 are recorded in the following locations on the Statements of Operations:
Hussman Strategic Growth Fund
Type of
Derivative | Risk | Location | Realized
Gains (Losses) | Location | Change in
Unrealized
Appreciation
(Depreciation) |
Index put options purchased | Equity | Net realized gains (losses) from investments | $ 10,593,439 | Net change in unrealized appreciation (depreciation) on investments | $ (5,311,995) |
Index call options written | Equity | Net realized gains (losses) from written option contracts | (21,469,390) | Net change in unrealized appreciation (depreciation) on written option contracts | (19,902,704) |
Hussman Strategic Allocation Fund
Type of
Derivative | Risk | Location | Realized
Gains (Losses) | Location | Change in
Unrealized
Appreciation
(Depreciation) |
Index put options purchased | Equity | Net realized gains (losses) from investments | $ 337,155 | Net change in unrealized appreciation (depreciation) on investments | $ (92,773) |
Index call options written | Equity | Net realized gains (losses) from written option contracts | (111,168) | Net change in unrealized appreciation (depreciation) on written option contracts | (444,487) |
Hussman Investment Trust
Notes to Financial Statements (continued) |
June 30, 2020 |
Hussman Strategic International Fund
Type of
Derivative | Risk | Location | Realized
Gains (Losses) | Location | Change in
Unrealized
Appreciation
(Depreciation) |
Index put options purchased | Equity | Net realized gains (losses) from investments | $ (371,427) | Net change in unrealized appreciation (depreciation) on investments | $ (21,988) |
Futures contracts sold short | Equity | Net realized gains (losses) from futures contracts | 967,625 | Net change in unrealized appreciation (depreciation) on futures contracts | 245,115 |
Hussman Strategic Total Return Fund had no transactions in derivative instruments during the year ended June 30, 2020.
In the ordinary course of business, Hussman Strategic Growth Fund, Hussman Strategic Allocation Fund and Hussman Strategic International Fund may enter into transactions subject to enforceable netting agreements or other similar arrangements (“netting agreements”). Generally, the right to offset in netting agreements allows each Fund to offset the exposure it has on any transaction with a specific counterparty with any collateral it has received or delivered in connection with other transactions with that counterparty. Generally, the Funds manage their cash collateral and securities collateral on a counterparty basis.
Hussman Investment Trust
Notes to Financial Statements (continued) |
June 30, 2020 |
The offsetting of financial liabilities and derivative liabilities as of June 30, 2020 are as follows:
Hussman Strategic Growth Fund
Description | | Gross
Amounts of
Recognized
Liabilities | | | Gross
Amounts
Offset on
Statements
of Assets and
Liabilities | | | Net Amounts
of Liabilities
Presented on
Statements
of Assets and
Liabilities | | | Collateral
Pledged* | | | Net Amount | |
Written call options at market value | | $ | (157,564,000 | ) | | $ | — | | | $ | (157,564,000 | ) | | $ | — | | | $ | (157,564,000 | ) |
Total subject to a master netting or similar arrangement | | $ | (157,564,000 | ) | | $ | — | | | $ | (157,564,000 | ) | | $ | — | | | $ | (157,564,000 | ) |
* | Common stocks owned by the Fund are held in escrow by the Fund’s custodian (or by a securities depository) to secure the Fund’s obligations to settle outstanding call option contracts it has written (Note 1). |
Hussman Strategic Allocation Fund
Description | | Gross
Amounts of
Recognized
Liabilities | | | Gross
Amounts
Offset on
Statements
of Assets and
Liabilities | | | Net Amounts
of Liabilities
Presented on
Statements
of Assets and
Liabilities | | | Collateral
Pledged* | | | Net Amount | |
Written call options at market value | | $ | (1,782,344 | ) | | $ | — | | | $ | (1,782,344 | ) | | $ | — | | | $ | (1,782,344 | ) |
Total subject to a master netting or similar arrangement | | $ | (1,782,344 | ) | | $ | — | | | $ | (1,782,344 | ) | | $ | — | | | $ | (1,782,344 | ) |
* | Common stocks owned by the Fund are held in escrow by the Fund’s custodian (or by a securities depository) to secure the Fund’s obligations to settle outstanding call option contracts it has written (Note 1). |
Hussman Investment Trust
Notes to Financial Statements (continued) |
June 30, 2020 |
Hussman Strategic International Fund
Description | | Gross
Amounts of
Recognized
Liabilities | | | Gross
Amounts
Offset on
Statements
of Assets and
Liabilities | | | Net Amounts
of Liabilities
Presented on
Statements
of Assets and
Liabilities | | | Collateral
Pledged* | | | Net Amount | |
Variation margin receivable - futures contracts | | $ | 14,965 | | | $ | — | | | $ | 14,965 | | | $ | (14,965 | ) | | $ | — | |
Total subject to a master netting or similar arrangement | | $ | 14,965 | | | $ | — | | | $ | 14,965 | | | $ | (14,965 | ) | | $ | — | |
* | Amounts in cash collateral pledged in the table above are limited to the net amounts of liabilities presented on the Statements of Assets and Liabilities. |
5. CERTAIN INVESTMENTS AND ASSOCIATED RISKS
The securities in which the Funds invest, as well as the risks associated with these securities and with the investment programs of the Funds, are described in each Fund’s Prospectus. Among these risks are those associated with investments in derivative instruments, investments in shares of money market funds, concentration of investments within a particular business sector and, in the case of Hussman Strategic International Fund, investments in foreign securities.
Risks of Derivative Instruments — The purchase and sale of derivative instruments, including options and futures contracts, and other derivative transactions involve risks different from those involved with direct investments in securities and also require different skills from the Adviser in managing each Fund’s portfolio of investments. While utilization of options, futures contracts and similar instruments may be advantageous to the Funds, if the Adviser is not successful in employing such instruments in managing a Fund’s investments or in anticipating general market movements, the Fund’s performance will be worse than if the Fund did not make such investments. It is possible that there will be imperfect correlation, or even no correlation, between price movements of the investments held by the Funds and the options, futures or other derivative instruments used to hedge those investments. It is also possible that a Fund may be unable to close out or liquidate its hedges during unusual periods of illiquidity in the options, futures or other markets. In addition, a Fund will pay commissions and other costs in connection with its transactions in such instruments, which may increase its expenses and reduce its investment performance.
Hussman Investment Trust
Notes to Financial Statements (continued) |
June 30, 2020 |
Investments in Money Market Funds — In order to maintain sufficient liquidity to implement investment strategies, or for temporary defensive purposes, each Fund may at times invest a significant portion of its assets in shares of money market funds. As of June 30, 2020, Hussman Strategic Growth Fund and Hussman Strategic Allocation Fund had 45.3% and 20.5%, respectively, of the value of their net assets invested in shares of a money market fund registered under the 1940 Act. An investment in a money market fund is not insured or guaranteed by the Federal Deposit Insurance Corporation or any other governmental agency, entity or person. While investor losses in money market funds have been rare, they are possible. The Funds, as investors in money market funds, indirectly bear the fees and expenses of those funds, which are in addition to the fees and expenses of the Funds.
Sector Risk — If a Fund has significant investments in the securities of issuers in industries within a particular business sector, any development generally affecting that sector will have a greater impact on the value of the net assets of the Fund than would be the case if the Fund did not have significant investments in that sector. This may increase the risk of loss of an investment in a Fund and increase the volatility of a Fund’s NAV per share. From time to time, circumstances may affect a particular sector and the companies within such sector. For instance, economic or market factors, regulation or deregulation, and technological or other developments, may negatively impact all companies in a particular sector and therefore the value of a Fund’s portfolio could be adversely affected if it has significant holdings of securities of issuers in that sector. As of June 30, 2020, Hussman Strategic Growth Fund had 24.1% and 22.2% of the value of its net assets invested in stocks within the Consumer Discretionary sector and the Technology sector, respectively.
Foreign Investment Risk — Compared with investing in the United States, investing in foreign markets involves a greater degree and variety of risks. Investors in foreign markets may face delayed settlements, currency controls and adverse economic developments as well as higher overall transaction costs. In addition, fluctuations in the U.S. dollar’s value versus other currencies may erode or reverse gains from investments denominated in foreign currencies or increase losses. Foreign governments may expropriate assets, impose capital or currency controls, impose punitive taxes, impose limits on ownership or nationalize a company or industry. Any of these actions could have a severe effect on securities prices and impair an investor’s ability to bring its capital or income back to the U.S. Exchange rate fluctuations also may impair a foreign issuer’s ability to repay U.S. dollar denominated debt, thereby increasing credit risk associated with investment in such debt. The values of foreign securities may be affected by incomplete, less frequent or inaccurate financial information about
Hussman Investment Trust
Notes to Financial Statements (continued) |
June 30, 2020 |
their issuers, social upheavals or political actions ranging from tax code changes to government collapse. Foreign companies may also receive less coverage than U.S. companies by market analysts and may be subject to reporting standards or regulatory requirements that differ from those applicable to U.S. companies.
As of June 30, 2020, investments of Hussman Strategic International Fund in issuers in the United Kingdom (the “UK”) represented 13.0% of the value of its stock portfolio and investments by the Fund in issuers in countries within the European Union (the “EU”) represented 44.4% of the value of its stock portfolio. EU member countries that use the Euro as their currency (so-called Eurozone countries) lack the ability to implement an independent monetary policy and may be significantly affected by requirements that limit their fiscal options. Since the global economic crisis in 2008, some of these countries have depended on, and may continue to depend on, assistance from others such as the European Central Bank and other governments or institutions, and failure to implement reforms as a condition of assistance may have negative long-them effects for the economies of those countries and other European countries. In June 2016, voters in the UK approved a referendum calling for the exit of the UK from the EU (a process commonly referred to as “Brexit”), and Brexit took place on January 31, 2020. There presently is considerable uncertainty regarding the impact of Brexit on the economies and financial markets of the UK and of the EU and other European countries. As a result of Brexit, there may be an extended period of political and economic uncertainty and market volatility in the UK, the EU, other European countries and globally, which may adversely impact the prices and liquidity of securities held by Hussman Strategic International Fund.
As of June 30, 2020, Hussman Strategic International Fund had 27.3% of the value of its stock portfolio invested in stocks of companies domiciled in Japan. At times, the Japanese economy has been negatively affected by government intervention and protectionism, an unstable financial services sector, a heavy reliance on international trade, and natural disasters. These factors, as well as other adverse political developments, increases in government debt, and changes to fiscal monetary or trade policies, may negatively affect Japanese markets and the prices of stocks of Japanese companies.
6. FORWARD FOREIGN CURRENCY EXCHANGE CONTRACTS
Hussman Strategic International Fund is subject to foreign currency exchange rate risk in the normal course of pursuing its investment objective. Hussman Strategic International Fund may (but is not required to) enter into contracts for the purchase or sale of a specific foreign currency at a fixed price on a future date as a hedge or
Hussman Investment Trust
Notes to Financial Statements (continued) |
June 30, 2020 |
cross-hedge against either specific transactions or portfolio positions generally. Foreign currency hedging transactions may be used to reduce the risk that the U.S. dollar value of the Fund’s holdings of securities denominated in foreign currency will decline in value due to changes in foreign currency exchange rates or to protect against adverse changes in the prices of securities that the Fund is purchasing or selling prior to settlement of those transactions. All foreign currency exchange contracts are “marked-to-market” daily at the applicable translation rates resulting in unrealized gains or losses. Realized and unrealized gains or losses from transactions in foreign currency exchange contracts are included in the Fund’s Statement of Assets and Liabilities and Statement of Operations. Risks associated with these contracts include the potential inability of counterparties to meet the terms of their contracts and unanticipated movements in the value of a foreign currency relative to the U.S. dollar. Hussman Strategic International Fund, as previously noted, may also purchase foreign currency options to manage foreign currency exposures.
As of and during the year ended June 30, 2020, Hussman Strategic International Fund had no forward currency exchange contracts outstanding.
7. BANK LINE OF CREDIT
Hussman Strategic Growth Fund has an unsecured bank line of credit with its custodian bank in the amount of $10,000,000. Hussman Strategic Total Return Fund has an unsecured bank line of credit with its custodian bank in the amount of $2,000,000. Any borrowings under these arrangements bear interest at a rate determined by the lending bank at the time of borrowing. During the year ended June 30, 2020, Hussman Strategic Growth Fund did not borrow under its line of credit. During the year ended June 30, 2020, Hussman Strategic Total Return Fund incurred $222 of interest expense related to borrowings. The average debt outstanding and the average interest rate for days with borrowings for Hussman Strategic Total Return Fund during the year ended June 30, 2020 were $560,000 and 5.0%, respectively. The largest outstanding borrowing during the year ended June 30, 2020 for Hussman Strategic Total Return Fund was $560,000. Hussman Strategic Allocation Fund and Hussman Strategic International Fund currently do not have bank lines of credit.
8. CONTINGENCIES AND COMMITMENTS
The Trust’s officers and Trustees are entitled to indemnification from the Funds for certain liabilities to which they may become subject in connection with the performance of their duties to the Funds. Additionally, in the normal course of business, the Funds enter into contracts that contain a variety of representations and warranties and which
Hussman Investment Trust
Notes to Financial Statements (continued) |
June 30, 2020 |
may require the Funds to indemnify the other parties to the contracts in the event of certain losses. The Funds’ maximum exposure under these arrangements is unknown, as this would involve potential claims for indemnification for losses that may or may not be incurred in the future. However, based on experience, the Trust believes the risk of loss to be remote.
9. LEGAL PROCEEDINGS
Several lawsuits have been filed relating to the Hussman Strategic Growth Fund’s investment in Tribune Company common stock in connection with Tribune Company’s Chapter 11 bankruptcy. The lawsuits stem from a leveraged buyout by which Tribune Company converted to a privately-held company in 2007. The Trust, the Hussman Strategic Growth Fund and Hussman Strategic Advisors (the “Hussman Entities”) were named as defendants and putative members of the proposed defendant class of shareholders in an adversary proceeding brought by The Official Committee of Unsecured Creditors of Tribune Company in the U.S. Bankruptcy Court for the District of Delaware in 2010. That action was subsequently transferred to the U.S. District Court for the Southern District of New York by order of the Judicial Panel on Multidistrict Litigation, and Marc S. Kirschner, the Litigation Trustee for the Tribune Litigation Trust, became successor plaintiff to the Creditors Committee on December 31, 2012, the effective date of Tribune Company’s plan of reorganization. The Trust and the Hussman Strategic Growth Fund were also named as defendants in a lawsuit filed by the indenture trustees of certain noteholders of Tribune Company in the U.S. District Court for the Southern District of Ohio in 2011. The Hussman Strategic Growth Fund and Hussman Strategic Advisors were named as defendants in a similar action in the U.S. District Court for the District of Maryland in 2011. Both of those actions have been transferred to the U.S. District Court for the Southern District of New York for coordinated proceedings with many other similar lawsuits brought by individual creditors against former Tribune Company shareholders and the action currently prosecuted by the Tribune Litigation Trustee. The Trust, the Hussman Strategic Growth Fund and Hussman Strategic Advisors may also be putative defendant class members in some of these actions. The plaintiffs in all these lawsuits seek to recover amounts paid to shareholders of Tribune Company in connection with the leveraged buyout, plus interest and attorneys’ fees and expenses.
An omnibus motion to dismiss the actions filed by the individual creditors (the “Individual Creditor Actions”), but not the action prosecuted by the Litigation Trustee for the Tribune Litigation Trust (the “Litigation Trustee Action”), was filed in November 2012. On September 23, 2013, the U.S. District Court Judge issued a decision and order dismissing the Individual Creditor Actions in full. The plaintiffs in those actions
Hussman Investment Trust
Notes to Financial Statements (continued) |
June 30, 2020 |
appealed that decision to the U.S. Court of Appeals for the Second Circuit and certain shareholder defendants, including each of the Hussman Entities, cross-appealed. The Second Circuit heard oral argument on November 5, 2014 and issued a unanimous decision affirming the District Court’s decision on March 29, 2016. A petition of the individual creditors for rehearing or rehearing en banc was denied by the Second Circuit on July 22, 2016. The individual creditors filed a petition for a writ of certiorari in the United States Supreme Court on September 9, 2016, seeking Supreme Court review of the Second Circuit decision.
On April 10, 2018, the plaintiffs in the Individual Creditor Actions filed a motion requesting that the Second Circuit recall its mandate, vacate its prior decision, and remand the actions to the District Court for further proceedings in light of the Supreme Court’s decision in Merit Management Group, LP v. FTI Consulting, Inc., No. 16-784 (U.S.) (“Merit Management”). The Second Circuit issued an order recalling the mandate “in anticipation of further panel review,” but on December 19, 2019 reaffirmed its prior decision. On February 6, 2020, Second Circuit denied a petition of the individual creditor plaintiffs for rehearing or rehearing en banc by the Second Circuit, and on July 6, 2020, the plaintiffs filed a new petition for a writ of certiorari in the Supreme Court.
On August 2, 2013, with the District Court’s permission, the Litigation Trustee filed an amended complaint in the Litigation Trustee Action that named the Hussman Strategic Growth Fund as one of the class representatives for the putative class of shareholder defendants. A global motion to dismiss this action was filed on behalf of all shareholder defendants on May 23, 2014 and the District Court issued an opinion and order granting the motion to dismiss on January 6, 2017. The Litigation Trustee noticed an appeal from the District Court’s decision on July 15, 2019.
On July 18, 2017, the Litigation Trustee requested a pre-motion conference in the District Court on a proposed motion to amend his complaint in the Litigation Trustee Action to add a claim for constructive fraudulent conveyance against the shareholder defendants based on the Supreme Court’s decision in Merit Management. Although the District Court denied the Litigation Trustee’s motion to amend its complaint on August 24, 2017, that denial was without prejudice and the Litigation Trustee renewed the motion to amend on March 8, 2018, based on the Supreme Court’s decision in Merit Management. The District Court denied the Litigation Trustee’s renewed motion to amend on April 23, 2019, and the Litigation Trustee noticed an appeal from the District Court’s decision on July 15, 2019. That appeal has been consolidated with the Litigation Trustee’s appeal of the District Court’s dismissal of the actual fraudulent transfer claims, and oral argument on both appeals is scheduled for August 24, 2020.
Hussman Investment Trust
Notes to Financial Statements (continued) |
June 30, 2020 |
The lawsuits allege no misconduct by the Hussman Entities, and each of them intends to defend itself vigorously in the lawsuits. Although the outcome of these proceedings cannot be predicted, the adverse impact to the Hussman Strategic Growth Fund is not expected to exceed materially the value of the proceeds received by the Hussman Strategic Growth Fund in connection with the leveraged buyout, which was $29,432,814 (representing, as of June 30, 2020, approximately 9.5% of the Hussman Strategic Growth Fund’s net assets), plus interest. If the proceedings are decided or settled in a manner adverse to the Hussman Strategic Growth Fund, the payment of judgments or settlements by the Hussman Strategic Growth Fund in connection with the proceedings could have a material adverse effect on its NAV per share.
10. SUBSEQUENT EVENTS
The Funds are required to recognize in their financial statements the effects of all subsequent events that provide additional evidence about conditions that existed as of the date of the Statements of Assets and Liabilities. For non-recognized subsequent events that must be disclosed to keep the financial statements from being misleading, the Funds are required to disclose the nature of the event as well as an estimate of its financial effect, or a statement that such an estimate cannot be made. Management has evaluated subsequent events through the date of issuance of these financial statements and has noted no such events.
Hussman Investment Trust
Report of Independent Registered
Public Accounting Firm |
To the Shareholders and the Board of Trustees of
Hussman Investment Trust
Opinion on the Financial Statements
We have audited the accompanying statements of assets and liabilities of Hussman Investment Trust (the “Trust”) (comprising the Hussman Strategic Growth Fund, Hussman Strategic Allocation Fund, Hussman Strategic Total Return Fund and Hussman Strategic International Fund (collectively referred to as the “Funds”)), including the schedules of investments and the schedules of open written option contracts for Hussman Strategic Growth Fund and Hussman Strategic Allocation Fund, the schedule of investments for Hussman Strategic Total Return Fund, the schedule of investments and the schedule of futures contracts sold short for Hussman Strategic International Fund, as of June 30, 2020, and the related statements of operations, and changes in net assets, and the financial highlights for each of the periods indicated in the table below and the related notes (collectively referred to as the “financial statements”). In our opinion, the financial statements present fairly, in all material respects, the financial position of each of the Funds comprising Hussman Investment Trust at June 30, 2020, the results of their operations, changes in net assets and financial highlights for each of the periods indicated in the table below, in conformity with U.S. generally accepted accounting principles.
Funds comprising the
Hussman Investment Trust | Statement of
operations | Statements of
changes in
net assets | Financial highlights |
Hussman Strategic Growth Fund Hussman Strategic Total Return Fund Hussman Strategic International Fund | For the year ended June 30, 2020 | For each of the two years in the period ended June 30, 2020 | For each of the five years in the period ended June 30, 2020 |
Hussman Strategic Allocation Fund | For the period from August 27, 2019 (commencement of operations) through June 30, 2020 |
Basis for Opinion
These financial statements are the responsibility of the Trust’s management. Our responsibility is to express an opinion on each of the Funds’ financial statements based on our audits. We are a public accounting firm registered with the Public Company Accounting Oversight Board (United States) (“PCAOB”) and are required to be independent with respect to the Trust in accordance with the U.S. federal securities laws and the applicable rules and regulations of the Securities and Exchange Commission and the PCAOB.
Hussman Investment Trust
Report of Independent Registered
Public Accounting Firm (continued) |
We conducted our audits in accordance with the standards of the PCAOB. Those standards require that we plan and perform the audit to obtain reasonable assurance about whether the financial statements are free of material misstatement, whether due to error or fraud. The Trust is not required to have, nor were we engaged to perform, an audit of the Trust’s internal control over financial reporting. As part of our audits we are required to obtain an understanding of internal control over financial reporting but not for the purpose of expressing an opinion on the effectiveness of the Trust’s internal control over financial reporting. Accordingly, we express no such opinion.
Our audits included performing procedures to assess the risks of material misstatement of the financial statements, whether due to error or fraud, and performing procedures that respond to those risks. Such procedures included examining, on a test basis, evidence regarding the amounts and disclosures in the financial statements. Our procedures included confirmation of securities owned as of June 30, 2020, by correspondence with the custodian and brokers or by other appropriate auditing procedures where replies from brokers were not received. Our audits also included evaluating the accounting principles used and significant estimates made by management, as well as evaluating the overall presentation of the financial statements. We believe that our audits provide a reasonable basis for our opinion.

We have served as the auditor of one or more Hussman Investment Trust investment companies since 2002.
Cincinnati, Ohio
August 20, 2020
Hussman Investment Trust
About Your Funds’ Expenses (Unaudited) |
|
We believe it is important for you to understand the impact of costs on your investment. As a shareholder of the Funds, you incur two types of costs: (1) transaction costs, which may include redemption fees; and (2) ongoing costs, including management fees and other Fund expenses. The following examples are intended to help you understand your ongoing costs (in dollars) of investing in the Funds and to compare these costs with the ongoing costs of investing in other mutual funds. A mutual fund’s ongoing costs are expressed as a percentage of its average net assets. This figure is known as the expense ratio.
The examples below are based on an investment of $1,000 made at the beginning of the period shown and held for the entire period (January 1, 2020 – June 30, 2020).
The table on the following page illustrates each Fund’s ongoing costs in two ways:
Actual fund return – This section helps you to estimate the actual expenses that you paid over the period. The “Ending Account Value” shown is derived from each Fund’s actual return, and the fourth column shows the dollar amount of operating expenses that would have been paid by an investor who started the period with $1,000 invested in that Fund. You may use that information, together with the amount of your investment, to estimate the expenses that you paid over the period.
To do so, simply divide your account value by $1,000 (for example, an $8,600 account value divided by $1,000 = 8.6), and then multiply the result by the number given for the applicable Fund under the heading “Expenses Paid During Period.”
Hypothetical 5% return – This section is intended to help you compare each Fund’s ongoing costs with those of other mutual funds. It assumes that each Fund had an annual return of 5% before expenses during the period shown. In this case, because the return used is not each Fund’s actual return, the results do not illustrate the actual expenses associated with your investment. However, the example is useful in making comparisons because the Securities and Exchange Commission (the “SEC”) requires all mutual funds to provide an example of fund expenses based on a 5% annual return. You can assess each Fund’s ongoing costs by comparing this hypothetical example with the hypothetical examples that appear in shareholder reports of other mutual funds.
Note that expenses shown in the table are meant to highlight and help you compare ongoing costs only. The expense ratios used in computing annual expenses in the tables are the expense ratios of the Funds during the six-month period ended June 30, 2020, annualized, after fee waivers and expense reimbursements. Actual expenses of the Funds in future periods may differ. The calculations assume no shares were bought or sold during the period. Your actual costs may have been higher or lower, depending on the amount of your investment and the timing of any purchases or redemptions.
Hussman Investment Trust
About Your Funds’ Expenses (Unaudited) (continued) |
|
More information about each Fund’s expenses, including annual expense ratios, can be found elsewhere in this report. For additional information on operating expenses and other shareholder costs, please refer to each Fund’s prospectus.
| Beginning
Account Value
January 1, 2020 | Ending
Account Value
June 30, 2020 | Net
Expense
Ratio(a) | Expenses
Paid During
Period(b) |
Hussman Strategic Growth Fund |
Based on Actual Fund Return | $1,000.00 | $ 1,139.70 | 1.15% | $ 6.12 |
Based on Hypothetical 5% Return (before expenses) | $1,000.00 | $ 1,019.14 | 1.15% | $ 5.77 |
Hussman Strategic Allocation Fund |
Based on Actual Fund Return | $1,000.00 | $ 1,039.30 | 1.25% | $ 6.34 |
Based on Hypothetical 5% Return (before expenses) | $1,000.00 | $ 1,018.65 | 1.25% | $ 6.27 |
Hussman Strategic Total Return Fund |
Based on Actual Fund Return | $1,000.00 | $ 1,096.40 | 0.75% | $ 3.91 |
Based on Hypothetical 5% Return (before expenses) | $1,000.00 | $ 1,021.13 | 0.75% | $ 3.77 |
Hussman Strategic International Fund |
Based on Actual Fund Return | $1,000.00 | $ 968.80 | 2.00% | $ 9.79 |
Based on Hypothetical 5% Return (before expenses) | $1,000.00 | $ 1,014.92 | 2.00% | $ 10.02 |
(a) | Annualized, based on each Fund’s most recent one-half year expenses. |
(b) | Expenses are equal to each Fund’s annualized net expense ratio multiplied by the average account value over the period, multiplied by 182/366 (to reflect the one-half year period). |
Hussman Investment Trust
Board of Trustees and Officers (Unaudited) |
|
Overall responsibility for supervision of management of the Funds rests with the Board of Trustees. The Trustees serve during the lifetime of the Trust and until its termination, or until death, resignation, retirement or removal. The Trustees, in turn, elect the officers of the Trust to supervise the day-to-day operations of the Funds. The officers are elected for annual terms. The following are the Trustees and executive officers of the Trust:
Trustee | Address | Age | Position Held
with the Trust | Length of
Time Served |
*John P. Hussman, Ph. D. | 6021 University Boulevard, Suite 490
Ellicott City, MD 21043 | 57 | President and Trustee | Since
June 2000 |
David C. Anderson | 225 Pictoria Drive
Cincinnati, OH 45246 | 69 | Trustee | Since
June 2000 |
Jody T. Foster | 225 Pictoria Drive
Cincinnati, OH 45246 | 51 | Trustee | Since
June 2016 |
William H. Vanover | 225 Pictoria Drive
Cincinnati, OH 45246 | 73 | Trustee | Since
June 2000 |
Robert G. Dorsey | 225 Pictoria Drive
Cincinnati, OH 45246 | 63 | Vice President | Since
June 2000 |
Mark J. Seger | 225 Pictoria Drive
Cincinnati, OH 45246 | 58 | Treasurer | Since
June 2000 |
John F. Splain | 225 Pictoria Drive
Cincinnati, OH 45246 | 63 | Secretary and Chief Compliance Officer | Since
June 2000 |
* | Dr. Hussman, as an affiliated person of the Adviser, is an “interested person” of the Trust within the meaning of Section 2(a)(19) of the 1940 Act. |
Each Trustee oversees four portfolios of the Trust. The principal occupations during the past five years of the Trustees and executive officers of the Trust and public directorships (if any) currently held by the Trustees are set forth below:
John P. Hussman, Ph.D. is Chairman, President and Treasurer of the Adviser.
David C. Anderson is Network Administrator for Hephzibah Children’s Association (a child welfare organization).
Jody T. Foster is President of Symphony Consulting LLC (a provider of compliance, finance, marketing, operations and human resources services to public and private fund advisers).
Hussman Investment Trust
Board of Trustees and Officers (Unaudited) (continued) |
|
William H. Vanover is retired. Prior to June 30, 2018, he was an investment counselor with Planning Alternatives, Ltd. (a registered investment adviser).
Robert G. Dorsey is Vice Chairman of Ultimus Fund Solutions, LLC (the Trust’s administrator and transfer agent) and affiliated companies. He was previously Co-CEO of Ultimus Fund Solutions, LLC (1999-2019).
Mark J. Seger is Vice Chairman of Ultimus Fund Solutions, LLC and affiliated companies. He was previously Co-CEO of Ultimus Fund Solutions, LLC (1999-2019).
John F. Splain is an Executive Vice President of Ultimus Fund Solutions, LLC.
Additional information about members of the Board of Trustees and executive officers of the Trust is available in the Statement of Additional Information (“SAI”) of each Fund. To obtain a free copy of the SAI, please call 1-800-487-7626.
Hussman Investment Trust
Other Information (Unaudited) |
|
A description of the policies and procedures the Funds use to determine how to vote proxies relating to portfolio securities is available without charge upon request by calling toll-free 1-800-HUSSMAN (1-800-487-7626), or on the SEC’s website at www.sec.gov. Information regarding how the Funds voted proxies relating to portfolio securities during the most recent 12-month period ended June 30 is also available without charge upon request by calling toll-free 1-800-HUSSMAN, or on the SEC’s website at www.sec.gov.
Each Fund files a complete listing of portfolio holdings with the SEC as of the end of the first and third quarters of each fiscal year as an exhibit to each Fund’s Form N-PORT. The filings are available upon request, by calling 1-800-HUSSMAN (1-800-487-7626). You may also obtain copies of these filings on the SEC’s website at www.sec.gov.
Federal Tax Information (Unaudited)
|
|
In accordance with federal tax requirements, the following provides shareholders with information concerning distributions from ordinary income made by the Funds during the fiscal year ended June 30, 2020. Certain dividends paid by the Funds may be subject to a maximum tax rate of 23.8%. Hussman Strategic Growth Fund, Hussman Strategic Allocation Fund, Hussman Strategic Total Return Fund and Hussman Strategic International Fund intend to designate up to a maximum amount of $4,497,796, $2,121, $1,974,954 and $119,506, respectively, as taxed at a maximum rate of 23.8%. For the fiscal year ended June 30, 2020, 100%, 100%, 17% and 100% of the dividends paid from ordinary income by Hussman Strategic Growth Fund, Hussman Strategic Allocation Fund, Hussman Strategic Total Return Fund and Hussman Strategic International Fund, respectively, qualified for the dividends received deduction for corporations.
As required by federal regulations, the Trust will send to each shareholder complete information regarding dividends and other distributions of the Funds for 2020 on Form 1099-DIV.
Hussman Investment Trust
Approval of Investment Advisory Agreements |
(Unaudited) |
At a meeting held on June 4, 2020, the Board of Trustees (the “Board”) of Hussman Investment Trust, including the Trustees who are not “interested persons,” as defined by the Investment Company Act of 1940, of the Trust (the “Independent Trustees”) voting separately, reviewed and unanimously approved the continuance, for an additional annual period, of the Investment Advisory Agreements between the Trust and Hussman Strategic Advisors, Inc. (the “Adviser”) on behalf of each of Hussman Strategic Growth Fund (the “Growth Fund”), Hussman Strategic Total Return Fund (the “Total Return Fund”) and Hussman Strategic International Fund (the “International Fund,” and together with the Growth Fund and the Total Return Fund, the “Funds” for purposes of the discussion that follows). The Board did not review or approve the continuance of the Investment Advisory Agreement between the Trust and the Adviser on behalf of Hussman Strategic Allocation Fund at its meeting because that agreement has an initial term that does not expire until August 26, 2021.
In determining whether to approve continuances of the Investment Advisory Agreements of the Funds (the “Advisory Agreements”), the Independent Trustees requested and received from the Adviser such information as they deemed reasonably necessary to evaluate the terms of the Advisory Agreements and to assess whether the Advisory Agreements continue to be in the best interests of the Funds and their shareholders. In addition to reviewing and considering this information, the Independent Trustees considered information relating to the Funds and the Adviser that was provided to them in connection with meetings of the Board held throughout the year. They reviewed and considered, among other things: (i) the nature, extent and quality of the services provided by the Adviser to each of the Funds; (ii) the investment performance of each of the Funds; (iii) comparisons of the advisory fees and expenses of the Funds to the fees and expenses of peer groups of mutual funds; (iv) the Adviser’s costs of providing services to the Funds and the profits realized by the Adviser from its relationship with the Funds; (v) whether economies of scale in the Adviser’s costs of providing services have been realized from growth of the Funds’ assets; and (vi) whether the advisory fees payable by each Fund reflect an appropriate sharing of any such economies with such Fund for the benefit of the Fund and its shareholders. The Independent Trustees also reviewed the background, qualifications, education and experience of the Adviser’s investment professionals and support personnel, and discussed and considered: (i) the quality of shareholder communications, administrative functions and other services provided by the Adviser to the Trust and each of the Funds; (ii) the quality of the Adviser’s compliance program; (iii) the Adviser’s role in coordinating and supervising services provided to the Trust; and (iv) indirect benefits that the Adviser may derive from its relationship with the Funds. The Independent Trustees were advised and
Hussman Investment Trust
Approval of Investment Advisory Agreements |
(Unaudited) (continued) |
supported in this process by independent legal counsel and, prior to voting, met with and asked questions of representatives of the Adviser, including Dr. John Hussman, and met separately with their counsel.
The Adviser provided the Independent Trustees with extensive information to assist them in analyzing both the absolute and risk-adjusted returns of the Funds over various periods. In these materials, the returns of each Fund were compared to the returns of relevant indices and to the average returns of one or more selected peer groups of mutual funds.
The analyses and comparisons provided by the Adviser showed that the Growth Fund modestly underperformed the S&P 500 Index for the one year period ended April 30, 2020, returning –0.36% versus a return of 0.86% for the Index for that period. The information provided further showed that, since its inception on July 24, 2000 through April 30, 2020, the Growth Fund generated an average annual total return of 0.28%, compared with an average annual total return of 5.59% for the S&P 500 Index for that period. However, the analyses also showed that, since inception, the Growth Fund’s hedging strategies have generally been successful in reducing the volatility of an investment in the Fund as compared to the volatility of relevant securities indices.
The Independent Trustees observed that, although the Growth Fund underperformed the S&P 500 Index from 2009 to date, this period represents only half of a full market cycle and that the Fund’s outperformance of the Index prior to 2009 was substantial. They reviewed the Fund’s performance over various periods as compared to the performance of mutual funds categorized by Morningstar, Inc. as U.S. Market Neutral and U.S. Long-Short Equity. They recognized that the Fund’s performance during various recent multi-year periods lagged the average performance of these other mutual funds, but noted that, for the one year period ended April 30, 2020, the Growth Fund’s investment performance exceeded the average performance of funds included in each of these Morningstar fund categories. The Independent Trustees also noted that the Fund’s 2020 year-to-date performance through April 30, 2020 – a period of significant market volatility - was 10.06%, which exceeded the -9.29% return of the S&P 500 Index for that period.
Information provided to the Board indicated that, over the long term, the Adviser’s stock selection record for the Growth Fund has been acceptable and that the underperformance of the Fund in recent years is largely attributable to the Fund’s use of hedging techniques and the nature of the Fund’s alternative investment approach, which is not intended to track general stock market movements. In evaluating the Growth Fund’s investment performance, the Independent Trustees recognized that the
Hussman Investment Trust
Approval of Investment Advisory Agreements |
(Unaudited) (continued) |
use of hedging is an integral part of the Fund’s investment program and that, although this has caused the Fund’s significant underperformance since 2009, the Adviser has managed the investment portfolio of the Growth Fund in a manner consistent with the Fund’s investment objective and policies, and with the Adviser’s investment methodology, as described in the Fund’s prospectus. The Independent Trustees also recognized that the Adviser has adapted and refined the models and analytics it uses in managing the Growth Fund in seeking to address the Fund’s underperformance and noted that the Adviser has from time to time implemented various modifications in its analytics and restrictions in its hedging approach with the goals of improving the investment performance of the Fund over the long term and reducing the risks and costs of its hedging strategy.
In reviewing the performance of the Total Return Fund, the Independent Trustees took note of the fact that the Fund outperformed the Bloomberg Barclays U.S. Aggregate Bond Index for the one year period ended April 30, 2020, returning 16.75% versus a return of 10.84% for the Index. They also considered that the Total Return Fund’s average annual total return of 5.05% since its inception on September 12, 2002 through April 30, 2020 compares favorably to the 4.45% average annual total return of the Bloomberg Barclays U.S. Aggregate Bond Index for that period. In addition, the Independent Trustees compared the performance of the Total Return Fund for various periods to the performance of mutual funds categorized by Morningstar as U.S. Tactical Allocation and U.S. Multisector Bond. They noted that the performance of the Total Return Fund exceeded the average performance of funds included by Morningstar in each of these categories for the 1-, 3-, 5- and 10-year periods ended April 30, 2020, as well as since inception of the Fund (September 12, 2002).
With respect to the International Fund, the Independent Trustees took note of the fact that the Fund outperformed the MSCI Europe, Australasia, Far East (“EAFE”) Index for the one year period ended April 30, 2020, returning –1.19% versus a return of –11.34% for the Index. They also considered the fact that the International Fund’s average annual total return of –1.22% since its inception on December 31, 2009 through April 30, 2020 lagged the 3.34% average annual total return of the MSCI EAFE Index for that period. In addition, the Independent Trustees compared the Fund’s performance over various periods to mutual funds in various pertinent Morningstar categories, including Foreign Large Blend, and noted that the total returns of the International Fund exceeded the average total returns of Foreign Large Blend funds for each of the 1-, 3- and 5-year periods ended April 30, 2020 (but underperformed these funds for the 10-year period ended on such date and for the period since the Fund’s inception on December 31, 2009 through April 30, 2020). In their evaluation of the
Hussman Investment Trust
Approval of Investment Advisory Agreements |
(Unaudited) (continued) |
investment performance of the International Fund, the Independent Trustees observed that, since its inception, the Fund has maintained a defensive investment position in which it has been substantially fully hedged against the impact of general market fluctuations. They also observed, however, that the International Fund has experienced considerably less downside risk since its inception than would have resulted from use of a passive investment approach. In this regard, the Independent Trustees noted that the International Fund’s 2020 year-to-date performance through April 30, 2020 was -4.51%, versus a return of -17.84% for the MSCI EAFE Index for that period. They also noted that the Fund has not been in existence for a full market cycle, making it difficult to evaluate the Fund’s long-term investment performance relative to its investment objective.
In evaluating the advisory fees payable by the Funds and the Funds’ expense ratios, the Independent Trustees reviewed comparative expense and advisory fee information for peer groups of mutual funds based on investment style.
With respect to advisory fees, the Independent Trustees concluded that the advisory fee of the Growth Fund, computed at the annual rate of 0.90% of average daily net assets (based on the Fund’s then current asset level), compares favorably to the average advisory fees payable by mutual funds categorized by Morningstar as U.S. Long-Short Equity or U.S. Market Neutral. The Independent Trustees also concluded that the advisory fee of the Total Return Fund, computed at the annual rate of 0.50% of average daily net assets (based on the Fund’s then current asset level), is within the range of advisory fees of other funds of similar size investing in similar securities. The Independent Trustees observed that the advisory fee of the International Fund, computed at the annual rate of 0.95% of average daily net assets (based on the Fund’s then current asset level), is higher than the advisory fee rates of most other international stock funds, but noted that the Fund’s fee rate is less than the average advisory fee rates payable by mutual funds categorized by Morningstar as U.S. Long-Short Equity or U.S. Market Neutral. They noted in this regard that, unlike many international stock funds and similar to “long-short” and “market neutral” mutual funds, the International Fund employs an investment strategy that incorporates risk management and hedging techniques. Thus, the Independent Trustees concluded that the advisory fee payable by the International Fund is appropriate. With respect to each of the Funds, the Independent Trustees determined that the fees payable to the Adviser appropriately reflect the nature and scope of services provided by the Adviser (which are broader than the norm) and the value to the Funds of the Adviser’s experience, expertise and analytic capabilities. They also determined that the advisory fee schedules of the Funds, which include breakpoints in the fee rates applicable to net assets in excess of
Hussman Investment Trust
Approval of Investment Advisory Agreements |
(Unaudited) (continued) |
specified levels, provide the opportunity for each of the Funds and its shareholders to participate in economies of scale in the Adviser’s costs of providing services that may be associated with potential future growth of the Funds’ assets.
With respect to the total expenses of the Funds, the Independent Trustees considered the fact that the expense ratios of the Growth Fund and the Total Return Fund, both before and after advisory fee reductions pursuant to the Adviser’s agreement to waive its fees or to absorb expenses of the Funds as necessary to maintain the operating expenses of the Funds (excluding acquired fund fees and expenses, brokerage commissions, taxes, interest expense and any extraordinary expenses) at specified levels, are less than the averages for their respective peer group funds. They noted in this regard that the Growth Fund has one of the lowest expense ratios among mutual funds categorized by Morningstar as U.S. Long-Short Equity or U.S. Market Neutral. They further noted that, notwithstanding the significant decline in the net assets of the Growth Fund in recent years, the expense ratio of the Fund (after fee waivers) has not increased significantly and, in addition, that the Fund has continued to benefit from reductions in the contractual fee rates payable pursuant to its Advisory Agreement that were implemented when the Fund’s assets were substantially greater. With respect to the Total Return Fund, the Independent Trustees noted that the Fund’s expense ratio is less than the average expense ratio of mutual funds categorized by Morningstar as U.S. Tactical Allocation or U.S. Multisector Bond. They also noted that, from time to time since each such Fund’s inception, its expense ratio was reduced through the introduction of advisory fee breakpoints. In addition, the Independent Trustees considered the fact that, since March 2013, the Adviser has contractually been waiving a portion of its fees to reduce the total ordinary operating expenses of the Growth Fund and the Total Return Fund, and most recently has agreed to waive its advisory fees or to absorb operating expenses of these Funds until at least November 1, 2020, to the extent necessary to limit the total annual operating expenses of the Growth Fund and the Total Return Fund (excluding acquired fund fees and expenses, brokerage commissions, taxes, interest expense and any extraordinary expenses) to 1.15% and 0.75%, respectively, of average daily net assets.
The Independent Trustees also reviewed comparative information relating to the total expenses of the International Fund. They noted that the expense ratio of the International Fund is higher than many other mutual funds that have similar investment strategies. However, the Independent Trustees considered the fact that this higher expense ratio is attributable, in part, to the small size of the International Fund and took into consideration the expense limitation arrangement under which the Adviser has contractually agreed to waive its advisory fees or to absorb operating expenses of
Hussman Investment Trust
Approval of Investment Advisory Agreements |
(Unaudited) (continued) |
the Fund until at least November 1, 2020, to the extent necessary to limit total annual ordinary operating expenses of the Fund (excluding acquired fund fees and expenses, brokerage commissions, taxes, interest expense and any extraordinary expenses) to 2.00% of average daily net assets. The Independent Trustees also considered the fact that the Adviser agreed several years ago to a revised schedule of advisory fee rates which resulted in an immediate reduction in the effective advisory fee rate of the International Fund of 0.05% of average daily net assets (based on the Fund’s then current asset level). They concluded that the International Fund has benefited and continues to benefit from a reduction in advisory fee rates and expense limitation arrangements that have enabled it to maintain an expense ratio within the range of expense ratios of its peer group funds.
In evaluating the expense ratios of the Funds, the Independent Trustees recognized that, although under the expense limitation agreements currently in effect the Adviser may be entitled to be reimbursed by a Fund for all or a portion of fees waived and expenses absorbed by the Adviser, any such reimbursement could not result in the expense ratio of a Fund (excluding acquired fund fees and expenses, brokerage commissions, taxes, interest expense and any extraordinary expenses) exceeding the lesser of: (i) the expense limitation in effect for the Fund at the time of the fee waiver or expense absorption by the Adviser; and (ii) the expense limitation (if any) in effect at the time of reimbursement by the Fund. The Independent Trustees were cognizant of the fact that the current expense limitation agreement for each Fund remains in effect only until November 1, 2020, but recognized that the Adviser has historically agreed to continuing such agreements in effect from year to year (either without change or with only relatively minor upward adjustment in the applicable expense limitation).
The Independent Trustees also reviewed recent financial statements of the Adviser, as well as schedules showing the Adviser’s estimated revenues, expenses and profitability with respect to each of the Funds for calendar years 2017, 2018 and 2019 and for the first four months of 2020. They noted that the Adviser has waived the fees payable to it by the Funds, thereby reducing its profitability, pursuant to expense limitation agreements. They recognized that, although the Adviser has realized significant profits over the years from its advisory relationship with each Fund and that the Adviser’s profit margins associated with providing services to each Fund have been significant at times, the Adviser’s profitability with respect to each of the Funds was not excessive when viewed in light of the scope of services provided by the Adviser and the Adviser’s adherence to its stated investment philosophy and the investment programs of the Funds. The Independent Trustees also recognized that the Adviser’s profitability with respect to each Fund has declined significantly in recent
Hussman Investment Trust
Approval of Investment Advisory Agreements |
(Unaudited) (continued) |
years as a consequence of declines in the total net assets of the Funds. In evaluating the Adviser’s profitability, the Independent Trustees considered the broad and unique skill set and talent of the Adviser that is required for the Adviser to pursue and to adhere to the Funds’ well-defined and disciplined investment programs, which has been a primary attraction of the Funds to investors. They determined that, notwithstanding a decline in the Adviser’s revenues and the resulting decrease in its profitability, the Adviser has available financial resources sufficient to enable it to continue to provide all required services to the Funds, without diminution of service quality, and that, to the extent declines in the net assets of the Funds has reduced (or may in the future reduce further) the Adviser’s revenues, the Adviser has been able (and is expected to be able) to reduce its expenses or access capital resources so as to enable the scope and quality of services provided to the Funds to be maintained.
Based on a careful review of the investment performance and risk characteristics of the Funds and consideration of other matters deemed by them to be pertinent (including, but not limited to, the factors and information discussed above), the Independent Trustees concluded that the Adviser has provided all required services to the Funds in a satisfactory manner. They determined that this conclusion is supported by the nature and scope of advisory services required by the Funds, which are broader and more sophisticated than those required by many other mutual funds due to the nature of the Funds’ investment programs and which involve extensive use of risk-management techniques. The Independent Trustees also considered the fact that the Adviser has generally achieved lower volatility of investment returns for the Funds than would have resulted from use of a passive investment approach. They recognized that challenges associated with the Adviser’s hedging approach have reduced the returns of the Growth Fund and the International Fund in the period since 2009, but noted that the Adviser has implemented meaningful changes in its methodologies since 2009 that may operate to reduce the frequency of similar challenges in future market cycles while maintaining the favorable attributes that the Adviser’s hedging strategies exhibited in the years prior to 2009. In this regard, the Independent Trustees specifically considered the fact that, except for the 12-month period ended April 30, 2020, the investment performance of the Funds has in recent years generally been disappointing, and they considered whether, under such circumstances, it would be appropriate and consistent with their duties and the interests of the Funds to approve the continuance of each of the Advisory Agreements, as proposed.
The Independent Trustees concluded that the Adviser has consistently taken a proactive stance with regard to shareholder protections, service quality and ethical standards. Among other things, they noted that the Adviser: (i) does not derive any
Hussman Investment Trust
Approval of Investment Advisory Agreements |
(Unaudited) (continued) |
material indirect benefits from its relationship with the Funds; (ii) does not derive any economic benefit in connection with transactions in shares of the Funds; and (iii) adheres to a brokerage placement policy that seeks to obtain best execution and low commissions on all of the Funds’ brokerage transactions and does not direct transactions to obtain “soft dollar” services, which has resulted in significant savings to the Funds and their shareholders by reducing transaction costs (which are not reflected in the expense ratios of the Funds) and has operated to increase the Funds’ investment performance after expenses. The Independent Trustees thought it was significant that Dr. John Hussman and other personnel of the Adviser, and their immediate family members and charitable entities, maintain substantial investments in the Funds, which helps to align the interests of the Adviser and its personnel with the interests of shareholders.
After evaluating all pertinent factors and information (including but not limited to the factors and information discussed above), the Board determined that the fees payable by each Fund pursuant to the Advisory Agreements are appropriate in view of the nature, scope and quality of services provided by the Adviser and determined that continuances of the Advisory Agreements are in the best interests of the Funds and their shareholders. Accordingly, the Board voted unanimously to approve the continuance of each of the Advisory Agreements for an additional annual period. No single factor was considered in isolation or to be determinative to this decision.
Hussman Investment Trust
Discussion of Liquidity Risk Management Program |
(Unaudited) |
As required by Rule 22e-4 under the 1940 Act, the Trust has adopted a liquidity risk management program (the “Program”) and has designated persons to be responsible for administering the Program (the “Program Administrators”). In connection with its meeting on June 4, 2020, the Board was presented with and considered a written report from the Program Administrators addressing the operation of the Program and assessing its adequacy and the effectiveness of its implementation for the period commencing with the Program’s implementation on December 1, 2019 through March 31, 2020. The Program Administrators took into account the liquidity of each Fund in relation to its investment strategies, short-term and long-term cash flow projections, borrowing arrangements and cash positions. Based upon these and other pertinent factors, the Program Administrators determined that each of the Funds primarily holds highly liquid securities, and that there has been no unusual stress or disruption from any redemption activity since the implementation of the Program.
The Program Administrators concluded that the Program is reasonably designed and has been effectively implemented. They further concluded that the combination of the diversification of portfolio holdings, the Adviser’s ability to execute trades without significant cost impact, the infrequency of significant daily redemptions, and the record of each Fund’s daily holdings of cash and cash equivalents, mitigate against the risk that a Fund would be unable to meet a shareholder request to redeem shares without significant dilution of the interests of remaining investors in the Fund. Despite the uncertainty and market volatility arising as a consequence of the COVID-19 pandemic, the Funds have not experienced execution or settlement issues with respect to their portfolio trades.
THIS PAGE INTENTIONALLY LEFT BLANK.

INVESTMENT ADVISER
Hussman Strategic Advisors, Inc.
6021 University Boulevard, Suite 490
Ellicott City, Maryland 21043
www.hussmanfunds.com
1-800-HUSSMAN (1-800-487-7626)
ADMINISTRATOR/TRANSFER AGENT
Ultimus Fund Solutions, LLC
225 Pictoria Drive, Suite 450
Cincinnati, Ohio 45246
CUSTODIANS
U.S. Bank, N.A.
425 Walnut Street
Cincinnati, Ohio 45202
The Northern Trust Company
50 South LaSalle Street
Chicago, Illinois 60675
INDEPENDENT REGISTERED
PUBLIC ACCOUNTING FIRM
Ernst & Young LLP
221 East 4th Street
Suite 2900
Cincinnati, Ohio 45202
LEGAL COUNSEL
Schulte Roth & Zabel LLP
919 Third Avenue
New York, New York 10022
This Report is authorized for
distribution only if accompanied or preceded
by a current Prospectus of the Funds.
As of the end of the period covered by this report, the registrant has adopted a code of ethics that applies to the registrant’s principal executive officer, principal financial officer, principal accounting officer or controller, or persons performing similar functions, regardless of whether these individuals are employed by the registrant or a third party. Pursuant to Item 12(a)(1), a copy of registrant’s code of ethics is filed as an exhibit to this Form N-CSR. During the period covered by this report, the code of ethics has not been amended, and the registrant has not granted any waivers, including implicit waivers, from the provisions of the code of ethics.
| Item 3. | Audit Committee Financial Expert. |
The registrant’s board of trustees has determined that the registrant does not have an audit committee financial expert serving on its audit committee. The audit committee determined that, although none of its members meet the technical definition of an audit committee financial expert, the members have sufficient financial expertise to address any issues that are likely to come before the committee. After evaluation of the accounting environment within which the registrant operates, it was the consensus of the audit committee members that it is not necessary at the present time for the committee to seek to recruit an additional trustee who would qualify as an audit committee financial expert. It was the view of the committee that, if novel issues ever arise, it will hire an expert to assist it as needed.
| Item 4. | Principal Accountant Fees and Services. |
| (a) | Audit Fees. The aggregate fees billed for professional services rendered by the principal accountant for the audit of the registrant’s annual financial statements or for services that are normally provided by the accountant in connection with statutory and regulatory filings or engagements were $137,000 and $99,600 with respect to the registrant’s fiscal years ended June 30, 2020 and 2019, respectively. |
| (b) | Audit-Related Fees. No fees were billed during the fiscal years ended June 30, 2020 and 2019 for assurance and related services by the principal accountant that are reasonably related to the performance of the audit of the registrant’s financial statements and are not reported under paragraph (a) of this Item. |
| (c) | Tax Fees. The aggregate fees billed for professional services rendered by the principal accountant for tax compliance, tax advice, and tax planning were $33,600 and $38,720 with respect to the registrant’s fiscal years ended June 30, 2020 and 2019, respectively. The services comprising these fees are the computation of required distributions; the preparation of the registrant’s federal income and excise tax returns; and, with respect to the fiscal year ended June 30, 2019, the preparation of application forms and documentation to qualify for a reduced rate of German withholding taxes. |
| (d) | All Other Fees. No fees were billed in either of the last two fiscal years for products and services provided by the principal accountant, other than the services reported in paragraphs (a) through (c) of this Item. |
| (e)(1) | The audit committee has adopted pre-approval policies and procedures described in paragraph (c)(7) of Rule 2-01 of Regulation S-X. Pursuant to the pre-approval policies and procedures, the audit committee has pre-approved certain audit, audit-related and tax services and has established, with respect to each fiscal year of the registrant, the following maximum fee levels for services covered under the pre-approval policies and procedures: |
| • | Services associated with SEC registration statements filed by the registrant with the SEC or other documents issued by the registrant in connection with securities offerings and assistance in responding to SEC comment letters – $6,000 |
| • | Consultations with management of the registrant as to the accounting or disclosure treatment of transactions or events and/or the actual or potential impact of final or proposed rules, standards or interpretations by the SEC, FASB or other regulatory or standard setting bodies – $6,000 |
| • | All additional tax services provided to the registrant in the aggregate – $6,000 |
| (e)(2) | None of the services described in paragraph (b) through (d) of this Item were approved by the audit committee pursuant to paragraph (c)(7)(i)(C) of Rule 2-01 of Regulation S-X. |
| (f) | Less than 50% of hours expended on the principal accountant’s engagement to audit the registrant’s financial statements for the most recent fiscal year were attributed to work performed by persons other than the principal accountant’s full-time, permanent employees. |
| (g) | During the fiscal years ended June 30, 2020 and 2019, aggregate non-audit fees of $33,600 and $38,720, respectively, were billed by the registrant’s principal accountant for services rendered to the registrant. No non-audit fees were billed in either of the last two fiscal years by the registrant’s principal accountant for services rendered to the registrant’s investment adviser (not including any sub-adviser whose role is primarily portfolio management and is subcontracted with or overseen by another investment adviser), and any entity controlling, controlled by, or under common control with the adviser that provides ongoing services to the registrant. |
| (h) | The principal accountant has not provided any non-audit services to the registrant’s investment adviser (not including any sub-adviser whose role is primarily portfolio management and is subcontracted with or overseen by another investment adviser), and any entity controlling, controlled by, or under common control with the investment adviser that provides ongoing services to the registrant. |
| Item 5. | Audit Committee of Listed Registrants. |
Not applicable
| (a) | Not applicable [schedule filed with Item 1] |
| Item 7. | Disclosure of Proxy Voting Policies and Procedures for Closed-End Management Investment Companies. |
Not applicable
| Item 8. | Portfolio Managers of Closed-End Management Investment Companies |
Not applicable
| Item 9. | Purchases of Equity Securities by Closed-End Management Investment Company and Affiliated Purchasers. |
Not applicable
| Item 10. | Submission of Matters to a Vote of Security Holders. |
The registrant has not adopted procedures by which shareholders may recommend nominees to the registrant’s board of trustees.
| Item 11. | Controls and Procedures. |
(a) Based on their evaluation of the registrant’s disclosure controls and procedures (as defined in Rule 30a-3(c) under the Investment Company Act of 1940) as of a date within 90 days of the filing date of this report, the registrant’s principal executive officer and principal financial officer have concluded that such disclosure controls and procedures are reasonably designed and are operating effectively to ensure that material information relating to the registrant, including its consolidated subsidiaries, is made known to them by others within those entities, particularly during the period in which this report is being prepared, and that the information required in filings on Form N-CSR is recorded, processed, summarized, and reported on a timely basis.
(b) There were no changes in the registrant’s internal control over financial reporting (as defined in Rule 30a-3(d) under the Investment Company Act of 1940) that occurred during the second fiscal quarter of the period covered by this report that have materially affected, or are reasonably likely to materially affect, the registrant’s internal control over financial reporting.
| Item 12. | Disclosure of Securities Lending Activities for Closed-End Management Investment Companies. |
Not applicable
File the exhibits listed below as part of this Form. Letter or number the exhibits in the sequence indicated.
(a)(1) Any code of ethics, or amendment thereto, that is the subject of the disclosure required by Item 2, to the extent that the registrant intends to satisfy the Item 2 requirements through filing of an exhibit: Attached hereto
(a)(2) A separate certification for each principal executive officer and principal financial officer of the registrant as required by Rule 30a-2(a) under the Act (17 CFR 270.30a-2(a)): Attached hereto
(a)(3) Any written solicitation to purchase securities under Rule 23c-1 under the Act (17 CFR 270.23c-1) sent or given during the period covered by the report by or on behalf of the registrant to 10 or more persons: Not applicable
(a)(4) Change in the registrant’s independent public accountant: Not applicable
(b) Certifications required by Rule 30a-2(b) under the Act (17 CFR 270.30a-2(b)): Attached hereto
SIGNATURES
Pursuant to the requirements of the Securities Exchange Act of 1934 and the Investment Company Act of 1940, the registrant has duly caused this report to be signed on its behalf by the undersigned, thereunto duly authorized.
| (Registrant) | Hussman Investment Trust | | |
| | | | |
| By (Signature and Title)* | /s/ John P. Hussman | |
| | | John P. Hussman, President | |
| | | | |
| Date | August 27, 2020 | | |
Pursuant to the requirements of the Securities Exchange Act of 1934 and the Investment Company Act of 1940, this report has been signed below by the following persons on behalf of the registrant and in the capacities and on the dates indicated.
| By (Signature and Title)* | /s/ John P. Hussman | |
| | | John P. Hussman, President | |
| | | | |
| Date | August 27, 2020 | | |
| | | | |
| By (Signature and Title)* | /s/ Mark J. Seger | |
| | | Mark J. Seger, Treasurer | |
| | | | |
| Date | August 27, 2020 | | |
| * | Print the name and title of each signing officer under his or her signature. |