| | OMB APPROVAL |
| | OMB Number: 3235-0570
Expires: July 31, 2022
Estimated average burden hours per response: 20.6 |
UNITED STATES
SECURITIES AND EXCHANGE COMMISSION
Washington, D.C. 20549
FORM N-CSR
CERTIFIED SHAREHOLDER REPORT OF
REGISTERED MANAGEMENT INVESTMENT COMPANIES
| Investment Company Act file number | 811-09911 | |
| Hussman Investment Trust |
| (Exact name of registrant as specified in charter) |
| 6021 University Boulevard, Suite 490 Ellicott City, Maryland | 21043 |
| (Address of principal executive offices) | (Zip code) |
John F. Splain
| Ultimus Fund Solutions, LLC | 225 Pictoria Drive, Suite 450 | Cincinnati, Ohio 45246 |
| (Name and address of agent for service) |
| Registrant's telephone number, including area code: | (513) 587-3400 | |
| Date of fiscal year end: | June 30, 2021 | |
| Date of reporting period: | June 30, 2021 | |
Form N-CSR is to be used by management investment companies to file reports with the Commission not later than 10 days after the transmission to stockholders of any report that is required to be transmitted to stockholders under Rule 30e-1 under the Investment Company Act of 1940 (17 CFR 270.30e-1). The Commission may use the information provided on Form N-CSR in its regulatory, disclosure review, inspection, and policymaking roles.
A registrant is required to disclose the information specified by Form N-CSR, and the Commission will make this information public. A registrant is not required to respond to the collection of information contained in Form N-CSR unless the Form displays a currently valid Office of Management and Budget ("OMB") control number. Please direct comments concerning the accuracy of the information collection burden estimate and any suggestions for reducing the burden to Secretary, Securities and Exchange Commission, 450 Fifth Street, NW, Washington, DC 20549-0609. The OMB has reviewed this collection of information under the clearance requirements of 44 U.S.C. § 3507.
Item 1. Reports to Stockholders.

HUSSMAN INVESTMENT TRUST
HUSSMAN STRATEGIC GROWTH FUND
HUSSMAN STRATEGIC ALLOCATION FUND
HUSSMAN STRATEGIC TOTAL RETURN FUND
HUSSMAN STRATEGIC INTERNATIONAL FUND
ANNUAL REPORT
June 30, 2021
Table of Contents
| | |
Performance Information | |
Hussman Strategic Growth Fund | 1 |
Hussman Strategic Allocation Fund | 2 |
Hussman Strategic Total Return Fund | 3 |
Hussman Strategic International Fund | 4 |
Letter to Shareholders | 5 |
Portfolio Information | 18 |
Schedules of Investments | |
Hussman Strategic Growth Fund | 21 |
Hussman Strategic Allocation Fund | 34 |
Hussman Strategic Total Return Fund | 48 |
Hussman Strategic International Fund | 52 |
Statements of Assets and Liabilities | 61 |
Statements of Operations | 63 |
Statements of Changes in Net Assets | |
Hussman Strategic Growth Fund | 65 |
Hussman Strategic Allocation Fund | 66 |
Hussman Strategic Total Return Fund | 67 |
Hussman Strategic International Fund | 68 |
Financial Highlights | |
Hussman Strategic Growth Fund | 69 |
Hussman Strategic Allocation Fund | 70 |
Hussman Strategic Total Return Fund | 71 |
Hussman Strategic International Fund | 72 |
Notes to Financial Statements | 73 |
Report of Independent Registered Public Accounting Firm | 99 |
About Your Funds’ Expenses | 101 |
Board of Trustees and Officers | 103 |
Other Information | 105 |
Federal Tax Information | 105 |
Approval of Investment Advisory Agreements | 106 |
Discussion of Liquidity Risk Management Program | 114 |

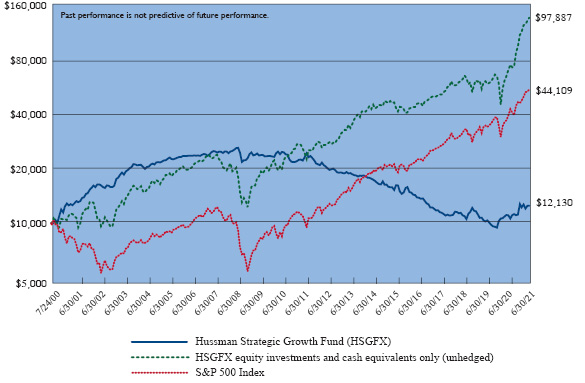
Hussman Strategic Growth Fund
Comparison of the Change in Value of a $10,000 Investment in
Hussman Strategic Growth Fund versus the S&P 500 Index(a) (Unaudited)
Average Annual Total Returns For Periods Ended June 30, 2021 |
| | 1 Year | 3 Years | 5 Years | 10 Years | Since
Inception(b) | |
Hussman Strategic Growth Fund(c)(d) | 10.80% | 2.65% | (2.35%) | (5.00%) | 0.93% | |
S&P 500 Index | 40.79% | 18.67% | 17.65% | 14.84% | 7.35% | |
(a) | Hussman Strategic Growth Fund invests primarily in stocks listed on the New York, American, and NASDAQ exchanges and varies its investment exposure to market fluctuations depending on market conditions. The S&P 500 Index is an index of large capitalization stocks. However, the Fund may invest in securities that are not included in the S&P 500 Index and there are no restrictions as to the market capitalization of companies in which the Fund invests. “HSGFX equity investments and cash equivalents only (unhedged)” reflects the performance of the Fund’s stock investments and modest day-to-day cash balances, after fees and expenses, and does not reflect the impact of hedging transactions on the Fund’s overall investment performance. The Fund’s unhedged equity investments do not represent a separately available portfolio, and their performance is presented solely for purposes of comparison and performance attribution. Performance data presented using log scale. Each segment on the vertical axis represents an equivalent percentage change. |
(b) | The Fund commenced operations on July 24, 2000. |
(c) | Returns do not reflect the deduction of taxes a shareholder would pay on Fund distributions or the redemption of Fund shares. |
(d) | The Adviser has contractually agreed to waive its investment advisory fees and/or absorb Fund expenses until at least November 1, 2021 to the extent necessary to limit the Fund’s annual ordinary operating expenses to an amount not exceeding 1.15% annually of the Fund’s average daily net assets. Absent this arrangement, the expense ratio of the Fund for the year ended June 30, 2021 would have been 1.19%. |

Hussman Strategic Allocation Fund
Comparison of the Change in Value of a $10,000 Investment in Hussman Strategic Allocation Fund
versus Benchmark Fixed Allocation Composite(a) (Unaudited)

Average Annual Total Returns For Periods Ended June 30, 2021 |
| | 1 Year | Since
Inception(b) |
Hussman Strategic Allocation Fund(c)(d) | 19.70% | 12.16% |
Benchmark Fixed Allocation Composite | 21.96% | 17.12% |
(a) | Benchmark Fixed Allocation Composite represents the gross investment performance of a portfolio that is invested in securities included in three separate indices, weighted as follows: 60% S&P 500 Index, 30% Bloomberg U.S. Treasury Unhedged Index and 10% Bloomberg U.S. Treasury Bills Index. The Composite represents an investment approach that invests a fixed percentage of assets in stocks, bonds, and money-market securities, with little or no variation. The Fund may invest in securities that are not included in the indices that comprise the Composite. |
(b) | The Fund commenced operations on August 27, 2019. |
(c) | Returns do no reflect the deduction of taxes a shareholder would pay on Fund distributions or the redemptions of Fund shares. |
(d) | The Advisor has contractually agreed to waive its investment advisory fees and/or absorb Fund expenses until at least November 1, 2022 to the extent necessary to limit the Fund’s annual ordinary operating expenses to an amount not exceeding 1.25% annually of the Fund’s average daily net assets. Absent this arrangement, the expense ratio of the Fund for the year ended June 30, 2021 would have been 2.87%. |

Hussman Strategic Total Return Fund
Comparison of the Change in Value of a $10,000 Investment in Hussman Strategic Total Return Fund
versus the Bloomberg U.S. Aggregate Bond Index(a) (Unaudited)

Average Annual Total Returns For Periods Ended June 30, 2021 |
| | 1 Year | 3 Years | 5 Years | 10 Years | Since
Inception(b) | |
Hussman Strategic Total Return Fund(c)(d) | 2.70% | 8.70% | 4.35% | 3.18% | 5.01% | |
Bloomberg U.S. Aggregate Bond Index | (0.33%) | 5.34% | 3.03% | 3.39% | 4.21% | |
(a) | The Bloomberg U.S. Aggregate Bond Index covers the U.S. investment grade fixed rate bond market, with index components for U.S. government, agency and corporate securities. The Fund does not invest solely in securities included in the Bloomberg U.S. Aggregate Bond Index and may invest in other types of bonds, as well as common stocks, exchange-traded funds and other securities. |
(b) | The Fund commenced operations on September 12, 2002. |
(c) | Returns do not reflect the deduction of taxes a shareholder would pay on Fund distributions or the redemption of Fund shares. |
(d) | The Adviser has contractually agreed to waive its investment advisory fees and/or absorb Fund expenses until at least November 1, 2021 to the extent necessary to limit the Fund’s annual ordinary operating expenses to an amount not exceeding 0.75% annually of the Fund’s average daily net assets. |

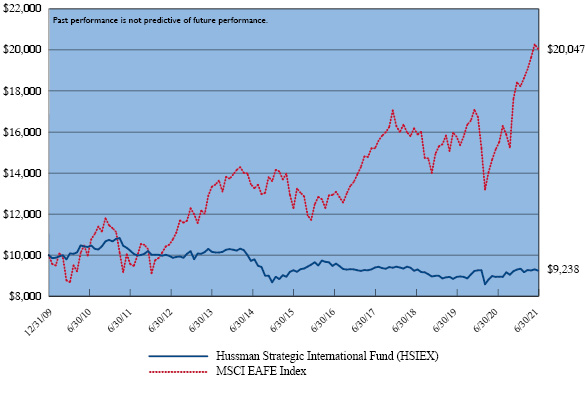
Hussman Strategic International Fund
Comparison of the Change in Value of a $10,000 Investment in
Hussman Strategic International Fund versus the MSCI EAFE Index(a) (Unaudited)
Average Annual Total Returns For Periods Ended June 30, 2021 |
| | 1 Year | 3 Years | 5 Years | 10 Years | Since
Inception(b) | |
Hussman Strategic International Fund(c)(d) | 3.38% | (0.52%) | (0.91%) | (1.43%) | (0.69%) | |
MSCI EAFE Index | 32.35% | 8.27% | 10.28% | 5.89% | 6.24% | |
(a) | The MSCI EAFE (Europe, Australasia, and Far East) Index is a free float-adjusted weighted capitalization index that is designed to measure the equity market performance of developed markets, excluding the U.S. and Canada. As of June 30, 2021, the MSCI EAFE Index consisted of the following 21 developed market country indices: Australia, Austria, Belgium, Denmark, Finland, France, Germany, Hong Kong, Ireland, Israel, Italy, Japan, the Netherlands, New Zealand, Norway, Portugal, Singapore, Spain, Sweden, Switzerland and the United Kingdom. The Fund is not required to invest in each of the countries represented in the MSCI EAFE Index and may invest in securities that are not included in the MSCI EAFE Index. In addition, the Fund varies its exposure to market fluctuations depending on market conditions. |
(b) | The Fund commenced operations on December 31, 2009. |
(c) | Returns do not reflect the deduction of taxes a shareholder would pay on Fund distributions or the redemption of Fund shares. |
(d) | The Adviser has contractually agreed to waive its investment advisory fees and/or absorb Fund expenses until at least November 1, 2021 to the extent necessary to limit the Fund’s annual ordinary operating expenses to an amount not exceeding 2.00% annually of the Fund’s average daily net assets. Absent this arrangement, the expense ratio of the Fund for the year ended June 30, 2021 would have been 3.54%. |
The Hussman Funds
|
Letter to Shareholders | August 6, 2021 |
Dear Shareholder,
“It does not matter, in the short run, whether the beliefs of investors are well-informed or wildly misguided. Over any given segment of the market cycle, it is important to consider whether investors are inclined toward speculation or risk-aversion. If our measures of market internals improve, our near-term outlook will also shift to a more neutral outlook. While current valuation extremes would require some sort of hedge in order to provide a safety net against extended market losses, sufficient improvements relating to market internals, economic data, public health, and other factors could even encourage a moderately constructive outlook, despite our long-term and full-cycle concerns.”
– John P. Hussman, Ph.D., Hussman Funds 2020 Annual Report
We often describe our investment approach as a “value-conscious, historically-informed, full-cycle” investment discipline. Presently, every element of that discipline appears to be at odds with investor sentiment.
Current sentiment certainly does not appear value-conscious. Instead, we observe breathtaking extremes, beyond even 1929 and 2000 levels, in the valuation measures that we find best-correlated with actual subsequent total returns in the Standard & Poor’s 500 Index in market cycles across history.
Current sentiment certainly does not appear historically-informed. If anything, investors appear to be widely convinced that activist central bank interventions have created a “new reality.” According to this view, the only thing needed to avoid any downturn in the economy or the financial markets – regardless of any valuation extreme – is simply for the Federal Reserve to buy interest-bearing Treasury securities and replace them with zero-interest bank reserves.
Current sentiment certainly does not appear to consider full-cycles. Even the March 2020 market low early in the SARS-CoV-2 pandemic left the S&P 500 at twice the run-of-the-mill valuation levels that have been regularly visited or breached by the completion of other market cycles. Yet Wall Street somehow views the present moment as the early phase of a long bull market, despite already establishing the most speculative valuations in U.S. history.
Indeed, as of the fiscal year-end on June 30, 2021, the closest thing to a “full cycle” that we have observed in recent years is the period from the February 19, 2020 pre-pandemic peak in the S&P 500 Index to its subsequent record high on June 30, 2021, with a brief loss of -33.79% in the index in the interim. Market valuations at the trough certainly offered little that could be described as a “margin of safety” from a historical perspective.
The Hussman Funds
|
Letter to Shareholders (continued) |
It seems most appropriate to characterize the February-March 2020 decline as a “panic” or “crisis” rather than a “bear market.” Still, the intervening volatility did create enough dispersion across individual securities to pursue our value-conscious stock-selection discipline, and enough “compression” in short-term market action to justify maintaining a rather neutral market outlook for much of the period since March 2020.
In short, even the “mini-cycle” from the pre-pandemic market peak of February 19, 2020 to the subsequent record high at the June 30, 2021 fiscal year-end provided adequate opportunities for our risk-managed investment discipline. During this period:
Strategic Growth Fund gained 29.16%, compared with a total return of 29.86% for the S&P 500 Index. The deepest interim loss experienced by Strategic Growth Fund during this period was -6.98%, compared with an interim loss of -33.79% for the S&P 500.
Strategic Allocation Fund gained 23.66%, compared with a gain of 20.07% for a benchmark fixed- allocation portfolio invested 60% in the S&P 500, 30% in the Bloomberg U.S. Treasury Unhedged Index, and 10% in the Bloomberg U.S. Treasury Bills Index. The deepest interim loss experienced by Strategic Allocation Fund during this period was -2.81%, compared with -19.93% for the benchmark portfolio.
Strategic Total Return Fund gained 11.60%, compared with a gain of 3.71% in the Bloomberg U.S. Aggregate Bond Index. The deepest interim loss experienced by Strategic Total Return Fund during this period was -7.18%, compared with -6.30% for the Index.
Strategic International Fund lost -0.88%, compared with a gain of 18.27% for the MSCI EAFE Index. The deepest interim loss experienced by Strategic International Fund during this period was -10.26%, compared with -32.68% for the EAFE.
Attending to the drivers of total return
What distinguishes an overvalued market that continues higher from an overvalued market that drops like a rock? I asked that question over two decades ago during the technology bubble. The answer then remains the answer today. When investors are inclined to speculate, they tend to be indiscriminate about it. When investors move toward risk-aversion, they tend to become selective. So we find that the best measure of speculative psychology is the “uniformity” of market action across thousands of individual stocks, industries, sectors, and security-types, including debt securities of varying creditworthiness. In 1998, I described this feature of market action using the phrase “trend uniformity.” In more recent cycles, I’ve used the phrase “market internals.”
The Hussman Funds
|
Letter to Shareholders (continued) |
Market valuations provide an enormous amount of observable information about likely long-term investment returns. Yet over shorter segments of the market cycle, investment returns are far more dependent on whether valuations are being pressed higher or lower. Indeed, these two factors – the level of valuations and the pressure on valuations – are closely tied to the very definition of total return: income plus price change. Our investment discipline is intended to capture these central elements of total return by focusing primarily on two objects:
| | 1) | Prevailing market valuations, which are correlated with both dividend yields and long-term returns, and also provide a sense of how much distance there is between current valuations and their historical norms, and; |
| | 2) | The uniformity or divergence of market internals, which helps to gauge the extent to which speculative investor psychology is pressing valuations higher, or risk-averse psychology is pressing valuations lower. |
Aside from our stock selection discipline, the strongest driver of our investment success in previous complete market cycles was the ability to navigate those two elements, balancing careful attention to both valuations and market internals.
Historically, there was also a third very useful consideration. In prior market cycles, there was typically a “limit” to speculation, which one could identify based on a combination of “overvalued, overbought, overbullish” conditions. Once those features of market action emerged, a panic, air-pocket or crash would typically follow in short order. These outcomes suggested that one should respond pre-emptively, without waiting for deterioration in market internals.
In the 1950’s, psychologist Paul Meehl – an advocate of well-validated models in decision making – called this sort of consideration a “broken leg case”:
“If a sociologist were predicting whether Professor X would go to the movies on a certain night, he might have an equation involving age, academic specialty, and introversion score. The equation might yield a probability of .90 that Professor X will go to the movies tonight. But if the family doctor announced that Professor X had just broken his leg, no sensible sociologist would stick with the equation.”
– Paul Meehl, 1957, When Shall We Use our Heads Instead of the Formula?
Following the global financial crisis (which we correctly anticipated), my insistence on stress-testing our methods against Depression-era data strengthened our attention to “overvalued, overbought, overbullish” features of market action, because of their historical reliability. The Federal Reserve’s deranged experiment with zero interest rates
The Hussman Funds
|
Letter to Shareholders (continued) |
unfortunately created a perfect storm – it was like handing Professor X a handful of narcotics to kill the pain, to the point he would repeatedly hobble to the movies despite having a broken leg worse than Joe Theismann.
Our late-2017 adaptation did not require the introduction of clever or complex new elements. Instead, it required us to “unlearn” the warning signs that historically placed “limits” on speculation, and to instead prioritize valuations and market internals. We had to refrain from adopting a bearish market outlook in response to “overvalued, overbought, overbullish” broken leg conditions, until our measures of market internals also became unfavorable (as they are at present).
In short, we became content to gauge valuations, and the presence or absence of speculative or risk-averse investor psychology, without assuming that there is any well-defined “limit” to either. I certainly expect that we will periodically adopt a hard-negative outlook in hypervalued, overextended market conditions with deteriorating and divergent internals (as is presently the case). But faced with what we view as reckless monetary policies, we have learned to refrain from “fighting” even severely overextended speculation when the uniformity of internals suggests that investors still have the speculative bit in their teeth. The elements of our discipline that we continue to emphasize are also those that we consider to be directly related to the very definition of total return.
Fund Performance
Strategic Growth Fund
In the fiscal year ended June 30, 2021, Strategic Growth Fund gained 10.80%. During the same period, the S&P 500 gained 40.79%. Notably, this period reflects a general market advance during which our most reliable valuation measures averaged 2-3 times their historical norms. The Fund presently maintains a strongly defensive position reflective of extreme valuations and divergence in our measures of market internals. While an improvement in our measures of internals would encourage a more neutral investment outlook, we presently observe a combination of extremes that has often been resolved by sharp market declines – independent of recessions – as occurred in 1987 and 1998.
The hedging stance of the Fund since the beginning of 2020 has varied between a strongly defensive position (particularly before mid-March 2020) and a more neutral near-term outlook (particularly after the mid-March 2020 market low). In recent months, we have attempted to maintain a flexible response to market conditions, particularly valuations and measures of market internals. During the 2021 fiscal year, the hedging
The Hussman Funds
|
Letter to Shareholders (continued) |
strategy of the Fund contributed notably to a reduction in overall risk, as the deepest interim loss experienced by the Fund during this period was -6.70%, compared with an interim loss of -9.52% for the S&P 500 Index.
While recent market conditions have generally encouraged a neutral or defensive market outlook, the recent fiscal year did provide strong opportunities to establish hedged positions in individual stocks. The stock selection approach of Strategic Growth Fund has outperformed the S&P 500 Index by an average of 4.16% (416 basis points) annually since the inception of the Fund on July 24, 2000. During the fiscal year ended June 30, 2021, the performance of the Fund’s stock selections, excluding the impact of hedging, realized a gain of 91.31% versus a 40.79% gain in the S&P 500 Index, largely reflecting our continued emphasis of value-conscious selection. As at other market extremes such as 2000, our stock selection discipline presently avoids large holdings in high-weight components of the S&P 500 that we consider to be overvalued speculative “glamour” stocks.
It is undoubtedly tempting to imagine the ability to choose only the profitable side of a hedged equity position. Because this is not possible, our approach is to maintain a disciplined stock selection strategy at all times, regardless of market valuations, with the expectation that our hedging approach will both mitigate risk and add value over the complete market cycle. This was certainly our experience in complete market cycles prior to 2009. Despite valuations that remained two or three times historical norms, the total return of Strategic Growth Fund during the “mini-cycle” from the February 19, 2020 market peak to the subsequent peak on June 30, 2021 was nearly identical to that of the unhedged S&P 500. Yet neither the stock selection component nor the hedging component of our discipline would have been comfortable by itself. For example, excluding the impact of hedging, the Fund’s stock selections lost -39.64 from the market peak of February 19, 2020 to the market trough of March 23, 2020. The Fund’s hedging strategy instead enabled the Fund to gain 17.33% during that same period.
Our objective is certainly to be generally constructive during cyclical market advances and generally defensive during cyclical market declines. While there is no question that record market valuations weighed against adopting a constructive or unhedged position during the recent fiscal year, I do expect that such opportunities will emerge with adequate regularity over time, even if valuations never again retreat to their historical norms.
From the inception of Strategic Growth Fund on July 24, 2000 through June 30, 2021, the Fund had an average annual total return of 0.93%, compared with an average annual total return of 7.35% for the S&P 500 Index. Given that Strategic
The Hussman Funds
|
Letter to Shareholders (continued) |
Growth Fund outperformed the S&P 500 Index, with smaller periodic losses, from its July 24, 2000 inception through May 20, 2014, the current performance gap is distinctly the result of challenges that we encountered during the speculative bubble of recent years. In late-2017, we adapted our investment discipline in a way that leaves us content to gauge the presence or absence of speculative pressures, without assuming that they have a well-defined limit. We believe that this adaptation has addressed the primary reason behind this period of underperformance.
An initial $10,000 investment in the Fund at its inception on July 24, 2000 would have grown to $12,130, compared with $44,109 for the same investment in the S&P 500 Index. The deepest loss experienced by the Fund since inception was -60.36%. The deepest loss experienced by the S&P 500 Index since the inception of the Fund was -55.25%.
It is notable that from the inception of the Fund on July 24, 2000 through the market low on March 9, 2009, Strategic Growth Fund gained 105.57% (an 8.71% average annual total return) compared with a -45.99% loss in the S&P 500 (a -6.89% average annual loss). The deepest loss experienced by the Fund during this period was -21.45%, compared with a -55.25% loss in the S&P 500.
While there is no assurance that the future performance of the Fund, relative to the S&P 500, will be similar to that of the 2000-2009 period, we do believe that the late-2017 adaptation to our investment discipline addressed the aspect of our investment discipline that was responsible for the departure of the Fund’s performance from our full-cycle expectations in recent years.
Strategic Allocation Fund
In the fiscal year ended June 30, 2021, Strategic Allocation Fund had a total return of 19.70%, compared with a total return of 21.96% in the benchmark fixed allocation composite index which is weighted 60% S&P 500 Index, 30% Bloomberg U.S. Treasury Unhedged Index and 10% Bloomberg U.S. Treasury Bills Index. The Fund always holds unhedged positions of at least 5% in both equity and bond market investments, which has been beneficial during the recent advance to record market highs. The Fund presently holds an unhedged equity position representing approximately 7% of net assets, hedged equities representing approximately 60% of assets, bonds representing approximately 18% of assets, and the remaining assets in money market investments.
From the inception of the Strategic Allocation Fund on August 27, 2019 through June 30, 2021, the Fund had an average annual total return of 12.16%, compared with an average annual total return of 17.12% for the benchmark fixed allocation
The Hussman Funds
|
Letter to Shareholders (continued) |
composite index. An initial $10,000 investment in the Fund at its inception on August 27, 2019 would have grown to $12,357, compared with $13,383 for the same investment in the benchmark fixed allocation composite index. The deepest loss experienced by the Fund since inception was -2.81%. The deepest loss experienced by the benchmark fixed allocation composite index since the inception of the Fund was -19.93%.
Strategic Total Return Fund
In the fiscal year ended June 30, 2021, Strategic Total Return Fund had a total return of 2.70%. During the same period, the Bloomberg U.S. Aggregate Bond Index had a total return of -0.33%. Strategic Total Return Fund held a moderately constructive position in long-term bonds during this period, with a duration typically ranging between 2-3 years (meaning that a 100 basis point move in interest rates would be expected to affect Fund value by about 2-3% on the basis of bond price fluctuations). The Fund currently holds 70% of net assets in Treasury securities, with 14% of assets in shares of companies in the precious metals, energy and utilities sectors. The remaining net assets are invested in money market investments. The Fund benefited from holdings in shares of companies engaged in the mining of precious metals, as well as utilities, largely by varying the size of its investment positions in response to periods of strength and weakness in these sectors. The deepest interim loss experienced by the Fund during this period was -3.56%, compared with an interim loss of -4.01% for the Bloomberg U.S. Aggregate Bond Index.
From the inception of Strategic Total Return Fund on September 12, 2002 through June 30, 2021, the Fund had an average annual total return of 5.01%, compared with an average annual total return of 4.21% for the Bloomberg U.S. Aggregate Bond Index. An initial $10,000 investment in the Fund on September 12, 2002 would have grown to $25,054, compared with $21,692 for the same investment in the Bloomberg U.S. Aggregate Bond Index. The deepest loss experienced by the Fund since inception was -11.52%, compared with a maximum loss of -6.30% for the Bloomberg U.S. Aggregate Bond Index during the same period.
Strategic International Fund
In the fiscal year ended June 30, 2021, Strategic International Fund had a total return of 3.38%. During the same period, the MSCI EAFE Index gained 32.35%. The Fund is currently fully hedged against the impact of market fluctuations. During the second half of 2020, the stock selections of the Fund modestly lagged the MSCI EAFE Index primarily due to differences in sector composition. The Fund held relatively low weightings in financial stocks and industrials, which outperformed the MSCI EAFE
The Hussman Funds
|
Letter to Shareholders (continued) |
Index. Meanwhile, the health care and consumer staples sectors, in which the Fund held moderately higher weightings relative to the Index, trailed the EAFE. The deepest interim loss in Strategic International Equity Fund during this period was -2.89%, compared with an interim loss of -7.28% for the MSCI EAFE Index.
Because international stock markets tend to become highly correlated during steep declines in the U.S. stock market, the downside risk that we observe in the U.S. market exists in international equity markets as well. A material improvement in U.S. conditions, particularly in our measures of market internals, would likely encourage a constructive stance in the international markets as well. Without the elevated level of market risk that we currently observe, the Fund will have substantially greater opportunity to establish a constructive investment stance based on individual country valuations and market action, along with other local considerations.
From the inception of Strategic International Fund on December 31, 2009 through June 30, 2021, the Fund had an average annual total return of -0.69%, compared with an average annual total return of 6.24% for the MSCI EAFE Index. An initial $10,000 investment in the Fund on December 31, 2009 would be worth $9,238, compared with $20,047 for the same investment in the MSCI EAFE Index. The deepest loss experienced by the Fund since inception was -22.87%, compared with a maximum loss of -34.12% for the MSCI EAFE Index during the same period.
Portfolio Composition
As of June 30, 2021, Strategic Growth Fund had net assets of $412,897,982, and held 288 stocks in a wide variety of industries. The largest sector holdings as a percent of net assets were consumer discretionary (23.9%), health care (15.7%), technology (13.9%), consumer staples (13.6%), financials (9.2%), communications (8.1%) and energy (5.4%). The smallest sector holdings were in industrials (4.7%), materials (4.3%), real estate (0.7%) and utilities (0.3%). Exchange-traded funds represented 0.5% of the Fund’s net assets.
Strategic Growth Fund’s holdings of individual stocks and exchange-traded funds as of June 30, 2021 were valued at $414,001,266. Against these stock positions, the Fund also held 540 option combinations (long put option/short call option) on the S&P 500 Index and 750 option combinations on the Russell 2000 Index. The Fund also held 10 long puts on the S&P 500 Index. Each option combination behaves as a short sale on the underlying index, with a notional value of $100 times the index value. On June 30, 2021, the S&P 500 Index closed at 4,297.50, while the Russell
The Hussman Funds
|
Letter to Shareholders (continued) |
2000 Index closed at 2,310.549. The Fund’s total hedge therefore represented a short position of $409,653,675, thereby hedging 98.9% of the dollar value of the Fund’s long investment positions in individual issues.
Although the performance of Strategic Growth Fund’s diversified portfolio cannot be attributed to any narrow group of stocks, the following equity holdings achieved gains in excess of $3.5 million during the fiscal year ended June 30, 2021: Gamestop (reflecting a small position purchased largely on the basis of valuation, which was later sold amid nearly absurd meme-related speculation), JinkoSolar Holding, Hibbett Sports, AMC Networks, Canadian Solar and Editas Medicine. The Fund did not realize any losses in excess of $1 million for equity holdings during this same period.
As of June 30, 2021, Strategic Allocation Fund had net assets of $19,881,242 and held 286 stocks in a wide variety of industries. The largest sector holdings as a percent of net assets were consumer discretionary (16.0%), health care (10.3%), technology (9.5%), consumer staples (9.1%), financials (5.9%) and communications (5.5%). The smallest sector weights were energy (3.6%), industrials (3.1%), materials (2.9%), real estate (0.5%) and utilities (0.2%). Exchange-traded funds represented 0.3% of the Fund’s net assets. Treasury securities with more than one year until maturity represented 12.6% of net assets. The remaining Fund assets were invested in shorter-term Treasury securities and money market funds.
Strategic Allocation Fund’s holdings of individual stocks and exchange-traded funds as of June 30, 2021 were valued at $13,311,737. Against these positions, the Fund also held 15 option combinations (long put option/short call option) on the S&P 500 and 24 option combinations on the Russell 2000 Index. The notional value of this hedge was $11,991,568, hedging 90.1% of the value of equity investments held by the Fund.
In Strategic Allocation Fund, during the period ended June 30, 2021, individual equity portfolio gains in excess of $100,000 were achieved in Gamestop, JinkoSolar Holding, Hibbett Sports, and AMC Networks. The Fund did not realize any losses in excess of $50,000 for equity holdings during this same period.
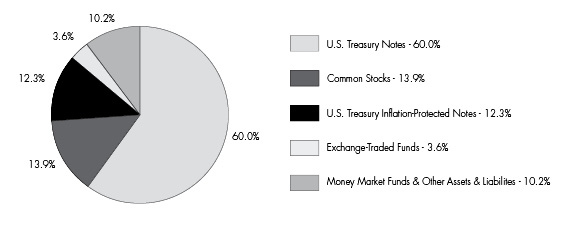
As of June 30, 2021, Strategic Total Return Fund had net assets of $316,538,886. Treasury notes, Treasury Inflation-Protected Securities (TIPS) and investments in money market funds represented 82.4% of the Fund’s net assets. Shares of exchange-traded funds accounted for 3.6% of net assets. Precious metals shares accounted for 6.5% of net assets, and shares in utilities and energy-related companies collectively accounted for 7.4% of net assets.
The Hussman Funds
|
Letter to Shareholders (continued) |
In Strategic Total Return Fund, during the fiscal year ended June 30, 2021, portfolio gains in excess of $1 million were achieved in SM Energy and Laredo Petroleum. The only portfolio losses in excess of $1 million during this same period were U.S. Treasury Note (1.50%, due 8/15/2026) and U.S. Treasury Note (0.625%, due 8/15/2030).
As of June 30, 2021, Strategic International Fund had net assets of $14,870,333 and held 173 stocks in a wide variety of industries. The largest sector holdings as a percent of net assets were in consumer discretionary (20.0%), communications (11.0%), consumer staples (10.6%), financials (10.6%), health care (9.6%), technology (9.2%), industrials (8.9%) and materials (5.7%). The smallest sector holdings were in utilities (2.4%), energy (0.8%) and real estate (0.4%).
In order to hedge the impact of general market fluctuations, as of June 30, 2021, Strategic International Fund was short 75 futures on the Mini MSCI EAFE Index and long 10 puts on the S&P 500 Index. The notional value of this hedge was $12,940,950, hedging 98.7% of the dollar value of equity investments held by the Fund. When the Fund is in a hedged investment position, the primary driver of Fund returns is the difference in performance between the stocks owned by the Fund and the indices that are used to hedge.
While the investment portfolio of Strategic International Fund is widely diversified and its performance is affected by numerous investment positions, the hedging strategy of the Fund was primarily responsible for the reduced sensitivity of the Fund to market fluctuations from the Fund’s inception through June 30, 2021. Individual equity holdings having a portfolio gain in excess of $100,000 during the fiscal year ended June 30, 2021 were achieved in Next and Softcat. The Fund did not realize any losses in excess of $50,000 for equity holdings during this same period.
Supplementary information including quarterly returns and equity-only performance of the Funds is available on the Hussman Funds website: www.hussmanfunds.com.
Current Outlook
Amid fresh deterioration in our measures of market internals, coupled with record valuations in the first quarter of 2021, our market outlook has recently become more negative. Among the valuation measures that we have found most reliable in market cycles across history, including the period since 2000, all of them currently stand at over 3.5 times their run-of-the-mill historical norms.
The Hussman Funds
|
Letter to Shareholders (continued) |
The backward-looking returns of passive investment strategies are always the most glorious when market overvaluation is the most extreme. Yet that is also precisely the moment when likely future returns are the most dismal. Indeed, the problem with a speculative bubble is that short-term market outcomes cannot become better without long-term outcomes becoming worse, and long-term market outcomes cannot become better without short-term outcomes becoming worse. All one faces is an unfortunate situation.
It is common, almost fashionable, to argue that current extreme valuations are “justified” by low interest rates. Yet it is critical for investors to understand what this argument actually means.
Given any set of future cash flows, the higher the price an investor pays today, the lower the long-term returns the investor can expect. Put simply, high valuations imply low returns. As a result, one can demonstrate in a century of data that even when high stock market valuations are accompanied by low interest rates, subsequent stock market returns are still low, on average. It’s just that the low stock market returns are accompanied by low bond market returns as well. To say that high stock market valuations are “justified” by low interest rates is simply to say that passive investors can expect low investment returns across the board.
Of course, there are periods when stock market valuations are rich, yet bond yields are quite reasonable. For example, at the peak of the 2000 “tech bubble,” stock market valuations were nearly as high as they are at present, yet bond yields were not far from their historical norms. Not surprisingly, the extreme stock market valuations were followed by over a decade of negative total returns for the S&P 500. Yet diversified investors had acceptable bond returns to offset the disappointment. Such is not the case at present. Indeed, based on valuation measures having a correlation of about 0.9 or higher with actual subsequent returns, we presently expect 12-year nominal total returns for a passive investment allocation invested 60% in the S&P 500, 30% in Treasury bonds, and 10% in Treasury bills to average a loss of about -3.2% annually.
Across a century of market cycles, the relationship between valuations and subsequent 10-12 year market returns has been quite stable. The extent of overvaluation at the peak of a market cycle has also been a useful predictor of the depth of market losses of the completion of the cycle. For that reason, investors should not rule out a potential loss in the S&P 500 on the order of 60-70% in the coming years. Still, our current outlook does not require or even assume that valuations will approach their historical norms in the future. Our investment outlook at any point in time is a reflection of observable market conditions, particularly our gauges of valuations and market internals, and to a lesser extent, measures of overextension.
The Hussman Funds
|
Letter to Shareholders (continued) |
Investors appear to be equating the very reasonably expected post-pandemic “recovery” of private income and employment with an equally inevitable boom in U.S. gross domestic product, corporate earnings, and stock prices. The problem with this thesis is that both GDP and S&P 500 earnings are already at record highs. Meanwhile, the most reliable measures of S&P 500 valuation are easily beyond every prior historical extreme, including 1929 and 2000.
Over the past 18 months, the U.S. federal government has run the deepest fiscal deficit since World War II. Investors seem to be underestimating the extent to which a likely economic rebound will replace rather than augment the effect of trillions of dollars in pandemic relief programs, amounting to close to 20% of GDP, which preserved corporate revenues while subsidizing labor costs.
Investors have already driven the S&P 500 to the most extreme valuation multiples in history. But as Benjamin Graham and David Dodd observed after the 1929-1932 market collapse, rather than basing their expectations for future returns on historically reliable valuation measures, investors have transferred their attention almost exclusively to the trend. Investors view valuations as unimportant, because the trend of prices and earnings has advanced. Indeed, there is an almost universal expectation that a recovery in the private economy will augment fundamentals with enormous growth. This kind of double-counting ignores the enormous amount of private income and spending that will be needed simply to substitute for trillion dollar deficits that have pushed fundamentals above their pre-pandemic highs.
With the 10-year Treasury bond yield at just 1.3%, an increase in yield to just 1.5% would be more than sufficient to produce a negative one-year total return. With the S&P 500 dividend yield at just 1.35%, even an increase to the very low 2% median since 2000 would imply a price decline of nearly one-third. This illustrates the general principle that rich valuations are also associated with high sensitivity to small disappointments. In my view, even if the current extreme level of market valuations was to persist at a “permanently high plateau,” that outcome would likely be associated with steep periodic market losses, however quickly those losses might be recovered.
I certainly do not expect that sort of “plateau,” which Irving Fisher disastrously predicted when market valuations were at similar levels in 1929. Yet we also have no need for valuations to retreat to their historical norms, regardless of the fact that they have ultimately done so across history. What matters for us is to consistently pursue a value-conscious, historically-informed, risk-managed, full-cycle discipline – yet one that is tolerant even of deranged policies. The required adaptation in the recent market cycle was undoubtedly difficult: abandoning the notion that speculative recklessness had any “limit,” and instead being content simply to gauge its presence or absence. I believe
The Hussman Funds
|
Letter to Shareholders (continued) |
that we’ve restored our flexibility to changing market conditions, without any need to embrace speculative delusions that have historically ended in tears. In the meantime, I am pleased to again describe our overall performance with the phrase “as intended.”
I remain grateful, as always, for your trust.
Sincerely,
John P. Hussman, Ph.D.
Past performance is not predictive of future performance. Investment results and principal value will fluctuate so that shares of the Funds, when redeemed, may be worth more or less than their original cost. Current performance may be higher or lower than the performance data quoted.
Periodic updates regarding market conditions and investment strategy, as well as special reports, analysis, and performance data current to the most recent month end, are available at the Hussman Funds website: www.hussmanfunds.com.
An investor should consider the investment objectives, risks, charges and expenses of the Funds carefully before investing. The Funds’ prospectuses contain this and other important information. To obtain a copy of the Hussman Funds’ prospectuses please visit our website at www.hussmanfunds.com or call 1-800-487-7626 and a copy will be sent to you free of charge. Please read the prospectus carefully before you invest. The Hussman Funds are distributed by Ultimus Fund Distributors, LLC.
Estimates of prospective return and risk for equities, bonds, and other financial markets are forward-looking statements based on the analysis and reasonable beliefs of Hussman Strategic Advisors. They are not a guarantee of future performance, and are not indicative of the prospective returns of any of the Hussman Funds. Actual returns may differ substantially from the estimates provided. Estimates of prospective long-term returns for the S&P 500 Index reflect valuation methods focusing on the relationship between current market prices and earnings, dividends and other fundamentals, adjusted for variability over the economic cycle.
This Letter to Shareholders seeks to describe some of the adviser’s current opinions and views of the financial markets. Although the adviser believes it has a reasonable basis for any opinions or views expressed, actual results may differ, sometimes significantly, from those expected or expressed. The securities held by the Funds that are discussed in this Letter to Shareholders were held during the period covered by this Report. They do not comprise the entire investment portfolios of the Funds, may be sold at any time and may no longer be held by the Funds. The opinions of the Funds’ adviser with respect to those securities may change at any time.
Hussman Strategic Growth Fund
Portfolio Information |
June 30, 2021 (Unaudited) |
Sector Allocation (% of Common Stocks)

Hussman Strategic Allocation Fund
Portfolio Information |
June 30, 2021 (Unaudited) |
Asset Allocation (% of Net Assets)

Hussman Strategic Allocation Fund
Portfolio Information (continued) |
June 30, 2021 (Unaudited) |
Sector Allocation (% of Common Stocks)

Hussman Strategic Total Return Fund
Portfolio Information |
June 30, 2021 (Unaudited) |
Asset Allocation (% of Net Assets)
Hussman Strategic International Fund
Portfolio Information |
June 30, 2021 (Unaudited) |
Sector Allocation (% of Common and Preferred Stocks)

Country Allocation (% of Common and Preferred Stocks)

Hussman Strategic Growth Fund
Schedule of Investments |
June 30, 2021 |
COMMON STOCKS — 99.8% | | Shares | | | Value | |
Communications — 8.1% | | | | | | | | |
Cable & Satellite — 1.0% | | | | | | | | |
Comcast Corporation - Class A | | | 30,000 | | | $ | 1,710,600 | |
Sirius XM Holdings, Inc. | | | 360,000 | | | | 2,354,400 | |
| | | | | | | | 4,065,000 | |
Entertainment Content — 1.9% | | | | | | | | |
AMC Networks, Inc. - Class A (a) | | | 48,000 | | | | 3,206,400 | |
MSG Networks, Inc. - Class A (a) | | | 30,000 | | | | 437,400 | |
ViacomCBS, Inc. - Class B | | | 90,000 | | | | 4,068,000 | |
| | | | | | | | 7,711,800 | |
Internet Media & Services — 2.5% | | | | | | | | |
Alphabet, Inc. - Class C (a) | | | 600 | | | | 1,503,792 | |
Baidu, Inc. - ADR (a) | | | 15,000 | | | | 3,058,500 | |
Facebook, Inc. - Class A (a) | | | 600 | | | | 208,626 | |
fuboTV, Inc. (a) | | | 15,000 | | | | 481,650 | |
Pinterest, Inc. - Class A (a) | | | 9,000 | | | | 710,550 | |
Shutterstock, Inc. | | | 21,000 | | | | 2,061,570 | |
Stamps.com, Inc. (a) | | | 9,000 | | | | 1,802,610 | |
Twitter, Inc. (a) | | | 9,000 | | | | 619,290 | |
| | | | | | | | 10,446,588 | |
Media — 1.3% | | | | | | | | |
Discovery, Inc. - Series A (a) | | | 60,000 | | | | 1,840,800 | |
Nexstar Media Group, Inc. - Class A | | | 15,000 | | | | 2,218,200 | |
TEGNA, Inc. | | | 60,000 | | | | 1,125,600 | |
| | | | | | | | 5,184,600 | |
Publishing & Broadcasting — 1.0% | | | | | | | | |
Audacy, Inc. (a) | | | 120,000 | | | | 517,200 | |
Gray Television, Inc. | | | 120,000 | | | | 2,808,000 | |
Meredith Corporation (a) | | | 21,000 | | | | 912,240 | |
| | | | | | | | 4,237,440 | |
Telecommunications — 0.4% | | | | | | | | |
Consolidated Communications Holdings, Inc. (a) | | | 90,000 | | | | 791,100 | |
Verizon Communications, Inc. | | | 15,000 | | | | 840,450 | |
| | | | | | | | 1,631,550 | |
Consumer Discretionary — 23.9% | | | | | | | | |
Apparel & Textile Products — 0.1% | | | | | | | | |
Fossil Group, Inc. (a) | | | 28,000 | | | | 399,840 | |
| | | | | | | | | |
Hussman Strategic Growth Fund
Schedule of Investments (continued) |
June 30, 2021 |
COMMON STOCKS — 99.8% (continued) | | Shares | | | Value | |
Consumer Discretionary — 23.9% (continued) | | | | | | | | |
Automotive — 0.6% | | | | | | | | |
Arcimoto, Inc. (a) | | | 14,000 | | | $ | 240,660 | |
Harley-Davidson, Inc. | | | 24,000 | | | | 1,099,680 | |
Tenneco, Inc. - Class A (a) | | | 50,000 | | | | 966,000 | |
| | | | | | | | 2,306,340 | |
Consumer Services — 1.3% | | | | | | | | |
American Public Education, Inc. (a) | | | 7,000 | | | | 198,380 | |
Graham Holdings Company - Class B | | | 3,000 | | | | 1,901,700 | |
Matthews International Corporation - Class A | | | 15,000 | | | | 539,400 | |
Medifast, Inc. | | | 6,000 | | | | 1,697,880 | |
Perdoceo Education Corporation (a) | | | 35,000 | | | | 429,450 | |
WW International, Inc. (a) | | | 15,000 | | | | 542,100 | |
| | | | | | | | 5,308,910 | |
E-Commerce Discretionary — 2.0% | | | | | | | | |
Amazon.com, Inc. (a) | | | 450 | | | | 1,548,072 | |
eBay, Inc. | | | 36,000 | | | | 2,527,560 | |
Etsy, Inc. (a) | | | 18,000 | | | | 3,705,120 | |
PetMed Express, Inc. | | | 15,000 | | | | 477,750 | |
| | | | | | | | 8,258,502 | |
Home & Office Products — 2.2% | | | | | | | | |
Container Store Group, Inc. (The) (a) | | | 22,500 | | | | 293,400 | |
Hamilton Beach Brands Holding Company - Class A | | | 35,000 | | | | 779,450 | |
iRobot Corporation (a) | | | 36,000 | | | | 3,362,040 | |
Newell Brands, Inc. | | | 30,000 | | | | 824,100 | |
Tupperware Brands Corporation (a) | | | 60,000 | | | | 1,425,000 | |
Whirlpool Corporation | | | 12,000 | | | | 2,616,240 | |
| | | | | | | | 9,300,230 | |
Home Construction — 4.0% | | | | | | | | |
Century Communities, Inc. | | | 43,500 | | | | 2,894,490 | |
D.R. Horton, Inc. | | | 24,000 | | | | 2,168,880 | |
Forestar Group, Inc. (a) | | | 35,000 | | | | 731,850 | |
Lennar Corporation - Class A | | | 21,000 | | | | 2,086,350 | |
LGI Homes, Inc. (a) | | | 10,500 | | | | 1,700,370 | |
M/I Homes, Inc. (a) | | | 30,000 | | | | 1,760,100 | |
Meritage Homes Corporation (a) | | | 14,000 | | | | 1,317,120 | |
PulteGroup, Inc. | | | 20,000 | | | | 1,091,400 | |
Toll Brothers, Inc. | | | 15,000 | | | | 867,150 | |
TRI Pointe Homes, Inc. (a) | | | 84,000 | | | | 1,800,120 | |
| | | | | | | | 16,417,830 | |
Hussman Strategic Growth Fund
Schedule of Investments (continued) |
June 30, 2021 |
COMMON STOCKS — 99.8% (continued) | | Shares | | | Value | |
Consumer Discretionary — 23.9% (continued) | | | | | | | | |
Leisure Facilities & Services — 1.3% | | | | | | | | |
Brinker International, Inc. (a) | | | 45,000 | | | $ | 2,783,250 | |
Domino’s Pizza, Inc. | | | 4,500 | | | | 2,099,205 | |
Waitr Holdings, Inc. (a) | | | 180,000 | | | | 320,400 | |
| | | | | | | | 5,202,855 | |
Leisure Products — 0.3% | | | | | | | | |
Mattel, Inc. (a) | | | 30,000 | | | | 603,000 | |
Nautilus, Inc. (a) | | | 45,000 | | | | 758,250 | |
| | | | | | | | 1,361,250 | |
Retail - Discretionary — 11.4% | | | | | | | | |
AutoZone, Inc. (a) | | | 900 | | | | 1,342,998 | |
Bed Bath & Beyond, Inc. (a) | | | 24,000 | | | | 798,960 | |
Big 5 Sporting Goods Corporation | | | 24,000 | | | | 616,320 | |
Buckle, Inc. (The) | | | 75,000 | | | | 3,731,250 | |
Chico’s FAS, Inc. (a) | | | 150,000 | | | | 987,000 | |
Designer Brands, Inc. - Class A (a) | | | 21,000 | | | | 347,550 | |
Dick’s Sporting Goods, Inc. | | | 36,000 | | | | 3,606,840 | |
Duluth Holdings, Inc. - Class B (a) | | | 154,000 | | | | 3,180,100 | |
Express, Inc. (a) | | | 390,000 | | | | 2,531,100 | |
Gap, Inc. (The) | | | 15,000 | | | | 504,750 | |
Genesco, Inc. (a) | | | 12,000 | | | | 764,160 | |
Hibbett, Inc. (a) | | | 35,000 | | | | 3,137,050 | |
Home Depot, Inc. (The) | | | 6,000 | | | | 1,913,340 | |
Kohl’s Corporation | | | 60,000 | | | | 3,306,600 | |
Lumber Liquidators Holdings, Inc. (a) | | | 90,000 | | | | 1,899,000 | |
Macy’s, Inc. (a) | | | 210,000 | | | | 3,981,600 | |
MarineMax, Inc. (a) | | | 30,000 | | | | 1,462,200 | |
O’Reilly Automotive, Inc. (a) | | | 2,500 | | | | 1,415,525 | |
Qurate Retail, Inc. - Series A | | | 140,000 | | | | 1,832,600 | |
Sally Beauty Holdings, Inc. (a) | | | 60,000 | | | | 1,324,200 | |
Signet Jewelers Ltd. (a) | | | 9,000 | | | | 727,110 | |
Sleep Number Corporation (a) | | | 30,000 | | | | 3,298,500 | |
Urban Outfitters, Inc. (a) | | | 28,000 | | | | 1,154,160 | |
Vera Bradley, Inc. (a) | | | 30,000 | | | | 371,700 | |
Williams-Sonoma, Inc. | | | 9,000 | | | | 1,436,850 | |
Zumiez, Inc. (a) | | | 28,000 | | | | 1,371,720 | |
| | | | | | | | 47,043,183 | |
Hussman Strategic Growth Fund
Schedule of Investments (continued) |
June 30, 2021 |
COMMON STOCKS — 99.8% (continued) | | Shares | | | Value | |
Consumer Discretionary — 23.9% (continued) | | | | | | | | |
Specialty Retail — 0.5% | | | | | | | | |
Best Buy Company, Inc. | | | 9,000 | | | $ | 1,034,820 | |
Penske Automotive Group, Inc. | | | 15,000 | | | | 1,132,350 | |
| | | | | | | | 2,167,170 | |
Wholesale - Discretionary — 0.2% | | | | | | | | |
Educational Development Corporation | | | 60,000 | | | | 748,200 | |
| | | | | | | | | |
Consumer Staples — 13.6% | | | | | | | | |
Beverages — 0.5% | | | | | | | | |
National Beverage Corporation | | | 36,000 | | | | 1,700,280 | |
NewAge, Inc. (a) | | | 70,000 | | | | 156,100 | |
| | | | | | | | 1,856,380 | |
Consumer Products — 0.7% | | | | | | | | |
Colgate-Palmolive Company | | | 24,000 | | | | 1,952,400 | |
PepsiCo, Inc. | | | 6,000 | | | | 889,020 | |
| | | | | | | | 2,841,420 | |
Food — 4.6% | | | | | | | | |
B&G Foods, Inc. | | | 120,000 | | | | 3,936,000 | |
Campbell Soup Company | | | 56,000 | | | | 2,553,040 | |
General Mills, Inc. | | | 36,000 | | | | 2,193,480 | |
Herbalife Nutrition Ltd. (a) | | | 45,000 | | | | 2,372,850 | |
J.M. Smucker Company (The) | | | 15,000 | | | | 1,943,550 | |
Kellogg Company | | | 45,000 | | | | 2,894,850 | |
Kraft Heinz Company (The) | | | 36,000 | | | | 1,468,080 | |
LifeVantage Corporation (a) | | | 25,000 | | | | 183,750 | |
USANA Health Sciences, Inc. (a) | | | 14,000 | | | | 1,434,020 | |
| | | | | | | | 18,979,620 | |
Household Products — 1.6% | | | | | | | | |
Clearwater Paper Corporation (a) | | | 45,000 | | | | 1,303,650 | |
Clorox Company (The) | | | 10,000 | | | | 1,799,100 | |
Kimberly-Clark Corporation | | | 6,000 | | | | 802,680 | |
Nu Skin Enterprises, Inc. - Class A | | | 49,000 | | | | 2,775,850 | |
| | | | | | | | 6,681,280 | |
Retail - Consumer Staples — 6.2% | | | | | | | | |
Big Lots, Inc. | | | 60,000 | | | | 3,960,600 | |
Ingles Markets, Inc. - Class A | | | 28,000 | | | | 1,631,560 | |
Kroger Company (The) | | | 90,000 | | | | 3,447,900 | |
Murphy USA, Inc. | | | 21,000 | | | | 2,800,770 | |
Hussman Strategic Growth Fund
Schedule of Investments (continued) |
June 30, 2021 |
COMMON STOCKS — 99.8% (continued) | | Shares | | | Value | |
Consumer Staples — 13.6% (continued) | | | | | | | | |
Retail - Consumer Staples — 6.2% (continued) | | | | | | | | |
Natural Grocers by Vitamin Cottage, Inc. | | | 90,000 | | | $ | 966,600 | |
Ollie’s Bargain Outlet Holdings, Inc. (a) | | | 30,000 | | | | 2,523,900 | |
Rite Aid Corporation (a) | | | 90,000 | | | | 1,467,000 | |
Sprouts Farmers Market, Inc. (a) | | | 120,000 | | | | 2,982,000 | |
United Natural Foods, Inc. (a) | | | 90,000 | | | | 3,328,200 | |
Walgreens Boots Alliance, Inc. | | | 36,000 | | | | 1,893,960 | |
Weis Markets, Inc. | | | 14,000 | | | | 723,240 | |
| | | | | | | | 25,725,730 | |
Energy — 5.4% | | | | | | | | |
Energy Equipment & Services — 0.6% | | | | | | | | |
American Superconductor Corporation (a) | | | 14,000 | | | | 243,460 | |
Nabors Industries Ltd. (a) | | | 20,000 | | | | 2,284,800 | |
| | | | | | | | 2,528,260 | |
Oil & Gas Producers — 1.6% | | | | | | | | |
Laredo Petroleum, Inc. (a) | | | 15,000 | | | | 1,391,850 | |
Ovintiv, Inc. | | | 30,000 | | | | 944,100 | |
Range Resources Corporation (a) | | | 90,000 | | | | 1,508,400 | |
SM Energy Company | | | 120,000 | | | | 2,955,600 | |
| | | | | | | | 6,799,950 | |
Renewable Energy — 3.2% | | | | | | | | |
Broadwind, Inc. (a) | | | 210,000 | | | | 951,300 | |
Canadian Solar, Inc. (a) | | | 75,000 | | | | 3,363,000 | |
CleanSpark, Inc. (a) | | | 45,000 | | | | 748,800 | |
First Solar, Inc. (a) | | | 3,500 | | | | 316,785 | |
JinkoSolar Holding Company Ltd. - ADR (a) | | | 75,000 | | | | 4,201,500 | |
Renewable Energy Group, Inc. (a) | | | 14,000 | | | | 872,760 | |
SunPower Corporation (a) | | | 45,000 | | | | 1,314,900 | |
Sunworks, Inc. (a) | | | 120,000 | | | | 1,261,200 | |
| | | | | | | | 13,030,245 | |
Financials — 9.2% | | | | | | | | |
Asset Management — 1.2% | | | | | | | | |
BrightSphere Investment Group, Inc. | | | 140,000 | | | | 3,280,200 | |
Federated Hermes, Inc. | | | 50,000 | | | | 1,695,500 | |
| | | | | | | | 4,975,700 | |
Banking — 1.3% | | | | | | | | |
Comerica, Inc. | | | 15,000 | | | | 1,070,100 | |
Customers Bancorp, Inc. (a) | | | 28,000 | | | | 1,091,720 | |
Hussman Strategic Growth Fund
Schedule of Investments (continued) |
June 30, 2021 |
COMMON STOCKS — 99.8% (continued) | | Shares | | | Value | |
Financials — 9.2% (continued) | | | | | | | | |
Banking — 1.3% (continued) | | | | | | | | |
Hilltop Holdings, Inc. | | | 45,000 | | | $ | 1,638,000 | |
Investors Bancorp, Inc. | | | 70,000 | | | | 998,200 | |
Reliant Bancorp, Inc. | | | 17,500 | | | | 485,275 | |
| | | | | | | | 5,283,295 | |
Institutional Financial Services — 2.0% | | | | | | | | |
Cboe Global Markets, Inc. | | | 12,000 | | | | 1,428,600 | |
Evercore, Inc. - Class A | | | 21,000 | | | | 2,956,170 | |
StoneX Group, Inc. (a) | | | 30,000 | | | | 1,820,100 | |
Virtu Financial, Inc. - Class A | | | 70,000 | | | | 1,934,100 | |
| | | | | | | | 8,138,970 | |
Insurance — 2.9% | | | | | | | | |
Aflac, Inc. | | | 15,000 | | | | 804,900 | |
Allstate Corporation (The) | | | 15,000 | | | | 1,956,600 | |
Lincoln National Corporation | | | 30,000 | | | | 1,885,200 | |
MGIC Investment Corporation | | | 30,000 | | | | 408,000 | |
NMI Holdings, Inc. - Class A (a) | | | 30,000 | | | | 674,400 | |
Progressive Corporation (The) | | | 30,000 | | | | 2,946,300 | |
Unum Group | | | 120,000 | | | | 3,408,000 | |
| | | | | | | | 12,083,400 | |
Specialty Finance — 1.8% | | | | | | | | |
Alliance Data Systems Corporation | | | 14,000 | | | | 1,458,660 | |
Ally Financial, Inc. | | | 15,000 | | | | 747,600 | |
Essent Group Ltd. | | | 15,000 | | | | 674,250 | |
Navient Corporation | | | 75,000 | | | | 1,449,750 | |
PennyMac Financial Services, Inc. | | | 49,000 | | | | 3,024,280 | |
| | | | | | | | 7,354,540 | |
Health Care — 15.7% | | | | | | | | |
Biotech & Pharma — 10.3% | | | | | | | | |
AbbVie, Inc. | | | 15,000 | | | | 1,689,600 | |
Alexion Pharmaceuticals, Inc. (a) | | | 6,000 | | | | 1,102,260 | |
Alkermes plc (a) | | | 30,000 | | | | 735,600 | |
Amgen, Inc. | | | 9,000 | | | | 2,193,750 | |
Amneal Pharmaceuticals, Inc. (a) | | | 175,000 | | | | 896,000 | |
ANI Pharmaceuticals, Inc. (a) | | | 30,000 | | | | 1,051,500 | |
Beam Therapeutics, Inc. (a) | | | 3,500 | | | | 450,485 | |
Biocept, Inc. (a) | | | 70,000 | | | | 293,300 | |
Biogen, Inc. (a) | | | 3,000 | | | | 1,038,810 | |
Hussman Strategic Growth Fund
Schedule of Investments (continued) |
June 30, 2021 |
COMMON STOCKS — 99.8% (continued) | | Shares | | | Value | |
Health Care — 15.7% (continued) | | | | | | | | |
Biotech & Pharma — 10.3% (continued) | | | | | | | | |
Blueprint Medicines Corporation (a) | | | 6,000 | | | $ | 527,760 | |
Catalyst Pharmaceutical, Inc. (a) | | | 120,000 | | | | 690,000 | |
Clovis Oncology, Inc. (a) | | | 50,000 | | | | 290,000 | |
Coherus Biosciences, Inc. (a) | | | 35,000 | | | | 484,050 | |
Corcept Therapeutics, Inc. (a) | | | 90,000 | | | | 1,980,000 | |
CRISPR Therapeutics AG (a) | | | 9,000 | | | | 1,457,010 | |
Editas Medicine, Inc. (a) | | | 30,000 | | | | 1,699,200 | |
electroCore, Inc. (a) | | | 35,000 | | | | 41,650 | |
Exelixis, Inc. (a) | | | 60,000 | | | | 1,093,200 | |
Innoviva, Inc. (a) | | | 120,000 | | | | 1,609,200 | |
Intra-Cellular Therapies, Inc. (a) | | | 30,000 | | | | 1,224,600 | |
Ionis Pharmaceuticals, Inc. (a) | | | 7,000 | | | | 279,230 | |
Jazz Pharmaceuticals plc (a) | | | 21,000 | | | | 3,730,440 | |
Jounce Therapeutics, Inc. (a) | | | 15,000 | | | | 102,000 | |
Neurocrine Biosciences, Inc. (a) | | | 15,000 | | | | 1,459,800 | |
Neuronetics, Inc. (a) | | | 36,000 | | | | 576,720 | |
Organogenesis Holdings, Inc. (a) | | | 30,000 | | | | 498,600 | |
Pacira Biosciences, Inc. (a) | | | 12,000 | | | | 728,160 | |
Sage Therapeutics, Inc. (a) | | | 72,000 | | | | 4,090,320 | |
Sangamo Therapeutics, Inc. (a) | | | 35,000 | | | | 418,950 | |
Supernus Pharmaceuticals, Inc. (a) | | | 90,000 | | | | 2,771,100 | |
United Therapeutics Corporation (a) | | | 7,000 | | | | 1,255,870 | |
Vanda Pharmaceuticals, Inc. (a) | | | 90,000 | | | | 1,935,900 | |
Vertex Pharmaceuticals, Inc. (a) | | | 9,000 | | | | 1,814,670 | |
Viatris, Inc. | | | 150,000 | | | | 2,143,500 | |
| | | | | | | | 42,353,235 | |
Health Care Facilities & Services — 2.0% | | | | | | | | |
Brookdale Senior Living, Inc. (a) | | | 70,000 | | | | 553,000 | |
Cigna Corporation | | | 6,000 | | | | 1,422,420 | |
Community Health Systems, Inc. (a) | | | 100,000 | | | | 1,544,000 | |
Fulget Genetics, Inc. (a) | | | 9,000 | | | | 830,070 | |
Laboratory Corporation of America Holdings (a) | | | 6,000 | | | | 1,655,100 | |
Patterson Companies, Inc. | | | 70,000 | | | | 2,127,300 | |
| | | | | | | | 8,131,890 | |
Hussman Strategic Growth Fund
Schedule of Investments (continued) |
June 30, 2021 |
COMMON STOCKS — 99.8% (continued) | | Shares | | | Value | |
Health Care — 15.7% (continued) | | | | | | | | |
Health Care Providers & Services — 0.9% | | | | | | | | |
HCA Healthcare, Inc. | | | 6,000 | | | $ | 1,240,440 | |
Quest Diagnostics, Inc. | | | 18,000 | | | | 2,375,460 | |
| | | | | | | | 3,615,900 | |
Medical Equipment & Devices — 2.5% | | | | | | | | |
10X Genomics, Inc. - Class A (a) | | | 3,000 | | | | 587,460 | |
Accuray, Inc. (a) | | | 30,000 | | | | 135,600 | |
Alpha Pro Tech Ltd. (a) | | | 50,000 | | | | 428,500 | |
Co-Diagnostics, Inc. (a) | | | 35,000 | | | | 288,750 | |
Exact Sciences Corporation (a) | | | 12,000 | | | | 1,491,720 | |
Fluidigm Corporation (a) | | | 140,000 | | | | 862,400 | |
Hologic, Inc. (a) | | | 30,000 | | | | 2,001,600 | |
Meridian Bioscience, Inc. (a) | | | 140,000 | | | | 3,105,200 | |
OPKO Health, Inc. (a) | | | 140,000 | | | | 567,000 | |
Quidel Corporation (a) | | | 6,000 | | | | 768,720 | |
Retractable Technologies, Inc. (a) | | | 1,000 | | | | 11,560 | |
Sonoma Pharmaceuticals, Inc. (a) | | | 3,000 | | | | 22,020 | |
Vericel Corporation (a) | | | 6,000 | | | | 315,000 | |
| | | | | | | | 10,585,530 | |
Industrials — 4.7% | | | | | | | | |
Commercial Support Services — 1.0% | | | | | | | | |
H&R Block, Inc. | | | 36,000 | | | | 845,280 | |
Pitney Bowes, Inc. | | | 120,000 | | | | 1,052,400 | |
Quad/Graphics, Inc. (a) | | | 70,000 | | | | 290,500 | |
TriNet Group, Inc. (a) | | | 28,000 | | | | 2,029,440 | |
| | | | | | | | 4,217,620 | |
Diversified Consumer Services — 0.2% | | | | | | | | |
Hillenbrand, Inc. | | | 15,000 | | | | 661,200 | |
| | | | | | | | | |
Electrical Equipment — 0.7% | | | | | | | | |
Blink Charging Company (a) | | | 7,000 | | | | 288,190 | |
BWX Technologies, Inc. | | | 9,000 | | | | 523,080 | |
Capstone Green Energy Corporation (a) | | | 60,000 | | | | 337,200 | |
Carrier Global Corporation | | | 15,000 | | | | 729,000 | |
WidePoint Corporation (a) | | | 140,000 | | | | 1,016,400 | |
| | | | | | | | 2,893,870 | |
Hussman Strategic Growth Fund
Schedule of Investments (continued) |
June 30, 2021 |
COMMON STOCKS — 99.8% (continued) | | Shares | | | Value | |
Industrials — 4.7% (continued) | | | | | | | | |
Engineering & Construction — 0.5% | | | | | | | | |
Infrastructure & Energy Alternatives, Inc. (a) | | | 21,000 | | | $ | 270,060 | |
Orbital Energy Group, Inc. (a) | | | 90,000 | | | | 393,300 | |
Primoris Services Corporation | | | 35,000 | | | | 1,030,050 | |
Tutor Perini Corporation (a) | | | 30,000 | | | | 415,500 | |
| | | | | | | | 2,108,910 | |
Industrial Intermediate Products — 0.3% | | | | | | | | |
Proto Labs, Inc. (a) | | | 14,000 | | | | 1,285,200 | |
| | | | | | | | | |
Industrial Support Services — 1.2% | | | | | | | | |
ARC Document Solutions, Inc. | | | 50,000 | | | | 107,500 | |
MSC Industrial Direct Company, Inc. - Class A | | | 30,000 | | | | 2,691,900 | |
Triton International Ltd. | | | 15,000 | | | | 785,100 | |
WESCO International, Inc. (a) | | | 12,000 | | | | 1,233,840 | |
| | | | | | | | 4,818,340 | |
Machinery — 0.3% | | | | | | | | |
Energy Recovery, Inc. (a) | | | 60,000 | | | | 1,366,800 | |
| | | | | | | | | |
Professional Services — 0.1% | | | | | | | | |
Insperity, Inc. | | | 7,000 | | | | 632,590 | |
| | | | | | | | | |
Transportation & Logistics — 0.4% | | | | | | | | |
Atlas Air Worldwide Holdings, Inc. (a) | | | 9,000 | | | | 612,990 | |
Expeditors International of Washington, Inc. | | | 8,000 | | | | 1,012,800 | |
| | | | | | | | 1,625,790 | |
Materials — 4.3% | | | | | | | | |
Chemicals — 1.5% | | | | | | | | |
AdvanSix, Inc. (a) | | | 15,000 | | | | 447,900 | |
Celanese Corporation | | | 6,000 | | | | 909,600 | |
Ingevity Corporation (a) | | | 9,000 | | | | 732,240 | |
Kronos Worldwide, Inc. | | | 30,000 | | | | 429,600 | |
Mosaic Company (The) | | | 60,000 | | | | 1,914,600 | |
Rayonier Advanced Materials, Inc. (a) | | | 50,000 | | | | 334,500 | |
Valvoline, Inc. | | | 45,000 | | | | 1,460,700 | |
Yield10 Bioscience, Inc. (a) | | | 6,000 | | | | 51,180 | |
| | | | | | | | 6,280,320 | |
Hussman Strategic Growth Fund
Schedule of Investments (continued) |
June 30, 2021 |
COMMON STOCKS — 99.8% (continued) | | Shares | | | Value | |
Materials — 4.3% (continued) | | | | | | | | |
Metals & Mining — 2.4% | | | | | | | | |
Agnico Eagle Mines Ltd. | | | 15,000 | | | $ | 906,750 | |
AngloGold Ashanti Ltd. - ADR | | | 36,000 | | | | 668,880 | |
Barrick Gold Corporation | | | 120,000 | | | | 2,481,600 | |
Compass Minerals International, Inc. | | | 20,000 | | | | 1,185,200 | |
Kinross Gold Corporation | | | 108,000 | | | | 685,800 | |
Newmont Corporation | | | 45,000 | | | | 2,852,100 | |
Royal Gold, Inc. | | | 10,000 | | | | 1,141,000 | |
| | | | | | | | 9,921,330 | |
Paper & Forest Products — 0.4% | | | | | | | | |
Boise Cascade Company | | | 24,000 | | | | 1,400,400 | |
| | | | | | | | | |
Real Estate — 0.7% | | | | | | | | |
Real Estate Services — 0.4% | | | | | | | | |
eXp World Holdings, Inc. (a) | | | 24,000 | | | | 930,480 | |
Jones Lang LaSalle, Inc. (a) | | | 3,500 | | | | 684,110 | |
| | | | | | | | 1,614,590 | |
REITs — 0.3% | | | | | | | | |
Kimco Realty Corporation | | | 70,000 | | | | 1,459,500 | |
| | | | | | | | | |
Technology — 13.9% | | | | | | | | |
Semiconductors — 1.8% | | | | | | | | |
Intel Corporation | | | 45,000 | | | | 2,526,300 | |
QUALCOMM, Inc. | | | 18,000 | | | | 2,572,740 | |
Skyworks Solutions, Inc. | | | 12,000 | | | | 2,301,000 | |
| | | | | | | | 7,400,040 | |
Software — 3.1% | | | | | | | | |
AudioEye, Inc. (a) | | | 14,000 | | | | 235,060 | |
Ebix, Inc. | | | 75,000 | | | | 2,542,500 | |
Evolent Health, Inc. - Class A (a) | | | 35,000 | | | | 739,200 | |
j2 Global, Inc. (a) | | | 15,000 | | | | 2,063,250 | |
Microsoft Corporation | | | 500 | | | | 135,450 | |
NextGen Healthcare, Inc. (a) | | | 30,000 | | | | 497,700 | |
Oracle Corporation | | | 28,000 | | | | 2,179,520 | |
Qualys, Inc. (a) | | | 15,000 | | | | 1,510,350 | |
Synchronoss Technologies, Inc. (a) | | | 70,000 | | | | 251,300 | |
Vislink Technologies, Inc. (a) | | | 1 | | | | 3 | |
Hussman Strategic Growth Fund
Schedule of Investments (continued) |
June 30, 2021 |
COMMON STOCKS — 99.8% (continued) | | Shares | | | Value | |
Technology — 13.9% (continued) | | | | | | | | |
Software — 3.1% (continued) | | | | | | | | |
VMware, Inc. - Class A (a) | | | 12,000 | | | $ | 1,919,640 | |
Xperi Holding Corporation | | | 45,000 | | | | 1,000,800 | |
| | | | | | | | 13,074,773 | |
Technology Hardware — 6.3% | | | | | | | | |
Apple, Inc. | | | 3,000 | | | | 410,880 | |
Aviat Networks, Inc. (a) | | | 28,000 | | | | 917,560 | |
Cambium Networks Corporation (a) | | | 9,000 | | | | 435,150 | |
Casa Systems, Inc. (a) | | | 63,000 | | | | 558,810 | |
Clearfield, Inc. (a) | | | 60,000 | | | | 2,247,000 | |
Corning, Inc. | | | 30,000 | | | | 1,227,000 | |
F5 Networks, Inc. (a) | | | 14,000 | | | | 2,613,240 | |
Genasys, Inc. (a) | | | 35,000 | | | | 191,800 | |
HP, Inc. | | | 90,000 | | | | 2,717,100 | |
Infinera Corporation (a) | | | 30,000 | | | | 306,000 | |
Jabil, Inc. | | | 15,000 | | | | 871,800 | |
Maxar Technologies, Inc. | | | 30,000 | | | | 1,197,600 | |
NetApp, Inc. | | | 36,000 | | | | 2,945,520 | |
Plantronics, Inc. (a) | | | 28,000 | | | | 1,168,440 | |
Ribbon Communications, Inc. (a) | | | 180,000 | | | | 1,369,800 | |
Sonos, Inc. (a) | | | 30,000 | | | | 1,056,900 | |
Turtle Beach Corporation (a) | | | 60,000 | | | | 1,915,200 | |
Ubiquiti, Inc. | | | 12,000 | | | | 3,746,280 | |
| | | | | | | | 25,896,080 | |
Technology Services — 2.7% | | | | | | | | |
Cognizant Technology Solutions Corporation - Class A | | | 48,000 | | | | 3,324,480 | |
FactSet Research Systems, Inc. | | | 3,000 | | | | 1,006,830 | |
Infosys Ltd. - ADR | | | 150,000 | | | | 3,178,500 | |
International Business Machines Corporation | | | 6,000 | | | | 879,540 | |
MAXIMUS, Inc. | | | 15,000 | | | | 1,319,550 | |
Square, Inc. - Class A (a) | | | 6,000 | | | | 1,462,800 | |
| | | | | | | | 11,171,700 | |
Utilities — 0.3% | | | | | | | | |
Electric Utilities — 0.3% | | | | | | | | |
NRG Energy, Inc. | | | 35,000 | | | | 1,410,500 | |
| | | | | | | | | |
Total Common Stocks (Cost $362,206,378) (b) | | | | | | $ | 411,996,186 | |
Hussman Strategic Growth Fund
Schedule of Investments (continued) |
June 30, 2021 |
EXCHANGE-TRADED FUNDS — 0.5% | | Shares | | | Value | |
iShares Gold Trust (a) | | | 30,000 | | | $ | 1,011,300 | |
SPDR Gold Shares (a) | | | 6,000 | | | | 993,780 | |
Total Exchange-Traded Funds (Cost $2,132,507) | | | | | | $ | 2,005,080 | |
WARRANTS — 0.0% (c) | | | | | | |
Nabors Industries Ltd. (Cost $0) | | | 8,000 | | | $ | 80,000 | |
EXCHANGE-TRADED PUT OPTION CONTRACTS — 2.5% | | Contracts | | | Notional
Amount | | | Value | |
Russell 2000 Index Option, 09/17/2021 at $2,250 | | | 750 | | | $ | 173,291,175 | | | $ | 4,900,500 | |
S&P 500 Index Option, 09/17/2021 at $4,250 | | | 550 | | | | 236,362,500 | | | | 5,263,500 | |
Total Put Option Contracts (Cost $10,909,247) | | | | | | $ | 409,653,675 | | | $ | 10,164,000 | |
| | | | | | | | | | | | | |
Total Investments at Value — 102.8% (Cost $375,248,132) | | | | | | | | | | $ | 424,245,266 | |
MONEY MARKET FUNDS — 50.8% | | Shares | | | Value | |
Invesco Short-Term Investments Trust - Treasury Portfolio - Institutional Class, 0.01% (d) (Cost $209,818,056) | | | 209,818,056 | | | $ | 209,818,056 | |
| | | | | | | | | |
Total Investments and Money Market Funds at Value — 153.6% (Cost $585,066,188) | | | | | | $ | 634,063,322 | |
| | | | | | | | | |
Exchanged-Traded Written Call Option Contracts — (53.6%) | | | | | | | (221,385,090 | ) |
| | | | | | | | | |
Other Assets in Excess of Liabilities — 0.0% (c) | | | | | | | 219,750 | |
| | | | | | | | | |
Net Assets — 100.0% | | | | | | $ | 412,897,982 | |
ADR - American Depositary Receipt. |
(a) | Non-income producing security. |
(b) | Common stocks owned by the Fund are held in escrow by the Fund’s custodian (or by a securities depositary) to secure the Fund’s obligations to settle outstanding call option contracts it has written (Note 1). |
(c) | Percentage rounds to less than 0.1%. |
(d) | The rate shown is the 7-day effective yield as of June 30, 2021. |
See accompanying notes to financial statements. |
Hussman Strategic Growth Fund
Schedule of Open Written Option Contracts |
June 30, 2021 |
EXCHANGE-TRADED WRITTEN CALL OPTION CONTRACTS | | Contracts | | | Notional
Amount | | | Strike
Price | | | Expiration
Date | | | Value of
Options | |
Call Option Contracts |
Russell 2000 Index Option | | | 750 | | | $ | 173,291,175 | | | $ | 1,000 | | | | 09/17/2021 | | | $ | 97,956,750 | |
S&P 500 Index Option | | | 540 | | | | 232,065,000 | | | | 2,000 | | | | 09/17/2021 | | | | 123,428,340 | |
Total Written Call Option Contracts (Premiums received $209,810,955) | | | | | | $ | 405,356,175 | | | | | | | | | | | $ | 221,385,090 | |
See accompanying notes to financial statements. |
Hussman Strategic Allocation Fund
Schedule of Investments |
June 30, 2021 |
COMMON STOCKS — 66.6% | | Shares | | | Value | |
Communications — 5.5% | | | | | | | | |
Cable & Satellite — 0.7% | | | | | | | | |
Comcast Corporation - Class A | | | 1,000 | | | $ | 57,020 | |
Sirius XM Holdings, Inc. | | | 12,000 | | | | 78,480 | |
| | | | | | | | 135,500 | |
Entertainment Content — 1.3% | | | | | | | | |
AMC Networks, Inc. - Class A (a) | | | 1,600 | | | | 106,880 | |
MSG Networks, Inc. - Class A (a) | | | 1,000 | | | | 14,580 | |
ViacomCBS, Inc. - Class B | | | 3,000 | | | | 135,600 | |
| | | | | | | | 257,060 | |
Internet Media & Services — 1.7% | | | | | | | | |
Alphabet, Inc. - Class C (a) | | | 20 | | | | 50,126 | |
Baidu, Inc. - ADR (a) | | | 500 | | | | 101,951 | |
Facebook, Inc. - Class A (a) | | | 20 | | | | 6,954 | |
fuboTV, Inc. (a) | | | 500 | | | | 16,055 | |
Pinterest, Inc. - Class A (a) | | | 300 | | | | 23,685 | |
Shutterstock, Inc. | | | 700 | | | | 68,719 | |
Stamps.com, Inc. (a) | | | 300 | | | | 60,087 | |
Twitter, Inc. (a) | | | 300 | | | | 20,643 | |
| | | | | | | | 348,220 | |
Media — 0.9% | | | | | | | | |
Discovery, Inc. - Series A (a) | | | 2,000 | | | | 61,360 | |
Nexstar Media Group, Inc. - Class A | | | 500 | | | | 73,940 | |
TEGNA, Inc. | | | 2,000 | | | | 37,520 | |
| | | | | | | | 172,820 | |
Publishing & Broadcasting — 0.6% | | | | | | | | |
Audacy, Inc. (a) | | | 4,000 | | | | 17,240 | |
Gray Television, Inc. | | | 4,000 | | | | 93,600 | |
Meredith Corporation (a) | | | 300 | | | | 13,032 | |
| | | | | | | | 123,872 | |
Telecommunications — 0.3% | | | | | | | | |
Consolidated Communications Holdings, Inc. (a) | | | 3,000 | | | | 26,370 | |
Verizon Communications, Inc. | | | 500 | | | | 28,015 | |
| | | | | | | | 54,385 | |
Consumer Discretionary — 16.0% | | | | | | | | |
Apparel & Textile Products — 0.0% (b) | | | | | | | | |
Fossil Group, Inc. (a) | | | 800 | | | | 11,424 | |
| | | | | | | | | |
Hussman Strategic Allocation Fund
Schedule of Investments (continued) |
June 30, 2021 |
COMMON STOCKS — 66.6% (continued) | | Shares | | | Value | |
Consumer Discretionary — 16.0% (continued) | | | | | | | | |
Automotive — 0.4% | | | | | | | | |
Arcimoto, Inc. (a) | | | 400 | | | $ | 6,876 | |
Harley-Davidson, Inc. | | | 800 | | | | 36,656 | |
Tenneco, Inc. - Class A (a) | | | 1,500 | | | | 28,980 | |
| | | | | | | | 72,512 | |
Consumer Services — 0.9% | | | | | | | | |
American Public Education, Inc. (a) | | | 200 | | | | 5,668 | |
Graham Holdings Company - Class B | | | 100 | | | | 63,390 | |
Matthews International Corporation - Class A | | | 500 | | | | 17,980 | |
Medifast, Inc. | | | 200 | | | | 56,596 | |
Perdoceo Education Corporation (a) | | | 1,000 | | | | 12,270 | |
WW International, Inc. (a) | | | 500 | | | | 18,070 | |
| | | | | | | | 173,974 | |
E-Commerce Discretionary — 1.4% | | | | | | | | |
Amazon.com, Inc. (a) | | | 15 | | | | 51,603 | |
eBay, Inc. | | | 1,200 | | | | 84,252 | |
Etsy, Inc. (a) | | | 600 | | | | 123,504 | |
PetMed Express, Inc. | | | 500 | | | | 15,925 | |
| | | | | | | | 275,284 | |
Home & Office Products — 1.5% | | | | | | | | |
Container Store Group, Inc. (The) (a) | | | 750 | | | | 9,780 | |
Hamilton Beach Brands Holding Company - Class A | | | 1,000 | | | | 22,270 | |
iRobot Corporation (a) | | | 1,200 | | | | 112,068 | |
Newell Brands, Inc. | | | 1,000 | | | | 27,470 | |
Tupperware Brands Corporation (a) | | | 2,000 | | | | 47,500 | |
Whirlpool Corporation | | | 400 | | | | 87,208 | |
| | | | | | | | 306,296 | |
Home Construction — 2.6% | | | | | | | | |
Century Communities, Inc. | | | 1,450 | | | | 96,483 | |
D.R. Horton, Inc. | | | 800 | | | | 72,296 | |
Forestar Group, Inc. (a) | | | 1,000 | | | | 20,910 | |
Lennar Corporation - Class A | | | 700 | | | | 69,545 | |
LGI Homes, Inc. (a) | | | 300 | | | | 48,582 | |
M/I Homes, Inc. (a) | | | 1,000 | | | | 58,670 | |
Meritage Homes Corporation (a) | | | 400 | | | | 37,632 | |
PulteGroup, Inc. | | | 500 | | | | 27,285 | |
Toll Brothers, Inc. | | | 500 | | | | 28,905 | |
TRI Pointe Homes, Inc. (a) | | | 2,400 | | | | 51,432 | |
| | | | | | | | 511,740 | |
Hussman Strategic Allocation Fund
Schedule of Investments (continued) |
June 30, 2021 |
COMMON STOCKS — 66.6% (continued) | | Shares | | | Value | |
Consumer Discretionary — 16.0% (continued) | | | | | | | | |
Leisure Facilities & Services — 0.9% | | | | | | | | |
Brinker International, Inc. (a) | | | 1,500 | | | $ | 92,775 | |
Domino’s Pizza, Inc. | | | 150 | | | | 69,974 | |
Waitr Holdings, Inc. (a) | | | 6,000 | | | | 10,680 | |
| | | | | | | | 173,429 | |
Leisure Products — 0.2% | | | | | | | | |
Mattel, Inc. (a) | | | 1,000 | | | | 20,100 | |
Nautilus, Inc. (a) | | | 1,500 | | | | 25,275 | |
| | | | | | | | 45,375 | |
Retail - Discretionary — 7.6% | | | | | | | | |
AutoZone, Inc. (a) | | | 30 | | | | 44,767 | |
Bed Bath & Beyond, Inc. (a) | | | 800 | | | | 26,632 | |
Big 5 Sporting Goods Corporation | | | 800 | | | | 20,544 | |
Buckle, Inc. (The) | | | 2,500 | | | | 124,374 | |
Chico’s FAS, Inc. (a) | | | 4,000 | | | | 26,320 | |
Designer Brands, Inc. - Class A (a) | | | 700 | | | | 11,585 | |
Dick’s Sporting Goods, Inc. | | | 1,200 | | | | 120,228 | |
Duluth Holdings, Inc. - Class B (a) | | | 4,400 | | | | 90,860 | |
Express, Inc. (a) | | | 13,000 | | | | 84,370 | |
Gap, Inc. (The) | | | 500 | | | | 16,825 | |
Genesco, Inc. (a) | | | 400 | | | | 25,472 | |
Hibbett, Inc. (a) | | | 1,000 | | | | 89,630 | |
Home Depot, Inc. (The) | | | 200 | | | | 63,778 | |
Kohl’s Corporation | | | 2,000 | | | | 110,220 | |
Lumber Liquidators Holdings, Inc. (a) | | | 3,000 | | | | 63,300 | |
Macy’s, Inc. (a) | | | 7,000 | | | | 132,719 | |
MarineMax, Inc. (a) | | | 1,000 | | | | 48,740 | |
O’Reilly Automotive, Inc. (a) | | | 70 | | | | 39,635 | |
Qurate Retail, Inc. - Series A | | | 4,000 | | | | 52,360 | |
Sally Beauty Holdings, Inc. (a) | | | 2,000 | | | | 44,140 | |
Signet Jewelers Ltd. (a) | | | 300 | | | | 24,237 | |
Sleep Number Corporation (a) | | | 1,000 | | | | 109,950 | |
Urban Outfitters, Inc. (a) | | | 800 | | | | 32,976 | |
Vera Bradley, Inc. (a) | | | 1,000 | | | | 12,390 | |
Williams-Sonoma, Inc. | | | 300 | | | | 47,895 | |
Zumiez, Inc. (a) | | | 800 | | | | 39,192 | |
| | | | | | | | 1,503,139 | |
Hussman Strategic Allocation Fund
Schedule of Investments (continued) |
June 30, 2021 |
COMMON STOCKS — 66.6% (continued) | | Shares | | | Value | |
Consumer Discretionary — 16.0% (continued) | | | | | | | | |
Specialty Retail — 0.4% | | | | | | | | |
Best Buy Company, Inc. | | | 300 | | | $ | 34,494 | |
Penske Automotive Group, Inc. | | | 500 | | | | 37,745 | |
| | | | | | | | 72,239 | |
Wholesale - Discretionary — 0.1% | | | | | | | | |
Educational Development Corporation | | | 2,000 | | | | 24,940 | |
| | | | | | | | | |
Consumer Staples — 9.1% | | | | | | | | |
Beverages — 0.3% | | | | | | | | |
National Beverage Corporation | | | 1,200 | | | | 56,676 | |
NewAge, Inc. (a) | | | 2,000 | | | | 4,460 | |
| | | | | | | | 61,136 | |
Consumer Products — 0.5% | | | | | | | | |
Colgate-Palmolive Company | | | 800 | | | | 65,080 | |
PepsiCo, Inc. | | | 200 | | | | 29,634 | |
| | | | | | | | 94,714 | |
Food — 3.1% | | | | | | | | |
B&G Foods, Inc. | | | 4,000 | | | | 131,200 | |
Campbell Soup Company | | | 1,600 | | | | 72,944 | |
General Mills, Inc. | | | 1,200 | | | | 73,116 | |
Herbalife Nutrition Ltd. (a) | | | 1,500 | | | | 79,095 | |
J.M. Smucker Company (The) | | | 500 | | | | 64,785 | |
Kellogg Company | | | 1,500 | | | | 96,495 | |
Kraft Heinz Company (The) | | | 1,200 | | | | 48,936 | |
LifeVantage Corporation (a) | | | 500 | | | | 3,675 | |
USANA Health Sciences, Inc. (a) | | | 400 | | | | 40,972 | |
| | | | | | | | 611,218 | |
Household Products — 1.0% | | | | | | | | |
Clearwater Paper Corporation (a) | | | 1,500 | | | | 43,455 | |
Clorox Company (The) | | | 300 | | | | 53,973 | |
Kimberly-Clark Corporation | | | 200 | | | | 26,756 | |
Nu Skin Enterprises, Inc. - Class A | | | 1,400 | | | | 79,310 | |
| | | | | | | | 203,494 | |
Retail - Consumer Staples — 4.2% | | | | | | | | |
Big Lots, Inc. | | | 2,000 | | | | 132,020 | |
Ingles Markets, Inc. - Class A | | | 800 | | | | 46,616 | |
Kroger Company (The) | | | 3,000 | | | | 114,930 | |
Murphy USA, Inc. | | | 700 | | | | 93,359 | |
Hussman Strategic Allocation Fund
Schedule of Investments (continued) |
June 30, 2021 |
COMMON STOCKS — 66.6% (continued) | | Shares | | | Value | |
Consumer Staples — 9.1% (continued) | | | | | | | | |
Retail - Consumer Staples — 4.2% (continued) | | | | | | | | |
Natural Grocers by Vitamin Cottage, Inc. | | | 3,000 | | | $ | 32,220 | |
Ollie’s Bargain Outlet Holdings, Inc. (a) | | | 1,000 | | | | 84,130 | |
Rite Aid Corporation (a) | | | 3,000 | | | | 48,900 | |
Sprouts Farmers Market, Inc. (a) | | | 4,000 | | | | 99,400 | |
United Natural Foods, Inc. (a) | | | 3,000 | | | | 110,940 | |
Walgreens Boots Alliance, Inc. | | | 1,200 | | | | 63,132 | |
Weis Markets, Inc. | | | 400 | | | | 20,664 | |
| | | | | | | | 846,311 | |
Energy — 3.6% | | | | | | | | |
Energy Equipment & Services — 0.4% | | | | | | | | |
American Superconductor Corporation (a) | | | 400 | | | | 6,956 | |
Nabors Industries Ltd. (a) | | | 600 | | | | 68,544 | |
| | | | | | | | 75,500 | |
Oil & Gas Producers — 1.1% | | | | | | | | |
Laredo Petroleum, Inc. (a) | | | 400 | | | | 37,116 | |
Ovintiv, Inc. | | | 1,000 | | | | 31,470 | |
Range Resources Corporation (a) | | | 3,000 | | | | 50,280 | |
SM Energy Company | | | 4,000 | | | | 98,520 | |
| | | | | | | | 217,386 | |
Renewable Energy — 2.1% | | | | | | | | |
Broadwind, Inc. (a) | | | 7,000 | | | | 31,710 | |
Canadian Solar, Inc. (a) | | | 2,500 | | | | 112,100 | |
CleanSpark, Inc. (a) | | | 1,500 | | | | 24,960 | |
First Solar, Inc. (a) | | | 100 | | | | 9,051 | |
JinkoSolar Holding Company Ltd. - ADR (a) | | | 2,500 | | | | 140,050 | |
Renewable Energy Group, Inc. (a) | | | 400 | | | | 24,936 | |
SunPower Corporation (a) | | | 1,500 | | | | 43,830 | |
Sunworks, Inc. (a) | | | 4,000 | | | | 42,040 | |
| | | | | | | | 428,677 | |
Financials — 5.9% | | | | | | | | |
Asset Management — 0.7% | | | | | | | | |
BrightSphere Investment Group, Inc. | | | 4,000 | | | | 93,720 | |
Federated Hermes, Inc. | | | 1,400 | | | | 47,474 | |
| | | | | | | | 141,194 | |
Banking — 0.8% | | | | | | | | |
Comerica, Inc. | | | 500 | | | | 35,670 | |
Customers Bancorp, Inc. (a) | | | 800 | | | | 31,192 | |
Hussman Strategic Allocation Fund
Schedule of Investments (continued) |
June 30, 2021 |
COMMON STOCKS — 66.6% (continued) | | Shares | | | Value | |
Financials — 5.9% (continued) | | | | | | | | |
Banking — 0.8% (continued) | | | | | | | | |
Hilltop Holdings, Inc. | | | 1,500 | | | $ | 54,600 | |
Investors Bancorp, Inc. | | | 2,000 | | | | 28,520 | |
Reliant Bancorp, Inc. | | | 500 | | | | 13,865 | |
| | | | | | | | 163,847 | |
Institutional Financial Services — 1.3% | | | | | | | | |
Cboe Global Markets, Inc. | | | 400 | | | | 47,620 | |
Evercore, Inc. - Class A | | | 700 | | | | 98,539 | |
StoneX Group, Inc. (a) | | | 1,000 | | | | 60,670 | |
Virtu Financial, Inc. - Class A | | | 2,000 | | | | 55,260 | |
| | | | | | | | 262,089 | |
Insurance — 2.0% | | | | | | | | |
Aflac, Inc. | | | 500 | | | | 26,830 | |
Allstate Corporation (The) | | | 500 | | | | 65,220 | |
Lincoln National Corporation | | | 1,000 | | | | 62,840 | |
MGIC Investment Corporation | | | 1,000 | | | | 13,600 | |
NMI Holdings, Inc. - Class A (a) | | | 1,000 | | | | 22,480 | |
Progressive Corporation (The) | | | 1,000 | | | | 98,210 | |
Unum Group | | | 4,000 | | | | 113,600 | |
| | | | | | | | 402,780 | |
Specialty Finance — 1.1% | | | | | | | | |
Alliance Data Systems Corporation | | | 400 | | | | 41,676 | |
Ally Financial, Inc. | | | 500 | | | | 24,920 | |
Essent Group Ltd. | | | 500 | | | | 22,475 | |
Navient Corporation | | | 1,500 | | | | 28,995 | |
PennyMac Financial Services, Inc. | | | 1,400 | | | | 86,408 | |
| | | | | | | | 204,474 | |
Health Care — 10.3% | | | | | | | | |
Biotech & Pharma — 6.8% | | | | | | | | |
AbbVie, Inc. | | | 500 | | | | 56,320 | |
Alexion Pharmaceuticals, Inc. (a) | | | 200 | | | | 36,742 | |
Alkermes plc (a) | | | 1,000 | | | | 24,520 | |
Amgen, Inc. | | | 300 | | | | 73,125 | |
Amneal Pharmaceuticals, Inc. (a) | | | 5,000 | | | | 25,600 | |
ANI Pharmaceuticals, Inc. (a) | | | 400 | | | | 14,020 | |
Beam Therapeutics, Inc. (a) | | | 100 | | | | 12,871 | |
Biocept, Inc. (a) | | | 2,000 | | | | 8,380 | |
Biogen, Inc. (a) | | | 100 | | | | 34,627 | |
Hussman Strategic Allocation Fund
Schedule of Investments (continued) |
June 30, 2021 |
COMMON STOCKS — 66.6% (continued) | | Shares | | | Value | |
Health Care — 10.3% (continued) | | | | | | | | |
Biotech & Pharma — 6.8% (continued) | | | | | | | | |
Blueprint Medicines Corporation (a) | | | 200 | | | $ | 17,592 | |
Catalyst Pharmaceutical, Inc. (a) | | | 4,000 | | | | 23,000 | |
Clovis Oncology, Inc. (a) | | | 1,500 | | | | 8,700 | |
Coherus Biosciences, Inc. (a) | | | 1,000 | | | | 13,830 | |
Corcept Therapeutics, Inc. (a) | | | 3,000 | | | | 66,000 | |
CRISPR Therapeutics AG (a) | | | 300 | | | | 48,567 | |
Editas Medicine, Inc. (a) | | | 1,000 | | | | 56,640 | |
electroCore, Inc. (a) | | | 1,000 | | | | 1,190 | |
Exelixis, Inc. (a) | | | 2,000 | | | | 36,440 | |
Innoviva, Inc. (a) | | | 4,000 | | | | 53,640 | |
Intra-Cellular Therapies, Inc. (a) | | | 1,000 | | | | 40,820 | |
Ionis Pharmaceuticals, Inc. (a) | | | 200 | | | | 7,978 | |
Jazz Pharmaceuticals plc (a) | | | 600 | | | | 106,584 | |
Jounce Therapeutics, Inc. (a) | | | 500 | | | | 3,400 | |
Neurocrine Biosciences, Inc. (a) | | | 500 | | | | 48,660 | |
Neuronetics, Inc. (a) | | | 1,200 | | | | 19,224 | |
Organogenesis Holdings, Inc. (a) | | | 1,000 | | | | 16,620 | |
Pacira Biosciences, Inc. (a) | | | 400 | | | | 24,272 | |
Sage Therapeutics, Inc. (a) | | | 2,400 | | | | 136,344 | |
Sangamo Therapeutics, Inc. (a) | | | 1,000 | | | | 11,970 | |
Supernus Pharmaceuticals, Inc. (a) | | | 3,000 | | | | 92,370 | |
United Therapeutics Corporation (a) | | | 200 | | | | 35,882 | |
Vanda Pharmaceuticals, Inc. (a) | | | 3,000 | | | | 64,530 | |
Vertex Pharmaceuticals, Inc. (a) | | | 300 | | | | 60,489 | |
Viatris, Inc. | | | 5,000 | | | | 71,450 | |
| | | | | | | | 1,352,397 | |
Health Care Facilities & Services — 1.2% | | | | | | | | |
Brookdale Senior Living, Inc. (a) | | | 2,000 | | | | 15,800 | |
Cigna Corporation | | | 200 | | | | 47,414 | |
Community Health Systems, Inc. (a) | | | 2,800 | | | | 43,232 | |
Fulget Genetics, Inc. (a) | | | 300 | | | | 27,669 | |
Laboratory Corporation of America Holdings (a) | | | 200 | | | | 55,170 | |
Patterson Companies, Inc. | | | 2,000 | | | | 60,780 | |
| | | | | | | | 250,065 | |
Health Care Providers & Services — 0.6% | | | | | | | | |
HCA Healthcare, Inc. | | | 200 | | | | 41,348 | |
Hussman Strategic Allocation Fund
Schedule of Investments (continued) |
June 30, 2021 |
COMMON STOCKS — 66.6% (continued) | | Shares | | | Value | |
Health Care — 10.3% (continued) | | | | | | | | |
Health Care Providers & Services — 0.6% (continued) | | | | | | | | |
Quest Diagnostics, Inc. | | | 600 | | | $ | 79,182 | |
| | | | | | | | 120,530 | |
Medical Equipment & Devices — 1.7% | | | | | | | | |
10X Genomics, Inc. - Class A (a) | | | 100 | | | | 19,582 | |
Accuray, Inc. (a) | | | 1,000 | | | | 4,520 | |
Alpha Pro Tech Ltd. (a) | | | 1,500 | | | | 12,855 | |
Co-Diagnostics, Inc. (a) | | | 1,000 | | | | 8,250 | |
Exact Sciences Corporation (a) | | | 400 | | | | 49,724 | |
Fluidigm Corporation (a) | | | 4,000 | | | | 24,640 | |
Hologic, Inc. (a) | | | 1,000 | | | | 66,720 | |
Meridian Bioscience, Inc. (a) | | | 4,000 | | | | 88,720 | |
OPKO Health, Inc. (a) | | | 4,000 | | | | 16,200 | |
Quidel Corporation (a) | | | 200 | | | | 25,624 | |
Retractable Technologies, Inc. (a) | | | 400 | | | | 4,624 | |
Sonoma Pharmaceuticals, Inc. (a) | | | 100 | | | | 734 | |
Vericel Corporation (a) | | | 200 | | | | 10,500 | |
| | | | | | | | 332,693 | |
Industrials — 3.1% | | | | | | | | |
Commercial Support Services — 0.7% | | | | | | | | |
H&R Block, Inc. | | | 1,200 | | | | 28,176 | |
Pitney Bowes, Inc. | | | 4,000 | | | | 35,080 | |
Quad/Graphics, Inc.(a) | | | 2,000 | | | | 8,300 | |
TriNet Group, Inc. (a) | | | 800 | | | | 57,984 | |
| | | | | | | | 129,540 | |
Diversified Consumer Services — 0.1% | | | | | | | | |
Hillenbrand, Inc. | | | 500 | | | | 22,040 | |
| | | | | | | | | |
Electrical Equipment — 0.4% | | | | | | | | |
Blink Charging Company (a) | | | 200 | | | | 8,234 | |
BWX Technologies, Inc. | | | 300 | | | | 17,436 | |
Capstone Green Energy Corporation (a) | | | 2,000 | | | | 11,240 | |
Carrier Global Corporation | | | 500 | | | | 24,300 | |
WidePoint Corporation (a) | | | 4,000 | | | | 29,040 | |
| | | | | | | | 90,250 | |
Engineering & Construction — 0.3% | | | | | | | | |
Infrastructure & Energy Alternatives, Inc. (a) | | | 600 | | | | 7,716 | |
Orbital Energy Group, Inc. (a) | | | 3,000 | | | | 13,110 | |
Hussman Strategic Allocation Fund
Schedule of Investments (continued) |
June 30, 2021 |
COMMON STOCKS — 66.6% (continued) | | Shares | | | Value | |
Industrials — 3.1% (continued) | | | | | | | | |
Engineering & Construction — 0.3% (continued) | | | | | | | | |
Primoris Services Corporation | | | 1,000 | | | $ | 29,430 | |
Tutor Perini Corporation (a) | | | 1,000 | | | | 13,850 | |
| | | | | | | | 64,106 | |
Industrial Intermediate Products — 0.2% | | | | | | | | |
Proto Labs, Inc. (a) | | | 400 | | | | 36,720 | |
| | | | | | | | | |
Industrial Support Services — 0.8% | | | | | | | | |
ARC Document Solutions, Inc. | | | 1,500 | | | | 3,225 | |
MSC Industrial Direct Company, Inc. - Class A | | | 1,000 | | | | 89,730 | |
Triton International Ltd. | | | 500 | | | | 26,170 | |
WESCO International, Inc. (a) | | | 400 | | | | 41,128 | |
| | | | | | | | 160,253 | |
Machinery — 0.2% | | | | | | | | |
Energy Recovery, Inc. (a) | | | 2,000 | | | | 45,560 | |
| | | | | | | | | |
Professional Services — 0.1% | | | | | | | | |
Insperity, Inc. | | | 200 | | | | 18,074 | |
| | | | | | | | | |
Transportation & Logistics — 0.3% | | | | | | | | |
Atlas Air Worldwide Holdings, Inc. (a) | | | 300 | | | | 20,433 | |
Expeditors International of Washington, Inc. | | | 300 | | | | 37,980 | |
| | | | | | | | 58,413 | |
Materials — 2.9% | | | | | | | | |
Chemicals — 1.1% | | | | | | | | |
AdvanSix, Inc. (a) | | | 500 | | | | 14,930 | |
Celanese Corporation | | | 200 | | | | 30,320 | |
Ingevity Corporation (a) | | | 300 | | | | 24,408 | |
Kronos Worldwide, Inc. | | | 1,000 | | | | 14,320 | |
Mosaic Company (The) | | | 2,000 | | | | 63,820 | |
Rayonier Advanced Materials, Inc. (a) | | | 1,500 | | | | 10,035 | |
Valvoline, Inc. | | | 1,500 | | | | 48,690 | |
Yield10 Bioscience, Inc. (a) | | | 200 | | | | 1,706 | |
| | | | | | | | 208,229 | |
Metals & Mining — 1.6% | | | | | | | | |
Agnico Eagle Mines Ltd. | | | 500 | | | | 30,225 | |
AngloGold Ashanti Ltd. - ADR | | | 1,200 | | | | 22,296 | |
Barrick Gold Corporation | | | 4,000 | | | | 82,720 | |
Hussman Strategic Allocation Fund
Schedule of Investments (continued) |
June 30, 2021 |
COMMON STOCKS — 66.6% (continued) | | Shares | | | Value | |
Materials — 2.9% (continued) | | | | | | | | |
Metals & Mining — 1.6% (continued) | | | | | | | | |
Compass Minerals International, Inc. | | | 400 | | | $ | 23,704 | |
Kinross Gold Corporation | | | 3,600 | | | | 22,860 | |
Newmont Corporation | | | 1,500 | | | | 95,070 | |
Royal Gold, Inc. | | | 350 | | | | 39,935 | |
| | | | | | | | 316,810 | |
Paper & Forest Products — 0.2% | | | | | | | | |
Boise Cascade Company | | | 800 | | | | 46,680 | |
| | | | | | | | | |
Real Estate — 0.5% | | | | | | | | |
Real Estate Services — 0.3% | | | | | | | | |
eXp World Holdings, Inc. (a) | | | 800 | | | | 31,016 | |
Jones Lang LaSalle, Inc. (a) | | | 100 | | | | 19,546 | |
| | | | | | | | 50,562 | |
REITs — 0.2% | | | | | | | | |
Kimco Realty Corporation | | | 2,000 | | | | 41,700 | |
| | | | | | | | | |
Technology — 9.5% | | | | | | | | |
Semiconductors — 1.2% | | | | | | | | |
Intel Corporation | | | 1,500 | | | | 84,210 | |
QUALCOMM, Inc. | | | 600 | | | | 85,758 | |
Skyworks Solutions, Inc. | | | 400 | | | | 76,700 | |
| | | | | | | | 246,668 | |
Software — 2.2% | | | | | | | | |
AudioEye, Inc. (a) | | | 400 | | | | 6,716 | |
Ebix, Inc. | | | 2,500 | | | | 84,750 | |
Evolent Health, Inc. - Class A (a) | | | 1,000 | | | | 21,120 | |
j2 Global, Inc. (a) | | | 500 | | | | 68,775 | |
Microsoft Corporation | | | 50 | | | | 13,545 | |
NextGen Healthcare, Inc. (a) | | | 1,000 | | | | 16,590 | |
Oracle Corporation | | | 800 | | | | 62,272 | |
Qualys, Inc. (a) | | | 500 | | | | 50,345 | |
Synchronoss Technologies, Inc. (a) | | | 2,000 | | | | 7,180 | |
VMware, Inc. - Class A (a) | | | 400 | | | | 63,988 | |
Xperi Holding Corporation | | | 1,500 | | | | 33,360 | |
| | | | | | | | 428,641 | |
Technology Hardware — 4.2% | | | | | | | | |
Apple, Inc. | | | 100 | | | | 13,696 | |
Hussman Strategic Allocation Fund
Schedule of Investments (continued) |
June 30, 2021 |
COMMON STOCKS — 66.6% (continued) | | Shares | | | Value | |
Technology — 9.5% (continued) | | | | | | | | |
Technology Hardware — 4.2% (continued) | | | | | | | | |
Aviat Networks, Inc. (a) | | | 800 | | | $ | 26,216 | |
Cambium Networks Corporation (a) | | | 300 | | | | 14,505 | |
Casa Systems, Inc. (a) | | | 1,800 | | | | 15,966 | |
Clearfield, Inc. (a) | | | 2,000 | | | | 74,900 | |
Corning, Inc. | | | 1,000 | | | | 40,900 | |
F5 Networks, Inc. (a) | | | 400 | | | | 74,664 | |
Genasys, Inc. (a) | | | 1,000 | | | | 5,480 | |
HP, Inc. | | | 3,000 | | | | 90,570 | |
Infinera Corporation (a) | | | 1,000 | | | | 10,200 | |
Jabil, Inc. | | | 500 | | | | 29,060 | |
Maxar Technologies, Inc. | | | 1,000 | | | | 39,920 | |
NetApp, Inc. | | | 1,200 | | | | 98,184 | |
Plantronics, Inc. (a) | | | 800 | | | | 33,384 | |
Ribbon Communications, Inc. (a) | | | 6,000 | | | | 45,660 | |
Sonos, Inc. (a) | | | 1,000 | | | | 35,230 | |
Turtle Beach Corporation (a) | | | 2,000 | | | | 63,840 | |
Ubiquiti, Inc. | | | 400 | | | | 124,876 | |
| | | | | | | | 837,251 | |
Technology Services — 1.9% | | | | | | | | |
Cognizant Technology Solutions Corporation - Class A | | | 1,600 | | | | 110,816 | |
FactSet Research Systems, Inc. | | | 100 | | | | 33,561 | |
Infosys Ltd. - ADR | | | 5,000 | | | | 105,950 | |
International Business Machines Corporation | | | 200 | | | | 29,318 | |
MAXIMUS, Inc. | | | 500 | | | | 43,985 | |
Square, Inc. - Class A (a) | | | 200 | | | | 48,760 | |
| | | | | | | | 372,390 | |
Utilities — 0.2% | | | | | | | | |
Electric Utilities — 0.2% | | | | | | | | |
NRG Energy, Inc. | | | 1,000 | | | | 40,300 | |
| | | | | | | | | |
Total Common Stocks (Cost $11,734,385) (c) | | | | | | $ | 13,244,901 | |
EXCHANGE-TRADED FUNDS — 0.3% | | Shares | | | Value | |
iShares Gold Trust (a) | | | 1,000 | | | $ | 33,710 | |
SPDR Gold Shares (a) | | | 200 | | | | 33,126 | |
Total Exchange-Traded Funds (Cost $71,084) | | | | | | $ | 66,836 | |
Hussman Strategic Allocation Fund
Schedule of Investments (continued) |
June 30, 2021 |
U.S. TREASURY OBLIGATIONS — 17.6% | | Par Value | | | Value | |
U.S. Treasury Inflation-Protected Notes — 2.9% | | | | | | | | |
0.125%, due 01/15/2031 | | $ | 512,800 | | | $ | 564,701 | |
| | | | | | | | | |
U.S. Treasury Notes (Long-Term) — 9.7% | | | | | | | | |
0.125%, due 07/31/2022 | | | 500,000 | | | | 500,079 | |
0.625%, due 08/15/2030 | | | 500,000 | | | | 466,191 | |
0.875%, due 11/15/2030 | | | 500,000 | | | | 475,859 | |
1.125%, due 02/15/2031 | | | 500,000 | | | | 485,859 | |
| | | | | | | | 1,927,988 | |
U.S. Treasury Notes (Short-Term) — 5.0% | | | | | | | | |
1.5%, due 08/31/2021 | | | 1,000,000 | | | | 1,002,412 | |
| | | | | | | | | |
Total U.S. Treasury Obligations (Cost $3,522,517) | | | | | | $ | 3,495,101 | |
WARRANTS — 0.0% (b) | | Shares | | | Value | |
Nabors Industries Ltd. (Cost $0) | | | 240 | | | $ | 2,400 | |
EXCHANGE-TRADED PUT OPTION CONTRACTS — 0.1% | | Contracts | | | Notional
Amount | | | Value | |
Russell 2000 Index Option, 09/17/2021 at $1,100 | | | 24 | | | $ | 5,545,318 | | | $ | 2,232 | |
S&P 500 Index Option, 09/17/2021 at $3,500 | | | 15 | | | | 6,446,250 | | | | 21,750 | |
Total Put Option Contracts (Cost $65,937) | | | | | | $ | 11,991,568 | | | $ | 23,982 | |
| | | | | | | | | | | | | |
Total Investments at Value — 84.6% (Cost $15,393,923) | | | | | | | | | | $ | 16,833,220 | |
Hussman Strategic Allocation Fund
Schedule of Investments (continued) |
June 30, 2021 |
MONEY MARKET FUNDS — 35.8% | | Shares | | | Value | |
Invesco Short-Term Investments Trust - Treasury Portfolio - Institutional Class, 0.01% (d) (Cost $7,117,135) | | | 7,117,135 | | | $ | 7,117,135 | |
| | | | | | | | | |
Total Investments and Money Market Funds at Value — 120.4% (Cost $22,511,058) | | | | | | $ | 23,950,355 | |
| | | | | | | | | |
Written Call Option Contracts — (20.6%) | | | | | | | (4,096,848 | ) |
| | | | | | | | �� | |
Other Assets in Excess of Liabilities — 0.2% | | | | | | | 27,735 | |
| | | | | | | | | |
Net Assets — 100.0% | | | | | | $ | 19,881,242 | |
(a) | Non-income producing security. |
(b) | Percentage rounds to less than 0.1%. |
(c) | Common stocks owned by the Fund are held in escrow by the Fund’s custodian (or by a securities depositary) to secure the Fund’s obligations to settle outstanding call option contracts it has written (Note 1). |
(d) | The rate shown is the 7-day effective yield as of June 30, 2021. |
See accompanying notes to financial statements. |
Hussman Strategic Allocation Fund
Schedule of Open Written Option Contracts |
June 30, 2021 |
EXCHANGE-TRADED WRITTEN CALL OPTION CONTRACTS | | Contracts | | | Notional
Amount | | | Strike
Price | | | Expiration
Date | | | Value of
Options | |
Call Option Contracts |
Russell 2000 Index Option | | | 24 | | | $ | 5,545,318 | | | $ | 1,100 | | | | 09/17/2021 | | | $ | 2,895,048 | |
S&P 500 Index Option | | | 15 | | | | 6,446,250 | | | | 3,500 | | | | 09/17/2021 | | | | 1,201,800 | |
Total Written Call Option Contracts (Premiums received $3,781,541) | | | | | | $ | 11,991,568 | | | | | | | | | | | $ | 4,096,848 | |
See accompanying notes to financial statements. |
Hussman Strategic Total Return Fund
Schedule of Investments |
June 30, 2021 |
COMMON STOCKS — 13.9% | | Shares | | | Value | |
Energy — 3.5% | | | | | | | | |
Energy Equipment & Services — 0.7% | | | | | | | | |
Nabors Industries Ltd. (a) | | | 20,000 | | | $ | 2,284,800 | |
| | | | | | | | | |
Oil & Gas Producers — 2.3% | | | | | | | | |
Cheniere Energy Partners, L.P. | | | 20,000 | | | | 885,800 | |
Laredo Petroleum, Inc. (a) | | | 15,000 | | | | 1,391,850 | |
NuStar Energy, L.P. | | | 31,000 | | | | 559,550 | |
ONEOK, Inc. | | | 985 | | | | 54,805 | |
PBF Energy, Inc. - Class A (a) | | | 35,000 | | | | 535,500 | |
Range Resources Corporation (a) | | | 70,000 | | | | 1,173,200 | |
SM Energy Company | | | 70,000 | | | | 1,724,100 | |
Valero Energy Corporation | | | 10,000 | | | | 780,800 | |
Williams Companies, Inc. (The) | | | 1,293 | | | | 34,329 | |
| | | | | | | | 7,139,934 | |
Oil & Gas Services & Equipment — 0.5% | | | | | | | | |
Halliburton Company | | | 35,000 | | | | 809,200 | |
Helmerich & Payne, Inc. | | | 25,000 | | | | 815,750 | |
| | | | | | | | 1,624,950 | |
Renewable Energy — 0.0% (b) | | | | | | | | |
Beam Global (a) | | | 2,500 | | | | 95,775 | |
| | | | | | | | | |
Industrials — 0.3% | | | | | | | | |
Electrical Equipment — 0.3% | | | | | | | | |
BWX Technologies, Inc. | | | 14,000 | | | | 813,680 | |
| | | | | | | | | |
Materials — 6.5% | | | | | | | | |
Construction Materials — 0.4% | | | | | | | | |
MDU Resources Group, Inc. | | | 35,000 | | | | 1,096,900 | |
| | | | | | | | | |
Metals & Mining — 6.1% | | | | | | | | |
Agnico Eagle Mines Ltd. | | | 22,500 | | | | 1,360,125 | |
Alamos Gold, Inc. - Class A | | | 75,000 | | | | 573,750 | |
AngloGold Ashanti Ltd. - ADR | | | 54,000 | | | | 1,003,320 | |
B2Gold Corporation | | | 150,000 | | | | 631,500 | |
Barrick Gold Corporation | | | 180,000 | | | | 3,722,400 | |
Coeur Mining, Inc. (a) | | | 60,000 | | | | 532,800 | |
Compania de Minas Buenaventura S.A.A. - ADR (a) | | | 50,000 | | | | 452,500 | |
Kinross Gold Corporation | | | 162,000 | | | | 1,028,700 | |
Hussman Strategic Total Return Fund
Schedule of Investments (continued) |
June 30, 2021 |
COMMON STOCKS — 13.9% (continued) | | Shares | | | Value | |
Materials — 6.5% (continued) | | | | | | | | |
Metals & Mining — 6.1% (continued) | | | | | | | | |
Newmont Corporation | | | 67,500 | | | $ | 4,278,150 | |
Novagold Resources, Inc. (a) | | | 50,000 | | | | 400,500 | |
Pan American Silver Corporation | | | 36,000 | | | | 1,028,520 | |
Royal Gold, Inc. | | | 15,000 | | | | 1,711,500 | |
Wheaton Precious Metals Corporation | | | 50,000 | | | | 2,203,500 | |
Yamana Gold, Inc. | | | 125,000 | | | | 527,500 | |
| | | | | | | | 19,454,765 | |
Utilities — 3.6% | | | | | | | | |
Electric & Gas Marketing & Trading — 0.1% | | | | | | | | |
Spark Energy, Inc. - Class A | | | 20,000 | | | | 226,600 | |
| | | | | | | | | |
Electric Utilities — 3.1% | | | | | | | | |
AES Corporation (The) | | | 25,000 | | | | 651,750 | |
ALLETE, Inc. | | | 5,000 | | | | 349,900 | |
Ameren Corporation | | | 400 | | | | 32,016 | |
American Electric Power Company, Inc. | | | 2,000 | | | | 169,180 | |
Avangrid, Inc. | | | 10,000 | | | | 514,300 | |
Avista Corporation | | | 10,000 | | | | 426,700 | |
Black Hills Corporation | | | 10,000 | | | | 656,300 | |
Consolidated Edison, Inc. | | | 10,000 | | | | 717,200 | |
Dominion Energy, Inc. | | | 2,000 | | | | 147,140 | |
DTE Energy Company | | | 1,000 | | | | 129,600 | |
Duke Energy Corporation | | | 2,000 | | | | 197,440 | |
Edison International | | | 5,000 | | | | 289,100 | |
Entergy Corporation | | | 5,000 | | | | 498,500 | |
Exelon Corporation | | | 20,000 | | | | 886,200 | |
FirstEnergy Corporation | | | 10,000 | | | | 372,100 | |
Hawaiian Electric Industries, Inc. | | | 5,000 | | | | 211,400 | |
NorthWestern Corporation | | | 5,000 | | | | 301,100 | |
NRG Energy, Inc. | | | 25,000 | | | | 1,007,500 | |
Otter Tail Corporation | | | 5,000 | | | | 244,050 | |
Pinnacle West Capital Corporation | | | 2,000 | | | | 163,940 | |
Portland General Electric Company | | | 10,000 | | | | 460,800 | |
PPL Corporation | | | 25,000 | | | | 699,250 | |
Public Service Enterprise Group, Inc. | | | 5,000 | | | | 298,700 | |
Southern Company (The) | | | 10,000 | | | | 605,100 | |
| | | | | | | | 10,029,266 | |
Hussman Strategic Total Return Fund
Schedule of Investments (continued) |
June 30, 2021 |
COMMON STOCKS — 13.9% (continued) | | Shares | | | Value | |
Utilities — 3.6% (continued) | | | | | | | | |
Gas & Water Utilities — 0.4% | | | | | | | | |
Global Water Resources, Inc. | | | 1,000 | | | $ | 17,080 | |
UGI Corporation | | | 25,000 | | | | 1,157,750 | |
| | | | | | | | 1,174,830 | |
| | | | | | | | | |
Total Common Stocks (Cost $39,675,751) | | | | | | $ | 43,941,500 | |
EXCHANGE-TRADED FUNDS — 3.6% | | | | | | |
Invesco CurrencyShares British Pound Sterling Trust (a) | | | 20,000 | | | $ | 2,668,600 | |
Invesco CurrencyShares Euro Currency Trust (a) | | | 20,000 | | | | 2,216,200 | |
Invesco CurrencyShares Japanese Yen Trust (a) | | | 1,000 | | | | 84,730 | |
Invesco CurrencyShares Swiss Franc Trust (a) | | | 5,000 | | | | 489,500 | |
iShares Gold Trust (a) | | | 90,000 | | | | 3,033,900 | |
SPDR Gold Shares (a) | | | 18,000 | | | | 2,981,340 | |
Total Exchange-Traded Funds (Cost $10,762,813) | | | | | | $ | 11,474,270 | |
U.S. TREASURY OBLIGATIONS — 72.3% | | Par Value | | | Value | |
U.S. Treasury Inflation-Protected Notes — 12.3% | | | | | | | | |
2.5%, due 01/15/2029 | | $ | 12,435,100 | | | $ | 16,034,771 | |
0.125%, due 01/15/2030 | | | 10,376,900 | | | | 11,405,956 | |
0.125%, due 01/15/2031 | | | 10,256,000 | | | | 11,304,794 | |
| | | | | | | | 38,745,521 | |
U.S. Treasury Notes — 60.0% | | | | | | | | |
1.75%, due 06/15/2022 | | | 10,000,000 | | | | 10,157,905 | |
1.5%, due 08/15/2022 | | | 25,000,000 | | | | 25,391,602 | |
2%, due 05/31/2024 | | | 25,000,000 | | | | 26,132,812 | |
1.375%, due 01/31/2025 | | | 15,000,000 | | | | 15,417,188 | |
2.125%, due 05/31/2026 | | | 10,000,000 | | | | 10,612,500 | |
1.5%, due 08/15/2026 | | | 25,000,000 | | | | 25,760,254 | |
2.25%, due 11/15/2027 | | | 10,000,000 | | | | 10,705,664 | |
0.625%, due 08/15/2030 | | | 50,000,000 | | | | 46,626,953 | |
0.875%, due 11/15/2030 | | | 10,000,000 | | | | 9,518,750 | |
1.125%, due 02/15/2031 | | | 10,000,000 | | | | 9,718,750 | |
| | | | | | | | 190,042,378 | |
| | | | | | | | | |
Total U.S. Treasury Obligations (Cost $221,951,733) | | | | | | $ | 228,787,899 | |
Hussman Strategic Total Return Fund
Schedule of Investments (continued) |
June 30, 2021 |
WARRANTS — 0.0% (b) | | Shares | | | Value | |
Nabors Industries Ltd. (Cost $0) | | | 8,000 | | | $ | 80,000 | |
| | | | | | | | | |
Total Investments at Value — 89.8% (Cost $272,390,297) | | | | | | $ | 284,283,669 | |
MONEY MARKET FUNDS — 10.1% | | | | | | |
Invesco Short-Term Investments Trust - Treasury Portfolio - Institutional Class, 0.01% (c) (Cost $31,821,289) | | | 31,821,289 | | | $ | 31,821,289 | |
| | | | | | | | | |
Total Investments and Money Market Funds at Value — 99.9% (Cost $304,211,586) | | | | | | $ | 316,104,958 | |
| | | | | | | | | |
Other Assets in Excess of Liabilities — 0.1% | | | | | | | 433,928 | |
| | | | | | | | | |
Net Assets — 100.0% | | | | | | $ | 316,538,886 | |
ADR - American Depositary Receipt. |
(a) | Non-income producing security. |
(b) | Percentage rounds to less than 0.1%. |
(c) | The rate shown is the 7-day effective yield as of June 30, 2021. |
See accompanying notes to financial statements. |
Hussman Strategic International Fund
Schedule of Investments |
June 30, 2021 |
COMMON STOCKS — 88.4% | | Shares | | | Value | |
Australia — 4.8% | | | | | | | | |
Accent Group Ltd. | | | 42,000 | | | $ | 87,865 | |
Coles Group Ltd. | | | 4,000 | | | | 51,232 | |
Computershare Ltd. | | | 11,000 | | | | 139,398 | |
Harvey Norman Holdings Ltd. | | | 14,000 | | | | 57,574 | |
IPH Ltd. | | | 10,000 | | | | 58,508 | |
JB Hi-Fi Ltd. | | | 2,800 | | | | 106,101 | |
Sandfire Resources Ltd. | | | 10,000 | | | | 51,043 | |
SG Fleet Group Ltd | | | 20,000 | | | | 45,057 | |
SmartGroup Corporation Ltd. | | | 10,000 | | | | 55,280 | |
STRABAG SE | | | 1,500 | | | | 64,309 | |
| | | | | | | | 716,367 | |
Austria — 1.3% | | | | | | | | |
ams AG (a) | | | 4,000 | | | | 80,355 | |
EVN AG | | | 5,000 | | | | 117,853 | |
| | | | | | | | 198,208 | |
Belgium — 3.4% | | | | | | | | |
bpost S.A. (a) | | | 10,000 | | | | 119,997 | |
Colruyt S.A. | | | 2,000 | | | | 111,860 | |
Econocom Group S.A./N.V. | | | 28,000 | | | | 106,392 | |
Ontex Group N.V. (a) | | | 5,000 | | | | 62,303 | |
Telenet Group Holding N.V. | | | 2,600 | | | | 97,962 | |
| | | | | | | | 498,514 | |
Bermuda — 0.3% | | | | | | | | |
BW LPG Ltd. | | | 8,000 | | | | 51,705 | |
| | | | | | | | | |
Canada — 9.2% | | | | | | | | |
Alamos Gold, Inc. - Class A | | | 3,500 | | | | 26,735 | |
B2Gold Corporation | | | 10,000 | | | | 41,944 | |
BRP, Inc. | | | 500 | | | | 39,121 | |
Canada Goose Holdings, Inc. (a) | | | 1,800 | | | | 78,664 | |
Canadian Western Bank Group | | | 2,000 | | | | 56,140 | |
Cascades, Inc. | | | 4,000 | | | | 49,236 | |
Celestica, Inc. (a) | | | 10,000 | | | | 78,403 | |
CI Financial Corporation | | | 4,500 | | | | 82,577 | |
Dollarama, Inc. | | | 3,000 | | | | 137,302 | |
Eldorado Gold Corporation (a) | | | 4,000 | | | | 39,718 | |
iA Financial Corporation, Inc. | | | 2,500 | | | | 136,096 | |
IGM Financial, Inc. | | | 3,500 | | | | 123,541 | |
Hussman Strategic International Fund
Schedule of Investments (continued) |
June 30, 2021 |
COMMON STOCKS — 88.4% (continued) | | Shares | | | Value | |
Canada — 9.2% (continued) | | | | | | | | |
Kinross Gold Corporation | | | 4,000 | | | $ | 25,360 | |
Linamar Corporation | | | 1,000 | | | | 62,714 | |
Manulife Financial Corporation | | | 5,500 | | | | 108,248 | |
Sun Life Financial, Inc. | | | 1,500 | | | | 77,338 | |
Tourmaline Oil Corporation | | | 3,000 | | | | 85,735 | |
Transcontinental, Inc. - Class A | | | 6,000 | | | | 112,668 | |
| | | | | | | | 1,361,540 | |
Denmark — 0.6% | | | | | | | | |
Novo Nordisk A/S - Class B | | | 1,000 | | | | 83,717 | |
| | | | | | | | | |
France — 7.7% | | | | | | | | |
Albioma S.A. | | | 1,500 | | | | 61,417 | |
ALD S.A. | | | 6,500 | | | | 97,579 | |
Atos SE | | | 1,500 | | | | 91,355 | |
Carrefour S.A. | | | 4,000 | | | | 78,731 | |
Electricite de France S.A. | | | 7,000 | | | | 95,679 | |
Eutelsat Communications S.A. | | | 8,000 | | | | 93,605 | |
Iliad S.A. | | | 600 | | | | 87,927 | |
Ipsos | | | 2,500 | | | | 105,500 | |
Mercialys S.A. | | | 5,300 | | | | 64,192 | |
Metropole Television S.A. | | | 3,000 | | | | 63,117 | |
Sanofi | | | 700 | | | | 73,557 | |
Television Francaise 1 | | | 6,500 | | | | 65,826 | |
Trigano S.A | | | 300 | | | | 62,042 | |
Vilmorin & Cie | | | 1,500 | | | | 99,737 | |
| | | | | | | | 1,140,264 | |
Germany — 6.6% | | | | | | | | |
Bayerische Motoren Werke AG | | | 1,000 | | | | 106,034 | |
Daimler AG | | | 700 | | | | 62,562 | |
Evonik Industries AG | | | 2,000 | | | | 67,159 | |
Fresenius Medical Care AG & Company KGaA | | | 2,000 | | | | 166,222 | |
Fresenius SE & Company KGaA | | | 2,000 | | | | 104,398 | |
Hornbach Holding AG & Company KGaA | | | 1,500 | | | | 171,092 | |
ProSiebenSat.1 Media SE | | | 4,000 | | | | 79,772 | |
Siemens Healthineers AG | | | 1,000 | | | | 61,324 | |
United Internet AG | | | 2,500 | | | | 102,261 | |
Volkswagon AG | | | 200 | | | | 65,744 | |
| | | | | | | | 986,568 | |
Hussman Strategic International Fund
Schedule of Investments (continued) |
June 30, 2021 |
COMMON STOCKS — 88.4% (continued) | | Shares | | | Value | |
Ireland — 0.4% | | | | | | | | |
Glanbia plc | | | 4,000 | | | $ | 65,158 | |
| | | | | | | | | |
Israel — 0.6% | | | | | | | | |
Plus500 Ltd. | | | 5,000 | | | | 92,420 | |
| | | | | | | | | |
Italy — 1.5% | | | | | | | | |
ACEA SpA | | | 1,500 | | | | 34,685 | |
Azimut Holdings SpA | | | 3,000 | | | | 72,968 | |
Carel Industries SpA | | | 2,000 | | | | 48,031 | |
Moncler SpA | | | 1,000 | | | | 67,800 | |
| | | | | | | | 223,484 | |
Japan — 26.5% | | | | | | | | |
Arcland Sakamoto Company Ltd. | | | 4,000 | | | | 54,605 | |
Asahi Company Ltd. | | | 7,000 | | | | 90,314 | |
Belluna Company Ltd. | | | 7,500 | | | | 65,873 | |
BeNEXT-Yumeshin Group Company | | | 3,000 | | | | 34,431 | |
C.I. Takiron Corporation | | | 11,100 | | | | 58,372 | |
Change, Inc. (a) | | | 3,200 | | | | 85,458 | |
Daiwabo Holdings Company Ltd. | | | 6,000 | | | | 102,989 | |
Enigmo, Inc. | | | 10,500 | | | | 133,311 | |
Feed One Company Ltd. | | | 3,000 | | | | 19,855 | |
Fuji Corporation (Aichi) | | | 2,000 | | | | 45,816 | |
GEO Holdings Corporation | | | 3,400 | | | | 37,695 | |
Happinet Corporation | | | 6,300 | | | | 83,714 | |
IBJ, Inc. | | | 9,000 | | | | 90,867 | |
Jafco Group Company Ltd. | | | 1,100 | | | | 68,594 | |
Japan Post Insurance Company Ltd. | | | 2,800 | | | | 51,813 | |
Kaga Electronics Company Ltd. | | | 4,000 | | | | 107,152 | |
KDDI Corporation | | | 2,500 | | | | 77,896 | |
Kohnan Shoji Company Ltd. | | | 4,100 | | | | 141,451 | |
Komeri Company Ltd. | | | 4,500 | | | | 106,092 | |
Kusuri No Aoki Holdings Company Ltd. | | | 1,500 | | | | 109,097 | |
Mizuho Leasing Company Ltd. | | | 1,800 | | | | 60,642 | |
Nintendo Company Ltd. | | | 200 | | | | 115,745 | |
Nippon Telegraph and Telephone Corporation | | | 2,000 | | | | 52,295 | |
Nissha Company Ltd. | | | 4,500 | | | | 67,746 | |
Nisso Corporation | | | 8,200 | | | | 61,155 | |
Nojima Corporation | | | 4,300 | | | | 106,247 | |
Hussman Strategic International Fund
Schedule of Investments (continued) |
June 30, 2021 |
COMMON STOCKS — 88.4% (continued) | | Shares | | | Value | |
Japan — 26.5% (continued) | | | | | | | | |
Obayashi Corporation | | | 2,000 | | | $ | 15,947 | |
Organo Corporation | | | 1,000 | | | | 56,005 | |
Panasonic Corporation | | | 9,000 | | | | 103,640 | |
Pressance Corporation | | | 7,000 | | | | 94,007 | |
RAIZNEXT Corporation | | | 5,000 | | | | 52,063 | |
Rakuten Group, Inc. | | | 5,000 | | | | 56,461 | |
Rengo Company Ltd. | | | 6,500 | | | | 54,180 | |
RS Technologies Company Ltd. | | | 1,000 | | | | 58,793 | |
Sawai Group Holdings Company Ltd. | | | 3,000 | | | | 133,860 | |
SCSK Corporation | | | 500 | | | | 29,795 | |
Shimamura Company Ltd. | | | 700 | | | | 67,163 | |
Square Enix Holdings Company Ltd. | | | 500 | | | | 24,695 | |
Sugi Holdings Company Ltd. | | | 2,000 | | | | 145,931 | |
SUMCO Corporation | | | 3,000 | | | | 73,495 | |
Sundrug Company Ltd. | | | 4,000 | | | | 127,154 | |
T&D Holdings, Inc. | | | 4,000 | | | | 51,912 | |
Taiko Pharmaceutical Company Ltd. | | | 3,100 | | | | 28,412 | |
Takasago International Corporation | | | 4,000 | | | | 97,361 | |
TechnoPro Holdings, Inc. | | | 3,600 | | | | 85,133 | |
TerraSky Company Ltd. (a) | | | 1,800 | | | | 43,282 | |
Tomoku Company Ltd. | | | 3,000 | | | | 51,219 | |
Towa Pharmaceutical Company Ltd. | | | 4,000 | | | | 97,344 | |
Toyota Motor Corporation | | | 400 | | | | 34,969 | |
transcosmos, inc. | | | 2,000 | | | | 55,270 | |
Wacom Company Ltd. | | | 20,000 | | | | 127,085 | |
World Holdings Company Ltd. | | | 2,500 | | | | 68,306 | |
Z Holdings Corporation | | | 16,000 | | | | 80,079 | |
| | | | | | | | 3,942,786 | |
Jersey — 0.2% | | | | | | | | |
Sanne Group plc | | | 2,000 | | | | 23,017 | |
| | | | | | | | | |
Luxembourg — 0.9% | | | | | | | | |
RTL Group S.A. | | | 1,100 | | | | 65,519 | |
Stabilus S.A. | | | 900 | | | | 73,324 | |
| | | | | | | | 138,843 | |
Netherlands — 1.9% | | | | | | | | |
Euronext N.V. | | | 1,000 | | | | 108,808 | |
Koninklijke Ahold Delhaize N.V. | | | 2,500 | | | | 74,462 | |
Hussman Strategic International Fund
Schedule of Investments (continued) |
June 30, 2021 |
COMMON STOCKS — 88.4% (continued) | | Shares | | | Value | |
Netherlands — 1.9% (continued) | | | | | | | | |
NN Group N.V. | | | 2,000 | | | $ | 94,495 | |
| | | | | | | | 277,765 | |
New Zealand — 0.3% | | | | | | | | |
Kathmandu Holdings Ltd. | | | 40,000 | | | | 45,022 | |
| | | | | | | | | |
Norway — 0.2% | | | | | | | | |
NEL ASA (a) | | | 15,000 | | | | 35,025 | |
| | | | | | | | | |
Russian Federation — 0.3% | | | | | | | | |
Polymetal International plc | | | 2,000 | | | | 43,068 | |
| | | | | | | | | |
Spain — 4.1% | | | | | | | | |
Atresmedia Corporacion de Medios de Comunicacion S.A. | | | 23,000 | | | | 100,707 | |
Ebro Foods S.A. | | | 5,500 | | | | 115,583 | |
Enagas S.A. | | | 2,000 | | | | 46,234 | |
Mediaset Espana Comunicacion S.A. (a) | | | 11,000 | | | | 69,011 | |
Neinor Homes S.A. (a) | | | 8,000 | | | | 108,194 | |
Pharma Mar SA | | | 1,000 | | | | 90,155 | |
Prosegur Cia de Seguridad S.A. | | | 25,000 | | | | 81,834 | |
| | | | | | | | 611,718 | |
Sweden — 5.5% | | | | | | | | |
Clas Ohlson AB - B Shares | | | 10,000 | | | | 103,135 | |
Hennes & Mauritz AB - B Shares (a) | | | 6,000 | | | | 142,503 | |
Hexpol AB | | | 5,000 | | | | 61,814 | |
ICA Gruppen AB | | | 3,000 | | | | 139,628 | |
Karo Pharma AB (a) | | | 10,000 | | | | 64,036 | |
Mekonomen AB (a) | | | 6,500 | | | | 107,400 | |
Nordic Entertainment Group AB - Class B (a) | | | 2,500 | | | | 110,278 | |
Swedish Orphan Biovitrum AB (a) | | | 4,500 | | | | 82,057 | |
| | | | | | | | 810,851 | |
Switzerland — 1.9% | | | | | | | | |
DKSH Holding AG | | | 1,200 | | | | 91,928 | |
Roche Holdings AG | | | 200 | | | | 75,366 | |
Swisscom AG | | | 125 | | | | 71,422 | |
UBS Group AG | | | 3,000 | | | | 45,951 | |
| | | | | | | | 284,667 | |
Hussman Strategic International Fund
Schedule of Investments (continued) |
June 30, 2021 |
COMMON STOCKS — 88.4% (continued) | | Shares | | | Value | |
United Kingdom — 10.2% | | | | | | | | |
Avast plc | | | 5,000 | | | $ | 33,896 | |
Aviva plc | | | 12,000 | | | | 67,366 | |
B & M European Value Retail S.A. | | | 8,500 | | | | 67,478 | |
Centamin plc | | | 30,000 | | | | 42,079 | |
Domino’s Pizza Group plc | | | 20,000 | | | | 107,592 | |
Dunelm Group plc | | | 3,000 | | | | 59,011 | |
FDM Group Holdings plc | | | 5,000 | | | | 70,587 | |
Frasers Group plc (a) | | | 10,000 | | | | 83,380 | |
Fresnillo plc | | | 3,500 | | | | 37,424 | |
GlaxoSmithKline plc | | | 9,100 | | | | 178,893 | |
Halfords Group plc (a) | | | 25,000 | | | | 149,115 | |
Hikma Pharmaceuticals plc | | | 2,000 | | | | 67,682 | |
IG Group Holdings plc | | | 5,000 | | | | 58,590 | |
Just Group plc (a) | | | 50,000 | | | | 64,488 | |
Rio Tinto plc | | | 700 | | | | 57,810 | |
Royal Mail plc (a) | | | 8,000 | | | | 63,965 | |
Softcat plc | | | 5,000 | | | | 122,833 | |
SThree plc | | | 5,000 | | | | 31,956 | |
Ultra Electronics Holdings plc | | | 1,800 | | | | 57,050 | |
Unilever plc | | | 500 | | | | 29,216 | |
WM Morrison Supermarkets plc | | | 20,000 | | | | 68,250 | |
| | | | | | | | 1,518,661 | |
| | | | | | | | | |
Total Common Stocks (Cost $11,596,379) | | | | | | $ | 13,149,368 | |
PREFERRED STOCKS — 0.8% | | | | | | |
Germany — 0.8% | | | | | | | | |
Draegerwerk AG & Company KGaA (Cost $101,141) | | | 1,300 | | | $ | 123,031 | |
EXCHANGE-TRADED PUT OPTION CONTRACTS — 0.7% | | Contracts | | | Notional
Amount | | | Value | |
S&P 500 Index Option, 09/17/2021 at $4,250 (Cost $110,823) | | | 10 | | | $ | 4,297,500 | | | $ | 95,700 | |
| | | | | | | | | | | | | |
Total Investments at Value — 89.9% (Cost $11,808,343) | | | | | | | | | | $ | 13,368,099 | |
Hussman Strategic International Fund
Schedule of Investments (continued) |
June 30, 2021 |
MONEY MARKET FUNDS — 2.4% | | Shares | | | Value | |
Invesco Short-Term Investments Trust - Treasury Portfolio - Institutional Class, 0.01% (b) (Cost $327,338) | | | 327,338 | | | $ | 327,338 | |
| | | | | | | | | |
Total Investments and Money Market Funds at Value — 92.3% (Cost $12,135,681) | | | | | | $ | 13,695,437 | |
| | | | | | | | | |
Other Assets in Excess of Liabilities — 7.7% | | | | | | | 1,174,896 | |
| | | | | | | | | |
Net Assets — 100.0% | | | | | | $ | 14,870,333 | |
(a) | Non-income producing security. |
(b) | The rate shown is the 7-day effective yield as of June 30, 2021. |
See accompanying notes to financial statements. |
Hussman Strategic International Fund
Schedule of Investments (continued) |
June 30, 2021 |
Common and Preferred Stocks by Sector/Industry | % of Net
Assets |
Communications — 11.0% | |
Advertising & Marketing | 1.3% |
Cable & Satellite | 0.7% |
Communication Services | 0.4% |
Entertainment Content | 0.9% |
Internet Media & Services | 1.2% |
Publishing & Broadcasting | 2.5% |
Telecommunications | 4.0% |
Consumer Discretionary — 20.0% | |
Apparel & Textile Products | 0.8% |
Automotive | 3.2% |
Consumer Services | 0.3% |
Home Construction | 1.4% |
Leisure Facilities & Services | 0.7% |
Leisure Products | 0.7% |
Retail - Discretionary | 9.6% |
Wholesale - Discretionary | 3.3% |
Consumer Staples — 10.6% | |
Food | 1.4% |
Household Products | 0.6% |
Retail - Consumer Staples | 8.6% |
Energy — 0.8% | |
Oil & Gas Producers | 0.6% |
Renewable Energy | 0.2% |
Financials — 10.6% | |
Asset Management | 2.6% |
Banking | 0.4% |
Institutional Financial Services | 2.5% |
Insurance | 3.9% |
Specialty Finance | 1.2% |
Health Care — 9.6% | |
Biotech & Pharma | 7.4% |
Health Care Facilities & Services | 1.8% |
Medical Equipment & Devices | 0.4% |
Industrials — 8.9% | |
Aerospace & Defense | 0.4% |
Commercial Support Services | 4.1% |
Electrical Equipment | 0.3% |
Hussman Strategic International Fund
Schedule of Investments (continued) |
June 30, 2021 |
Common and Preferred Stocks by Sector/Industry (continued) | % of Net
Assets |
Industrials — 8.9% (continued) | |
Engineering & Construction | 0.9% |
Industrial Intermediate Products | 0.4% |
Machinery | 1.2% |
Transportation & Logistics | 1.6% |
Materials — 5.7% | |
Chemicals | 1.8% |
Construction Materials | 0.4% |
Containers & Packaging | 1.0% |
Metals & Mining | 2.5% |
Real Estate — 0.4% | |
REITs | 0.4% |
Technology — 9.2% | |
Semiconductors | 1.0% |
Software | 0.9% |
Technology Hardware | 4.0% |
Technology Services | 3.3% |
Utilities — 2.4% | |
Electric Utilities | 2.1% |
Gas & Water Utilities | 0.3% |
| | 89.2% |
See accompanying notes to financial statements. |
Hussman Strategic International Fund
Schedule of Futures Contracts Sold Short |
June 30, 2021 |
FUTURES CONTRACTS SOLD SHORT | | Contracts | | | Expiration
Date | | | Notional
Amount | | | Value/
Unrealized
Appreciation* | |
FUTURES | | | | | | | | | | | | | | | | |
Mini MSCI EAFE Index Future | | | 75 | | | | 09/17/2021 | | | $ | 8,643,450 | | | $ | 204,096 | |
* | Includes cumulative appreciation (depreciation) of futures contracts from the date that contracts were opened through June 30, 2021. Only current day variation margin is reported on the Statements of Assets and Liabilities. |
See accompanying notes to financial statements. |
Hussman Investment Trust
Statements of Assets and Liabilities |
June 30, 2021 |
| | | Hussman
Strategic
Growth Fund | | | Hussman
Strategic
Allocation Fund | |
ASSETS | | | | | | | | |
Investments in securities: | | | | | | | | |
At cost | | $ | 375,248,132 | | | $ | 15,393,923 | |
At value (Note 1) | | $ | 424,245,266 | | | $ | 16,833,220 | |
Investments in money market funds | | | 209,818,056 | | | | 7,117,135 | |
Cash | | | — | | | | 23,544 | |
Receivable for capital shares sold | | | 526,275 | | | | 1,155 | |
Dividends and interest receivable | | | 141,182 | | | | 14,065 | |
Tax reclaims receivable | | | 8,509 | | | | — | |
Other assets | | | 53,531 | | | | 29,844 | |
Total Assets | | | 634,792,819 | | | | 24,018,963 | |
| | | | | | | | | |
LIABILITIES | | | | | | | | |
Written call options, at value (Notes 1 and 4) (premiums received $209,810,955 and $3,781,541) | | | 221,385,090 | | | | 4,096,848 | |
Bank overdraft | | | 18,716 | | | | — | |
Payable for capital shares redeemed | | | 64,106 | | | | — | |
Accrued investment advisory fees (Note 3) | | | 310,028 | | | | 1,249 | |
Payable to administrator (Note 3) | | | 39,100 | | | | 6,360 | |
Other accrued expenses | | | 77,797 | | | | 33,264 | |
Total Liabilities | | | 221,894,837 | | | | 4,137,721 | |
CONTINGENCIES AND COMMITMENTS (NOTES 8 & 9) | | | — | | | | — | |
NET ASSETS | | $ | 412,897,982 | | | $ | 19,881,242 | |
| | | | | | | | | |
Net assets consist of: | | | | | | | | |
Paid-in capital | | $ | 1,274,532,928 | | | $ | 17,852,967 | |
Accumulated earnings (deficit) | | | (861,634,946 | ) | | | 2,028,275 | |
NET ASSETS | | $ | 412,897,982 | | | $ | 19,881,242 | |
| | | | | | | | | |
Shares of beneficial interest outstanding (unlimited number of shares authorized, no par value) | | | 60,975,388 | | | | 1,699,689 | |
| | | | | | | | | |
Net asset value, offering price and redemption price per share (a) (Note 1) | | $ | 6.77 | | | $ | 11.70 | |
(a) | Redemption fee may apply to redemptions of shares held for 60 days or less. |
See accompanying notes to financial statements. |
Hussman Investment Trust
Statements of Assets and Liabilities (continued) |
June 30, 2021 |
| | | Hussman
Strategic Total
Return Fund | | | Hussman
Strategic
International Fund | |
ASSETS | | | | | | | | |
Investments in securities: | | | | | | | | |
At cost | | $ | 272,390,297 | | | $ | 11,808,343 | |
At value (Note 1) | | $ | 284,283,669 | | | $ | 13,368,099 | |
Investments in money market funds | | | 31,821,289 | | | | 327,338 | |
Cash | | | 6,694 | | | | 26,139 | |
Receivable for capital shares sold | | | 45,340 | | | | 72 | |
Variation margin receivable (Notes 1 and 4) | | | — | | | | 65,721 | |
Margin deposits for futures contracts (Note 1) | | | — | | | | 1,262,151 | |
Receivable from Adviser (Note 3) | | | — | | | | 6,091 | |
Dividends and interest receivable | | | 829,956 | | | | 12,838 | |
Tax reclaims receivable | | | — | | | | 40,577 | |
Other assets | | | 82,810 | | | | 29,668 | |
Total Assets | | | 317,069,758 | | | | 15,138,694 | |
| | | | | | | | | |
LIABILITIES | | | | | | | | |
Distributions payable | | | 81,029 | | | | — | |
Payable for capital shares redeemed | | | 239,373 | | | | 71 | |
Payable for investment securities purchased | | | — | | | | 204,590 | |
Accrued investment advisory fees (Note 3) | | | 130,991 | | | | — | |
Payable to administrator (Note 3) | | | 29,600 | | | | 7,060 | |
Other accrued expenses | | | 49,879 | | | | 56,640 | |
Total Liabilities | | | 530,872 | | | | 268,361 | |
CONTINGENCIES AND COMMITMENTS (NOTE 8) | | | — | | | | — | |
NET ASSETS | | $ | 316,538,886 | | | $ | 14,870,333 | |
| | | | | | | | | |
Net assets consist of: | | | | | | | | |
Paid-in capital | | $ | 350,062,031 | | | $ | 29,692,934 | |
Accumulated deficit | | | (33,523,145 | ) | | | (14,822,601 | ) |
NET ASSETS | | $ | 316,538,886 | | | $ | 14,870,333 | |
| | | | | | | | | |
Shares of beneficial interest outstanding (unlimited number of shares authorized, no par value) | | | 21,447,387 | | | | 1,739,114 | |
| | | | | | | | | |
Net asset value, offering price and redemption price per share (a) (Note 1) | | $ | 14.76 | | | $ | 8.55 | |
(a) | Redemption fee may apply to redemptions of shares held for 60 days or less. |
See accompanying notes to financial statements. |
Hussman Investment Trust
Statements of Operations |
For the Year Ended June 30, 2021 |
| | | Hussman
Strategic
Growth Fund | | | Hussman
Strategic
Allocation Fund | |
INVESTMENT INCOME | | | | | | | | |
Dividends | | $ | 4,326,962 | | | $ | 112,867 | |
Foreign withholding taxes on dividends | | | (36,153 | ) | | | (1,102 | ) |
Interest | | | — | | | | 36,493 | |
Total Investment Income | | | 4,290,809 | | | | 148,258 | |
| | | | | | | | | |
EXPENSES | | | | | | | | |
Investment advisory fees (Note 3) | | | 3,113,395 | | | | 96,818 | |
Administration fees (Note 3) | | | 242,680 | | | | 23,000 | |
Transfer agent, account maintenance and shareholder services fees (Note 3) | | | 247,312 | | | | 17,960 | |
Trustees’ fees (Note 3) | | | 72,375 | | | | 72,375 | |
Legal fees | | | 67,394 | | | | 40,762 | |
Fund accounting fees (Note 3) | | | 64,726 | | | | 30,013 | |
Custodian fees | | | 72,320 | | | | 19,018 | |
Registration and filing fees | | | 53,170 | | | | 24,322 | |
Insurance expense | | | 63,058 | | | | 1,863 | |
Postage and supplies | | | 32,334 | | | | 6,206 | |
Audit and tax services fees | | | 19,000 | | | | 19,500 | |
Compliance service fees (Note 3) | | | 30,279 | | | | 5,453 | |
Printing of shareholder reports | | | 18,444 | | | | 3,316 | |
Pricing fees | | | 3,160 | | | | 2,591 | |
Other expenses | | | 12,798 | | | | 8,402 | |
Total Expenses | | | 4,112,445 | | | | 371,599 | |
Less fee waivers and Fund expenses absorbed by the Adviser (Note 3) | | | (126,004 | ) | | | (209,679 | ) |
Net Expenses | | | 3,986,441 | | | | 161,920 | |
| | | | | | | | | |
NET INVESTMENT INCOME (LOSS) | | | 304,368 | | | | (13,662 | ) |
| | | | | | | | | |
REALIZED AND UNREALIZED GAINS (LOSSES) ON INVESTMENTS AND WRITTEN OPTION CONTRACTS | | | | | | | | |
Net realized gains (losses) from: | | | | | | | | |
Investments | | | 117,642,861 | | | | 3,476,564 | |
Written option contracts (Note 4) | | | (156,098,054 | ) | | | (2,721,432 | ) |
Net change in unrealized appreciation (depreciation) on: | | | | | | | | |
Investments | | | 52,375,934 | | | | 1,423,231 | |
Written option contracts (Note 4) | | | 20,470,053 | | | | 129,180 | |
| | | | | | | | | |
NET REALIZED AND UNREALIZED GAINS ON INVESTMENTS AND WRITTEN OPTION CONTRACTS | | | 34,390,794 | | | | 2,307,543 | |
| | | | | | | | | |
NET INCREASE IN NET ASSETS RESULTING FROM OPERATIONS | | $ | 34,695,162 | | | $ | 2,293,881 | |
See accompanying notes to financial statements. |
Hussman Investment Trust
Statements of Operations (continued) |
For the Year Ended June 30, 2021 |
| | | Hussman
Strategic Total
Return Fund | | | Hussman
Strategic
International Fund | |
INVESTMENT INCOME | | | | | | | | |
Dividend income | | $ | 1,336,879 | | | $ | 327,553 | |
Foreign withholding taxes on dividends | | | (43,379 | ) | | | (42,702 | ) |
Interest | | | 3,987,110 | | | | — | |
Total Investment Income | | | 5,280,610 | | | | 284,851 | |
| | | | | | | | | |
EXPENSES | | | | | | | | |
Investment advisory fees (Note 3) | | | 1,576,934 | | | | 140,932 | |
Administration fees (Note 3) | | | 221,081 | | | | 24,000 | |
Transfer agent, account maintenance and shareholder services fees (Note 3) | | | 151,365 | | | | 35,597 | |
Trustees’ fees (Note 3) | | | 72,375 | | | | 72,375 | |
Fund accounting fees (Note 3) | | | 61,611 | | | | 37,487 | |
Legal fees | | | 41,277 | | | | 50,796 | |
Custodian fees | | | 27,702 | | | | 48,097 | |
Registration and filing fees | | | 42,720 | | | | 33,056 | |
Insurance expense | | | 60,559 | | | | 3,396 | |
Postage and supplies | | | 21,871 | | | | 19,012 | |
Audit and tax services fees | | | 19,000 | | | | 17,300 | |
Compliance service fees (Note 3) | | | 28,670 | | | | 5,528 | |
Pricing fees | | | 5,123 | | | | 25,529 | |
Printing of shareholder reports | | | 12,608 | | | | 3,714 | |
Other expenses | | | 13,416 | | | | 8,453 | |
Total Expenses | | | 2,356,312 | | | | 525,272 | |
Less fee waivers and Fund expenses absorbed by the Adviser (Note 3) | | | — | | | | (228,170 | ) |
Net Expenses | | | 2,356,312 | | | | 297,102 | |
| | | | | | | | | |
NET INVESTMENT INCOME (LOSS) | | | 2,924,298 | | | | (12,251 | ) |
| | | | | | | | | |
REALIZED AND UNREALIZED GAINS (LOSSES) ON INVESTMENTS, FUTURES CONTRACTS AND FOREIGN CURRENCIES | | | | | | | | |
Net realized gains (losses) from: | | | | | | | | |
Investments | | | 10,710,580 | | | | 2,299,590 | |
Futures contracts (Note 4) | | | — | | | | (2,588,080 | ) |
Foreign currency transactions | | | — | | | | 1,805 | |
Net change in unrealized appreciation (depreciation) on: | | | | | | | | |
Investments | | | (5,771,682 | ) | | | 516,468 | |
Futures contracts (Note 4) | | | — | | | | 271,031 | |
Foreign currency translation | | | — | | | | 1,867 | |
| | | | | | | | | |
NET REALIZED AND UNREALIZED GAINS ON INVESTMENTS, FUTURES CONTRACTS AND FOREIGN CURRENCIES | | | 4,938,898 | | | | 502,681 | |
| | | | | | | | | |
NET INCREASE IN NET ASSETS RESULTING FROM OPERATIONS | | $ | 7,863,196 | | | $ | 490,430 | |
See accompanying notes to financial statements. |
Hussman Strategic Growth Fund
Statements of Changes in Net Assets |
|
| | | Year Ended
June 30,
2021 | | | Year Ended
June 30,
2020 | |
FROM OPERATIONS | | | | | | | | |
Net investment income | | $ | 304,368 | | | $ | 2,420,909 | |
Net realized gains (losses) from: | | | | | | | | |
Investments | | | 117,642,861 | | | | 56,420,650 | |
Written option contracts | | | (156,098,054 | ) | | | (21,469,390 | ) |
Net change in unrealized appreciation (depreciation) on: | | | | | | | | |
Investments | | | 52,375,934 | | | | (2,099,222 | ) |
Written option contracts | | | 20,470,053 | | | | (19,902,704 | ) |
Net increase in net assets resulting from operations | | | 34,695,162 | | | | 15,370,243 | |
| | | | | | | | | |
DISTRIBUTIONS TO SHAREHOLDERS (Note 1) | | | (509,834 | ) | | | (4,497,796 | ) |
| | | | | | | | | |
FROM CAPITAL SHARE TRANSACTIONS | | | | | | | | |
Proceeds from shares sold | | | 136,243,478 | | | | 96,065,262 | |
Net asset value of shares issued in reinvestment of distributions to shareholders | | | 468,051 | | | | 4,209,892 | |
Proceeds from redemption fees collected (Note 1) | | | 70,280 | | | | 76,103 | |
Payments for shares redeemed | | | (66,843,256 | ) | | | (96,355,492 | ) |
Net increase in net assets from capital share transactions | | | 69,938,553 | | | | 3,995,765 | |
| | | | | | | | | |
TOTAL INCREASE IN NET ASSETS | | | 104,123,881 | | | | 14,868,212 | |
| | | | | | | | | |
NET ASSETS | | | | | | | | |
Beginning of year | | | 308,774,101 | | | | 293,905,889 | |
End of year | | $ | 412,897,982 | | | $ | 308,774,101 | |
| | | | | | | | | |
CAPITAL SHARE ACTIVITY | | | | | | | | |
Shares sold | | | 20,962,383 | | | | 16,263,829 | |
Shares reinvested | | | 76,230 | | | | 783,965 | |
Shares redeemed | | | (10,551,320 | ) | | | (16,627,560 | ) |
Net increase in shares outstanding | | | 10,487,293 | | | | 420,234 | |
Shares outstanding at beginning of year | | | 50,488,095 | | | | 50,067,861 | |
Shares outstanding at end of year | | | 60,975,388 | | | | 50,488,095 | |
See accompanying notes to financial statements. |
Hussman Strategic Allocation Fund
Statements of Changes in Net Assets |
|
| | | Year Ended
June 30,
2021 | | | Period Ended
June 30,
2020 (a) | |
FROM OPERATIONS | | | | | | | | |
Net investment income (loss) | | $ | (13,662 | ) | | $ | 20,537 | |
Net realized gains (losses) from: | | | | | | | | |
Investments | | | 3,476,564 | | | | 765,618 | |
Written option contracts | | | (2,721,432 | ) | | | (111,168 | ) |
Net change in unrealized appreciation (depreciation) on: | | | | | | | | |
Investments | | | 1,423,231 | | | | 16,066 | |
Written option contracts | | | 129,180 | | | | (444,487 | ) |
Net increase in net assets resulting from operations | | | 2,293,881 | | | | 246,566 | |
| | | | | | | | | |
DISTRIBUTIONS TO SHAREHOLDERS (Note 1) | | | (510,051 | ) | | | (2,121 | ) |
| | | | | | | | | |
FROM CAPITAL SHARE TRANSACTIONS | | | | | | | | |
Proceeds from shares sold | | | 10,618,759 | | | | 7,864,751 | |
Net asset value of shares issued in reinvestment of distributions to shareholders | | | 479,658 | | | | 2,120 | |
Proceeds from redemption fees collected (Note 1) | | | 760 | | | | 232 | |
Payments for shares redeemed | | | (1,094,824 | ) | | | (18,489 | ) |
Net increase in net assets from capital share transactions | | | 10,004,353 | | | | 7,848,614 | |
| | | | | | | | | |
TOTAL INCREASE IN NET ASSETS | | | 11,788,183 | | | | 8,093,059 | |
| | | | | | | | | |
NET ASSETS | | | | | | | | |
Beginning of period | | | 8,093,059 | | | | — | |
End of period | | $ | 19,881,242 | | | $ | 8,093,059 | |
| | | | | | | | | |
CAPITAL SHARE ACTIVITY | | | | | | | | |
Shares sold | | | 966,742 | | | | 785,509 | |
Shares reinvested | | | 46,068 | | | | 214 | |
Shares redeemed | | | (96,956 | ) | | | (1,888 | ) |
Net increase in shares outstanding | | | 915,854 | | | | 783,835 | |
Shares outstanding at beginning of period | | | 783,835 | | | | — | |
Shares outstanding at end of period | | | 1,699,689 | | | | 783,835 | |
(a) | Represents the period from the commencement of operations (August 27, 2019) through June 30, 2020. |
See accompanying notes to financial statements. |
Hussman Strategic Total Return Fund
Statements of Changes in Net Assets |
|
| | | Year Ended
June 30,
2021 | | | Year Ended
June 30,
2020 | |
FROM OPERATIONS | | | | | | | | |
Net investment income | | $ | 2,924,298 | | | $ | 2,025,508 | |
Net realized gains (losses) from: | | | | | | | | |
Investments | | | 10,710,580 | | | | 22,766,794 | |
Foreign currency transactions | | | — | | | | (2,867 | ) |
Net change in unrealized appreciation (depreciation) on investments | | | (5,771,682 | ) | | | 5,904,223 | |
Net increase in net assets resulting from operations | | | 7,863,196 | | | | 30,693,658 | |
| | | | | | | | | |
DISTRIBUTIONS TO SHAREHOLDERS (Note 1) | | | (2,788,362 | ) | | | (1,974,954 | ) |
| | | | | | | | | |
FROM CAPITAL SHARE TRANSACTIONS | | | | | | | | |
Proceeds from shares sold | | | 96,123,075 | | | | 93,237,623 | |
Net asset value of shares issued in reinvestment of distributions to shareholders | | | 2,595,158 | | | | 1,856,942 | |
Proceeds from redemption fees collected (Note 1) | | | 40,060 | | | | 78,782 | |
Payments for shares redeemed | | | (77,423,428 | ) | | | (54,998,030 | ) |
Net increase in net assets from capital share transactions | | | 21,334,865 | | | | 40,175,317 | |
| | | | | | | | | |
TOTAL INCREASE IN NET ASSETS | | | 26,409,699 | | | | 68,894,021 | |
| | | | | | | | | |
NET ASSETS | | | | | | | | |
Beginning of year | | | 290,129,187 | | | | 221,235,166 | |
End of year | | $ | 316,538,886 | | | $ | 290,129,187 | |
| | | | | | | | | |
CAPITAL SHARE ACTIVITY | | | | | | | | |
Shares sold | | | 6,542,852 | | | | 6,769,222 | |
Shares reinvested | | | 177,553 | | | | 139,474 | |
Shares redeemed | | | (5,286,536 | ) | | | (4,140,034 | ) |
Net increase in shares outstanding | | | 1,433,869 | | | | 2,768,662 | |
Shares outstanding at beginning of year | | | 20,013,518 | | | | 17,244,856 | |
Shares outstanding at end of year | | | 21,447,387 | | | | 20,013,518 | |
See accompanying notes to financial statements. |
Hussman Strategic International Fund
Statements of Changes in Net Assets |
|
| | | Year Ended
June 30,
2021 | | | Year Ended
June 30,
2020 | |
FROM OPERATIONS | | | | | | | | |
Net investment income (loss) | | $ | (12,251 | ) | | $ | 10,781 | |
Net realized gains (losses) from: | | | | | | | | |
Investments | | | 2,299,590 | | | | (1,396,802 | ) |
Futures contracts | | | (2,588,080 | ) | | | 967,625 | |
Foreign currency transactions | | | 1,805 | | | | 29,634 | |
Net change in unrealized appreciation (depreciation) on: | | | | | | | | |
Investments | | | 516,468 | | | | 381,644 | |
Futures contracts | | | 271,031 | | | | 245,115 | |
Foreign currency translation | | | 1,867 | | | | (778 | ) |
Net increase in net assets resulting from operations | | | 490,430 | | | | 237,219 | |
| | | | | | | | | |
DISTRIBUTIONS TO SHAREHOLDERS (Note 1) | | | (193,735 | ) | | | (119,506 | ) |
| | | | | | | | | |
FROM CAPITAL SHARE TRANSACTIONS | | | | | | | | |
Proceeds from shares sold | | | 766,652 | | | | 388,907 | |
Net asset value of shares issued in reinvestment of distributions to shareholders | | | 190,507 | | | | 116,458 | |
Proceeds from redemption fees collected (Note 1) | | | 96 | | | | 333 | |
Payments for shares redeemed | | | (1,378,182 | ) | | | (7,562,951 | ) |
Net decrease in net assets from capital share transactions | | | (420,927 | ) | | | (7,057,253 | ) |
| | | | | | | | | |
TOTAL DECREASE IN NET ASSETS | | | (124,232 | ) | | | (6,939,540 | ) |
| | | | | | | | | |
NET ASSETS | | | | | | | | |
Beginning of year | | | 14,994,565 | | | | 21,934,105 | |
End of year | | $ | 14,870,333 | | | $ | 14,994,565 | |
| | | | | | | | | |
CAPITAL SHARE ACTIVITY | | | | | | | | |
Shares sold | | | 89,670 | | | | 46,702 | |
Shares reinvested | | | 22,152 | | | | 13,464 | |
Shares redeemed | | | (162,147 | ) | | | (898,341 | ) |
Net decrease in shares outstanding | | | (50,325 | ) | | | (838,175 | ) |
Shares outstanding at beginning of year | | | 1,789,439 | | | | 2,627,614 | |
Shares outstanding at end of year | | | 1,739,114 | | | | 1,789,439 | |
See accompanying notes to financial statements. |
Hussman Strategic Growth Fund
Financial Highlights |
Selected Per Share Data and Ratios for a Share Outstanding Throughout Each Year |
| | Year
Ended
June 30,
2021 | | | Year
Ended
June 30,
2020 | | | Year
Ended
June 30,
2019 | | | Year
Ended
June 30,
2018 | | | Year
Ended
June 30,
2017 | |
Net asset value at beginning of year | | $ | 6.12 | | | $ | 5.87 | | | $ | 6.46 | | | $ | 6.68 | | | $ | 7.93 | |
| | | | | | | | | | | | | | | | | | | | | |
Income (loss) from investment operations: | | | | | | | | | | | | | | | | | | | | |
Net investment income | | | 0.01 | | | | 0.06 | | | | 0.10 | | | | 0.06 | | | | 0.02 | |
Net realized and unrealized gains (losses) on investments and written option contracts | | | 0.65 | | | | 0.29 | | | | (0.61 | ) | | | (0.25 | ) | | | (1.25 | ) |
Total from investment operations | | | 0.66 | | | | 0.35 | | | | (0.51 | ) | | | (0.19 | ) | | | (1.23 | ) |
| | | | | | | | | | | | | | | | | | | | | |
Less distributions from: | | | | | | | | | | | | | | | | | | | | |
Net investment income | | | (0.01 | ) | | | (0.10 | ) | | | (0.08 | ) | | | (0.03 | ) | | | (0.02 | ) |
| | | | | | | | | | | | | | | | | | | | | |
Proceeds from redemption fees collected (Note 1) | | | 0.00 | (a) | | | 0.00 | (a) | | | 0.00 | (a) | | | 0.00 | (a) | | | 0.00 | (a) |
| | | | | | | | | | | | | | | | | | | | | |
Net asset value at end of year | | $ | 6.77 | | | $ | 6.12 | | | $ | 5.87 | | | $ | 6.46 | | | $ | 6.68 | |
| | | | | | | | | | | | | | | | | | | | | |
Total return (b) | | | 10.80 | % | | | 6.17 | % | | | (8.05 | %) | | | (2.81 | %) | | | (15.53 | %) |
| | | | | | | | | | | | | | | | | | | | | |
Net assets at end of year (000’s) | | $ | 412,898 | | | $ | 308,774 | | | $ | 293,906 | | | $ | 324,003 | | | $ | 375,467 | |
| | | | | | | | | | | | | | | | | | | | | |
Ratio of total expenses to average net assets | | | 1.19 | % | | | 1.26 | % | | | 1.24 | % | | | 1.23 | % | | | 1.19 | % |
| | | | | | | | | | | | | | | | | | | | | |
Ratio of net expenses to average net assets (c) | | | 1.15 | % | | | 1.15 | % | | | 1.14 | % | | | 1.13 | % | | | 1.12 | % |
| | | | | | | | | | | | | | | | | | | | | |
Ratio of net investment income to average net assets (c) | | | 0.09 | % | | | 0.87 | % | | | 1.66 | % | | | 0.82 | % | | | 0.19 | % |
| | | | | | | | | | | | | | | | | | | | | |
Portfolio turnover rate | | | 198 | % | | | 167 | % | | | 124 | % | | | 142 | % | | | 209 | % |
(a) | Amount rounds to less than $0.01 per share. |
(b) | Total return is a measure of the change in value of an investment in the Fund over the period covered, which assumes any dividends or capital gains distributions are reinvested in shares of the Fund. Returns do not reflect the deduction of taxes a shareholder would pay on Fund distributions or the redemption of Fund shares. |
(c) | Ratio was determined after advisory fee waivers (Note 3). |
See accompanying notes to financial statements. |
Hussman Strategic Allocation Fund
Financial Highlights |
Selected Per Share Data and Ratios for a Share Outstanding Throughout Each Period |
| | | Year
Ended
June 30,
2021 | | | Period Ended
June 30,
2020 (a) | |
Net asset value at beginning of period | | $ | 10.32 | | | $ | 10.00 | |
| | | | | | | | | |
Income (loss) from investment operations: | | | | | | | | |
Net investment income (loss) | | | (0.02 | ) | | | 0.03 | |
Net realized and unrealized gains on investments and written option contracts | | | 1.98 | | | | 0.29 | |
Total from investment operations | | | 1.96 | | | | 0.32 | |
| | | | | | | | | |
Less distributions from: | | | | | | | | |
Net investment income | | | (0.01 | ) | | | (0.00 | )(b) |
Net realized gains | | | (0.57 | ) | | | — | |
Total distributions | | | (0.58 | ) | | | (0.00 | )(b) |
| | | | | | | | | |
Proceeds from redemption fees collected (Note 1) | | | 0.00 | (b) | | | 0.00 | (b) |
| | | | | | | | | |
Net asset value at end of period | | $ | 11.70 | | | $ | 10.32 | |
| | | | | | | | | |
Total return (c) | | | 19.70 | % | | | 3.23 | %(d) |
| | | | | | | | | |
Net assets at end of period (000’s) | | $ | 19,881 | | | $ | 8,093 | |
| | | | | | | | | |
Ratio of total expenses to average net assets | | | 2.87 | % | | | 4.67 | %(e) |
| | | | | | | | | |
Ratio of net expenses to average net assets (f) | | | 1.25 | % | | | 1.25 | %(e) |
| | | | | | | | | |
Ratio of net investment income (loss) to average net assets (f) | | | (0.11 | %) | | | 0.34 | %(e) |
| | | | | | | | | |
Portfolio turnover rate | | | 163 | % | | | 94 | %(d) |
(a) | Represents the period from the commencement of operations (August 27, 2019) through June 30, 2020. |
(b) | Amount rounds to less than $0.01 per share. |
(c) | Total return is a measure of the change in value of an investment in the Fund over the period covered, which assumes any dividends or capital gains distributions are reinvested in shares of the Fund. Returns do not reflect the deduction of taxes a shareholder would pay on Fund distributions or the redemption of Fund shares. |
(d) | Not annualized. |
(e) | Annualized. |
(f) | Ratio was determined after advisory fee waivers and absorption of Fund expenses by the Adviser (Note 3). |
See accompanying notes to financial statements. |
Hussman Strategic Total Return Fund
Financial Highlights |
Selected Per Share Data and Ratios for a Share Outstanding Throughout Each Year |
| | | Year
Ended
June 30,
2021 | | | Year
Ended
June 30,
2020 | | | Year
Ended
June 30,
2019 | | | Year
Ended
June 30,
2018 | | | Year
Ended
June 30,
2017 | |
Net asset value at beginning of year | | $ | 14.50 | | | $ | 12.83 | | | $ | 11.86 | | | $ | 11.98 | | | $ | 12.44 | |
| | | | | | | | | | | | | | | | | | | | | |
Income (loss) from investment operations: | | | | | | | | | | | | | | | | | | | | |
Net investment income | | | 0.14 | | | | 0.13 | | | | 0.19 | | | | 0.10 | | | | 0.02 | |
Net realized and unrealized gains (losses) on investments and foreign currency contracts | | | 0.25 | | | | 1.66 | | | | 0.95 | | | | (0.12 | ) | | | (0.46 | ) |
Total from investment operations | | | 0.39 | | | | 1.79 | | | | 1.14 | | | | (0.02 | ) | | | (0.44 | ) |
| | | | | | | | | | | | | | | | | | | | | |
Less distributions from: | | | | | | | | | | | | | | | | | | | | |
Net investment income | | | (0.13 | ) | | | (0.12 | ) | | | (0.17 | ) | | | (0.10 | ) | | | (0.02 | ) |
| | | | | | | | | | | | | | | | | | | | | |
Proceeds from redemption fees collected (Note 1) | | | 0.00 | (a) | | | 0.00 | (a) | | | 0.00 | (a) | | | 0.00 | (a) | | | 0.00 | (a) |
| | | | | | | | | | | | | | | | | | | | | |
Net asset value at end of year | | $ | 14.76 | | | $ | 14.50 | | | $ | 12.83 | | | $ | 11.86 | | | $ | 11.98 | |
| | | | | | | | | | | | | | | | | | | | | |
Total return (b) | | | 2.70 | % | | | 14.00 | % | | | 9.72 | % | | | (0.18 | %) | | | (3.50 | %) |
| | | | | | | | | | | | | | | | | | | | | |
Net assets at end of year (000’s) | | $ | 316,539 | | | $ | 290,129 | | | $ | 221,235 | | | $ | 274,602 | | | $ | 372,502 | |
| | | | | | | | | | | | | | | | | | | | | |
Ratio of total expenses to average net assets | | | 0.75 | % | | | 0.81 | % | | | 0.81 | % | | | 0.77 | % | | | 0.75 | % |
| | | | | | | | | | | | | | | | | | | | | |
Ratio of net expenses to average net assets | | | 0.75 | % | | | 0.75 | %(c) | | | 0.74 | %(c) | | | 0.73 | %(c) | | | 0.72 | %(c) |
| | | | | | | | | | | | | | | | | | | | | |
Ratio of net investment income to average net assets | | | 0.93 | % | | | 0.87 | %(c) | | | 1.36 | %(c) | | | 0.76 | %(c) | | | 0.12 | %(c) |
| | | | | | | | | | | | | | | | | | | | | |
Portfolio turnover rate | | | 38 | % | | | 88 | % | | | 61 | % | | | 63 | % | | | 341 | % |
(a) | Amount rounds to less than $0.01 per share. |
(b) | Total return is a measure of the change in value of an investment in the Fund over the period covered, which assumes any dividends or capital gains distributions are reinvested in shares of the Fund. Returns do not reflect the deduction of taxes a shareholder would pay on Fund distributions or the redemption of Fund shares. |
(c) | Ratio was determined after advisory fee waivers (Note 3). |
See accompanying notes to financial statements. |
Hussman Strategic International Fund
Financial Highlights |
Selected Per Share Data and Ratios for a Share Outstanding Throughout Each Year |
| | | Year
Ended
June 30,
2021 | | | Year
Ended
June 30,
2020 | | | Year
Ended
June 30,
2019 | | | Year
Ended
June 30,
2018 | | | Year
Ended
June 30,
2017 | |
Net asset value at beginning of year | | $ | 8.38 | | | $ | 8.35 | | | $ | 8.87 | | | $ | 8.80 | | | $ | 9.19 | |
| | | | | | | | | | | | | | | | | | | | | |
Income (loss) from investment operations: | | | | | | | | | | | | | | | | | | | | |
Net investment income (loss) | | | (0.00 | )(a) | | | 0.04 | | | | 0.06 | | | | 0.02 | | | | 0.01 | |
Net realized and unrealized gains (losses) on investments, futures contracts and foreign currencies | | | 0.28 | | | | 0.05 | | | | (0.57 | ) | | | 0.10 | | | | (0.40 | ) |
Total from investment operations | | | 0.28 | | | | 0.09 | | | | (0.51 | ) | | | 0.12 | | | | (0.39 | ) |
| | | | | | | | | | | | | | | | | | | | | |
Less distributions from: | | | | | | | | | | | | | | | | | | | | |
Net investment income | | | (0.11 | ) | | | (0.06 | ) | | | (0.01 | ) | | | (0.05 | ) | | | — | |
| | | | | | | | | | | | | | | | | | | | | |
Proceeds from redemption fees collected (Note 1) | | | 0.00 | (a) | | | 0.00 | (a) | | | 0.00 | (a) | | | 0.00 | (a) | | | 0.00 | (a) |
| | | | | | | | | | | | | | | | | | | | | |
Net asset value at end of year | | $ | 8.55 | | | $ | 8.38 | | | $ | 8.35 | | | $ | 8.87 | | | $ | 8.80 | |
| | | | | | | | | | | | | | | | | | | | | |
Total return (b) | | | 3.38 | % | | | 1.08 | % | | | (5.79 | %) | | | 1.34 | % | | | (4.24 | %) |
| | | | | | | | | | | | | | | | | | | | | |
Net assets at end of year (000’s) | | $ | 14,870 | | | $ | 14,995 | | | $ | 21,934 | | | $ | 26,973 | | | $ | 30,494 | |
| | | | | | | | | | | | | | | | | | | | | |
Ratio of total expenses to average net assets | | | 3.54 | % | | | 3.43 | % | | | 2.72 | % | | | 2.42 | % | | | 2.26 | % |
| | | | | | | | | | | | | | | | | | | | | |
Ratio of net expenses to average net assets (c) | | | 2.00 | % | | | 2.00 | % | | | 2.00 | % | | | 2.00 | % | | | 2.00 | % |
| | | | | | | | | | | | | | | | | | | | | |
Ratio of net investment income (loss) to average net assets (c) | | | (0.08 | %) | | | 0.06 | % | | | 0.61 | % | | | 0.18 | % | | | 0.25 | % |
| | | | | | | | | | | | | | | | | | | | | |
Portfolio turnover rate | | | 88 | % | | | 115 | % | | | 58 | % | | | 61 | % | | | 102 | % |
(a) | Amount rounds to less than $0.01 per share. |
(b) | Total return is a measure of the change in value of an investment in the Fund over the period covered, which assumes any dividends or capital gains distributions are reinvested in shares of the Fund. Returns do not reflect the deduction of taxes a shareholder would pay on Fund distributions or the redemption of Fund shares. |
(c) | Ratio was determined after advisory fee waivers and absorption of Fund expenses by the Adviser (Note 3). |
See accompanying notes to financial statements. |
Hussman Investment Trust
Notes to Financial Statements |
June 30, 2021 |
1. ORGANIZATION AND SIGNIFICANT ACCOUNTING POLICIES
Hussman Strategic Growth Fund, Hussman Strategic Allocation Fund, Hussman Strategic Total Return Fund and Hussman Strategic International Fund (each, a “Fund,” and collectively, the “Funds”) are diversified, separate series of Hussman Investment Trust (the “Trust”), which is registered under the Investment Company Act of 1940, as amended (the “1940 Act”), as an open-end management investment company. Each Fund is authorized to issue an unlimited number of shares.
Hussman Strategic Growth Fund’s investment objective is to provide long-term capital appreciation, with added emphasis on protection of capital during unfavorable market conditions.
Hussman Strategic Allocation Fund’s investment objective is to provide total return through a combination of income and capital appreciation.
Hussman Strategic Total Return Fund’s investment objective is to provide long-term total return from income and capital appreciation.
Hussman Strategic International Fund’s investment objective is to provide long-term capital appreciation, with added emphasis on the protection of capital during unfavorable market conditions. The Fund invests primarily in equity securities of non-U.S. issuers.
The following is a summary of significant accounting policies followed by the Funds. The policies are in conformity with accounting principles generally accepted in the United States of America (“GAAP”). Each Fund follows accounting and reporting guidance under Financial Accounting Standards Board Accounting Standards Codification Topic 946 “Financial Services – Investment Companies.”
Securities, Options and Futures Valuation — The Funds’ portfolio securities are valued at market value as of the close of regular trading on the New York Stock Exchange (“NYSE”) (normally, 4:00 p.m. Eastern time) on each business day the NYSE is open. Securities listed on the NYSE or other exchanges, other than options, are valued on the basis of their last sale prices on the exchanges on which they are primarily traded. However, if the last sale price on the NYSE is different than the last sale price on any other exchange, the NYSE price will be used. If there are no sales on that day, the securities are valued at the last bid price on the NYSE or other primary exchange for that day. Securities quoted by NASDAQ are valued at the NASDAQ Official Closing Price. If there are no sales on that day, the securities are valued at the last bid price as reported by NASDAQ. Securities traded in over-the-counter markets, other than NASDAQ quoted securities, are valued at the last sales price, or if there
Hussman Investment Trust
Notes to Financial Statements (continued) |
June 30, 2021 |
are no sales on that day, at the mean of the closing bid and ask prices. Securities traded on a foreign stock exchange are valued at their closing prices on the principal exchange where they are traded; however, on days when the value of securities traded on foreign stock exchanges may be materially affected by events occurring before a Fund’s pricing time, but after the close of the primary markets or exchanges on which such securities are traded, such securities typically will be valued at their fair value as determined by an independent pricing service approved by the Board of Trustees where such value is believed to reflect the market values of such securities as of the time of computation of a Fund’s net asset value (“NAV”). As a result, the prices of foreign securities used to calculate a Fund’s NAV may differ from quoted or published prices for these securities. Values of foreign securities denominated in or expected to settle in a foreign currency are translated from the local currency into U.S. dollars using prevailing currency exchange rates as of the close of the NYSE, as supplied by an independent pricing service.
Pursuant to procedures approved by the Board of Trustees, options traded on a national securities exchange are valued at prices between the closing bid and ask prices determined by Hussman Strategic Advisors, Inc. (the “Adviser”) to most closely reflect market value as of the time of computation of NAV. As of June 30, 2021, all options held by Hussman Strategic Growth Fund, Hussman Strategic Allocation Fund and Hussman Strategic International Fund have been valued in this manner. Options not traded on a national securities exchange or board of trade, but for which over-the-counter market quotations are readily available, are valued at the mean between their closing bid and ask prices. Futures contracts and options thereon, which are traded on commodities exchanges, are valued at their last sale prices as of the close of regular trading on the NYSE or, if not available, at the mean between their bid and ask prices.
Fixed income securities traded over-the-counter and not traded or dealt in upon any securities exchange, but for which market quotations are readily available, generally are valued at the mean of their closing bid and ask prices. Fixed income securities may also be valued on the basis of prices provided by an independent pricing service. Debt securities with remaining maturities of 60 days or less may be valued at amortized cost if the Adviser, under the supervision of the Board of Trustees, determines that the amortized cost value of the security represents fair value.
Investments in shares of other open-end investment companies, other than shares of exchange-traded funds, are valued at their NAVs per share as reported by such companies.
Hussman Investment Trust
Notes to Financial Statements (continued) |
June 30, 2021 |
In the event that market quotations are not readily available or are determined by the Adviser to not be reflective of fair market value due to market events or developments, securities and other financial instruments will be valued at fair value as determined by the Adviser in accordance with procedures adopted by the Board of Trustees. Methods used to determine fair value may include, but are not limited to: multiple of earnings, multiple of book value, discount from market of a similar freely traded security, purchase price of the security, subsequent private transactions in the security or related securities, or a combination of these and other factors.
GAAP establishes a single authoritative definition of fair value, sets out a framework for measuring fair value and requires additional disclosures about fair value measurements.
Various inputs are used in determining the values of the Funds’ investments. These inputs are summarized in the three broad levels listed below:
| | ● | Level 1 – quoted unadjusted prices for identical instruments in active markets to which the Fund has access at the date of measurement. |
| | ● | Level 2 – quoted prices for similar instruments in active markets; quoted prices for identical or similar instruments in markets that are not active; and model-derived valuations in which all significant inputs and significant value drivers are observable in active markets. Level 2 inputs are those in markets for which there are few transactions, the prices are not current, little public information exists or instances where prices vary substantially over time or among market makers. |
| | ● | Level 3 – model-derived valuations in which one or more significant inputs or significant value drivers are unobservable. Unobservable inputs are those inputs that reflect the Fund’s own assumptions that market participants would use to price the asset or liability based on the best available information. |
Option contracts purchased or written by Hussman Strategic Growth Fund, Hussman Strategic Allocation Fund and Hussman Strategic International Fund are classified as Level 2 since they are valued using “other significant observable inputs” at prices between the closing bid and ask prices determined by the Adviser to most closely reflect fair value. U.S. Treasury obligations held by Hussman Strategic Allocation Fund and Hussman Strategic Total Return Fund are classified as Level 2 since values are based on prices provided by an independent pricing service that utilizes various “other significant observable inputs,” including bid and ask quotations, prices of similar securities and interest rates, among other factors. Non-U.S. equity securities actively traded in foreign markets held by Hussman Strategic International
Hussman Investment Trust
Notes to Financial Statements (continued) |
June 30, 2021 |
Fund may be classified as Level 2 despite the availability of closing prices because such securities are typically valued at their fair value as determined by an independent pricing service, as described below.
The Trust uses an independent pricing service to determine the fair value of portfolio securities traded on a foreign securities exchange when the value of such securities may be materially affected by events occurring before a Fund’s pricing time, but after the close of the primary markets or exchanges on which such securities are traded. These intervening events might be: country-specific (e.g., natural disaster, economic or political developments, interest rate change); issuer specific (e.g., earnings report, merger announcement); or U.S. markets-specific (such as a significant movement in the U.S. markets that is deemed likely to affect the value of foreign securities). The pricing service uses an automated system incorporating a model based on multiple parameters, including a security’s local closing price, relevant general and sector indices, currency fluctuations, trading in depositary receipts and futures, if applicable, and/or research valuations by its staff, in determining what it believes is the fair value of the securities. The frequency of use of this procedure depends on market and other events and thus cannot be predicted. However, the procedure may be utilized to a significant extent by Hussman Strategic International Fund.
Determining the fair value of portfolio securities involves reliance on judgment, and a security’s fair value may differ depending on the method used for determining value. With respect to a portfolio security that has been valued at fair value, there can be no assurance that a Fund could purchase or sell that security at a price equal to the fair value of such security used in calculating the Fund’s NAV. Because of the inherent uncertainty in determining fair value and the various factors considered in making such determinations, there can be significant deviations between the fair value at which a portfolio security is being carried and the price at which it can be sold. To the extent Hussman Strategic International Fund has significant holdings of foreign securities, fair value determinations will be used more frequently for this Fund than for the other Funds.
The inputs or methodology used for valuing securities are not necessarily an indication of the risks associated with investing in those securities. The inputs used to measure the value of a particular security may fall into more than one level of the fair value hierarchy. In such cases, for disclosure purposes, the level in the fair value hierarchy within which the fair value measurement of that security is determined to fall in its entirety is the lowest level input that is significant to the fair value measurement.
Hussman Investment Trust
Notes to Financial Statements (continued) |
June 30, 2021 |
The following is a summary of each Fund’s investments and other financial instruments and the inputs used to value the investments and other financial instruments as of June 30, 2021 by security type:
Hussman Strategic Growth Fund
| | | Level 1 | | | Level 2 | | | Level 3 | | | Total | |
Investments in Securities and Money Market Funds: | | | | | | | | | | | | | | | | |
Common Stocks | | $ | 411,996,186 | | | $ | — | | | $ | — | | | $ | 411,996,186 | |
Exchange-Traded Funds | | | 2,005,080 | | | | — | | | | — | | | | 2,005,080 | |
Warrants | | | 80,000 | | | | — | | | | — | | | | 80,000 | |
Exchange-Traded Put Option Contracts | | | — | | | | 10,164,000 | | | | — | | | | 10,164,000 | |
Money Market Funds | | | 209,818,056 | | | | — | | | | — | | | | 209,818,056 | |
Total Investments in Securities and Money Market Funds | | $ | 623,899,322 | | | $ | 10,164,000 | | | $ | — | | | $ | 634,063,322 | |
| | | | | | | | | | | | | | | | | |
Other Financial Instruments: | | | | | | | | | | | | | | | | |
Exchange-Traded Written Call Option Contracts | | $ | — | | | $ | (221,385,090 | ) | | $ | — | | | $ | (221,385,090 | ) |
Total Other Financial Instruments | | $ | — | | | $ | (221,385,090 | ) | | $ | — | | | $ | (221,385,090 | ) |
Hussman Strategic Allocation Fund
| | | Level 1 | | | Level 2 | | | Level 3 | | | Total | |
Investments in Securities and Money Market Funds: | | | | | | | | | | | | | | | | |
Common Stocks | | $ | 13,244,901 | | | $ | — | | | $ | — | | | $ | 13,244,901 | |
Exchange-Traded Funds | | | 66,836 | | | | — | | | | — | | | | 66,836 | |
U.S. Treasury Obligations | | | — | | | | 3,495,101 | | | | — | | | | 3,495,101 | |
Warrants | | | 2,400 | | | | — | | | | — | | | | 2,400 | |
Exchange-Traded Put Option Contracts | | | — | | | | 23,982 | | | | — | | | | 23,982 | |
Money Market Funds | | | 7,117,135 | | | | — | | | | — | | | | 7,117,135 | |
Total Investments in Securities and Money Market Funds | | $ | 20,431,272 | | | $ | 3,519,083 | | | $ | — | | | $ | 23,950,355 | |
| | | | | | | | | | | | | | | | | |
Other Financial Instruments: | | | | | | | | | | | | | | | | |
Exchange-Traded Written Call Option Contracts | | $ | — | | | $ | (4,096,848 | ) | | $ | — | | | $ | (4,096,848 | ) |
Total Other Financial Instruments | | $ | — | | | $ | (4,096,848 | ) | | $ | — | | | $ | (4,096,848 | ) |
Hussman Investment Trust
Notes to Financial Statements (continued) |
June 30, 2021 |
Hussman Strategic Total Return Fund
| | | Level 1 | | | Level 2 | | | Level 3 | | | Total | |
Investments in Securities and Money Market Funds: | | | | | | | | | | | | | | | | |
Common Stocks | | $ | 43,941,500 | | | $ | — | | | $ | — | | | $ | 43,941,500 | |
Exchange-Traded Funds | | | 11,474,270 | | | | — | | | | — | | | | 11,474,270 | |
U.S. Treasury Obligations | | | — | | | | 228,787,899 | | | | — | | | | 228,787,899 | |
Warrants | | | 80,000 | | | | — | | | | — | | | | 80,000 | |
Money Market Funds | | | 31,821,289 | | | | — | | | | — | | | | 31,821,289 | |
Total Investments in Securities and Money Market Funds | | $ | 87,317,059 | | | $ | 228,787,899 | | | $ | — | | | $ | 316,104,958 | |
Hussman Strategic International Fund
| | | Level 1 | | | Level 2 | | | Level 3 | | | Total | |
Investments in Securities and Money Market Funds: | | | | | | | | | | | | | | | | |
Common Stocks | | $ | 2,813,527 | | | $ | 10,335,841 | | | $ | — | | | $ | 13,149,368 | |
Preferred Stocks | | | — | | | | 123,031 | | | | — | | | | 123,031 | |
Exchange-Traded Put Option Contracts | | | — | | | | 95,700 | | | | — | | | | 95,700 | |
Money Market Funds | | | 327,338 | | | | — | | | | — | | | | 327,338 | |
Total Investments in Securities and Money Market Funds | | $ | 3,140,865 | | | $ | 10,554,572 | | | $ | — | | | $ | 13,695,437 | |
| | | | | | | | | | | | | | | | | |
Other Financial Instruments: | | | | | | | | | | | | | | | | |
Futures Contracts Sold Short* | | $ | 204,096 | | | $ | — | | | $ | — | | | $ | 204,096 | |
Total Other Financial Instruments | | $ | 204,096 | | | $ | — | | | $ | — | | | $ | 204,096 | |
* | Includes cumulative appreciation (depreciation) of futures contracts as of June 30, 2021. |
Each Fund’s Schedule of Investments identifies the specific securities (by type of security and sector and industry type or geographical region) that comprise that Fund’s holdings within the Level 1 and Level 2 categories shown in the tables above.
The Funds did not have any assets or liabilities that were measured at fair value on a recurring basis using significant unobservable inputs (Level 3) as of June 30, 2021.
Futures Contracts and Option Transactions — Hussman Strategic Growth Fund, Hussman Strategic Allocation Fund and Hussman Strategic International Fund may purchase and write call and put options on broad-based stock indices and also may purchase and write call and put option contracts on individual securities. Each
Hussman Investment Trust
Notes to Financial Statements (continued) |
June 30, 2021 |
of the Funds may use financial futures contracts and related option contracts to hedge against changes in the market value of its portfolio securities. Hussman Strategic Total Return Fund and Hussman Strategic International Fund may also purchase foreign currency options to manage their exposures to foreign currencies. Hussman Strategic Allocation Fund and Hussman Strategic Total Return Fund may purchase interest rate futures contracts to protect against a decline in the value of its portfolio resulting from rising interest rates. Hussman Strategic International Fund may enter into forward foreign currency contracts to hedge against the adverse impact of changes in foreign exchange rates on the U.S. dollar value of its investments or changes in the prices at which it effects transactions in foreign securities.
Hussman Strategic Growth Fund, Hussman Strategic Allocation Fund and Hussman Strategic International Fund may each use futures and option contracts on stock indices for the purpose of seeking to reduce the market risk that would otherwise be associated with the securities in which it invests. For example, these Funds may sell a stock index futures contracts to hedge the risk of a general market or market sector decline that might adversely affect prices of the Funds’ portfolio securities. To the extent there is a correlation between a Fund’s portfolio and a particular stock index, the sale of futures contracts on that index could reduce the Fund’s exposure to general market risk.
When a Fund writes an index option, an amount equal to the net premium (the premium less the commission) received by the Fund is recorded as a liability on the Fund’s Statement of Assets and Liabilities and is subsequently marked-to-market daily. If an index option written by a Fund expires unexercised on the stipulated expiration date or if a Fund enters into a closing purchase transaction, it will realize a gain or a loss depending on whether the cost of a closing purchase transaction is less than or exceeds the net premium received when the option was sold and the liability related to such option will be eliminated. If an index option written by a Fund is exercised, the Fund will be required to pay the difference between the closing index value and the exercise price of the option. In this event, the proceeds of the sale will be increased by the net premium originally received and the Fund will realize a gain or loss. To secure the obligation of a Fund to settle index options it has written, common stocks owned by the Fund are held in escrow by the Fund’s custodian bank (or by a securities depository acting for the custodian bank) for the benefit of the Options Clearing Corporation (the “OCC”). Stocks are released from escrow by the OCC (thus, enabling the Fund to sell the stocks) only when options expire unexercised or when the Fund enters into a closing purchase transaction.
When a Fund purchases or sells a stock index futures contract, no price is paid to or received by the Fund upon the purchase or sale of the futures contract. Instead, the Fund is required to deposit in a segregated account with its custodian an amount of cash or
Hussman Investment Trust
Notes to Financial Statements (continued) |
June 30, 2021 |
qualifying securities currently ranging from 2% to 11% of the contract amount. This is called “initial margin.” Subsequent payments, known as “variation margin,” are made or received by the Fund to or from the separate account each day, depending on the daily fluctuations in the value of the underlying stock index. The Fund recognizes an unrealized gain or loss equal to the daily variation margin. If general market movements are not as expected, the Fund may not achieve the anticipated benefits from the use of futures contracts and may realize a loss. In addition to the possibility that there may be an imperfect correlation or no correlation at all between the movements in the stock index futures and the portion of the portfolio being hedged, the price of the stock index futures may not correlate perfectly with movements in the stock index due to certain market distortions.
Foreign Currency Translation — Investment securities and other assets and liabilities denominated in or expected to settle in foreign currencies are translated into U.S. dollars based on exchange rates on the following basis:
| | A. | The values of investment securities and other assets and liabilities are translated as of the close of the NYSE each day. |
| | B. | Purchases and sales of investment securities and income and expenses are translated at the rate of exchange prevailing as of 4:00 p.m., Eastern time, on the respective date of such transactions. |
| | C. | The Funds do not isolate that portion of the results of operations caused by changes in foreign exchange rates on investments from those caused by changes in market prices of securities held. Such fluctuations are included with the net realized and unrealized gains or losses on investments. |
Reported net realized foreign exchange gains or losses arise from: (1) purchases and sales of foreign currencies; (2) currency gains or losses realized between the trade and settlement dates on securities transactions; and (3) the difference between the amounts of dividends, interest and foreign withholding taxes recorded on a Fund’s books and the U.S. dollar equivalent of the amounts actually received or paid. Reported net unrealized foreign exchange gains and losses arise from changes in the U.S. dollar value of assets and liabilities that result from changes in exchange rates.
Share Valuation and Redemption Fees — The NAV per share of each Fund is calculated as of the close of regular trading on the NYSE (normally 4:00 p.m., Eastern time) on each day that the NYSE is open for business. NAV per share of a Fund is calculated by dividing the total value of the Fund’s assets, less its liabilities, by the number of its shares outstanding. The offering price and redemption price per share of each Fund is equal to the NAV per share next computed after receipt of an order to purchase or to redeem shares. However, a redemption fee of 1.5%, payable to the applicable
Hussman Investment Trust
Notes to Financial Statements (continued) |
June 30, 2021 |
Fund, generally will apply to shares that are redeemed 60 days or less from the date of purchase. During the periods ended June 30, 2021 and 2020, proceeds from redemption fees, recorded in capital, totaled: $70,280 and $76,103, respectively, for Hussman Strategic Growth Fund; $760 and $232, respectively, for Hussman Strategic Allocation Fund; $40,060 and $78,782, respectively, for Hussman Strategic Total Return Fund; and $96 and $333, respectively, for Hussman Strategic International Fund.
Investment Income — Interest income is accrued as earned. Dividend income is recorded on the ex-dividend date. Non-cash dividends included in dividend income, if any, are recorded at the value of the security received. Discounts and premiums on fixed income securities are amortized using the effective interest method. Withholding taxes on foreign dividends have been recorded in accordance with the Trust’s understanding of the applicable country’s rules and tax rates.
Distributions to Shareholders — Dividends from net investment income, if any, are declared and paid annually to shareholders of Hussman Strategic Growth Fund and Hussman Strategic International Fund and are declared and paid quarterly to shareholders of Hussman Strategic Allocation Fund and Hussman Strategic Total Return Fund. Dividends are recorded on the ex-dividend date. Net realized short-term capital gains, if any, may be distributed throughout the year and net realized long-term capital gains, if any, are generally distributed annually. The amount of distributions from net investment income and net realized capital gains are determined in accordance with federal income tax regulations, which may differ from GAAP. These “book/tax” differences are either temporary or permanent in nature and are primarily due to timing differences in the recognition of capital gains or losses on options and futures transactions, losses deferred due to wash sales and the treatment of foreign currency transactions. The tax character of distributions paid by each Fund during the periods ended June 30, 2021 and 2020 was ordinary income.
Investment Transactions — Investment transactions are accounted for on trade date for financial reporting purposes. Realized gains and losses on investments sold are determined on a specific identification basis.
Common Expenses — Expenses of the Trust not attributable solely to one of the Funds are allocated among the Funds based on the relative net assets of each Fund or based on the nature of the expense and its relative applicability to each Fund.
Accounting Estimates — The preparation of financial statements in conformity with GAAP requires management to make estimates and assumptions that affect the reported amounts of assets and liabilities and the disclosure of contingent assets and liabilities as of the date of the financial statements and the reported amounts of increase (decrease) in net assets from operations during the reporting period. Actual results could differ from these estimates.
Hussman Investment Trust
Notes to Financial Statements (continued) |
June 30, 2021 |
Federal Income Tax — Each Fund has qualified and intends to continue to qualify each year as a “regulated investment company” under Subchapter M of the Internal Revenue Code of 1986, as amended (the “Code”). By so qualifying, a Fund generally will not be subject to federal income taxes to the extent that it distributes its net investment income and any net realized capital gains in accordance with the Code. Accordingly, no provision for income taxes has been made.
In order to avoid imposition of a federal excise tax applicable to regulated investment companies, it is each Fund’s intention to declare and pay as dividends in each calendar year at least 98% of its net investment income (earned during the calendar year) and 98.2% of its net realized capital gains (earned during the twelve months ended October 31) plus undistributed amounts from prior years.
The tax character of accumulated earnings (deficit) as of June 30, 2021 was as follows:
| | | Hussman
Strategic
Growth Fund | | | Hussman
Strategic
Allocation Fund | | | Hussman
Strategic Total
Return Fund | | | Hussman
Strategic
International
Fund | |
Net unrealized appreciation | | $ | 47,677,568 | | | $ | 1,453,949 | | | $ | 10,320,498 | | | $ | 1,572,795 | |
Undistributed ordinary income | | | 2,726,141 | | | | 574,326 | | | | 197,583 | | | | — | |
Accumulated capital and other losses | | | (912,038,655 | ) | | | — | | | | (43,960,197 | ) | | | (16,395,396 | ) |
Other temporary differences | | | — | | | | — | | | | (81,029 | ) | | | — | |
Accumulated earnings (deficit) | | $ | (861,634,946 | ) | | $ | 2,028,275 | | | $ | (33,523,145 | ) | | $ | (14,822,601 | ) |
The following information is based upon the federal income tax cost of investment securities as of June 30, 2021:
| | | Hussman
Strategic
Growth Fund | | | Hussman
Strategic
Allocation Fund | | | Hussman
Strategic Total
Return Fund | | | Hussman
Strategic
International
Fund | |
Cost of investments and money market funds | | $ | 365,000,664 | | | $ | 18,399,558 | | | $ | 305,784,460 | | | $ | 12,124,444 | |
Gross unrealized appreciation | | $ | 60,943,008 | | | $ | 1,882,878 | | | $ | 16,283,901 | | | $ | 1,903,280 | |
Gross unrealized depreciation | | | (13,265,440 | ) | | | (428,929 | ) | | | (5,963,403 | ) | | | (330,485 | ) |
Net unrealized appreciation | | $ | 47,677,568 | | | $ | 1,453,949 | | | $ | 10,320,498 | | | $ | 1,572,795 | |
Hussman Investment Trust
Notes to Financial Statements (continued) |
June 30, 2021 |
The difference between the federal income tax cost of portfolio investments and the financial statement cost of portfolio investments for each Fund is due to certain timing differences in the recognition of capital gains or losses under income tax regulations and GAAP. These “book/tax” differences are temporary in nature and are primarily due to losses deferred due to wash sales, derivatives and adjustments to basis for passive foreign investment companies, publicly traded partnerships and grantor trusts.
During the year ended June 30, 2021, Hussman Strategic Total Return Fund utilized $10,649,833 of capital loss carryforwards to offset current year capital gains.
As of June 30, 2021, the Funds had the following capital loss carryforwards for federal income tax purposes:
| | | Hussman
Strategic
Growth Fund | | | Hussman
Strategic Total
Return Fund | | | Hussman
Strategic
International
Fund | |
Short-term loss carryforwards | | $ | 569,173,135 | | | $ | 38,549,269 | | | $ | 15,478,664 | |
Long-term loss carryforwards | | | 342,865,520 | | | | 5,410,928 | | | | 916,732 | |
Total | | $ | 912,038,655 | | | $ | 43,960,197 | | | $ | 16,395,396 | |
These capital loss carryforwards, which do not expire, may be utilized by the Funds in future years to offset their net realized capital gains, if any.
For the year ended June 30, 2021, the following reclassifications were made as a result of permanent differences between the financial statement and income tax reporting requirements due to adjustments for net operating loss, nondeductible expenses from publicly traded partnerships and distributions in excess of earnings and profits:
| | | Hussman
Strategic
Growth Fund | | | Hussman
Strategic
Allocation Fund | | | Hussman
Strategic Total
Return Fund | | | Hussman
Strategic
International
Fund | |
Paid-in capital | | $ | (243 | ) | | $ | — | | | $ | (1,711 | ) | | $ | (6,601 | ) |
Accumulated earnings (deficit) | | $ | 243 | | | $ | — | | | $ | 1,711 | | | $ | 6,601 | |
Such reclassifications have no effect on each Fund’s total net assets or its NAV per share.
Hussman Investment Trust
Notes to Financial Statements (continued) |
June 30, 2021 |
Each Fund recognizes the tax benefits or expenses of uncertain tax positions only when the position is “more likely than not” to be sustained assuming examination by tax authorities. Management has reviewed each Fund’s tax positions taken on federal income tax returns for all open tax years (generally, tax returns that have been filed within the past three years) and all major jurisdictions and has concluded that no provision for unrecognized tax benefits or expenses is required in these financial statements. Therefore, no tax expense (including interest and penalties) was recorded in the current year and no adjustments were made to prior periods.
2. INVESTMENT TRANSACTIONS
During the year ended June 30, 2021, cost of purchases and proceeds from sales and maturities of investment securities, other than short-term investments and U.S. government securities, were as follows:
| | | Hussman
Strategic
Growth Fund | | | Hussman
Strategic
Allocation Fund | | | Hussman
Strategic Total
Return Fund | | | Hussman
Strategic
International
Fund | |
Purchases of investment securities | | $ | 702,834,854 | | | $ | 20,115,032 | | | $ | 70,169,523 | | | $ | 11,195,088 | |
Proceeds from sales and maturities of investment securities | | $ | 826,766,223 | | | $ | 18,228,153 | | | $ | 97,576,470 | | | $ | 13,660,460 | |
During the year ended June 30, 2021, cost of purchases and proceeds from sales and maturities of long-term U.S. government securities were as follows:
| | | Hussman
Strategic
Growth Fund | | | Hussman
Strategic
Allocation Fund | | | Hussman
Strategic Total
Return Fund | | | Hussman
Strategic
International
Fund | |
Purchases of investment securities | | $ | — | | | $ | 2,522,702 | | | $ | 80,685,310 | | | $ | — | |
Proceeds from sales and maturities of investment securities | | $ | — | | | $ | 77 | | | $ | 19,137 | | | $ | — | |
3. TRANSACTIONS WITH AFFILIATES
Advisory Agreement
Under the terms of an Advisory Agreement between the Trust and the Adviser, Hussman Strategic Growth Fund pays the Adviser a fee, which is computed and accrued daily and paid monthly, at annual rates of: 0.90% of the first $2 billion of the Fund’s average daily net assets; 0.85% of the next $3 billion of such assets;
Hussman Investment Trust
Notes to Financial Statements (continued) |
June 30, 2021 |
and 0.80% of such assets over $5 billion. Under the terms of a separate Advisory Agreement between the Trust and the Adviser, Hussman Strategic Allocation Fund pays the Adviser a fee, which is computed and accrued daily and paid monthly, at annual rates of: 0.75% of the first $2 billion of the Fund’s average daily net assets; 0.70% of the next $3 billion of such assets; and 0.65% of such assets over $5 billion. Under the terms of a separate Advisory Agreement between the Trust and the Adviser, Hussman Strategic Total Return Fund pays the Adviser a fee, which is computed and accrued daily and paid monthly, at annual rates of: 0.50% of the first $1 billion of the Fund’s average daily net assets; 0.45% of the next $1.5 billion of such assets; and 0.40% of such assets over $2.5 billion. Under the terms of a separate Advisory Agreement between the Trust and the Adviser, Hussman Strategic International Fund pays the Adviser a fee, which is computed and accrued daily and paid monthly, at annual rates of: 0.95% of the first $2 billion of the Fund’s average daily net assets; 0.90% of the next $3 billion of such assets; and 0.85% of such assets over $5 billion.
The Adviser has contractually agreed that, until November 1, 2021 (or until November 1, 2022 with respect to Hussman Strategic Allocation Fund), it will waive its advisory fees and/or absorb operating expenses of each Fund to the extent necessary so that operating expenses of Hussman Strategic Growth Fund, Hussman Strategic Allocation Fund, Hussman Strategic Total Return Fund and Hussman Strategic International Fund (excluding fees and expenses incurred on investments in other investment companies and pooled investment vehicles, brokerage commissions, taxes, interest expense and any extraordinary expenses) do not exceed annually an amount equal to 1.15%, 1.25%, 0.75%, and 2.00%, respectively, of such Fund’s average daily net assets. During the year ended June 30, 2021, the Adviser waived advisory fees in the amount of $126,004, $96,818 and $140,932 with respect to Hussman Strategic Growth Fund, Hussman Strategic Allocation Fund and Hussman Strategic International Fund, respectively. Additionally, during the year ended June 30, 2021, the Adviser absorbed operating expenses of $112,861 and $87,238 with respect to Hussman Strategic Allocation Fund and Hussman Strategic International Fund, respectively. During the year ended June 30, 2021, the Adviser waived no advisory fees with respect to Hussman Strategic Total Return Fund.
Pursuant to the Expense Limitation Agreements governing these arrangements, each Fund is obligated to reimburse the Adviser the amount of advisory fees previously waived and expenses previously absorbed by the Adviser for a period of three years from the date such fees or expenses were waived or absorbed, but only if such reimbursement does not cause the Fund’s operating expenses (after the reimbursement is taken into account) to exceed the lesser of: (i) the expense limitation in effect at the
Hussman Investment Trust
Notes to Financial Statements (continued) |
June 30, 2021 |
time such fees and expenses were waived or absorbed; and (ii) the expense limitation in effect at the time the Adviser seeks reimbursement of such fees and expenses. The Expense Limitation Agreements may not be terminated by the Adviser without the approval of the Board of Trustees. As of June 30, 2021, the amount of fee waivers and expense reimbursements available for possible recovery by the Adviser from Hussman Strategic Growth Fund, Hussman Strategic Allocation Fund, Hussman Strategic Total Return Fund and Hussman Strategic International Fund is $747,552, $417,648, $299,791 and $642,756, respectively. The portions of these amounts that the Adviser may recover expire as of the following dates:
| | | June 30,
2022 | | | June 30,
2023 | | | June 30,
2024 | |
Hussman Strategic Growth Fund | | $ | 313,486 | | | $ | 308,062 | | | $ | 126,004 | |
Hussman Strategic Allocation Fund | | $ | — | | | $ | 207,969 | | | $ | 209,679 | |
Hussman Strategic Total Return Fund | | $ | 166,982 | | | $ | 132,809 | | | $ | — | |
Hussman Strategic International Fund | | $ | 171,269 | | | $ | 243,317 | | | $ | 228,170 | |
The Adviser may agree to continue after November 1, 2021 (or in the case of Hussman Strategic Allocation Fund, November 1, 2022) the current arrangement to limit the Funds’ expenses or to implement a similar arrangement, but it is not obligated to do so.
Certain officers of the Trust are also officers of the Adviser.
Other Service Providers
Ultimus Fund Solutions, LLC (“Ultimus”) provides administration, fund accounting, compliance and transfer agency services to the Funds. The Funds pay Ultimus fees for these services in accordance with various servicing agreements. In addition, the Funds reimburse Ultimus for certain out-of-pocket expenses incurred in providing services to the Funds, including, but not limited to, postage, supplies and costs related to the pricing of the Funds’ portfolio securities. Certain officers of the Trust are also officers of Ultimus, or of Ultimus Fund Distributors, LLC (the “Distributor”), the principal underwriter of the Funds. The Distributor is a wholly-owned subsidiary of Ultimus.
The Funds compensate certain financial intermediaries for providing account maintenance and shareholder services to shareholder accounts held through such intermediaries. During the year ended June 30, 2021, Hussman Strategic Growth Fund, Hussman Strategic Allocation Fund, Hussman Strategic Total Return Fund and Hussman Strategic International Fund paid $167,469, $685, $104,298 and
Hussman Investment Trust
Notes to Financial Statements (continued) |
June 30, 2021 |
$17,597, respectively, to financial intermediaries for such services. These amounts are included in transfer agent, account maintenance and shareholder services fees on the Statements of Operations.
Trustee Compensation
Trustees and officers affiliated with the Adviser or Ultimus are not compensated by the Funds for their services. Effective October 1, 2020, each Trustee who is not an “interested person,” as defined by the 1940 Act, of the Trust or an affiliated person of the Adviser or Ultimus (an “Independent Trustee”) receives from the Trust: an annual retainer of $50,000, payable quarterly; a fee of $7,000 for attendance at each regular quarterly meeting of the Board of Trustees other than the annual meeting of the Board, for which each Independent Trustee receives an attendance fee of $12,000; a fee of $4,000 for attendance at each special meeting of the Board of Trustees; a fee of $3,000 for attendance at each meeting of any committee of the Board of Trustees that is not held on the same day as a Board of Trustees meeting; and a fee of $1,500 for participation in each informal monthly telephone conference call of the Board of Trustees. In addition, the Independent Trustees are reimbursed for travel and other expenses incurred in attending meetings. Prior to October 1, 2020, each Independent Trustee received from the Trust: an annual retainer of $50,000, payable quarterly; a fee of $10,000 for attendance at each in-person meeting of the Board of Trustees (except that such fee was $15,000 with respect to the annual meeting of the Board) and a fee of $4,000 for attendance at each telephone meeting of the Board of Trustees; a fee of $3,000 for attendance at each meeting of any committee of the Board if not held on the same day as a Board of Trustees meeting; and a fee of $1,500 for participation in each informal monthly telephone conference call of the Board of Trustees. Each Fund pays its proportionate share of the Independent Trustees’ fees and expenses.
Principal Holder of Fund Shares
As of June 30, 2021, an officer of the Adviser owned of record 43.5% and 50.5% of the outstanding shares of Hussman Strategic Allocation Fund and Hussman Strategic International Fund, respectively. A shareholder owning of record or beneficially 25% or more of a Fund’s outstanding shares may be considered a controlling person. That shareholder’s vote could have a more significant effect on matters presented at a shareholders’ meeting.
Hussman Investment Trust
Notes to Financial Statements (continued) |
June 30, 2021 |
4. DERIVATIVES TRANSACTIONS
The locations in the Statements of Assets and Liabilities of the derivative positions of Hussman Strategic Growth Fund, Hussman Strategic Allocation Fund and Hussman Strategic International Fund are as follows:
Hussman Strategic Growth Fund
| | | | | Fair Value | | | Average Monthly | |
Type of
Derivative | Risk | Location | | Asset
Derivatives | | | Liability
Derivatives | | | Notional Value
During the
Year Ended
June 30,
2021* | |
Index put options purchased | Equity | Investments in securities at value | | $ | 10,164,000 | | | $ | — | | | $ | 352,876,576 | |
Index call options written | Equity | Written call options, at value | | | — | | | | (221,385,090 | ) | | | (347,539,382 | ) |
Hussman Strategic Allocation Fund
| | | | | Fair Value | | | Average Monthly | |
Type of
Derivative | Risk | Location | | Asset
Derivatives | | | Liability
Derivatives | | | Notional Value
During the
Year Ended
June 30,
2021* | |
Index put options purchased | Equity | Investments in securities at value | | $ | 23,982 | | | $ | — | | | $ | 8,265,298 | |
Index call options written | Equity | Written call options, at value | | | — | | | | (4,096,848 | ) | | | (8,125,173 | ) |
Hussman Investment Trust
Notes to Financial Statements (continued) |
June 30, 2021 |
Hussman Strategic International Fund
| | | | | Fair Value | | | Average Monthly | |
Type of
Derivative | Risk | Location | | Asset
Derivatives | | | Liability
Derivatives | | | Notional Value
During the
Year Ended
June 30,
2021* | |
Index put options purchased | Equity | Investments in securities at value | | $ | 95,700 | | | $ | — | | | $ | 4,354,813 | |
Futures contracts sold short** | Equity | Accumulated deficit | | | — | | | | 204,096 | | | | (8,192,494 | ) |
* | The average monthly notional value generally represents the Fund’s derivative activity throughout the period. |
** | Includes cumulative appreciation (depreciation) of futures contracts from the date the contracts were opened through June 30, 2021. Only current variation margin is reported on the Statements of Assets and Liabilities. |
Realized and unrealized gains and losses associated with transactions in derivative instruments for Hussman Strategic Growth Fund, Hussman Strategic Allocation Fund and Hussman Strategic International Fund during the year ended June 30, 2021 are recorded in the following locations on the Statements of Operations:
Hussman Strategic Growth Fund
Type of
Derivative | Risk | Location | | Realized
Losses | | Location | | Change in
Unrealized
Appreciation
(Depreciation) | |
Index put options purchased | Equity | Net realized gains (losses) from investments | | $ | (59,104,514 | ) | Net change in unrealized appreciation (depreciation) on investments | | $ | 4,591,203 | |
Index call options written | Equity | Net realized gains (losses) from written option contracts | | | (156,098,054 | ) | Net change in unrealized appreciation (depreciation) on written option contracts | | | 20,470,053 | |
Hussman Investment Trust
Notes to Financial Statements (continued) |
June 30, 2021 |
Hussman Strategic Allocation Fund
Type of
Derivative | Risk | Location | | Realized
Losses | | Location | | Change in
Unrealized
Appreciation
(Depreciation) | |
Index put options purchased | Equity | Net realized gains (losses) from investments | | $ | (456,905 | ) | Net change in unrealized appreciation (depreciation) on investments | | $ | 50,818 | |
Index call options written | Equity | Net realized gains (losses) from written option contracts | | | (2,721,432 | ) | Net change in unrealized appreciation (depreciation) on written option contracts | | | 129,180 | |
Hussman Strategic International Fund
Type of
Derivative | Risk | Location | | Realized
Losses | | Location | | Change in
Unrealized
Appreciation
(Depreciation) | |
Index put options purchased | Equity | Net realized gains (losses) from investments | | $ | (862,060 | ) | Net change in unrealized appreciation (depreciation) on investments | | $ | 6,865 | |
Futures contracts sold short | Equity | Net realized gains (losses) from futures contracts | | | (2,588,080 | ) | Net change in unrealized appreciation (depreciation) on futures contracts | | | 271,031 | |
Hussman Strategic Total Return Fund had no transactions in derivative instruments during the year ended June 30, 2021.
In the ordinary course of business, Hussman Strategic Growth Fund, Hussman Strategic Allocation Fund and Hussman Strategic International Fund may enter into transactions subject to enforceable netting agreements or other similar arrangements (“netting agreements”). Generally, the right to offset in netting agreements allows each Fund to offset the exposure it has on any transaction with a specific counterparty with
Hussman Investment Trust
Notes to Financial Statements (continued) |
June 30, 2021 |
any collateral it has received or delivered in connection with other transactions with that counterparty. Generally, the Funds manage their cash collateral and securities collateral on a counterparty basis.
The offsetting of financial liabilities and derivative liabilities as of June 30, 2021 are as follows:
Hussman Strategic Growth Fund
Description | | Gross
Amounts of
Recognized
Liabilities | | | Gross
Amounts
Offset on
Statements
of Assets and
Liabilities | | | Net Amounts
of Liabilities
Presented on
Statements
of Assets and
Liabilities | | | Collateral
Pledged* | | | Net Amount | |
Written call options at market value | | $ | (221,385,090 | ) | | $ | — | | | $ | (221,385,090 | ) | | $ | — | | | $ | (221,385,090 | ) |
Total subject to a master netting or similar arrangement | | $ | (221,385,090 | ) | | $ | — | | | $ | (221,385,090 | ) | | $ | — | | | $ | (221,385,090 | ) |
* | Common stocks owned by the Fund are held in escrow by the Fund’s custodian (or by a securities depository) to secure the Fund’s obligations to settle outstanding call option contracts it has written (Note 1). |
Hussman Strategic Allocation Fund
Description | | Gross
Amounts of
Recognized
Liabilities | | | Gross
Amounts
Offset on
Statements
of Assets and
Liabilities | | | Net Amounts
of Liabilities
Presented on
Statements
of Assets and
Liabilities | | | Collateral
Pledged* | | | Net Amount | |
Written call options at market value | | $ | (4,096,848 | ) | | $ | — | | | $ | (4,096,848 | ) | | $ | — | | | $ | (4,096,848 | ) |
Total subject to a master netting or similar arrangement | | $ | (4,096,848 | ) | | $ | — | | | $ | (4,096,848 | ) | | $ | — | | | $ | (4,096,848 | ) |
* | Common stocks owned by the Fund are held in escrow by the Fund’s custodian (or by a securities depository) to secure the Fund’s obligations to settle outstanding call option contracts it has written (Note 1). |
Hussman Investment Trust
Notes to Financial Statements (continued) |
June 30, 2021 |
Hussman Strategic International Fund
Description | | Gross
Amounts of
Recognized
Liabilities | | | Gross
Amounts
Offset on
Statements
of Assets and
Liabilities | | | Net Amounts
of Liabilities
Presented on
Statements
of Assets and
Liabilities | | | Collateral
Pledged* | | | Net Amount | |
Variation margin receivable - futures contracts | | $ | 65,721 | | | $ | — | | | $ | 65,721 | | | $ | — | | | $ | 65,721 | |
Total subject to a master netting or similar arrangement | | $ | 65,721 | | | $ | — | | | $ | 65,721 | | | $ | — | | | $ | 65,721 | |
* | Amounts in cash collateral pledged in the table above are limited to the net amounts of liabilities presented on the Statements of Assets and Liabilities. |
5. CERTAIN INVESTMENTS AND ASSOCIATED RISKS
The securities in which the Funds invest, as well as the risks associated with these securities and with the investment programs of the Funds, are described in each Fund’s Prospectus. Among these risks are those associated with investments in derivative instruments, investments in shares of money market funds, concentration of investments within a particular business sector and, in the case of Hussman Strategic International Fund, investments in foreign securities.
Risks of Derivative Instruments — The purchase and sale of derivative instruments, including options and futures contracts, and other derivative transactions involve risks different from those involved with direct investments in securities and also require different skills from the Adviser in managing each Fund’s portfolio of investments. While utilization of options, futures contracts and similar instruments may be advantageous to the Funds, if the Adviser is not successful in employing such instruments in managing a Fund’s investments or in anticipating general market movements, the Fund’s performance will be worse than if the Fund did not make such investments. It is possible that there will be imperfect correlation, or even no correlation, between price movements of the investments held by the Funds and the options, futures or other derivative instruments used to hedge those investments. It is also possible that a Fund may be unable to close out or liquidate its hedges during unusual periods of illiquidity in the options, futures or other markets. In addition, a Fund will pay commissions and other costs in connection with its transactions in such instruments, which may increase its expenses and reduce its investment performance.
Hussman Investment Trust
Notes to Financial Statements (continued) |
June 30, 2021 |
Investments in Money Market Funds — In order to maintain sufficient liquidity to implement investment strategies, or for temporary defensive purposes, each Fund may at times invest a significant portion of its assets in shares of money market funds. As of June 30, 2021, Hussman Strategic Growth Fund and Hussman Strategic Allocation Fund had 50.8% and 35.8%, respectively, of the value of their net assets invested in shares of a money market fund registered under the 1940 Act. An investment in a money market fund is not insured or guaranteed by the Federal Deposit Insurance Corporation or any other governmental agency, entity or person. While investor losses in money market funds have been rare, they are possible. The Funds, as investors in money market funds, indirectly bear the fees and expenses of those funds, which are in addition to the fees and expenses of the Funds.
Sector Risk — If a Fund has significant investments in the securities of issuers in industries within a particular business sector, any development generally affecting that sector will have a greater impact on the value of the net assets of the Fund than would be the case if the Fund did not have significant investments in that sector. This may increase the risk of loss of an investment in a Fund and increase the volatility of a Fund’s NAV per share. From time to time, circumstances may affect a particular sector and the companies within such sector. For instance, economic or market factors, regulation or deregulation, and technological or other developments, may negatively impact all companies in a particular sector and therefore the value of a Fund’s portfolio could be adversely affected if it has significant holdings of securities of issuers in that sector. As of June 30, 2021, Hussman Strategic Growth Fund and Hussman Strategic International Fund had 23.9% and 20.0%, respectively, of the value of their net assets invested in stocks within the Consumer Discretionary sector.
Foreign Investment Risk — Compared with investing in the United States, investing in foreign markets involves a greater degree and variety of risks. Investors in foreign markets may face delayed settlements, currency controls and adverse economic developments as well as higher overall transaction costs. In addition, fluctuations in the U.S. dollar’s value versus other currencies may erode or reverse gains from investments denominated in foreign currencies or increase losses. Foreign governments may expropriate assets, impose capital or currency controls, impose punitive taxes, impose limits on ownership or nationalize a company or industry. Any of these actions could have a severe effect on securities prices and impair an investor’s ability to bring its capital or income back to the U.S. Exchange rate fluctuations also may impair a foreign issuer’s ability to repay U.S. dollar denominated debt, thereby increasing credit risk associated with investment in such debt. The values of foreign securities may be affected by incomplete, less frequent or inaccurate financial information about
Hussman Investment Trust
Notes to Financial Statements (continued) |
June 30, 2021 |
their issuers, social upheavals or political actions ranging from tax code changes to government collapse. Foreign companies may also receive less coverage than U.S. companies by market analysts and may be subject to reporting standards or regulatory requirements that differ from those applicable to U.S. companies.
As of June 30, 2021, investments of Hussman Strategic International Fund in issuers in the United Kingdom (the “UK”) represented 11.4% of the value of its stock portfolio and investments by the Fund in issuers in countries within the European Union (the “EU”) represented 38.9% of the value of its stock portfolio. EU member countries that use the Euro as their currency (so-called Eurozone countries) lack the ability to implement an independent monetary policy and may be significantly affected by requirements that limit their fiscal options. Since the global economic crisis in 2008, some of these countries have depended on, and may continue to depend on, assistance from others such as the European Central Bank and other governments or institutions, and failure to implement reforms as a condition of assistance may have negative long-them effects for the economies of those countries and other European countries. In June 2016, voters in the UK approved a referendum calling for the exit of the UK from the EU (a process commonly referred to as “Brexit”), and Brexit took place on January 31, 2020. There presently is considerable uncertainty regarding the impact of Brexit on the economies and financial markets of the UK and of the EU and other European countries. As a result of Brexit, there may be an extended period of political and economic uncertainty and market volatility in the UK, the EU, other European countries and globally, which may adversely impact the prices and liquidity of securities held by Hussman Strategic International Fund.
As of June 30, 2021, Hussman Strategic International Fund had 29.7% of the value of its stock portfolio invested in stocks of companies domiciled in Japan. At times, the Japanese economy has been negatively affected by government intervention and protectionism, an unstable financial services sector, a heavy reliance on international trade, and natural disasters. These factors, as well as other adverse political developments, increases in government debt, and changes to fiscal monetary or trade policies, may negatively affect Japanese markets and the prices of stocks of Japanese companies.
6. FORWARD FOREIGN CURRENCY EXCHANGE CONTRACTS
Hussman Strategic International Fund is subject to foreign currency exchange rate risk in the normal course of pursuing its investment objective. Hussman Strategic International Fund may (but is not required to) enter into contracts for the purchase or sale of a specific foreign currency at a fixed price on a future date as a hedge or
Hussman Investment Trust
Notes to Financial Statements (continued) |
June 30, 2021 |
cross-hedge against either specific transactions or portfolio positions generally. Foreign currency hedging transactions may be used to reduce the risk that the U.S. dollar value of the Fund’s holdings of securities denominated in foreign currency will decline in value due to changes in foreign currency exchange rates or to protect against adverse changes in the prices of securities that the Fund is purchasing or selling prior to settlement of those transactions. All foreign currency exchange contracts are marked-to-market daily at the applicable translation rates resulting in unrealized gains or losses. Realized and unrealized gains or losses from transactions in foreign currency exchange contracts are included in the Fund’s Statement of Assets and Liabilities and Statement of Operations. Risks associated with these contracts include the potential inability of counterparties to meet the terms of their contracts and unanticipated movements in the value of a foreign currency relative to the U.S. dollar. Hussman Strategic International Fund, as previously noted, may also purchase foreign currency options to manage foreign currency exposures.
As of and during the year ended June 30, 2021, Hussman Strategic International Fund had no forward currency exchange contracts outstanding.
7. BANK LINE OF CREDIT
Hussman Strategic Growth Fund has an unsecured bank line of credit with its custodian bank in the amount of $10,000,000. Hussman Strategic Total Return Fund has an unsecured bank line of credit with its custodian bank in the amount of $2,000,000. Any borrowings under these arrangements bear interest at the Prime Rate. During the year ended June 30, 2021, Hussman Strategic Growth Fund and Hussman Strategic Total Return Fund did not borrow under their respective lines of credit. Hussman Strategic Allocation Fund and Hussman Strategic International Fund currently do not have bank lines of credit.
8. CONTINGENCIES AND COMMITMENTS
The Trust’s officers and Trustees are entitled to indemnification from the Funds for certain liabilities to which they may become subject in connection with the performance of their duties to the Funds. Additionally, in the normal course of business, the Funds enter into contracts that contain a variety of representations and warranties and which may require the Funds to indemnify the other parties to the contracts in the event of certain losses. The Funds’ maximum exposure under these arrangements is unknown, as this would involve potential claims for indemnification for losses that may or may not be incurred in the future. However, based on experience, the Trust believes the risk of loss to be remote.
Hussman Investment Trust
Notes to Financial Statements (continued) |
June 30, 2021 |
9. LEGAL PROCEEDINGS
Several lawsuits have been filed relating to Hussman Strategic Growth Fund’s investment in Tribune Company common stock in connection with Tribune Company’s Chapter 11 bankruptcy. The lawsuits stem from a leveraged buyout by which Tribune Company converted to a privately-held company in 2007. The Trust, Hussman Strategic Growth Fund and Hussman Strategic Advisors (the “Hussman Entities”) were named as defendants and putative members of the proposed defendant class of shareholders in an adversary proceeding brought by The Official Committee of Unsecured Creditors of Tribune Company in the U.S. Bankruptcy Court for the District of Delaware in 2010. That action was subsequently transferred to the U.S. District Court for the Southern District of New York by order of the Judicial Panel on Multidistrict Litigation, and Marc S. Kirschner, the Litigation Trustee for the Tribune Litigation Trust, became successor plaintiff to the Creditors Committee on December 31, 2012, the effective date of Tribune Company’s plan of reorganization. The Trust and Hussman Strategic Growth Fund were also named as defendants in a lawsuit filed by the indenture trustees of certain noteholders of Tribune Company in the U.S. District Court for the Southern District of Ohio in 2011. Hussman Strategic Growth Fund and Hussman Strategic Advisors were named as defendants in a similar action in the U.S. District Court for the District of Maryland in 2011. Both of those actions have been transferred to the U.S. District Court for the Southern District of New York for coordinated proceedings with many other similar lawsuits brought by individual creditors against former Tribune Company shareholders and the action currently prosecuted by the Tribune Litigation Trustee. The Trust, Hussman Strategic Growth Fund and Hussman Strategic Advisors may also be putative defendant class members in some of these actions. The plaintiffs in all these lawsuits seek to recover amounts paid to shareholders of Tribune Company in connection with the leveraged buyout, plus interest and attorneys’ fees and expenses.
An omnibus motion to dismiss the actions filed by the individual creditors (the “Individual Creditor Actions”), but not the action prosecuted by the Litigation Trustee for the Tribune Litigation Trust (the “Litigation Trustee Action”), was filed in November 2012. On September 23, 2013, the U.S. District Court Judge issued a decision and order dismissing the Individual Creditor Actions in full. The plaintiffs in those actions appealed that decision to the U.S. Court of Appeals for the Second Circuit and certain shareholder defendants, including each of the Hussman Entities, cross-appealed. The Second Circuit heard oral argument on November 5, 2014 and issued a unanimous decision affirming the District Court’s decision on March 29, 2016. A petition of the individual creditors for rehearing or rehearing en banc was denied by the Second
Hussman Investment Trust
Notes to Financial Statements (continued) |
June 30, 2021 |
Circuit on July 22, 2016. The individual creditors filed a petition for a writ of certiorari in the United States Supreme Court on September 9, 2016, seeking Supreme Court review of the Second Circuit decision.
On April 10, 2018, the plaintiffs in the Individual Creditor Actions filed a motion requesting that the Second Circuit recall its mandate, vacate its prior decision, and remand the actions to the District Court for further proceedings in light of the Supreme Court’s decision in Merit Management Group, LP v. FTI Consulting, Inc., No. 16-784 (U.S.) (“Merit Management”). The Second Circuit issued an order recalling the mandate “in anticipation of further panel review,” but on December 19, 2019 reaffirmed its prior decision. On February 6, 2020, Second Circuit denied a petition of the individual creditor plaintiffs for rehearing or rehearing en banc by the Second Circuit, and on July 6, 2020, the plaintiffs filed a new petition for a writ of certiorari in the Supreme Court. The Supreme Court denied the individual creditor plaintiffs’ new petition for a writ of certiorari in April 2021, and, as a result, the Second Circuit’s decision to dismiss the Individual Creditor Actions will stand.
On August 2, 2013, with the District Court’s permission, the Litigation Trustee filed an amended complaint in the Litigation Trustee Action that named Hussman Strategic Growth Fund as one of the class representatives for the putative class of shareholder defendants. A global motion to dismiss this action was filed on behalf of all shareholder defendants on May 23, 2014 and the District Court issued an opinion and order granting the motion to dismiss on January 6, 2017. The Litigation Trustee noticed an appeal from the District Court’s decision on July 15, 2019.
On July 18, 2017, the Litigation Trustee requested a pre-motion conference in the District Court on a proposed motion to amend his complaint in the Litigation Trustee Action to add a claim for constructive fraudulent conveyance against the shareholder defendants based on the Supreme Court’s decision in Merit Management. Although the District Court denied the Litigation Trustee’s motion to amend its complaint on August 24, 2017, that denial was without prejudice and the Litigation Trustee renewed the motion to amend on March 8, 2018, based on the Supreme Court’s decision in Merit Management. The District Court denied the Litigation Trustee’s renewed motion to amend on April 23, 2019, and the Litigation Trustee noticed an appeal from the District Court’s decision on July 15, 2019. That appeal was consolidated with the Litigation Trustee’s appeal of the District Court’s dismissal of the actual fraudulent transfer claims. On August 20, 2021, the Second Circuit affirmed the District Court’s decisions in both appeals.
Hussman Investment Trust
Notes to Financial Statements (continued) |
June 30, 2021 |
The lawsuits allege no misconduct by the Hussman Entities, and each of them intends to defend itself vigorously in the lawsuits. Although the outcome of these proceedings cannot be predicted, the adverse impact to Hussman Strategic Growth Fund is not expected to exceed materially the value of the proceeds received by Hussman Strategic Growth Fund in connection with the leveraged buyout, which was $29,432,814 (representing, as of June 30, 2021, approximately 7.1% of Hussman Strategic Growth Fund’s net assets), plus interest. If the proceedings are decided or settled in a manner adverse to Hussman Strategic Growth Fund, the payment of judgments or settlements by Hussman Strategic Growth Fund in connection with the proceedings could have a material adverse effect on its NAV per share.
10. SUBSEQUENT EVENTS
The Funds are required to recognize in their financial statements the effects of all subsequent events that provide additional evidence about conditions that existed as of the date of the Statements of Assets and Liabilities. For non-recognized subsequent events that must be disclosed to keep the financial statements from being misleading, the Funds are required to disclose the nature of the event as well as an estimate of its financial effect, or a statement that such an estimate cannot be made. Management has evaluated subsequent events through the date of issuance of these financial statements and has noted no such events.
Hussman Investment Trust
Report of Independent Registered
Public Accounting Firm |
To the Shareholders and Board of Trustees of
Hussman Investment Trust
Opinion on the Financial Statements
We have audited the accompanying statements of assets and liabilities, including the schedules of investments, open written options contracts, and futures contracts sold short of Hussman Investment Trust comprising Hussman Strategic Growth Fund, Hussman Strategic Allocation Fund, Hussman Strategic Total Return Fund and Hussman Strategic International Fund (the “Funds”) as of June 30, 2021, the related statements of operations and changes in net assets, the related notes, and the financial highlights for the year then ended (collectively referred to as the “financial statements”). In our opinion, the financial statements present fairly, in all material respects, the financial position of each of the Funds as of June 30, 2021, the results of their operations, changes in net assets, and the financial highlights for the year then ended, in conformity with accounting principles generally accepted in the United States of America.
The Funds’ financial statements and financial highlights for the periods ended June 30, 2020, and prior, were audited by other auditors whose report dated August 20, 2020, expressed an unqualified opinion on those financial statements and financial highlights.
Basis for Opinion
These financial statements are the responsibility of the Funds’ management. Our responsibility is to express an opinion on the Funds’ financial statements based on our audit. We are a public accounting firm registered with the Public Company Accounting Oversight Board (United States) (“PCAOB”) and are required to be independent with respect to the Funds in accordance with the U.S. federal securities laws and the applicable rules and regulations of the Securities and Exchange Commission and the PCAOB.
We conducted our audit in accordance with the standards of the PCAOB. Those standards require that we plan and perform the audit to obtain reasonable assurance about whether the financial statements are free of material misstatement whether due to error or fraud.
Our audit included performing procedures to assess the risks of material misstatement of the financial statements, whether due to error or fraud, and performing procedures that respond to those risks. Such procedures included examining, on a test basis, evidence regarding the amounts and disclosures in the financial statements. Our procedures
Hussman Investment Trust
Report of Independent Registered
Public Accounting Firm (continued) |
included confirmation of securities owned as of June 30, 2021, by correspondence with the custodian and brokers. Our audit also included evaluating the accounting principles used and significant estimates made by management, as well as evaluating the overall presentation of the financial statements. We believe that our audit provides a reasonable basis for our opinion.
We have served as the Funds’ auditor since 2021.
COHEN & COMPANY, LTD.
Milwaukee, Wisconsin
August 20, 2021
Hussman Investment Trust
About Your Funds’ Expenses (Unaudited) |
|
We believe it is important for you to understand the impact of costs on your investment. As a shareholder of the Funds, you incur two types of costs: (1) transaction costs, which may include redemption fees; and (2) ongoing costs, including management fees and other Fund expenses. The following examples are intended to help you understand your ongoing costs (in dollars) of investing in the Funds and to compare these costs with the ongoing costs of investing in other mutual funds. A mutual fund’s ongoing costs are expressed as a percentage of its average net assets. This figure is known as the expense ratio.
The examples below are based on an investment of $1,000 made at the beginning of the period shown and held for the entire period (January 1, 2021 – June 30, 2021).
The table on the following page illustrates each Fund’s ongoing costs in two ways:
Actual fund return – This section helps you to estimate the actual expenses that you paid over the period. The “Ending Account Value” shown is derived from each Fund’s actual return, and the fourth column shows the dollar amount of operating expenses that would have been paid by an investor who started the period with $1,000 invested in that Fund. You may use that information, together with the amount of your investment, to estimate the expenses that you paid over the period.
To do so, simply divide your account value by $1,000 (for example, an $8,600 account value divided by $1,000 = 8.6), and then multiply the result by the number given for the applicable Fund under the heading “Expenses Paid During Period.”
Hypothetical 5% return – This section is intended to help you compare each Fund’s ongoing costs with those of other mutual funds. It assumes that each Fund had an annual return of 5% before expenses during the period shown. In this case, because the return used is not each Fund’s actual return, the results do not illustrate the actual expenses associated with your investment. However, the example is useful in making comparisons because the Securities and Exchange Commission (the “SEC”) requires all mutual funds to provide an example of fund expenses based on a 5% annual return. You can assess each Fund’s ongoing costs by comparing this hypothetical example with the hypothetical examples that appear in shareholder reports of other mutual funds.
Note that expenses shown in the table are meant to highlight and help you compare ongoing costs only. The expense ratios used in computing annual expenses in the tables are the expense ratios of the Funds during the six-month period ended June 30, 2021, annualized, after fee waivers and expense reimbursements. Actual expenses of the
Hussman Investment Trust
About Your Funds’ Expenses (Unaudited) (continued) |
|
Funds in future periods may differ. The calculations assume no shares were bought or sold during the period. Your actual costs may have been higher or lower, depending on the amount of your investment and the timing of any purchases or redemptions.
More information about each Fund’s expenses, including annual expense ratios, can be found elsewhere in this report. For additional information on operating expenses and other shareholder costs, please refer to each Fund’s prospectus.
| Beginning
Account Value
January 1, 2021 | Ending
Account Value
June 30, 2021 | Net
Expense
Ratio(a) | Expenses
Paid During
Period(b) |
Hussman Strategic Growth Fund |
Based on Actual Fund Return | $ 1,000.00 | $ 1,102.60 | 1.15% | $ 6.00 |
Based on Hypothetical 5% Return (before expenses) | $ 1,000.00 | $ 1,019.09 | 1.15% | $ 5.76 |
Hussman Strategic Allocation Fund |
Based on Actual Fund Return | $ 1,000.00 | $ 1,118.50 | 1.25% | $ 6.57 |
Based on Hypothetical 5% Return (before expenses) | $ 1,000.00 | $ 1,018.60 | 1.25% | $ 6.26 |
Hussman Strategic Total Return Fund |
Based on Actual Fund Return | $ 1,000.00 | $ 1,010.30 | 0.75% | $ 3.74 |
Based on Hypothetical 5% Return (before expenses) | $ 1,000.00 | $ 1,021.08 | 0.75% | $ 3.76 |
Hussman Strategic International Fund |
Based on Actual Fund Return | $ 1,000.00 | $ 994.20 | 2.00% | $ 9.89 |
Based on Hypothetical 5% Return (before expenses) | $ 1,000.00 | $ 1,014.88 | 2.00% | $ 9.99 |
(a) | Annualized, based on each Fund’s most recent one-half year expenses. |
(b) | Expenses are equal to each Fund’s annualized net expense ratio multiplied by the average account value over the period, multiplied by 181/365 (to reflect the one-half year period). |
Hussman Investment Trust
Board of Trustees and Officers (Unaudited) |
|
Overall responsibility for supervision of management of the Funds rests with the Board of Trustees. The Trustees serve during the lifetime of the Trust and until its termination, or until death, resignation, retirement or removal. The Trustees, in turn, elect the officers of the Trust to supervise the day-to-day operations of the Funds. The officers are elected for annual terms. The following are the Trustees and executive officers of the Trust:
Trustee | Address | Age | Position Held
with the Trust | Length of
Time Served |
*John P. Hussman, Ph. D. | 6021 University Boulevard, Suite 490
Ellicott City, MD 21043 | 58 | President and Trustee | Since
June 2000 |
David C. Anderson | 225 Pictoria Drive
Cincinnati, OH 45246 | 70 | Trustee | Since
June 2000 |
Jody T. Foster | 225 Pictoria Drive
Cincinnati, OH 45246 | 52 | Trustee | Since
June 2016 |
William H. Vanover | 225 Pictoria Drive
Cincinnati, OH 45246 | 74 | Trustee | Since
June 2000 |
Mark J. Seger | 225 Pictoria Drive
Cincinnati, OH 45246 | 59 | Treasurer | Since
June 2000 |
John F. Splain | 225 Pictoria Drive
Cincinnati, OH 45246 | 64 | Secretary and Chief Compliance Officer | Since
June 2000 |
* | Dr. Hussman, as an affiliated person of the Adviser, is an “interested person” of the Trust within the meaning of Section 2(a)(19) of the 1940 Act. |
Each Trustee oversees four portfolios of the Trust. The principal occupations during the past five years of the Trustees and executive officers of the Trust and public directorships (if any) currently held by the Trustees are set forth below:
John P. Hussman, Ph.D. is Chairman, President and Treasurer of the Adviser.
David C. Anderson is retired. Prior to July 9, 2021, he was Network Administrator for Hephzibah Children’s Association (a child welfare organization).
Jody T. Foster is President of Symphony Consulting LLC (a provider of compliance, finance, marketing, operations and human resources services to public and private fund advisers).
Hussman Investment Trust
Board of Trustees and Officers (Unaudited) (continued) |
|
William H. Vanover is retired. Prior to June 30, 2018, he was an investment counselor with Planning Alternatives, Ltd. (a registered investment adviser).
Mark J. Seger is Vice Chairman of Ultimus Fund Solutions, LLC (the Trust’s administrator and transfer agent) and affiliated companies. He was previously Co-CEO of Ultimus Fund Solutions, LLC (1999-2019).
John F. Splain is an Executive Vice President of Ultimus Fund Solutions, LLC.
Additional information about members of the Board of Trustees and executive officers of the Trust is available in the Statement of Additional Information (“SAI”) of each Fund. To obtain a free copy of the SAI, please call 1-800-487-7626.
Hussman Investment Trust
Other Information (Unaudited) |
|
A description of the policies and procedures the Funds use to determine how to vote proxies relating to portfolio securities is available without charge upon request by calling toll-free 1-800-HUSSMAN (1-800-487-7626), or on the SEC’s website at www.sec.gov. Information regarding how the Funds voted proxies relating to portfolio securities during the most recent 12-month period ended June 30 is also available without charge upon request by calling toll-free 1-800-HUSSMAN, or on the SEC’s website at www.sec.gov.
Each Fund files a complete listing of portfolio holdings with the SEC as of the end of the first and third quarters of each fiscal year as an exhibit to each Fund’s Form N-PORT. The filings are available upon request, by calling 1-800-HUSSMAN (1-800-487-7626). You may also obtain copies of these filings on the SEC’s website at www.sec.gov.
Federal Tax Information (Unaudited)
|
|
In accordance with federal tax requirements, the following provides shareholders with information concerning distributions from ordinary income made by the Funds during the fiscal year ended June 30, 2021. Certain dividends paid by the Funds may be subject to a maximum tax rate of 23.8%. Hussman Strategic Growth Fund, Hussman Strategic Allocation Fund, Hussman Strategic Total Return Fund and Hussman Strategic International Fund intend to designate up to a maximum amount of $509,834, $510,051, $2,788,362 and $193,735, respectively, as taxed at a maximum rate of 23.8%. For the fiscal year ended June 30, 2021, 100%, 8%, 31% and 0% of the dividends paid from ordinary income by Hussman Strategic Growth Fund, Hussman Strategic Allocation Fund, Hussman Strategic Total Return Fund and Hussman Strategic International Fund, respectively, qualified for the dividends received deduction for corporations.
As required by federal regulations, the Trust will send to each shareholder complete information regarding dividends and other distributions of the Funds for 2021 on Form 1099-DIV.
Hussman Investment Trust
Approval of Investment Advisory Agreements |
(Unaudited) |
At a meeting held on June 3, 2021, the Board of Trustees (the “Board”) of Hussman Investment Trust, including the Trustees who are not “interested persons,” as defined by the Investment Company Act of 1940, of the Trust (the “Independent Trustees”) voting separately, reviewed and unanimously approved the continuance, for an additional annual period, of the Investment Advisory Agreements between the Trust and Hussman Strategic Advisors, Inc. (the “Adviser”) on behalf of each of Hussman Strategic Growth Fund (the “Growth Fund”), Hussman Strategic Allocation Fund (the “Allocation Fund”), Hussman Strategic Total Return Fund (the “Total Return Fund”) and Hussman Strategic International Fund (the “International Fund,” and together with the Growth Fund, the Allocation Fund and the Total Return Fund, the “Funds”).
In determining whether to approve continuances of the Investment Advisory Agreements of the Funds (the “Advisory Agreements”), the Independent Trustees requested and received from the Adviser such information as they deemed reasonably necessary to evaluate the terms of the Advisory Agreements and to assess whether the Advisory Agreements continue to be in the best interests of the Funds and their shareholders. In addition to reviewing and considering this information, the Independent Trustees considered information relating to the Funds and the Adviser that was provided to them in connection with meetings of the Board held throughout the year. They reviewed and considered, among other things: (i) the nature, extent and quality of the services provided by the Adviser to each of the Funds; (ii) the investment performance of each of the Funds; (iii) comparisons of the advisory fees and expenses of the Funds to the fees and expenses of peer groups of mutual funds; (iv) the Adviser’s costs of providing services to the Funds and the profits realized by the Adviser from its relationship with the Funds; (v) whether economies of scale in the Adviser’s costs of providing services have been realized from growth of the Funds’ assets; and (vi) whether the advisory fees payable by each Fund reflect an appropriate sharing of any such economies with such Fund for the benefit of the Fund and its shareholders. The Independent Trustees also reviewed the background, qualifications, education and experience of the Adviser’s investment professionals and support personnel, and discussed and considered: (i) the quality of shareholder communications, administrative functions and other services provided by the Adviser to the Trust and each of the Funds; (ii) the quality of the Adviser’s compliance program; (iii) the Adviser’s role in coordinating and supervising services provided to the Trust; and (iv) indirect benefits, if any, that the Adviser may derive from its relationship with the Funds. The Independent Trustees were advised and supported in this process by independent legal counsel and, prior to voting, met with and asked questions of representatives of the Adviser, including Dr. John Hussman, and met separately with their counsel.
Hussman Investment Trust
Approval of Investment Advisory Agreements |
(Unaudited) (continued) |
The Adviser provided the Independent Trustees with extensive information to assist them in analyzing both the absolute and risk-adjusted returns of the Funds over various periods. In these materials, the returns of each Fund were compared to the returns of relevant indices and to the average returns of one or more selected peer groups of mutual funds.
The analyses and comparisons provided by the Adviser showed that during the most recent period of market volatility measured from the February 19, 2020 pre-pandemic peak of the S&P 500 Index to its subsequent record high on May 7, 2021, the Growth Fund gained 27.64%, compared with a total return of 27.61% for the Index. The deepest interim loss experienced by the Growth Fund during this period was -6.98%, compared with an interim loss of -33.79% for the S&P 500 Index. The Growth Fund underperformed the S&P 500 Index for the one year period ended April 30, 2021, returning 11.18% versus a return of 45.98% for the Index for that period, as the Index recovered from its first quarter 2020 loss. The information provided further showed that, since its inception on July 24, 2000 through April 30, 2021, the Growth Fund generated an average annual total return of 0.78%, compared with an average annual total return of 7.25% for the S&P 500 Index for that period. However, the analyses also showed that, since inception, the Growth Fund’s hedging strategies have generally been successful in reducing the volatility of an investment in the Fund as compared to the volatility of relevant securities indices. The Independent Trustees observed that, although the Growth Fund underperformed the S&P 500 Index from 2009 to date, this period has represented a largely uncorrected advance to historic valuation extremes, that the Fund’s outperformance of the Index prior to 2009 was substantial, and that the Fund’s return/risk characteristics have been well-aligned with its investment objectives during the most recent period of market volatility since the February 19, 2020 pre-pandemic peak in the Index. They reviewed the Growth Fund’s performance over various periods as compared to the performance of mutual funds categorized by Morningstar, Inc. as U.S. Market Neutral and U.S. Long-Short Equity. They recognized that the Fund’s performance during various recent multi-year periods lagged the average performance of these other mutual funds. Information provided to the Board indicated that, over the long term, the Adviser’s stock selection record for the Growth Fund has been very good and that the underperformance of the Fund in recent years is largely attributable to the Fund’s use of hedging techniques and the nature of the Fund’s alternative investment approach, which is not intended to track general stock market movements. In evaluating the Growth Fund’s investment performance, the Independent Trustees recognized that the use of hedging is an integral part of the Fund’s investment program and that, although this has caused the Fund’s significant underperformance since 2009, the Adviser has managed the investment portfolio
Hussman Investment Trust
Approval of Investment Advisory Agreements |
(Unaudited) (continued) |
of the Growth Fund in a manner consistent with the Fund’s investment objective and policies, and with the Adviser’s investment methodology, as described in the Fund’s prospectus. The Independent Trustees also recognized that the Adviser has adapted and refined the models and analytics it uses in managing the Growth Fund in seeking to address the Fund’s underperformance and noted that the Adviser has from time to time implemented various modifications in its analytics and restrictions in its hedging approach with the goals of improving the investment performance of the Fund over the long term and reducing the risks and costs of its hedging strategy.
With respect to the Allocation Fund, the Independent Trustees took note of the fact that from the pre-pandemic peak of the S&P 500 Index on February 19, 2020 to its recent record high on May 7, 2020, the Fund gained 21.33%, compared with a gain of 18.55% for a benchmark fixed-allocation portfolio invested 60% in the S&P 500 Index, 30% in the Bloomberg U.S. Treasury Total Return Index, and 10% in the Bloomberg Barclays U.S. Treasury Bills Index. The deepest interim loss experienced by the Allocation Fund during this period was -2.81%, compared with -19.93% for the benchmark fixed-allocation portfolio. The Fund’s average annual total return of 11.01% from inception on August 27, 2019 through April 30, 2021 lagged the 17.48% average annual total return of the benchmark fixed-allocation portfolio during the same period. In their consideration of the Allocation Fund’s performance, the Independent Trustees noted that the Fund has maintained a defensive stance since inception (with a significant portion of the Fund’s stock portfolio hedged against general market fluctuations) and that the Fund has experienced significantly less downside risk than a passive investment approach, although the Fund has not been in existence long enough to evaluate its investment performance over a full market cycle.
In reviewing the performance of the Total Return Fund, the Independent Trustees took note of the fact that the Fund outperformed the Bloomberg Barclays U.S. Aggregate Bond Index for the one year period ended April 30, 2021, returning 3.26% versus a return of –0.27% for the Index. They also considered that the Total Return Fund’s average annual total return of 4.96% since its inception on September 12, 2002 through April 30, 2021 compares favorably to the 4.19% average annual total return of the Bloomberg Barclays U.S. Aggregate Bond Index for that period. In addition, the Independent Trustees reviewed comparisons of the performance of the Total Return Fund for various periods to the performance of mutual funds categorized by Morningstar as U.S. Allocation (15% to 30% Equity), U.S. Tactical Allocation and U.S. Multisector Bond. They noted that the performance of the Total Return Fund for the one year period ended April 30, 2021 lagged the average performance of funds
Hussman Investment Trust
Approval of Investment Advisory Agreements |
(Unaudited) (continued) |
included by Morningstar in each of these categories, but also noted that the Fund’s performance over longer periods (3-, 5- and 10-year periods ended April 30, 2021, as well as since inception of the Fund) has been competitive with such averages.
With respect to the International Fund, the Independent Trustees took note of the fact that the Fund lagged the MSCI Europe, Australasia, Far East (“EAFE”) Index for the one year period ended April 30, 2021, returning 5.01% versus a return of 39.88% for the Index. They also considered the fact that the International Fund’s average annual total return of –0.69% since its inception on December 31, 2009 through April 30, 2021 lagged the 6.14% average annual total return of the MSCI EAFE Index for that period. In addition, the Independent Trustees compared the International Fund’s performance over various periods to mutual funds categorized by Morningstar as U.S. Market Neutral, U.S. Long-Short Equity and Foreign Large Blend. They recognized that the Fund’s performance during the one year period ended April 30, 2021 and during various multi-year periods then ended lagged the average performance of these other mutual funds. In their evaluation of the investment performance of the International Fund, the Independent Trustees observed that, since its inception, the Fund has maintained a defensive investment position in which it has been substantially fully hedged against the impact of general market fluctuations. They also observed, however, that the International Fund has experienced considerably less downside risk since its inception than would have resulted from use of a passive investment approach. The Independent Trustees noted that the Fund has not been in existence for a full market cycle, making it difficult to evaluate the Fund’s long-term investment performance relative to its investment objective.
In evaluating the advisory fees payable by the Funds and the Funds’ expense ratios, the Independent Trustees reviewed comparative expense and advisory fee information for peer groups of mutual funds based on investment style.
With respect to advisory fees, the Independent Trustees concluded that the advisory fee of the Growth Fund, computed at the annual rate of 0.90% of average daily net assets (based on the Fund’s then current asset level), compares favorably to the average advisory fees payable by mutual funds categorized by Morningstar as U.S. Long-Short Equity or U.S. Market Neutral. The Independent Trustees also reviewed comparative advisory fee information for the Allocation Fund, computed at the annual rate of 0.75% of average daily net assets (based on the Fund’s then current asset level), and noted that the advisory fee of the Fund is within the range of advisory fees of other funds of similar size investing in similar securities. With respect to the Total Return Fund, the Independent Trustees concluded that the advisory fee of the Fund, computed at the annual rate of 0.50% of average daily net assets (based on
Hussman Investment Trust
Approval of Investment Advisory Agreements |
(Unaudited) (continued) |
the Fund’s then current asset level), compares favorably to the average of advisory fees of other funds of similar size investing in similar securities. The Independent Trustees observed that the advisory fee of the International Fund, computed at the annual rate of 0.95% of average daily net assets (based on the Fund’s then current asset level), is higher than the advisory fee rates of most other international stock funds, but noted that the Fund’s fee rate is less than the average advisory fee rates payable by mutual funds categorized by Morningstar as U.S. Long-Short Equity or U.S. Market Neutral. They noted in this regard that, unlike many international stock funds and similar to “long-short” and “market neutral” mutual funds, the International Fund employs an investment strategy that incorporates risk management and hedging techniques. Thus, the Independent Trustees concluded that the advisory fee payable by the International Fund is appropriate. With respect to each of the Funds, the Independent Trustees determined that the fees payable to the Adviser appropriately reflect the nature and scope of services provided by the Adviser (which are broader than the norm) and the value to the Funds of the Adviser’s experience, expertise and analytic capabilities. They also determined that the advisory fee schedules of the Funds, which include breakpoints in the fee rates applicable to net assets in excess of specified levels, provide the opportunity for each of the Funds and its shareholders to participate in economies of scale in the Adviser’s costs of providing services that may be associated with potential future growth of the Funds’ assets.
With respect to the total expenses of the Funds, the Independent Trustees considered the fact that the expense ratios of the Growth Fund and the Total Return Fund, both before and after advisory fee reductions pursuant to the Adviser’s agreement to waive its fees or to absorb expenses of the Funds as necessary to maintain the operating expenses of the Funds (excluding acquired fund fees and expenses, brokerage commissions, taxes, interest expense and any extraordinary expenses) at specified levels, are less than the averages for their respective peer group funds. They noted in this regard that the Growth Fund has one of the lowest expense ratios among mutual funds categorized by Morningstar as U.S. Long-Short Equity or U.S. Market Neutral. They further noted that, notwithstanding the significant decline in the net assets of the Growth Fund in recent years, the expense ratio of the Fund (after fee waivers) has not increased significantly and, in addition, that the Fund has continued to benefit from reductions in the contractual fee rates payable pursuant to its Advisory Agreement that were implemented when the Fund’s assets were substantially greater. With respect to the Total Return Fund, the Independent Trustees noted that the Fund’s expense ratio is less than the average expense ratio of mutual funds categorized by Morningstar as U.S. Tactical Allocation or U.S. Multisector Bond. They also noted that, from time to time since each such Fund’s inception, its expense ratio was reduced
Hussman Investment Trust
Approval of Investment Advisory Agreements |
(Unaudited) (continued) |
through the introduction of advisory fee breakpoints. In addition, the Independent Trustees considered the fact that, since March 2013, the Adviser has contractually been waiving a portion of its fees to reduce the total ordinary operating expenses of the Growth Fund and the Total Return Fund, and most recently has agreed to waive its advisory fees or to absorb operating expenses of these Funds, until at least November 1, 2021, to the extent necessary to limit the total annual operating expenses of the Growth Fund and the Total Return Fund (excluding acquired fund fees and expenses, brokerage commissions, taxes, interest expense and any extraordinary expenses) to 1.15% and 0.75%, respectively, of average daily net assets.
The Independent Trustees also reviewed comparative information relating to the total expenses of the Allocation Fund and the International Fund. They noted that the expense ratios of the Allocation Fund and the International Fund are higher than many other mutual funds that have similar investment strategies. However, the Independent Trustees considered the fact that the higher expense ratios are attributable, in part, to the relatively small size of those Funds and took into consideration the expense limitation arrangements under which the Adviser has contractually agreed to waive its advisory fees or to absorb operating expenses of these Funds, until at least November 1, 2021, to the extent necessary to limit total annual ordinary operating expenses of the Allocation Fund and the International Fund (excluding acquired fund fees and expenses, brokerage commissions, taxes, interest expense and any extraordinary expenses) to 1.25% and 2.00%, respectively, of average daily net assets.
In evaluating the expense ratios of the Funds, the Independent Trustees recognized that, although under the expense limitation agreements currently in effect the Adviser may be entitled to be reimbursed by a Fund for all or a portion of fees waived and expenses absorbed by the Adviser, any such reimbursement could not result in the expense ratio of a Fund (excluding acquired fund fees and expenses, brokerage commissions, taxes, interest expense and any extraordinary expenses) exceeding the lesser of: (i) the expense limitation in effect for the Fund at the time of the fee waiver or expense absorption by the Adviser; and (ii) the expense limitation (if any) in effect at the time of reimbursement by the Fund. The Independent Trustees were cognizant of the fact that the current expense limitation agreement for each Fund remains in effect only until November 1, 2021, but recognized that the Adviser has historically agreed to continuing such agreements in effect from year to year (either without change or with only relatively minor upward adjustment in the applicable expense limitation). The Independent Trustees concluded that each Fund has benefited and continues to benefit from these expense limitation arrangements, which have enabled each Fund to maintain an expense ratio within the expense ratios of its peer group funds.
Hussman Investment Trust
Approval of Investment Advisory Agreements |
(Unaudited) (continued) |
The Independent Trustees also reviewed recent financial statements of the Adviser, as well as schedules showing the Adviser’s estimated revenues, expenses and profitability with respect to each of the Funds for calendar years 2018, 2019 and 2020 and for the first four months of 2021. They noted that the Adviser has waived its fees (and, in some cases, absorbed expenses of a Fund), thereby reducing its profitability, pursuant to expense limitation agreements. They recognized that, although the Adviser has realized significant profits over the years from its advisory relationship with each Fund and that the Adviser’s profit margins associated with providing services to each Fund have been significant at times, the Adviser’s profitability with respect to each of the Funds was not excessive when viewed in light of the scope of services provided by the Adviser and the Adviser’s adherence to its stated investment philosophy and the investment programs of the Funds. The Independent Trustees also recognized that the Adviser’s profitability with respect to the Funds has declined considerably in recent years as a consequence of declines in the total net assets of the Funds. In evaluating the Adviser’s profitability, the Independent Trustees considered the broad and unique skill set and talent of the Adviser that is required for the Adviser to pursue and to adhere to the Funds’ well-defined and disciplined investment programs, which has been a primary attraction of the Funds to investors. They determined that, notwithstanding a decline in the Adviser’s revenues and the resulting decrease in its profitability, the Adviser has available financial resources sufficient to enable it to continue to provide all required services to the Funds, without diminution of service quality, and that, to the extent declines in the net assets of the Funds prior to 2020 reduced (or may in the future reduce further) the Adviser’s revenues, the Adviser has been able (and is expected to be able) to reduce its expenses or access capital resources so as to enable the scope and quality of services provided to the Funds to be maintained.
Based on a careful review of the investment performance and risk characteristics of the Funds and consideration of other matters deemed by them to be pertinent (including, but not limited to, the factors and information discussed above), the Independent Trustees concluded that the Adviser has provided all required services to the Funds in a satisfactory manner. They determined that this conclusion is supported by the nature and scope of advisory services required by the Funds, which are broader and more sophisticated than those required by many other mutual funds due to the nature of the Funds’ investment programs and which involve extensive use of risk-management techniques. The Independent Trustees also considered the fact that the Adviser has generally achieved lower volatility of investment returns for the Funds than would have resulted from use of a passive investment approach. They recognized that challenges associated with the Adviser’s hedging approach have reduced the returns of the Growth Fund and the International Fund in the period since 2009, but
Hussman Investment Trust
Approval of Investment Advisory Agreements |
(Unaudited) (continued) |
noted that the Adviser has implemented meaningful changes in its methodologies since 2009 that may operate to reduce the frequency of similar challenges in future market cycles while maintaining the favorable attributes that the Adviser’s hedging strategies exhibited in the years prior to 2009. In this regard, the Independent Trustees specifically considered the fact that the investment performance of the Growth Fund and the International Fund has in recent years prior to 2020 generally been disappointing, and they considered whether, under such circumstances, it would be appropriate and consistent with their duties and the interests of the Funds to approve the continuance of each of the Advisory Agreements, as proposed.
The Independent Trustees concluded that the Adviser has consistently taken a proactive stance with regard to shareholder protections, service quality and ethical standards. Among other things, they noted that the Adviser: (i) does not derive any material indirect benefits from its relationship with the Funds; (ii) does not derive any economic benefit in connection with transactions in shares of the Funds; and (iii) adheres to a brokerage placement policy that seeks to obtain best execution and low commissions on all of the Funds’ brokerage transactions and does not direct transactions to obtain “soft dollar” services, which has resulted in significant savings to the Funds and their shareholders by reducing transaction costs (which are not reflected in the expense ratios of the Funds) and has operated to increase the Funds’ investment performance after expenses. The Independent Trustees thought it was significant that Dr. John Hussman and other personnel of the Adviser, and their immediate family members and charitable entities, maintain substantial investments in the Funds, which helps to align the interests of the Adviser and its personnel with the interests of shareholders.
After evaluating all pertinent factors and information (including but not limited to the factors and information discussed above), the Board determined that the fees payable by each Fund pursuant to the Advisory Agreements are appropriate in view of the nature, scope and quality of services provided by the Adviser, and further determined that continuances of the Advisory Agreements are in the best interests of the Funds and their shareholders. Accordingly, the Board voted unanimously to approve the continuance of each of the Advisory Agreements for an additional annual period. No single factor was considered in isolation or to be determinative to this decision.
Hussman Investment Trust
Discussion of Liquidity Risk Management Program |
(Unaudited) |
As required by Rule 22e-4 under the 1940 Act, the Trust has adopted a liquidity risk management program (the “Program”) and has designated persons to be responsible for administering the Program (the “Program Administrators”). In connection with its meeting on June 3, 2021, the Board was presented with and considered a written report from the Program Administrators addressing the operation of the Program and assessing its adequacy and the effectiveness of its implementation. The Program Administrators took into account the liquidity of each Fund in relation to its investment strategies, short-term and long-term cash flow projections, borrowing arrangements and cash positions. Based upon these and other pertinent factors, the Program Administrators determined that each of the Funds primarily holds highly liquid securities, and that there has been no unusual stress or disruption from any redemption activity since the implementation of the Program.
The Program Administrators concluded that the Program is reasonably designed and has been effectively implemented. They further concluded that the combination of the diversification of portfolio holdings, the Adviser’s ability to execute trades without significant cost impact, the infrequency of significant daily redemptions, and the record of each Fund’s daily holdings of cash and cash equivalents, mitigate against the risk that a Fund would be unable to meet a shareholder request to redeem shares without significant dilution of the interests of remaining investors in the Fund. Despite the uncertainty and market volatility arising as a consequence of the COVID-19 pandemic, the Funds have not experienced execution or settlement issues with respect to their portfolio trades.
THIS PAGE INTENTIONALLY LEFT BLANK.
THIS PAGE INTENTIONALLY LEFT BLANK.
THIS PAGE INTENTIONALLY LEFT BLANK.

INVESTMENT ADVISER
Hussman Strategic Advisors, Inc.
6021 University Boulevard, Suite 490
Ellicott City, Maryland 21043
www.hussmanfunds.com
1-800-HUSSMAN (1-800-487-7626)
ADMINISTRATOR/TRANSFER AGENT
Ultimus Fund Solutions, LLC
225 Pictoria Drive, Suite 450
Cincinnati, Ohio 45246
CUSTODIAN
U.S. Bank, N.A.
425 Walnut Street
Cincinnati, Ohio 45202
INDEPENDENT REGISTERED
PUBLIC ACCOUNTING FIRM
Cohen & Company, Ltd.
342 N. Water Street
Suite 830
Milwaukee, Wisconsin 53202
LEGAL COUNSEL
Schulte Roth & Zabel LLP
901 Fifteenth Street, NW
Suite 800
Washington, DC 20005
This Report is authorized for
distribution only if accompanied or preceded
by a current Prospectus of the Funds.
Hussman-AR-21
Item 2. Code of Ethics.
As of the end of the period covered by this report, the registrant has adopted a code of ethics that applies to the registrant’s principal executive officer, principal financial officer, principal accounting officer or controller, or persons performing similar functions, regardless of whether these individuals are employed by the registrant or a third party. Pursuant to Item 13(a)(1), a copy of registrant’s code of ethics is filed as an exhibit to this Form N-CSR. During the period covered by this report, the code of ethics has not been amended, and the registrant has not granted any waivers, including implicit waivers, from the provisions of the code of ethics.
Item 3. Audit Committee Financial Expert.
The registrant’s board of trustees has determined that the registrant does not have an audit committee financial expert serving on its audit committee. The audit committee determined that, although none of its members meet the technical definition of an audit committee financial expert, the members have sufficient financial expertise to address any issues that are likely to come before the committee. After evaluation of the accounting environment within which the registrant operates, it was the consensus of the audit committee members that it is not necessary at the present time for the committee to seek to recruit an additional trustee who would qualify as an audit committee financial expert. It was the view of the committee that, if novel issues ever arise, it will hire an expert to assist it as needed.
Item 4. Principal Accountant Fees and Services.
| (a) | Audit Fees. The aggregate fees billed for professional services rendered by the principal accountant for the audit of the registrant’s annual financial statements or for services that are normally provided by the accountant in connection with statutory and regulatory filings or engagements were $60,000 and $137,000 with respect to the registrant’s fiscal years ended June 30, 2021 and 2020, respectively. |
| (b) | Audit-Related Fees. No fees were billed during the fiscal years ended June 30, 2021 and 2020 for assurance and related services by the principal accountant that are reasonably related to the performance of the audit of the registrant’s financial statements and are not reported under paragraph (a) of this Item. |
| (c) | Tax Fees. The aggregate fees billed for professional services rendered by the principal accountant for tax compliance, tax advice, and tax planning were $16,000 and $33,600 with respect to the registrant’s fiscal years ended June 30, 2021 and 2020, respectively. The services comprising these fees include the preparation of the registrant’s federal income tax returns and the preparation of the Funds’ excise tax returns (which includes review of the Funds’ required distributions). |
| (d) | All Other Fees. No fees were billed in either of the last two fiscal years for products and services provided by the principal accountant, other than the services reported in paragraphs (a) through (c) of this Item. |
| (e)(1) | The audit committee has adopted pre-approval policies and procedures described in paragraph (c)(7) of Rule 2-01 of Regulation S-X. Pursuant to the pre-approval policies and procedures, the audit committee has pre-approved certain audit, audit-related and tax services and has established, with respect to each fiscal year of the registrant, the following maximum fee levels for services covered under the pre-approval policies and procedures: |
| · | Services associated with SEC registration statements filed by the registrant with the SEC or other documents issued by the registrant in connection with securities offerings and assistance in responding to SEC comment letters – $6,000 |
| · | Consultations with management of the registrant as to the accounting or disclosure treatment of transactions or events and/or the actual or potential impact of final or proposed rules, standards or interpretations by the SEC, PCAOB or other regulatory or standard setting bodies – $6,000 |
| · | All additional tax services provided to the registrant in the aggregate – $6,000 |
| (e)(2) | None of the services described in paragraph (b) through (d) of this Item were approved by the audit committee pursuant to paragraph (c)(7)(i)(C) of Rule 2-01 of Regulation S-X. |
| (f) | Less than 50% of hours expended on the principal accountant’s engagement to audit the registrant’s financial statements for the most recent fiscal year were attributed to work performed by persons other than the principal accountant’s full-time, permanent employees. |
| (g) | During the fiscal years ended June 30, 2021 and 2020, aggregate non-audit fees of $16,000 and $33,600, respectively, were billed by the registrant’s principal accountant for services rendered to the registrant. No non-audit fees were billed in either of the last two fiscal years by the registrant’s principal accountant for services rendered to the registrant’s investment adviser (not including any sub-adviser whose role is primarily portfolio management and is subcontracted with or overseen by another investment adviser), and any entity controlling, controlled by, or under common control with the adviser that provides ongoing services to the registrant. |
| (h) | The principal accountant has not provided any non-audit services to the registrant’s investment adviser (not including any sub-adviser whose role is primarily portfolio management and is subcontracted with or overseen by another investment adviser), and any entity controlling, controlled by, or under common control with the investment adviser that provides ongoing services to the registrant. |
Item 5. Audit Committee of Listed Registrants.
Not applicable
Item 6. Investments.
| (a) | Not applicable [schedule filed with Item 1] |
Item 7. Disclosure of Proxy Voting Policies and Procedures for Closed-End Management Investment Companies.
Not applicable
Item 8. Portfolio Managers of Closed-End Management Investment Companies
Not applicable
Item 9. Purchases of Equity Securities by Closed-End Management Investment Company and Affiliated Purchasers.
Not applicable
Item 10. Submission of Matters to a Vote of Security Holders.
The registrant has not adopted procedures by which shareholders may recommend nominees to the registrant’s board of trustees.
Item 11. Controls and Procedures.
(a) Based on their evaluation of the registrant’s disclosure controls and procedures (as defined in Rule 30a-3(c) under the Investment Company Act of 1940) as of a date within 90 days of the filing date of this report, the registrant’s principal executive officer and principal financial officer have concluded that such disclosure controls and procedures are reasonably designed and are operating effectively to ensure that material information relating to the registrant, including its consolidated subsidiaries, is made known to them by others within those entities, particularly during the period in which this report is being prepared, and that the information required in filings on Form N-CSR is recorded, processed, summarized, and reported on a timely basis.
(b) There were no changes in the registrant’s internal control over financial reporting (as defined in Rule 30a-3(d) under the Investment Company Act of 1940) that occurred during the period covered by this report that have materially affected, or are reasonably likely to materially affect, the registrant’s internal control over financial reporting.
Item 12. Disclosure of Securities Lending Activities for Closed-End Management Investment Companies.
Not applicable
Item 13. Exhibits.
File the exhibits listed below as part of this Form. Letter or number the exhibits in the sequence indicated.
(a)(1) Any code of ethics, or amendment thereto, that is the subject of the disclosure required by Item 2, to the extent that the registrant intends to satisfy the Item 2 requirements through filing of an exhibit: Attached hereto
(a)(2) A separate certification for each principal executive officer and principal financial officer of the registrant as required by Rule 30a-2(a) under the Act (17 CFR 270.30a-2(a)): Attached hereto
(a)(3) Any written solicitation to purchase securities under Rule 23c-1 under the Act (17 CFR 270.23c-1) sent or given during the period covered by the report by or on behalf of the registrant to 10 or more persons: Not applicable
(a)(4) Change in the registrant’s independent public accountant: Attached hereto
(b) Certifications required by Rule 30a-2(b) under the Act (17 CFR 270.30a-2(b)): Attached hereto
SIGNATURES
Pursuant to the requirements of the Securities Exchange Act of 1934 and the Investment Company Act of 1940, the registrant has duly caused this report to be signed on its behalf by the undersigned, thereunto duly authorized.
| (Registrant) | Hussman Investment Trust | |
| | | |
| By (Signature and Title)* | /s/ John P. Hussman | |
| | John P. Hussman, President | |
| | | |
| Date | August 25, 2021 | |
Pursuant to the requirements of the Securities Exchange Act of 1934 and the Investment Company Act of 1940, this report has been signed below by the following persons on behalf of the registrant and in the capacities and on the dates indicated.
| By (Signature and Title)* | /s/ John P. Hussman | |
| | John P. Hussman, President | |
| | | |
| Date | August 25, 2021 | |
| | | |
| By (Signature and Title)* | /s/ Mark J. Seger | |
| | Mark J. Seger, Treasurer | |
| | | |
| Date | August 25, 2021 | |
| * | Print the name and title of each signing officer under his or her signature. |