| | OMB APPROVAL |
| | OMB Number: 3235-0570
Expires: July 31, 2022
Estimated average burden hours per response: 20.6 |
UNITED STATES
SECURITIES AND EXCHANGE COMMISSION
Washington, D.C. 20549
FORM N-CSR
CERTIFIED SHAREHOLDER REPORT OF REGISTERED
MANAGEMENT INVESTMENT COMPANIES
| Investment Company Act file number | 811-09911 | |
| Hussman Investment Trust |
| (Exact name of registrant as specified in charter) |
| 6021 University Boulevard, Suite 490 Ellicott City, Maryland | 21043 |
| (Address of principal executive offices) | (Zip code) |
John F. Splain
| Ultimus Fund Solutions, LLC 225 Pictoria Drive, Suite 450 Cincinnati, Ohio 45246 |
| (Name and address of agent for service) |
| Registrant's telephone number, including area code: | (513) 587-3400 | |
| Date of fiscal year end: | June 30, 2021 | |
| | | |
| Date of reporting period: | December 31, 2020 | |
Form N-CSR is to be used by management investment companies to file reports with the Commission not later than 10 days after the transmission to stockholders of any report that is required to be transmitted to stockholders under Rule 30e-1 under the Investment Company Act of 1940 (17 CFR 270.30e-1). The Commission may use the information provided on Form N-CSR in its regulatory, disclosure review, inspection, and policymaking roles.
A registrant is required to disclose the information specified by Form N-CSR, and the Commission will make this information public. A registrant is not required to respond to the collection of information contained in Form N-CSR unless the Form displays a currently valid Office of Management and Budget ("OMB") control number. Please direct comments concerning the accuracy of the information collection burden estimate and any suggestions for reducing the burden to Secretary, Securities and Exchange Commission, 450 Fifth Street, NW, Washington, DC 20549-0609. The OMB has reviewed this collection of information under the clearance requirements of 44 U.S.C. § 3507.
| Item 1. | Reports to Stockholders. |

HUSSMAN INVESTMENT TRUST
HUSSMAN STRATEGIC GROWTH FUND
HUSSMAN STRATEGIC ALLOCATION FUND
HUSSMAN STRATEGIC TOTAL RETURN FUND
HUSSMAN STRATEGIC INTERNATIONAL FUND
SEMI-ANNUAL REPORT
December 31, 2020
(Unaudited)
Table of Contents
| | |
Performance Information | |
Hussman Strategic Growth Fund | 1 |
Hussman Strategic Allocation Fund | 2 |
Hussman Strategic Total Return Fund | 3 |
Hussman Strategic International Fund | 4 |
Letter to Shareholders | 5 |
Portfolio Information | 21 |
Schedules of Investments | |
Hussman Strategic Growth Fund | 24 |
Hussman Strategic Allocation Fund | 35 |
Hussman Strategic Total Return Fund | 46 |
Hussman Strategic International Fund | 50 |
Statements of Assets and Liabilities | 58 |
Statements of Operations | 60 |
Statements of Changes in Net Assets | |
Hussman Strategic Growth Fund | 62 |
Hussman Strategic Allocation Fund | 63 |
Hussman Strategic Total Return Fund | 64 |
Hussman Strategic International Fund | 65 |
Financial Highlights | |
Hussman Strategic Growth Fund | 66 |
Hussman Strategic Allocation Fund | 67 |
Hussman Strategic Total Return Fund | 68 |
Hussman Strategic International Fund | 69 |
Notes to Financial Statements | 70 |
About Your Funds’ Expenses | 95 |
Other Information | 97 |
Change in Independent Auditor | 98 |
Privacy Notice | 99 |

Hussman Strategic Growth Fund
Comparison of the Change in Value of a $10,000 Investment in
Hussman Strategic Growth Fund versus the S&P 500 Index(a) (Unaudited)

Average Annual Total Returns For Periods Ended December 31, 2020 |
| | 1 Year | 3 Years | 5 Years | 10 Years | Since
Inception(b) | |
Hussman Strategic Growth Fund(c)(d) | 14.53% | 0.36% | (4.83%) | (5.93%) | 0.47% | |
S&P 500 Index | 18.40% | 14.18% | 15.22% | 13.88% | 6.79% | |
(a) | Hussman Strategic Growth Fund invests primarily in stocks listed on the New York, American, and NASDAQ exchanges and varies its investment exposure to market fluctuations depending on market conditions. The S&P 500 Index is an index of large capitalization stocks. However, the Fund may invest in securities that are not included in the S&P 500 Index and there are no restrictions as to the market capitalization of companies in which the Fund invests. “HSGFX equity investments and cash equivalents only (unhedged)” reflects the performance of the Fund’s stock investments and modest day-to-day cash balances, after fees and expenses, and does not reflect the impact of hedging transactions on the Fund’s overall investment performance. The Fund’s unhedged equity investments do not represent a separately available portfolio, and their performance is presented solely for purposes of comparison and performance attribution. Performance data presented using log scale. Each segment on the vertical axis represents an equivalent percentage change. |
(b) | The Fund commenced operations on July 24, 2000. |
(c) | Returns do not reflect the deduction of taxes a shareholder would pay on Fund distributions or the redemption of Fund shares. |
(d) | The Adviser has contractually agreed to waive its investment advisory fees and/or absorb Fund expenses until at least November 1, 2021 to the extent necessary to limit the Fund’s annual ordinary operating expenses to an amount not exceeding 1.15% annually of the Fund’s average daily net assets. Absent this arrangement, the expense ratio of the Fund (annualized) for the semi-annual period ended December 31, 2020 would have been 1.22%. |

Hussman Strategic Allocation Fund
Comparison of the Change in Value of a $10,000 Investment in Hussman Strategic Allocation Fund
versus Benchmark Fixed Allocation Composite(a) (Unaudited)

Average Annual Total Returns For Periods Ended December 31, 2020 |
| | 1 Year | Since
Inception(b) |
Hussman Strategic Allocation Fund(c)(d) | 11.22% | 7.69% |
Benchmark Fixed Allocation Composite | 15.20% | 17.16% |
(a) | Benchmark Fixed Allocation Composite represents the gross investment performance of a portfolio that is invested in securities included in three separate indices, weighted as follows: 60% S&P 500 Index, 30% Bloomberg Barclays U.S. Treasury Unhedged Index and 10% Bloomberg Barclays Treasury Bills Index. The Composite represents an investment approach that invests a fixed percentage of assets in stocks, bonds, and money-market securities, with little or no variation. The Fund may invest in securities that are not included in the indices that comprise the Composite. |
(b) | The Fund commenced operations on August 27, 2019. |
(c) | Returns do no reflect the deduction of taxes a shareholder would pay on Fund distributions or the redemptions of Fund shares. |
(d) | The Advisor has contractually agreed to waive its investment advisory fees and/or absorb Fund expenses until at least November 1, 2022 to the extent necessary to limit the Fund’s annual ordinary operating expenses to an amount not exceeding 1.25% annually of the Fund’s average daily net assets. Absent this arrangement, the expense ratio of the Fund (annualized) for the semi-annual period ended December 31, 2020 would have been 3.86%. |

Hussman Strategic Total Return Fund
Comparison of the Change in Value of a $10,000 Investment in Hussman Strategic Total Return Fund
versus the Bloomberg Barclays U.S. Aggregate Bond Index(a) (Unaudited)

Average Annual Total Returns For Periods Ended December 31, 2020 |
| | 1 Year | 3 Years | 5 Years | 10 Years | Since
Inception(b) | |
Hussman Strategic Total Return Fund(c)(d) | 11.45% | 8.01% | 6.62% | 3.16% | 5.09% | |
Bloomberg Barclays U.S. Aggregate Bond Index | 7.51% | 5.34% | 4.44% | 3.84% | 4.41% | |
(a) | The Bloomberg Barclays U.S. Aggregate Bond Index covers the U.S. investment grade fixed rate bond market, with index components for U.S. government, agency and corporate securities. The Fund does not invest solely in securities included in the Bloomberg Barclays U.S. Aggregate Bond Index and may invest in other types of bonds, as well as common stocks, exchange-traded funds and other securities. |
(b) | The Fund commenced operations on September 12, 2002. |
(c) | Returns do not reflect the deduction of taxes a shareholder would pay on Fund distributions or the redemption of Fund shares. |
(d) | The Adviser has contractually agreed to waive its investment advisory fees and/or absorb Fund expenses until at least November 1, 2021 to the extent necessary to limit the Fund’s annual ordinary operating expenses to an amount not exceeding 0.75% annually of the Fund’s average daily net assets. Absent this arrangement, the expense ratio of the Fund (annualized) for the semi-annual period ended December 31, 2020 would have been 0.76%. |

Hussman Strategic International Fund
Comparison of the Change in Value of a $10,000 Investment in
Hussman Strategic International Fund versus the MSCI EAFE Index(a) (Unaudited)

Average Annual Total Returns For Periods Ended December 31, 2020 |
| | 1 Year | 3 Years | 5 Years | 10 Years | Since
Inception(b) | |
Hussman Strategic International Fund(c)(d) | 0.74% | (0.44%) | (0.11%) | (1.18%) | (0.67%) | |
MSCI EAFE Index | 7.82% | 4.28% | 7.45% | 5.51% | 5.71% | |
(a) | The MSCI EAFE (Europe, Australasia, and Far East) Index is a free float-adjusted weighted capitalization index that is designed to measure the equity market performance of developed markets, excluding the U.S. and Canada. As of December 31, 2020, the MSCI EAFE Index consisted of the following 21 developed market country indices: Australia, Austria, Belgium, Denmark, Finland, France, Germany, Hong Kong, Ireland, Israel, Italy, Japan, the Netherlands, New Zealand, Norway, Portugal, Singapore, Spain, Sweden, Switzerland and the United Kingdom. The Fund is not required to invest in each of the countries represented in the MSCI EAFE Index and may invest in securities that are not included in the MSCI EAFE Index. In addition, the Fund varies its exposure to market fluctuations depending on market conditions. |
(b) | The Fund commenced operations on December 31, 2009. |
(c) | Returns do not reflect the deduction of taxes a shareholder would pay on Fund distributions or the redemption of Fund shares. |
(d) | The Adviser has contractually agreed to waive its investment advisory fees and/or absorb Fund expenses until at least November 1, 2021 to the extent necessary to limit the Fund’s annual ordinary operating expenses to an amount not exceeding 2.00% annually of the Fund’s average daily net assets. Absent this arrangement, the expense ratio of the Fund (annualized) for the semi-annual period ended December 31, 2020 would have been 3.64%. |
The Hussman Funds
|
Letter to Shareholders | February 12, 2021 |
Dear Shareholder,
For the calendar year ended December 31, 2020, the Hussman Funds performed as intended; neither extraordinary nor disappointing in the context of prevailing market conditions and our value-conscious, historically-informed, full-cycle investment discipline. The phrase, “as intended,” is one that I regularly chose to describe our performance in prior market cycles. I am pleased that I can do so again.
In a year that began at the most extreme stock market valuations in history, our intent in 2020 was to navigate changing market conditions and opportunities within the conservative investment stance demanded by those extremes. Though the market decline in the first quarter of 2020 brought our most reliable measures of valuation to levels that still exceeded 87% of historical observations, the volatility provided enough opportunities to enable all of the Hussman Funds to end the year with positive returns.
Strategic Growth Fund ended calendar year 2020 with a total return of 14.53%. The deepest peak-to-trough loss in the Fund during the year was -6.98%. By comparison, the S&P 500 had a total return of 18.40%. The deepest peak-to-trough loss in the S&P 500 during the year was -33.79%.
Strategic Allocation Fund ended calendar year 2020 with a total return of 11.22%. The deepest peak-to-trough loss in the Fund during the year was -2.70%. By comparison, a benchmark portfolio invested 60% in the S&P 500 Index, 30% in the Bloomberg Barclays U.S. Treasury Unhedged Total Return Index, and 10% in the Bloomberg Barclays U.S. Treasury Bills Index had a total return of 15.20% during 2020. The deepest peak-to-trough loss in this benchmark during the year was -19.93%.
Strategic Total Return Fund ended calendar year 2020 with a total return of 11.45%. The deepest peak-to-trough loss in the Fund during the year was -7.18%. By comparison, the Bloomberg Barclays U.S. Aggregate Bond Index had a total return of 7.51% during 2020. The deepest peak-to-trough loss in this benchmark during the year was -6.30%.
Strategic International Fund ended calendar year 2020 with a total return of 0.74%. The deepest peak-to-trough loss in the Fund during the year was -10.26%. By comparison, the MSCI EAFE Index had a total return of 7.82%. The deepest peak-to-trough loss in this benchmark during the year was -33.90%.
The Hussman Funds
|
Letter to Shareholders (continued) |
The most extremely overvalued market in U.S. history
“The most striking similarity between the 1920s and 1990s bull markets is the notion that traditional measures of stock valuation had become obsolete.”
– Edward Chancellor, Devil Take The Hindmost, 1999
Nothing so animates a speculative herd as a parabolic price advance in an asset detached from any standard of value. I am convinced that future generations will use the present moment to define the concept of a reckless speculative extreme, in the same way our generation looks back on 1929 and 2000. People will use us to teach lessons to their children.
As I write this letter, the S&P 500 has reached the highest valuations in U.S. history, eclipsing both the 1929 and 2000 extremes, based on the measures that we find best correlated with actual subsequent S&P 500 total returns. Unlike prior financial bubbles, however, the current speculative extreme has extended to every conventional asset class, and every subset of the equity market.
For example, at the peak of the 2000 technology bubble, the 10% of S&P 500 components with the highest price/revenue ratios had a median ratio of 13.7. In contrast, the median price/revenue ratio for the remaining components of the S&P 500 was just 1.2.
Presently, the 10% of S&P 500 components with the highest price/revenue ratios have a median ratio of 14.8, exceeding the 2000 extreme even for this decile. Yet the median price/revenue ratio for the remaining components of the S&P 500 is 2.8.
For the capitalization-weighted S&P 500 Index as a whole, the price/revenue ratio has now climbed to a historic extreme of 2.9. When one recognizes that the historical norm is only about 0.9 (a level that was breached even at the 2008-2009 market lows), and that one-quarter of U.S. history has seen that ratio below 0.6, it becomes clear that substantial long-term and full-cycle risk is built into present valuation extremes.
The situation might be of less concern if the most extreme valuations were isolated to relatively small components of the S&P 500. However, this is not the case. Among the 10% of S&P 500 components with the largest market capitalizations, the median price/revenue ratio is presently 5.7, easily eclipsing the 2000 extreme of 4.8 for this subgroup. Yet unlike 2000, even the smallest 10% of S&P 500 components are at extreme valuations, with a median price/revenue ratio of 1.8, compared with a median ratio of just 0.3 at the 2000 market peak.
The Hussman Funds
|
Letter to Shareholders (continued) |
Of course, valuations are extreme on measures that go well beyond price/revenue ratios. Even if one constructs the S&P 500 price/earnings multiple in a very optimistic way – dividing the S&P 500 by the highest level of earnings ever achieved to-date – the current multiple exceeds that observed at the 1929 peak, and at every point in history outside of the 1999-2000 market peak.
Across the set of valuation measures that we find most strongly correlated with actual subsequent 10-12 year total returns, the S&P 500 Index is presently between 3.3-3.8 times run-of-the-mill norms that have been restored or breached by the end of nearly every market cycle in history (including 2008-2009). We presently estimate that annual nominal total returns of the S&P 500 Index are likely to average -4.5% annually over the coming 12-year period.
As at previous pre-collapse market peaks such as 1929, 1972, 1987, 2000, and 2007, S&P 500 valuations imply likely returns below the prevailing yield on Treasury bonds. Because Treasury bond yields are also at dismally low levels, we estimate that the prospective 12-year average total return for a passive investment mix invested 60% in the S&P 500, 30% in Treasury bonds, and 10% in Treasury bills is likely to be a loss of -2.2% annually.
The main source of potential error in these projections would be the sort of “permanently high plateau” that Irving Fisher disastrously projected at the 1929 market peak. If market valuations 10-12 years from today remain fixed at the highest level in U.S. history, while average nominal growth in the economy and corporate revenues maintains the same rate as in recent decades (about 4% annually), we would expect S&P 500 total returns, including dividends, to average about 5.4% annually. This would imply a 10-year projected total return of about 3.6% on a 60%-30%-10% mix of stocks, bonds, and cash.
However, the potential benefit of a “permanently high plateau” is vulnerable to even slight disappointments in those assumptions. If valuations were simply to retreat by 22%, to the highest extremes observed in 1929 and 2000, and even if it takes a decade to do so, we estimate that the resulting 10-year total return of the S&P 500 would likely average just 2.9% annually. All of these estimates are grounded in basic arithmetic. Even a 22% retreat in valuations over a decade implies a -2.5% drag on 10-year annual total returns. Higher inflation is also unlikely to help, because inflation generally does not benefit stocks when valuations are elevated. All of this is worth considering with valuations more than three times their historical norms.
The Hussman Funds
|
Letter to Shareholders (continued) |
Fortunately, the profile of expected returns for stocks, bonds, and other assets changes substantially as valuations change. I doubt there is any diversified passive investment that will help investors solve the problem created by an “everything bubble,” except perhaps a passive investment in an active discipline. That is precisely the role that the Hussman Funds are intended to serve as an “alternative” holding in the portfolios of our shareholders. All of the Hussman Funds adhere to value-conscious, historically-informed, full-cycle investment disciplines that respond to prevailing valuations and market conditions as they change over time. Indeed, even amid the most extreme valuations in history, we were able to maintain reasonable flexibility in our market outlook in response to market volatility during 2020.
“Nothing demands that investors ‘lock in’ the lowest investment prospects in history. The alternative that investors have is flexibility. The alternative investors have is the capacity to imagine a complete market cycle. The alternative investors have is discipline – the willingness to lean away from risk when it is richly valued and unsupported by uniformly favorable internals, and to lean toward risk when a material retreat in valuations is joined by an improvement in the uniformity of market internals. I have every expectation that we’ll observe such opportunities over the completion of this cycle.”
– John P. Hussman, Ph.D., January 2020
Fund Performance
Strategic Growth Fund
For the year ended December 31, 2020, the total return of Strategic Growth Fund was 14.53%, compared with a total return of 18.40% for the S&P 500 Index. While continued extremes in market valuation have required us to navigate the market within the context of a conservative and well-hedged position, the Fund benefited from a hedging stance that was more defensive during the first quarter than during the remainder of 2020, as well as stock selection performance that was more characteristic of our long-term experience. Excluding the impact of hedging, the stock selection approach of Strategic Growth Fund has outperformed the total return of the S&P 500 by an average of 329 basis points (3.29%) annually from its inception on July 24, 2000 through December 31, 2020.
Strategic Allocation Fund
For the year ended December 31, 2020, the total return of Strategic Allocation Fund was 11.22%, compared with a total return of 15.20% in the benchmark fixed allocation composite index which is weighted 60% S&P 500 Index, 30% Bloomberg
The Hussman Funds
|
Letter to Shareholders (continued) |
Barclays U.S. Treasury Unhedged Index and 10% Bloomberg Barclays U.S. Treasury Bills Index. The Fund’s largely hedged investment stance during 2020 resulted in substantially lower volatility than that of the unhedged benchmark. The deepest peak-to-trough loss experienced by the Fund during 2020 was -2.70%, compared with a -19.93% interim loss for the Fund’s 60%-30%-10% benchmark.
Strategic Total Return Fund
For the year ended December 31, 2020, the total return of Strategic Total Return Fund was 11.45%, compared with a total return of 7.51% for the Bloomberg Barclays U.S. Aggregate Bond Index. The Fund held a relatively conservative position in bonds during this time, with a duration typically ranging between 1-5 years (meaning that a 100 basis point move in interest rates would be expected to affect Fund value by about 1-5% on the basis of bond price fluctuations). During 2020, the yield on 10-year U.S. Treasury bonds fell from 1.92% to 0.92%, resulting in modest total returns for Treasury bonds. The Fund also held a moderate exposure to precious metals shares, which varied significantly during the year, generally between 6-20% of the Fund’s net assets, changing in response to prevailing market conditions in this sector, particularly valuations.
Strategic International Fund
For the year ended December 31, 2020, the total return of Strategic International Fund was 0.74%, compared with a total return of 7.82% in the MSCI EAFE Index. The Fund remained conservatively positioned during the year, holding a broadly diversified portfolio of international equities, with an offsetting hedge against market fluctuations, primarily using the MSCI EAFE Index. The small overall gain in Fund value was primarily attributable to a slightly more defensive hedging stance during the first quarter, compared to the remainder of 2020.
Portfolio Composition
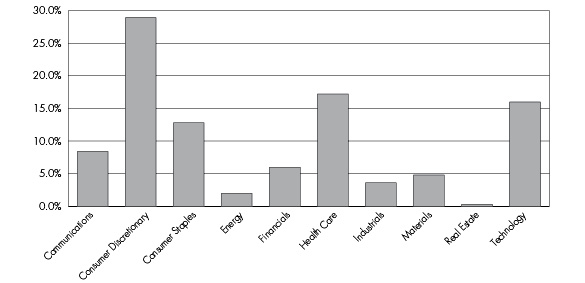
As of December 31, 2020, Strategic Growth Fund had net assets of $313,748,350, and held 218 stocks in a wide variety of industries. The largest sector holdings as a percent of net assets were consumer discretionary (29.5%), health care (17.3%), technology (16.9%), consumer staples (13.2%), communications (8.7%), financials (6.1%) and materials (5.2%). The smallest sector holdings as a percent of net assets were industrials (3.8%), energy (2.2%), and real estate (0.3%).
Strategic Growth Fund’s holdings of individual stocks as of December 31, 2020 were valued at $323,748,997. Against these stock positions, the Fund also held 480 option combinations (long put option/short call option) on the S&P 500 Index
The Hussman Funds
|
Letter to Shareholders (continued) |
and 700 option combinations on the Russell 2000 Index. Each option combination behaves as a short sale on the underlying index, with a notional value of $100 times the index value. On December 31, 2020, the S&P 500 Index closed at 3,756.07, while the Russell 2000 Index closed at 1,974.855. The Fund’s total hedge therefore represented a short position of $318,531,210, thereby hedging 98.4% of the dollar value of the Fund’s investment positions in individual stocks.
Though the performance of Strategic Growth Fund’s diversified portfolio cannot be attributed to any narrow group of stocks, the following equity holdings achieved gains in excess of $2.5 million during the six months ended December 31, 2020: JinkoSolar Holdings ADR, Editas Medicine, Canadian Solar, Hibbett Sports, Owens & Minor, Ubiquiti and Tupperware Brands. There were no equity holdings with a loss in excess of $1 million during this period.
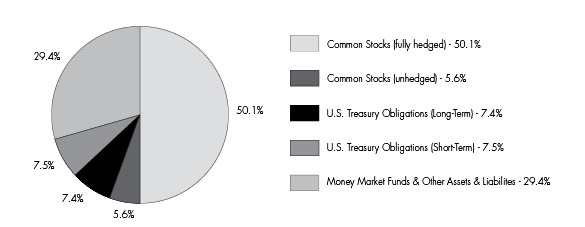
As of December 31, 2020, Strategic Allocation Fund had net assets of $13,412,292 and held 218 stocks in a wide variety of industries. The largest sector holdings as a percent of net assets were consumer discretionary (16.1%), health care (9.6%), technology (8.9%), consumer staples (7.2%), communications (4.7%) and financials (3.3%). The smallest sector weights were materials (2.7%), industrials (2.0%), energy (1.1%) and real estate (0.1%). Treasury notes and money market funds represented 58.5% of the Fund’s net assets.
Strategic Allocation Fund’s holdings of individual stocks as of December 31, 2020 were valued at $7,473,499, representing 55.7% of the Fund’s net assets. Against these stock positions, the Fund also held 10 option combinations (long put option/short call option) on the S&P 500 and 15 option combinations on the Russell 2000 Index. The notional value of this hedge was $6,718,352, hedging 89.9% of the value of equity investments held by the Fund. The Fund’s holdings in long-term Treasury obligations represented 7.4% of the Fund’s net assets.
In Strategic Allocation Fund, during the six months ended December 31, 2020, individual equity portfolio gains in excess of $50,000 were achieved in JinkoSolar Holdings ADR, Canadian Solar, Editas Medicine, Hibbett Sports, eXp World Holdings, Ubiquiti and Tupperware Brands. There were no individual equity portfolio losses in excess of $50,000 during this period.
As of December 31, 2020, Strategic Total Return Fund had net assets of $320,707,040. Treasury notes, Treasury Inflation-Protected Securities (TIPS) and money market funds represented 84.2% of the Fund’s net assets. Exchange-traded funds, precious metals shares, energy and utility shares accounted for 3.1%, 6.0%, 1.3%, and 5.2% of net assets, respectively.
The Hussman Funds
|
Letter to Shareholders (continued) |
In Strategic Total Return Fund, during the six months ended December 31, 2020, the following holdings achieved portfolio gains in excess of $250,000: AES, Agnico Eagle Mines, U.S. Treasury Inflation-Protected Note (2.50%, due 1/15/2029), U.S. Treasury Inflation-Protected Note (0.125%, due 1/15/2030) and Compania de Minas Buenaventura ADR. The only portfolio loss in excess of $250,000 during this period was U.S. Treasury Note (0.625%, due 8/15/2030).
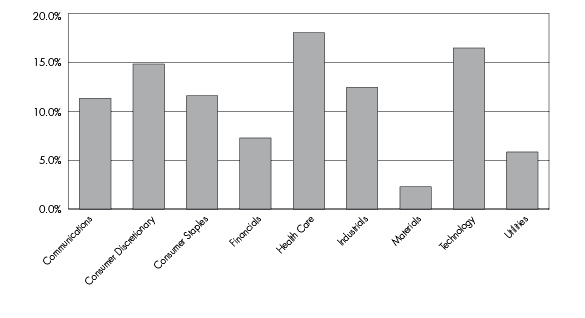
As of December 31, 2020, Strategic International Fund had net assets of $14,790,262 and held 135 stocks in a wide variety of industries. The largest sector holdings as a percent of net assets were health care (15.7%), technology (14.3%), consumer discretionary (12.9%), industrials (10.8%), consumer staples (10.1%), communications (9.8%) and financials (6.3%). The smallest sector weights were utilities (5.1%) and materials (2.0%). Investment in shares of money market funds accounted for 3.5% of net assets.
Strategic International Fund’s holdings of individual stocks as of December 31, 2020 were valued at $12,863,205. In order to hedge the impact of general market fluctuations, as of December 31, 2020, Strategic International Fund was long 12 put option contracts on the S&P 500 Index and short 75 futures on the Mini MSCI EAFE Index. The notional value of this hedge was $12,513,534, hedging 97.3% of the value of equity investments held by the Fund. When the Fund is in a hedged investment position, the primary driver of Fund returns is the difference in performance between the stocks owned by the Fund and the indices that are used to hedge.
While Strategic International Fund’s investment portfolio is diversified and the Fund’s performance is affected by numerous investment positions, the hedging strategy of the Fund was primarily responsible for the reduced sensitivity of the Fund to market fluctuations from the Fund’s inception through December 31, 2020. Individual equity holdings having portfolio gains in excess of $75,000 during the six months ended December 31, 2020 included Next plc, Siltronic AG and Mycronic AB. There were no equity holdings with portfolio losses in excess of $75,000 during this period.
Supplementary performance information for the Funds is available on the Hussman Funds website: www.hussmanfunds.com
The Hussman Funds
|
Letter to Shareholders (continued) |
Current Outlook
“The one reality that you can never change is that a higher-priced asset will produce a lower return than a lower-priced asset. You can’t have your cake and eat it. You can enjoy it now, or you can enjoy it steadily in the distant future, but not both – and the price we pay for having this market go higher and higher is a lower 10-year return from the peak.”
– Jeremy Grantham, CNBC, November 12, 2020
One of the central principles to remember about investing is that the higher the price one pays today, for a given stream of future cash flows, the lower the long-term returns one can expect over time. It is exactly when past returns are most glorious that future prospects are most dismal.
Still, it is also clear that if overvaluation alone was enough to drive prices lower, the market could never reach the sort of extreme hypervaluation we saw in 1929 and 2000, nor the dismal full-cycle outcomes those valuations created. So we have to distinguish between long-term returns, which are driven by valuations, and returns over shorter segments of the market cycle, which are driven by investor psychology.
There is enormous value in understanding that market valuations are the main drivers of long-term investment returns and the extent of potential market losses over the complete market cycle, while investor psychology typically matters more over shorter segments of the market cycle.
When investors are inclined toward speculation, they tend to be indiscriminate about it. In market cycles across history (including the most recent one), we’ve found that the most reliable gauge of whether investors are inclined toward “speculation” or “risk-aversion” is the uniformity of market internals across thousands of stocks, industries, sectors, and security-types, including debt securities of varying creditworthiness.
Yet in prior market cycles across history, there was also generally a “limit” to speculation. Once sufficiently extreme “overvalued, overbought, overbullish” conditions emerged, one could adopt a bearish outlook even if market internals were still favorable. Only this aspect of the recent bull market was truly “different” from history. Once the Federal Reserve drove interest rates to zero, even the most extreme and historically reliable “limits” to speculation became ineffective. Instead, yield-seeking speculation persisted long after speculative extremes had emerged.
The Hussman Funds
|
Letter to Shareholders (continued) |
Investors have now bid stock market valuations up to the point where we estimate that the S&P 500 is likely to produce zero or negative returns for a very long period of time – even if those returns are delivered in an “interesting” way, through a series of collapses and recoveries.
In late-2017, I finally threw up my hands and abandoned the idea that there remains any reliable “limit” to speculation at all. Instead of acting pre-emptively in response to extremely overextended conditions, we adapted our investment discipline to require deterioration in our measures of market internals before adopting a bearish outlook. While sufficiently extreme conditions can still justify a neutral market outlook, we no longer adopt or amplify a bearish outlook unless our measures of market internals are explicitly unfavorable.
Now, saying that the Fed has disabled previously reliable limits to speculation does not mean embracing risk regardless of observable market conditions. Rather, I expect that the most valuable aspect of our investment discipline over the completion of this cycle, and future ones, will be our ability and willingness to flexibly respond to changes in observable market conditions – particularly valuations and market internals – as they emerge. In my view, the strongest opportunities to embrace market risk will emerge at those points when a material retreat in valuations is joined by improvement in market internals.
“The notion that the desirability of a common stock was entirely independent of its prices seems incredibly absurd. Yet the new-era theory led directly to this thesis. An alluring corollary of this principle was that making money in the stock market was now the easiest thing in the world. It was only necessary to buy ‘good’ stocks, regardless of price, and then to let nature take her upward course. The results of such a doctrine could not fail to be tragic.”
– Benjamin Graham and David L. Dodd, Security Analysis, 1934
On Federal Reserve policy
In response to market losses in March, the Federal Reserve announced that it would be purchasing existing corporate bonds from investors (mainly through exchange-traded funds), using funds specifically allocated by the CARES Act for that purpose. While the Fed announced that it planned to “leverage” government funds beyond the amount allocated by the Treasury, members of Congress promptly questioned the legal authority on which the Fed believed it could do so. Ultimately, the Federal Reserve’s
The Hussman Funds
|
Letter to Shareholders (continued) |
purchases amounted to just $14 billion dollars of bonds, limited to funds specifically provided by the Treasury, as the purchase of uncollateralized corporate bonds by the Fed remains otherwise illegal under Section 13(3) of the Federal Reserve Act.
Nevertheless, the mere idea that the Fed was purchasing corporate securities triggered enough magical thinking among investors to drive the aggregate value of U.S. corporate equities to a record extreme that now stands at over $56 trillion. This is 2.63 times U.S. nominal GDP, compared with a historical norm of just 0.78. About $39 trillion of that market capitalization represents paper profits that could be wiped out without even bringing valuations below historical norms seen as recently as the 2009 cycle low. It is wholly unclear that investors understand how limited the Federal Reserve’s corporate bond purchases ultimately were, and how much the subsequent rebound has relied on speculative psychology.
Notably, in treating uncollateralized corporate debt as if it stood as its own 13(3) “collateral,” and reporting its purchases at book value rather than market value, the Federal Reserve revealed an inclination to interpret, as loosely as possible, its legal obligation to “protect taxpayers from losses.” For interventionists who advocate modifying the Federal Reserve Act to enable the Fed to buy stocks, with no collateral other than the stock shares themselves, my question is how much of the potential $39 trillion in paper losses should the public be forced to absorb on behalf of private speculators, in lieu of other budget priorities?
Could the Fed sustain this bubble forever? I certainly do not believe so, but given our late-2017 adaptation to our investment discipline, I expect we would tolerate that unlikely outcome just fine. Our discipline is flexible enough to shift as investor psychology does. We also know that when valuations are extreme, even very small changes in expected returns imply rather large price fluctuations. So even in the unlikely event of a “permanently high plateau,” I expect we will see enough volatility to navigate a broad range of opportunities.
Meanwhile, despite the confidence that investors have placed in the Federal Reserve, it is worth remembering how Federal Reserve policy actually “supports” the financial markets. Most asset purchases of the Fed simply replace interest-bearing Treasury bonds with zero-interest base money, which must be held by someone, at every moment in time, until that base money is retired. This zero-interest money behaves just like a “hot potato.” One can try to get rid of it by buying stocks, but the base money simply ends up in the hands of whoever sold those stocks.
The Hussman Funds
|
Letter to Shareholders (continued) |
When investors are inclined to speculate, safe liquidity is viewed as an “inferior” asset, so the desire to abandon these low-interest hot-potatoes can amplify speculation. However, when investors are inclined toward risk-aversion, low interest liquidity becomes a desirable asset rather than an “inferior” one, so creating more of the stuff does nothing to support the market. Recall that during the 2000-2002 and 2007-2009 collapses, the Fed aggressively and persistently eased monetary policy to absolutely no avail.
Ultimately, there is no way to sustain a bubble without making its consequences worse. While we can tolerate a world where monetary policy keeps the market at a “permanently high plateau,” I question the ability of these policies to successfully do so when investors become inclined toward risk-aversion. Even the steep market declines we’ve observed in recent years (early-2018, late-2018, early-2020) have occurred during periods when our measures of market internals were unfavorable. For that reason, even since 2017, I have viewed the combination of hypervaluation, price overextension, lopsided bullishness, and unfavorable market internals as a “trap door” situation.
“That the rate of interest will be lower when commerce languishes and when there is little demand for money, than when the energies of commerce are in full play and there is an active demand for money, is indisputable; but it is equally beyond doubt, that every speculative mania which has run its course of folly and disaster in this country has derived its original impulse from cheap money.”
– The Economist, 1858
Very long, interesting trips to nowhere
The stock market has experienced several long, interesting, but ultimately unprofitable trips to nowhere over the past century. These periods have either started at elevated valuations, ended at depressed valuations, or some combination of both. I have little doubt that measured from the present valuation extreme, investors will look back at some future date, more than a decade from now, and find that the S&P 500 has lagged even the depressed yields available on Treasury bills.
Recall that despite two intervening bubbles, the total return of the S&P 500 lagged Treasury bills for the full period from May 1995 to March 2009. What makes this long trip to nowhere “interesting” is that investors during this period had the benefit of two financial bubbles, only to watch every bit of total return over-and-above T-bills
The Hussman Funds
|
Letter to Shareholders (continued) |
wiped out. The total return of the S&P 500 also lagged T-bills from August 1929 to August 1945. Ditto for the full period from August 1959 to August 1982. Taken together, these periods comprise 53 years of the 80-year period from 1929 to 2009.
Of course, one can define other starting and ending points to demonstrate that a combination of elevated starting valuations or depressed ending valuations produce long, interesting trips to nowhere for passive investors. While one cannot know future valuations in advance, starting valuations are directly observable. Given that our most reliable measures of equity market valuation currently exceed the 1929 and 2000 market peaks, it is instructive to remember that the total return of the S&P 500 also lagged Treasury bills for the 13-year period between March 2000 and April 2013. Given that market valuations in April 2013 were among the highest 20% of valuations in history, it should be clear that our concerns about likely equity market returns in the coming years do not rely on the assumption that market valuations will return to levels anywhere near their historical norms.
Our most reliable valuation measures are presently over three times their run-of-the-mill historical norms (where we measure reliability based on correlation with actual subsequent market returns in market cycles across history). In order to simply touch those historical valuation norms, the S&P 500 would have to lose somewhere in the range of 60-70% over the completion of this market cycle – or possibly even over two cycles, as we observed between 2000 and 2009. In that context, it is worth noting that a 63% loss would wipe out the entire total return of the S&P 500 over-and-above Treasury bills since the March 2000 market peak.
I would not be terribly surprised if the completion of this cycle sheds every bit of total return that the S&P 500 has achieved in excess of T-bills since 2000. Fortunately, our investment discipline does not rely on that outcome. I expect that far less “interesting” market outcomes will provide sufficient opportunities for our value-conscious, historically-informed, full-cycle investment approach.
Notes on inflation
While I expect that our attention to valuations, market internals, overextended conditions and the like will help us to navigate the coming market cycles regardless of how the course of inflation unfolds, it is worth observing that inflation is not likely to benefit stocks at these valuations, or provide a meaningful offset to the downside risk we expect over the completion of the market cycle.
The Hussman Funds
|
Letter to Shareholders (continued) |
Across a century of U.S. data, the total return of the S&P 500 has lagged Treasury bills, on average, in periods when inflation has been anywhere above about 2% and rising. The comparison has been particularly hostile to the S&P 500 when market valuations have exceeded their historical norms and the year-over-year CPI inflation rate has advanced anywhere above about 3%.
Historically, the first casualties of rising inflation are market valuations. It is only after valuations have been driven to historically normal or below-average levels that the positive effect of inflation on nominal cash flows dominates the negative impact on valuations. So yes, if inflation is rapid enough, the effect on nominal values can eventually dominate. But given present valuation extremes, I believe that outcome would require the consumer price index to more than triple first.
The effect of inflation in boosting nominal stock market returns is more immediate if valuations begin at depressed levels, as they did in the early 1940’s. In contrast, the economy can sustain quite a bit of inflation without benefit to stocks if valuations begin at elevated levels, as they did in the early 1970’s. Regardless, when we examine the two 10-year periods having the highest trailing CPI inflation rates (the decades ending in March 1951 and September 1981), we find that the 10-year total return of the S&P 500 during those periods fell short of what could have been projected simply based on prevailing valuations at the beginning of those periods.
Put simply, U.S. stocks have actually earned their reputation as “inflation hedges” in periods when inflation is falling, starting valuations are depressed, or both. Once valuations have been crushed, stocks recover lost ground – particularly once the rate of inflation has peaked and begins to normalize. The combination of depressed starting valuations and falling inflation is exactly what contributed to the enormous stock market returns during the disinflationary period between the early 1980s and the 2000 bubble peak. The current environment could not be further from that set of conditions.
Inflation has an enormous psychological component. The Federal Reserve does not disrupt price stability simply by purchasing Treasury bonds and replacing them with base money (which is all that “quantitative easing” entails). Those transactions simply exchange one government liability for another. Nor do government deficits necessarily disrupt price stability. There is a very normal cyclical tendency for deficits to expand during economic recessions and contract during expansions.
The shift from price stability to inflation typically combines an expansion in fiscal deficits, well beyond those that would be “normal” given the position of the economy in the economic cycle, along with a willingness of the Federal Reserve to monetize those extraordinary deficits by purchasing new government debt and creating base money
The Hussman Funds
|
Letter to Shareholders (continued) |
in its place. Examine major episodes of inflation in the U.S. and internationally, and you will find that inflation typically reflects the monetization of what I call “cyclically excessive” government deficits, often in an environment where some supply disruption (energy, labor, productivity) has occurred.
Amid extreme market valuations and near-zero interest rates, we presently observe a combination of extraordinary fiscal deficits and weak monetary discipline. This combination increases the potential for “revulsion” toward government liabilities of all forms. Rising interest rates and inflation typically emerge hand-in-hand. If the Federal Reserve attempts to set a “cap” on long-term interest rates, as it did during World War II, it will likely invite the same sort of rapid inflation that emerged in 1948, and ultimately forced the Fed to abandon that policy.
None of this is a forecast, nor do we require any particular outcome for valuations, interest rates, inflation, or the economy. Our investment discipline requires only that we respond to market conditions as they change over time. We are as comfortable with changes in our exposure to inflation hedges as we are with changes to our stock and bond market exposures. Still, in contrast to Wall Street’s confidence in permanently high plateaus, we believe that it is worth allowing for the possibility that the future will not forever be limited to one familiar and wildly speculative state of the world.
In short, I do not believe that market cycles have ceased to exist. The problem in recent years was that the speculation encouraged by extraordinary monetary policies made historically reliable “limits” to speculation ineffective. As a result, we have become content to gauge the presence of speculation or risk-aversion, without immediately becoming bearish even when speculation has become outrageous. While sufficiently extreme conditions can still hold us to a neutral market outlook, the shift to a bearish outlook requires deterioration or divergence in our measures of market internals, which are our most reliable gauge of whether investor psychology is inclined toward speculation or toward risk-aversion.
Given the most extreme valuations in history, it is tempting to focus strictly on my expectation of a 60-70% market loss over the completion of this cycle, while ignoring the fact that nothing in our investment discipline actually requires that outcome. I believe that we are fully capable of navigating a world where market valuations never again ever visit historical norms. I just think that it is both misguided and unnecessary to rely on that idea.
The Hussman Funds
|
Letter to Shareholders (continued) |
Having adapted our approach to allow for even the most extraordinary policy interventions, we are content to pursue our value-conscious, historically-informed, full-cycle discipline, and to align our investment stance with market conditions as they change over time.
As always, I remain grateful for your trust.
Sincerely,
John P. Hussman, Ph.D.
Past performance is not predictive of future performance. There is no assurance that the Hussman Funds will achieve their investment objectives. Investment results and principal value will fluctuate so that shares of the Funds, when redeemed, may be worth more or less than their original cost. It is possible to lose money when investing in securities. Current performance may be higher or lower than the performance data quoted.
Periodic updates regarding market conditions and investment strategy, as well as special reports, analysis, and performance data current to the most recent month end, are available at the Hussman Funds website www.hussmanfunds.com.
An investor should consider the investment objectives, risks, charges and expenses of the Funds carefully before investing. The Funds’ prospectuses contain this and other important information. To obtain a copy of the Hussman Funds’ prospectuses please visit our website at www.hussmanfunds.com or call 1-800-487-7626 and a copy will be sent to you free of charge. Please read the prospectus carefully before you invest. The Hussman Funds are distributed by Ultimus Fund Distributors, LLC.
Estimates of prospective return and risk for equities, bonds and other financial markets are forward-looking statements based the analysis and reasonable beliefs of Hussman Strategic Advisors (the “Adviser”), which serves as the investment adviser of the Funds. They are not a guarantee of future performance and are not indicative of the prospective returns of any of the Hussman Funds. Actual returns may differ substantially from the estimates provided. Estimates of prospective long-term returns for the S&P 500 reflect valuation methods focusing on the relationship between current market prices and earnings, dividends and other fundamentals, adjusted for variability over the economic cycle.
The Hussman Funds
|
Letter to Shareholders (continued) |
This Letter to Shareholders seeks to describe some of the Adviser’s current opinions and views of the financial markets. Although the Adviser believes it has a reasonable basis for the opinions or views expressed, actual results may differ, sometimes significantly so, from those expected or expressed. The securities held by the Funds that are discussed in this Letter to Shareholders were held during the period covered by this Report. They do not comprise the entire investment portfolios of the Funds, may be sold at any time and may no longer be held by the Funds. The opinions of the Adviser with respect to those securities may change at any time.
Hussman Strategic Growth Fund
Portfolio Information |
December 31, 2020 (Unaudited) |
Sector Allocation* (% of Common Stocks)

* | As of December 31, 2020, the Fund held no securities in the Utilities sector. |
Hussman Strategic Allocation Fund
Portfolio Information |
December 31, 2020 (Unaudited) |
Asset Allocation (% of Net Assets)
Hussman Strategic Allocation Fund
Portfolio Information (continued) |
December 31, 2020 (Unaudited) |
Sector Allocation* (% of Common Stocks)
* | As of December 31, 2020, the Fund held no securities in the Utilities sector. |
Hussman Strategic Total Return Fund
Portfolio Information |
December 31, 2020 (Unaudited) |
Asset Allocation (% of Net Assets)

Hussman Strategic International Fund
Portfolio Information |
December 31, 2020 (Unaudited) |
Sector Allocation (% of Common Stocks)
Country Allocation (% of Common Stocks)

Hussman Strategic Growth Fund
Schedule of Investments |
December 31, 2020 (Unaudited) |
COMMON STOCKS — 103.2% | | Shares | | | Value | |
Communications — 8.7% | | | | | | | | |
Cable & Satellite — 0.5% | | | | | | | | |
Sirius XM Holdings, Inc. | | | 250,000 | | | $ | 1,592,500 | |
| | | | | | | | | |
Entertainment Content — 2.1% | | | | | | | | |
AMC Networks, Inc. - Class A (a) | | | 80,000 | | | | 2,861,600 | |
Electronic Arts, Inc. | | | 12,000 | | | | 1,723,200 | |
ViacomCBS, Inc. - Class B | | | 50,000 | | | | 1,863,000 | |
| | | | | | | | 6,447,800 | |
Internet Media & Services — 3.3% | | | | | | | | |
Alphabet, Inc. - Class C (a) | | | 500 | | | | 875,940 | |
Baidu, Inc. - ADR (a) | | | 8,000 | | | | 1,729,920 | |
Facebook, Inc. - Class A (a) | | | 2,000 | | | | 546,320 | |
GrubHub, Inc. (a) | | | 25,000 | | | | 1,856,750 | |
Shutterstock, Inc. | | | 30,000 | | | | 2,151,000 | |
Stamps.com, Inc. (a) | | | 15,000 | | | | 2,942,850 | |
TrueCar, Inc. (a) | | | 80,000 | | | | 336,000 | |
| | | | | | | | 10,438,780 | |
Publishing & Broadcasting — 1.4% | | | | | | | | |
Gray Television, Inc. (a) | | | 200,000 | | | | 3,578,000 | |
Meredith Corporation | | | 35,000 | | | | 672,000 | |
Urban One, Inc. (a) | | | 20,000 | | | | 84,200 | |
| | | | | | | | 4,334,200 | |
Telecommunications — 1.4% | | | | | | | | |
AT&T, Inc. | | | 75,000 | | | | 2,157,000 | |
CenturyLink, Inc. | | | 60,000 | | | | 585,000 | |
Consolidated Communications Holdings, Inc. (a) | | | 120,000 | | | | 586,800 | |
Verizon Communications, Inc. | | | 20,000 | | | | 1,175,000 | |
| | | | | | | | 4,503,800 | |
Consumer Discretionary — 29.5% | | | | | | | | |
Apparel & Textile Products — 1.0% | | | | | | | | |
Capri Holdings Ltd. (a) | | | 25,000 | | | | 1,050,000 | |
Hanesbrands, Inc. | | | 150,000 | | | | 2,187,000 | |
| | | | | | | | 3,237,000 | |
Automotive — 0.3% | | | | | | | | |
Tenneco, Inc. - Class A (a) | | | 75,000 | | | | 795,000 | |
| | | | | | | | | |
Hussman Strategic Growth Fund
Schedule of Investments (continued) |
December 31, 2020 (Unaudited) |
COMMON STOCKS — 103.2% (continued) | | Shares | | | Value | |
Consumer Discretionary — 29.5% (continued) | | | | | | | | |
Consumer Services — 2.1% | | | | | | | | |
2U, Inc. (a) | | | 80,000 | | | $ | 3,200,800 | |
Medifast, Inc. | | | 2,500 | | | | 490,850 | |
Stride, Inc. (a) | | | 75,000 | | | | 1,592,250 | |
WW International, Inc. (a) | | | 50,000 | | | | 1,220,000 | |
| | | | | | | | 6,503,900 | |
E-Commerce Discretionary — 3.0% | | | | | | | | |
Amazon.com, Inc. (a) | | | 250 | | | | 814,232 | |
Chewy, Inc. - Class A (a) | | | 6,000 | | | | 539,340 | |
eBay, Inc. | | | 60,000 | | | | 3,015,000 | |
Etsy, Inc. (a) | | | 10,000 | | | | 1,779,100 | |
PetMed Express, Inc. | | | 100,000 | | | | 3,206,000 | |
| | | | | | | | 9,353,672 | |
Home & Office Products — 1.9% | | | | | | | | |
ACCO Brands Corporation | | | 75,000 | | | | 633,750 | |
iRobot Corporation (a) | | | 40,000 | | | | 3,211,600 | |
Tupperware Brands Corporation (a) | | | 65,000 | | | | 2,105,350 | |
| | | | | | | | 5,950,700 | |
Home Construction — 3.8% | | | | | | | | |
Century Communities, Inc. (a) | | | 75,000 | | | | 3,283,500 | |
D.R. Horton, Inc. | | | 20,000 | | | | 1,378,400 | |
Lennar Corporation - Class A | | | 20,000 | | | | 1,524,600 | |
LGI Homes, Inc. (a) | | | 10,000 | | | | 1,058,500 | |
M/I Homes, Inc. (a) | | | 25,000 | | | | 1,107,250 | |
Meritage Homes Corporation (a) | | | 10,000 | | | | 828,200 | |
PulteGroup, Inc. | | | 20,000 | | | | 862,400 | |
Toll Brothers, Inc. | | | 25,000 | | | | 1,086,750 | |
TRI Pointe Group, Inc. (a) | | | 50,000 | | | | 862,500 | |
| | | | | | | | 11,992,100 | |
Leisure Facilities & Services — 1.6% | | | | | | | | |
Brinker International, Inc. | | | 20,000 | | | | 1,131,400 | |
Domino’s Pizza, Inc. | | | 7,000 | | | | 2,684,220 | |
Waitr Holdings, Inc. (a) | | | 400,000 | | | | 1,112,000 | |
| | | | | | | | 4,927,620 | |
Leisure Products — 1.0% | | | | | | | | |
Malibu Boats, Inc. - Class A (a) | | | 40,000 | | | | 2,497,600 | |
Thor Industries, Inc. | | | 8,000 | | | | 743,920 | |
| | | | | | | | 3,241,520 | |
Hussman Strategic Growth Fund
Schedule of Investments (continued) |
December 31, 2020 (Unaudited) |
COMMON STOCKS — 103.2% (continued) | | Shares | | | Value | |
Consumer Discretionary — 29.5% (continued) | | | | | | | | |
Retail - Discretionary — 14.8% | | | | | | | | |
At Home Group, Inc. (a) | | | 75,000 | | | $ | 1,159,500 | |
Bed Bath & Beyond, Inc. | | | 80,000 | | | | 1,420,800 | |
Big 5 Sporting Goods Corporation | | | 150,000 | | | | 1,531,500 | |
Buckle, Inc. (The) | | | 25,000 | | | | 730,000 | |
Designer Brands, Inc. - Class A | | | 50,000 | | | | 382,500 | |
Dick’s Sporting Goods, Inc. | | | 55,000 | | | | 3,091,550 | |
Duluth Holdings, Inc. - Class B (a) | | | 140,000 | | | | 1,478,400 | |
GameStop Corporation - Class A (a) | | | 120,000 | | | | 2,260,800 | |
Gap, Inc. (The) | | | 25,000 | | | | 504,750 | |
Hibbett Sports, Inc. (a) | | | 80,000 | | | | 3,694,400 | |
Home Depot, Inc. (The) | | | 7,500 | | | | 1,992,150 | |
Kohl’s Corporation | | | 80,000 | | | | 3,255,200 | |
L Brands, Inc. | | | 25,000 | | | | 929,750 | |
Lumber Liquidators Holdings, Inc. (a) | | | 50,000 | | | | 1,537,000 | |
Macy’s, Inc. | | | 160,000 | | | | 1,800,000 | |
MarineMax, Inc. (a) | | | 50,000 | | | | 1,751,500 | |
Michaels Companies, Inc. (The) (a) | | | 200,000 | | | | 2,602,000 | |
Nordstrom, Inc. | | | 20,000 | | | | 624,200 | |
Sally Beauty Holdings, Inc. (a) | | | 200,000 | | | | 2,608,000 | |
Sleep Number Corporation (a) | | | 25,000 | | | | 2,046,500 | |
Sportman’s Warehouse Holdings, Inc. (a) | | | 50,000 | | | | 877,500 | |
Tractor Supply Company | | | 20,000 | | | | 2,811,600 | |
Ulta Beauty, Inc. (a) | | | 8,000 | | | | 2,297,280 | |
Urban Outfitters, Inc. (a) | | | 50,000 | | | | 1,280,000 | |
Williams-Sonoma, Inc. | | | 20,000 | | | | 2,036,800 | |
Zumiez, Inc. (a) | | | 50,000 | | | | 1,839,000 | |
| | | | | | | | 46,542,680 | |
Consumer Staples — 13.2% | | | | | | | | |
Food — 4.1% | | | | | | | | |
B&G Foods, Inc. | | | 100,000 | | | | 2,773,000 | |
Campbell Soup Company | | | 40,000 | | | | 1,934,000 | |
General Mills, Inc. | | | 35,000 | | | | 2,058,000 | |
J.M. Smucker Company (The) | | | 20,000 | | | | 2,312,000 | |
Kellogg Company | | | 25,000 | | | | 1,555,750 | |
LifeVantage Corporation (a) | | | 25,000 | | | | 233,000 | |
USANA Health Sciences, Inc. (a) | | | 25,000 | | | | 1,927,500 | |
| | | | | | | | 12,793,250 | |
Hussman Strategic Growth Fund
Schedule of Investments (continued) |
December 31, 2020 (Unaudited) |
COMMON STOCKS — 103.2% (continued) | | Shares | | | Value | |
Consumer Staples — 13.2% (continued) | | | | | | | | |
Household Products — 0.9% | | | | | | | | |
Clearwater Paper Corporation (a) | | | 15,000 | | | $ | 566,250 | |
Nu Skin Enterprises, Inc. - Class A | | | 40,000 | | | | 2,185,200 | |
| | | | | | | | 2,751,450 | |
Retail - Consumer Staples — 8.2% | | | | | | | | |
Big Lots, Inc. | | | 75,000 | | | | 3,219,750 | |
Dollar General Corporation | | | 4,000 | | | | 841,200 | |
Ingles Markets, Inc. - Class A | | | 65,000 | | | | 2,772,900 | |
Kroger Company (The) | | | 100,000 | | | | 3,176,000 | |
Natural Grocers by Vitamin Cottage, Inc. | | | 75,000 | | | | 1,030,500 | |
Ollie’s Bargain Outlet Holdings, Inc. (a) | | | 25,000 | | | | 2,044,250 | |
Rite Aid Corporation (a) | | | 175,000 | | | | 2,770,250 | |
Sprouts Farmers Market, Inc. (a) | | | 150,000 | | | | 3,015,000 | |
United Natural Foods, Inc. (a) | | | 200,000 | | | | 3,194,000 | |
Walgreens Boots Alliance, Inc. | | | 75,000 | | | | 2,991,000 | |
Weis Markets, Inc. | | | 16,000 | | | | 764,960 | |
| | | | | | | | 25,819,810 | |
Energy — 2.2% | | | | | | | | |
Renewable Energy — 2.2% | | | | | | | | |
Aemetis, Inc. (a) | | | 30,000 | | | | 74,700 | |
Broadwind, Inc. (a) | | | 65,000 | | | | 515,450 | |
Canadian Solar, Inc. (a) | | | 40,000 | | | | 2,049,600 | |
First Solar, Inc. (a) | | | 10,000 | | | | 989,200 | |
JinkoSolar Holding Company Ltd. - ADR (a) | | | 15,000 | | | | 928,050 | |
Renewable Energy Group, Inc. (a) | | | 10,000 | | | | 708,200 | |
SolarEdge Technologies, Inc. (a) | | | 2,000 | | | | 638,240 | |
Sunworks, Inc. (a) | | | 200,000 | | | | 1,024,000 | |
| | | | | | | | 6,927,440 | |
Financials — 6.1% | | | | | | | | |
Asset Management — 0.8% | | | | | | | | |
BrightSphere Investment Group, Inc. | | | 35,000 | | | | 674,800 | |
Federated Hermes, Inc. | | | 50,000 | | | | 1,444,500 | |
Ranpak Holdings Corporation (a) | | | 25,000 | | | | 336,000 | |
| | | | | | | | 2,455,300 | |
Banking — 0.4% | | | | | | | | |
Signature Bank | | | 10,000 | | | | 1,352,900 | |
| | | | | | | | | |
Hussman Strategic Growth Fund
Schedule of Investments (continued) |
December 31, 2020 (Unaudited) |
COMMON STOCKS — 103.2% (continued) | | Shares | | | Value | |
Financials — 6.1% (continued) | | | | | | | | |
Institutional Financial Services — 1.6% | | | | | | | | |
State Street Corporation | | | 20,000 | | | $ | 1,455,600 | |
StoneX Group, Inc. (a) | | | 40,000 | | | | 2,316,000 | |
Virtu Financial, Inc. - Class A | | | 50,000 | | | | 1,258,500 | |
| | | | | | | | 5,030,100 | |
Insurance — 1.3% | | | | | | | | |
Allstate Corporation (The) | | | 12,000 | | | | 1,319,160 | |
Principal Financial Group, Inc. | | | 35,000 | | | | 1,736,350 | |
Progressive Corporation (The) | | | 10,000 | | | | 988,800 | |
| | | | | | | | 4,044,310 | |
Specialty Finance — 2.0% | | | | | | | | |
AerCap Holdings N.V. (a) | | | 16,000 | | | | 729,280 | |
Air Lease Corporation | | | 10,000 | | | | 444,200 | |
American Express Company | | | 4,000 | | | | 483,640 | |
Discover Financial Services | | | 12,000 | | | | 1,086,360 | |
Navient Corporation | | | 75,000 | | | | 736,500 | |
Synchrony Financial | | | 80,000 | | | | 2,776,800 | |
| | | | | | | | 6,256,780 | |
Health Care — 17.3% | | | | | | | | |
Biotech & Pharma — 9.2% | | | | | | | | |
ADMA Biologics, Inc. (a) | | | 80,000 | | | | 156,000 | |
Amgen, Inc. | | | 12,000 | | | | 2,759,040 | |
Amneal Pharmaceuticals, Inc. (a) | | | 120,000 | | | | 548,400 | |
ANI Pharmaceuticals, Inc. (a) | | | 30,000 | | | | 871,200 | |
Biogen, Inc. (a) | | | 12,000 | | | | 2,938,320 | |
Celldex Therapeutics, Inc. (a) | | | 25,000 | | | | 438,000 | |
Corcept Therapeutics, Inc. (a) | | | 140,000 | | | | 3,662,400 | |
CRISPR Therapeutics AG (a) | | | 10,000 | | | | 1,531,100 | |
Editas Medicine, Inc. (a) | | | 30,000 | | | | 2,103,300 | |
electroCore, Inc. (a) | | | 120,000 | | | | 187,200 | |
Exelixis, Inc. (a) | | | 100,000 | | | | 2,007,000 | |
Gilead Sciences, Inc. | | | 20,000 | | | | 1,165,200 | |
ImmunoGen, Inc. (a) | | | 80,000 | | | | 516,000 | |
Innoviva, Inc. (a) | | | 50,000 | | | | 619,500 | |
Jazz Pharmaceuticals plc (a) | | | 20,000 | | | | 3,301,000 | |
Jounce Therapeutics, Inc. (a) | | | 50,000 | | | | 350,000 | |
Lannett Company, Inc. (a) | | | 7,500 | | | | 48,900 | |
Pulmatrix, Inc. (a) | | | 200,000 | | | | 238,000 | |
Hussman Strategic Growth Fund
Schedule of Investments (continued) |
December 31, 2020 (Unaudited) |
COMMON STOCKS — 103.2% (continued) | | Shares | | | Value | |
Health Care — 17.3% (continued) | | | | | | | | |
Biotech & Pharma — 9.2% (continued) | | | | | | | | |
Supernus Pharmaceuticals, Inc. (a) | | | 50,000 | | | $ | 1,258,000 | |
United Therapeutics Corporation (a) | | | 10,000 | | | | 1,517,900 | |
Vanda Pharmaceuticals, Inc. (a) | | | 50,000 | | | | 657,000 | |
Vertex Pharmaceuticals, Inc. (a) | | | 5,000 | | | | 1,181,700 | |
Viatris, Inc. (a) | | | 40,000 | | | | 749,600 | |
| | | | | | | | 28,804,760 | |
Health Care Facilities & Services — 5.0% | | | | | | | | |
AdaptHealth Corporation (a) | | | 20,000 | | | | 751,200 | |
AmerisourceBergen Corporation | | | 20,000 | | | | 1,955,200 | |
Cigna Corporation | | | 12,000 | | | | 2,498,160 | |
Community Health Systems, Inc. (a) | | | 100,000 | | | | 743,000 | |
CVS Health Corporation | | | 40,000 | | | | 2,732,000 | |
Ontrak, Inc. (a) | | | 20,000 | | | | 1,235,800 | |
Owens & Minor, Inc. | | | 80,000 | | | | 2,164,000 | |
Patterson Companies, Inc. | | | 70,000 | | | | 2,074,100 | |
Tivity Health, Inc. (a) | | | 75,000 | | | | 1,469,250 | |
| | | | | | | | 15,622,710 | |
Medical Equipment & Devices — 3.1% | | | | | | | | |
Accuray, Inc. (a) | | | 80,000 | | | | 333,600 | |
Alpha Pro Tech Ltd. (a) | | | 100,000 | | | | 1,115,000 | |
Fluidigm Corporation (a) | | | 200,000 | | | | 1,200,000 | |
GenMark Diagnostics, Inc. (a) | | | 35,000 | | | | 511,000 | |
Inogen, Inc. (a) | | | 60,000 | | | | 2,680,800 | |
Luminex Corporation | | | 75,000 | | | | 1,734,000 | |
Meridian Bioscience, Inc. (a) | | | 125,000 | | | | 2,336,250 | |
| | | | | | | | 9,910,650 | |
Industrials — 3.8% | | | | | | | | |
Commercial Support Services — 1.3% | | | | | | | | |
ASGN, Inc. (a) | | | 10,000 | | | | 835,300 | |
Cimpress plc (a) | | | 30,000 | | | | 2,632,200 | |
H&R Block, Inc. | | | 35,000 | | | | 555,100 | |
| | | | | | | | 4,022,600 | |
Electrical Equipment — 0.4% | | | | | | | | |
Bloom Energy Corporation - Class A (a) | | | 28,000 | | | | 802,480 | |
WidePoint Corporation (a) | | | 50,000 | | | | 505,500 | |
| | | | | | | | 1,307,980 | |
Hussman Strategic Growth Fund
Schedule of Investments (continued) |
December 31, 2020 (Unaudited) |
COMMON STOCKS — 103.2% (continued) | | Shares | | | Value | |
Industrials — 3.8% (continued) | | | | | | | | |
Engineering & Construction — 0.4% | | | | | | | | |
Infrastructure & Energy Alternatives, Inc. (a) | | | 75,000 | | | $ | 1,242,750 | |
| | | | | | | | | |
Industrial Intermediate Products — 0.2% | | | | | | | | |
Proto Labs, Inc. (a) | | | 4,000 | | | | 613,600 | |
| | | | | | | | | |
Industrial Support Services — 0.3% | | | | | | | | |
MSC Industrial Direct Company, Inc. - Class A | | | 10,000 | | | | 843,900 | |
| | | | | | | | | |
Transportation & Logistics — 1.2% | | | | | | | | |
C.H. Robinson Worldwide, Inc. | | | 25,000 | | | | 2,346,750 | |
Cryoport, Inc. (a) | | | 10,000 | | | | 438,800 | |
Expeditors International of Washington, Inc. | | | 10,000 | | | | 951,100 | |
| | | | | | | | 3,736,650 | |
Materials — 5.2% | | | | | | | | |
Chemicals — 1.0% | | | | | | | | |
Ingevity Corporation (a) | | | 10,000 | | | | 757,300 | |
Kraton Corporation (a) | | | 40,000 | | | | 1,111,600 | |
Valvoline, Inc. | | | 50,000 | | | | 1,157,000 | |
| | | | | | | | 3,025,900 | |
Containers & Packaging — 1.2% | | | | | | | | |
Berry Global Group, Inc. (a) | | | 50,000 | | | | 2,809,500 | |
Silgan Holdings, Inc. | | | 30,000 | | | | 1,112,400 | |
| | | | | | | | 3,921,900 | |
Metals & Mining — 3.0% | | | | | | | | |
Agnico Eagle Mines Ltd. | | | 15,000 | | | | 1,057,650 | |
AngloGold Ashanti Ltd. - ADR | | | 25,000 | | | | 565,500 | |
Barrick Gold Corporation | | | 110,000 | | | | 2,505,800 | |
Compass Minerals International, Inc. | | | 20,000 | | | | 1,234,400 | |
Kinross Gold Corporation | | | 75,000 | | | | 550,500 | |
Newmont Corporation | | | 50,000 | | | | 2,994,500 | |
Royal Gold, Inc. | | | 4,000 | | | | 425,440 | |
| | | | | | | | 9,333,790 | |
Real Estate — 0.3% | | | | | | | | |
Real Estate Services — 0.3% | | | | | | | | |
eXp World Holdings, Inc. (a) | | | 15,000 | | | | 946,800 | |
| | | | | | | | | |
Hussman Strategic Growth Fund
Schedule of Investments (continued) |
December 31, 2020 (Unaudited) |
COMMON STOCKS — 103.2% (continued) | | Shares | | | Value | |
Technology — 16.9% | | | | | | | | |
Semiconductors — 1.1% | | | | | | | | |
Intel Corporation | | | 70,000 | | | $ | 3,487,400 | |
| | | | | | | | | |
Software — 4.6% | | | | | | | | |
Akamai Technologies, Inc. (a) | | | 10,000 | | | | 1,049,900 | |
Citrix Systems, Inc. | | | 12,000 | | | | 1,561,200 | |
Cloudera, Inc. (a) | | | 80,000 | | | | 1,112,800 | |
Ebix, Inc. | | | 35,000 | | | | 1,328,950 | |
Evolent Health, Inc. - Class A (a) | | | 100,000 | | | | 1,603,000 | |
Fortinet, Inc. (a) | | | 6,000 | | | | 891,180 | |
Microsoft Corporation | | | 500 | | | | 111,210 | |
Oracle Corporation | | | 20,000 | | | | 1,293,800 | |
Qualys, Inc. (a) | | | 10,000 | | | | 1,218,700 | |
SciPlay Corporation - Class A (a) | | | 50,000 | | | | 692,500 | |
VirnetX Holding Corporation | | | 100,000 | | | | 504,000 | |
VMware, Inc. - Class A (a) | | | 15,000 | | | | 2,103,900 | |
Zoom Video Communications, Inc. - Class A (a) | | | 2,500 | | | | 843,300 | |
| | | | | | | | 14,314,440 | |
Technology Hardware — 7.7% | | | | | | | | |
Apple, Inc. | | | 4,000 | | | | 530,760 | |
Arista Networks, Inc. (a) | | | 4,000 | | | | 1,162,280 | |
Ciena Corporation (a) | | | 40,000 | | | | 2,114,000 | |
Cisco Systems, Inc. | | | 40,000 | | | | 1,790,000 | |
Clearfield, Inc. (a) | | | 34,500 | | | | 852,840 | |
F5 Networks, Inc. (a) | | | 8,000 | | | | 1,407,520 | |
Infinera Corporation (a) | | | 160,000 | | | | 1,676,800 | |
Juniper Networks, Inc. | | | 50,000 | | | | 1,125,500 | |
Maxar Technologies, Inc. | | | 40,000 | | | | 1,543,600 | |
NetApp, Inc. | | | 20,000 | | | | 1,324,800 | |
Plantronics, Inc. | | | 40,000 | | | | 1,081,200 | |
Ribbon Communications, Inc. (a) | | | 150,000 | | | | 984,000 | |
Seagate Technology plc | | | 10,000 | | | | 621,600 | |
Super Micro Computer, Inc. (a) | | | 75,000 | | | | 2,374,500 | |
SYNNEX Corporation | | | 10,000 | | | | 814,400 | |
Turtle Beach Corporation (a) | | | 125,000 | | | | 2,693,750 | |
Ubiquiti, Inc. | | | 8,000 | | | | 2,228,080 | |
| | | | | | | | 24,325,630 | |
Hussman Strategic Growth Fund
Schedule of Investments (continued) |
December 31, 2020 (Unaudited) |
COMMON STOCKS — 103.2% (continued) | | Shares | | | Value | |
Technology — 16.9% (continued) | | | | | | | | |
Technology Services — 3.5% | | | | | | | | |
Cognizant Technology Solutions Corporation - Class A | | | 32,500 | | | $ | 2,663,375 | |
FactSet Research Systems, Inc. | | | 2,500 | | | | 831,250 | |
Green Dot Corporation - Class A (a) | | | 20,000 | | | | 1,116,000 | |
Infosys Ltd. - ADR | | | 150,000 | | | | 2,542,500 | |
International Business Machines Corporation | | | 10,000 | | | | 1,258,800 | |
NIC, Inc. | | | 100,000 | | | | 2,583,000 | |
| | | | | | | | 10,994,925 | |
| | | | | | | | | |
Total Common Stocks (Cost $280,824,102) (b) | | | | | | $ | 323,748,997 | |
EXCHANGE-TRADED PUT OPTION CONTRACTS — 0.7% | | Contracts | | | Notional
Amount | | | Value | |
Russell 2000 Index Option, 03/19/2021 at $1,450 | | | 700 | | | $ | 138,239,850 | | | $ | 627,900 | |
S&P 500 Index Option, 03/19/2021 at $3,200 | | | 480 | | | | 180,291,360 | | | | 1,520,160 | |
Total Put Option Contracts (Cost $8,238,294) | | | | | | $ | 318,531,210 | | | $ | 2,148,060 | |
| | | | | | | | | | | | | |
Total Investments at Value — 103.9% (Cost $289,062,396) | | | | | | | | | | $ | 325,897,057 | |
Hussman Strategic Growth Fund
Schedule of Investments (continued) |
December 31, 2020 (Unaudited) |
MONEY MARKET FUNDS — 44.0% | | Shares | | | Value | |
Invesco Short-Term Investments Trust - Treasury Portfolio - Institutional Class, 0.01% (c) (Cost $137,977,882) | | | 137,977,882 | | | $ | 137,977,882 | |
| | | | | | | | | |
Total Investments and Money Market Funds at Value — 147.9% (Cost $427,040,278) | | | | | | $ | 463,874,939 | |
| | | | | | | | | |
Written Call Option Contracts — (48.4%) | | | | | | | (151,798,180 | ) |
| | | | | | | | | |
Other Assets in Excess of Liabilities — 0.5% | | | | | | | 1,671,591 | |
| | | | | | | | | |
Net Assets — 100.0% | | | | | | $ | 313,748,350 | |
ADR - American Depositary Receipt. |
(a) | Non-income producing security. |
(b) | Common stocks owned by the Fund are held in escrow by the Fund’s custodian (or by a securities depository) to secure the Fund’s obligations to settle outstanding call option contracts it has written (Note 1). |
(c) | The rate shown is the 7-day effective yield as of December 31, 2020. |
See accompanying notes to financial statements. |
Hussman Strategic Growth Fund
Schedule of Open Written Option Contracts |
December 31, 2020 (Unaudited) |
EXCHANGE-TRADED WRITTEN CALL OPTION CONTRACTS | | Contracts | | | Notional
Amount | | | Strike
Price | | | Expiration
Date | | | Value of
Options | |
Call Option Contracts |
Russell 2000 Index Option | | | 700 | | | $ | 138,239,850 | | | $ | 1,000 | | | | 03/19/2021 | | | $ | 68,011,300 | |
S&P 500 Index Option | | | 480 | | | | 180,291,360 | | | | 2,000 | | | | 03/19/2021 | | | | 83,786,880 | |
Total Written Call Option Contracts (Premiums received $129,142,424) | | | | | | $ | 318,531,210 | | | | | | | | | | | $ | 151,798,180 | |
See accompanying notes to financial statements. |
Hussman Strategic Allocation Fund
Schedule of Investments |
December 31, 2020 (Unaudited) |
COMMON STOCKS — 55.7% | | Shares | | | Value | |
Communications — 4.7% | | | | | | | | |
Cable & Satellite — 0.3% | | | | | | | | |
Sirius XM Holdings, Inc. | | | 6,000 | | | $ | 38,220 | |
| | | | | | | | | |
Entertainment Content — 1.1% | | | | | | | | |
AMC Networks, Inc. - Class A (a) | | | 2,000 | | | | 71,540 | |
Electronic Arts, Inc. | | | 300 | | | | 43,080 | |
ViacomCBS, Inc. - Class B | | | 1,000 | | | | 37,260 | |
| | | | | | | | 151,880 | |
Internet Media & Services — 1.6% | | | | | | | | |
Alphabet, Inc. - Class C (a) | | | 10 | | | | 17,519 | |
Baidu, Inc. - ADR (a) | | | 200 | | | | 43,248 | |
Facebook, Inc. - Class A (a) | | | 40 | | | | 10,926 | |
GrubHub, Inc. (a) | | | 500 | | | | 37,135 | |
Shutterstock, Inc. | | | 600 | | | | 43,020 | |
Stamps.com, Inc. (a) | | | 300 | | | | 58,857 | |
TrueCar, Inc. (a) | | | 2,000 | | | | 8,400 | |
| | | | | | | | 219,105 | |
Publishing & Broadcasting — 0.8% | | | | | | | | |
Gray Television, Inc. (a) | | | 5,000 | | | | 89,450 | |
Meredith Corporation | | | 700 | | | | 13,440 | |
Urban One, Inc. (a) | | | 500 | | | | 2,105 | |
| | | | | | | | 104,995 | |
Telecommunications — 0.9% | | | | | | | | |
AT&T, Inc. | | | 2,000 | | | | 57,520 | |
CenturyLink, Inc. | | | 2,000 | | | | 19,500 | |
Consolidated Communications Holdings, Inc. (a) | | | 3,000 | | | | 14,670 | |
Verizon Communications, Inc. | | | 400 | | | | 23,500 | |
| | | | | | | | 115,190 | |
Consumer Discretionary — 16.1% | | | | | | | | |
Apparel & Textile Products — 0.6% | | | | | | | | |
Capri Holdings Ltd. (a) | | | 500 | | | | 21,000 | |
Hanesbrands, Inc. | | | 3,750 | | | | 54,675 | |
| | | | | | | | 75,675 | |
Automotive — 0.1% | | | | | | | | |
Tenneco, Inc. - Class A (a) | | | 1,500 | | | | 15,900 | |
| | | | | | | | | |
Hussman Strategic Allocation Fund
Schedule of Investments (continued) |
December 31, 2020 (Unaudited) |
COMMON STOCKS — 55.7% (continued) | | Shares | | | Value | |
Consumer Discretionary — 16.1% (continued) | | | | | | | | |
Consumer Services — 1.1% | | | | | | | | |
2U, Inc. (a) | | | 2,000 | | | $ | 80,020 | |
Medifast, Inc. | | | 50 | | | | 9,817 | |
Stride, Inc. (a) | | | 1,500 | | | | 31,845 | |
WW International, Inc. (a) | | | 1,000 | | | | 24,400 | |
| | | | | | | | 146,082 | |
E-Commerce Discretionary — 1.8% | | | | | | | | |
Amazon.com, Inc. (a) | | | 6 | | | | 19,542 | |
Chewy, Inc. - Class A (a) | | | 150 | | | | 13,483 | |
eBay, Inc. | | | 1,500 | | | | 75,375 | |
Etsy, Inc. (a) | | | 250 | | | | 44,478 | |
PetMed Express, Inc. | | | 2,500 | | | | 80,150 | |
| | | | | | | | 233,028 | |
Home & Office Products — 1.1% | | | | | | | | |
ACCO Brands Corporation | | | 2,000 | | | | 16,900 | |
iRobot Corporation (a) | | | 1,000 | | | | 80,290 | |
Tupperware Brands Corporation (a) | | | 1,625 | | | | 52,634 | |
| | | | | | | | 149,824 | |
Home Construction — 2.0% | | | | | | | | |
Century Communities, Inc. (a) | | | 1,875 | | | | 82,088 | |
D.R. Horton, Inc. | | | 400 | | | | 27,568 | |
Lennar Corporation - Class A | | | 400 | | | | 30,492 | |
LGI Homes, Inc. (a) | | | 250 | | | | 26,462 | |
M/I Homes, Inc. (a) | | | 500 | | | | 22,145 | |
Meritage Homes Corporation (a) | | | 250 | | | | 20,705 | |
PulteGroup, Inc. | | | 500 | | | | 21,560 | |
Toll Brothers, Inc. | | | 500 | | | | 21,735 | |
TRI Pointe Group, Inc. (a) | | | 1,000 | | | | 17,250 | |
| | | | | | | | 270,005 | |
Leisure Facilities & Services — 0.8% | | | | | | | | |
Brinker International, Inc. | | | 500 | | | | 28,285 | |
Domino’s Pizza, Inc. | | | 140 | | | | 53,684 | |
Waitr Holdings, Inc. (a) | | | 10,000 | | | | 27,800 | |
| | | | | | | | 109,769 | |
Leisure Products — 0.6% | | | | | | | | |
Malibu Boats, Inc. - Class A (a) | | | 1,000 | | | | 62,440 | |
Thor Industries, Inc. | | | 200 | | | | 18,598 | |
| | | | | | | | 81,038 | |
Hussman Strategic Allocation Fund
Schedule of Investments (continued) |
December 31, 2020 (Unaudited) |
COMMON STOCKS — 55.7% (continued) | | Shares | | | Value | |
Consumer Discretionary — 16.1% (continued) | | | | | | | | |
Retail - Discretionary — 8.0% | | | | | | | | |
At Home Group, Inc. (a) | | | 1,500 | | | $ | 23,190 | |
Bed Bath & Beyond, Inc. | | | 2,000 | | | | 35,520 | |
Big 5 Sporting Goods Corporation | | | 3,000 | | | | 30,630 | |
Buckle, Inc. (The) | | | 500 | | | | 14,600 | |
Designer Brands, Inc. - Class A | | | 1,000 | | | | 7,650 | |
Dick’s Sporting Goods, Inc. | | | 1,300 | | | | 73,073 | |
Duluth Holdings, Inc. - Class B (a) | | | 3,500 | | | | 36,960 | |
GameStop Corporation - Class A (a) | | | 3,000 | | | | 56,520 | |
Gap, Inc. (The) | | | 500 | | | | 10,095 | |
Hibbett Sports, Inc. (a) | | | 2,000 | | | | 92,360 | |
Home Depot, Inc. (The) | | | 150 | | | | 39,843 | |
Kohl’s Corporation | | | 2,000 | | | | 81,380 | |
L Brands, Inc. | | | 500 | | | | 18,595 | |
Lumber Liquidators Holdings, Inc. (a) | | | 1,000 | | | | 30,740 | |
Macy’s, Inc. | | | 4,000 | | | | 45,000 | |
MarineMax, Inc. (a) | | | 1,000 | | | | 35,030 | |
Michaels Companies, Inc. (The) (a) | | | 5,000 | | | | 65,050 | |
Nordstrom, Inc. | | | 500 | | | | 15,605 | |
Sally Beauty Holdings, Inc. (a) | | | 5,000 | | | | 65,200 | |
Sleep Number Corporation (a) | | | 500 | | | | 40,930 | |
Sportman’s Warehouse Holdings, Inc. (a) | | | 1,000 | | | | 17,550 | |
Tractor Supply Company | | | 500 | | | | 70,290 | |
Ulta Beauty, Inc. (a) | | | 200 | | | | 57,432 | |
Urban Outfitters, Inc. (a) | | | 1,000 | | | | 25,600 | |
Williams-Sonoma, Inc. | | | 500 | | | | 50,920 | |
Zumiez, Inc. (a) | | | 1,000 | | | | 36,780 | |
| | | | | | | | 1,076,543 | |
Consumer Staples — 7.2% | | | | | | | | |
Food — 2.1% | | | | | | | | |
B&G Foods, Inc. | | | 2,500 | | | | 69,325 | |
Campbell Soup Company | | | 1,000 | | | | 48,350 | |
General Mills, Inc. | | | 700 | | | | 41,160 | |
J.M. Smucker Company (The) | | | 400 | | | | 46,240 | |
Kellogg Company | | | 600 | | | | 37,338 | |
LifeVantage Corporation (a) | | | 500 | | | | 4,660 | |
USANA Health Sciences, Inc. (a) | | | 500 | | | | 38,550 | |
| | | | | | | | 285,623 | |
Hussman Strategic Allocation Fund
Schedule of Investments (continued) |
December 31, 2020 (Unaudited) |
COMMON STOCKS — 55.7% (continued) | | Shares | | | Value | |
Consumer Staples — 7.2% (continued) | | | | | | | | |
Household Products — 0.5% | | | | | | | | |
Clearwater Paper Corporation (a) | | | 300 | | | $ | 11,325 | |
Nu Skin Enterprises, Inc. - Class A | | | 1,000 | | | | 54,630 | |
| | | | | | | | 65,955 | |
Retail - Consumer Staples — 4.6% | | | | | | | | |
Big Lots, Inc. | | | 1,875 | | | | 80,494 | |
Dollar General Corporation | | | 80 | | | | 16,824 | |
Ingles Markets, Inc. - Class A | | | 1,650 | | | | 70,389 | |
Kroger Company (The) | | | 2,500 | | | | 79,400 | |
Natural Grocers by Vitamin Cottage, Inc. | | | 2,000 | | | | 27,480 | |
Ollie’s Bargain Outlet Holdings, Inc. (a) | | | 500 | | | | 40,885 | |
Rite Aid Corporation (a) | | | 4,000 | | | | 63,320 | |
Sprouts Farmers Market, Inc. (a) | | | 3,500 | | | | 70,350 | |
United Natural Foods, Inc. (a) | | | 5,000 | | | | 79,850 | |
Walgreens Boots Alliance, Inc. | | | 1,500 | | | | 59,820 | |
Weis Markets, Inc. | | | 400 | | | | 19,124 | |
| | | | | | | | 607,936 | |
Energy — 1.1% | | | | | | | | |
Renewable Energy — 1.1% | | | | | | | | |
Aemetis, Inc. (a) | | | 600 | | | | 1,494 | |
Broadwind, Inc. (a) | | | 1,200 | | | | 9,516 | |
Canadian Solar, Inc. (a) | | | 1,000 | | | | 51,240 | |
First Solar, Inc. (a) | | | 200 | | | | 19,784 | |
JinkoSolar Holding Company Ltd. - ADR (a) | | | 300 | | | | 18,561 | |
Renewable Energy Group, Inc. (a) | | | 200 | | | | 14,164 | |
SolarEdge Technologies, Inc. (a) | | | 40 | | | | 12,765 | |
Sunworks, Inc. (a) | | | 5,000 | | | | 25,600 | |
| | | | | | | | 153,124 | |
Financials — 3.3% | | | | | | | | |
Asset Management — 0.4% | | | | | | | | |
BrightSphere Investment Group, Inc. | | | 700 | | | | 13,496 | |
Federated Hermes, Inc. | | | 1,000 | | | | 28,890 | |
Ranpak Holdings Corporation (a) | | | 500 | | | | 6,720 | |
| | | | | | | | 49,106 | |
Banking — 0.2% | | | | | | | | |
Signature Bank | | | 200 | | | | 27,058 | |
| | | | | | | | | |
Hussman Strategic Allocation Fund
Schedule of Investments (continued) |
December 31, 2020 (Unaudited) |
COMMON STOCKS — 55.7% (continued) | | Shares | | | Value | |
Financials — 3.3% (continued) | | | | | | | | |
Institutional Financial Services — 0.9% | | | | | | | | |
State Street Corporation | | | 500 | | | $ | 36,390 | |
StoneX Group, Inc. (a) | | | 1,000 | | | | 57,900 | |
Virtu Financial, Inc. - Class A | | | 1,000 | | | | 25,170 | |
| | | | | | | | 119,460 | |
Insurance — 0.7% | | | | | | | | |
Allstate Corporation (The) | | | 300 | | | | 32,979 | |
Principal Financial Group, Inc. | | | 1,000 | | | | 49,610 | |
Progressive Corporation (The) | | | 200 | | | | 19,776 | |
| | | | | | | | 102,365 | |
Specialty Finance — 1.1% | | | | | | | | |
AerCap Holdings N.V. (a) | | | 400 | | | | 18,232 | |
Air Lease Corporation | | | 200 | | | | 8,884 | |
American Express Company | | | 80 | | | | 9,673 | |
Discover Financial Services | | | 300 | | | | 27,159 | |
Navient Corporation | | | 1,500 | | | | 14,730 | |
Synchrony Financial | | | 2,000 | | | | 69,420 | |
| | | | | | | | 148,098 | |
Health Care — 9.6% | | | | | | | | |
Biotech & Pharma — 5.2% | | | | | | | | |
ADMA Biologics, Inc. (a) | | | 2,000 | | | | 3,900 | |
Amgen, Inc. | | | 300 | | | | 68,976 | |
Amneal Pharmaceuticals, Inc. (a) | | | 3,000 | | | | 13,710 | |
ANI Pharmaceuticals, Inc. (a) | | | 400 | | | | 11,616 | |
Biocept, Inc. (a) | | | 3,500 | | | | 15,540 | |
Biogen, Inc. (a) | | | 300 | | | | 73,458 | |
Celldex Therapeutics, Inc. (a) | | | 500 | | | | 8,760 | |
Corcept Therapeutics, Inc. (a) | | | 3,500 | | | | 91,560 | |
CRISPR Therapeutics AG (a) | | | 200 | | | | 30,622 | |
Editas Medicine, Inc. (a) | | | 750 | | | | 52,582 | |
electroCore, Inc. (a) | | | 3,000 | | | | 4,680 | |
Exelixis, Inc. (a) | | | 2,500 | | | | 50,175 | |
Gilead Sciences, Inc. | | | 400 | | | | 23,304 | |
ImmunoGen, Inc. (a) | | | 2,000 | | | | 12,900 | |
Innoviva, Inc. (a) | | | 1,000 | | | | 12,390 | |
Jazz Pharmaceuticals plc (a) | | | 500 | | | | 82,525 | |
Jounce Therapeutics, Inc. (a) | | | 1,000 | | | | 7,000 | |
Lannett Company, Inc. (a) | | | 150 | | | | 978 | |
Hussman Strategic Allocation Fund
Schedule of Investments (continued) |
December 31, 2020 (Unaudited) |
COMMON STOCKS — 55.7% (continued) | | Shares | | | Value | |
Health Care — 9.6% (continued) | | | | | | | | |
Biotech & Pharma — 5.2% (continued) | | | | | | | | |
Pulmatrix, Inc. (a) | | | 5,000 | | | $ | 5,950 | |
Supernus Pharmaceuticals, Inc. (a) | | | 1,000 | | | | 25,160 | |
United Therapeutics Corporation (a) | | | 200 | | | | 30,358 | |
Vanda Pharmaceuticals, Inc. (a) | | | 1,000 | | | | 13,140 | |
Vertex Pharmaceuticals, Inc. (a) | | | 100 | | | | 23,634 | |
Viatris, Inc. (a) | | | 1,600 | | | | 29,984 | |
| | | | | | | | 692,902 | |
Health Care Facilities & Services — 2.8% | | | | | | | | |
AdaptHealth Corporation (a) | | | 500 | | | | 18,780 | |
AmerisourceBergen Corporation | | | 500 | | | | 48,880 | |
Cigna Corporation | | | 300 | | | | 62,454 | |
Community Health Systems, Inc. (a) | | | 2,000 | | | | 14,860 | |
CVS Health Corporation | | | 1,000 | | | | 68,300 | |
Ontrak, Inc. (a) | | | 400 | | | | 24,716 | |
Owens & Minor, Inc. | | | 2,000 | | | | 54,100 | |
Patterson Companies, Inc. | | | 1,400 | | | | 41,482 | |
Tivity Health, Inc. (a) | | | 2,000 | | | | 39,180 | |
| | | | | | | | 372,752 | |
Medical Equipment & Devices — 1.6% | | | | | | | | |
Accuray, Inc. (a) | | | 2,000 | | | | 8,340 | |
Alpha Pro Tech Ltd. (a) | | | 2,000 | | | | 22,300 | |
Fluidigm Corporation (a) | | | 4,000 | | | | 24,000 | |
GenMark Diagnostics, Inc. (a) | | | 750 | | | | 10,950 | |
Inogen, Inc. (a) | | | 1,500 | | | | 67,020 | |
Luminex Corporation | | | 1,500 | | | | 34,680 | |
Meridian Bioscience, Inc. (a) | | | 3,000 | | | | 56,070 | |
| | | | | | | | 223,360 | |
Industrials — 2.0% | | | | | | | | |
Commercial Support Services — 0.7% | | | | | | | | |
ASGN, Inc. (a) | | | 200 | | | | 16,706 | |
Cimpress plc. (a) | | | 800 | | | | 70,192 | |
H&R Block, Inc. | | | 700 | | | | 11,102 | |
| | | | | | | | 98,000 | |
Electrical Equipment — 0.2% | | | | | | | | |
Bloom Energy Corporation - Class A (a) | | | 700 | | | | 20,062 | |
WidePoint Corporation (a) | | | 1,000 | | | | 10,110 | |
| | | | | | | | 30,172 | |
Hussman Strategic Allocation Fund
Schedule of Investments (continued) |
December 31, 2020 (Unaudited) |
COMMON STOCKS — 55.7% (continued) | | Shares | | | Value | |
Industrials — 2.0% (continued) | | | | | | | | |
Engineering & Construction — 0.3% | | | | | | | | |
Infrastructure & Energy Alternatives, Inc. (a) | | | 2,000 | | | $ | 33,140 | |
| | | | | | | | | |
Industrial Intermediate Products — 0.1% | | | | | | | | |
Proto Labs, Inc. (a) | | | 100 | | | | 15,340 | |
| | | | | | | | | |
Industrial Support Services — 0.1% | | | | | | | | |
MSC Industrial Direct Company, Inc. - Class A | | | 200 | | | | 16,878 | |
| | | | | | | | | |
Transportation & Logistics — 0.6% | | | | | | | | |
C.H. Robinson Worldwide, Inc. | | | 500 | | | | 46,935 | |
Cryoport, Inc. (a) | | | 200 | | | | 8,776 | |
Expeditors International of Washington, Inc. | | | 200 | | | | 19,022 | |
| | | | | | | | 74,733 | |
Materials — 2.7% | | | | | | | | |
Chemicals — 0.5% | | | | | | | | |
Ingevity Corporation (a) | | | 200 | | | | 15,146 | |
Kraton Corporation (a) | | | 1,000 | | | | 27,790 | |
Valvoline, Inc. | | | 1,000 | | | | 23,140 | |
| | | | | | | | 66,076 | |
Containers & Packaging — 0.8% | | | | | | | | |
Berry Global Group, Inc. (a) | | | 1,300 | | | | 73,047 | |
Silgan Holdings, Inc. | | | 700 | | | | 25,956 | |
| | | | | | | | 99,003 | |
Metals & Mining — 1.4% | | | | | | | | |
Agnico Eagle Mines Ltd. | | | 300 | | | | 21,153 | |
AngloGold Ashanti Ltd. - ADR | | | 500 | | | | 11,310 | |
Barrick Gold Corporation | | | 2,200 | | | | 50,116 | |
Compass Minerals International, Inc. | | | 400 | | | | 24,688 | |
Kinross Gold Corporation | | | 2,000 | | | | 14,680 | |
Newmont Corporation | | | 1,000 | | | | 59,890 | |
Royal Gold, Inc. | | | 80 | | | | 8,509 | |
| | | | | | | | 190,346 | |
Real Estate — 0.1% | | | | | | | | |
Real Estate Services — 0.1% | | | | | | | | |
eXp World Holdings, Inc. (a) | | | 300 | | | | 18,936 | |
| | | | | | | | | |
Hussman Strategic Allocation Fund
Schedule of Investments (continued) |
December 31, 2020 (Unaudited) |
COMMON STOCKS — 55.7% (continued) | | Shares | | | Value | |
Technology — 8.9% | | | | | | | | |
Semiconductors — 0.6% | | | | | | | | |
Intel Corporation | | | 1,700 | | | $ | 84,694 | |
| | | | | | | | | |
Software — 2.4% | | | | | | | | |
Akamai Technologies, Inc. (a) | | | 250 | | | | 26,247 | |
Citrix Systems, Inc. | | | 300 | | | | 39,030 | |
Cloudera, Inc. (a) | | | 2,000 | | | | 27,820 | |
Ebix, Inc. | | | 700 | | | | 26,579 | |
Evolent Health, Inc. - Class A (a) | | | 2,000 | | | | 32,060 | |
Fortinet, Inc. (a) | | | 150 | | | | 22,280 | |
Microsoft Corporation | | | 50 | | | | 11,121 | |
Oracle Corporation | | | 400 | | | | 25,876 | |
Qualys, Inc. (a) | | | 200 | | | | 24,374 | |
SciPlay Corporation - Class A (a) | | | 1,000 | | | | 13,850 | |
VirnetX Holding Corporation | | | 2,000 | | | | 10,080 | |
VMware, Inc. - Class A (a) | | | 300 | | | | 42,078 | |
Zoom Video Communications, Inc. - Class A (a) | | | 50 | | | | 16,866 | |
| | | | | | | | 318,261 | |
Technology Hardware — 4.2% | | | | | | | | |
Apple, Inc. | | | 100 | | | | 13,269 | |
Arista Networks, Inc. (a) | | | 80 | | | | 23,246 | |
Ciena Corporation (a) | | | 1,000 | | | | 52,850 | |
Cisco Systems, Inc. | | | 1,000 | | | | 44,750 | |
Clearfield, Inc. (a) | | | 1,000 | | | | 24,720 | |
F5 Networks, Inc. (a) | | | 200 | | | | 35,188 | |
Infinera Corporation (a) | | | 4,000 | | | | 41,920 | |
Juniper Networks, Inc. | | | 1,000 | | | | 22,510 | |
Maxar Technologies, Inc. | | | 1,000 | | | | 38,590 | |
NetApp, Inc. | | | 500 | | | | 33,120 | |
Plantronics, Inc. | | | 800 | | | | 21,624 | |
Ribbon Communications, Inc. (a) | | | 3,000 | | | | 19,680 | |
Seagate Technology plc | | | 200 | | | | 12,432 | |
Super Micro Computer, Inc. (a) | | | 1,250 | | | | 39,575 | |
SYNNEX Corporation | | | 200 | | | | 16,288 | |
Turtle Beach Corporation (a) | | | 3,000 | | | | 64,650 | |
Ubiquiti, Inc. | | | 200 | | | | 55,702 | |
| | | | | | | | 560,114 | |
Hussman Strategic Allocation Fund
Schedule of Investments (continued) |
December 31, 2020 (Unaudited) |
COMMON STOCKS — 55.7% (continued) | | Shares | | | Value | |
Technology — 8.9% (continued) | | | | | | | | |
Technology Services — 1.7% | | | | | | | | |
Cognizant Technology Solutions Corporation - Class A | | | 650 | | | $ | 53,267 | |
FactSet Research Systems, Inc. | | | 50 | | | | 16,625 | |
Green Dot Corporation - Class A (a) | | | 400 | | | | 22,320 | |
Infosys Ltd. - ADR | | | 3,000 | | | | 50,850 | |
International Business Machines Corporation | | | 200 | | | | 25,176 | |
NIC, Inc. | | | 2,500 | | | | 64,575 | |
| | | | | | | | 232,813 | |
| | | | | | | | | |
Total Common Stocks (Cost $6,449,685) (b) | | | | | | $ | 7,473,499 | |
U.S. TREASURY OBLIGATIONS — 14.9% | | Par Value | | | Value | |
U.S. Treasury Notes — 14.9% | | | | | | | | |
1.50%, due 08/31/2021 | | $ | 1,000,000 | | | $ | 1,009,219 | |
0.125%, due 07/31/2022 | | | 500,000 | | | | 500,078 | |
0.625%, due 08/15/2030 | | | 500,000 | | | | 487,500 | |
Total U.S. Treasury Obligations (Cost $1,991,339) | | | | | | $ | 1,996,797 | |
EXCHANGE-TRADED PUT OPTION CONTRACTS — 0.3% | | Contracts | | | Notional
Amount | | | Value | |
Russell 2000 Index Option, 03/19/2021 at $1,100 | | | 15 | | | $ | 2,962,283 | | | $ | 2,640 | |
S&P 500 Index Option, 03/19/2021 at $2,500 | | | 5 | | | | 1,878,035 | | | | 3,210 | |
S&P 500 Index Option, 03/19/2021 at $3,500 | | | 5 | | | | 1,878,035 | | | | 35,205 | |
Total Put Option Contracts (Cost $84,452) | | | | | | $ | 6,718,353 | | | $ | 41,055 | |
| | | | | | | | | | | | | |
Total Investments at Value — 70.9% (Cost $8,525,476) | | | | | | | | | | $ | 9,511,351 | |
Hussman Strategic Allocation Fund
Schedule of Investments (continued) |
December 31, 2020 (Unaudited) |
MONEY MARKET FUNDS — 43.6% | | Shares | | | Value | |
Invesco Short-Term Investments Trust - Treasury Portfolio - Institutional Class, 0.01% (c) (Cost $5,847,619) | | | 5,847,619 | | | $ | 5,847,619 | |
| | | | | | | | | |
Total Investments and Money Market Funds at Value — 114.5% (Cost $14,373,095) | | | | | | $ | 15,358,970 | |
| | | | | | | | | |
Written Call Option Contracts — (15.6%) | | | | | | | (2,089,725 | ) |
| | | | | | | | | |
Other Assets in Excess of Liabilities — 1.1% | | | | | | | 143,047 | |
| | | | | | | | | |
Net Assets — 100.0% | | | | | | $ | 13,412,292 | |
ADR - American Depositary Receipt. |
(a) | Non-income producing security. |
(b) | Common stocks owned by the Fund are held in escrow by the Fund’s custodian (or by a securities depository) to secure the Fund’s obligations to settle outstanding call option contracts it has written (Note 1). |
(c) | The rate shown is the 7-day effective yield as of December 31, 2020. |
See accompanying notes to financial statements. |
Hussman Strategic Allocation Fund
Schedule of Open Written Option Contracts |
December 31, 2020 (Unaudited) |
EXCHANGE-TRADED WRITTEN CALL OPTION CONTRACTS | | Contracts | | | Notional
Amount | | | Strike
Price | | | Expiration
Date | | | Value of
Options | |
Call Option Contracts |
Russell 2000 Index Option | | | 15 | | | $ | 2,962,283 | | | $ | 1,100 | | | | 03/19/2021 | | | $ | 1,308,330 | |
S&P 500 Index Option | | | 5 | | | | 1,878,035 | | | | 2,500 | | | | 03/19/2021 | | | | 624,685 | |
S&P 500 Index Option | | | 5 | | | | 1,878,035 | | | | 3,500 | | | | 03/19/2021 | | | | 156,710 | |
Total Written Call Option Contracts (Premiums received $1,728,758) | | | | | | $ | 6,718,353 | | | | | | | | | | | $ | 2,089,725 | |
See accompanying notes to financial statements. |
Hussman Strategic Total Return Fund
Schedule of Investments |
December 31, 2020 (Unaudited) |
COMMON STOCKS — 12.5% | | Shares | | | Value | |
Energy — 1.3% | | | | | | | | |
Oil & Gas Producers — 0.9% | | | | | | | | |
Cheniere Energy Partners, L.P. | | | 20,000 | | | $ | 705,000 | |
CNX Resources Corporation (a) | | | 52,800 | | | | 570,240 | |
NuStar Energy, L.P. | | | 31,000 | | | | 446,710 | |
ONEOK, Inc. | | | 985 | | | | 37,804 | |
PBF Energy, Inc. - Class A | | | 35,000 | | | | 248,500 | |
Valero Energy Corporation | | | 15,000 | | | | 848,550 | |
Williams Companies, Inc. (The) | | | 1,293 | | | | 25,925 | |
| | | | | | | | 2,882,729 | |
Oil & Gas Services & Equipment — 0.4% | | | | | | | | |
Halliburton Company | | | 35,000 | | | | 661,500 | |
Helmerich & Payne, Inc. | | | 25,000 | | | | 579,000 | |
| | | | | | | | 1,240,500 | |
Renewable Energy — 0.0% (b) | | | | | | | | |
Beam Global (a) | | | 2,500 | | | | 184,450 | |
| | | | | | | | | |
Materials — 6.0% | | | | | | | | |
Construction Materials — 0.3% | | | | | | | | |
MDU Resources Group, Inc. | | | 35,000 | | | | 921,900 | |
| | | | | | | | | |
Metals & Mining — 5.7% | | | | | | | | |
Agnico Eagle Mines Ltd. | | | 22,500 | | | | 1,586,475 | |
Alamos Gold, Inc. - Class A | | | 75,000 | | | | 656,250 | |
AngloGold Ashanti Ltd. - ADR | | | 37,500 | | | | 848,250 | |
B2Gold Corporation | | | 150,000 | | | | 840,000 | |
Barrick Gold Corporation | | | 165,000 | | | | 3,758,700 | |
Coeur Mining, Inc. (a) | | | 50,000 | | | | 517,500 | |
Compania de Minas Buenaventura S.A.A. - ADR (a) | | | 50,000 | | | | 609,500 | |
Kinross Gold Corporation | | | 110,000 | | | | 807,400 | |
Newmont Corporation | | | 75,000 | | | | 4,491,750 | |
Novagold Resources, Inc. (a) | | | 50,000 | | | | 483,500 | |
Pan American Silver Corporation | | | 20,000 | | | | 690,200 | |
Royal Gold, Inc. | | | 5,500 | | | | 584,980 | |
Wheaton Precious Metals Corporation | | | 40,000 | | | | 1,669,600 | |
Yamana Gold, Inc. | | | 125,000 | | | | 713,750 | |
| | | | | | | | 18,257,855 | |
Hussman Strategic Total Return Fund
Schedule of Investments (continued) |
December 31, 2020 (Unaudited) |
COMMON STOCKS — 12.5% (continued) | | Shares | | | Value | |
Utilities — 5.2% | | | | | | | | |
Electric & Gas Marketing & Trading — 0.0% (b) | | | | | | | | |
Spark Energy, Inc. - Class A | | | 2,500 | | | $ | 23,925 | |
| | | | | | | | | |
Electric Utilities — 4.9% | | | | | | | | |
AES Corporation (The) | | | 75,000 | | | | 1,762,500 | |
ALLETE, Inc. | | | 15,000 | | | | 929,100 | |
Ameren Corporation | | | 500 | | | | 39,030 | |
American Electric Power Company, Inc. | | | 5,000 | | | | 416,350 | |
Avangrid, Inc. | | | 20,000 | | | | 909,000 | |
Avista Corporation | | | 10,000 | | | | 401,400 | |
Black Hills Corporation | | | 10,000 | | | | 614,500 | |
Consolidated Edison, Inc. | | | 10,000 | | | | 722,700 | |
Dominion Energy, Inc. | | | 5,000 | | | | 376,000 | |
DTE Energy Company | | | 2,000 | | | | 242,820 | |
Duke Energy Corporation | | | 7,500 | | | | 686,700 | |
Edison International | | | 10,000 | | | | 628,200 | |
Entergy Corporation | | | 500 | | | | 49,920 | |
Exelon Corporation | | | 30,000 | | | | 1,266,600 | |
FirstEnergy Corporation | | | 15,000 | | | | 459,150 | |
Hawaiian Electric Industries, Inc. | | | 10,000 | | | | 353,900 | |
NorthWestern Corporation | | | 10,000 | | | | 583,100 | |
NRG Energy, Inc. | | | 20,000 | | | | 751,000 | |
Otter Tail Corporation | | | 10,000 | | | | 426,100 | |
Pinnacle West Capital Corporation | | | 5,000 | | | | 399,750 | |
Portland General Electric Company | | | 20,000 | | | | 855,400 | |
PPL Corporation | | | 35,000 | | | | 987,000 | |
Public Service Enterprise Group, Inc. | | | 10,000 | | | | 583,000 | |
Southern Company (The) | | | 20,000 | | | | 1,228,600 | |
| | | | | | | | 15,671,820 | |
Gas & Water Utilities — 0.3% | | | | | | | | |
Global Water Resources, Inc. | | | 1,000 | | | | 14,410 | |
UGI Corporation | | | 25,000 | | | | 874,000 | |
| | | | | | | | 888,410 | |
| | | | | | | | | |
Total Common Stocks (Cost $40,714,253) | | | | | | $ | 40,071,589 | |
Hussman Strategic Total Return Fund
Schedule of Investments (continued) |
December 31, 2020 (Unaudited) |
EXCHANGE-TRADED FUNDS — 3.1% | | Shares | | | Value | |
Invesco CurrencyShares British Pound Sterling Trust (a) | | | 20,000 | | | $ | 2,642,400 | |
Invesco CurrencyShares Euro Currency Trust (a) | | | 20,000 | | | | 2,294,800 | |
Invesco CurrencyShares Japanese Yen Trust (a) | | | 1,000 | | | | 91,460 | |
Invesco CurrencyShares Swiss Franc Trust (a) | | | 5,000 | | | | 514,850 | |
iShares Gold Trust (a) | | | 125,000 | | | | 2,266,250 | |
SPDR Gold Shares (a) | | | 12,500 | | | | 2,229,500 | |
Total Exchange-Traded Funds (Cost $8,808,015) | | | | | | $ | 10,039,260 | |
U.S. TREASURY OBLIGATIONS — 78.8% | | Par Value | | | Value | |
U.S. Treasury Bills (c) — 15.6% | | | | | | | | |
0.08%, due 01/26/2021 | | $ | 50,000,000 | | | $ | 49,998,854 | |
| | | | | | | | | |
U.S. Treasury Inflation-Protected Notes — 8.5% | | | | | | | | |
2.50%, due 01/15/2029 | | | 12,127,800 | | | | 15,941,822 | |
0.125%, due 01/15/2030 | | | 10,120,500 | | | | 11,299,046 | |
| | | | | | | | 27,240,868 | |
U.S. Treasury Notes — 54.7% | | | | | | | | |
1.75%, due 06/15/2022 | | | 10,000,000 | | | | 10,235,937 | |
1.50%, due 08/15/2022 | | | 25,000,000 | | | | 25,561,523 | |
2.00%, due 05/31/2024 | | | 25,000,000 | | | | 26,536,133 | |
1.375%, due 01/31/2025 | | | 15,000,000 | | | | 15,677,930 | |
2.125%, due 05/31/2026 | | | 10,000,000 | | | | 10,919,141 | |
1.50%, due 08/15/2026 | | | 25,000,000 | | | | 26,477,539 | |
2.25%, due 11/15/2027 | | | 10,000,000 | | | | 11,105,078 | |
0.625%, due 08/15/2030 | | | 50,000,000 | | | | 48,757,812 | |
| | | | | | | | 175,271,093 | |
| | | | | | | | | |
Total U.S. Treasury Obligations (Cost $240,688,342) | | | | | | $ | 252,510,815 | |
| | | | | | | | | |
Total Investments at Value — 94.4% (Cost $290,210,610) | | | | | | $ | 302,621,664 | |
Hussman Strategic Total Return Fund
Schedule of Investments (continued) |
December 31, 2020 (Unaudited) |
MONEY MARKET FUNDS — 5.4% | | Shares | | | Value | |
Invesco Short-Term Investments Trust - Treasury Portfolio - Institutional Class, 0.01% (d) (Cost $17,337,919) | | | 17,337,919 | | | $ | 17,337,919 | |
| | | | | | | | | |
Total Investments and Money Market Funds at Value — 99.8% (Cost $307,548,529) | | | | | | $ | 319,959,583 | |
| | | | | | | | | |
Other Assets in Excess of Liabilities — 0.2% | | | | | | | 747,457 | |
| | | | | | | | | |
Net Assets — 100.0% | | | | | | $ | 320,707,040 | |
ADR - American Depositary Receipt. |
(a) | Non-income producing security. |
(b) | Percentage rounds to less than 0.1%. |
(c) | Rate shown is the annualized yield at time of purchase, not a coupon rate. |
(d) | The rate shown is the 7-day effective yield as of December 31, 2020. |
See accompanying notes to financial statements. |
Hussman Strategic International Fund
Schedule of Investments |
December 31, 2020 (Unaudited) |
COMMON STOCKS — 87.0% | | Shares | | | Value | |
Australia — 1.2% | | | | | | | | |
Accent Group Ltd. (a) | | | 42,000 | | | $ | 74,895 | |
Coles Group Ltd. (a) | | | 4,000 | | | | 55,890 | |
TPG Telecom Ltd. (a) (b) | | | 9,000 | | | | 49,989 | |
| | | | | | | | 180,774 | |
Austria — 1.6% | | | | | | | | |
ams AG (a) (b) | | | 4,000 | | | | 87,157 | |
EVN AG (a) | | | 7,026 | | | | 152,253 | |
| | | | | | | | 239,410 | |
Belgium — 1.5% | | | | | | | | |
Colruyt S.A. | | | 800 | | | | 47,369 | |
Econocom Group SE (a) | | | 15,000 | | | | 45,190 | |
Ontex Group N.V. (a) (b) | | | 5,000 | | | | 67,217 | |
Telenet Group Holding N.V. (a) | | | 1,600 | | | | 68,431 | |
| | | | | | | | 228,207 | |
Canada — 5.7% | | | | | | | | |
BRP, Inc. | | | 1,000 | | | | 66,087 | |
Canadian Utilities Ltd. - Class A | | | 3,000 | | | | 73,301 | |
Celestica, Inc. (b) | | | 10,000 | | | | 80,712 | |
iA Financial Corporation, Inc. | | | 2,500 | | | | 108,416 | |
IGM Financial, Inc. | | | 5,500 | | | | 149,169 | |
Linamar Corporation | | | 2,000 | | | | 105,971 | |
Sun Life Financial, Inc. | | | 3,800 | | | | 169,032 | |
Transcontinental, Inc. - Class A | | | 6,000 | | | | 96,713 | |
| | | | | | | | 849,401 | |
Denmark — 2.1% | | | | | | | | |
Genmab A/S (a) (b) | | | 300 | | | | 121,648 | |
Novo Nordisk A/S - Class B (a) | | | 2,700 | | | | 188,350 | |
| | | | | | | | 309,998 | |
Finland — 0.6% | | | | | | | | |
Stora Enso OYJ - R Shares (a) | | | 2,000 | | | | 38,294 | |
Valmet OYJ (a) | | | 2,000 | | | | 57,498 | |
| | | | | | | | 95,792 | |
France — 5.7% | | | | | | | | |
Albioma S.A. (a) | | | 1,500 | | | | 85,813 | |
Atos SE (a) (b) | | | 1,500 | | | | 136,968 | |
Electricite de France S.A. (a) (b) | | | 7,000 | | | | 110,766 | |
Iliad S.A. (a) | | | 600 | | | | 123,153 | |
IPSOS (a) | | | 2,500 | | | | 84,363 | |
Hussman Strategic International Fund
Schedule of Investments (continued) |
December 31, 2020 (Unaudited) |
COMMON STOCKS — 87.0% (continued) | | Shares | | | Value | |
France — 5.7% (continued) | | | | | | | | |
Sanofi (a) | | | 1,400 | | | $ | 135,686 | |
Sopra Steria Group (a) (b) | | | 500 | | | | 80,593 | |
Trigano S.A | | | 500 | | | | 88,444 | |
| | | | | | | | 845,786 | |
Germany — 9.4% | | | | | | | | |
Bayer AG (a) | | | 1,800 | | | | 106,036 | |
Dermapharm Holding SE | | | 2,000 | | | | 139,164 | |
Dialog Semiconductor plc (a) (b) | | | 3,500 | | | | 190,717 | |
Draegerwerk AG & Company KGaA (a) | | | 1,300 | | | | 100,621 | |
Evonik Industries AG (a) | | | 1,500 | | | | 49,025 | |
Fresenius Medical Care AG & Company KGaA (a) | | | 2,000 | | | | 166,768 | |
Fresenius SE & Company KGaA (a) | | | 1,500 | | | | 69,360 | |
Hornbach Holding AG & Company KGaA | | | 1,500 | | | | 144,210 | |
Siemens Healthineers AG (a) | | | 1,500 | | | | 77,188 | |
Siltronic AG (a) | | | 500 | | | | 78,187 | |
Software AG | | | 2,000 | | | | 81,456 | |
United Internet AG (a) | | | 2,500 | | | | 105,233 | |
Volkswagon AG (a) | | | 400 | | | | 83,398 | |
| | | | | | | | 1,391,363 | |
Italy — 3.1% | | | | | | | | |
ACEA SpA (a) | | | 8,500 | | | | 178,586 | |
Azimut Holdings SpA (a) | | | 6,500 | | | | 141,266 | |
Carel Industries SpA | | | 2,000 | | | | 46,860 | |
Moncler SpA (a) (b) | | | 1,500 | | | | 92,217 | |
| | | | | | | | 458,929 | |
Japan — 25.9% | | | | | | | | |
Advantest Corporation (a) | | | 1,500 | | | | 112,350 | |
Asahi Company. Ltd. (a) | | | 3,200 | | | | 50,340 | |
Astellas Pharma, Inc. (a) | | | 8,000 | | | | 123,866 | |
C.I. Takiron Corporation (a) | | | 11,100 | | | | 74,260 | |
Daiwabo Holdings Company Ltd. (a) | | | 1,200 | | | | 106,822 | |
Enigmo, Inc. (a) (b) | | | 7,500 | | | | 89,873 | |
Feed One Company Ltd. (a) | | | 3,000 | | | | 25,305 | |
Fuji Corporation (Aichi) (a) | | | 2,000 | | | | 52,716 | |
GEO Holdings Corporation (a) | | | 3,400 | | | | 39,905 | |
IBJ, Inc. (a) | | | 9,000 | | | | 68,553 | |
ITOCHU Corporation (a) | | | 4,000 | | | | 115,037 | |
Kaga Electronics Company Ltd. (a) (b) | | | 4,000 | | | | 92,666 | |
Hussman Strategic International Fund
Schedule of Investments (continued) |
December 31, 2020 (Unaudited) |
COMMON STOCKS — 87.0% (continued) | | Shares | | | Value | |
Japan — 25.9% (continued) | | | | | | | | |
Kakaku.com, Inc. (a) | | | 4,800 | | | $ | 131,388 | |
KDDI Corporation (a) | | | 2,500 | | | | 74,124 | |
Kinden Corporation (a) | | | 3,100 | | | | 50,480 | |
Kohnan Shoji Company Ltd. (a) | | | 1,600 | | | | 49,847 | |
Komeri Company Ltd. (a) | | | 2,000 | | | | 56,544 | |
Nihon Chouzai Company Ltd. (a) | | | 8,000 | | | | 115,960 | |
Nippon Telegraph and Telephone Corporation (a) | | | 5,000 | | | | 128,291 | |
Nojima Corporation (a) | | | 1,800 | | | | 49,373 | |
Organo Corporation (a) | | | 1,500 | | | | 89,269 | |
Panasonic Corporation (a) | | | 13,000 | | | | 151,540 | |
RAIZNEXT Corporation (a) | | | 15,000 | | | | 178,327 | |
RS Technologies Company Ltd. (a) | | | 2,000 | | | | 110,367 | |
Sawai Pharmaceutical Company Ltd. (a) | | | 3,000 | | | | 136,146 | |
SCSK Corporation (a) | | | 2,500 | | | | 142,960 | |
Shimamura Company Ltd. (a) | | | 700 | | | | 73,550 | |
Square Enix Holdings Company Ltd. (a) | | | 1,000 | | | | 60,629 | |
Sugi Holdings Company Ltd. (a) | | | 2,000 | | | | 133,594 | |
SUMCO Corporation (a) | | | 8,500 | | | | 186,640 | |
Sundrug Company Ltd. (a) | | | 4,000 | | | | 159,863 | |
T&D Holdings, Inc. (a) | | | 4,000 | | | | 47,314 | |
Taiko Pharmaceutical Company Ltd. (a) | | | 3,100 | | | | 48,460 | |
TDK Corporation (a) | | | 700 | | | | 105,615 | |
TechnoPro Holdings, Inc. (a) (b) | | | 1,200 | | | | 99,688 | |
Tomoku Company Ltd. (a) | | | 3,000 | | | | 49,699 | |
Torii Pharmaceutical Company Ltd. (a) | | | 3,500 | | | | 109,320 | |
Towa Pharmaceutical Company Ltd. (a) | | | 4,000 | | | | 74,237 | |
Toyota Motor Corporation (a) | | | 1,500 | | | | 115,752 | |
World Holdings Company Ltd. (a) | | | 2,500 | | | | 47,611 | |
Z Holdings Corporation (a) | | | 16,000 | | | | 96,817 | |
| | | | | | | | 3,825,098 | |
Jersey — 0.3% | | | | | | | | |
Sanne Group plc (a) | | | 5,000 | | | | 42,127 | |
| | | | | | | | | |
Luxembourg — 0.6% | | | | | | | | |
Stabilus S.A. (a) | | | 1,300 | | | | 91,897 | |
| | | | | | | | | |
Hussman Strategic International Fund
Schedule of Investments (continued) |
December 31, 2020 (Unaudited) |
COMMON STOCKS — 87.0% (continued) | | Shares | | | Value | |
Netherlands — 3.9% | | | | | | | | |
Aalberts N.V. (a) | | | 2,500 | | | $ | 111,233 | |
Cementir Holding N.V. (a) | | | 10,000 | | | | 81,555 | |
Euronext N.V. (a) | | | 1,000 | | | | 110,145 | |
Koninklijke Ahold Delhaize N.V. (a) | | | 5,500 | | | | 155,156 | |
NN Group N.V. (a) | | | 1,000 | | | | 43,228 | |
STMicroelectronics N.V. (a) (b) | | | 2,000 | | | | 74,611 | |
| | | | | | | | 575,928 | |
New Zealand — 0.3% | | | | | | | | |
Summerset Group Holdings Ltd. (a) | | | 4,500 | | | | 40,702 | |
| | | | | | | | | |
Norway — 1.8% | | | | | | | | |
Norway Royal Salmon ASA | | | 3,031 | | | | 75,851 | |
Norwegian Finans Holding ASA (a) (b) | | | 8,000 | | | | 68,406 | |
SalMar ASA (a) | | | 2,000 | | | | 117,165 | |
| | | | | | | | 261,422 | |
Spain — 1.5% | | | | | | | | |
Enagas S.A. (a) | | | 2,000 | | | | 43,998 | |
Euskaltel S.A. (a) | | | 5,000 | | | | 53,092 | |
Industria de Diseno Textil S.A. (a) | | | 1,500 | | | | 47,608 | |
Prosegur Seguridad S.A. (a) | | | 25,000 | | | | 74,998 | |
| | | | | | | | 219,696 | |
Sweden — 8.4% | | | | | | | | |
Alfa Laval AB (a) (b) | | | 4,000 | | | | 110,476 | |
Clas Ohlson AB - B Shares (a) | | | 10,000 | | | | 95,106 | |
Essity AB - Series B (a) | | | 1,600 | | | | 51,556 | |
Hennes & Mauritz AB - B Shares (a) (b) | | | 6,000 | | | | 125,964 | |
Hexpol AB (a) | | | 15,000 | | | | 160,615 | |
ICA Gruppen AB (a) | | | 4,000 | | | | 200,102 | |
Karo Pharma AB (a) (b) | | | 10,000 | | | | 63,758 | |
Mekonomen AB (a) (b) | | | 4,500 | | | | 49,818 | |
Mycronic AB (a) | | | 5,000 | | | | 148,525 | |
Nordic Entertainment Group AB - Class B | | | 2,500 | | | | 139,361 | |
Swedish Orphan Biovitrum AB (a) (b) | | | 4,500 | | | | 90,568 | |
| | | | | | | | 1,235,849 | |
Hussman Strategic International Fund
Schedule of Investments (continued) |
December 31, 2020 (Unaudited) |
COMMON STOCKS — 87.0% (continued) | | Shares | | | Value | |
Switzerland — 3.7% | | | | | | | | |
DKSH Holding AG (a) | | | 1,200 | | | $ | 89,905 | |
Evolva Holding S.A. (b) | | | 250,000 | | | | 57,042 | |
Novartis AG (a) | | | 800 | | | | 75,326 | |
Sonova Holding AG (a) (b) | | | 500 | | | | 130,045 | |
Swisscom AG (a) | | | 250 | | | | 134,633 | |
Vontobel Holding AG (a) | | | 700 | | | | 55,648 | |
| | | | | | | | 542,599 | |
United Kingdom — 9.7% | | | | | | | | |
Ashtead Group plc (a) | | | 2,000 | | | | 94,203 | |
Domino’s Pizza Group plc (a) (b) | | | 30,000 | | | | 129,275 | |
Dunelm Group plc (a) (b) | | | 3,000 | | | | 49,671 | |
FDM Group Holdings plc (a) | | | 5,000 | | | | 77,290 | |
Frasers Group plc (a) (b) | | | 10,000 | | | | 61,580 | |
GlaxoSmithKline plc (a) | | | 9,100 | | | | 166,514 | |
Halfords Group plc (b) | | | 10,000 | | | | 36,513 | |
Mediclinic International plc (a) (b) | | | 25,000 | | | | 96,590 | |
National Grid plc (a) | | | 9,000 | | | | 106,358 | |
Next plc (a) (b) | | | 1,500 | | | | 144,642 | |
Pets at Home Group plc (a) | | | 9,000 | | | | 51,202 | |
Royal Mail plc (a) | | | 16,000 | | | | 73,745 | |
Softcat plc (a) | | | 10,000 | | | | 188,102 | |
SThree plc (b) | | | 25,000 | | | | 101,880 | |
Ultra Electronics Holdings plc (a) | | | 1,800 | | | | 50,662 | |
| | | | | | | | 1,428,227 | |
| | | | | | | | | |
Total Common Stocks (Cost $10,501,709) | | | | | | $ | 12,863,205 | |
PUT OPTION CONTRACTS — 0.7% | | Contracts | | | Notional
Amount | | | Value | |
S&P 500 Index Option, 02/19/2021 at $3,725 (Cost $121,900) | | | 12 | | | $ | 4,507,284 | | | $ | 110,244 | |
| | | | | | | | | | | | | |
Total Investments at Value — 87.7% (Cost $10,623,609) | | | | | | | | | | $ | 12,973,449 | |
Hussman Strategic International Fund
Schedule of Investments (continued) |
December 31, 2020 (Unaudited) |
MONEY MARKET FUNDS — 3.5% | | Shares | | | Value | |
Northern Institutional Treasury Portfolio, 0.01% (c) (Cost $510,724) | | | 510,724 | | | $ | 510,724 | |
| | | | | | | | | |
Total Investments and Money Market Funds at Value — 91.2% (Cost $11,134,333) | | | | | | $ | 13,484,173 | |
| | | | | | | | | |
Other Assets in Excess of Liabilities — 8.8% | | | | | | | 1,306,089 | |
| | | | | | | | | |
Net Assets — 100.0% | | | | | | $ | 14,790,262 | |
(a) | Level 2 Security (Note 1). |
(b) | Non-income producing security. |
(c) | The rate shown is the 7-day effective yield as of December 31, 2020. |
See accompanying notes to financial statements. |
Hussman Strategic International Fund
Schedule of Investments (continued) |
December 31, 2020 (Unaudited) |
Common Stocks by Sector/Industry | % of Net
Assets |
Communications — 9.8% | |
Advertising & Marketing | 1.2% |
Cable & Satellite | 0.8% |
Entertainment Content | 1.3% |
Internet Media & Services | 2.0% |
Telecommunications | 4.5% |
Consumer Discretionary — 12.9% | |
Automotive | 2.3% |
Consumer Services | 0.3% |
E-Commerce Discretionary | 0.6% |
Leisure Facilities & Services | 0.9% |
Leisure Products | 1.0% |
Retail - Discretionary | 5.9% |
Wholesale - Discretionary | 1.9% |
Consumer Staples — 10.1% | |
Food | 1.5% |
Household Products | 0.8% |
Retail - Consumer Staples | 7.0% |
Wholesale - Consumer Staples | 0.8% |
Financials — 6.3% | |
Asset Management | 2.3% |
Banking | 0.5% |
Institutional Financial Services | 0.7% |
Insurance | 2.5% |
Specialty Finance | 0.3% |
Health Care — 15.7% | |
Biotech & Pharma | 11.8% |
Health Care Facilities & Services | 2.5% |
Medical Equipment & Devices | 1.4% |
Industrials — 10.8% | |
Aerospace & Defense | 0.3% |
Commercial Support Services | 2.9% |
Diversified Industrials | 0.8% |
Electrical Equipment | 0.3% |
Engineering & Construction | 1.6% |
Industrial Intermediate Products | 1.1% |
Industrial Support Services | 0.6% |
Hussman Strategic International Fund
Schedule of Investments (continued) |
December 31, 2020 (Unaudited) |
Common Stocks by Sector/Industry (continued) | % of Net
Assets |
Industrials — 10.8% (continued) | |
Machinery | 2.7% |
Transportation & Logistics | 0.5% |
Materials — 2.0% | |
Chemicals | 0.3% |
Construction Materials | 1.1% |
Containers & Packaging | 0.6% |
Technology — 14.3% | |
Semiconductors | 5.9% |
Software | 0.6% |
Technology Hardware | 2.9% |
Technology Services | 4.9% |
Utilities — 5.1% | |
Electric Utilities | 4.8% |
Gas & Water Utilities | 0.3% |
| | 87.0% |
See accompanying notes to financial statements. |
Hussman Strategic International Fund
Schedule of Futures Contracts Sold Short |
December 31, 2020 (Unaudited) |
FUTURES CONTRACTS SOLD SHORT | | Contracts | | | Expiration
Date | | | Notional
Amount | | | Value/
Unrealized
Depreciation* | |
FUTURES | | | | | | | | | | | | | | | | |
Mini MSCI EAFE Index Future | | | 75 | | | | 03/19/2021 | | | $ | 8,053,238 | | | $ | (162,279 | ) |
* | Includes cumulative appreciation (depreciation) of futures contracts from the date that contracts were opened through December 31, 2020. Only current day variation margin is reported on the Statements of Assets and Liabilities. |
See accompanying notes to financial statements. |
Hussman Investment Trust
Statements of Assets and Liabilities |
December 31, 2020 (Unaudited) |
| | | Hussman
Strategic
Growth Fund | | | Hussman
Strategic
Allocation Fund | |
ASSETS | | | | | | | | |
Investments in securities: | | | | | | | | |
At cost | | $ | 289,062,396 | | | $ | 8,525,476 | |
At value (Note 1) | | $ | 325,897,057 | | | $ | 9,511,351 | |
Investments in money market funds | | | 137,977,882 | | | | 5,847,619 | |
Cash | | | 45,552 | | | | — | |
Receivable for capital shares sold | | | 397,049 | | | | 309,976 | |
Receivable for investment securities sold | | | 3,714,759 | | | | — | |
Receivable from Adviser (Note 3) | | | — | | | | 4,836 | |
Dividends receivable | | | 122,811 | | | | 9,304 | |
Tax reclaims receivable | | | 8,509 | | | | — | |
Other assets | | | 75,273 | | | | 12,473 | |
Total Assets | | | 468,238,892 | | | | 15,695,559 | |
| | | | | | | | | |
LIABILITIES | | | | | | | | |
Written call options, at value (Notes 1 and 4) (premiums received $129,142,424 and $1,728,758) | | | 151,798,180 | | | | 2,089,725 | |
Distributions payable | | | 41,783 | | | | 420 | |
Payable for capital shares redeemed | | | 159,364 | | | | 46,223 | |
Payable for investment securities purchased | | | 2,156,163 | | | | 112,856 | |
Accrued investment advisory fees (Note 3) | | | 240,482 | | | | — | |
Payable to administrator (Note 3) | | | 33,000 | | | | 6,510 | |
Accrued custodian fees | | | 12,300 | | | | 3,000 | |
Other accrued expenses | | | 49,270 | | | | 24,533 | |
Total Liabilities | | | 154,490,542 | | | | 2,283,267 | |
CONTINGENCIES AND COMMITMENTS (NOTES 8 & 9) | | | — | | | | — | |
NET ASSETS | | $ | 313,748,350 | | | $ | 13,412,292 | |
| | | | | | | | | |
Net assets consist of: | | | | | | | | |
Paid-in capital | | $ | 1,208,187,908 | | | $ | 13,092,106 | |
Accumulated earnings (deficit) | | | (894,439,558 | ) | | | 320,186 | |
NET ASSETS | | $ | 313,748,350 | | | $ | 13,412,292 | |
| | | | | | | | | |
Shares of beneficial interest outstanding (unlimited number of shares authorized, no par value) | | | 51,098,321 | | | | 1,281,824 | |
| | | | | | | | | |
Net asset value, offering price and redemption price per share (a) (Note 1) | | $ | 6.14 | | | $ | 10.46 | |
(a) | Redemption fee may apply to redemptions of shares held for 60 days or less. |
See accompanying notes to financial statements. |
Hussman Investment Trust
Statements of Assets and Liabilities (continued) |
December 31, 2020 (Unaudited) |
| | | Hussman
Strategic Total
Return Fund | | | Hussman
Strategic
International Fund | |
ASSETS | | | | | | | | |
Investments in securities: | | | | | | | | |
At cost | | $ | 290,210,610 | | | $ | 10,623,609 | |
At value (Note 1) | | $ | 302,621,664 | | | $ | 12,973,449 | |
Investments in money market funds | | | 17,337,919 | | | | 510,724 | |
Foreign currency, at value (Cost $74,861) | | | — | | | | 74,916 | |
Receivable for capital shares sold | | | 197,704 | | | | 166 | |
Variation margin receivable (Notes 1 and 4) | | | — | | | | 64,221 | |
Margin deposits for futures contracts (Note 1) | | | — | | | | 1,230,783 | |
Receivable from Adviser (Note 3) | | | — | | | | 504 | |
Dividends and interest receivable | | | 792,966 | | | | 11,819 | |
Tax reclaims receivable | | | — | | | | 38,703 | |
Other assets | | | 102,068 | | | | 30,298 | |
Total Assets | | | 321,052,321 | | | | 14,935,583 | |
| | | | | | | | | |
LIABILITIES | | | | | | | | |
Distributions payable | | | 19,531 | | | | 3,228 | |
Payable for capital shares redeemed | | | 120,063 | | | | 5,738 | |
Payable for investment securities purchased | | | — | | | | 74,916 | |
Accrued investment advisory fees (Note 3) | | | 127,004 | | | | — | |
Payable to administrator (Note 3) | | | 30,700 | | | | 7,070 | |
Accrued custodian fees | | | 5,500 | | | | 25,000 | |
Other accrued expenses | | | 42,483 | | | | 29,369 | |
Total Liabilities | | | 345,281 | | | | 145,321 | |
CONTINGENCIES AND COMMITMENTS (NOTE 8) | | | — | | | | — | |
NET ASSETS | | $ | 320,707,040 | | | $ | 14,790,262 | |
| | | | | | | | | |
Net assets consist of: | | | | | | | | |
Paid-in capital | | $ | 355,429,723 | | | $ | 29,529,274 | |
Accumulated deficit | | | (34,722,683 | ) | | | (14,739,012 | ) |
NET ASSETS | | $ | 320,707,040 | | | $ | 14,790,262 | |
| | | | | | | | | |
Shares of beneficial interest outstanding (unlimited number of shares authorized, no par value) | | | 21,823,249 | | | | 1,719,446 | |
| | | | | | | | | |
Net asset value, offering price and redemption price per share (a) (Note 1) | | $ | 14.70 | | | $ | 8.60 | |
(a) | Redemption fee may apply to redemptions of shares held for 60 days or less. |
See accompanying notes to financial statements. |
Hussman Investment Trust
Statements of Operations |
For the Six Months Ended December 31, 2020 (Unaudited) |
| | | Hussman
Strategic
Growth Fund | | | Hussman
Strategic
Allocation Fund | |
INVESTMENT INCOME | | | | | | | | |
Dividends | | $ | 2,008,923 | | | $ | 43,743 | |
Foreign withholding taxes on dividends | | | (16,116 | ) | | | (311 | ) |
Interest | | | — | | | | 10,660 | |
Total Income | | | 1,992,807 | | | | 54,092 | |
| | | | | | | | | |
EXPENSES | | | | | | | | |
Investment advisory fees (Note 3) | | | 1,418,172 | | | | 33,770 | |
Transfer agent, account maintenance and shareholder services fees (Note 3) | | | 120,625 | | | | 8,412 | |
Administration fees (Note 3) | | | 110,667 | | | | 11,000 | |
Legal fees | | | 43,890 | | | | 27,037 | |
Trustees’ fees (Note 3) | | | 33,750 | | | | 33,750 | |
Custodian fees | | | 37,917 | | | | 8,674 | |
Fund accounting fees (Note 3) | | | 30,809 | | | | 14,165 | |
Registration and filing fees | | | 24,585 | | | | 13,315 | |
Insurance expense | | | 31,553 | | | | 913 | |
Postage and supplies | | | 19,400 | | | | 4,707 | |
Audit fees | | | 9,500 | | | | 9,750 | |
Printing of shareholder reports | | | 15,689 | | | | 2,445 | |
Compliance service fees (Note 3) | | | 14,368 | | | | 2,601 | |
Pricing fees | | | 1,018 | | | | 1,131 | |
Other expenses | | | 5,551 | | | | 2,899 | |
Total Expenses | | | 1,917,494 | | | | 174,569 | |
Less fee waivers and Fund expenses absorbed by the Adviser (Note 3) | | | (100,193 | ) | | | (117,958 | ) |
Net Expenses | | | 1,817,301 | | | | 56,611 | |
| | | | | | | | | |
NET INVESTMENT INCOME (LOSS) | | | 175,506 | | | | (2,519 | ) |
| | | | | | | | | |
REALIZED AND UNREALIZED GAINS (LOSSES) ON INVESTMENTS AND WRITTEN OPTION CONTRACTS | | | | | | | | |
Net realized gains (losses) from: | | | | | | | | |
Investments | | | 41,327,460 | | | | 882,725 | |
Written option contracts (Note 4) | | | (89,214,069 | ) | | | (1,347,743 | ) |
Net change in unrealized appreciation (depreciation) on: | | | | | | | | |
Investments | | | 40,213,461 | | | | 969,809 | |
Written option contracts (Note 4) | | | 9,388,432 | | | | 83,520 | |
| | | | | | | | | |
NET REALIZED AND UNREALIZED GAINS ON INVESTMENTS AND WRITTEN OPTION CONTRACTS | | | 1,715,284 | | | | 588,311 | |
| | | | | | | | | |
NET INCREASE IN NET ASSETS RESULTING FROM OPERATIONS | | $ | 1,890,790 | | | $ | 585,792 | |
See accompanying notes to financial statements. |
Hussman Investment Trust
Statements of Operations (continued) |
For the Six Months Ended December 31, 2020 (Unaudited) |
| | | Hussman
Strategic Total
Return Fund | | | Hussman
Strategic
International Fund | |
INVESTMENT INCOME | | | | | | | | |
Dividend income | | $ | 655,683 | | | $ | 105,139 | |
Foreign withholding taxes on dividends | | | (17,470 | ) | | | (9,784 | ) |
Interest | | | 1,669,986 | | | | — | |
Total Income | | | 2,308,199 | | | | 95,355 | |
| | | | | | | | | |
EXPENSES | | | | | | | | |
Investment advisory fees (Note 3) | | | 799,148 | | | | 70,795 | |
Administration fees (Note 3) | | | 112,268 | | | | 12,000 | |
Transfer agent, account maintenance and shareholder services fees (Note 3) | | | 80,640 | | | | 18,337 | |
Trustees’ fees (Note 3) | | | 33,750 | | | | 33,750 | |
Legal fees | | | 27,551 | | | | 27,551 | |
Fund accounting fees (Note 3) | | | 31,053 | | | | 18,745 | |
Custodian fees | | | 16,945 | | | | 25,795 | |
Registration and filing fees | | | 24,527 | | | | 16,995 | |
Insurance expense | | | 28,715 | | | | 1,808 | |
Postage and supplies | | | 13,861 | | | | 16,647 | |
Compliance service fees (Note 3) | | | 15,189 | | | | 2,742 | |
Audit fees | | | 9,500 | | | | 8,050 | |
Printing of shareholder reports | | | 10,713 | | | | 2,886 | |
Pricing fees | | | 1,112 | | | | 11,858 | |
Other expenses | | | 6,505 | | | | 2,951 | |
Total Expenses | | | 1,211,477 | | | | 270,910 | |
Less fee waivers and Fund expenses absorbed by the Adviser (Note 3) | | | (8,838 | ) | | | (121,471 | ) |
Net Expenses | | | 1,202,639 | | | | 149,439 | |
| | | | | | | | | |
NET INVESTMENT INCOME (LOSS) | | | 1,105,560 | | | | (54,084 | ) |
| | | | | | | | | |
REALIZED AND UNREALIZED GAINS (LOSSES) ON INVESTMENTS, FUTURES CONTRACTS AND FOREIGN CURRENCIES | | | | | | | | |
Net realized gains (losses) from: | | | | | | | | |
Investments | | | 8,889,861 | | | | 867,883 | |
Futures contracts (Note 4) | | | — | | | | (1,452,214 | ) |
Foreign currency transactions | | | — | | | | 5,027 | |
Net change in unrealized appreciation (depreciation) on: | | | | | | | | |
Investments | | | (5,254,000 | ) | | | 1,306,552 | |
Futures contracts (Note 4) | | | — | | | | (95,344 | ) |
Foreign currency translation | | | — | | | | 2,800 | |
| | | | | | | | | |
NET REALIZED AND UNREALIZED GAINS ON INVESTMENTS, FUTURES CONTRACTS AND FOREIGN CURRENCIES | | | 3,635,861 | | | | 634,704 | |
| | | | | | | | | |
NET INCREASE IN NET ASSETS RESULTING FROM OPERATIONS | | $ | 4,741,421 | | | $ | 580,620 | |
See accompanying notes to financial statements. |
Hussman Strategic Growth Fund
Statements of Changes in Net Assets |
|
| | Six Months Ended
December 31,
2020
(Unaudited) | | | Year Ended
June 30,
2020 | |
FROM OPERATIONS | | | | | | | | |
Net investment income | | $ | 175,506 | | | $ | 2,420,909 | |
Net realized gains (losses) from: | | | | | | | | |
Investments | | | 41,327,460 | | | | 56,420,650 | |
Written option contracts | | | (89,214,069 | ) | | | (21,469,390 | ) |
Net change in unrealized appreciation (depreciation) on: | | | | | | | | |
Investments | | | 40,213,461 | | | | (2,099,222 | ) |
Written option contracts | | | 9,388,432 | | | | (19,902,704 | ) |
Net increase in net assets resulting from operations | | | 1,890,790 | | | | 15,370,243 | |
| | | | | | | | | |
DISTRIBUTIONS TO SHAREHOLDERS (Note 1) | | | (509,834 | ) | | | (4,497,796 | ) |
| | | | | | | | | |
FROM CAPITAL SHARE TRANSACTIONS | | | | | | | | |
Proceeds from shares sold | | | 42,855,618 | | | | 96,065,262 | |
Net asset value of shares issued in reinvestment of distributions to shareholders | | | 468,051 | | | | 4,209,892 | |
Proceeds from redemption fees collected (Note 1) | | | 35,470 | | | | 76,103 | |
Payments for shares redeemed | | | (39,765,846 | ) | | | (96,355,492 | ) |
Net increase in net assets from capital share transactions | | | 3,593,293 | | | | 3,995,765 | |
| | | | | | | | | |
TOTAL INCREASE IN NET ASSETS | | | 4,974,249 | | | | 14,868,212 | |
| | | | | | | | | |
NET ASSETS | | | | | | | | |
Beginning of period | | | 308,774,101 | | | | 293,905,889 | |
End of period | | $ | 313,748,350 | | | $ | 308,774,101 | |
| | | | | | | | | |
CAPITAL SHARE ACTIVITY | | | | | | | | |
Shares sold | | | 7,026,300 | | | | 16,263,829 | |
Shares reinvested | | | 76,230 | | | | 783,965 | |
Shares redeemed | | | (6,492,304 | ) | | | (16,627,560 | ) |
Net increase in shares outstanding | | | 610,226 | | | | 420,234 | |
Shares outstanding at beginning of period | | | 50,488,095 | | | | 50,067,861 | |
Shares outstanding at end of period | | | 51,098,321 | | | | 50,488,095 | |
See accompanying notes to financial statements. |
Hussman Strategic Allocation Fund
Statements of Changes in Net Assets |
|
| | | Six Months Ended
December 31,
2020
(Unaudited) | | | Period Ended
June 30,
2020 (a) | |
FROM OPERATIONS | | | | | | | | |
Net investment income (loss) | | $ | (2,519 | ) | | $ | 20,537 | |
Net realized gains (losses) from: | | | | | | | | |
Investments | | | 882,725 | | | | 765,618 | |
Written option contracts | | | (1,347,743 | ) | | | (111,168 | ) |
Net change in unrealized appreciation (depreciation) on: | | | | | | | | |
Investments | | | 969,809 | | | | 16,066 | |
Written option contracts | | | 83,520 | | | | (444,487 | ) |
Net increase in net assets resulting from operations | | | 585,792 | | | | 246,566 | |
| | | | | | | | | |
DISTRIBUTIONS TO SHAREHOLDERS (Note 1) | | | (510,051 | ) | | | (2,121 | ) |
| | | | | | | | | |
FROM CAPITAL SHARE TRANSACTIONS | | | | | | | | |
Proceeds from shares sold | | | 4,890,500 | | | | 7,864,751 | |
Net asset value of shares issued in reinvestment of distributions to shareholders | | | 479,658 | | | | 2,120 | |
Proceeds from redemption fees collected (Note 1) | | | 9 | | | | 232 | |
Payments for shares redeemed | | | (126,675 | ) | | | (18,489 | ) |
Net increase in net assets from capital share transactions | | | 5,243,492 | | | | 7,848,614 | |
| | | | | | | | | |
TOTAL INCREASE IN NET ASSETS | | | 5,319,233 | | | | 8,093,059 | |
| | | | | | | | | |
NET ASSETS | | | | | | | | |
Beginning of period | | | 8,093,059 | | | | — | |
End of period | | $ | 13,412,292 | | | $ | 8,093,059 | |
| | | | | | | | | |
CAPITAL SHARE ACTIVITY | | | | | | | | |
Shares sold | | | 463,847 | | | | 785,509 | |
Shares reinvested | | | 46,068 | | | | 214 | |
Shares redeemed | | | (11,926 | ) | | | (1,888 | ) |
Net increase in shares outstanding | | | 497,989 | | | | 783,835 | |
Shares outstanding at beginning of period | | | 783,835 | | | | — | |
Shares outstanding at end of period | | | 1,281,824 | | | | 783,835 | |
(a) | Represents the period from the commencement of operations (August 27, 2019) through June 30, 2020. |
See accompanying notes to financial statements. |
Hussman Strategic Total Return Fund
Statements of Changes in Net Assets |
|
| | | Six Months Ended
December 31,
2020
(Unaudited) | | | Year Ended
June 30,
2020 | |
FROM OPERATIONS | | | | | | | | |
Net investment income | | $ | 1,105,560 | | | $ | 2,025,508 | |
Net realized gains (losses) from: | | | | | | | | |
Investments | | | 8,889,861 | | | | 22,766,794 | |
Foreign currency transactions | | | — | | | | (2,867 | ) |
Net change in unrealized appreciation (depreciation) on investments | | | (5,254,000 | ) | | | 5,904,223 | |
Net increase in net assets resulting from operations | | | 4,741,421 | | | | 30,693,658 | |
| | | | | | | | | |
DISTRIBUTIONS TO SHAREHOLDERS (Note 1) | | | (864,414 | ) | | | (1,974,954 | ) |
| | | | | | | | | |
FROM CAPITAL SHARE TRANSACTIONS | | | | | | | | |
Proceeds from shares sold | | | 62,847,088 | | | | 93,237,623 | |
Net asset value of shares issued in reinvestment of distributions to shareholders | | | 812,564 | | | | 1,856,942 | |
Proceeds from redemption fees collected (Note 1) | | | 35,271 | | | | 78,782 | |
Payments for shares redeemed | | | (36,994,077 | ) | | | (54,998,030 | ) |
Net increase in net assets from capital share transactions | | | 26,700,846 | | | | 40,175,317 | |
| | | | | | | | | |
TOTAL INCREASE IN NET ASSETS | | | 30,577,853 | | | | 68,894,021 | |
| | | | | | | | | |
NET ASSETS | | | | | | | | |
Beginning of period | | | 290,129,187 | | | | 221,235,166 | |
End of period | | $ | 320,707,040 | | | $ | 290,129,187 | |
| | | | | | | | | |
CAPITAL SHARE ACTIVITY | | | | | | | | |
Shares sold | | | 4,270,026 | | | | 6,769,222 | |
Shares reinvested | | | 55,420 | | | | 139,474 | |
Shares redeemed | | | (2,515,715 | ) | | | (4,140,034 | ) |
Net increase in shares outstanding | | | 1,809,731 | | | | 2,768,662 | |
Shares outstanding at beginning of period | | | 20,013,518 | | | | 17,244,856 | |
Shares outstanding at end of period | | | 21,823,249 | | | | 20,013,518 | |
See accompanying notes to financial statements. |
Hussman Strategic International Fund
Statements of Changes in Net Assets |
|
| | | Six Months Ended
December 31,
2020
(Unaudited) | | | Year Ended
June 30,
2020 | |
FROM OPERATIONS | | | | | | | | |
Net investment income (loss) | | $ | (54,084 | ) | | $ | 10,781 | |
Net realized gains (losses) from: | | | | | | | | |
Investments | | | 867,883 | | | | (1,396,802 | ) |
Futures contracts | | | (1,452,214 | ) | | | 967,625 | |
Foreign currency transactions | | | 5,027 | | | | 29,634 | |
Net change in unrealized appreciation (depreciation) on: | | | | | | | | |
Investments | | | 1,306,552 | | | | 381,644 | |
Futures contracts | | | (95,344 | ) | | | 245,115 | |
Foreign currency translation | | | 2,800 | | | | (778 | ) |
Net increase in net assets resulting from operations | | | 580,620 | | | | 237,219 | |
| | | | | | | | | |
DISTRIBUTIONS TO SHAREHOLDERS (Note 1) | | | (193,735 | ) | | | (119,506 | ) |
| | | | | | | | | |
FROM CAPITAL SHARE TRANSACTIONS | | | | | | | | |
Proceeds from shares sold | | | 280,721 | | | | 388,907 | |
Net asset value of shares issued in reinvestment of distributions to shareholders | | | 190,507 | | | | 116,458 | |
Proceeds from redemption fees collected (Note 1) | | | 83 | | | | 333 | |
Payments for shares redeemed | | | (1,062,499 | ) | | | (7,562,951 | ) |
Net decrease in net assets from capital share transactions | | | (591,188 | ) | | | (7,057,253 | ) |
| | | | | | | | | |
TOTAL DECREASE IN NET ASSETS | | | (204,303 | ) | | | (6,939,540 | ) |
| | | | | | | | | |
NET ASSETS | | | | | | | | |
Beginning of period | | | 14,994,565 | | | | 21,934,105 | |
End of period | | $ | 14,790,262 | | | $ | 14,994,565 | |
| | | | | | | | | |
CAPITAL SHARE ACTIVITY | | | | | | | | |
Shares sold | | | 33,318 | | | | 46,702 | |
Shares reinvested | | | 22,152 | | | | 13,464 | |
Shares redeemed | | | (125,463 | ) | | | (898,341 | ) |
Net decrease in shares outstanding | | | (69,993 | ) | | | (838,175 | ) |
Shares outstanding at beginning of period | | | 1,789,439 | | | | 2,627,614 | |
Shares outstanding at end of period | | | 1,719,446 | | | | 1,789,439 | |
See accompanying notes to financial statements. |
Hussman Strategic Growth Fund
Financial Highlights |
Selected Per Share Data and Ratios for a Share Outstanding Throughout Each Period |
| | Six Months
Ended
December 31,
2020
(Unaudited) | | | Year
Ended
June 30,
2020 | | | Year
Ended
June 30,
2019 | | | Year
Ended
June 30,
2018 | | | Year
Ended
June 30,
2017 | | | Year
Ended
June 30,
2016 | |
Net asset value at beginning of period | | $ | 6.12 | | | $ | 5.87 | | | $ | 6.46 | | | $ | 6.68 | | | $ | 7.93 | | | $ | 8.70 | |
| | | | | | | | | | | | | | | | | | | | | | | | | |
Income (loss) from investment operations: | | | | | | | | | | | | | | | | | | | | | | | | |
Net investment income | | | 0.00 | (a) | | | 0.06 | | | | 0.10 | | | | 0.06 | | | | 0.02 | | | | 0.03 | |
Net realized and unrealized gains (losses) on investments and written option contracts | | | 0.03 | | | | 0.29 | | | | (0.61 | ) | | | (0.25 | ) | | | (1.25 | ) | | | (0.75 | ) |
Total from investment operations | | | 0.03 | | | | 0.35 | | | | (0.51 | ) | | | (0.19 | ) | | | (1.23 | ) | | | (0.72 | ) |
| | | | | | | | | | | | | | | | | | | | | | | | | |
Less distributions from: | | | | | | | | | | | | | | | | | | | | | | | | |
Net investment income | | | (0.01 | ) | | | (0.10 | ) | | | (0.08 | ) | | | (0.03 | ) | | | (0.02 | ) | | | (0.05 | ) |
| | | | | | | | | | | | | | | | | | | | | | | | | |
Proceeds from redemption fees collected (Note 1) | | | 0.00 | (a) | | | 0.00 | (a) | | | 0.00 | (a) | | | 0.00 | (a) | | | 0.00 | (a) | | | 0.00 | (a) |
| | | | | | | | | | | | | | | | | | | | | | | | | |
Net asset value at end of period | | $ | 6.14 | | | $ | 6.12 | | | $ | 5.87 | | | $ | 6.46 | | | $ | 6.68 | | | $ | 7.93 | |
| | | | | | | | | | | | | | | | | | | | | | | | | |
Total return (b) | | | 0.49 | %(c) | | | 6.17 | % | | | (8.05 | %) | | | (2.81 | %) | | | (15.53 | %) | | | (8.34 | %) |
| | | | | | | | | | | | | | | | | | | | | | | | | |
Net assets at end of period (000’s) | | $ | 313,748 | | | $ | 308,774 | | | $ | 293,906 | | | $ | 324,003 | | | $ | 375,467 | | | $ | 580,503 | |
| | | | | | | | | | | | | | | | | | | | | | | | | |
Ratio of total expenses to average net assets | | | 1.22 | %(d) | | | 1.26 | % | | | 1.24 | % | | | 1.23 | % | | | 1.19 | % | | | 1.15 | % |
| | | | | | | | | | | | | | | | | | | | | | | | | |
Ratio of net expenses to average net assets (e) | | | 1.15 | %(d) | | | 1.15 | % | | | 1.14 | % | | | 1.13 | % | | | 1.12 | % | | | 1.09 | % |
| | | | | | | | | | | | | | | | | | | | | | | | | |
Ratio of net investment income to average net assets (e) | | | 0.11 | %(d) | | | 0.87 | % | | | 1.66 | % | | | 0.82 | % | | | 0.19 | % | | | 0.34 | % |
| | | | | | | | | | | | | | | | | | | | | | | | | |
Portfolio turnover rate | | | 86 | %(c) | | | 167 | % | | | 124 | % | | | 142 | % | | | 209 | % | | | 161 | % |
(a) | Amount rounds to less than $0.01 per share. |
(b) | Total return is a measure of the change in value of an investment in the Fund over the period covered, which assumes any dividends or capital gains distributions are reinvested in shares of the Fund. Returns do not reflect the deduction of taxes a shareholder would pay on Fund distributions or the redemption of Fund shares. |
(c) | Not annualized. |
(d) | Annualized. |
(e) | Ratio was determined after advisory fee waivers (Note 3). |
See accompanying notes to financial statements. |
Hussman Strategic Allocation Fund
Financial Highlights |
Selected Per Share Data and Ratios for a Share Outstanding Throughout Each Period |
| | | Six Months
Ended
December 31,
2020
(Unaudited) | | | Period Ended
June 30,
2020 (a) | |
Net asset value at beginning of period | | $ | 10.32 | | | $ | 10.00 | |
| | | | | | | | | |
Income (loss) from investment operations: | | | | | | | | |
Net investment income (loss) | | | (0.01 | ) | | | 0.03 | |
Net realized and unrealized gains on investments and written option contracts | | | 0.73 | | | | 0.29 | |
Total from investment operations | | | 0.72 | | | | 0.32 | |
| | | | | | | | | |
Less distributions from: | | | | | | | | |
Net investment income | | | (0.01 | ) | | | (0.00 | )(b) |
Net realized gains | | | (0.57 | ) | | | — | |
Total distributions | | | (0.58 | ) | | | (0.00 | )(b) |
| | | | | | | | | |
Proceeds from redemption fees collected (Note 1) | | | 0.00 | (b) | | | 0.00 | (b) |
| | | | | | | | | |
Net asset value at end of period | | $ | 10.46 | | | $ | 10.32 | |
| | | | | | | | | |
Total return (c) | | | 7.02 | %(d) | | | 3.23 | %(d) |
| | | | | | | | | |
Net assets at end of period (000’s) | | $ | 13,412 | | | $ | 8,093 | |
| | | | | | | | | |
Ratio of total expenses to average net assets | | | 3.86 | %(e) | | | 4.67 | %(e) |
| | | | | | | | | |
Ratio of net expenses to average net assets (f) | | | 1.25 | %(e) | | | 1.25 | %(e) |
| | | | | | | | | |
Ratio of net investment income (loss) to average net assets (f) | | | (0.06 | %)(e) | | | 0.34 | %(e) |
| | | | | | | | | |
Portfolio turnover rate | | | 84 | %(d) | | | 94 | %(d) |
(a) | Represents the period from the commencement of operations (August 27, 2019) through June 30, 2020. |
(b) | Amount rounds to less than $0.01 per share. |
(c) | Total return is a measure of the change in value of an investment in the Fund over the period covered, which assumes any dividends or capital gains distributions are reinvested in shares of the Fund. Returns do not reflect the deduction of taxes a shareholder would pay on Fund distributions or the redemption of Fund shares. |
(d) | Not annualized. |
(e) | Annualized. |
(f) | Ratio was determined after advisory fee waivers and absorption of Fund expenses by the Adviser (Note 3). |
See accompanying notes to financial statements. |
Hussman Strategic Total Return Fund
Financial Highlights |
Selected Per Share Data and Ratios for a Share Outstanding Throughout Each Period |
| | | Six Months
Ended
December 31,
2020
(Unaudited) | | | Year
Ended
June 30,
2020 | | | Year
Ended
June 30,
2019 | | | Year
Ended
June 30,
2018 | | | Year
Ended
June 30,
2017 | | | Year
Ended
June 30,
2016 | |
Net asset value at beginning of period | | $ | 14.50 | | | $ | 12.83 | | | $ | 11.86 | | | $ | 11.98 | | | $ | 12.44 | | | $ | 11.32 | |
| | | | | | | | | | | | | | | | | | | | | | | | | |
Income (loss) from investment operations: | | | | | | | | | | | | | | | | | | | | | | | | |
Net investment income | | | 0.05 | | | | 0.13 | | | | 0.19 | | | | 0.10 | | | | 0.02 | | | | 0.04 | |
Net realized and unrealized gains (losses) on investments and foreign currencies | | | 0.19 | | | | 1.66 | | | | 0.95 | | | | (0.12 | ) | | | (0.46 | ) | | | 1.13 | |
Total from investment operations | | | 0.24 | | | | 1.79 | | | | 1.14 | | | | (0.02 | ) | | | (0.44 | ) | | | 1.17 | |
| | | | | | | | | | | | | | | | | | | | | | | | | |
Less distributions from: | | | | | | | | | | | | | | | | | | | | | | | | |
Net investment income | | | (0.04 | ) | | | (0.12 | ) | | | (0.17 | ) | | | (0.10 | ) | | | (0.02 | ) | | | (0.05 | ) |
| | | | | | | | | | | | | | | | | | | | | | | | | |
Proceeds from redemption fees collected (Note 1) | | | 0.00 | (a) | | | 0.00 | (a) | | | 0.00 | (a) | | | 0.00 | (a) | | | 0.00 | (a) | | | 0.00 | (a) |
| | | | | | | | | | | | | | | | | | | | | | | | | |
Net asset value at end of period | | $ | 14.70 | | | $ | 14.50 | | | $ | 12.83 | | | $ | 11.86 | | | $ | 11.98 | | | $ | 12.44 | |
| | | | | | | | | | | | | | | | | | | | | | | | | |
Total return (b) | | | 1.65 | %(c) | | | 14.00 | % | | | 9.72 | % | | | (0.18 | %) | | | (3.50 | %) | | | 10.33 | % |
| | | | | | | | | | | | | | | | | | | | | | | | | |
Net assets at end of period (000’s) | | $ | 320,707 | | | $ | 290,129 | | | $ | 221,235 | | | $ | 274,602 | | | $ | 372,502 | | | $ | 463,503 | |
| | | | | | | | | | | | | | | | | | | | | | | | | |
Ratio of total expenses to average net assets | | | 0.76 | %(d) | | | 0.81 | % | | | 0.81 | % | | | 0.77 | % | | | 0.75 | % | | | 0.75 | % |
| | | | | | | | | | | | | | | | | | | | | | | | | |
Ratio of net expenses to average net assets (e) | | | 0.75 | %(d) | | | 0.75 | % | | | 0.74 | % | | | 0.73 | % | | | 0.72 | % | | | 0.69 | % |
| | | | | | | | | | | | | | | | | | | | | | | | | |
Ratio of net investment income to average net assets (e) | | | 0.69 | %(d) | | | 0.87 | % | | | 1.36 | % | | | 0.76 | % | | | 0.12 | % | | | 0.36 | % |
| | | | | | | | | | | | | | | | | | | | | | | | | |
Portfolio turnover rate | | | 31 | %(c) | | | 88 | % | | | 61 | % | | | 63 | % | | | 341 | % | | | 129 | % |
(a) | Amount rounds to less than $0.01 per share. |
(b) | Total return is a measure of the change in value of an investment in the Fund over the period covered, which assumes any dividends or capital gains distributions are reinvested in shares of the Fund. Returns do not reflect the deduction of taxes a shareholder would pay on Fund distributions or the redemption of Fund shares. |
(c) | Not annualized. |
(d) | Annualized. |
(e) | Ratio was determined after advisory fee waivers (Note 3). |
See accompanying notes to financial statements. |
Hussman Strategic International Fund
Financial Highlights |
Selected Per Share Data and Ratios for a Share Outstanding Throughout Each Period |
| | | Six Months
Ended
December 31,
2020
(Unaudited) | | | Year
Ended
June 30,
2020 | | | Year
Ended
June 30,
2019 | | | Year
Ended
June 30,
2018 | | | Year
Ended
June 30,
2017 | | | Year
Ended
June 30,
2016 | |
Net asset value at beginning of period | | $ | 8.38 | | | $ | 8.35 | | | $ | 8.87 | | | $ | 8.80 | | | $ | 9.19 | | | $ | 8.57 | |
| | | | | | | | | | | | | | | | | | | | | | | | | |
Income (loss) from investment operations: | | | | | | | | | | | | | | | | | | | | | | | | |
Net investment income (loss) | | | (0.03 | ) | | | 0.04 | | | | 0.06 | | | | 0.02 | | | | 0.01 | | | | (0.05 | ) |
Net realized and unrealized gains (losses) on investments, futures contracts and foreign currencies | | | 0.36 | | | | 0.05 | | | | (0.57 | ) | | | 0.10 | | | | (0.40 | ) | | | 0.67 | |
Total from investment operations | | | 0.33 | | | | 0.09 | | | | (0.51 | ) | | | 0.12 | | | | (0.39 | ) | | | 0.62 | |
| | | | | | | | | | | | | | | | | | | | | | | | | |
Less distributions from: | | | | | | | | | | | | | | | | | | | | | | | | |
Net investment income | | | (0.11 | ) | | | (0.06 | ) | | | (0.01 | ) | | | (0.05 | ) | | | — | | | | — | |
| | | | | | | | | | | | | | | | | | | | | | | | | |
Proceeds from redemption fees collected (Note 1) | | | 0.00 | (a) | | | 0.00 | (a) | | | 0.00 | (a) | | | 0.00 | (a) | | | 0.00 | (a) | | | 0.00 | (a) |
| | | | | | | | | | | | | | | | | | | | | | | | | |
Net asset value at end of period | | $ | 8.60 | | | $ | 8.38 | | | $ | 8.35 | | | $ | 8.87 | | | $ | 8.80 | | | $ | 9.19 | |
| | | | | | | | | | | | | | | | | | | | | | | | | |
Total return (b) | | | 3.99 | %(c) | | | 1.08 | % | | | (5.79 | %) | | | 1.34 | % | | | (4.24 | %) | | | 7.23 | % |
| | | | | | | | | | | | | | | | | | | | | | | | | |
Net assets at end of period (000’s) | | $ | 14,790 | | | $ | 14,995 | | | $ | 21,934 | | | $ | 26,973 | | | $ | 30,494 | | | $ | 37,645 | |
| | | | | | | | | | | | | | | | | | | | | | | | | |
Ratio of total expenses to average net assets | | | 3.64 | %(d) | | | 3.43 | % | | | 2.72 | % | | | 2.42 | % | | | 2.26 | % | | | 2.03 | % |
| | | | | | | | | | | | | | | | | | | | | | | | | |
Ratio of net expenses to average net assets (e) | | | 2.00 | %(d) | | | 2.00 | % | | | 2.00 | % | | | 2.00 | % | | | 2.00 | % | | | 2.00 | % |
| | | | | | | | | | | | | | | | | | | | | | | | | |
Ratio of net investment income (loss) to average net assets (e) | | | (0.73 | %)(d) | | | 0.06 | % | | | 0.61 | % | | | 0.18 | % | | | 0.25 | % | | | (0.05 | %) |
| | | | | | | | | | | | | | | | | | | | | | | | | |
Portfolio turnover rate | | | 37 | %(c) | | | 115 | % | | | 58 | % | | | 61 | % | | | 102 | % | | | 107 | % |
(a) | Amount rounds to less than $0.01 per share. |
(b) | Total return is a measure of the change in value of an investment in the Fund over the period covered, which assumes any dividends or capital gains distributions are reinvested in shares of the Fund. Returns do not reflect the deduction of taxes a shareholder would pay on Fund distributions or the redemption of Fund shares. |
(c) | Not annualized. |
(d) | Annualized. |
(e) | Ratio was determined after advisory fee waivers and absorption of Fund expenses by the Adviser (Note 3). |
See accompanying notes to financial statements. |
Hussman Investment Trust
Notes to Financial Statements |
December 31, 2020 (Unaudited) |
1. ORGANIZATION AND SIGNIFICANT ACCOUNTING POLICIES
Hussman Strategic Growth Fund, Hussman Strategic Allocation Fund, Hussman Strategic Total Return Fund and Hussman Strategic International Fund (each, a “Fund,” and collectively, the “Funds”) are diversified, separate series of Hussman Investment Trust (the “Trust”), which is registered under the Investment Company Act of 1940, as amended (the “1940 Act”), as an open-end management investment company. Each Fund is authorized to issue an unlimited number of shares.
Hussman Strategic Growth Fund’s investment objective is to provide long-term capital appreciation, with added emphasis on protection of capital during unfavorable market conditions.
Hussman Strategic Allocation Fund’s investment objective is to provide total return through a combination of income and capital appreciation.
Hussman Strategic Total Return Fund’s investment objective is to provide long-term total return from income and capital appreciation.
Hussman Strategic International Fund’s investment objective is to provide long-term capital appreciation, with added emphasis on the protection of capital during unfavorable market conditions. The Fund invests primarily in equity securities of non-U.S. issuers.
The following is a summary of significant accounting policies followed by the Funds. The policies are in conformity with accounting principles generally accepted in the United States of America (“GAAP”). Each Fund follows accounting and reporting guidance under Financial Accounting Standards Board Accounting Standards Codification Topic 946 “Financial Services – Investment Companies.”
Securities, Options and Futures Valuation — The Funds’ portfolio securities are valued at market value as of the close of regular trading on the New York Stock Exchange (“NYSE”) (normally, 4:00 p.m. Eastern time) on each business day the NYSE is open. Securities listed on the NYSE or other exchanges, other than options, are valued on the basis of their last sale prices on the exchanges on which they are primarily traded. However, if the last sale price on the NYSE is different than the last sale price on any other exchange, the NYSE price will be used. If there are no sales on that day, the securities are valued at the last bid price on the NYSE or other primary exchange for that day. Securities quoted by NASDAQ are valued at the NASDAQ Official Closing Price. If there are no sales on that day, the securities are valued at the last bid price as reported by NASDAQ. Securities traded in over-the-counter markets, other than NASDAQ quoted securities, are valued at the last sales price, or if there
Hussman Investment Trust
Notes to Financial Statements (continued) |
December 31, 2020 (Unaudited) |
are no sales on that day, at the mean of the closing bid and ask prices. Securities traded on a foreign stock exchange are valued at their closing prices on the principal exchange where they are traded; however, on days when the value of securities traded on foreign stock exchanges may be materially affected by events occurring before a Fund’s pricing time, but after the close of the primary markets or exchanges on which such securities are traded, such securities typically will be valued at their fair value as determined by an independent pricing service approved by the Board of Trustees where such value is believed to reflect the market values of such securities as of the time of computation of a Fund’s net asset value (“NAV”). As a result, the prices of foreign securities used to calculate a Fund’s NAV may differ from quoted or published prices for these securities. Values of foreign securities denominated in or expected to settle in a foreign currency are translated from the local currency into U.S. dollars using prevailing currency exchange rates as of the close of the NYSE, as supplied by an independent pricing service.
Pursuant to procedures approved by the Board of Trustees, options traded on a national securities exchange are valued at prices between the closing bid and ask prices determined by Hussman Strategic Advisors, Inc. (the “Adviser”) to most closely reflect market value as of the time of computation of NAV. As of December 31, 2020, all options held by Hussman Strategic Growth Fund, Hussman Strategic Allocation Fund and Hussman Strategic International Fund have been valued in this manner. Options not traded on a national securities exchange or board of trade, but for which over-the-counter market quotations are readily available, are valued at the mean between their closing bid and ask prices. Futures contracts and options thereon, which are traded on commodities exchanges, are valued at their last sale prices as of the close of regular trading on the NYSE or, if not available, at the mean between their bid and ask prices.
Fixed income securities traded over-the-counter and not traded or dealt in upon any securities exchange, but for which market quotations are readily available, generally are valued at the mean of their closing bid and ask prices. Fixed income securities may also be valued on the basis of prices provided by an independent pricing service. Debt securities with remaining maturities of 60 days or less may be valued at amortized cost if the Adviser, under the supervision of the Board of Trustees, determines that the amortized cost value of the security represents fair value.
Investments in shares of other open-end investment companies, other than shares of exchange-traded funds, are valued at their NAVs per share as reported by such companies.
Hussman Investment Trust
Notes to Financial Statements (continued) |
December 31, 2020 (Unaudited) |
In the event that market quotations are not readily available or are determined by the Adviser to not be reflective of fair market value due to market events or developments, securities and other financial instruments will be valued at fair value as determined by the Adviser in accordance with procedures adopted by the Board of Trustees. Methods used to determine fair value may include, but are not limited to: multiple of earnings, multiple of book value, discount from market of a similar freely traded security, purchase price of the security, subsequent private transactions in the security or related securities, or a combination of these and other factors.
GAAP establishes a single authoritative definition of fair value, sets out a framework for measuring fair value and requires additional disclosures about fair value measurements.
Various inputs are used in determining the values of the Funds’ investments. These inputs are summarized in the three broad levels listed below:
| | ● | Level 1 – quoted unadjusted prices for identical instruments in active markets to which the Fund has access at the date of measurement. |
| | ● | Level 2 – quoted prices for similar instruments in active markets; quoted prices for identical or similar instruments in markets that are not active; and model-derived valuations in which all significant inputs and significant value drivers are observable in active markets. Level 2 inputs are those in markets for which there are few transactions, the prices are not current, little public information exists or instances where prices vary substantially over time or among market makers. |
| | ● | Level 3 – model-derived valuations in which one or more significant inputs or significant value drivers are unobservable. Unobservable inputs are those inputs that reflect the Fund’s own assumptions that market participants would use to price the asset or liability based on the best available information. |
Option contracts purchased or written by Hussman Strategic Growth Fund, Hussman Strategic Allocation Fund and Hussman Strategic International Fund are classified as Level 2 since they are valued using “other significant observable inputs” at prices between the closing bid and ask prices determined by the Adviser to most closely reflect fair value. U.S. Treasury obligations held by Hussman Strategic Allocation Fund and Hussman Strategic Total Return Fund are classified as Level 2 since values are based on prices provided by an independent pricing service that utilizes various “other significant observable inputs,” including bid and ask quotations, prices of similar securities and interest rates, among other factors. Non-U.S. equity securities actively traded in foreign markets held by Hussman Strategic International
Hussman Investment Trust
Notes to Financial Statements (continued) |
December 31, 2020 (Unaudited) |
Fund may be classified as Level 2 despite the availability of closing prices because such securities are typically valued at their fair value as determined by an independent pricing service, as described below.
The Trust uses an independent pricing service to determine the fair value of portfolio securities traded on a foreign securities exchange when the value of such securities may be materially affected by events occurring before a Fund’s pricing time, but after the close of the primary markets or exchanges on which such securities are traded. These intervening events might be: country-specific (e.g., natural disaster, economic or political developments, interest rate change); issuer specific (e.g., earnings report, merger announcement); or U.S. markets-specific (such as a significant movement in the U.S. markets that is deemed likely to affect the value of foreign securities). The pricing service uses an automated system incorporating a model based on multiple parameters, including a security’s local closing price, relevant general and sector indices, currency fluctuations, trading in depositary receipts and futures, if applicable, and/or research valuations by its staff, in determining what it believes is the fair value of the securities. The frequency of use of this procedure depends on market and other events and thus cannot be predicted. However, the procedure may be utilized to a significant extent by Hussman Strategic International Fund.
Determining the fair value of portfolio securities involves reliance on judgment, and a security’s fair value may differ depending on the method used for determining value. With respect to a portfolio security that has been valued at fair value, there can be no assurance that a Fund could purchase or sell that security at a price equal to the fair value of such security used in calculating the Fund’s NAV. Because of the inherent uncertainty in determining fair value and the various factors considered in making such determinations, there can be significant deviations between the fair value at which a portfolio security is being carried and the price at which it can be sold. To the extent Hussman Strategic International Fund has significant holdings of foreign securities, fair value determinations will be used more frequently for this Fund than for the other Funds.
The inputs or methodology used for valuing securities are not necessarily an indication of the risks associated with investing in those securities. The inputs used to measure the value of a particular security may fall into more than one level of the fair value hierarchy. In such cases, for disclosure purposes, the level in the fair value hierarchy within which the fair value measurement of that security is determined to fall in its entirety is the lowest level input that is significant to the fair value measurement.
Hussman Investment Trust
Notes to Financial Statements (continued) |
December 31, 2020 (Unaudited) |
The following is a summary of each Fund’s investments and other financial investments and the inputs used to value the investments and other financial instruments as of December 31, 2020 by security type:
Hussman Strategic Growth Fund
| | | Level 1 | | | Level 2 | | | Level 3 | | | Total | |
Investments in Securities and Money Market Funds: | | | | | | | | | | | | | | | | |
Common Stocks | | $ | 323,748,997 | | | $ | — | | | $ | — | | | $ | 323,748,997 | |
Put Option Contracts | | | — | | | | 2,148,060 | | | | — | | | | 2,148,060 | |
Money Market Funds | | | 137,977,882 | | | | — | | | | — | | | | 137,977,882 | |
Total Investments in Securities and Money Market Funds | | $ | 461,726,879 | | | $ | 2,148,060 | | | $ | — | | | $ | 463,874,939 | |
| | | | | | | | | | | | | | | | | |
Other Financial Instruments: | | | | | | | | | | | | | | | | |
Written Call Option Contracts | | $ | — | | | $ | (151,798,180 | ) | | $ | — | | | $ | (151,798,180 | ) |
Total Other Financial Instruments | | $ | — | | | $ | (151,798,180 | ) | | $ | — | | | $ | (151,798,180 | ) |
Hussman Strategic Allocation Fund
| | | Level 1 | | | Level 2 | | | Level 3 | | | Total | |
Investments in Securities and Money Market Funds: | | | | | | | | | | | | | | | | |
Common Stocks | | $ | 7,473,499 | | | $ | — | | | $ | — | | | $ | 7,473,499 | |
U.S. Treasury Obligations | | | — | | | | 1,996,797 | | | | — | | | | 1,996,797 | |
Put Option Contracts | | | — | | | | 41,055 | | | | — | | | | 41,055 | |
Money Market Funds | | | 5,847,619 | | | | — | | | | — | | | | 5,847,619 | |
Total Investments in Securities and Money Market Funds | | $ | 13,321,118 | | | $ | 2,037,852 | | | $ | — | | | $ | 15,358,970 | |
| | | | | | | | | | | | | | | | | |
Other Financial Instruments: | | | | | | | | | | | | | | | | |
Written Call Option Contracts | | $ | — | | | $ | (2,089,725 | ) | | $ | — | | | $ | (2,089,725 | ) |
Total Other Financial Instruments | | $ | — | | | $ | (2,089,725 | ) | | $ | — | | | $ | (2,089,725 | ) |
Hussman Investment Trust
Notes to Financial Statements (continued) |
December 31, 2020 (Unaudited) |
Hussman Strategic Total Return Fund
| | | Level 1 | | | Level 2 | | | Level 3 | | | Total | |
Investments in Securities and Money Market Funds: | | | | | | | | | | | | | | | | |
Common Stocks | | $ | 40,071,589 | | | $ | — | | | $ | — | | | $ | 40,071,589 | |
Exchange-Traded Funds | | | 10,039,260 | | | | — | | | | — | | | | 10,039,260 | |
U.S. Treasury Obligations | | | — | | | | 252,510,815 | | | | — | | | | 252,510,815 | |
Money Market Funds | | | 17,337,919 | | | | — | | | | — | | | | 17,337,919 | |
Total Investments in Securities and Money Market Funds | | $ | 67,448,768 | | | $ | 252,510,815 | | | $ | — | | | $ | 319,959,583 | |
Hussman Strategic International Fund
| | | Level 1 | | | Level 2 | | | Level 3 | | | Total | |
Investments in Securities and Money Market Funds: | | | | | | | | | | | | | | | | |
Common Stocks | | $ | 1,807,551 | | | $ | 11,055,654 | | | $ | — | | | $ | 12,863,205 | |
Put Option Contracts | | | — | | | | 110,244 | | | | — | | | | 110,244 | |
Money Market Funds | | | 510,724 | | | | — | | | | — | | | | 510,724 | |
Total Investments in Securities and Money Market Funds | | $ | 2,318,275 | | | $ | 11,165,898 | | | $ | — | | | $ | 13,484,173 | |
| | | | | | | | | | | | | | | | | |
Other Financial Instruments: | | | | | | | | | | | | | | | | |
Futures Contracts Sold Short | | $ | (162,279 | ) | | $ | — | | | $ | — | | | $ | (162,279 | ) |
Total Other Financial Instruments | | $ | (162,279 | ) | | $ | — | | | $ | — | | | $ | (162,279 | ) |
Each Fund’s Schedule of Investments identifies the specific securities (by type of security and sector and industry type or geographical region) that comprise that Fund’s holdings within the Level 1 and Level 2 categories shown in the tables above.
The Funds did not have any assets or liabilities that were measured at fair value on a recurring basis using significant unobservable inputs (Level 3) as of December 31, 2020.
Futures Contracts and Option Transactions — Hussman Strategic Growth Fund, Hussman Strategic Allocation Fund and Hussman Strategic International Fund may purchase and write call and put options on broad-based stock indices and also may purchase and write call and put option contracts on individual securities. Each of the Funds may use financial futures contracts and related option contracts to hedge against changes in the market value of its portfolio securities. Hussman Strategic Total
Hussman Investment Trust
Notes to Financial Statements (continued) |
December 31, 2020 (Unaudited) |
Return Fund and Hussman Strategic International Fund may also purchase foreign currency options to manage their exposures to foreign currencies. Hussman Strategic Allocation Fund and Hussman Strategic Total Return Fund may purchase interest rate futures contracts to protect against a decline in the value of its portfolio resulting from rising interest rates. Hussman Strategic International Fund may enter into forward foreign currency contracts to hedge against the adverse impact of changes in foreign exchange rates on the U.S. dollar value of its investments or changes in the prices at which it effects transactions in foreign securities.
Hussman Strategic Growth Fund, Hussman Strategic Allocation Fund and Hussman Strategic International Fund may each use futures and option contracts on stock indices for the purpose of seeking to reduce the market risk that would otherwise be associated with the securities in which it invests. For example, these Funds may sell a stock index futures contracts to hedge the risk of a general market or market sector decline that might adversely affect prices of the Funds’ portfolio securities. To the extent there is a correlation between a Fund’s portfolio and a particular stock index, the sale of futures contracts on that index could reduce the Fund’s exposure to general market risk.
When a Fund writes an index option, an amount equal to the net premium (the premium less the commission) received by the Fund is recorded as a liability on the Fund’s Statement of Assets and Liabilities and is subsequently marked-to-market daily. If an index option written by a Fund expires unexercised on the stipulated expiration date or if a Fund enters into a closing purchase transaction, it will realize a gain or a loss depending on whether the cost of a closing purchase transaction is less than or exceeds the net premium received when the option was sold and the liability related to such option will be eliminated. If an index option written by a Fund is exercised, the Fund will be required to pay the difference between the closing index value and the exercise price of the option. In this event, the proceeds of the sale will be increased by the net premium originally received and the Fund will realize a gain or loss. To secure the obligation of a Fund to settle index options it has written, common stocks owned by the Fund are held in escrow by the Fund’s custodian bank (or by a securities depository acting for the custodian bank) for the benefit of the Options Clearing Corporation (the “OCC”). Stocks are released from escrow by the OCC (thus, enabling the Fund to sell the stocks) only when options expire unexercised or when the Fund enters into a closing purchase transaction.
When a Fund purchases or sells a stock index futures contract, no price is paid to or received by the Fund upon the purchase or sale of the futures contract. Instead, the Fund is required to deposit in a segregated account with its custodian an amount of cash or qualifying securities currently ranging from 2% to 11% of the contract
Hussman Investment Trust
Notes to Financial Statements (continued) |
December 31, 2020 (Unaudited) |
amount. This is called “initial margin.” Subsequent payments, known as “variation margin,” are made or received by the Fund to or from the separate account each day, depending on the daily fluctuations in the value of the underlying stock index. The Fund recognizes an unrealized gain or loss equal to the daily variation margin. If general market movements are not as expected, the Fund may not achieve the anticipated benefits from the use of futures contracts and may realize a loss. In addition to the possibility that there may be an imperfect correlation or no correlation at all between the movements in the stock index futures and the portion of the portfolio being hedged, the price of the stock index futures may not correlate perfectly with movements in the stock index due to certain market distortions.
Foreign Currency Translation — Investment securities and other assets and liabilities denominated in or expected to settle in foreign currencies are translated into U.S. dollars based on exchange rates on the following basis:
| | A. | The values of investment securities and other assets and liabilities are translated as of the close of the NYSE each day. |
| | B. | Purchases and sales of investment securities and income and expenses are translated at the rate of exchange prevailing as of 4:00 p.m., Eastern time, on the respective date of such transactions. |
| | C. | The Funds do not isolate that portion of the results of operations caused by changes in foreign exchange rates on investments from those caused by changes in market prices of securities held. Such fluctuations are included with the net realized and unrealized gains or losses on investments. |
Reported net realized foreign exchange gains or losses arise from: (1) purchases and sales of foreign currencies; (2) currency gains or losses realized between the trade and settlement dates on securities transactions; and (3) the difference between the amounts of dividends, interest and foreign withholding taxes recorded on a Fund’s books and the U.S. dollar equivalent of the amounts actually received or paid. Reported net unrealized foreign exchange gains and losses arise from changes in the U.S. dollar value of assets and liabilities that result from changes in exchange rates.
Share Valuation and Redemption Fees — The NAV per share of each Fund is calculated as of the close of regular trading on the NYSE (normally 4:00 p.m., Eastern time) on each day that the NYSE is open for business. NAV per share of a Fund is calculated by dividing the total value of the Fund’s assets, less its liabilities, by the number of its shares outstanding. The offering price and redemption price per share of each Fund is equal to the NAV per share next computed after receipt of an order to purchase or to redeem shares. However, a redemption fee of 1.5%,
Hussman Investment Trust
Notes to Financial Statements (continued) |
December 31, 2020 (Unaudited) |
payable to the applicable Fund, generally will apply to shares that are redeemed 60 days or less from the date of purchase. During the periods ended December 31, 2020 and June 30, 2020, proceeds from redemption fees, recorded in capital, totaled: $35,470 and $76,103, respectively, for Hussman Strategic Growth Fund; $9 and $232, respectively, for Hussman Strategic Allocation Fund; $35,271 and $78,782, respectively, for Hussman Strategic Total Return Fund; and $83 and $333, respectively, for Hussman Strategic International Fund.
Investment Income — Interest income is accrued as earned. Dividend income is recorded on the ex-dividend date. Non-cash dividends included in dividend income, if any, are recorded at the value of the security received. Discounts and premiums on fixed income securities are amortized using the effective interest method. Withholding taxes on foreign dividends have been recorded in accordance with the Trust’s understanding of the applicable country’s rules and tax rates.
Distributions to Shareholders — Dividends from net investment income, if any, are declared and paid annually to shareholders of Hussman Strategic Growth Fund and Hussman Strategic International Fund and are declared and paid quarterly to shareholders of Hussman Strategic Allocation Fund and Hussman Strategic Total Return Fund. Net realized short-term capital gains, if any, may be distributed throughout the year and net realized long-term capital gains, if any, are generally distributed annually. The amount of distributions from net investment income and net realized capital gains are determined in accordance with federal income tax regulations, which may differ from GAAP. These “book/tax” differences are either temporary or permanent in nature and are primarily due to timing differences in the recognition of capital gains or losses on options and futures transactions, losses deferred due to wash sales and the treatment of foreign currency transactions. The tax character of distributions paid by each Fund during the periods ended December 31, 2020 and June 30, 2020 was ordinary income.
Investment Transactions — Investment transactions are accounted for on trade date for financial reporting purposes. Realized gains and losses on investments sold are determined on a specific identification basis.
Common Expenses — Expenses of the Trust not attributable solely to one of the Funds are allocated among the Funds based on the relative net assets of each Fund or based on the nature of the expense and its relative applicability to each Fund.
Accounting Estimates — The preparation of financial statements in conformity with GAAP requires management to make estimates and assumptions that affect the reported amounts of assets and liabilities and the disclosure of contingent assets
Hussman Investment Trust
Notes to Financial Statements (continued) |
December 31, 2020 (Unaudited) |
and liabilities as of the date of the financial statements and the reported amounts of increase (decrease) in net assets from operations during the reporting period. Actual results could differ from these estimates.
Federal Income Tax — Each Fund has qualified and intends to continue to qualify each year as a “regulated investment company” under Subchapter M of the Internal Revenue Code of 1986, as amended (the “Code”). By so qualifying, a Fund generally will not be subject to federal income taxes to the extent that it distributes its net investment income and any net realized capital gains in accordance with the Code. Accordingly, no provision for income taxes has been made.
In order to avoid imposition of a federal excise tax applicable to regulated investment companies, it is each Fund’s intention to declare and pay as dividends in each calendar year at least 98% of its net investment income (earned during the calendar year) and 98.2% of its net realized capital gains (earned during the twelve months ended October 31) plus undistributed amounts from prior years.
The tax character of accumulated earnings (deficit) as of December 31, 2020 was as follows:
| | | Hussman
Strategic
Growth Fund | | | Hussman
Strategic
Allocation Fund | | | Hussman
Strategic Total
Return Fund | | | Hussman
Strategic
International
Fund | |
Net unrealized appreciation | | $ | 41,136,423 | | | $ | 1,010,058 | | | $ | 10,344,809 | | | $ | 2,353,697 | |
Accumulated ordinary income (loss) | | | 37,794 | | | | (2,124 | ) | | | 14,386 | | | | (37,218 | ) |
Capital loss carryforwards | | | (896,309,166 | ) | | | — | | | | (54,609,886 | ) | | | (16,382,920 | ) |
Other gains (losses) | | | (39,262,826 | ) | | | (687,328 | ) | | | 9,547,539 | | | | (669,343 | ) |
Other temporary differences | | | (41,783 | ) | | | (420 | ) | | | (19,531 | ) | | | (3,228 | ) |
Accumulated earnings (deficit) | | $ | (894,439,558 | ) | | $ | 320,186 | | | $ | (34,722,683 | ) | | $ | (14,739,012 | ) |
Hussman Investment Trust
Notes to Financial Statements (continued) |
December 31, 2020 (Unaudited) |
The following information is based upon the federal income tax cost of investment securities as of December 31, 2020:
| | | Hussman
Strategic
Growth Fund | | | Hussman
Strategic
Allocation Fund | | | Hussman
Strategic Total
Return Fund | | | Hussman
Strategic
International
Fund | |
Cost of investments, money market funds and foreign currencies | | $ | 428,828,751 | | | $ | 14,392,308 | | | $ | 309,614,774 | | | $ | 11,144,868 | |
Gross unrealized appreciation | | $ | 56,527,713 | | | $ | 1,262,583 | | | $ | 15,701,875 | | | $ | 2,522,357 | |
Gross unrealized depreciation | | | (15,391,290 | ) | | | (252,525 | ) | | | (5,357,066 | ) | | | (168,660 | ) |
Net unrealized appreciation | | $ | 41,136,423 | | | $ | 1,010,058 | | | $ | 10,344,809 | | | $ | 2,353,697 | |
The difference between the federal income tax cost of portfolio investments and the financial statement cost of portfolio investments for each Fund is due to certain timing differences in the recognition of capital gains or losses under income tax regulations and GAAP. These “book/tax” differences are temporary in nature and are primarily due to losses deferred due to wash sales, derivatives and adjustments to basis on publicly traded partnerships and grantor trusts.
As of June 30, 2020, the Funds had the following capital loss carryforwards for federal income tax purposes:
| | | Hussman
Strategic
Growth Fund | | | Hussman
Strategic Total
Return Fund | | | Hussman
Strategic
International
Fund | |
Short-term loss carryforwards | | $ | 648,053,124 | | | $ | 48,173,836 | | | $ | 16,382,920 | |
Long-term loss carryforwards | | | 248,256,042 | | | | 6,436,050 | | | | — | |
Total | | $ | 896,309,166 | | | $ | 54,609,886 | | | $ | 16,382,920 | |
These capital loss carryforwards, which do not expire, may be utilized by the Funds in the current and future years to offset their net realized capital gains, if any.
Each Fund recognizes the tax benefits or expenses of uncertain tax positions only when the position is “more likely than not” to be sustained assuming examination by tax authorities. Management has reviewed each Fund’s tax positions taken on federal income tax returns for the current all open tax years (generally, tax returns that have been filed within the past three years) and all major jurisdictions and has concluded that no provision for unrecognized tax benefits or expenses is required in these financial statements. Therefore, no tax expense (including interest and penalties) was recorded in the current year and no adjustments were made to prior periods.
Hussman Investment Trust
Notes to Financial Statements (continued) |
December 31, 2020 (Unaudited) |
2. INVESTMENT TRANSACTIONS
During the six months ended December 31, 2020, cost of purchases and proceeds from sales and maturities of investment securities, other than short-term investments and U.S. government securities, amounted to: $278,284,033 and $375,471,211, respectively, for Hussman Strategic Growth Fund; $7,162,484 and $6,854,818, respectively, for Hussman Strategic Allocation Fund; $95,615,448 and $72,665,017, respectively, for Hussman Strategic Total Return Fund; and $4,607,529 and $6,403,574, respectively, for Hussman Strategic International Fund.
3. TRANSACTIONS WITH AFFILIATES
Advisory Agreement
Under the terms of an Advisory Agreement between the Trust and the Adviser, Hussman Strategic Growth Fund pays the Adviser a fee, which is computed and accrued daily and paid monthly, at annual rates of 0.90% of the first $2 billion of the Fund’s average daily net assets; 0.85% of the next $3 billion of such assets; and 0.80% of such assets over $5 billion. Under the terms of a separate Advisory Agreement between the Trust and the Adviser, Hussman Strategic Allocation Fund pays the Adviser a fee, which is computed and accrued daily and paid monthly, at annual rates of: 0.75% of the first $2 billion of the Fund’s average daily net assets; 0.70% of the next $3 billion of such assets; and 0.65% of such assets over $5 billion. Under the terms of a separate Advisory Agreement between the Trust and the Adviser, Hussman Strategic Total Return Fund pays the Adviser a fee, which is computed and accrued daily and paid monthly, at annual rates of: 0.50% of the first $1 billion of the Fund’s average daily net assets; 0.45% of the next $1.5 billion of such assets; and 0.40% of such assets over $2.5 billion. Under the terms of a separate Advisory Agreement between the Trust and the Adviser, Hussman Strategic International Fund pays the Adviser a fee, which is computed and accrued daily and paid monthly, at annual rates of: 0.95% of the first $2 billion of the Fund’s average daily net assets; 0.90% of the next $3 billion of such assets; and 0.85% of such assets over $5 billion.
The Adviser has contractually agreed that, until November 1, 2021 (or until November 1, 2022 with respect to Hussman Strategic Allocation Fund), it will waive its advisory fees and/or absorb operating expenses of each Fund to the extent necessary so that operating expenses of Hussman Strategic Growth Fund, Hussman Strategic Allocation Fund, Hussman Strategic Total Return Fund and Hussman Strategic International Fund (excluding fees and expenses incurred on investments in other
Hussman Investment Trust
Notes to Financial Statements (continued) |
December 31, 2020 (Unaudited) |
investment companies and pooled investment vehicles, brokerage commissions, taxes, interest expense and any extraordinary expenses) do not exceed annually an amount equal to 1.15%, 1.25%, 0.75%, and 2.00%, respectively, of such Fund’s average daily net assets. During the six months ended December 31, 2020, the Adviser waived advisory fees in the amount of $100,193, $33,770, $8,838 and $70,795 with respect to Hussman Strategic Growth Fund, Hussman Strategic Allocation Fund, Hussman Strategic Total Return Fund and Hussman Strategic International Fund, respectively. Additionally, during the six months ended December 31, 2020, the Adviser absorbed operating expenses of $84,188 and $50,676 with respect to Hussman Strategic Allocation Fund and Hussman Strategic International Fund, respectively.
Pursuant to the Expense Limitation Agreements governing these arrangements, each Fund is obligated to reimburse the Adviser the amount of advisory fees previously waived and expenses previously absorbed by the Adviser for a period of three years from the date such fees or expenses were waived or absorbed, but only if such reimbursement does not cause the Fund’s operating expenses (after the reimbursement is taken into account) to exceed the lesser of: (i) the expense limitation in effect at the time such fees and expenses were waived or absorbed; and (ii) the expense limitation in effect at the time the Adviser seeks reimbursement of such fees and expenses. The Expense Limitation Agreements may not be terminated by the Adviser without the approval of the Board of Trustees. As of December 31, 2020, the amount of fee waivers and expense reimbursements available for possible recovery by the Adviser from Hussman Strategic Growth Fund, Hussman Strategic Allocation Fund, Hussman Strategic Total Return Fund and Hussman Strategic International Fund is $866,013, $325,927, $366,127 and $587,074, respectively. The portions of these amounts that the Adviser may recover expire as of the following dates:
| | | June 30,
2021 | | | June 30,
2022 | | | June 30,
2023 | | | December 31,
2023 | |
Hussman Strategic Growth Fund | | $ | 144,272 | | | $ | 313,486 | | | $ | 308,062 | | | $ | 100,193 | |
Hussman Strategic Allocation Fund | | $ | — | | | $ | — | | | $ | 207,969 | | | $ | 117,958 | |
Hussman Strategic Total Return Fund | | $ | 57,498 | | | $ | 166,982 | | | $ | 132,809 | | | $ | 8,838 | |
Hussman Strategic International Fund | | $ | 51,017 | | | $ | 171,269 | | | $ | 243,317 | | | $ | 121,471 | |
The Adviser may agree to continue after November 1, 2021 (or in the case of Hussman Strategic Allocation Fund, November 1, 2022) the current arrangement to limit the Funds’ expenses or to implement a similar arrangement, but it is not obligated to do so.
Hussman Investment Trust
Notes to Financial Statements (continued) |
December 31, 2020 (Unaudited) |
Certain officers of the Trust are also officers of the Adviser.
Other Service Providers
Ultimus Fund Solutions, LLC (“Ultimus”) provides administration, fund accounting, compliance and transfer agency services to the Funds. The Funds pay Ultimus fees for these services in accordance with various servicing agreements. In addition, the Funds reimburse Ultimus for certain out-of-pocket expenses incurred in providing services to the Funds, including, but not limited to, postage, supplies and costs related to the pricing of the Funds’ portfolio securities. Certain officers of the Trust are also officers of Ultimus, or of Ultimus Fund Distributors, LLC (the “Distributor”), the principal underwriter of the Funds. The Distributor is a wholly-owned subsidiary of Ultimus.
The Funds compensate certain financial intermediaries for providing account maintenance and shareholder services to shareholder accounts held through such intermediaries. During the six months ended December 31, 2020, Hussman Strategic Growth Fund, Hussman Strategic Allocation Fund, Hussman Strategic Total Return Fund and Hussman Strategic International Fund paid $80,014, $137, $55,346 and $9,337, respectively, to financial intermediaries for such services. These amounts are included in transfer agent, account maintenance and shareholder services fees on the Statements of Operations.
Trustee Compensation
Trustees and officers affiliated with the Adviser or Ultimus are not compensated by the Funds for their services. Effective October 1, 2020, each Trustee who is not an “interested person,” as defined by the 1940 Act, of the Trust or an affiliated person of the Adviser or Ultimus (an “Independent Trustee”) receives from the Trust: an annual retainer of $50,000, payable quarterly; a fee of $7,000 for attendance at each regular quarterly meeting of the Board of Trustees other than the annual meeting of the Board, for which each Independent Trustee receives an attendance fee of $12,000; a fee of $4,000 for attendance at each special meeting of the Board of Trustees; a fee of $3,000 for attendance at each meeting of any committee of the Board of Trustees that is not held on the same day as a Board of Trustees meeting; and a fee of $1,500 for participation in each informal monthly telephone conference call of the Board of Trustees. In addition, the Independent Trustees are reimbursed for travel and other expenses incurred in attending meetings. Prior to October 1, 2020, each Independent Trustee received from the Trust: an annual retainer of $50,000, payable quarterly; a fee of $10,000 for attendance at each in-person meeting of the Board of Trustees (except that such fee was $15,000 with respect to the annual meeting of the Board) and a fee of $4,000 for attendance at each telephone meeting of the Board
Hussman Investment Trust
Notes to Financial Statements (continued) |
December 31, 2020 (Unaudited) |
of Trustees; a fee of $3,000 for attendance at each meeting of any committee of the Board if not held on the same day as a Board meeting; and a fee of $1,500 for participation in each informal monthly telephone conference call of the Board. Each Fund pays its proportionate share of the Independent Trustees’ fees and expenses.
4. DERIVATIVES TRANSACTIONS
The locations in the Statements of Assets and Liabilities of the derivative positions of Hussman Strategic Growth Fund, Hussman Strategic Allocation Fund and Hussman Strategic International Fund are as follows:
Hussman Strategic Growth Fund
| | | | | Fair Value | | | Average Monthly | |
Type of
Derivative | Risk | Location | | Asset
Derivatives | | | Liability
Derivatives | | | Notional Value
During the
Six Months Ended
December 31,
2020* | |
Index put options purchased | Equity | Investments in securities at value | | $ | 2,148,060 | | | $ | — | | | $ | 316,918,083 | |
Index call options written | Equity | Written call options, at value | | | — | | | | (151,798,180 | ) | | | (313,493,049 | ) |
Hussman Strategic Allocation Fund
| | | | | Fair Value | | | Average Monthly | |
Type of
Derivative | Risk | Location | | Asset
Derivatives | | | Liability
Derivatives | | | Notional Value
During the
Six Months Ended
December 31,
2020* | |
Index put options purchased | Equity | Investments in securities at value | | $ | 41,055 | | | $ | — | | | $ | 5,703,566 | |
Index call options written | Equity | Written call options, at value | | | — | | | | (2,089,725 | ) | | | (5,703,566 | ) |
Hussman Investment Trust
Notes to Financial Statements (continued) |
December 31, 2020 (Unaudited) |
Hussman Strategic International Fund
| | | | | Fair Value | | | Average Monthly | |
Type of
Derivative | Risk | Location | | Asset
Derivatives | | | Liability
Derivatives | | | Notional Value
During the
Six Months Ended
December 31,
2020* | |
Index put options purchased | Equity | Investments in securities at value | | $ | 110,244 | | | $ | — | | | $ | 4,156,418 | |
Futures contracts sold short** | Equity | Variation margin receivable (payable) | | | — | | | | (162,279 | ) | | | (8,004,568 | ) |
* | The average monthly notional value generally represents the Fund’s derivative activity throughout the period. |
** | Includes cumulative appreciation (depreciation) of futures contracts from the date the contracts were opened through December 31, 2020. Only current variation margin is reported on the Statements of Assets and Liabilities. |
Realized and unrealized gains and losses associated with transactions in derivative instruments for Hussman Strategic Growth Fund, Hussman Strategic Allocation Fund and Hussman Strategic International Fund during the six months ended December 31, 2020 are recorded in the following locations on the Statements of Operations:
Hussman Strategic Growth Fund
Type of
Derivative | Risk | Location | | Realized
Losses | | Location | | Change in
Unrealized
Appreciation
(Depreciation) | |
Index put options purchased | Equity | Net realized gains (losses) from investments | | $ | (25,086,891 | ) | Net change in unrealized appreciation (depreciation) on investments | | $ | (753,784 | ) |
Index call options written | Equity | Net realized gains (losses) from written option contracts | | | (89,214,069 | ) | Net change in unrealized appreciation (depreciation) on written option contracts | | | 9,388,432 | |
Hussman Investment Trust
Notes to Financial Statements (continued) |
December 31, 2020 (Unaudited) |
Hussman Strategic Allocation Fund
Type of
Derivative | Risk | Location | | Realized
Losses | | Location | | Change in
Unrealized
Appreciation
(Depreciation) | |
Index put options purchased | Equity | Net realized gains (losses) from investments | | $ | (264,758 | ) | Net change in unrealized appreciation (depreciation) on investments | | $ | 49,377 | |
Index call options written | Equity | Net realized gains (losses) from written option contracts | | | (1,347,743 | ) | Net change in unrealized appreciation (depreciation) on written option contracts | | | 83,520 | |
Hussman Strategic International Fund
Type of
Derivative | Risk | Location | | Realized
Losses | | Location | | Change in
Unrealized
Appreciation
(Depreciation) | |
Index put options purchased | Equity | Net realized gains (losses) from investments | | $ | (427,665 | ) | Net change in unrealized appreciation (depreciation) on investments | | $ | 10,332 | |
Futures contracts sold short | Equity | Net realized gains (losses) from futures contracts | | | (1,452,214 | ) | Net change in unrealized appreciation (depreciation) on futures contracts | | | (95,344 | ) |
Hussman Strategic Total Return Fund had no transactions in derivative instruments during the six months ended December 31, 2020.
In the ordinary course of business, Hussman Strategic Growth Fund, Hussman Strategic Allocation Fund and Hussman Strategic International Fund may enter into transactions subject to enforceable netting agreements or other similar arrangements (“netting agreements”). Generally, the right to offset in netting agreements allows each Fund to offset the exposure it has on any transaction with a specific counterparty with
Hussman Investment Trust
Notes to Financial Statements (continued) |
December 31, 2020 (Unaudited) |
any collateral it has received or delivered in connection with other transactions with that counterparty. Generally, the Funds manage their cash collateral and securities collateral on a counterparty basis.
The offsetting of financial liabilities and derivative liabilities as of December 31, 2020 are as follows:
Hussman Strategic Growth Fund
Description | | Gross
Amounts of
Recognized
Liabilities | | | Gross
Amounts
Offset on
Statements
of Assets and
Liabilities | | | Net Amounts
of Liabilities
Presented on
Statements
of Assets and
Liabilities | | | Collateral
Pledged* | | | Net Amount | |
Written call options at market value | | $ | (151,798,180 | ) | | $ | — | | | $ | (151,798,180 | ) | | $ | — | | | $ | (151,798,180 | ) |
Total subject to a master netting or similar arrangement | | $ | (151,798,180 | ) | | $ | — | | | $ | (151,798,180 | ) | | $ | — | | | $ | (151,798,180 | ) |
* | Common stocks owned by the Fund are held in escrow by the Fund’s custodian (or by a securities depository) to secure the Fund’s obligations to settle outstanding call option contracts it has written (Note 1). |
Hussman Strategic Allocation Fund
Description | | Gross
Amounts of
Recognized
Liabilities | | | Gross
Amounts
Offset on
Statements
of Assets and
Liabilities | | | Net Amounts
of Liabilities
Presented on
Statements
of Assets and
Liabilities | | | Collateral
Pledged* | | | Net Amount | |
Written call options at market value | | $ | (2,089,725 | ) | | $ | — | | | $ | (2,089,725 | ) | | $ | — | | | $ | (2,089,725 | ) |
Total subject to a master netting or similar arrangement | | $ | (2,089,725 | ) | | $ | — | | | $ | (2,089,725 | ) | | $ | — | | | $ | (2,089,725 | ) |
* | Common stocks owned by the Fund are held in escrow by the Fund’s custodian (or by a securities depository) to secure the Fund’s obligations to settle outstanding call option contracts it has written (Note 1). |
Hussman Investment Trust
Notes to Financial Statements (continued) |
December 31, 2020 (Unaudited) |
Hussman Strategic International Fund
Description | | Gross
Amounts of
Recognized
Liabilities | | | Gross
Amounts
Offset on
Statements
of Assets and
Liabilities | | | Net Amounts
of Liabilities
Presented on
Statements
of Assets and
Liabilities | | | Collateral
Pledged* | | | Net Amount | |
Variation margin receivable - futures contracts | | $ | 64,221 | | | $ | — | | | $ | 64,221 | | | $ | (64,221 | ) | | $ | — | |
Total subject to a master netting or similar arrangement | | $ | 64,221 | | | $ | — | | | $ | 64,221 | | | $ | (64,221 | ) | | $ | — | |
* | Amounts in cash collateral pledged in the table above are limited to the net amounts of liabilities presented on the Statements of Assets and Liabilities. |
5. CERTAIN INVESTMENTS AND ASSOCIATED RISKS
The securities in which the Funds invest, as well as the risks associated with these securities and with the investment programs of the Funds, are described in each Fund’s Prospectus. Among these risks are those associated with investments in derivative instruments, investments in shares of money market funds, concentration of investments within a particular business sector and, in the case of Hussman Strategic International Fund, investments in foreign securities.
Risks of Derivative Instruments — The purchase and sale of derivative instruments, including options and futures contracts, and other derivative transactions involve risks different from those involved with direct investments in securities and also require different skills from the Adviser in managing each Fund’s portfolio of investments. While utilization of options, futures contracts and similar instruments may be advantageous to the Funds, if the Adviser is not successful in employing such instruments in managing a Fund’s investments or in anticipating general market movements, the Fund’s performance will be worse than if the Fund did not make such investments. It is possible that there will be imperfect correlation, or even no correlation, between price movements of the investments held by the Funds and the options, futures or other derivative instruments used to hedge those investments. It is also possible that a Fund may be unable to close out or liquidate its hedges during unusual periods of illiquidity in the options, futures or other markets. In addition, a Fund will pay commissions and other costs in connection with its transactions in such instruments, which may increase its expenses and reduce its investment performance.
Hussman Investment Trust
Notes to Financial Statements (continued) |
December 31, 2020 (Unaudited) |
Investments in Money Market Funds — In order to maintain sufficient liquidity to implement investment strategies, or for temporary defensive purposes, each Fund may at times invest a significant portion of its assets in shares of money market funds. As of December 31, 2020, Hussman Strategic Growth Fund and Hussman Strategic Allocation Fund had 44.0% and 43.6%, respectively, of the value of their net assets invested in shares of a money market fund registered under the 1940 Act. An investment in a money market fund is not insured or guaranteed by the Federal Deposit Insurance Corporation or any other governmental agency, entity or person. While investor losses in money market funds have been rare, they are possible. The Funds, as investors in money market funds, indirectly bear the fees and expenses of those funds, which are in addition to the fees and expenses of the Funds.
Sector Risk — If a Fund has significant investments in the securities of issuers in industries within a particular business sector, any development generally affecting that sector will have a greater impact on the value of the net assets of the Fund than would be the case if the Fund did not have significant investments in that sector. This may increase the risk of loss of an investment in a Fund and increase the volatility of a Fund’s NAV per share. From time to time, circumstances may affect a particular sector and the companies within such sector. For instance, economic or market factors, regulation or deregulation, and technological or other developments, may negatively impact all companies in a particular sector and therefore the value of a Fund’s portfolio could be adversely affected if it has significant holdings of securities of issuers in that sector. As of December 31, 2020, Hussman Strategic Growth Fund had 29.5% of the value of its net assets invested in stocks within the Consumer Discretionary sector.
Foreign Investment Risk — Compared with investing in the United States, investing in foreign markets involves a greater degree and variety of risks. Investors in foreign markets may face delayed settlements, currency controls and adverse economic developments as well as higher overall transaction costs. In addition, fluctuations in the U.S. dollar’s value versus other currencies may erode or reverse gains from investments denominated in foreign currencies or increase losses. Foreign governments may expropriate assets, impose capital or currency controls, impose punitive taxes, impose limits on ownership or nationalize a company or industry. Any of these actions could have a severe effect on securities prices and impair an investor’s ability to bring its capital or income back to the U.S. Exchange rate fluctuations also may impair a foreign issuer’s ability to repay U.S. dollar denominated debt, thereby increasing credit risk associated with investment in such debt. The values of foreign securities may be affected by incomplete, less frequent or inaccurate financial information about their issuers, social upheavals or political actions ranging from tax code changes to
Hussman Investment Trust
Notes to Financial Statements (continued) |
December 31, 2020 (Unaudited) |
government collapse. Foreign companies may also receive less coverage than U.S. companies by market analysts and may be subject to reporting standards or regulatory requirements that differ from those applicable to U.S. companies.
As of December 31, 2020, investments of Hussman Strategic International Fund in issuers in the United Kingdom (the “UK”) represented 11.1% of the value of its stock portfolio and investments by the Fund in issuers in countries within the European Union (the “EU”) represented 44.3% of the value of its stock portfolio. EU member countries that use the Euro as their currency (so-called Eurozone countries) lack the ability to implement an independent monetary policy and may be significantly affected by requirements that limit their fiscal options. Since the global economic crisis in 2008, some of these countries have depended on, and may continue to depend on, assistance from others such as the European Central Bank and other governments or institutions, and failure to implement reforms as a condition of assistance may have negative long-them effects for the economies of those countries and other European countries. In June 2016, voters in the UK approved a referendum calling for the exit of the UK from the EU (a process commonly referred to as “Brexit”), and Brexit took place on January 31, 2020. There presently is considerable uncertainty regarding the impact of Brexit on the economies and financial markets of the UK and of the EU and other European countries. As a result of Brexit, there may be an extended period of political and economic uncertainty and market volatility in the UK, the EU, other European countries and globally, which may adversely impact the prices and liquidity of securities held by Hussman Strategic International Fund.
As of December 31, 2020, Hussman Strategic International Fund had 29.7% of the value of its stock portfolio invested in stocks of companies domiciled in Japan. At times, the Japanese economy has been negatively affected by government intervention and protectionism, an unstable financial services sector, a heavy reliance on international trade, and natural disasters. These factors, as well as other adverse political developments, increases in government debt, and changes to fiscal monetary or trade policies, may negatively affect Japanese markets and the prices of stocks of Japanese companies.
6. FORWARD FOREIGN CURRENCY EXCHANGE CONTRACTS
Hussman Strategic International Fund is subject to foreign currency exchange rate risk in the normal course of pursuing its investment objective. Hussman Strategic International Fund may (but is not required to) enter into contracts for the purchase or sale of a specific foreign currency at a fixed price on a future date as a hedge or cross-hedge against either specific transactions or portfolio positions generally. Foreign
Hussman Investment Trust
Notes to Financial Statements (continued) |
December 31, 2020 (Unaudited) |
currency hedging transactions may be used to reduce the risk that the U.S. dollar value of the Fund’s holdings of securities denominated in foreign currency will decline in value due to changes in foreign currency exchange rates or to protect against adverse changes in the prices of securities that the Fund is purchasing or selling prior to settlement of those transactions. All foreign currency exchange contracts are marked-to-market daily at the applicable translation rates resulting in unrealized gains or losses. Realized and unrealized gains or losses from transactions in foreign currency exchange contracts are included in the Fund’s Statement of Assets and Liabilities and Statement of Operations. Risks associated with these contracts include the potential inability of counterparties to meet the terms of their contracts and unanticipated movements in the value of a foreign currency relative to the U.S. dollar. Hussman Strategic International Fund, as previously noted, may also purchase foreign currency options to manage foreign currency exposures.
As of and during the six months ended December 31, 2020, Hussman Strategic International Fund had no forward currency exchange contracts outstanding.
7. BANK LINE OF CREDIT
Hussman Strategic Growth Fund has an unsecured bank line of credit with its custodian bank in the amount of $10,000,000. Hussman Strategic Total Return Fund has an unsecured bank line of credit with its custodian bank in the amount of $2,000,000. Any borrowings under these arrangements bear interest at a rate determined by the lending bank at the time of borrowing. During the six months ended December 31, 2020, Hussman Strategic Growth Fund and Hussman Strategic Total Return Fund did not borrow under their respective lines of credit. Hussman Strategic Allocation Fund and Hussman Strategic International Fund currently do not have bank lines of credit.
8. CONTINGENCIES AND COMMITMENTS
The Trust’s officers and Trustees are entitled to indemnification from the Funds for certain liabilities to which they may become subject in connection with the performance of their duties to the Funds. Additionally, in the normal course of business, the Funds enter into contracts that contain a variety of representations and warranties and which may require the Funds to indemnify the other parties to the contracts in the event of certain losses. The Funds’ maximum exposure under these arrangements is unknown, as this would involve potential claims for indemnification for losses that may or may not be incurred in the future. However, based on experience, the Trust believes the risk of loss to be remote.
Hussman Investment Trust
Notes to Financial Statements (continued) |
December 31, 2020 (Unaudited) |
9. LEGAL PROCEEDINGS
Several lawsuits have been filed relating to Hussman Strategic Growth Fund’s investment in Tribune Company common stock in connection with Tribune Company’s Chapter 11 bankruptcy. The lawsuits stem from a leveraged buyout by which Tribune Company converted to a privately-held company in 2007. The Trust, Hussman Strategic Growth Fund and Hussman Strategic Advisors (the “Hussman Entities”) were named as defendants and putative members of the proposed defendant class of shareholders in an adversary proceeding brought by The Official Committee of Unsecured Creditors of Tribune Company in the U.S. Bankruptcy Court for the District of Delaware in 2010. That action was subsequently transferred to the U.S. District Court for the Southern District of New York by order of the Judicial Panel on Multidistrict Litigation, and Marc S. Kirschner, the Litigation Trustee for the Tribune Litigation Trust, became successor plaintiff to the Creditors Committee on December 31, 2012, the effective date of Tribune Company’s plan of reorganization. The Trust and Hussman Strategic Growth Fund were also named as defendants in a lawsuit filed by the indenture trustees of certain noteholders of Tribune Company in the U.S. District Court for the Southern District of Ohio in 2011. Hussman Strategic Growth Fund and Hussman Strategic Advisors were named as defendants in a similar action in the U.S. District Court for the District of Maryland in 2011. Both of those actions have been transferred to the U.S. District Court for the Southern District of New York for coordinated proceedings with many other similar lawsuits brought by individual creditors against former Tribune Company shareholders and the action currently prosecuted by the Tribune Litigation Trustee. The Trust, Hussman Strategic Growth Fund and Hussman Strategic Advisors may also be putative defendant class members in some of these actions. The plaintiffs in all these lawsuits seek to recover amounts paid to shareholders of Tribune Company in connection with the leveraged buyout, plus interest and attorneys’ fees and expenses.
An omnibus motion to dismiss the actions filed by the individual creditors (the “Individual Creditor Actions”), but not the action prosecuted by the Litigation Trustee for the Tribune Litigation Trust (the “Litigation Trustee Action”), was filed in November 2012. On September 23, 2013, the U.S. District Court Judge issued a decision and order dismissing the Individual Creditor Actions in full. The plaintiffs in those actions appealed that decision to the U.S. Court of Appeals for the Second Circuit and certain shareholder defendants, including each of the Hussman Entities, cross-appealed. The Second Circuit heard oral argument on November 5, 2014 and issued a unanimous decision affirming the District Court’s decision on March 29, 2016. A petition of the individual creditors for rehearing or rehearing en banc was denied by the Second
Hussman Investment Trust
Notes to Financial Statements (continued) |
December 31, 2020 (Unaudited) |
Circuit on July 22, 2016. The individual creditors filed a petition for a writ of certiorari in the United States Supreme Court on September 9, 2016, seeking Supreme Court review of the Second Circuit decision.
On April 10, 2018, the plaintiffs in the Individual Creditor Actions filed a motion requesting that the Second Circuit recall its mandate, vacate its prior decision, and remand the actions to the District Court for further proceedings in light of the Supreme Court’s decision in Merit Management Group, LP v. FTI Consulting, Inc., No. 16-784 (U.S.) (“Merit Management”). The Second Circuit issued an order recalling the mandate “in anticipation of further panel review,” but on December 19, 2019 reaffirmed its prior decision. On February 6, 2020, Second Circuit denied a petition of the individual creditor plaintiffs for rehearing or rehearing en banc by the Second Circuit, and on July 6, 2020, the plaintiffs filed a new petition for a writ of certiorari in the Supreme Court.
On August 2, 2013, with the District Court’s permission, the Litigation Trustee filed an amended complaint in the Litigation Trustee Action that named Hussman Strategic Growth Fund as one of the class representatives for the putative class of shareholder defendants. A global motion to dismiss this action was filed on behalf of all shareholder defendants on May 23, 2014 and the District Court issued an opinion and order granting the motion to dismiss on January 6, 2017. The Litigation Trustee noticed an appeal from the District Court’s decision on July 15, 2019.
On July 18, 2017, the Litigation Trustee requested a pre-motion conference in the District Court on a proposed motion to amend his complaint in the Litigation Trustee Action to add a claim for constructive fraudulent conveyance against the shareholder defendants based on the Supreme Court’s decision in Merit Management. Although the District Court denied the Litigation Trustee’s motion to amend its complaint on August 24, 2017, that denial was without prejudice and the Litigation Trustee renewed the motion to amend on March 8, 2018, based on the Supreme Court’s decision in Merit Management. The District Court denied the Litigation Trustee’s renewed motion to amend on April 23, 2019, and the Litigation Trustee noticed an appeal from the District Court’s decision on July 15, 2019. That appeal has been consolidated with the Litigation Trustee’s appeal of the District Court’s dismissal of the actual fraudulent transfer claims, and oral argument on both appeals took place on August 24, 2020.
The lawsuits allege no misconduct by the Hussman Entities, and each of them intends to defend itself vigorously in the lawsuits. Although the outcome of these proceedings cannot be predicted, the adverse impact to Hussman Strategic Growth Fund is not expected to exceed materially the value of the proceeds received by Hussman Strategic Growth Fund in connection with the leveraged buyout, which was
Hussman Investment Trust
Notes to Financial Statements (continued) |
December 31, 2020 (Unaudited) |
$29,432,814 (representing, as of December 31, 2020, approximately 9.4% of Hussman Strategic Growth Fund’s net assets), plus interest. If the proceedings are decided or settled in a manner adverse to Hussman Strategic Growth Fund, the payment of judgments or settlements by Hussman Strategic Growth Fund in connection with the proceedings could have a material adverse effect on its NAV per share.
10. SUBSEQUENT EVENTS
The Funds are required to recognize in their financial statements the effects of all subsequent events that provide additional evidence about conditions that existed as of the date of the Statements of Assets and Liabilities. For non-recognized subsequent events that must be disclosed to keep the financial statements from being misleading, the Funds are required to disclose the nature of the event as well as an estimate of its financial effect, or a statement that such an estimate cannot be made. Management has evaluated subsequent events through the date of issuance of these financial statements and has noted no such events.
Hussman Investment Trust
About Your Funds’ Expenses (Unaudited) |
|
We believe it is important for you to understand the impact of costs on your investment. As a shareholder of the Funds, you incur two types of costs: (1) transaction costs, which may include redemption fees; and (2) ongoing costs, including management fees and other Fund expenses. The following examples are intended to help you understand your ongoing costs (in dollars) of investing in the Funds and to compare these costs with the ongoing costs of investing in other mutual funds. A mutual fund’s ongoing costs are expressed as a percentage of its average net assets. This figure is known as the expense ratio.
The examples below are based on an investment of $1,000 made at the beginning of the period shown and held for the entire period (July 1, 2020 – December 31, 2020).
The table on the following page illustrates each Fund’s ongoing costs in two ways:
Actual fund return – This section helps you to estimate the actual expenses that you paid over the period. The “Ending Account Value” shown is derived from each Fund’s actual return, and the fourth column shows the dollar amount of operating expenses that would have been paid by an investor who started the period with $1,000 invested in that Fund. You may use that information, together with the amount of your investment, to estimate the expenses that you paid over the period.
To do so, simply divide your account value by $1,000 (for example, an $8,600 account value divided by $1,000 = 8.6), and then multiply the result by the number given for the applicable Fund under the heading “Expenses Paid During Period.”
Hypothetical 5% return – This section is intended to help you compare each Fund’s ongoing costs with those of other mutual funds. It assumes that each Fund had an annual return of 5% before expenses during the period shown. In this case, because the return used is not each Fund’s actual return, the results do not illustrate the actual expenses associated with your investment. However, the example is useful in making comparisons because the Securities and Exchange Commission (the “SEC”) requires all mutual funds to provide an example of fund expenses based on a 5% annual return. You can assess each Fund’s ongoing costs by comparing this hypothetical example with the hypothetical examples that appear in shareholder reports of other mutual funds.
Note that expenses shown in the table are meant to highlight and help you compare ongoing costs only. The expense ratios used in computing annual expenses in the tables are the expense ratios of the Funds during the six-month period ended June 30, 2020, annualized, after fee waivers and expense reimbursements. Actual expenses of the
Hussman Investment Trust
About Your Funds’ Expenses (Unaudited) (continued) |
|
Funds in future periods may differ. The calculations assume no shares were bought or sold during the period. Your actual costs may have been higher or lower, depending on the amount of your investment and the timing of any purchases or redemptions.
More information about each Fund’s expenses, including annual expense ratios, can be found elsewhere in this report. For additional information on operating expenses and other shareholder costs, please refer to each Fund’s prospectus.
| Beginning
Account Value
July 1, 2020 | Ending
Account Value
December 31, 2020 | Net
Expense
Ratio(a) | Expenses
Paid During
Period(b) |
Hussman Strategic Growth Fund |
Based on Actual Fund Return | $1,000.00 | $1,004.90 | 1.15% | $ 5.80 |
Based on Hypothetical 5% Return (before expenses) | $1,000.00 | $1,019.36 | 1.15% | $ 5.84 |
Hussman Strategic Allocation Fund |
Based on Actual Fund Return | $1,000.00 | $1,070.20 | 1.25% | $ 6.50 |
Based on Hypothetical 5% Return (before expenses) | $1,000.00 | $1,018.85 | 1.25% | $ 6.34 |
Hussman Strategic Total Return Fund |
Based on Actual Fund Return | $1,000.00 | $1,016.50 | 0.75% | $ 3.80 |
Based on Hypothetical 5% Return (before expenses) | $1,000.00 | $1,021.37 | 0.75% | $ 3.81 |
Hussman Strategic International Fund |
Based on Actual Fund Return | $1,000.00 | $1,039.90 | 2.00% | $ 10.26 |
Based on Hypothetical 5% Return (before expenses) | $1,000.00 | $1,015.08 | 2.00% | $ 10.13 |
(a) | Annualized, based on each Fund’s most recent one-half year expenses. |
(b) | Expenses are equal to each Fund’s annualized net expense ratio multiplied by the average account value over the period, multiplied by 184/366 (to reflect the one-half year period). |
Hussman Investment Trust
Other Information (Unaudited) |
|
A description of the policies and procedures the Funds use to determine how to vote proxies relating to portfolio securities is available without charge upon request by calling toll-free 1-800-HUSSMAN (1-800-487-7626), or on the SEC’s website at www.sec.gov. Information regarding how the Funds voted proxies relating to portfolio securities during the most recent 12-month period ended June 30 is also available without charge upon request by calling toll-free 1-800-HUSSMAN, or on the SEC’s website at www.sec.gov.
Each Fund files a complete listing of portfolio holdings with the SEC as of the end of the first and third quarters of each fiscal year as an exhibit to each Fund’s Form N-PORT. The filings are available upon request, by calling 1-800-HUSSMAN (1-800-487-7626). You may also obtain copies of these filings on the SEC’s website at www.sec.gov.
Hussman Investment Trust
Change in Independent Auditor |
|
On February 18, 2021, the Audit Committee of the Board of Trustees approved the engagement of Cohen & Company, Ltd. (“Cohen”) to serve as the independent registered public accounting firm for each Fund for the fiscal year ending June 30, 2021, in replacement of Ernst & Young LLP (“EY”) which served previously as the independent registered public accounting firm for the Funds. Having been notified of the Audit Committee’s intention to make this change, EY resigned as the independent registered public accounting firm of the Funds, effective as of the close of business on January 19, 2021.
The reports of EY on the financial statements of the Funds as of and for the fiscal years ended June 30, 2019 and June 30, 2020 did not contain an adverse opinion or a disclaimer of opinion, and were not qualified or modified as to uncertainties, audit scope or accounting principles. During such fiscal years, and during the subsequent interim period ended January 19, 2021: (i) there were no disagreements between the Trust and EY on any matter of accounting principles or practices, financial statement disclosure or auditing scope or procedure, which disagreements, if not resolved to the satisfaction of EY, would have caused it to make reference to the subject matter of the disagreements in its report on the financial statements of any of the Funds for such years or interim period; and (ii) there were no “reportable events,” as defined in Item 304(a)(1)(v) of Regulation S-K under the Securities Exchange Act of 1934, as amended.
During the fiscal years of the Funds ended June 30, 2019 and June 30, 2020, and during the subsequent interim period ended February 18, 2021, neither the Trust, nor anyone acting on its behalf, consulted with Cohen on behalf of the Funds regarding the application of accounting principles to a specified transaction (either completed or proposed), the type of audit opinion that might be rendered on the Funds’ financial statements, or any matter that was either: (i) the subject of a “disagreement,” as defined in Item 304(a)(1)(iv) of Regulation S-K and the instructions thereto; or (ii) a “reportable event,” as defined in Item 304(a)(1)(v) of Regulation S-K.
Privacy Notice |
FACTS | WHAT DO THE HUSSMAN FUNDS DO WITH YOUR PERSONAL INFORMATION? |
| | | | |
Why? | Financial companies choose how they share your personal information. Federal law gives consumers the right to limit some but not all sharing. Federal law also requires us to tell you how we collect, share, and protect your personal information. Please read this notice carefully to understand what we do. |
| | | | |
What? | The types of personal information we collect and share depend on the product or service you have with us. This information can include: ■ Social Security number ■ Assets ■ Retirement Assets ■ Transaction History ■ Checking Account Information ■ Purchase History ■ Account Balances ■ Account Transactions ■ Wire Transfer Instructions When you are no longer our customer, we continue to share your information as described in this notice. |
| | | | |
How? | All financial companies need to share your personal information to run their everyday business. In the section below, we list the reasons financial companies can share their customers’ personal information; the reasons the Hussman Funds choose to share; and whether you can limit this sharing. |
| | | | |
Reasons we can share your personal information | Do the Hussman Funds share? | Can you limit this sharing? |
For our everyday business purposes –
Such as to process your transactions, maintain your account(s), respond to court orders and legal investigations, or report to credit bureaus | Yes | No |
For our marketing purposes –
to offer our products and services to you | No | We don’t share |
For joint marketing with other financial companies | No | We don’t share |
For our affiliates’ everyday business purposes –
information about your creditworthiness | No | We don’t share |
For nonaffiliates to market to you | No | We don’t share |
| | |
Questions? | Call 1-800-HUSSMAN (1-800-487-7626) |
Who we are |
Who is providing this notice? | Hussman Investment Trust Ultimus Fund Distributors, LLC (Distributor) Ultimus Fund Solutions, LLC (Administrator) |
What we do |
How do the Hussman Funds protect my personal information? | To protect your personal information from unauthorized access and use, we use security measures that comply with federal law. These measures include computer safeguards and secured files and buildings. Our service providers are held accountable for adhering to strict policies and procedures to prevent any misuse of your nonpublic personal information. |
How do the Hussman Funds collect my personal information? | We collect your personal information, for example, when you ■ Provide account information ■ Give us your contact information ■ Make deposits or withdrawals from your account ■ Make a wire transfer ■ Tell us where to send the money ■ Tell us who receives the money ■ Show your government-issued ID ■ Show your driver’s license We also collect your personal information from other companies. |
Why can’t I limit all sharing? | Federal law gives you the right to limit only ■ Sharing for affiliates’ everyday business purposes – information about your creditworthiness ■ Affiliates from using your information to market to you ■ Sharing for nonaffiliates to market to you State laws and individual companies may give you additional rights to limit sharing. |
| | |
Definitions |
Affiliates | Companies related by common ownership or control. They can be financial and nonfinancial companies. ■ Hussman Strategic Advisors, Inc., the investment manager to the Hussman Funds, could be deemed to be an affiliate. |
Nonaffiliates | Companies not related by common ownership or control. They can be financial and nonfinancial companies ■ The Hussman Funds do not share with nonaffiliates so they can market to you. |
Joint marketing | A formal agreement between nonaffiliated financial companies that together market financial products or services to you. ■ The Hussman Funds do not jointly market. |
THIS PAGE INTENTIONALLY LEFT BLANK.

INVESTMENT ADVISER
Hussman Strategic Advisors, Inc.
6021 University Boulevard, Suite 490
Ellicott City, Maryland 21043
www.hussmanfunds.com
1-800-HUSSMAN (1-800-487-7626)
ADMINISTRATOR/TRANSFER AGENT
Ultimus Fund Solutions, LLC
225 Pictoria Drive, Suite 450
Cincinnati, Ohio 45246
CUSTODIANS
U.S. Bank, N.A.
425 Walnut Street
Cincinnati, Ohio 45202
The Northern Trust Company
50 South LaSalle Street
Chicago, Illinois 60675
INDEPENDENT REGISTERED
PUBLIC ACCOUNTING FIRM
Cohen & Company, Ltd.
342 N. Water Street
Suite 830
Milwaukee, Wisconsin 53202
LEGAL COUNSEL
Schulte Roth & Zabel LLP
919 Third Avenue
New York, New York 10022
This Report is authorized for
distribution only if accompanied or preceded
by a current Prospectus of the Funds.
Hussman-SAR-20
Not required
| Item 3. | Audit Committee Financial Expert. |
Not required
| Item 4. | Principal Accountant Fees and Services. |
Not required
| Item 5. | Audit Committee of Listed Registrants. |
Not applicable
| (a) | Not applicable [schedule filed under Item 1] |
| Item 7. | Disclosure of Proxy Voting Policies and Procedures for Closed-End Management Investment Companies. |
Not applicable
| Item 8. | Portfolio Managers of Closed-End Management Investment Companies |
Not applicable
| Item 9. | Purchases of Equity Securities by Closed-End Management Investment Company and Affiliated Purchasers. |
Not applicable
| Item 10. | Submission of Matters to a Vote of Security Holders. |
The registrant has not adopted procedures by which shareholders may recommend nominees to the registrant’s board of trustees.
| Item 11. | Controls and Procedures. |
(a) Based on their evaluation of the registrant’s disclosure controls and procedures (as defined in Rule 30a-3(c) under the Investment Company Act of 1940) as of a date within 90 days of the filing date of this report, the registrant’s principal executive officer and principal financial officer have concluded that such disclosure controls and procedures are reasonably designed and are operating effectively to ensure that material information relating to the registrant, including its consolidated subsidiaries, is made known to them by others within those entities, particularly during the period in which this report is being prepared, and that the information required in filings on Form N-CSR is recorded, processed, summarized, and reported on a timely basis.
(b) There were no changes in the registrant’s internal control over financial reporting (as defined in Rule 30a-3(d) under the Investment Company Act of 1940) that occurred during the period covered by this report that have materially affected, or are reasonably likely to materially affect, the registrant’s internal control over financial reporting.
| Item 12. | Disclosure of Securities Lending Activities for Closed-End Management Investment Companies. |
Not applicable
File the exhibits listed below as part of this Form. Letter or number the exhibits in the sequence indicated.
(a)(1) Any code of ethics, or amendment thereto, that is the subject of the disclosure required by Item 2, to the extent that the registrant intends to satisfy the Item 2 requirements through filing of an exhibit: Not required
(a)(2) A separate certification for each principal executive officer and principal financial officer of the registrant as required by Rule 30a-2(a) under the Act (17 CFR 270.30a-2(a)): Attached hereto
(a)(3) Any written solicitation to purchase securities under Rule 23c-1 under the Act (17 CFR 270.23c-1) sent or given during the period covered by the report by or on behalf of the registrant to 10 or more persons: Not applicable
(a)(4) Change in the registrant’s independent public accountant: Attached hereto
(b) Certifications required by Rule 30a-2(b) under the Act (17 CFR 270.30a-2(b)): Attached hereto
SIGNATURES
Pursuant to the requirements of the Securities Exchange Act of 1934 and the Investment Company Act of 1940, the registrant has duly caused this report to be signed on its behalf by the undersigned, thereunto duly authorized.
| (Registrant) | Hussman Investment Trust | | |
| | | | |
| By (Signature and Title)* | /s/ John P. Hussman | |
| | | John P. Hussman, President | |
| | | | |
| Date | February 22, 2021 | | |
Pursuant to the requirements of the Securities Exchange Act of 1934 and the Investment Company Act of 1940, this report has been signed below by the following persons on behalf of the registrant and in the capacities and on the dates indicated.
| By (Signature and Title)* | /s/ John P. Hussman | |
| | | John P. Hussman, President | |
| | | | |
| Date | February 22, 2021 | | |
| | | | |
| By (Signature and Title)* | /s/ Mark J. Seger | |
| | | Mark J. Seger, Treasurer | |
| | | | |
| Date | February 22, 2021 | | |
| * | Print the name and title of each signing officer under his or her signature. |