UNITED STATES
SECURITIES AND EXCHANGE COMMISSION
Washington, D.C. 20549
FORM N-CSR
CERTIFIED SHAREHOLDER REPORT OF REGISTERED
MANAGEMENT INVESTMENT COMPANIES
| Investment Company Act file number | 811-09911 | |
Hussman Investment Trust
(Exact name of registrant as specified in charter)
6021 University Boulevard, Suite 490 Ellicott City, Maryland | 21043 |
| (Address of principal executive offices) | (Zip code) |
David K. James
Ultimus Fund Solutions, LLC 225 Pictoria Drive, Suite 450 Cincinnati, Ohio 45246
(Name and address of agent for service)
| Registrant's telephone number, including area code: | (513) 587-3400 | |
| Date of fiscal year end: | June 30 | |
| | | |
| Date of reporting period: | December 31, 2023 | |
Form N-CSR is to be used by management investment companies to file reports with the Commission not later than 10 days after the transmission to stockholders of any report that is required to be transmitted to stockholders under Rule 30e-1 under the Investment Company Act of 1940 (17 CFR 270.30e-1). The Commission may use the information provided on Form N-CSR in its regulatory, disclosure review, inspection, and policymaking roles.
A registrant is required to disclose the information specified by Form N-CSR, and the Commission will make this information public. A registrant is not required to respond to the collection of information contained in Form N-CSR unless the Form displays a currently valid Office of Management and Budget (“OMB”) control number. Please direct comments concerning the accuracy of the information collection burden estimate and any suggestions for reducing the burden to Secretary, Securities and Exchange Commission, 450 Fifth Street, NW, Washington, DC 20549-0609. The OMB has reviewed this collection of information under the clearance requirements of 44 U.S.C. § 3507.
Item 1. Reports to Stockholders.

HUSSMAN INVESTMENT TRUST
HUSSMAN STRATEGIC GROWTH FUND
HUSSMAN STRATEGIC ALLOCATION FUND
HUSSMAN STRATEGIC TOTAL RETURN FUND
SEMI-ANNUAL REPORT
December 31, 2023
(Unaudited)
Table of Contents
| | |
Performance Information | |
Hussman Strategic Growth Fund | 1 |
Hussman Strategic Allocation Fund | 2 |
Hussman Strategic Total Return Fund | 3 |
Letter to Shareholders | 4 |
Portfolio Information | 17 |
Schedules of Investments | |
Hussman Strategic Growth Fund | 19 |
Hussman Strategic Allocation Fund | 29 |
Hussman Strategic Total Return Fund | 40 |
Statements of Assets and Liabilities | 43 |
Statements of Operations | 44 |
Statements of Changes in Net Assets | |
Hussman Strategic Growth Fund | 46 |
Hussman Strategic Allocation Fund | 47 |
Hussman Strategic Total Return Fund | 48 |
Financial Highlights | |
Hussman Strategic Growth Fund | 49 |
Hussman Strategic Allocation Fund | 50 |
Hussman Strategic Total Return Fund | 51 |
Notes to Financial Statements | 52 |
About Your Funds’ Expenses | 72 |
Other Information | 74 |
Privacy Notice | 75 |

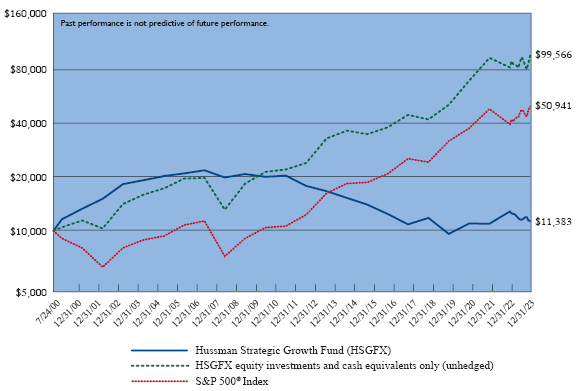
Hussman Strategic Growth Fund
Comparison of the Change in Value of a $10,000 Investment in
Hussman Strategic Growth Fund versus the S&P 500® Index(a) (Unaudited)
Average Annual Total Returns For the Periods Ended December 31, 2023 |
| | 1 Year | 3 Years | 5 Years | 10 Years | Since
Inception(b) | |
Hussman Strategic Growth Fund(c)(d) | -11.61% | 1.14% | -0.78% | -3.82% | 0.55% | |
S&P 500® Index | 26.29% | 10.00% | 15.69% | 12.03% | 7.19% | |
(a) | Hussman Strategic Growth Fund invests primarily in stocks listed on the New York, American, and NASDAQ exchanges and varies its investment exposure to market fluctuations depending on market conditions. The S&P 500® Index is an index of large capitalization stocks. However, the Fund may invest in securities that are not included in the S&P 500® Index and there are no restrictions as to the market capitalization of companies in which the Fund invests. “HSGFX equity investments and cash equivalents only (unhedged)” reflects the performance of the Fund’s stock investments and modest day-to-day cash balances, after fees and expenses, and does not reflect the impact of hedging transactions on the Fund’s overall investment performance. The Fund’s unhedged equity investments do not represent a separately available portfolio, and their performance is presented solely for purposes of comparison and performance attribution. Performance data presented using log scale. Each segment on the vertical axis represents an equivalent percentage change. |
(b) | The Fund commenced operations on July 24, 2000. |
(c) | Returns do not reflect the deduction of taxes a shareholder would pay on Fund distributions or the redemption of Fund shares. |
(d) | The Adviser has contractually agreed to waive its investment advisory fees and/or absorb Fund expenses until at least November 1, 2024 to the extent necessary to limit the Fund’s annual ordinary operating expenses to an amount not exceeding 1.15% annually of the Fund’s average daily net assets. Absent this arrangement and past fee recoveries, the expense ratio of the Fund (annualized) for the six months ended December 31, 2023 would have been 1.14%. |

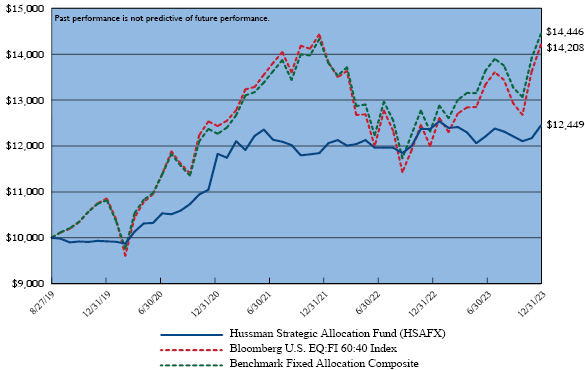
Hussman Strategic Allocation Fund
Comparison of the Change in Value of a $10,000 Investment in Hussman Strategic Allocation Fund versus the Bloomberg U.S. EQ:FI 60:40 Index(a) (Unaudited) and Benchmark Fixed Allocation Composite(a) (Unaudited)
Average Annual Total Returns For the Periods Ended December 31, 2023 |
| | 1 Year | 3 Years | Since
Inception(b) |
Hussman Strategic Allocation Fund(c)(d) | 0.65% | 4.06% | 5.17% |
Bloomberg U.S. EQ:FI 60:40 Index | 18.40% | 4.26% | 8.41% |
Benchmark Fixed Allocation Composite | 17.29% | 5.30% | 8.83% |
(a) | The Bloomberg U.S. EQ:FI 60:40 Index is designed to measure cross-asset market performance in the U.S. The index rebalances monthly to 60% equities and 40% fixed income. The equity and fixed income allocation is represented by Bloomberg U.S. Large Cap Index and U.S. Aggregate Bond Index. Benchmark Fixed Allocation Composite represents the gross investment performance of a portfolio that is invested in securities included in three separate indices, weighted as follows: 60% S&P 500® Index, 30% Bloomberg U.S. Treasury Unhedged Index and 10% Bloomberg U.S. Treasury Bills Index. The S&P 500 Index is an index of the 500 largest U.S. large capitalization stocks. The Bloomberg U.S. Treasury Unhedged Index measures U.S. dollar-denominated, fixed-rate, nominal debt issued by the U.S. Treasury. The Bloomberg U.S. Treasury Bills Index tracks the market for treasury bills with 1 to 2.9999 months to maturity issued by the U.S. government. |
(b) | The Fund commenced operations on August 27, 2019. |
(c) | Returns do no reflect the deduction of taxes a shareholder would pay on Fund distributions or the redemptions of Fund shares. |
(d) | The Advisor has contractually agreed to waive its investment advisory fees and/or absorb Fund expenses until at least November 1, 2024 to the extent necessary to limit the Fund’s annual ordinary operating expenses to an amount not exceeding 1.25% annually of the Fund’s average daily net assets. Absent this arrangement, the expense ratio of the Fund (annualized) for the six months ended December 31, 2023 would have been 2.09%. |

Hussman Strategic Total Return Fund
Comparison of the Change in Value of a $10,000 Investment in Hussman Strategic Total Return Fund
versus the Bloomberg U.S. Aggregate Bond Index(a) (Unaudited)

Average Annual Total Returns For the Periods Ended December 31, 2023 |
| | 1 Year | 3 Years | 5 Years | 10 Years | Since
Inception(b) | |
Hussman Strategic Total Return Fund(c)(d) | 6.04% | 0.21% | 4.56% | 3.60% | 4.39% | |
Bloomberg U.S. Aggregate Bond Index | 5.53% | -3.31% | 1.10% | 1.81% | 3.29% | |
(a) | The Bloomberg U.S. Aggregate Bond Index covers the U.S. investment grade fixed rate bond market, with index components for U.S. government, agency and corporate securities. The Fund does not invest solely in securities included in the Bloomberg U.S. Aggregate Bond Index and may invest in other types of bonds, as well as common stocks, exchange-traded funds and other securities. |
(b) | The Fund commenced operations on September 12, 2002. |
(c) | Returns do not reflect the deduction of taxes a shareholder would pay on Fund distributions or the redemption of Fund shares. |
(d) | The Adviser has contractually agreed to waive its investment advisory fees and/or absorb Fund expenses until at least November 1, 2024 to the extent necessary to limit the Fund’s annual ordinary operating expenses to an amount not exceeding 0.75% annually of the Fund’s average daily net assets. Absent this arrangement, the expense ratio of the Fund for the six months ended December 31, 2023 would have been 0.80%. |
The Hussman Funds
|
Letter to Shareholders | February 9, 2024 |
Dear Shareholder,
“By relentlessly depriving investors of risk-free return, the Federal Reserve has spawned an all-asset speculative bubble that we estimate will provide investors little but return-free risk. From a valuation standpoint, there is no ‘tradeoff’ between return and risk. Rather, depressed valuations tend to be followed by both strong long-term returns and modest subsequent losses, while extreme valuations tend to be followed by both poor long-term returns and deep subsequent losses. Recall that the S&P 500 lagged Treasury bills from 1929-1947, 1966-1985, and 2000-2013. 50 years out of an 84-year period. When the investment horizon begins at extreme valuations, and doesn’t end at the same extremes, the retreat in valuations acts as a headwind that consumes the return that would otherwise be provided by dividends and growth in fundamentals.”
– John P. Hussman, Ph.D., Return-Free Risk, January 2022
The U.S. stock market is two years into what we expect to be a very long, interesting trip to nowhere. We believe the strongest stock market returns in the coming decade, perhaps longer, are likely to emerge during advances that attempt to recover losses and catch up to the cumulative return of risk-free Treasury bills. Indeed, in the two-year period from December 31, 2021 to December 31, 2023, both the Strategic Growth Fund and 3-month Treasury bills outperformed the total return of the Standard & Poor’s 500 Index.
We view the recent two-year period not as a bear market followed by a durable new bull market, but instead as the extended top-formation of one of the three great speculative bubbles in U.S. history. The chart below shows the valuation measure we find best-correlated with actual subsequent returns in market cycles across history: the ratio of nonfinancial market capitalization to gross value-added, including estimated foreign revenues (MarketCap/GVA).
The Hussman Funds
|
Letter to Shareholders (continued) |

The current level of MarketCap/GVA is 3.03, slightly below the early 2022 market extreme, but beyond any level observed prior to April 2021, except for a 4-week period surrounding the 1929 peak. Historically, a level of about 1.0 has been associated with run-of-the-mill subsequent S&P 500 total returns averaging 10% annually. That is about 67% below current levels. Even restricting the data to the period since the late-1990’s, the level associated with subsequent 10% annual returns is only about 1.2.
It seems counterintuitive, but it’s true – lower expected market returns go hand-in-hand with higher risk of loss; higher expected market returns go hand-in-hand with lower risk of loss. That proposition seems to run counter to what’s taught in finance, but that is because the concept of “inefficient risk” is not discussed carefully enough. For example, if a portfolio is poorly diversified, one can typically find another portfolio that can target a higher level of expected return for the same amount of risk, or a lower level of risk for the same expected return. Likewise, in a wildly overvalued market, investors should expect not only poor returns but also higher prospective risk. Put simply, investors are not somehow rewarded for accepting higher levels of what Ben Graham described as “unintelligent” risk.
Nothing in our discipline requires market valuations to revisit their historical norms, but measured from the current extreme, we do expect that 10-12 year S&P 500 total returns may be unusually weak, even negative, and that potential market losses may be unusually deep. This is arithmetic. Over the past 10, 20, and 30 years,
The Hussman Funds
|
Letter to Shareholders (continued) |
U.S. nonfinancial gross value-added has grown at an average annual rate of 4.3%. The dividend yield of the S&P 500 is presently just 1.4%. Holding valuations at a “permanently high plateau,” the same growth and dividend yield would imply long-term stock market returns of 0.043+0.014 = 5.7%.
But allow MarketCap/GVA to retreat in the coming decade from 3.03 to the level of 1.67 it briefly reached in March 2020 – still higher than 80% of valuations observed across history – and the estimated total return of U.S. stocks in the coming decade would be 1.043*(1.67/3.03)^(1/10)-1+0.014 = -0.3% annually. As I observed at the 2000 bubble peak, “At current valuations, even optimistic assumptions lead to the conclusion that a long-term buy-and-hold approach will underperform Treasury bills during the next decade and perhaps beyond.” The S&P 500 lagged T-bills for the next 13 years.
In most bull market advances, the market action of individual stocks, industries, and sectors quickly displays very broad uniformity (what we describe as favorable “market internals”). In contrast, the market rebound of 2023 featured striking divergence within the broad market, with speculation concentrated heavily among seven large capitalization “glamour” stocks: Apple, Microsoft, Alphabet, Amazon, NVIDIA, Meta, and Tesla (dubbed the “Magnificent Seven”). For the year ended December 31, 2023, the S&P 500 had a total return of 26.26%. Yet excluding those seven stocks, the index gained only 12.49%. Weighting all components of the S&P 500 equally, rather than by market capitalization, S&P 500 Index components gained 13.84%. This performance gap between capitalization-weighted indices and broadly diversified individual stocks was a headwind for hedged-equity strategies in 2023.
Our investment discipline is to align our outlook with prevailing, observable market conditions, particularly valuations and market internals, and to shift our outlook as these conditions shift. In 2017, and more fully in 2021, we introduced adaptations to restore our strategic flexibility even in the face of persistent speculation and historically extreme valuations. These adaptations do not ensure that our discipline will participate in every market advance or avoid every market decline. Yet we do know that since we introduced our gauge of market internals into our discipline in 1998, the overall total return of the S&P 500 has concentrated in periods when market internals were favorable, while the steepest losses have emerged when they were not. We also know that the strongest market returns on a 10-12 year horizon have emerged from periods of depressed rather than elevated valuations. Put simply, we continue to believe that a focus on valuations and market internals will be essential in navigating the completion of what we see as an unresolved speculative bubble.
The Hussman Funds
|
Letter to Shareholders (continued) |
Valuations and passive investing
After the 1929-1932 market collapse, Graham & Dodd detailed the arguments that had lulled investors to turn their attention away from valuations in favor of passive investing: “This gospel was based on a certain amount of research, showing that diversified lists of common stocks had regularly increased in value over stated intervals of time for many years past… It was only necessary to buy ‘good’ stocks, regardless of price, and then to let nature take her upward course. The results of such a doctrine could not fail to be tragic.” Today, investors have again abandoned concern about valuations, embracing “passive” strategies in the belief that losses will always be recovered quickly.
One basic historical feature determines whether a period of time is dominated by the success of “passive,” “buy-and-hold,” “price-insensitive,” “performance stock” investing, or whether it is instead dominated by the success of “buy-low, sell-high,” “full cycle,” “risk-managed,” “flexible,” “margin-of-safety” investment disciplines. That feature is valuation.
An investment security is nothing but a claim to a stream of future cash flows that will be delivered to investors over time. Changes in valuation don’t change the future cash flows. Instead, changes in valuation are a kind of “transformation” between expected future returns and realized past returns. Rising valuations transform expected future returns into realized past returns. Falling valuations transform realized past returns into expected future returns. The cash flows are the same, but the level of valuation at any given time determines whether the returns are in the future or in the past.
Unfortunately, securities do not force their owners to examine valuations and do math. In the short term, the price is simply whatever investors collectively choose the price to be. In the long term, the cash flows must still arrive, and the relationship between initial price, future cash flows, and long-term return is just arithmetic.
Passive investing gains popularity during “secular” advances in valuation – starting from historically depressed valuations that gradually move to historically extreme levels. An extended period of rising valuations means, by definition, that prices must grow faster than fundamentals. Investors mistakenly come to believe that it is enough to buy stocks, regardless of price, “and then to let nature take her upward course.” They gradually imagine that market cycles no longer exist, and that new highs are always restored quickly. The reality is that those increasingly rich valuations have quietly transformed future returns into past returns. The moment that past market returns look the most glorious is the same moment that likely future returns are the most dismal.
The Hussman Funds
|
Letter to Shareholders (continued) |
In contrast, risk-managed investing gains popularity during “secular” retreats in valuation – starting from extreme valuations that gradually move toward or below their historical norms, typically over the course of several market cycles. An extended period of even modestly declining valuations means, by definition, that prices must grow slower than fundamentals. That is what creates those “long, interesting trips to nowhere.” Along the way, investors begin seeing magazine covers like Business Week’s August 1979 issue, “The Death of Equities.” The reality is that while declining valuations can take away past returns, they also quietly transform those losses into likely future returns. The moment that past market returns look the most dismal is the same moment that likely future returns are the most glorious.
Amid a market advance driven by the collective fear of missing out on an expected “Fed pivot,” it is easy to overlook that the total return of the S&P 500 has already lagged Treasury bills over the past two years. Our own investment discipline has also outperformed the S&P 500 during this period, with substantially less risk, despite last year’s frustrating two-tiered market behavior between “glamour” large-cap stocks and the broad market.
Taken together, a significant portion of U.S. market history consists of episodes when the cumulative total return of the S&P 500 lagged the cumulative total return of Treasury bills for periods of a decade or more. Those lagging returns had the same source – extreme starting valuations. These extremes were observable in 1929, 1968 and 2000, as they are today.
The fact that we expect another long, interesting 10-20 year trip to nowhere for the S&P 500 – measured from current valuations – does not mean that we believe that the market will be “uninvestable” for 10-20 years. To the contrary, the deepest market losses typically emerge a few years into these periods of revaluation. Once valuations approach or breach their historical norms, typical long-term expected returns are restored. Even in the 2000-2013 period, adequate valuations were restored by late-2002, encouraging us to remove the majority of our hedges in early 2003. Still, the overvaluation of the 2000 bubble was not fully resolved until the market collapse of 2008-2009 drove the S&P 500 below its 2002 trough.
Again, nothing in our investment discipline relies on valuations to approach or breach their run-of-the-mill historical norms. Even if valuations never revisit their historical norms, shifts in the uniformity and divergence of market internals alone should provide sufficient opportunities to change our investment outlook, possibly even in the coming quarters. Still, the strongest market return/risk profiles generally emerge when a material retreat in valuations is joined by an improvement in the uniformity of market action. While I believe that a loss of about 42% in the S&P 500 would be a fairly
The Hussman Funds
|
Letter to Shareholders (continued) |
minimal expectation over the completion of this cycle, and that a loss of 67% would be required to restore historically run-of-the-mill expected market returns, nothing in our discipline relies on these outcomes.
We expect that the coming years will regularly bring periods of constructive and even aggressive investment opportunities in stocks. However, these opportunities will most likely involve “segments” of the market cycle. The constructive opportunities will most likely emerge in periods when our main gauge of market internals is uniformly favorable, though with safety nets and position limits when valuations are extreme. The aggressive opportunities will typically emerge when material declines in valuation are joined by favorable market internals. Presently, we observe neither. That will change.
Market internals and extraordinary monetary policies
I regularly discuss our difficulty in the face of the Federal Reserve’s unprecedented and experimental monetary interventions – quantitative easing (QE) and zero interest rate policy (ZIRP) – because it is essential for investors to learn the right lesson from the recent bubble. The only thing truly “different” about this bubble is that zero interest rate policy disabled historically reliable “limits” to speculation. In previous market cycles across history, these limits could be gauged by extreme syndromes of “overvalued, overbought, overbullish” market action. Because of that reliability, these syndromes gained priority in our discipline when we stress-tested our methods against Depression-era data in 2009-2010.
Once interest rates hit zero, and the quantity of zero-interest liquidity exceeded the previous historical extreme of 16% of GDP (on its way to 36% in 2022), investors – taken together – were forced to tolerate enormous discomfort. Someone had to hold the stuff (there are no “sidelines”) and nobody wanted to. Every dollar a buyer puts “into” the market immediately comes “out” in the hands of a seller. The discomfort of holding 16-36% of GDP in zero-interest hot potatoes led investors to embrace the mantra “there is no alternative” (TINA) other than speculation. In previous market cycles, it was correct to respond bearishly to historically-reliable “limits.” Amid QE and ZIRP, our bearish response proved detrimental except when market internals had deteriorated explicitly.
In late-2017, we abandoned our bearish response to these overextended syndromes in periods when market internals were still favorable. Still, refraining from a bearish outlook isn’t the same as adopting a constructive one. In 2021, we expanded our willingness to adopt a constructive outlook even amid hypervalued market conditions (with position limits and safety nets of course) when internals are favorable – something Benjamin Graham might describe as “intelligent speculation.”
The Hussman Funds
|
Letter to Shareholders (continued) |
Though our gauge of market internals does not capture every individual market advance or decline, internals did beautifully in the recent market cycle, as they have in previous complete cycles. Likewise, valuations have remained well-correlated with subsequent market returns even in recent decades. Ignoring valuations and market internals would be the wrong lesson to draw from this bubble. These are exactly the tools that allowed us to admirably navigate decades of complete market cycles, prior to the Federal Reserve’s deranged policy experiment with zero interest rates.
Put simply, our difficulty during the recent, decidedly incomplete half-cycle bubble was not the result of our attention to valuations or market internals, but rather, our belief that speculation still had well-defined limits. In the face of QE and ZIRP, those limits became unreliable. Giving priority to the condition of market internals addresses that issue.
Valuations largely determine long-term returns and full-cycle risks. Internals gauge the speculative and risk-averse psychology that drives valuations higher or lower. Once you know the starting valuation and the likely pressures on valuation, arithmetic tells you the expected total return. TINA, ZIRP and QE disabled historically reliable “limits” to speculation – provided that speculative pressures were dominant, which we gauge based on the uniformity of market internals. We have adapted accordingly. Even if the future holds endless amounts of TINA, ZIRP, and QE, nothing in our discipline will encourage us to adopt a bearish outlook when market internals are favorable.
Fund Performance
All of the Hussman Funds pursue a value-conscious, historically-informed, risk-managed, full-cycle investment discipline. While each of the Hussman Funds outperformed its respective benchmark for the two-year period ended December 31, 2023, the narrowness of speculation in the market rebound of the past year was a headwind for our hedged-equity strategies
Strategic Growth Fund maintained a generally defensive stance toward market risk during the year ended December 31, 2023, and had a total return of -11.61%, compared with a total return of 26.29% for the S&P 500 Index. The primary driver of the Fund’s loss in 2023 was the difference in performance between the capitalization-weighted S&P 500 Index, which is the primary index used by the Fund to hedge market risk, and the performance of the Fund’s equity holdings and cash equivalents, which gained 17.28%. We believe that this performance gap is a temporary feature of a late-stage speculative bubble, and we remain committed to our disciplined, value-conscious stock selection approach. From the inception of Strategic Growth Fund
The Hussman Funds
|
Letter to Shareholders (continued) |
on July 24, 2000 through December 31, 2023, the Fund’s equity holdings and cash equivalents had an average annual total return of 10.30%, compared with an average annual total return of 7.19% for the S&P 500 Index.
Strategic Allocation Fund also maintained a generally defensive investment stance during the year ended December 31, 2023, and had a total return of 0.65%, compared with a total return of 18.40% for the Bloomberg U.S. EQ:FI 60:40 Index. Again, the primary headwind in 2023 was the difference in performance between the broadly diversified equity holdings of the Fund, and the capitalization-weighted indices used by the Fund to hedge market risk.
Strategic Total Return Fund maintained an unhedged but modest exposure to interest rate volatility during the year, typically ranging between 2-3 years in duration, and had a total return of 6.04%, compared with a total return of 5.53% for the Bloomberg U.S. Aggregate Bond Index.
Portfolio Composition
As of December 31, 2023, Strategic Growth Fund had net assets of $377,208,056, and held 192 stocks in a wide variety of industries. The largest sector holdings as a percent of net assets were technology (21.9%), health care (15.5%), consumer discretionary (15.0%), consumer staples (14.4%), communications (10.1%), materials (8.0%), energy (7.3%) and industrials (7.1%). The smallest sector holdings as a percent of net assets were financials (2.1%) and utilities (0.9%).
Strategic Growth Fund’s holdings of individual stocks as of December 31, 2023 were valued at $385,643,792. Against these stock positions, the Fund also held 488 option combinations (long put option/short call option) on the S&P 500 Index and 740 option combinations on the Russell 2000 Index. Each option combination behaves inversely to the underlying index, and has a notional value of $100 times the index value. On December 31, 2023, the S&P 500 Index closed at 4,769.83, while the Russell 2000 Index closed at 2,027.074. The Fund’s total hedge represented a notional value of $382,771,180, hedging 99.3% of the dollar value of the Fund’s investment positions in individual stocks.
Though the performance of Strategic Growth Fund’s diversified portfolio cannot be attributed to any narrow group of stocks, the following equity holdings achieved gains in excess of $1 million during the six months ended December 31, 2023: Customers Bancorp, Hibbett Sports, Nutanix, Alphabet, Super Micro Computer, Symbotic,
The Hussman Funds
|
Letter to Shareholders (continued) |
Qualcomm, Sprouts Farmers Market, VMware and Amazon. Equity holdings with portfolio losses in excess of $1 million during this period were Canadian Solar, Ebix, Clearfield, SolarEdge Technologies, Allegro Microsystems and Array Tech.
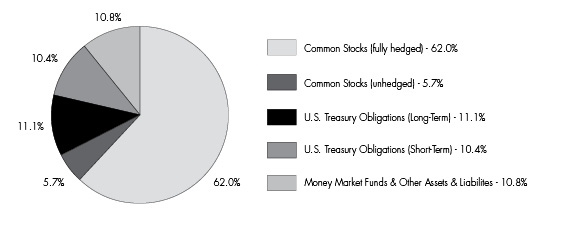
As of December 31, 2023, Strategic Allocation Fund had net assets of $28,514,380 and held 192 stocks in a wide variety of industries. The largest sector holdings as a percent of net assets were technology (14.5%), health care (10.2%), consumer discretionary (10.1%), consumer staples (9.5%), communications (6.7%), materials (5.3%), energy (4.8%) and industrials (4.7%). The smallest sector weights were financials (1.3%) and utilities (0.6%). Treasury bills, Treasury notes and money market funds represented 44.8% of the Fund’s net assets.
Strategic Allocation Fund’s holdings of individual stocks as of December 31, 2023 were valued at $19,289,802, representing 67.7% of the Fund’s net assets. Against these stock positions, the Fund also held 23 option combinations (long put option/short call option) on the S&P 500 and 33 option combinations on the Russell 2000 Index. The notional value of this hedge was $17,659,953, hedging 91.6% of the value of equity investments held by the Fund. The Fund’s holdings in long-term Treasury obligations represented 9.0% of the Fund’s net assets.
In Strategic Allocation Fund, during the six months ended December 31, 2023, the following equity holdings achieved gains in excess of $50,000: Nutanix, Hibbett Sports, Customers Bancorp, Alphabet, Qualcomm, Symbotic, Sprouts Farmers Market and Amazon. Equity holdings with portfolio losses in excess of $50,000 during this period were Canadian Solar, Ebix, SolarEdge Technologies, Clearfield, Allegro Microsystems and Array Tech.
As of December 31, 2023, Strategic Total Return Fund had net assets of $201,204,685. Treasury bills, Treasury notes, Treasury Inflation-Protected Securities (TIPS) and money market funds represented 82.8% of the Fund’s net assets. Sector holdings of equities as a percent of net assets were precious metals shares (13.4%), energy (1.4%), exchange-traded funds (1.7%) and utilities (1.0%).
In Strategic Total Return Fund, during the six months ended December 31, 2023, the following holdings achieved portfolio gains in excess of $250,000: Agnico Eagle Mines, Barrick Gold, NRG Energy, Newmont, SM Energy and a two U.S. Treasury Notes maturing in 2024 and 2025. There were no portfolio holdings with a loss in excess of $250,000 during this period.
Supplementary performance information for the Funds is available on the Hussman Funds website: www.hussmanfunds.com
The Hussman Funds
|
Letter to Shareholders (continued) |
Current Outlook
Presently, our most reliable valuation measures are again beyond every extreme in U.S. history prior to April 2021, apart from 4 weeks surrounding the 1929 market peak. Meanwhile, our most reliable gauge of market internals remains unfavorable as the result of persistent divergences across individual securities and sectors.
Although the stock market has lagged Treasury bills for more than two years, my impression is that investors feel an almost excruciating “fear of missing out” amid nominal record highs in the S&P 500 and Nasdaq 100, enthusiasm about an economic “soft landing,” and an expected “pivot” to lower interest rates. In my view, abandoning systematic investment discipline amid the most extreme market conditions in history would be a costly way to buy a fleeting sigh of relief.
We know that valuations are informative about long-term returns and full-cycle losses, but not about short-term outcomes. The only way the market could reach valuations as extreme as today was to advance, unfazed, through every lesser extreme. The consequences of rich valuations are often deferred when investors are inclined to speculate. Still, the deferral of consequences should not be confused with the absence of consequences. Presently, it is not only extreme valuations, but the full combination of extreme valuations, divergent market internals, and a fresh preponderance of speculative warning flags that holds us to a defensive outlook.
We estimate that current market conditions now “cluster” among the worst 0.1% instances in history – more similar to major market peaks and dissimilar to major market lows than 99.9% of all post-war periods. The handful of similarly extreme instances, most notably in 1972, 1987, 1998, 2000, 2018, 2020, and 2022, were typically followed by abrupt market losses over a handful of weeks, often seeing deeper follow-through later. I treat these outcomes as “regularities” rather than “forecasts.” Our primary focus, as always, is to align our investment outlook with prevailing, observable market conditions. No forecasts are required.
With regard to the mega-cap glamour stocks dubbed the “Magnificent Seven,” it seems that investors have largely ignored a decade of progressive slowing in their total revenue growth and narrowing of their aggregate operating profit margins. Among the things that investors often forget about mega-cap growth stocks is that both growth rates and operating margins tend to decline as companies become dominant. An emerging growth company with 100% year-over-year growth, sustainable prospects for continued growth, and operating margins of 40% might fetch a price/revenue
The Hussman Funds
|
Letter to Shareholders (continued) |
multiple in the range of 15-20. Two or three years later, year-over-year growth might be down to 50%, operating margins down to 30%, and a proper discounted cash flow calculation might justify a price/revenue multiple in the 5-10 range.
Several years later, the company might be enormous in terms of total revenues and profits, but progressively slowing to growth of 10% annually or less, with operating margins down to 25%. By then, the justified price/revenue multiple might be only 2. Yet investors might still be paying a multiple of 5-10 times revenues because they ignore a central feature of investment analysis: growth rates and operating margins are not fixed numbers, but trajectories. Ignoring this process is how steep losses happen.
In the bond market, we would characterize the prevailing 4.2% yield on 10-year Treasury bonds as “reasonable but inadequate.” Based on prevailing Treasury bill yields, core inflation, and nominal GDP growth, our benchmark for 10-year Treasury bond yields (below which 10-year Treasury bonds have historically lagged Treasury bills) presently stands at about 5.2%. Again, this is not a forecast, but simply a benchmark of what we would view as an adequate yield, relative to prevailing T-bill yields. As always, this benchmark will change as market and economic conditions change.
Our view of precious metals shares is generally favorable at present. Historically, the shares of precious metals companies tend to perform most strongly when real interest rates and the U.S. dollar are falling, particularly amid weak economic conditions when nominal Treasury yields are falling as well. As usual, our investment position at any time is a reflection of observable market conditions, and will change as those conditions change.
Amid the enthusiasm and now nearly unanimous consensus that U.S. recession risk is behind us, we view the data as consistent with a U.S. economy at the borderline of recession, though we would need more evidence to expect that outcome with confidence. Among our continuing concerns is the progressive weakening in leading measures of production, income, and employment. For example, the Conference Board Leading Economic Index has never experienced a year-over-year decline in excess of 7% except in the context of recession. While real U.S. Gross Domestic Product grew by 3.1% in 2023, real U.S. Gross Domestic Income, which measures the same economic activity in a different way, contracted by -0.1%, a disparity previously observed only in the third quarter of 2007, prior to the 2008-2009 recession.
Similarly, the level of new orders and order backlogs reported in regional and national purchasing managers and Federal Reserve surveys has declined to levels consistent with oncoming recession. While U.S. job creation appears robust on the
The Hussman Funds
|
Letter to Shareholders (continued) |
surface, we also observe a decline in both aggregate hours worked and the number of full-time workers, while the number of workers classified as “part-time for economic reasons” is increasing. Overall, we view the data as more consistent with the borderline of recession than an assured “soft landing” or continued expansion.
Emphatically, our investment outlook will change as market conditions change. A favorable shift in market internals would encourage us to adopt a neutral or constructive outlook (albeit with position limits and safety nets) even amid current speculative extremes. We made those constructive adaptations to our investment discipline in 2017 and 2021, and we are serious about adhering to that discipline. For now, however, we are equally serious about the downside risk, and frankly, the crash risk, implied by prevailing extremes.
Though we believe that a passive investment approach in the S&P 500 is likely to encounter depressed returns and steep risk in the coming years, investors need not commit themselves to an “either, or” approach to investing. For investors with passive exposure to the S&P 500, we believe that Strategic Growth Fund – particularly with the adaptations of recent years – can serve as a risk-managed diversifier, as our investment discipline effectively served in previous, complete market cycles prior to the recent speculative half-cycle. Likewise, Strategic Allocation Fund is well-suited, in our view, as a diversifier for conventional, balanced investment strategies such as 60% equity / 40% fixed-income portfolios. Finally, Strategic Total Return Fund can serve as an effective diversifier for the fixed-income segment of investor portfolios, having outperformed the Bloomberg U.S. Aggregate Bond Index since its inception on September 12, 2002, and for the 1, 3, 5, 7, and 10-year periods ended December 31, 2023.
Faced with valuations that rival the historic extremes of 1929 and 2022, coupled with divergent market internals and a preponderance of syndromes that characterize extreme speculation, our recent defensive investment outlook in the stock market has been very much intended. That outlook will also change. The strongest estimated return/risk profiles emerge when a material retreat in valuations is joined by an improvement in market internals. Still, an improvement in market internals would be welcome enough. We believe that our disciplined, value-conscious, strategic response to changing market conditions will be essential in navigating the uncertainties ahead.
As always, I remain grateful for your trust.
Sincerely,
John P. Hussman, Ph.D.
The Hussman Funds
|
Letter to Shareholders (continued) |
Past performance is not predictive of future performance. There is no assurance that the Hussman Funds will achieve their investment objectives. Investment results and principal value will fluctuate so that shares of the Funds, when redeemed, may be worth more or less than their original cost. It is possible to lose money when investing in securities. Current performance may be higher or lower than the performance data quoted.
Periodic updates regarding market conditions and investment strategy, as well as special reports, analysis, and performance data current to the most recent month end, are available at the Hussman Funds website www.hussmanfunds.com.
An investor should consider the investment objectives, risks, charges and expenses of the Funds carefully before investing. The Funds’ prospectuses contain this and other important information. To obtain a copy of the Hussman Funds’ prospectuses please visit our website at www.hussmanfunds.com or call 1-800-487-7626 and a copy will be sent to you free of charge. Please read the prospectus carefully before you invest. The Hussman Funds are distributed by Ultimus Fund Distributors, LLC.
Estimates of prospective return and risk for equities, bonds and other financial markets are forward-looking statements based the analysis and reasonable beliefs of Hussman Strategic Advisors (the “Adviser”), which serves as the investment adviser of the Funds. They are not a guarantee of future performance and are not indicative of the prospective returns of any of the Hussman Funds. Actual returns may differ substantially from the estimates provided. Estimates of prospective long-term returns for the S&P 500 reflect valuation methods focusing on the relationship between current market prices and earnings, dividends and other fundamentals, adjusted for variability over the economic cycle.
This Letter to Shareholders seeks to describe some of the Adviser’s current opinions and views of the financial markets. Although the Adviser believes it has a reasonable basis for the opinions or views expressed, actual results may differ, sometimes significantly so, from those expected or expressed. The securities held by the Funds that are discussed in this Letter to Shareholders were held during the period covered by this Report. They do not comprise the entire investment portfolios of the Funds, may be sold at any time and may no longer be held by the Funds. The opinions of the Adviser with respect to those securities may change at any time.
Hussman Strategic Growth Fund
Portfolio Information |
December 31, 2023 (Unaudited) |
Sector Allocation (% of Common Stocks)

Hussman Strategic Allocation Fund
Portfolio Information |
December 31, 2023 (Unaudited) |
Asset Allocation (% of Net Assets)
Hussman Strategic Allocation Fund
Portfolio Information (continued) |
December 31, 2023 (Unaudited) |
Sector Allocation (% of Common Stocks)

Hussman Strategic Total Return Fund
Portfolio Information |
December 31, 2023 (Unaudited) |
Asset Allocation (% of Net Assets)

Hussman Strategic Growth Fund
Schedule of Investments |
December 31, 2023 (Unaudited) |
COMMON STOCKS — 102.3% | | Shares | | | Value | |
Communications — 10.1% | | | | | | | | |
Advertising & Marketing — 0.2% | | | | | | | | |
Omnicom Group, Inc. (a) | | | 10,000 | | | $ | 865,100 | |
| | | | | | | | | |
Cable & Satellite — 1.2% | | | | | | | | |
Comcast Corporation - Class A (a) | | | 80,000 | | | | 3,508,000 | |
Sirius XM Holdings, Inc. (a) | | | 200,000 | | | | 1,094,000 | |
| | | | | | | | 4,602,000 | |
Entertainment Content — 0.9% | | | | | | | | |
AMC Networks, Inc. - Class A (a)(b) | | | 50,000 | | | | 939,500 | |
AppLovin Corporation - Class A (a)(b) | | | 60,000 | | | | 2,391,000 | |
| | | | | | | | 3,330,500 | |
Internet Media & Services — 5.7% | | | | | | | | |
Alphabet, Inc. - Class C (a)(b) | | | 74,000 | | | | 10,428,820 | |
Booking Holdings, Inc. (a)(b) | | | 400 | | | | 1,418,888 | |
Meta Platforms, Inc. - Class A (a)(b) | | | 15,000 | | | | 5,309,400 | |
Netflix, Inc. (a)(b) | | | 1,000 | | | | 486,880 | |
Shutterstock, Inc. (a) | | | 80,000 | | | | 3,862,400 | |
| | | | | | | | 21,506,388 | |
Publishing & Broadcasting — 0.7% | | | | | | | | |
Gray Television, Inc. | | | 100,000 | | | | 896,000 | |
Nexstar Media Group, Inc. (a) | | | 10,000 | | | | 1,567,500 | |
| | | | | | | | 2,463,500 | |
Telecommunications — 1.4% | | | | | | | | |
Verizon Communications, Inc. (a) | | | 140,000 | | | | 5,278,000 | |
| | | | | | | | | |
Consumer Discretionary — 15.0% | | | | | | | | |
Apparel & Textile Products — 2.0% | | | | | | | | |
Carter’s, Inc. (a) | | | 60,000 | | | | 4,493,400 | |
Crocs, Inc. (a)(b) | | | 15,000 | | | | 1,401,150 | |
Tapestry, Inc. (a) | | | 50,000 | | | | 1,840,500 | |
| | | | | | | | 7,735,050 | |
Automotive — 1.0% | | | | | | | | |
BorgWarner, Inc. (a) | | | 60,000 | | | | 2,151,000 | |
Harley-Davidson, Inc. (a) | | | 40,000 | | | | 1,473,600 | |
| | | | | | | | 3,624,600 | |
Hussman Strategic Growth Fund
Schedule of Investments (continued) |
December 31, 2023 (Unaudited) |
COMMON STOCKS — 102.3% (continued) | | Shares | | | Value | |
Consumer Discretionary — 15.0% (continued) |
Consumer Services — 0.3% | | | | | | | | |
Perdoceo Education Corporation (a) | | | 60,000 | | | $ | 1,053,600 | |
| | | | | | | | | |
E-Commerce Discretionary — 2.2% | | | | | | | | |
Amazon.com, Inc. (a)(b) | | | 40,000 | | | | 6,077,600 | |
Etsy, Inc. (a)(b) | | | 30,000 | | | | 2,431,500 | |
| | | | | | | | 8,509,100 | |
Home & Office Products — 0.4% | | | | | | | | |
Tempur Sealy International, Inc. (a) | | | 30,000 | | | | 1,529,100 | |
| | | | | | | | | |
Home Construction — 0.8% | | | | | | | | |
Century Communities, Inc. (a) | | | 20,000 | | | | 1,822,800 | |
Forestar Group, Inc. (a)(b) | | | 35,000 | | | | 1,157,450 | |
| | | | | | | | 2,980,250 | |
Leisure Facilities & Services — 2.0% | | | | | | | | |
Brinker International, Inc. (a)(b) | | | 60,000 | | | | 2,590,800 | |
Starbucks Corporation (a) | | | 30,000 | | | | 2,880,300 | |
Sweetgreen, Inc. - Class A (a)(b) | | | 200,000 | | | | 2,260,000 | |
| | | | | | | | 7,731,100 | |
Leisure Products — 0.4% | | | | | | | | |
Winnebago Industries, Inc. (a) | | | 20,000 | | | | 1,457,600 | |
| | | | | | | | | |
Retail - Discretionary — 5.5% | | | | | | | | |
AutoNation, Inc. (a)(b) | | | 4,000 | | | | 600,720 | |
Big 5 Sporting Goods Corporation (a) | | | 80,000 | | | | 507,200 | |
Buckle, Inc. (The) (a) | | | 30,000 | | | | 1,425,600 | |
Dick’s Sporting Goods, Inc. (a) | | | 20,000 | | | | 2,939,000 | |
Hibbett, Inc. (a) | | | 40,000 | | | | 2,880,800 | |
Kohl’s Corporation (a) | | | 40,000 | | | | 1,147,200 | |
Macy’s, Inc. (a) | | | 100,000 | | | | 2,012,000 | |
Sally Beauty Holdings, Inc. (b) | | | 200,000 | | | | 2,656,000 | |
Ulta Beauty, Inc. (a)(b) | | | 9,000 | | | | 4,409,910 | |
Urban Outfitters, Inc. (a)(b) | | | 60,000 | | | | 2,141,400 | |
| | | | | | | | 20,719,830 | |
Wholesale - Discretionary — 0.4% | | | | | | | | |
LKQ Corporation (a) | | | 20,000 | | | | 955,800 | |
ScanSource, Inc. (a)(b) | | | 10,000 | | | | 396,100 | |
| | | | | | | | 1,351,900 | |
Hussman Strategic Growth Fund
Schedule of Investments (continued) |
December 31, 2023 (Unaudited) |
COMMON STOCKS — 102.3% (continued) | | Shares | | | Value | |
Consumer Staples — 14.4% | | | | | | | | |
Beverages — 2.0% | | | | | | | | |
Coca-Cola Company (The) (a) | | | 40,000 | | | $ | 2,357,200 | |
PepsiCo, Inc. (a) | | | 30,000 | | | | 5,095,200 | |
| | | | | | | | 7,452,400 | |
Food — 6.9% | | | | | | | | |
Campbell Soup Company (a) | | | 100,000 | | | | 4,323,000 | |
Flowers Foods, Inc. (a) | | | 40,000 | | | | 900,400 | |
Fresh Del Monte Produce, Inc. | | | 20,000 | | | | 525,000 | |
General Mills, Inc. (a) | | | 60,000 | | | | 3,908,400 | |
Hershey Company (The) (a) | | | 14,000 | | | | 2,610,160 | |
Ingredion, Inc. (a) | | | 20,000 | | | | 2,170,600 | |
J.M. Smucker Company (The) (a) | | | 20,000 | | | | 2,527,600 | |
Kellanova (a) | | | 60,000 | | | | 3,354,600 | |
Kraft Heinz Company (The) (a) | | | 40,000 | | | | 1,479,200 | |
Lamb Weston Holdings, Inc. (a) | | | 40,000 | | | | 4,323,600 | |
| | | | | | | | 26,122,560 | |
Household Products — 1.4% | | | | | | | | |
Colgate-Palmolive Company (a) | | | 20,000 | | | | 1,594,200 | |
Kimberly-Clark Corporation (a) | | | 30,000 | | | | 3,645,300 | |
| | | | | | | | 5,239,500 | |
Retail - Consumer Staples — 3.3% | | | | | | | | |
BJ’s Wholesale Club Holdings, Inc. (a)(b) | | | 30,000 | | | | 1,999,800 | |
Kroger Company (The) (a) | | | 60,000 | | | | 2,742,600 | |
Natural Grocers by Vitamin Cottage, Inc. (a) | | | 85,000 | | | | 1,360,000 | |
Sprouts Farmers Market, Inc. (b) | | | 40,000 | | | | 1,924,400 | |
Target Corporation (a) | | | 20,000 | | | | 2,848,400 | |
Walgreens Boots Alliance, Inc. (a) | | | 60,000 | | | | 1,566,600 | |
| | | | | | | | 12,441,800 | |
Wholesale - Consumer Staples — 0.8% | | | | | | | | |
Andersons, Inc. (The) (a) | | | 20,000 | | | | 1,150,800 | |
United Natural Foods, Inc. (a)(b) | | | 120,000 | | | | 1,947,600 | |
| | | | | | | | 3,098,400 | |
Energy — 7.3% | | | | | | | | |
Oil & Gas Producers — 3.9% | | | | | | | | |
APA Corporation (a) | | | 40,000 | | | | 1,435,200 | |
California Resources Corporation (a) | | | 40,000 | | | | 2,187,200 | |
Civitas Resources, Inc. (a) | | | 20,000 | | | | 1,367,600 | |
Coterra Energy, Inc. (a) | | | 40,000 | | | | 1,020,800 | |
Hussman Strategic Growth Fund
Schedule of Investments (continued) |
December 31, 2023 (Unaudited) |
COMMON STOCKS — 102.3% (continued) | | Shares | | | Value | |
Energy — 7.3% (continued) |
Oil & Gas Producers — 3.9% (continued) |
Diamondback Energy, Inc. (a) | | | 10,000 | | | $ | 1,550,800 | |
Exxon Mobil Corporation (a) | | | 20,000 | | | | 1,999,600 | |
Marathon Petroleum Corporation (a) | | | 16,000 | | | | 2,373,760 | |
Range Resources Corporation (a) | | | 40,000 | | | | 1,217,600 | |
SM Energy Company (a) | | | 20,000 | | | | 774,400 | |
Vital Energy, Inc. (a)(b) | | | 20,000 | | | | 909,800 | |
| | | | | | | | 14,836,760 | |
Renewable Energy — 3.4% | | | | | | | | |
Array Technologies, Inc. (a)(b) | | | 200,000 | | | | 3,360,000 | |
Canadian Solar, Inc. (a)(b) | | | 250,000 | | | | 6,557,500 | |
SolarEdge Technologies, Inc. (a)(b) | | | 30,000 | | | | 2,808,000 | |
| | | | | | | | 12,725,500 | |
Financials — 2.1% | | | | | | | | |
Asset Management — 0.2% |
Federated Hermes, Inc. (a) | | | 20,000 | | | | 677,200 | |
| | | | | | | | | |
Banking — 1.0% | | | | | | | | |
Associated Banc-Corp (a) | | | 30,000 | | | | 641,700 | |
Customers Bancorp, Inc. (a)(b) | | | 40,000 | | | | 2,304,800 | |
New York Community Bancorp, Inc. (a) | | | 80,000 | | | | 818,400 | |
| | | | | | | | 3,764,900 | |
Insurance — 0.9% | | | | | | | | |
Old Republic International Corporation | | | 40,000 | | | | 1,176,000 | |
Unum Group (a) | | | 48,000 | | | | 2,170,560 | |
| | | | | | | | 3,346,560 | |
Health Care — 15.5% | | | | | | | | |
Biotech & Pharma — 10.1% | | | | | | | | |
ACADIA Pharmaceuticals, Inc. (a)(b) | | | 40,000 | | | | 1,252,400 | |
Amgen, Inc. (a) | | | 6,000 | | | | 1,728,120 | |
Biogen, Inc. (a)(b) | | | 6,000 | | | | 1,552,620 | |
Bristol-Myers Squibb Company (a) | | | 30,000 | | | | 1,539,300 | |
Catalyst Pharmaceuticals, Inc. (a)(b) | | | 150,000 | | | | 2,521,500 | |
Corcept Therapeutics, Inc. (a)(b) | | | 50,000 | | | | 1,624,000 | |
Dynavax Technologies Corporation (a)(b) | | | 80,000 | | | | 1,118,400 | |
Exelixis, Inc. (a)(b) | | | 140,000 | | | | 3,358,600 | |
Gilead Sciences, Inc. | | | 40,000 | | | | 3,240,400 | |
Halozyme Therapeutics, Inc. (a)(b) | | | 30,000 | | | | 1,108,800 | |
Hussman Strategic Growth Fund
Schedule of Investments (continued) |
December 31, 2023 (Unaudited) |
COMMON STOCKS — 102.3% (continued) | | Shares | | | Value | |
Health Care — 15.5% (continued) |
Biotech & Pharma — 10.1% (continued) |
Harmony Biosciences Holdings, Inc. (a)(b) | | | 20,000 | | | $ | 646,000 | |
Incyte Corporation (a)(b) | | | 30,000 | | | | 1,883,700 | |
Innoviva, Inc. (a)(b) | | | 100,000 | | | | 1,604,000 | |
Ironwood Pharmaceuticals, Inc. (a)(b) | | | 60,000 | | | | 686,400 | |
Johnson & Johnson (a) | | | 10,000 | | | | 1,567,400 | |
Neurocrine Biosciences, Inc. (a)(b) | | | 10,000 | | | | 1,317,600 | |
Pacira BioSciences, Inc. (a)(b) | | | 20,000 | | | | 674,800 | |
Pfizer, Inc. (a) | | | 120,000 | | | | 3,454,800 | |
Regeneron Pharmaceuticals, Inc. (a)(b) | | | 4,000 | | | | 3,513,160 | |
Supernus Pharmaceuticals, Inc. (a)(b) | | | 72,000 | | | | 2,083,680 | |
Vertex Pharmaceuticals, Inc. (a)(b) | | | 3,000 | | | | 1,220,670 | |
Voyager Therapeutics, Inc. (a)(b) | | | 50,000 | | | | 422,000 | |
| | | | | | | | 38,118,350 | |
Health Care Facilities & Services — 2.6% | | | | | | | | |
CVS Health Corporation (a) | | | 20,000 | | | | 1,579,200 | |
HCA Healthcare, Inc. (a) | | | 10,000 | | | | 2,706,800 | |
NeoGenomics, Inc. (a)(b) | | | 25,000 | | | | 404,500 | |
Patterson Companies, Inc. (a) | | | 100,000 | | | | 2,845,000 | |
Universal Health Services, Inc. - Class B (a) | | | 14,000 | | | | 2,134,160 | |
| | | | | | | | 9,669,660 | |
Medical Equipment & Devices — 2.8% | | | | | | | | |
Align Technology, Inc. (b) | | | 14,000 | | | | 3,836,000 | |
Exact Sciences Corporation (a)(b) | | | 30,000 | | | | 2,219,400 | |
Illumina, Inc. (a)(b) | | | 10,000 | | | | 1,392,400 | |
Penumbra, Inc. (a)(b) | | | 2,000 | | | | 503,080 | |
Shockwave Medical, Inc. (a)(b) | | | 10,000 | | | | 1,905,600 | |
Zynex, Inc. (a)(b) | | | 60,000 | | | | 653,400 | |
| | | | | | | | 10,509,880 | |
Industrials — 7.1% | | | | | | | | |
Commercial Support Services — 0.2% | | | | | | | | |
H&R Block, Inc. (a) | | | 20,000 | | | | 967,400 | |
Hussman Strategic Growth Fund
Schedule of Investments (continued) |
December 31, 2023 (Unaudited) |
COMMON STOCKS — 102.3% (continued) | | Shares | | | Value | |
Industrials — 7.1% (continued) |
Electrical Equipment — 1.7% | | | | | | | | |
Atkore, Inc. (a)(b) | | | 10,000 | | | $ | 1,600,000 | |
Bloom Energy Corporation - Class A (a)(b) | | | 60,000 | | | | 888,000 | |
Sensata Technologies Holding plc (a) | | | 70,000 | | | | 2,629,900 | |
Vontier Corporation (a) | | | 40,000 | | | | 1,382,000 | |
| | | | | | | | 6,499,900 | |
Engineering & Construction — 0.7% | | | | | | | | |
Primoris Services Corporation (a) | | | 80,000 | | | | 2,656,800 | |
| | | | | | | | | |
Industrial Support Services — 0.4% | | | | | | | | |
MSC Industrial Direct Company, Inc. - Class A (a) | | | 14,000 | | | | 1,417,640 | |
| | | | | | | | | |
Machinery — 1.5% | | | | | | | | |
AGCO Corporation (a) | | | 20,000 | | | | 2,428,200 | |
Symbotic, Inc. (a)(b) | | | 60,000 | | | | 3,079,800 | |
| | | | | | | | 5,508,000 | |
Transportation & Logistics — 2.3% | | | | | | | | |
C.H. Robinson Worldwide, Inc. (a) | | | 20,000 | | | | 1,727,800 | |
FedEx Corporation (a) | | | 15,000 | | | | 3,794,550 | |
Heartland Express, Inc. (a) | | | 40,000 | | | | 570,400 | |
Southwest Airlines Company (a) | | | 30,000 | | | | 866,400 | |
United Parcel Service, Inc. - Class B (a) | | | 10,000 | | | | 1,572,300 | |
| | | | | | | | 8,531,450 | |
Transportation Equipment — 0.3% | | | | | | | | |
Allison Transmission Holdings, Inc. (a) | | | 20,000 | | | | 1,163,000 | |
| | | | | | | | | |
Materials — 8.0% | | | | | | | | |
Chemicals — 2.2% | | | | | | | | |
AdvanSix, Inc. (a) | | | 50,000 | | | | 1,498,000 | |
Ingevity Corporation (a)(b) | | | 30,000 | | | | 1,416,600 | |
LyondellBasell Industries N.V. - Class A (a) | | | 20,000 | | | | 1,901,600 | |
Mosaic Company (The) (a) | | | 100,000 | | | | 3,573,000 | |
| | | | | | | | 8,389,200 | |
Containers & Packaging — 0.6% | | | | | | | | |
International Paper Company (a) | | | 20,000 | | | | 723,000 | |
O-I Glass, Inc. (a)(b) | | | 100,000 | | | | 1,638,000 | |
| | | | | | | | 2,361,000 | |
Hussman Strategic Growth Fund
Schedule of Investments (continued) |
December 31, 2023 (Unaudited) |
COMMON STOCKS — 102.3% (continued) | | Shares | | | Value | |
Materials — 8.0% (continued) |
Metals & Mining — 4.6% | | | | | | | | |
Agnico Eagle Mines Ltd. (a) | | | 80,000 | | | $ | 4,388,000 | |
Anglogold Ashanti plc (a) | | | 70,000 | | | | 1,308,300 | |
Barrick Gold Corporation (a) | | | 260,000 | | | | 4,703,400 | |
Encore Wire Corporation (a) | | | 8,000 | | | | 1,708,800 | |
Kinross Gold Corporation (a) | | | 40,000 | | | | 242,000 | |
Newmont Corporation (a) | | | 80,000 | | | | 3,311,200 | |
Royal Gold, Inc. (a) | | | 12,000 | | | | 1,451,520 | |
| | | | | | | | 17,113,220 | |
Steel — 0.6% | | | | | | | | |
Nucor Corporation (a) | | | 12,000 | | | | 2,088,480 | |
| | | | | | | | | |
Technology — 21.9% | | | | | | | | |
Semiconductors — 6.9% | | | | | | | | |
ACM Research, Inc. - Class A (a)(b) | | | 150,000 | | | | 2,931,000 | |
Allegro MicroSystems, Inc. (a)(b) | | | 60,000 | | | | 1,816,200 | |
Applied Materials, Inc. (a) | | | 15,000 | | | | 2,431,050 | |
Axcelis Technologies, Inc. (a)(b) | | | 10,000 | | | | 1,296,900 | |
Broadcom, Inc. (a) | | | 200 | | | | 223,250 | |
Cirrus Logic, Inc. (a)(b) | | | 24,000 | | | | 1,996,560 | |
Diodes, Inc. (a)(b) | | | 20,000 | | | | 1,610,400 | |
Intel Corporation (a) | | | 20,000 | | | | 1,005,000 | |
NVE Corporation (a) | | | 20,000 | | | | 1,568,600 | |
NVIDIA Corporation (a) | | | 2,000 | | | | 990,440 | |
Photronics, Inc. (a)(b) | | | 20,000 | | | | 627,400 | |
QUALCOMM, Inc. (a) | | | 20,000 | | | | 2,892,600 | |
Skyworks Solutions, Inc. (a) | | | 30,000 | | | | 3,372,600 | |
Universal Display Corporation (a) | | | 4,000 | | | | 765,040 | |
Vishay Intertechnology, Inc. (a) | | | 100,000 | | | | 2,397,000 | |
| | | | | | | | 25,924,040 | |
Software — 3.7% | | | | | | | | |
Akamai Technologies, Inc. (b) | | | 4,000 | | | | 473,400 | |
Bandwidth, Inc. - Class A (a)(b) | | | 140,000 | | | | 2,025,800 | |
C3.ai, Inc. - Class A (a)(b) | | | 30,000 | | | | 861,300 | |
Dynatrace, Inc. (a)(b) | | | 10,000 | | | | 546,900 | |
Fastly, Inc. - Class A (a)(b) | | | 160,000 | | | | 2,848,000 | |
Fortinet, Inc. (b) | | | 20,000 | | | | 1,170,600 | |
Gen Digital, Inc. (a) | | | 40,000 | | | | 912,800 | |
Hussman Strategic Growth Fund
Schedule of Investments (continued) |
December 31, 2023 (Unaudited) |
COMMON STOCKS — 102.3% (continued) | | Shares | | | Value | |
Technology — 21.9% (continued) |
Software — 3.7% (continued) | | | | | | | | |
Immersion Corporation (a) | | | 80,000 | | | $ | 564,800 | |
IonQ, Inc. (a)(b) | | | 150,000 | | | | 1,858,500 | |
Microsoft Corporation (a) | | | 400 | | | | 150,416 | |
Nutanix, Inc. - Class A (a)(b) | | | 20,000 | | | | 953,800 | |
Palantir Technologies, Inc. - Class A (a)(b) | | | 20,000 | | | | 343,400 | |
Salesforce, Inc. (a)(b) | | | 1,000 | | | | 263,140 | |
Samsara, Inc. - Class A (a)(b) | | | 10,000 | | | | 333,800 | |
Schrodinger, Inc. (a)(b) | | | 20,000 | | | | 716,000 | |
| | | | | | | | 14,022,656 | |
Technology Hardware — 8.0% |
Apple, Inc. (a) | | | 600 | | | | 115,518 | |
Arrow Electronics, Inc. (a)(b) | | | 24,000 | | | | 2,934,000 | |
Avnet, Inc. (a) | | | 40,000 | | | | 2,016,000 | |
Ciena Corporation (a)(b) | | | 20,000 | | | | 900,200 | |
Cisco Systems, Inc. (a) | | | 80,000 | | | | 4,041,600 | |
Clearfield, Inc. (a)(b) | | | 40,000 | | | | 1,163,200 | |
InterDigital, Inc. (a) | | | 26,000 | | | | 2,822,040 | |
Juniper Networks, Inc. (a) | | | 100,000 | | | | 2,948,000 | |
NetApp, Inc. (a) | | | 24,000 | | | | 2,115,840 | |
Super Micro Computer, Inc. (a)(b) | | | 24,000 | | | | 6,822,240 | |
Ubiquiti, Inc. (a) | | | 30,000 | | | | 4,186,800 | |
| | | | | | | | 30,065,438 | |
Technology Services — 3.3% | | | | | | | | |
Block, Inc. - Class A (a)(b) | | | 8,000 | | | | 618,800 | |
Cognizant Technology Solutions Corporation - Class A (a) | | | 60,000 | | | | 4,531,800 | |
FleetCor Technologies, Inc. (a)(b) | | | 10,000 | | | | 2,826,100 | |
Infosys Ltd. - ADR (a) | | | 120,000 | | | | 2,205,600 | |
Maximus, Inc. (a) | | | 8,000 | | | | 670,880 | |
PayPal Holdings, Inc. (a)(b) | | | 30,000 | | | | 1,842,300 | |
| | | | | | | | 12,695,480 | |
Utilities — 0.9% | | | | | | | | |
Electric Utilities — 0.9% | | | | | | | | |
Fluence Energy, Inc. (b) | | | 60,000 | | | | 1,431,000 | |
NRG Energy, Inc. (a) | | | 40,000 | | | | 2,068,000 | |
| | | | | | | | 3,499,000 | |
| | | | | | | | | |
Total Common Stocks (Cost $373,198,878) | | | | | | $ | 385,643,792 | |
Hussman Strategic Growth Fund
Schedule of Investments (continued) |
December 31, 2023 (Unaudited) |
WARRANTS — 0.0%(c) | | Shares | | | Value | |
Energy — 0.0% (c) | | | | | | | | |
Oil & Gas Services & Equipment — 0.0% (c) | | | | | | | | |
Nabors Industries Ltd., expires 06/11/2026 (Cost $0) | | | 8,000 | | | $ | 84,000 | |
EXCHANGE-TRADED PUT OPTION CONTRACTS — 2.0% | | Contracts | | | Notional
Amount | | | Value | |
Russell 2000® Index Option, 02/16/2024 at $2,050 | | | 740 | | | $ | 150,003,180 | | | $ | 4,731,560 | |
S&P 500® Index Option, 02/16/2024 at $4,750 | | | 488 | | | | 232,767,704 | | | | 2,918,240 | |
Total Put Option Contracts (Cost $7,206,328) | | | | | | $ | 382,770,884 | | | $ | 7,649,800 | |
| | | | | | | | | | | | | |
Total Investments at Value — 104.3% (Cost $380,405,206) | | | | | | | | | | $ | 393,377,592 | |
MONEY MARKET FUNDS — 44.0% | | Shares | | | Value | |
Invesco Treasury Portfolio - Institutional Class, 5.26% (d) (Cost $165,973,350) | | | 165,973,350 | | | $ | 165,973,350 | |
| | | | | | | | | |
Total Investments and Money Market Funds at Value — 148.3% (Cost $546,378,556) | | | | | | $ | 559,350,942 | |
| | | | | | | | | |
Written Call Option Contracts — (47.2%) | | | | | | | (177,915,980 | ) |
| | | | | | | | | |
Liabilities in Excess of Other Assets — (1.1%) | | | | | | | (4,226,906 | ) |
| | | | | | | | | |
Net Assets — 100.0% | | | | | | $ | 377,208,056 | |
ADR - American Depositary Receipt. |
(a) | All or portion of the security is used as collateral to cover written call options. The total value of the securities held as collateral as of December 31, 2023 was $85,643,792. |
(b) | Non-income producing security. |
(c) | Percentage rounds to less than 0.1%. |
(d) | The rate shown is the 7-day effective yield as of December 31, 2023. |
See accompanying notes to financial statements. |
Hussman Strategic Growth Fund
Schedule of Open Written Option Contracts |
December 31, 2023 (Unaudited) |
EXCHANGE-TRADED WRITTEN CALL OPTION CONTRACTS | | Contracts | | | Notional
Amount | | | Strike
Price | | | Expiration
Date | | | Value of
Options | |
Call Option Contracts |
Russell 2000® Index Option | | | 740 | | | $ | 150,003,180 | | | $ | 1,200 | | | | 03/15/2024 | | | $ | 61,725,620 | |
S&P 500® Index Option | | | 488 | | | | 232,767,704 | | | | 2,400 | | | | 03/15/2024 | | | | 116,190,360 | |
Total Written Call Option Contracts (Premiums received $157,638,734) | | | | | | $ | 382,770,884 | | | | | | | | | | | $ | 177,915,980 | |
See accompanying notes to financial statements. |
Hussman Strategic Allocation Fund
Schedule of Investments |
December 31, 2023 (Unaudited) |
COMMON STOCKS — 67.7% | | Shares | | | Value | |
Communications — 6.7% | | | | | | | | |
Advertising & Marketing — 0.2% | | | | | | | | |
Omnicom Group, Inc. (a) | | | 500 | | | $ | 43,255 | |
| | | | | | | | | |
Cable & Satellite — 0.8% | | | | | | | | |
Comcast Corporation - Class A (a) | | | 4,000 | | | | 175,400 | |
Sirius XM Holdings, Inc. (a) | | | 10,000 | | | | 54,700 | |
| | | | | | | | 230,100 | |
Entertainment Content — 0.6% | | | | | | | | |
AMC Networks, Inc. - Class A (a)(b) | | | 2,500 | | | | 46,975 | |
AppLovin Corporation - Class A (a)(b) | | | 3,000 | | | | 119,550 | |
| | | | | | | | 166,525 | |
Internet Media & Services — 3.8% | | | | | | | | |
Alphabet, Inc. - Class C (a)(b) | | | 3,700 | | | | 521,441 | |
Booking Holdings, Inc. (a)(b) | | | 20 | | | | 70,944 | |
Meta Platforms, Inc. - Class A (a)(b) | | | 750 | | | | 265,470 | |
Netflix, Inc. (a)(b) | | | 50 | | | | 24,344 | |
Shutterstock, Inc. (a) | | | 4,000 | | | | 193,120 | |
| | | | | | | | 1,075,319 | |
Publishing & Broadcasting — 0.4% | | | | | | | | |
Gray Television, Inc. (a) | | | 5,000 | | | | 44,800 | |
Nexstar Media Group, Inc. (a) | | | 500 | | | | 78,375 | |
| | | | | | | | 123,175 | |
Telecommunications — 0.9% | | | | | | | | |
Verizon Communications, Inc. (a) | | | 7,000 | | | | 263,900 | |
| | | | | | | | | |
Consumer Discretionary — 10.1% | | | | | | | | |
Apparel & Textile Products — 1.4% | | | | | | | | |
Carter’s, Inc. (a) | | | 3,000 | | | | 224,670 | |
Crocs, Inc. (a)(b) | | | 750 | | | | 70,058 | |
Tapestry, Inc. (a) | | | 2,500 | | | | 92,025 | |
| | | | | | | | 386,753 | |
Automotive — 0.6% | | | | | | | | |
BorgWarner, Inc. (a) | | | 3,000 | | | | 107,550 | |
Harley-Davidson, Inc. (a) | | | 2,000 | | | | 73,680 | |
| | | | | | | | 181,230 | |
Consumer Services — 0.2% | | | | | | | | |
Perdoceo Education Corporation (a) | | | 3,000 | | | | 52,680 | |
Hussman Strategic Allocation Fund
Schedule of Investments (continued) |
December 31, 2023 (Unaudited) |
COMMON STOCKS — 67.7% (continued) | | Shares | | | Value | |
Consumer Discretionary — 10.1% (continued) | | | | | | | | |
E-Commerce Discretionary — 1.5% | | | | | | | | |
Amazon.com, Inc. (a)(b) | | | 2,000 | | | $ | 303,880 | |
Etsy, Inc. (a)(b) | | | 1,500 | | | | 121,575 | |
| | | | | | | | 425,455 | |
Home & Office Products — 0.3% | | | | | | | | |
Tempur Sealy International, Inc. (a) | | | 1,500 | | | | 76,455 | |
| | | | | | | | | |
Home Construction — 0.4% | | | | | | | | |
Century Communities, Inc. (a) | | | 1,000 | | | | 91,140 | |
Forestar Group, Inc. (a)(b) | | | 1,000 | | | | 33,070 | |
| | | | | | | | 124,210 | |
Leisure Facilities & Services — 1.4% | | | | | | | | |
Brinker International, Inc. (a)(b) | | | 3,000 | | | | 129,540 | |
Starbucks Corporation (a) | | | 1,500 | | | | 144,015 | |
Sweetgreen, Inc. - Class A (a)(b) | | | 10,000 | | | | 113,000 | |
| | | | | | | | 386,555 | |
Leisure Products — 0.5% | | | | | | | | |
Winnebago Industries, Inc. (a) | | | 2,000 | | | | 145,760 | |
| | | | | | | | | |
Retail - Discretionary — 3.6% | | | | | | | | |
AutoNation, Inc. (a)(b) | | | 200 | | | | 30,036 | |
Big 5 Sporting Goods Corporation (a) | | | 4,000 | | | | 25,360 | |
Buckle, Inc. (The) | | | 1,500 | | | | 71,280 | |
Dick’s Sporting Goods, Inc. (a) | | | 1,000 | | | | 146,950 | |
Hibbett, Inc. (a) | | | 2,000 | | | | 144,040 | |
Kohl’s Corporation (a) | | | 2,000 | | | | 57,360 | |
Macy’s, Inc. (a) | | | 5,000 | | | | 100,600 | |
Sally Beauty Holdings, Inc. (a)(b) | | | 10,000 | | | | 132,800 | |
Ulta Beauty, Inc. (a)(b) | | | 450 | | | | 220,495 | |
Urban Outfitters, Inc. (a)(b) | | | 3,000 | | | | 107,070 | |
| | | | | | | | 1,035,991 | |
Wholesale - Discretionary — 0.2% | | | | | | | | |
LKQ Corporation (a) | | | 1,000 | | | | 47,790 | |
ScanSource, Inc. (a)(b) | | | 500 | | | | 19,805 | |
| | | | | | | | 67,595 | |
Hussman Strategic Allocation Fund
Schedule of Investments (continued) |
December 31, 2023 (Unaudited) |
COMMON STOCKS — 67.7% (continued) | | Shares | | | Value | |
Consumer Staples — 9.5% |
Beverages — 1.3% | | | | | | | | |
Coca-Cola Company (The) (a) | | | 2,000 | | | $ | 117,860 | |
PepsiCo, Inc. (a) | | | 1,500 | | | | 254,760 | |
| | | | | | | | 372,620 | |
Food — 4.6% | | | | | | | | |
Campbell Soup Company (a) | | | 5,000 | | | | 216,150 | |
Flowers Foods, Inc. (a) | | | 2,000 | | | | 45,020 | |
Fresh Del Monte Produce, Inc. (a) | | | 1,000 | | | | 26,250 | |
General Mills, Inc. (a) | | | 3,000 | | | | 195,420 | |
Hershey Company (The) (a) | | | 700 | | | | 130,508 | |
Ingredion, Inc. (a) | | | 1,000 | | | | 108,530 | |
J.M. Smucker Company (The) (a) | | | 1,000 | | | | 126,380 | |
Kellanova (a) | | | 3,000 | | | | 167,730 | |
Kraft Heinz Company (The) (a) | | | 2,000 | | | | 73,960 | |
Lamb Weston Holdings, Inc. (a) | | | 2,000 | | | | 216,180 | |
| | | | | | | | 1,306,128 | |
Household Products — 0.9% | | | | | | | | |
Colgate-Palmolive Company (a) | | | 1,000 | | | | 79,710 | |
Kimberly-Clark Corporation (a) | | | 1,500 | | | | 182,265 | |
| | | | | | | | 261,975 | |
Retail - Consumer Staples — 2.1% | | | | | | | | |
BJ’s Wholesale Club Holdings, Inc. (a)(b) | | | 1,500 | | | | 99,990 | |
Kroger Company (The) (a) | | | 3,000 | | | | 137,130 | |
Natural Grocers by Vitamin Cottage, Inc. (a) | | | 3,000 | | | | 48,000 | |
Sprouts Farmers Market, Inc. (b) | | | 2,000 | | | | 96,220 | |
Target Corporation (a) | | | 1,000 | | | | 142,420 | |
Walgreens Boots Alliance, Inc. (a) | | | 3,000 | | | | 78,330 | |
| | | | | | | | 602,090 | |
Wholesale - Consumer Staples — 0.6% | | | | | | | | |
Andersons, Inc. (The) (a) | | | 1,000 | | | | 57,540 | |
United Natural Foods, Inc. (a)(b) | | | 6,000 | | | | 97,380 | |
| | | | | | | | 154,920 | |
Energy — 4.8% | | | | | | | | |
Oil & Gas Producers — 2.6% | | | | | | | | |
APA Corporation (a) | | | 2,000 | | | | 71,760 | |
California Resources Corporation (a) | | | 2,000 | | | | 109,360 | |
Civitas Resources, Inc. (a) | | | 1,000 | | | | 68,380 | |
Coterra Energy, Inc. (a) | | | 2,000 | | | | 51,040 | |
Hussman Strategic Allocation Fund
Schedule of Investments (continued) |
December 31, 2023 (Unaudited) |
COMMON STOCKS — 67.7% (continued) | | Shares | | | Value | |
Energy — 4.8% (continued) |
Oil & Gas Producers — 2.6% (continued) |
Diamondback Energy, Inc. (a) | | | 500 | | | $ | 77,540 | |
Exxon Mobil Corporation (a) | | | 1,000 | | | | 99,980 | |
Marathon Petroleum Corp. (a) | | | 800 | | | | 118,688 | |
Range Resources Corporation (a) | | | 2,000 | | | | 60,880 | |
SM Energy Company (a) | | | 1,000 | | | | 38,720 | |
Vital Energy, Inc. (a)(b) | | | 1,000 | | | | 45,490 | |
| | | | | | | | 741,838 | |
Renewable Energy — 2.2% | | | | | | | | |
Array Technologies, Inc. (a)(b) | | | 10,000 | | | | 168,000 | |
Canadian Solar, Inc. (a)(b) | | | 12,500 | | | | 327,875 | |
SolarEdge Technologies, Inc. (a)(b) | | | 1,500 | | | | 140,400 | |
| | | | | | | | 636,275 | |
Financials — 1.3% | | | | | | | | |
Asset Management — 0.1% |
Federated Hermes, Inc. (a) | | | 1,000 | | | | 33,860 | |
| | | | | | | | | |
Banking — 0.6% | | | | | | | | |
Associated Banc-Corp (a) | | | 1,000 | | | | 21,390 | |
Customers Bancorp, Inc. (a)(b) | | | 2,000 | | | | 115,240 | |
New York Community Bancorp, Inc. (a) | | | 4,000 | | | | 40,920 | |
| | | | | | | | 177,550 | |
Insurance — 0.6% | | | | | | | | |
Old Republic International Corporation (a) | | | 2,000 | | | | 58,800 | |
Unum Group (a) | | | 2,400 | | | | 108,528 | |
| | | | | | | | 167,328 | |
Health Care — 10.2% | | | | | | | | |
Biotech & Pharma — 6.7% | | | | | | | | |
ACADIA Pharmaceuticals, Inc. (a)(b) | | | 2,000 | | | | 62,620 | |
Amgen, Inc. (a) | | | 300 | | | | 86,406 | |
Biogen, Inc. (a)(b) | | | 300 | | | | 77,631 | |
Bristol-Myers Squibb Company (a) | | | 1,500 | | | | 76,965 | |
Catalyst Pharmaceuticals, Inc. (a)(b) | | | 7,500 | | | | 126,075 | |
Corcept Therapeutics, Inc. (b) | | | 2,500 | | | | 81,200 | |
Dynavax Technologies Corporation (a)(b) | | | 4,000 | | | | 55,920 | |
Exelixis, Inc. (a)(b) | | | 7,000 | | | | 167,930 | |
Gilead Sciences, Inc. (a) | | | 2,000 | | | | 162,020 | |
Halozyme Therapeutics, Inc. (a)(b) | | | 1,500 | | | | 55,440 | |
Hussman Strategic Allocation Fund
Schedule of Investments (continued) |
December 31, 2023 (Unaudited) |
COMMON STOCKS — 67.7% (continued) | | Shares | | | Value | |
Health Care — 10.2% (continued) |
Biotech & Pharma — 6.7% (continued) | | | | | | | | |
Harmony Biosciences Holdings, Inc. (a)(b) | | | 1,000 | | | $ | 32,300 | |
Incyte Corporation (a)(b) | | | 1,500 | | | | 94,185 | |
Innoviva, Inc. (b) | | | 5,000 | | | | 80,200 | |
Ironwood Pharmaceuticals, Inc. (a)(b) | | | 3,000 | | | | 34,320 | |
Johnson & Johnson (a) | | | 500 | | | | 78,370 | |
Neurocrine Biosciences, Inc. (a)(b) | | | 500 | | | | 65,880 | |
Pacira BioSciences, Inc. (a)(b) | | | 1,000 | | | | 33,740 | |
Pfizer, Inc. (a) | | | 6,000 | | | | 172,740 | |
Regeneron Pharmaceuticals, Inc. (a)(b) | | | 200 | | | | 175,658 | |
Supernus Pharmaceuticals, Inc. (a)(b) | | | 3,600 | | | | 104,184 | |
Vertex Pharmaceuticals, Inc. (b) | | | 150 | | | | 61,033 | |
Voyager Therapeutics, Inc. (a)(b) | | | 2,500 | | | | 21,100 | |
| | | | | | | | 1,905,917 | |
Health Care Facilities & Services — 1.7% | | | | | | | | |
CVS Health Corporation (a) | | | 1,000 | | | | 78,960 | |
HCA Healthcare, Inc. (a) | | | 500 | | | | 135,340 | |
NeoGenomics, Inc. (a)(b) | | | 1,250 | | | | 20,225 | |
Patterson Companies, Inc. (a) | | | 5,000 | | | | 142,250 | |
Universal Health Services, Inc. - Class B (a) | | | 700 | | | | 106,708 | |
| | | | | | | | 483,483 | |
Medical Equipment & Devices — 1.8% | | | | | | | | |
Align Technology, Inc. (a)(b) | | | 700 | | | | 191,800 | |
Exact Sciences Corporation (a)(b) | | | 1,500 | | | | 110,970 | |
Illumina, Inc. (a)(b) | | | 500 | | | | 69,620 | |
Penumbra, Inc. (a)(b) | | | 100 | | | | 25,154 | |
Shockwave Medical, Inc. (a)(b) | | | 500 | | | | 95,280 | |
Zynex, Inc. (a)(b) | | | 3,000 | | | | 32,670 | |
| | | | | | | | 525,494 | |
Industrials — 4.7% | | | | | | | | |
Commercial Support Services — 0.2% | | | | | | | | |
H&R Block, Inc. (a) | | | 1,000 | | | | 48,370 | |
| | | | | | | | | |
Electrical Equipment — 1.1% | | | | | | | | |
Atkore, Inc. (a)(b) | | | 500 | | | | 80,000 | |
Bloom Energy Corporation - Class A (a)(b) | | | 3,000 | | | | 44,400 | |
Sensata Technologies Holding plc (a) | | | 3,500 | | | | 131,495 | |
Hussman Strategic Allocation Fund
Schedule of Investments (continued) |
December 31, 2023 (Unaudited) |
COMMON STOCKS — 67.7% (continued) | | Shares | | | Value | |
Industrials — 4.7% (continued) |
Electrical Equipment — 1.1% (continued) |
Vontier Corporation | | | 2,000 | | | $ | 69,100 | |
| | | | | | | | 324,995 | |
Engineering & Construction — 0.5% | | | | | | | | |
Primoris Services Corporation (a) | | | 4,000 | | | | 132,840 | |
| | | | | | | | | |
Industrial Support Services — 0.2% | | | | | | | | |
MSC Industrial Direct Company, Inc. - Class A (a) | | | 700 | | | | 70,882 | |
| | | | | | | | | |
Machinery — 1.0% | | | | | | | | |
AGCO Corporation (a) | | | 1,000 | | | | 121,410 | |
Symbotic, Inc. (a)(b) | | | 3,000 | | | | 153,990 | |
| | | | | | | | 275,400 | |
Transportation & Logistics — 1.5% | | | | | | | | |
C.H. Robinson Worldwide, Inc. (a) | | | 1,000 | | | | 86,390 | |
FedEx Corporation (a) | | | 750 | | | | 189,728 | |
Heartland Express, Inc. (a) | | | 2,000 | | | | 28,520 | |
Southwest Airlines Company (a) | | | 1,500 | | | | 43,320 | |
United Parcel Service, Inc. - Class B (a) | | | 500 | | | | 78,615 | |
| | | | | | | | 426,573 | |
Transportation Equipment — 0.2% | | | | | | | | |
Allison Transmission Holdings, Inc. (a) | | | 1,000 | | | | 58,150 | |
| | | | | | | | | |
Materials — 5.3% | | | | | | | | |
Chemicals — 1.5% |
AdvanSix, Inc. (a) | | | 2,500 | | | | 74,900 | |
Ingevity Corporation (a)(b) | | | 1,500 | | | | 70,830 | |
LyondellBasell Industries N.V. - Class A (a) | | | 1,000 | | | | 95,080 | |
Mosaic Company (The) (a) | | | 5,000 | | | | 178,650 | |
| | | | | | | | 419,460 | |
Containers & Packaging — 0.4% | | | | | | | | |
International Paper Company (a) | | | 1,000 | | | | 36,150 | |
O-I Glass, Inc. (a)(b) | | | 5,000 | | | | 81,900 | |
| | | | | | | | 118,050 | |
Metals & Mining — 3.0% | | | | | | | | |
Agnico Eagle Mines Ltd. (a) | | | 4,000 | | | | 219,400 | |
Anglogold Ashanti plc (a) | | | 3,500 | | | | 65,415 | |
Hussman Strategic Allocation Fund
Schedule of Investments (continued) |
December 31, 2023 (Unaudited) |
COMMON STOCKS — 67.7% (continued) | | Shares | | | Value | |
Materials — 5.3% (continued) |
Metals & Mining — 3.0% (continued) |
Barrick Gold Corporation (a) | | | 13,000 | | | $ | 235,170 | |
Encore Wire Corporation (a) | | | 400 | | | | 85,440 | |
Kinross Gold Corporation | | | 2,000 | | | | 12,100 | |
Newmont Corporation (a) | | | 4,000 | | | | 165,560 | |
Royal Gold, Inc. (a) | | | 600 | | | | 72,576 | |
| | | | | | | | 855,661 | |
Steel — 0.4% | | | | | | | | |
Nucor Corporation (a) | | | 600 | | | | 104,424 | |
| | | | | | | | | |
Technology — 14.5% | | | | | | | | |
Semiconductors — 4.5% | | | | | | | | |
ACM Research, Inc. - Class A (a)(b) | | | 7,000 | | | | 136,780 | |
Allegro MicroSystems, Inc. (a)(b) | | | 3,000 | | | | 90,810 | |
Applied Materials, Inc. (a) | | | 750 | | | | 121,552 | |
Axcelis Technologies, Inc. (a)(b) | | | 500 | | | | 64,845 | |
Broadcom, Inc. (a) | | | 10 | | | | 11,163 | |
Cirrus Logic, Inc. (a)(b) | | | 1,200 | | | | 99,828 | |
Diodes, Inc. (a)(b) | | | 1,000 | | | | 80,520 | |
Intel Corporation (a) | | | 1,000 | | | | 50,250 | |
NVE Corporation (a) | | | 1,000 | | | | 78,430 | |
NVIDIA Corporation (a) | | | 100 | | | | 49,522 | |
Photronics, Inc. (a)(b) | | | 1,000 | | | | 31,370 | |
QUALCOMM, Inc. (a) | | | 1,000 | | | | 144,630 | |
Skyworks Solutions, Inc. (a) | | | 1,500 | | | | 168,630 | |
Universal Display Corporation (a) | | | 200 | | | | 38,252 | |
Vishay Intertechnology, Inc. (a) | | | 5,000 | | | | 119,850 | |
| | | | | | | | 1,286,432 | |
Software — 2.5% | | | | | | | | |
Akamai Technologies, Inc. (a)(b) | | | 200 | | | | 23,670 | |
Bandwidth, Inc. - Class A (a)(b) | | | 7,000 | | | | 101,290 | |
C3.ai, Inc. - Class A (a)(b) | | | 1,500 | | | | 43,065 | |
Dynatrace, Inc. (a)(b) | | | 500 | | | | 27,345 | |
Fastly, Inc. - Class A (a)(b) | | | 8,000 | | | | 142,400 | |
Fortinet, Inc. (b) | | | 1,000 | | | | 58,530 | |
Gen Digital, Inc. (a) | | | 2,000 | | | | 45,640 | |
Immersion Corporation (a) | | | 4,000 | | | | 28,240 | |
IonQ, Inc. (a)(b) | | | 7,500 | | | | 92,925 | |
Hussman Strategic Allocation Fund
Schedule of Investments (continued) |
December 31, 2023 (Unaudited) |
COMMON STOCKS — 67.7% (continued) | | Shares | | | Value | |
Technology — 14.5% (continued) |
Software — 2.5% (continued) |
Microsoft Corporation (a) | | | 20 | | | $ | 7,521 | |
Nutanix, Inc. - Class A (a)(b) | | | 1,000 | | | | 47,690 | |
Palantir Technologies, Inc. - Class A (a)(b) | | | 1,000 | | | | 17,170 | |
Salesforce, Inc. (a)(b) | | | 50 | | | | 13,157 | |
Samsara, Inc. - Class A (a)(b) | | | 500 | | | | 16,690 | |
Schrodinger, Inc. (a)(b) | | | 1,000 | | | | 35,800 | |
| | | | | | | | 701,133 | |
Technology Hardware — 5.3% | | | | | | | | |
Apple, Inc. (a) | | | 30 | | | | 5,776 | |
Arrow Electronics, Inc. (a)(b) | | | 1,200 | | | | 146,700 | |
Avnet, Inc. (a) | | | 2,000 | | | | 100,800 | |
Ciena Corporation (a)(b) | | | 1,000 | | | | 45,010 | |
Cisco Systems, Inc. (a) | | | 4,000 | | | | 202,080 | |
Clearfield, Inc. (a)(b) | | | 2,000 | | | | 58,160 | |
InterDigital, Inc. (a) | | | 1,300 | | | | 141,102 | |
Juniper Networks, Inc. (a) | | | 5,000 | | | | 147,400 | |
NetApp, Inc. (a) | | | 1,200 | | | | 105,792 | |
Super Micro Computer, Inc. (b) | | | 1,200 | | | | 341,112 | |
Ubiquiti, Inc. | | | 1,500 | | | | 209,340 | |
| | | | | | | | 1,503,272 | |
Technology Services — 2.2% | | | | | | | | |
Block, Inc. - Class A (a)(b) | | | 400 | | | | 30,940 | |
Cognizant Technology Solutions Corporation - Class A (a) | | | 3,000 | | | | 226,590 | |
FleetCor Technologies, Inc. (a)(b) | | | 500 | | | | 141,305 | |
Infosys Ltd. - ADR (a) | | | 6,000 | | | | 110,280 | |
Maximus, Inc. (a) | | | 400 | | | | 33,544 | |
PayPal Holdings, Inc. (a)(b) | | | 1,500 | | | | 92,115 | |
| | | | | | | | 634,774 | |
Utilities — 0.6% | | | | | | | | |
Electric Utilities — 0.6% | | | | | | | | |
Fluence Energy, Inc. (a)(b) | | | 3,000 | | | | 71,550 | |
NRG Energy, Inc. (a) | | | 2,000 | | | | 103,400 | |
| | | | | | | | 174,950 | |
| | | | | | | | | |
Total Common Stocks (Cost $18,850,299) | | | | | | $ | 19,289,802 | |
Hussman Strategic Allocation Fund
Schedule of Investments (continued) |
December 31, 2023 (Unaudited) |
U.S. TREASURY OBLIGATIONS — 21.5% | | Par Value | | | Value | |
U.S. Treasury Bills (c) — 10.4% | | | | | | | | |
5.343%, due 03/21/2024 | | $ | 3,000,000 | | | $ | 2,965,800 | |
| | | | | | | | | |
U.S. Treasury Inflation-Protected Notes — 9.7% | | | | | | | | |
0.500%, due 04/15/2024 | | | 609,955 | | | | 602,276 | |
0.125%, due 04/15/2026 | | | 1,173,210 | | | | 1,117,425 | |
0.125%, due 04/15/2027 | | | 544,845 | | | | 512,523 | |
0.125%, due 01/15/2031 | | | 590,965 | | | | 529,073 | |
| | | | | | | | 2,761,297 | |
U.S. Treasury Notes — 1.4% | | | | | | | | |
0.625%, due 08/15/2030 | | | 500,000 | | | | 406,270 | |
| | | | | | | | | |
Total U.S. Treasury Obligations (Cost $6,352,323) | | | | | | $ | 6,133,367 | |
WARRANTS — 0.0%(d) | | Shares | | | Value | |
Energy — 0.0% (d) | | | | | | | | |
Oil & Gas Services & Equipment — 0.0% (d) | | | | | | | | |
Nabors Industries Ltd., expires 06/11/2026 (Cost $0) | | | 240 | | | $ | 2,520 | |
EXCHANGE-TRADED PUT OPTION CONTRACTS — 0.1% | | Contracts | | | Notional
Amount | | | Value | |
Russell 2000® Index Option, 03/15/2024 at $1,600 | | | 33 | | | $ | 6,689,331 | | | $ | 14,388 | |
S&P 500® Index Option, 03/15/2024 at $3,600 | | | 23 | | | | 10,970,609 | | | | 7,751 | |
Total Put Option Contracts (Cost $51,227) | | | | | | $ | 17,659,940 | | | $ | 22,139 | |
| | | | | | | | | | | | | |
Total Investments at Value — 89.3% (Cost $25,253,849) | | | | | | | | | | $ | 25,447,828 | |
Hussman Strategic Allocation Fund
Schedule of Investments (continued) |
December 31, 2023 (Unaudited) |
MONEY MARKET FUNDS — 23.3% | | Shares | | | Value | |
Invesco Treasury Portfolio - Institutional Class, 5.26% (e) (Cost $6,655,841) | | | 6,655,841 | | | $ | 6,655,841 | |
| | | | | | | | | |
Total Investments and Money Market Funds at Value — 112.6% (Cost $31,909,690) | | | | | | $ | 32,103,669 | |
| | | | | | | | | |
Written Call Option Contracts — (14.8%) | | | | | | | (4,210,509 | ) |
| | | | | | | | | |
Other Assets in Excess of Liabilities — 2.2% | | | | | | | 621,220 | |
| | | | | | | | | |
Net Assets — 100.0% | | | | | | $ | 28,514,380 | |
ADR - American Depositary Receipt. |
(a) | All or portion of the security is used as collateral to cover written call options. The total value of the securities held as collateral as of December 31, 2023 was $18,692,903. |
(b) | Non-income producing security. |
(c) | Rate shown is the annualized yield at time of purchase, not a coupon rate. |
(d) | Percentage rounds to less than 0.1%. |
(e) | The rate shown is the 7-day effective yield as of December 31, 2023. |
See accompanying notes to financial statements. |
Hussman Strategic Allocation Fund
Schedule of Open Written Option Contracts |
December 31, 2023 (Unaudited) |
EXCHANGE-TRADED WRITTEN CALL OPTION CONTRACTS | | Contracts | | | Notional
Amount | | | Strike
Price | | | Expiration
Date | | | Value of
Options | |
Call Option Contracts |
Russell 2000® Index Option | | | 33 | | | $ | 6,689,331 | | | $ | 1,600 | | | | 03/15/2024 | | | $ | 1,458,237 | |
S&P 500® Index Option | | | 23 | | | | 10,970,609 | | | | 3,600 | | | | 03/15/2024 | | | | 2,752,272 | |
Total Written Call Option Contracts (Premiums received $3,349,692) | | | | | | $ | 17,659,940 | | | | | | | | | | | $ | 4,210,509 | |
See accompanying notes to financial statements. |
Hussman Strategic Total Return Fund
Schedule of Investments |
December 31, 2023 (Unaudited) |
COMMON STOCKS — 15.8% | | Shares | | | Value | |
Energy — 1.4% | | | | | | | | |
Oil & Gas Producers — 1.4% | | | | | | | | |
California Resources Corporation | | | 15,000 | | | $ | 820,200 | |
Coterra Energy, Inc. | | | 20,000 | | | | 510,400 | |
DT Midstream, Inc. | | | 500 | | | | 27,400 | |
Range Resources Corporation | | | 15,000 | | | | 456,600 | |
Vital Energy, Inc. (a) | | | 20,000 | | | | 909,800 | |
| | | | | | | | 2,724,400 | |
Materials — 13.4% | | | | | | | | |
Metals & Mining — 13.4% | | | | | | | | |
Agnico Eagle Mines Ltd. | | | 120,000 | | | | 6,582,000 | |
Anglogold Ashanti plc | | | 105,000 | | | | 1,962,450 | |
B2Gold Corporation | | | 1,000,000 | | | | 3,160,000 | |
Barrick Gold Corporation | | | 390,000 | | | | 7,055,100 | |
Freeport-McMoRan, Inc. | | | 18,000 | | | | 766,260 | |
Kinross Gold Corporation | | | 60,000 | | | | 363,000 | |
Newmont Corporation | | | 120,000 | | | | 4,966,800 | |
Royal Gold, Inc. | | | 18,000 | | | | 2,177,280 | |
| | | | | | | | 27,032,890 | |
Utilities — 1.0% | | | | | | | | |
Electric Utilities — 1.0% | | | | | | | | |
AES Corporation (The) | | | 1,000 | | | | 19,250 | |
ALLETE, Inc. | | | 1,000 | | | | 61,160 | |
Ameren Corporation | | | 100 | | | | 7,234 | |
American Electric Power Company, Inc. | | | 100 | | | | 8,122 | |
Avangrid, Inc. | | | 1,000 | | | | 32,410 | |
Avista Corporation | | | 1,000 | | | | 35,740 | |
Black Hills Corporation | | | 500 | | | | 26,975 | |
Consolidated Edison, Inc. | | | 1,000 | | | | 90,970 | |
Dominion Energy, Inc. | | | 500 | | | | 23,500 | |
DTE Energy Company | | | 100 | | | | 11,026 | |
Duke Energy Corporation | | | 500 | | | | 48,520 | |
Edison International | | | 500 | | | | 35,745 | |
Entergy Corporation | | | 500 | | | | 50,595 | |
Exelon Corporation | | | 1,000 | | | | 35,900 | |
FirstEnergy Corporation | | | 1,000 | | | | 36,660 | |
Hawaiian Electric Industries, Inc. | | | 1,000 | | | | 14,190 | |
NorthWestern Energy Group, Inc. | | | 1,000 | | | | 50,890 | |
NRG Energy, Inc. | | | 20,000 | | | | 1,034,000 | |
Hussman Strategic Total Return Fund
Schedule of Investments (continued) |
December 31, 2023 (Unaudited) |
COMMON STOCKS — 15.8% (continued) | | Shares | | | Value | |
Utilities — 1.0% (continued) | | | | | | | | |
Electric Utilities — 1.0% (continued) | | | | | | | | |
Otter Tail Corporation | | | 1,000 | | | $ | 84,970 | |
Pinnacle West Capital Corporation | | | 1,000 | | | | 71,840 | |
Portland General Electric Company | | | 1,000 | | | | 43,340 | |
PPL Corporation | | | 1,000 | | | | 27,100 | |
Public Service Enterprise Group, Inc. | | | 500 | | | | 30,575 | |
Southern Company (The) | | | 500 | | | | 35,060 | |
| | | | | | | | 1,915,772 | |
Gas & Water Utilities — 0.0% (b) | | | | | | | | |
Global Water Resources, Inc. | | | 1,000 | | | | 13,080 | |
| | | | | | | | | |
Total Common Stocks (Cost $29,318,361) | | | | | | $ | 31,686,142 | |
EXCHANGE-TRADED FUNDS — 1.7% | | Shares | | | Value | |
Invesco CurrencyShares British Pound Sterling Trust | | | 10,000 | | | $ | 1,227,900 | |
Invesco CurrencyShares Euro Currency Trust | | | 12,500 | | | | 1,275,500 | |
Invesco CurrencyShares Japanese Yen Trust (a) | | | 12,500 | | | | 822,625 | |
Total Exchange-Traded Funds (Cost $3,329,990) | | | | | | $ | 3,326,025 | |
U.S. TREASURY OBLIGATIONS — 80.7% | | Par Value | | | Value | |
U.S. Treasury Bills (c) — 14.7% | | | | | | | | |
5.364%, due 03/14/2024 | | $ | 20,000,000 | | | $ | 19,791,800 | |
5.343%, due 03/21/2024 | | | 10,000,000 | | | | 9,885,999 | |
| | | | | | | | 29,677,799 | |
U.S. Treasury Inflation-Protected Notes — 39.8% | | | | | | | | |
0.500%, due 04/15/2024 | | | 12,199,100 | | | | 12,045,519 | |
0.125%, due 04/15/2026 | | | 11,732,100 | | | | 11,174,253 | |
0.125%, due 04/15/2027 | | | 21,793,800 | | | | 20,500,914 | |
2.500%, due 01/15/2029 | | | 14,330,500 | | | | 14,841,462 | |
0.125%, due 01/15/2030 | | | 11,958,600 | | | | 10,865,681 | |
0.125%, due 01/15/2031 | | | 11,819,300 | | | | 10,581,467 | |
| | | | | | | | 80,009,296 | |
Hussman Strategic Total Return Fund
Schedule of Investments (continued) |
December 31, 2023 (Unaudited) |
U.S. TREASURY OBLIGATIONS — 80.7% (continued) | | Par Value | | | Value | |
U.S. Treasury Notes — 26.2% | | | | | | | | |
2.000%, due 05/31/2024 | | $ | 10,000,000 | | | $ | 9,866,995 | |
1.375%, due 01/31/2025 | | | 15,000,000 | | | | 14,475,586 | |
2.125%, due 05/31/2026 | | | 10,000,000 | | | | 9,552,344 | |
1.500%, due 08/15/2026 | | | 10,000,000 | | | | 9,364,844 | |
2.250%, due 11/15/2027 | | | 10,000,000 | | | | 9,411,523 | |
| | | | | | | | 52,671,292 | |
| | | | | | | | | |
Total U.S. Treasury Obligations (Cost $167,607,971) | | | | | | $ | 162,358,387 | |
WARRANTS — 0.0% (b) | | Shares | | | Value | |
Energy — 0.0% (b) | | | | | | | | |
Oil & Gas Services & Equipment — 0.0% (b) | | | | | | | | |
Nabors Industries Ltd., expires 06/11/2026 (Cost $0) | | | 8,000 | | | $ | 84,000 | |
| | | | | | | | | |
Total Investments at Value — 98.2% (Cost $200,256,322) | | | | | | $ | 197,454,554 | |
MONEY MARKET FUNDS — 2.1% | | Shares | | | Value | |
Invesco Treasury Portfolio - Institutional Class, 5.26% (d) (Cost $4,261,944) | | | 4,261,944 | | | $ | 4,261,944 | |
| | | | | | | | | |
Total Investments and Money Market Funds at Value — 100.3% (Cost $204,518,266) | | | | | | $ | 201,716,498 | |
| | | | | | | | | |
Liabilities in Excess of Other Assets — (0.3%) | | | | | | | (511,813 | ) |
| | | | | | | | | |
Net Assets — 100.0% | | | | | | $ | 201,204,685 | |
(a) | Non-income producing security. |
(b) | Percentage rounds to less than 0.1%. |
(c) | Rate shown is the annualized yield at time of purchase, not a coupon rate. |
(d) | The rate shown is the 7-day effective yield as of December 31, 2023. |
See accompanying notes to financial statements. |
Hussman Investment Trust
Statements of Assets and Liabilities |
December 31, 2023 (Unaudited) |
| | | Hussman
Strategic
Growth Fund | | | Hussman
Strategic
Allocation Fund | | | Hussman
Strategic Total
Return Fund | |
ASSETS | | | | | | | | | | | | |
Investments in securities: | | | | | | | | | | | | |
At cost | | $ | 380,405,206 | | | $ | 25,253,849 | | | $ | 200,256,322 | |
At value (Note 1) | | $ | 393,377,592 | | | $ | 25,447,828 | | | $ | 197,454,554 | |
Investments in money market funds | | | 165,973,350 | | | | 6,655,841 | | | | 4,261,944 | |
Cash | | | 13,500 | | | | 675 | | | | — | |
Receivable for capital shares sold | | | 324,263 | | | | 568,741 | | | | 30,134 | |
Receivable for investment securities sold | | | 11,819 | | | | — | | | | — | |
Dividends and interest receivable | | | 818,693 | | | | 41,005 | | | | 503,888 | |
Tax reclaims receivable | | | 8,509 | | | | — | | | | — | |
Other assets | | | 83,237 | | | | 41,843 | | | | 87,221 | |
Total Assets | | | 560,610,963 | | | | 32,755,933 | | | | 202,337,741 | |
| | | | | | | | | | | | | |
LIABILITIES | | | | | | | | | | | | |
Written call options, at value (Notes 1 and 4) (premiums received $157,638,734 and $3,349,692) | | | 177,915,980 | | | | 4,210,509 | | | | — | |
Distributions payable | | | 1,261,242 | | | | 3,189 | | | | 108,865 | |
Payable for capital shares redeemed | | | 3,417,683 | | | | 3,212 | | | | 919,465 | |
Payable for investment securities purchased | | | 478,425 | | | | — | | | | — | |
Accrued investment advisory fees (Note 3) | | | 252,648 | | | | 4,489 | | | | 64,776 | |
Payable to administrator (Note 3) | | | 34,400 | | | | 6,240 | | | | 18,400 | |
Accrued account maintenance and shareholder servicing fees (Note 3) | | | 22,505 | | | | 400 | | | | 8,875 | |
Other accrued expenses | | | 20,024 | | | | 13,514 | | | | 12,675 | |
Total Liabilities | | | 183,402,907 | | | | 4,241,553 | | | | 1,133,056 | |
NET ASSETS | | $ | 377,208,056 | | | $ | 28,514,380 | | | $ | 201,204,685 | |
| | | | | | | | | | | | | |
Net assets consist of: | | | | | | | | | | | | |
Paid-in capital | | $ | 1,290,752,928 | | | $ | 31,297,395 | | | $ | 252,531,558 | |
Accumulated deficit | | | (913,544,872 | ) | | | (2,783,015 | ) | | | (51,326,873 | ) |
NET ASSETS | | $ | 377,208,056 | | | $ | 28,514,380 | | | $ | 201,204,685 | |
| | | | | | | | | | | | | |
Shares of beneficial interest outstanding (unlimited number of shares authorized, no par value) | | | 62,118,426 | | | | 3,027,255 | | | | 14,441,745 | |
| | | | | | | | | | | | | |
Net asset value, offering price and redemption price per share (Note 1) | | $ | 6.07 | | | $ | 9.42 | | | $ | 13.93 | |
See accompanying notes to financial statements. |
Hussman Investment Trust
Statements of Operations |
For the Six Months Ended December 31, 2023 (Unaudited) |
| | | Hussman
Strategic
Growth Fund | | | Hussman
Strategic
Allocation Fund | | | Hussman
Strategic Total
Return Fund | |
INVESTMENT INCOME | | | | | | | | | | | | |
Dividends | | $ | 8,232,531 | | | $ | 324,774 | | | $ | 788,955 | |
Foreign withholding taxes on dividends | | | (29,021 | ) | | | (1,284 | ) | | | (36,365 | ) |
Interest | | | — | | | | 89,765 | | | | 2,654,725 | |
Total Investment Income | | | 8,203,510 | | | | 413,255 | | | | 3,407,315 | |
| | | | | | | | | | | | | |
EXPENSES | | | | | | | | | | | | |
Investment advisory fees (Note 3) | | | 2,001,837 | | | | 105,458 | | | | 521,322 | |
Administration fees (Note 3) | | | 155,709 | | | | 12,000 | | | | 72,980 | |
Trustees’ fees and expenses (Note 3) | | | 51,686 | | | | 51,686 | | | | 51,686 | |
Account maintenance and shareholder services fees (Note 3) | | | 89,292 | | | | 4,180 | | | | 40,895 | |
Fund accounting fees (Note 3) | | | 40,957 | | | | 16,415 | | | | 25,383 | |
Legal fees | | | 21,433 | | | | 21,433 | | | | 21,433 | |
Registration and filing fees | | | 19,775 | | | | 21,547 | | | | 20,029 | |
Insurance expense | | | 29,069 | | | | 9,994 | | | | 18,063 | |
Transfer Agent Fees (Note 3) | | | 28,353 | | | | 9,000 | | | | 12,844 | |
Custodian and bank service fees | | | 29,435 | | | | 6,581 | | | | 6,983 | |
Postage and supplies | | | 22,453 | | | | 1,742 | | | | 8,644 | |
Audit and tax services fees | | | 10,916 | | | | 10,916 | | | | 10,916 | |
Compliance service fees (Note 3) | | | 16,966 | | | | 4,542 | | | | 9,742 | |
Printing of shareholder reports | | | 10,748 | | | | 6,778 | | | | 8,687 | |
Other expenses | | | 13,673 | | | | 12,133 | | | | 5,669 | |
Total Expenses | | | 2,542,302 | | | | 294,405 | | | | 835,276 | |
Previous fee waivers and Fund expenses recovered by the Adviser (Note 3) | | | 16,996 | | | | — | | | | — | |
Less fee waivers and Fund expenses absorbed by the Adviser (Note 3) | | | (10,818 | ) | | | (119,115 | ) | | | (55,687 | ) |
Net Expenses | | | 2,548,480 | | | | 175,290 | | | | 779,589 | |
| | | | | | | | | | | | | |
NET INVESTMENT INCOME | | | 5,655,030 | | | | 237,965 | | | | 2,627,726 | |
| | | | | | | | | | | | | |
Hussman Investment Trust
Statements of Operations (continued) |
For the Six Months Ended December 31, 2023 (Unaudited) |
| | | Hussman
Strategic
Growth Fund | | | Hussman
Strategic
Allocation Fund | | | Hussman
Strategic Total
Return Fund | |
REALIZED AND UNREALIZED GAINS (LOSSES) ON INVESTMENTS AND WRITTEN OPTION CONTRACTS | | | | | | | | | | | | |
Net realized gains (losses) from: | | | | | | | | | | | | |
Investments | | $ | (12,119,206 | ) | | $ | 172,542 | | | $ | (724,890 | ) |
Written option contracts (Note 4) | | | (37,808,343 | ) | | | (1,093,524 | ) | | | — | |
Net change in unrealized appreciation (depreciation) on: | | | | | | | | | | | | |
Investments | | | 28,685,990 | | | | 1,221,293 | | | | 5,928,864 | |
Written option contracts (Note 4) | | | 8,609,741 | | | | 2,155 | | | | — | |
| | | | | | | | | | | | | |
NET REALIZED AND UNREALIZED GAINS (LOSSES) ON INVESTMENTS AND WRITTEN OPTION CONTRACTS | | | (12,631,818 | ) | | | 302,466 | | | | 5,203,974 | |
| | | | | | | | | | | | | |
NET INCREASE (DECREASE) IN NET ASSETS RESULTING FROM OPERATIONS | | $ | (6,976,788 | ) | | $ | 540,431 | | | $ | 7,831,700 | |
See accompanying notes to financial statements. |
Hussman Strategic Growth Fund
Statements of Changes in Net Assets |
|
| | | Six Months Ended
December 31,
2023
(Unaudited) | | | Year Ended
June 30,
2023 | |
FROM OPERATIONS | | | | | | | | |
Net investment income | | $ | 5,655,030 | | | $ | 10,088,237 | |
Net realized losses from: | | | | | | | | |
Investments | | | (12,119,206 | ) | | | (41,105,139 | ) |
Written option contracts | | | (37,808,343 | ) | | | (17,435,013 | ) |
Net change in unrealized appreciation (depreciation) on: | | | | | | | | |
Investments | | | 28,685,990 | | | | 56,242,173 | |
Written option contracts | | | 8,609,741 | | | | (53,515,266 | ) |
Net decrease in net assets resulting from operations | | | (6,976,788 | ) | | | (45,725,008 | ) |
| | | | | | | | | |
DISTRIBUTIONS TO SHAREHOLDERS (Note 1) | | | (11,452,340 | ) | | | (5,831,678 | ) |
| | | | | | | | | |
FROM CAPITAL SHARE TRANSACTIONS | | | | | | | | |
Proceeds from shares sold | | | 19,853,660 | | | | 151,356,699 | |
Net asset value of shares issued in reinvestment of distributions to shareholders | | | 10,191,098 | | | | 5,079,128 | |
Proceeds from redemption fees collected (Note 1) | | | — | | | | 81,726 | |
Payments for shares redeemed | | | (100,635,492 | ) | | | (145,729,897 | ) |
Net increase (decrease) in net assets from capital share transactions | | | (70,590,734 | ) | | | 10,787,656 | |
| | | | | | | | | |
TOTAL DECREASE IN NET ASSETS | | | (89,019,862 | ) | | | (40,769,030 | ) |
| | | | | | | | | |
NET ASSETS | | | | | | | | |
Beginning of period | | | 466,227,918 | | | | 506,996,948 | |
End of period | | $ | 377,208,056 | | | $ | 466,227,918 | |
| | | | | | | | | |
CAPITAL SHARE ACTIVITY | | | | | | | | |
Shares sold | | | 3,087,535 | | | | 21,891,908 | |
Shares reinvested | | | 1,678,929 | | | | 717,391 | |
Shares redeemed | | | (15,839,264 | ) | | | (21,393,905 | ) |
Net increase (decrease) in shares outstanding | | | (11,072,800 | ) | | | 1,215,394 | |
Shares outstanding at beginning of period | | | 73,191,226 | | | | 71,975,832 | |
Shares outstanding at end of period | | | 62,118,426 | | | | 73,191,226 | |
See accompanying notes to financial statements. |
Hussman Strategic Allocation Fund
Statements of Changes in Net Assets |
|
| | | Six Months Ended
December 31,
2023
(Unaudited) | | | Year Ended
June 30,
2023 | |
FROM OPERATIONS | | | | | | | | |
Net investment income | | $ | 237,965 | | | $ | 316,543 | |
Net realized gains (losses) from: | | | | | | | | |
Investments | | | 172,542 | | | | (1,167,181 | ) |
Written option contracts | | | (1,093,524 | ) | | | 844,051 | |
Net change in unrealized appreciation (depreciation) on: | | | | | | | | |
Investments | | | 1,221,293 | | | | 2,226,022 | |
Written option contracts | | | 2,155 | | | | (1,695,308 | ) |
Net increase in net assets resulting from operations | | | 540,431 | | | | 524,127 | |
| | | | | | | | | |
DISTRIBUTIONS TO SHAREHOLDERS (Note 1) | | | (243,083 | ) | | | (4,234,623 | ) |
| | | | | | | | | |
FROM CAPITAL SHARE TRANSACTIONS | | | | | | | | |
Proceeds from shares sold | | | 2,583,334 | | | | 12,848,025 | |
Net asset value of shares issued in reinvestment of distributions to shareholders | | | 236,209 | | | | 4,105,135 | |
Proceeds from redemption fees collected (Note 1) | | | — | | | | 2,551 | |
Payments for shares redeemed | | | (2,341,323 | ) | | | (7,079,434 | ) |
Net increase in net assets from capital share transactions | | | 478,220 | | | | 9,876,277 | |
| | | | | | | | | |
TOTAL INCREASE IN NET ASSETS | | | 775,568 | | | | 6,165,781 | |
| | | | | | | | | |
NET ASSETS | | | | | | | | |
Beginning of period | | | 27,738,812 | | | | 21,573,031 | |
End of period | | $ | 28,514,380 | | | $ | 27,738,812 | |
| | | | | | | | | |
CAPITAL SHARE ACTIVITY | | | | | | | | |
Shares sold | | | 277,143 | | | | 1,307,195 | |
Shares reinvested | | | 25,261 | | | | 430,014 | |
Shares redeemed | | | (251,649 | ) | | | (735,346 | ) |
Net increase in shares outstanding | | | 50,755 | | | | 1,001,863 | |
Shares outstanding at beginning of period | | | 2,976,500 | | | | 1,974,637 | |
Shares outstanding at end of period | | | 3,027,255 | | | | 2,976,500 | |
See accompanying notes to financial statements. |
Hussman Strategic Total Return Fund
Statements of Changes in Net Assets |
|
| | | Six Months Ended
December 31,
2023
(Unaudited) | | | Year Ended
June 30,
2023 | |
FROM OPERATIONS | | | | | | | | |
Net investment income | | $ | 2,627,726 | | | $ | 5,511,582 | |
Net realized losses from investments | | | (724,890 | ) | | | (7,647,733 | ) |
Net change in unrealized appreciation (depreciation) on investments | | | 5,928,864 | | | | 994,293 | |
Net increase (decrease) in net assets resulting from operations | | | 7,831,700 | | | | (1,141,858 | ) |
| | | | | | | | | |
DISTRIBUTIONS TO SHAREHOLDERS (Note 1) | | | (2,804,590 | ) | | | (5,172,237 | ) |
| | | | | | | | | |
FROM CAPITAL SHARE TRANSACTIONS | | | | | | | | |
Proceeds from shares sold | | | 4,209,350 | | | | 18,315,533 | |
Net asset value of shares issued in reinvestment of distributions to shareholders | | | 2,589,312 | | | | 4,774,620 | |
Proceeds from redemption fees collected (Note 1) | | | — | | | | 8,496 | |
Payments for shares redeemed | | | (25,876,178 | ) | | | (65,216,881 | ) |
Net decrease in net assets from capital share transactions | | | (19,077,516 | ) | | | (42,118,232 | ) |
| | | | | | | | | |
TOTAL DECREASE IN NET ASSETS | | | (14,050,406 | ) | | | (48,432,327 | ) |
| | | | | | | | | |
NET ASSETS | | | | | | | | |
Beginning of period | | | 215,255,091 | | | | 263,687,418 | |
End of period | | $ | 201,204,685 | | | $ | 215,255,091 | |
| | | | | | | | | |
CAPITAL SHARE ACTIVITY | | | | | | | | |
Shares sold | | | 308,231 | | | | 1,336,689 | |
Shares reinvested | | | 189,767 | | | | 353,794 | |
Shares redeemed | | | (1,900,320 | ) | | | (4,808,370 | ) |
Net decrease in shares outstanding | | | (1,402,322 | ) | | | (3,117,887 | ) |
Shares outstanding at beginning of period | | | 15,844,067 | | | �� | 18,961,954 | |
Shares outstanding at end of period | | | 14,441,745 | | | | 15,844,067 | |
See accompanying notes to financial statements. |
Financial Highlights
Hussman Strategic Growth Fund
Financial Highlights |
Selected Per Share Data and Ratios for a Share Outstanding Throughout Each Period |
| | | Six Months
Ended
December 31,
2023
(Unaudited) | | | Year
Ended
June 30,
2023 | | | Year
Ended
June 30,
2022 | | | Year
Ended
June 30,
2021 | | | Year
Ended
June 30,
2020 | | | Year
Ended
June 30,
2019 | |
Net asset value at beginning of period | | $ | 6.37 | | | $ | 7.04 | | | $ | 6.77 | | | $ | 6.12 | | | $ | 5.87 | | | $ | 6.46 | |
| | | | | | | | | | | | | | | | | | | | | | | | | |
Income (loss) from investment operations: | | | | | | | | | | | | | | | | | | | | | | | | |
Net investment income | | | 0.11 | | | | 0.13 | | | | 0.05 | | | | 0.01 | | | | 0.06 | | | | 0.10 | |
Net realized and unrealized gains (losses) on investments and written option contracts | | | (0.22 | ) | | | (0.72 | ) | | | 0.25 | | | | 0.65 | | | | 0.29 | | | | (0.61 | ) |
Total from investment operations | | | (0.11 | ) | | | (0.59 | ) | | | 0.30 | | | | 0.66 | | | | 0.35 | | | | (0.51 | ) |
| | | | | | | | | | | | | | | | | | | | | | | | | |
Less distributions from: | | | | | | | | | | | | | | | | | | | | | | | | |
Net investment income | | | (0.19 | ) | | | (0.08 | ) | | | (0.03 | ) | | | (0.01 | ) | | | (0.10 | ) | | | (0.08 | ) |
| | | | | | | | | | | | | | | | | | | | | | | | | |
Proceeds from redemption fees collected (Note 1) | | | | — | | | 0.00 | (a) | | | 0.00 | (a) | | | 0.00 | (a) | | | 0.00 | (a) | | | 0.00 | (a) |
| | | | | | | | | | | | | | | | | | | | | | | | | |
Net asset value at end of period | | $ | 6.07 | | | $ | 6.37 | | | $ | 7.04 | | | $ | 6.77 | | | $ | 6.12 | | | $ | 5.87 | |
| | | | | | | | | | | | | | | | | | | | | | | | | |
Total return (b) | | | (1.76 | %)(c) | | | (8.54 | %) | | | 4.43 | % | | | 10.80 | % | | | 6.17 | % | | | (8.05 | %) |
| | | | | | | | | | | | | | | | | | | | | | | | | |
Net assets at end of period (000’s) | | $ | 377,208 | | | $ | 466,228 | | | $ | 506,997 | | | $ | 412,898 | | | $ | 308,774 | | | $ | 293,906 | |
| | | | | | | | | | | | | | | | | | | | | | | | | |
Ratio of total expenses to average net assets | | | 1.14 | %(d) | | | 1.12 | % | | | 1.14 | % | | | 1.19 | % | | | 1.26 | % | | | 1.24 | % |
| | | | | | | | | | | | | | | | | | | | | | | | | |
Ratio of net expenses to average net assets (e) | | | 1.15 | %(d) | | | 1.15 | % | | | 1.15 | % | | | 1.15 | % | | | 1.15 | % | | | 1.14 | % |
| | | | | | | | | | | | | | | | | | | | | | | | | |
Ratio of net investment income to average net assets (e) | | | 2.55 | %(d) | | | 1.97 | % | | | 0.74 | % | | | 0.09 | % | | | 0.87 | % | | | 1.66 | % |
| | | | | | | | | | | | | | | | | | | | | | | | | |
Portfolio turnover rate | | | 46 | %(c) | | | 79 | % | | | 113 | % | | | 198 | % | | | 167 | % | | | 124 | % |
(a) | Amount rounds to less than $0.01 per share. |
(b) | Total return is a measure of the change in value of an investment in the Fund over the period covered, which assumes any dividends or capital gains distributions are reinvested in shares of the Fund. Returns do not reflect the deduction of taxes a shareholder would pay on Fund distributions or the redemption of Fund shares. |
(c) | Not annualized. |
(d) | Annualized. |
(e) | Ratio was determined after advisory fee waivers and/or recovery. (Note 3). |
See accompanying notes to financial statements. |
Hussman Strategic Allocation Fund
Financial Highlights |
Selected Per Share Data and Ratios for a Share Outstanding Throughout Each Period |
| | | Six Months
Ended
December 31,
2023
(Unaudited) | | | Year
Ended
June 30,
2023 | | | Year
Ended
June 30,
2022 | | | Year
Ended
June 30,
2021 | | | Period
Ended
June 30,
2020 (a) | |
Net asset value at beginning of period | | $ | 9.32 | | | $ | 10.93 | | | $ | 11.70 | | | $ | 10.32 | | | $ | 10.00 | |
| | | | | | | | | | | | | | | | | | | | | |
Income (loss) from investment operations: | | | | | | | | | | | | | | | | | | | | |
Net investment income (loss) | | | 0.08 | | | | 0.12 | | | | 0.04 | | | | (0.02 | ) | | | 0.03 | |
Net realized and unrealized gains (losses) on investments and written option contracts | | | 0.10 | | | | 0.13 | | | | (0.42 | ) | | | 1.98 | | | | 0.29 | |
Total from investment operations | | | 0.18 | | | | 0.25 | | | | (0.38 | ) | | | 1.96 | | | | 0.32 | |
| | | | | | | | | | | | | | | | | | | | | |
Less distributions from: | | | | | | | | | | | | | | | | | | | | |
Net investment income | | | (0.08 | ) | | | (0.12 | ) | | | (0.04 | ) | | | (0.01 | ) | | | (0.00 | )(b) |
Net realized gains | | | — | | | | (1.74 | ) | | | (0.35 | ) | | | (0.57 | ) | | | — | |
Total distributions | | | (0.08 | ) | | | (1.86 | ) | | | (0.39 | ) | | | (0.58 | ) | | | (0.00 | )(b) |
| | | | | | | | | | | | | | | | | | | | | |
Proceeds from redemption fees collected (Note 1) | | | | — | | | 0.00 | (b) | | | 0.00 | (b) | | | 0.00 | (b) | | | 0.00 | (b) |
| | | | | | | | | | | | | | | | | | | | | |
Net asset value at end of period | | $ | 9.42 | | | $ | 9.32 | | | $ | 10.93 | | | $ | 11.70 | | | $ | 10.32 | |
| | | | | | | | | | | | | | | | | | | | | |
Total return (c) | | | 1.96 | %(d) | | | 2.06 | % | | | (3.19 | %) | | | 19.70 | % | | | 3.23 | %(d) |
| | | | | | | | | | | | | | | | | | | | | |
Net assets at end of period (000’s) | | $ | 28,514 | | | $ | 27,739 | | | $ | 21,573 | | | $ | 19,881 | | | $ | 8,093 | |
| | | | | | | | | | | | | | | | | | | | | |
Ratio of total expenses to average net assets | | | 2.09 | %(e) | | | 2.16 | % | | | 2.08 | % | | | 2.87 | % | | | 4.67 | %(e) |
| | | | | | | | | | | | | | | | | | | | | |
Ratio of net expenses to average net assets (f) | | | 1.25 | %(e) | | | 1.25 | % | | | 1.25 | % | | | 1.25 | % | | | 1.25 | %(e) |
| | | | | | | | | | | | | | | | | | | | | |
Ratio of net investment income (loss) to average net assets (f) | | | 1.69 | %(e) | | | 1.32 | % | | | 0.42 | % | | | (0.11 | %) | | | 0.34 | %(e) |
| | | | | | | | | | | | | | | | | | | | | |
Portfolio turnover rate | | | 62 | %(d) | | | 79 | % | | | 98 | % | | | 163 | % | | | 94 | %(d) |
(a) | Represents the period from the commencement of operations (August 27, 2019) through June 30, 2020. |
(b) | Amount rounds to less than $0.01 per share. |
(c) | Total return is a measure of the change in value of an investment in the Fund over the period covered, which assumes any dividends or capital gains distributions are reinvested in shares of the Fund. Returns do not reflect the deduction of taxes a shareholder would pay on Fund distributions or the redemption of Fund shares. |
(d) | Not annualized. |
(e) | Annualized. |
(f) | Ratio was determined after advisory fee waivers and absorption of Fund expenses by the Adviser (Note 3). |
See accompanying notes to financial statements. |
Hussman Strategic Total Return Fund
Financial Highlights |
Selected Per Share Data and Ratios for a Share Outstanding Throughout Each Period |
| | | Six Months
Ended
December 31,
2023
(Unaudited) | | | Year
Ended
June 30,
2023 | | | Year
Ended
June 30,
2022 | | | Year
Ended
June 30,
2021 | | | Year
Ended
June 30,
2020 | | | Year
Ended
June 30,
2019 | |
Net asset value at beginning of period | | $ | 13.59 | | | $ | 13.91 | | | $ | 14.76 | | | $ | 14.50 | | | $ | 12.83 | | | $ | 11.86 | |
| | | | | | | | | | | | | | | | | | | | | | | | | |
Income (loss) from investment operations: | | | | | | | | | | | | | | | | | | | | | | | | |
Net investment income | | | 0.18 | | | | 0.33 | | | | 0.26 | | | | 0.14 | | | | 0.13 | | | | 0.19 | |
Net realized and unrealized gains (losses) on investments | | | 0.35 | | | | (0.34 | ) | | | (0.86 | ) | | | 0.25 | | | | 1.66 | | | | 0.95 | |
Total from investment operations | | | 0.53 | | | | (0.01 | ) | | | 0.60 | | | | 0.39 | | | | 1.79 | | | | 1.14 | |
| | | | | | | | | | | | | | | | | | | | | | | | | |
Less distributions from: | | | | | | | | | | | | | | | | | | | | | | | | |
Net investment income | | | (0.19 | ) | | | (0.31 | ) | | | (0.25 | ) | | | (0.13 | ) | | | (0.12 | ) | | | (0.17 | ) |
| | | | | | | | | | | | | | | | | | | | | | | | | |
Proceeds from redemption fees collected (Note 1) | | | | — | | | 0.00 | (a) | | | 0.00 | (a) | | | 0.00 | (a) | | | 0.00 | (a) | | | 0.00 | (a) |
| | | | | | | | | | | | | | | | | | | | | | | | | |
Net asset value at end of period | | $ | 13.93 | | | $ | 13.59 | | | $ | 13.91 | | | $ | 14.76 | | | $ | 14.50 | | | $ | 12.83 | |
| | | | | | | | | | | | | | | | | | | | | | | | | |
Total return (b) | | | 3.93 | %(c) | | | (0.03 | %) | | | (4.14 | %) | | | 2.70 | % | | | 14.00 | % | | | 9.72 | % |
| | | | | | | | | | | | | | | | | | | | | | | | | |
Net assets at end of period (000’s) | | $ | 201,205 | | | $ | 215,255 | | | $ | 263,687 | | | $ | 316,539 | | | $ | 290,129 | | | $ | 221,235 | |
| | | | | | | | | | | | | | | | | | | | | | | | | |
Ratio of total expenses to average net assets | | | 0.80 | %(d) | | | 0.78 | % | | | 0.75 | % | | | 0.75 | % | | | 0.81 | % | | | 0.81 | % |
| | | | | | | | | | | | | | | | | | | | | | | | | |
Ratio of net expenses to average net assets (e) | | | 0.75 | %(d) | | | 0.75 | % | | | 0.75 | % | | | 0.75 | % | | | 0.75 | % | | | 0.74 | % |
| | | | | | | | | | | | | | | | | | | | | | | | | |
Ratio of net investment income to average net assets (e) | | | 2.52 | %(d) | | | 2.36 | % | | | 1.73 | % | | | 0.93 | % | | | 0.87 | % | | | 1.36 | % |
| | | | | | | | | | | | | | | | | | | | | | | | | |
Portfolio turnover rate | | | 28 | %(c) | | | 42 | % | | | 22 | % | | | 38 | % | | | 88 | % | | | 61 | % |
(a) | Amount rounds to less than $0.01 per share. |
(b) | Total return is a measure of the change in value of an investment in the Fund over the period covered, which assumes any dividends or capital gains distributions are reinvested in shares of the Fund. Returns do not reflect the deduction of taxes a shareholder would pay on Fund distributions or the redemption of Fund shares. |
(c) | Not annualized. |
(d) | Annualized. |
(e) | Ratio was determined after advisory fee waivers (Note 3). |
See accompanying notes to financial statements. |
Hussman Investment Trust
Notes to Financial Statements |
December 31, 2023 (Unaudited) |
1. ORGANIZATION AND SIGNIFICANT ACCOUNTING POLICIES
Hussman Strategic Growth Fund, Hussman Strategic Allocation Fund and Hussman Strategic Total Return Fund (each, a “Fund,” and collectively, the “Funds”) are diversified, separate series of Hussman Investment Trust (the “Trust”), which is registered under the Investment Company Act of 1940, as amended (the “1940 Act”), as an open-end management investment company. Each Fund is authorized to issue an unlimited number of shares.
Hussman Strategic Growth Fund’s investment objective seeks to achieve long-term capital appreciation, with added emphasis on protection of capital during unfavorable market conditions.
Hussman Strategic Allocation Fund’s investment objective seeks to achieve total return through a combination of income and capital appreciation.
Hussman Strategic Total Return Fund’s investment objective seeks to achieve long-term total return from income and capital appreciation.
The following is a summary of significant accounting policies followed by the Funds. The policies are in conformity with accounting principles generally accepted in the United States of America (“GAAP”). Each Fund follows accounting and reporting guidance under Financial Accounting Standards Board Accounting Standards Codification Topic 946 “Financial Services – Investment Companies.”
Regulatory Update – Tailored Shareholder Reports for Mutual Funds and Exchange-Traded Funds (“ETFs”) – Effective January 24, 2023, the Securities and Exchange Commission (the “SEC”) adopted rule and form amendments to require mutual funds and ETFs to transmit concise and visually engaging streamlined annual and semiannual reports to shareholders that highlight key information. Other information, including financial statements, will no longer appear in a streamlined shareholder report but must be available online, delivered free of charge upon request, and filed on a semiannual basis on Form N-CSR. The rule and form amendments have a compliance date of July 24, 2024. At this time, management is evaluating the impact of these amendments on the shareholder reports for the Funds.
Securities, Options and Futures Valuation — The Funds’ portfolio securities are valued at market value as of the close of regular trading on the New York Stock Exchange (“NYSE”) (normally, 4:00 p.m. Eastern time) on each business day the NYSE is open. Securities listed on the NYSE or other exchanges, other than options, are valued on the basis of their last sale prices on the exchanges on which they are primarily traded. However, if the last sale price on the NYSE is different than the last
Hussman Investment Trust
Notes to Financial Statements (continued) |
December 31, 2023 (Unaudited) |
sale price on any other exchange, the NYSE price will be used. If there are no sales on that day, the securities are valued at the last bid price on the NYSE or other primary exchange for that day. Securities quoted by NASDAQ are valued at the NASDAQ Official Closing Price. If there are no sales on that day, the securities are valued at the last bid price as reported by NASDAQ. Securities traded in over-the-counter markets, other than NASDAQ quoted securities, are valued at the last sales price, or if there are no sales on that day, at the mean of the closing bid and ask prices. Securities traded on a foreign stock exchange, if any, are valued at their closing prices on the principal exchange where they are traded; however, on days when the value of securities traded on foreign stock exchanges may be materially affected by events occurring before a Fund’s pricing time, but after the close of the primary markets or exchanges on which such securities are traded, such securities typically will be valued at their fair value as determined by an independent pricing service approved by the Board of Trustees where such value is believed to reflect the market values of such securities as of the time of computation of a Fund’s net asset value (“NAV”). As a result, the prices of foreign securities used to calculate a Fund’s NAV may differ from quoted or published prices for these securities. Values of foreign securities denominated in or expected to settle in a foreign currency are translated from the local currency into U.S. dollars using prevailing currency exchange rates as of the close of the NYSE, as supplied by an independent pricing service.
Pursuant to procedures approved by the Board of Trustees, options traded on a national securities exchange are valued at prices between the closing bid and ask prices determined by Hussman Strategic Advisors, Inc. (the “Adviser”) to most closely reflect market value as of the time of computation of the NAV. As of December 31, 2023, all options held by Hussman Strategic Growth Fund and Hussman Strategic Allocation Fund have been valued in this manner. Options not traded on a national securities exchange or board of trade, but for which over-the-counter market quotations are readily available, are valued at the mean between their closing bid and ask prices. Futures contracts and options thereon, if any, which are traded on commodities exchanges, are valued at their last sale prices as of the close of regular trading on the NYSE or, if not available, at the mean between their bid and ask prices.
Fixed income securities traded over-the-counter and not traded or dealt in upon any securities exchange, but for which market quotations are readily available, generally are valued at the mean of their closing bid and ask prices. Fixed income securities may also be valued on the basis of prices provided by an independent
Hussman Investment Trust
Notes to Financial Statements (continued) |
December 31, 2023 (Unaudited) |
pricing service. Debt securities with remaining maturities of 60 days or less may be valued at amortized cost if the Adviser, under the supervision of the Board of Trustees, determines that the amortized cost value of the security represents fair value.
Investments in shares of other open-end investment companies, other than shares of exchange-traded funds, are valued at their NAVs per share as reported by such companies.
In the event that market quotations are not readily available or are determined by the Adviser, as the valuation designee, to not be reflective of fair market value due to market events or developments, securities and other financial instruments will be valued at fair value as determined by the Adviser in accordance with procedures adopted by the Board of Trustees pursuant to Rule 2a-5 under the 1940 Act. Methods used to determine fair value may include, but are not limited to: multiple of earnings, multiple of book value, discount from market of a similar freely traded security, purchase price of the security, subsequent private transactions in the security or related securities, or a combination of these and other factors.
GAAP establishes a single authoritative definition of fair value, sets out a framework for measuring fair value and requires additional disclosures about fair value measurements.
Various inputs are used in determining the values of the Funds’ investments. These inputs are summarized in the three broad levels listed below:
| | ● | Level 1 – quoted unadjusted prices for identical instruments in active markets to which the Fund has access at the date of measurement. |
| | ● | Level 2 – quoted prices for similar instruments in active markets; quoted prices for identical or similar instruments in markets that are not active; and model-derived valuations in which all significant inputs and significant value drivers are observable in active markets. Level 2 inputs are those in markets for which there are few transactions, the prices are not current, little public information exists or instances where prices vary substantially over time or among market makers. |
| | ● | Level 3 – model-derived valuations in which one or more significant inputs or significant value drivers are unobservable. Unobservable inputs are those inputs that reflect the Fund’s own assumptions that market participants would use to price the asset or liability based on the best available information. |
Hussman Investment Trust
Notes to Financial Statements (continued) |
December 31, 2023 (Unaudited) |
Option contracts purchased or written by Hussman Strategic Growth Fund and Hussman Strategic Allocation Fund are classified as Level 2 since they are valued using “other significant observable inputs” at prices between the closing bid and ask prices determined by the Adviser to most closely reflect fair value. U.S. Treasury obligations held by Hussman Strategic Allocation Fund and Hussman Strategic Total Return Fund are classified as Level 2 since values are based on prices provided by an independent pricing service that utilizes various “other significant observable inputs,” including bid and ask quotations, prices of similar securities and interest rates, among other factors.
The Trust uses an independent pricing service to determine the fair value of portfolio securities traded on a foreign securities exchange, if any, when the value of such securities may be materially affected by events occurring before a Fund’s pricing time, but after the close of the primary markets or exchanges on which such securities are traded. These intervening events might be: country-specific (e.g., natural disaster, economic or political developments, interest rate change); issuer specific (e.g., earnings report, merger announcement); or U.S. markets-specific (such as a significant movement in the U.S. markets that is deemed likely to affect the value of foreign securities). The pricing service uses an automated system incorporating a model based on multiple parameters, including a security’s local closing price, relevant general and sector indices, currency fluctuations, trading in depositary receipts and futures, if applicable, and/or research valuations by its staff, in determining what it believes is the fair value of the securities. The frequency of use of this procedure depends on market and other events and thus cannot be predicted.
Determining the fair value of portfolio securities involves reliance on judgment, and a security’s fair value may differ depending on the method used for determining value. With respect to a portfolio security that has been valued at fair value, there can be no assurance that a Fund could purchase or sell that security at a price equal to the fair value of such security used in calculating the Fund’s NAV. Because of the inherent uncertainty in determining fair value and the various factors considered in making such determinations, there can be significant deviations between the fair value at which a portfolio security is being carried and the price at which it can be sold.
The inputs or methodology used for valuing securities are not necessarily an indication of the risks associated with investing in those securities. The inputs used to measure the value of a particular security may fall into more than one level of the fair value hierarchy. In such cases, for disclosure purposes, the level in the fair value hierarchy within which the fair value measurement of that security is determined to fall in its entirety is the lowest level input that is significant to the fair value measurement.
Hussman Investment Trust
Notes to Financial Statements (continued) |
December 31, 2023 (Unaudited) |
The following is a summary of each Fund’s investments and other financial instruments and the inputs used to value the investments and other financial instruments as of December 31, 2023 by security type:
Hussman Strategic Growth Fund
| | | Level 1 | | | Level 2 | | | Level 3 | | | Total | |
Investments in Securities and Money Market Funds: | | | | | | | | | | | | | | | | |
Common Stocks | | $ | 385,643,792 | | | $ | — | | | $ | — | | | $ | 385,643,792 | |
Warrants | | | 84,000 | | | | — | | | | — | | | | 84,000 | |
Exchange-Traded Put Option Contracts | | | — | | | | 7,649,800 | | | | — | | | | 7,649,800 | |
Money Market Funds | | | 165,973,350 | | | | — | | | | — | | | | 165,973,350 | |
Total Investments in Securities and Money Market Funds | | $ | 551,701,142 | | | $ | 7,649,800 | | | $ | — | | | $ | 559,350,942 | |
| | | | | | | | | | | | | | | | | |
Other Financial Instruments: | | | | | | | | | | | | | | | | |
Exchange-Traded Written Call Option Contracts | | $ | — | | | $ | (177,915,980 | ) | | $ | — | | | $ | (177,915,980 | ) |
Total Other Financial Instruments | | $ | — | | | $ | (177,915,980 | ) | | $ | — | | | $ | (177,915,980 | ) |
Hussman Strategic Allocation Fund
| | | Level 1 | | | Level 2 | | | Level 3 | | | Total | |
Investments in Securities and Money Market Funds: | | | | | | | | | | | | | | | | |
Common Stocks | | $ | 19,289,802 | | | $ | — | | | $ | — | | | $ | 19,289,802 | |
U.S. Treasury Obligations | | | — | | | | 6,133,367 | | | | — | | | | 6,133,367 | |
Warrants | | | 2,520 | | | | — | | | | — | | | | 2,520 | |
Exchange-Traded Put Option Contracts | | | — | | | | 22,139 | | | | — | | | | 22,139 | |
Money Market Funds | | | 6,655,841 | | | | — | | | | — | | | | 6,655,841 | |
Total Investments in Securities and Money Market Funds | | $ | 25,948,163 | | | $ | 6,155,506 | | | $ | — | | | $ | 32,103,669 | |
| | | | | | | | | | | | | | | | | |
Other Financial Instruments: | | | | | | | | | | | | | | | | |
Exchange-Traded Written Call Option Contracts | | $ | — | | | $ | (4,210,509 | ) | | $ | — | | | $ | (4,210,509 | ) |
Total Other Financial Instruments | | $ | — | | | $ | (4,210,509 | ) | | $ | — | | | $ | (4,210,509 | ) |
Hussman Investment Trust
Notes to Financial Statements (continued) |
December 31, 2023 (Unaudited) |
Hussman Strategic Total Return Fund
| | | Level 1 | | | Level 2 | | | Level 3 | | | Total | |
Investments in Securities and Money Market Funds: | | | | | | | | | | | | | | | | |
Common Stocks | | $ | 31,686,142 | | | $ | — | | | $ | — | | | $ | 31,686,142 | |
Exchange-Traded Funds | | | 3,326,025 | | | | — | | | | — | | | | 3,326,025 | |
U.S. Treasury Obligations | | | — | | | | 162,358,387 | | | | — | | | | 162,358,387 | |
Warrants | | | 84,000 | | | | — | | | | — | | | | 84,000 | |
Money Market Funds | | | 4,261,944 | | | | — | | | | — | | | | 4,261,944 | |
Total Investments in Securities and Money Market Funds | | $ | 39,358,111 | | | $ | 162,358,387 | | | $ | — | | | $ | 201,716,498 | |
Each Fund’s Schedule of Investments identifies the specific securities (by type of security and sector and industry type) that comprise that Fund’s holdings within the Level 1 and Level 2 categories shown in the tables above. The Funds did not have any assets or liabilities that were measured at fair value on a recurring basis using significant unobservable inputs (Level 3) as of December 31, 2023.
Futures Contracts and Option Transactions — Hussman Strategic Growth Fund and Hussman Strategic Allocation Fund may purchase and write call and put options on broad-based stock indices and also may purchase and write call and put option contracts on individual securities. Each of the Funds may use financial futures contracts and related option contracts to hedge against changes in the market value of its portfolio securities. Hussman Strategic Total Return Fund may also purchase foreign currency options to manage its exposures to foreign currencies. Hussman Strategic Allocation Fund and Hussman Strategic Total Return Fund may purchase interest rate futures contracts to protect against a decline in the value of its portfolio resulting from rising interest rates.
Hussman Strategic Growth Fund and Hussman Strategic Allocation Fund may each use futures and option contracts on stock indices for the purpose of seeking to reduce the market risk that would otherwise be associated with the securities in which it invests. For example, these Funds may sell a stock index futures contracts to hedge the risk of a general market or market sector decline that might adversely affect prices of the Funds’ portfolio securities. To the extent there is a correlation between a Fund’s portfolio and a particular stock index, the sale of futures contracts on that index could reduce the Fund’s exposure to general market risk.
Hussman Investment Trust
Notes to Financial Statements (continued) |
December 31, 2023 (Unaudited) |
When a Fund writes an index option, an amount equal to the net premium (the premium less the commission) received by the Fund is recorded as a liability on the Fund’s Statement of Assets and Liabilities and is subsequently marked-to-market daily. If an index option written by a Fund expires unexercised on the stipulated expiration date or if a Fund enters into a closing purchase transaction, it will realize a gain or a loss depending on whether the cost of a closing purchase transaction is less than or exceeds the net premium received when the option was sold and the liability related to such option will be eliminated. If an index option written by a Fund is exercised, the Fund will be required to pay the difference between the closing index value and the exercise price of the option. In this event, the proceeds of the sale will be increased by the net premium originally received and the Fund will realize a gain or loss. To secure the obligation of a Fund to settle index options it has written, common stocks owned by the Fund are held in escrow by the Fund’s custodian bank (or by a securities depository acting for the custodian bank) for the benefit of the Options Clearing Corporation (the “OCC”). Escrow is maintained with the OCC on a daily basis until written options expire unexercised or when the Fund enters into a closing purchase transaction.
When a Fund purchases or sells a stock index futures contract, no price is paid to or received by the Fund upon the purchase or sale of the futures contract. Instead, the Fund is required to deposit in a segregated account with its custodian an amount of cash or qualifying securities currently ranging from 2% to 11% of the contract amount. This is called “initial margin.” Subsequent payments, known as “variation margin,” are made or received by the Fund to or from the separate account each day, depending on the daily fluctuations in the value of the underlying stock index. The Fund recognizes an unrealized gain or loss equal to the daily variation margin. If general market movements are not as expected, the Fund may not achieve the anticipated benefits from the use of futures contracts and may realize a loss. In addition to the possibility that there may be an imperfect correlation or no correlation at all between the movements in the stock index futures and the portion of the portfolio being hedged, the price of the stock index futures may not correlate perfectly with movements in the stock index due to certain market distortions.
Foreign Currency Translation — Investment securities and other assets and liabilities denominated in or expected to settle in foreign currencies, if any, are translated into U.S. dollars based on exchange rates on the following basis:
| | A. | The values of investment securities and other assets and liabilities are translated as of the close of the NYSE each day. |
Hussman Investment Trust
Notes to Financial Statements (continued) |
December 31, 2023 (Unaudited) |
| | B. | Purchases and sales of investment securities and income and expenses are translated at the rate of exchange prevailing as of 4:00 p.m., Eastern time, on the respective date of such transactions. |
| | C. | The Funds do not isolate that portion of the results of operations caused by changes in foreign exchange rates on investments from those caused by changes in market prices of securities held. Such fluctuations are included with the net realized and unrealized gains or losses on investments. |
Reported net realized foreign exchange gains or losses arise from: (1) purchases and sales of foreign currencies; (2) currency gains or losses realized between the trade and settlement dates on securities transactions; and (3) the difference between the amounts of dividends, interest and foreign withholding taxes recorded on a Fund’s books and the U.S. dollar equivalent of the amounts actually received or paid. Reported net unrealized foreign exchange gains and losses arise from changes in the U.S. dollar value of assets and liabilities that result from changes in exchange rates.
Share Valuation and Redemption Fees — The NAV per share of each Fund is calculated as of the close of regular trading on the NYSE (normally 4:00 p.m., Eastern time) on each day that the NYSE is open for business. NAV per share of a Fund is calculated by dividing the total value of the Fund’s assets, less its liabilities, by the number of its shares outstanding. The offering price and redemption price per share of each Fund is equal to the NAV per share next computed after receipt of an order to purchase or to redeem shares. Prior to April 1, 2023, a redemption fee of 1.5%, payable to the applicable Fund, generally was applied to shares that were redeemed 60 days or less from the date of purchase. During the year ended June 30, 2023, proceeds from redemption fees, recorded in capital totaled: $81,726, $2,551 and $8,496 for Hussman Strategic Growth Fund, Hussman Strategic Allocation Fund and Hussman Strategic Total Return Fund, respectively. Effective April 1, 2023, the Funds eliminated the redemption fees being charged, regardless of how long shares are held.
Investment Income — Interest income is accrued as earned. Dividend income is recorded on the ex-dividend date. Non-cash dividends included in dividend income, if any, are recorded at the value of the security received. Discounts and premiums on fixed income securities are amortized using the effective interest method. Withholding taxes on foreign dividends have been recorded in accordance with the Trust’s understanding of the applicable country’s rules and tax rates.
Hussman Investment Trust
Notes to Financial Statements (continued) |
December 31, 2023 (Unaudited) |
Distributions to Shareholders — Dividends from net investment income, if any, are declared and paid annually to shareholders of Hussman Strategic Growth Fund and are declared and paid quarterly to shareholders of Hussman Strategic Allocation Fund and Hussman Strategic Total Return Fund. Dividends are recorded on the ex-dividend date. Net realized short-term capital gains, if any, may be distributed throughout the year and net realized long-term capital gains, if any, are generally distributed annually. The amount of distributions from net investment income and net realized capital gains are determined in accordance with federal income tax regulations, which may differ from GAAP. These “book/tax” differences are either temporary or permanent in nature and are primarily due to timing differences in the recognition of capital gains or losses on options and futures transactions and losses deferred due to wash sales.
The tax character of distributions paid during the periods ended December 31, 2023 and June 30, 2023 was as follows:
Period Ended | | Ordinary
Income | | | Long-Term
Capital Gains | | | Total
Distributions* | |
Hussman Strategic Growth Fund | | | | | | | | | | | | |
December 31, 2023 | | $ | 11,452,340 | | | $ | — | | | $ | 11,452,340 | |
June 30, 2023 | | $ | 5,831,678 | | | $ | — | | | $ | 5,831,678 | |
Hussman Strategic Allocation Fund | | | | | | | | | | | | |
December 31, 2023 | | $ | 243,083 | | | $ | — | | | $ | 243,083 | |
June 30, 2023 | | $ | 2,188,035 | | | $ | 2,045,274 | | | $ | 4,233,309 | |
Hussman Strategic Total Return Fund | | | | | | | | | | | | |
December 31, 2023 | | $ | 2,804,590 | | | $ | — | | | $ | 2,804,590 | |
June 30, 2023 | | $ | 5,210,037 | | | $ | — | | | $ | 5,210,037 | |
* | Total Distributions may not tie to the amounts listed on the Statements of Changes in Net Assets due to dividends payable amounts. |
Investment Transactions — Investment transactions are accounted for on trade date for financial reporting purposes. Realized gains and losses on investments sold are determined on a specific identification basis.
Common Expenses — Expenses of the Trust not attributable solely to one of the Funds are allocated among the Funds based on the relative net assets of each Fund or based on the nature of the expense and its relative applicability to each Fund.
Accounting Estimates — The preparation of financial statements in conformity with GAAP requires management to make estimates and assumptions that affect the reported amounts of assets and liabilities and the disclosure of contingent assets
Hussman Investment Trust
Notes to Financial Statements (continued) |
December 31, 2023 (Unaudited) |
and liabilities as of the date of the financial statements and the reported amounts of increase (decrease) in net assets from operations during the reporting period. Actual results could differ from these estimates.
Federal Income Tax — Each Fund has qualified and intends to continue to qualify each year as a “regulated investment company” under Subchapter M of the Internal Revenue Code of 1986, as amended (the “Code”). By so qualifying, a Fund generally will not be subject to federal income taxes to the extent that it distributes its net investment income and any net realized capital gains in accordance with the Code. Accordingly, no provision for income taxes has been made.
In order to avoid imposition of a federal excise tax applicable to regulated investment companies, it is each Fund’s intention to declare and pay as dividends in each calendar year at least 98% of its net investment income (earned during the calendar year) and 98.2% of its net realized capital gains (earned during the twelve months ended October 31) plus undistributed amounts from prior years.
The tax character of distributable earnings (accumulated deficit) as of December 31, 2023 was as follows:
| | | Hussman
Strategic
Growth Fund | | | Hussman
Strategic
Allocation Fund | | | Hussman
Strategic Total
Return Fund | |
Net unrealized appreciation (depreciation) | | $ | 10,243,606 | | | $ | 114,255 | | | $ | (4,960,078 | ) |
Accumulated ordinary income | | | 1,414,716 | | | | 2,638 | | | | 108,567 | |
Capital loss carryforwards | | | (887,024,253 | ) | | | (2,084,914 | ) | | | (44,499,793 | ) |
Other losses | | | (36,917,699 | ) | | | (811,805 | ) | | | (1,866,704 | ) |
Other temporary differences | | | (1,261,242 | ) | | | (3,189 | ) | | | (108,865 | ) |
Total accumulated deficit | | $ | (913,544,872 | ) | | $ | (2,783,015 | ) | | $ | (51,326,873 | ) |
The following information is based upon the federal income tax cost of investment securities as of December 31, 2023:
| | | Hussman
Strategic
Growth Fund | | | Hussman
Strategic
Allocation Fund | | | Hussman
Strategic Total
Return Fund | |
Cost of investments and money market funds | | $ | 371,191,356 | | | $ | 27,778,905 | | | $ | 206,676,576 | |
Gross unrealized appreciation | | $ | 40,771,215 | | | $ | 1,835,216 | | | $ | 2,636,349 | |
Gross unrealized depreciation | | | (30,527,609 | ) | | | (1,720,961 | ) | | | (7,596,427 | ) |
Net unrealized appreciation (depreciation) | | $ | 10,243,606 | | | $ | 114,255 | | | $ | (4,960,078 | ) |
Hussman Investment Trust
Notes to Financial Statements (continued) |
December 31, 2023 (Unaudited) |
The difference between the federal income tax cost of portfolio investments and the financial statement cost of portfolio investments for each Fund is due to certain timing differences in the recognition of capital gains or losses under income tax regulations and GAAP. These “book/tax” differences are temporary in nature and are primarily due to losses deferred due to wash sales, derivatives and adjustments to basis for publicly traded partnerships, passive foreign investment companies and grantor trusts.
As of June 30, 2023, the Funds had the following capital loss carryforwards for federal income tax purposes:
| | | Hussman
Strategic
Growth Fund | | | Hussman
Strategic
Allocation Fund | | | Hussman
Strategic Total
Return Fund | |
Short-term capital loss carryforwards | | $ | 521,778,993 | | | $ | — | | | $ | 39,597,386 | |
Long-term capital loss carryforwards | | | 365,245,260 | | | | 2,084,914 | | | | 4,902,407 | |
Total | | $ | 887,024,253 | | | $ | 2,084,914 | | | $ | 44,499,793 | |
These capital loss carryforwards, which do not expire, may be utilized by the Funds in the current and future years to offset their net realized capital gains, if any, prior to distributing such gains to shareholders.
Each Fund recognizes the tax benefits or expenses of uncertain tax positions only when the position is “more likely than not” to be sustained assuming examination by tax authorities. Management has reviewed each Fund’s tax positions taken on federal income tax returns for the current and all open tax years (generally, tax returns that have been filed within the past three years) and all major jurisdictions and has concluded that no provision for unrecognized tax benefits or expenses is required in these financial statements. Therefore, no tax expense (including interest and penalties) was recorded in the current year and no adjustments were made to prior periods.
Each Fund recognizes interest and penalties, if any, related to unrecognized tax benefits as income tax expenses on the Statements of Operations. During the six months ended December 31, 2023, the Funds did not incur any interest or penalties.
Hussman Investment Trust
Notes to Financial Statements (continued) |
December 31, 2023 (Unaudited) |
2. INVESTMENT TRANSACTIONS
During the six months ended December 31, 2023, cost of purchases and proceeds from sales and maturities of investment securities, other than short-term investments and U.S. government securities, were as follows:
| | | Hussman
Strategic
Growth Fund | | | Hussman
Strategic
Allocation Fund | | | Hussman
Strategic Total
Return Fund | |
Purchases of investment securities | | $ | 215,056,170 | | | $ | 12,669,170 | | | $ | 20,378,833 | |
Proceeds from sales and maturities of investment securities | | $ | 339,498,822 | | | $ | 13,202,923 | | | $ | 34,771,520 | |
During the six months ended December 31, 2023, cost of purchases and proceeds from sales and maturities of long-term U.S. government securities were as follows:
| | | Hussman
Strategic
Growth Fund | | | Hussman
Strategic
Allocation Fund | | | Hussman
Strategic Total
Return Fund | |
Purchases of investment securities | | $ | — | | | $ | 2,849,905 | | | $ | 33,817,194 | |
Proceeds from sales and maturities of investment securities | | $ | — | | | $ | 3,298,779 | | | $ | 66,114,718 | |
3. TRANSACTIONS WITH AFFILIATES
Advisory Agreement
Under the terms of an Advisory Agreement between the Trust and the Adviser, Hussman Strategic Growth Fund pays the Adviser a fee, which is computed and accrued daily and paid monthly, at annual rates of: 0.90% of the first $2 billion of the Fund’s average daily net assets; 0.85% of the next $3 billion of such assets; and 0.80% of such assets over $5 billion. Under the terms of a separate Advisory Agreement between the Trust and the Adviser, Hussman Strategic Allocation Fund pays the Adviser a fee, which is computed and accrued daily and paid monthly, at annual rates of: 0.75% of the first $2 billion of the Fund’s average daily net assets; 0.70% of the next $3 billion of such assets; and 0.65% of such assets over $5 billion. Under the terms of a separate Advisory Agreement between the Trust and the Adviser, Hussman Strategic Total Return Fund pays the Adviser a fee, which is computed and accrued daily and paid monthly, at annual rates of: 0.50% of the first $1 billion of the Fund’s average daily net assets; 0.45% of the next $1.5 billion of such assets; and 0.40% of such assets over $2.5 billion.
Hussman Investment Trust
Notes to Financial Statements (continued) |
December 31, 2023 (Unaudited) |
The Adviser has contractually agreed that, until November 1, 2024, it will waive its advisory fees and/or absorb operating expenses of each Fund to the extent necessary so that operating expenses of Hussman Strategic Growth Fund, Hussman Strategic Allocation Fund and Hussman Strategic Total Return Fund (excluding fees and expenses incurred on investments in other investment companies and pooled investment vehicles, brokerage commissions, taxes, interest expense and any extraordinary expenses) do not exceed annually an amount equal to 1.15%, 1.25% and 0.75%, respectively, of such Fund’s average daily net assets. During the six months ended December 31, 2023, the Adviser waived advisory fees in the amount of $10,818, $105,458 and $55,687 with respect to Hussman Strategic Growth Fund, Hussman Strategic Allocation Fund and Hussman Strategic Total Return Fund, respectively. Additionally, during the six months ended December 31, 2023, the Adviser absorbed operating expenses of $13,657 with respect to Hussman Strategic Allocation Fund.
Pursuant to the Expense Limitation Agreements governing these arrangements, each Fund is obligated to reimburse the Adviser the amount of advisory fees previously waived and expenses previously absorbed by the Adviser for a period of three years from the date such fees or expenses were waived or absorbed, but only if such reimbursement does not cause the Fund’s operating expenses (after the reimbursement is taken into account) to exceed the lesser of: (i) the expense limitation in effect at the time such fees and expenses were waived or absorbed; and (ii) the expense limitation in effect at the time the Adviser seeks reimbursement of such fees and expenses. The Expense Limitation Agreements may not be terminated by the Adviser without the approval of the Board of Trustees. During the six months ended December 31, 2023, Hussman Strategic Growth Fund recovered $16,996 of past advisory fees waived. As of December 31, 2023, the amount of fee waivers and expense reimbursements available for possible recovery by the Adviser from Hussman Strategic Growth Fund, Hussman Strategic Allocation Fund and Hussman Strategic Total Return Fund is $36,629, $600,242 and $128,565, respectively. The portions of these amounts that the Adviser may recover expire as of the following dates:
| | | June 30,
2024 | | | June 30,
2025 | | | June 30,
2026 | | | December 31,
2026 | | | Total | |
Hussman Strategic Growth Fund | | $ | 25,811 | | | $ | — | | | $ | — | | | $ | 10,818 | | | $ | 36,629 | |
Hussman Strategic Allocation Fund | | $ | 91,721 | | | $ | 171,615 | | | $ | 217,791 | | | $ | 119,115 | | | $ | 600,242 | |
Hussman Strategic Total Return Fund | | $ | — | | | $ | 10,253 | | | $ | 62,625 | | | $ | 55,687 | | | $ | 128,565 | |
Hussman Investment Trust
Notes to Financial Statements (continued) |
December 31, 2023 (Unaudited) |
The Adviser may agree to continue after November 1, 2024 the current arrangement to limit the Funds’ expenses or to implement a similar arrangement, but it is not obligated to do so.
Certain officers of the Trust are also officers of the Adviser.
Other Service Providers
Ultimus Fund Solutions, LLC (“Ultimus”) provides administration, fund accounting and transfer agency services to the Funds. The Funds pay Ultimus fees for these services in accordance with various servicing agreements. In addition, the Funds reimburse Ultimus for certain out-of-pocket expenses incurred in providing services to the Funds, including, but not limited to, postage, supplies and costs related to the pricing of the Funds’ portfolio securities. Certain officers of the Trust are also officers of Ultimus, or Ultimus Fund Distributors, LLC (the “Distributor”), the principal underwriter of the Funds. The Distributor is a wholly-owned subsidiary of Ultimus.
Under the terms of a Consulting Agreement with the Trust, Northern Lights Compliance Services, LLC (“NLCS”) provides an Anti-Money Laundering Officer to the Trust, as well as related compliance services. Under the terms of the agreement, NLCS receives fees from the Funds. NLCS is a wholly-owned subsidiary of Ultimus.
The Funds compensate certain financial intermediaries for providing account maintenance and shareholder services to shareholder accounts held through such intermediaries. During six months ended December 31, 2023, Hussman Strategic Growth Fund, Hussman Strategic Allocation Fund and Hussman Strategic Total Return Fund paid $89,292, $4,180 and $40,895, respectively, to financial intermediaries for such services.
Trustee Compensation
Trustees and officers affiliated with the Adviser or Ultimus are not compensated by the Funds for their services. Each Trustee who is not an “interested person,” as defined by the 1940 Act, of the Trust or an affiliated person of the Adviser or Ultimus (an “Independent Trustee”) receives from the Trust: an annual retainer of $50,000, payable quarterly; a fee of $7,000 for attendance at each regular quarterly meeting of the Board of Trustees other than the annual meeting of the Board, for which each Independent Trustee receives an attendance fee of $12,000; a fee of $4,000 for attendance at each special meeting of the Board of Trustees; a fee of $3,000 for attendance at each meeting of any committee of the Board of Trustees that is not held on the same day as a Board of Trustees meeting; and a fee of $1,500 for participation in each informal monthly telephone conference call of the Board of
Hussman Investment Trust
Notes to Financial Statements (continued) |
December 31, 2023 (Unaudited) |
Trustees. In addition, the Independent Trustees are reimbursed for travel and other expenses incurred in attending meetings. Each Fund pays its proportionate share of the Independent Trustees’ fees and expenses.
Principal Holder of Fund Shares
As of December 31, 2023, an officer of the Adviser owned of record 39.9% of the outstanding shares of Hussman Strategic Allocation Fund. A shareholder owning of record or beneficially 25% or more of a Fund’s outstanding shares may be considered a controlling person. That shareholder’s vote could have a more significant effect on matters presented at a shareholders’ meeting.
4. DERIVATIVES TRANSACTIONS
The locations in the Statements of Assets and Liabilities of the derivative positions of Hussman Strategic Growth Fund and Hussman Strategic Allocation Fund are as follows:
Hussman Strategic Growth Fund
| | | | | Fair Value | | | Average Monthly | |
Type of
Derivative | Risk | Location | | Asset Derivatives | | | Liability
Derivatives | | | Notional Value
During the
Six Months Ended
December 31,
2023* | |
Index put options purchased | Equity | Investments in securities at value | | $ | 7,649,800 | | | $ | — | | | $ | 455,331,256 | |
Index call options purchased | Equity | Investments in securities at value | | | — | | | | — | | | | 2,657,978 | |
Index call options written | Equity | Written call options, at value | | | — | | | | (177,915,980 | ) | | | (455,331,256 | ) |
* | The average monthly notional value generally represents the Fund’s derivative activity throughout the six months. |
Hussman Investment Trust
Notes to Financial Statements (continued) |
December 31, 2023 (Unaudited) |
Hussman Strategic Allocation Fund
| | | | | Fair Value | | | Average Monthly | |
Type of
Derivative | Risk | Location | | Asset Derivatives | | | Liability
Derivatives | | | Notional Value
During the
Six Months Ended
December 31,
2023* | |
Index put options purchased | Equity | Investments in securities at value | | $ | 22,139 | | | $ | — | | | $ | 19,628,892 | |
Index call options written | Equity | Written call options, at value | | | — | | | | (4,210,509 | ) | | | (19,628,892 | ) |
* | The average monthly notional value generally represents the Fund’s derivative activity throughout the six months. |
Realized and unrealized gains and losses associated with transactions in derivative instruments for Hussman Strategic Growth Fund and Hussman Strategic Allocation Fund during the six months ended December 31, 2023 are recorded in the following locations on the Statements of Operations:
Hussman Strategic Growth Fund
Type of
Derivative | Risk | Location | | Realized Losses | | Location | | Change in
Unrealized
Appreciation
(Depreciation) | |
Index put options purchased | Equity | Net realized gains (losses) from investments | | $ | (15,805,725 | ) | Net change in unrealized appreciation (depreciation) on investments | | $ | 4,861,990 | |
Index call options purchased | Equity | Net realized gains (losses) from investments | | | (3,499,895 | ) | Net change in unrealized appreciation (depreciation) on investments | | | — | |
Index call options written | Equity | Net realized losses from written option contracts | | | (37,808,343 | ) | Net change in unrealized appreciation (depreciation) on written option contracts | | | 8,609,741 | |
Hussman Investment Trust
Notes to Financial Statements (continued) |
December 31, 2023 (Unaudited) |
Hussman Strategic Allocation Fund
Type of
Derivative | Risk | Location | | Realized Losses | | Location | | Change in
Unrealized
Appreciation
(Depreciation) | |
Index put options purchased | Equity | Net realized gains (losses) from investments | | $ | (303,425 | ) | Net change in unrealized appreciation (depreciation) on investments | | $ | 112,832 | |
Index call options written | Equity | Net realized losses from written option contracts | | | (1,093,524 | ) | Net change in unrealized appreciation (depreciation) on written option contracts | | | 2,155 | |
Hussman Strategic Total Return Fund had no transactions in derivative instruments during the six months ended December 31, 2023.
In the ordinary course of business, Hussman Strategic Growth Fund and Hussman Strategic Allocation Fund may enter into transactions subject to enforceable netting agreements or other similar arrangements (“netting agreements”). Generally, the right to offset in netting agreements allows each Fund to offset the exposure it has on any transaction with a specific counterparty with any collateral it has received or delivered in connection with other transactions with that counterparty. Generally, the Funds manage their cash collateral and securities collateral on a counterparty basis.
Hussman Investment Trust
Notes to Financial Statements (continued) |
December 31, 2023 (Unaudited) |
The offsetting of financial liabilities and derivative liabilities as of December 31, 2023 are as follows:
Hussman Strategic Growth Fund
Description | | Gross
Amounts of
Recognized
Liabilities | | | Gross
Amounts
Offset on
Statements
of Assets and
Liabilities | | | Net Amounts
of Liabilities
Presented on
Statements
of Assets and
Liabilities | | | Collateral
Pledged* | | | Net Amount | |
Written options at market value | | $ | (177,915,980 | ) | | $ | — | | | $ | (177,915,980 | ) | | $ | 177,915,980 | | | $ | — | |
Total subject to a master netting or similar arrangement | | $ | (177,915,980 | ) | | $ | — | | | $ | (177,915,980 | ) | | $ | 177,915,980 | | | $ | — | |
* | Common stocks owned by the Fund are held in escrow by the Fund’s custodian (or by a security depository) to secure the Fund’s obligations to settle outstanding call option contracts it has written (Note 1). Amounts in collateral pledged in the table above are limited to the net amounts presented on the Statements of Assets and Liabilities. |
Hussman Strategic Allocation Fund
Description | | Gross
Amounts of
Recognized
Liabilities | | | Gross
Amounts
Offset on
Statements
of Assets and
Liabilities | | | Net Amounts
of Liabilities
Presented on
Statements
of Assets and
Liabilities | | | Collateral
Pledged* | | | Net Amount | |
Written options at market value | | $ | (4,210,509 | ) | | $ | — | | | $ | (4,210,509 | ) | | $ | 4,210,509 | | | $ | — | |
Total subject to a master netting or similar arrangement | | $ | (4,210,509 | ) | | $ | — | | | $ | (4,210,509 | ) | | $ | 4,210,509 | | | $ | — | |
* | Common stocks owned by the Fund are held in escrow by the Fund’s custodian (or by a security depository) to secure the Fund’s obligations to settle outstanding call option contracts it has written (Note 1). Amounts in collateral pledged in the table above are limited to the net amounts presented on the Statements of Assets and Liabilities. |
Hussman Investment Trust
Notes to Financial Statements (continued) |
December 31, 2023 (Unaudited) |
5. CERTAIN INVESTMENTS AND ASSOCIATED RISKS
The securities in which the Funds invest, as well as the risks associated with these securities and with the investment programs of the Funds, are described in each Fund’s Prospectus. Among these risks are those associated with investments in derivative instruments, investments in shares of money market funds, and concentration of investments within a particular business sector.
Risks of Derivative Instruments — The purchase and sale of derivative instruments, including options and futures contracts, and other derivative transactions involve risks different from those involved with direct investments in securities and also require different skills from the Adviser in managing each Fund’s portfolio of investments. While utilization of options, futures contracts and similar instruments may be advantageous to the Funds, if the Adviser is not successful in employing such instruments in managing a Fund’s investments or in anticipating general market movements, the Fund’s performance will be worse than if the Fund did not make such investments. It is possible that there will be imperfect correlation, or even no correlation, between price movements of the investments held by the Funds and the options, futures or other derivative instruments used to hedge those investments. It is also possible that a Fund may be unable to close out or liquidate its hedges during unusual periods of illiquidity in the options, futures or other markets. In addition, a Fund will pay commissions and other costs in connection with its transactions in such instruments, which may increase its expenses and reduce its investment performance.
Investments in Money Market Funds — In order to maintain sufficient liquidity to implement investment strategies, or for temporary defensive purposes, each Fund may at times invest a significant portion of its assets in shares of money market funds. As of December 31, 2023, Hussman Strategic Growth Fund had 44.0% of the value of its net assets invested in shares of a money market fund registered under the 1940 Act. The annual report, along with the report of the independent registered public accounting firm is included in the money market fund’s N-CSR available at www.sec.gov. An investment in a money market fund is not insured or guaranteed by the Federal Deposit Insurance Corporation or any other governmental agency, entity or person. While investor losses in money market funds have been rare, they are possible. The Fund, as investors in money market funds, indirectly bear the fees and expenses of those funds, which are in addition to the fees and expenses of the Fund.
Sector Risk — If a Fund has significant investments in the securities of issuers in industries within a particular business sector, any development generally affecting that sector will have a greater impact on the value of the net assets of the Fund than would be the case if the Fund did not have significant investments in that sector. This
Hussman Investment Trust
Notes to Financial Statements (continued) |
December 31, 2023 (Unaudited) |
may increase the risk of loss of an investment in a Fund and increase the volatility of a Fund’s NAV per share. From time to time, circumstances may affect a particular sector and the companies within such sector. For instance, economic or market factors, regulation or deregulation, and technological or other developments, may negatively impact all companies in a particular sector and therefore the value of a Fund’s portfolio could be adversely affected if it has significant holdings of securities of issuers in that sector. As of December 31, 2023, none of the Funds had 25% or more of the value of their net assets invested in a particular sector.
6. BANK LINE OF CREDIT
The Trust has established a $15,000,000 unsecured bank line of credit with its custodian bank which collectively allows the Funds to borrow up to this line. Any borrowings under these arrangements bear interest at the Prime Rate, currently 8.50% as of December 31, 2023. During the six months ended December 31, 2023, Hussman Strategic Growth Fund, Hussman Strategic Allocation Fund and Hussman Strategic Total Return Fund did not borrow under their line of credit.
7. CONTINGENCIES AND COMMITMENTS
The Trust’s officers and Trustees are entitled to indemnification from the Funds for certain liabilities to which they may become subject in connection with the performance of their duties to the Funds. Additionally, in the normal course of business, the Funds enter into contracts that contain a variety of representations and warranties and which may require the Funds to indemnify the other parties to the contracts in the event of certain losses. The Funds’ maximum exposure under these arrangements is unknown, as this would involve potential claims for indemnification for losses that may or may not be incurred in the future. However, based on experience, the Trust believes the risk of loss to be remote.
8. SUBSEQUENT EVENTS
The Funds are required to recognize in their financial statements the effects of all subsequent events that provide additional evidence about conditions that existed as of the date of the Statements of Assets and Liabilities. For non-recognized subsequent events that must be disclosed to keep the financial statements from being misleading, the Funds are required to disclose the nature of the event as well as an estimate of its financial effect, or a statement that such an estimate cannot be made. Management has evaluated subsequent events through the date of issuance of these financial statements and has noted no such events.
Hussman Investment Trust
About Your Funds’ Expenses (Unaudited) |
|
We believe it is important for you to understand the impact of costs on your investment. As a shareholder of the Funds, you incur two types of costs: (1) transaction costs, which may include redemption fees, if any; and (2) ongoing costs, including management fees and other Fund expenses. The following examples are intended to help you understand your ongoing costs (in dollars) of investing in the Funds and to compare these costs with the ongoing costs of investing in other mutual funds. A mutual fund’s ongoing costs are expressed as a percentage of its average net assets. This figure is known as the expense ratio.
The examples below are based on an investment of $1,000 made at the beginning of the period shown and held for the entire period (July 1, 2023 – December 31, 2023).
The table on the following page illustrates each Fund’s ongoing costs in two ways:
Actual fund return – This section helps you to estimate the actual expenses that you paid over the period. The “Ending Account Value” shown is derived from each Fund’s actual return, and the fourth column shows the dollar amount of operating expenses that would have been paid by an investor who started the period with $1,000 invested in that Fund. You may use that information, together with the amount of your investment, to estimate the expenses that you paid over the period.
To do so, simply divide your account value by $1,000 (for example, an $8,600 account value divided by $1,000 = 8.6), and then multiply the result by the number given for the applicable Fund under the heading “Expenses Paid During Period.”
Hypothetical 5% return – This section is intended to help you compare each Fund’s ongoing costs with those of other mutual funds. It assumes that each Fund had an annual return of 5% before expenses during the period shown. In this case, because the return used is not each Fund’s actual return, the results do not illustrate the actual expenses associated with your investment. However, the example is useful in making comparisons because the SEC requires all mutual funds to provide an example of fund expenses based on a 5% annual return. You can assess each Fund’s ongoing costs by comparing this hypothetical example with the hypothetical examples that appear in shareholder reports of other mutual funds.
Note that expenses shown in the table are meant to highlight and help you compare ongoing costs only. The expense ratios used in computing annual expenses in the tables are the expense ratios of the Funds during the six-month period ended December 31, 2023, annualized, after fee waivers and expense reimbursements. Actual expenses of the Funds in future periods may differ. The calculations assume no
Hussman Investment Trust
About Your Funds’ Expenses (Unaudited) (continued) |
|
shares were bought or sold during the period. Your actual costs may have been higher or lower, depending on the amount of your investment and the timing of any purchases or redemptions.
More information about each Fund’s expenses, including annual expense ratios, can be found elsewhere in this report. For additional information on operating expenses and other shareholder costs, please refer to each Fund’s prospectus.
| Beginning
Account Value
July 1, 2023 | Ending
Account Value
December 31, 2023 | Net
Expense
Ratio(a) | Expenses
Paid During
Period(b) |
Hussman Strategic Growth Fund |
Based on Actual Fund Return | $ 1,000.00 | $ 982.40 | 1.15% | $ 5.75 |
Based on Hypothetical 5% Return (before expenses) | $ 1,000.00 | $ 1,019.41 | 1.15% | $ 5.85 |
Hussman Strategic Allocation Fund |
Based on Actual Fund Return | $ 1,000.00 | $ 1,019.60 | 1.25% | $ 6.36 |
Based on Hypothetical 5% Return (before expenses) | $ 1,000.00 | $ 1,018.90 | 1.25% | $ 6.36 |
Hussman Strategic Total Return Fund |
Based on Actual Fund Return | $ 1,000.00 | $ 1,039.30 | 0.75% | $ 3.86 |
Based on Hypothetical 5% Return (before expenses) | $ 1,000.00 | $ 1,021.42 | 0.75% | $ 3.82 |
(a) | Annualized, based on each Fund’s most recent one-half year expenses. |
(b) | Expenses are equal to each Fund’s annualized net expense ratio multiplied by the average account value over the period, multiplied by 184/365 (to reflect the one-half year period). |
Hussman Investment Trust
Other Information (Unaudited) |
|
A description of the policies and procedures the Funds use to determine how to vote proxies relating to portfolio securities is available without charge upon request by calling toll-free 1-800-HUSSMAN (1-800-487-7626), or on the SEC’s website at www.sec.gov. Information regarding how the Funds voted proxies relating to portfolio securities during the most recent 12-month period ended June 30 is also available without charge upon request by calling toll-free 1-800-HUSSMAN, or on the SEC’s website at www.sec.gov.
Each Fund files a complete listing of portfolio holdings with the SEC as of the end of the first and third quarters of each fiscal year as an exhibit to each Fund’s Form N-PORT. The filings are available upon request, by calling 1-800-HUSSMAN (1-800-487-7626). You may also obtain copies of these filings on the SEC’s website at www.sec.gov and the Funds’ website at www.hussmanfunds.com.
Privacy Notice |
FACTS | WHAT DO THE HUSSMAN FUNDS DO WITH YOUR PERSONAL INFORMATION? |
| | | | |
Why? | Financial companies choose how they share your personal information. Federal law gives consumers the right to limit some but not all sharing. Federal law also requires us to tell you how we collect, share, and protect your personal information. Please read this notice carefully to understand what we do. |
| | | | |
What? | The types of personal information we collect and share depend on the product or service you have with us. This information can include: ■ Social Security number ■ Assets ■ Retirement Assets ■ Transaction History ■ Checking Account Information ■ Purchase History ■ Account Balances ■ Account Transactions ■ Wire Transfer Instructions When you are no longer our customer, we continue to share your information as described in this notice. |
| | | | |
How? | All financial companies need to share your personal information to run their everyday business. In the section below, we list the reasons financial companies can share their customers’ personal information; the reasons the Hussman Funds choose to share; and whether you can limit this sharing. |
| | | | |
Reasons we can share your personal information | Do the Hussman Funds share? | Can you limit this sharing? |
For our everyday business purposes –
Such as to process your transactions, maintain your account(s), respond to court orders and legal investigations, or report to credit bureaus | Yes | No |
For our marketing purposes –
to offer our products and services to you | No | We don’t share |
For joint marketing with other financial companies | No | We don’t share |
For our affiliates’ everyday business purposes –
information about your creditworthiness | No | We don’t share |
For nonaffiliates to market to you | No | We don’t share |
| | |
Questions? | Call 1-800-HUSSMAN (1-800-487-7626) |
Who we are |
Who is providing this notice? | Hussman Investment Trust Ultimus Fund Distributors, LLC (Distributor) Ultimus Fund Solutions, LLC (Administrator) |
What we do |
How do the Hussman Funds protect my personal information? | To protect your personal information from unauthorized access and use, we use security measures that comply with federal law. These measures include computer safeguards and secured files and buildings. Our service providers are held accountable for adhering to strict policies and procedures to prevent any misuse of your nonpublic personal information. |
How do the Hussman Funds collect my personal information? | We collect your personal information, for example, when you ■ Provide account information ■ Give us your contact information ■ Make deposits or withdrawals from your account ■ Make a wire transfer ■ Tell us where to send the money ■ Tell us who receives the money ■ Show your government-issued ID ■ Show your driver’s license We also collect your personal information from other companies. |
Why can’t I limit all sharing? | Federal law gives you the right to limit only ■ Sharing for affiliates’ everyday business purposes – information about your creditworthiness ■ Affiliates from using your information to market to you ■ Sharing for nonaffiliates to market to you State laws and individual companies may give you additional rights to limit sharing. |
| | |
Definitions |
Affiliates | Companies related by common ownership or control. They can be financial and nonfinancial companies. ■ Hussman Strategic Advisors, Inc., the investment manager to the Hussman Funds, could be deemed to be an affiliate. |
Nonaffiliates | Companies not related by common ownership or control. They can be financial and nonfinancial companies ■ The Hussman Funds do not share with nonaffiliates so they can market to you. |
Joint marketing | A formal agreement between nonaffiliated financial companies that together market financial products or services to you. ■ The Hussman Funds do not jointly market. |
THIS PAGE INTENTIONALLY LEFT BLANK.

INVESTMENT ADVISER
Hussman Strategic Advisors, Inc.
6021 University Boulevard, Suite 490
Ellicott City, Maryland 21043
www.hussmanfunds.com
1-800-HUSSMAN (1-800-487-7626)
ADMINISTRATOR/TRANSFER AGENT
Ultimus Fund Solutions, LLC
225 Pictoria Drive, Suite 450
Cincinnati, Ohio 45246
CUSTODIAN
U.S. Bank, N.A.
425 Walnut Street
Cincinnati, Ohio 45202
INDEPENDENT REGISTERED
PUBLIC ACCOUNTING FIRM
Cohen & Company, Ltd.
342 N. Water Street
Suite 830
Milwaukee, Wisconsin 53202
LEGAL COUNSEL
Troutman Pepper Hamilton Sanders LLP
3000 Two Logan Square
Eighteenth and Arch Streets
Philadelphia, PA 19103
This Report is authorized for
distribution only if accompanied or preceded
by a current Prospectus of the Funds.
Hussman-SAR-23
Item 2. Code of Ethics.
Not required
Item 3. Audit Committee Financial Expert.
Not required
Item 4. Principal Accountant Fees and Services.
Not required
Item 5. Audit Committee of Listed Registrants.
Not applicable
Item 6. Investments.
| (a) | Not applicable [schedule filed under Item 1] |
Item 7. Disclosure of Proxy Voting Policies and Procedures for Closed-End Management Investment Companies.
Not applicable
Item 8. Portfolio Managers of Closed-End Management Investment Companies.
Not applicable
Item 9. Purchases of Equity Securities by Closed-End Management Investment Company and Affiliated Purchasers.
Not applicable
Item 10. Submission of Matters to a Vote of Security Holders.
The registrant has not adopted procedures by which shareholders may recommend nominees to the registrant’s board of trustees.
Item 11. Controls and Procedures.
(a) Based on their evaluation of the registrant’s disclosure controls and procedures (as defined in Rule 30a-3(c) under the Investment Company Act of 1940) as of a date within 90 days of the filing date of this report, the registrant’s principal executive officer and principal financial officer have concluded that such disclosure controls and procedures are reasonably designed and are operating effectively to ensure that material information relating to the registrant, including its consolidated subsidiaries, is made known to them by others within those entities, particularly during the period in which this report is being prepared, and that the information required in filings on Form N-CSR is recorded, processed, summarized, and reported on a timely basis.
(b) There were no changes in the registrant’s internal control over financial reporting (as defined in Rule 30a-3(d) under the Investment Company Act of 1940) that occurred during the period covered by this report that have materially affected, or are reasonably likely to materially affect, the registrant’s internal control over financial reporting.
| Item 12. | Disclosure of Securities Lending Activities for Closed-End Management Investment Companies. |
Not applicable
File the exhibits listed below as part of this Form. Letter or number the exhibits in the sequence indicated.
(a)(1) Any code of ethics, or amendment thereto, that is the subject of the disclosure required by Item 2, to the extent that the registrant intends to satisfy the Item 2 requirements through filing of an exhibit: Not required
(a)(2) A separate certification for each principal executive officer and principal financial officer of the registrant as required by Rule 30a-2(a) under the Act (17 CFR 270.30a-2(a)): Attached hereto
(1) Not applicable
(2) Change in the registrant’s independent public accountant: Not applicable
(b) Certifications required by Rule 30a-2(b) under the Act (17 CFR 270.30a-2(b)): Attached hereto
SIGNATURES
Pursuant to the requirements of the Securities Exchange Act of 1934 and the Investment Company Act of 1940, the registrant has duly caused this report to be signed on its behalf by the undersigned, thereunto duly authorized.
| (Registrant) | Hussman Investment Trust | |
| | | |
| By (Signature and Title)* | /s/ John P. Hussman | |
| | | |
| | John P. Hussman, President | |
| | | |
| Date | March 1, 2024 | |
Pursuant to the requirements of the Securities Exchange Act of 1934 and the Investment Company Act of 1940, this report has been signed below by the following persons on behalf of the registrant and in the capacities and on the dates indicated.
| By (Signature and Title)* | /s/ John P. Hussman | |
| | | |
| | John P. Hussman, President | |
| | | |
| Date | March 1, 2024 | |
| | | |
| By (Signature and Title)* | /s/ Mark J. Seger | |
| | | |
| | Mark J. Seger, Treasurer | |
| | | |
| Date | March 1, 2024 | |
| * | Print the name and title of each signing officer under his or her signature. |