FINANCIAL HIGHLIGHTS
| (In U.S. Dollars Thousands, Except Number of Shares and Per Share Data) | | Year Ended December 31 | | Year Ended December 31 | | |
| CONSOLIDATED STATEMENT OF OPERATIONS | | 2013 | | 2012 | | % Change |
| Revenue | | $ | 197,522 | | | $ | 231,740 | | | | (15 | ) |
| Sales costs | | | 61,958 | | | | 80,354 | | | | 23 | |
| Event production | | | 24,403 | | | | 26,250 | | | | 7 | |
| Community and content | | | 27,481 | | | | 32,696 | | | | 16 | |
| General and administrative | | | 50,272 | | | | 44,281 | | | | (14 | ) |
| Information and technology | | | 12,729 | | | | 13,188 | | | | 3 | |
| Profit on sale of property | | | 15,410 | | | | - | | | | 100 | |
| Profit from operations | | | 36,089 | | | | 34,971 | | | | 3 | |
| Interest income | | | 1,472 | | | | 1,044 | | | | 41 | |
| Gain on sale of available-for-sale securities | | | 64 | | | | - | | | | 100 | |
| Share of loss of associate | | | - | | | | 24 | | | | 100 | |
| Impairment loss on investment in associate | | | - | | | | 302 | | | | 100 | |
| Income tax expense | | | 4,753 | | | | 2,744 | | | | (73 | ) |
| | | | | | | | | | | | | |
| Net profit | | | 32,872 | | | | 32,945 | | | | 0 | |
| | | | | | | | | | | | | |
| Net profit attributable to non-controlling interests | | | 137 | | | | 739 | | | | 81 | |
| Net profit attributable to the Company’s shareholders | | $ | 32,735 | | | $ | 32,206 | | | | 2 | |
| Diluted earnings per share | | $ | 0.91 | | | $ | 0.90 | | | | 1 | |
| Shares used in diluted net profit per share calculations | | | 36,068,326 | | | | 35,742,495 | | | | 1 | |
| | | | | | | | | | | | | |
| BALANCE SHEET HIGHLIGHTS | | | | | | | | | | | | |
| Cash and cash equivalents | | $ | 137,359 | | | $ | 104,631 | | | | 31 | |
| Term deposits with banks | | | 106 | | | | 4,184 | | | | (97 | ) |
| Financial assets, available-for-sale | | | 6,367 | | | | 7,472 | | | | (15 | ) |
| Current assets | | | 176,394 | | | | 147,108 | | | | 20 | |
| Property and equipment | | | 49,701 | | | | 30,442 | | | | 63 | |
| Investment properties | | | 89,615 | | | | 97,377 | | | | (8 | ) |
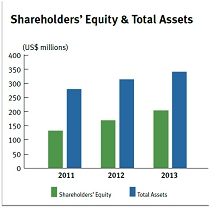
| Total assets | | | 339,097 | | | | 311,169 | | | | 9 | |
| Current liabilities | | | 115,284 | | | | 118,705 | | | | 3 | |
| Total liabilities | | | 125,535 | | | | 133,857 | | | | 6 | |
| Total Company shareholders’ equity | | | 203,980 | | | | 165,920 | | | | 23 | |
| | | | | | | | | | | | | |
| OTHER INFORMATION | | | | | | | | | | | | |
| Net cash generated from operating activities | | $ | 31,055 | | | $ | 31,277 | | | | (1 | ) |
| Capital expenditures | | | 27,047 | | | | 1,371 | | | | (1,873 | ) |
| Stock price | | $ | 8.13 | (1) | | $ | 6.48 | (1) | | | 25 | |
| (1) | Stock price is based on last trading day of the year. |
Fellow Shareholders,
2013 was a challenging year for Global Sources. Retail demand for consumer products was slow in most major markets, our advertisers and exhibitors experienced significant cost increases and overall ad spending in our markets declined. However, beginning in the fourth quarter we began to see signs of improvement, which is encouraging for the coming year. We have also maintained a very strong balance sheet with no short- or long-term debt.
Operationally, we continued to integrate our online and trade show services with the aim of delivering unique and enhanced value to our respective buyer and supplier communities. For export markets, we announced the launch of new China Sourcing Fairs for the new vertical of Mobile and Wireless and just recently, for the new location of Jakarta, Indonesia. During 2013, we also announced an acquisition that enhanced our position in the machinery industry and expanded our footprint in China’s domestic B2B market.
Financial Highlights for 2013
We achieved the following 2013 results compared to 2012, reported in accordance with the International Financial Reporting Standards (IFRS):
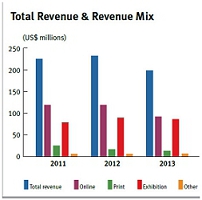
| • | Revenue was $197.5 million, down 15% as compared to $231.7 million; |
| - | Online revenue was $91.4 million, down 23%; |
| - | Exhibitions revenue was $85.6 million, down 4%; and |
| - | China grew to represent 83% of total revenue, up from 82%. |
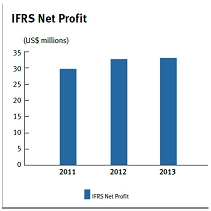
| • | Net profit was $32.7 million, or $0.91 per diluted share, as compared to $32.2 million, or $0.90 per diluted share. |
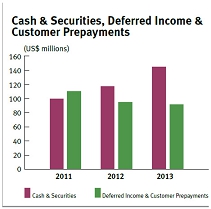
| • | Cash and securities as of December 31st, 2013 totaled $143.8 million. |

Merle A. Hinrichs
Executive Chairman
Letter to shareholders 1
Key Industry Trends
2013 was a year of substantial economic uncertainty with weak consumer demand in key developed markets, while the emerging markets generally continued to grow in importance. The overall weakness continued into the early part of 2014 with China’s exports showing a slight decline over the previous year. However, outside of the macro issues, there are several key trends that we see shaping our future.
A big factor impacting our industry is the ongoing importance of trade shows. They help buyers overcome the “trust” issues inherent in online-only environments and give them early access to the industry’s most carefully selected products.

Trade show attendees, who include many trade show "fans" who rarely or never use online services, are a primary segment of our buyer community and account for a major portion of the buying power. In addition, these "Verified Buyers" are even more attractive to suppliers because they are "in-market" buyers who are actively sourcing
Trade shows are also very important because of who participates. By exhibiting, a supplier demonstrates their size, existence and commitment to exporting. Accordingly, most buyers consider them to be more qualified than the average supplier they find online.
Similarly, the buyers have made a significant financial investment to travel to the show, a much larger commitment than simply going online and sending an inquiry. Accordingly, it is no surprise that our trade show attendees have much larger buying power than the average online user.
Both trade show and online media are necessary – but insufficient on their own. On the one hand, online marketplaces are valuable because they are fast, comprehensive and searchable. On the other hand, trade shows are essential for many buyers because they can personally evaluate products and suppliers, negotiate, and place orders. To source more safely, confidently and profitably, many buyers want to take advantage of both trade shows and online services.
Another big driver of trends, services and buyer behavior in our business is the sheer quantity of “products” and “exporters” that can be found online. This makes it riskier and more difficult than ever to find the right suppliers.
2 Letter to shareholders
Buyers can find more than one million “export” suppliers online and many millions of products. However, the challenge for buyers becomes clearer when you realize that there are likely fewer than 150,000 suppliers of consumer goods in China who have a background that would qualify them as a legitimate potential supplier for a volume import buyer.

Given the overwhelming quantity of suppliers and products that can be found online, finding the right suppliers is riskier and more difficult than ever.
Business and Growth Strategy
Our overall growth strategy has four primary components:
| • | Penetration of the market for our export media; |
| • | New product and market development; |
| • | Expansion into China’s domestic B2B market; and |
| • | Acquisitions, joint ventures and alliances |
In our primary business, our focus is on serving the professional segment. By being an essential provider of information and services to buyers, we are able to be an important marketing partner for suppliers.
We give suppliers access to a community of buyers that is highly qualified, influential and exclusive – including Verified Buyers who have all been qualified face-to-face at our trade shows. To help suppliers win orders and establish profitable, long-term customers, we offer an integrated, multi- channel solution that includes the industry’s leading services for helping suppliers differentiate and boost their image or brand.
Connecting our communities
To connect global buyers with suppliers in China and throughout Asia, we have two broad underlying initiatives. One is to provide a unique combination of online and trade show services, and the other is to match the right buyers with the right suppliers.
Letter to shareholders 3
Our primary strategy is to offer services that integrate the best of online with the best of trade shows. ThisFind Them and Meet Theminitiative is boosting value for all four of our major constituencies: buyers who attend our shows; buyers who use our online services; exhibitors; and online advertisers.

Global Sources’Find Them and Meet Theminitiative aims to provide buyers with the best of online media integratedwith the best of trade shows. The goal is to overcome limitations of online-only environments and provide unique and essential sourcing content and services.
For example, our Product Showcases at the trade shows feature carefully selected products from hundreds of suppliers who do not have booths at the particular show. In addition, we are connecting more suppliers with show attendees using unique matching services like ourPersonal Shortlisting Service. As another example, for the April 2014China Sourcing Fairsin Hong Kong we had more than 130,000 products online for buyers to view before the shows began.
The other key objective we are focused on is helping buyers find the right suppliers from among more than a million that they can find online. With GlobalSources.com we have proprietary systems that strive to include only those suppliers who have evidence of a background that would make them potential suppliers to the buyers we serve. Accordingly, this validated group of suppliers excludes the many thousands of other higher-risk suppliers.
We also help buyers find the right suppliers by providing vital data on suppliers’ customers, credentials and compliances within our search results – and with our focus on featuring exclusive products from Verified Suppliers and trade show exhibitors.
4 Letter to shareholders

Global Sources’ unique user interface provides the most content-rich row of search results in the industry. The “headline” features a primary buyer benefit and the search result also features an expandable product catalog and details about the suppliers credentials and capabilities.
Expanding our markets
For our export trade shows, we are focused on further penetrating the market including looking at opportunities in new verticals and for new trade shows. For example, ourElectronicsshows are a very strong franchise that we intend to continue developing. Booth sales for future shows are strong, and we have various expansion plans underway including launching a new show for theMobile and Wirelesscategory. In addition, we recently announced thatChina Sourcing Fairswill be launched in Jakarta, Indonesia later in 2014.
The domestic B2B market in mainland China is also an important growth opportunity where we will continue to develop existing properties and look for new opportunities. We have been steadily building our presence and plan to continue in this direction.
In recent years, much of our growth in the China domestic market has been driven by acquisitions. The most recent example was in 2013, when we entered into an agreement to acquire an interest in theShenzhen International Machinery Manufacturing Industry Exhibitionand its related shows, also called theSIMMevents. The 2014SIMMevents took place in March and featured more than 4,000 booths. These events give us a strong presence in the machinery industry, which is a large and growing market sector and one of the

The largestChina Sourcing Fairsare held each spring and fall in Hong Kong and regional shows are scheduled this year in Johannesburg, Sao Paulo, Miami and Jakarta.
Letter to shareholders 5

Trade shows for the China domestic B2B market encompass mobile & wireless, semiconductors, fashion, optoelectronics, and machinery.
strategic pillars of mainland China’s national economy. It is also the foundation of the manufacturing sector, supporting a wide scope of industrial production such as automobiles, computers and electronics.
Outlook
While we expect the challenging environment to continue in 2014, we have a very strong team and a long track record of uninterrupted profitability.
Our future opportunities are numerous and are based on the large and attractive markets around China’s exports and domestic B2B market. We have an excellent set of products and services upon which to build, and a large and influential customer base. In addition, our balance sheet gives us the flexibility to explore a wide variety of options to grow our business and strengthen our competitive position.
Since we became a public company in 2000, we have been recognized numerous times for our excellence in corporate operations. In 2013 we were recognized again, this time withThe Asset’sGold corporate award for excellence in management and corporate governance.
Finally, I want to thank our Chief Executive Officer Spenser Au, our Board of Directors, and all of our team members for their contributions. I also want to thank all of our customers for choosing Global Sources, and all of our shareholders for your continued support.
Sincerely,

Merle A. Hinrich
Executive Chairman
April, 2014
6 Letter to shareholders
Management
 | | Merle A. Hinrich, Executive Chairman
Mr. Hinrich has been a director since April 2000 and is currently our Executive Chairman. He was our Chief Executive officer from April 2000 to August 2011. A co-founder of the business, he was the principal executive officer of our predecessor company, Trade Media Holdings Limited, a Cayman Islands corporation wholly owned by us (“Trade Media”), from 1971 through 1993 and resumed that position in September 1999. From 1994 to August 1999, Mr. Hinrich was chairman of the ASM Group, which included Trade Media. Mr. Hinrich is a director of Trade Media and has also been the Chairman of the Board of Trade Media. Mr. Hinrich graduated from the University of Nebraska and the Thunderbird School of Global Management (“Thunderbird”). Mr. Hinrich is a founder and former chairman of the Society of Hong Kong Publishers. He is a member of the board of trustees of Thunderbird and is a board member of the Economic Strategy Institute. He is also an investment Promotion Ambassador with Invest Hong Kong and established the Hinrich Foundation with the mission of promoting sustainable global trade. His term as director expires in 2015. |
| | |
 | | Spenser Au, Chief Executive Officer
Mr. Au was appointed as our Chief Executive officer in August, 2011. Mr. Au first became a team member in 1978 as an account executive for Asian Sources Electronics magazine. The positions through which he advanced to senior management included regional sales manager in 1988, associate publisher in 1991, publisher in 1992 and president of Asian Sales in 1999. Mr. Au has a deep knowledge of Greater China and other markets where the company operates. Mr. Au received a Diploma in Business Management in 1977 from the Hong Kong Baptist University. |
| | |
 | | Brent Barnes, Chief Operating Officer
Mr. Barnes was appointed as our Chief Operating Officer in January 2012. Mr. Barnes is responsible for the company’s worldwide operations, including community development, content development, human resources and administration. Mr. Barnes began his career handling operations for a group of lobbyists in Austin, Texas. Later, he moved to Mexico City, where he designed and delivered training programs for executives at Ford Motor Co. and Mercedes-Benz. Upon completion of his MBA, Mr. Barnes spent a year working as a Market Analyst for Global Sources in Phoenix, Arizona before moving to Hong Kong to become Executive Assistant to the Chairman & CEO in June of 2000. Since 2003 he has spent time managing each of the core operational departments and assumed the role of General Manager of Content & Community Development in December 2009. Mr. Barnes holds a Bachelor of Arts degree from the University of Texas at Austin and an MBA from the Thunderbird School of Global Management. |
| | |
 | | Connie Lai, Chief Financial Officer
Ms. Lai was appointed as our Chief Financial Officer effective August 2010. Ms. Lai joined Global Sources in June 2007 as financial controller, Hong Kong & China. Prior to joining Global Sources, she was Chief Financial Officer and an Executive Director of HC International, Inc., a Hong Kong listed company. Earlier in her career, she spent over four years with PricewaterhouseCoopers (“PwC”) Hong Kong. Ms. Lai graduated from the Chinese University of Hong Kong with a bachelor’s degree in professional accountancy. She is also a Member of the Hong Kong Institute of Certified Public Accountants and a Fellow Member of the Association of Chartered Certified Accountants in the United Kingdom. |
| | |
 | | Peter Zapf, Chief Information Officer
Mr. Zapf was appointed as our Chief Information Officer in January 2012. Mr. Zapf began his career in software project management with the United States Air Force. He then joined Global Sources in Phoenix, Arizona, working on the development, sales and marketing of the company’s early software and e-commerce products. Later, he worked as a research analyst at Bear Stearns in New York, focusing on the business-to-business market, after which he joined Hong Kong-based AsiaCommerce, a startup incubator, as Chief Executive Officer. He rejoined Global Sources in 2001, and was Chief Operating Officer from January 2011 to December 2011. Mr. Zapf holds a BS in Electrical Engineering and Engineering and Public Policy from Carnegie Mellon University, an MS in Computer Science from Troy State University, and an MBA from Thunderbird, the American Graduate School of International Management. |
(Note: * indicates independent director)
Letter to shareholders 7
GLOBAL SOURCES LTD. AND SUBSIDIARIES
CONSOLIDATED FINANCIAL STATEMENTS
For the year ended December 31, 2013
| Contents | Page |
| | |
| Report of Independent Registered Public Accounting Firm | 9 |
| | |
| Consolidated Income Statements | 10 |
| | |
| Consolidated Statements of Comprehensive Income | 11 |
| | |
| Consolidated Balance Sheets | 12 |
| | |
| Consolidated Statements of Changes in Equity | 13 |
| | |
| Consolidated Statements of Cash Flows | 14 |
| | |
| Notes to the Consolidated Financial Statements | 15 - 52 |
| | |
| Report of Management on Internal Control Over Financial Reporting | 53 |
REPORT OF INDEPENDENT REGISTERED PUBLIC ACCOUNTING FIRM
To the Board of Directors and Shareholders
In our opinion, the accompanying consolidated balance sheets and the related consolidated income statements and statements of comprehensive income, changes in equity and cash flows present fairly, in all material respects, the financial position of Global Sources Ltd. (the ‘Company’) and its subsidiaries at December 31, 2013, and December 31, 2012 and the results of their operations and their cash flows for each of the three years ended December 31, 2013 in conformity with International Financial Reporting Standards as issued by the International Accounting Standards Board.
Also in our opinion, the Company maintained, in all material respects, effective internal control over financial reporting as at December 31, 2013, based on criteria established inInternal Control - Integrated Framework 1992issued by the Committee of Sponsoring Organizations of the Treadway Commission (COSO). The Company’s management is responsible for these financial statements, for maintaining effective internal control over financial reporting and for its assessment of the effectiveness of internal control over financial reporting, included in the accompanying Report of Management on Internal Control over Financial Reporting.
Our responsibility is to express opinions on these financial statements and on the Company’s internal control over financial reporting based on our integrated audits. We conducted our audits in accordance with the standards of the Public Company Accounting Oversight Board (United States). Those standards require that we plan and perform the audits to obtain reasonable assurance about whether the financial statements are free of material misstatement and whether effective internal control over financial reporting was maintained in all material respects. Our audits of the financial statements included examining, on a test basis, evidence supporting the amounts and disclosures in the financial statements, assessing the accounting principles used and significant estimates made by management, and evaluating the overall financial statement presentation. Our audit of internal control over financial reporting included obtaining an understanding of internal control over financial reporting, assessing the risk that a material weakness exists, and testing and evaluating the design and operating effectiveness of internal control based on the assessed risk. Our audits also included performing such other procedures as we considered necessary in the circumstances. We believe that our audits provide a reasonable basis for our opinions.
A company’s internal control over financial reporting is a process designed to provide reasonable assurance regarding the reliability of financial reporting and the preparation of financial statements for external purposes in accordance with generally accepted accounting principles. A company’s internal control over financial reporting includes those policies and procedures that (i) pertain to the maintenance of records that, in reasonable detail, accurately and fairly reflect the transactions and dispositions of the assets of the company; (ii) provide reasonable assurance that transactions are recorded as necessary to permit preparation of financial statements in accordance with generally accepted accounting principles, and that receipts and expenditures of the company are being made only in accordance with authorizations of management and directors of the company; and (iii) provide reasonable assurance regarding prevention or timely detection of unauthorized acquisition, use, or disposition of the company’s assets that could have a material effect on the financial statements.
Because of its inherent limitations, internal control over financial reporting may not prevent or detect misstatements. Also, projections of any evaluation of effectiveness to future periods are subject to the risk that controls may become inadequate because of changes in conditions, or that the degree of compliance with the policies or procedures may deteriorate.
/s/ PricewaterhouseCoopers LLP
Singapore
April 2, 2014
GLOBAL SOURCES LTD. AND SUBSIDIARIES
CONSOLIDATED INCOME STATEMENTS
(In U.S. Dollars Thousands, Except Number of Shares and Per Share Data)
| | | Year Ended December 31, |
| | | 2013 | | 2012 | | 2011 |
| Revenue: | | | | | | | | | | | | |
| Online and other media services | | $ | 104,629 | | | $ | 136,101 | | | $ | 141,475 | |
| Exhibitions | | | 85,636 | | | | 88,782 | | | | 77,973 | |
| Miscellaneous | | | 7,257 | | | | 6,857 | | | | 5,617 | |
| | | | 197,522 | | | | 231,740 | | | | 225,065 | |
| Operating Expenses: | | | | | | | | | | | | |
| Sales | | | 61,958 | | | | 80,354 | | | | 81,363 | |
| Event production | | | 24,403 | | | | 26,250 | | | | 24,637 | |
| Community and content | | | 27,481 | | | | 32,696 | | | | 34,078 | |
| General and administrative | | | 50,272 | | | | 44,281 | | | | 40,660 | |
| Information and technology | | | 12,729 | | | | 13,188 | | | | 12,607 | |
| Total Operating Expenses | | | 176,843 | | | | 196,769 | | | | 193,345 | |
| Profit on sale of property | | | 15,410 | | | | - | | | | - | |
| Profit from Operations | | | 36,089 | | | | 34,971 | | | | 31,720 | |
| Interest income | | | 1,472 | | | | 1,044 | | | | 360 | |
| Share of loss of associate | | | - | | | | (24 | ) | | | - | |
| Gain on sale of available-for-sale securities | | | 64 | | | | - | | | | - | |
| Impairment loss on investment in associate | | | - | | | | (302 | ) | | | - | |
| Profit before income taxes | | | 37,625 | | | | 35,689 | | | | 32,080 | |
| Income tax expense | | | (4,753 | ) | | | (2,744 | ) | | | (1,613 | ) |
| Net profit | | | 32,872 | | | | 32,945 | | | | 30,467 | |
| Net profit attributable to non-controlling interests | | | (137 | ) | | | (739 | ) | | | (991 | ) |
| Net profit attributable to the Company’s shareholders | | $ | 32,735 | | | $ | 32,206 | | | $ | 29,476 | |
| Basic net profit per share attributable to the Company’s shareholders | | $ | 0.95 | | | $ | 0.95 | | | $ | 0.87 | |
| Shares used in basic net profit per share calculations | | | 34,426,468 | | | | 34,017,730 | | | | 33,742,648 | |
| Diluted net profit per share attributable to the Company’s shareholders | | $ | 0.91 | | | $ | 0.90 | | | $ | 0.83 | |
| Shares used in diluted net profit per share calculations | | | 36,068,326 | | | | 35,742,495 | | | | 35,385,218 | |
The notes on pages 15 to 52 are an integral part of these consolidated financial statements.
GLOBAL SOURCES LTD. AND SUBSIDIARIES
CONSOLIDATED STATEMENTS OF COMPREHENSIVE INCOME
(In U.S. Dollars Thousands, Except Number of Shares and Per Share Data)
| | | Year ended December 31, |
| | | 2013 | | 2012 | | 2011 |
| Net profit | | $ | 32,872 | | | $ | 32,945 | | | $ | 30,467 | |
Other comprehensive income that may be reclassified
subsequently to profit or loss: | | | | | | | | | | | | |
| Currency translation differences arising from consolidation | | | 3,170 | | | | 1,623 | | | | 3,212 | |
| Financial assets, available-for-sale: | | | | | | | | | | | | |
| Fair value gains | | | 61 | | | | 52 | | | | - | |
| Reclassification to income statements on disposal | | | (64 | ) | | | - | | | | - | |
| Other comprehensive income for the year, net of tax of $nil | | | 3,167 | | | | 1,675 | | | | 3,212 | |
| Total comprehensive income for the year | | | 36,039 | | | | 34,620 | | | | 33,679 | |
| Total comprehensive income attributable to the Company’s shareholders | | | 35,806 | | | | 33,812 | | | | 32,573 | |
| Total comprehensive income attributable to non-controlling interests | | | 233 | | | | 808 | | | | 1,106 | |
| Total comprehensive income for the year | | $ | 36,039 | | | $ | 34,620 | | | $ | 33,679 | |
The notes on pages 15 to 52 are an integral part of these consolidated financial statements.
GLOBAL SOURCES LTD. AND SUBSIDIARIES
CONSOLIDATED BALANCE SHEETS
(In U.S. Dollars Thousands, Except Number of Shares and Per Share Data)
| | | As at December 31, |
| | | | 2013 | | | | 2012 | |
| ASSETS | | | | | | | | |
| | | | | | | | | |
| Current assets: | | | | | | | | |
| Cash and cash equivalents | | $ | 137,359 | | | $ | 104,631 | |
| Term deposits with banks | | | 106 | | | | 4,184 | |
| Financial assets, available-for-sale | | | 6,367 | | | | 7,472 | |
| Accounts receivables, net | | | 3,122 | | | | 4,242 | |
| Receivables from sales representatives | | | 10,630 | | | | 7,773 | |
| Inventories | | | 266 | | | | 410 | |
| Prepaid expenses and other current assets | | | 18,544 | | | | 18,396 | |
| | | | 176,394 | | | | 147,108 | |
| Non-current assets: | | | | | | | | |
| Property and equipment | | | 49,701 | | | | 30,442 | |
| Investment properties | | | 89,615 | | | | 97,377 | |
| Intangible assets | | | 21,423 | | | | 33,136 | |
| Long term investment | | | 100 | | | | 100 | |
| Deferred income tax assets | | | 98 | | | | 244 | |
| Other non-current assets | | | 1,766 | | | | 2,762 | |
| | | | 162,703 | | | | 164,061 | |
| Total assets | | $ | 339,097 | | | $ | 311,169 | |
| | | | | | | | | |
| LIABILITIES AND SHAREHOLDERS’ EQUITY | | | | | | | | |
| Current liabilities: | | | | | | | | |
| Accounts payable | | $ | 8,779 | | | $ | 12,531 | |
| Deferred income and customer prepayments | | | 84,704 | | | | 84,540 | |
| Accrued liabilities | | | 19,166 | | | | 20,409 | |
| Income taxes liabilities | | | 2,635 | | | | 1,225 | |
| | | | | | | | | |
| Non-current liabilities: | | | 115,284 | | | | 118,705 | |
| Deferred income and customer prepayments | | | 5,660 | | | | 9,062 | |
| Deferred income tax liabilities | | | 4,591 | | | | 6,090 | |
| | | | 10,251 | | | | 15,152 | |
| Total liabilities | | | 125,535 | | | | 133,857 | |
| | | | | | | | | |
| Commitments and contingencies (note 25 and 26) | | | | | | | | |
| | | | | | | | | |
| Equity attributable to Company’s shareholders: | | | | | | | | |
| Common shares | | | 525 | | | | 521 | |
| Treasury shares | | | (150,089 | ) | | | (150,089 | ) |
| Other reserves | | | 161,950 | | | | 156,629 | |
| Retained earnings | | | 191,594 | | | | 158,859 | |
| Total Company shareholders’ equity | | | 203,980 | | | | 165,920 | |
| Non-controlling interests | | | 9,582 | | | | 11,392 | |
| Total equity | | $ | 213,562 | | | $ | 177,312 | |
| Total liabilities and equity | | $ | 339,097 | | | $ | 311,169 | |
The notes on pages 15 to 52 are an integral part of these consolidated financial statements.
GLOBAL SOURCES LTD. AND SUBSIDIARIES
CONSOLIDATED STATEMENTS OF CHANGES IN EQUITY
(In U.S. Dollars Thousands, Except Number of Shares and Per Share Data)
| | | Attributable to Company’s shareholders | | | | |
| | | | | | | | | | | | | Non- | | |
| | | Common | | Treasury | | Other | | Retained | | | | controlling | | Total |
| | | shares | | shares | | reserves | | earnings | | Total | | interests | | equity |
| Balance at January 1, 2011 | | $ | 516 | | | $ | (150,089 | ) | | $ | 146,691 | | | $ | 97,177 | | | $ | 94,295 | | | $ | 8,165 | | | $ | 102,460 | |
| Total comprehensive income for the year | | | - | | | | - | | | | 3,097 | | | | 29,476 | | | | 32,573 | | | | 1,106 | | | | 33,679 | |
| Transaction with owners: | | | | | | | | | | | | | | | | | | | | | | | | | | | | |
| Dividend issued by a subsidiary to non-controlling interest | | | - | | | | - | | | | - | | | | - | | | | - | | | | (390 | ) | | | (390 | ) |
| Fair value of non-cash compensation expense | | | - | | | | - | | | | 2,777 | | | | - | | | | 2,777 | | | | - | | | | 2,777 | |
| Capitalization of intangible assets relating to share grants for non-compete agreements | | | - | | | | - | | | | 28 | | | | - | | | | 28 | | | | - | | | | 28 | |
| Issue of new shares | | | 2 | | | | - | | | | (2 | ) | | | - | | | | - | | | | - | | | | - | |
| Balance at December 31, 2011 | | $ | 518 | | | $ | (150,089 | ) | | $ | 152,591 | | | $ | 126,653 | | | $ | 129,673 | | | $ | 8,881 | | | $ | 138,554 | |
| Total comprehensive income for the year | | | - | | | | - | | | | 1,606 | | | | 32,206 | | | | 33,812 | | | | 808 | | | | 34,620 | |
| Transaction with owners: | | | | | | | | | | | | | | | | | | | | | | | | | | | | |
| Fair value of non-controlling interest in business acquisition | | | - | | | | - | | | | - | | | | - | | | | - | | | | 3,006 | | | | 3,006 | |
| Dividend issued by subsidiaries to non-controlling interests | | | - | | | | - | | | | - | | | | - | | | | - | | | | (1,303 | ) | | | (1,303 | ) |
| Fair value of non-cash compensation expense | | | - | | | | - | | | | 2,409 | | | | - | | | | 2,409 | | | | - | | | | 2,409 | |
| Capitalization of intangible assets relating to share grants for non-compete agreements | | | - | | | | - | | | | 26 | | | | - | | | | 26 | | | | - | | | | 26 | |
| Issue of new shares | | | 3 | | | | - | | | | (3 | ) | | | - | | | | - | | | | - | | | | - | |
| Balance at December 31, 2012 | | $ | 521 | | | $ | (150,089 | ) | | $ | 156,629 | | | $ | 158,859 | | | $ | 165,920 | | | $ | 11,392 | | | $ | 177,312 | |
| Total comprehensive income for the year | | | - | | | | - | | | | 3,071 | | | | 32,735 | | | | 35,806 | | | | 233 | | | | 36,039 | |
| Transaction with owners: | | | | | | | | | | | | | | | | | | | | | | | | | | | | |
| Dividend issued by subsidiaries to non-controlling interests | | | - | | | | - | | | | - | | | | - | | | | - | | | | (2,043 | ) | | | (2,043 | ) |
| Fair value of non-cash compensation expense | | | - | | | | - | | | | 2,170 | | | | - | | | | 2,170 | | | | - | | | | 2,170 | |
| Capitalization of intangible assets relating to share grants for non-compete agreements | | | - | | | | - | | | | 84 | | | | - | | | | 84 | | | | - | | | | 84 | |
| Issue of new shares | | | 4 | | | | - | | | | (4 | ) | | | - | | | | - | | | | - | | | | - | |
| Balance at December 31, 2013 | | $ | 525 | | | $ | (150,089 | ) | | $ | 161950 | | | $ | 191,594 | | | $ | 203,980 | | | $ | 9,582 | | | $ | 213,562 | |
The notes on pages 15 to 52 are an integral part of these consolidated financial statements.
GLOBAL SOURCES LTD. AND SUBSIDIARIES
CONSOLIDATED STATEMENTS OF CASH FLOWS
(In U.S. Dollars Thousands, Except Number of Shares and Per Share Data)
| | | Year Ended December 31, |
| | | 2013 | | 2012 | | 2011 |
| Cash flows from operating activities: | | | | | | | | | | | | |
| Net Profit | | $ | 32,872 | | | $ | 32,945 | | | $ | 30,467 | |
| Adjustments for: | | | | | | | | | | | | |
| Income tax expense | | | 4,753 | | | | 2,744 | | | | 1,613 | |
| Depreciation and amortization | | | 9,029 | | | | 9,112 | | | | 6,785 | |
| (Profit)/loss on sale of property and equipment and investment property | | | (15,410 | ) | | | (6 | ) | | | 12 | |
| Gain on sale of available-for-sale securities | | | (64 | ) | | | - | | | | - | |
| Interest income | | | (1,472 | ) | | | (1,044 | ) | | | (360 | ) |
| Provision for impairment of receivables | | | 30 | | | | 229 | | | | 25 | |
| Non-cash compensation expense | | | 2,170 | | | | 2,409 | | | | 2,777 | |
| Equipment written off | | | 65 | | | | 48 | | | | 5 | |
| Share of loss of associate | | | - | | | | 24 | | | | - | |
| Impairment loss on investment in associate | | | - | | | | 302 | | | | - | |
| Impairment of intangible assets | | | 8,525 | | | | 1,389 | | | | 670 | |
| Net foreign exchange differences | | | (15 | ) | | | (12 | ) | | | 87 | |
| Changes in working capital (excluding the effects of acquisition and exchange differences on consolidation): | | | | | | | | | | | | |
| Accounts receivable | | | 1,106 | | | | 264 | | | | (325 | ) |
| Receivables from sales representatives | | | (2,880 | ) | | | (1,251 | ) | | | 1,716 | |
| Inventories | | | 144 | | | | (180 | ) | | | 205 | |
| Prepaid expenses and other current assets | | | (171 | ) | | | 2,528 | | | | (379 | ) |
| Other non-current assets | | | 990 | | | | (204 | ) | | | 21 | |
| Accounts payable | | | 594 | | | | 464 | | | | (2,008 | ) |
| Accrued liabilities | | | (1,202 | ) | | | 2,337 | | | | 2,984 | |
| Deferred income and customer prepayments | | | (3,299 | ) | | | (18,142 | ) | | | 12,592 | |
| Cash generated from operations | | | 35,765 | | | | 33,956 | | | | 56,887 | |
| Income tax paid | | | (4,710 | ) | | | (2,679 | ) | | | (1,656 | ) |
| Net cash generated from operating activities | | | 31,055 | | | | 31,277 | | | | 55,231 | |
| Cash flows from investing activities: | | | | | | | | | | | | |
| Acquisition of subsidiary, net of cash acquired | | | (4,387 | ) | | | (11,359 | ) | | | (3,423 | ) |
| Investment in associate | | | - | | | | (326 | ) | | | - | |
| Purchase of property and equipment and investment property | | | (27,047 | ) | | | (1,371 | ) | | | (56,667 | ) |
| Proceeds from sale of property and equipment and investment property, net of transaction costs | | | 27,907 | | | | 6 | | | | 12 | |
| Placement of term deposits with banks | | | (1,762 | ) | | | (5,012 | ) | | | (3,526 | ) |
| Proceeds from matured term deposits with banks | | | 5,840 | | | | 3,632 | | | | 2,198 | |
| Purchase of available-for-sale financial assets | | | (63 | ) | | | (12,611 | ) | | | (18,247 | ) |
| Proceeds from sale of available-for-sale securities | | | 1,294 | | | | 18,441 | | | | 4,999 | |
| Interest received | | | 1,472 | | | | 1,004 | | | | 334 | |
| Net cash generated from (used in) investing activities | | | 3,254 | | | | (7,596 | ) | | | (74,320 | ) |
| Cash flows from financing activities: | | | | | | | | | | | | |
| Dividend paid to non-controlling interest | | | (2,043 | ) | | | (1,303 | ) | | | (390 | ) |
| Net cash used in financing activities | | | (2,043 | ) | | | (1,303 | ) | | | (390 | ) |
| Net increase (decrease) in cash and cash equivalents | | | 32,266 | | | | 22,378 | | | | (19,479 | ) |
| Cash and cash equivalents, beginning of the year | | | 104,631 | | | | 81,903 | | | | 101,298 | |
| Effect of exchange rate changes on cash and cash equivalents | | | 462 | | | | 350 | | | | 84 | |
| Cash and cash equivalents, end of the year | | $ | 137,359 | | | $ | 104,631 | | | $ | 81,903 | |
The notes on pages 15 to 52 are an integral part of these consolidated financial statements.
GLOBAL SOURCES LTD. AND SUBSIDIARIES
NOTES TO THE CONSOLIDATED FINANCIAL STATEMENTS
(In U.S. Dollars Thousands, Except Number of Shares and Per Share Data)
Global Sources Ltd. (the ‘Company’) and its subsidiaries’ (together ‘Group’) principal business is to provide services that allow global buyers to identify suppliers and products, and enable suppliers to market their products to a large number of buyers. The Group’s primary online service is creating and hosting marketing websites that present suppliers’ product and company information in a consistent, easily searchable manner on Global Sources Online. Complementing this service are various trade magazines. The Group launched China Sourcing Fairs exhibitions in 2003. These exhibitions offer international buyers direct access to China and other Asian manufacturers. The Group’s businesses are conducted primarily through Trade Media Limited, its wholly owned subsidiary, which was incorporated in October 1984 under the laws of Cayman Islands. Through certain other wholly owned subsidiaries, the Group also organizes China Sourcing Fairs exhibitions, conferences and exhibitions on technology related issues, licenses Asian Sources/Global Sources Online and offers catalog services.
The Company was incorporated in Bermuda. The Company’s registered office address is Canon’s Court, 22 Victoria Street, Hamilton, HM 12, Bermuda.
These financial statements were authorized for issue by the executive committee of the Board of Directors on April 2, 2014.
| 2. | Summary of significant accounting policies |
The principal accounting policies applied in the preparation of these consolidated financial statements are set out below. These policies have been consistently applied to all the years presented, unless otherwise stated.
The consolidated financial statements of Global Sources Ltd. have been prepared in accordance with International Financial Reporting Standards (‘IFRS’) and International Financial Reporting Interpretations Committee (‘IFRIC’) interpretations as issued by the International Accounting Standards Board (‘IASB’).
The consolidated financial statements have been prepared under the historical cost convention, except as disclosed in the accounting policies below.
The preparation of financial statements in conformity with IFRS requires the use of certain critical accounting estimates. It also requires management to exercise its judgment in the process of applying the Group’s accounting policies. The areas involving a higher degree of judgment or complexity, or areas where assumptions and estimates are significant to the consolidated financial statements are disclosed in note 4. Actual results could differ from those estimates and such differences could affect the results of operations reported in future periods.
New and amended standards adopted by the Group:
The following standards have been adopted by the Group for the first time from the financial year beginning on January 1, 2013:
| • | Amendment to IAS 1, ‘Financial statement presentation’ regarding other comprehensive income. The main change resulting from these amendments is a requirement for entities to group items presented in other comprehensive income on the basis of whether they are potentially reclassifiable to profit or loss subsequently. The adoption of this standard did not have a significant impact on the Group’s financial statements. |
| • | IFRS 10, ‘Consolidated financial statements’ builds on existing principles by identifying the concept of control as the determining factor in whether an entity should be included within the consolidated financial statements of the parent company. The standard provides additional guidance to assist in the determination of control where this is difficult to assess. The adoption of this standard did not have a significant impact on the Group’s financial statements. |
GLOBAL SOURCES LTD. AND SUBSIDIARIES
NOTES TO THE CONSOLIDATED FINANCIAL STATEMENTS
(In U.S. Dollars Thousands, Except Number of Shares and Per Share Data)
| • | IFRS 11 replaces the guidance on ‘Joint ventures’ in IAS 31 – Interests in Joint Ventures and SIC 13 – Jointly Controlled Entities – Non-Monetary Contributions by Venturers. The new standard introduces a principles- based approach to accounting for joint arrangements that requires a party to a joint arrangement to recognize its rights and obligations arising from the arrangement. The new standard requires that joint ventures be accounted for under the equity method thus eliminating the option to proportionally consolidate such ventures. There was no impact on the Group’s financial statements upon adoption. |
| • | IFRS 12, ‘Disclosures of interests in other entities’ includes the disclosure requirements for all forms of interests in other entities, including joint arrangements, associates, special purpose vehicles and other off balance sheet vehicles. The adoption of this standard did not result in a significant impact on the Group’s financial statements as it affects only the disclosures. None of the subsidiaries in the Group has non-controlling interests that are material to the Group as at and for the year ended December 31, 2013. |
| • | IFRS 13, ‘Fair value measurement’, aims to improve consistency and reduce complexity by providing a precise definition of fair value and a single source of fair value measurement and disclosure requirements for use across IFRSs. The requirements, which are largely aligned between IFRSs and US GAAP, do not extend the use of fair value accounting but provide guidance on how it should be applied where its use is already required or permitted by other standards within IFRSs or US GAAP. The adoption of this standard did not have a significant impact on the Group’s financial statements. |
The consolidated financial statements comprise the financial statements of the Company and its majority owned or otherwise controlled subsidiaries.
Subsidiaries are all entities (including structured entities) over which the Group has control. The Group controls an entity when the Group is exposed to, or has rights to, variable returns from its involvement with the entity and has the ability to affect those returns through its power over the entity. Subsidiaries are fully consolidated from the date on which control is transferred to the Group. They are deconsolidated from the date that control ceases.
The Group uses the acquisition method of accounting to account for business combinations. The consideration transferred for the acquisition of a subsidiary is the fair value of the assets transferred, the liabilities incurred and the equity interests issued by the Group. The consideration transferred includes the fair value of any asset or liability resulting from a contingent consideration arrangement. Acquisition-related costs are expensed as incurred. Identifiable assets acquired and liabilities and contingent liabilities assumed in a business combination are measured initially at their fair values at the acquisition date. On an acquisition-by-acquisition basis, the Group recognizes any non-controlling interest in the acquiree either at fair value or at the non-controlling interest’s proportionate share of the acquiree’s net assets.
The excess of the consideration transferred, the amount of any non-controlling interest in the acquiree and the acquisition-date fair value of any previous equity interest in the acquiree over the fair value of the Group’s share of the identifiable net assets acquired is recorded as goodwill. If this is less than the fair value of the net assets of the subsidiary acquired in the case of a bargain purchase, the difference is recognized directly in the consolidated income statement.
Investments in subsidiaries are accounted for at cost less impairment by the Company. Cost is adjusted to reflect changes in consideration arising from contingent consideration amendments. Cost also includes direct attributable costs of investment.
| (b) Transactions with non-controlling interests |
The Group treats transactions with non-controlling interests as transactions with equity owners of the Group. For purchases from non-controlling interests, the difference between any consideration paid and the relevant share
GLOBAL SOURCES LTD. AND SUBSIDIARIES
NOTES TO THE CONSOLIDATED FINANCIAL STATEMENTS
(In U.S. Dollars Thousands, Except Number of Shares and Per Share Data)
acquired of the carrying value of net assets of the subsidiary is recorded in equity. Gains or losses on disposals to non-controlling interests are also recorded in equity.
When the Group ceases to have control or significant influence, any retained interest in the entity is re-measured to its fair value, with the change in carrying amount recognized in the consolidated income statement.
Associates are all entities over which the Group has significant influence but not control, generally accompanying a shareholding of between 20% and 50% of the voting rights. Investments in associates are accounted for using the equity method of accounting. Under the equity method, the investment is initially recognized at cost, and the carrying amount is increased or decreased to recognize the investor’s share of the profit or loss of the investee after the date of acquisition. The Group’s investment in associates includes goodwill identified on acquisition. The Group’s share of post-acquisition profit or loss is recognized in the consolidated income statement, and its share of post-acquisition movements in other comprehensive income is recognized in other comprehensive income with a corresponding adjustment to the carrying amount of the investment.
The Group determines at each reporting date whether there is any objective evidence that the investment in the associate is impaired. If this is the case, the Group calculates the amount of impairment as the difference between the recoverable amount of the associate and its carrying value and recognizes the amount adjacent to ’share of loss of associate’, on the face of the consolidated income statement.
Operating segments are reported in a manner consistent with the internal reporting provided to chief operating decision-maker, which is the Company’s Board of Directors. The chief operating decision maker assesses the Group’s performance and makes decisions about resources to be allocated to each segment.
| 2.4 Foreign currency translation |
| | (a) Functional and presentation currency |
Items included in the financial statements of each of the Group’s entities are measured using the currency of the primary economic environment in which the entity operates (‘the functional currency’). The Company’s functional currency is United States dollar (’$’ or ‘USD’). The consolidated financial statements are presented in USD, which is the Group’s presentation currency.
| | (b) Transactions and balances |
Transactions in currencies other than the functional currency are measured and recorded in the functional currency using the exchange rate in effect on the date of the transaction. As at the balance sheet date, monetary assets and liabilities that are denominated in currencies other than the functional currency are translated using the exchange rate at the balance sheet date. All gains and losses arising from foreign currency transactions and translation of foreign currency denominated accounts are recognized in the consolidated income statement.
Non-monetary items measured at fair values in foreign currencies are translated using the exchange rates at the date when the fair values are determined.
The financial statements of the subsidiaries reported in their respective local currencies are translated into USD for consolidation as follows:
| (i) | assets and liabilities at the closing exchange rate as at the balance sheet date, |
| (ii) | shareholders’ equity at the historical rates of exchange, |
GLOBAL SOURCES LTD. AND SUBSIDIARIES
NOTES TO THE CONSOLIDATED FINANCIAL STATEMENTS
(In U.S. Dollars Thousands, Except Number of Shares and Per Share Data)
| (iii) | income and expense amounts at the average monthly exchange rates (unless this average is not a reasonable approximation of the cumulative effect of the rates prevailing on the transaction dates, in which case income and expenses are translated at the rate on the dates of the transactions), |
| (iv) | all resulting translation differences are recorded in other comprehensive income and accumulated in ‘currency translation reserve’ within equity. |
Goodwill and fair value adjustments arising on the acquisition of foreign operations on or after January 1, 2009 (the Group’s date of transition to IFRS) are treated as assets and liabilities of the foreign operations and translated at the closing rates at the reporting date.
| | 2.5 Property and equipment |
Property and equipment are stated at cost less accumulated depreciation and accumulated impairment losses (note 2.8). Cost represents the purchase price of the asset and other costs incurred to bring the asset into its existing use. Subsequent costs are included in the asset’s carrying amount or recognized as a separate asset, as appropriate, only when it is probable that future economic benefits associated with the item will flow to the Group and the cost of the item can be measured reliably. The carrying amount of the replaced part is derecognized. All other repairs and maintenance are charged to the consolidated income statement during the year in which they are incurred.
Depreciation on property and equipment is calculated on a straight-line basis over their estimated useful lives as follows:
| Buildings | | Over the remaining lease period
or 50 years, whichever is shorter |
| Leasehold improvements | | 5 years |
| Computer equipment and software | | 3 years |
| Fixtures, fittings and office equipment | | 5 years |
| Reusable trade show booths | | 2 years |
| Motor vehicles | | 5 years |
No depreciation was recognized for capital work-in-progress.
The assets’ residual values and useful lives are reviewed, and adjusted if appropriate, at the end of each reporting period. Gains and losses on disposals are determined by comparing the proceeds with the carrying amount and are recognized in the consolidated income statement.
| | 2.6 Investment properties |
Investment properties include those portions of buildings that are held either to earn rental income or capital appreciation or both in the short to medium term. The portions of building and its associated land use rights are, together, classified as investment property if the components are not separable. Investment properties are initially recognized at cost and subsequently carried at cost less accumulated depreciation and accumulated impairment losses. The assets’ residual values and useful lives are reviewed, and adjusted if appropriate, at the end of each reporting period. Depreciation is calculated using a straight line method to allocate the depreciable amounts over the estimated lives of 50 years or over the remaining lease period whichever is shorter. Gains and losses on disposals are determined by comparing the proceeds with the carrying amount and are recognized in the consolidated income statement.
Transfers to, or from, investment properties are made when there is a change in the Company’s intention with respect to the use of the property.
GLOBAL SOURCES LTD. AND SUBSIDIARIES
NOTES TO THE CONSOLIDATED FINANCIAL STATEMENTS
(In U.S. Dollars Thousands, Except Number of Shares and Per Share Data)
Goodwill on acquisition of subsidiaries on or after January 1, 2009 (the Group’s date of transition to IFRS) represents the excess of the consideration transferred, the amount of any non-controlling interest in the acquiree and the acquisition date fair value of any previous equity interest in the acquiree over the fair value of the net identifiable assets acquired. Goodwill on acquisitions of subsidiaries is included in ‘intangible assets’. Goodwill is carried at cost less accumulated impairment losses. Impairment losses on goodwill are not reversed. Gains and losses on the disposal of an entity include the carrying amount of goodwill relating to the entity sold.
Goodwill is allocated to cash-generating units (CGU) for the purpose of impairment testing. The allocation is made to those CGUs or groups of CGUs that are expected to benefit from the business combination in which the goodwill arose, identified according to operating segment.
Trademarks acquired in a business combination are recognized at fair value at the acquisition date. Trademarks have a finite useful life and are carried at cost less accumulated amortization. Amortization is calculated using the straight-line method over their estimated useful lives of 6 to 14 years. The useful lives are reviewed, and adjusted if appropriate, at the end of each reporting period. The Group has reviewed the useful life of intangible asset and the change in useful life is disclosed under note 13.
| | (c) Contractual backlog and others |
Contractual backlog and others acquired in a business combination mainly relates to customer relationships which are recognized at fair value at the acquisition date. The contractual customer relationships have a finite useful life and are carried at cost less accumulated amortization. Amortization is calculated using the straight-line method over the expected life of the customer relationship of 5 to 12 months.
The databases acquired are measured on initial recognition at cost being the fair value as at the date of acquisition. Following initial recognition, databases are carried at cost less any accumulated amortization and any accumulated impairment losses. Databases are amortized over a period of one year beginning on the date of acquisition. The amortization expense on databases is recognized in the consolidated income statement.
| | (e) Non-compete agreements |
Intangible assets relating to non-compete agreements with the Group’s former employees and consultants and to the former employees of third party service providers are recorded at fair values at the date the respective agreements are entered into and are carried at cost less accumulated amortization. Amortization is calculated using a straight-line basis over the non-compete period of 5 years. The fair values are estimated based on the cash flow valuation model whereby valuation inputs include an estimate of future cash flows expected to be generated by the asset (note 2.15 (b)).
| | 2.8 Impairment of non-financial assets |
Assets that have an indefinite useful life – for example, goodwill, are not subject to amortization and are tested at least annually for impairment or more frequently if events or changes in circumstances indicate a potential impairment. Assets that are subject to amortization are reviewed for impairment whenever events or changes in circumstances indicate that the carrying amount may not be recoverable. An impairment loss is recognized for the amount by which the asset’s carrying amount exceeds its recoverable amount. The recoverable amount is the higher of an asset’s fair value less costs to sell and value in use. For the purposes of assessing impairment, assets are grouped at the lowest levels for which there are separately identifiable cash flows (cash-generating units). Non-financial assets other than goodwill that suffered impairment are reviewed for possible reversal of the impairment at each reporting date.
GLOBAL SOURCES LTD. AND SUBSIDIARIES
NOTES TO THE CONSOLIDATED FINANCIAL STATEMENTS
(In U.S. Dollars Thousands, Except Number of Shares and Per Share Data)
2.9.1 Classification
The Group classifies its financial assets in the following categories: loans and receivables, and available-for-sale. The classification depends on the purpose for which the financial assets were acquired. Management determines the classification of its financial assets at initial recognition.
(a) Loans and receivables
Loans and receivables are non-derivative financial assets with fixed or determinable payments that are not quoted in an active market. They are included in current assets, except for maturities greater than 12 months after the end of the reporting period, which are classified as non-current assets. The Group’s loans and receivables comprise ‘accounts receivables’, ‘receivables from sales representatives’, ‘term deposits with banks’, ‘cash and cash equivalents’ and assets other than ‘prepaid expenses’, ‘deferred expenses’ and ‘club memberships’ included in the ‘prepaid expenses and other current assets’ and ‘other non-current assets’ in the balance sheet.
(b) Financial assets, available-for-sale
Financial assets, available-for-sale are non-derivatives that are either designated in this category or not classified as loans and receivables, held-to-maturity investments or financial assets at fair value through profit or loss. They are included in non-current assets unless the investment matures or management intends to dispose of it within 12 months of the end of the reporting period.
2.9.2 Recognition and measurement
Regular purchases and sales of financial assets are recognized on the trade-date – the date on which the Group commits to purchase or sell the asset. Investments are initially recognized at fair value plus transaction costs. Financial assets are derecognized when the rights to receive cash flows from the investments have expired or have been transferred and the Group has transferred substantially all risks and rewards of ownership. Available- for-sale financial assets are subsequently carried at fair value. Loans and receivables are subsequently carried at amortized cost using the effective interest method, less provision for impairment. A provision for impairment is established when there is objective evidence that the Group will not be able to collect all amounts due according to the original terms of the receivables (note 2.9.3).
Changes in the fair value of available-for-sale securities are recognized in other comprehensive income and accumulated in ‘fair value reserve’ within equity.
When securities classified as available-for-sale are sold or impaired, the accumulated fair value adjustments recognized in equity are included in the consolidated income statement.
Interest on available-for-sale securities calculated using the effective interest method is recognized in the consolidated income statement.
Investment in equity instruments that do not have a quoted market price in an active market and whose fair values cannot be reliably measured are measured at cost less provision for impairment in value.
2.9.3 Impairment of financial assets
The Group assesses at the end of each reporting period whether there is objective evidence that a financial asset or a group of financial assets is impaired. A financial asset or a group of financial assets is impaired and impairment losses are incurred only if there is objective evidence of impairment as a result of one or more events that occurred after the initial recognition of the asset (a ‘loss event’) and that loss event (or events) has an impact on the estimated future cash flows of the financial asset or group of financial assets that can be reliably estimated.
The criteria that the Group uses to determine that there is objective evidence of an impairment loss include:
GLOBAL SOURCES LTD. AND SUBSIDIARIES
NOTES TO THE CONSOLIDATED FINANCIAL STATEMENTS
(In U.S. Dollars Thousands, Except Number of Shares and Per Share Data)
| • | significant financial difficulty of the issuer or obligor; |
| • | a breach of contract, such as a default or delinquency in interest or principal payments; |
| • | the Group, for economic or legal reasons relating to the borrower’s financial difficulty, granting to the borrower a concession that the lender would not otherwise consider; |
| • | it becomes probable that the borrower will enter bankruptcy or other financial reorganization; |
| • | the disappearance of an active market for that financial asset because of financial difficulties; or |
| • | observable data indicating that there is a measurable decrease in the estimated future cash flows from a portfolio of financial assets since the initial recognition of those assets, although the decrease cannot yet be identified with the individual financial assets in the portfolio. |
For loans and receivables, the Group estimates the collectability of the trade receivables based on the analysis of trade receivables, historical bad debts, customer credit-worthiness and current economic trends and maintains adequate impairment allowance. The amount of allowance is the difference between the receivables’ carrying amount and the present value of estimated future cash flows, discounted at the original effective interest rate. The carrying amount of the receivables is reduced through the use of an allowance account, and the amount of the loss is recognized in the consolidated income statement. When a receivable is uncollectible, it is written off against the allowance account for receivables. Subsequent recoveries of amounts previously written off are credited to the consolidated income statement.
In the case of equity investments classified as available-for-sale, a significant or prolonged decline in the fair value of the security below its cost is also evidence that the assets are impaired. If any such evidence exists for available-for-sale financial assets, the cumulative loss – measured as the difference between the acquisition cost and the current fair value, less any impairment loss on that financial asset previously recognized in profit or loss – is removed from equity and recognized in the consolidated income statement. Impairment losses recognized in the consolidated income statement on equity instruments are not reversed through the consolidated income statement. If, in a subsequent period, the fair value of a debt instrument classified as available for sale increases and the increase can be objectively related to an event occurring after the impairment loss was recognized in the consolidated income statement, the impairment loss is reversed through the consolidated income statement.
2.9.4 Offsetting financial instruments
Financial assets and liabilities are offset and the net amount reported in the balance sheet when there is a legally enforceable right to offset the recognized amounts and there is an intention to settle on a net basis or realize the asset and settle the liability simultaneously.
2.10 Inventories
Inventories are stated at the lower of cost and net realizable value. Cost is determined on the first-in, first-out basis. Cost includes the purchase cost and the delivery costs incurred in bringing the inventory to the warehouse. Net realizable value is the estimated selling price in the ordinary course of business, less applicable variable selling expenses.
2.11 Cash and cash equivalents
In the consolidated statements of cash flows, cash and cash equivalents includes cash in hand, deposits held at call with banks and other short-term highly liquid investments with original maturities of three months or less with insignificant risk of change in value.
2.12 Share capital
Ordinary shares are classified as equity. Incremental costs directly attributable to the issue of new ordinary shares are shown in equity as a deduction, net of tax, from the proceeds.
GLOBAL SOURCES LTD. AND SUBSIDIARIES
NOTES TO THE CONSOLIDATED FINANCIAL STATEMENTS
(In U.S. Dollars Thousands, Except Number of Shares and Per Share Data)
Where any group company purchases the Company’s equity share capital (treasury shares), the consideration paid, including any directly attributable incremental costs (net of income taxes) is deducted from equity attributable to the Company’s equity holders until the shares are cancelled or reissued. Where such ordinary shares are subsequently reissued, any consideration received, net of any directly attributable incremental transaction costs and the related income tax effects, is included in equity attributable to the Company’s equity holders.
2.13 Current and deferred income tax
The tax expense for the period comprises current and deferred tax. Tax is recognized in the income statement, except to the extent that it relates to items recognized in other comprehensive income or directly in equity. In this case, the tax is also recognized in other comprehensive income or directly in equity, respectively.
The current income tax charge is calculated on the basis of tax laws enacted or substantively enacted at the balance sheet date in the countries where the Company’s subsidiaries operate and generate taxable income. Management periodically evaluates positions taken in tax returns with respect to situations in which applicable tax regulation is subject to interpretation. It establishes provisions where appropriate on the basis of amounts expected to be paid to the tax authorities.
Deferred income tax is recognized, using the asset and liability method, on temporary differences arising between the tax bases of assets and liabilities and their carrying amounts in the consolidated financial statements. However, the deferred income tax is not accounted for if it arises from initial recognition of an asset or liability in a transaction other than a business combination that at the time of the transaction affects neither accounting nor taxable profit or loss. Deferred income tax is determined using tax rates (and laws) that have been enacted or substantively enacted by the balance sheet date and are expected to apply when the related deferred income tax asset is realized or the deferred income tax liability is settled.
Deferred income tax assets are recognized only to the extent that it is probable that future taxable profit will be available against which the temporary differences can be utilized.
Deferred income tax is provided on temporary differences arising on investments in subsidiaries, except where the timing of the reversal of the temporary difference is controlled by the Group and it is probable that the temporary difference will not reverse in the foreseeable future.
Deferred income tax assets and liabilities are offset when there is a legally enforceable right to offset current tax assets against current tax liabilities and when the deferred income taxes assets and liabilities relate to income taxes levied by the same taxation authority on either the same taxable entity or different taxable entities where there is an intention to settle the balances on a net basis.
2.14 Employee benefits
(a) Retirement contribution plans
Group companies operate a number of retirement contribution plans. The Group pays contributions to privately administered retirement contribution plans or government authorities on a mandatory, contractual or voluntary basis based on a percentage of each eligible employee’s salary. Employees working in a jurisdiction where there is no statutory provision for retirement contributions are covered by the Company’s plans. Once the contributions have been paid, the Group has no legal or constructive obligations to pay further contributions if the fund does not hold sufficient assets to pay all employees the benefits relating to employee service in the current and prior periods. The contributions are recognized as employee benefit expense when they are due.
2.15 Non-cash compensation expenses
(a) Share grants to employees and team members
The Group operates a number of equity-settled compensation plans, under which the Group receives services
GLOBAL SOURCES LTD. AND SUBSIDIARIES
NOTES TO THE CONSOLIDATED FINANCIAL STATEMENTS
(In U.S. Dollars Thousands, Except Number of Shares and Per Share Data)
from employees, and consultants and employees of third party service providers (collectively known as ‘team members’) as consideration for equity instruments of the Group. The Group’s employee and team member equity compensation plans are share grants without any exercise price or exercise period. Therefore, the fair value of the share grants at the date of grant approximates the intrinsic value. The fair value of the employee or team member services received in exchange for the grant of the shares is recognized as an expense in the income statement with a corresponding increase in ‘capital reserve’ within equity.
Non-market vesting conditions are included in assumptions about the number of share grants that are expected to vest. The total expense is recognized over the vesting period, which is the period over which all of the specified vesting conditions are to be satisfied. At the end of each reporting period, the entity revises its estimates of the number of shares that are expected to vest based on the non-market vesting conditions. It recognizes the impact of the revision to original estimates, if any, in the consolidated income statement, with a corresponding adjustment to equity.
The Group made share awards to its directors under The Global Sources Directors Share Grant Award Plan. These awards are share grants without any exercise price or exercise period. Therefore, the fair value of the share grants at the date of grant approximates the intrinsic value. The Group recognizes the compensation costs associated with share awards with cliff vesting to directors on a straight-line basis over the vesting period.
(b) Share grants for non-compete agreements
The Group issues share grants to former employees, and former consultants and the former employees of third party service providers when they resign or retire from their respective employment or consultancy service. Under these plans, the share grants vest over a five-year period with a percentage of shares vesting each year. The grantee is subject to the non-compete terms stipulated in the plan. There is no other vesting condition other than the non- compete terms.
Where the Group has the ability to enforce the non-compete agreement and the grantees are entitled to the shares, an intangible asset is recognized in relation to the non-compete provisions of these awards at the fair value of the respective award. The intangible asset is amortized over the non-compete period on a straight-line basis (note 2.7 (e)).
2.16 Revenue recognition
The Group derives its revenue from advertising fees in its published trade magazines and websites, sales of trade magazines and reports, fees from licensing its trade and service marks, and organizing exhibitions and business seminars.
Revenue comprises the fair value of the consideration received or receivable for the sale of goods and services in the ordinary course of the Group’s activities. Revenue is shown excluding value added taxes, net of discounts and after eliminating sales within the Group. The Group presents the sales taxes imposed on revenue generating transactions on a gross basis in ’sales costs’.
The Group recognizes revenue when the amount of revenue can be reliably measured, it is probable that future economic benefits will flow to the entity and when specific criteria have been met for each of the Group’s activities as described below.
Revenue from advertising in trade magazines and websites, net of discounts, are recognized ratably over the period in which the advertisement is displayed. Revenue from sales of trade magazines and reports is recognized upon delivery of the magazine/report. Magazine subscriptions received in advance are deferred and recognized as revenue upon delivery of the magazine. Revenue from organizing exhibitions and business seminars is recognized at the conclusion of the event and the related direct event production costs are deferred and recognized as expenses upon conclusion of the event. When multiple deliverables are contracted under a single arrangement, the Group allocates the total consideration to each unit of accounting based on its relative percentage of the total fair value
GLOBAL SOURCES LTD. AND SUBSIDIARIES
NOTES TO THE CONSOLIDATED FINANCIAL STATEMENTS
(In U.S. Dollars Thousands, Except Number of Shares and Per Share Data)
of all units of accounting included in the arrangement. Where the Group is unable to determine the fair value of each of the unit in an arrangement, total consideration is allocated by estimating the stand-alone selling price for one performance obligation if a directly observable price exists.
Barter transactions are recorded at the fair value of the merchandise or services received. Where the fair value of the merchandise or services received cannot be measured reliably, the revenue is measured at the fair value of the services rendered.
Rental income arising from operating leases on investment properties is recognized on a straight-line basis over the lease term. The aggregate costs of incentives provided to lessees are recognized as a reduction of rental income over the lease term on a straight-line basis.
Interest income is recognized using the effective interest method.
2.17 Leases
Leases in which a significant portion of the risks and rewards of ownership are retained by the lessor are classified as operating leases. The Group leases certain office facilities and exhibition venues under cancelable and non- cancellable operating leases, generally with an option to renew upon expiry of the lease term. Rentals under operating leases (net of any incentives received from the lessor) are expensed on a straight-line basis over the life of the leases.
2.18 Advertising Expenses
Advertising and promotion expenses are expensed as incurred.
2.19 Transactions with Sales Representatives
The Group utilizes sales representatives in various territories to promote the Group’s products and services. Under these arrangements, these sales representatives are entitled to commissions as well as marketing fees. Commission expenses are expensed as incurred. For online and other media services, the commission expense is incurred when the associated revenue is recognized or when the associated accounts receivable are paid, whichever is earlier. For exhibitions, the commission expense is incurred when the associated revenue is recognized, upon conclusion of the event.
These third party sales representatives, which are mainly corporate entities, handle collections from clients on behalf of the Group. Included in receivables from these sales representatives are amounts collected on behalf of the Group.
2.20 Accounts payable
Accounts payable are obligations to pay for goods or services that have been acquired in the ordinary course of business from suppliers. Accounts payable are classified as current liabilities if payment is due within one year or less (or in the normal operating cycle of the business if longer). If not, they are presented as non-current liabilities.
Accounts payable are recognized initially at fair value and subsequently measured at amortized cost using the effective interest method.
2.21 Dividend distribution
Dividend distribution to the Company’s shareholders is recognized as a liability in the Group’s financial statements in the period in which the dividends are approved by the Company’s shareholders.
| 3. | Financial risk management |
The Group’s activities expose it to a variety of financial risks: market risk (including currency risk, fair value interest rate risk, and cash flow interest rate risk), credit risk and liquidity risk. The Group’s overall risk management
GLOBAL SOURCES LTD. AND SUBSIDIARIES
NOTES TO THE CONSOLIDATED FINANCIAL STATEMENTS
(In U.S. Dollars Thousands, Except Number of Shares and Per Share Data)
program focuses on the unpredictability of financial markets and seeks to minimize potential adverse effects on the Group’s financial performance.
Risk management is carried out by a group of senior management personnel. This particular group identifies, evaluates and takes appropriate measures to alleviate financial risks in close co-operation with the Group’s operating units. The Board of Directors provide direction for overall risk management, covering specific areas, such as foreign exchange risk, interest rate risk, credit risk, use of derivative financial instruments and non- derivative financial instruments, and investment of excess liquidity.
(a) Market risk
(i) Foreign exchange risk
The Group operates internationally and is exposed to foreign currency risk arising from various currency exposures, primarily with respect to the Chinese Renminbi (‘RMB’). Foreign currency risk arises from commercial transactions, recognized assets and liabilities and net investments in foreign operations. A majority of the Group’s contracts with customers that are denominated in foreign currencies are in RMB. The conversion of these contract proceeds to USD could result in losses and reflects the foreign exchange risk assumed by the Group between contract signing and the conversion of cash into USD.
The Group has not engaged in foreign currency hedging activities. Historically a majority (ranging between 98% to 99%) of the revenue is denominated in USD or is received in Hong Kong Dollar (‘HKD’), RMB or New Taiwan Dollar (‘TWD’). HKD is currently pegged to the USD while RMB has been relatively stable historically but has strengthened during the past few years against the USD. TWD is also relatively stable against USD.
The Group has certain investments in foreign operations, whose net assets are exposed to foreign currency translation risk. Currency exposure arising from the net assets of the Group’s foreign operations is managed primarily through identification of the specific risks and taking appropriate measures to alleviate the risk.
At December 31, 2013, if the RMB had weakened/strengthened by 3% (2012: 1%) against the USD with all other variables held constant, profit before tax for the year would have been $2,909 (2012: $989) lower/higher as a result of foreign currency losses/gains on translation of RMB denominated monetary assets and liabilities.
(ii) Cash flow and fair value interest rate risk
The Group has no interest-bearing borrowings as at December 31, 2013 and 2012. The Group’s exposure to changes in market interest rates is mainly attributable to its interest-bearing assets including term deposits with banks, available-for-sale financial assets and cash and cash equivalents. As at December 31, 2013 and December 31, 2012, the term deposits with banks are all fixed interest rate instruments and the available-for-sale securities are highly liquid and are short term in nature. Therefore interest rate risk is considered to be insignificant.
(iii) Credit risk
Credit risk arises from investments in checking and savings accounts, debt securities issued by U.S. Treasury, term deposits with banks, available-for-sale securities, accounts receivable and receivables from sales representatives.
The Company maintains checking, money market accounts, term deposits with banks, debt securities issued by U.S. Treasury held in custody with banks and available-for-sale securities with high quality institutions. The Company has a large number of customers, operates in different geographic areas and
GLOBAL SOURCES LTD. AND SUBSIDIARIES
NOTES TO THE CONSOLIDATED FINANCIAL STATEMENTS
(In U.S. Dollars Thousands, Except Number of Shares and Per Share Data)
generally does not require collateral on accounts receivable or receivables from sales representatives. The Company generally collects in advance from customers in markets with higher credit risk. In addition, the Company is continuously monitoring the credit transactions and maintains impairment allowance where necessary.
The Group’s maximum exposure to credit risk is represented by the carrying amount of each financial asset in the balance sheet.
Bank deposits that are neither past due nor impaired are mainly deposits with banks with high credit- ratings assigned by international credit-rating agencies. Available-for-sale financial assets are highly liquid instruments maintained with reputable institutions. Accounts receivable and receivables from sales representatives that are neither past due nor impaired are substantially companies with a good collection track record with the Group.
(iv) Liquidity risk
Cash flow forecasting is performed in the operating entities of the Group and aggregated by Group finance. Group finance monitors rolling forecasts of the Group’s liquidity requirements to ensure it has sufficient cash to meet operational needs.
The Group invests its excess cash in term deposits with commercial banks, U.S. Treasury securities and available-for-sale securities to generate income from interest received as well as capital gains, while the funds are held to support its business.
Generally, the Group holds securities with specified maturity dates such as U.S. Treasury Bills to maturity. The Group does not engage in buying and selling of securities with the objective of generating profits on short-term differences in price or for other speculative purposes. Its objective is to invest to support the Group’s capital preservation strategy.
The Group’s financial liabilities which consist of accounts payable and accrued liabilities are due within 12 months and their contractual undiscounted cash flows approximate their carrying amounts as the impact of discounting is not significant.
(v) Capital risk management
The Group’s objectives when managing capital are to safeguard the Group’s ability to continue as a going concern in order to provide returns for shareholders and benefits for other stakeholders and to maintain an optimal capital structure to reduce the cost of capital.
In order to maintain or adjust the capital structure, the Group may return capital to shareholders and issue new shares. Currently the Group has no external borrowings and is not subject to any externally imposed capital requirements. The Group defines the total equity as the capital of the Group.
(vi) Fair value estimation
The table below analyses financial instruments carried at fair value, by valuation method. The different levels have been defined as follows:
| • | Level 1: quoted prices (unadjusted) in active markets for identical assets or liabilities. |
| • | Level 2: inputs other than quoted prices included within level 1 that are observable for the asset or liability, either directly (that is, as prices) or indirectly (that is, derived from prices). |
| • | Level 3: inputs for the asset or liability that are not based on observable market data (that is unobservable inputs). |
GLOBAL SOURCES LTD. AND SUBSIDIARIES
NOTES TO THE CONSOLIDATED FINANCIAL STATEMENTS
(In U.S. Dollars Thousands, Except Number of Shares and Per Share Data)
The following table presents the Group’s assets and liabilities that are measured at fair value.
| 31 December 2013 | | | |
| | | Level 1 | | | Level 2 | | | Level 3 | | | Total | |
| Asset | | | | | | | | | | | | | | | | |
| Available-for-sale securities | | $ | 6,367 | | | | - | | | | - | | | $ | 6,367 | |
| Total asset | | $ | 6,367 | | | | - | | | | - | | | $ | 6,367 | |
| 31 December 2012 | | | |
| | | Level 1 | | | Level 2 | | | Level 3 | | | Total | |
| Asset | | | | | | | | | | | | | | | | |
| Available-for-sale securities | | $ | 7,472 | | | | - | | | | - | | | $ | 7,472 | |
| Total asset | | $ | 7,472 | | | | - | | | | - | | | $ | 7,472 | |
The fair value of financial instruments traded in active markets is based on quoted market prices at the balance sheet date. A market is regarded as active if quoted prices are readily and regularly available from an exchange, dealer, broker, industry group, pricing service, or regulatory agency, and those prices represent actual and regularly occurring market transactions on an arm’s length basis. The quoted market price used for financial assets held by the Group is the current bid price. These instruments are included in level 1. Instruments included in level 1 comprise primarily of available-for-sale financial assets.
The fair values of investment properties are disclosed under note 12.
| 4. | Critical accounting estimates and judgments |
Estimates and judgments are continually evaluated and are based on historical experience and other factors, including expectations of future events that are believed to be reasonable under the circumstances.
The Group makes estimates and assumptions concerning the future. The resulting accounting estimates will, by definition, seldom equal the related actual results. The estimates and assumptions that have a significant risk of causing a material adjustment to the carrying amounts of assets and liabilities within the next financial year are addressed below.
(a) Income Taxes
The Group has exposure to income taxes in numerous jurisdictions. Significant judgment is involved in determining the Group-wide provision for income taxes and recognition of deferred tax assets. The Group has open tax assessments with tax authorities at the balance sheet date and there are certain transactions and computations for which the ultimate tax determination is uncertain during the ordinary course of business. The Group recognizes liabilities for expected tax issues (note 9) based on reasonable estimates of whether additional taxes will be due and recognizes deferred income tax assets (note 15) on carried forward tax losses to the extent there are sufficient estimated future taxable profits and/or taxable temporary differences against which the tax loss can be utilized. Where the final tax outcome of these matters is different from the amounts that were initially recognized, such differences will impact the income tax and deferred tax recognized in the period in which such determination is made.
(b) Goodwill and Intangible assets
Upon acquisition, the purchase consideration is allocated between the net tangible and intangible assets other than goodwill on a fair value basis with any excess purchase consideration representing goodwill. The valuation of the acquired intangible assets represents the estimated economic value in use, using the discounted cash flow method. Acquired intangible assets are capitalized and amortized systematically over their estimated useful lives (refer to note 2.7), subject to impairment review.
GLOBAL SOURCES LTD. AND SUBSIDIARIES
NOTES TO THE CONSOLIDATED FINANCIAL STATEMENTS
(In U.S. Dollars Thousands, Except Number of Shares and Per Share Data)
Amortization periods are selected based on assessment of the longevity of the brands, the strength and stability of customer relationships, the market positions of the acquired assets and the technological and competitive risks they face. The longevity of these assets is evidenced by their long established and well regarded brands, and their characteristically stable market condition. The Group has reviewed the useful life of intangible assets and revised the useful life of a trademark. The change in useful life is disclosed under note 13.
The carrying amounts of goodwill in each business are reviewed for impairment at least annually or more frequently if events or changes in circumstances indicate a potential impairment in accordance to the accounting policy stated in note 2.8. The carrying amounts of all other intangible assets are reviewed where there are indications of possible impairment.
An impairment review involves a comparison of the carrying value of the asset with the value in use based on management cash flow projections or fair value less cost to sell based on market comparable transactions or income approach. Key areas of judgment in estimating the recoverable amount of a CGU are the growth in cash flows over a five-year forecast period, the long term growth rate assumed thereafter and the discount rate applied to the forecast cash flows.
During the year ended December 31, 2013, the Group recorded goodwill impairment charge of $4,980 and intangible asset impairment charge of $3,542 relating to the Haoji Group’s exhibition business. A detailed discussion on the events leading to the impairment charges is included in note 13. After recording the impairment charge, the balance of goodwill relating to this business as at December 31, 2013 is nil. A sensitivity analysis has been performed for each Exhibition business based on changes in key assumptions considered to be reasonably possible by management. The Group’s profit after tax will reduce by $493 and $784 if the pre-tax discount rate and the revenue growth applied to the discounted cash flows for the Haoji Group exhibition business at December 31, 2013 is raised by 1% and decreased by 1%, respectively, with all other variables including tax rate being held constant.
For the other Exhibition business, there will be no impact to the Group’s results after tax if the pre-tax discount rate and the revenue growth applied to the discounted cash flows for the acquired Exhibition business at December 31, 2013 is raised by 1% and decreased by 1%, respectively, with all other variables including tax rate being held constant.
Management has determined the operating segments based on the business activities whose operating results are reviewed by the Group’s chief operating decision maker (‘CODM’), which is the Company’s Board of Directors to assess the Group’s performance and to make decisions about resources to be allocated to each segment.
The Group considers the business from a services perspective. The reportable operating segments derive their revenue primarily from the online and other media services and from the exhibitions.
Miscellaneous revenue consists mainly of technical services fee income and rental income. The results of these operations are included in the ‘all other segments’ column.
The CODM assesses the performance of the operating segments based on a measure of profit/loss from operations. This measurement basis excludes interest income. Other gains or losses comprising gain on sale of available-for- sale financial assets and impairment loss on available-for-sale financial assets are not allocated to segments, as this type of activity is driven by the treasury of the Group, which manages the cash position of the Group.
GLOBAL SOURCES LTD. AND SUBSIDIARIES
NOTES TO THE CONSOLIDATED FINANCIAL STATEMENTS
(In U.S. Dollars Thousands, Except Number of Shares and Per Share Data)
The segment information provided to the CODM for the reportable segments for the year ended December 31, 2013 is as follows:
| | | Online and other | | | | | | All other | | | | |
| | | media services | | | Exhibitions | | | segments | | | Total | |
| Revenue from external customers | | $ | 104,629 | | | $ | 85,636 | | | $ | 7,257 | | | $ | 197,522 | |
| Reportable segment profit/(loss) from operations | | $ | 20,244 | | | $ | (2,455 | ) | | $ | 2,890 | | | $ | 20,679 | |
| Depreciation and amortization | | $ | 2,541 | | | $ | 3,227 | | | $ | 3,261 | | | $ | 9,029 | |
| Impairment of intangible assets | | | - | | | $ | 8,525 | | | | - | | | $ | 8,525 | |
| Other material non-cash items: | | | | | | | | | | | | | | | | |
| Non-cash compensations expenses | | $ | 1,106 | | | $ | 1,064 | | | | - | | | $ | 2,170 | |
| Additions to property and equipment and intangible assets | | $ | 14,869 | | | $ | 12,170 | | | $ | 92 | | | $ | 27,131 | |
| Reportable segment assets | | $ | 115,310 | | | $ | 126,455 | | | $ | 97,332 | | | $ | 339,097 | |
The segment information for the year ended December 31, 2012 is as follows:
| | | Online and other | | | | | | All other | | | | |
| | | media services | | | Exhibitions | | | segments | | | Total | |
| Revenue from external customers | | $ | 136,101 | | | $ | 88,782 | | | $ | 6,857 | | | $ | 231,740 | |
| Reportable segment profit from operations | | $ | 24,856 | | | $ | 7,331 | | | $ | 2,784 | | | $ | 34,971 | |
| Depreciation and amortization | | $ | 3,069 | | | $ | 3,037 | | | $ | 3,006 | | | $ | 9,112 | |
| Other material non-cash items: | | | | | | | | | | | | | | | | |
| Non-cash compensations expenses | | $ | 1,412 | | | $ | 997 | | | | - | | | $ | 2,409 | |
| Additions to property and equipment and intangible assets | | $ | 1,120 | | | $ | 25,910 | | | $ | 42 | | | $ | 27,072 | |
| Reportable segment assets | | $ | 98,896 | | | $ | 110,169 | | | $ | 102,104 | | | $ | 311,169 | |
The segment information for the year ended December 31, 2011 is as follows:
| | | Online and other | | | | | | All other | | | | |
| | | media services | | | Exhibitions | | | segments | | | Total | |
| Revenue from external customers | | $ | 141,475 | | | $ | 77,973 | | | $ | 5,617 | | | $ | 225,065 | |
| Reportable segment profit from operations | | $ | 21,078 | | | $ | 7,292 | | | $ | 3,350 | | | $ | 31,720 | |
| Depreciation and amortization | | $ | 3,270 | | | $ | 1,327 | | | $ | 2,188 | | | $ | 6,785 | |
| Other material non-cash items: | | | | | | | | | | | | | | | | |
| Non-cash compensations expenses | | $ | 1,636 | | | $ | 1,141 | | | | - | | | $ | 2,777 | |
| Additions to property and equipment and intangible assets | | $ | 21,214 | | | $ | 10,004 | | | $ | 29,115 | | | $ | 60,333 | |
| Reportable segment assets | | $ | 112,189 | | | $ | 84,610 | | | $ | 79,531 | | | $ | 276,330 | |
The revenue from external parties reported to the CODM is measured in a manner consistent with that in the consolidated income statement.
Revenue from barter transactions was $4,725, $3,252 and $4,650 for the years ended December 31, 2013, 2012 and 2011, respectively. Similarly, the expenses from barter transactions were $5,078, $5,984 and $4,478 for the years ended December 31, 2013, 2012 and 2011, respectively.
GLOBAL SOURCES LTD. AND SUBSIDIARIES
NOTES TO THE CONSOLIDATED FINANCIAL STATEMENTS
(In U.S. Dollars Thousands, Except Number of Shares and Per Share Data)
The amounts provided to the CODM with respect to total assets are measured in a manner consistent with that of the consolidated financial statements. These assets are allocated based on the operations of the segment. For the purposes of monitoring segment performance and allocating resources between segments, the CODM monitors the total assets attributable to each segment.
A reconciliation of the reportable segment profit from operations to profit before income taxes is provided as follows:
| | | 2013 | | | 2012 | | | 2011 | |
| Total profit from operations for reportable segments | | $ | 20,679 | | | $ | 34,971 | | | $ | 31,720 | |
| | | | | | | | | | | | | |
| Unallocated amounts: | | | | | | | | | | | | |
| Profit on sale of property | | | 15,410 | | | | - | | | | - | |
| Interest income | | | 1,472 | | | | 1,044 | | | | 360 | |
| Share of loss of associate | | | - | | | | (24 | ) | | | - | |
| Gain on sale of available-for-sale securities | | | 64 | | | | - | | | | - | |
| Impairment loss on investment in associate | | | - | | | | (302 | ) | | | - | |
| Profit before income taxes | | $ | 37,625 | | | $ | 35,689 | | | $ | 32,080 | |
Revenue from external customers is derived mainly from online and other media services and from the exhibitions. The online and other media services comprise online services and print services. Technical services fee income and rental income are included in ‘miscellaneous’ revenue.
Breakdown of the revenue from all services is as follows:
| Revenues | | | | | | | | | |
| | | 2013 | | | 2012 | | | 2011 | |
| Online services | | $ | 91,422 | | | $ | 119,011 | | | $ | 117,946 | |
| Print services | | | 13,207 | | | | 17,090 | | | | 23,529 | |
| Exhibitions | | | 85,636 | | | | 88,782 | | | | 77,973 | |
| Miscellaneous | | | 7,257 | | | | 6,857 | | | | 5,617 | |
| | | $ | 197,522 | | | $ | 231,740 | | | $ | 225,065 | |
Miscellaneous income includes rental income for the year ended December 31, 2013, 2012 and 2011 of $6,083, $5,795 and $4,496, respectively.
Geographic information
Revenue by geographic locations is based on the location of the customer. Segment assets are based on the location of the assets. Non-current assets exclude investments and deferred income tax assets. There are no revenue and assets generated from or located in Bermuda.
| Revenues | | | | | | | | | |
| | | 2013 | | | 2012 | | | 2011 | |
| China | | $ | 163,107 | | | $ | 189,648 | | | $ | 177,563 | |
| Rest of Asia | | | 29,891 | | | | 35,603 | | | | 40,011 | |
| United States | | | 4,031 | | | | 5,706 | | | | 6,455 | |
| Europe | | | 365 | | | | 531 | | | | 695 | |
| Others | | | 128 | | | | 252 | | | | 341 | |
| | | $ | 197,522 | | | $ | 231,740 | | | $ | 225,065 | |
GLOBAL SOURCES LTD. AND SUBSIDIARIES
NOTES TO THE CONSOLIDATED FINANCIAL STATEMENTS
(In U.S. Dollars Thousands, Except Number of Shares and Per Share Data)
| | | December 31, | | | December 31, | |
| | | 2013 | | | 2012 | |
| Non-current assets | | | | | | | | |
| China and rest of Asia | | $ | 162,505 | | | $ | 163,717 | |
| | | $ | 162,505 | | | $ | 163,717 | |
There is no revenue derived from transactions with a single external customer that amounted to 10% or more of the Group’s revenue (2012: nil, 2011: nil).
| | | 2013 | | | 2012 | | | 2011 | |
| Interest income | | | | | | | | | | | | |
| Treasury bills and balances with banks | | $ | 58 | | | $ | 59 | | | $ | 101 | |
| Term deposits with banks | | | 1,414 | | | | 979 | | | | 257 | |
| Available-for-sale financial assets | | | - | | | | 6 | | | | 2 | |
| | | $ | 1,472 | | | $ | 1,044 | | | $ | 360 | |
| | | 2013 | | | 2012 | | | 2011 | |
| Depreciation of property and equipment (note 11) | | $ | 3,507 | | | $ | 4,186 | | | $ | 5,286 | |
| Depreciation of investment property (note 12) | | | 2,287 | | | | 1,804 | | | | - | |
| Amortization of intangible assets (note 13) | | | 3,235 | | | | 3,122 | | | | 1,499 | |
| Total depreciation and amortization | | $ | 9,029 | | | $ | 9,112 | | | $ | 6,785 | |
| Employee benefit expenses (note 8) | | | 29,764 | | | | 29,742 | | | | 29,515 | |
| Rental expense on operating leases | | | 13,786 | | | | 14,844 | | | | 14,734 | |
| Content, community, marketing and administrative service fees | | | 33,427 | | | | 42,389 | | | | 44,694 | |
| Advertising costs | | | 10,458 | | | | 12,352 | | | | 11,054 | |
| Sales commissions | | | 43,217 | | | | 45,360 | | | | 42,943 | |
| Business tax | | | 2,263 | | | | 9,719 | | | | 12,039 | |
| Legal and professional fees | | | 1,335 | | | | 1,716 | | | | 1,562 | |
| Magazine, printing and mailing | | | 2,132 | | | | 3,377 | | | | 3,937 | |
| Materials and supplies | | | 11,494 | | | | 12,607 | | | | 11,066 | |
| Impairment of intangible assets (note 13) | | | 8,525 | | | | 1,389 | | | | 670 | |
| Exchange (gain) loss | | | (1,448 | ) | | | (61 | ) | | | 246 | |
| Other expenses | | | 12,861 | | | | 14,223 | | | | 14,100 | |
| Total operating expenses | | $ | 176,843 | | | $ | 196,769 | | | $ | 193,345 | |
Impairment of intangible assets and exchange gain/loss were included in general and administrative expenses in the consolidated income statement.
GLOBAL SOURCES LTD. AND SUBSIDIARIES
NOTES TO THE CONSOLIDATED FINANCIAL STATEMENTS
(In U.S. Dollars Thousands, Except Number of Shares and Per Share Data)
| 8. | Employee benefit expenses |
| | | 2013 | | | 2012 | | | 2011 | |
| Wages and salaries | | $ | 24,548 | | | $ | 25,371 | | | $ | 24,978 | |
| Retirement contribution plans | | | 2,235 | | | | 1,649 | | | | 1,480 | |
| Non-cash compensation expenses | | | 1,910 | | | | 1,732 | | | | 2,111 | |
| Other employee’s benefits | | | 1,071 | | | | 990 | | | | 946 | |
| | | $ | 29,764 | | | $ | 29,742 | | | $ | 29,515 | |
The Company and some of its subsidiaries operate in the Cayman Islands and other jurisdictions where there are no taxes imposed on companies (collectively referred to as ‘Cayman Islands’). Some of the Company’s subsidiaries operate in Hong Kong Special Administrative Region, Singapore, the People’s Republic of China and certain other jurisdictions and are subject to income taxes in their respective jurisdictions. The Group is also subject to withholding taxes for revenues earned in certain other countries.
The Company received an exemption from Bermuda taxation under the Exempted Undertakings Tax Protection Act, 1996 (as amended) of Bermuda until March 31, 2035. The Company’s subsidiary in Dubai, United Arab Emirates has been granted a fifty year tax holiday in Dubai since it is located in a Free Trade Zone, which may be subject to further renewal upon expiry of the initial fifty-year period in 2057. The Group did not utilize these tax holidays as at December 31, 2013 and December 31, 2012, as there were no taxable profits.
Income tax expense for the year consists of:
| | 2013 | | | 2012 | | | 2011 | |
| Current tax: | | | | | | | | | | | | |
| Current foreign tax on profits for the year | | $ | 6,106 | | | $ | 3,181 | | | $ | 1,674 | |
| Total current tax | | $ | 6,106 | | | $ | 3,181 | | | $ | 1,674 | |
| Deferred foreign tax benefit (note 15) | | | (1,353 | ) | | | (437 | ) | | | (61 | ) |
| Income tax expense | | $ | 4,753 | | | $ | 2,744 | | | $ | 1,613 | |
The tax on the Group’s profit before income taxes differs from the theoretical amount that would arise using the statutory income tax rate of 0% as follows:
| | | 2013 | | | 2012 | | | 2011 | |
| Profit before income taxes | | $ | 37,625 | | | $ | 35,689 | | | $ | 32,080 | |
| Tax calculated at statutory income tax rate of 0% (2012: 0%; 2011: 0%) | | | - | | | | - | | | | - | |
| Tax effect of: | | | | | | | | | | | | |
| Foreign income and revenues taxed at higher rates | | | 4,753 | | | | 2,744 | | | | 1,613 | |
| Income tax expense | | $ | 4,753 | | | $ | 2,744 | | | $ | 1,613 | |
The Company’s subsidiaries are subject to taxation in Hong Kong, the People’s Republic of China, Singapore and other jurisdictions. There are certain open tax assessments as at December 31, 2013. The tax returns of the Company’s subsidiaries remain open to assessment in the following major tax jurisdictions: Hong Kong SAR – for the years from 2004 to 2013, Singapore – for the years from 2012 to 2013 and the People’s Republic of China – for the years from 2008 to 2013. The Group’s estimates of income tax expenses and liabilities of each year end include management judgment about the eventual outcome of the reviews of open years based on the latest information available about the positions taken by each tax authority.
GLOBAL SOURCES LTD. AND SUBSIDIARIES
NOTES TO THE CONSOLIDATED FINANCIAL STATEMENTS
(In U.S. Dollars Thousands, Except Number of Shares and Per Share Data)
(a) Basic
Basic earnings per share is calculated by dividing the profit attributable to equity holders of the Company by the weighted average number of ordinary shares in issue during the year excluding ordinary shares purchased by the Company and held as treasury shares.
| | | 2013 | | | 2012 | | | 2011 | |
| Profit attributable to equity holders of the Company | | $ | 32,735 | | | $ | 32,206 | | | $ | 29,476 | |
| Weighted average number of ordinary shares in issue | | | 34,426,468 | | | | 34,017,730 | | | | 33,742,648 | |
| Basic earnings per share ($ per share) | | $ | 0.95 | | | $ | 0.95 | | | $ | 0.87 | |
(b) Diluted
Diluted earnings per share is calculated by adjusting the weighted average number of ordinary shares outstanding to assume the effects of all dilutive potential ordinary shares. The dilutive potential ordinary shares of the Company consist of share grants.
For share grants, a calculation is done to determine the number of shares that could have been acquired at fair value (determined as the average annual market share price of the Company’s shares) based on the monetary value of the outstanding share grants. The number of shares so calculated is compared against the number of shares that would have been issued assuming the exercise of the shares granted. The difference is added to the denominator as an issue of ordinary share for no consideration. No adjustment is made to earnings (the numerator).
| | | 2013 | | | 2012 | | | 2011 | |
| Profit attributable to equity holders of the Company | | $ | 32,735 | | | $ | 32,206 | | | $ | 29,476 | |
| Weighted average number of ordinary shares in issue | | | 34,426,468 | | | | 34,017,730 | | | | 33,742,648 | |
| Adjustments for share grants | | | 1,641,858 | | | | 1,724,765 | | | | 1,642,570 | |
| Weighted average number of ordinary shares for diluted earnings per share | | | 36,068,326 | | | | 35,742,495 | | | | 35,385,218 | |
| Diluted earnings per share ($ per share) | | $ | 0.91 | | | $ | 0.90 | | | $ | 0.83 | |
GLOBAL SOURCES LTD. AND SUBSIDIARIES
NOTES TO THE CONSOLIDATED FINANCIAL STATEMENTS
(In U.S. Dollars Thousands, Except Number of Shares and Per Share Data)
| 11. | Property and Equipment |
| | | | | | | | | Computer | | | | | | | | | | |
| | | | | | | | | equipment, | | | | | | | | | | |
| | | | | | | | | software, fixtures, | | | | | | | | | | |
| | | | | | | | | fittings and office | | | | | | | | | | |
| | | | | | | | | equipment and | | | | | | | | | | |
| | | | | | Leasehold | | | reusable trade | | | Motor | | | Capital
work-in- | | | | |
| | Buildings | | | improvements | | | show booths | | | vehicles | | | progress | | | Total | |
| Year ended December 31, 2013 | | | | | | | | | | | | | | | | | | | | | | | | |
| Cost | | | | | | | | | | | | | | | | | | | | | | | | |
| Opening balance | | $ | 27,972 | | | $ | 15,179 | | | $ | 36,439 | | | $ | 373 | | | $ | 2 | | | $ | 79,965 | |
| Exchange differences | | | 316 | | | | (30 | ) | | | (631 | ) | | | 3 | | | | - | | | | (342 | ) |
| Additions | | | 24,619 | | | | 1,628 | | | | 738 | | | | - | | | | 62 | | | | 27,047 | |
| Disposals and write-off | | | (5,122 | ) | | | (4,762 | ) | | | (1,535 | ) | | | - | | | | - | | | | (11,419 | ) |
| Total Cost | | $ | 47,785 | | | $ | 12,015 | | | $ | 35,011 | | | $ | 376 | | | $ | 64 | | | $ | 95,251 | |
| | | | | | | | | | | | | | | | | | | | | | | | | |
| Year ended December 31, 2013 | | | | | | | | | | | | | | | | | | | | | | | | |
| Accumulated Depreciation | | | | | | | | | | | | | | | | | | | | | | | | |
| Opening balance | | $ | 2,521 | | | $ | 12,612 | | | $ | 34,167 | | | $ | 223 | | | $ | - | | | $ | 49,523 | |
| Exchange differences | | | 13 | | | | (56 | ) | | | (625 | ) | | | 1 | | | | - | | | | (667 | ) |
| Additions | | | 974 | | | | 923 | | | | 1,545 | | | | 65 | | | | - | | | | 3,507 | |
| Disposals and write-off | | | (614 | ) | | | (4,670 | ) | | | (1,529 | ) | | | - | | | | - | | | | (6,813 | ) |
| Total accumulated depreciation | | $ | 2,894 | | | $ | 8,809 | | | $ | 33,558 | | | $ | 289 | | | $ | - | | | $ | 45,550 | |
| Net book amount. | | $ | 44,891 | | | $ | 3,206 | | | $ | 1,453 | | | $ | 87 | | | $ | 64 | | | $ | 49,701 | |
| | | | | | | | | | | | | | | | | | | |
| Year ended December 31, 2012 | | | | | | | | | | | | | | | | | | |
| Cost | | | | | | | | | | | | | | | | | | |
| Opening balance | | $ | 51,823 | | | $ | 13,714 | | | $ | 35,579 | | | $ | 371 | | | $ | 894 | | | $ | 102,381 | |
| Exchange differences | | | 509 | | | | 203 | | | | 779 | | | | 2 | | | | (19 | ) | | | 1,474 | |
| Additions | | | - | | | | 1,342 | | | | 902 | | | | - | | | | (873 | ) | | | 1,371 | |
| Transfer to investment properties | | | (24,360 | ) | | | - | | | | - | | | | - | | | | - | | | | (24,360 | ) |
| Disposals and write-off | | | - | | | | (80 | ) | | | (821 | ) | | | - | | | | - | | | | (901 | ) |
| Total Cost | | $ | 27,972 | | | $ | 15,179 | | | $ | 36,439 | | | $ | 373 | | | $ | 2 | | | $ | 79,965 | |
| | | | | | | | | | | | | | | | | | | | | | | | | |
| Year ended December 31, 2012 | | | | | | | | | | | | | | | | | | | | | | | | |
| Accumulated Depreciation | | | | | | | | | | | | | | | | | | | | | | | | |
| Opening balance | | $ | 2,672 | | | $ | 11,525 | | | $ | 32,271 | | | $ | 152 | | | $ | - | | | $ | 46,620 | |
| Exchange differences | | | 28 | | | | 181 | | | | 739 | | | | 2 | | | | - | | | | 950 | |
| Additions | | | 1,201 | | | | 940 | | | | 1,976 | | | | 69 | | | | - | | | | 4,186 | |
| Transfer to investment properties | | | (1,380 | ) | | | - | | | | - | | | | - | | | | - | | | | (1,380 | ) |
| Disposals and write-off | | | - | | | | (34 | ) | | | (819 | ) | | | - | | | | - | | | | (853 | ) |
| Total accumulated depreciation | | $ | 2,521 | | | $ | 12,612 | | | $ | 34,167 | | | $ | 223 | | | $ | - | | | $ | 49,523 | |
| Net book amount | | $ | 25,451 | | | $ | 2,567 | | | $ | 2,272 | | | $ | 150 | | | $ | 2 | | | $ | 30,442 | |
Shenzhen International Chamber of Commerce Tower
In 2004, the Group entered into an agreement to purchase approximately 9,000 square meters of office space in a commercial building in Shenzhen, China. The building is situated on leasehold land. The lease period of the land is 50 years, commencing from year 2002. At the end of the lease period, the building together with land will revert to the local government authority. The construction was completed and the property was put in use during the year 2005. Depreciation of the property commenced during the year 2005. This building is depreciated on a straight-line basis over the remaining lease term.
GLOBAL SOURCES LTD. AND SUBSIDIARIES
NOTES TO THE CONSOLIDATED FINANCIAL STATEMENTS
(In U.S. Dollars Thousands, Except Number of Shares and Per Share Data)
In 2008, the Group purchased approximately 6,365 square meters of office space in the abovementioned commercial building in Shenzhen, China. Depreciation of the property commenced during the year 2008. This building is depreciated on a straight-line basis over the remaining lease term.
Excellence Times Square
In 2007, the Group purchased approximately 1,939 square meters of office space in a commercial building in Shenzhen, China. The building is situated on leasehold land. The lease period of the land is 50 years, commencing from year 2002. At the end of the lease period the building together with the land will revert to the local government authority. The delivery of the office space to the Group was completed in 2007. The depreciation on this property commenced during 2007. The building is depreciated on a straight-line basis over the remaining lease term.
In 2013, the Group sold this property and recorded a profit on sale of property of $10,953 and related taxes of $2,286 resulting from this transaction.
Southmark
In 2008, the Group purchased approximately 22,874 square feet of office space, together with six car parking spaces, in a commercial building in Hong Kong S.A.R.. The lease period of the land is 55 years, commencing from year 1991. Depreciation of the property commenced during the year 2008, and the building is being depreciated on a straight-line basis over the remaining lease term.
In 2013, the Group sold 9,431 square feet of the property and three car parking spaces and recorded a profit on sale of property of $4,457 resulting from this transaction.
City Point
In 2011, the Group purchased approximately 6,668 square meters of office space in Shanghai. The lease period of the land is 50 years, commencing from year 2006. Depreciation of the property commenced during the year 2011, and the building is being depreciated on a straight-line basis over the remaining lease term.
Vita Tower
In 2013, the Group purchased approximately 36,822 square feet of office space in a commercial building situated in Hong Kong S.A.R., China, The building is situated on land with a lease period of 75 years expiring in 2023, which is renewable for a further 75 years. Depreciation of the property commenced during the year 2013 and the building is being depreciated on a straight-line basis over 50 years.
The carrying amounts of the buildings classified as property and equipment, as at December 31, 2013 and December 31, 2012 were as follows:
| | | Carrying | | | Carrying | |
| | | amount as at | | | amount as at | |
| | | December 31, | | | December 31, | |
| | | 2013 | | | 2012 | |
| Property | | | | | | | | |
| Shenzhen International Chamber of Commerce Tower | | $ | 3,938 | | | $ | 4,041 | |
| Southmark | | $ | 6,204 | | | $ | 10,930 | |
| City Point | | $ | 10,541 | | | $ | 10,480 | |
| Vita Tower | | $ | 24,208 | | | $ | - | |
| | | $ | 44,891 | | | $ | 25,451 | |
GLOBAL SOURCES LTD. AND SUBSIDIARIES
NOTES TO THE CONSOLIDATED FINANCIAL STATEMENTS
(In U.S. Dollars Thousands, Except Number of Shares and Per Share Data)
The fair values of properties are determined with the assistance of independent licensed appraisers who have appropriate recognized qualifications and experience to carry out such an exercise. The fair value is based on market values, being the estimated amount for which a property can be exchanged on the date of valuation between a willing buyer and a willing seller in an arm’s length transaction.
The total carrying amount of the investment properties (note 12) and buildings under property and equipment as at December 31, 2013 and December 31, 2012 were $134,506 and $122,828 respectively. The total fair value of these properties as at December 31, 2013 and December 31, 2012 were $229,437 and $219,690 respectively. The fair values of the properties as at December 31, 2013 and December 31, 2012 were determined by Savills Valuation and Professional Services Limited, Hong Kong using internationally accepted valuation methods.
| | | 2013 | | | 2012 | |
| Cost | | | | | | | | |
| Opening balance | | $ | 106,148 | | | $ | 80,893 | |
| Exchange differences | | | 2,684 | | | | 895 | |
| Transfers from property and equipment (note 11) | | | - | | | | 24,360 | |
| Disposals and write-off | | | (9,206 | ) | | | - | |
| Total cost | | $ | 99,626 | | | $ | 106,148 | |
| | | | | | | | | |
| Accumulated Depreciation | | | | | | | | |
| Opening balance | | | 8,771 | | | | 5,523 | |
| Exchange differences | | | 203 | | | | 64 | |
| Additions | | | 2,287 | | | | 1,804 | |
| Transfers from property and equipment (note 11) | | | - | | | | 1,380 | |
| Disposals and write-off | | | (1,250 | ) | | | - | |
| Total accumulated depreciation | | $ | 10,011 | | | $ | 8,771 | |
| Net book amount | | $ | 89,615 | | | $ | 97,377 | |
The information of the properties is detailed in note 11.
In the case when investment property forms part of a larger property unit, it is distinguished by Management on the basis of the area which it occupies in the total area of the property unit. The fair value attributable to investment properties determined based on the properties’ highest and best use as at December 31, 2013 was $161,206 (2012: $170,147).
The table below analyses the fair values of investment properties, by valuation method. The different levels have been defined as follows:
| • | Level 1: quoted prices (unadjusted) in active markets for identical assets or liabilities. |
| • | Level 2: inputs other than quoted prices included within level 1 that are observable for the asset or liability, either directly (that is, as prices) or indirectly (that is, derived from prices). |
| • | Level 3: inputs for the asset or liability that are not based on observable market data (that is unobservable inputs). |
GLOBAL SOURCES LTD. AND SUBSIDIARIES
NOTES TO THE CONSOLIDATED FINANCIAL STATEMENTS
(In U.S. Dollars Thousands, Except Number of Shares and Per Share Data)
The following table presents the Group’s investment properties at fair value.
| | | At 31 December 2013 | |
| | | Level 1 | | | Level 2 | | | Level 3 | | | Total | |
| Asset | | | | | | | | | | | | | | | | |
| Investment properties | | | - | | | | - | | | $ | 161,206 | | | $ | 161,206 | |
| Total asset | | | - | | | | - | | | $ | 161,206 | | | $ | 161,206 | |
Level 3 fair values of investment properties have been derived using the income capitalization approach whereby the rental incomes from rental contract for remaining rental periods are capitalized, taking into account the changes in market rents after the expiry of the contracts. The most significant input into this valuation approach is rental yield per square foot.
The rental income from investment properties for the year ended December 31, 2013, 2012 and 2011 was $5,972, $5,663 and $nil, respectively.
Direct operating expenses for investment properties, which generated rental income for the year ended December 31, 2013, 2012 and 2011 were as follows:
| | | 2013 | | | 2012 | | | 2011 | |
| Insurance | | $ | 70 | | | $ | 60 | | | | - | |
| Property tax/services fee | | | 785 | | | | 751 | | | | - | |
| Building maintenance | | | 37 | | | | 49 | | | | - | |
| Business tax | | | 214 | | | | 208 | | | | - | |
| Depreciation | | | 2,287 | | | | 1,804 | | | | - | |
| Total expenses | | $ | 3,393 | | | | $2,872 | | | | - | |
The transfer from property and equipment to investment properties with carrying amount of $22,980 and $75,370 was performed on December 31, 2012 and December 2011.
As at December 31, 2013, the contractual obligations relating to the investment property for renovation and maintenance were $77 and $38 respectively.
As at December 31, 2012 and 201l, there were no material contractual obligations relating to the investment property for renovation, repairs, maintenance.
GLOBAL SOURCES LTD. AND SUBSIDIARIES
NOTES TO THE CONSOLIDATED FINANCIAL STATEMENTS
(In U.S. Dollars Thousands, Except Number of Shares and Per Share Data)
| | | | | | Contractual | | | | | | | | | | | | | | |
| | | | | | backlog and | | Non-compete | | | | | | Database | | | |
| | | Trademarks | | others | | agreements | | Goodwill | | licences | | Total |
| Year ended December 31, 2013 | | | | | | | | | | | | | | | | | | | | | |
| Cost | | | | | | | | | | | | | | | | | | | | | |
| Opening balance | | $ | 26,638 | | $ | - | | | $ | 3,523 | | | $ | 9,488 | | | | 300 | | $39,949 | |
| Additions | | | - | | | - | | | | 84 | | | | - | | | | - | | 84 | |
| Write-off | | | - | | | - | | | | (459 | ) | | | - | | | | (37 | ) | (496 | ) |
| Total cost | | $ | 26,638 | | $ | - | | | $ | 3,148 | | | $ | 9,488 | | | $ | 263 | | $39,537 | |
| | | | | | | | | | | | | | | | | | | | | | |
| Year ended December 31, 2013 | | | | | | | | | | | | | | | | | | | | | |
| Accumulated amortization and impairment | | | | | | | | | | | | | | | | | | | | | |
| Opening balance | | $ | 2,548 | | $ | - | | | $ | 2,154 | | | | 2,011 | | | | 100 | | 6,813 | |
| Additions | | | 2,324 | | | - | | | | 748 | | | | - | | | | 163 | | 3,235 | |
| Impairment charge | | | 3,542 | | | - | | | | 3 | | | | 4,980- | | | | - | | 8,525 | |
| Write-off | | | - | | | - | | | | (459 | ) | | | - | | | | - | | (459 | ) |
| Total accumulated amortization and impairment | | $ | 8,414 | | $ | - | | | $ | 2,446 | | | $ | 6,991 | | | $ | 263 | | $18,114 | |
| Net book amount | | $ | 18,224 | | $ | - | | | $ | 702 | | | $ | 2,497 | | | $ | - | | $21,423 | |
| | | | | Contractual | | | | | | | | |
| | | | | backlog and | | Non-compete | | | | Database | | |
| | | Trademarks | | others | | agreements | | Goodwill | | licences | | Total |
| Year ended December 31, 2012 | | | | | | | | | | | | | | | | | | | | | | | | |
| Cost | | | | | | | | | | | | | | | | | | | | | | | | |
| Opening balance | | $ | 6,864 | | | $ | 566 | | | $ | 4,586 | | | $ | 4,508 | | | | - | | | $ | 16,524 | |
| Additions | | | 19,774 | | | | 621 | | | | 26 | | | | 4,980 | | | | 300 | | | | 25,701 | |
| Write-off | | | - | | | | (1,187 | ) | | | (1,089 | ) | | | - | | | | - | | | | (2,276 | ) |
| Total cost | | $ | 26,638 | | | $ | - | | | $ | 3,523 | | | $ | 9,488 | | | $ | 300 | | | $ | 39,949 | |
| | | | | | | | | | | | | | | | | | | | | | | | | |
| Year ended December 31, 2012 | | | | | | | | | | | | | | | | | | | | | | | | |
| Accumulated amortization and impairment | | | | | | | | | | | | | | | | | | | | | | | | |
| Opening balance | | $ | 955 | | | $ | 509 | | | $ | 2,458 | | | | 656 | | | | - | | | $ | 4,578 | |
| Additions | | | 1,593 | | | | 678 | | | | 751 | | | | - | | | | 100 | | | | 3,122 | |
| Impairment charge | | | - | | | | - | | | | 34 | | | | 1,355 | | | | | | | | 1,389 | |
| Write-off | | | - | | | | (1,187 | ) | | | (1,089 | ) | | | - | | | | - | | | | (2,276 | ) |
| Total accumulated amortization and impairment | | $ | 2,548 | | | $ | - | | | $ | 2,154 | | | $ | 2,011 | | | $ | 100 | | | $ | 6,813 | |
| Net book amount | | $ | 24,090 | | | $ | - | | | $ | 1,369 | | | $ | 7,477 | | | $ | 200 | | | $ | 33,136 | |
The Group has recognized intangible assets relating to non-compete agreements with its former employees and former team members at fair values as discussed in note 2.15 (b) and note 21. The Group amortizes these intangible assets on straight-line basis over the non-compete term which is specified in the award.
On October 1, 2013, the Group reviewed the useful life of the trademark relating to the Haoji Group taking into account weaker than expected performance of the operations and the changes in market conditions and revised the useful life of the trademark from seventeen years to seven years. The effect of this change in the accounting estimate was recognized prospectively from October 1, 2013. The Group recorded additional amortization expense of $537 during the year ended December 31, 2013 resulting from the change in accounting estimate. Annual amortization expense is expected to be higher by $1,462 during future financial years due to the change in accounting estimate.
The amortization expense was included under general and administration expenses in the consolidated income statements.
GLOBAL SOURCES LTD. AND SUBSIDIARIES
NOTES TO THE CONSOLIDATED FINANCIAL STATEMENTS
(In U.S. Dollars Thousands, Except Number of Shares and Per Share Data)
Impairment test for goodwill / trademarks:
Goodwill is allocated to the Group’s cash-generating units (‘CGUs’) identified according to operating segments. An operating segment-level summary of the goodwill allocation is:
| | | December 31, | | | December 31, | |
| | | 2013 | | | 2012 | |
| Exhibitions, eMedia South China Limited | | $ | 2,497 | | | $ | 2,497 | |
| Exhibitions, Haoji Group Limited | | | - | | | | 4,980 | |
| Net book amount | | $ | 2,497 | | | $ | 7,477 | |
The recoverable amount of CGU has been determined based on value-in-use calculations. These calculations use cash flow projections by management covering a five-year period. Cash flows beyond the five-year period are extrapolated using the estimated growth rates. The growth rate did not exceed the long-term average growth rate for the business in which the CGU operates.
Exhibitions, Shenzhen PRC:
Key assumptions used for value-in-use calculations in 2013 and 2012 are as follows:
eMedia South China Limited
| • | Revenue growth rate of average 2% (2012: 12%) |
| • | Pre-tax discount rate of 22% (2012: 24%) applied to the pre-tax cash flow projections |
| • | Growth rate beyond five years of 1.5% (2012: 1.5%) |
These above assumptions have been used for the analysis of the CGU within the operating segment.
Management determined revenue growth rate based on past performance and its expectations of market developments. The discount rates used reflect specific risks relating to the relevant operating segment.
There was no impairment to goodwill for eMedia South China Limited at December 31, 2013 and December 31, 2012. In addition, there were no indicators of impairment for the trademark relating to eMedia South China Limited at December 31, 2013. The Group also re-assessed the useful lives of the trademarks and determined that no change in the useful lives was required.
Haoji Group:
| • | Revenue growth of average 16% (2012: 12%). |
| • | Pre-tax discount rate of 22% (2012: 24%) applied to the pre-tax cash flow projections |
| • | Growth rate beyond five years of 1.5% (2012: 1.5%) |
Management determined revenue growth rates based on past performance and its expectations of market developments. The discount rates used reflect specific risks relating to the relevant operating segment.
Due to slowdown in the current economic climate in China, the Group noted a significant decline in booth sales for the 2013 event. Accordingly, management performed an impairment review as at June 30, 2013. Management performed an annual impairment review again as at December 31, 2013. These reviews revealed a slow sales trend and a shortfall in the future cash flows to support the recoverability of the carrying value of the Haoji Group exhibition business. The cash flow projections used by management were based on the detailed financial and operating plans of the business and the more than anticipated softening of the fashion industry exhibitions market since the end of last financial year. Accordingly, a total impairment of $4,980 to goodwill and an impairment of $3,542 to trademark were recorded in the consolidated income statement for year ended December 31, 2013.
GLOBAL SOURCES LTD. AND SUBSIDIARIES
NOTES TO THE CONSOLIDATED FINANCIAL STATEMENTS
(In U.S. Dollars Thousands, Except Number of Shares and Per Share Data)
Online and other media business, EDN:
During the years ended December 31, 2012 and 2011, the Group recorded impairment of $1,355 and $656 to goodwill due to more than anticipated softening of the print advertising business. The balance of goodwill relating to EDN business was $nil as at December 31, 2012.
| 14. | Financial assets, available-for-sale and long term investments |
(a) Financial assets, available-for-sale
| | | 2013 | | | 2012 | |
| At January 1 | | $ | 7,472 | | | $ | 13,250 | |
| Purchases during the year | | | 63 | | | | 12,611 | |
| Disposals | | | (1,294 | ) | | | (18,508 | ) |
| Interest income recognized during the year | | | - | | | | 6 | |
| Exchange differences | | | 65 | | | | 61 | |
| Fair value gains recognized in other comprehensive income | | | 61 | | | | 52 | |
| At December 31 | | $ | 6,367 | | | $ | 7,472 | |
Financial assets, available-for-sale include the followings:
| | | December 31,
2013 | | | December 31,
2012 | |
| Listed securities: | | | | | | | | |
| Quoted money market debt instruments | | $ | 6,367 | | | $ | 7,472 | |
| | | $ | 6,367 | | | $ | 7,472 | |
The maximum exposure to credit risk at the reporting date is the carrying value of the debt securities classified as available for sale.
None of these financial assets are either past due or impaired (2012: nil).
(b) Long term investments
As at December 31, 2013 and December 31, 2012, the Company holds equity instruments carried at $100 in a privately held unaffiliated electronic commerce company for business and strategic purposes. The investment is accounted for under the cost method since the ownership is less than 20%, the Company does not have the ability to exercise significant influence over the investee and the fair value cannot be reliably measured. The Company’s policy is to regularly review the carrying values of the non-quoted investments and to identify and provide for when circumstances indicate impairment other than a temporary decline in the carrying values of such assets has occurred.
(c) Associate
In 2012, the Group subscribed to an approximate 10% of equity interest in Shooii Limited, an Australian start-up company, which operated an online retail platform for footwear for approximately $326. The Group has the ability to exercise significant influence over Shooii Limited by virtue of their representation on the Board of Directors. During 2012, management carried out an impairment assessment and determined that this investment has been fully impaired as Shooii Limited suffered severe cash flow problems and all their attempts to find new sources of financing failed, resulting in Shooii Limited going under official administration and facing a prospect of being liquidated. The Group recorded an impairment loss relating to this investment of $302 under ‘Impairment loss on investment in associate’ in the consolidated income statement for 2012.
GLOBAL SOURCES LTD. AND SUBSIDIARIES
NOTES TO THE CONSOLIDATED FINANCIAL STATEMENTS
(In U.S. Dollars Thousands, Except Number of Shares and Per Share Data)
Deferred tax assets and liabilities are offset when there is a legally enforceable right to offset current income tax assets against current income tax liabilities and when the deferred income taxes relate to the same fiscal authority. The amounts, determined after appropriate offsetting, are shown on the balance sheets as follows:
| | | December 31,
2013 | | | December 31,
2012 | |
| Deferred tax assets: | | | | | | | | |
| Deferred tax asset to be recovered after more than 12 months | | $ | 4 | | | $ | 149 | |
| Deferred tax assets to be recovered within 12 months | | | 94 | | | | 95 | |
| | | $ | 98 | | | $ | 244 | |
| | | | | | | | | |
| Deferred tax liabilities | | | | | | | | |
| Deferred tax liabilities to be settled after more than 12 months | | $ | 3,787 | | | $ | 5,651 | |
| Deferred tax liabilities to be settled within 12 months | | | 804 | | | | 439 | |
| | | $ | 4,591 | | | $ | 6,090 | |
| Deferred tax liabilities, net | | $ | (4,493 | ) | | $ | (5,846 | ) |
The gross movement on the deferred income tax account is as follows:
| | | 2013 | | | 2012 | |
| At January 1 | | $ | (5,846 | ) | | $ | (1,185 | ) |
| Credited to the consolidated income statement | | | 1,353 | | | | 437 | |
| Acquisition of business | | | - | | | | (5,098 | ) |
| At December 31 | | $ | (4,493 | ) | | $ | (5,846 | ) |
The movement in deferred income tax assets and liabilities during the year, without taking into consideration the offsetting of balances within the same tax jurisdiction, is as follows:
| | | Provisions | | | | | | | | | | |
| | | and expenses | | | Tax losses | | | Other | | | Total | |
| At January 1, 2012 | | $ | 273 | | | $ | 13 | | | $ | 39 | | | $ | 325 | |
| (Charged)/credited to the consolidated income statement. | | | (86 | ) | | | (13 | ) | | | 18 | | | | (81 | ) |
| At December 31, 2012 | | $ | 187 | | | $ | - | | | $ | 57 | | | $ | 244 | |
| Charged to the consolidated income statement | | | (89 | ) | | | - | | | | (57 | ) | | | (146 | ) |
| At December 31, 2013 | | $ | 98 | | | $ | - | | | $ | - | | | $ | 98 | |
| | | Accelerated tax | | | Fair value adjustments on acquisition of | | | | |
| | | depreciation | | | business | | | Total | |
| Deferred tax liabilities | | | | | | | | | | | | |
| At January 1, 2012 | | $ | 61 | | | | $ 1, 449 | | | $ | 1,510 | |
| Acquisition of business | | | - | | | | 5,098 | | | | 5,098 | |
| Charged/(credited) to the consolidated income statement | | | 39 | | | | (557 | ) | | | (518 | ) |
| At December 31, 2012 | | $ | 100 | | | $ | 5,990 | | | $ | 6,090 | |
| Charged to the consolidated income statement | | | (40 | ) | | | (1,459 | ) | | | (1,499 | ) |
| At December 31, 2013 | | $ | 60 | | | $ | 4,531 | | | $ | 4,591 | |
GLOBAL SOURCES LTD. AND SUBSIDIARIES
NOTES TO THE CONSOLIDATED FINANCIAL STATEMENTS
(In U.S. Dollars Thousands, Except Number of Shares and Per Share Data)
Deferred income tax assets are recognized for tax loss carry-forwards to the extent that the realization of the related tax benefit through future taxable profits is probable. The Group did not recognize deferred income tax assets of $9,117 (December 31 2012: $10,236) in respect of losses amounting to $32,058 (December 31, 2012: $36,010) that can be carried forward against future taxable income. Losses amounting to $27,612 (December 31, 2012: $29,232) expire by 2020, and the remaining losses have no expiry date. In 2013, $7,721 of previously unrecognized losses were utilized in relation to the taxable profits arising from the sale of investment properties in note 12.
| 16. | Prepaid expenses and other current assets |
| | | December 31, | | December 31, |
| | | 2013 | | 2012 |
| Non-current portion: | | $ | 216 | | | $ | 216 | |
| Club memberships | | | 1,218 | | | | 2,144 | |
| Deferred expenses – exhibition (iii) | | | 332 | | | | 402 | |
| Rental, utility and other deposits | | $ | 1,766 | | | $ | 2,762 | |
| Current portion: | | $ | 19 | | | $ | 25 | |
| Unsecured employee loans (i) | | | - | | | | 9 | |
| Temporary advances to employees (ii) | | | 1,542 | | | | 1,431 | |
| Prepaid expenses | | | 14,016 | | | | 15,496 | |
| Deferred expenses (iii) | | | 2,967 | | | | 1,435 | |
| Other current assets | | $ | 18,544 | | | $ | 18,396 | |
| (i) | The loans for the lease of residence are unsecured, interest free and are repayable in equal monthly installments over the period of the lease, typically less than or equal to twelve months. |
There were no loans due from the Company’s directors and executive officers as at December 31, 2013 and December 31, 2012.
| (ii) | Other temporary advances to staff are unsecured, interest free and are generally repayable within twelve months. |
| (iii) | Deferred expenses relate to deferred commission expenses and direct event production costs for exhibition events to be held in future periods. |
The fair value of club membership, employee loans and other receivables at the reporting date approximates its carrying value of each asset mentioned above.
| | | December 31, | | | December 31, | |
| | | 2013 | | | 2012 | |
| Stock of paper, at costs | | $ | 266 | | | $ | 410 | |
| | | $ | 266 | | | $ | 410 | |
The cost of inventories recognized as expense and included in community and content amounted to $468, $707 and $866 for the years ended December 31, 2013, 2012 and 2011, respectively.
GLOBAL SOURCES LTD. AND SUBSIDIARIES
NOTES TO THE CONSOLIDATED FINANCIAL STATEMENTS
(In U.S. Dollars Thousands, Except Number of Shares and Per Share Data)
| 18. | Accounts receivables and receivables from sales representatives |
| | | December 31,
2013 | | December 31,
2012 |
| Accounts receivables | | $ | 3,598 | | | $ | 4,774 | |
| Less: provision for impairment of accounts receivables | | | (476 | ) | | | (532 | ) |
| Accounts receivables – net | | | 3,122 | | | | 4,242 | |
| Receivables from sales representatives | | | 10,630 | | | | 7,773 | |
| | | $ | 13,752 | | | $ | 12,015 | |
The fair values of accounts receivables and receivables from sales representatives are as follows:
| | | December 31, | | December 31, |
| | | 2013 | | 2012 |
| Accounts receivables | | $ | 3,122 | | | $ | 4,242 | |
| Receivables from sales representatives | | | 10,630 | | | | 7,773 | |
| | | $ | 13,752 | | | $ | 12,015 | |
As at December 31, 2013 and December 31, 2012, receivables from sales representatives of $10,630 and $7,773, respectively, were neither past due nor impaired. The receivables from sale representatives represent cash receipts from the Group’s customers, net of commissions and fees payable, and which are collected by the independent sales representatives on behalf of the Group. These cash receipts are banked into designated bank accounts owned by the independent sales representatives in China. For credit risk management purposes, the Group’s employees are the only authorized signatories for the withdrawal of cash from these bank accounts. The majority of these independent sales representatives have long standing relationships with the Group, and for whom there is no recent history of default.
As at December 31, 2013 and December 31, 2012 accounts receivables of $3,122 and $4,242, respectively were past due but not impaired. The aging analysis of these accounts receivables is as follows:
| | | December 31, | | December 31, |
| | | 2013 | | 2012 |
| Up to 3 months | | $ | 2,420 | | | $ | 3,501 | |
| 3 to 6 months | | | 468 | | | | 505 | |
| Over 6 months | | | 234 | | | | 236 | |
| | | $ | 3,122 | | | $ | 4,242 | |
As at December 31, 2013 and December 31, 2012, the gross trade receivables of $476 and $532, respectively, were impaired and provided for. The individually impaired receivables mainly relate to certain customers for online and other media services, which are in unexpectedly difficult economic situations.
The aging of these accounts receivables is as follows:
| | | December 31, | | December 31, |
| | | 2013 | | 2012 |
| Up to 3 months | | $ | 116 | | | $ | 178 | |
| 3 to 6 months | | | 109 | | | | 118 | |
| Over 6 months | | | 251 | | | | 236 | |
| | | $ | 476 | | | $ | 532 | |
GLOBAL SOURCES LTD. AND SUBSIDIARIES
NOTES TO THE CONSOLIDATED FINANCIAL STATEMENTS
(In U.S. Dollars Thousands, Except Number of Shares and Per Share Data)
Movements on the Group’s provision for impairment of accounts receivables are as follows:
| | | 2013 | | 2012 |
| At January 1 | | $ | 532 | | | $ | 527 | |
| Provision for receivable impairment | | | 30 | | | | 229 | |
| Receivables written off during the year as uncollectible | | | (86 | ) | | | (224 | ) |
| At December 31. | | $ | 476 | | | $ | 532 | |
The creation and release of provision for impaired receivables have been included in sales costs in the consolidated income statements. Amounts charged to the allowance account are generally written off, when there is no expectation of recovering additional cash.
The maximum exposure to credit risk at the reporting date is the carrying value of each class of receivable mentioned above. The Group does not hold any collateral as security.
| 19. | Cash, bank balances, term deposits with banks and financial assets, available-for-sale |
| | | December 31, | | December 31, |
| | | 2013 | | 2012 |
| Cash at bank and on hand | | $ | 26,070 | | | $ | 19,304 | |
| U.S. Treasury securities with original maturities of less than three months | | | 13,246 | | | | 13,256 | |
| Term deposits and short-term highly liquid investments with original maturities of three months or less. | | | 98,043 | | | | 72,071 | |
| Cash and cash equivalents | | | 137,359 | | | | 104,631 | |
| Quoted money market debt instruments | | | 6,367 | | | | 7,472 | |
| Financial assets available-for-sale | | | 6,367 | | | | 7,472 | |
| Term deposits with original maturities of over three months. | | | 106 | | | | 4,184 | |
| Total | | $ | 143,832 | | | $ | 116,287 | |
| 20. | Share capital and treasury shares |
| | | Number of common shares | | | | | | Amount | | |
| | | Issued share | | Treasury | | Issued share | | Treasury | | Share |
| | | capital | | shares | | capital | | shares | | premium |
| At January 1, 2011 | | | 51,569,540 | | | | (17,996,000 | ) | | $ | 516 | | | $ | (150,089 | ) | | $ | 39,985 | |
| Issuance of common shares under Equity Compensation Plans | | | 220,408 | | | | - | | | | 2 | | | | - | | | | - | |
| At January 1, 2011 | | | 51,789,948 | | | | (17,996,000 | ) | | $ | 518 | | | $ | (150,089 | ) | | $ | 39,985 | |
| Issuance of common shares under Equity Compensation Plans | | | 275,415 | | | | - | | | | 3 | | | | - | | | | - | |
| At December 31, 2012 | | | 52,065,363 | | | | (17,996,000 | ) | | $ | 521 | | | $ | (150,089 | ) | | $ | 39,985 | |
| Issuance of common shares under Equity Compensation Plans | | | 416,408 | | | | - | | | | 4 | | | | - | | | | - | |
| At December 31, 2013 | | | 52,481,771 | | | | (17,996,000 | ) | | $ | 525 | | | $ | (150,089 | ) | | $ | 39,985 | |
GLOBAL SOURCES LTD. AND SUBSIDIARIES
NOTES TO THE CONSOLIDATED FINANCIAL STATEMENTS
(In U.S. Dollars Thousands, Except Number of Shares and Per Share Data)
The authorised share capital of the Company as at December 31, 2013 and December 31, 2012 is 75,000,000 common shares of $0.01 par value. As at December 31, 2013 and December 31, 2012, the Company has 34,485,771 and 34,069,363 common shares outstanding, respectively. The share premium of $39,985 as at December 31, 2013 and December 31, 2012 is recognized under capital reserves in note 22.
On February 4, 2008, the Board of Directors of the Company authorized a program to buy back up to $50,000 worth of common shares. The Company may, from time to time, as business conditions warrant, purchase shares in the open market or through private transactions. The buyback program does not obligate the Company to buyback any specific number of shares and may be suspended or terminated at any time at management’s discretion. The timing and amount of any buyback of shares will be determined by management based on its evaluation of market conditions and other factors. As at December 31, 2013 and December 31, 2012, the Company has not bought back any of its shares under this program.
Under a separate program approved by the Board of Directors of the Company at their meeting held on 10 and 11 November 2008, the Company repurchased 6,875,000 issued and outstanding common shares at a total purchase price of $50,000 or $8.00 per share pursuant to a tender offer available for all shareholders to participate in 2008. The Company is holding the repurchased shares as treasury shares.
On 24 June 2010, the Board of Directors of the Company authorized a program to repurchase 11,121,000 of its common shares by tender offer at purchase price of $9.00 per share. Accordingly, in August 2010, the Company completed the repurchase and paid a total purchase consideration of $100,089. The Company is holding the repurchased shares as treasury shares.
On December 30, 1999, the Company established The Global Sources Employee Equity Compensation Trust (the ‘Trust’) for the purpose of administering monies and other assets to be contributed by the Company to the Trust for the establishment of equity compensation and other benefit plans, including the Equity Compensation Plans Numbers I to VII described below. The Trust is administered by Appleby Services (Bermuda) Ltd (previously known as ‘Harrington Trust Limited’ and then as ‘Appleby Trust (Bermuda) Ltd.’) (the ‘Trustee’). The Trustee in the exercise of its power under the Declaration of Trust may be directed by the Equity Compensation Plan committee, including the voting of securities held in the Trust. The Board of Directors of the Company will select the members of the Equity Compensation Plan committee.
On February 4, 2000, in conjunction with the establishment of the Trust and the Share Exchange, the former parent company of Global Sources Ltd. assigned 4,034,552 common shares of the Company at a historical cost of less than $1, representing a 10% equity interest in the Company, for the establishment of share option plans and/ or share award plans, known as ECP I, ECP II and ECP III. Subsequently, share option plans and/or share award plans, known as ECP IV, ECP V, ECP VI and ECP VII were established.
Pursuant to a Declaration of Trust dated November 28, 2006 by the Trustee, ‘The Global Sources Equity Compensation Trust 2007’ (’2007 Trust’) was established. The 2007 Trust is administered by the Trustee as trustee. The purpose of the 2007 Trust is to administer shares contributed by the Company to the 2007 Trust from time to time in connection with providing equity compensation benefits under The Global Sources Equity Compensation (2007) Master Plan described below (‘ECP 2007 Master Plan’). In exercising its powers under the Trust, the Trustee may be directed by a plan committee to be constituted and appointed by the Company. The Plan Committee (‘ECP 2007 Plan Committee’) was constituted and appointed by the Board of Directors on February 15, 2007.
The ECP 2007 Master Plan was approved by the Company’s shareholders on May 8, 2006. The ECP 2007 Master Plan commenced with effect on January 1, 2007 and, unless terminated earlier by the Company’s Board of Directors, will expire on December 31, 2017. The Group’s employees, directors, consultants and the Group’s independent contractors’ employees are eligible to be awarded grants of the Company’s common shares under
GLOBAL SOURCES LTD. AND SUBSIDIARIES
NOTES TO THE CONSOLIDATED FINANCIAL STATEMENTS
(In U.S. Dollars Thousands, Except Number of Shares and Per Share Data)
the ECP 2007 Master Plan. The grantees and the number of shares to be awarded, and the vesting rules and other terms and conditions, are to be as determined by the Plan Committee, which is authorized under the ECP 2007 Master Plan to issue supplementary or subsidiary documents to set out and evidence such vesting rules and other terms and conditions. The total number of shares to be issued under the ECP 2007 Master Plan is subject to a limit of 3,000,000 common shares.
On November 7, 2006, the Company filed a Form S-8 Registration Statement under the Securities Act of 1933, with the U.S. Securities and Exchange Commission, for up to 3,000,000 common shares to be issued under the ECP 2007 Master Plan.
(a) Share grants to employees and team members
The Equity Compensation Plan committee approved and made several share awards / options under the plans ECP I, ECP II, ECP III, ECP IV and ECP VII. All the share awards / options under these plans have fully vested. The non-cash compensation expenses associated with these awards have been recognized over the vesting terms of the awards from their respective award dates.
Eligible employees, directors and team members (consultants and the employees of third party independent contractors) under ECP V are awarded grants of shares, the numbers of which are determined by the Equity Compensation Plan committee.
Entitlement of the employees and directors to these common shares is subject to employment and vesting terms. Entitlement of team members to these common shares is subject to continued services provided by them and vesting terms.
The Equity Compensation Plan committee approved the awards of common shares under ECP V on January 23, 2001. The Equity Compensation Plan committee subsequently approved additional awards of common shares under ECP V on various dates.
The non-cash compensation expenses associated with the above awards are recognized over the five or six year vesting term as applicable from the respective award dates.
On March 6, 2007, the Plan Committee approved and issued ‘The Global Sources Share Grant Award Plan’ as a supplementary or subsidiary document to the ECP 2007 Master Plan. Under the plan, the Plan Committee is to determine who will be granted awards of shares and the number of shares to be awarded to them, and the vesting schedule for such awards. The plan commenced with effect on March 6, 2007, and will terminate upon the expiration or termination of the ECP 2007 Master Plan, or upon the liquidation of the Company, or upon termination by the Plan Committee, whichever is the earliest to occur. The Plan Committee approved awards of common shares under the plan during the years 2007 to 2013 to employees and team members (consultants and the employees of third party independent contractors). The non-cash compensation expenses associated with the awards are recognized over the six year vesting term of the award.
On April 24, 2009, the Plan Committee approved and issued ‘The Global Sources Directors Share Grant Award Plan’ as a supplementary or subsidiary document to the ECP 2007 Master Plan. Persons eligible to receive grants under the plan are directors of the Company. Under the plan, the Plan Committee is to determine who amongst the directors of the Company will be granted awards of shares and the number of shares to be awarded to them. Any shares awarded will not vest immediately, but only at the end of four years after such effective date as may be specified by the Plan Committee (or in accordance with such other vesting schedule as may be determined by the Plan Committee). The plan commenced with effect on April 24, 2009, and will terminate upon the expiration or termination of the ECP 2007 Master Plan, or upon the liquidation of the Company, or upon termination by the Plan Committee, whichever is the earliest to occur. The Plan Committee awarded 21,000 common shares (comprising 3,000 common shares each to seven directors of the company), 19,500 common shares (comprising
GLOBAL SOURCES LTD. AND SUBSIDIARIES
NOTES TO THE CONSOLIDATED FINANCIAL STATEMENTS
(In U.S. Dollars Thousands, Except Number of Shares and Per Share Data)
3,000 common shares each to six directors and 1,500 to one director) to the seven directors of the Company, 1,500 common shares (to one director), 21,000 common shares (comprising 3,000 common shares each to seven directors), 21,000 common shares (comprising 3,000 common shares each to seven directors) and 21,000 common shares (comprising 3,000 common shares each to seven directors) in January 2013, January 2012, June 2011, January 2011, January 2010 and June 2009, respectively. The non-cash compensation expenses as at December 31, 2012, associated with the awards under the plan are recognized over the four year vesting term of the award.
As at December 31, 2013 and December 31, 2012, there was $4,059 and $4,298, respectively, of unrecognized non-cash compensation cost associated with the awards under the above ECP plans, excluding the awards under ECP VI, and The Global Sources Retention Share Grant Plan and The Global Sources Retention Share Grant Plan II, which are expected to be recognized over the next six years.
(b) Share grants for non-compete agreements
Eligible employees and team members under ECP VI are awarded, when they resign or retire from their respective employment or consultancy service, one-time grants of Global Sources Ltd. common shares, the numbers of which are determined by the Equity Compensation Plan committee. Entitlement of the grantees to these common shares is subject to non-compete terms. There is no other vesting conditions other than the non-compete terms. The Equity Compensation Plan committee approved ECP VI on March 13, 2001 and made awards of common shares under the plan on various dates subsequently.
On March 6, 2007, the Plan Committee approved and issued ‘The Global Sources Retention Share Grant Plan’ as a supplementary or subsidiary document to the ECP 2007 Master Plan. Persons eligible to receive grants under the plan are persons who have been the employees and team members for at least five years, who retire ‘in good standing’ (as determined by the Plan Committee), and who would otherwise have their unvested shares (under any applicable equity compensation plans) forfeited upon retirement. The Plan Committee is to determine who amongst eligible persons will be granted awards of common shares. The number of common shares to be awarded to such grantees is calculated according to a formula defined in the plan, and will vest in equal installments over a period of five years after retirement, subject to certain non-compete terms and the grantees remaining ‘in good standing’. There is no other vesting conditions other than the non-compete terms. The plan commenced with effect from March 6, 2007, and will terminate upon the expiration or termination of the ECP 2007 Master Plan, or upon the liquidation of the Company, or upon termination by the Plan Committee, whichever is the earliest to occur. The Plan Committee approved awards of common shares under the plan during 2007 to 2013.
On May 9, 2012, the Company established The Global Sources Retention Share Grant Plan II (amended effective as at May 1, 2012) to issue share awards to former employees and former team members when they resign or retire from their respective employment or consultancy service. Under this plan, the share grants vest over a five-year period on a graded vesting basis, with a percentage of shares vesting each year. The grantee is subject to the non- compete terms stipulated in the plan. There is no vesting conditions other than the non-compete terms. The shares awarded to a grantee can be issued by the Company to the trustee of the 2007 Trust, to be held by the trustee, at any time following the award thereof or can be issued by the Company directly to the grantee, in accordance with the vesting rules. The Company recognizes the intangible asset relating to the non-compete provisions of the awards under the ECP VI, The Global Sources Retention Share Grant Plan and The Global Sources Retention Share Grant Plan II at the fair value on date of grant in accordance with note 2.15(b).
As at December 31, 2013 and December 31, 2012, there was $702 and $1,369 balance of intangible asset, respectively, associated with the awards under the ECP VI, The Global Sources Retention Share Grant Plan and The Global Sources Retention Share Grant Plan II which is expected to be amortized over the next five years. During the year ended December 31, 2013 the Company recorded $748 (2012: $751; 2011: $764) amortization of intangible assets associated with the awards under these plans.
GLOBAL SOURCES LTD. AND SUBSIDIARIES
NOTES TO THE CONSOLIDATED FINANCIAL STATEMENTS
(In U.S. Dollars Thousands, Except Number of Shares and Per Share Data)
The Company’s non-vested shares as at December 31, 2013 and 2012 and changes during the year ended December 31, 2013 and 2012 were as follows:
| | | | | | | | | | | | | | | | | | | The Global Sources | | | | |
| | | | | | | | | | | | | | | | | | | Retention Share Grant | | | | |
| | | | | | | | | | | | | | | The Global Sources | | Plan and the Global | | The Global Sources |
| | | | | | | | | | | | | | | Share Grant Award | | Sources Retention | | Directors Share Grant |
| | | ECP V Grant Plan | | ECP VI Grant Plan | | ECP VII Grant Plan | | Plan | | Share Grant Plan II | | Award Plan |
| | | | | | | | | | | | | | | | | | | | | Weighted | | | | |
| | | | | Weighted | | | | Weighted | | | | Weighted | | | | Weighted | | | | average | | | | Weighted |
| | | | | average | | Number | | average | | | | average | | | | average | | | | grant | | | | average |
| | | Number | | grant date | | of | | grant date | | Number | | grant date | | Number | | grant date | | Number | | date fair | | Number | | grant date |
| | | of shares | | fair value | | shares | | fair value | | of shares | | fair value | | of shares | | fair value | | of shares | | value | | of shares | | fair value |
| Non-vested at | | | | | | | | | | | | | | | | | | | | | | | | | | | | | | | | | | | | | | | | | | | | | | | | | |
| January 1, | | | | | | | | | | | | | | | | | | | | | | | | | | | | | | | | | | | | | | | | | | | | | | | | | |
| 2013 | | | | 18,100 | | | $ | 5.75 | | | | 1,500 | | | $ | 7.42 | | | | - | | | | - | | | | 1,439,836 | | | $ | 8.25 | | | | 280,297 | | | $ | 7.43 | | | | 84,000 | | | $ | 7.40 | |
| Granted | | | | - | | | | - | | | | - | | | | - | | | | - | | | | - | | | | 314,352 | | | $ | 7.57 | | | | 19,430 | | | $ | 7.52 | | | | 21,000 | | | $ | 7.36 | |
| Vested | | | | (3,100 | ) | | $ | 7.11 | | | | - | | | | - | | | | - | | | | - | | | | (296,477 | ) | | $ | 10.28 | | | | (98,834 | ) | | $ | 7.58 | | | | (21,000 | ) | | $ | 7.62 | |
| Forfeited | | | | - | | | | - | | | | - | | | | - | | | | - | | | | - | | | | (25,238 | ) | | $ | 7.58 | | | | (554 | ) | | $ | 9.38 | | | | - | | | $ | - | |
| Non-vested at | | | | | | | | | | | | | | | | | | | | | | | | | | | | | | | | | | | | | | | | | | | | | | | | | |
| December 31, | | | | | | | | | | | | | | | | | | | | | | | | | | | | | | | | | | | | | | | | | | | | | | | | | |
| 2013 | | | | 15,00 | | | $ | 5.46 | | | | 1,500 | | | $ | 7.42 | | | | - | | | | - | | | | 1,432,473 | | | $ | 7.70 | | | | 200,339 | | | $ | 7.36 | | | | 84,000 | | | $ | 7.33 | |
| Non-vested at January 1, | | | | | | | | | | | | | | | | | | | | | | | | | | | | | | | | | | | | | | | | | | | | | | | | | |
| 2012 | | | | 21,200 | | | $ | 5.95 | | | | 2,000 | | | $ | 7.42 | | | | 135,625 | | | $ | 6.86 | | | | 1,340,673 | | | $ | 9.28 | | | | 302,577 | | | $ | 7.96 | | | | 64,500 | | | $ | 8.10 | |
| Granted | | | | - | | | | - | | | | - | | | | - | | | | - | | | | - | | | | 365,238 | | | $ | 5.07 | | | | 72,044 | | | $ | 6.16 | | | | 19,500 | | | $ | 5.08 | |
| Vested | | | | (3,100 | ) | | $ | 7.11 | | | | (500 | ) | | $ | 7.42 | | | | (135,625 | ) | | $ | 6.86 | | | | (185,661 | ) | | $ | 9.40 | | | | (88,808 | ) | | $ | 8.14 | | | | - | | | | - | |
| Forfeited | | | | - | | | | - | | | | - | | | | - | | | | - | | | | - | | | | (80,414 | ) | | $ | 8.31 | | | | (5,516 | ) | | $ | 8.29 | | | | - | | | | - | |
| Non-vested at | | | | | | | | | | | | | | | | | | | | | | | | | | | | | | | | | | | | | | | | | | | | | | | | | |
| December 31, | | | | | | | | | | | | | | | | | | | | | | | | | | | | | | | | | | | | | | | | | | | | | | | | | |
| 2012 | | | | 18,100 | | | $ | 5.75 | | | | 1,500 | | | $ | 7.42 | | | | - | | | | - | | | | 1,439,836 | | | $ | 8.25 | | | | 280,297 | | | $ | 7.43 | | | | 84,000 | | | $ | 7.40 | |
The total fair value of shares vested during the years ended December 31, 2013 and 2012 were as follows:
| | | | | | | | | | | The | | | | |
| | | | | | | | | | | Global | | | | |
| | | | | | | | | | | Sources | | | | |
| | | | | | | | | | | Retention | | The | | |
| | | | | | | | | The | | Share Grant | | Global | | |
| | | | | | | | | Global | | Plan and the | | Sources | | |
| | | | | | | | | Sources | | Global | | Directors | | |
| | | | | | | | | Share | | Sources | | Share | | |
| Year ended | | | | ECP VI | | | | Grant | | Retention | | Grant | | |
| December | | ECP V | | Grant | | ECP VII | | Award | | Share Grant | | Award | | |
| 31, | | Grant Plan | | Plan | | Grant Plan | | Plan | | Plan II | | Plan | | Total |
| | 2013 | | | $ | 24 | | | $ | - | | | $ | - | | | $ | 1,922 | | | $ | 694 | | | $ | 136 | | | $ | 2,776 | |
| | 2012 | | | $ | 19 | | | $ | 3 | | | $ | 658 | | | $ | 905 | | | $ | 578 | | | $ | - | | | $ | 2,163 | |
Non-cash compensation expenses associated with the employee and team member Equity Compensation Plans and Global Sources Directors Share Grant Award Plan included under various categories of operating expenses are approximately as follows: sales: $539 (2012: $565; 2011: $737), community and content: $43 (2012: $70; 2011: $234), general and administrative $1,340 (2012: $1,524; 2011: $1,528), and information and technology: $248 (2012: $250; 2011: $278).
GLOBAL SOURCES LTD. AND SUBSIDIARIES
NOTES TO THE CONSOLIDATED FINANCIAL STATEMENTS
(In U.S. Dollars Thousands, Except Number of Shares and Per Share Data)
| | | Accumulated other | | | | |
| | | comprehensive income | | | | |
| | | | | Currency | | | | |
| | | Fair value | | translation | | Capital | | |
| | | reserve | | reserve | | reserve | | Total |
| At January 1, 2013 | | $ | 33 | | | $ | 6,750 | | | $ | 149,846 | | | $ | 156,629 | |
| Fair value gains (note 14) | | | 61 | | | | - | | | | - | | | | 61 | |
| Reclassification to income statement on | | | | | | | | | | | | | | | | |
| disposal of available-for-sale financial asset | | | (64 | ) | | | - | | | | - | | | | (64 | ) |
| Currency translation differences | | | - | | | | 3,170 | | | | - | | | | 3,170 | |
| Less: Share of non-controlling interests | | | (22 | ) | | | (74 | ) | | | - | | | | (96 | ) |
| Non-cash compensation | | | - | | | | - | | | | 2,170 | | | | 2,170 | |
| Capitalisation of intangible assets relating | | | | | | | | | | | | | | | | |
| to share grants for non-compete | | | | | | | | | | | | | | | | |
| agreements, net (note 13) | | | - | | | | - | | | | 84 | | | | 84 | |
| Issuance of shares | | | - | | | | - | | | | (4 | ) | | | (4 | ) |
| At December 31, 2013 | | $ | 8 | | | $ | 9,846 | | | $ | 152,096 | | | $ | 161,950 | |
| | | | | | | | | | | | | | | | | |
| At January 1, 2012 | | $ | - | | | $ | 5,177 | | | $ | 147,414 | | | $ | 152,591 | |
| Fair value gains (note 14) | | | 52 | | | | - | | | | - | | | | 52 | |
| Currency translation differences | | | - | | | | 1,623 | | | | - | | | | 1,623 | |
| Less : Share of non-controlling interests | | | (19 | ) | | | (50 | ) | | | - | | | | (69 | ) |
| Non-cash compensation | | | - | | | | - | | | | 2,409 | | | | 2,409 | |
| Capitalisation of intangible assets relating | | | | | | | | | | | | | | | | |
| to share grants for non-compete | | | | | | | | | | | | | | | | |
| agreements, net (note 13) | | | - | | | | - | | | | 26 | | | | 26 | |
| Issuance of shares | | | - | | | | - | | | | (3 | ) | | | (3 | ) |
| At December 31, 2012 | | $ | 33 | | | $ | 6,750 | | | $ | 149,846 | | | $ | 156,629 | |
| 23. | Deferred income and customer prepayments |
| | | December 31, | | December 31, |
| | | 2013 | | 2012 |
| Non-current portion: | | | | | | | | |
| Advertising | | $ | 664 | | | $ | 2,990 | |
| Exhibitions | | | 4,996 | | | | 6,072 | |
| | | $ | 5,660 | | | $ | 9,062 | |
| Current portion: | | | | | | | | |
| Advertising | | | 44,251 | | | | 47,904 | |
| Exhibitions, subscription and others | | | 40,453 | | | | 36,636 | |
| | | $ | 84,704 | | | $ | 84,540 | |
GLOBAL SOURCES LTD. AND SUBSIDIARIES
NOTES TO THE CONSOLIDATED FINANCIAL STATEMENTS
(In U.S. Dollars Thousands, Except Number of Shares and Per Share Data)
| | | December 31, | | December 31, |
| | | 2013 | | 2012 |
| Salaries, wages and commissions | | $ | 2,152 | | | $ | 2,507 | |
| Retirement defined contribution accruals | | | 1,563 | | | | 869 | |
| Liabilities for incentive plan | | | 1,824 | | | | 1,759 | |
| Printing, paper and bulk mailing costs | | | 46 | | | | 221 | |
| Sales commissions and fees to third parties | | | 3,787 | | | | 4,745 | |
| Business taxes | | | 4,489 | | | | 4,946 | |
| Others | | | 5,305 | | | | 5,362 | |
| | | $ | 19,166 | | | $ | 20,409 | |
From time to time the Group is involved in litigation in the normal course of business. While the results of such litigation and claims cannot be predicted with certainty, the Group believes that the probability is remote that the outcome of the outstanding litigation and the claims will individually, and in aggregate, have a material adverse effect on the Group’s consolidated financial position, results of operation and cash flows.
(a) Capital commitment
Capital expenditure contracted for at the end of the reporting period but not yet incurred is as follows:
| | | 2013 | | 2012 |
| Purchase of property and equipment | | $ | 205 | | | $ | 9 | |
| Total | | $ | 205 | | | $ | 9 | |
(b) Operating lease commitments – group company as lessee
The Group leases office facilities and exhibition venues under cancellable and non-cancellable operating leases generally with an option to renew upon expiry of the lease term.
During the first quarter of 2007, the Group entered into a number of venue license agreements for exhibition events amounting to $44,396 in payments over five and a half years. In 2010, the Group further entered into a number of venue license agreements for exhibition events amounting to a gross value approximately $19,990 in payments over five years. Subsequently, the Group signed supplemental agreements for additional space, increasing the total amount to $20,731. Again in 2012, the Group entered into additional venue license agreements for the exhibition events amounting to a gross value of approximately $21,418. All the above agreements are cancellable under force majeure or other specified conditions, or upon notice and payment of cancellation charges to the other party. The amounts paid will be expensed when the related events are held. As at December 31, 2013, the Group paid approximately, in aggregate, $53,146 for the above agreements.
In addition, the Group entered into several agreements for the venue rental for future exhibition events to be held in 2014 amounting to $476 during 2013. The amounts paid under these agreements as at December 31, 2013 were $7. The above agreements are cancellable upon notice and payment of cancellation charges to the other party.
The future aggregate minimum lease rental payments under non-cancellable operating leases for office premises and leases for exhibition venues are as follows:
| | | 2013 | | 2012 |
| No later than 1 year | | $ | 599 | | | $ | 831 | |
| Later than 1 year and no later than 5 years. | | | 85 | | | | 749 | |
| Total | | $ | 684 | | | $ | 1,580 | |
GLOBAL SOURCES LTD. AND SUBSIDIARIES
NOTES TO THE CONSOLIDATED FINANCIAL STATEMENTS
(In U.S. Dollars Thousands, Except Number of Shares and Per Share Data)
(c) Operating lease commitments – group company as lessor
The Group leases out office premises to non-related companies under non-cancellable operating leases. The future aggregate lease payments receivable under non-cancellable operating leases for office premises within the next 1 year and later than 1 year but not later than 5 years are $3,897 and $2,844, respectively.
| 27. | Related party transactions |
There were no material related party transactions during the year 2013 and 2012, except for the compensation paid or payable to key management for employee services is shown below:
| | | 2013 | | 2012 |
| Wages, salaries, bonus, fees and other short-term benefits. | | $ | 2,561 | | | $ | 2,194 | |
| Non-cash compensation expenses | | | 998 | | | | 718 | |
| Total | | $ | 3,559 | | | $ | 2,912 | |
| 28. | Events after reporting periods |
(a) Acquisition of commercial property
In order to reduce the Group’s exposure to potential rental cost increases, and to secure office space for the Group’s continued and uninterrupted operational use, the Group has signed a sale and purchase agreement on January 20, 2014 for the purchase of commercial property on the eighth floor of No. 1 Sims Lane, Singapore, with a total gross floor area of approximately 22,496.50 square feet, together with roof top accessory lots above the eighth floor, which the Group currently leases for operational use for a total consideration of approximately $13,100. The transaction has been completed on February 10, 2014 and the total purchase consideration has been paid by the Group.
(b) Acquisition of Topranch Limited
In April 2013, the Group entered into an agreement to acquire 100% interest in Topranch Limited, subject to closing conditions.
Topranch Limited (a company incorporated in the British Virgin Islands) holds the entire issued share capital of Smart Advisory Limited (a company incorporated in Hong Kong S.A.R.), which holds 70% of the equity interests in Huanxi Information Consulting (Shenzhen) Co., Ltd. (a company incorporated in the People’s Republic of China). Huanxi Information Consulting (Shenzhen) Co., Ltd. holds 100% of the equity interests in Shenzhen Huanyue Convention & Exhibition Co., Ltd. (a company incorporated in the People’s Republic of China), which holds 80% of the equity interests in Shenzhen Xieguang Convention & Exhibition Co., Ltd. (a company incorporated in the People’s Republic of China).
Shenzhen Huanyue Convention & Exhibition Co., Ltd. organizes the Shenzhen International Machining Automation Exhibition and the Shenzhen International Metal Forming Machine Tool & Mould Exhibition. Shenzhen Xieguang Convention & Exhibition Co., Ltd. organizes the Shenzhen International Metal Cutting Machine Tool Exhibition. These events are held annually in Shenzhen, People’s Republic of China. The Group’s ownership interest in these events will further assist the Group to establish a strong presence in a fast-growing market in mainland China. With the above events’ dominant presence in the machinery industry, combined with the Group’s globally established media platform, the Group’s ownership interest in the above events will enable the Group to take advantage of the market opportunities.
The total consideration for this transaction amounts to approximately $16,600, with an initial deposit of $2,145 that was paid in 2013. The balance cash consideration of $14,455 is payable in several installments over next four years upon certain conditions being fulfilled. In addition, there is a potential obligation for the Group to pay no
GLOBAL SOURCES LTD. AND SUBSIDIARIES
NOTES TO THE CONSOLIDATED FINANCIAL STATEMENTS
(In U.S. Dollars Thousands, Except Number of Shares and Per Share Data)
more than $1,156 for transaction cost, which will be expensed upon payment. The Group expensed $231 legal and other costs relating to this transaction in 2013. The transaction has been completed in 2014.
The Group is currently in the process of valuing the assets acquired and liabilities assumed in the transaction. The Group will provide all the required disclosures upon the completion of the valuation in 2014.
(c) Purchase of treasury shares
On March 11, 2014, the Board of Directors of the Company authorized the repurchase of up to 5,000,000 of its issued and outstanding common shares by tender offer at a purchase price of $10.00 per share. The total purchase consideration for this tender offer will be up to $50,000. The Company expects to fund this share repurchase from the cash balance on hand. The offer is expected to commence before the end of April 2014 and is expected to be completed by the end of May 2014. The Company will hold the repurchased shares as treasury shares.
| 29. | Recent accounting pronouncements |
New standards, amendments and interpretations issued that are effective for the financial year beginning 1 January 2014:
| • | Amendment to IAS 36, ‘Impairment of assets’ on recoverable amount disclosures. This amendment addresses the disclosure of information about the recoverable amount of impaired assets if that amount is based on fair value less costs of disposal. The Group adopted Amendments to IAS 36 for the accounting period beginning on January 1, 2014 and the adoption of this standard is not expected to have a significant impact on the Group’s financial statements. |
IFRS 9, ‘Financial instruments’, addresses the classification, measurement and recognition of financial assets and financial liabilities. IFRS 9 was issued in November 2009 and October 2010. It replaces the parts of IAS 39 that relate to the classification and measurement of financial instruments. IFRS 9 requires financial assets to be classified into two measurement categories: those measured as at fair value and those measured at amortized cost. The determination is made at initial recognition. The classification depends on the entity’s business model for managing its financial instruments and the contractual cash flow characteristics of the instrument. For financial liabilities, the standard retains most of the IAS 39 requirements. The main change is that, in cases where the fair value option is taken for financial liabilities, the part of a fair value change due to an entity’s own credit risk is recorded in other comprehensive income rather than the income statement, unless this creates an accounting mismatch. The transitional provisions governing the switch to IFRS 9 have changed as a result of amendments to IFRS 9 and IFRS 7 – Mandatory Effective Date and Transition Disclosures. These amendments have postponed the date for mandatory first-time adoption to accounting periods beginning on or after January 1, 2018. Accordingly, the Group will adopt IFRS 9 when it becomes applicable. The Group will assess the impact on the Group’s financial statements, if any, when the final standard is announced.
There are no other IFRSs or IFRIC interpretations that are not yet effective that would be expected to have a material impact on the group.
REPORT OF MANAGEMENT ON INTERNAL CONTROL OVER FINANCIAL REPORTING
Evaluation of Disclosure Controls and Procedures
As required by Rules 13a-15(e) and 15d-15(e) under the Exchange Act, management, with the participation of our Executive Chairman and Chief Financial Officer, has evaluated the effectiveness of our disclosure controls and procedures as of the end of the period covered by this report. Disclosure controls and procedures refer to controls and other procedures designed to ensure that information required to be disclosed in the reports we file or submit under the Exchange Act is recorded, processed, summarized and reported, within the time periods specified in the rules and forms of the SEC. Disclosure controls and procedures include, without limitation, controls and procedures designed to ensure that information required to be disclosed by us in our reports that we file or submit under the Securities Exchange Act of 1934 is accumulated and communicated to management, including our Executive Chairman and Chief Financial Officer, as appropriate to allow timely decisions regarding our required disclosure.
Based on the foregoing, our Executive Chairman and Chief Financial Officer have concluded that, as of December 31, 2013, the end of the period covered by this report, our disclosure controls and procedures were effective.
Report of Management on Internal Control over Financial Reporting
Management is responsible for establishing and maintaining adequate internal control over financial reporting as such term is defined in Rule 13a-15(f) under the Exchange Act.
Internal control over financial reporting refers to a process designed by, or under the supervision of, our Executive Chairman and Chief Financial Officer and effected by our Board of Directors, Management and other personnel, to provide reasonable assurance regarding the reliability of financial reporting and the preparation of financial statements for external purposes in accordance with generally accepted accounting principles and includes those policies and procedures that:
| - | pertain to the maintenance of records that in reasonable detail accurately and fairly reflect the transactions and dispositions of our assets; |
| - | provide reasonable assurance that transactions are recorded as necessary to permit preparation of financial statements in accordance with generally accepted accounting principles, and that our receipts and expenditures are being made only in accordance with authorizations of our management and members of our board of directors; and |
| - | provide reasonable assurance regarding prevention or timely detection of unauthorized acquisition, use, or disposition of our assets that could have a material effect on our financial statements. |
Because of its inherent limitations, internal control over financial reporting may not prevent or detect misstatements. Also, projections of any evaluation of effectiveness to future periods are subject to the risk that controls may become inadequate because of changes in conditions, or that the degree of compliance with the policies or procedures may deteriorate.
Management evaluated the effectiveness of our internal control over financial reporting as of December 31, 2013 using the 1992 framework set forth in the report of the Treadway Commission’s Committee of Sponsoring Organizations (‘COSO’), ‘Internal Control — Integrated Framework.’
Based on the foregoing, management has concluded that our internal control over financial reporting was effective as of December 31, 2013. Our independent registered public accounting firm, PricewaterhouseCoopers LLP, has issued an audit report on our internal control over financial reporting, which is included herein.
Changes to Internal Controls
Management has evaluated, with the participation of our Executive Chairman and Chief Financial Officer, whether any changes in our internal control over financial reporting that occurred during our last fiscal year have materially affected, or are reasonably likely to materially affect, our internal control over financial reporting. Based on the evaluation we conducted, management has concluded that no such changes have occurred.
Enabling successful trade for over 40 years


Reliable Exporters –
Find ThemandMeet Them