| UNITED STATES SECURITIES AND EXCHANGE COMMISSION Washington, D.C. 20549 |
| FORM N-CSR |
| CERTIFIED SHAREHOLDER REPORT OF REGISTERED MANAGEMENT INVESTMENT COMPANIES |
| Investment Company Act file number | 811-09903 |
| BNY Mellon Funds Trust (Exact name of Registrant as specified in charter) |
| c/o The Dreyfus Corporation 200 Park Avenue New York, New York 10166 (Address of principal executive offices) (Zip code) |
| Michael A. Rosenberg, Esq. 200 Park Avenue New York, New York 10166 (Name and address of agent for service) |
| Registrant's telephone number, including area code: | (212) 922-6000 |
| Date of fiscal year end: | 12/31 | |
| Date of reporting period: | 12/31/2008 |
| FORM N-CSR |
| Item 1. | Reports to Stockholders. |
The BNY Mellon Funds
BNY Mellon Intermediate U.S. Government Fund
| ANNUAL REPORT |
| December 31, 2008 |
The views expressed herein are current to the date of this report. These views and the composition of the fund’s portfolio are subject to change at any time based on market and other conditions.

| Contents | |
| THE FUND | |
| 2 | A Letter from the President |
| 3 | Discussion of Fund Performance |
| 6 | Fund Performance |
| 8 | Understanding Your Fund’s Expenses |
| 8 | Comparing Your Fund’s Expenses With Those of Other Funds |
| 9 | Statement of Investments |
| 14 | Statement of Assets and Liabilities |
| 15 | Statement of Operations |
| 16 | Statement of Changes in Net Assets |
| 18 | Financial Highlights |
| 20 | Notes to Financial Statements |
| 30 | Report of Independent Registered Public Accounting Firm |
| 31 | Important Tax Information |
| 32 | Information About the Review and Approval of the Fund’s Investment Advisory Agreement |
| 36 | Board Members Information |
| 40 | Officers of the Trust |
| FOR MORE INFORMATION | |
| Back Cover | |
| BNY Mellon Intermediate U.S. Government Fund |
| The Fund |

A LETTER FROM THE PRESIDENT
Dear Shareholder:
We present to you this annual report for BNY Mellon Intermediate U.S. Government Fund, covering the 12-month period from January 1, 2008, through December 31, 2008.
2008 was the most difficult year in decades for the financial markets. A credit crunch that began in 2007 exploded in mid-2008 into a global financial crisis, resulting in the failures of major financial institutions, a deep and prolonged recession and lower investment values across a broad range of asset classes. Governments and regulators throughout the world moved aggressively to curtail the damage, implementing unprecedented reductions of short-term interest rates, massive injections of liquidity into the banking system, government bailouts of struggling companies and plans for massive economic stimulus programs. U.S. government securities generally fared well in the ensuing “flight to quality,” but riskier bond market sectors suffered sharp price declines.
Although we expect the U.S. and global economies to remain weak until longstanding imbalances have worked their way out of the system, the financial markets currently appear to have priced in investors’ generally low expectations. In previous recessions, however, the markets have tended to anticipate economic improvement before it occurs, potentially leading to major rallies when few expected them.That’s why it makes sense to remain disciplined, maintain a long-term perspective and adopt a consistent asset allocation strategy that reflects one’s future goals and attitudes toward risk. As always, we urge you to consult with your portfolio manager, who can recommend the course of action that is right for you.
For information about how the fund performed during the reporting period, as well as market perspectives, we have provided a Discussion of Fund Performance.
Thank you for your continued confidence and support.
Sincerely,

| Christopher E. Sheldon President BNY Mellon Funds Trust January 15, 2009 |
2

DISCUSSION OF FUND PERFORMANCE
For the period of January 1, 2008, through December 31, 2008, as provided by John Flahive, Portfolio Manager
Fund and Market Performance Overview
For the 12-month period ended December 31, 2008, BNY Mellon Intermediate U.S. Government Fund’s Class M shares achieved a total return of 8.31% and the fund’s Investor shares achieved a total return of 8.06% .1 In comparison, the Barclays Capital Intermediate Government Bond Index (the “Index”), the fund’s benchmark, achieved a total return of 10.43% and the funds reported in the Lipper Intermediate U.S. Government category provided an average return of 6.61% for the same period.2,3
The fund underperformed its benchmark largely because its exposure to non-Treasury securities, particularly mortgage-backed securities, was greater than the benchmark’s. In this year’s extremely risk-averse environment,Treasuries offered much stronger performance.We anticipate bringing the fund’s composition closer to that of the benchmark in the upcoming reporting period.
The Fund’s Investment Approach
The fund seeks to provide a high level of current income as is consistent with the presentation of capital.To pursue this goal, the fund normally invests at least 80% of its assets in securities issued or guaranteed by the U.S. government or its agencies or instrumentalities, including U.S. Treasury obligations, direct U.S. government agency debt obligations, and U.S.government agency mortgage-backed securities,including mortgage pass-through securities and collateralized mortgage obligations (CMOs). The securities in which the fund invests include those backed by the full faith and credit of the U.S. government and those that are neither insured nor guaranteed by the U.S. government.
When choosing securities, we typically first examine U.S. and global economic conditions and other market factors to estimate long- and short-term interest rates. Using a research-driven investment process, we then analyze economic trends, particularly interest rate movements and yield spreads, to determine which types of securities offer the best investment opportunities.
The Fund 3
| DISCUSSION OF FUND PERFORMANCE (continued) |
A Dramatic Year
The financial markets in 2008 were largely defined by the volatility they endured during their last three and a half months, beginning with the collapse of Lehman Brothers in mid-September. That once-venerable institution’s rapid fall had ripple effects that created severe dislocations and liquidity breakdowns in all the capital markets.These in turn drove the massive flight to quality that caused Treasury yields to plummet beyond any kind of historical norm.
As the financial crisis intensified, the Federal Reserve Board made a series of moves to reduce the short-term interest rate target, ultimately bringing the rate down to near zero. In addition, Congress enacted a sweeping bailout package in an effort to shore up financial institutions and restore confidence in the markets.
The dramatic slowdown in economic activity seen over the year was largely attributable to the many problems associated with declining housing values and the issues surrounding subprime lending.Although the question of whether the U.S. economy was in recession was a matter of some controversy for much of 2008, by the time official word came in December that a recession had been in progress for more than a year, few people were surprised.
A Look at the Portfolio
Even though the non-Treasury securities in the portfolio, including mortgage-backed securities, were all rated AAA, they significantly underperformed Treasuries during the reporting period.This was the greatest force detracting from the fund’s performance for the year.We simply didn’t anticipate how low Treasury yields would fall — and indeed most market participants have been somewhat surprised by the degree of this move.We kept the fund’s duration, or sensitivity to interest-rate shifts, close to neutral relative to the benchmark, so it was not a significant factor in the fund’s relative performance.
We are continuing our efforts to bring the fund’s composition more in line with that of the Index. As we have reduced the fund’s position in mortgage-backed securities, we have increased its weightings in Treasuries and agency-backed issues. We are, however, still willing to make modest deviations from the Index when we deem it appropriate. For example, we’re now keeping the fund’s duration just short of the benchmark’s, based on our belief that longer duration securities are not offering sufficient return for the perceived risk, given how lowTreasury
4
rates are now.To this end, we are moving out of longer-term Treasuries and taking a more bulleted approach.
We are also including a few moreTreasury Inflation-Protected Securities, or TIPS, in the portfolio. Instead of having approximately a 2% exposure to TIPS, we anticipate leaning toward a 4% to 5% exposure. Relatively speaking, we think TIPS have the potential to outperform in a market environment that shows some signs of inflation. Although inflation has not recently been a problem, there are some concerns that the very low interest rates that currently prevail could cause it to re-emerge.
Looking Forward
Although there have been some signs of improved stability in the financial markets, we believe that the markets are not done with volatility and economic uncertainty. Investors are likely to retain a high level of risk aversion, which can lead to rapid shifts in the market should further negative developments come to light.
There is some potential for volatility among Treasury securities, as the market grapples with the question of whether inflation is likely to be a problem as the economy moves toward recovery. Another area of concern is whether foreign participants in the Treasury market will continue to buy Treasury debt at the very low nominal rates currently available, particularly in light of the possibility that the high budget and trade deficits in the U.S. could spark currency volatility as well.
In short, many of the potential factors for continued market volatility remain. In this environment, we believe moving the portfolio toward the composition of the benchmark Index, while shortening the fund’s duration, is an appropriate, cautious approach to take in the year ahead.
January 15, 2009
| 1 | Total return includes reinvestment of dividends and any capital gains paid. Past performance is no | |
| guarantee of future results. Share price, yield and investment return fluctuate such that upon | ||
| redemption, fund shares may be worth more or less than their original cost. Return figures reflect | ||
| the absorption of certain fund expenses by the investment adviser pursuant to an agreement in | ||
| effect through September 30, 2010, at which time it may be extended, terminated or modified. | ||
| Had these expenses not been absorbed, the fund’s returns would have been lower. | ||
| 2 | SOURCE: LIPPER INC. — Reflects reinvestment of dividends and, where applicable, capital | |
| gain distributions.The Barclays Capital Intermediate Government Index is an unmanaged index | ||
| designed to measure the performance of intermediate-term government bonds. Index returns do not | ||
| reflect fees and expenses associated with operating a mutual fund. | ||
| 3 | Source: Lipper Inc. |
The Fund 5
| FUND PERFORMANCE |

| Average Annual Total Returns as of 12/31/08 | ||||||
| 1 Year | 5 Years | 10 Years | ||||
| Class M shares | 8.31% | 4.85% | 5.33% | |||
| Investor shares | 8.06% | 4.59% | 5.06% |
| † Source: Lipper Inc. |
| Past performance is not predictive of future performance.The fund’s performance shown in the graph and table does not |
| reflect the deduction of taxes that a shareholder would pay on fund distributions or the redemption of fund shares. |
| The above graph compares a $10,000 investment made in Class M shares and Investor shares of BNY Mellon |
| Intermediate U.S. Government Fund on 12/31/98 to a $10,000 investment made in the Barclays Capital |
| Intermediate Government Index (the “Index”) on that date.All dividends and capital gain distributions are reinvested. |
6
As of the close of business on September 12, 2008, substantially all of the assets of another investment company advised by an affiliate of the fund’s investment adviser, BNY Hamilton Intermediate Government Fund (the “predecessor fund”), a series of BNY Hamilton Funds, Inc., were transferred to BNY Mellon Intermediate U.S. Government Fund in a tax-free reorganization and the fund commenced operations. The performance figures for the fund’s Class M shares represent the performance of the predecessor fund’s Institutional shares prior to the commencement of operations for BNY Mellon Intermediate U.S. Government Fund and the performance of BNY Mellon Intermediate U.S. Government Fund’s Class M shares thereafter. The performance figures for Investor shares represent the performance of the predecessor fund’s Class A shares prior to the commencement of operations for BNY Mellon Intermediate U.S. Governm ent Fund and the performance of BNY Mellon Intermediate U.S. Government Fund’s Investor shares thereafter. Investor shares are subject to a Shareholder Services Plan. Performance for Investor shares will vary from the performance of Class M shares shown because of the differences in charges and expenses.
The fund’s performance shown in the line graph takes into account all applicable fees and expenses for all share classes. The Index is an unmanaged index designed to measure the performance of intermediate-term government bonds. Unlike a mutual fund, the Index is not subject to charges, fees and other expenses. Investors cannot invest directly in any index. Further information relating to fund performance, including expense reimbursements, if applicable, is contained in the Financial Highlights section of the prospectus and elsewhere in this report.
The Fund 7
UNDERSTANDING YOUR FUND’S EXPENSES (Unaudited)
As a mutual fund investor, you pay ongoing expenses, such as management fees and other expenses. Using the information below, you can estimate how these expenses affect your investment and compare them with the expenses of other funds.You also may pay one-time transaction expenses, including sales charges (loads) and redemption fees, which are not shown in this section and would have resulted in higher total expenses. For more information, see your fund’s prospectus or talk to your financial adviser.
Review your fund’s expenses
The table below shows the expenses you would have paid on a $1,000 investment in BNY Mellon Intermediate U.S. Government Fund from July 1, 2008 to December 31, 2008. It also shows how much a $1,000 investment would be worth at the close of the period, assuming actual returns and expenses.
| Expenses and Value of a $1,000 Investment |
| assuming actual returns for the six months ended December 31, 2008 |
| Class M Shares | Investor Shares | |||
| Expenses paid per $1,000† | $ 3.38 | $ 4.67 | ||
| Ending value (after expenses) | $1,067.10 | $1,065.90 |
| COMPARING YOUR FUND’S EXPENSES WITH THOSE OF OTHER FUNDS (Unaudited) |
Using the SEC’s method to compare expenses
The Securities and Exchange Commission (SEC) has established guidelines to help investors assess fund expenses. Per these guidelines, the table below shows your fund’s expenses based on a $1,000 investment, assuming a hypothetical 5% annualized return. You can use this information to compare the ongoing expenses (but not transaction expenses or total cost) of investing in the fund with those of other funds.All mutual fund shareholder reports will provide this information to help you make this comparison. Please note that you cannot use this information to estimate your actual ending account balance and expenses paid during the period.
| Expenses and Value of a $1,000 Investment |
| assuming a hypothetical 5% annualized return for the six months ended December 31, 2008 |
| Class M Shares | Investor Shares | |||
| Expenses paid per $1,000† | $ 3.30 | $ 4.57 | ||
| Ending value (after expenses) | $1,021.87 | $1,020.61 |
| † Expenses are equal to the fund’s annualized expense ratio of .65% for Class M Shares and .90% for Investors Shares, |
| multiplied by the average account value over the period, multiplied by 184/366 (to reflect the one-half year period). |
8
| STATEMENT OF INVESTMENTS | ||||||||
| December 31, 2008 | ||||||||
| Coupon | Maturity | Principal | ||||||
| Bonds and Notes—96.6% | Rate (%) | Date | Amount ($) | Value ($) | ||||
| Banks—7.9% | ||||||||
| Bank of America, | ||||||||
| Gtd. Notes | 3.13 | 6/15/12 | 1,500,000 | 1,560,045 | ||||
| Goldman Sachs Group, | ||||||||
| Gtd. Notes | 3.25 | 6/15/12 | 400,000 | 417,668 | ||||
| JPMorgan Chase, | ||||||||
| Gtd. Notes | 3.13 | 12/1/11 | 1,400,000 | 1,455,468 | ||||
| Key Bank, | ||||||||
| Gtd. Notes | 3.20 | 6/15/12 | 1,500,000 | 1,559,715 | ||||
| Morgan Stanley, | ||||||||
| Gtd. Notes | 2.90 | 12/1/10 | 2,500,000 | 2,566,587 | ||||
| Regions Bank, | ||||||||
| Gtd. Notes | 3.25 | 12/9/11 | 1,500,000 | 1,561,632 | ||||
| Wells Fargo & Co., | ||||||||
| Gtd. Notes | 3.00 | 12/9/11 | 875,000 | 910,338 | ||||
| 10,031,453 | ||||||||
| Diversified Financial Services—1.2% | ||||||||
| General Electric Capital, | ||||||||
| Gtd. Notes | 3.00 | 12/9/11 | 1,500,000 | 1,551,861 | ||||
| U.S. Government Agencies—18.2% | ||||||||
| Federal Farm Credit Banks, | ||||||||
| Bonds | 2.63 | 4/21/11 | 1,000,000 | 1,029,548 | ||||
| Federal Farm Credit Banks, | ||||||||
| Bonds | 3.88 | 8/25/11 | 2,095,000 | 2,227,408 | ||||
| Federal Home Loan Banks, | ||||||||
| Bonds | 3.63 | 10/18/13 | 2,105,000 | 2,216,874 | ||||
| Federal Home Loan Banks, | ||||||||
| Bonds | 4.25 | 6/14/13 | 1,040,000 | 1,118,934 | ||||
| Federal Home Loan Banks, | ||||||||
| Bonds | 4.88 | 11/18/11 | 1,500,000 | 1,639,111 | ||||
| Federal Home Loan Banks, | ||||||||
| Bonds | 4.88 | 12/13/13 | 6,710,000 | 7,435,807 | ||||
| Federal Home Loan Mortgage Corp., | ||||||||
| Notes | 4.00 | 7/28/11 | 1,190,000 a | 1,208,733 | ||||
| Federal National Mortgage | ||||||||
| Association, Notes | 2.88 | 10/12/10 | 820,000 a | 846,164 | ||||
The Fund 9
| STATEMENT OF INVESTMENTS (continued) |

10
| Principal | ||||
| Bonds and Notes (continued) | Amount ($) | Value ($) | ||
| U.S. Government Agencies/ | ||||
| Mortgage-Backed (continued) | ||||
| Federal National Mortgage Association (continued): | ||||
| 4.46%, 10/1/31 | 262,164 a,b | 258,932 | ||
| 4.49%, 10/1/33 | 148,515 a,b | 146,667 | ||
| 4.50%, 5/1/24 | 156,109 a | 158,914 | ||
| 4.52%, 4/1/33—11/1/34 | 620,231 a,b | 613,944 | ||
| 4.70%, 6/1/33 | 563,059 a,b | 566,607 | ||
| 4.72%, 10/1/34 | 160,560 a,b | 160,607 | ||
| 4.75%, 1/1/29 | 291,002 a,b | 294,438 | ||
| 5.07%, 8/1/33 | 290,400 a,b | 292,340 | ||
| 5.11%, 2/1/33 | 98,337 a,b | 101,070 | ||
| 5.18%, 10/1/19 | 162,242 a,b | 163,464 | ||
| 5.20%, 6/1/34 | 233,086 a,b | 233,134 | ||
| 5.22%, 9/1/33 | 322,811 a,b | 324,549 | ||
| 5.25%, 4/1/30 | 32,769 a,b | 32,636 | ||
| 5.36%, 2/1/36 | 146,433 a,b | 148,265 | ||
| 5.48%, 1/1/27 | 279,551 a,b | 280,022 | ||
| 5.80%, 3/1/36 | 179,805 a,b | 183,392 | ||
| 6.00%, 12/1/10 | 11,355 a | 11,797 | ||
| 6.20%, 4/1/40 | 355,138 a,b | 361,354 | ||
| 6.25%, 11/1/12 | 104,545 a | 108,777 | ||
| 6.87%, 7/1/22 | 132,106 a | 139,539 | ||
| 7.00%, 9/1/19—5/1/29 | 603,333 a | 638,708 | ||
| 7.50%, 5/1/09—11/1/29 | 232,462 a | 246,818 | ||
| 7.83%, 12/1/24 | 38,182 a,b | 40,372 | ||
| 8.00%, 6/1/15—10/1/29 | 687,216 a | 726,937 | ||
| 8.35%, 11/1/24 | 75 a,b | 79 | ||
| 8.50%, 10/1/26 | 103,197 a | 111,077 | ||
| 9.00%, 4/1/16—3/1/22 | 18,558 a | 19,767 | ||
| Principal Only, | ||||
| Ser. 1993-253 Cl. H, 0.00%, 11/25/23 | 25,995 a | 22,232 | ||
| Ser. 1992-136 Cl. PK, 6.00%, 8/25/22 | 141,753 a | 147,723 | ||
| Ser. 1993-178 Cl. PK, 6.50%, 9/25/23 | 1,870,200 a | 1,964,617 | ||
| Ser. 1992-172 Cl. M, 7.00%, 9/25/22 | 31,051 a | 32,790 | ||
| Ser. 1993-149 Cl. M, 7.00%, 8/25/23 | 520,334 a | 556,546 | ||
| Ser. 1993-255 Cl. E, 7.10%, 12/25/23 | 1 ,192,392 a | 1,255,850 | ||
| Ser. 1988-15 Cl. A, 9.00%, 6/25/18 | 191,445 a | 210,902 |
The Fund 11
| STATEMENT OF INVESTMENTS (continued) |
| Principal | ||||
| Bonds and Notes (continued) | Amount ($) | Value ($) | ||
| U.S. Government Agencies/ | ||||
| Mortgage-Backed (continued) | ||||
| Government National Mortgage Association I: | ||||
| 6.00%, 8/15/31 | 35,183 | 36,469 | ||
| 6.50%, 3/15/09—7/15/24 | 341,021 | 357,133 | ||
| 7.00%, 6/15/13—11/15/26 | 72,322 | 76,494 | ||
| 7.50%, 4/15/23—6/15/24 | 28,106 | 29,800 | ||
| 7.68%, 1/15/22 | 139,745 | 147,494 | ||
| 8.00%, 7/15/28 | 7,730 | 8,247 | ||
| 8.50%, 2/15/20 | 2,192 | 2,346 | ||
| 9.00%, 3/15/17—4/15/18 | 50,811 | 54,306 | ||
| 9.50%, 5/15/19 | 1,099 | 1,198 | ||
| Government National Mortgage Association II: | ||||
| 4.50%, 5/20/20—1/20/34 | 1,076,708 | 1,091,082 | ||
| 4.63%, 8/20/30 | 200,388 b | 195,927 | ||
| 5.13%, 10/20/22 | 19,730 b | 19,519 | ||
| 5.38%, 2/20/24 | 148,364 b | 147,152 | ||
| 6.00%, 9/20/14 | 38,324 | 39,785 | ||
| 6.50%, 10/20/33 | 281,026 | 294,731 | ||
| 7.50%, 11/20/15—9/20/25 | 131,531 | 138,955 | ||
| 8.50%, 12/20/26 | 31,559 | 33,815 | ||
| 20,521,091 | ||||
| U.S. Government Securities—53.2% | ||||
| U.S. Treasury Bonds; | ||||
| 7.25%, 5/15/16 | 2,800,000 | 3,750,032 | ||
| U.S. Treasury Inflation Protected Securities: | ||||
| Notes, 1.38%, 7/15/18 | 35,163 c | 32,897 | ||
| Notes, 2.38%, 1/15/17 | 3,298,040 c | 3,273,047 | ||
| U.S. Treasury Notes: | ||||
| 1.75%, 11/15/11 | 1,500,000 | 1,534,685 | ||
| 3.50%, 2/15/18 | 4,060,000 | 4,495,183 | ||
| 3.88%, 5/15/18 | 635,000 | 724,298 | ||
| 4.13%, 8/15/10 | 8,470,000 | 8,974,566 | ||
| 4.25%, 1/15/11 | 11,720,000 | 12,609,993 | ||
| 4.25%, 8/15/13 | 8,750,000 | 9,951,078 | ||
| 4.63%, 8/31/11 | 5,165,000 | 5,678,680 | ||
| 4.63%, 2/29/12 | 11,250,000 | 12,496,298 | ||
| 5.13%, 5/15/16 | 3,375,000 | 4,087,706 | ||
| 67,608,463 | ||||
| Total Bonds and Notes | ||||
| (cost $118,338,040) | 122,886,765 |
12
| Other Investment—1.7% | Shares | Value ($) | ||
| Registered Investment Company; | ||||
| Dreyfus Institutional Preferred | ||||
| Plus Money Market Fund | ||||
| (cost $2,195,000) | 2,195,000 d | 2,195,000 | ||
| Total Investments (cost $120,533,040) | 98.3% | 125,081,765 | ||
| Cash and Receivables (Net) | 1.7% | 2,180,218 | ||
| Net Assets | 100.0% | 127,261,983 | ||
| a On September 7, 2008, the Federal Housing Finance Agency (FHFA) placed Federal National Mortgage |
| Association and Federal Home Loan Mortgage Corporation into conservatorship with FHFA as the conservator.As |
| such, the FHFA will oversee the continuing affairs of these companies. |
| b Variable rate security—interest rate subject to periodic change. |
| c Principal amount for accrual purposes is periodically adjusted based on changes in the Consumer Price Index. |
| d Investment in affiliated money market mutual fund. |
| Portfolio Summary (Unaudited)† | ||||||
| Value (%) | Value (%) | |||||
| U.S. Government & Agencies | 87.5 | Money Market Investment | 1.7 | |||
| Corporate Bonds | 9.1 | 98.3 | ||||
| † Based on net assets. | ||||||
| See notes to financial statements. | ||||||
The Fund 13
| STATEMENT OF ASSETS AND LIABILITIES December 31, 2008 |
| Cost | Value | |||
| Assets ($): | ||||
| Investments in securities—See Statement of Investments: | ||||
| Unaffiliated issuers | 118,338,040 | 122,886,765 | ||
| Affiliated issuers | 2,195,000 | 2,195,000 | ||
| Cash | 195,768 | |||
| Dividends and interest receivable | 1,242,370 | |||
| Receivable for shares of Beneficial Interest subscribed | 865,548 | |||
| Other receivables | 76,136 | |||
| Prepaid expenses | 9,895 | |||
| 127,471,482 | ||||
| Liabilities ($): | ||||
| Due to The Dreyfus Corporation and affiliates—Note 3(c) | 55,446 | |||
| Due to Administrator—Note 3(a) | 14,055 | |||
| Payable for shares of Beneficial Interest redeemed | 94,044 | |||
| Accrued expenses | 45,954 | |||
| 209,499 | ||||
| Net Assets ($) | 127,261,983 | |||
| Composition of Net Assets ($): | ||||
| Paid-in capital | 123,037,475 | |||
| Accumulated undistributed investment income—net | 28,689 | |||
| Accumulated net realized gain (loss) on investments | (352,906) | |||
| Accumulated net unrealized appreciation | ||||
| (depreciation) on investments | 4,548,725 | |||
| Net Assets ($) | 127,261,983 |
| Net Asset Value Per Share | ||||
| Class M Shares | Investor Shares | |||
| Net Assets ($) | 120,970,183 | 6,291,800 | ||
| Shares Outstanding | 11,594,460 | 603,652 | ||
| Net Asset Value Per Share ($) | 10.43 | 10.42 | ||
| See notes to financial statements. | ||||
14
| STATEMENT OF OPERATIONS | ||
| Year Ended December 31, 2008 | ||
| Investment Income ($): | ||
| Income: | ||
| Interest | 5,602,869 | |
| Dividends; | ||
| Affiliated issuers | 4,013 | |
| Total Income | 5,606,882 | |
| Expenses: | ||
| Investment advisory fees—Note 3(a) | 587,395 | |
| Administration fee—Note 3(a) | 128,744 | |
| Shareholder servicing costs—Note 3(c) | 37,670 | |
| Registration fees | 34,229 | |
| Custodian fees—Note 3(c) | 30,041 | |
| Professional fees | 24,829 | |
| Trustees’ fees and expenses—Note 3(d) | 17,837 | |
| Distribution fees 3(b) | 10,574 | |
| Prospectus and shareholders’ reports | 6,129 | |
| Miscellaneous | 34,313 | |
| Total Expenses | 911,761 | |
| Less—reduction in investment advisory fees | ||
| due to undertaking—Note 3(a) | (132,395) | |
| Less—reduction in fees due to earnings credits—Note 1(b) | (481) | |
| Net Expenses | 778,885 | |
| Investment Income—Net | 4,827,997 | |
| Realized and Unrealized Gain (Loss) on Investments—Note 4 ($): | ||
| Net realized gain (loss) on investments | 1,949,660 | |
| Net unrealized appreciation (depreciation) on investments | 2,702,619 | |
| Net Realized and Unrealized Gain (Loss) on Investments | 4,652,279 | |
| Net Increase in Net Assets Resulting from Operations | 9,480,276 | |
| See notes to financial statements. | ||
The Fund 15
STATEMENT OF CHANGES IN NET ASSETS
| Year Ended December 31, | ||||
| 2008a | 2007a | |||
| Operations ($): | ||||
| Investment income—net | 4,827,997 | 4,789,807 | ||
| Net realized gain (loss) on investments | 1,949,660 | 875,278 | ||
| Net unrealized appreciation | ||||
| (depreciation) on investments | 2,702,619 | 1,780,688 | ||
| Net Increase (Decrease) in Net Assets | ||||
| Resulting from Operations | 9,480,276 | 7,445,773 | ||
| Dividends to Shareholders from ($): | ||||
| Investment income—net: | ||||
| Class M Shares | (4,101,999) | (5,036,821) | ||
| Investor Shares | (208,291) | (271,390) | ||
| Total Dividends | (4,310,290) | (5,308,211) | ||
| Beneficial InterestTransactions ($): | ||||
| Net proceeds from shares sold: | ||||
| Class M Shares | 86,183,073 | 20,252,610 | ||
| Investor Shares | 332,350 | 97,266 | ||
| Dividends reinvested: | ||||
| Class M Shares | 2,049,935 | 2,409,418 | ||
| Investor Shares | 190,880 | 243,918 | ||
| Cost of shares redeemed: | ||||
| Class M Shares | (78,823,733) | (21,719,917) | ||
| Investor Shares | (505,041) | (760,998) | ||
| Increase (Decrease) in Net Assets from | ||||
| Beneficial Interest Transactions | 9,427,464 | 522,297 | ||
| Total Increase (Decrease) in Net Assets | 14,597,450 | 2,659,859 | ||
| Net Assets ($): | ||||
| Begining of Period | 112,664,533 | 110,004,674 | ||
| End of Period | 127,261,983 | 112,664,533 | ||
| Accumulated undistributed | ||||
| investment income—net | 28,689 | — | ||
16
| Year Ended December 31, | ||||
| 2008a | 2007a | |||
| Capital Share Transactions (Shares): | ||||
| Class M | ||||
| Shares sold | 8,579,424 | 2,064,135 | ||
| Shares issued for dividends reinvested | 203,055 | 245,431 | ||
| Shares redeemed | (7,859,101) | (2,212,165) | ||
| Net Increase (Decrease) in Shares Outstanding | 923,378 | 97,401 | ||
| Investor Shares | ||||
| Shares sold | 32,504 | 9,889 | ||
| Shares issued for dividends reinvested | 18,926 | 24,871 | ||
| Shares redeemed | (50,126) | (77,375) | ||
| Net Increase (Decrease) in Shares Outstanding | 1,304 | (42,615) | ||
| a Represents information from the fund’s predecessor, BNY Hamilton Intermediate Government Fund through |
| September 12, 2008. |
| See notes to financial statements. |
The Fund 17
FINANCIAL HIGHLIGHTS
Please note that the financial highlights information in the following tables for the fund’s Class M and Investor shares represents the financial highlights of the Institutional shares and Class A shares, respectively, of the fund’s predecessor, BNY Hamilton Intermediate Government Fund (the “Intermediate Government Fund”), before the fund commenced operations as of the close of business on September 12, 2008, and represents the performance of the fund’s Class M and Investor shares thereafter. Before the fund commenced operations, substantially all of the assets of the Intermediate Government Fund were transferred to the fund in a tax-free reorganization.Total return shows how much your investment in the fund would have increased (or decreased) during each period, assuming you had reinvested all dividends and distributions. These figures have been derived from the fund’s and the fund’s predecessor’s financial statements.
| Year Ended December 31, | ||||||||||
| Class M Shares† | 2008 | 2007 | 2006 | 2005 | 2004 | |||||
| Per Share Data ($): | ||||||||||
| Net asset value, beginning of period | 9.99 | 9.81 | 9.94 | 10.15 | 10.28 | |||||
| Investment Operations: | ||||||||||
| Investment income—neta | .42 | .42 | .42 | .39 | .37 | |||||
| Net realized and unrealized | ||||||||||
| gain (loss) on investments | .39 | .23 | (.08) | (.14) | (.05) | |||||
| Total from Investment Operations | .81 | .65 | .34 | .25 | .32 | |||||
| Distributions: | ||||||||||
| Dividends from investment income—net | (.37) | (.47) | (.47) | (.46) | (.45) | |||||
| Net asset value, end of period | 10.43 | 9.99 | 9.81 | 9.94 | 10.15 | |||||
| Total Return (%) | 8.31 | 6.80 | 3.58 | 2.51 | 3.18 | |||||
| Ratios/Supplemental Data (%): | ||||||||||
| Ratio of total expenses | ||||||||||
| to average net assets | .76 | .77 | .78 | .78 | .86 | |||||
| Ratio of net expenses | ||||||||||
| to average net assets | .65 | .65 | .65 | .65 | .72 | |||||
| Ratio of net investment income | ||||||||||
| to average net assets | 4.12 | 4.31 | 4.27 | 3.88 | 3.65 | |||||
| Portfolio Turnover Rate | 85.47 | 57 | 21 | 29 | 8 | |||||
| Net Assets, end of period ($ x 1,000) | 120,970 | 106,650 | 103,686 | 114,209 | 111,963 | |||||
| † | Represents information from Institutional shares of the fund’s predecessor, BNY Hamilton Intermediate Government | |
| Fund, through September 12, 2008. | ||
| a | Based on average shares outstanding at each month end. | |
| See notes to financial statements. | ||
18
| Year Ended December 31, | ||||||||||
| Investor Shares† | 2008 | 2007 | 2006 | 2005 | 2004 | |||||
| Per Share Data ($): | ||||||||||
| Net asset value, beginning of period | 9.98 | 9.80 | 9.93 | 10.14 | 10.27 | |||||
| Investment Operations: | ||||||||||
| Investment income—neta | .39 | .40 | .39 | .36 | .35 | |||||
| Net realized and unrealized | ||||||||||
| gain (loss) on investments | .40 | .23 | (.07) | (.14) | (.06) | |||||
| Total from Investment Operations | .79 | .63 | .32 | .22 | .29 | |||||
| Distributions: | ||||||||||
| Dividends from investment income—net | (.35) | (.45) | (.45) | (.43) | (.42) | |||||
| Net asset value, end of period | 10.42 | 9.98 | 9.80 | 9.93 | 10.14 | |||||
| Total Return (%) | 8.06 | 6.53 | 3.32 | 2.25 | 2.92 | |||||
| Ratios/Supplemental Data (%): | ||||||||||
| Ratio of total expenses | ||||||||||
| to average net assets | 1.01 | 1.02 | 1.03 | 1.03 | 1.11 | |||||
| Ratio of net expenses | ||||||||||
| to average net assets | .90 | .90 | .90 | .90 | .98 | |||||
| Ratio of net investment income | ||||||||||
| to average net assets | 3.87 | 4.06 | 4.02 | 3.62 | 3.39 | |||||
| Portfolio Turnover Rate | 85.47 | 57 | 21 | 29 | 8 | |||||
| Net Assets, end of period ($ x 1,000) | 6,292 | 6,015 | 6,319 | 7,161 | 10,505 | |||||
| † | Represents information from Class A shares of the fund’s predecessor, BNY Hamilton Intermediate Government | |
| Fund, through September 12, 2008. | ||
| a | Based on average shares outstanding at each month end. | |
| See notes to financial statements. | ||
The Fund 19
NOTES TO FINANCIAL STATEMENTS
NOTE 1—Significant Accounting Policies:
BNY Mellon FundsTrust (the “Trust”) was organized as a Massachusetts business trust which is registered under the Investment Company Act of 1940, as amended (the “Act”), as an open-end management investment company and operates as a series company currently comprised of twenty-one series including the BNY Mellon Intermediate U.S. Government Fund (the “Fund”). The fund’s investment objective seeks to provide as high a level of current income as is consistent with the preservation of capital. BNY Mellon Fund Advisers, a division of The Dreyfus Corporation (the “Manager” or “Dreyfus”), a wholly-owned subsidiary of The Bank of New York Mellon Corporation (“BNY Mellon”), serves as the fund’s investment adviser (“Investment Adviser”). The Bank of New York Mellon, a subsidiary of BNY Mellon and an affiliate of Dreyfus, serves as administrator for the fund pursuant to an Administration Agreement with the Trust (the “Administration Agreement”). The Bank of New York Mellon has entered into a Sub-Administration Agreement with Dreyfus pursuant to which The Bank of New York Mellon pays Dreyfus for performing certain administrative services.
At a meeting held on September 9, 2008, the Trust’s Board of Trustees approved the change of the fund’s fiscal year end from December 31st to August 31st.
As of the close of business on September 12, 2008, pursuant to an Agreement and Plan of Reorganization previously approved by the Trust’s Board of Trustees, all of the assets, subject to the liabilities, of BNY Hamilton Intermediate Government Fund, a series of BNY Hamilton Funds, Inc., were transferred to the fund in exchange for the corresponding class of shares of Beneficial Interest of the fund of equal value. Shareholders of Institutional and Class A shares of Intermediate Government Fund received Class M and Investor shares of the fund, respectively, in each case in an amount equal to the aggregate net asset value of their investment in the Intermediate Government Fund at the time of the exchange. The net asset value of the fund’s shares on the close of business on September 12, 2008, after the reorganization, was
20
$10.06 for Class M shares and $10.05 for Investor shares, and a total of 11,175,308 Class M shares and 588,552 Investor shares, representing net assets of $118,349,299 (including $1,092,783 net unrealized appreciation on investments) were issued to shareholders of the Intermediate Government Fund shareholders in the exchange.The exchange was a tax-free event to the shareholders of the fund. Intermediate Government Fund is the accounting survivor and its historical performance is presented for periods prior to September 12, 2008.
MBSC Securities Corporation (the “Distributor”), a wholly owned subsidiary of Dreyfus, is the distributor of the fund’s shares, which are sold without a sales charge.The Trust is authorized to issue an unlimited number of shares of Beneficial Interest, par value $.001 per share, in each of the Class M and Investor class shares of the fund. Each class of shares has similar rights and privileges, except with respect to the expenses borne by and the shareholder services offered to each class and the shareholder services plan applicable to the Investor shares and certain voting rights. Income, expenses (other than expenses attributable to a specific class), and realized and unrealized gains or losses on investments are allocated daily for each class of shares based upon relative proportion of net assets of each class.
The Trust accounts separately for the assets, liabilities and operations of each series. Expenses directly attributable to each series are charged to that series’ operations; expenses that are applicable to all series are allocated among them on a pro rata basis.
The fund’s financial statements are prepared in accordance with U.S. generally accepted accounting principles, which may require the use of management estimates and assumptions. Actual results could differ from those estimates.
(a) Portfolio valuation: Investments in securities excluding short-term investments (other than U.S. Treasury Bills), are valued each business day by an independent pricing service (the “Service”) approved by the Board of Trustees. Investments for which quoted bid prices are readily available and are representative of the bid side of the market in the
The Fund 21
| NOTES TO FINANCIAL STATEMENTS (continued) |
judgment of the Service are valued at the mean between the quoted bid prices (as obtained by the Service from dealers in such securities) and asked prices (as calculated by the Service based upon its evaluation of the market for such securities). Other investments (which constitute a majority of the portfolio securities) are valued as determined by the Service, based on methods which include consideration of: yields or prices of securities of comparable quality, coupon, maturity and type; indications as to values from dealers; and general market conditions. Restricted securities, as well as securities or other assets for which recent market quotations are not readily available, that are not valued by a pricing service approved by the fund’s Board of Trustees, or are determined by the fund not to reflect accurately fair value, are valued at fair value as determined in good faith under the direction of the Board of Trustees.The factors that may be considered when fair valuing a security include fundamental analytical data, the nature and duration of restrictions on disposition, an evaluation of the forces that influence the market in which the securities are purchased and sold, and public trading in similar securities of the issuer or comparable issuers. Registered investment companies that are not traded on an exchange are valued at their net asset value.
The fund adopted Statement of Financial Accounting Standards No. 157 “FairValue Measurements” (“FAS 157”). FAS 157 establishes an authoritative definition of fair value, sets out a framework for measuring fair value, and requires additional disclosures about fair value measurements.
Various inputs are used in determining the value of the fund’s investments relating to FAS 157.These inputs are summarized in the three broad levels listed below.
| Level 1—quoted prices in active markets for identical securities. Level 2—other significant observable inputs (including quoted prices for similar securities, interest rates, prepayment speeds, credit risk, etc.). Level 3—significant unobservable inputs (including the fund’s own assumptions in determining the fair value of investments). |
22
The inputs or methodology used for valuing securities are not necessarily an indication of the risk associated with investing in those securities.
The following is a summary of the inputs used as of December 31, 2008 in valuing the fund’s investments carried at fair value:
| Investments in | Other Financial | |||
| Valuation Inputs | Securities ($) | Instruments ($)† | ||
| Level 1—Quoted Prices | 2,195,000 | 0 | ||
| Level 2—Other Significant | ||||
| Observable Inputs | 122,886,765 | 0 | ||
| Level 3—Significant | ||||
| Unobservable Inputs | 0 | 0 | ||
| Total | 125,081,765 | 0 |
| † | Other financial instruments include derivative instruments such as futures, forward currency | |
| exchange contracts and swap contracts, which are valued at the unrealized appreciation | ||
| (depreciation) on the instrument and written options contracts which are shown at value. |
(b) Securities transactions and investment income: Securities transactions are recorded on a trade date basis. Realized gains and losses from securities transactions are recorded on the identified cost basis. Dividend income is recorded on the ex-dividend date and interest income, including where applicable, accretion of discount and amortization of premium on investments is recognized on the accrual basis.
The fund has arrangements with the custodian and cash management banks whereby the fund may receive earnings credits when positive cash balances are maintained, which are used to offset custody and cash management fees. For financial reporting purposes, the fund includes net earnings credits as an expense offset in the Statement of Operations.
(c) Affiliated issuers: Investments in other investment companies advised by Dreyfus are defined as “affiliated” in the Act.
(d) Dividends to shareholders: Dividends payable to shareholders are recorded by the fund on the ex-dividend date.The fund declares and pays dividends from investment income-net monthly.With respect to each series, dividends from net realized capital gains, if any, are nor-
The Fund 23
| NOTES TO FINANCIAL STATEMENTS (continued) |
mally declared and paid annually, but the fund may make distributions on a more frequent basis to comply with the distribution requirements of the Internal Revenue Code of 1986, as amended (the “Code”).To the extent that net realized capital gains can be offset by capital loss carryovers of that fund, it is the policy of the fund not to distribute such gains. Income and capital gain distributions are determined in accordance with income tax regulations, which may differ from generally accepted accounting principles.
(e) Federal income taxes: It is the policy of each fund to continue to qualify as a regulated investment company, if such qualification is in the best interests of its shareholders, by complying with the applicable provisions of the Code, and to make distributions of taxable income sufficient to relieve it from substantially all federal income and excise taxes. For federal income tax purposes, each series is treated as a single entity for the purpose of determining such qualification.
As of and during the period ended December 31, 2008, the fund did not have any liabilities for any unrecognized tax positions. The fund recognizes interest and penalties, if any, related to unrecognized tax positions as income tax expense in the Statement of Operations. During the period, the fund did not incur any interest or penalties.
Each of the tax years in the four-year period ended December 31, 2008, remains subject to examination by the Internal Revenue Service and state taxing authorities.
At December 31, 2008, the components of accumulated earnings on a tax basis were as follows: undistributed ordinary income $44,045, undistributed capital gains $19,954 and unrealized appreciation $4,160,509.
The tax character of distributions paid to shareholders during the fiscal periods ended December 31, 2008 and December 31, 2007 were as follows: ordinary income $4,310,290 and $5,308,211, respectively.
During the period ended December 31, 2008, as a result of permanent book to tax differences, primarily due to amortization of premiums and paydown gains and losses on mortgage backed securities, the fund
24
increased accumulated undistributed investment income-net by $60,883 and decreased accumulated net realized gain (loss) on investments by the same amount. Net assets and net asset value per share were not affected by this reclassification.
NOTE 2—Bank Lines of Credit:
Effective October 15, 2008, the fund participates with other Dreyfus-managed funds in a $145 million primary credit facility led by Citibank, N.A. (the “Facility”) to be utilized for temporary or emergency purposes, including the financing of redemptions. In connection therewith, the fund has agreed to pay its pro rata portion of Facility fees for the Facility. Interest is charged to the fund based on rates determined pursuant to the terms of the Facility at the time of the borrowing. During the period ended December 31, 2008, the fund did not borrow under the Facility.
NOTE 3—Investment Advisory Fee, Administration Fee and Other Transactions With Affiliates:
(a) Pursuant to an Investment Advisory Agreement (“Agreement”) with the Investment Advisor, effective September 13, 2008, the investment advisory fee is computed at the annual rate of .50% of the value of the fund’s average daily net assets and is payable monthly. Prior to September 13, 2008,The Bank of NewYork Mellon (the “Advisor”) was the advisor for the Intermediate Government Fund.The Advisor’s fee was computed at an annual rate of .50% of the value of the Intermediate Government Fund’s average daily net assets and was payable monthly. During the period ended December 31, 2008, the Advisor and Manager earned $405,746 and $181,649, respectively.
Effective September 13, 2008, the investment Advisor has contractually agreed to waive receipt of its fees and/or assume the expenses of the fund, until September 30, 2010, so that annual fund operating expenses (excluding shareholder services fees, taxes, interest, brokerage commissions, commitment fees on borrowings, and extraordinary expenses) do
The Fund 25
| NOTES TO FINANCIAL STATEMENTS (continued) |
not exceed .65% of the value of the fund’s average daily net assets.The reduction in investment advisory fee, pursuant to the undertaking, amount to $132,395 during the period ended December 31, 2008.
Pursuant to the Administration Agreement, The Bank of New York Mellon provides or arranges for fund accounting, transfer agency and other fund administration services and receives a fee based on the total net assets of the Trust based on the following rates:
| 0 up to $6 billion | .15% | |
| $6 billion up to $12 billion | .12% | |
| In excess of $12 billion | .10% |
The administration fees amounted to $47,594 for the period September 13, 2008 through December 31, 2008.
The Bank of NewYork Mellon served as Administrator to Intermediate Government Fund pursuant to an Administration Agreement. The Administrator received from Intermediate Government Fund a monthly fee equal to an annual rate of .10% of the average daily net asset of Intermediate Government Fund.The administration fees amounted to $81,149 for the period ended September 12, 2008.This agreement was terminated as of the close of business on September 12, 2008, due to the reorganization.
The Bank of NewYork Mellon has entered into a Sub-Administration Agreement with Dreyfus pursuant to which The Bank of New York Mellon pays Dreyfus for performing certain administrative services.
(b) Under a prior Distribution Plan adopted pursuant to Rule 12b-1, the Intermediate Government Fund’s Class A shares paid BNY Hamilton Distributors, Inc. for the distribution and/or shareholders servicing expenses in an amount up to .25% of the average annual daily net assets of the Class A shares. During the period January 1, 2008 through September 12, 2008, Class A shares were charged $10,574.The agreement was terminated as of the close of business on September 12, 2008, due to the reorganization.
26
(c) The fund has adopted a Shareholder Services Plan with respect to its Investor shares pursuant to which each fund pays the Distributor for the provision of certain services to holders of Investor shares a fee at an annual rate of .25% of the value of the average daily net assets attributable to Investor shares.The services provided may include personal services relating to shareholder accounts, such as answering shareholder inquiries regarding a fund, and providing reports and other information, and services related to the maintenance of such shareholder accounts.The Shareholder Services Plan allows the Distributor to make payments from the shareholder services fees it collects from each fund to compensate service agents (certain banks, securities brokers or dealers and other financial institutions) in respect of these services. During the period ended December 3 1, 2008, Investor shares were charged $4,540, pursuant to the Shareholder Services Plan. Additional fees included in shareholder servicing costs in the Statement of Operations include fees paid to the transfer agent.
The fund compensates The Bank of New York Mellon under a cash management agreement for performing cash management services related to fund subscriptions and redemptions. During the period ended December 31, 2008, the fund was charged $481 pursuant to the cash management agreement.
The fund compensates The Bank of New York Mellon under a custody agreement for providing custodial services for the fund. During the period ended December 31, 2008, the fund was charged $30,041 pursuant to the custody agreement.
During the period ended December 31, 2008, the fund was charged $1,197 for services performed by the Chief Compliance Officer.
The components of “Due to The Dreyfus Corporation and affiliates” in the Statement of Assets and Liabilities consist of: investment advisory fees $53,174, shareholders service fees $1,317, custodian fees $8,840,
The Fund 27
| NOTES TO FINANCIAL STATEMENTS (continued) |
chief compliance officer fees $1,197 and transfer agency per account fees $3,520, which are offset against an expense reimbursement currently in effect in the amount of $ 12,602.
(d) Effective June 1, 2008, each trustee who is not an “affiliated person” as defined in the Act receives from the Trust an annual fee of $68,000 and an attendance fee of $7,500 for each in-person meeting attended and $500 for telephone meetings and is reimbursed for travel and out-of-pocket expenses. The Chairman of the Trust’s Board receives an additional annual fee of $15,000 and the Chairman of the Trust’s Audit Committee receives an additional annual fee of $10,000. Prior to June 1, 2008, the Trust paid its Board members an annual fee of $48,000 and an attendance fee of $5,000 for each in-person meeting attended and $500 for telephone meetings and reimbursed them for travel and out-of-pocket expenses, and the Chairmen of the Trust’s Board and Audit Committee received additional annual fees of $10,000 and $8,000, respectively.
NOTE 4—Securities Transactions:
The aggregate amount of purchases and sales of investment securities (including paydowns) excluding short-term securities, during the period ended December 31, 2008, amounted to $105,438,843 and $97,968,507, respectively.
At December 31, 2008, the cost of investments for federal income tax purposes was $120,921,256; accordingly, accumulated net unrealized appreciation on investments was $4,160,509, consisting of $4,572,570 gross unrealized appreciation and $412,061, gross unrealized depreciation.
28
In March 2008, the Financial Accounting Standards Board released Statement of Financial Accounting Standards No. 161 “Disclosures about Derivative Instruments and Hedging Activities” (“FAS 161”). FAS 161 requires qualitative disclosures about objectives and strategies for using derivatives, quantitative disclosures about fair value amounts of gains and losses on derivative instruments and disclosures about credit-risk-related contingent features in derivative agreements. The application of FAS 161 is required for fiscal years and interim periods beginning after November 15, 2008.At this time, management is evaluating the implications of FAS 161 and its impact on the financial statements and the accompanying notes has not yet been determined.
The Fund 29
| REPORT OF INDEPENDENT REGISTERED PUBLIC ACCOUNTING FIRM |
| The Board of Trustees and Shareholders BNY Mellon Funds Trust |
We have audited the accompanying statement of assets and liabilities, including the statement of investments, of BNY Mellon Intermediate U.S. Government Fund, a series of BNY Mellon Funds Trust (the “Trust”) (formerly, BNY Hamilton Intermediate Government Fund, a series of BNY Hamilton Funds, Inc.), as of December 31, 2008, and the related statement of operations, the statement of changes in net assets and the financial highlights for the year then ended.The financial statements and financial highlights are the responsibility of the Fund’s management. Our responsibility is to express an opinion on these financial statements and financial highlights based on our audit. The statement of changes in net assets for the year ended December 31, 2007 and the financial highlights for each of the years in the four-year period ended December 31, 2007 were audited by other independent registered public accountants whose report thereon dat ed February 28, 2008, expressed an unqualified opinion on that financial statement and those financial highlights.
We conducted our audit in accordance with the standards of the Public Company Accounting Oversight Board (United States).Those standards require that we plan and perform the audit to obtain reasonable assurance about whether the financial statements and financial highlights are free of material misstatement. An audit includes examining, on a test basis, evidence supporting the amounts and disclosures in the financial statements. Our procedures included confirmation of securities owned as of December 31, 2008, by correspondence with the custodian and brokers. An audit also includes assessing the accounting principles used and significant estimates made by management, as well as evaluating the overall financial statement presentation.We believe that our audit provides a reasonable basis for our opinion.
In our opinion, the financial statements and financial highlights referred to above present fairly, in all material respects, the financial position of BNY Mellon Intermediate U.S. Government Fund as of December 31, 2008, and the results of its operations, the changes in its net assets and the financial highlights for the year then ended, in conformity with U.S. generally accepted accounting principles.

| New York, New York February 25, 2009 |
30
IMPORTANT TAX INFORMATION (Unaudited)
For federal tax purposes the fund hereby designates 100% of ordinary income dividends paid during the fiscal year ended December 31, 2008 as qualifying interest related dividends. For State individual income tax purposes, the fund hereby designates 64.50% of the ordinary income dividends paid during its fiscal year ended December 31, 2008 as attributable to interest income from direct obligations of the United States. Such dividends are currently exempt from taxation for individual income tax purposes in most states, including New York, California and the District of Columbia.
| The Fund 31 |
| INFORMATION ABOUT THE REVIEW AND APPROVAL OF THE FUND’S INVESTMENT ADVISORY AGREEMENT (Unaudited) |
At a meeting of the Board of Trustees held on March 10-11, 2008, the Board considered the approval of the Trust’s Investment Advisory Agreement with respect to the fund through its renewal date of June 1, 2009, pursuant to which BNY Mellon Fund Advisers, a division of Dreyfus, will provide the fund with investment advisory services. The Board members also considered the approval of the Trust’s Administration Agreement with The Bank of New York Mellon (“BNY Mellon”) for a one year term, pursuant to which BNY Mellon will provide the fund with administrative services. BNY Mellon has entered into a Sub-Administration Agreement with Dreyfus pursuant to which BNY Mellon pays Dreyfus for performing certain of these administrative services. The Board members who are not “interested persons” (as defined in the Act) of the Trust were assisted in their review by independent legal counsel and met with counsel in executive s ession separate from representatives of Dreyfus.
Analysis of Nature, Extent and Quality of Services to be Provided to the Fund. The Board members received a presentation from representatives of Dreyfus regarding services provided to the other funds comprising the Trust, and discussed the nature, extent and quality of the services to be provided to the fund pursuant to the Investment Advisory Agreement. The Board members also referenced information provided and discussed at the meeting regarding the funds’ distribution of accounts, the diversity of distribution of those funds and Dreyfus’ corresponding need for broad, deep and diverse resou rces to be able to provide ongoing shareholder services to each of the funds’ distribution channels.
The Board members also considered Dreyfus’ research and portfolio management capabilities and that Dreyfus also provides oversight of day-to-day fund operations, including fund accounting and administration and assistance in meeting legal and regulatory requirements, and Dreyfus’ extensive administrative, accounting and compliance infrastructure.
32
Comparative Analysis of the Fund’s Advisory Fee and Expense Ratio. As the fund had not yet commenced operations, the Board members were not able to review the fund’s performance.The Board was advised, however, that the fund was being established pursuant a proposed reorganization of BNY Hamilton Intermediate Government Fund, a series of BNY Hamilton Funds, Inc. (the “BNY Fund”), and will inherit the BNY Fund’s performance record upon the closing of the reorganization. The Board members received a presentation from Dreyfus that described, among other matters, the BNY Fund’s average annual total returns for the 1-, 3-, 5- and 10-year periods ended December 31, 2007. The Board discussed with representatives of Dreyfus the fund’s investment objective and policies and primary portfolio manager, and noted that the current primary portfolio manager of the BNY Fund will continue to serve as the primary portfolio manager of the fund.
The Board members reviewed comparisons of the fund’s proposed advisory fee to those of funds in the Lipper Intermediate U.S. Government Funds category. The fund’s contractual advisory fee was above the average and median advisory or adviser/administration fees of the funds in the category (both with and without any fee waivers and reimbursements). The fund’s total expense ratio (as limited through September 30, 2010 by agreement with BNY Mellon Fund Advisers) was below the average and median for the category (net of any fee waivers and reimbursements).
Representatives of Dreyfus reviewed with the Board members the fees paid by the only mutual fund managed by Dreyfus or its affiliates included in the Lipper Intermediate U.S. Government Funds category. The Board considered BNY Mellon Wealth Management’s general advisory fee schedule for accounts with similar investment objectives, policies and strategies as the fund.The Board analyzed the differences in fees paid to Dreyfus or its affiliates and discussed the relationship of
| The Fund 33 |
| INFORMATION ABOUT THE REVIEW AND APPROVAL OF THE FUND’S INVESTMENT ADVISORY AGREEMENT (Unaudited) (continued) |
the advisory fee to be paid in light of the services to be provided to the fund. The Board members considered the relevance of the fee information provided to evaluate the appropriateness and reasonableness of the fund’s advisory fee.
Analysis of Profitability and Economies of Scale. As the fund had not yet commenced operations, Dreyfus’ representatives were not able to review the dollar amount of expenses allocated and profit received by Dreyfus and its affiliates. The Board members were presented with a schedule of the estimated profitability of the fund prepared by Dreyfus. The Board members also considered potential benefits to Dreyfus and its affiliates, including BNY Mellon Fund Advisers, from acting as investment adviser to the fund, and noted the unlikelihood of future soft dollar arrangements with respect to trading the fund’s portfolio. The Board also considered whether the fund would be able to participate in any economies of scale that Dreyfus may experience in the event that the fund attracts a large amount of assets.The Board members noted the uncertainty of the estimated as set levels, and discussed the renewal requirements for advisory agreements and their ability to review the advisory fees annually after an initial term of the Investment Advisory Agreement with respect to the fund.
At the conclusion of these discussions, the Board agreed that it had been furnished with sufficient information to make an informed business decision with respect to approving the Trust’s Investment Advisory Agreement with respect to the fund. Based on the discussions and considerations as described above, the Board made the following conclusions and determinations:
- The Board concluded that the nature, extent and quality of the services to be provided by Dreyfus to the fund are adequate and appropriate.
- The Board concluded that the fee to be paid by the fund to Dreyfus was reasonable in light of the services to be provided, comparative advisory fee information and benefits anticipated to be derived by Dreyfus and its affiliates, including BNY Mellon Fund Advisers, from its relationship with the fund.
34
- The Board determined that because the fund had not commenced operations, economies of scale were not a factor, and that, to the extent in the future it were to be determined that material economies of scale had not been shared with the fund, the Board would seek to have those economies of scale shared with the fund.
The Board members considered these conclusions and determinations, and, without any one factor being dispositive, the Board determined that approval of the Trust’s Investment Advisory Agreement and Administration Agreement with respect to the fund was in the best interests of the fund and its shareholders.
| The Fund 35 |
36
The Fund 37
38
Once elected all Board Members serve for an indefinite term.The address of the Board Members and Officers is in c/o The Dreyfus Corporation, 200 Park Avenue, NewYork, NewYork 10166.Additional information about the Board Members is available in the fund’s Statement of Additional Information which can be obtained from Dreyfus free of charge by calling this toll free number: 1-800-645-6561. For Wealth Management clients, please contact your account officer or call 1-888-281-7350.
The Fund 39
OFFICERS OF THE TRUST (Unaudited)
CHRISTOPHER SHELDON, President since September 2006.
As director of Investment Strategy for BNY Mellon Wealth Management group since April 2003, Mr. Sheldon manages the analysis and development of investment and asset allocation strategies and oversees investment product research. He also oversaw the alternative investment groups from June 2006 to September 2008. Prior to assuming his current position, Mr. Sheldon was West Coast managing director of Mellon’s Private Wealth Management group from 2001-2003 and its regional manager from 1998-2001. He was previously a Vice President of the Trust. He is 43 years old has been employed by BNY Mellon since January 1995.
MICHAEL A. ROSENBERG, Vice President and Secretary since August 2005.
Assistant General Counsel of BNY Mellon, and an officer of 77 investment companies (comprised of 201 portfolios) managed by the Manager. He is 48 years old and has been an employee of the Manager since October 1991.
JAMES BITETTO, Vice President and Assistant Secretary since August 2005.
Senior Counsel of BNY Mellon and Secretary of the Manager, and an officer of 77 investment companies (comprised of 201 portfolios) managed by the Manager. He is 42 years old and has been an employee of the Manager since December 1996.
JONI LACKS CHARATAN, Vice President and Assistant Secretary since August 2005.
Senior Counsel of BNY Mellon, and an officer of 77 investment companies (comprised of 201 portfolios) managed by the Manager. She is 53 years old and has been an employee of the Manager since October 1988.
JOSEPH M. CHIOFFI, Vice President and Assistant Secretary since August 2005.
Senior Counsel of BNY Mellon, and an officer of 77 investment companies (comprised of 201 portfolios) managed by the Manager. He is 47 years old and has been an employee of the Manager since June 2000.
JANETTE E. FARRAGHER, Vice President and Assistant Secretary since August 2005.
Assistant General Counsel of BNY Mellon, and an officer of 77 investment companies (comprised of 201 portfolios) managed by the Manager. She is 46 years old and has been an employee of the Manager since February 1984.
JOHN B. HAMMALIAN, Vice President and Assistant Secretary since August 2005.
Managing Counsel of BNY Mellon, and an officer of 77 investment companies (comprised of 201 portfolios) managed by the Manager. He is 45 years old and has been an employee of the Manager since February 1991.
ROBERT R. MULLERY, Vice President and Assistant Secretary since August 2005.
Managing Counsel of BNY Mellon, and an officer of 77 investment companies (comprised of 201 portfolios) managed by the Manager. He is 56 years old and has been an employee of the Manager since May 1986.
JEFF PRUSNOFSKY, Vice President and Assistant Secretary since August 2005.
Managing Counsel of BNY Mellon, and an officer of 77 investment companies (comprised of 201 portfolios) managed by the Manager. He is 43 years old and has been an employee of the Manager since October 1990.
40
JAMES WINDELS, Treasurer since November 2001.
Director – Mutual Fund Accounting of the Manager, and an officer of 77 investment companies (comprised of 201 portfolios) managed by the Manager. He is 49 years old and has been an employee of the Manager since April 1985.
RICHARD CASSARO, Assistant Treasurer since January 2008.
Senior Accounting Manager – Money Market and Municipal Bond Funds of the Manager, and an officer of 77 investment companies (comprised of 201 portfolios) managed by the Manager. He is 49 years old and has been an employee of the Manager since September 1982.
GAVIN C. REILLY, Assistant Treasurer since December 2005.
Tax Manager of the Investment Accounting and Support Department of the Manager, and an officer of 77 investment companies (comprised of 201 portfolios) managed by the Manager. He is 40 years old and has been an employee of the Manager since April 1991.
ROBERT ROBOL, Assistant Treasurer since December 2002.
Senior Accounting Manager – Fixed Income Funds of the Manager, and an officer of 77 investment companies (comprised of 201 portfolios) managed by the Manager. He is 44 years old and has been an employee of the Manager since October 1988.
ROBERT SALVIOLO, Assistant Treasurer since July 2007.
Senior Accounting Manager – Equity Funds of the Manager, and an officer of 77 investment companies (comprised of 201 portfolios) managed by the Manager. He is 41 years old and has been an employee of the Manager since June 1989.
ROBERT SVAGNA, Assistant Treasurer since December 2002.
Senior Accounting Manager - Equity Funds of the Manager, and an officer of 77 investment companies (comprised of 201 portfolios) managed by the Manager. He is 41 years old and has been an employee of the Manager since November 1990.
JOSEPH W. CONNOLLY, Chief Compliance Officer since October 2004.
Chief Compliance Officer of the Manager and The Dreyfus Family of Funds (77 investment companies, comprised of 201 portfolios). From November 2001 through March 2004, Mr. Connolly was first Vice-President, Mutual Fund Servicing for Mellon Global Securities Services. In that capacity, Mr. Connolly was responsible for managing Mellon’s Custody, Fund Accounting and Fund Administration services to third-party mutual fund clients. He is 51 years old and has served in various capacities with the Manager since 1980, including manager of the firm’s Fund Accounting Department from 1997 through October 2001.
WILLIAM GERMENIS, Anti-Money Laundering Compliance Officer since September 2002.
Vice President and Anti-Money Laundering Compliance Officer of the Distributor, and the Anti-Money Laundering Compliance Officer of 73 investment companies (comprised of 197 portfolios) managed by the Manager. He is 37 years old and has been an employee of the Distributor since October 1998.
| The Fund |
| 41 |
For More Information
Telephone Wealth Management (WM) Clients, please contact your Account Officer or call 1-888-281-7350. Brokerage Clients of BNY Mellon Wealth Advisors (BNYMWA), please contact your financial representative or call 1-800-830-0549, Option 2. Individual Account holders, please call Dreyfus at 1-800-645-6561.
Mail WM Clients, write to your Account Officer, c/o The Bank of New York Mellon, One Mellon Bank Center, Pittsburgh, PA 15258. BNYMWA Brokerage Clients, write to your financial representative, P.O. Box 9012, Hicksville, NY 11802–9012. Individual Account Holders, write to: BNY Mellon Funds, P.O. Box 55268, Boston, MA 02205–8502.
The fund files its complete schedule of portfolio holdings with the Securities and Exchange Commission (“SEC”) for the first and third quarters of each fiscal year on Form N-Q. The fund’s Forms N-Q are available on the SEC’s website at http://www.sec.gov and may be reviewed and copied at the SEC’s Public Reference Room in Washington, DC. Information on the operation of the Public Reference Room may be obtained by calling 1-800-SEC-0330.
A description of the policies and procedures that the fund uses to determine how to vote proxies relating to portolio securities, and information regarding how the fund voted proxies relating to portfolio securities, is available on the SEC’s website at http://www.sec.gov and without charge, upon request, by calling 1-800-645-6561.
| © 2009 MBSC Securities Corporation |
| 6534AR1208 |
The BNY Mellon Funds
BNY Mellon New York Intermediate Tax-Exempt Bond Fund
| ANNUAL REPORT |
| December 31, 2008 |
The views expressed herein are current to the date of this report. These views and the composition of the fund’s portfolio are subject to change at any time based on market and other conditions.

| Contents | |
| THE FUND | |
| 2 | A Letter from the President |
| 3 | Discussion of Fund Performance |
| 6 | Fund Performance |
| 8 | Understanding Your Fund’s Expenses |
| 8 | Comparing Your Fund’s Expenses With Those of Other Funds |
| 9 | Statement of Investments |
| 21 | Statement of Assets and Liabilities |
| 22 | Statement of Operations |
| 23 | Statement of Changes in Net Assets |
| 25 | Financial Highlights |
| 27 | Notes to Financial Statements |
| 36 | Report of Independent Registered Public Accounting Firm |
| 37 | Important Tax Information |
| 38 | Information About the Review and Approval of the Fund’s Investment Advisory Agreement |
| 42 | Board Members Information |
| 46 | Officers of the Trust |
| FOR MORE INFORMATION | |
| Back Cover | |
| BNY Mellon New York Intermediate Tax-Exempt Bond Fund |
| The Fund |

A LETTER FROM THE PRESIDENT
Dear Shareholder:
We present to you this annual report for BNY Mellon New York Intermediate Tax-Exempt Bond Fund, covering the 12-month period from January 1, 2008, through December 31, 2008.
2008 was the most difficult year in decades for the financial markets. A credit crunch that began in 2007 exploded in mid-2008 into a global financial crisis, resulting in the failures of major financial institutions, a deep and prolonged recession and lower investment values across a broad range of asset classes. Governments and regulators throughout the world moved aggressively to curtail the damage, implementing unprecedented reductions of short-term interest rates, massive injections of liquidity into the banking system, government bailouts of struggling companies and plans for massive economic stimulus programs. U.S. government securities generally fared well in the ensuing “flight to quality,” but riskier bond market sectors suffered sharp price declines.
Although we expect the U.S. and global economies to remain weak until longstanding imbalances have worked their way out of the system, the financial markets currently appear to have priced in investors’ generally low expectations. In previous recessions, however, the markets have tended to anticipate economic improvement before it occurs, potentially leading to major rallies when few expected them.That’s why it makes sense to remain disciplined, maintain a long-term perspective and adopt a consistent asset allocation strategy that reflects one’s future goals and attitudes toward risk.As always, we urge you to consult with your portfolio manager, who can recommend the course of action that is right for you.
For information about how the fund performed during the reporting period, as well as market perspectives, we have provided a Discussion of Fund Performance.
Thank you for your continued confidence and support.
Sincerely,

| Christopher E. Sheldon President BNY Mellon Funds Trust January 15, 2009 |
2

D I S C U S S I O N O F F U N D P E R F O R M A N C E
For the period of January 1, 2008, through December 31, 2008, as provided by John Flahive, Portfolio Manager
Fund and Market Performance Overview
For the 12-month period ended December 31, 2008, BNY Mellon New York Intermediate Tax-Exempt Bond Fund’s Class M shares achieved a total return of 2.64% and the fund’s Investor shares achieved a total return of 2.39% .1 In comparison, the Barclays Capital 5-Year General Obligation Bond Index and the Merrill Lynch 2-17 Year Municipal Bond Index, the fund’s former and current benchmarks, achieved a total return of 5.78% and 2.47%, respectively.2 The fund’s performance benefited from its bias toward essential services bonds and high-quality general obligation securities.The fund also had a good weighting in pre-refunded municipal bonds, which performed well during the reporting period.
The Fund’s Investment Approach
The fund seeks to provide a high level of income exempt from federal, New York state and New York city income taxes as is consistent with the preservation of capital. To pursue this goal, the fund normally invests at least 80% of its assets in municipal bonds that provide income exempt from federal, New York state and New York city personal income taxes. These municipal bonds include those issued by New York state and NewYork city as well as those issued by U.S. territories and possessions. The fund may also invest up to 20% of its assets in fixed-income securities, the interest from which is subject to federal income tax, the federal alternative minimum tax, and/or New York state and New York city personal income taxes.
The fund’s investments in municipal and taxable bonds must be rated investment grade at the time of purchase or, if unrated, deemed of comparable quality by the investment adviser.3
A Look at the Year
The dominant themes in the municipal securities markets during 2008 were periods of extreme illiquidity and lack of price correlation to the Treasury market which benefited from a dramatic flight to quality.
A major factor driving both of these themes was hedge fund activity. Many hedge funds that had previously participated in the municipal bond market, facing unexpected redemptions, needed to unwind their muni-related positions quickly. This created significant sell pressure, driving prices of municipal securities down steeply in very short time
The Fund 3
| DISCUSSION OF FUND PERFORMANCE (continued) |
periods. One such period was from early February into March, and from the collapse of Lehman Brothers in mid-September through mid-November.
Another factor affecting the municipal securities markets was the changing landscape among broker dealers, with Bear Stearns, Merrill Lynch, UBS, and Lehman Brothers all either merging with other parties or deciding to get out of the municipal bond business.With fewer players in the market, liquidity was constricted further.
Third, municipal bonds were affected by investors’ concerns about the credit quality of issuers.The deteriorating credit profile of many municipalities sparked increased redemptions from municipal bond funds, particularly high-yield bond funds. This created a supply/demand imbalance that led to near-total illiquidity and a severe steepening of the yield curve; there were also significant deviations and dislocations among various credit qualities.
Unlike theTreasury market, the flight to quality in municipal bonds only extended to very high quality bonds with relatively short maturities. Municipal bonds along many portions of the yield curve experienced significant price depreciation during the reporting period.
Long Maturities and Lower Quality Paid the Price
Among high-quality bonds, those with maturities beyond 15 years generally produced negative returns. Bonds along the 10-year portion of the yield curve did little better, only producing slightly positive returns. For these high-quality issues, the shorter the position on the yield curve, the better protected the bond was from the market turmoil.
There was also major widening among credit spreads in the municipal market. The difference in yield, or spread, widened greatly between AAA and AA,A, and BBB rated municipal securities.This was because the demand for lower-rated investment-grade securities fell in the highly risk-averse market climate, while the supply of lower-rated bonds increased due to redemptions from high-yield municipal funds. In this difficult environment, the high-yield municipal funds sold what they could — and when they could not sell enough of their non-investment grade paper to meet redemptions, they sold their investment grade holdings instead.
Although bonds tied to the housing, hospitals, and industrial revenue sectors did well in the first half of the year, as the financial crisis took hold in the second half they did very poorly. Bonds that did well in the year’s second half were pre-refunded bonds (which have an implied rating of AAA), and very high-quality general obligation bonds, particularly those associated with essential services.
4
A Challenging Municipal Marketplace
After a couple of years at a brisk, record-setting pace, new bond issuance in the New York market was down over 20% for the year, totaling approximately $375 billion.The decrease in new bond supply was primarily a function of the higher yields demanded by the marketplace, as well as the lack of liquidity that caused a lot of issuers to put their offerings on hold.
There is a somewhat guarded outlook for the overall credit profile in both New York state and New York city, given the impending drop-off in personal and corporate tax revenues due to the crisis in the financial sector.We are, however, encouraged by their swift acceptance of the reality that they will need to cut expenditures immediately.While making changes to balance their budgets won’t be easy, the lack of complacency about the situation means they will be able to take action sooner, rather than waiting until significant credit deterioration is unavoidable.
What’s Ahead
Although the current market environment necessitates that we stay guarded in our outlook, we do see what we believe are opportunities in the municipal securities market. We anticipate that the periods of illiquidity we saw in the markets in 2008 are likely to recur in 2009. Given the continued illiquidity we will seek out and make use of opportunities we identify, while maintaining a high-quality, intermediate duration portfolio.
January 15, 2009
| 1 | Total return includes reinvestment of dividends and any capital gains paid. Past performance is no | |
| guarantee of future results. Share price, yield and investment return fluctuate such that upon | ||
| redemption, fund shares may be worth more or less than their original cost. Income may be subject | ||
| to state and local taxes for non-NewYork residents, and some income tax may be subject to the | ||
| federal alternative minimum tax (AMT) for certain investors. Capital gains, if any, are fully | ||
| taxable. Return figures reflect the absorption of certain fund expenses by the investment adviser | ||
| pursuant to an agreement in effect through September 30, 2010, at which time it may be | ||
| extended, terminated or modified. Had these expenses not been absorbed, the fund’s returns would | ||
| have been lower. | ||
| 2 | SOURCE: LIPPER INC. — Reflects reinvestment of dividends and, where applicable, capital gain | |
| distributions.The Barclays Capital 5-Year General Obligation Index is an unmanaged index | ||
| designed to measure the performance of intermediate-term general obligation municipal bonds with | ||
| maturities in the 6-8 year range.The Merrill Lynch 2-17Year Municipal Bond Index is a broad- | ||
| based, unmanaged, market-weighted index of investment grade municipal bonds maturing in the 2- | ||
| 17 year range. Index returns do not reflect fees and expenses associated with operating a mutual fund. | ||
| In the future shareholder reports, the fund’s performance will no longer be compared to the Barclays | ||
| Capital 5-Year General Obligation Index because the Merrill Lynch 2-17Year Municipal Bond | ||
| Index is more reflective of the fund’s portfolio maturity profile. | ||
| 3 | The fund may continue to own investment-grade bonds (at the time of purchase), which are | |
| subsequently downgraded to below investment grade. |
The Fund 5

| Average Annual Total Returns as of 12/31/08 | ||||||
| 1 Year | 5 Years | 10 Years | ||||
| Class M shares | 2.64% | 3.01% | 3.93% | |||
| Investor shares | 2.39% | 2.75% | 3.68% |
| † Source: Lipper Inc. |
| †† Source: Bloomberg L.P. |
| Past performance is not predictive of future performance.The fund’s performance shown in the graph and table does not |
| reflect the deduction of taxes that a shareholder would pay on fund distributions or the redemption of fund shares. |
| The above graph compares a $10,000 investment made in Class M shares and Investor shares of BNY Mellon |
| NewYork Intermediate Tax-Exempt Bond Fund on 12/31/98 to a $10,000 investment made in the Barclays |
| Capital 5-Year General Obligation Municipal Bond Index (the “Barclays Capital Index”) and in the Merrill Lynch |
| 2-17Year Municipal Bond Index (the “Merrill Lynch Index”) on that date. All dividends and capital gain |
| distributions are reinvested. |
6
As of the close of business on September 12, 2008, substantially all of the assets of another investment company advised by an affiliate of the fund’s investment adviser, BNY Hamilton NewYork Intermediate Tax-Exempt Fund (the “predecessor fund”), a series of BNY Hamilton Funds, Inc., were transferred to BNY Mellon NewYork Intermediate Tax-Exempt Bond Fund in a tax-free reorganization and the fund commenced operations.The performance figures for the fund’s Class M shares represent the performance of the predecessor fund’s Institutional shares prior to the commencement of operations for BNY Mellon NewYork Intermediate Tax-Exempt Bond Fund and the performance of BNY Mellon NewYork Intermediate Tax-Exempt Bond Fund’s Class M shares thereafter. The performance figures for Investor shares represent the performance of the predecessor fund’s Class A shares prior to the commencement of operations for BNY M ellon NewYork Intermediate Tax-Exempt Bond Fund and the performance of BNY Mellon NewYork Intermediate Tax-Exempt Bond Fund’s Investor shares thereafter. Investor shares are subject to a Shareholder Services Plan. Performance for Investor shares will vary from the performance of Class M shares shown because of the differences in charges and expenses.
The fund’s performance shown in the line graph takes into account all applicable fees and expenses for all share classes. The Barclays Capital Index is an unmanaged index designed to measure the performance of intermediate-term general obligation municipal bonds.The Merrill Lynch Index is a broad-based, unmanaged, market-weighted index of investment grade municipal bonds maturing in the 2-17 year range. In future annual reports, the fund’s performance will no longer be compared to the Barclays Capital Index because the Merrill Lynch Index is more reflective of the fund’s portfolio maturity profile. Unlike a mutual fund, the indices are not subject to charges, fees and other expenses. Investors cannot invest directly in any index. Further information relating to fund performance, including expense reimbursements, if applicable, is contained in the Financial Highlights section of the prospectus and elsewhere in this re port.
The Fund 7
UNDERSTANDING YOUR FUND’S EXPENSES (Unaudited)
As a mutual fund investor, you pay ongoing expenses, such as management fees and other expenses. Using the information below, you can estimate how these expenses affect your investment and compare them with the expenses of other funds.You also may pay one-time transaction expenses, including sales charges (loads) and redemption fees, which are not shown in this section and would have resulted in higher total expenses. For more information, see your fund’s prospectus or talk to your financial adviser.
Review your fund’s expenses
The table below shows the expenses you would have paid on a $1,000 investment in BNY Mellon NewYork IntermediateTax-Exempt Bond Fund from July 1, 2008 to December 31, 2008. It also shows how much a $1,000 investment would be worth at the close of the period, assuming actual returns and expenses.
| Expenses and Value of a $1,000 Investment assuming actual returns for the six months ended December 31, 2008 |
| Class M Shares | Investor Shares | |||
| Expenses paid per $1,000† | $ 3.00 | $ 4.26 | ||
| Ending value (after expenses) | $1,021.10 | $1,019.80 |
| COMPARING YOUR FUND’S EXPENSES WITH THOSE OF OTHER FUNDS (Unaudited) |
Using the SEC’s method to compare expenses
The Securities and Exchange Commission (SEC) has established guidelines to help investors assess fund expenses. Per these guidelines, the table below shows your fund’s expenses based on a $1,000 investment, assuming a hypothetical 5% annualized return. You can use this information to compare the ongoing expenses (but not transaction expenses or total cost) of investing in the fund with those of other funds.All mutual fund shareholder reports will provide this information to help you make this comparison. Please note that you cannot use this information to estimate your actual ending account balance and expenses paid during the period.
| Expenses and Value of a $1,000 Investment assuming a hypothetical 5% annualized return for the six months ended December 31, 2008 |
| Class M Shares | Investor Shares | |||
| Expenses paid per $1,000† | $ 3.00 | $ 4.27 | ||
| Ending value (after expenses) | $1,022.17 | $1,020.91 |
| † Expenses are equal to the fund’s annualized expense ratio of .59% for Class M shares and .84% for Investor shares, |
| multiplied by the average account value over the period, multiplied by 184/366 (to reflect the one-half year period). |
8
| STATEMENT OF INVESTMENTS December 31, 2008 |
| Long-Term Municipal | Coupon | Maturity | Principal | |||||
| Investments—92.7% | Rate (%) | Date | Amount ($) | Value ($) | ||||
| Arizona—.2% | ||||||||
| Salt Verde Financial Corporation, | ||||||||
| Senior Gas Revenue | 5.00 | 12/1/32 | 500,000 | 322,925 | ||||
| New York—88.4% | ||||||||
| Albany Industrial Development | ||||||||
| Agency, Civic Facility Revenue | ||||||||
| (Saint Peter’s Hospital of the | ||||||||
| City of Albany Project) | 5.75 | 11/15/22 | 1,000,000 | 821,010 | ||||
| Battery Park City Authority, | ||||||||
| Senior Revenue | 5.25 | 11/1/22 | 1,000,000 | 1,036,580 | ||||
| Katonah-Lewisboro Union Free | ||||||||
| School District, GO (Insured; FGIC) | 5.00 | 9/15/15 | 1,000,000 | 1,121,330 | ||||
| Long Island Power Authority, | ||||||||
| Electric System General Revenue | 5.25 | 6/1/14 | 2,000,000 | 2,155,420 | ||||
| Long Island Power Authority, | ||||||||
| Electric System General | ||||||||
| Revenue (Insured; MBIA, Inc.) | 4.00 | 5/1/12 | 850,000 | 873,664 | ||||
| Long Island Power Authority, | ||||||||
| Electric System General | ||||||||
| Revenue (Insured; MBIA, Inc.) | 5.00 | 12/1/18 | 1,000,000 | 1,027,860 | ||||
| Metropolitan Transportation | ||||||||
| Authority, Dedicated Tax Fund | ||||||||
| Revenue (Insured; FGIC) | 5.25 | 11/15/15 | 2,000,000 | 2,106,120 | ||||
| Metropolitan Transportation | ||||||||
| Authority, Transit Facilities | ||||||||
| Revenue (Insured; FGIC) | 0.00 | 7/1/11 | 1,000,000 a | 951,230 | ||||
| Metropolitan Transportation | ||||||||
| Authority, Transportation | ||||||||
| Revenue | 5.00 | 11/15/17 | 1,000,000 | 1,038,230 | ||||
| Nassau County, | ||||||||
| GO (Insured; FSA) | 5.00 | 7/1/22 | 1,000,000 | 1,014,350 | ||||
| Nassau County Interim Finance | ||||||||
| Authority, Sales Tax Secured | ||||||||
| Revenue (Insured; AMBAC) | 5.00 | 11/15/16 | 1,500,000 | 1,593,705 | ||||
| Nassau County Interim Finance | ||||||||
| Authority, Sales Tax Secured | ||||||||
| Revenue (Insured; AMBAC) | 5.00 | 11/15/17 | 1,500,000 | 1,592,955 | ||||
| Nassau County Interim Finance | ||||||||
| Authority, Sales Tax Secured | ||||||||
| Revenue (Insured; MBIA, Inc.) | 5.00 | 11/15/16 | 1,000,000 | 1,107,230 |
The Fund 9
| STATEMENT OF INVESTMENTS (continued) |
| Long-Term Municipal | Coupon | Maturity | Principal | |||||
| Investments (continued) | Rate (%) | Date | Amount ($) | Value ($) | ||||
| New York (continued) | ||||||||
| Nassau County Sewer and Storm | ||||||||
| Water Finance Authority, | ||||||||
| System Revenue (Insured; | ||||||||
| Berkshire Hathaway Assurance | ||||||||
| Corporation) | 5.38 | 11/1/28 | 1,000,000 | 1,017,110 | ||||
| New York City, | ||||||||
| GO | 5.00 | 8/1/14 | 465,000 | 470,719 | ||||
| New York City, | ||||||||
| GO | 5.00 | 8/1/18 | 1,000,000 | 1,034,840 | ||||
| New York City, | ||||||||
| GO | 5.13 | 12/1/22 | 1,000,000 | 985,490 | ||||
| New York City, | ||||||||
| GO (Insured; FSA) | 5.00 | 4/1/18 | 1,000,000 | 1,032,410 | ||||
| New York City Municipal Water | ||||||||
| Finance Authority, Water and | ||||||||
| Sewer System Second General | ||||||||
| Resolution Revenue | 5.00 | 6/15/20 | 2,500,000 | 2,623,650 | ||||
| New York City Transitional Finance | ||||||||
| Authority, Future Tax Secured | ||||||||
| Revenue | 5.38 | 2/1/13 | 1,000,000 | 1,062,870 | ||||
| New York City Transitional Finance | ||||||||
| Authority, Future Tax Secured | ||||||||
| Revenue | 5.38 | 2/15/14 | 1,000,000 | 1,069,410 | ||||
| New York City Transitional Finance | ||||||||
| Authority, Future Tax Secured | ||||||||
| Revenue | 5.50 | 11/15/17 | 1,755,000 | 1,905,368 | ||||
| New York City Transitional Finance | ||||||||
| Authority, Future Tax Secured | ||||||||
| Revenue (Insured; MBIA, Inc.) | 4.75 | 11/15/15 | 500,000 | 505,590 | ||||
| New York City Trust for Cultural | ||||||||
| Resources, Revenue (Lincoln Center | ||||||||
| for the Performing Arts, Inc.) | 5.75 | 12/1/16 | 1,000,000 | 1,093,790 | ||||
| New York City Trust for Cultural | ||||||||
| Resources, Revenue (The Museum | ||||||||
| of Modern Art) | 5.00 | 4/1/31 | 1,000,000 | 947,240 | ||||
| New York Liberty Development | ||||||||
| Corporation, Revenue (Goldman | ||||||||
| Sachs Headquarters Issue) | 5.00 | 10/1/15 | 1,850,000 | 1,712,600 | ||||
| New York Local Government | ||||||||
| Assistance Corporation, Revenue | 5.00 | 4/1/18 | 2,500,000 | 2,734,875 |
10
| Long-Term Municipal | Coupon | Maturity | Principal | |||||
| Investments (continued) | Rate (%) | Date | Amount ($) | Value ($) | ||||
| New York (continued) | ||||||||
| New York Local Government | ||||||||
| Assistance Corporation, | ||||||||
| Subordianate Lien Revenue | ||||||||
| (Insured; FSA) | 5.00 | 4/1/13 | 2,000,000 | 2,194,840 | ||||
| New York State, | ||||||||
| GO | 5.00 | 4/15/14 | 1,000,000 | 1,081,730 | ||||
| New York State, | ||||||||
| GO | 5.25 | 3/15/15 | 2,750,000 | 2,905,265 | ||||
| New York State, | ||||||||
| GO | 5.00 | 3/1/19 | 1,000,000 | 1,066,020 | ||||
| New York State Dormitory | ||||||||
| Authority, Consolidated Fifth | ||||||||
| General Resolution Revenue | ||||||||
| (City University System) | 5.00 | 7/1/19 | 1,000,000 | 1,030,950 | ||||
| New York State Dormitory | ||||||||
| Authority, Consolidated | ||||||||
| Revenue (City University | ||||||||
| System) (Insured; FGIC) | 5.75 | 7/1/18 | 2,370,000 | 2,579,958 | ||||
| New York State Dormitory | ||||||||
| Authority, Court Facilities LR | ||||||||
| (The City of New York Issue) | 5.38 | 5/15/13 | 1,000,000 b | 1,148,060 | ||||
| New York State Dormitory | ||||||||
| Authority, LR (State | ||||||||
| University Dormitory | ||||||||
| Facilities Issue) | 5.00 | 7/1/18 | 1,000,000 | 1,020,850 | ||||
| New York State Dormitory | ||||||||
| Authority, Revenue (Columbia | ||||||||
| University) | 5.00 | 7/1/12 | 1,000,000 | 1,092,410 | ||||
| New York State Dormitory | ||||||||
| Authority, Revenue (Columbia | ||||||||
| University) | 5.00 | 7/1/18 | 1,500,000 | 1,659,375 | ||||
| New York State Dormitory | ||||||||
| Authority, Revenue (Columbia | ||||||||
| University) | 5.00 | 7/1/38 | 500,000 | 498,470 | ||||
| New York State Dormitory | ||||||||
| Authority, Revenue (Fordham | ||||||||
| University) (Insured; FGIC) | 5.00 | 7/1/18 | 405,000 | 416,162 | ||||
| New York State Dormitory | ||||||||
| Authority, Revenue (Memorial | ||||||||
| Sloan-Kettering Cancer Center) | 5.00 | 7/1/11 | 1,000,000 | 1,058,480 |
The Fund 11
| STATEMENT OF INVESTMENTS (continued) |
| Long-Term Municipal | Coupon | Maturity | Principal | |||||
| Investments (continued) | Rate (%) | Date | Amount ($) | Value ($) | ||||
| New York (continued) | ||||||||
| New York State Dormitory | ||||||||
| Authority, Revenue (Memorial | ||||||||
| Sloan-Kettering Cancer Center) | ||||||||
| (Insured; MBIA, Inc.) | 5.00 | 7/1/20 | 3,250,000 | 3,292,413 | ||||
| New York State Dormitory | ||||||||
| Authority, Revenue (New York | ||||||||
| University) (Insured; AMBAC) | 5.50 | 7/1/09 | 1,500,000 | 1,532,670 | ||||
| New York State Dormitory | ||||||||
| Authority, Revenue (New York | ||||||||
| University) (Insured; FGIC) | 5.00 | 7/1/21 | 1,500,000 | 1,536,915 | ||||
| New York State Dormitory | ||||||||
| Authority, Revenue (Rochester | ||||||||
| Institute of Technology) | ||||||||
| (Insured; AMBAC) | 5.00 | 7/1/13 | 500,000 | 510,680 | ||||
| New York State Dormitory | ||||||||
| Authority, Revenue (State | ||||||||
| University Educational | ||||||||
| Facilities) (Insured; CMAC) | 5.25 | 5/15/15 | 500,000 | 527,545 | ||||
| New York State Dormitory | ||||||||
| Authority, Revenue | ||||||||
| (State University | ||||||||
| Educational Facilities) | ||||||||
| (Insured; MBIA, Inc.) | 5.88 | 5/15/11 | 1,500,000 | 1,619,235 | ||||
| New York State Dormitory | ||||||||
| Authority, Revenue | ||||||||
| (State University | ||||||||
| Educational Facilities) | ||||||||
| (Insured; MBIA, Inc.) | 5.00 | 5/15/15 | 800,000 | 808,832 | ||||
| New York State Dormitory | ||||||||
| Authority, Revenue (The New | ||||||||
| York Public Library) (Insured; | ||||||||
| MBIA, Inc.) | 0.00 | 7/1/10 | 600,000 a | 585,132 | ||||
| New York State Dormitory | ||||||||
| Authority, Revenue (Upstate | ||||||||
| Community Colleges) | ||||||||
| (Insured; AMBAC) | 5.00 | 7/1/14 | 1,105,000 | 1,128,603 | ||||
| New York State Dormitory | ||||||||
| Authority, Revenue | ||||||||
| (Vassar College) | 5.00 | 7/1/15 | 675,000 | 747,461 | ||||
| New York State Dormitory | ||||||||
| Authority, Secured HR | ||||||||
| (The Bronx-Lebanon | ||||||||
| Hospital Center) | 4.00 | 8/15/14 | 1,000,000 | 1,008,240 |
12
| Long-Term Municipal | Coupon | Maturity | Principal | |||||
| Investments (continued) | Rate (%) | Date | Amount ($) | Value ($) | ||||
| New York (continued) | ||||||||
| New York State Dormitory | ||||||||
| Authority, State Personal | ||||||||
| Income Tax Revenue (Education) | 5.00 | 3/15/16 | 1,000,000 | 1,088,190 | ||||
| New York State Dormitory Authority, | ||||||||
| Third General Resolution Revenue | ||||||||
| (State University Educational | ||||||||
| Facilities Issue) | 5.25 | 5/15/12 | 1,500,000 | 1,522,470 | ||||
| New York State Environmental | ||||||||
| Facilities Corporation, State | ||||||||
| Clean Water and Drinking Water | ||||||||
| Revolving Funds Revenue (New | ||||||||
| York City Municipal Water | ||||||||
| Finance Authority Projects) | 5.25 | 6/15/12 | 390,000 | 395,058 | ||||
| New York State Environmental | ||||||||
| Facilities Corporation, State | ||||||||
| Clean Water and Drinking Water | ||||||||
| Revolving Funds Revenue (New | ||||||||
| York City Municipal Water | ||||||||
| Finance Authority Projects) | 5.25 | 6/15/14 | 1,500,000 | 1,678,830 | ||||
| New York State Environmental | ||||||||
| Facilities Corporation, State | ||||||||
| Clean Water and Drinking Water | ||||||||
| Revolving Funds Revenue (New | ||||||||
| York City Municipal Water | ||||||||
| Finance Authority Projects) | 5.38 | 6/15/15 | 1,000,000 | 1,071,140 | ||||
| New York State Environmental | ||||||||
| Facilities Corporation, State | ||||||||
| Clean Water and Drinking Water | ||||||||
| Revolving Funds Revenue (New | ||||||||
| York City Municipal Water | ||||||||
| Finance Authority Projects) | 5.25 | 6/15/17 | 1,000,000 | 1,065,400 | ||||
| New York State Environmental | ||||||||
| Facilities Corporation, State | ||||||||
| Clean Water and Drinking Water | ||||||||
| Revolving Funds Revenue (New | ||||||||
| York City Municipal Water | ||||||||
| Finance Authority Projects) | 5.25 | 6/15/19 | 775,000 | 808,984 | ||||
| New York State Environmental | ||||||||
| Facilities Corporation, State | ||||||||
| Water Pollution Control | ||||||||
| Revolving Fund Revenue (New | ||||||||
| York City Municipal Water | ||||||||
| Finance Authority Project) | 7.00 | 6/15/12 | 150,000 | 150,645 |
The Fund 13
| STATEMENT OF INVESTMENTS (continued) |
| Long-Term Municipal | Coupon | Maturity | Principal | ||||||
| Investments (continued) | Rate (%) | Date | Amount ($) | Value ($) | |||||
| New York (continued) | |||||||||
| New York State Environmental | |||||||||
| Facilities Corporation, State | |||||||||
| Water Pollution Control | |||||||||
| Revolving Fund Revenue (Pooled | |||||||||
| Loan Issue) | 7.20 | 3/15/11 | 5,000 | 5,023 | |||||
| New York State Medical Care | |||||||||
| Facilities Finance Agency, | |||||||||
| Secured Mortgage Revenue | |||||||||
| (Collateralized; SONYMA) | 6.38 | 11/15/20 | 440,000 | 440,339 | |||||
| New York State Mortgage Agency, | |||||||||
| Homeowner Mortgage Revenue | 5.10 | 10/1/17 | 1,000,000 | 1,006,650 | |||||
| New York State Mortgage Agency, | |||||||||
| Homeowner Mortgage Revenue | 5.38 | 10/1/17 | 1,000,000 | 1,003,340 | |||||
| New York State Power Authority, | |||||||||
| Revenue | 5.00 | 11/15/12 | 2,500,000 | b | 2,799,375 | ||||
| New York State Power Authority, | |||||||||
| Revenue (Insured; FGIC) | 5.00 | 11/15/20 | 1,000,000 | 1,031,010 | |||||
| New York State Thruway Authority, | |||||||||
| General Revenue (Insured; | |||||||||
| AMBAC) | 5.00 | 1/1/19 | 1,000,000 | 1,039,890 | |||||
| New York State Thruway Authority, | |||||||||
| Highway and Bridge Trust Fund | |||||||||
| Bonds (Insured; MBIA, Inc.) | 5.25 | 10/1/11 | 1,000,000 | b | 1,098,780 | ||||
| New York State Thruway Authority, | |||||||||
| Local Highway and Bridge | |||||||||
| Service Contract Bonds | 5.50 | 4/1/14 | 1,000,000 | 1,071,840 | |||||
| New York State Thruway Authority, | |||||||||
| Second General Highway and | |||||||||
| Bridge Trust Fund Bonds | |||||||||
| (Insured; AMBAC) | 5.00 | 4/1/25 | 2,000,000 | 1,962,340 | |||||
| New York State Thruway Authority, | |||||||||
| Second General Highway and | |||||||||
| Bridge Trust Fund Bonds | |||||||||
| (Insured; FSA) | 4.75 | 4/1/13 | 1,000,000 | b | 1,096,710 | ||||
| New York State Urban Development | |||||||||
| Corporation, Corporate Purpose | |||||||||
| Senior Lien Revenue | 5.50 | 7/1/16 | 1,460,000 | 1,463,460 | |||||
| New York State Urban Development | |||||||||
| Corporation, Service | |||||||||
| Contract Revenue | 5.25 | 1/1/24 | 2,375,000 | 2,324,365 |
14
| Long-Term Municipal | Coupon | Maturity | Principal | |||||
| Investments (continued) | Rate (%) | Date | Amount ($) | Value ($) | ||||
| New York (continued) | ||||||||
| Onondaga County, | ||||||||
| GO | 5.00 | 5/1/12 | 350,000 b | 386,848 | ||||
| Onondaga County, | ||||||||
| GO | 5.00 | 5/1/17 | 1,150,000 | 1,218,046 | ||||
| Orange County, | ||||||||
| GO | 5.00 | 7/15/19 | 1,000,000 | 1,062,520 | ||||
| Orange County, | ||||||||
| GO | 5.00 | 7/15/20 | 1,000,000 | 1,046,940 | ||||
| Port Authority of New York and New | ||||||||
| Jersey (Consolidated Bonds, | ||||||||
| 125th Series) (Insured; FSA) | 5.00 | 10/15/19 | 2,000,000 | 2,074,360 | ||||
| Port Authority of New York and New | ||||||||
| Jersey (Consolidated Bonds, | ||||||||
| 128th Series) (Insured; FSA) | 5.00 | 11/1/18 | 1,000,000 | 1,051,770 | ||||
| Port Authority of New York and | ||||||||
| New Jersey (Consolidated | ||||||||
| Bonds, 140th Series) | ||||||||
| (Insured; FSA) | 5.00 | 12/1/19 | 1,000,000 | 1,054,520 | ||||
| Port Authority of New York and New | ||||||||
| Jersey (Consolidated Bonds, | ||||||||
| 142nd Series) | 5.00 | 7/15/21 | 1,000,000 | 1,019,340 | ||||
| Rockland County, | ||||||||
| GO (Various Purpose) | 5.00 | 10/1/15 | 500,000 | 528,150 | ||||
| Suffolk, | ||||||||
| Public Improvement GO | ||||||||
| (Insured; FGIC) | 5.00 | 10/1/13 | 750,000 | 799,935 | ||||
| Suffolk County Water Authority, | ||||||||
| Water System Revenue (Insured; | ||||||||
| MBIA, Inc.) | 4.00 | 6/1/14 | 1,000,000 | 1,049,790 | ||||
| Tobacco Settlement Financing | ||||||||
| Corporation, Asset-Backed | ||||||||
| Revenue Bonds (State | ||||||||
| Contingency Contract Secured) | 5.00 | 6/1/12 | 2,000,000 | 2,115,460 | ||||
| Triborough Bridge and Tunnel | ||||||||
| Authority, General Purpose | ||||||||
| Revenue | 6.00 | 1/1/12 | 1,000,000 | 1,064,800 | ||||
| Triborough Bridge and Tunnel | ||||||||
| Authority, General | ||||||||
| Purpose Revenue | 5.25 | 1/1/16 | 1,000,000 | 1,053,800 |
The Fund 15
| STATEMENT OF INVESTMENTS (continued) |
| Long-Term Municipal | Coupon | Maturity | Principal | ||||||
| Investments (continued) | Rate (%) | Date | Amount ($) | Value ($) | |||||
| New York (continued) | |||||||||
| Triborough Bridge and Tunnel | |||||||||
| Authority, General Purpose | |||||||||
| Revenue | 5.25 | 1/1/22 | 1,000,000 | b | 1,150,440 | ||||
| Triborough Bridge and Tunnel | |||||||||
| Authority, General Revenue | 5.25 | 11/15/15 | 1,000,000 | 1,123,430 | |||||
| Triborough Bridge and Tunnel | |||||||||
| Authority, General Revenue | 5.25 | 11/15/16 | 2,000,000 | 2,127,720 | |||||
| Triborough Bridge and Tunnel | |||||||||
| Authority, General Revenue | 5.25 | 11/15/17 | 775,000 | 824,492 | |||||
| Troy Industrial Development | |||||||||
| Authority, Civic Facility | |||||||||
| Revenue (Rensselaer | |||||||||
| Polytechnic Institute Project) | 5.00 | 9/1/10 | 2,000,000 | 2,018,440 | |||||
| Westchester County, | |||||||||
| GO | 4.00 | 11/15/15 | 1,000,000 | 1,055,540 | |||||
| Westchester County Health Care | |||||||||
| Corporation, Subordinate | |||||||||
| Lien Revenue | 5.13 | 11/1/15 | 1,100,000 | 1,143,230 | |||||
| U.S. Related—4.1% | |||||||||
| Puerto Rico Commonwealth, | |||||||||
| Public Improvement GO | 5.50 | 7/1/13 | 1,000,000 | 968,310 | |||||
| Puerto Rico Highways and | |||||||||
| Transportation Authority, | |||||||||
| Highway Revenue (Insured; | |||||||||
| MBIA, Inc.) | 6.00 | 7/1/11 | 1,000,000 | 1,039,480 | |||||
| Puerto Rico Highways and | |||||||||
| Transportation Authority, | |||||||||
| Transportation Revenue | 5.25 | 7/1/12 | 1,000,000 | b | 1,104,870 | ||||
| Puerto Rico Housing Finance | |||||||||
| Authority, Capital Fund | |||||||||
| Program Revenue (Puerto Rico | |||||||||
| Housing Administration Projects) | 5.00 | 12/1/13 | 740,000 | b | 823,805 | ||||
| Puerto Rico Housing Finance | |||||||||
| Authority, Capital Fund | |||||||||
| Program Revenue (Puerto Rico | |||||||||
| Housing Administration Projects) | 5.00 | 12/1/13 | 730,000 | b | 812,673 |
16
| Long-Term Municipal | Coupon | Maturity | Principal | ||||||
| Investments (continued) | Rate (%) | Date | Amount ($) | Value ($) | |||||
| U.S. Related (continued) | |||||||||
| Puerto Rico Housing Finance | |||||||||
| Authority, Capital Fund | |||||||||
| Program Revenue (Puerto Rico | |||||||||
| Housing Administration Projects) | 5.00 | 12/1/18 | 260,000 | 267,701 | |||||
| Puerto Rico Housing Finance | |||||||||
| Authority, Capital Fund | |||||||||
| Program Revenue (Puerto Rico | |||||||||
| Housing Administration Projects) | 5.00 | 12/1/19 | 270,000 | 275,241 | |||||
| Total Long-Term Municipal Investments | |||||||||
| (cost $118,687,890) | 120,394,357 | ||||||||
| Short-Term Municipal | |||||||||
| Investments—6.0% | |||||||||
| New York; | |||||||||
| Metropolitan Transportation | |||||||||
| Authority, Transportation | |||||||||
| Revenue (LOC; BNP Paribas) | 1.15 | 1/1/09 | 300,000 | c | 300,000 | ||||
| New York City, | |||||||||
| GO Notes (Insured; FSA and | |||||||||
| Liquidity Facility; Dexia | |||||||||
| Credit Locale) | 1.15 | 1/1/09 | 2,650,000 | c | 2,650,000 | ||||
| New York City, | |||||||||
| GO Notes (LOC; Bayerische | |||||||||
| Landesbank) | 1.05 | 1/1/09 | 800,000 | c | 800,000 | ||||
| New York City, | |||||||||
| GO Notes (LOC; JPMorgan | |||||||||
| Chase Bank) | 1.05 | 1/1/09 | 100,000 | c | 100,000 | ||||
| New York City, | |||||||||
| GO Notes (LOC; JPMorgan | |||||||||
| Chase Bank) | 1.05 | 1/1/09 | 300,000 | c | 300,000 | ||||
| New York City, | |||||||||
| GO Notes (LOC; JPMorgan | |||||||||
| Chase Bank) | 1.05 | 1/1/09 | 200,000 | c | 200,000 | ||||
| New York City, | |||||||||
| GO Notes (LOC; JPMorgan | |||||||||
| Chase Bank) | 1.05 | 1/1/09 | 250,000 | c | 250,000 | ||||
The Fund 17
| STATEMENT OF INVESTMENTS (continued) |
| Short-Term Municipal | Coupon | Maturity | Principal | ||||||
| Investments (continued) | Rate (%) | Date | Amount ($) | Value ($) | |||||
| New York (continued) | |||||||||
| New York City Municipal Water | |||||||||
| Finance Authority, Water and | |||||||||
| �� Sewer System Second General | |||||||||
| Resolution Revenue (Liquidity | |||||||||
| Facility; Dexia Credit Locale) | 1.30 | 1/1/09 | 3,000,000 | c | 3,000,000 | ||||
| New York City Transitional Finance | |||||||||
| Authority, Revenue (New York | |||||||||
| City Recovery) (Liquidity | |||||||||
| Facility; Dexia Credit Locale) | 1.15 | 1/1/09 | 150,000 | c | 150,000 | ||||
| Total Short-Term Municipal Investments | |||||||||
| (cost $7,750,000) | 7,750,000 | ||||||||
| Total Investments (cost $126,437,890) | 98.7% | 128,144,357 | |||||||
| Cash and Receivables (Net) | 1.3% | 1,752,628 | |||||||
| Net Assets | 100.0% | 129,896,985 | |||||||
| a Security issued with a zero coupon. Income is recognized through the accretion of discount. |
| b These securities are prerefunded; the date shown represents the prerefunded date. Bonds which are prerefunded are |
| collateralized by U.S. Government securities which are held in escrow and are used to pay principal and interest on |
| the municipal issue and to retire the bonds in full at the earliest refunding date. |
| c Variable rate demand note—rate shown is the interest rate in effect at December 31, 2008. Maturity date represents |
| the next demand date, or the ultimate maturity date if earlier. |
18
| Summary of Abbreviations | ||||||
| ABAG | Association of Bay Area Governments | ACA | American Capital Access | |||
| AGC | ACE Guaranty Corporation | AGIC | Asset Guaranty Insurance Company | |||
| AMBAC | American Municipal Bond | |||||
| Assurance Corporation | ARRN | Adjustable Rate Receipt Notes | ||||
| BAN | Bond Anticipation Notes | BIGI | Bond Investors Guaranty Insurance | |||
| BPA | Bond Purchase Agreement | CGIC | Capital Guaranty Insurance Company | |||
| CIC | Continental Insurance Company | CIFG | CDC Ixis Financial Guaranty | |||
| CMAC | Capital Market Assurance Corporation | COP | Certificate of Participation | |||
| CP | Commercial Paper | EDR | Economic Development Revenue | |||
| EIR | Environmental Improvement Revenue | FGIC | Financial Guaranty Insurance | |||
| Company | ||||||
| FHA | Federal Housing Administration | FHLB | Federal Home Loan Bank | |||
| FHLMC | Federal Home Loan Mortgage | FNMA | Federal National | |||
| Corporation | Mortgage Association | |||||
| FSA | Financial Security Assurance | GAN | Grant Anticipation Notes | |||
| GIC | Guaranteed Investment Contract | GNMA | Government National | |||
| Mortgage Association | ||||||
| GO | General Obligation | HR | Hospital Revenue | |||
| IDB | Industrial Development Board | IDC | Industrial Development Corporation | |||
| IDR | Industrial Development Revenue | LOC | Letter of Credit | |||
| LOR | Limited Obligation Revenue | LR | Lease Revenue | |||
| MFHR | Multi-Family Housing Revenue | MFMR | Multi-Family Mortgage Revenue | |||
| PCR | Pollution Control Revenue | PILOT | Payment in Lieu of Taxes | |||
| RAC | Revenue Anticipation Certificates | RAN | Revenue Anticipation Notes | |||
| RAW | Revenue Anticipation Warrants | RRR | Resources Recovery Revenue | |||
| SAAN | State Aid Anticipation Notes | SBPA | Standby Bond Purchase Agreement | |||
| SFHR | Single Family Housing Revenue | SFMR | Single Family Mortgage Revenue | |||
| SONYMA | State of New York Mortgage Agency | SWDR | Solid Waste Disposal Revenue | |||
| TAN | Tax Anticipation Notes | TAW | Tax Anticipation Warrants | |||
| TRAN | Tax and Revenue Anticipation Notes | XLCA | XL Capital Assurance | |||
The Fund 19
| STATEMENT OF INVESTMENTS (continued) |
| Summary of Combined Ratings (Unaudited) | ||||||||||
| Fitch | or | Moody’s | or | Standard & Poor’s | Value (%)† | |||||
| AAA | Aaa | AAA | 35.0 | |||||||
| AA | Aa | AA | 48.4 | |||||||
| A | A | A | 8.8 | |||||||
| BBB | Baa | BBB | 1.4 | |||||||
| F1 | MIG1/P1 | SP1/A1 | 6.1 | |||||||
| Not Ratedd | Not Ratedd | Not Ratedd | .3 | |||||||
| 100.0 | ||||||||||
| † Based on total investments. |
| d Securities which, while not rated by Fitch, Moody’s and Standard & Poor’s, have been determined by the Manager |
| be of comparable quality to those rated securities in which the fund may invest. |
| See notes to financial statements. |
20
| STATEMENT OF ASSETS AND LIABILITIES December 31, 2008 |
| Cost | Value | |||
| Assets ($): | ||||
| Investments in securities—See Statement of Investments | 126,437,890 | 128,144,357 | ||
| Interest receivable | 1,578,912 | |||
| Receivable for shares of Beneficial Interest subscribed | 400,000 | |||
| Prepaid expenses | 6,913 | |||
| 130,130,182 | ||||
| Liabilities ($): | ||||
| Due to The Dreyfus Corporation and affiliates—Note 3(c) | 46,164 | |||
| Due to Administrator—Note 3(a) | 13,993 | |||
| Cash overdraft due to Custodian | 115,083 | |||
| Payable for shares of Beneficial Interest redeemed | 3,261 | |||
| Accrued expenses | 54,696 | |||
| 233,197 | ||||
| Net Assets ($) | 129,896,985 | |||
| Composition of Net Assets ($): | ||||
| Paid-in capital | 128,185,428 | |||
| Accumulated net realized gain (loss) on investments | 5,090 | |||
| Accumulated net unrealized appreciation | ||||
| (depreciation) on investments | 1,706,467 | |||
| Net Assets ($) | 129,896,985 |
| Net Asset Value Per Share | ||||
| Class M Shares | Investor Shares | |||
| Net Assets ($) | 113,698,872 | 16,198,113 | ||
| Shares Outstanding | 10,612,532 | 1,511,013 | ||
| Net Asset Value Per Share ($) | 10.71 | 10.72 | ||
| See notes to financial statements. | ||||
The Fund 21
| STATEMENT OF OPERATIONS Year Ended December 31, 2008 |
| Investment Income ($): | ||
| Interest Income | 4,893,994 | |
| Expenses: | ||
| Investment advisory fee—Note 3(a) | 600,069 | |
| Administration fee—Note 3(a) | 131,481 | |
| Shareholder servicing costs—Note 3(c) | 44,095 | |
| Professional fees | 36,668 | |
| Registration fees | 33,150 | |
| Distribution fees—Note 3(b) | 29,990 | |
| Trustees’ fees and expenses—Note 3(d) | 13,878 | |
| Custodian fees—Note 3(c) | 12,835 | |
| Prospectus and shareholders’ reports | 9,516 | |
| Miscellaneous | 32,183 | |
| Total Expenses | 943,865 | |
| Less—reduction in investment advisory fees | ||
| due to undertaking—Note 3(a) | (192,479) | |
| Less—reduction in fees due to | ||
| earnings credits—Note 1(b) | (1,447) | |
| Net Expenses | 749,939 | |
| Investment Income—Net | 4,144,055 | |
| Realized and Unrealized Gain (Loss) on Investments—Note 4 ($): | ||
| Net realized gain (loss) on investments | 20,068 | |
| Net unrealized appreciation (depreciation) on investments | (938,532) | |
| Net Realized and Unrealized Gain (Loss) on Investments | (918,464) | |
| Net Increase in Net Assets Resulting from Operations | 3,225,591 | |
| See notes to financial statements. | ||
22
STATEMENT OF CHANGES IN NET ASSETS
| Year Ended December 31, | ||||
| 2008a | 2007a,b | |||
| Operations ($): | ||||
| Investment income—net | 4,144,055 | 4,017,532 | ||
| Net realized gain (loss) on investments | 20,068 | 203,025 | ||
| Net unrealized appreciation | ||||
| (depreciation) on investments | (938,532) | 514,471 | ||
| Net Increase (Decrease) in Net Assets | ||||
| Resulting from Operations | 3,225,591 | 4,735,028 | ||
| Dividends to Shareholders from ($): | ||||
| Investment income—net: | ||||
| Class M Shares | (3,598,570) | (3,438,535) | ||
| Investor Shares | (543,884) | (578,931) | ||
| Net realized gain on investments: | ||||
| Class M Shares | (68,788) | (117,454) | ||
| Investor Shares | (10,087) | (20,561) | ||
| Total Dividends | (4,221,329) | (4,155,481) | ||
| Beneficial Interest Transactions ($): | ||||
| Net proceeds from shares sold: | ||||
| Class M Shares | 126,073,812 | 16,821,126 | ||
| Investor Shares | 4,658,301 | 383,375 | ||
| Dividends reinvested: | ||||
| Class M Shares | 565,070 | 563,588 | ||
| Investor Shares | 418,905 | 463,142 | ||
| Class C Shares | — | 8 | ||
| Cost of shares redeemed: | ||||
| Class M Shares | (110,021,230) | (14,729,741) | ||
| Investor Shares | (5,889,948) | (1,912,848) | ||
| Class C Shares | — | (10,447) | ||
| Increase (Decrease) in Net Assets from | ||||
| Beneficial Interest Transactions | 15,804,910 | 1,578,203 | ||
| Total Increase (Decrease) in Net Assets | 14,809,172 | 2,157,750 | ||
| Net Assets ($): | ||||
| Beginning of Period | 115,087,813 | 112,930,063 | ||
| End of Period | 129,896,985 | 115,087,813 | ||
| Undistributed investment income—net | — | 63 | ||
The Fund 23
| STATEMENT OF CHANGES IN NET ASSETS (continued) |
| Year Ended December 31, | ||||
| 2008a | 2007a,b | |||
| Capital Share Transactions: | ||||
| Class M | ||||
| Shares sold | 11,647,326 | 1,569,026 | ||
| Shares issued for dividends reinvested | 53,897 | 52,613 | ||
| Shares redeemed | (10,149,397) | (1,380,442) | ||
| Net Increase (Decrease) in Shares Outstanding | 1,551,826 | 241,197 | ||
| Investor Shares | ||||
| Shares sold | 429,958 | 35,671 | ||
| Shares issued for dividends reinvested | 39,188 | 43,233 | ||
| Shares redeemed | (543,832) | (178,919) | ||
| Net Increase (Decrease) in Shares Outstanding | (74,686) | (100,015) | ||
| Class C | ||||
| Shares issued for dividends reinvested | — | 1 | ||
| Shares redeemed | — | (970) | ||
| Net Increase (Decrease) in Shares Outstanding | — | (969) | ||
| a Represents information for the predecessor fund, BNY Hamilton Intermediate NewYork Tax-Exempt Fund, |
| through September 12, 2008. |
| b Prior to January 1, 2007, Class C Shares accounts had been closed. On January 3, 2007, residual Class C Shares |
| remaining were redeemed. |
| See notes to financial statements. |
24
FINANCIAL HIGHLIGHTS
Please note that the financial highlights information in the following tables for the fund’s Class M and Investor shares represents the financial highlights of the Institutional shares and Class A shares, respectively, of the fund’s predecessor, BNY Hamilton Intermediate New York Tax-Exempt Fund (the “Intermediate New York Tax-Exempt Fund”), before the fund commenced operations as of the close of business on September 12, 2008, and represents the performance of the fund’s shares thereafter. Before the fund commenced operations, all of the assets of the Intermediate NewYork Tax-Exempt Fund were transferred to the fund in a tax-free reorganization. Total return shows how much your investment in the fund would have increased (or decreased) during each period, assuming you had reinvested all dividends and distributions.These figures have been derived from the fund’s and the fund’s predecessor’s financial s tatements.
| Year Ended December 31, | ||||||||||||
| Class M Shares† | 2008 | 2007 | 2006 | 2005 | 2004 | |||||||
| Per Share Data ($): | ||||||||||||
| Net asset value, beginning of period | 10.81 | 10.75 | 10.74 | 10.89 | 11.00 | |||||||
| Investment Operations: | ||||||||||||
| Investment income—neta | .37 | .38 | .37 | .35 | .35 | |||||||
| Net realized and unrealized | ||||||||||||
| gain (loss) on investments | (.09) | .07 | .01 | (.14) | (.08) | |||||||
| Total from Investment Operations | .28 | .45 | .38 | .21 | .27 | |||||||
| Distributions: | ||||||||||||
| Dividends from investment income—net | (.37) | (.38) | (.37) | (.35) | (.35) | |||||||
| Dividends from net realized | ||||||||||||
| gain on investments | (.01) | (.01) | (.00)b | (.01) | (.03) | |||||||
| Total Distributions | (.38) | (.39) | (.37) | (.36) | (.38) | |||||||
| Net asset value, end of period | 10.71 | 10.81 | 10.75 | 10.74 | 10.89 | |||||||
| Total Return (%)c | 2.64 | 4.33 | 3.64 | 2.01 | 2.45 | |||||||
| Ratios/Supplemental Data (%): | ||||||||||||
| Ratio of total expenses to average net assets | .75 | .75 | .76 | .77 | .85 | |||||||
| Ratio of net expenses to average net assets | .59 | .59 | .59 | .59 | .68 | |||||||
| Ratio of net investment income | ||||||||||||
| to average net assets | 3.49 | 3.56 | 3.46 | 3.26 | 3.19 | |||||||
| Portfolio Turnover Rate | 6 | 17 | 13 | 16 | 11 | |||||||
| Net Assets, end of period ($ x 1,000) | 113,699 | 97,935 | 94,789 | 95,160 | 88,706 | |||||||
| † Represents information for Institutional shares of the fund’s predecessor, BNY Hamilton Intermediate NewYork Tax- |
| Exempt Fund, through September 12, 2008. |
| a | Based on average shares outstanding at each month end. | |
| b | Amount represents less than $.01 per share. | |
| c | Exclusive of sales charge. |
| See notes to financial statements. |
The Fund 25
| FINANCIAL HIGHLIGHTS (continued) |
| Year Ended December 31, | ||||||||||
| Investor Shares† | 2008 | 2007 | 2006 | 2005 | 2004 | |||||
| Per Share Data ($): | ||||||||||
| Net asset value, beginning of period | 10.82 | 10.76 | 10.75 | 10.90 | 11.01 | |||||
| Investment Operations: | ||||||||||
| Investment income—neta | .34 | .35 | .34 | .33 | .32 | |||||
| Net realized and unrealized | ||||||||||
| gain (loss) on investments | (.08) | .08 | .01 | (.14) | (.08) | |||||
| Total from Investment Operations | .26 | .43 | .35 | .19 | .24 | |||||
| Distributions: | ||||||||||
| Dividends from investment income—net | (.35) | (.36) | (.34) | (.33) | (.32) | |||||
| Dividends from net realized | ||||||||||
| gain on investments | (.01) | (.01) | (.00)b | (.01) | (.03) | |||||
| Total Distributions | (.36) | (.37) | (.34) | (.34) | (.35) | |||||
| Net asset value, end of period | 10.72 | 10.82 | 10.76 | 10.75 | 10.90 | |||||
| Total Return (%)c | 2.39 | 4.07 | 3.38 | 1.76 | 2.19 | |||||
| Ratios/Supplemental Data (%): | ||||||||||
| Ratio of total expenses | ||||||||||
| to average net assets | 1.00 | 1.00 | 1.01 | 1.02 | 1.11 | |||||
| Ratio of net expenses | ||||||||||
| to average net assets | .84 | .84 | .84 | .84 | .94 | |||||
| Ratio of net investment income | ||||||||||
| to average net assets | 3.24 | 3.31 | 3.21 | 3.00 | 2.93 | |||||
| Portfolio Turnover Rate | 6 | 17 | 13 | 16 | 11 | |||||
| Net Assets, end of period ($ x 1,000) | 16,198 | 17,153 | 18,131 | 20,164 | 22,844 | |||||
| † Represents information for Class A shares of the fund’s predecessor, BNY Hamilton Intermediate NewYork Tax- |
| Exempt Fund, through September 12, 2008. |
| a | Based on average shares outstanding at each month end. | |
| b | Amount represents less than $.01 per share. | |
| c | Exclusive of sales charge. |
| See notes to financial statements. |
26
NOTES TO FINANCIAL STATEMENTS
NOTE 1—Significant Accounting Policies:
BNY Mellon FundsTrust (the “Trust”) was organized as a Massachusetts business trust which is registered under the Investment Company Act of 1940, as amended (the “Act”), as a diversified open-end management investment company and operates as a series company currently comprised of twenty-one series, including the BNY Mellon New York Intermediate Tax-Exempt Bond Fund (the “fund”). The fund’s investment objective seeks to provide investors with as high a level of current income exempt from federal, New York state and New York city personal income taxes as is consistent with the preservation of capital. BNY Mellon Fund advisers, a division ofThe Dreyfus Corporation (the “Manager” or “Dreyfus”), a wholly-owned subsidiary of The Bank of New York Mellon Corporation (“BNY Mellon”), serves as the fund’s investment adviser (“Investment Adviser”). The Bank of New York Mell on, a subsidiary of BNY Mellon and an affiliate of Dreyfus, serves as administrator for the fund pursuant to an Administration Agreement with the Trust (the “Administration Agreement”). The Bank of New York Mellon has entered into a Sub-Administration Agreement with Dreyfus pursuant to which The Bank of New York Mellon pays Dreyfus for performing certain administrative services.
On September 9, 2008, the Trust’s Board of Trustees approved the change of the fund’s fiscal year end from December 31st to August 31st.
As of the close of business on September 12, 2008, pursuant to an Agreement and Plan of Reorganization previously approved by the Trust’s Board of Trustees, all of the assets, subject to the liabilities, of Intermediate New York Tax-Exempt Fund, a series of BNY Hamilton Funds, Inc., were transferred to the fund in exchange for the corresponding class of shares of Beneficial Interest of the fund of equal value. Shareholders of Institutional and Class A shares of the Intermediate New York Tax-Exempt Fund received Class M and Investor shares of the fund, respectively, in each case in an amount equal to the aggregate
The Fund 27
| NOTES TO FINANCIAL STATEMENTS (continued) |
net asset value of their investment in the Intermediate New York Tax-Exempt Fund at the time of the exchange. The net asset value of the fund’s shares on the close of business September 12, 2008, after the reorganization, was $10.88 for Class M shares and $10.89 for Investor shares, and a total of 10,104,446 Class M shares and 1,481,705 Investor shares, representing net assets of $126,036,956 (including $3,602,375 net unrealized appreciation on investments) were issued to shareholders of the Intermediate NewYorkTax-Exempt Fund in the exchange.The exchange was a tax-free event to the shareholders of the fund. Intermediate New York Tax-Exempt Fund is the accounting survivor and its historical performance is presented for periods prior to September 12, 2008.
MBSC Securities Corporation (the “Distributor”), a wholly-owned subsidiary of Dreyfus, is the distributor of the fund’s shares, which are sold without a sales charge.The Trust is authorized to issue an unlimited number of shares of Beneficial Interest, par value $.001per share, in Class M and Investor class shares of the fund. Each class of shares has identical rights and privileges, except with respect to the expenses borne by each class and the shareholder services offered to each class, the shareholder services plan applicable to Investor shares and certain voting rights. Income, expenses (other than expenses attributable to a specific class), and realized and unrealized gains or losses on investments are allocated to each class of shares based on its relative net assets.
The Trust accounts separately for the assets, liabilities and operations of each series. Expenses directly attributable to each series are charged to that series’ operations; expenses which are applicable to all series are allocated among them on a pro rata basis.
The fund’s financial statements are prepared in accordance with U.S. generally accepted accounting principles, which may require the use of management estimates and assumptions. Actual results could differ from those estimates.
(a) Portfolio valuation: Investments in securities are valued each business day by an independent pricing service (the “Service”) approved by
28
the Board of Trustees. Investments for which quoted bid prices are readily available and are representative of the bid side of the market in the judgment of the Service are valued at the mean between the quoted bid prices (as obtained by the Service from dealers in such securities) and asked prices (as calculated by the Service based upon its evaluation of the market for such securities). Other investments are valued by the Service, based on methods which include consideration of: yields or prices of municipal securities of comparable quality, coupon, maturity and type; indications as to values from dealers; and general market conditions. Options and financial futures on municipal and U.S. Treasury securities are valued at the last sales price on the securities exchange on which such securities are primarily traded or at the last sales price on the national securities market on each business day.
The fund adopted Statement of Financial Accounting Standards No. 157 “Fair Value Measurements” (“FAS 157”). FAS 157 establishes an authoritative definition of fair value, sets out a framework for measuring fair value, and requires additional disclosures about fair value measurements.
Various inputs are used in determining the value of the fund’s investments relating to FAS 157.These inputs are summarized in the three broad levels listed below.
| Level 1—quoted prices in active markets for identical securities. Level 2—other significant observable inputs (including quoted prices for similar securities, interest rates, prepayment speeds, credit risk, etc.). Level 3—significant unobservable inputs (including the fund’s own assumptions in determining the fair value of investments). |
The inputs or methodology used for valuing securities are not necessarily an indication of the risk associated with investing in those securities.
The Fund 29
| NOTES TO FINANCIAL STATEMENTS (continued) |
The following is a summary of the inputs used as of December 31, 2008 in valuing the fund’s investments carried at fair value:
| Investments in | Other Financial | |||
| Valuation Inputs | Securities ($) | Instruments ($)† | ||
| Level 1—Quoted Prices | 0 | 0 | ||
| Level 2—Other Significant | ||||
| Observable Inputs | 128,144,357 | 0 | ||
| Level 3—Significant | ||||
| Unobservable Inputs | 0 | 0 | ||
| Total | 128,144,357 | 0 |
| † | Other financial instruments include derivative instruments, such as futures, forward currency | |
| exchange contracts and swap contracts, which are valued at the unrealized appreciation | ||
| (depreciation) on the instrument and written options contracts which are shown at value. |
(b) Securities transactions and investment income: Securities transactions are recorded on a trade date basis. Realized gains and losses from securities transactions are recorded on the identified cost basis. Interest income, adjusted for accretion of discount and amortization of premium on investments, is earned from settlement date and recognized on the accrual basis. Securities purchased or sold on a when-issued or delayed-delivery basis may be settled a month or more after the trade date.
The fund has arrangements with the custodian and cash management banks whereby the fund may receive earnings credits when positive cash balances are maintained, which are used to offset custody and cash management fees. For financial reporting purposes, the fund includes net earnings credits as an expense offset in the Statement of Operations.
The fund follows an investment policy of investing primarily in municipal obligations of one state. Economic changes affecting the state and certain of its public bodies and municipalities may affect the ability of issuers within the state to pay interest on, or repay principal of, municipal obligations held by the fund.
(c) Dividends to shareholders: It is the policy of the fund to declare dividends daily from investment income-net. Such dividends are paid monthly. Dividends from net realized capital gains, if any, are normally declared and paid annually, but the fund may make distributions on a more frequent basis to comply with the distribution requirements of
30
the Internal Revenue Code of 1986, as amended (the “Code”).To the extent that net realized capital gains can be offset by capital loss carryovers, it is the policy of the fund not to distribute such gains. Income and capital gain distributions are determined in accordance with income tax regulations, which may differ from U.S. generally accepted accounting principles.
(d) Federal income taxes: It is the policy of the fund to continue to qualify as a regulated investment company, which can distribute tax exempt dividends, by complying with the applicable provisions of the Code, and to make distributions of income and net realized capital gain sufficient to relieve it from substantially all federal income and excise taxes. For federal income tax purposes, each series is treated as a single entity for the purpose of determining such qualification.
As of and during the period ended December 31, 2008, the fund did not have any liabilities for any unrecognized tax positions. The fund recognizes interest and penalties, if any, related to unrecognized tax positions as income tax expense in the Statement of Operations. During the period, the fund did not incur any interest or penalties.
Each of the tax years in the four-year period ended December 31, 2008, remains subject to examination by the Internal Revenue Service and state taxing authorities.
At December 31, 2008, the components of accumulated earnings on a tax basis were as follows: undistributed capital gains $3,489 and unrealized appreciation $1,708,068.
The tax character of distributions paid to shareholders during the fiscal periods ended December 31, 2008 and December 31, 2007 were as follows: tax exempt income $4,142,454 and $4,017,466 and long-term capital gains $78,875 and $138,015, respectively.
During the period ended December 31, 2008, as a result of permanent book to tax differences, primarily due to the tax treatment of amortization adjustments, the fund decreased accumulated undistributed investment income-net by $1,664, increased accumulated net
The Fund 31
| NOTES TO FINANCIAL STATEMENTS (continued) |
realized gain (loss) on investments by $1,601 and increased paid-in capital by $63. Net assets and net asset value per share were not affected by this reclassification.
NOTE 2—Bank Lines of Credit:
Effective October 15, 2008, the fund participates with other Dreyfus-managed funds in a $145 million primary credit facility led by Citibank, N.A. (the “Facility”) to be utilized for temporary or emergency purposes, including the financing of redemptions. In connection therewith, the fund has agreed to pay its pro rata portion of Facility fees for the Facility. Interest is charged to the fund based on rates determined pursuant to the terms of the Facility at the time of the borrowing. During the period ended December 31, 2008, the fund did not borrow under the Facility.
NOTE 3—Investment Advisory Fee, Administration and Other Transactions With Affiliates:
(a) Pursuant to an Investment Advisory Agreement (“Agreement”) with the Investment Adviser, effective September 13, 2008, the investment advisory fee is computed at the annual rate of .50% of the value of the fund’s average daily net assets and is payable monthly. Prior to September 13, 2008,The Bank of NewYork Mellon (the “Advisor”) was the advisor for the Intermediate New York Tax-Exempt Fund. The Advisor’s fee was computed at an annual rate of .50% of the value of the Intermediate NewYork Tax-Exempt Fund’s average daily net assets and was payable monthly. During the period ended December 31, 2008, the Adviser and Manager earned $415,022 and $185,047, respectively.
Effective September 13, 2008, the Investment Advisor has contractually agreed to waive receipt of its fees and/or assume the expenses of the fund, until September 30, 2010, so that the direct expenses of neither class, excluding shareholder services fees, taxes, interest, brokerage commissions, commitment fees on borrowings and extraordinary expenses, do not exceed an annual rate of .59% of the value of the fund’s average daily net assets. The reduction in investment advisory
32
fee, pursuant to the undertaking, amounted to $192,479 during the period ended December 31,2008.
Pursuant to the Administration Agreement, The Bank of New York Mellon provides or arranges for fund accounting, transfer agency and other fund administration services and receives a fee based on the total net assets of the Trust based on the following rates:
| 0 up to $6 billion | .15% | |
| $6 billion up to $12 billion | .12% | |
| In excess of $12 billion | .10% |
The administration fees amounted to $48,477 for the period September 13, 2008 through December 31, 2008.
The Bank of NewYork Mellon served as Administrator to Intermediate New York Tax-Exempt Fund pursuant to an Administration Agreement. The Administrator received from Intermediate New York Tax-Exempt Fund a monthly fee equal to an annual rate of .10% of the average daily net asset of Intermediate New York Tax-Exempt Fund. The Administration fees amounted to $83,004 for the period ended September 12, 2008.This agreement was terminated as of the close of business on September 12, 2008, due to the reorganization.
The Bank of NewYork Mellon has entered into a Sub-Administration Agreement with Dreyfus pursuant to which The Bank of New York Mellon pays Dreyfus for performing certain administrative services.
(b) Under a prior Distribution Plan adopted pursuant to Rule 12b-1, the Intermediate New York Tax-Exempt Fund’s Class A shares paid BNY Hamilton Distributors, Inc. for distribution and/or shareholder servicing expenses in an amount up to .25% of the average annual daily net assets of the Class A shares. During the period January 1, 2008 through September 12, 2008, Class A shares were charged $29,990.This agreement was terminated as of the close of business on September 12, 2008, due to the reorganization.
The Fund 33
| NOTES TO FINANCIAL STATEMENTS (continued) |
(c) Under the Shareholder Services Plan, Investor shares reimburse the Distributor an amount not to exceed an annual rate of .25% of the value of the Investor shares average daily net assets for certain allocated expenses with respect to servicing and/or maintaining Investor shares shareholder accounts. The services provided may include personal services relating to shareholder accounts, such as answering shareholder inquiries regarding the fund and providing reports and other information, and services related to the maintenance of shareholder accounts. During the period from September 13, 2008 through December 31, 2008, Investor shares were charged $11,986 pursuant to the Shareholders Services Plan.
The fund compensates The Bank of New York Mellon under a cash management agreement for performing cash management services related to fund subscriptions and redemptions. During the period from September 13, 2008 through December 31, 2008, the fund was charged $1,172 pursuant to the cash management agreement.
The fund compensates The Bank of New York Mellon under a custody agreement for providing custodial services for the fund. During the period ended December 31, 2008, the fund was charged $12,835 pursuant to the custody agreement.
During the period from September 13, 2008 through December 31, 2008, the fund was charged $1,197 for services performed by the Chief Compliance Officer.
The components of “Due to The Dreyfus Corporation and affiliates” in the Statement of Assets and Liabilities consist of: management fees $54,089, shareholder services plan fees $3,378, custodian fees $3,831 and chief compliance officer fees $1,197, which are offset against an expense reimbursement currently in effect in the amount of $16,331.
(d) Effective June 1, 2008, each trustee who is not an “affiliated person” as defined in the Act receives from the Trust an annual fee of $68,000 and an attendance fee of $7,500 for each in-person meeting attended and $500 for telephone meetings and is reimbursed for travel
34
and out-of-pocket expenses. The Chairman of the Trust’s Board receives an additional annual fee of $15,000 and the Chairman of the Trust’s Audit Committee receives an additional annual fee of $10,000. Prior to June 1, 2008, the Trust paid its Board members an annual fee of $48,000 and an attendance fee of $5,000 for each in-person meeting attended and $500 for telephone meetings and reimbursed them for travel and out-of-pocket expenses, and the Chairmen of the Trust’s Board and Audit Committee received additional annual fees of $10,000 and $8,000, respectively.
NOTE 4—Securities Transactions:
The aggregate amount of purchases and sales of investment securities, excluding short-term securities, during the period ended December 31, 2008, amounted to $18,817,444 and $6,931,529, respectively.
At December 31, 2008, the cost of investments for federal income tax purposes was $126,436,289; accordingly, accumulated net unrealized appreciation on investments was $1,708,068, consisting of 2,952,112 gross unrealized appreciation and $1,244,044 gross unrealized depreciation.
In March 2008, the Financial Accounting Standards Board released Statement of Financial Accounting Standards No. 161 “Disclosures about Derivative Instruments and Hedging Activities” (“FAS 161”). FAS 161 requires qualitative disclosures about objectives and strategies for using derivatives, quantitative disclosures about fair value amounts of gains and losses on derivative instruments and disclosures about credit-risk-related contingent features in derivative agreements. The application of FAS 161 is required for fiscal years and interim periods beginning after November 15, 2008.At this time, management is evaluating the implications of FAS 161 and its impact on the financial statements and the accompanying notes has not yet been determined.
The Fund 35
| REPORT OF INDEPENDENT REGISTERED PUBLIC ACCOUNTING FIRM |
| The Board of Trustees and Shareholders BNY Mellon Funds Trust |
We have audited the accompanying statement of assets and liabilities, including the statement of investments, of BNY Mellon New York Intermediate Tax-Exempt Bond Fund, a series of BNY Mellon Funds Trust (the “Trust”) (formerly, BNY Hamilton Intermediate New York Tax-Exempt Fund, a series of BNY Hamilton Funds, Inc.), as of December 31, 2008, and the related statement of operations, the statement of changes in net assets and the financial highlights for the year then ended.The financial statements and financial highlights are the responsibility of the Fund’s management. Our responsibility is to express an opinion on these financial statements and financial highlights based on our audit.The statement of changes in net assets for the year ended December 31, 2007 and the financial highlights for each of the years in the four-year period ended December 31, 2007 were audited by other independent registered public accountants whose r eport thereon dated February 28, 2008, expressed an unqualified opinion on that financial statement and those financial highlights.
We conducted our audit in accordance with the standards of the Public Company Accounting Oversight Board (United States).Those standards require that we plan and perform the audit to obtain reasonable assurance about whether the financial statements and financial highlights are free of material misstatement. An audit includes examining, on a test basis, evidence supporting the amounts and disclosures in the financial statements. Our procedures included confirmation of securities owned as of December 31, 2008, by correspondence with the custodian and brokers. An audit also includes assessing the accounting principles used and significant estimates made by management, as well as evaluating the overall financial statement presentation. We believe that our audit provide a reasonable basis for our opinion. In our opinion, the financial statements and financial highlights referred to above present fairly, in all material respects, the financial po sition of BNY Mellon Intermediate New York Tax-Exempt Bond Fund as of December 31, 2008, and the results of its operations, the changes in its net assets and the financial highlights for the year then ended, in conformity with U. S. generally accepted accounting principles.

| New York, New York February 25, 2009 |
36
IMPORTANT TAX INFORMATION (Unaudited)
In accordance with federal tax law, the fund hereby makes the following designations regarding its fiscal year ended December 31, 2008:
—all the dividends paid from investment income-net are “exempt-interest dividends” (not subject to regular federal income tax and, for individuals who are NewYork residents, NewYork State and New York City personal income taxes).
—the fund hereby designates $.0054 per share as a long-term capital gain distribution paid on September 11, 2008 and also hereby designates $.0014 per share as a long-term capital gain distribution paid on December 11, 2008. As required by federal tax law rules, shareholders will receive notification of their portion of the fund’s taxable ordinary dividends (if any) and capital gains (if any) distributions paid for the 2008 calendar year on Form 1099-DIV and their portion of the Fund’s exempt-interest dividends paid for the 2008 calendar year on Form 1099-INT, both which will be mailed by January 31, 2009.
The Fund 37
| INFORMATION ABOUT THE REVIEW AND APPROVAL OF THE FUND’S INVESTMENT ADVISORY AGREEMENT (Unaudited) |
At a meeting of the Board of Trustees held on March 10-11, 2008, the Board considered the approval of the Trust’s Investment Advisory Agreement with respect to the fund through its renewal date of June 1, 2009, pursuant to which BNY Mellon Fund Advisers, a division of Dreyfus, will provide the fund with investment advisory services. The Board members also considered the approval of the Trust’s Administration Agreement with The Bank of New York Mellon (“BNY Mellon”) for a one year term, pursuant to which BNY Mellon will provide the fund with administrative services. BNY Mellon has entered into a Sub-Administration Agreement with Dreyfus pursuant to which BNY Mellon pays Dreyfus for performing certain of these administrative services. The Board members who are not “interested persons” (as defined in the Act) of theTrust were assisted in their review by independent legal counsel and met with counsel in executive session separate from representatives of Dreyfus.
Analysis of Nature, Extent and Quality of Services to be Provided to the Fund. The Board members received a presentation from representatives of Dreyfus regarding services provided to the other funds comprising the Trust, and discussed the nature, extent and quality of the services to be provided to the fund pursuant to the Investment Advisory Agreement. The Board members also referenced information provided and discussed at the meeting regarding the funds’ distribution of accounts, the diversity of distribution of those funds and Dreyfus’ corresponding need for broad, deep and diverse resources to be able to provide ongoing shareholder services to each of the funds’ distribution channels.
The Board members also considered Dreyfus’ research and portfolio management capabilities and that Dreyfus also provides oversight of day-to-day fund operations, including fund accounting and administration and assistance in meeting legal and regulatory requirements, and Dreyfus’ extensive administrative, accounting and compliance infrastructure.
38
Comparative Analysis of the Fund’s Advisory Fee and Expense Ratio. As the fund had not yet commenced operations, the Board members were not able to review the fund’s performance.The Board was advised, however, that the fund was being established pursuant a proposed reorganization of BNY Hamilton Intermediate New York Tax-Exempt Fund, a series of BNY Hamilton Funds, Inc. (the “BNY Fund”), and will inherit the BNY Fund’s performance record upon the closing of the reorganization. The Board members received a presentation from Dreyfus that described, among other matters, the BNY Fund’s average annual total returns for the 1-, 3-, 5- and 10-year periods ended December 31, 2007. The Board discussed with representatives of Dreyfus the fund’s investment objective and policies and primary portfolio manager, and noted that the current primary portfolio manager of the BNY Fund will continue to serve as the primary portfolio manager of the fund.
The Board members reviewed comparisons of the fund’s proposed advisory fee to those of funds in the Lipper New York Intermediate Municipal Debt Funds category. The fund’s contractual advisory fee was above the average and median advisory or adviser/administration fees of the funds in the category (both with and without any fee waivers and reimbursements).The fund’s total expense ratio (as limited through September 30, 2010 by agreement with BNY Mellon Fund Advisers) was below the average and median for the category (net of any fee waivers and reimbursements).
Representatives of Dreyfus reviewed with the Board members the fees paid by the only mutual fund managed by Dreyfus or its affiliates included in the Lipper NewYork Intermediate Municipal Debt Funds category. The Board considered BNY Mellon Wealth Management’s general advisory fee schedule for accounts with similar investment objectives, policies and strategies as the fund.The Board analyzed the differences in fees paid to Dreyfus or its affiliates and discussed the relationship of the advisory fee to be paid in light of the services to be
The Fund 39
| INFORMATION ABOUT THE REVIEW AND APPROVAL OF THE FUND’S INVESTMENT ADVISORY AGREEMENT (Unaudited) (continued) |
provided to the fund.The Board members considered the relevance of the fee information provided to evaluate the appropriateness and reasonableness of the fund’s advisory fee.
Analysis of Profitability and Economies of Scale. As the fund had not yet commenced operations, Dreyfus’ representatives were not able to review the dollar amount of expenses allocated and profit received by Dreyfus and its affiliates. The Board members were presented with a schedule of the estimated profitability of the fund prepared by Dreyfus. The Board members also considered potential benefits to Dreyfus and its affiliates, including BNY Mellon Fund Advisers, from acting as investment adviser to the fund, and noted the unlikelihood of future soft dollar arrangements with respect to trading the fund’s portfolio. The Board also considered whether the fund would be able to participate in any economies of scale that Dreyfus may experience in the event that the fund attracts a large amount of assets.The Board members noted the uncertainty of the estimated as set levels, and discussed the renewal requirements for advisory agreements and their ability to review the advisory fees annually after an initial term of the Investment Advisory Agreement with respect to the fund.
At the conclusion of these discussions, the Board agreed that it had been furnished with sufficient information to make an informed business decision with respect to approving the Trust’s Investment Advisory Agreement with respect to the fund. Based on the discussions and considerations as described above, the Board made the following conclusions and determinations:
- The Board concluded that the nature, extent and quality of the services to be provided by Dreyfus to the fund are adequate and appropriate.
- The Board concluded that the fee to be paid by the fund to Dreyfus was reasonable in light of the services to be provided, comparative advisory fee information and benefits anticipated to be derived by Dreyfus and its affiliates, including BNY Mellon Fund Advisers, from its relationship with the fund.
40
- The Board determined that because the fund had not commenced operations, economies of scale were not a factor, and that, to the extent in the future it were to be determined that material economies of scale had not been shared with the fund, the Board would seek to have those economies of scale shared with the fund.
The Board members considered these conclusions and determinations, and, without any one factor being dispositive, the Board determined that approval of the Trust’s Investment Advisory Agreement and Administration Agreement with respect to the fund was in the best interests of the fund and its shareholders.
The Fund 41
42

The Fund 43
44

Once elected all Board Members serve for an indefinite term.The address of the Board Members and Officers is in c/o The Dreyfus Corporation, 200 Park Avenue, NewYork, NewYork 10166.Additional information about the Board Members is available in the fund’s Statement of Additional Information which can be obtained from Dreyfus free of charge by calling this toll free number: 1-800-645-6561. For Wealth Management clients, please contact your account officer or call 1-888-281-7350.
The Fund 45
OFFICERS OF THE TRUST (Unaudited)
CHRISTOPHER SHELDON, President since September 2006.
As director of Investment Strategy for BNY Mellon Wealth Management since April 2003, Mr. Sheldon manages the analysis and development of investment and asset allocation strategies and oversees investment product research. He also oversaw the alternative investment groups from June 2006 to September 2008. Prior to assuming his current position, Mr. Sheldon was West Coast managing director of Mellon’s Private Wealth Management group from 2001-2003. He was previously a Vice President of the Trust. He is 43 years old has been employed by BNY Mellon since January 1995.
MICHAEL A. ROSENBERG, Vice President and Secretary since August 2005.
Assistant General Counsel of BNY Mellon, and an officer of 77 investment companies (comprised of 201 portfolios) managed by the Manager. He is 48 years old and has been an employee of the Manager since October 1991.
JAMES BITETTO, Vice President and Assistant Secretary since August 2005.
Senior Counsel of BNY Mellon and Secretary of the Manager, and an officer of 77 investment companies (comprised of 201 portfolios) managed by the Manager. He is 42 years old and has been an employee of the Manager since December 1996.
JONI LACKS CHARATAN, Vice President and Assistant Secretary since August 2005.
Senior Counsel of BNY Mellon, and an officer of 77 investment companies (comprised of 201 portfolios) managed by the Manager. She is 53 years old and has been an employee of the Manager since October 1988.
JOSEPH M. CHIOFFI, Vice President and Assistant Secretary since August 2005.
Senior Counsel of BNY Mellon, and an officer of 77 investment companies (comprised of 201 portfolios) managed by the Manager. He is 47 years old and has been an employee of the Manager since June 2000.
JANETTE E. FARRAGHER, Vice President and Assistant Secretary since August 2005.
Assistant General Counsel of BNY Mellon, and an officer of 77 investment companies (comprised of 201 portfolios) managed by the Manager. She is 46 years old and has been an employee of the Manager since February 1984.
JOHN B. HAMMALIAN, Vice President and Assistant Secretary since August 2005.
Managing Counsel of BNY Mellon, and an officer of 77 investment companies (comprised of 201 portfolios) managed by the Manager. He is 45 years old and has been an employee of the Manager since February 1991.
ROBERT R. MULLERY, Vice President and Assistant Secretary since August 2005.
Managing Counsel of BNY Mellon, and an officer of 77 investment companies (comprised of 201 portfolios) managed by the Manager. He is 56 years old and has been an employee of the Manager since May 1986.
JEFF PRUSNOFSKY, Vice President and Assistant Secretary since August 2005.
Managing Counsel of BNY Mellon, and an officer of 77 investment companies (comprised of 201 portfolios) managed by the Manager. He is 43 years old and has been an employee of the Manager since October 1990.
46
JAMES WINDELS, Treasurer since November 2001.
Director – Mutual Fund Accounting of the Manager, and an officer of 77 investment companies (comprised of 201 portfolios) managed by the Manager. He is 49 years old and has been an employee of the Manager since April 1985.
RICHARD CASSARO, Assistant Treasurer since September 2007.
Senior Accounting Manager – Money Market and Municipal Bond Funds of the Manager, and an officer of 77 investment companies (comprised of 201 portfolios) managed by the Manager. He is 49 years old and has been an employee of the Manager since September 1982.
GAVIN C. REILLY, Assistant Treasurer since December 2005.
Tax Manager of the Investment Accounting and Support Department of the Manager, and an officer of 77 investment companies (comprised of 201 portfolios) managed by the Manager. He is 40 years old and has been an employee of the Manager since April 1991.
ROBERT ROBOL, Assistant Treasurer since December 2002.
Senior Accounting Manager – Fixed Income Funds of the Manager, and an officer of 77 investment companies (comprised of 201 portfolios) managed by the Manager. He is 44 years old and has been an employee of the Manager since October 1988.
ROBERT SALVIOLO, Assistant Treasurer since May 2007.
Senior Accounting Manager – Equity Funds of the Manager, and an officer of 77 investment companies (comprised of 201 portfolios) managed by the Manager. He is 41 years old and has been an employee of the Manager since June 1989.
ROBERT SVAGNA, Assistant Treasurer since December 2002.
Senior Accounting Manager - Equity Funds of the Manager, and an officer of 77 investment companies (comprised of 201 portfolios) managed by the Manager. He is 41 years old and has been an employee of the Manager since November 1990.
JOSEPH W. CONNOLLY, Chief Compliance Officer since October 2004.
Chief Compliance Officer of the Manager and The Dreyfus Family of Funds (77 investment companies, comprised of 201 portfolios). From November 2001 through March 2004, Mr. Connolly was first Vice-President, Mutual Fund Servicing for Mellon Global Securities Services. In that capacity, Mr. Connolly was responsible for managing Mellon’s Custody, Fund Accounting and Fund Administration services to third-party mutual fund clients. He is 51 years old and has served in various capacities with the Manager since 1980, including manager of the firm’s Fund Accounting Department from 1997 through October 2001.
WILLIAM GERMENIS, Anti-Money Laundering Compliance Officer since September 2002.
Vice President and Anti-Money Laundering Compliance Officer of the Distributor, and the Anti-Money Laundering Compliance Officer of 73 investment companies (comprised of 197 portfolios) managed by the Manager. He is 37 years old and has been an employee of the Distributor since October 1998.
The Fund 47
NOTES
For More Information

Telephone Wealth Management (WM) Clients, please contact your Account Officer or call 1-888-281-7350. Brokerage Clients of BNY Mellon Wealth Advisors (BNYMWA), please contact your financial representative or call 1-800-830-0549, Option 2. Individual Account holders, please call Dreyfus at 1-800-645-6561.
Mail WM Clients, write to your Account Officer, c/o The Bank of New York Mellon, One Mellon Bank Center, Pittsburgh, PA 15258. BNYMWA Brokerage Clients, write to your financial representative, P.O. Box 9012, Hicksville, NY 11802–9012. Individual Account Holders, write to: BNY Mellon Funds, P.O. Box 55268, Boston, MA 02205–8502.
The fund files its complete schedule of portfolio holdings with the Securities and Exchange Commission (“SEC”) for the first and third quarters of each fiscal year on Form N-Q. The fund’s Forms N-Q are available on the SEC’s website at http://www.sec.gov and may be reviewed and copied at the SEC’s Public Reference Room in Washington, DC. Information on the operation of the Public Reference Room may be obtained by calling 1-800-SEC-0330.
A description of the policies and procedures that the fund uses to determine how to vote proxies relating to portolio securities, and information regarding how the fund voted proxies relating to portfolio securities, is available on the SEC’s website at http://www.sec.gov and without charge, upon request, by calling 1-800-645-6561.
| © 2009 MBSC Securities Corporation |
| 6533AR1208 |
The BNY Mellon Funds
BNY Mellon International Appreciation Fund
| ANNUAL REPORT |
| December 31, 2008 |
The views expressed herein are current to the date of this report. These views and the composition of the fund’s portfolio are subject to change at any time based on market and other conditions.

| Contents | |
| THE FUND | |
| 2 | A Letter from the President |
| 3 | Discussion of Fund Performance |
| 6 | Fund Performance |
| 8 | Understanding Your Fund’s Expenses |
| 8 | Comparing Your Fund’s Expenses With Those of Other Funds |
| 9 | Statement of Investments |
| 19 | Statement of Assets and Liabilities |
| 20 | Statement of Operations |
| 21 | Statement of Changes in Net Assets |
| 23 | Financial Highlights |
| 25 | Notes to Financial Statements |
| 36 | Report of Independent Registered Public Accounting Firm |
| 37 | Important Tax Information |
| 38 | Information About the Review and Approval of the Fund’s Investment Advisory Agreement |
| 42 | Board Members Information |
| 46 | Officers of the Trust |
| FOR MORE INFORMATION | |
| Back Cover | |
The Fund
| BNY Mellon |
| International |
| Appreciation Fund |

A LETTER FROM THE PRESIDENT
Dear Shareholder:
We present to you this annual report for BNY Mellon International Appreciation Fund, covering the 12-month period from January 1, 2008, through December 31, 2008.
2008 was the most difficult year in decades for the world’s financial markets. A credit crunch that began in 2007 in the U.S. sub-prime mortgage market exploded in mid-2008 into a global financial crisis, resulting in the failures of major financial institutions, a deep and prolonged recession and lower investment values across a broad range of asset classes. Governments and regulators throughout the world moved aggressively to curtail the damage, implementing unprecedented reductions of short-term interest rates, massive injections of liquidity into the banking system, government bailouts of struggling companies and plans for massive economic stimulus programs. After several years of strong relative returns, international stocks generally declined more sharply than their U.S. counterparts.
Although we expect the U.S. and global economies to remain weak until longstanding imbalances have worked their way out of the system, the financial markets currently appear to have priced in investors’ generally low expectations. In previous recessions, however, the markets have tended to anticipate economic improvement before it occurs, potentially leading to major rallies when few expected them. That’s why it makes sense to remain disciplined, maintain a long-term perspective and adopt a consistent asset allocation strategy that reflects one’s future goals and attitudes toward risk.As always, we urge you to consult with your portfolio manager, who can recommend the course of action that is right for you. For information about how the fund performed during the reporting period, as well as market perspectives, we have provided a Discussion of Fund Performance.
Thank you for your continued confidence and support.
Sincerely,

| Christopher E. Sheldon President BNY Mellon Funds Trust January 15, 2009 |
2

DISCUSSION OF FUND PERFORMANCE
For the period of January 1, 2008, through December 31, 2008, as provided by Denise Krisko and Lloyd Buchanan, Portfolio Managers
Fund and Market Performance Overview
For the 12-month period ended December 31, 2008, BNY Mellon International Appreciation Fund’s Class M shares achieved a total return of –41.12% and Investor shares returned –41.21% .1 In comparison, the Morgan Stanley Capital International Europe, Australasia and Far East Index (the “MSCI EAFE Index”), the fund’s benchmark, achieved a total return of –43.38% .2
The fund’s slight outperformance relative to the benchmark in part reflects differences between the pricing of the direct shares of the companies in the MSCI EAFE Index, and the pricing of the Depositary Receipts (DR) in which this company invests. It also reflects the decision to only hold ADRs in the fund, as they outperformed the non-ADRs.
The Fund’s Investment Approach
The fund seeks long-term capital appreciation.To pursue its goal, the fund normally invests at least 80% of its assets in equity securities, including Depositary Receipts (DRs), common stocks, preferred stocks, convertible securities, equity securities in foreign investment funds or trusts, and other equity investments.
The fund invests primarily in DRs representing the local shares of non-U.S. companies, in particular,American Depositary Receipts (ADRs). In selecting securities, we screen the MSCI EAFE Index universe of approximately 1,000 issuers for the availability of issuers with a DR facility. The investment adviser then uses a proprietary mathematical algorithm to reflect the characteristics of the developed markets that takes into consideration risk characteristics, including country weights, sector weights, and sector weights within each country. As a result of this process, we expect to hold ADRs representing 200 to 300 foreign issuers.The fund’s country allocation is expected to be within 5% of that of the MSCI EAFE Index, and under normal circumstances, the fund will invest in at least 10 different countries.The fund will generally not invest in securities from developing countries because they are not included in the MSCI EAFE Index.
The Fund 3
| DISCUSSION OF FUND PERFORMANCE (continued) |
A Complex Economic Backdrop
A global credit crunch that hampered international equity performance for much of 2008 culminated in an international financial meltdown in September that reverberated through the remainder of the year. Investors concerned about volatility in the equity markets and the uncertain economic outlook fled global equity securities, a trend that encompassed all sectors and all market capitalizations.
The negative market developments persisted despite concerted efforts throughout the world’s economies, including a coordinated move by the world’s central banks to cut their short-term rate targets by half a percentage point in early October. Throughout the rest of the year, further rate cuts and other stimulus efforts in the U.S. and around the world at times gave some hope that the global recession’s severity could be eased. Unfortunately, such optimism was usually quickly undone by the continued flow of negative economic news.
A Look at the Portfolio
The portfolio holds only American Depositary Receipts (ADRs), which are securities that represent shares of foreign companies but are traded on U.S. exchanges.The companies that offer ADRs tend to be larger, higher-quality companies, so the portfolio itself tends to have somewhat of a bias toward more liquid, higher-quality names.This was an advantage in the past year.
The fund’s strongest performer for the year wasVolkswagen AG, though this holding’s performance was driven not so much by any intrinsic developments at that company, but by speculative interests that first drove up the share price,and then caused it to recede somewhat late in the year.
In a difficult year for global markets, Japan showed some surprising strength late in the year, though it was weak for the year overall. Another of the fund’s strongest performers,Yamazaki Baking Co. Ltd., may have benefited from some of the country’s resurgence.Yamazaki is one of Japan’s largest baking companies, and it has a broadly diversified product lineup serving both the retail and food service sectors. It may also have benefited from some modernization of its facilities. In all, a number of our top performers for the period were from Japan.
Given the global financial crisis, it’s not surprising that a number of the greatest detractors from the fund’s performance came from the financial
4
sector, which was also the weakest sector in 2008 for both the fund and the MSCI EAFE Index.Among the disappointing performers in financials were Italy’s Intesa Sanpaolo S.p.A., the U.K.’s HSBC Holdings PLC and Barclays PLC, Spain’s Banco Santander S.A., and France’s BNP Paribas S.A.That so many established financial institutions from some of the world’s leading economies were so hard-hit during the year speaks to how broadly and deeply the economic troubles ran.
Looking Ahead
The fund seeks to match the risk and return characteristics of the MSCI EAFE Index (including country weightings and sector allocations) as closely as possible while incorporating only securities represented by an ADR or the equivalent. We do not vary our approach for changing market conditions. That said, we are, of course, carefully monitoring global markets, and are looking for signs that the market has hit a bottom, which cannot be predicted with certainty.
Once we reach the point where the equity markets can begin to recover, we believe that investors are likely to remain somewhat cautious for some time to come. In that scenario, we believe that larger, more liquid companies — such as those represented by the ADRs in our portfolio — may be in a position to benefit.
We are encouraged by the significant, coordinated global efforts to shore up the financial markets and stimulate economic activity, though we recognize that it will take more time for those efforts to percolate through the system. Although the recovery may ultimately take longer than investors would like, we believe that over the longer term, portfolio exposure to international markets has the potential to be beneficial for investors.
January 15, 2009
| 1 | Total return includes reinvestment of dividends and any capital gains paid. Past performance is no | |
| guarantee of future results. Share price and investment return fluctuate such that upon redemption, | ||
| fund shares may be worth more or less than their original cost. Return figures provided reflect the | ||
| absorption of certain fund expenses by BNY Mellon Fund Advisors pursuant to an agreement in | ||
| effect through September 30, 2010, at which time it may be extended, terminated or modified. | ||
| Had these expenses not been absorbed, the fund’s returns would have been lower. | ||
| 2 | SOURCE: LIPPER INC. — Reflects reinvestment of net dividends and, where applicable, | |
| capital gain distributions.The Morgan Stanley Capital International Europe, Australasia, Far | ||
| East (MSCI EAFE) Index is an unmanaged index composed of a sample of companies | ||
| representative of the market structure of European and Pacific Basin countries.The Index does not | ||
| take into account fees and expenses to which the fund is subject. |
The Fund 5
| FUND PERFORMANCE |
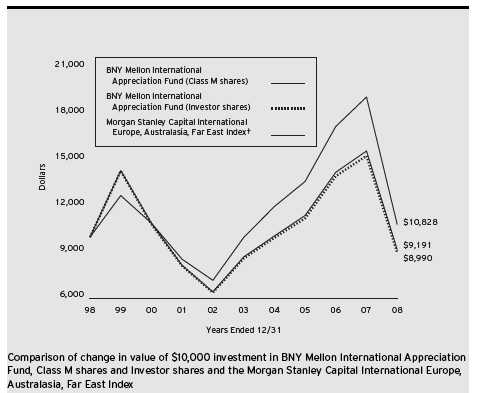
| Average Annual Total Returns as of 12/31/08 | ||||||
| 1 Year | 5 Years | 10 Years | ||||
| Class M shares | (41.12)% | 1.11% | (0.84)% | |||
| Investor shares | (41.21)% | 0.87% | (1.06)% |
| † Source: Lipper Inc. |
| Past performance is not predictive of future performance.The fund’s performance shown in the graph and table does not |
| reflect the deduction of taxes that a shareholder would pay on fund distributions or the redemption of fund shares. |
| The above graph compares a $10,000 investment made in Class M shares and Investor shares of BNY Mellon |
| International Appreciation Fund on 12/31/98 to a $10,000 investment made in the Morgan Stanley Capital |
| International Europe, Australasia, Far East Index (the “Index”) on that date. All dividends and capital gain |
| distributions are reinvested. |
6
As of the close of business on September 12, 2008, substantially all of the assets of another investment company advised by an affiliate of the fund’s investment adviser, BNY Hamilton International Equity Fund (the “predecessor fund”), a series of BNY Hamilton Funds, Inc., were transferred to BNY Mellon International Appreciation Fund in a tax-free reorganization and the fund commenced operations.The performance figures for the fund’s Class M shares represent the performance of the predecessor fund’s Institutional shares prior to the commencement of operations for BNY Mellon International Appreciation Fund and the performance of BNY Mellon International Appreciation Fund’s Class M shares thereafter.The performance figures for Investor shares represent the performance of the predecessor fund’s Class A shares prior to the commencement of operations for BNY Mellon International Appreciation Fund and the performance of BNY Mellon International Appreciation Fund’s Investor shares thereafter. Investor shares are subject to a Shareholder Services Plan. Performance for Investor shares will vary from the performance of Class M shares shown because of the differences in charges and expenses.
The fund’s performance shown in the line graph takes into account all applicable fees and expenses for all shares classes. The Index is an unmanaged, market-capitalization weighted index that is designed to measure the performance of publicly-traded stocks issued by companies in developed markets, excluding the United States and Canada. Unlike a mutual fund, the Index is not subject to charges, fees and other expenses. Investors cannot invest directly in any index. Further information relating to fund performance, including expense reimbursements, if applicable, is contained in the Financial Highlights section of the prospectus and elsewhere in this report.
The Fund 7
UNDERSTANDING YOUR FUND’S EXPENSES (Unaudited)
As a mutual fund investor, you pay ongoing expenses, such as management fees and other expenses. Using the information below, you can estimate how these expenses affect your investment and compare them with the expenses of other funds.You also may pay one-time transaction expenses, including sales charges (loads) and redemption fees, which are not shown in this section and would have resulted in higher total expenses. For more information, see your fund’s prospectus or talk to your financial adviser.
Review your fund’s expenses
The table below shows the expenses you would have paid on a $1,000 investment in BNY Mellon International Appreciation Fund from July 1, 2008 to December 31, 2008. It also shows how much a $1,000 investment would be worth at the close of the period, assuming actual returns and expenses.
| Expenses and Value of a $1,000 Investment assuming actual returns for the six months ended December 31, 2008 |
| Class M Shares | Investor Shares | |||
| Expenses paid per $1,000† | $ 2.72 | $ 3.72 | ||
| Ending value (after expenses) | $662.80 | $662.30 |
| COMPARING YOUR FUND’S EXPENSES WITH THOSE OF OTHER FUNDS (Unaudited) |
Using the SEC’s method to compare expenses
The Securities and Exchange Commission (SEC) has established guidelines to help investors assess fund expenses. Per these guidelines, the table below shows your fund’s expenses based on a $1,000 investment, assuming a hypothetical 5% annualized return. You can use this information to compare the ongoing expenses (but not transaction expenses or total cost) of investing in the fund with those of other funds.All mutual fund shareholder reports will provide this information to help you make this comparison. Please note that you cannot use this information to estimate your actual ending account balance and expenses paid during the period.
| Expenses and Value of a $1,000 Investment assuming a hypothetical 5% annualized return for the six months ended December 31, 2008 |
| Class M Shares | Investor Shares | |||
| Expenses paid per $1,000† | $ 3.30 | $ 4.52 | ||
| Ending value (after expenses) | $1,021.87 | $1,020.66 |
| † Expenses are equal to the fund’s annualized expense ratio of .65% for Class M Shares and .89% for Investor Shares, |
| multiplied by the average account value over the period, multiplied by 184/366 (to reflect the one-half year period). |
8
| STATEMENT OF INVESTMENTS December 31, 2008 |
| Common Stocks—101.2% | Shares | Value ($) | ||
| Consumer Discretionary—9.2% | ||||
| Adidas, ADR | 15,800 | 305,730 | ||
| Bridgestone, ADR | 22,000 | 664,400 | ||
| British Sky Broadcasting Group, ADR | 15,075 | 428,130 | ||
| Bulgari, ADR | 13,775 a | 338,343 | ||
| Casio Computer, ADR | 5,900 | 363,828 | ||
| Compass Group, ADR | 65,400 | 332,232 | ||
| Dailmer | 40,800 | 1,561,824 | ||
| Denso, ADR | 6,750 | 450,495 | ||
| Electrolux, ADR | 31,100 | 541,140 | ||
| Fiat, ADR | 48,300 | 317,331 | ||
| Honda Motor, ADR | 71,000 | 1,515,140 | ||
| Husqvarna, ADR | 37,650 | 393,262 | ||
| Intercontinental Hotels Group, ADR | 38,270 | 320,320 | ||
| Kingfisher, ADR | 111,626 | 436,458 | ||
| Ladbrokes, ADR | 83,611 | 227,422 | ||
| Loxottica Group, ADR | 18,500 | 335,220 | ||
| LVMH Moet Hennessy Louis Vuitton, ADR | 39,500 | 524,580 | ||
| Marks & Spencer Group, ADR | 45,750 | 294,172 | ||
| Marui Group, ADR | 32,500 | 372,450 | ||
| Mediaset, ADR | 32,800 | 559,240 | ||
| Nissan Motor, ADR | 64,500 | 469,560 | ||
| Panasonic Electric Works | 6,000 | 516,000 | ||
| Panasonic, ADR | 82,000 | 1,020,080 | ||
| Pearson, ADR | 40,800 | 389,232 | ||
| Peugeot, ADR | 17,400 | 300,150 | ||
| Publicis Groupe, ADR | 24,500 | 630,630 | ||
| Reed Elsevier, ADR | 12,443 | 371,299 | ||
| Sega Sammy Holdings, ADR | 160,000 | 462,400 | ||
| Sharp, ADR | 63,000 | 446,040 | ||
| Sodexo, ADR | 29,100 | 1,616,505 | ||
| Sony, ADR | 42,400 | 927,288 | ||
| TABCORP Holdings, ADR | 10,340 | 503,912 | ||
| Television Broadcasts, ADR | 68,000 | 435,880 | ||
| Thomson Reuters, ADR | 1,472 | 199,912 | ||
| Toyota Motor, ADR | 51,650 | 3,379,976 | ||
| Valeo, ADR | 50,000 | 375,000 |
The Fund 9
| STATEMENT OF INVESTMENTS (continued) |
| Common Stocks (continued) | Shares | Value ($) | ||
| Consumer Discretionary (continued) | ||||
| Volkswagen, ADR | 24,500 | 1,752,975 | ||
| Wolters Kluwer, ADR | 21,800 | 416,380 | ||
| WPP, ADR | 9,640 | 285,248 | ||
| Zon Multimedia Servicos de | ||||
| Telecomunicacoes e Multimedia, ADR | 5,535 a | 28,545 | ||
| 24,808,729 | ||||
| Consumer Staples—11.5% | ||||
| Aeon, ADR | 54,000 | 537,300 | ||
| Ajinomoto, ADR | 8,100 | 867,634 | ||
| British American Tobacco, ADR | 31,800 | 1,683,492 | ||
| Cadbury, ADR | 12,543 | 447,409 | ||
| Coca Cola Hellenic Bottling, ADR | 18,850 | 272,571 | ||
| Coca-Cola Amatil, ADR | 69,750 | 888,615 | ||
| Delhaize Group, ADR | 20,500 | 1,290,270 | ||
| Diageo, ADR | 23,720 | 1,345,873 | ||
| Foster’s Group, ADR | 170,100 | 680,400 | ||
| Groupe Danone, ADR | 112,500 | 1,359,000 | ||
| Heineken, ADR | 21,050 | 323,117 | ||
| Henkel & Co., ADR | 21,900 | 704,085 | ||
| Hitachi, ADR | 14,300 | 559,702 | ||
| Imperial Tobacco Group, ADR | 17,600 | 952,160 | ||
| J. Sainsbury, ADR | 15,475 | 298,822 | ||
| Kao, ADR | 3,700 | 1,124,430 | ||
| Kirin Holdings, ADR | 61,000 | 802,150 | ||
| Koninklijke Ahold, ADR | 49,680 | 611,064 | ||
| L’Oreal, ADR | 118,500 | 2,079,675 | ||
| Nestle, ADR | 143,760 | 5,707,272 | ||
| Sabmiller, ADR | 37,700 | 639,769 | ||
| Shiseido, ADR | 33,000 | 681,450 | ||
| Tate & Lyle, ADR | 18,150 | 423,984 | ||
| Tesco, ADR | 94,268 | 1,494,148 | ||
| Toyo Suisan Kaisha, ADR | 4,600 | 1,309,211 | ||
| Unilever (NY Shares) | 58,300 | 1,431,265 | ||
| Unilever, ADR | 45,020 | 1,036,360 | ||
| Yamazaki Baking, ADR | 10,500 | 1,597,298 | ||
| 31,148,526 |
10
| Common Stocks (continued) | Shares | Value ($) | ||
| Energy—8.7% | ||||
| BG Group, ADR | 25,620 | 1,822,863 | ||
| BP, ADR | 109,846 | 5,134,202 | ||
| ENI, ADR | 53,192 | 2,543,641 | ||
| Repsol YPF, ADR | 44,100 | 948,591 | ||
| Royal Dutch Shell, ADR | 48,788 | 2,509,167 | ||
| Royal Dutch Shell, Cl. A, ADR | 63,977 | 3,386,942 | ||
| Santos, ADR | 17,100 | 756,675 | ||
| StatoilHydro, ADR | 60,005 | 999,683 | ||
| Technip, ADR | 11,800 | 368,868 | ||
| Total, ADR | 79,124 | 4,375,557 | ||
| Woodside Petroleum, ADR | 28,805 | 754,691 | ||
| 23,600,880 | ||||
| Financial—23.0% | ||||
| Aegon (NY Shares) | 59,800 | 361,790 | ||
| Allianz, ADR | 209,000 | 2,263,470 | ||
| Allied Irish Banks, ADR | 20,050 | 94,034 | ||
| Alpha Bank, ADR | 121,900 | 255,990 | ||
| Australian & New Zealand | ||||
| Banking Group, ADR | 101,400 | 1,084,980 | ||
| AXA, ADR | 81,500 | 1,831,305 | ||
| Banco Bilbao Vizcaya Argentaria, ADR | 170,400 | 2,128,296 | ||
| Banco Santander, ADR | 324,400 | 3,078,556 | ||
| Bank of Yokohama, ADR | 10,300 | 607,700 | ||
| Barclays, ADR | 98,550 | 965,790 | ||
| BNP Paribas, ADR | 70,000 | 1,501,500 | ||
| British Land, ADR | 57,600 | 456,307 | ||
| Capitaland, ADR | 108,500 | 461,125 | ||
| Cheung Kong Holdings, ADR | 76,000 | 718,960 | ||
| City Developments, ADR | 106,000 | 471,700 | ||
| Commerzbank, ADR | 43,300 | 420,443 | ||
| Commonwealth Bank of Australia, ADR | 23,800 a | 1,438,643 | ||
| Credit Suisse Group, ADR | 50,900 | 1,438,434 | ||
| Daiwa House Industry, ADR | 5,300 | 517,810 | ||
| Daiwa Securities Group, ADR | 9,900 | 581,724 | ||
| Danske Bank, ADR | 61,600 | 317,240 | ||
| Deutsche Bank | 26,023 | 1,058,876 |
The Fund 11
| STATEMENT OF INVESTMENTS (continued) |
| Common Stocks (continued) | Shares | Value ($) | ||
| Financial (continued) | ||||
| DNB NOR, ADR | 4,400 a | 169,664 | ||
| Erste Group Bank, ADR | 20,000 | 227,000 | ||
| Fortis, ADR | 150,300 | 174,348 | ||
| Friends of Provident, ADR | 46,860 | 581,064 | ||
| Governor & Co of the Bank of Ireland, ADR | 17,250 | 82,282 | ||
| Hang Seng Bank, ADR | 40,400 | 535,704 | ||
| HBOS, ADR | 219,393 | 225,975 | ||
| HSBC Holdings, ADR | 87,340 | 4,250,838 | ||
| Hypo Real Estate Holdings, ADR | 33,300 | 134,865 | ||
| Hysan Development, ADR | 145,000 | 468,480 | ||
| ING Groep, ADR | 70,700 | 784,770 | ||
| Intesa Sanpaolo, ADR | 198,298 | 4,277,288 | ||
| Legal & General Group, ADR | 96,400 | 568,760 | ||
| Lend Lease, ADR | 205,200 | 995,220 | ||
| Lloyds TSB Group, ADR | 73,525 | 566,143 | ||
| Mitsubishi Estate, ADR | 6,200 | 1,004,400 | ||
| Mitsubishi Financial Group, ADR | 390,868 | 2,427,290 | ||
| Mitsui Sumitoto Insurance | ||||
| Group Holdings, ADR | 46,400 | 721,520 | ||
| Mizuho Financial Group, ADR | 500,000 | 2,885,000 | ||
| National Australia Bank, ADR | 117,600 | 1,728,720 | ||
| National Bank of Greece, ADR | 138,320 | 526,999 | ||
| Nomura Holdings, ADR | 98,000 | 818,300 | ||
| ORIX, ADR | 12,000 | 341,040 | ||
| Promise, ADR | 64,000 | 817,280 | ||
| Prudential, ADR | 59,900 | 757,735 | ||
| Shinsei Bank, ADR | 113,000 | 355,950 | ||
| Shizuoka Bank, ADR | 6,400 | 729,600 | ||
| Sino Land, ADR | 46,000 | 235,060 | ||
| Social Generale, ADR | 119,445 | 1,242,228 | ||
| Sumitomo Mitsui Financial Group, ADR | 315,000 | 1,269,450 | ||
| Sumitomo Trust & Banking, ADR | 121,000 | 716,320 | ||
| Sun Hung Kai Properties, ADR | 81,000 | 686,880 | ||
| Suruga Bank, ADR | 7,100 | 687,678 | ||
| Swire Pacific, ADR | 76,000 | 513,760 |
12
| Common Stocks (continued) | Shares | Value ($) | ||
| Financial (continued) | ||||
| Swiss Reinsurance, ADR | 16,914 | 808,489 | ||
| Tokio Marine Holdings, ADR | 37,514 | 1,090,157 | ||
| Tokyu Land, ADR | 12,700 | 469,332 | ||
| UBS | 126,514 b | 1,809,150 | ||
| United Overseas Bank, ADR | 34,000 | 612,000 | ||
| Westpac Banking, ADR | 23,520 | 1,417,080 | ||
| Zurich Financial Services, ADR | 63,700 | 1,391,845 | ||
| 62,160,337 | ||||
| Health Care—9.8% | ||||
| AstraZeneca, ADR | 55,269 | 2,267,687 | ||
| Bayer, ADR | 32,600 | 1,936,440 | ||
| Cie Generale d’Opitique Essilor | ||||
| International, ADR | 34,000 | 799,340 | ||
| Eisai, ADR | 39,000 | 1,628,250 | ||
| Elan, ADR | 25,400 b | 152,400 | ||
| Fresenius Medical Care, ADR | 13,600 | 641,648 | ||
| GlaxoSmithKline, ADR | 97,951 | 3,650,634 | ||
| Novartis, ADR | 91,260 | 4,541,098 | ||
| Novo Nordisk, ADR | 28,800 | 1,480,032 | ||
| Novozymes, ADR | 1,400 | 112,210 | ||
| Olympus, ADR | 73,000 | 1,423,500 | ||
| Roche Holding, ADR | 58,180 | 4,453,679 | ||
| Sanofi-Aventis, ADR | 89,600 | 2,881,536 | ||
| Smith & Nephew, ADR | 12,300 | 397,290 | ||
| 26,365,744 | ||||
| Industrial—11.8% | ||||
| ABB, ADR | 100,310 | 1,505,653 | ||
| Air France, ADR | 43,600 | 574,212 | ||
| All Nippon Airways, ADR | 160,000 | 1,249,648 | ||
| Amada, ADR | 24,500 | 464,865 | ||
| Asahi Glass, ADR | 83,000 | 448,200 | ||
| Atlas Copco, Cl. A, ADR | 69,200 | 605,500 | ||
| Atlas Copco, Cl. B, ADR | 77,500 | 608,375 | ||
| Bae Systems, ADR | 33,825 | 754,636 | ||
| British Airways, ADR | 16,520 | 430,676 |
The Fund 13
| STATEMENT OF INVESTMENTS (continued) |
| Common Stocks (continued) | Shares | Value ($) | ||
| Industrial (continued) | ||||
| Dai Nippon Printing, ADR | 53,000 | 583,000 | ||
| Deutsche Lufthansa, ADR | 42,700 | 681,065 | ||
| European Aeronautic Defence | ||||
| and Space, ADR | 37,400 | 626,450 | ||
| Experian, ADR | 83,670 | 531,305 | ||
| Hutchison Whampoa, ADR | 18,200 | 458,822 | ||
| Invensys, ADR | 144,010 b | 362,905 | ||
| ITOCHU, ADR | 11,200 | 564,928 | ||
| Japan Airlines, ADR | 160,200 b | 1,873,267 | ||
| Kajima, ADR | 18,000 | 615,555 | ||
| Kawasaki Heavy Industries, ADR | 54,000 | 426,519 | ||
| Keppel, ADR | 69,000 | 424,350 | ||
| Komatsu, ADR | 13,250 | 676,413 | ||
| Koninklijke Philips Electronics (NY Shares) | 46,000 | 914,020 | ||
| Kubota, ADR | 16,600 | 598,762 | ||
| Marubeni, ADR | 6,700 | 256,945 | ||
| Metso, ADR | 24,300 | 296,217 | ||
| Mitsubishi Electric, ADR | 12,400 | 756,400 | ||
| Mitsubishi, ADR | 35,000 | 983,500 | ||
| Mitsui & Co., ADR | 3,500 | 717,535 | ||
| MTR, ADR | 14,000 | 323,540 | ||
| Neptune Orient Lines, ADR | 83,750 | 255,438 | ||
| Nippon Yusen Kabus, ADR | 95,500 | 1,184,200 | ||
| NSK, ADR | 9,400 | 355,696 | ||
| Orkla, ADR | 38,100 | 247,303 | ||
| Rolls-Royce Group, ADR | 15,740 | 388,778 | ||
| Ryanair Holdings, ADR | 11,600 b | 337,328 | ||
| Sandvik, ADR | 76,900 | 495,236 | ||
| Secom, ADR | 6,500 | 663,975 | ||
| Siemens, ADR | 35,342 | 2,677,156 | ||
| SKF, ADR | 71,100 | 715,977 | ||
| Sumitomo Electric Industries, ADR | 6,800 | 511,594 | ||
| Sumitomo, ADR | 62,000 | 530,100 | ||
| Taisei, ADR | 24,400 | 656,767 |
14
| Common Stocks (continued) | Shares | Value ($) | ||
| Industrial (continued) | ||||
| TNT, ADR | 25,700 | 497,295 | ||
| Tomkins, ADR | 40,425 | 295,507 | ||
| Toppan Printing, ADR | 14,800 | 540,200 | ||
| Toto, ADR | 4,600 | 282,440 | ||
| Verbund-Oesterreichische | ||||
| Elektrizitaetswirtschafts, ADR | 65,500 | 592,906 | ||
| Vestas Wind Systems, ADR | 22,200 b | 429,570 | ||
| Volvo, ADR | 114,700 | 649,202 | ||
| Weinerberger, ADR | 52,500 | 173,686 | ||
| Wolseley, ADR | 42,100 | 234,918 | ||
| 32,028,535 | ||||
| Information Technology—5.1% | ||||
| Advantest, ADR | 18,500 | 301,180 | ||
| Alcatel-Lucent, ADR | 110,400 b | 237,360 | ||
| Alps Electric, ADR | 43,500 | 428,475 | ||
| Canon, ADR | 41,500 | 1,303,100 | ||
| Computershare, ADR | 82,600 | 437,780 | ||
| Dassault Systemes, ADR | 9,400 | 425,820 | ||
| Fujifilm Holdings, ADR | 29,000 | 644,380 | ||
| Fujitsu, ADR | 20,600 | 491,722 | ||
| Kyocera, ADR | 10,200 | 738,174 | ||
| NEC, ADR | 110,000 | 360,397 | ||
| Nidec, ADR | 43,600 | 427,716 | ||
| Nintendo, ADR | 31,200 | 1,489,800 | ||
| Nokia, ADR | 146,000 | 2,277,600 | ||
| Omron, ADR | 34,000 | 445,400 | ||
| Ricoh, ADR | 9,400 | 583,740 | ||
| Sage Group, ADR | 18,825 | 193,897 | ||
| SAP, ADR | 34,180 | 1,238,000 | ||
| TDK, ADR | 11,000 | 409,640 | ||
| Telefonaktiebolaget LM Ericsson, ADR | 109,200 | 852,852 | ||
| Trend Micro, ADR | 17,000 | 595,000 | ||
| 13,882,033 |
The Fund 15
| STATEMENT OF INVESTMENTS (continued) |
| Common Stocks (continued) | Shares | Value ($) | ||
| Materials—8.0% | ||||
| Air Liquide, ADR | 47,414 | 872,418 | ||
| Akzo Nobel, ADR | 7,900 | 329,588 | ||
| Alumina, ADR | 48,575 | 207,901 | ||
| Amcor, ADR | 31,750 | 525,462 | ||
| Anglo American, ADR | 92,316 | 1,072,712 | ||
| ArcelorMittal | 33,224 | 816,978 | ||
| Asahi Kasei, ADR | 11,400 | 506,160 | ||
| BASF, ADR | 35,100 | 1,379,781 | ||
| BHP Billiton, ADR | 98,849 | 4,074,950 | ||
| Boral, ADR | 37,450 | 482,513 | ||
| CRH, ADR | 19,300 | 502,379 | ||
| Intalcementi, ADR | 28,500 | 355,954 | ||
| James Hardie Industries, ADR | 33,700 | 550,658 | ||
| Johnson Matthey, ADR | 6,650 | 210,273 | ||
| Kobe Steel, ADR | 51,600 | 456,660 | ||
| Koninklijke DSM, ADR | 16,000 | 103,200 | ||
| Lafarge, ADR | 14,824 | 228,586 | ||
| Newcrest Mining, ADR | 18,047 | 433,128 | ||
| Nippon Steel, ADR | 27,300 | 909,090 | ||
| Nisshin Steel, ADR | 12,350 | 495,907 | ||
| Nitto Denko, ADR | 2,000 | 370,400 | ||
| Norsk Hydro, ADR | 43,500 | 177,480 | ||
| Oji Paper, ADR | 8,400 | 486,487 | ||
| Rexam, ADR | 11,220 | 292,730 | ||
| Rio Tinto, ADR | 9,525 | 846,868 | ||
| Solvay, ADR | 6,400 | 499,200 | ||
| Stora Enso, ADR | 55,600 | 435,348 | ||
| Sumitomo Metal Industries, ADR | 22,400 | 543,424 | ||
| Svenska Cellulosa, ADR | 62,700 | 547,998 | ||
| Syngenta, ADR | 24,250 | 949,145 | ||
| Taiheiyo Cement, ADR | 24,800 | 465,084 | ||
| Teijin, ADR | 16,100 | 445,165 |
16
| Common Stocks (continued) | Shares | Value ($) | ||
| Materials (continued) | ||||
| Toray Industries, ADR | 11,600 | 586,960 | ||
| UPM-Kymmene, ADR | 43,400 | 557,256 | ||
| 21,717,843 | ||||
| Telecommunications—7.2% | ||||
| BT Group, ADR | 27,910 | 557,642 | ||
| Deutsche Telekom, ADR | 107,500 | 1,644,750 | ||
| France Telecom, ADR | 65,200 | 1,830,164 | ||
| Hellenic Telecommunications | ||||
| Organization, ADR | 36,600 | 304,146 | ||
| Koninklijke KPN, ADR | 67,800 | 998,694 | ||
| Nippon Telegraph & Telephone, ADR | 57,400 | 1,560,706 | ||
| NTT Docomo, ADR | 71,800 | 1,408,716 | ||
| Portugal Telecom | 26,300 | 225,654 | ||
| Singapore Telecommunications, ADR | 32,935 | 587,890 | ||
| Swisscom, ADR | 10,000 | 323,300 | ||
| Telecom Corp New Zealand, ADR | 33,973 | 227,619 | ||
| Telecom Italia, ADR | 96,069 | 1,339,140 | ||
| Telefonica, ADR | 53,675 | 3,617,158 | ||
| Telenor, ADR | 12,400 | 254,200 | ||
| Telstra, ADR | 49,100 | 670,215 | ||
| Vodafone Group, ADR | 190,273 | 3,889,180 | ||
| 19,439,174 | ||||
| Utilities—6.9% | ||||
| Centrica, ADR | 60,345 | 917,244 | ||
| CLP Holdings, ADR | 114,000 | 777,480 | ||
| E.ON, ADR | 87,927 | 3,583,025 | ||
| Energias de Portugal, ADR | 19,220 | 734,204 | ||
| GDF Suez, ADR | 68,249 | 3,351,259 | ||
| Hong Kong & China Gas, ADR | 283,800 | 431,376 | ||
| Iberdrola, ADR | 64,150 | 2,309,400 | ||
| International Power, ADR | 11,920 | 420,180 | ||
| National Grid, ADR | 27,928 | 1,409,247 |
The Fund 17
| STATEMENT OF INVESTMENTS (continued) |
| Common Stocks (continued) | Shares | Value ($) | ||
| Utilities (continued) | ||||
| RWE, ADR | 24,200 | 2,205,830 | ||
| Scottish & Southern Energy, ADR | 53,700 | 971,970 | ||
| United Utilities Group, ADR | 29,865 | 555,489 | ||
| Veolia Enviroment, ADR | 28,500 | 903,735 | ||
| 18,570,439 | ||||
| Total Investments (cost $373,000,726) | 101.2% | 273,722,240 | ||
| Liabilities, Less Cash and Receivables | (1.2%) | (3,149,975) | ||
| Net Assets | 100.0% | 270,572,265 | ||
| ADR—American Depository Receipts |
| a Securities exempt from registration under Rule 144A of the Securities Act of 1933.These securities may be resold in |
| transactions exempt from registration, normally to qualified institutional buyers. At December 31, 2008, these |
| securities amounted to $1,975,195 or 0.7% of net assets. |
| b Non-income producing security. |
| Portfolio Summary (Unaudited)† | ||||||
| Value (%) | Value (%) | |||||
| Financial | 23.0 | Materials | 8.0 | |||
| Industrial | 11.8 | Telecommunications | 7.2 | |||
| Consumer Staples | 11.5 | Utilities | 6.9 | |||
| Health Care | 9.8 | Information Technology | 5.1 | |||
| Consumer Discretionary | 9.2 | |||||
| Energy | 8.7 | 101.2 | ||||
| † Based on net assets. | ||||||
| See notes to financial statements. | ||||||
18
| STATEMENT OF ASSETS AND LIABILITIES December 31, 2008 |
| Cost | Value | |||
| Assets ($): | ||||
| Investments in securities—See Statement of Investments | 373,000,726 | 273,722,240 | ||
| Cash | 39,650 | |||
| Receivable for investment securities sold | 2,913,698 | |||
| Receivable for shares of Beneficial Interest subscribed | 694,016 | |||
| Dividends and interest receivable | 494,060 | |||
| Prepaid expenses | 525,065 | |||
| 278,388,729 | ||||
| Liabilities ($): | ||||
| Due to The Dreyfus Corporation and affiliates—Note 3(c) | 121,224 | |||
| Due to Administrator—Note 3(a) | 30,012 | |||
| Bank loan payable—Note 2 | 3,800,000 | |||
| Payable for shares of Beneficial Interest redeemed | 3,770,340 | |||
| Interest payable—Note 2 | 3,851 | |||
| Accrued expenses | 91,037 | |||
| 7,816,464 | ||||
| Net Assets ($) | 270,572,265 | |||
| Composition of Net Assets ($): | ||||
| Paid-in capital | 407,440,417 | |||
| Accumulated undistributed investment income—net | 319,586 | |||
| Accumulated net realized gain (loss) on investments | (37,909,252) | |||
| Accumulated net unrealized appreciation | ||||
| (depreciation) on investments | (99,278,486) | |||
| Net Assets ($) | 270,572,265 |
| Net Asset Value Per Share | ||||
| Class M Shares | Class I Shares | |||
| Net Assets ($) | 267,393,182 | 3,179,083 | ||
| Shares Outstanding | 28,459,236 | 341,559 | ||
| Net Asset Value Per Share ($) | 9.40 | 9.31 | ||
| See notes to financial statements. | ||||
The Fund 19
| STATEMENT OF OPERATIONS Year Ended December 31, 2008 |
| Investment Income ($): | ||
| Income: | ||
| Cash dividends (net of $2,132,464 foreign taxes withheld at source): | ||
| Unaffiliated issuers | 16,708,901 | |
| Affiliated issuers | 14,281 | |
| Income from securities lending | 744,309 | |
| Total Income | 17,467,491 | |
| Expenses: | ||
| Investment advisory fee—Note 3(a) | 2,191,507 | |
| Administration fee—Note 3(a) | 466,293 | |
| Shareholders servicing cost—Note 3(c) | 111,472 | |
| Custodian fees—Note 3(b) | 69,040 | |
| Prospectus and shareholders’ reports | 35,202 | |
| Professional fees | 33,842 | |
| Registration fees | 31,593 | |
| Trustees’ fees and expenses—Note 3(d) | 15,387 | |
| Distribution fees—Note 3(b) | 8,519 | |
| Interest expense—Note 2 | 3,851 | |
| Miscellaneous | 120,792 | |
| Total Expenses | 3,087,498 | |
| Less—reduction in investment advisory | ||
| fees due to undertaking—Note 3(a) | (136,009) | |
| Less—reduction in fees due to earnings credits—Note 1(c) | (719) | |
| Net Expenses | 2,950,770 | |
| Investment Income—Net | 14,516,721 | |
| Realized and Unrealized Gain (Loss) on Investments—Note 4 ($): | ||
| Net realized gain (loss) on investments | 4,306,492 | |
| Net unrealized appreciation (depreciation) on investments | (239,798,814) | |
| Net Realized and Unrealized Gain (Loss) on Investments | (235,492,322) | |
| Net (Decrease) in Net Assets Resulting from Operations | (220,975,601) | |
| See notes to financial statements. | ||
20
STATEMENT OF CHANGES IN NET ASSETS
| Year Ended December 31, | ||||
| 2008a | 2007a | |||
| Operations ($): | ||||
| Investment income—net | 14,516,721 | 13,096,461 | ||
| Net realized gain (loss) on investments | 4,306,492 | 26,632,323 | ||
| Net unrealized appreciation | ||||
| (depreciation) on investments | (239,798,814) | 8,151,462 | ||
| Net Increase (Decrease) in Net Assets | ||||
| Resulting from Operations | (220,975,601) | 47,880,246 | ||
| Dividends to Shareholders from ($): | ||||
| Investment income—net: | ||||
| Class M Shares | (14,464,661) | (12,711,910) | ||
| Investor Shares | (129,203) | (116,978) | ||
| Total Dividends | (14,593,864) | (12,828,888) | ||
| Beneficial Interest Transactions ($): | ||||
| Net proceeds from shares sold: | ||||
| Class M Shares | 433,260,379 | 96,494,246 | ||
| Investor Shares | 296,509 | 68,584 | ||
| Dividends reinvested: | ||||
| Class M Shares | 1,972,462 | 1,872,498 | ||
| Investor Shares | 126,953 | 115,643 | ||
| Cost of shares redeemed: | ||||
| Class M Shares | (480,007,312) | (43,956,150) | ||
| Investor Shares | (521,761) | (313,523) | ||
| Increase (Decrease) in Net Assets from | ||||
| Beneficial Interest Transactions | (44,872,770) | 54,281,298 | ||
| Total Increase (Decrease) in Net Assets | (280,442,235) | 89,332,656 | ||
| Net Assets ($): | ||||
| Beginning of Period | 551,014,500 | 461,681,844 | ||
| End of Period | 270,572,265 | 551,014,500 | ||
| Undistributed investment income—net | 319,586 | 396,729 | ||
The Fund 21
STATEMENT OF CHANGES IN NET ASSETS (continued)
| Year Ended December 31, | ||||
| 2008a | 2007a | |||
| Capital Share Transactions: | ||||
| Class M | ||||
| Shares sold | 31,399,895 | 5,899,901 | ||
| Shares issued for dividends reinvested | 165,654 | 114,386 | ||
| Shares redeemed | (36,005,253) | (2,640,766) | ||
| Net Increase (Decrease) in Shares Outstanding | (4,439,704) | 3,373,521 | ||
| Investor Shares | ||||
| Shares sold | 25,050 | 4,271 | ||
| Shares issued for dividends reinvested | 10,623 | 7,157 | ||
| Shares redeemed | (37,585) | (19,466) | ||
| Net Increase (Decrease) in Shares Outstanding | (1,912) | (8,038) | ||
| a Represents information from the fund’s predecessor, BNY Hamilton International Equity Fund, through |
| September 12, 2008. |
| See notes to financial statements. |
22
FINANCIAL HIGHLIGHTS
Please not that the financial highlights information in the following tables for the fund’s Class M and Investor shares represents the financial highlights of the Institutional shares and Class A shares, respectively, of the fund’s predecessor, BNY Hamilton International Equity Fund (the “International Equity Fund”), before the fund commenced operations as of the close of business on September 12, 2008, and represents the performance of the fund’s Class M and Investor shares thereafter. Before the fund commenced operations, substantially all of the assets of the International Equity Fund were transferred to the fund in a tax-free reorganization.Total return shows how much your investment in the fund would have increased (or decreased) during each period, assuming you had reinvested all dividends and distributions.These figures have been derived from the fund’s and the fund’s predecessor’s financial sta tements.
| Year Ended December 31, | ||||||||||
| Class M Shares† | 2008 | 2007 | 2006 | 2005 | 2004 | |||||
| Per Share Data ($): | ||||||||||
| Net asset value, beginning of period | 16.58 | 15.46 | 12.62 | 11.32 | 9.89 | |||||
| Investment Operations: | ||||||||||
| Investment income—neta | .45 | .41 | .30 | .20 | .14 | |||||
| Net realized and unrealized | ||||||||||
| gain (loss) on investments | (7.17) | 1.10 | 2.81 | 1.29 | 1.42 | |||||
| Total from Investment Operations | (6.72) | 1.51 | 3.11 | 1.49 | 1.56 | |||||
| Distributions: | ||||||||||
| Dividends from investment income—net | (.46) | (.39) | (.27) | (.19) | (.13) | |||||
| Net asset value, end of period | 9.40 | 16.58 | 15.46 | 12.62 | 11.32 | |||||
| Total Return (%) | (41.12) | 9.79 | 24.68 | 13.14 | 15.85 | |||||
| Ratios/Supplemental Data (%): | ||||||||||
| Ratio of total expenses | ||||||||||
| to average net assets | .70 | .69 | .68 | .84 | 1.08 | |||||
| Ratio of net expenses | ||||||||||
| to average net assets | .67 | .69 | .68 | .84 | 1.08 | |||||
| Ratio of net investment income | ||||||||||
| to average net assets | 3.32 | 2.45 | 2.14 | 1.71 | 1.37 | |||||
| Portfolio Turnover Rate | 10.62 | 11 | 15 | 11 | 31 | |||||
| Net Assets, end of period ($ x 1,000) | 267,393 | 545,392 | 456,316 | 308,769 | 219,404 | |||||
| † Represents information from Institutional shares of the fund’s predecessor, BNY Hamilton International Equity |
| Fund, through September 12, 2008. |
| a Based on average shares outstanding at each month end. See notes to financial statements. |
The Fund 23
| FINANCIAL HIGHLIGHTS (continued) |
| Year Ended December 31, | ||||||||||
| Investor Shares† | 2008 | 2007 | 2006 | 2005 | 2004 | |||||
| Per Share Data ($): | ||||||||||
| Net asset value, beginning of period | 16.37 | 15.27 | 12.47 | 11.19 | 9.77 | |||||
| Investment Operations: | ||||||||||
| Investment income—neta | .40 | .36 | .27 | .17 | .13 | |||||
| Net realized and unrealized | ||||||||||
| gain (loss) on investments | (7.06) | 1.09 | 2.77 | 1.26 | 1.39 | |||||
| Total from Investment Operations | (6.66) | 1.45 | 3.04 | 1.43 | 1.52 | |||||
| Distributions: | ||||||||||
| Dividends from investment income—net | (.40) | (.35) | (.24) | (.15) | (.10) | |||||
| Net asset value, end of period | 9.31 | 16.37 | 15.27 | 12.47 | 11.19 | |||||
| Total Return (%) | (41.21) | 9.50 | 24.38 | 12.81 | 15.61 | |||||
| Ratios/Supplemental Data (%): | ||||||||||
| Ratio of total expenses | ||||||||||
| to average net assets | .95 | .94 | .93 | 1.10 | 1.35 | |||||
| Ratio of net expenses | ||||||||||
| to average net assets | .92 | .94 | .93 | 1.10 | 1.35 | |||||
| Ratio of net investment income | ||||||||||
| to average net assets | 3.02 | 2.20 | 1.92 | 1.49 | 1.25 | |||||
| Portfolio Turnover Rate | 10.62 | 11 | 15 | 11 | 31 | |||||
| Net Assets, end of period ($ x 1,000) | 3,179 | 5,623 | 5,366 | 4,431 | 4,384 | |||||
| † Represents information from Class A shares of the fund’s predecessor, BNY Hamilton International Equity Fund, |
| through September 12, 2008. |
a Based on average shares outstanding at each month end. See notes to financial statements.
24
NOTES TO FINANCIAL STATEMENTS
NOTE 1—Significant Accounting Policies:
BNY Mellon FundsTrust (the “Trust”) was organized as a Massachusetts business trust which is registered under the Investment Company Act of 1940, as amended (the “Act”), as a diversified open-end management investment company and operates as a series company currently comprised of twenty-one series, including the BNY Mellon International Appreciation Fund (the “fund”).The fund’s investment objective seeks to provide long-term capital appreciation. BNY Mellon Fund Advisers, a division of The Dreyfus Corporation (the “Manager” or “Dreyfus”), a wholly-owned subsidiary of The Bank of New York Mellon Corporation (“BNY Mellon”), serves as the fund’s investment adviser (“Investment Adviser”).The Bank of NewYork Mellon, a subsidiary of BNY Mellon and an affiliate of Dreyfus, serves as administrator for the fund pursuant to an Administration Agreement with the Trust (the “Administration Agreement”). The Bank of New York Mellon has entered into a Sub-Administration Agreement with Dreyfus pursuant to which The Bank of NewYork Mellon pays Dreyfus for performing certain administrative services.
At a meeting held on September 9, 2008, the Trust’s Board of Trustees approved the change of the fund’s fiscal year end from December 31st to August 31st.
As of the close of business on September 12, 2008, pursuant to an Agreement and Plan of Reorganization previously approved by the Trust’s Board of Trustees, all of the assets, subject to the liabilities, of BNY Hamilton International Equity Fund, a series of BNY Hamilton Funds, Inc., were transferred to the fund in exchange for the corresponding class of shares of Beneficial Interest of the fund of equal value. Shareholders of Institutional and Class A shares of the International Equity Fund received Class M and Investor shares of the fund, respectively, in each case in an equal amount to the aggregate net asset value of their investment in the International Equity Fund at the time of the exchange. The net asset value of the fund’s shares on the close of business on September 12, 2008, after the reorganization, was
The Fund 25
| NOTES TO FINANCIAL STATEMENTS (continued) |
$12.63 for Class M Shares and $12.48 for Investor Shares, and a total of 32,104,036 Class M shares and 330,263 Investor shares, representing net assets of $409,748,221 (including $5,303,215 net unrealized appreciation on investments) were issued to the International Equity Fund shareholders in the exchange.The exchange was a tax-free event to shareholders of the fund. International Equity Fund is the accounting survivor and its historical performance is presented for periods prior to September 12, 2008.
MBSC Securities Corporation (the “Distributor”), a wholly owned subsidiary of Dreyfus, is the distributor of the fund’s shares, which are sold without a sales charge.The Trust is authorized to issue an unlimited number of shares of Beneficial Interest, par value $.001 per share, in each of the Investor class shares and Class M shares of the fund. Each class of shares has similar rights and privileges, except with respect to the expenses borne by and the shareholder services offered to each class and the shareholder services plan applicable to the Investor shares and certain voting rights. Income, expenses (other than expenses attributable to a specific class), and realized and unrealized gains or losses on investments are allocated daily for each class of shares based upon relative proportion of net assets of each class.
The Trust accounts separately for the assets, liabilities and operations of each series. Expenses directly attributable to each series are charged to that series’ operations; expenses that are applicable to all series are allocated among them on a pro rata basis.
The fund’s financial statements are prepared in accordance with U.S. generally accepted accounting principles, which may require the use of management estimates and assumptions. Actual results could differ from those estimates.
(a) Portfolio valuation: Investments in securities are valued at the last sales price on the securities exchange or national securities market on which such securities are primarily traded. Securities listed on the National Market System for which market quotations are available are
26
valued at the official closing price or, if there is no official closing price that day, at the last sales price. Securities not listed on an exchange or the national securities market, or securities for which there were no transactions, are valued at the average of the most recent bid and asked prices, except for open short positions, where the asked price is used for valuation purposes. Bid price is used when no asked price is available. Registered investment companies that are not traded on an exchange are valued at their net asset value.When market quotations or official closing prices are not readily available, or are determined not to reflect accurately fair value, such as when the value of a security has been significantly affected by events after the close of the exchange or market on which the security is principally traded (for example, a foreign exchange or market), but before the fund calculates its net asset value, the fund may value these investments at fair value as determined in accordance with the procedures approved by the Board of Trustees. Fair valuing of securities may be determined with the assistance of a pricing service using calculations based on indices of domestic securities and other appropriate indicators, such as prices of relevant ADRs and futures contracts. For other securities that are fair valued by the Board of Trustees, certain factors may be considered such as: fundamental analytical data, the nature and duration of restrictions on disposition, an evaluation of the forces that influence the market in which the securities are purchased and sold and public trading in similar securities of the issuer or comparable issuers. Financial futures are valued at the last sales price. Investments denominated in foreign currencies are translated to U.S. dollars at the prevailing rates of exchange. Forward currency exchange contracts are valued at the forward rate.
The fund adopted Statement of Financial Accounting Standards No. 157 “FairValue Measurements” (“FAS 157”). FAS 157 establishes an authoritative definition of fair value, sets out a framework for measuring fair value, and requires additional disclosures about fair value measurements.
The Fund 27
| NOTES TO FINANCIAL STATEMENTS (continued) |
Various inputs are used in determining the value of the fund’s investments relating to FAS 157.These inputs are summarized in the three broad levels listed below.
| Level 1—quoted prices in active markets for identical securities. Level 2—other significant observable inputs (including quoted prices for similar securities, interest rates, prepayment speeds, credit risk, etc.). Level 3—significant unobservable inputs (including the fund’s own assumptions in determining the fair value of investments). |
The inputs or methodology used for valuing securities are not necessarily an indication of the risk associated with investing in those securities.
The following is a summary of the inputs used as of December 31, 2008 in valuing the fund’s investments carried at fair value:
| Investments in | Other Financial | |||
| Valuation Inputs | Securities ($) | Instruments ($)† | ||
| Level 1—Quoted Prices | 129,823,284 | 0 | ||
| Level 2—Other Significant | ||||
| Observable Inputs | 143,898,956 | 0 | ||
| Level 3—Significant | ||||
| Unobservable Inputs | 0 | 0 | ||
| Total | 273,722,240 | 0 |
| † Other financial instruments include derivative instruments such as futures, forward currency exchange |
| contracts, options written and swap contracts, which are valued at the unrealized appreciation |
| (depreciation) on the instrument and written options contracts which are shown at value. |
(b) Foreign currency transactions: The fund does not isolate that portion of the results of operations resulting from changes in foreign exchange rates on investments from the fluctuations arising from changes in market prices of securities held. Such fluctuations are included with the net realized and unrealized gains or losses on investments.
Net realized foreign exchange gains or losses arise from sales and maturities of short-term securities, sales of foreign currencies, currency gains or losses realized on securities transactions and the difference between the amounts of dividends, interest and foreign withholding taxes recorded on the fund’s books and the U.S. dollar equivalent of the
28
amounts actually received or paid. Net unrealized foreign exchange gains or losses arise from changes in the value of assets and liabilities other than investments in securities, resulting from changes in exchange rates. Such gains and losses are included with net realized and unrealized gains or losses on investments.
(c) Securities transactions and investment income: Securities transactions are recorded on a trade date basis. Realized gains and losses from securities transactions are recorded on the identified cost basis. Dividend income is recorded on the ex-dividend date and interest income, including where applicable, accretion of discount and amortization of premium on investments is recognized on the accrual basis.
The fund has arrangements with the custodian and cash management banks whereby the fund may receive earnings credits when positive cash balances are maintained, which are used to offset custody and cash management fees. For financial reporting purposes, the fund includes net earnings credits as an expense offset in the Statement of Operations.
Pursuant to a securities lending agreement with The Bank of New York Mellon, the fund may lend securities to certain qualified institutions. It is the fund’s policy that, at origination, all loans are secured by collateral of at least 102% of the value of U.S. securities loaned and 105% of the value of foreign securities loaned. Collateral equivalent to at least 100% of the market value of securities on loan is maintained at all times. Collateral is either in the form of cash, which can be invested in certain money market mutual funds managed by Dreyfus, U.S. Government and Agency securities or letters of credit.The funds are entitled to receive all income on securities loaned, in addition to income earned as a result of the lending transaction. Although each security loaned is fully collateralized, the fund bear the risk of delay in recovery of, or loss of rights in, the securities loaned should a borrower fail to return the securities in a timely manner. During the period ended December 31, 2008, The Bank of New York Mellon earned $318,990 from lending fund portfolio securities, pursuant to the securities lending agreement.
The Fund 29
| NOTES TO FINANCIAL STATEMENTS (continued) |
(d) Affiliated issuers: Investments in other investment companies advised by Dreyfus are defined as “affiliated” in the Act.
(e) Dividends to shareholders: Dividends payable to shareholders are recorded by the fund on the ex-dividend date.The fund declares and pays dividends from investment income-net annually.With respect to each series, dividends from net realized capital gains, if any, are normally declared and paid annually, but the fund may make distributions on a more frequent basis to comply with the distribution requirements of the Internal Revenue Code of 1986, as amended (the “Code”).To the extent that net realized capital gains can be offset by capital loss carryovers of that fund, it is the policy of the fund not to distribute such gains. Income and capital gain distributions are determined in accordance with income tax regulations, which may differ from generally accepted accounting principles.
(f) Federal income taxes: It is the policy of each fund to continue to qualify as a regulated investment company, if such qualification is in the best interests of its shareholders, by complying with the applicable provisions of the Code, and to make distributions of taxable income sufficient to relieve it from substantially all federal income and excise taxes. For federal income tax purposes, each series is treated as a single entity for the purpose of determining such qualification.
As of and during the period ended December 31, 2008, the fund did not have any liabilities for any unrecognized tax positions. The fund recognizes interest and penalties, if any, related to unrecognized tax positions as income tax expense in the Statement of Operations. During the period, the fund did not incur any interest or penalties.
Each of the tax years in the four-year period ended December 31, 2008, remains subject to examination by the Internal Revenue Service and state taxing authorities.
At December 31, 2008, the components of accumulated earnings on a tax basis were as follows: undistributed ordinary income $319,586, accumulated capital losses $31,707,825 and unrealized depreciation
30
$100,600,966. In addition, the fund had $4,878,947 of capital losses realized after October 31, 2008, which were deferred for tax purposes to the first day of the following fiscal year.
The accumulated capital loss carryover is available for federal income tax purposes to be applied against future net securities profits, if any, realized subsequent to December 31, 2008. If not applied, $21,219,717 of the carryover expires in fiscal 2010 and $10,488,108 expires in fiscal 2011.
The tax character of distributions paid to shareholders during the fiscal periods ended December 31, 2008 and December 31, 2007 were as follows: ordinary income $14,593,864 and $12,828,888, respectively.
NOTE 2—Bank Lines of Credit:
Effective October 15, 2008, the fund participates with other Dreyfus-managed funds in a $145 million primary credit facility led by Citibank N.A. (the “Facility”) to be utilized for temporary or emergency purposes, including the financing of redemptions. In connection therewith, the fund has agreed to pay its pro rata portion of Facility fees for the Facility. Interest is charged to the fund based on rates determined pursuant to the terms of the Facility at the time of the borrowing.
The average daily amount of borrowings outstanding under the Facility during the period ended December 31, 2008 was approximately $246,100 with a related weighted average annualized interest rate of 1.56% .
NOTE 3—Investment Advisory Fee, Administration Fee and Other Transactions With Affiliates:
(a) Pursuant to an Investment Advisory Agreement (“Agreement”) with the Investment Adviser, effective September 13, 2008, the investment advisory fee is computed at the annual rate of .50% of the value of the fund’s average daily net assets and is payable monthly. Prior to September 13, 2008, The Bank of New York Mellon (the “Advisor”) was the advisor for the International Equity Fund.The Advisor’s fee was
The Fund 31
| NOTES TO FINANCIAL STATEMENTS (continued) |
computed at an annual rate of .50% of the value of the International Equity Fund’s average daily net assets and was payable monthly. During the period ended December 31, 2008, the Advisor and Manager earned $1,736,142 and $455,335, respectively.
Effective September 13, 2008, the Investment Advisor had contractually agreed to waive receipt of its fees and/or assume the expenses of the fund, until September 30, 2010, so that annual fund operating expenses (excluding shareholder services fees, taxes, interest, brokerage commissions, commitment fees on borrowings, and extraordinary expenses) do not exceed .67% of the value of the fund’s average daily net assets.The reduction in investment advisory fee, pursuant to the undertaking, amount to $136,009 during the period ended December 31, 2008.
Pursuant to the Administration Agreement, The Bank of New York Mellon provides or arranges for fund accounting, transfer agency and other fund administration services and receives a fee based on the total net assets of the Trust based on the following rates:
| 0 up to $6 billion | .15% | |
| $6 billion up to $12 billion | .12% | |
| In excess of $12 billion | .10% |
The Administration fees amounted to $119,059 for the period September 13, 2008 through December 31, 2008.
The Bank of New York Mellon served as Administrator to International Equity Fund pursuant to an Administration Agreement. The Administrator received from International Equity Fund a monthly fee equal to an annual rate of .10% of the average daily net asset of International Equity Fund.The administration fees amounted to $347,234 for the period ended September 12, 2008.This agreement was terminated as of the close of business on September 12, 2008, due to the reorganization.
The Bank of NewYork Mellon has entered into a Sub-Administration Agreement with Dreyfus pursuant to which The Bank of New York Mellon pays Dreyfus for performing certain administrative services.
32
(b) Under a prior Distribution Plan adopted pursuant to Rule 12b-1, the International Equity Fund’s Class A shares paid BNY Hamilton Distributors, Inc. for distribution and/or shareholder servicing expenses in an amount up to .25% of the average annual daily net assets of the Class A shares. During the period January 1, 2008 through September 12, 2008, Class A shares were charged $8,519.This agreement was terminated as of the close of business on September 12, 2008, due to the reorganization.
(c) The fund has adopted a Shareholder Services Plan with respect to its Investor shares pursuant to which each fund pays the Distributor for the provision of certain services to holders of Investor shares a fee at an annual rate of .25% of the value of the average daily net assets attributable to Investor shares.The services provided may include personal services relating to shareholder accounts, such as answering shareholder inquiries regarding a fund, and providing reports and other information, and services related to the maintenance of such shareholder accounts.The Shareholder Services Plan allows the Distributor to make payments from the shareholder services fees it collects from each fund to compensate service agents (certain banks, securities brokers or dealers and other financial institutions) in respect of these services. During the period ended December 3 1, 2008, Investor shares were charged $2,416, pursuant to the Shareholder Services Plan. Additional fees included in shareholder servicing costs in the Statement of Operations include fees paid to the transfer agent.
The fund compensates The Bank of New York Mellon under a cash management agreement for performing cash management services related to fund subscriptions and redemptions. During the period ended December 31, 2008, the fund was charged $719 pursuant to the cash management agreement.
The fund compensates The Bank of New York Mellon under a custody agreement for providing custodial services for the fund. During the period ended December 31, 2008, the fund was charged $69,040 pursuant to the custody agreement.
The Fund 33
| NOTES TO FINANCIAL STATEMENTS (continued) |
During the period ended December 31, 2008, the fund was charged $1,197 for services performed by the Chief Compliance Officer.
The components of “Due to The Dreyfus Corporation and affiliates” in the Statement of Assets and Liabilities consist of: investment advisory fees $113,545, shareholders service fees $629, custodian fees $23,570 and chief compliance officer fees $1,197, which are offset against an expense reimbursement currently in effect in the amount of $17,717.
(d) Effective June 1, 2008, each trustee who is not an “affiliated person” as defined in the Act receives from the Trust an annual fee of $68,000 and an attendance fee of $7,500 for each in-person meeting attended and $500 for telephone meetings and is reimbursed for travel and out-of-pocket expenses. The Chairman of the Trust’s Board receives an additional annual fee of $15,000 and the Chairman of the Trust’s Audit Committee receives an additional annual fee of $10,000. Prior to June 1, 2008, the Trust paid its Board members an annual fee of $48,000 and an attendance fee of $5,000 for each in-person meeting attended and $500 for telephone meetings and reimbursed them for travel and out-of-pocket expenses, and the Chairmen of the Trust’s Board and Audit Committee received additional annual fees of $10,000 and $8,000, respectively.
NOTE 4—Securities Transactions:
The aggregate amount of purchases and sales of investment securities excluding short-term securities, during the period ended December 31, 2008, amounted to $46,743,697 and $87,390,534, respectively.
At December 31, 2008, the cost of investments for federal income tax purposes was $374,323,206; accordingly, accumulated net unrealized depreciation on investments was $100,600,966, consisting of $19,568,406 gross unrealized appreciation and $120,169,372, gross unrealized depreciation.
34
In March 2008, the Financial Accounting Standards Board released Statement of Financial Accounting Standards No. 161 “Disclosures about Derivative Instruments and Hedging Activities” (“FAS 161”). FAS 161 requires qualitative disclosures about objectives and strategies for using derivatives, quantitative disclosures about fair value amounts of gains and losses on derivative instruments and disclosures about credit-risk-related contingent features in derivative agreements. The application of FAS 161 is required for fiscal years and interim periods beginning after November 15, 2008.At this time, management is evaluating the implications of FAS 161 and its impact on the financial statements and the accompanying notes has not yet been determined.
The Fund 35
REPORT OF INDEPENDENT REGISTERED PUBLIC ACCOUNTING FIRM
| The Board of Trustees and Shareholders BNY Mellon Funds Trust |
We have audited the accompanying statement of assets and liabilities, including the statement of investments, of BNY Mellon International Appreciation Fund, a series of BNY Mellon Funds Trust (the “Trust”) (formerly, BNY Hamilton International Equity Fund, a series of BNY Hamilton Funds, Inc.), as of December 31, 2008, and the related statement of operations, the statement of changes in net assets and the financial highlights for the year then ended. The financial statements and financial highlights are the responsibility of the Fund’s management.Our responsibility is to express an opinion on these financial statements and financial highlights based on our audit.The statement of changes in net assets for the year ended December 31, 2007 and the financial highlights for each of the years in the four-year period ended December 31, 2007 were audited by other independent registered public accountants whose report thereon dated Feb ruary 28, 2008, expressed an unqualified opinion on that financial statement and those financial highlights.
We conducted our audit in accordance with the standards of the Public Company Accounting Oversight Board (United States).Those standards require that we plan and perform the audit to obtain reasonable assurance about whether the financial statements and financial highlights are free of material misstatement. An audit includes examining, on a test basis, evidence supporting the amounts and disclosures in the financial statements. Our procedures included confirmation of securities owned as of December 31, 2008, by correspondence with the custodian and brokers. An audit also includes assessing the accounting principles used and significant estimates made by management, as well as evaluating the overall financial statement presentation.We believe that our audit provides a reasonable basis for our opinion.
In our opinion, the financial statements and financial highlights referred to above present fairly, in all material respects, the financial position of BNY Mellon International Appreciation Fund as of December 31, 2008, and the results of its operations, the changes in its net assets and the financial highlights for the year then ended, in conformity with U.S. generally accepted accounting principles.

| New York, New York February 25, 2009 |
36
IMPORTANT TAX INFORMATION (Unaudited)
In accordance with federal tax law, the fund elects to provide each shareholder with their portion of the fund’s foreign taxes paid and the income sourced from foreign countries. Accordingly, the fund hereby makes the following designations regarding its fiscal year ended December 31, 2008:
—the total amount of taxes paid to foreign countries was $1,832,894
—the total amount of income sourced from foreign countries was $13,886,280.
As required by federal tax law rules, shareholders will receive notification of their proportionate share of foreign taxes paid and foreign sourced income for the calendar year 2008 with Form 1099-DIV.
For the fiscal year ended December 31, 2008, certain dividends paid by the fund may be subject to a maximum tax rate of 15%, as provided for by the Jobs and Growth Tax Relief Reconciliation Act of 2003. Of the distributions paid during the fiscal year, $14,593,864 represents the maximum amount that may be considered qualified dividend income.
The Fund 37
| INFORMATION ABOUT THE REVIEW AND APPROVAL OF THE FUND’S INVESTMENT ADVISORY AGREEMENT (Unaudited) |
At a meeting of the Board of Trustees held on March 10-11, 2008, the Board considered the approval of the Trust’s Investment Advisory Agreement with respect to the fund through its renewal date of June 1, 2009, pursuant to which BNY Mellon Fund Advisers, a division of Dreyfus, will provide the fund with investment advisory services. The Board members also considered the approval of the Trust’s Administration Agreement with The Bank of New York Mellon (“BNY Mellon”) for a one year term, pursuant to which BNY Mellon will provide the fund with administrative services. BNY Mellon has entered into a Sub-Administration Agreement with Dreyfus pursuant to which BNY Mellon pays Dreyfus for performing certain of these administrative services. The Board members who are not “interested persons” (as defined in the Act) of the Trust were assisted in their review by independent legal counsel and met with counsel in executive s ession separate from representatives of Dreyfus.
Analysis of Nature, Extent and Quality of Services to be Provided to the Fund. The Board members received a presentation from representatives of Dreyfus regarding services provided to the other funds comprising the Trust, and discussed the nature, extent and quality of the services to be provided to the fund pursuant to the Investment Advisory Agreement. The Board members also referenced information provided and discussed at the meeting regarding the funds’ distribution of accounts, the diversity of distribution of those funds and Dreyfus’ corresponding need for broad, deep and diverse resources to be able to provide ongoing shareholder services to each of the funds’ distribution channels.
The Board members also considered Dreyfus’ research and portfolio management capabilities and that Dreyfus also provides oversight of day-to-day fund operations, including fund accounting and administration and assistance in meeting legal and regulatory requirements, and Dreyfus’ extensive administrative, accounting and compliance infrastructure.
Comparative Analysis of the Fund’s Advisory Fee and Expense Ratio. As the fund had not yet commenced operations, the Board members were not able to review the fund’s performance. The Board was
38
advised, however, that the fund was being established pursuant a proposed reorganization of BNY Hamilton International Equity Fund, a series of BNY Hamilton Funds, Inc. (the “BNY Fund”), and will inherit the BNY Fund’s performance record upon the closing of the reorganization. The Board members received a presentation from Dreyfus that described, among other matters, the BNY Fund’s average annual total returns for the 1-, 3-, 5- and 10-year periods ended December 31, 2007. The Board discussed with representatives of Dreyfus the fund’s investment objective and policies and portfolio management team, and noted that the current team responsible for managing the BNY Fund will continue to manage the fund.
The Board members reviewed comparisons of the fund’s proposed advisory fee to those of funds in the Lipper International Large-Cap Core Funds category. The fund’s contractual advisory fee was below the average and median advisory or adviser/administration fees of the funds in the category (both with and without any fee waivers and reimbursements). The fund’s total expense ratio (as limited through September 30, 2010 by agreement with BNY Mellon Fund Advisers) was below the average and median for the category (net of any fee waivers and reimbursements).
Representatives of Dreyfus reviewed with the Board members the fees paid to Dreyfus or its affiliates by mutual funds managed by Dreyfus or its affiliates included in the Lipper International Large-Cap Core Funds category (the “Similar Funds”), and by other accounts managed or sub-advised by Dreyfus or its affiliates with similar investment objectives, policies and strategies as the fund (the “Similar Accounts”). Dreyfus’ representatives explained the nature of the Similar Accounts and the differences, from Dreyfus’ perspective, in management of the Similar Accounts as compared to managing and providing services to the fund. Dreyfus’ representatives also reviewed the costs associated with distribution through intermediaries. The Board analyzed the differences in fees paid to Dreyfus and discussed the relationship of the advisory fee to be paid in light of the services to be provided to the fund.The Board
The Fund 39
| INFORMATION ABOUT THE REVIEW AND APPROVAL OF THE FUND’S INVESTMENT ADVISORY AGREEMENT (Unaudited) (continued) |
members considered the relevance of the fee information provided for the Similar Funds and Similar Accounts to evaluate the appropriateness and reasonableness of the fund’s advisory fees.
Analysis of Profitability and Economies of Scale. As the fund had not yet commenced operations, Dreyfus’ representatives were not able to review the dollar amount of expenses allocated and profit received by Dreyfus and its affiliates. The Board members were presented with a schedule of the estimated profitability of the fund prepared by Dreyfus. The Board members also considered potential benefits to Dreyfus and its affiliates, including BNY Mellon Fund Advisers, from acting as investment adviser to the fund, and noted the unlikelihood of future soft dollar arrangements with respect to trading the fund’s portfolio. The Board also considered whether the fund would be able to participate in any economies of scale that Dreyfus may experience in the event that the fund attracts a large amount of assets.The Board members noted the uncertainty of the estimated as set levels, and discussed the renewal requirements for advisory agreements and their ability to review the advisory fees annually after an initial term of the Investment Advisory Agreement with respect to the fund.
At the conclusion of these discussions, the Board agreed that it had been furnished with sufficient information to make an informed business decision with respect to approving the Trust’s Investment Advisory Agreement with respect to the fund. Based on the discussions and considerations as described above, the Board made the following conclusions and determinations:
- The Board concluded that the nature, extent and quality of the services to be provided by Dreyfus to the fund are adequate and appropriate.
- The Board concluded that the fee to be paid by the fund to Dreyfus was reasonable in light of the services to be provided, comparative advisory fee information and benefits anticipated to be derived by Dreyfus and its affiliates, including BNY Mellon Fund Advisers, from its relationship with the fund.
40
- The Board determined that because the fund had not commenced operations, economies of scale were not a factor, and that, to the extent in the future it were to be determined that material economies of scale had not been shared with the fund, the Board would seek to have those economies of scale shared with the fund.
The Board members considered these conclusions and determinations, and, without any one factor being dispositive, the Board determined that approval of the Trust’s Investment Advisory Agreement and Administration Agreement with respect to the fund was in the best interests of the fund and its shareholders.
The Fund 41

42
The Fund 43
44
Once elected all Board Members serve for an indefinite term.The address of the Board Members and Officers is in c/o The Dreyfus Corporation, 200 Park Avenue, NewYork, NewYork 10166. Additional information about the Board Members is available in the fund’s Statement of Additional Information which can be obtained from Dreyfus free of charge by calling this toll free number: 1-800-645-6561. For Wealth Management clients, please contact your account officer or call 1-888-281-7350.
The Fund 45
OFFICERS OF THE TRUST (Unaudited)
CHRISTOPHER SHELDON, President since September 2006.
As director of Investment Strategy for BNY Mellon Wealth Management since April 2003, Mr. Sheldon manages the analysis and development of investment and asset allocation strategies and oversees investment product research. He also oversaw the alternative investment groups from June 2006 to September 2008. Prior to assuming his current position, Mr. Sheldon was West Coast managing director of Mellon’s Private Wealth Management group from 2001-2003 and its regional manager from 1998-2001. He was previously a Vice President of the Trust.
He is 43 years old has been employed by BNY Mellon since January 1995.
MICHAEL A. ROSENBERG, Vice President and Secretary since August 2005.
Assistant General Counsel of BNY Mellon, and an officer of 77 investment companies (comprised of 201 portfolios) managed by the Manager. He is 48 years old and has been an employee of the Manager since October 1991.
JAMES BITETTO, Vice President and Assistant Secretary since August 2005.
Senior Counsel of BNY Mellon and Secretary of the Manager, and an officer of 77 investment companies (comprised of 201 portfolios) managed by the Manager. He is 42 years old and has been an employee of the Manager since December 1996.
JONI LACKS CHARATAN, Vice President and Assistant Secretary since August 2005.
Senior Counsel of BNY Mellon, and an officer of 77 investment companies (comprised of 201 portfolios) managed by the Manager. She is 53 years old and has been an employee of the Manager since October 1988.
JOSEPH M. CHIOFFI, Vice President and Assistant Secretary since August 2005.
Senior Counsel of BNY Mellon, and an officer of 77 investment companies (comprised of 201 portfolios) managed by the Manager. He is 47 years old and has been an employee of the Manager since June 2000.
JANETTE E. FARRAGHER, Vice President and Assistant Secretary since August 2005.
Assistant General Counsel of BNY Mellon, and an officer of 77 investment companies (comprised of 201 portfolios) managed by the Manager. She is 46 years old and has been an employee of the Manager since February 1984.
JOHN B. HAMMALIAN, Vice President and Assistant Secretary since August 2005.
Managing Counsel of BNY Mellon, and an officer of 77 investment companies (comprised of 201 portfolios) managed by the Manager. He is 45 years old and has been an employee of the Manager since February 1991.
ROBERT R. MULLERY, Vice President and Assistant Secretary since August 2005.
Managing Counsel of BNY Mellon, and an officer of 77 investment companies (comprised of 201 portfolios) managed by the Manager. He is 56 years old and has been an employee of the Manager since May 1986.
JEFF PRUSNOFSKY, Vice President and Assistant Secretary since August 2005.
Managing Counsel of BNY Mellon, and an officer of 77 investment companies (comprised of 201 portfolios) managed by the Manager. He is 43 years old and has been an employee of the Manager since October 1990.
46
JAMES WINDELS, Treasurer since November 2001.
Director – Mutual Fund Accounting of the Manager, and an officer of 77 investment companies (comprised of 201 portfolios) managed by the Manager. He is 49 years old and has been an employee of the Manager since April 1985.
RICHARD CASSARO, Assistant Treasurer since January 2008.
Senior Accounting Manager – Money Market and Municipal Bond Funds of the Manager, and an officer of 77 investment companies (comprised of 201 portfolios) managed by the Manager. He is 49 years old and has been an employee of the Manager since September 1982.
GAVIN C. REILLY, Assistant Treasurer since December 2005.
Tax Manager of the Investment Accounting and Support Department of the Manager, and an officer of 77 investment companies (comprised of 201 portfolios) managed by the Manager. He is 40 years old and has been an employee of the Manager since April 1991.
ROBERT ROBOL, Assistant Treasurer since December 2002.
Senior Accounting Manager – Fixed Income Funds of the Manager, and an officer of 77 investment companies (comprised of 201 portfolios) managed by the Manager. He is 44 years old and has been an employee of the Manager since October 1988.
ROBERT SALVIOLO, Assistant Treasurer since July 2007.
Senior Accounting Manager – Equity Funds of the Manager, and an officer of 77 investment companies (comprised of 201 portfolios) managed by the Manager. He is 41 years old and has been an employee of the Manager since June 1989.
ROBERT SVAGNA, Assistant Treasurer since December 2002.
Senior Accounting Manager - Equity Funds of the Manager, and an officer of 77 investment companies (comprised of 201 portfolios) managed by the Manager. He is 41 years old and has been an employee of the Manager since November 1990.
JOSEPH W. CONNOLLY, Chief Compliance Officer since October 2004.
Chief Compliance Officer of the Manager and The Dreyfus Family of Funds (77 investment companies, comprised of 201 portfolios). From November 2001 through March 2004, Mr. Connolly was first Vice-President, Mutual Fund Servicing for Mellon Global Securities Services. In that capacity, Mr. Connolly was responsible for managing Mellon’s Custody, Fund Accounting and Fund Administration services to third-party mutual fund clients. He is 51 years old and has served in various capacities with the Manager since 1980, including manager of the firm’s Fund Accounting Department from 1997 through October 2001.
WILLIAM GERMENIS, Anti-Money Laundering Compliance Officer since September 2002.
Vice President and Anti-Money Laundering Compliance Officer of the Distributor, and the Anti-Money Laundering Compliance Officer of 73 investment companies (comprised of 197 portfolios) managed by the Manager. He is 37 years old and has been an employee of the Distributor since October 1998.
The Fund 47
NOTES
For More Information

Telephone Wealth Management (WM) Clients, please contact your Account Officer or call 1-888-281-7350. Brokerage Clients of BNY Mellon Wealth Advisors (BNYMWA), please contact your financial representative or call 1-800-830-0549, Option 2. Individual Account holders, please call Dreyfus at 1-800-645-6561.
Mail WM Clients, write to your Account Officer, c/o The Bank of New York Mellon, One Mellon Bank Center, Pittsburgh, PA 15258. BNYMWA Brokerage Clients, write to your financial representative, P.O. Box 9012, Hicksville, NY 11802–9012. Individual Account Holders, write to: BNY Mellon Funds, P.O. Box 55268, Boston, MA 02205–8502.
The fund files its complete schedule of portfolio holdings with the Securities and Exchange Commission (“SEC”) for the first and third quarters of each fiscal year on Form N-Q. The fund’s Forms N-Q are available on the SEC’s website at http://www.sec.gov and may be reviewed and copied at the SEC’s Public Reference Room in Washington, DC. Information on the operation of the Public Reference Room may be obtained by calling 1-800-SEC-0330.
A description of the policies and procedures that the fund uses to determine how to vote proxies relating to portolio securities, and information regarding how the fund voted proxies relating to portfolio securities, is available on the SEC’s website at http://www.sec.gov and without charge, upon request, by calling 1-800-645-6561.
| © 2009 MBSC Securities Corporation |
| 6581AR1208 |
| Item 2. | Code of Ethics. |
The Registrant has adopted a code of ethics that applies to the Registrant's principal executive officer, principal financial officer, principal accounting officer or controller, or persons performing similar functions. There have been no amendments to, or waivers in connection with, the Code of Ethics during the period covered by this Report.
| Item 3. | Audit Committee Financial Expert. |
The Registrant's Board has determined that Thomas F. Ryan, Jr., a member of the Audit Committee of the Board, is an audit committee financial expert as defined by the Securities and Exchange Commission (the "SEC"). Thomas F. Ryan, Jr. is "independent" as defined by the SEC for purposes of audit committee financial expert determinations.
| Item 4. | Principal Accountant Fees and Services. |
(a) Audit Fees. The aggregate fees billed for each of the last two fiscal years (the "Reporting Periods") for professional services rendered by the Registrant's principal accountant (the "Auditor") for the audit of the Registrant's annual financial statements or services that are normally provided by the Auditor in connection with the statutory and regulatory filings or engagements for the Reporting Periods, were $35,100.00 in 2007 and $66,352.00 in 2008.
(b) Audit-Related Fees. The aggregate fees billed in the Reporting Periods for assurance and related services by the Auditor that are reasonably related to the performance of the audit of the Registrant's financial statements and are not reported under paragraph (a) of this Item 4 were $4,214.00 in 2007 and $11,333.00 in 2008. These services consisted of: (i) security counts required by rule 17f-2 under the Investment Company Act of 1940, as amended.
The aggregate fees billed in the Reporting Periods for non-audit assurance and related services by the Auditor to the Registrant's investment adviser (not including any sub-investment adviser whose role is primarily portfolio management and is subcontracted with or overseen by another investment adviser), and any entity controlling, controlled by or under common control with the investment adviser that provides ongoing services to the Registrant ("Service Affiliates"), that were reasonably related to the performance of the annual audit of the Service Affiliate, which required pre-approval by the Audit Committee were $0 in 2007 and $0 in 2008.
Note: For the second paragraph in each of (b) through (d) of this Item 4, certain of such services were not pre-approved prior to May 6, 2003, when such services were required to be pre-approved. On and after May 6, 2003, 100% of all services provided by the Auditor were pre-approved as required. For comparative purposes, the fees shown assume that all such services were pre-approved, including services that were not pre-approved prior to the compliance date of the pre-approval requirement.
(c) Tax Fees. The aggregate fees billed in the Reporting Periods for professional services rendered by the Auditor for tax compliance, tax advice, and tax planning ("Tax Services") were $7,800.00 in 2007 and $6,900.00 in 2008. These services consisted of: (i) review or preparation of U.S. federal, state, local and excise tax returns.
The aggregate fees billed in the Reporting Periods for Tax Services by the Auditor to Service Affiliates, which required pre-approval by the Audit Committee were $0 in 2007 and $0 in 2008.
(d) All Other Fees. The aggregate fees billed in the Reporting Periods for products and services provided by the Auditor, other than the services reported in paragraphs (a) through (c) of this Item, were $545.00 in 2007 and $0 in 2008.
The aggregate fees billed in the Reporting Periods for Non-Audit Services by the Auditor to Service Affiliates, other than the services reported in paragraphs (b) through (c) of this Item, which required pre-approval by the Audit Committee, were $0 in 2007 and $0 in 2008.
Audit Committee Pre-Approval Policies and Procedures. The Registrant's Audit Committee has established policies and procedures (the "Policy") for pre-approval (within specified fee limits) of the Auditor's engagements for non-audit services to the Registrant and Service Affiliates without specific case-by-case consideration. Pre-approval considerations include whether the proposed services are compatible with maintaining the Auditor's independence. Pre-approvals pursuant to the Policy are considered annually.
Non-Audit Fees. The aggregate non-audit fees billed by the Auditor for services rendered to the Registrant, and rendered to Service Affiliates, for the Reporting Periods were $0 in 2007 and $2,532,612.00 in 2008.
Auditor Independence. The Registrant's Audit Committee has considered whether the provision of non-audit services that were rendered to Service Affiliates, which were not pre-approved (not requiring pre-approval), is compatible with maintaining the Auditor's independence.
| Item 5. | Audit Committee of Listed Registrants. | |
| Not applicable. | ||
| Item 6. | Investments. | |
| (a) | Not applicable. | |
| Item 7. | Disclosure of Proxy Voting Policies and Procedures for Closed-End Management | |
| Investment Companies. | ||
| Not applicable. | ||
| Item 8. | Portfolio Managers of Closed-End Management Investment Companies. | |
| Not applicable. | ||
| Item 9. | Purchases of Equity Securities by Closed-End Management Investment Companies and | |
| Affiliated Purchasers. | ||
| Not applicable. | ||
| Item 10. | Submission of Matters to a Vote of Security Holders. |
The Registrant has a Nominating Committee (the "Committee"), which is responsible for selecting and nominating persons for election or appointment by the Registrant's Board as Board members. The Committee has adopted a Nominating Committee Charter (the "Charter"). Pursuant to the Charter, the Committee will consider recommendations for nominees from shareholders submitted to the Secretary of the Registrant, c/o The Dreyfus Corporation Legal Department, 200 Park Avenue, 8th Floor East, New York, New York 10166. A nomination submission must include information regarding the recommended nominee as specified in the Charter. This information includes all information relating to a recommended nominee
that is required to be disclosed in solicitations or proxy statements for the election of Board members, as well as information sufficient to evaluate the factors to be considered by the Committee, including character and integrity, business and professional experience, and whether the person has the ability to apply sound and independent business judgment and would act in the interests of the Registrant and its shareholders. Nomination submissions are required to be accompanied by a written consent of the individual to stand for election if nominated by the Board and to serve if elected by the shareholders, and such additional information must be provided regarding the recommended nominee as reasonably requested by the Committee.
| Item 11. | Controls and Procedures. |
(a) The Registrant's principal executive and principal financial officers have concluded, based on their evaluation of the Registrant's disclosure controls and procedures as of a date within 90 days of the filing date of this report, that the Registrant's disclosure controls and procedures are reasonably designed to ensure that information required to be disclosed by the Registrant on Form N-CSR is recorded, processed, summarized and reported within the required time periods and that information required to be disclosed by the Registrant in the reports that it files or submits on Form N-CSR is accumulated and communicated to the Registrant's management, including its principal executive and principal financial officers, as appropriate to allow timely decisions regarding required disclosure.
(b) There were no changes to the Registrant's internal control over financial reporting that occurred during the second fiscal quarter of the period covered by this report that have materially affected, or are reasonably likely to materially affect, the Registrant's internal control over financial reporting.
| Item 12. | Exhibits. |
(a)(1) Code of ethics referred to in Item 2.
(a)(2) Certifications of principal executive and principal financial officers as required by Rule 30a-2(a) under the Investment Company Act of 1940.
(a)(3) Not applicable.
(b) Certification of principal executive and principal financial officers as required by Rule 30a-2(b) under the Investment Company Act of 1940.
| SIGNATURES |
Pursuant to the requirements of the Securities Exchange Act of 1934 and the Investment Company Act of 1940, the Registrant has duly caused this Report to be signed on its behalf by the undersigned, thereunto duly authorized.
BNY Mellon Funds Trust
| By: | /s/ Christopher Sheldon | |
| Christopher Sheldon, | ||
| President | ||
| Date: | 2/23/2009 | |
Pursuant to the requirements of the Securities Exchange Act of 1934 and the Investment Company Act of 1940, this Report has been signed below by the following persons on behalf of the Registrant and in the capacities and on the dates indicated.
| By: | /s/ Christopher Sheldon | |
| Christopher Sheldon, | ||
| President | ||
| Date: | 2/23/2009 | |
| By: | /s/ James Windels | |
James Windels, | ||
| Treasurer | ||
| Date: | 2/23/2009 | |
| EXHIBIT INDEX |
(a)(1) Code of ethics referred to in Item 2.
(a)(2) Certifications of principal executive and principal financial officers as required by Rule 30a-2(a) under the Investment Company Act of 1940. (EX-99.CERT)
(b) Certification of principal executive and principal financial officers as required by Rule 30a-2(b) under the Investment Company Act of 1940. (EX-99.906CERT)