| UNITED STATES |
| SECURITIES AND EXCHANGE COMMISSION |
| Washington, D.C. 20549 |
| FORM N-CSR |
| CERTIFIED SHAREHOLDER REPORT OF REGISTERED MANAGEMENT |
| INVESTMENT COMPANIES |
Investment Company Act file number 811-09903
| BNY Mellon Funds Trust |
| (Exact name of Registrant as specified in charter) |
| c/o The Dreyfus Corporation | ||
| 200 Park Avenue | ||
| New York, New York 10166 | ||
| (Address of principal executive offices) | (Zip code) | |
| Michael A. Rosenberg, Esq. |
| 200 Park Avenue |
| New York, New York 10166 |
| (Name and address of agent for service) |
| Registrant's telephone number, including area code: | (212) 922-6000 | |||
| Date of fiscal year end: | 8/31 | |||
| Date of reporting period: | 8/31/2008 | |||
| FORM N-CSR |
Item 1. Reports to Stockholders.


| DISCUSSION OF |
| FUND PERFORMANCE |
For the period of September 1, 2007, through August 31, 2008, as provided by John F. Flahive, Portfolio Manager
Fund and Market Performance Overview
For the 12-month period ended August 31, 2008, BNY Mellon Bond Fund’s Class M shares achieved a total return of 6.17%, and the fund’s Investor shares achieved a total return of 5.81% ..1 In comparison, the fund’s benchmark, the Lehman Brothers U.S. Aggregate Index (the “Index”), achieved a total return of 5.86%, and the average return of funds reported in the Lipper Intermediate Investment Grade Debt category was 1.58% for the same period.2
Heightened volatility in the bond market persisted throughout the reporting period as a global credit crisis continued to trigger a “flight to quality” among investors, benefiting U.S. Treasury securities but punishing most other fixed-income market sectors. The fund’s Class M shares produced higher returns relative to its benchmark, primarily due to an overweighted position in U.S.Treasury securities and an emphasis on short-duration, high-quality corporate- and mortgage-backed securities.
The Fund’s Investment Approach
The fund seeks total return (consisting of capital appreciation and current income). To pursue its goal, the fund actively manages bond market and maturity exposure and invests at least 80% of its assets in bonds, such as U.S. Treasury and government agency bonds, corporate bonds, mortgage-related securities and foreign corporate and government bonds. The fund’s investments in bonds must be rated investment-grade quality at the time of purchase3 or, if unrated, deemed of comparable quality by the investment adviser. Generally, the average effective duration of the fund’s portfolio will not exceed eight years.
Credit and Economic Concerns Fueled Volatility
A credit crisis that began in the sub-prime mortgage market continued to dampen investor sentiment over much of the reporting period, causing prices in most
segments of the bond market to fall.The impact of the credit crunch was particularly severe among riskier mortgage- and asset-backed securities. In addition, slumping housing markets, a weaker job market and soaring food and energy prices sparked a downturn in the U.S. economy, leading to lower prices for corporate bonds. In contrast, U.S.Treasury securities gained value as newly risk-averse investors flocked to the relatively safe haven provided by government-backed investments.
The Federal Reserve Board (the “Fed”) responded aggressively to these developments by injecting liquidity into the U.S. banking system and reducing short-term interest rates from 5.25% at the start of the reporting period to 2.00% at the end.As a result of these moves, yield differences generally widened along the bond market’s maturity range. Intermediate-term securities were among the greater beneficiaries of the steepening yield curve.
Fixed-income markets began to see signs of improvement in March 2008, after the Fed participated in a plan to prevent the insolvency of a major investment bank from damaging other financial institutions. Market liquidity appeared to improve, and spread sectors generally rallied. However, over the summer, heightened inflation concerns, another wave of sub-prime related write-downs by global investment banks and larger-than-expected losses at U.S. government-sponsored mortgage agencies Fannie Mae and Freddie Mac had offset a substantial portion of the rebound by the reporting period’s end.
| Positioned Early for Value-Oriented |
| Opportunities |
As prices of mortgage-backed, asset-backed and corporate securities declined, we intensified our focus on credit quality, increasing the fund’s holdings of bonds we deemed to be relatively insensitive to the economic downturn and turmoil in the credit markets. We trimmed holdings of riskier corporate, asset-backed and commercial mortgage-backed securities, and we shifted the remaining allocation in these sub-sectors to bonds
The Funds 3
DISCUSSION OF FUND PERFORMANCE (continued)
with higher levels of credit quality and shorter maturities or call dates. Conversely, we increased the fund’s exposure to longer-duration U.S.Treasury securities.As a result, the fund held none of the securities that were hit hardest by the credit crisis.
Among the fund’s holdings of U.S. government agency securities, we maintained a slightly underweighted overall position relative to the benchmark, and we focused primarily on securities from Ginnie Mae, which are backed by the U.S. government, over those from Fannie Mae and Freddie Mac.This strategy benefited the fund’s performance when Fannie Mae and Freddie Mac encountered severe financial problems that, soon after the reporting period’s end, resulted in their takeover by the federal government.
Consistent with our focus on shorter-maturity corporate and asset-backed securities, we set the fund’s weighted average maturity in a range that was shorter than industry averages.This position detracted modestly from the fund’s relative performance in the declining interest-rate environment.
Maintaining a Cautious Investment Posture
As of the end of the reporting period, the U.S. economy has continued to struggle, and the global credit crisis has not abated.Therefore, we generally have maintained the fund’s defensive strategies. However, after extensive credit analysis, we have found what we believe are attractive values among certain corporate bonds that appear to have been punished too severely during the downturn, and we recently reallocated assets in a way that more closely mirrors the composition of the fund’s benchmark.
September 15, 2008
1 Total return includes reinvestment of dividends and any capital gains paid. Past performance is no guarantee of future results. Share price, yield and investment return fluctuate such that upon redemption, fund shares may be worth more or less than their original cost.
2 SOURCE: LIPPER INC. — Reflects reinvestment of dividends and, where applicable, capital gain distributions.The Lehman Brothers U.S.Aggregate Index is a widely accepted, unmanaged total return index of corporate, U.S. government and U.S. government agency debt instruments, mortgage-backed securities and asset-backed securities with an average maturity of 1-10 years.
3 The fund may continue to own investment-grade bonds (at the time of purchase), which are subsequently downgraded to below investment grade.
4
FUND PERFORMANCE
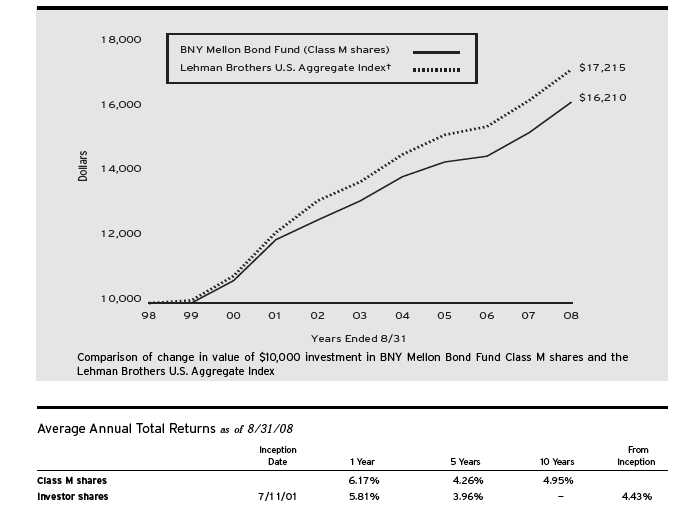
| † Source: Lipper Inc. |
| Past performance is not predictive of future performance.The fund’s performance shown in the graph and table does not reflect the deduction of taxes that a shareholder |
| would pay on fund distributions or the redemption of fund shares. |
| The above graph compares a $10,000 investment made in Class M shares of BNY Mellon Bond Fund on 8/31/98 to a $10,000 investment made in the |
| Lehman Brothers U.S.Aggregate Index (the “Index”) on that date.All dividends and capital gain distributions are reinvested. |
| Effective March 31, 2008, Mellon Funds Trust changed its name to BNY Mellon Funds Trust. |
| Before the fund commenced operations, substantially all of the assets of a predecessor common trust fund (CTF) that, in all material respects, had the same investment |
| objective, policies, guidelines and restrictions as the fund (and those of two other CTFs) were transferred to the fund. Please note that the performance of the fund’s |
| Class M shares represents the performance of the predecessor CTF through October 1, 2000, adjusted to reflect the fund’s fees and expenses, by subtracting from the |
| actual performance of the CTF the expenses of the fund’s Class M shares as they were estimated prior to the conversion of the CTF into the fund, and the |
| performance of the fund’s Class M shares thereafter.The predecessor CTF was not registered under the Investment Company Act of 1940, as amended, and therefore |
| was not subject to certain investment restrictions that might have adversely affected performance. In addition, the expenses of the fund’s Class M shares may be higher |
| than those estimated prior to the conversion of the CTF into the fund, which would lower the performance shown in the above line graph. |
| Effective July 11, 2001, existing fund shares were designated as Class M shares and the fund began offering a second class of shares designated as Investor shares, |
| which are subject to a Shareholder Services Plan. Performance for Investor shares will vary from the performance of Class M shares shown above because of the |
| differences in charges and expenses. |
| The fund’s performance shown in the line graph takes into account all applicable fees and expenses for Class M shares only.The Index is a widely accepted, unmanaged |
| index of corporate, government and government agency debt instruments, mortgage-backed securities, and asset-backed securities with an average maturity of 1-10 years. |
| Unlike a mutual fund, the Index is not subject to charges, fees and other expenses. Investors cannot invest directly in any index. Further information relating to fund |
| performance, including expense reimbursements, if applicable, is contained in the Financial Highlights section of the prospectus and elsewhere in this report. |
The Funds 5

| DISCUSSION OF |
| FUND PERFORMANCE |
For the period of September 1, 2007, through August 31, 2008, as provided by John F. Flahive, Portfolio Manager
Fund and Market Performance Overview
For the 12-month period ended August 31, 2008, BNY Mellon Intermediate Bond Fund’s Class M shares achieved a total return of 6.19%, and the fund’s Investor shares achieved a total return of 5.91% .1 In comparison, the fund’s benchmark, the Lehman Brothers Intermediate Government/Credit Bond Index (the “Index”), achieved a total return of 6.05%, and the average return of funds reported in the Lipper Short-Intermediate Investment Grade Debt category was 2.03% for the same period.2
Heightened bond market volatility persisted throughout the reporting period as a global credit crisis continued to trigger a “flight to quality” among investors, benefiting U.S. Treasury securities but punishing riskier fixed-income market sectors. The fund produced higher returns relative to its benchmark, primarily due to its defensive investment posture.
The Fund’s Investment Approach
The fund seeks total return (consisting of capital appreciation and current income).To pursue its goal, the fund actively manages bond market and maturity exposure and invests at least 80% of its assets in bonds, such as U.S. government and agency bonds, corporate bonds, mortgage-related securities, foreign corporate and government bonds and municipal bonds.The fund’s investments in bonds must be rated investment grade at the time of purchase3 or, if unrated, deemed of comparable quality by the investment adviser. Generally, the fund’s average effective portfolio maturity will be between three and 10 years, and the average effective duration of the fund’s portfolio will be between 2.5 and 5.5 years.
When managing the fund, we use a disciplined process to select securities and manage risk.We generally choose bonds based on yield, credit quality, the level of interest rates and inflation, general economic and financial trends and our outlook for the securities markets. Our manage-
ment process also includes computer modeling and scenario testing of possible changes in market conditions.
Credit and Economic Concerns Fueled Volatility
A credit crisis that began in the sub-prime mortgage market continued to dampen investor sentiment over much of the reporting period, causing prices of higher-yielding mortgage- and asset-backed securities to fall sharply. In addition, slumping housing markets, a weaker job market and soaring food and energy prices sparked a downturn in the U.S. economy, leading to lower prices for many corporate bonds. In contrast, U.S. Treasury securities gained value as newly risk-averse investors flocked to the relatively safe haven provided by government-backed investments.
The Federal Reserve Board (the “Fed”) responded aggressively to these developments by injecting liquidity into the U.S. banking system and reducing short-term interest rates from 5.25% at the start of the reporting period to 2.00% at the end. As a result of these moves, yield differences generally widened along the bond market’s maturity range. Intermediate-term securities were among the greater beneficiaries of the steepening yield curve.
Fixed-income markets began to improve in March 2008, after the Fed participated in a plan to prevent the insolvency of a major investment bank from damaging other financial institutions. However, over the summer, heightened inflation concerns, another wave of sub-prime related write-downs by global investment banks and larger-than-expected losses at U.S. government-sponsored mortgage agencies Fannie Mae and Freddie Mac had offset a substantial portion of the rebound by the reporting period’s end.
Focus on Credit Quality Supported Fund Returns
As corporate securities prices declined, we intensified our focus on credit quality, increasing the fund’s exposure to issuers we deemed relatively insensitive to the economic downturn and credit crisis.We trimmed holdings of lower-rated corporate securities, and we shifted the remaining allocation to bonds with higher levels of credit quality and
6
shorter maturities or call dates. Although we strove to diversify the fund’s corporate-backed holdings across the full spectrum of industry groups, we found relatively few opportunities among bonds issued by financial companies. Conversely, we increased the fund’s exposure to longer-duration U.S. Treasury securities. We also established modest positions in high-quality, short-duration asset-backed and commercial mortgage-backed securities that are not represented in the Index.
We maintained a slightly underweighted position in U.S. government agency securities relative to the benchmark, and we focused primarily on securities from Ginnie Mae, which are backed by the U.S. government, over those from Fannie Mae and Freddie Mac.This strategy benefited the fund’s performance when Fannie Mae and Freddie Mac encountered severe financial problems that, soon after the reporting period’s end, resulted in their takeover by the federal government.
Finally, we set the fund’s weighted average maturity in a range that was shorter than industry averages.This position detracted modestly from the fund’s relative performance in the declining interest-rate environment.
Maintaining a Cautious Investment Posture
As of the end of the reporting period, we generally have maintained the fund’s defensive strategies. However, after extensive credit analysis, we have found what we believe are attractive values among certain corporate bonds that appear to have been punished too severely during the downturn, and we recently reallocated assets in a way that more closely mirrors the composition of the fund’s benchmark.
September 15, 2008
| 1 | Total return includes reinvestment of dividends and any capital gains paid. | |
| Past performance is no guarantee of future results. Share price, yield and | ||
| investment return fluctuate such that upon redemption, fund shares may be | ||
| worth more or less than their original cost. | ||
| 2 | SOURCE: LIPPER INC. – Reflects reinvestment of dividends and, | |
| where applicable, capital gain distributions.The Lehman Brothers | ||
| Intermediate Government/Credit Bond Index is a widely accepted, | ||
| unmanaged index of government and credit bond market performance | ||
| composed of U.S. government,Treasury and agency securities, fixed-income | ||
| securities and nonconvertible investment-grade credit debt, with an average | ||
| maturity of 1-10 years. Index return does not reflect the fees and expenses | ||
| associated with operating a mutual fund. | ||
| 3 | The fund may continue to own investment-grade bonds (at the time of | |
| purchase), which are subsequently downgraded to below investment grade. |
The Funds 7
FUND PERFORMANCE
| 8 |
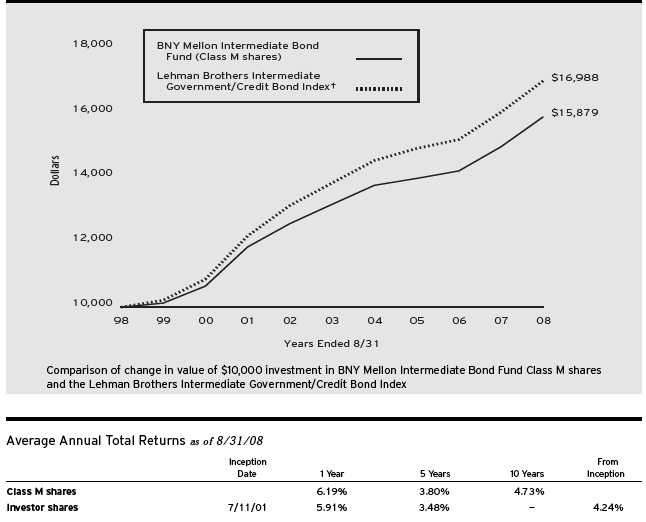
| † Source: Lipper Inc. |
| Past performance is not predictive of future performance.The fund’s performance shown in the graph and table does not reflect the deduction of taxes that a shareholder |
| would pay on fund distributions or the redemption of fund shares. |
| The above graph compares a $10,000 investment made in Class M shares of BNY Mellon Intermediate Bond Fund on 8/31/98 to a $10,000 investment made in |
| the Lehman Brothers Intermediate Government/Credit Bond Index (the “Index”) on that date.All dividends and capital gain distributions are reinvested. |
| Effective March 31, 2008, Mellon Funds Trust changed its name to BNY Mellon Funds Trust. |
| Before the fund commenced operations, substantially all of the assets of a predecessor common trust fund (CTF) that, in all material respects, had the same investment |
| objective, policies, guidelines and restrictions as the fund were transferred to the fund. Please note that the performance of the fund’s Class M shares represents the |
| performance of the predecessor CTF through October 1, 2000, adjusted to reflect the fund’s fees and expenses, by subtracting from the actual performance of the CTF |
| the expenses of the fund’s Class M shares as they were estimated prior to the conversion of the CTF into the fund, and the performance of the fund’s Class M shares |
| thereafter.The predecessor CTF was not registered under the Investment Company Act of 1940, as amended, and therefore was not subject to certain investment |
| restrictions that might have adversely affected performance. In addition, the expenses of the fund’s Class M shares may be higher than those estimated prior to the |
| conversion of the CTF into the fund, which would lower the performance shown in the above line graph. |
| Effective July 11, 2001, existing fund shares were designated as Class M shares and the fund began offering a second class of shares designated as Investor shares, |
| which are subject to a Shareholder Services Plan. Performance for Investor shares will vary from the performance of Class M shares shown above because of the |
| differences in charges and expenses. |
| The fund’s performance shown in the line graph takes into account all applicable fees and expenses for Class M shares only.The Index is a widely accepted, |
| unmanaged index of Government and credit bond market performance composed of U.S. Government,Treasury and Agency securities, fixed-income securities and |
| nonconvertible investment-grade credit debt, with an average maturity of 1-10 years. Unlike a mutual fund, the Index is not subject to charges, fees and other expenses. |
| Investors cannot invest directly in any index. Further information relating to fund performance, including expense reimbursements, if applicable, is contained in the |
| Financial Highlights section of the prospectus and elsewhere in this report. |

| DISCUSSION OF |
| FUND PERFORMANCE |
For the period of September 1, 2007, through August 31, 2008, as provided by Lawrence R. Dunn, CFA, Portfolio Manager
Fund and Market Performance Overview
For the 12-month period ended August 31, 2008, BNY Mellon Short-Term U.S. Government Securities Fund’s Class M shares achieved a total return of 5.83%, and the fund’s Investor shares achieved a total return of 5.55% .1 In comparison, the Lehman Brothers 1-3 Year U.S. Government Index (the “Index”), the fund’s benchmark, achieved a total return of 6.05%, and the funds reported in the Lipper Short U.S. Government category provided an average return of 4.01% for the same period.2
A flight to quality amid a U.S. economic downturn and global credit crisis fueled gains in U.S.Treasury securities and other government-backed bonds. The fund’s returns were roughly in line with its benchmark, but higher than its Lipper category average, primarily due to our cautious approach to a volatile market.
The Fund’s Investment Approach
The fund seeks to provide as high a level of current income as is consistent with the preservation of capital. To pursue this goal, the fund invests at least 80% of its assets in securities issued or guaranteed by the U.S. government or its agencies or instrumentalities and in repurchase agreements.The fund may invest up to 35% of its net assets in mortgage-related securities issued by U.S. government agencies or instrumentalities, such as mortgage pass-through securities issued by the Government National Mortgage Association (“Ginnie Mae”), the Federal National Mortgage Association (“Fannie Mae”) and the Federal Home Loan Mortgage Corporation (“Freddie Mac”). The fund may also invest in collateralized mortgage obligations (“CMOs”), including stripped mortgage-backed securities. Generally, the fund’s average effective portfolio maturity and the average effective duration of the fund’s portfolio will be less than three years.
When choosing securities,we typically first examine U.S. and global economic conditions and other market factors to estimate long- and short-term interest rates. Using a research-driven investment process, we then seek to identify what we believe are potentially profitable sectors before they are widely perceived by the market.We also seek to identify underpriced or mispriced securities that appear likely to perform well over time.
Credit and Economic Concerns Fueled Volatility
A credit crisis that began in the sub-prime mortgage market continued to dampen investor sentiment over the reporting period, causing prices in the riskier segments of the bond market, such as mortgage- and asset-backed securities, to fall. In addition, slumping housing markets, a weaker job market and soaring food and energy prices sparked a downturn in the U.S. economy, leading to lower prices for corporate bonds. In contrast, U.S. Treasury securities gained value as risk-averse investors flocked to the relative safety of government-backed investments.
The Federal Reserve Board (the “Fed”) responded aggressively to these developments by injecting liquidity into the U.S. banking system and reducing short-term interest rates from 5.25% at the start of the reporting period to 2.00% at the end.As a result of these moves, yields of short-term U.S. government securities declined, and their prices rose.
Fixed-income markets began to see signs of improvement in March 2008, after the Fed participated in a plan to prevent the insolvency of a major investment bank from damaging other financial institutions. Market liquidity appeared to recover, and higher-yielding sectors generally rallied. However, over the summer, renewed declines stemming from heightened inflation concerns, another wave of sub-prime related write-downs by global investment banks and turmoil affecting two major U.S. government-sponsored mortgage agencies had offset a substantial portion of the rebound by the reporting period’s end.
The Funds 9
DISCUSSION OF FUND PERFORMANCE (continued)
Defensive Posture Dampened Volatility
In this volatile environment, we generally maintained a conservative approach in an attempt to preserve shareholder value.We set the fund’s average duration in a range between neutral and shorter than industry averages.This positioning proved to be effective when yields of U.S. Treasury securities climbed in the spring of 2008. In addition, we increased the fund’s exposure to U.S. Treasury securities. Conversely, we reduced the fund’s holdings of U.S. government agency securities and mortgage-backed securities, which proved beneficial when mortgage agencies Fannie Mae and Freddie Mac stumbled over the summer. Indeed, we tended to emphasize agency debentures from the Federal Home Loan Bank and Farm Credit Bank, not Fannie Mae and Freddie Mac.Although the fund’s benchmark holds no mortgage-backed securities, we felt comfortable with a modest position in high-quality, shorter-maturity balloon mortgages and hybrid ARMS, which fared relatively well.
Monitoring Developments Closely
As of the reporting period’s end, it appears that inflationary pressures may be easing as commodity prices fall from their peaks.While this could give the Fed room to raise interest rates, the weak U.S. economy and persistent credit crisis suggest to us that it will not do so anytime soon. Meanwhile, we are monitoring the economy and fixed-income markets, and we intend to reposition the fund for opportunities and challenges as they become apparent.
September 15, 2008
| 1 | Total return includes reinvestment of dividends and any capital gains paid. | |
| Past performance is no guarantee of future results. Share price, yield and | ||
| investment return fluctuate such that upon redemption, fund shares may be | ||
| worth more or less than their original cost. | ||
| 2 | SOURCE: LIPPER INC. — Reflects reinvestment of dividends and, | |
| where applicable, capital gain distributions.The Lehman Brothers 1-3Year | ||
| U.S. Government Index is a widely accepted, unmanaged index of | ||
| government bond market performance composed of U.S.Treasury and agency | ||
| securities with maturities of 1-3 years. Index return does not reflect the fees | ||
| and expenses associated with operating a mutual fund. |
10
FUND PERFORMANCE
| † Source: Lipper Inc. |
| Past performance is not predictive of future performance.The fund’s performance shown in the graph and table does not reflect the deduction of taxes that a shareholder |
| would pay on fund distributions or the redemption of fund shares. |
| The above graph compares a $10,000 investment made in Class M shares of BNY Mellon Short-Term U.S. Government Securities Fund on 8/31/98 to a $10,000 |
| investment made in the Lehman Brothers 1-3Year U.S. Government Index (the “Index”) on that date.All dividends and capital gain distributions are reinvested. |
| Effective March 31, 2008, Mellon Funds Trust changed its name to BNY Mellon Funds Trust. |
| Before the fund commenced operations, substantially all of the assets of a predecessor common trust fund (CTF) that, in all material respects, had the same investment |
| objective, policies, guidelines and restrictions as the fund were transferred to the fund. Please note that the performance of the fund’s Class M shares represents the |
| performance of the predecessor CTF through October 1, 2000, adjusted to reflect the fund’s fees and expenses, by subtracting from the actual performance of the CTF |
| the expenses of the fund’s Class M shares as they were estimated prior to the conversion of the CTF into the fund, and the performance of the fund’s Class M shares |
| thereafter.The predecessor CTF was not registered under the Investment Company Act of 1940, as amended, and therefore was not subject to certain investment |
| restrictions that might have adversely affected performance. In addition, the expenses of the fund’s Class M shares may be higher than those estimated prior to the |
| conversion of the CTF into the fund, which would lower the performance shown in the above line graph. |
| Effective July 11, 2001, existing fund shares were designated as Class M shares and the fund began offering a second class of shares designated as Investor shares, |
| which are subject to a Shareholder Services Plan. Performance for Investor shares will vary from the performance of Class M shares shown above because of the |
| differences in charges and expenses. |
| The fund’s performance shown in the line graph takes into account all applicable fees and expenses for Class M shares only.The Index is a widely accepted, |
| unmanaged index of government bond market performance composed of U.S.Treasury and agency securities with maturities of 1-3 years. Unlike a mutual fund, the |
| Index is not subject to charges, fees and other expenses. Investors cannot invest directly in any index. Further information relating to fund performance, including |
| expense reimbursements, if applicable, is contained in the Financial Highlights section of the prospectus and elsewhere in this report. |
The Funds 11
UNDERSTANDING YOUR FUND’S EXPENSES (Unaudited)
As a mutual fund investor, you pay ongoing expenses, such as management fees and other expenses. Using the information below, you can estimate how these expenses affect your investment and compare them with the expenses of other funds.You also may pay one-time transaction expenses, including sales charges (loads) and redemption fees, which are not shown in this section and would have resulted in higher total expenses. For more information, see your fund’s prospectus or talk to your financial advisor.
Review your fund’s expenses
The table below shows the expenses you would have paid on a $1,000 investment in each class of each BNY Mellon fixed income fund from March 1, 2008 to August 31, 2008. It also shows how much a $1,000 investment would be worth at the close of the period, assuming actual returns and expenses.
| Expenses and Value of a $1,000 Investment | ||||
| assuming actual returns for the six months ended August 31, 2008 | ||||
| Class M Shares | Investor Shares | |||
| BNY Mellon Bond Fund | ||||
| Expenses paid per $1,000† | $ 2.77 | $ 3.97 | ||
| Ending value (after expenses) | $1,002.20 | $ 999.90 | ||
| BNY Mellon Intermediate Bond Fund | ||||
| Expenses paid per $1,000† | $ 2.76 | $ 4.01 | ||
| Ending value (after expenses) | $ 996.50 | $ 995.40 | ||
| BNY Mellon Short-Term U.S. Government Securities Fund | ||||
| Expenses paid per $1,000† | $ 2.71 | $ 3.88 | ||
| Ending value (after expenses) | $1,004.10 | $1,002.80 |
COMPARING YOUR FUND’S EXPENSES WITH THOSE OF OTHER FUNDS (Unaudited)
Using the SEC’s method to compare expenses
The Securities and Exchange Commission (SEC) has established guidelines to help investors assess fund expenses. Per these guidelines, the table below shows your fund’s expenses based on a $1,000 investment, assuming a hypothetical 5% annualized return.You can use this information to compare the ongoing expenses (but not transaction expenses or total cost) of investing in the fund with those of other funds. All mutual fund shareholder reports will provide this information to help you make this comparison. Please note that you cannot use this information to estimate your actual ending account balance and expenses paid during the period.
| Expenses and Value of a $1,000 Investment | ||||
| assuming a hypothetical 5% annualized return for the six months ended August 31, 2008 | ||||
| Class M Shares | Investor Shares | |||
| BNY Mellon Bond Fund | ||||
| Expenses paid per $1,000† | $ 2.80 | $ 3.91 | ||
| Ending value (after expenses) | $1,022.37 | $1,021.27 | ||
| BNY Mellon Intermediate Bond Fund | ||||
| Expenses paid per $1,000† | $ 2.80 | $ 4.06 | ||
| Ending value (after expenses) | $1,022.37 | $1,021.11 | ||
| BNY Mellon Short-Term U.S. Government Securities Fund | ||||
| Expenses paid per $1,000† | $ 2.80 | $ 3.91 | ||
| Ending value (after expenses) | $1,022.37 | $1,021.27 |
| † Expenses are equal to the BNY Mellon Bond Fund annualized expense ratio of .55% for Class M and .77% for Investor shares, BNY Mellon Intermediate Bond Fund .55% |
| for Class M and .80% for Investor shares and BNY Mellon Short-Term U.S. Government Securities Fund .55% for Class M and .77% for Investor shares, multiplied by the |
| average account value over the period, multiplied by 184/366 (to reflect the one-half year period). |
12
| STATEMENT OF INVESTMENTS |
| August 31, 2008 |
| BNY Mellon Bond Fund | ||||||||
| Coupon | Maturity | Principal | ||||||
| Bonds and Notes—99.0% | Rate (%) | Date | Amount ($) | Value ($) | ||||
| Asset—Backed Ctfs.—.8% | ||||||||
| CIT Equipment Collateral, Ser. 2006-VT2, Cl. A4 | 5.05 | 4/20/14 | 6,030,000 | 6,043,264 | ||||
| CNH Equipment Trust, Ser. 2005-A, Cl. A4B | 4.29 | 6/15/12 | 1,770,366 | 1,774,779 | ||||
| 7,818,043 | ||||||||
| Asset-Backed Ctfs./Auto Receivables—3.4% | ||||||||
| Franklin Auto Trust, Ser. 2007-1, Cl. A4 | 5.03 | 2/16/15 | 5,865,000 | 5,681,558 | ||||
| Harley-Davidson Motorcycle Trust, Ser. 2005-3, Cl. A2 | 4.41 | 6/15/12 | 1,780,250 | 1,787,067 | ||||
| Harley-Davidson Motorcycle Trust, Ser. 2007-1, Cl. A4 | 5.21 | 6/17/13 | 3,715,000 | 3,747,263 | ||||
| Honda Auto Receivables Owner Trust, Ser. 2007-1, Cl. A4 | 5.09 | 7/18/13 | 1,470,000 | 1,484,993 | ||||
| Honda Auto Receivables Owner Trust, Ser. 2006-3, Cl. A4 | 5.11 | 4/15/12 | 6,180,000 | 6,218,792 | ||||
| Household Automotive Trust, Ser. 2007-1, Cl. A4 | 5.33 | 11/17/13 | 4,700,000 | 4,559,573 | ||||
| Hyundai Auto Receivables Trust, Ser. 2006-B, Cl. A4 | 5.15 | 5/15/13 | 3,600,000 | 3,612,887 | ||||
| Nissan Auto Lease Trust, Ser. 2006-A, Cl. A4 | 5.10 | 7/16/12 | 7,295,000 | 7,246,161 | ||||
| 34,338,294 | ||||||||
| Bank & Finance—8.3% | ||||||||
| AEP Texas Central Transition Funding, Sr. Scd. Bonds, Ser. A-4 | 5.17 | 1/1/18 | 7,090,000 | 6,804,710 | ||||
| Agua Caliente Band of Cahuilla Indians, Sr. Scd. Notes | 6.08 | 10/1/16 | 2,635,000 a | 2,607,596 | ||||
| Agua Caliente Band of Cahuilla Indians, Scd. Notes | 6.35 | 10/1/15 | 1,135,000 a | 1,089,044 | ||||
| Agua Caliente Band of Cahuilla Indians, Sr. Scd. Notes | 6.44 | 10/1/16 | 2,860,000 a | 2,830,256 | ||||
| AXA Financial, Unscd. Notes | 7.75 | 8/1/10 | 5,000,000 | 5,235,180 | ||||
| Bank of America, Sub. Notes | 5.49 | 3/15/19 | 10,600,000 | 9,473,294 | ||||
| BankAmerica Capital II, Bank Gtd. Secs., Ser. 2 | 8.00 | 12/15/26 | 6,775,000 | 6,612,691 | ||||
| Bear Stearns, Sr. Unscd. Notes | 4.50 | 10/28/10 | 2,845,000 | 2,839,762 | ||||
| Blackrock, Sr. Unsub. Notes | 6.25 | 9/15/17 | 4,885,000 | 4,806,117 | ||||
| CIT Group, Sr. Unscd. Notes | 5.40 | 3/7/13 | 4,100,000 | 3,106,103 | ||||
| Citigroup, Sr. Unscd. Notes | 6.13 | 11/21/17 | 3,135,000 | 2,953,054 | ||||
| Countrywide Home Loan, Gtd. Notes, Ser. K | 5.63 | 7/15/09 | 2,855,000 | 2,791,784 | ||||
| Countrywide Home Loan, Gtd. Notes, Ser. H | 6.25 | 4/15/09 | 1,435,000 | 1,420,875 | ||||
| Goldman Sachs Group, Sub. Notes | 6.75 | 10/1/37 | 3,980,000 | 3,512,091 | ||||
| HSBC Finance, Sr. Unscd. Notes | 5.00 | 6/30/15 | 2,410,000 | 2,300,692 | ||||
| HSBC Holdings, Sub. Notes | 6.50 | 9/15/37 | 4,500,000 | 4,115,943 | ||||
| International Lease Finance, Sr. Unscd. Notes | 5.75 | 6/15/11 | 5,645,000 | 5,163,848 | ||||
| John Deere Capital, Sr. Unscd. Notes | 7.00 | 3/15/12 | 4,360,000 | 4,708,054 | ||||
| JPMorgan Chase & Co., Sr. Unscd. Notes | 5.38 | 10/1/12 | 1,800,000 | 1,787,539 | ||||
| Morgan Stanley, Sub. Notes | 4.75 | 4/1/14 | 7,210,000 | 6,338,051 | ||||
| PNC Funding, Bank Gtd. Notes | 4.50 | 3/10/10 | 2,825,000 | 2,826,983 | ||||
| 83,323,667 | ||||||||
| Building & Construction—.4% | ||||||||
| CRH America, Gtd. Notes | 5.30 | 10/15/13 | 4,095,000 | 3,792,785 | ||||
| Commercial & Professional Services—.9% | ||||||||
| Seminole Tribe of Florida, Notes | 5.80 | 10/1/13 | 8,840,000 a | 8,905,460 |
The Funds 13
STATEMENT OF INVESTMENTS (continued)
| BNY Mellon Bond Fund (continued) | ||||||||
| Coupon | Maturity | Principal | ||||||
| Bonds and Notes (continued) | Rate (%) | Date | Amount ($) | Value ($) | ||||
| Commercial Mortgage Pass-Through Ctfs.—1.6% | ||||||||
| Citigroup/Deutsche Bank Commercial | ||||||||
| Mortgage Trust, Ser. 2007-CD4, Cl. A2B | 5.21 | 12/11/49 | 3,390,000 | 3,255,513 | ||||
| Credit Suisse Mortgage Capital Certificates, Ser. 2007-C2, Cl. A2 | 5.45 | 1/15/49 | 4,610,000 b | 4,459,531 | ||||
| CWCapital Cobalt, Ser. 2007-C2, Cl. A2 | 5.33 | 4/15/47 | 4,780,000 | 4,602,669 | ||||
| LB-UBS Commercial Mortgage Trust, Ser. 2007-C2, Cl. A2 | 5.30 | 2/15/40 | 4,225,000 | 4,065,876 | ||||
| 16,383,589 | ||||||||
| Food & Beverages—.9% | ||||||||
| Diageo Finance, Gtd. Notes | 5.50 | 4/1/13 | 3,805,000 | 3,899,836 | ||||
| Pepsico, Unscd. Notes | 5.00 | 6/1/18 | 4,800,000 | 4,766,702 | ||||
| 8,666,538 | ||||||||
| Foreign/Governmental—1.1% | ||||||||
| Hydro-Quebec, Gov’t. Gtd. Bonds, Ser. IF | 8.00 | 2/1/13 | 3,920,000 | 4,548,274 | ||||
| United Mexican States, Sr. Unscd. Notes | 5.63 | 1/15/17 | 4,705,000 c | 4,761,460 | ||||
| United Mexican States, Sr. Unscd. Notes | 6.63 | 3/3/15 | 1,480,000 | 1,591,000 | ||||
| 10,900,734 | ||||||||
| Health Care—.4% | ||||||||
| Aetna, Sr. Unscd. Notes | 5.75 | 6/15/11 | 3,750,000 | 3,805,650 | ||||
| Industrials—2.0% | ||||||||
| Devon Financing, Gtd. Notes | 6.88 | 9/30/11 | 4,110,000 | 4,369,283 | ||||
| Emerson Electric, Sr. Unscd. Notes | 5.00 | 12/15/14 | 3,500,000 | 3,538,034 | ||||
| Johnson Controls, Sr. Unscd. Notes | 5.50 | 1/15/16 | 7,116,000 | 6,929,660 | ||||
| United Technologies, Notes | 6.13 | 7/15/38 | 5,195,000 | 5,237,064 | ||||
| 20,074,041 | ||||||||
| Information Technology—1.5% | ||||||||
| International Business Machines, Sr. Unscd. Debs. | 7.00 | 10/30/25 | 2,000,000 c | 2,208,800 | ||||
| Intuit, Sr. Unscd. Notes | 5.40 | 3/15/12 | 4,735,000 | 4,720,904 | ||||
| Oracle, Sr. Unscd. Notes | 5.75 | 4/15/18 | 7,685,000 | 7,721,012 | ||||
| 14,650,716 | ||||||||
| Media & Telecommunications—4.0% | ||||||||
| AT&T, Sr. Unscd. Notes | 6.50 | 9/1/37 | 5,105,000 | 4,929,020 | ||||
| British Sky Broadcasting, Gtd. Notes | 6.88 | 2/23/09 | 4,180,000 | 4,229,608 | ||||
| Cisco Systems, Sr. Unscd. Notes | 5.50 | 2/22/16 | 4,200,000 | 4,273,991 | ||||
| Comcast, Gtd. Notes | 5.90 | 3/15/16 | 6,400,000 | 6,263,533 | ||||
| News America Holdings, Gtd. Debs. | 7.60 | 10/11/15 | 3,750,000 | 4,170,394 | ||||
| News America, Gtd. Notes | 6.15 | 3/1/37 | 2,375,000 | 2,155,557 | ||||
| SBC Communications, Sr. Unscd. Notes | 5.88 | 8/15/12 | 4,320,000 | 4,469,839 | ||||
| Time Warner Cable, Gtd. Debs. | 7.30 | 7/1/38 | 2,895,000 | 2,917,816 | ||||
| Time Warner, Gtd. Debs. | 6.50 | 11/15/36 | 2,115,000 | 1,874,112 | ||||
| Verizon Communications, Sr. Unscd. Notes | 5.50 | 2/15/18 | 4,545,000 | 4,354,642 | ||||
| 39,638,512 |
14
| BNY Mellon Bond Fund (continued) | ||||||||
| Coupon | Maturity | Principal | ||||||
| Bonds and Notes (continued) | Rate (%) | Date | Amount ($) | Value ($) | ||||
| Real Estate—.9% | ||||||||
| ERP Operating, Sr. Unscd. Notes | 6.95 | 3/2/11 | 4,000,000 | 4,093,684 | ||||
| Simon Property Group, Sr. Unscd. Notes | 5.75 | 5/1/12 | 5,265,000 | 5,211,981 | ||||
| 9,305,665 | ||||||||
| Residential Mortgage Pass-Through Ctfs.—.5% | ||||||||
| WaMu Mortgage Pass Through Certificates, Ser. 2003-S4, Cl. 4A1 | 4.00 | 2/25/32 | 900,868 | 838,954 | ||||
| WaMu Mortgage Pass Through Certificates, Ser. 2004-AR9, Cl. A6 | 4.13 | 8/25/34 | 4,510,000 b | 4,412,558 | ||||
| 5,251,512 | ||||||||
| Retail—.7% | ||||||||
| Wal-Mart Stores, Sr. Unscd. Notes | 6.50 | 8/15/37 | 7,250,000 | 7,446,497 | ||||
| U.S. Government Agencies—7.8% | ||||||||
| Federal Farm Credit Banks, Bonds | 3.88 | 8/25/11 | 6,970,000 | 7,039,177 | ||||
| Federal Farm Credit Banks, Bonds | 5.25 | 9/13/10 | 3,915,000 | 4,069,521 | ||||
| Federal Home Loan Banks, Bonds | 5.33 | 3/6/12 | 5,380,000 | 5,436,458 | ||||
| Federal Home Loan Banks, Bonds | 5.65 | 4/20/22 | 8,000,000 | 8,119,408 | ||||
| Federal Home Loan Mortgage Corp., Notes | 5.38 | 1/9/14 | 4,405,000 g | 4,430,760 | ||||
| Federal Home Loan Mortgage Corp., Notes | 5.40 | 2/2/12 | 4,830,000 g | 4,870,925 | ||||
| Federal Home Loan Mortgage Corp., Notes | 5.40 | 3/2/12 | 5,165,000 g | 5,165,000 | ||||
| Federal Home Loan Mortgage Corp., Notes | 5.50 | 3/22/22 | 4,440,000 g | 4,449,204 | ||||
| Federal Home Loan Mortgage Corp., Notes | 5.90 | 6/15/22 | 6,485,000 g | 6,591,134 | ||||
| Federal National Mortgage Association, Notes | 5.25 | 3/5/14 | 13,815,000 g | 14,075,786 | ||||
| Federal National Mortgage Association, Notes | 5.38 | 4/11/22 | 6,855,000 g | 6,842,764 | ||||
| Federal National Mortgage Association, Notes | 5.50 | 7/9/10 | 6,320,000 g | 6,374,914 | ||||
| 77,465,051 | ||||||||
| U.S. Government Agencies/Mortgage-Backed—38.7% | ||||||||
| Federal Home Loan Mortgage Corp.: | ||||||||
| 4.50%, 3/1/21 | 3,715,420 g | 3,638,349 | ||||||
| 5.00%, 1/1/21 | 1,379,973 g | 1,374,419 | ||||||
| 5.00%, 6/1/28—7/1/28 | 12,459,235 d,g | 12,139,027 | ||||||
| 5.08%, 10/1/35 | 4,537,613 b,g | 4,548,175 | ||||||
| 5.50%, 3/1/35—12/1/37 | 33,010,307 g | 32,622,661 | ||||||
| 5.77%, 4/1/37 | 8,782,181 b,g | 8,953,722 | ||||||
| 6.00%, 5/1/37—12/1/37 | 26,143,968 g | 26,385,828 | ||||||
| 7.00%, 4/1/32—8/1/36 | 3,036,950 g | 3,179,933 | ||||||
| Ser. 1660, Cl. H, 6.50%, 1/15/09 | 81,104 g | 81,015 | ||||||
| Federal National Mortgage Association: | ||||||||
| 4.50%, 1/1/36 | 8,230,787 g | 7,685,675 | ||||||
| 4.58%, 3/1/35 | 3,348,093 b,g | 3,325,605 | ||||||
| 4.92%, 9/1/35 | 5,596,343 b,g | 5,593,224 | ||||||
| 4.99%, 10/1/35 | 5,259,058 b,g | 5,264,582 | ||||||
| 5.00%, 3/1/21 | 4,383,246 g | 4,391,630 | ||||||
| 5.50%, 7/1/35—3/1/38 | 70,185,284 g | 69,503,184 | ||||||
| 5.71%, 4/1/37 | 9,547,732 b,g | 9,710,559 | ||||||
The Funds 15
STATEMENT OF INVESTMENTS (continued)
| BNY Mellon Bond Fund (continued) | ||||||||
| Principal | ||||||||
| Bonds and Notes (continued) | Amount ($) | Value ($) | ||||||
| U.S. Government Agencies/Mortgage-Backed (continued) | ||||||||
| Federal National Mortgage Association (continued): | ||||||||
| 5.97%, 5/1/37 | 8,268,506 b,g | 8,369,240 | ||||||
| 6.00%, 4/1/33—6/1/38 | 48,837,398 g | 49,469,411 | ||||||
| 6.02%, 8/1/37 | 9,214,991 b,g | 9,306,938 | ||||||
| 6.50%, 4/1/17—4/1/38 | 32,857,836 g | 33,840,444 | ||||||
| 7.00%, 4/1/32—6/1/32 | 1,602,120 g | 1,688,877 | ||||||
| 7.50%, 7/1/32 | 517,065 g | 555,166 | ||||||
| Government National Mortgage Association I: | ||||||||
| 5.00%, 11/15/34—4/15/38 | 44,438,263 | 43,470,144 | ||||||
| 5.50%, 2/15/36 | 6,070,441 | 6,074,666 | ||||||
| 6.00%, 10/15/08—7/15/34 | 10,403,200 | 10,593,929 | ||||||
| 6.50%, 4/15/38 | 9,287,470 | 9,586,015 | ||||||
| 6.50%, 8/15/38 | 13,815,000 d | 14,259,082 | ||||||
| 7.00%, 5/15/23—11/15/23 | 533,823 | 569,523 | ||||||
| 9.00%, 12/15/09 | 73,338 | 73,738 | ||||||
| 7.00%, 12/15/23 | 291,423 | 310,913 | ||||||
| 386,565,674 | ||||||||
| U.S. Government Securities—24.9% | ||||||||
| U.S. Treasury Bonds: | ||||||||
| 4.50%, 2/15/36 | 5,920,000 c | 5,981,053 | ||||||
| 6.25%, 8/15/23 | 7,620,000 c | 9,190,436 | ||||||
| U.S. Treasury Inflation Protected Securities: | ||||||||
| Bonds, 2.38%, 1/15/27 | 9,891,500 c,e | 10,237,712 | ||||||
| Notes, 1.38%, 7/15/18 | 9,225,034 e | 8,994,417 | ||||||
| Notes, 2.38%, 1/15/17 | 9,913,180 c,e | 10,523,465 | ||||||
| U.S. Treasury Notes: | ||||||||
| 3.88%, 5/15/18 | 19,410,000 c | 19,529,799 | ||||||
| 4.00%, 11/15/12 | 31,000,000 c | 32,399,867 | ||||||
| 4.25%, 8/15/13 | 23,500,000 c | 24,770,481 | ||||||
| 4.25%, 11/15/13 | 24,080,000 c | 25,415,694 | ||||||
| 4.50%, 5/15/17 | 21,935,000 c | 23,233,969 | ||||||
| 4.63%, 8/31/11 | 22,285,000 c | 23,576,839 | ||||||
| 4.63%, 2/29/12 | 30,245,000 c | 32,116,440 | ||||||
| 4.75%, 8/15/17 | 775,000 c | 835,063 | ||||||
| 5.13%, 5/15/16 | 19,680,000 c | 21,790,995 | ||||||
| 248,596,230 | ||||||||
| Utilities—.2% | ||||||||
| Southern California Edison, | ||||||||
| First Mortgage Bonds, Ser. 04-F | 4.65 | 4/1/15 | 2,200,000 | 2,152,524 | ||||
| Total Bonds and Notes | ||||||||
| (cost $985,348,734) | 989,081,182 | |||||||
| Other Investment—3.1% | Shares | Value ($) | ||||||
| Registered Investment Company; | ||||||||
| Dreyfus Institutional Preferred Plus Money Market Fund | ||||||||
| (cost $30,664,000) | 30,664,000 f | 30,664,000 | ||||||
16
| BNY Mellon Bond Fund (continued) | ||||
| Investment of Cash Collateral for Securities Loaned—18.5% | Shares | Value ($) | ||
| Registered Investment Company; | ||||
| Dreyfus Institutional Cash Advantage Plus Fund | ||||
| (cost $184,599,122) | 184,599,122 f | 184,599,122 | ||
| Total Investments (cost $1,200,611,856) | 120.6% | 1,204,344,304 | ||
| Liabilities, Less Cash and Receivables | (20.6%) | (205,451,255) | ||
| Net Assets | 100.0% | 998,893,049 | ||
| a Securities exempt from registration under Rule 144A of the Securities Act of 1933.These securities may be resold in transactions exempt from registration, normally to qualified |
| institutional buyers.At August 31, 2008, these securities amounted to $15,432,356 or 1.5% of net assets. |
| b Variable rate security—interest rate subject to periodic change. |
| c All or a portion of these securities are on loan.At August 31, 2008, the total market value of the fund’s securities on loan is $210,406,857 and the total market value of the |
| collateral held by the fund is $227,609,527, consisting of cash collateral of $184,599,122, U.S. Government and Agency securities valued at $33,561,605, and letters of credit |
| valued at $9,448,800. |
| d Purchased on a delayed delivery basis. |
| e Principal amount for accrual purposes is periodically adjusted based on changes in the Consumer Price Index. |
| f Investment in affiliated money market mutual fund. |
| g On September 7, 2008, the Federal Housing Finance Agency (FHFA) placed Federal National Mortgage Association and Federal Home Loan Mortgage Corporation into |
| conservatorship with FHFA as the conservator. |
| Portfolio Summary (Unaudited)† | ||||||
| Value (%) | Value (%) | |||||
| U.S. Government & Agencies | 71.4 | Asset/Mortgage-Backed | 6.3 | |||
| Money Market Investments | 21.6 | Foreign/Governmental | 1.1 | |||
| Corporate Bonds | 20.2 | 120.6 | ||||
| † Based on net assets. |
| See notes to financial statements. |
The Funds 17
| STATEMENT OF INVESTMENTS |
| August 31, 2008 |
| BNY Mellon Intermediate Bond Fund | ||||||||
| Coupon | Maturity | Principal | ||||||
| Bonds and Notes—100.2% | Rate (%) | Date | Amount ($) | Value ($) | ||||
| Asset-Backed Ctfs./Auto Receivables—3.0% | ||||||||
| Harley-Davidson Motorcycle Trust, Ser. 2005-3, Cl. A2 | 4.41 | 6/15/12 | 1,768,959 | 1,775,732 | ||||
| Harley-Davidson Motorcycle Trust, Ser. 2007-1, Cl. A4 | 5.21 | 6/17/13 | 2,020,000 | 2,037,542 | ||||
| Honda Auto Receivables Owner Trust, Ser. 2007-1, Cl. A4 | 5.09 | 7/18/13 | 2,395,000 | 2,419,428 | ||||
| Honda Auto Receivables Owner Trust, Ser. 2006-3, Cl. A4 | 5.11 | 4/15/12 | 4,670,000 | 4,699,314 | ||||
| Household Automotive Trust, Ser. 2007-1, Cl. A4 | 5.33 | 11/17/13 | 2,125,000 | 2,061,509 | ||||
| Hyundai Auto Receivables Trust, Ser. 2006-B, Cl. A4 | 5.15 | 5/15/13 | 2,680,000 | 2,689,593 | ||||
| Nissan Auto Lease Trust, Ser. 2006-A, Cl. A4 | 5.10 | 7/16/12 | 6,575,000 | 6,530,982 | ||||
| Onyx Acceptance Grantor Trust, Ser. 2005-A, Cl. A4 | 3.91 | 9/15/11 | 1,611,476 | 1,571,309 | ||||
| 23,785,409 | ||||||||
| Asset-Backed Ctfs./Other—.5% | ||||||||
| CIT Equipment Collateral, Ser. 2006-VT2, Cl. A4 | 5.05 | 4/20/14 | 3,185,000 | 3,192,006 | ||||
| CNH Equipment Trust, Ser. 2005-A, Cl. A4B | 4.29 | 6/15/12 | 940,419 | 942,762 | ||||
| 4,134,768 | ||||||||
| Automotive, Trucks & Parts—.7% | ||||||||
| Johnson Controls, Sr. Unscd. Notes | 5.25 | 1/15/11 | 5,080,000 | 5,150,267 | ||||
| Johnson Controls, Sr. Unscd. Notes | 5.50 | 1/15/16 | 635,000 | 618,372 | ||||
| 5,768,639 | ||||||||
| Bank & Finance—14.4% | ||||||||
| Agua Caliente Band of Cahuilla Indians, Sr. Scd. Notes | 6.08 | 10/1/16 | 1,965,000 a | 1,944,564 | ||||
| Agua Caliente Band of Cahuilla Indians, Scd. Notes | 6.35 | 10/1/15 | 990,000 a | 949,915 | ||||
| Agua Caliente Band of Cahuilla Indians, Sr. Scd. Notes | 6.44 | 10/1/16 | 2,185,000 a | 2,162,276 | ||||
| AXA Financial, Unscd. Notes | 7.75 | 8/1/10 | 3,625,000 | 3,795,506 | ||||
| Bank of America, Sub. Notes | 5.42 | 3/15/17 | 8,900,000 | 7,924,186 | ||||
| BankAmerica Capital II, Bank Gtd. Secs., Ser. 2 | 8.00 | 12/15/26 | 4,975,000 | 4,855,814 | ||||
| Bear Stearns, Sr. Unscd. Notes | 4.50 | 10/28/10 | 3,200,000 | 3,194,109 | ||||
| Caterpillar Financial Services, Sr. Unscd. Notes | 5.05 | 12/1/10 | 4,975,000 | 5,129,847 | ||||
| CIT Group, Sr. Unscd. Notes | 5.40 | 3/7/13 | 3,730,000 | 2,825,796 | ||||
| Citigroup, Sub. Notes | 5.00 | 9/15/14 | 4,400,000 | 3,942,070 | ||||
| Citigroup, Sr. Unscd. Notes | 6.13 | 11/21/17 | 2,840,000 b | 2,675,175 | ||||
| Countrywide Home Loan, Gtd. Notes, Ser. K | 5.63 | 7/15/09 | 2,380,000 | 2,327,302 | ||||
| Countrywide Home Loan, Gtd. Notes, Ser. H | 6.25 | 4/15/09 | 1,200,000 b | 1,188,188 | ||||
| Daimler Finance North America, Gtd. Notes | 6.50 | 11/15/13 | 3,935,000 | 3,913,566 | ||||
| General Electric Capital, Sr. Unscd. Notes, Ser. A | 5.88 | 2/15/12 | 5,265,000 | 5,439,014 | ||||
| Goldman Sachs Group, Sr. Unscd. Notes | 4.75 | 7/15/13 | 5,400,000 | 5,194,049 | ||||
| HSBC Finance, Sr. Unscd. Notes | 6.38 | 11/27/12 | 8,108,000 | 8,296,762 | ||||
| International Lease Finance, Sr. Unscd. Notes | 5.75 | 6/15/11 | 7,205,000 | 6,590,882 | ||||
| John Deere Capital, Sr. Unscd. Notes | 7.00 | 3/15/12 | 5,805,000 | 6,268,407 |
18
| BNY Mellon Intermediate Bond Fund (continued) | ||||||||
| Coupon | Maturity | Principal | ||||||
| Bonds and Notes (continued) | Rate (%) | Date | Amount ($) | Value ($) | ||||
| Bank & Finance (continued) | ||||||||
| JPMorgan Chase & Co., Sr. Unscd. Notes | 5.38 | 10/1/12 | 4,110,000 | 4,081,546 | ||||
| Merrill Lynch & Co., Notes | 5.45 | 2/5/13 | 7,580,000 | 7,076,142 | ||||
| Morgan Stanley, Sr. Unscd. Notes | 6.75 | 4/15/11 | 5,895,000 | 6,007,441 | ||||
| NYSE Euronext, Sr. Unscd. Notes | 4.80 | 6/28/13 | 5,305,000 | 5,249,218 | ||||
| Prudential Financial, Sr. Unscd. Notes | 6.00 | 12/1/17 | 3,295,000 | 3,165,938 | ||||
| Wachovia, Sub. Notes | 6.38 | 2/1/09 | 4,000,000 | 3,986,440 | ||||
| Wells Fargo & Co., Sub. Notes | 6.38 | 8/1/11 | 5,240,000 | 5,469,491 | ||||
| 113,653,644 | ||||||||
| Building & Construction—.6% | ||||||||
| CRH America, Gtd. Notes | 5.30 | 10/15/13 | 4,930,000 | 4,566,161 | ||||
| Commercial & Professional Services—.9% | ||||||||
| Seminole Tribe of Florida, Notes | 5.80 | 10/1/13 | 6,765,000 a | 6,815,095 | ||||
| Commercial Mortgage Pass-Through Ctfs.—.7% | ||||||||
| LB-UBS Commercial Mortgage Trust, Ser. 2007-C2, Cl. A2 | 5.30 | 2/15/40 | 6,125,000 | 5,894,317 | ||||
| Food & Beverages—2.1% | ||||||||
| Coca-Cola, Sr. Unscd. Notes | 5.35 | 11/15/17 | 4,880,000 | 4,962,911 | ||||
| Diageo Finance, Gtd. Notes | 5.50 | 4/1/13 | 4,275,000 | 4,381,550 | ||||
| McDonald’s, Sr. Unscd. Notes | 5.80 | 10/15/17 | 4,460,000 | 4,594,875 | ||||
| Pepsico, Sr. Unscd. Notes | 4.65 | 2/15/13 | 2,355,000 b | 2,412,410 | ||||
| 16,351,746 | ||||||||
| Foreign/Governmental—1.3% | ||||||||
| Hydro-Quebec, Gov’t. Gtd. Bonds, Ser. IF | 8.00 | 2/1/13 | 3,200,000 | 3,712,877 | ||||
| Nova Scotia Province, Bonds | 5.13 | 1/26/17 | 5,430,000 | 5,630,617 | ||||
| United Mexican States, Sr. Unscd. Notes | 6.63 | 3/3/15 | 1,064,000 | 1,143,800 | ||||
| 10,487,294 | ||||||||
| Health Care—1.9% | ||||||||
| Aetna, Sr. Unscd. Notes | 5.75 | 6/15/11 | 4,245,000 | 4,307,996 | ||||
| Astrazeneca, Sr. Unscd. Notes | 5.40 | 9/15/12 | 4,700,000 | 4,858,291 | ||||
| GlaxoSmithKline Capital, Gtd. Notes | 4.85 | 5/15/13 | 5,855,000 | 5,904,732 | ||||
| 15,071,019 | ||||||||
| Industrials—2.6% | ||||||||
| Devon Financing, Gtd. Notes | 6.88 | 9/30/11 | 4,575,000 | 4,863,618 | ||||
| Emerson Electric, Sr. Unscd. Notes | 4.63 | 10/15/12 | 3,000,000 | 3,045,888 | ||||
| Progress Energy, Sr. Unscd. Notes | 6.85 | 4/15/12 | 4,398,000 | 4,641,808 | ||||
| Vulcan Materials, Sr. Unscd. Notes | 5.60 | 11/30/12 | 5,710,000 | 5,574,547 | ||||
| XTO Energy, Sr. Unscd. Notes | 5.50 | 6/15/18 | 2,565,000 | 2,383,829 | ||||
| 20,509,690 |
The Funds 19
STATEMENT OF INVESTMENTS (continued)
| BNY Mellon Intermediate Bond Fund (continued) | ||||||||
| Coupon | Maturity | Principal | ||||||
| Bonds and Notes (continued) | Rate (%) | Date | Amount ($) | Value ($) | ||||
| Media & Telecommunications—6.2% | ||||||||
| British Sky Broadcasting, Gtd. Notes | 6.88 | 2/23/09 | 4,280,000 | 4,330,795 | ||||
| Cisco Systems, Sr. Unscd. Notes | 5.50 | 2/22/16 | 7,135,000 b | 7,260,697 | ||||
| Comcast, Gtd. Notes | 5.90 | 3/15/16 | 5,135,000 | 5,025,506 | ||||
| News America, Gtd. Notes | 5.30 | 12/15/14 | 5,260,000 | 5,204,370 | ||||
| SBC Communications, Sr. Unscd. Notes | 5.88 | 8/15/12 | 5,045,000 | 5,219,986 | ||||
| Time Warner, Gtd. Notes | 5.50 | 11/15/11 | 6,625,000 | 6,558,207 | ||||
| Time Warner, Gtd. Notes | 6.75 | 7/1/18 | 2,985,000 | 3,018,990 | ||||
| Verizon Global Funding, Sr. Unscd. Notes | 7.25 | 12/1/10 | 5,525,000 | 5,858,693 | ||||
| Vodafone Group, Sr. Unscd. Notes | 7.75 | 2/15/10 | 6,165,000 | 6,452,437 | ||||
| 48,929,681 | ||||||||
| Real Estate Investment Trusts—1.8% | ||||||||
| ERP Operating, Sr. Unscd. Notes | 6.95 | 3/2/11 | 3,280,000 | 3,356,821 | ||||
| Mack-Cali Realty, Sr. Unscd. Notes | 7.75 | 2/15/11 | 5,280,000 | 5,513,434 | ||||
| Simon Property Group, Sr. Unscd. Notes | 5.75 | 5/1/12 | 5,680,000 | 5,622,802 | ||||
| 14,493,057 | ||||||||
| Retailing—1.4% | ||||||||
| Wal-Mart Stores, Sr. Unscd. Notes | 4.55 | 5/1/13 | 4,675,000 | 4,767,616 | ||||
| Xerox, Sr. Unscd. Notes | 5.50 | 5/15/12 | 6,090,000 | 6,053,941 | ||||
| 10,821,557 | ||||||||
| Software & Services—1.5% | ||||||||
| Intuit, Sr. Unscd. Notes | 5.40 | 3/15/12 | 5,115,000 | 5,099,773 | ||||
| Oracle, Sr. Unscd. Notes | 5.75 | 4/15/18 | 7,000,000 | 7,032,802 | ||||
| 12,132,575 | ||||||||
| Transportation—.4% | ||||||||
| United Parcel Service, Sr. Unscd. Notes | 4.50 | 1/15/13 | 2,725,000 | 2,758,790 | ||||
| U.S. Government Agencies—21.6% | ||||||||
| Federal Farm Credit Banks, Bonds | 2.63 | 4/21/11 | 11,000,000 | 10,781,749 | ||||
| Federal Farm Credit Banks, Bonds | 3.40 | 2/7/13 | 15,800,000 | 15,485,754 | ||||
| Federal Farm Credit Banks, Bonds | 3.88 | 8/25/11 | 7,895,000 | 7,973,358 | ||||
| Federal Farm Credit Banks, Bonds | 4.75 | 5/7/10 | 10,375,000 | 10,669,619 | ||||
| Federal Farm Credit Banks, Bonds | 5.00 | 10/23/09 | 11,780,000 | 12,042,305 | ||||
| Federal Farm Credit Banks, Bonds | 5.25 | 9/13/10 | 6,770,000 | 7,037,205 | ||||
| Federal Home Loan Banks, Bonds | 3.50 | 7/16/10 | 5,245,000 | 5,283,404 | ||||
| Federal Home Loan Banks, Bonds | 4.25 | 6/14/13 | 7,500,000 | 7,598,220 | ||||
| Federal Home Loan Banks, Bonds | 5.00 | 12/11/09 | 6,460,000 | 6,618,102 |
20
| BNY Mellon Intermediate Bond Fund (continued) | ||||||||
| Coupon | Maturity | Principal | ||||||
| Bonds and Notes (continued) | Rate (%) | Date | Amount ($) | Value ($) | ||||
| U.S. Government Agencies (continued) | ||||||||
| Federal Home Loan Banks, Bonds | 5.13 | 9/10/10 | 7,315,000 | 7,599,107 | ||||
| Federal Home Loan Banks, Bonds | 5.25 | 11/3/09 | 7,500,000 | 7,527,915 | ||||
| Federal Home Loan Mortgage Corp., Notes | 5.25 | 9/3/10 | 8,355,000 f | 8,355,485 | ||||
| Federal Home Loan Mortgage Corp., Notes | 5.38 | 1/9/14 | 7,655,000 f | 7,699,767 | ||||
| Federal Home Loan Mortgage Corp., Notes | 5.40 | 2/2/12 | 7,900,000 f | 7,966,937 | ||||
| Federal Home Loan Mortgage Corp., Notes | 5.40 | 3/2/12 | 6,635,000 f | 6,635,000 | ||||
| Federal National Mortgage Association, Notes | 4.75 | 3/12/10 | 20,270,000 f | 20,782,953 | ||||
| Federal National Mortgage Association, Notes | 5.10 | 9/10/09 | 8,065,000 f | 8,068,395 | ||||
| Federal National Mortgage Association, Notes | 5.25 | 3/5/14 | 11,855,000 f | 12,078,787 | ||||
| 170,204,062 | ||||||||
| U.S. Government Agencies/Mortgage-Backed—.2% | ||||||||
| Federal Home Loan Mortgage Corp., | ||||||||
| 6.85%, 11/1/32 | 134,753 c,f | 136,128 | ||||||
| REMIC, Ser. 2134, Cl. PM, 5.50%, 3/15/14 | 1,051,503 f | 1,075,360 | ||||||
| 1,211,488 | ||||||||
| U.S. Government Securities—38.4% | ||||||||
| Federal National Mortgage Association, Notes, 4.88%, 12/15/16 | 8,420,000 f | 8,643,147 | ||||||
| U.S. Treasury Inflation Protected Securities: | ||||||||
| Notes, 1.38%, 7/15/18 | 7,886,897 d | 7,689,733 | ||||||
| Notes, 2.38%, 1/15/17 | 15,067,600 b,d | 15,995,207 | ||||||
| U.S. Treasury Notes: | ||||||||
| 2.38%, 8/31/10 | 11,415,000 | 11,420,354 | ||||||
| 3.88%, 5/15/18 | 9,890,000 b | 9,951,041 | ||||||
| 4.13%, 8/15/10 | 23,335,000 b | 24,160,849 | ||||||
| 4.25%, 1/15/11 | 33,055,000 b | 34,493,421 | ||||||
| 4.25%, 8/15/13 | 22,000,000 b | 23,189,386 | ||||||
| 4.25%, 11/15/13 | 11,640,000 b | 12,285,659 | ||||||
| 4.50%, 11/15/15 | 20,505,000 b | 21,954,786 | ||||||
| 4.63%, 8/31/11 | 25,780,000 b | 27,274,441 | ||||||
| 4.63%, 2/29/12 | 24,860,000 b | 26,398,237 | ||||||
| 4.63%, 11/15/16 | 3,420,000 b | 3,664,479 | ||||||
| 4.75%, 2/15/10 | 6,300,000 b | 6,535,267 | ||||||
| 4.88%, 8/15/16 | 19,085,000 b | 20,774,328 | ||||||
| 5.13%, 5/15/16 | 32,825,000 b | 36,346,007 | ||||||
| 6.00%, 8/15/09 | 10,500,000 b | 10,874,892 | ||||||
| 301,651,234 | ||||||||
| Total Bonds and Notes | ||||||||
| (cost $781,186,685) | 789,240,226 | |||||||
The Funds 21
STATEMENT OF INVESTMENTS (continued)
| BNY Mellon Intermediate Bond Fund (continued) | ||||
| Other Investment—.7% | Shares | Value ($) | ||
| Registered Investment Company; | ||||
| Dreyfus Institutional Preferred Plus Money Market Fund | ||||
| (cost $5,259,000) | 5,259,000 e | 5,259,000 | ||
| Investment of Cash Collateral for Securities Loaned—27.2% | ||||
| Registered Investment Company; | ||||
| Dreyfus Institutional Cash Advantage Plus Fund | ||||
| (cost $214,186,808) | 214,186,808 e | 214,186,808 | ||
| Total Investments (cost $1,000,632,493) | 128.1% | 1,008,686,034 | ||
| Liabilities, Less Cash and Receivables | (28.1%) | (221,229,416) | ||
| Net Assets | 100.0% | 787,456,618 | ||
| a Securities exempt from registration under Rule 144A of the Securities Act of 1933.These securities may be resold in transactions exempt from registration, normally to qualified |
| institutional buyers.At August 31, 2008, these securities amounted to $11,871,850 or 1.5% of net assets. |
| b All or a portion of these securities are on loan.At August 31, 2008, the total market value of the fund’s securities on loan is $267,061,747 and the total market value of the |
| collateral held by the fund is $274,956,650, consisting of cash collateral of $214,186,808 and U.S. Government and Agency securities valued at $60,769,842. |
| c Variable rate security—interest rate subject to periodic change. |
| d Principal amount for accrual purposes is periodically adjusted based on changes in the Consumer Price Index. |
| e Investment in affiliated money market mutual fund. |
| f On September 7, 2008, the Federal Housing Finance Agency (FHFA) placed Federal National Mortgage Association and Federal Home Loan Mortgage Corporation into |
| conservatorship with FHFA as the conservator. |
| Portfolio Summary (Unaudited)† | ||||||
| Value (%) | Value (%) | |||||
| U.S. Government & Agencies | 60.2 | Asset/Mortgage-Backed | 4.3 | |||
| Corporate Bonds | 34.4 | Foreign/Governmental | 1.3 | |||
| Money Market Investments | 27.9 | 128.1 | ||||
| † Based on net assets. |
| See notes to financial statements. |
22
| STATEMENT OF INVESTMENTS |
| August 31, 2008 |
| BNY Mellon Short-Term U.S. Government Securities Fund | ||||||||
| Coupon | Maturity | Principal | ||||||
| Bonds and Notes—98.1% | Rate (%) | Date | Amount ($) | Value ($) | ||||
| U.S. Government Agencies—34.0% | ||||||||
| Federal Farm Credit Banks, Bonds | 2.63 | 4/21/11 | 4,000,000 | 3,920,636 | ||||
| Federal Farm Credit Banks, Bonds | 3.00 | 3/3/11 | 4,195,000 | 4,157,308 | ||||
| Federal Farm Credit Banks, Bonds | 3.75 | 12/6/10 | 3,525,000 | 3,560,289 | ||||
| Federal Farm Credit Banks, Bonds | 3.88 | 8/25/11 | 1,400,000 | 1,413,895 | ||||
| Federal Farm Credit Banks, Bonds | 4.63 | 11/19/10 | 1,325,000 | 1,329,750 | ||||
| Federal Farm Credit Banks, Bonds | 4.75 | 5/7/10 | 1,440,000 | 1,480,892 | ||||
| Federal Farm Credit Banks, Bonds | 5.25 | 9/13/10 | 1,490,000 | 1,548,809 | ||||
| Federal Home Loan Banks, Unscd. Bonds | 2.38 | 4/30/10 | 1,885,000 | 1,864,352 | ||||
| Federal Home Loan Banks, Bonds | 4.38 | 10/22/10 | 4,060,000 | 4,152,353 | ||||
| Federal Home Loan Banks, Bonds | 5.00 | 10/16/09 | 1,300,000 | 1,303,137 | ||||
| Federal Home Loan Banks, Bonds | 5.25 | 11/3/09 | 1,250,000 | 1,254,653 | ||||
| Federal Home Loan Mortgage Corp., Notes | 4.13 | 11/30/09 | 1,860,000 d | 1,884,617 | ||||
| Federal Home Loan Mortgage Corp., Notes | 5.00 | 10/1/10 | 4,030,000 d | 4,036,762 | ||||
| Federal National Mortgage Association, Notes | 3.88 | 12/10/09 | 3,400,000 d | 3,438,842 | ||||
| Federal National Mortgage Association, Notes | 5.00 | 10/15/10 | 4,265,000 d | 4,275,168 | ||||
| Federal National Mortgage Association, Notes | 5.50 | 7/9/10 | 5,835,000 d | 5,885,700 | ||||
| 45,507,163 | ||||||||
| U.S. Government Agencies/Mortgage-Backed—4.2% | ||||||||
| Federal Home Loan Mortgage Corp.: | ||||||||
| 3.50%, 9/1/08 | 160,359 d | 160,148 | ||||||
| 4.00%, 3/1/10 | 705,252 d | 704,264 | ||||||
| 5.00%, 4/1/09 | 76,281 d | 77,090 | ||||||
| 6.85%, 11/1/32 | 33,688 a,d | 34,032 | ||||||
| REMIC, Ser. 2638, Cl. NC, 3.00%, 5/15/22 | 65,176 d | 65,092 | ||||||
| REMIC, Ser. 2495, Cl. UC, 5.00%, 7/15/32 | 102,497 d | 102,338 | ||||||
| REMIC, Ser. 1648, Cl. E, 6.00%, 9/15/23 | 1,171,494 d | 1,185,269 | ||||||
| REMIC, Ser. 1961, Cl. H, 6.50%, 5/15/12 | 183,307 d | 185,252 | ||||||
| Federal National Mortgage Association: | ||||||||
| 4.50%, 1/1/10 | 176,276 d | 177,805 | ||||||
| 4.89%, 5/1/32 | 34,927 a,d | 34,849 | ||||||
| 4.92%, 3/1/32 | 16,143 a,d | 16,058 | ||||||
| 5.13%, 6/1/32 | 134,975 a,d | 138,471 | ||||||
| 5.28%, 6/1/32 | 171,433 a,d | 173,857 | ||||||
| 5.31%, 4/1/32 | 8,217 a,d | 8,330 | ||||||
| 5.50%, 6/1/09 | 31,695 d | 32,170 | ||||||
| REMIC, Ser. 2002-73, Cl. AM, 5.00%, 12/25/15 | 1,851,451 d | 1,856,788 | ||||||
| REMIC, Ser. 1994-86, Cl. PJ 6.00%, 6/25/09 | 287,392 d | 288,357 | ||||||
| Whole Loan, Ser. 2003-W19, Cl. 1A4, 4.78%, 11/25/33 | 358,645 d | 357,842 | ||||||
| Government National Mortgage Association I | ||||||||
| 6.00%, 12/15/08—4/15/09 | 81,209 | 82,722 | ||||||
| 5,680,734 | ||||||||
| U.S. Government Securities—59.9% | ||||||||
| U.S. Treasury Notes: | ||||||||
| 2.75%, 7/31/10 | 3,440,000 b | 3,469,027 | ||||||
| 3.50%, 2/15/10 | 6,750,000 b | 6,885,007 | ||||||
| 4.13%, 8/15/10 | 10,335,000 b | 10,700,766 | ||||||
The Funds 23
STATEMENT OF INVESTMENTS (continued)
| BNY Mellon Short-Term U.S. Government Securities Fund (continued) | ||||
| Principal | ||||
| Bonds and Notes (continued) | Amount ($) | Value ($) | ||
| U.S. Government Securities (continued) | ||||
| U.S. Treasury Notes (continued): | ||||
| 4.25%, 1/15/11 | 9,000,000 b | 9,391,644 | ||
| 4.38%, 12/15/10 | 9,000,000 b | 9,395,163 | ||
| 4.50%, 5/15/10 | 3,190,000 b | 3,313,865 | ||
| 4.50%, 11/15/10 | 8,185,000 b | 8,561,641 | ||
| 4.63%, 8/31/11 | 10,275,000 b | 10,870,631 | ||
| 5.75%, 8/15/10 | 9,000,000 | 9,592,740 | ||
| 6.50%, 2/15/10 | 7,620,000 b | 8,097,446 | ||
| 80,277,930 | ||||
| Total Bonds and Notes | ||||
| (cost $129,699,260) | 131,465,827 | |||
| Other Investment—4.4% | Shares | Value ($) | ||
| Registered Investment Company; | ||||
| Dreyfus Institutional Preferred Plus Money Market Fund | ||||
| (cost $5,831,000) | 5,831,000 c | 5,831,000 | ||
| Investment of Cash Collateral for Securities Loaned—43.2% | ||||
| Registered Investment Company; | ||||
| Dreyfus Institutional Cash Advantage Plus Fund | ||||
| (cost $57,865,887) | 57,865,887 c | 57,865,887 | ||
| Total Investments (cost $193,396,147) | 145.7% | 195,162,714 | ||
| Liabilities, Less Cash and Receivables | (45.7%) | (61,212,105) | ||
| Net Assets | 100.0% | 133,950,609 | ||
| a Variable rate security—interest rate subject to periodic change. |
| b All or a portion of these securities are on loan.At August 31, 2008, the total market value of the fund’s securities on loan is $57,552,773 and the total market value of the |
| collateral held by the fund is $58,947,384, consisting of cash collateral of $57,865,887 and U.S. Government and agency securities valued at $1,081,497. |
| c Investment in affiliated money market mutual fund. |
| d On September 7, 2008, the Federal Housing Finance Agency (FHFA) placed Federal National Mortgage Association and Federal Home Loan Mortgage Corporation into |
| conservatorship with FHFA as the conservator. |
| Portfolio Summary (Unaudited)† | ||||||
| Value (%) | Value (%) | |||||
| U.S. Government & Agencies | 98.1 | Money Market Investments | 47.6 | |||
| 145.7 |
| † Based on net assets. |
| See notes to financial statements. |
24
| STATEMENTS OF ASSETS AND LIABILITIES |
| August 31, 2008 |
| BNY Mellon | ||||||
| BNY Mellon | BNY Mellon | Short-Term | ||||
| Bond | Intermediate | U.S. Government | ||||
| Fund | Bond Fund | Securities Fund | ||||
| Assets ($): | ||||||
| Investments in securities—See Statement of Investments†—Note 2(c) | ||||||
| (including securities loaned)††—Note 2(b): | ||||||
| Unaffiliated issuers | 989,081,182 | 789,240,226 | 131,465,827 | |||
| Affiliated issuers | 215,263,122 | 219,445,808 | 63,696,887 | |||
| Receivable for investment securities sold | 22,493,384 | — | — | |||
| Dividend and interest receivable | 10,492,395 | 9,908,669 | 1,262,790 | |||
| Receivable for shares of Beneficial Interest subscribed | 817,684 | 20,700 | 250,000 | |||
| Prepaid expenses | 21,764 | 24,923 | 20,863 | |||
| 1,238,169,531 | 1,018,640,326 | 196,696,367 | ||||
| Liabilities ($): | ||||||
| Due to The Dreyfus Corporation and affiliates—Note 4(b) | 362,499 | 285,543 | 46,641 | |||
| Due to Administrator—Note 4(a) | 109,016 | 86,308 | 14,482 | |||
| Cash overdraft due to Custodian | 3,197,632 | 2,099,214 | 259,113 | |||
| Liability for securities on loan—Note 2(b) | 184,599,122 | 214,186,808 | 57,865,887 | |||
| Payable for investment securities purchased | 50,346,793 | 13,528,037 | 4,499,462 | |||
| Payable for shares of Beneficial Interest redeemed | 621,042 | 956,813 | 27,598 | |||
| Accrued expenses | 40,378 | 40,985 | 32,575 | |||
| 239,276,482 | 231,183,708 | 62,745,758 | ||||
| Net Assets ($) | 998,893,049 | 787,456,618 | 133,950,609 | |||
| Composition of Net Assets ($): | ||||||
| Paid-in capital | 1,015,530,952 | 801,112,493 | 142,295,864 | |||
| Accumulated undistributed investment income—net | 1,142,719 | 1,076,964 | 93,282 | |||
| Accumulated net realized gain (loss) on investments | (21,513,070) | (22,786,380) | (10,205,104) | |||
| Accumulated net unrealized appreciation | ||||||
| (depreciation) on investments | 3,732,448 | 8,053,541 | 1,766,567 | |||
| Net Assets ($) | 998,893,049 | 787,456,618 | 133,950,609 | |||
| Net Asset Value Per Share | ||||||
| Class M Shares | ||||||
| Net Assets ($) | 995,421,394 | 785,840,958 | 133,856,732 | |||
| Shares Outstanding | 80,380,098 | 63,549,763 | 10,978,869 | |||
| Net Asset Value Per Share ($) | 12.38 | 12.37 | 12.19 | |||
| Investor Shares | ||||||
| Net Assets ($) | 3,471,655 | 1,615,660 | 93,877 | |||
| Shares Outstanding | 280,805 | 130,690 | 7,697 | |||
| Net Asset Value Per Share ($) | 12.36 | 12.36 | 12.20 | |||
| † Investments at cost ($): | ||||||
| Unaffiliated issuers | 985,348,734 | 781,186,685 | 129,699,260 | |||
| Affiliated issuers | 215,263,122 | 219,445,808 | 63,696,887 | |||
| †† Value of securities loaned ($) | 210,406,857 | 267,061,747 | 57,552,773 |
See notes to financial statements.
The Funds 25
| STATEMENTS OF OPERATIONS |
| Year Ended August 31, 2008 |
| BNY Mellon | ||||||
| BNY Mellon | BNY Mellon | Short-Term | ||||
| Bond | Intermediate | U.S. Government | ||||
| Fund | Bond Fund | Securities Fund | ||||
| Investment Income ($): | ||||||
| Income: | ||||||
| Interest | 51,040,581 | 37,727,531 | 5,331,165 | |||
| Income from securities lending | 1,110,976 | 1,495,648 | 302,928 | |||
| Dividends; | ||||||
| Affiliated issuers | 399,872 | 333,921 | 81,500 | |||
| Total Income | 52,551,429 | 39,557,100 | 5,715,593 | |||
| Expenses: | ||||||
| Investment advisory fee—Note 4(a) | 3,945,186 | 3,174,533 | 460,791 | |||
| Administration fee—Note 4(a) | 1,257,409 | 1,011,823 | 167,839 | |||
| Custodian fees—Note 4(b) | 72,620 | 59,576 | 11,862 | |||
| Trustees’ fees and expenses—Note 4(c) | 37,360 | 31,858 | 5,625 | |||
| Professional fees | 33,404 | 27,817 | 34,002 | |||
| Registration fees | 25,381 | 27,085 | 20,309 | |||
| Prospectus and shareholders’ reports | 12,417 | 11,333 | 7,903 | |||
| Shareholder servicing costs—Note 4(b) | 11,021 | 4,527 | 554 | |||
| Miscellaneous | 35,477 | 31,739 | 18,708 | |||
| Total Expenses | 5,430,275 | 4,380,291 | 727,593 | |||
| Less—reduction in fees due to earnings credits—Note 2(b) | (600) | (513) | (126) | |||
| Net Expenses | 5,429,675 | 4,379,778 | 727,467 | |||
| Investment Income—Net | 47,121,754 | 35,177,322 | 4,988,126 | |||
| Realized and Unrealized Gain (Loss) on Investments—Note 5 ($): | ||||||
| Net realized gain (loss) on investments | 6,283,577 | 5,518,623 | 1,045,781 | |||
| Net unrealized appreciation (depreciation) on investments | 5,224,152 | 6,356,485 | 1,405,504 | |||
| Net Realized and Unrealized Gain (Loss) on Investments | 11,507,729 | 11,875,108 | 2,451,285 | |||
| Net Increase in Net Assets Resulting from Operations | 58,629,483 | 47,052,430 | 7,439,411 |
See notes to financial statements.
26
STATEMENTS OF CHANGES IN NET ASSETS
| BNY Mellon Bond Fund | BNY Mellon Intermediate Bond Fund | |||||||
| Year Ended August 31, | Year Ended August 31, | |||||||
| 2008 | 2007 | 2008 | 2007 | |||||
| Operations ($): | ||||||||
| Investment income—net | 47,121,754 | 42,539,452 | 35,177,322 | 30,017,411 | ||||
| Net realized gain (loss) on investments | 6,283,577 | (5,725,505) | 5,518,623 | (1,245,819) | ||||
| Net unrealized appreciation (depreciation) on investments | 5,224,152 | 8,185,985 | 6,356,485 | 6,587,764 | ||||
| Net Increase (Decrease) in Net Assets | ||||||||
| Resulting from Operations | 58,629,483 | 44,999,932 | 47,052,430 | 35,359,356 | ||||
| Dividends to Shareholders from ($): | ||||||||
| Investment income—net: | ||||||||
| Class M Shares | (47,780,845) | (44,179,220) | (36,721,118) | (32,341,234) | ||||
| Investor Shares | (188,423) | (167,461) | (67,882) | (47,297) | ||||
| Total Dividends | (47,969,268) | (44,346,681) | (36,789,000) | (32,388,531) | ||||
| Beneficial Interest Transactions ($): | ||||||||
| Net proceeds from shares sold: | ||||||||
| Class M Shares | 221,829,437 | 224,083,407 | 198,388,346 | 189,209,805 | ||||
| Investor Shares | 2,495,001 | 2,299,966 | 2,622,243 | 1,671,176 | ||||
| Dividends reinvested: | ||||||||
| Class M Shares | 6,175,094 | 5,188,901 | 6,785,054 | 4,878,898 | ||||
| Investor Shares | 137,300 | 122,579 | 64,610 | 38,542 | ||||
| Cost of shares redeemed: | ||||||||
| Class M Shares | (187,604,496) | (171,502,626) | (154,644,870) | (128,112,462) | ||||
| Investor Shares | (3,837,335) | (1,121,092) | (3,017,144) | (463,190) | ||||
| Increase (Decrease) in Net Assets from | ||||||||
| Beneficial Interest Transactions | 39,195,001 | 59,071,135 | 50,198,239 | 67,222,769 | ||||
| Total Increase (Decrease) in Net Assets | 49,855,216 | 59,724,386 | 60,461,669 | 70,193,594 | ||||
| Net Assets ($): | ||||||||
| Beginning of Period | 949,037,833 | 889,313,447 | 726,994,949 | 656,801,355 | ||||
| End of Period | 998,893,049 | 949,037,833 | 787,456,618 | 726,994,949 | ||||
| Undistributed investment income—net | 1,142,719 | 443,713 | 1,076,964 | 56,696 | ||||
| Capital Share Transactions (Shares): | ||||||||
| Class M Shares | ||||||||
| Shares sold | 17,793,146 | 18,282,293 | 15,947,733 | 15,561,595 | ||||
| Shares issued for dividends reinvested | 495,793 | 423,129 | 545,539 | 401,273 | ||||
| Shares redeemed | (15,077,630) | (13,973,760) | (12,418,444) | (10,519,626) | ||||
| Net Increase (Decrease) in Shares Outstanding | 3,211,309 | 4,731,662 | 4,074,828 | 5,443,242 | ||||
| Investor Shares | ||||||||
| Shares sold | 201,629 | 188,124 | 211,227 | 137,241 | ||||
| Shares issued for dividends reinvested | 11,049 | 10,011 | 5,201 | 3,173 | ||||
| Shares redeemed | (310,213) | (91,617) | (244,187) | (38,058) | ||||
| Net Increase (Decrease) in Shares Outstanding | (97,535) | 106,518 | (27,759) | 102,356 | ||||
See notes to financial statements.
The Funds 27
STATEMENTS OF CHANGES IN NET ASSETS (continued)
| BNY Mellon Short-Term U.S. Government Securities Fund | ||||
| Year Ended August 31, | ||||
| 2008 | 2007 | |||
| Operations ($): | ||||
| Investment income—net | 4,988,126 | 5,383,065 | ||
| Net realized gain (loss) on investments | 1,045,781 | (332,872) | ||
| Net unrealized appreciation (depreciation) on investments | 1,405,504 | 1,219,315 | ||
| Net Increase (Decrease) in Net Assets | ||||
| Resulting from Operations | 7,439,411 | 6,269,508 | ||
| Dividends to Shareholders from ($): | ||||
| Investment income—net: | ||||
| Class M Shares | (5,610,253) | (5,930,702) | ||
| Investor Shares | (6,948) | (4,699) | ||
| Total Dividends | (5,617,201) | (5,935,401) | ||
| Beneficial Interest Transactions ($): | ||||
| Net proceeds from shares sold: | ||||
| Class M Shares | 28,624,431 | 49,065,963 | ||
| Investor Shares | 337,771 | 104,867 | ||
| Dividends reinvested: | ||||
| Class M Shares | 1,058,288 | 868,612 | ||
| Investor Shares | 5,813 | 4,167 | ||
| Cost of shares redeemed: | ||||
| Class M Shares | (26,272,918) | (53,525,145) | ||
| Investor Shares | (392,564) | (250,641) | ||
| Increase (Decrease) in Net Assets from | ||||
| Beneficial Interest Transactions | 3,360,821 | (3,732,177) | ||
| Total Increase (Decrease) in Net Assets | 5,183,031 | (3,398,070) | ||
| Net Assets ($): | ||||
| Beginning of Period | 128,767,578 | 132,165,648 | ||
| End of Period | 133,950,609 | 128,767,578 | ||
| Undistributed investment income—net | 93,282 | 35,188 | ||
| Capital Share Transactions (Shares): | ||||
| Class M Shares | ||||
| Shares sold | 2,343,294 | 4,089,237 | ||
| Shares issued for dividends reinvested | 86,711 | 72,506 | ||
| Shares redeemed | (2,149,337) | (4,461,016) | ||
| Net Increase (Decrease) in Shares Outstanding | 280,668 | (299,273) | ||
| Investor Shares | ||||
| Shares sold | 27,802 | 8,753 | ||
| Shares issued for dividends reinvested | 477 | 348 | ||
| Shares redeemed | (32,199) | (20,894) | ||
| Net Increase (Decrease) in Shares Outstanding | (3,920) | (11,793) | ||
See notes to financial statements.
28
FINANCIAL HIGHLIGHTS
The following tables describe the performance for each share class of each BNY Mellon fixed income fund for the fiscal periods indicated.All information (except portfolio turnover rate) reflects financial results for a single fund share.Total return shows how much your investment in each fund would have increased (or decreased) during the period, assuming you had reinvested all dividends and distributions.These figures have been derived from each fund’s financial statements.
| Class M Shares | ||||||||||
| Year Ended August 31, | ||||||||||
| BNY Mellon Bond Fund | 2008 | 2007 | 2006 | 2005 | 2004 | |||||
| Per Share Data ($): | ||||||||||
| Net asset value, beginning of period | 12.24 | 12.23 | 12.66 | 12.79 | 12.92 | |||||
| Investment Operations: | ||||||||||
| Investment income—neta | .60 | .57 | .52 | .48 | .49 | |||||
| Net realized and unrealized gain (loss) on investments | .15 | .04 | (.38) | (.07) | .21 | |||||
| Total from Investment Operations | .75 | .61 | .14 | .41 | .70 | |||||
| Distributions: | ||||||||||
| Dividends from investment income—net | (.61) | (.60) | (.57) | (.54) | (.56) | |||||
| Dividends from net realized gain on investments | — | — | — | — | (.27) | |||||
| Total Distributions | (.61) | (.60) | (.57) | (.54) | (.83) | |||||
| Net asset value, end of period | 12.38 | 12.24 | 12.23 | 12.66 | 12.79 | |||||
| Total Return (%) | 6.17 | 5.06 | 1.20 | 3.30 | 5.63 | |||||
| Ratios/Supplemental Data (%): | ||||||||||
| Ratio of total expenses to average net assets | .55 | .56 | .56 | .56 | .56 | |||||
| Ratio of net expenses to average net assets | .55b | .56b | .56b | .56 | .56b | |||||
| Ratio of net investment income | ||||||||||
| to average net assets | 4.78 | 4.67 | 4.27 | 3.81 | 3.79 | |||||
| Portfolio Turnover Rate | 60.76 | 134.49 | 104.53c | 151.34c | 133.00c | |||||
| Net Assets, end of period ($ x 1,000) | 995,421 | 944,416 | 885,994 | 839,804 | 819,664 | |||||
| a Based on average shares outstanding at each month end. |
| b Expense waivers and/or reimbursements amounted to less than .01%. |
| c The portfolio turnover rates excluding mortgage dollar roll transactions for the periods ended August 31, 2006, 2005 and 2004, were 101.12%, 104.24% and 106.10%, |
| respectively. |
| See notes to financial statements. |
The Funds 29
FINANCIAL HIGHLIGHTS (continued)
| Investor Shares | ||||||||||
| Year Ended August 31, | ||||||||||
| BNY Mellon Bond Fund | 2008 | 2007 | 2006 | 2005 | 2004 | |||||
| Per Share Data ($): | ||||||||||
| Net asset value, beginning of period | 12.21 | 12.21 | 12.63 | 12.77 | 12.90 | |||||
| Investment Operations: | ||||||||||
| Investment income—neta | .56 | .53 | .49 | .45 | .50 | |||||
| Net realized and unrealized gain (loss) on investments | .16 | .04 | (.37) | (.08) | .17 | |||||
| Total from Investment Operations | .72 | .57 | .12 | .37 | .67 | |||||
| Distributions: | ||||||||||
| Dividends from investment income—net | (.57) | (.57) | (.54) | (.51) | (.53) | |||||
| Dividends from net realized gain on investments | — | — | — | — | (.27) | |||||
| Total Distributions | (.57) | (.57) | (.54) | (.51) | (.80) | |||||
| Net asset value, end of period | 12.36 | 12.21 | 12.21 | 12.63 | 12.77 | |||||
| Total Return (%) | 5.81 | 4.82 | 1.01 | 2.98 | 5.29 | |||||
| Ratios/Supplemental Data (%): | ||||||||||
| Ratio of total expenses to average net assets | .80 | .81 | .80 | .81 | .81 | |||||
| Ratio of net expenses to average net assets | .80b | .81b | .80b | .81 | .81b | |||||
| Ratio of net investment income | ||||||||||
| to average net assets | 4.52 | 4.42 | 4.02 | 3.56 | 3.52 | |||||
| Portfolio Turnover Rate | 60.76 | 134.49 | 104.53c | 151.34c | 133.00c | |||||
| Net Assets, end of period ($ x 1,000) | 3,472 | 4,621 | 3,319 | 2,704 | 3,068 |
| a Based on average shares outstanding at each month end. |
| b Expense waivers and/or reimbursements amounted to less than .01%. |
| c The portfolio turnover rates excluding mortgage dollar roll transactions for the periods ended August 31, 2006, 2005 and 2004, were 101.12%, 104.24% and 106.10%, |
| respectively. |
| See notes to financial statements. |
30
| Class M Shares | ||||||||||
| Year Ended August 31, | ||||||||||
| BNY Mellon Intermediate Bond Fund | 2008 | 2007 | 2006 | 2005 | 2004 | |||||
| Per Share Data ($): | ||||||||||
| Net asset value, beginning of period | 12.19 | 12.14 | 12.47 | 12.77 | 12.97 | |||||
| Investment Operations: | ||||||||||
| Investment income—neta | .55 | .53 | .46 | .41 | .42 | |||||
| Net realized and unrealized gain (loss) on investments | .21 | .09 | (.26) | (.22) | .14 | |||||
| Total from Investment Operations | .76 | .62 | .20 | .19 | .56 | |||||
| Distributions: | ||||||||||
| Dividends from investment income—net | (.58) | (.57) | (.53) | (.49) | (.52) | |||||
| Dividends from net realized gain on investments | — | — | — | — | (.24) | |||||
| Total Distributions | (.58) | (.57) | (.53) | (.49) | (.76) | |||||
| Net asset value, end of period | 12.37 | 12.19 | 12.14 | 12.47 | 12.77 | |||||
| Total Return (%) | 6.19 | 5.22 | 1.69 | 1.53 | 4.45 | |||||
| Ratios/Supplemental Data (%): | ||||||||||
| Ratio of total expenses to average net assets | .55 | .56 | .56 | .57 | .57 | |||||
| Ratio of net expenses to average net assets | .55b | .56 | .56 | .57 | .57b | |||||
| Ratio of net investment income | ||||||||||
| to average net assets | 4.43 | 4.36 | 3.79 | 3.23 | 3.26 | |||||
| Portfolio Turnover Rate | 53.28 | 84.24 | 86.50 | 112.51c | 109.19 | |||||
| Net Assets, end of period ($ x 1,000) | 785,841 | 725,064 | 656,120 | 569,233 | 524,590 | |||||
| a Based on average shares outstanding at each month end. |
| b Expense waivers and/or reimbursements amounted to less than .01%. |
| c The portfolio turnover rate excluding mortgage dollar roll transactions for the period ended August 31, 2005 was 111.52%. |
| See notes to financial statements. |
The Funds 31
FINANCIAL HIGHLIGHTS (continued)
| Investor Shares | ||||||||||
| Year Ended August 31, | ||||||||||
| BNY Mellon Intermediate Bond Fund | 2008 | 2007 | 2006 | 2005 | 2004 | |||||
| Per Share Data ($): | ||||||||||
| Net asset value, beginning of period | 12.19 | 12.14 | 12.47 | 12.77 | 13.02 | |||||
| Investment Operations: | ||||||||||
| Investment income—neta | .53 | .48 | .43 | .37 | .55 | |||||
| Net realized and unrealized gain (loss) on investments | .18 | .11 | (.26) | (.21) | (.07)b | |||||
| Total from Investment Operations | .71 | .59 | .17 | .16 | .48 | |||||
| Distributions: | ||||||||||
| Dividends from investment income—net | (.54) | (.54) | (.50) | (.46) | (.49) | |||||
| Dividends from net realized gain on investments | — | — | — | — | (.24) | |||||
| Total Distributions | (.54) | (.54) | (.50) | (.46) | (.73) | |||||
| Net asset value, end of period | 12.36 | 12.19 | 12.14 | 12.47 | 12.77 | |||||
| Total Return (%) | 5.91 | 4.96 | 1.43 | 1.30 | 3.88 | |||||
| Ratios/Supplemental Data (%): | ||||||||||
| Ratio of total expenses to average net assets | .80 | .81 | .81 | .81 | .82 | |||||
| Ratio of net expenses to average net assets | .80c | .81 | .81 | .81 | .82c | |||||
| Ratio of net investment income | ||||||||||
| to average net assets | 4.19 | 4.10 | 3.55 | 3.00 | 3.01 | |||||
| Portfolio Turnover Rate | 53.28 | 84.24 | 86.50 | 112.51d | 109.19 | |||||
| Net Assets, end of period ($ x 1,000) | 1,616 | 1,931 | 681 | 547 | 455 |
| a Based on average shares outstanding at each month end. |
| b In addition to the net realized and unrealized gain on investments, this amount includes a decrease in net asset value per share resulting from the timing of issuances and |
| redemptions of shares in relation to fluctuating market values for the fund’s investments. |
| c Expense waivers and/or reimbursements amounted to less than .01%. |
| d The portfolio turnover rate excluding mortgage dollar roll transactions for the period ended August 31, 2005 was 111.52%. |
| See notes to financial statements. |
32
| Class M Shares | ||||||||||
| Year Ended August 31, | ||||||||||
| BNY Mellon Short-Term U.S. Government Securities Fund | 2008 | 2007 | 2006 | 2005 | 2004 | |||||
| Per Share Data ($): | ||||||||||
| Net asset value, beginning of period | 12.02 | 11.99 | 12.14 | 12.47 | 12.70 | |||||
| Investment Operations: | ||||||||||
| Investment income—neta | .46 | .56 | .39 | .28 | .25 | |||||
| Net realized and unrealized gain (loss) on investments | .23 | .03 | (.06) | (.16) | (.01) | |||||
| Total from Investment Operations | .69 | .59 | .33 | .12 | .24 | |||||
| Distributions: | ||||||||||
| Dividends from investment income—net | (.52) | (.56) | (.48) | (.45) | (.45) | |||||
| Dividends from net realized gain on investments | — | — | — | — | (.02) | |||||
| Total Distributions | (.52) | (.56) | (.48) | (.45) | (.47) | |||||
| Net asset value, end of period | 12.19 | 12.02 | 11.99 | 12.14 | 12.47 | |||||
| Total Return (%) | 5.83 | 5.05 | 2.78 | 1.00 | 1.97 | |||||
| Ratios/Supplemental Data (%): | ||||||||||
| Ratio of total expenses to average net assets | .55 | .55 | .54 | .55 | .55 | |||||
| Ratio of net expenses to average net assets | .55b | .55 | .54 | .55b | .55b | |||||
| Ratio of net investment income | ||||||||||
| to average net assets | 3.79 | 4.65 | 3.24 | 2.25 | 1.97 | |||||
| Portfolio Turnover Rate | 84.77 | 127.30 | 85.97 | 69.11 | 44.76 | |||||
| Net Assets, end of period ($ x 1,000) | 133,857 | 128,628 | 131,885 | 161,963 | 176,301 | |||||
| a | Based on average shares outstanding at each month end. | |
| b | Expense waivers and/or reimbursements amounted to less than .01%. | |
| See notes to financial statements. | ||
The Funds 33
FINANCIAL HIGHLIGHTS (continued)
| Investor Shares | ||||||||||
| Year Ended August 31, | ||||||||||
| BNY Mellon Short-Term U.S. Government Securities Fund | 2008 | 2007 | 2006 | 2005 | 2004 | |||||
| Per Share Data ($): | ||||||||||
| Net asset value, beginning of period | 12.02 | 12.00 | 12.14 | 12.47 | 12.73 | |||||
| Investment Operations: | ||||||||||
| Investment income—neta | .45 | .49 | .41 | .23 | .37 | |||||
| Net realized and unrealized gain (loss) on investments | .22 | .06 | (.10) | (.14) | (.19) | |||||
| Total from Investment Operations | .67 | .55 | .31 | .09 | .18 | |||||
| Distributions: | ||||||||||
| Dividends from investment income—net | (.49) | (.53) | (.45) | (.42) | (.42) | |||||
| Dividends from net realized gain on investments | — | — | — | — | (.02) | |||||
| Total Distributions | (.49) | (.53) | (.45) | (.42) | (.44) | |||||
| Net asset value, end of period | 12.20 | 12.02 | 12.00 | 12.14 | 12.47 | |||||
| Total Return (%) | 5.55 | 4.67 | 2.62 | .78 | 1.46 | |||||
| Ratios/Supplemental Data (%): | ||||||||||
| Ratio of total expenses to average net assets | .79 | .80 | .77 | .81 | .78 | |||||
| Ratio of net expenses to average net assets | .79b | .80 | .77 | .81b | .78b | |||||
| Ratio of net investment income | ||||||||||
| to average net assets | 3.61 | 4.51 | 3.25 | 1.99 | 1.74 | |||||
| Portfolio Turnover Rate | 84.77 | 127.30 | 85.97 | 69.11 | 44.76 | |||||
| Net Assets, end of period ($ x 1,000) | 94 | 140 | 281 | 20 | 11 |
| a | Based on average shares outstanding at each month end. | |
| b | Expense waivers and/or reimbursements amounted to less than .01%. | |
| See notes to financial statements. | ||
34
NOTES TO FINANCIAL STATEMENTS
NOTE 1—General:
BNY Mellon Funds Trust (the “Trust”) was organized as a Massachusetts business trust which is registered under the Investment Company Act of 1940, as amended (the “Act”), as an open-end management investment company and operates as a series company currently comprised of twenty series, effective as of the close of business on September 12, 2008, including the following diversified fixed income funds: BNY Mellon Bond Fund, BNY Mellon Intermediate Bond Fund and BNY Mellon Short-Term U.S. Government Securities Fund (each, a “fund” and collectively, the “funds”). Effective March 31, 2008, the Trust changed its name from “Mellon Funds Trust” to its current name and each fund added “BNY” to the beginning of its name. BNY Mellon Bond Fund’s and BNY Mellon Intermediate Bond Fund’s investment objective is to seek total return (consisting of capital appreciation and current income). BNY Mellon Short-Term U.S. Government Securities Fund’s investment objective is to seek to provide as high a level of current income as is consistent with the preservation of capital.
BNY Mellon Fund Advisers, a division of The Dreyfus Corporation (the “Manager” or “Dreyfus”), a wholly-owned subsidiary of The Bank of New York Mellon Corporation (“BNY Mellon”), serves as each fund’s investment adviser (“Investment Adviser”). The Bank of New York Mellon, a subsidiary of BNY Mellon and an affiliate of Dreyfus, serves as administrator for the funds pursuant to an Administration Agreement with the Trust (the “Administration Agreement”). The Bank of New York Mellon has entered into a Sub-Administration Agreement with Dreyfus pursuant to which The Bank of New York Mellon pays Dreyfus for performing certain administrative services. MBSC Securities Corporation (the “Distributor”), a wholly-owned subsidiary of Dreyfus, is the distributor of each fund’s shares, which are sold without a sales charge.
Effective July 1, 2008, BNY Mellon has reorganized and consolidated a number of its banking and trust company subsidiaries.As a result of the reorganization, any services previously provided to the funds by Mellon Bank, N.A.
or Mellon Trust of New England, N.A. are now provided by The Bank of New York, which has changed its name to The Bank of New York Mellon.
The Trust is authorized to issue an unlimited number of shares of Beneficial Interest, par value $.001 per share, in each of the Class M and Investor class shares of each fund. Each class of shares has similar rights and privileges, except with respect to the expenses borne by and the shareholder services offered to each class and the shareholder services plan applicable to the Investor shares and certain voting rights. Income, expenses (other than expenses attributable to a specific class), and realized and unrealized gains or losses on investments are allocated daily for each class of shares based upon relative proportion of net assets of each class.
TheTrust accounts separately for the assets, liabilities and operations of each series. Expenses directly attributable to each series are charged to that series’ operations; expenses that are applicable to all series are allocated among them on a pro rata basis.
The funds’ financial statements are prepared in accordance with U.S. generally accepted accounting principles, which may require the use of management estimates and assumptions. Actual results could differ from those estimates.
NOTE 2—Significant Accounting Policies:
(a) Portfolio valuation: Investments in securities excluding short-term investments (other than U.S. Treasury Bills), are valued each business day by an independent pricing service (the “Service”) approved by the Board of Trustees. Investments for which quoted bid prices are readily available and are representative of the bid side of the market in the judgment of the Service are valued at the mean between the quoted bid prices (as obtained by the Service from dealers in such securities) and asked prices (as calculated by the Service based upon its evaluation of the market for such securities). Other investments (which constitute a majority of the portfolio securities) are valued as determined by the Service, based on methods which include consideration of: yields or prices of
The Funds 35
NOTES TO FINANCIAL STATEMENTS (continued)
securities of comparable quality, coupon, maturity and type; indications as to values from dealers; and general market conditions. Restricted securities, as well as securities or other assets for which recent market quotations are not readily available, that are not valued by a pricing service approved by the fund’s Board of Trustees, or are determined by the fund not to reflect accurately fair value, are valued at fair value as determined in good faith under the direction of the Board of Trustees.The factors that may be considered when fair valuing a security include fundamental analytical data, the nature and duration of restrictions on disposition, an evaluation of the forces that influence the market in which the securities are purchased and sold, and public trading in similar securities of the issuer or comparable issuers. Registered investment companies that are not traded on an exchange are valued at their net asset value.
The Financial Accounting Standards Board (FASB) released Statement of Financial Accounting Standards No. 157 “Fair Value Measurements” (“FAS 157”). FAS 157 establishes an authoritative definition of fair value, sets out a framework for measuring fair value, and requires additional disclosures about fair-value measure-ments.The application of FAS 157 is required for fiscal years beginning after November 15, 2007 and interim periods within those fiscal years. Management does not believe that the application of this standard will have a material impact on the financial statements of the funds.
(b) Securities transactions and investment income:
Securities transactions are recorded on a trade date basis. Realized gains and losses from securities transactions are recorded on the identified cost basis. Dividend income is recorded on the ex-dividend date and interest income, including where applicable, accretion of discount and amortization of premium on investments is recognized on the accrual basis.
The funds have arrangements with the custodian and cash management banks whereby the funds may receive earnings credits when positive cash balances are maintained, which are used to offset custody and cash management fees. For financial reporting purposes, the funds
include net earnings credits as an expense offset in the Statement of Operations.
Pursuant to a securities lending agreement with The Bank of NewYork Mellon, the funds may lend securities to certain qualified institutions. It is the funds’ policy that, at origination, all loans are secured by collateral of at least 102% of the value of U.S. securities loaned and 105% of the value of foreign securities loaned. Collateral equivalent to at least 100% of the market value of securities on loan is maintained at all times. Collateral is either in the form of cash, which can be invested in certain money market mutual funds managed by Dreyfus, U.S. Government and Agency securities or letters of credit. The funds are entitled to receive all income on securities loaned, in addition to income earned as a result of the lending transaction. Although each security loaned is fully collateralized, the funds bear the risk of delay in recovery of, or loss of rights in, the securities loaned should a borrower fail to return the securities in a timely manner. Table 1 summarizes the amount The Bank of New York Mellon earned from each fund from lending fund portfolio securities, pursuant to the securities lending agreement during the period ended August 31, 2008.
| Table 1. | ||
| BNY Mellon Bond Fund | $598,218 | |
| BNY Mellon Intermediate Bond Fund | 805,349 | |
| BNY Mellon Short-Term | ||
| U.S. Government Securities Fund | 163,115 |
(c) Affiliated issuers: Investments in other investment companies advised by Dreyfus are defined as “affiliated” in the Act.
(d) Concentration of Risk: The funds invest primarily in debt securities. Failure of an issuer of the debt securities to make timely interest or principal payments, or a decline or the perception of a decline in the credit quality of a debt security, can cause the debt security’s price to fall, potentially lowering the fund’s share price. In addition, the value of the debt securities may decline due to general market conditions that are not specifically related to a particular company, such as real or perceived
36
adverse economic conditions, changes in outlook for corporate earnings, changes in interest or currency rates or adverse investor sentiment. They may also decline because of factors that affect a particular industry.
(e) Dividends to shareholders: Dividends payable to shareholders are recorded by the funds on the ex-dividend date.The funds declare and pay dividends from investment income-net monthly.With respect to each series,dividends from net realized capital gains, if any, are normally declared and paid annually, but the funds may make distributions on a more frequent basis to comply with the distribution requirements of the Internal Revenue Code of 1986, as amended (the “Code”).To the extent that net realized capital gains can be offset by capital loss carryovers of that fund, it is the policy of the fund not to distribute such gains.Income and capital gain distributions are determined in accordance with income tax regulations,which may differ from generally accepted accounting principles.
(f) Federal income taxes: It is the policy of each fund to continue to qualify as a regulated investment company, if such qualification is in the best interests of its shareholders, by complying with the applicable provisions of the Code, and to make distributions of taxable income sufficient to relieve it from substantially all federal income and excise taxes. For federal income tax purposes, each series is treated as a single entity for the purpose of determining such qualification.
The funds adopted FASB Interpretation No. 48 “Accounting for Uncertainty in Income Taxes” (“FIN 48”).FIN 48 provides guidance for how uncertain tax positions should be recognized, measured, presented and disclosed in the financial statements. FIN 48 requires the evaluation of tax positions taken or expected to be taken in the
course of preparing the funds’ tax returns to determine whether the tax positions are “more-likely-than-not” of being sustained by the applicable tax authority.Tax positions not deemed to meet the more-likely-than-not threshold would be recorded as a tax expense in the current year. The adoption of FIN 48 had no impact on the operations of the funds for the period ending August 31, 2008.
As of and during the period ended August 31, 2008, the funds did not have any liabilities for any unrecognized tax benefits. The funds recognize interest and penalties, if any, related to unrecognized tax benefits as income tax expense in the Statement of Operations. During the period, the funds did not incur any interest or penalties.
Each of the tax years in the four-year period ended August 31, 2008, remains subject to examination by the Internal Revenue Service and state taxing authorities.
Table 2 summarizes each fund’s components of accumulated earnings on a tax basis at August 31, 2008.
Table 3 summarizes each fund’s accumulated capital loss carryover available to be applied against future net securities profits, if any, realized subsequent to August 31, 2008.
Table 4 summarizes each fund’s tax character of distributions paid to shareholders during the fiscal periods ended August 31, 2008 and August 31, 2007, respectively.
During the period ended August 31, 2008, as a result of permanent book to tax differences,primarily due to amortization of premiums and paydown gains and losses on mortgage backed securities,the funds increased (decreased) accumulated undistributed investment income-net, increased (decreased) accumulated net realized gain (loss) on investments and increased (decreased) paid-in capital as
| Table 2. | ||||||
| Undistributed | Accumulated | |||||
| Ordinary | Capital | Unrealized | ||||
| Income ($) | Losses ($) | Appreciation ($) | ||||
| BNY Mellon Bond Fund | 1,142,719 | (19,514,144) | 1,733,522 | |||
| BNY Mellon Intermediate Bond Fund | 1,076,964 | (19,094,338) | 4,361,499 | |||
| BNY Mellon Short-Term U.S. Government Securities Fund | 93,282 | (9,496,179) | 1,057,642 | |||
The Funds 37
NOTES TO FINANCIAL STATEMENTS (continued)
summarized in Table 5. Net assets and net asset value per share were not affected by this reclassification.
NOTE 3—Bank Lines of Credit:
Effective May 1, 2008, the funds participate with other Dreyfus-managed funds in a $300 million unsecured line of credit primarily to be utilized for temporary or emergency purposes, including the financing of redemptions. Interest is charged to the funds based on prevailing market rates in effect at the time of borrowing. Prior to May 1, 2008, the funds participated with other Dreyfus-managed funds in a $100 million unsecured line of credit. During the period ended August 31, 2008, the funds did not borrow under the lines of credit.
NOTE 4—Investment Advisory Fee, Administration Fee and Other Transactions With Affiliates:
(a) Fees payable by the funds pursuant to the provisions of an Investment Advisory Agreement with the
Investment Adviser are payable monthly, computed on the average daily value of each fund’s net assets at the following annual rates: .40% of the BNY Mellon Bond Fund, .40% of the BNY Mellon Intermediate Bond Fund and .35% of the BNY Mellon Short-Term U.S. Government Securities Fund.
Pursuant to the Administration Agreement, The Bank of New York Mellon provides or arranges for fund accounting, transfer agency and other fund administration services and receives a fee based on the total net assets of the Trust based on the following rates:
| 0 up to $6 billion | .15% | |
| $6 billion up to $12 billion | .12% | |
| In excess of $12 billion | .10% |
The Bank of New York Mellon has entered into a Sub-Administration Agreement with Dreyfus pursuant to which The Bank of New York Mellon pays Dreyfus for performing certain administrative services.
| Table 3. | ||||||||||||
| Expiring in fiscal | 2012 ($)† | 2013 ($)† | 2014 ($)† | 2015 ($)† | 2016 ($) | Total ($) | ||||||
| BNY Mellon Bond Fund | 1,596,239 | 136,060 | 1,275,059 | 15,167,649 | 1,339,137 | 19,514,144 | ||||||
| BNY Mellon Intermediate Bond Fund | — | 742,782 | 4,073,519 | 14,278,037 | — | 19,094,338 | ||||||
| BNY Mellon Short-Term U.S. | ||||||||||||
| Government Securities Fund | — | 1,825,032 | 2,969,151 | 4,701,996 | — | 9,496,179 | ||||||
† If not applied, the carryovers expire in the above years.
| Table 4. | ||||
| Ordinary Income ($) | ||||
| 2008 | 2007 | |||
| BNY Mellon Bond Fund | 47,969,268 | 44,346,681 | ||
| BNY Mellon Intermediate Bond Fund | 36,789,000 | 32,388,531 | ||
| BNY Mellon Short-Term U.S. Government Securities Fund | 5,617,201 | 5,935,401 | ||
| Table 5. | ||||||
| Accumulated | ||||||
| Undistributed | Accumulated | |||||
| Investment | Net Realized | Paid-in | ||||
| Income—Net ($) | Gain (Loss) ($) | Capital ($) | ||||
| BNY Mellon Bond Fund | 1,546,520 | (1,124,283) | (422,237) | |||
| BNY Mellon Intermediate Bond Fund | 2,631,946 | (2,298,347) | (333,599) | |||
| BNY Mellon Short-Term U.S. Government Securities Fund | 687,170 | (687,258) | 88 | |||
38
(b) The funds have adopted a Shareholder Services Plan with respect to its Investor shares pursuant to which each fund pays the Distributor for the provision of certain services to holders of Investor shares a fee at an annual rate of .25% of the value of the average daily net assets attributable to Investor shares. The services provided may include personal services relating to shareholder accounts, such as answering shareholder inquiries regarding a fund, and providing reports and other information, and services related to the maintenance of such shareholder accounts. The Shareholder Services Plan allows the Distributor to make payments from the shareholder services fees it collects from each fund to compensate service agents (certain banks, securities brokers or dealers and other financial institutions) in respect of these services.
Table 6 summarizes the amounts Investor shares were charged during the period ended August 31, 2008, pursuant to the Shareholder Services Plan. Additional fees included in shareholder servicing costs in the Statement of Operations include fees paid to the transfer agent.
| Table 6. | ||
| BNY Mellon Bond Fund | $10,421 | |
| BNY Mellon Intermediate Bond Fund | 4,014 | |
| BNY Mellon Short-Term | ||
| U.S. Government Securities Fund | 513 |
The funds compensate The Bank of New York Mellon under a cash management agreement for performing cash management services related to fund subscriptions and redemptions.
Table 7 summarizes the amount each fund was charged during the period ended August 31, 2008, pursuant to the cash management agreement.
| Table 7. | ||
| BNY Mellon Bond Fund | $600 | |
| BNY Mellon Intermediate Bond Fund | 498 | |
| BNY Mellon Short-Term | ||
| U.S. Government Securities Fund | 126 |
The funds compensate The Bank of New York Mellon under a custody agreement for providing custodial services for the funds.
Table 8 summarizes the amount each fund was charged during the period ended August 31, 2008, pursuant to the custody agreement.
| Table 8. | ||
| BNY Mellon Bond Fund | $72,620 | |
| BNY Mellon Intermediate Bond Fund | 59,576 | |
| BNY Mellon Short-Term | ||
| U.S. Government Securities Fund | 11,862 |
During the period ended August 31, 2008, each fund was charged $5,622 for services performed by the Chief Compliance Officer.
Table 9 summarizes the components of “Due to The Dreyfus Corporation and affiliates” in the Statement of Assets and Liabilities for each fund.
(c) Effective June 1, 2008, each trustee who is not an “affiliated person” as defined in the Act receives from the Trust an annual fee of $68,000 and an attendance fee of $7,500 for each in-person meeting attended and $500 for telephone meetings and is reimbursed for travel and out-of-pocket expenses. The Chairman of the Trust’s Board receives an additional annual fee of $15,000 and the Chairman of the Trust’s Audit Committee receives an additional annual fee of $10,000. Prior to June 1, 2008, the Trust paid its Board members an annual fee of $48,000 and an attendance fee of $5,000 for each in-person meeting attended and $500 for telephone meetings and reimbursed them for travel and out-of-pocket expenses, and the Chairmen of the Trust’s Board and Audit Committee received additional annual fees of $10,000 and $8,000, respectively.
NOTE 5—Securities Transactions:
Table 10 summarizes each fund’s aggregate amount of purchases and sales of investment securities (including paydowns) excluding short-term securities, during the period ended August 31, 2008. Table 11 summarizes the cost of investments for federal income tax purposes and accumulated net unrealized appreciation on investments for each fund at August 31, 2008.
The Funds 39
NOTES TO FINANCIAL STATEMENTS (continued)
In March 2008, the FASB released Statement of Financial Accounting Standards No. 161 “Disclosures about Derivative Instruments and Hedging Activities” (“FAS 161”). FAS 161 requires qualitative disclosures about objectives and strategies for using derivatives, quantitative disclosures about fair value amounts of gains and losses on derivative instruments and disclosures about credit-risk-related contingent features in derivative agreements.The application of FAS 161 is required for fiscal years and interim periods beginning after November 15, 2008. At this time, management is evaluating the implications of FAS 161 and its impact on the financial statements and the accompanying notes has not yet been determined.
NOTE 6—Plan of Reorganization:
On March 11, 2008, the Board of Trustees approved an Agreement and Plan of Reorganization between BNY
Mellon Bond Fund (the “Acquiring Fund”) and BNY Hamilton Core Bond Fund (the “Acquired Fund”), providing for the Acquired Fund to merge into the Acquiring Fund as part of a tax-free reorganization.The merger, which was approved by the Acquired Fund’s shareholders, on July 16, 2008, occurred as of the close of business on September 12, 2008. On that date, shareholders of the Acquired Fund’s Institutional shares received Class M shares of the Acquiring Fund and shareholders of the Acquired Fund’s Class A shares received Investor shares of the Acquiring Fund. The Acquired Fund exchanged all of its assets at net asset value, subject to liabilities, for an equivalent value of shares of the Acquiring Fund. Such shares have been distributed pro rata to shareholders of the Acquired Fund so that each shareholder received a number of shares of the Acquiring Fund equal to the aggregate net asset value of the shareholder’s Acquired Fund’s shares.
| Table 9. | ||||||||
| Investment | Chief | Shareholder | ||||||
| Advisory | Compliance | Services | Custodian | |||||
| Fees ($) | Officer Fees ($) | Plan Fees ($) | Fees ($) | |||||
| BNY Mellon Bond Fund | 339,647 | 3,760 | 735 | 18,357 | ||||
| BNY Mellon Intermediate Bond Fund | 268,898 | 3,760 | 339 | 12,546 | ||||
| BNY Mellon Short-Term U.S. Government Securities Fund | 39,861 | 3,760 | 20 | 3,000 | ||||
| Table 10. | ||||||||
| Purchases ($) | Sales ($) | |||||||
| BNY Mellon Bond Fund | 635,208,828 | 589,887,114 | ||||||
| BNY Mellon Intermediate Bond Fund | 478,119,199 | 413,715,637 | ||||||
| BNY Mellon Short-Term U.S. Government Securities Fund | 113,313,485 | 108,721,633 | ||||||
| Table 11. | ||||||||
| Cost of | Gross | Gross | ||||||
| Investments ($) | Appreciation ($) | (Depreciation) ($) | Net ($) | |||||
| BNY Mellon Bond Fund | 1,202,610,782 | 5,173,024 | 3,439,502 | 1,733,522 | ||||
| BNY Mellon Intermediate Bond Fund | 1,004,324,535 | 13,018,181 | 8,656,682 | 4,361,499 | ||||
| BNY Mellon Short-Term U.S. Government Securities Fund | 194,105,072 | 1,945,450 | 887,808 | 1,057,642 | ||||
40
REPORT OF INDEPENDENT REGISTERED PUBLIC ACCOUNTING FIRM
| The Board of Trustees and Shareholders of |
| BNY Mellon Funds Trust: |
We have audited the accompanying statements of assets and liabilities of BNY Mellon Bond Fund, BNY Mellon Intermediate Bond Fund and BNY Mellon Short-Term U.S. Government Securities Fund, each a series of BNY Mellon Funds Trust, (collectively “the Funds”), including the statements of investments, as of August 31, 2008, and the related statements of operations for the year then ended, the statements of changes in net assets for each of the years in the two-year period then ended, and the financial highlights for each of the years in the five-year period then ended.These financial statements and financial highlights are the responsibility of the Funds’management. Our responsibility is to express an opinion on these financial statements and financial highlights based on our audits.
We conducted our audits in accordance with the standards of the Public Company Accounting Oversight Board (United States). Those standards require that we plan and perform the audit to obtain reasonable assurance about whether the financial statements and financial highlights are free of material misstatement.An audit includes examining, on a test basis, evidence supporting the amounts and disclosures in the financial statements.
Our procedures included confirmation of securities owned as of August 31, 2008, by correspondence with the custodian and brokers or by appropriate auditing procedures where replies from brokers were not received. An audit also includes assessing the accounting principles used and significant estimates made by management, as well as evaluating the overall financial statement presentation.We believe that our audits provide a reasonable basis for our opinion.
In our opinion, the financial statements and financial highlights referred to above present fairly, in all material respects, the financial position of BNY Mellon Bond Fund, BNY Mellon Intermediate Bond Fund and BNY Mellon Short-Term U.S. Government Securities Fund as of August 31, 2008, and the results of their operations for the year then ended, the changes in their net assets for each of the years in the two-year period then ended and the financial highlights for each of the years in the five-year period then ended, in conformity with U.S. generally accepted accounting principles.
![]()
| New York, New York |
| October 27, 2008 |
The Funds 41
IMPORTANT TAX INFORMATION (Unaudited)
BNY Mellon Bond Fund
For federal tax purposes the fund hereby designates 98.68% of ordinary income dividends paid during the fiscal year ended August 31, 2008 as qualifying “interest related dividends.”
BNY Mellon Intermediate Bond Fund
For federal tax purposes the fund hereby designates 99.83% of ordinary income dividends paid during the fiscal year ended August 31, 2008 as qualifying “interest related dividends.”
BNY Mellon Short-Term U.S. Government Securities Fund
For federal tax purposes the fund hereby designates 100% of the ordinary income dividends paid during its fiscal year ended August 31, 2008 as qualifying “interest related dividends”. Also for state individual income tax purposes, the fund hereby designates 63.18% of the ordinary income dividends paid during its fiscal year ended August 31, 2008 as attributable to interest income from direct obligations of the United States. Such dividends are currently exempt from taxation for individual income tax purposes in most states, including NewYork, California and the District of Columbia.
42
| INFORMATION ABOUT THE REVIEW AND APPROVAL |
| OF EACH FUND’S INVESTMENT ADVISORY AGREEMENT (Unaudited) |
At a meeting of the Board of Trustees held on March 10-11, 2008, the Board considered the re-approval of the Trust’s Investment Advisory Agreement for another one year term, pursuant to which BNY Mellon Fund Advisers, a division of Dreyfus, provides the funds with investment advisory services. The Board members also considered the re-approval of the Trust’s Administration Agreement with Mellon Bank for another one year term, pursuant to which Mellon Bank provides the funds with administrative services. Mellon Bank has entered into a Sub-Administration Agreement with Dreyfus pursuant to which Mellon Bank pays Dreyfus for performing certain of these administrative services. The Board members who are not “interested persons” (as defined in the Act) of theTrust were assisted in their review by independent legal counsel and met with counsel in executive session separate from representatives of Dreyfus.
Analysis of Nature, Extent and Quality of Services Provided to the Funds. The Board members received a presentation from representatives of Dreyfus regarding services provided to the funds, and discussed the nature, extent and quality of the services provided to the funds pursuant to the Investment Advisory Agreement. Dreyfus’ representatives reviewed the funds’ distribution of accounts, and noted the diversity of distribution of the funds and Dreyfus’ corresponding need for broad, deep and diverse resources to be able to provide ongoing shareholder services to each of the funds’ distribution channels. Dreyfus also provided the number of shareholder accounts in each fund, as well as each fund’s asset size.
The Board members also considered Dreyfus’ research and portfolio management capabilities and that Dreyfus also provides oversight of day-to-day fund operations, including fund accounting and administration and assistance in meeting legal and regulatory requirements, and Dreyfus’ extensive administrative, accounting and compliance infrastructure.
Comparative Analysis of the Funds’ Advisory Fees, Expense Ratios and Performance
The Board members reviewed reports prepared by Lipper, Inc., an independent provider of investment company data, which included information comparing each fund’s advisory fee and expense ratio with a group of comparable funds (the “Expense Group”) and with a broader group of funds (the “Expense Universe”), in each case in the same category applicable to the fund, that were selected by Lipper. The Board members also reviewed reports prepared by Lipper which included information comparing each fund’s performance with that of a group of comparable funds (the “Performance Group”) composed of the same funds included in the Expense Group and with that of a broader group of funds (the “Performance Universe”), in each case in the same category applicable to the fund, that were selected by Lipper. Included in these reports were comparisons of contractual and actual advisory fee rates, total operating expenses, total return performance and yield. Dreyfus also provided a comparison of each fund’s calendar year total returns to the performance of the fund’s benchmark. Representatives of Dreyfus furnished these reports to the Board along with a description of the methodology Lipper used to select each Expense Group and Expense Universe and each Performance Group and Performance Universe.
BNY Mellon Bond Fund
The Board reviewed the results of the Expense Group and Expense Universe comparisons.The Board reviewed the range of advisory fees and expense ratios of the funds in the Expense Group and Expense Universe, and noted that the fund’s expense ratio ranked in the third quartile (above the median) of the Expense Group and in the second quartile (below the median) of the Expense Universe.
The Funds 43
INFORMATION ABOUT THE REVIEW AND APPROVAL OF EACH FUND’S INVESTMENT ADVISORY AGREEMENT (Unaudited) (continued)
The Board also reviewed, and placed significant emphasis on, the results of the Performance Group and Performance Universe comparisons. The Board noted that for periods ended January 31, 2008, the fund’s total return performance was above the medians of the Performance Group for the 1-, 2- and 3-year periods, and was below the medians for the 4- and 5-year periods, and was above the medians of the Performance Universe for the reported periods.The Board also noted that the fund’s yield was above the medians of the Performance Group for each of the 1-year periods ended January 31st for 2004 and 2005, and was below the medians for each of the 1-year periods ended January 31st for 2002, 2003, 2006, 2007 and 2008, and was above the medians of the Performance Universe for each of the 1-year periods ended January 31st for each of the reported periods.
Representatives of Dreyfus reviewed with the Board members the fees paid to Dreyfus or its affiliates by mutual funds managed by Dreyfus or its affiliates with similar investment objectives, policies and strategies, and included within the same Lipper category, as the fund. The Board considered BNY Mellon Wealth Management’s general advisory fee schedule for accounts with similar investment objectives, policies and strategies as the fund.The Board analyzed the differences in fees paid to Dreyfus and discussed the relationship of the advisory fees paid in light of the services provided. The Board members considered the relevance of the fee information provided to evaluate the appropriateness and reasonableness of the fund’s advisory fees.
BNY Mellon Intermediate Bond Fund
The Board reviewed the results of the Expense Group and Expense Universe comparisons.The Board reviewed the range of advisory fees and expense ratios of the funds in the Expense Group and Expense Universe, and noted that the fund’s expense ratio ranked in the first quartile of the Expense Group and in the second quartile of the
Expense Universe (below the respective Expense Group and Expense Universe medians).
The Board also reviewed, and placed significant emphasis on, the results of the Performance Group and Performance Universe comparisons. The Board noted that for periods ended January 31, 2008, the fund’s total return performance was above the medians of the Performance Group for the 1-, 2- and 3-year periods, was equal to the median for the 4-year period and was below the median for the 5-year period, and was above the medians of the Performance Universe for the reported periods.The Board also noted that the fund’s yield was equal to the medians of the Performance Group for each of the 1-year periods ended January 31st for 2004 and 2006, was above the medians for each of the 1-year periods ended January 31st for 2005 and 2007 and was below the medians for each of the 1-year periods ended January 31st for 2002, 2003 and 2008, and was above the medians of the Performance Universe for each of the 1-year periods ended January 31st for each of the reported periods.
The Board considered BNY Mellon Wealth Management’s general advisory fee schedule for accounts with similar investment objectives, policies and strategies as the fund.The Board analyzed the differences in fees paid to Dreyfus and discussed the relationship of the advisory fees paid in light of the services provided. The Board members considered the relevance of the fee information provided to evaluate the appropriateness and reasonableness of the fund’s advisory fees.
BNY Mellon Short-Term U.S. Government Securities Fund
The Board reviewed the results of the Expense Group and Expense Universe comparisons. The Board reviewed the range of advisory fees and expense ratios of the funds in the Expense Group and Expense Universe, and noted that the fund’s expense ratio ranked in the second quartile (below the median) of the Expense Group and in the third quartile (above the median) of the Expense Universe.
44
The Board also reviewed, and placed significant emphasis on, the results of the Performance Group and Performance Universe comparisons. The Board noted that for periods ended January 31, 2008, the fund’s total return performance was above the medians of the Performance Group for the 1- and 3-year periods, was equal to the medians for the 2- and 4-year periods and was below the median for the 5-year period, and was above the medians of the Performance Universe for the reported periods. The Board also noted that the fund’s yield was above the medians of the Performance Group and Performance Universe for each of the 1-year periods ended January 31st for each of the reported periods.
Representatives of Dreyfus reviewed with the Board members the fees paid to Dreyfus or its affiliates by a mutual fund managed by Dreyfus or its affiliates with a similar investment objective and similar policies and strategies, and included within the same Lipper category, as the fund.The Board considered BNY Mellon Wealth Management’s general advisory fee schedule for accounts with similar investment objectives, policies and strategies as the fund.The Board analyzed the differences in fees paid to Dreyfus and discussed the relationship of the advisory fees paid in light of the services provided. The Board members considered the relevance of the fee information provided to evaluate the appropriateness and reasonableness of the fund’s advisory fees.
Analysis of Profitability and Economies of Scale. Dreyfus’ representatives reviewed the dollar amount of expenses allocated and profit received by Dreyfus and its affiliates with respect to each fund and the method used to determine such expenses and profit.The Board previously had been provided with information prepared by an independent consulting firm regarding Dreyfus’ approach to allocating costs to, and determining the profitability of, individual funds and the entire Dreyfus mutual fund complex. The Board members also had been informed that the methodology had been reviewed
by an independent registered public accounting firm which, like the consultant, found the methodology to be reasonable.The consulting firm also analyzed where any economies of scale might emerge in connection with the management of the funds.The Board members evaluated the profitability analysis in light of the relevant circumstances for each fund, including any decline in assets, and the extent to which economies of scale would be realized if a fund grows and whether fee levels reflect these economies of scale for the benefit of fund shareholders. The Board members also considered potential benefits to Dreyfus and its affiliates, including BNY Mellon Fund Advisers, from acting as investment adviser to the funds and noted that there were no soft dollar arrangements with respect to trading each fund’s portfolio.
It was noted that the Board members should consider Dreyfus’ profitability with respect to each fund as part of their evaluation of whether the fees under the Investment Advisory Agreement bear a reasonable relationship to the mix of services provided by Dreyfus, including the nature, extent and quality of such services. It was noted that the profitability percentage for managing each fund was within ranges determined by appropriate court cases to be reasonable given the services rendered and that the profitability percentage for managing each fund was not unreasonable given the services provided.
At the conclusion of these discussions, the Board agreed that it had been furnished with sufficient information to make an informed business decision with respect to the continuation of the Trust’s Investment Advisory Agreement with respect to the funds. Based on the discussions and considerations as described above, the Board made the following conclusions and determinations with respect to the funds:
- The Board concluded that the nature, extent and qual- ity of the services provided by Dreyfus to each fund are adequate and appropriate.
The Funds 45
INFORMATION ABOUT THE REVIEW AND APPROVAL OF EACH FUND’S INVESTMENT ADVISORY AGREEMENT (Unaudited) (continued)
- With respect to BNY Mellon Bond Fund and BNY Mellon Intermediate Bond Fund, the Board was gen- erally satisfied with each fund’s overall performance.
- With respect to BNY Mellon Short-Term U.S. Government Securities Fund, the Board was satisfied with the fund’s performance.
- The Board concluded that the fee paid to Dreyfus by each fund was reasonable in light of the services pro- vided, comparative performance and expense and advisory fee information, costs of the services pro- vided and profits to be realized and benefits derived or to be derived by Dreyfus and its affiliates from its rela- tionship with the fund.
- The Board determined that the economies of scale which may accrue to Dreyfus and its affiliates in con-
nection with the management of the funds had been adequately considered by Dreyfus in connection with the advisory fee rate charged to each fund, and that, to the extent in the future it were to be determined that material economies of scale had not been shared with a fund, the Board would seek to have those economies of scale shared with the fund.
The Board members considered these conclusions and determinations, along with the information received on a routine and regular basis throughout the year, and, without any one factor being dispositive, the Board determined that re-approval of the Trust’s Investment Advisory Agreement and Administration Agreement with respect to the funds was in the best interests of each fund and its respective shareholders.
46
BOARD MEMBERS INFORMATION (Unaudited)
Patrick J. O’Connor (65) Chairman of the Board (2000)
Principal Occupation During Past 5Years:
Attorney, Cozen and O’Connor, P.C. since 1973, including Vice Chairman since 1980 and Chief Executive Officer and President from 2002 to 2007
Other Board Memberships and Affiliations:
Board of Consultors of Villanova University School of Law, Board Member Temple University,Trustee Philadelphia Police Foundation, Board Member Philadelphia Children’s First Fund, Board Member American College of Trial Lawyers, Fellow Historical Society of the United States District Court for the Eastern District of Pennsylvania, Director St. Jude’s Children Research Hospital Professional Advisory Board, Director Crowley Chemical, Director Franklin Security Bank,Vice Chairman International Academy of Trial Lawyers, Fellow
No. of Portfolios for which Board Member Serves: 20
Ronald R. Davenport (72) Board Member (2000)
Principal Occupation During Past 5Years:
Chairman of Sheridan Broadcasting Corporation since July 1972
Other Board Memberships and Affiliations:
American Urban Radio Networks, Co-Chairman
No. of Portfolios for which Board Member Serves: 20
Jack L. Diederich (71) Board Member (2000)
Principal Occupation During Past 5Years:
Chairman of Digital Site Systems, Inc., a privately held software company providing internet service to the construction materials industry, since July 1998
Other Board Memberships and Affiliations:
Continental Mills, a dry baking products company, Board Member Pittsburgh Parks Conservancy, Board Member
No. of Portfolios for which Board Member Serves: 20
Maureen M.Young (63) Board Member (2000)
Principal Occupation During Past 5Years:
Director of the Office of Government Relations at Carnegie Mellon University from January 2000 to December 2007
Other Board Memberships and Affiliations:
Oakland Planning and Development Corp., Board Member
No. of Portfolios for which Board Member Serves: 20
Kevin C. Phelan (64) Board Member (2000)
Principal Occupation During Past 5Years:
Mortgage Banker, Meredith & Grew, Inc. since March 1978, including President since September 2007 and Executive Vice President and Director from March 1998 to September 2007
Other Board Memberships and Affiliations:
Greater Boston Chamber of Commerce, Director Fiduciary Trust of Boston, Director Caritas Medical Center,Vice Chairman St. Elizabeth’s Medical Center of Boston, Board Member Providence College,Trustee Simmons College,Trustee Newton Country Day School, Chairman of the Board Babson College, Board of Visitors Boston University School of Public Health, Board of Visitors Boston Public Library Foundation, Director Boston Foundation, Director Boston Municipal Research Bureau, Board Member Boys and Girls Club of Boston, Board Member Boston Capital Real Estate Investment Trust, Director
No. of Portfolios for which Board Member Serves: 20
The Funds 47
BOARD MEMBERS INFORMATION (Unaudited) (continued)
Patrick J. Purcell (60) Board Member (2000)
Principal Occupation During Past 5Years:
Owner, President and Publisher of The Boston Herald since February 1994 President and Founder, jobfind.com, an employment search site on the world wide web, since July 1996 President and CEO, Herald Media since 2001
Other Board Memberships and Affiliations:
The American Ireland Fund, an organization that raises funds for philanthropic projects in Ireland, Board Member The Genesis Fund, an organization that raises funds for the specialized care and treatment of New England area children born with birth defects, mental retardation and genetic diseases, Board Member United Way of Massachusetts Bay, Board Member Greater Boston Chamber of Commerce, Board Member
No. of Portfolios for which Board Member Serves: 20
Thomas F. Ryan, Jr. (67) Board Member (2000)
Principal Occupation During Past 5Years:
Retired since April 1999
President and Chief Operating Officer of the American Stock Exchange from October 1995 to April 1999
Other Board Memberships and Affiliations:
Boston College,Trustee
Brigham & Women’s Hospital,Trustee
New York State Independent System Operator, a non-profit organization which administers a competitive wholesale market for electricity in New York State, Director RepliGen Corporation, a biopharmaceutical company, Director
No. of Portfolios for which Board Member Serves: 20
John R. Alchin (60) Board Member (2008)
Principal Occupation During Past 5Years:
Retired since 2007
Executive of Comcast Corporation, a cable services provider, from 1990 to 2007, including Executive Vice-President, Co-Chief Financial Officer and Treasurer from 2002 to 2007
Other Board Memberships and Affiliations
Big Brothers/Big Sisters of Southeastern Pennsylvania, Director Polo Ralph Lauren Corporation, a retail clothing and home furnishings company, Director Philadelphia Museum of Art, Board Member Metropolitan AIDS Neighborhood Nutrition Alliance, Board Member
No. of Portfolios for which Board Member Serves: 20
Kim D. Kelly (52) Board Member (2008)
Principal Occupation During Past 5Years:
Consultant since 2005
President, Chief Executive Officer and a Director of Arroyo Video Solutions, Inc., a video-on-demand technology company, from 2004 to 2005 Executive of Insight Communications Company, Inc., a cable services provider, from 1990 to 2003, including President from 2002 to 2003 and Chief Operating Officer from 1998 to 2003
Other Board Memberships and Affiliations:
Saint David's School,Trustee MCG Capital Corp., Director
No. of Portfolios for which Board Member Serves: 20
Once elected all Board Members serve for an indefinite term.The address of the Board Members and Officers is in c/o The Dreyfus Corporation, 200 Park Avenue, New York, NewYork 10166.Additional information about the Board Members is available in the fund’s Statement of Additional Information which can be obtained from Dreyfus free of charge by calling this toll free number: 1-800-645-6561. For Wealth Management clients, please contact your account officer or call 1-888-281-7350.
48
OFFICERS OF THE TRUST (Unaudited)
CHRISTOPHER SHELDON, President since September 2006.
As director of Investment Strategy for Mellon’s Private Wealth Management group since April 2003, Mr. Sheldon manages the analysis and development of investment and asset allocation strategies and oversees investment product research and, since June 2006, also oversees the alternative investment groups. Prior to assuming his current position, Mr. Sheldon was West Coast managing director of Mellon’s Private Wealth Management group from 2001-2003 and its regional manager from 1998-2001. He was previously a Vice President of the Trust. He is 43 years old has been employed by Mellon Bank since January 1995.
MICHAEL A. ROSENBERG, Vice President and Secretary since August 2005.
Assistant General Counsel of BNY Mellon, and an officer of 77 investment companies (comprised of 174 portfolios) managed by the Manager. He is 48 years old and has been an employee of the Manager since October 1991.
JAMES BITETTO, Vice President and Assistant Secretary since August 2005.
Senior Counsel of BNY Mellon and Secretary of the Manager, and an officer of 77 investment companies (comprised of 174 portfolios) managed by the Manager. He is 42 years old and has been an employee of the Manager since December 1996.
JONI LACKS CHARATAN, Vice President and Assistant Secretary since August 2005.
Senior Counsel of BNY Mellon, and an officer of 77 investment companies (comprised of 174 portfolios) managed by the Manager. She is 52 years old and has been an employee of the Manager since October 1988.
JOSEPH M. CHIOFFI, Vice President and Assistant Secretary since August 2005.
Senior Counsel of BNY Mellon, and an officer of 77 investment companies (comprised of 174 portfolios) managed by the Manager. He is 46 years old and has been an employee of the Manager since June 2000.
JANETTE E. FARRAGHER, Vice President and Assistant Secretary since August 2005.
Assistant General Counsel of BNY Mellon, and an officer of 77 investment companies (comprised of 174 portfolios) managed by the Manager. She is 45 years old and has been an employee of the Manager since February 1984.
JOHN B. HAMMALIAN, Vice President and Assistant Secretary since August 2005.
Managing Counsel of BNY Mellon, and an officer of 77 investment companies (comprised of 174 portfolios) managed by the Manager. He is 45 years old and has been an employee of the Manager since February 1991.
ROBERT R. MULLERY, Vice President and Assistant Secretary since August 2005.
Managing Counsel of BNY Mellon, and an officer of 77 investment companies (comprised of 174 portfolios) managed by the Manager. He is 56 years old and has been an employee of the Manager since May 1986.
JEFF PRUSNOFSKY, Vice President and Assistant Secretary since August 2005.
Managing Counsel of BNY Mellon, and an officer of 77 investment companies (comprised of 174 portfolios) managed by the Manager. He is 43 years old and has been an employee of the Manager since October 1990.
JAMES WINDELS, Treasurer since November 2001.
Director – Mutual Fund Accounting of the Manager, and an officer of 77 investment companies (comprised of 174 portfolios) managed by the Manager. He is 49 years old and has been an employee of the Manager since April 1985.
RICHARD CASSARO, Assistant Treasurer since September 2007.
Senior Accounting Manager – Money Market and Municipal Bond Funds of the Manager, and an officer of 77 investment companies (comprised of 174 portfolios) managed by the Manager. He is 49 years old and has been an employee of the Manager since September 1982.
GAVIN C. REILLY, Assistant Treasurer since December 2005.
Tax Manager of the Investment Accounting and Support Department of the Manager, and an officer of 77 investment companies (comprised of 174 portfolios) managed by the Manager. He is 40 years old and has been an employee of the Manager since April 1991.
The Funds 49
OFFICERS OF THE TRUST (Unaudited) (continued)
ROBERT ROBOL, Assistant Treasurer since December 2002.
Senior Accounting Manager – Fixed Income Funds of the Manager, and an officer of 77 investment companies (comprised of 174 portfolios) managed by the Manager. He is 44 years old and has been an employee of the Manager since October 1988.
ROBERT SALVIOLO, Assistant Treasurer since May 2007.
Senior Accounting Manager – Equity Funds of the Manager, and an officer of 77 investment companies (comprised of 174 portfolios) managed by the Manager. He is 41 years old and has been an employee of the Manager since June 1989.
ROBERT SVAGNA, Assistant Treasurer since December 2002.
Senior Accounting Manager – Equity Funds of the Manager, and an officer of 77 investment companies (comprised of 174 portfolios) managed by the Manager. He is 41 years old and has been an employee of the Manager since November 1990.
JOSEPH W. CONNOLLY, Chief Compliance Officer since October 2004.
Chief Compliance Officer of the Manager and The Dreyfus Family of Funds (77 investment companies, comprised of 174 portfolios). From November 2001 through March 2004, Mr. Connolly was first Vice-President, Mutual Fund Servicing for Mellon Global Securities Services. In that capacity, Mr. Connolly was responsible for managing Mellon’s Custody, Fund Accounting and Fund Administration services to third-party mutual fund clients. He is 51 years old and has served in various capacities with the Manager since 1980, including manager of the firm’s Fund Accounting Department from 1997 through October 2001.
WILLIAM GERMENIS, Anti-Money Laundering Compliance Officer since September 2002.
Vice President and Anti-Money Laundering Compliance Officer of the Distributor, and the Anti-Money Laundering Compliance Officer of 73 investment companies (comprised of 170 portfolios) managed by the Manager. He is 37 years old and has been an employee of the Distributor since October 1998.
50
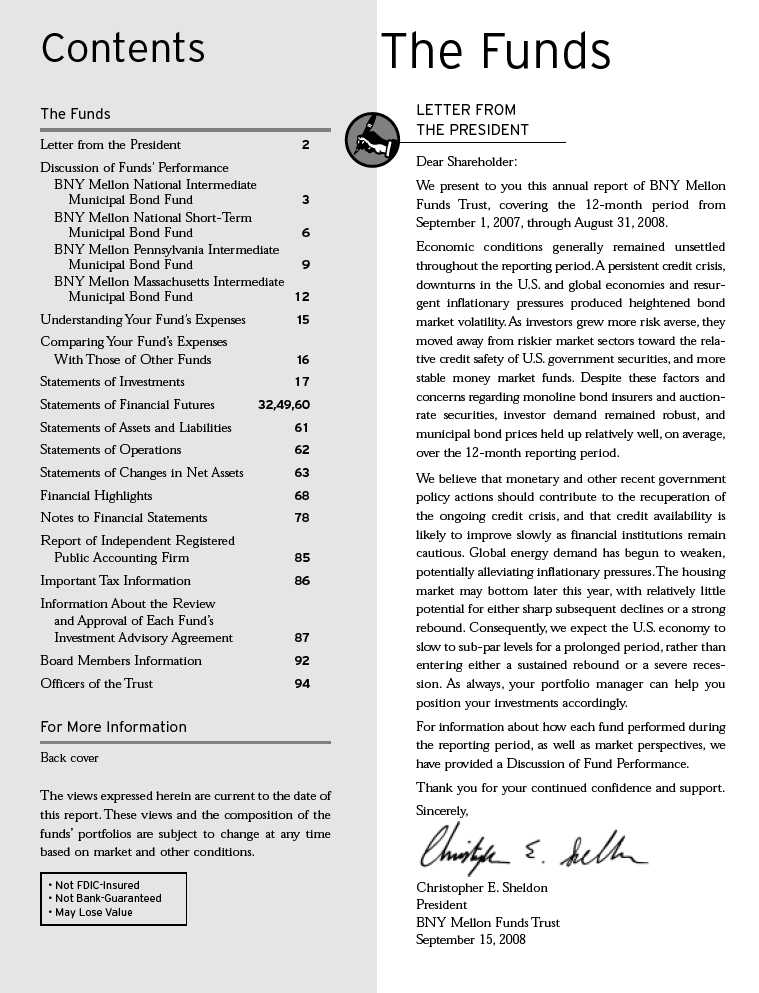

| DISCUSSION OF |
| FUND PERFORMANCE |
For the period of September 1, 2007, through August 31, 2008, as provided by John F. Flahive and Mary Collette O’Brien, Portfolio Managers
Fund and Market Performance Overview
For the 12-month period ended August 31, 2008, BNY Mellon National Intermediate Municipal Bond Fund achieved total returns of 4.32% for Class M shares, 4.06% for Investor shares and 3.46% for Dreyfus Premier shares.1 In comparison, the Lehman Brothers 7-Year Municipal Bond Index (the “Index”), the fund’s benchmark, achieved a total return of 6.71% for the same period.2
Municipal bonds were subject to heightened volatility over the reporting period due to a global credit crisis and economic downturn.The fund produced modestly lower returns relative to its benchmark, primarily due to an overweighted position in lower-rated investment-grade securities and the fund’s relatively short duration while interest rates fell.
The Fund’s Investment Approach
The fund seeks to maximize current income exempt from federal income tax to the extent consistent with the preservation of capital.To pursue its goal, the fund normally invests at least 80% of its assets in municipal bonds that provide income exempt from federal income tax. The fund may occasionally, including for temporary defensive purposes, invest in taxable bonds. The fund’s investments in municipal and taxable bonds must be rated investment grade at the time of purchase or, if unrated, deemed of comparable quality by the investment adviser.3 Generally, the fund’s average effective portfolio maturity will be between three and 10 years, and the average effective duration of the fund’s portfolio will not exceed eight years.
Rather than focusing on economic or market trends, we search for securities that, in our opinion, will help
us enhance the fund’s yield without sacrificing quality. We use a more tactical approach with respect to the fund’s average duration. If we expect the supply of securities to increase temporarily, we may reduce the fund’s average duration to make cash available for the purchase of higher-yielding securities. This is due to the fact that yields generally tend to rise if issuers are competing for investor interest. If we expect demand to surge at a time when we anticipate little issuance and therefore lower yields, we may increase the fund’s average duration to maintain current yields for as long as practical. At other times, we typically try to maintain a neutral average duration.
Credit and Economic Concerns Fueled Volatility
A credit crisis continued to dampen investor sentiment over much of the reporting period, causing prices in most segments of the U.S. bond market to fall.While municipal bonds had no exposure to the troubled sub-prime mortgages that precipitated the crisis, a number of monoline insurance companies suffered severe losses in their mortgage-backed investment portfolios, undermining confidence in insured municipal bonds. In addition, difficult liquidity conditions among auction-rate securities led to turbulence in that segment of the tax-exempt bond market.
Meanwhile, slumping housing markets, a weaker job market and soaring food and energy prices sparked a downturn in the U.S. economy, driving prices for some corporate-backed municipal bonds lower. In contrast, high-quality municipal securities supported by taxes or other dedicated revenue streams fared relatively well as demand intensified from risk-averse investors.
The Federal Reserve Board (the “Fed”) responded aggressively to these developments by injecting liquidity into the U.S. banking system and reducing short-term interest rates from 5.25% at the start of the reporting period to 2.00% at the end. As yield differences
The Funds 3
DISCUSSION OF FUND PERFORMANCE (continued)
widened along the market’s maturity range, intermediate-term municipal securities produced higher total returns than their shorter- and longer-term counterparts.
Security Selection Strategy Produced Mixed Results
Although the fund participated in the relative strength of the intermediate-term municipal bonds, its performance was hindered by its holdings of insured securities, which reverted to prices reflecting their underlying credit ratings when investors questioned the value of insurance. Similarly, the fund’s positions in unenhanced bonds toward the lower end of the investment-grade spectrum detracted from its relative performance.We had set the fund’s average duration in a position that was shorter than industry averages in anticipation of possible rate hikes from the Fed amid mounting inflationary pressures. However, inflation appeared to abate later in the reporting period, undermining our duration management strategy.
On the other hand, the fund’s lower-rated positions helped bolster its tax-exempt income stream, which supported the fund’s total return relative to its benchmark. In addition, robust demand for high-quality municipal securities, which comprised a substantial portion of the fund, contributed positively to its absolute returns.
Finding Value in an Unsettled Market
As of the end of the reporting period, the U.S. economy has continued to struggle, and the global credit crisis has intensified, suggesting that heightened volatility is likely to persist. However, in our judgment, some of the fund’s higher-yielding holdings now represent more attractive values that we believe should benefit the fund when the current bout of market uncertainty passes. Meanwhile, they offer higher levels of tax-exempt income than are currently available from higher-rated municipal bonds.
September 15, 2008
| 1 | Total return includes reinvestment of dividends and any capital gains paid and | |
| does not take into consideration the applicable contingent deferred sales charges | ||
| imposed on redemptions in the case of Dreyfus Premier shares. Past | ||
| performance is no guarantee of future results. Share price, yield and investment | ||
| return fluctuate such that upon redemption, fund shares may be worth more or | ||
| less than their original cost. Income may be subject to state and local taxes, and | ||
| some income may be subject to the federal alternative minimum tax (AMT) | ||
| for certain investors. Capital gains, if any, are fully taxable. | ||
| 2 | SOURCE: LIPPER INC. — Reflects reinvestment of dividends and, where | |
| applicable, capital gain distributions.The Lehman Brothers 7-Year Municipal | ||
| Bond Index is an unmanaged total return performance benchmark for the | ||
| investment-grade, geographically unrestricted 7-year tax-exempt bond market, | ||
| consisting of municipal bonds with maturities of 6-8 years. Index return does | ||
| not reflect the fees and expenses associated with operating a mutual fund. | ||
| 3 | The fund may continue to own investment-grade bonds (at the time of | |
| purchase), which are subsequently downgraded to below investment grade. |
4
FUND PERFORMANCE
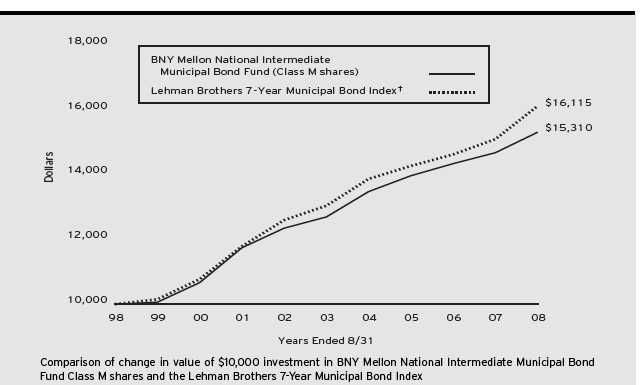
| Average Annual Total Returns as of 8/31/08 | ||||||||||
| Inception | From | |||||||||
| Date | 1 Year | 5 Years | 10 Years | Inception | ||||||
| Class M shares | 4.32% | 3.82% | 4.35% | |||||||
| Investor shares | 7/11/01 | 4.06% | 3.58% | — | 3.97% | |||||
| Dreyfus Premier shares | ||||||||||
| with applicable redemption †† | 10/11/02 | 0.46% | 2.88% | — | 2.69% | |||||
| without redemption | 10/11/02 | 3.46% | 3.05% | — | 2.69% | |||||
| † Source: Lipper Inc. |
| Past performance is not predictive of future performance.The fund’s performance shown in the graph and table does not reflect the deduction of taxes that a shareholder |
| would pay on fund distributions or the redemption of fund shares. |
| The above graph compares a $10,000 investment made in Class M shares of BNY Mellon National Intermediate Municipal Bond Fund on 8/31/98 to a $10,000 |
| investment made in the Lehman Brothers 7-Year Municipal Bond Index (the “Index”) on that date.All dividends and capital gain distributions are reinvested. |
| Effective March 31, 2008, Mellon Funds Trust changed its name to BNY Mellon Funds Trust. |
| Before the fund commenced operations, substantially all of the assets of a predecessor common trust fund (CTF) that, in all material respects, had the same investment |
| objective, policies, guidelines and restrictions as the fund were transferred to the fund. Please note that the performance of the fund’s Class M shares represents the |
| performance of the predecessor CTF through October 1, 2000, adjusted to reflect the fund’s fees and expenses, by subtracting from the actual performance of the CTF |
| the expenses of the fund’s Class M shares as they were estimated prior to the conversion of the CTF into the fund, and the performance of the fund’s Class M shares |
| thereafter.The predecessor CTF was not registered under the Investment Company Act of 1940, as amended, and therefore was not subject to certain investment |
| restrictions that might have adversely affected performance. In addition, the expenses of the fund’s Class M shares may be higher than those estimated prior to the |
| conversion of the CTF into the fund, which would lower the performance shown in the above line graph. |
| Effective July 11, 2001, existing fund shares were designated as Class M shares and the fund began offering a second class of shares designated as Investor shares, |
| which are subject to a Shareholder Services Plan. Performance for Investor shares will vary from the performance of Class M shares shown above because of the |
| differences in charges and expenses. |
| The fund’s performance shown in the line graph takes into account all applicable fees and expenses for Class M shares only.The Index is an unmanaged total return |
| performance benchmark for the investment-grade, geographically unrestricted, 7-year tax-exempt bond market, consisting of municipal bonds with maturities of 6-8 |
| years. Unlike a mutual fund, the Index is not subject to charges, fees and other expenses. Investors cannot invest directly in any index. Further information relating to |
| fund performance, including expense reimbursements, if applicable, is contained in the Financial Highlights section of the prospectus and elsewhere in this report. |
| ††The maximum contingent deferred sales charge for Dreyfus Premier shares is 3%.After six years Dreyfus Premier shares convert to Investor shares. |
The Funds 5

| DISCUSSION OF |
| FUND PERFORMANCE |
For the period of September 1, 2007, through August 31, 2008, as provided by Timothy J. Sanville and Jeremy N. Baker, Portfolio Managers
Fund and Market Performance Overview
For the 12-month period ended August 31, 2008, BNY Mellon National Short-Term Municipal Bond Fund’s Class M shares achieved a total return of 4.09%, and the fund’s Investor shares achieved a total return of 3.83% .1 In comparison, the Lehman Brothers 3-Year Municipal Bond Index (the “Index”), the fund’s benchmark achieved a total return of 6.60% for the same period.2
Municipal bonds were subject to heightened volatility over the reporting period due to a global credit crisis and economic downturn.The fund produced modestly lower returns relative to its benchmark, primarily due to an overweighted position in lower-rated investment-grade securities and the fund’s relatively short duration while interest rates fell.
The Fund’s Investment Approach
The fund seeks to maximize current income exempt from federal income tax to the extent consistent with the preservation of capital.To pursue its goal, the fund normally invests at least 80% of its assets in municipal bonds that provide income exempt from federal income tax.The fund occasionally may invest in taxable bonds, including for temporary defensive purposes.The fund’s investments in municipal and taxable bonds must be rated investment grade at the time of purchase or, if unrated, deemed of comparable quality by the investment adviser.3 Generally, the average effective portfolio maturity and the average effective portfolio duration of the fund’s portfolio will be less than three years.
Rather than focusing on economic or market trends, we search for securities that, in our opinion, will help us
enhance the fund’s yield without sacrificing quality.We use a more tactical approach with respect to the fund’s average duration. If we expect the supply of securities to increase temporarily, we may reduce the fund’s average duration to make cash available for the purchase of higher-yielding securities.This is due to the fact that yields generally tend to rise if issuers are competing for investor interest. If we expect demand to surge at a time when we anticipate little issuance and therefore lower yields,we may increase the fund’s average duration to maintain current yields for as long as practical.At other times, we typically try to maintain a neutral average duration.
Credit and Economic Concerns Fueled Volatility
A credit crisis continued to dampen investor sentiment over much of the reporting period, causing prices in most segments of the U.S. bond market to fall. While municipal bonds had no exposure to the troubled sub-prime mortgages that precipitated the crisis, a number of monoline insurance companies suffered severe losses in their mortgage-backed investment portfolios, undermining confidence in insured municipal bonds. In addition, difficult liquidity conditions among auction-rate securities led to turbulence in that segment of the tax-exempt bond market.
Meanwhile, slumping housing markets, a weaker job market and soaring food and energy prices sparked a downturn in the U.S. economy, driving prices of some corporate-backed municipal bonds lower. In contrast, high-quality municipal securities fared relatively well as demand intensified from risk-averse investors.
The Federal Reserve Board (the “Fed”) responded aggressively to these developments by injecting liquidity into the U.S. banking system and reducing short-term interest rates from 5.25% at the start of the reporting period to 2.00% at the end.As yield differences widened
6
along the market’s maturity range, intermediate-term municipal securities produced slightly higher total returns than their shorter-term counterparts.
Security Selection Strategy Produced Mixed Results
The fund’s performance was hindered by its holdings of insured municipal bonds that reverted to prices reflecting their underlying credit ratings when investors questioned the value of insurance. Similarly, the fund’s holdings of unenhanced bonds rated toward the lower end of the investment-grade spectrum detracted from its relative performance as their prices fell during the “flight to quality.” We had set the fund’s average duration in a position that was shorter than industry averages in anticipation of possible rate hikes from the Fed due to mounting inflationary pressures. However, inflation appeared to abate later in the reporting period, undermining our duration management strategy.
On the other hand, the fund’s lower-rated positions helped bolster its tax-exempt income stream, which supported the fund’s total return relative to its benchmark. In addition, robust demand for high-quality municipal securities, which comprised a substantial portion of the fund, contributed positively to its absolute returns.
Finding Value in an Unsettled Market
As of the end of the reporting period, the U.S. economy has continued to struggle, and the global credit crisis has intensified, suggesting that heightened volatility is likely to persist. However, some of the fund’s higher-yielding holdings now represent more attractive values, in our judgment, that we believe should benefit the fund when the current bout of market uncertainty passes. In the meantime, they offer higher levels of tax-exempt income than are currently available from municipal bonds with higher credit ratings.
September 15, 2008
| 1 | Total return includes reinvestment of dividends and any capital gains paid. | |
| Past performance is no guarantee of future results. Share price, yield and | ||
| investment return fluctuate such that upon redemption, fund shares may be | ||
| worth more or less than their original cost. Income may be subject to state | ||
| and local taxes, and some income may be subject to the federal alternative | ||
| minimum tax (AMT) for certain investors. Capital gains, if any, are fully | ||
| taxable. | ||
| 2 | SOURCE: LIPPER INC. — Reflects reinvestment of dividends and, | |
| where applicable, capital gain distributions.The Lehman Brothers 3-Year | ||
| Municipal Bond Index is an unmanaged total return performance | ||
| benchmark for the investment-grade, geographically unrestricted 3-year tax- | ||
| exempt bond market, consisting of municipal bonds with maturities of 2-4 | ||
| years. Index return does not reflect the fees and expenses associated with | ||
| operating a mutual fund. | ||
| 3 | The fund may continue to own investment-grade bonds (at the time of | |
| purchase), which are subsequently downgraded to below investment grade. |
The Funds 7
FUND PERFORMANCE
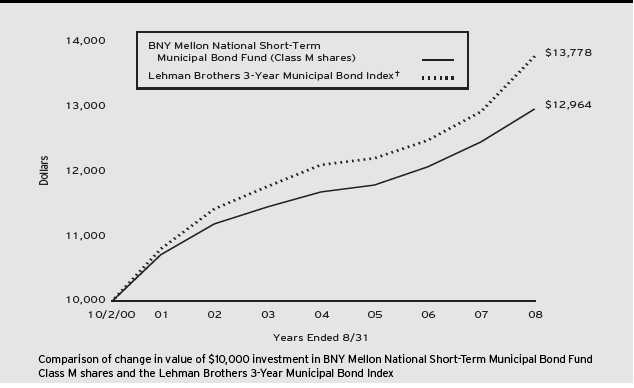
| Average Annual Total Returns as of 8/31/08 | ||||||||
| Inception | From | |||||||
| Date | 1 Year | 5 Years | Inception | |||||
| Class M shares | 10/2/00 | 4.09% | 2.51% | 3.33% | ||||
| Investor shares | 7/11/01 | 3.83% | 2.26% | 2.66% | ||||
| † Source: Lipper Inc. |
| Past performance is not predictive of future performance.The fund’s performance shown in the graph and table does not reflect the deduction of taxes that a shareholder |
| would pay on fund distributions or the redemption of fund shares. |
| The above graph compares a $10,000 investment made in Class M shares of BNY Mellon National Short-Term Municipal Bond Fund on 10/2/00 (inception |
| date) to a $10,000 investment made in the Lehman Brothers 3-Year Municipal Bond Index (the “Index”) on that date. For comparative purposes, the value of the |
| Index on 9/30/00 is used as the beginning value on 10/2/00.All dividends and capital gain distributions are reinvested. |
| Effective March 31, 2008, Mellon Funds Trust changed its name to BNY Mellon Funds Trust. |
| Effective July 11, 2001, existing fund shares were designated as Class M shares and the fund began offering a second class of shares designated as Investor shares, |
| which are subject to a Shareholder Services Plan. Performance for Investor shares will vary from the performance of Class M shares shown above because of the |
| differences in charges and expenses. |
| The fund’s performance shown in the line graph takes into account all applicable fees and expenses for Class M shares only.The Index is an unmanaged total return |
| performance benchmark for the investment-grade, geographically unrestricted, 3-year tax-exempt bond market, consisting of municipal bonds with maturities of 2-4 |
| years. Unlike a mutual fund, the Index is not subject to charges, fees and other expenses. Investors cannot invest directly in any index. Further information relating to |
| fund performance, including expense reimbursements, if applicable, is contained in the Financial Highlights section of the prospectus and elsewhere in this report. |
8

| DISCUSSION OF |
| FUND PERFORMANCE |
For the period of September 1, 2007, through August 31, 2008, as provided by Mary Collette O’Brien and Jeremy N. Baker, Portfolio Managers
Fund and Market Performance Overview
For the 12-month period ended August 31, 2008, BNY Mellon Pennsylvania Intermediate Municipal Bond Fund’s Class M shares achieved a total return of 3.43%, and the fund’s Investor shares achieved a total return of 3.17% .1 In comparison, the Lehman Brothers 7-Year Municipal Bond Index (the “Index”), the fund’s benchmark, achieved a total return of 6.71% for the same period.2
Municipal bonds encountered heightened volatility over the reporting period due to a global credit crisis and economic downturn.The fund produced modestly lower returns relative to its benchmark, primarily due to overweighted exposure to lower-rated investment-grade securities and a relatively short duration while interest rates fell.
The Fund’s Investment Approach
The fund seeks as high a level of income exempt from federal and Pennsylvania state income taxes as is consistent with the preservation of capital. To pursue its goal, the fund normally invests at least 80% of its assets in municipal bonds, the interest from which is exempt from federal and Pennsylvania state personal income taxes.The fund may also invest in municipal bonds that are exempt from federal income taxes, but not Pennsylvania personal income taxes, and in taxable bonds.The fund’s investments in municipal and taxable bonds must be rated investment grade at the time of purchase or, if unrated, deemed of comparable quality by the investment adviser.3 Generally, the fund’s average effective portfolio maturity will be between three and 10 years, and the average effective duration of the fund’s portfolio will not exceed eight years.
Rather than focusing on economic or market trends, we search for securities that, in our opinion, will help us enhance the fund’s yield without sacrificing quality. We use a more tactical approach with respect to the fund’s average duration. If we expect the supply of securities to increase temporarily, we may reduce the fund’s average duration to make cash available for the purchase of higher-yielding securities. This is due to the fact that yields generally tend to rise if issuers are competing for investor interest. If we expect demand to surge at a time when we anticipate little issuance and therefore lower yields, we may increase the fund’s average duration to maintain current yields for as long as practical.At other times, we typically try to maintain a neutral average duration.
Credit and Economic Concerns Fueled Volatility
A credit crisis continued to dampen investor sentiment over much of the reporting period. While municipal bonds had no exposure to the troubled sub-prime mortgages that precipitated the crisis, a number of monoline insurance companies suffered severe losses, undermining confidence in insured municipal bonds. In addition, difficult liquidity conditions among auction-rate securities led to turbulence in that segment of the tax-exempt bond market.
Meanwhile, slumping housing markets, a weaker job market and soaring commodity prices sparked a U.S. economic downturn, driving prices of corporate-backed municipal bonds lower. In contrast, high-quality municipal securities supported by taxes or dedicated revenue streams fared relatively well as demand investor intensified. In addition, while Pennsylvania was affected by the national economic downturn, its fiscal condition generally remained sound during the reporting period.
The Federal Reserve Board (the “Fed”) responded aggressively to economic and market developments by injecting liquidity into the U.S. banking system and
The Funds 9
DISCUSSION OF FUND PERFORMANCE (continued)
reducing short-term interest rates from 5.25% to 2.00% during the reporting period.As yield differences widened along the market’s maturity range, intermediate-term municipal securities produced higher total returns than their shorter- and longer-term counterparts.
Security Selection Strategy Produced Mixed Results
Although the fund participated in the relative strength of intermediate-term municipal bonds, its performance was hindered by its holdings of insured securities, which reverted to prices reflecting their underlying credit ratings when investors questioned the value of insurance. Similarly, the fund’s positions in unenhanced bonds toward the lower end of the investment-grade spectrum detracted from its relative performance.We had set the fund’s average duration in a position that was shorter than industry averages in anticipation of possible rate hikes from the Fed amid mounting inflationary pressures, but this strategy was undermined when inflation appeared to abate later in the reporting period.
On the other hand, the fund’s lower-rated positions helped bolster its tax-exempt income stream, supporting the fund’s total returns. In addition, robust demand for high-quality municipal securities, which comprised a substantial portion of the fund, contributed positively to its absolute returns.
Finding Opportunities in an Unsettled Market
As of the end of the reporting period, the U.S. economy has continued to struggle and the global credit crisis has intensified, suggesting that heightened volatility is likely to persist. However, in our judgment, some of the fund’s higher-yielding holdings now represent more attractive values that we believe should benefit the fund when the current bout of market uncertainty passes. Meanwhile, they offer higher levels of tax-exempt income than are currently available from higher-rated municipal bonds.
| September 15, 2008 |
| 1 | Total return includes reinvestment of dividends and any capital gains paid. | |
| Past performance is no guarantee of future results. Share price, yield and | ||
| investment return fluctuate such that upon redemption, fund shares may be | ||
| worth more or less than their original cost. Income may be subject to state and | ||
| local taxes for non-Pennsylvania residents, and some income may be subject to | ||
| the federal alternative minimum tax (AMT) for certain investors. Capital | ||
| gains, if any, are fully taxable. | ||
| 2 | SOURCE: LIPPER INC. — Reflects reinvestment of dividends and, | |
| where applicable, capital gain distributions.The Lehman Brothers 7-Year | ||
| Municipal Bond Index is an unmanaged total return performance benchmark | ||
| for the investment-grade, geographically unrestricted 7-year tax-exempt bond | ||
| market, consisting of municipal bonds with maturities of 6-8 years. Index | ||
| return does not reflect the fees and expenses associated with operating a | ||
| mutual fund. | ||
| 3 | The fund may continue to own investment-grade bonds (at the time of | |
| purchase), which are subsequently downgraded to below investment grade. |
10
FUND PERFORMANCE
![]()
| Average Annual Total Returns as of 8/31/08 | ||||||||||
| Inception | From | |||||||||
| Date | 1 Year | 5 Years | 10 Years | Inception | ||||||
| Class M shares | 3.43% | 3.30% | 3.85% | |||||||
| Investor shares | 7/11/01 | 3.17% | 3.02% | — | 3.43% | |||||
| † Source: Lipper Inc. |
| Past performance is not predictive of future performance.The fund’s performance shown in the graph and table does not reflect the deduction of taxes that a shareholder |
| would pay on fund distributions or the redemption of fund shares. |
| The above graph compares a $10,000 investment made in Class M shares of BNY Mellon Pennsylvania Intermediate Municipal Bond Fund on 8/31/98 to a |
| $10,000 investment made in the Lehman Brothers 7-Year Municipal Bond Index (the “Index”) on that date.All dividends and capital gain distributions are reinvested. |
| Effective March 31, 2008, Mellon Funds Trust changed its name to BNY Mellon Funds Trust. |
| Before the fund commenced operations, substantially all of the assets of a predecessor common trust fund (CTF) that, in all material respects, had the same investment |
| objective, policies, guidelines and restrictions as the fund were transferred to the fund. Please note that the performance of the fund’s Class M shares represents the |
| performance of the predecessor CTF through October 1, 2000, adjusted to reflect the fund’s fees and expenses, by subtracting from the actual performance of the CTF |
| the expenses of the fund’s Class M shares as they were estimated prior to the conversion of the CTF into the fund, and the performance of the fund’s Class M shares |
| thereafter.The predecessor CTF was not registered under the Investment Company Act of 1940, as amended, and therefore was not subject to certain investment |
| restrictions that might have adversely affected performance. In addition, the expenses of the fund’s Class M shares may be higher than those estimated prior to the |
| conversion of the CTF into the fund, which would lower the performance shown in the above line graph. |
| Effective July 11, 2001, existing fund shares were designated as Class M shares and the fund began offering a second class of shares designated as Investor shares, |
| which are subject to a Shareholder Services Plan. Performance for Investor shares will vary from the performance of Class M shares shown above because of the |
| differences in charges and expenses. |
| The fund invests primarily in Pennsylvania investment-grade municipal bonds.The fund’s performance shown in the line graph takes into account all applicable fees |
| and expenses for Class M shares only.The Index is not limited to investments principally in Pennsylvania municipal obligations.The Index is an unmanaged total |
| return performance benchmark for the investment-grade, geographically unrestricted, 7-year tax-exempt bond market, consisting of municipal bonds with maturities of |
| 6-8 years. Unlike a mutual fund, the Index is not subject to charges, fees and other expenses. Investors cannot invest directly in any index.These factors can contribute |
| to the Index potentially outperforming the fund. Further information relating to fund performance, including expense reimbursements, if applicable, is contained in the |
| Financial Highlights section of the prospectus and elsewhere in this report. |
The Funds 11

| DISCUSSION OF |
| FUND PERFORMANCE |
For the period of September 1, 2007, through August 31, 2008, as provided by John F. Flahive and Mary Collette O’Brien, Portfolio Managers
Fund and Market Performance Overview
For the 12-month period ended August 31, 2008, BNY Mellon Massachusetts Intermediate Municipal Bond Fund achieved total returns of 5.02% for Class M shares, 4.76% for Investor shares and 4.25% for Dreyfus Premier shares.1 In comparison, the Lehman Brothers 7-Year Municipal Bond Index (the “Index”), the fund’s benchmark, achieved a total return of 6.71% for the same period.2
Municipal bonds encountered heightened volatility over the reporting period due to a global credit crisis and economic downturn.The fund produced modestly lower returns relative to its benchmark, primarily due to overweighted exposure to lower-rated investment-grade securities and a relatively short duration while interest rates fell.
The Fund’s Investment Approach
The fund seeks as high a level of income exempt from federal and Massachusetts state income taxes as is consistent with the preservation of capital. To pursue its goal, the fund normally invests at least 80% of its assets in municipal bonds, the interest from which is exempt from federal and Massachusetts state personal income taxes.The fund may also invest in municipal bonds that are exempt from federal income taxes, but not Massachusetts personal income taxes, and in taxable bonds.The fund’s investments in municipal and taxable bonds must be rated investment grade at the time of purchase or, if unrated, deemed of comparable quality by the investment adviser.3 Generally, the fund’s average effective portfolio maturity will be between three and
10 years, and the average effective duration of the fund’s portfolio will not exceed eight years.
Rather than focusing on economic or market trends, we search for securities that, in our opinion, will help us enhance the fund’s yield without sacrificing quality.We use a more tactical approach with respect to the fund’s average duration. If we expect the supply of securities to increase temporarily, we may reduce the fund’s average duration to make cash available for the purchase of higher yielding securities.This is because yields generally tend to rise if issuers are competing for investor interest. If we expect demand to surge at a time when we anticipate little issuance and therefore lower yields, we may increase the fund’s average duration to maintain current yields for as long as practical.At other times, we typically try to maintain a neutral average duration.
Credit and Economic Concerns Fueled Volatility
A credit crisis continued to dampen investor sentiment over much of the reporting period. While municipal bonds had no exposure to the troubled sub-prime mortgages that precipitated the crisis, a number of monoline insurance companies suffered severe losses, undermining confidence in insured municipal bonds. In addition, difficult liquidity conditions among auction-rate securities led to turbulence in that segment of the tax-exempt bond market.
Meanwhile, slumping housing markets, a weaker job market and soaring commodity prices sparked a U.S. economic downturn, driving prices of corporate-backed municipal bonds lower. In contrast, high-quality municipal securities supported by taxes or dedicated revenue streams fared relatively well as investor demand intensified. In addition, while Massachusetts was affected by the
12
national economic downturn, its fiscal condition generally remained sound during the reporting period.
The Federal Reserve Board (the “Fed”) responded aggressively to economic and market developments by injecting liquidity into the U.S. banking system and reducing short-term interest rates from 5.25% to 2.00% during the reporting period.As yield differences widened along the market’s maturity range, intermediate-term municipal securities produced higher total returns than their shorter- and longer-term counterparts.
Security Selection Strategy Produced Mixed Results
Although the fund participated in the relative strength of intermediate-term municipal bonds, its performance was hindered by its holdings of insured securities, which reverted to prices reflecting their underlying credit ratings when investors questioned the value of insurance. Similarly, the fund’s positions in unenhanced bonds toward the lower end of the investment-grade spectrum detracted from its relative performance.We had set the fund’s average duration in a position that was shorter than industry averages in anticipation of possible rate hikes from the Fed amid mounting inflationary pressures, but this strategy was undermined when inflation appeared to abate later in the reporting period.
On the other hand, the fund’s lower-rated positions helped bolster its tax-exempt income stream, supporting the fund’s total returns. In addition, robust demand for high-quality municipal securities, which comprised a substantial portion of the fund, contributed positively to its absolute returns.
Finding Opportunities in an Unsettled Market
As of the end of the reporting period, the U.S. economy has continued to struggle and the global credit crisis has intensified, suggesting that heightened volatility is likely to persist. However, in our judgment, some of the fund’s higher-yielding holdings now represent more attractive values that we believe should benefit the fund when the current bout of market uncertainty passes. Meanwhile, they offer higher levels of tax-exempt income than are currently available from higher-rated municipal bonds.
September 15, 2008
| 1 | Total return includes reinvestment of dividends and any capital gains paid | |
| and does not take into consideration the applicable contingent deferred sales | ||
| charges imposed on redemptions in the case of Dreyfus Premier shares. Past | ||
| performance is no guarantee of future results. Share price, yield and | ||
| investment return fluctuate such that upon redemption, fund shares may be | ||
| worth more or less than their original cost. Income may be subject to state | ||
| and local taxes for non-Massachusetts residents, and some income may be | ||
| subject to the federal alternative minimum tax (AMT) for certain investors. | ||
| Capital gains, if any, are fully taxable. Return figures reflect the absorption | ||
| of certain fund expenses by The Bank of NewYork Mellon pursuant to an | ||
| agreement in effect through September 30, 2007, at which time it was | ||
| terminated. Had these expenses not been absorbed, the fund’s returns | ||
| would have been lower. | ||
| 2 | SOURCE: LIPPER INC. — Reflects reinvestment of dividends and, | |
| where applicable, capital gain distributions.The Lehman Brothers 7-Year | ||
| Municipal Bond Index is an unmanaged total return performance | ||
| benchmark for the investment-grade, geographically unrestricted 7-year tax- | ||
| exempt bond market, consisting of municipal bonds with maturities of 6-8 | ||
| years. Index return does not reflect the fees and expenses associated with | ||
| operating a mutual fund. | ||
| 3 | The fund may continue to own investment-grade bonds (at the time of | |
| purchase), which are subsequently downgraded to below investment grade. |
The Funds 13
FUND PERFORMANCE
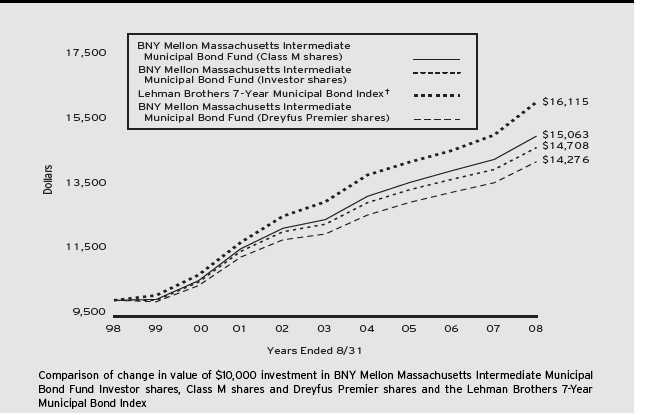
| Average Annual Total Returns as of 8/31/08 | ||||||
| 1 Year | 5 Years | 10 Years | ||||
| Investor shares | 4.76% | 3.56% | 3.93% | |||
| Class M shares | 5.02% | 3.82% | 4.18% | |||
| Dreyfus Premier shares | ||||||
| with applicable redemption †† | 1.25% | 2.87% | 3.62% | |||
| without redemption | 4.25% | 3.05% | 3.62% |
| † Source: Lipper Inc. |
| Past performance is not predictive of future performance. |
| The above graph compares a $10,000 investment made in Class M shares, Investor shares and Dreyfus Premier shares of BNY Mellon Massachusetts Intermediate |
| Municipal Bond Fund (the “BNY Mellon Massachusetts Fund”) on 8/31/98 to a $10,000 investment made in the Lehman Brothers 7-Year Municipal Bond |
| Index (the “Index”) on that date.All dividends and capital gain distributions are reinvested. |
| Effective March 31, 2008, Mellon Funds Trust changed its name to BNY Mellon Funds Trust. |
| As of the close of business on September 6, 2002, substantially all of the assets of another investment company managed by Dreyfus, Dreyfus Premier Limited Term |
| Massachusetts Municipal Fund (the “Premier Massachusetts Fund”), were transferred to the BNY Mellon Massachusetts Fund in a tax-free reorganization and the |
| fund commenced operations.The performance shown in the line graph for Class M shares represents the performance of the Premier Massachusetts Fund’s Class R |
| shares prior to the commencement of operations of the BNY Mellon Massachusetts Fund and the performance of the BNY Mellon Massachusetts Fund’s Class M |
| shares thereafter.The performance shown in the line graph for Investor shares represents the performance of the Premier Massachusetts Fund’s Class A shares prior to |
| the commencement of operations of the BNY Mellon Massachusetts Fund, and the performance of the BNY Mellon Massachusetts Fund’s Investor shares thereafter. |
| The fund’s performance shown in the line graph takes into account all applicable fees and expenses for all share classes.The Index, unlike the fund, is an unmanaged |
| total return performance benchmark for the investment-grade, geographically unrestricted 7-year tax-exempt bond market consisting of municipal bonds with maturities of |
| 6-8 years. Unlike a mutual fund, the Index is not subject to charges, fees and other expenses and is not limited to investments principally in Massachusetts municipal |
| obligations. Investors cannot invest directly in any index.These factors can contribute to the Index outperforming or underperforming the fund. Further information relating |
| to fund performance, including expense reimbursements, if applicable, is contained in the Financial Highlights section of the prospectus and elsewhere in this report. |
| Performance for Dreyfus Premier shares assumes the conversion of Dreyfus Premier shares to Investor shares at the end of the sixth year following the date of purchase. |
| †† The maximum contingent deferred sales charge for Dreyfus Premier shares is 3%.After six years Dreyfus Premier shares convert to Investor shares. |
14
UNDERSTANDING YOUR FUND’S EXPENSES (Unaudited)
As a mutual fund investor, you pay ongoing expenses, such as management fees and other expenses. Using the information below, you can estimate how these expenses affect your investment and compare them with the expenses of other funds.You also may pay one-time transaction expenses, including sales charges (loads) and redemptions fees, which are not shown in this section and would have resulted in higher total expenses. For more information, see your fund’s prospectus or talk to your financial adviser.
Review your fund’s expenses
The table below shows the expenses you would have paid on a $1,000 investment in each class of each Mellon municipal bond fund from March 1, 2008 to August 31, 2008. It also shows how much a $1,000 investment would be worth at the close of the period, assuming actual returns and expenses.
| Expenses and Value of a $1,000 Investment | ||||||
| assuming actual returns for the six months ended August 31, 2008 | ||||||
| Dreyfus | ||||||
| Class M Shares | Investor Shares | Premier Shares | ||||
| BNY Mellon National Intermediate | ||||||
| Municipal Bond Fund | ||||||
| Expenses paid per $1,000† | $ 2.62 | $ 3.90 | $ 6.46 | |||
| Ending value (after expenses) | $1,042.00 | $1,041.60 | $1,038.20 | |||
| BNY Mellon National Short-Term | ||||||
| Municipal Bond Fund | ||||||
| Expenses paid per $1,000† | $ 2.74 | $ 4.01 | — | |||
| Ending value (after expenses) | $1,019.30 | $1,018.00 | — | |||
| BNY Mellon Pennsylvania Intermediate | ||||||
| Municipal Bond Fund | ||||||
| Expenses paid per $1,000† | $ 3.37 | $ 4.64 | — | |||
| Ending value (after expenses) | $1,032.00 | $1,029.90 | — | |||
| BNY Mellon Massachusetts Intermediate | ||||||
| Municipal Bond Fund | ||||||
| Expenses paid per $1,000† | $ 2.72 | $ 4.00 | $ 6.56 | |||
| Ending value (after expenses) | $1,041.90 | $1,040.60 | $1,038.00 |
| † Expenses are equal to the BNY Mellon National Intermediate Municipal Bond Fund annualized expense ratio of .51% for Class M, .76% for Investor shares and 1.26% for |
| Dreyfus Premier shares, BNY Mellon National Short-Term Municipal Bond Fund .54% for Class M and .79% for Investor shares, BNY Mellon Pennsylvania Intermediate |
| Municipal Bond Fund .66% for Class M and .91% for Investor shares and BNY Mellon Massachusetts Intermediate Municipal Bond Fund .53% for Class M, .78% for Investor |
| shares and 1.28% for Dreyfus Premier shares, multiplied by the respective fund’s average account value over the period, multiplied by 184/366 (to reflect the one-half year period). |
The Funds 15
COMPARING YOUR FUND’S EXPENSES WITH THOSE OF OTHER FUNDS (Unaudited)
Using the SEC’s method to compare expenses
The Securities and Exchange Commission (SEC) has established guidelines to help investors assess fund expenses. Per these guidelines, the table below shows your fund’s expenses based on a $1,000 investment, assuming a hypothetical 5% annualized return.You can use this information to compare the ongoing expenses (but not transaction expenses or total cost) of investing in the fund with those of other funds.All mutual fund shareholder reports will provide this information to help you make this comparison. Please note that you cannot use this information to estimate your actual ending account balance and expenses paid during the period.
| Expenses and Value of a $1,000 Investment | ||||||
| assuming a hypothetical 5% annualized return for the six months ended August 31, 2008 | ||||||
| Dreyfus | ||||||
| Class M Shares | Investor Shares | Premier Shares | ||||
| BNY Mellon National Intermediate | ||||||
| Municipal Bond Fund | ||||||
| Expenses paid per $1,000† | $ 2.59 | $ 3.86 | $ 6.39 | |||
| Ending value (after expenses) | $1,022.57 | $1,021.32 | $1,018.80 | |||
| BNY Mellon National Short-Term | ||||||
| Municipal Bond Fund | ||||||
| Expenses paid per $1,000† | $ 2.75 | $ 4.01 | — | |||
| Ending value (after expenses) | $1,022.42 | $1,021.17 | — | |||
| BNY Mellon Pennsylvania Intermediate | ||||||
| Municipal Bond Fund | ||||||
| Expenses paid per $1,000† | $ 3.35 | $ 4.64 | — | |||
| Ending value (after expenses) | $1,021.82 | $1,020.56 | — | |||
| BNY Mellon Massachusetts Intermediate | ||||||
| Municipal Bond Fund | ||||||
| Expenses paid per $1,000† | $ 2.69 | $ 3.96 | $ 6.50 | |||
| Ending value (after expenses) | $1,022.47 | $1,021.22 | $1,018.70 | |||
| † Expenses are equal to the BNY Mellon National Intermediate Municipal Bond Fund annualized expense ratio of .51% for Class M, .76% for Investor shares and 1.26% for |
| Dreyfus Premier shares, BNY Mellon National Short-Term Municipal Bond Fund .54% for Class M and .79% for Investor shares, BNY Mellon Pennsylvania Intermediate |
| Municipal Bond Fund .66% for Class M and .91% for Investor shares and BNY Mellon Massachusetts Intermediate Municipal Bond Fund .53% for Class M, .78% for Investor |
| shares and 1.28% for Dreyfus Premier shares, multiplied by the respective fund’s average account value over the period, multiplied by 184/366 (to reflect the one-half year period). |
16
| STATEMENT OF INVESTMENTS |
| August 31, 2008 |
| BNY Mellon National Intermediate Municipal Bond Fund | ||||||||
| Long-Term Municipal | Coupon | Maturity | Principal | |||||
| Investments—92.6% | Rate (%) | Date | Amount ($) | Value ($) | ||||
| Alabama—2.7% | ||||||||
| Alabama Public School and College Authority, | ||||||||
| Capital Improvement Bonds | 5.63 | 7/1/13 | 3,000,000 | 3,130,830 | ||||
| Birmingham Special Care Facilities Financing Authority- | ||||||||
| Baptist Medical Centers, Revenue (Baptist Health System, Inc.) | 5.00 | 11/15/15 | 5,260,000 | 5,278,568 | ||||
| Jefferson County, Limited Obligation School Warrants | 5.25 | 1/1/16 | 4,810,000 | 4,244,103 | ||||
| Jefferson County, Limited Obligation School Warrants | 5.00 | 1/1/24 | 13,500,000 | 12,206,565 | ||||
| Montgomery BMC Special Care Facilities Financing Authority, | ||||||||
| Revenue (Baptist Health) (Insured; MBIA, Inc.) | 5.00 | 11/15/13 | 1,365,000 | 1,500,927 | ||||
| Montgomery BMC Special Care Facilities Financing Authority, | ||||||||
| Revenue (Baptist Health) (Insured; MBIA, Inc.) | 5.00 | 11/15/14 | 2,500,000 | 2,767,125 | ||||
| Alaska—.1% | ||||||||
| Anchorage, Electric Utility Revenue (Insured; MBIA, Inc.) | 8.00 | 12/1/10 | 1,000,000 | 1,122,560 | ||||
| Arizona—3.0% | ||||||||
| Arizona Transportation Board, Highway Revenue | 5.00 | 7/1/26 | 5,000,000 | 5,249,450 | ||||
| Maricopa County Unified School District | ||||||||
| (Paradise Valley) (Insured; MBIA, Inc.) | 6.35 | 7/1/10 | 550,000 | 589,358 | ||||
| Maricopa County Unified School District | ||||||||
| (Paradise Valley) (Insured; MBIA, Inc.) | 7.00 | 7/1/11 | 1,905,000 | 2,129,047 | ||||
| Maricopa County Unified School District (Scottsdale School) | 6.60 | 7/1/12 | 1,250,000 | 1,429,525 | ||||
| Phoenix, GO | 6.25 | 7/1/16 | 1,250,000 | 1,502,800 | ||||
| Phoenix Civic Improvement Corporation, Transit Excise | ||||||||
| Tax Revenue (Light Rail Project) (Insured; AMBAC) | 5.00 | 7/1/16 | 6,000,000 | 6,454,860 | ||||
| Salt River Project Agricultural Improvement | ||||||||
| and Power District, Electric System Revenue | 5.00 | 1/1/10 | 1,000,000 | 1,040,490 | ||||
| Salt River Project Agricultural Improvement | ||||||||
| and Power District, Electric System Revenue | 5.00 | 1/1/17 | 1,000,000 | 1,079,500 | ||||
| Salt Verde Financial Corporation, Senior Gas Revenue | 5.25 | 12/1/28 | 5,000,000 | 4,557,800 | ||||
| Salt Verde Financial Corporation, Senior Gas Revenue | 5.50 | 12/1/29 | 3,085,000 | 2,879,755 | ||||
| Scottsdale Industrial Development Authority, | ||||||||
| HR (Scottsdale Healthcare) | 5.70 | 12/1/11 | 1,000,000 a | 1,106,910 | ||||
| Tucson, GO | 5.00 | 7/1/12 | 1,265,000 | 1,374,233 | ||||
| University Medical Center Corporation, HR | 5.25 | 7/1/16 | 2,310,000 | 2,348,115 | ||||
| California—13.7% | ||||||||
| Agua Caliente Band, Cahuilla Indians Revenue | 5.60 | 7/1/13 | 1,815,000 | 1,783,401 | ||||
| Alameda Corridor Transportation Authority, | ||||||||
| Revenue (Insured; AMBAC) | 0/5.25 | 10/1/21 | 5,000,000 b | 4,268,700 | ||||
| California, Economic Recovery Bonds | 5.00 | 7/1/16 | 15,400,000 | 16,289,812 | ||||
| California, GO | 6.60 | 2/1/09 | 510,000 | 520,470 | ||||
| California, GO | 5.00 | 11/1/11 | 655,000 a | 709,640 | ||||
| California, GO | 5.00 | 11/1/12 | 345,000 | 366,718 | ||||
| California, GO | 5.50 | 6/1/20 | 270,000 | 281,659 | ||||
| California, GO | 5.25 | 11/1/26 | 10,500,000 | 10,727,850 | ||||
| California, GO | 5.50 | 11/1/33 | 3,900,000 | 3,978,702 | ||||
The Funds 17
STATEMENT OF INVESTMENTS (continued)
| BNY Mellon National Intermediate Municipal Bond Fund (continued) | ||||||||
| Long-Term Municipal | Coupon | Maturity | Principal | |||||
| Investments (continued) | Rate (%) | Date | Amount ($) | Value ($) | ||||
| California (continued) | ||||||||
| California, GO (Insured; FGIC) | 5.75 | 3/1/09 | 80,000 | 81,526 | ||||
| California, GO (Various Purpose) | 5.00 | 2/1/14 | 1,825,000 a | 2,022,356 | ||||
| California County Tobacco Securitization Agency, | ||||||||
| Tobacco Settlement Asset-Backed Bonds | ||||||||
| (Golden Gate Tobacco Funding Corporation) | 4.50 | 6/1/21 | 3,300,000 | 3,026,760 | ||||
| California County Tobacco Securitization Agency, | ||||||||
| Tobacco Settlement Asset-Backed Bonds | ||||||||
| (Los Angeles County Securitization Corporation) | 0/5.25 | 6/1/21 | 1,250,000 b | 955,475 | ||||
| California Department of Water Resources, Power Supply Revenue | 5.00 | 5/1/18 | 10,000,000 | 10,907,300 | ||||
| California Department of Water Resources, | ||||||||
| Power Supply Revenue (Insured; AMBAC) | 5.38 | 5/1/12 | 5,000,000 a | 5,562,700 | ||||
| California Infrastructure and Economic Development Bank, | ||||||||
| Clean Water State Revolving Fund Revenue | 5.00 | 10/1/17 | 2,500,000 | 2,678,050 | ||||
| California Municipal Finance Authority, | ||||||||
| SWDR (Waste Management, Inc. Project) | 4.10 | 9/1/09 | 1,000,000 | 996,930 | ||||
| California State Public Works Board, LR (Department of | ||||||||
| General Services) (Capitol East End Complex— | ||||||||
| Blocks 171-174 and 225) (Insured; AMBAC) | 5.25 | 12/1/19 | 5,000,000 | 5,193,250 | ||||
| California Statewide Communities Development Authority, | ||||||||
| Insured Revenue (Saint Joseph Health System) (Insured; FSA) | 4.50 | 7/1/18 | 4,670,000 | 4,800,713 | ||||
| California Statewide Communities Development Authority, | ||||||||
| MFHR (Equity Residential/Parkview Terrace Club Apartments) | 5.20 | 6/15/09 | 3,000,000 | 3,033,210 | ||||
| California Statewide Communities Development Authority, | ||||||||
| Revenue (Daughters of Charity Health System) | 5.25 | 7/1/24 | 3,470,000 | 3,313,468 | ||||
| California Statewide Communities Development Authority, | ||||||||
| Revenue (Daughters of Charity Health System) | 5.25 | 7/1/35 | 8,000,000 | 7,174,560 | ||||
| Foothill/Eastern Transportation Corridor Agency, | ||||||||
| Toll Road Revenue (Insured; MBIA, Inc.) | 0/5.80 | 1/15/20 | 1,505,000 b | 1,550,692 | ||||
| Foothill/Eastern Transportation Corridor Agency, | ||||||||
| Toll Road Revenue (Insured; MBIA, Inc.) | 0/5.88 | 1/15/26 | 8,000,000 b | 8,108,960 | ||||
| Golden State Tobacco Securitization Corporation, | ||||||||
| Enhanced Tobacco Settlement Asset-Backed Bonds | 5.00 | 6/1/18 | 675,000 | 675,101 | ||||
| Golden State Tobacco Securitization Corporation, | ||||||||
| Tobacco Settlement Asset-Backed Bonds | 4.50 | 6/1/27 | 9,305,000 | 8,342,584 | ||||
| Hesperia Public Financing Authority, Revenue | ||||||||
| (Redevelopment and Housing Projects) (Insured; XLCA) | 5.00 | 9/1/37 | 4,450,000 | 3,936,069 | ||||
| Kern High School District, GO (Insured; MBIA, Inc.) | 6.40 | 2/1/12 | 2,750,000 | 2,975,913 | ||||
| Los Angeles Department of Water and Power, | ||||||||
| Power System Revenue (Insured; MBIA, Inc.) | 5.25 | 7/1/11 | 2,250,000 | 2,412,068 | ||||
| Los Angeles Unified School District, GO (Insured; MBIA, Inc.) | 5.75 | 7/1/16 | 2,000,000 | 2,300,880 | ||||
| Oakland Joint Powers Financing Authority, LR | ||||||||
| (Oakland Convention Centers) (Insured; AMBAC) | 5.50 | 10/1/13 | 1,500,000 | 1,617,510 | ||||
| Sacramento County Sanitation Districts Financing | ||||||||
| Authority, Revenue (Sacramento Regional | ||||||||
| County Sanitation District) (Insured; AMBAC) | 5.00 | 12/1/14 | 10,000,000 a | 11,188,200 | ||||
18
| BNY Mellon National Intermediate Municipal Bond Fund (continued) | ||||||||
| Long-Term Municipal | Coupon | Maturity | Principal | |||||
| Investments (continued) | Rate (%) | Date | Amount ($) | Value ($) | ||||
| California (continued) | ||||||||
| Sacramento Municipal Utility District, Electric Revenue | 5.30 | 7/1/12 | 720,000 | 759,334 | ||||
| Sacramento Municipal Utility District, | ||||||||
| Electric Revenue (Insured; FGIC) | 5.25 | 5/15/13 | 3,530,000 | 3,819,884 | ||||
| San Jose Redevelopment Agency, Tax Allocation Revenue | ||||||||
| (Merged Area Redevelopment Project) (Insured; MBIA, Inc.) | 6.00 | 8/1/09 | 205,000 | 213,223 | ||||
| San Jose Redevelopment Agency, Tax Allocation Revenue | ||||||||
| (Merged Area Redevelopment Project) (Insured; MBIA, Inc.) | 6.00 | 8/1/09 | 420,000 | 433,171 | ||||
| Southern California Public Power Authority, | ||||||||
| Gas Project Revenue (Project Number One) | 5.00 | 11/1/28 | 1,000,000 | 953,500 | ||||
| Southern California Public Power Authority, | ||||||||
| Gas Project Revenue (Project Number One) | 5.00 | 11/1/29 | 3,815,000 | 3,618,985 | ||||
| Southern California Public Power Authority, | ||||||||
| Power Project Revenue (San Juan Unit 3) (Insured; FSA) | 5.50 | 1/1/13 | 3,010,000 | 3,341,040 | ||||
| Southern California Public Power Authority, | ||||||||
| Power Project Revenue (San Juan Unit 3) (Insured; FSA) | 5.50 | 1/1/14 | 2,000,000 | 2,243,840 | ||||
| Westside Unified School District, GO (Insured; AMBAC) | 6.00 | 8/1/14 | 385,000 | 443,959 | ||||
| Colorado—5.8% | ||||||||
| Adams County, FHA Insured Mortgage Revenue | ||||||||
| (Platte Valley Medical Center Project) (Insured; MBIA, Inc.) | 5.00 | 2/1/31 | 5,000,000 | 5,002,700 | ||||
| Colorado Department of Transportation, | ||||||||
| Transportation RAN (Insured; MBIA, Inc.) | 5.25 | 6/15/10 | 1,000,000 | 1,054,590 | ||||
| Colorado Educational and Cultural Facilities Authority, | ||||||||
| Revenue (Regis University Project) (Insured; Radian) | 5.00 | 6/1/22 | 1,825,000 | 1,751,197 | ||||
| Colorado Health Facilities Authority, Health Facilities Revenue | ||||||||
| (The Evangelical Lutheran Good Samaritan Society Project) | 5.25 | 6/1/31 | 1,000,000 | 937,610 | ||||
| Colorado Health Facilities Authority, | ||||||||
| Revenue (Vail Valley Medical Center Project) | 5.00 | 1/15/20 | 1,250,000 | 1,223,412 | ||||
| Colorado Housing Finance Authority (Single Family Program) | 6.75 | 4/1/15 | 75,000 | 76,198 | ||||
| Colorado Housing Finance Authority (Single Family Program) | 6.05 | 10/1/16 | 110,000 | 114,474 | ||||
| Colorado Housing Finance Authority (Single Family Program) | 6.70 | 10/1/16 | 40,000 | 41,426 | ||||
| Colorado Housing Finance Authority (Single Family Program) | 7.55 | 11/1/27 | 5,000 | 5,164 | ||||
| Colorado Housing Finance Authority (Single Family Program) | 6.80 | 11/1/28 | 10,000 | 10,202 | ||||
| Colorado Housing Finance Authority | ||||||||
| (Single Family Program) (Collateralized; FHA) | 6.75 | 10/1/21 | 230,000 | 247,604 | ||||
| Colorado Housing Finance Authority | ||||||||
| (Single Family Program) (Collateralized; FHA) | 7.15 | 10/1/30 | 50,000 | 50,996 | ||||
| E-470 Public Highway Authority, | ||||||||
| Senior Revenue (Insured; MBIA, Inc.) | 0/5.00 | 9/1/16 | 3,565,000 b | 3,189,106 | ||||
| E-470 Public Highway Authority, | ||||||||
| Senior Revenue (Insured; MBIA, Inc.) | 5.25 | 9/1/16 | 4,000,000 | 4,194,320 | ||||
| E-470 Public Highway Authority, | ||||||||
| Senior Revenue (Insured; MBIA, Inc.) | 0/5.00 | 9/1/17 | 3,500,000 b | 3,095,610 | ||||
| Jefferson County School District, GO (Insured; MBIA, Inc.) | 6.50 | 12/15/10 | 1,500,000 | 1,637,445 | ||||
The Funds 19
STATEMENT OF INVESTMENTS (continued)
| BNY Mellon National Intermediate Municipal Bond Fund (continued) | ||||||||
| Long-Term Municipal | Coupon | Maturity | Principal | |||||
| Investments (continued) | Rate (%) | Date | Amount ($) | Value ($) | ||||
| Colorado (continued) | ||||||||
| Northwest Parkway Public Highway Authority, | ||||||||
| Revenue (Insured; AMBAC) | 0/5.45 | 6/15/16 | 7,690,000 a,b | 7,488,214 | ||||
| Northwest Parkway Public Highway Authority, | ||||||||
| Revenue (Insured; AMBAC) | 0/5.70 | 6/15/16 | 7,345,000 a,b | 7,227,260 | ||||
| Northwest Parkway Public Highway Authority, | ||||||||
| Revenue (Insured; FSA) | 0/5.55 | 6/15/16 | 10,960,000 a,b | 10,717,126 | ||||
| Public Authority for Colorado Energy, | ||||||||
| Natural Gas Purchase Revenue | 5.75 | 11/15/18 | 3,250,000 | 3,194,620 | ||||
| Public Authority for Colorado Energy, | ||||||||
| Natural Gas Purchase Revenue | 6.13 | 11/15/23 | 4,895,000 | 4,820,792 | ||||
| University of Colorado, Enterprise System Revenue | 5.50 | 6/1/10 | 500,000 | 529,010 | ||||
| University of Colorado Regents, Participation Interest | ||||||||
| (Sempra Energy Colorado, Inc., Lease, Development | ||||||||
| and Operating Agreement) (Insured; MBIA, Inc.) | 6.00 | 12/1/22 | 5,000,000 | 5,270,150 | ||||
| Connecticut—.9% | ||||||||
| Connecticut, GO (Insured; AMBAC) | 5.25 | 6/1/18 | 1,500,000 | 1,691,340 | ||||
| Connecticut Health and Educational Facilities | ||||||||
| Authority, Revenue (Yale University Issue) | 5.13 | 7/1/27 | 300,000 | 303,633 | ||||
| Connecticut Health and Educational Facilities | ||||||||
| Authority, Revenue (Yale University Issue) | 4.70 | 7/1/29 | 8,000,000 | 8,094,240 | ||||
| District of Columbia—.5% | ||||||||
| District of Columbia, GO (Insured; FSA) | 7.68 | 6/1/16 | 5,000,000 c | 4,805,250 | ||||
| Florida—6.3% | ||||||||
| Florida Department of Transportation, | ||||||||
| State Infrastructure Bank Revenue | 5.00 | 7/1/19 | 4,220,000 | 4,542,450 | ||||
| Florida Department of Transportation, | ||||||||
| State Infrastructure Bank Revenue | 5.00 | 7/1/20 | 2,500,000 | 2,666,975 | ||||
| Florida Municipal Loan Council, | ||||||||
| Revenue (Insured; MBIA, Inc.) | 5.75 | 11/1/15 | 520,000 | 555,162 | ||||
| Hillsborough County Aviation Authority, Revenue | ||||||||
| (Tampa International Airport) (Insured; AMBAC) | 5.13 | 10/1/20 | 3,540,000 | 3,675,476 | ||||
| Hillsborough County Aviation Authority, Revenue | ||||||||
| (Tampa International Airport) (Insured; AMBAC) | 5.13 | 10/1/21 | 3,675,000 | 3,789,770 | ||||
| Hillsborough County Educational Facilities Authority, | ||||||||
| Revenue (University of Tampa Project) (Insured; Radian) | 5.75 | 4/1/18 | 2,710,000 | 2,771,761 | ||||
| JEA, Saint Johns River Power Park System, Revenue | 5.00 | 10/1/15 | 2,750,000 | 2,890,937 | ||||
| Lee County, Airport Revenue (Insured; FSA) | 5.88 | 10/1/19 | 3,000,000 | 3,057,360 | ||||
| Miami-Dade County, Aviation Revenue, Miami | ||||||||
| International Airport (Hub of the Americas) | 5.00 | 10/1/10 | 3,000,000 | 3,103,890 | ||||
| Miami-Dade County, Subordinate Special Obligation | 0/5.00 | 10/1/22 | 2,000,000 b | 1,570,920 | ||||
| Miami-Dade County, Subordinate Special Obligation | 0/5.00 | 10/1/35 | 1,500,000 b | 1,345,695 | ||||
| Orlando and Orange County Expressway Authority, | ||||||||
| Expressway Revenue (Insured; AMBAC) | 5.00 | 7/1/13 | 4,710,000 | 5,061,931 | ||||
| Orlando Utilities Commission, Utility System Revenue | 6.07 | 10/1/16 | 12,400,000 c | 11,879,572 | ||||
20
| BNY Mellon National Intermediate Municipal Bond Fund (continued) | ||||||||
| Long-Term Municipal | Coupon | Maturity | Principal | |||||
| Investments (continued) | Rate (%) | Date | Amount ($) | Value ($) | ||||
| Florida (continued) | ||||||||
| Orlando Utilities Commission, Water and Electric Revenue | 5.25 | 10/1/20 | 2,260,000 | 2,400,482 | ||||
| Sarasota County, Limited Ad Valorem Tax Bonds | ||||||||
| (Environmentally Sensitive Lands and Parkland Program) | 5.25 | 10/1/25 | 6,895,000 | 7,162,871 | ||||
| Seminole Tribe, Special Obligation Revenue | 5.75 | 10/1/22 | 5,000,000 | 4,866,200 | ||||
| Seminole Tribe, Special Obligation Revenue | 5.50 | 10/1/24 | 2,000,000 | 1,882,860 | ||||
| Seminole Tribe, Special Obligation Revenue | 5.25 | 10/1/27 | 5,000,000 | 4,496,700 | ||||
| Georgia—3.0% | ||||||||
| Burke County Development Authority, PCR (Oglethorpe | ||||||||
| Power Corporation, Vogtle Project) (Insured; MBIA, Inc.) | 4.75 | 4/1/11 | 16,000,000 | 16,460,480 | ||||
| Chatham County Hospital Authority, HR Improvement | ||||||||
| (Memorial Health University Medical Center, Inc.) | 6.13 | 1/1/24 | 2,480,000 | 2,428,391 | ||||
| Crisp County Development Authority, EIR | ||||||||
| (International Paper Company Project) | 5.55 | 2/1/15 | 1,000,000 | 1,010,110 | ||||
| Georgia, GO | 5.40 | 11/1/10 | 1,000,000 | 1,070,260 | ||||
| Georgia State Road and Tollway Authority, | ||||||||
| Federal Highway Grant Anticipation Revenue (Insured; FSA) | 5.00 | 6/1/13 | 5,310,000 | 5,818,592 | ||||
| Putnam County Development Authority, | ||||||||
| PCR (Georgia Power Company) | 5.10 | 6/1/23 | 5,000,000 | 4,999,600 | ||||
| Illinois—5.5% | ||||||||
| Chicago, Gas Supply Revenue (The Peoples | ||||||||
| Gas Light and Coke Company Project) | 4.75 | 6/30/14 | 1,000,000 | 1,023,640 | ||||
| Chicago, GO, Project and Refunding (Insured; FGIC) | 5.00 | 1/1/29 | 10,000,000 | 10,121,800 | ||||
| Chicago, SFMR (Collateralized: FNMA and GNMA) | 4.70 | 10/1/17 | 115,000 | 117,224 | ||||
| Chicago Metropolitan Water Reclamation | ||||||||
| District, GO Capital Improvement | 7.25 | 12/1/12 | 8,500,000 | 10,053,120 | ||||
| Cook County, GO Capital Improvement (Insured; AMBAC) | 5.00 | 11/15/25 | 5,000,000 | 5,096,500 | ||||
| DuPage, Cook and Will Counties Community | ||||||||
| College District Number 502, GO | 5.25 | 6/1/16 | 5,980,000 | 6,522,864 | ||||
| Illinois, GO | 5.00 | 1/1/17 | 7,500,000 | 8,227,575 | ||||
| Illinois Finance Authority, Gas Supply Revenue (The Peoples | ||||||||
| Gas Light and Coke Company Project) (Insured; AMBAC) | 4.30 | 6/1/16 | 2,500,000 | 2,462,750 | ||||
| Illinois Health Facilities Authority, Revenue | ||||||||
| (Loyola University Health System) | 5.75 | 7/1/11 | 1,530,000 | 1,601,971 | ||||
| Lake County Community Unitary School | ||||||||
| District Number 60, GO (Insured; FSA) | 5.63 | 12/1/11 | 3,150,000 | 3,267,747 | ||||
| Metropolitan Pier and Exposition Authority, | ||||||||
| Dedicated State Tax Revenue (Insured; AMBAC) | 5.38 | 6/1/14 | 5,000,000 | 5,036,150 | ||||
| Regional Transportation Authority, GO (Insured; FGIC) | 7.75 | 6/1/09 | 1,000,000 | 1,044,370 | ||||
| Regional Transportation Authority, GO (Insured; FGIC) | 7.75 | 6/1/10 | 1,620,000 | 1,772,377 | ||||
| Regional Transportation Authority, GO (Insured; FGIC) | 7.75 | 6/1/12 | 1,890,000 | 2,217,575 | ||||
| Indiana—.5% | ||||||||
| Indiana Health Facility Financing Authority, HR | ||||||||
| (The Methodist Hospitals, Inc.) | 5.25 | 9/15/10 | 650,000 | 665,808 | ||||
The Funds 21
STATEMENT OF INVESTMENTS (continued)
| BNY Mellon National Intermediate Municipal Bond Fund (continued) | ||||||||
| Long-Term Municipal | Coupon | Maturity | Principal | |||||
| Investments (continued) | Rate (%) | Date | Amount ($) | Value ($) | ||||
| Indiana (continued) | ||||||||
| Indiana Health Facility Financing Authority, HR | ||||||||
| (The Methodist Hospitals, Inc.) | 5.25 | 9/15/11 | 750,000 | 767,580 | ||||
| Indiana Municipal Power Agency, Power Supply | ||||||||
| System Revenue (Insured; AMBAC) | 5.13 | 1/1/20 | 4,045,000 | 4,154,741 | ||||
| Iowa—.3% | ||||||||
| Muscatine, Electric Revenue (Insured; AMBAC) | 5.50 | 1/1/11 | 3,000,000 | 3,188,340 | ||||
| Kansas—.5% | ||||||||
| Wyandotte County/Kansas City Unified Government, | ||||||||
| Utility System Revenue (Insured; AMBAC) | 5.65 | 9/1/22 | 5,000,000 | 5,376,000 | ||||
| Kentucky—1.3% | ||||||||
| Kentucky Property and Buildings Commission, | ||||||||
| Revenue (Insured; FSA) | 6.00 | 2/1/10 | 2,000,000 a | 2,112,000 | ||||
| Kentucky Turnpike Authority, EDR | ||||||||
| (Revitalization’s Projects) (Insured; AMBAC) | 5.50 | 7/1/12 | 1,250,000 | 1,372,937 | ||||
| Louisville and Jefferson County Metropolitan Sewer District, | ||||||||
| Sewer and Drainage System Revenue (Insured; MBIA, Inc.) | 5.50 | 5/15/34 | 10,000,000 | 10,344,500 | ||||
| Louisiana—.5% | ||||||||
| Louisiana Citizens Property Insurance Corporation, | ||||||||
| Assessment Revenue (Insured; AMBAC) | 5.25 | 6/1/13 | 5,000,000 | 5,349,250 | ||||
| Maine—.2% | ||||||||
| Maine Municipal Bond Bank, GO (Insured; FSA) | 5.88 | 11/1/09 | 1,660,000 a | 1,751,947 | ||||
| Maryland—1.1% | ||||||||
| Maryland Health and Higher Educational Facilities Authority, | ||||||||
| Revenue (LifeBridge Health Issue) (Insured; Assured Guaranty) | 5.00 | 7/1/28 | 5,000,000 | 5,110,800 | ||||
| Maryland Health and Higher Educational Facilities | ||||||||
| Authority, Revenue (University of Maryland | ||||||||
| Medical System Issue) (Insured; AMBAC) | 5.25 | 7/1/28 | 6,400,000 | 6,478,016 | ||||
| Massachusetts—3.6% | ||||||||
| Massachusetts, Consolidated Loan | 5.25 | 11/1/12 | 3,000,000 a | 3,266,550 | ||||
| Massachusetts, Consolidated Loan | 5.00 | 8/1/14 | 3,000,000 a | 3,255,090 | ||||
| Massachusetts Development Finance Agency, Revenue | ||||||||
| (Combined Jewish Philanthropies of Greater Boston, Inc. Project) | 4.75 | 2/1/15 | 4,135,000 | 4,345,802 | ||||
| Massachusetts Health and Educational Facilities Authority, | ||||||||
| Revenue (Massachusetts Institute of Technology Issue) | 5.00 | 7/1/38 | 10,000,000 | 10,250,700 | ||||
| Massachusetts Housing Finance Agency, Housing Revenue | 5.13 | 12/1/34 | 350,000 | 308,812 | ||||
| Massachusetts Municipal Wholesale Electric Company, | ||||||||
| Power Supply Project Revenue (Nuclear | ||||||||
| Project Number 4 Issue) (Insured; MBIA, Inc.) | 5.25 | 7/1/12 | 2,000,000 | 2,157,660 | ||||
| Massachusetts Port Authority, Revenue | 6.00 | 1/1/10 | 2,035,000 a | 2,161,333 | ||||
| Massachusetts Port Authority, Revenue | 5.75 | 7/1/10 | 1,325,000 | 1,408,780 | ||||
| Massachusetts School Building Authority, | ||||||||
| Dedicated Sales Tax Revenue (Insured; AMBAC) | 5.00 | 8/15/20 | 10,000,000 | 10,710,900 | ||||
22
| BNY Mellon National Intermediate Municipal Bond Fund (continued) | ||||||||
| Long-Term Municipal | Coupon | Maturity | Principal | |||||
| Investments (continued) | Rate (%) | Date | Amount ($) | Value ($) | ||||
| Massachusetts (continued) | ||||||||
| Massachusetts Water Pollution Abatement | ||||||||
| Trust (Pooled Loan Program) | 5.25 | 8/1/17 | 275,000 | 303,859 | ||||
| Weston, GO | 5.63 | 3/1/10 | 650,000 a | 691,847 | ||||
| Michigan—2.1% | ||||||||
| Detroit, Water Supply System Revenue | ||||||||
| (Second Lien) (Insured; FGIC) | 5.75 | 7/1/22 | 10,000,000 | 11,059,600 | ||||
| Michigan Municipal Bond Authority, | ||||||||
| Clean Water Revolving Fund Revenue | 5.00 | 10/1/21 | 5,000,000 | 5,223,600 | ||||
| Michigan Municipal Bond Authority, Drinking | ||||||||
| Water Revolving Fund Revenue | 5.50 | 10/1/15 | 1,000,000 | 1,143,450 | ||||
| Michigan Tobacco Settlement Finance Authority, | ||||||||
| Tobacco Settlement Asset-Backed Bonds | 5.13 | 6/1/22 | 5,000,000 | 4,624,600 | ||||
| Minnesota—.9% | ||||||||
| Minneapolis Special School District Number 1, GO (Insured; FSA) | 5.00 | 2/1/14 | 2,350,000 | 2,379,775 | ||||
| University of Minnesota Regents, Special Purpose | ||||||||
| Revenue (State Supported Stadium Debt) | 5.00 | 8/1/19 | 6,300,000 | 6,778,422 | ||||
| Mississippi—.0% | ||||||||
| Mississippi State University Educational Building | ||||||||
| Corporation, Revenue (Insured; MBIA, Inc.) | 5.25 | 8/1/16 | 400,000 | 445,508 | ||||
| Missouri—.5% | ||||||||
| Missouri Environmental Improvement and | ||||||||
| Energy Resource Authority, Water Pollution | ||||||||
| Control Revenue (Revolving Fund Program) | 5.50 | 7/1/14 | 1,250,000 | 1,414,750 | ||||
| Missouri Highways and Transportation | ||||||||
| Commission, State Road Revenue | 5.50 | 2/1/10 | 2,000,000 | 2,099,620 | ||||
| Missouri Highways and Transportation | ||||||||
| Commission, State Road Revenue | 5.50 | 2/1/11 | 2,000,000 | 2,150,000 | ||||
| Nevada—1.0% | ||||||||
| Clark County School District, GO (Insured; FGIC) | 5.00 | 6/15/20 | 10,000,000 | 10,752,000 | ||||
| New Hampshire—.2% | ||||||||
| Nashua, Capital Improvement Bonds | 5.50 | 7/15/12 | 560,000 a | 619,321 | ||||
| New Hampshire Business Finance Authority, | ||||||||
| PCR (Central Maine Power Company) | 5.38 | 5/1/14 | 1,000,000 | 1,036,720 | ||||
| New Jersey—4.5% | ||||||||
| Garden State Preservation Trust, Open Space and | ||||||||
| Farmland Preservation Revenue (Insured; FSA) | 5.80 | 11/1/17 | 2,500,000 | 2,838,200 | ||||
| Garden State Preservation Trust, Open Space and | ||||||||
| Farmland Preservation Revenue (Insured; FSA) | 5.80 | 11/1/18 | 5,000,000 | 5,666,650 | ||||
| Garden State Preservation Trust, Open Space and | ||||||||
| Farmland Preservation Revenue (Insured; FSA) | 5.80 | 11/1/19 | 5,000,000 | 5,655,200 | ||||
| Garden State Preservation Trust, Open Space and | ||||||||
| Farmland Preservation Revenue (Insured; FSA) | 5.80 | 11/1/23 | 5,000,000 | 5,584,100 | ||||
The Funds 23
STATEMENT OF INVESTMENTS (continued)
| BNY Mellon National Intermediate Municipal Bond Fund (continued) | ||||||||
| Long-Term Municipal | Coupon | Maturity | Principal | |||||
| Investments (continued) | Rate (%) | Date | Amount ($) | Value ($) | ||||
| New Jersey (continued) | ||||||||
| Gloucester County Improvement Authority, | ||||||||
| Solid Waste Resource Recovery Revenue | 6.85 | 12/1/09 | 4,000,000 | 4,130,200 | ||||
| Gloucester County Improvement Authority, | ||||||||
| Solid Waste Resource Recovery Revenue | 7.00 | 12/1/09 | 1,000,000 | 1,030,650 | ||||
| New Jersey, GO | 6.00 | 2/15/11 | 1,000,000 | 1,086,650 | ||||
| New Jersey Economic Development | ||||||||
| Authority, Cigarette Tax Revenue | 5.38 | 6/15/15 | 4,400,000 | 4,326,036 | ||||
| New Jersey Economic Development | ||||||||
| Authority, Cigarette Tax Revenue | 5.50 | 6/15/24 | 4,000,000 | 3,813,000 | ||||
| New Jersey Economic Development | ||||||||
| Authority, Cigarette Tax Revenue | 5.50 | 6/15/31 | 1,000,000 | 913,930 | ||||
| New Jersey Economic Development Authority, | ||||||||
| School Facilities Construction Revenue | 5.00 | 3/1/17 | 2,000,000 | 2,144,560 | ||||
| New Jersey Economic Development Authority, | ||||||||
| School Facilities Construction Revenue | 5.00 | 3/1/18 | 1,000,000 | 1,063,550 | ||||
| New Jersey Economic Development Authority, Transportation | ||||||||
| Project Sublease Revenue (New Jersey Transit | ||||||||
| Corporation Light Rail Transit System Project) (Insured; FSA) | 5.88 | 5/1/09 | 1,000,000 a | 1,028,120 | ||||
| New Jersey Highway Authority, Senior Parkway Revenue | ||||||||
| (Garden State Parkway) (Insured; FGIC) | 5.00 | 1/1/09 | 1,060,000 | 1,071,978 | ||||
| New Jersey Highway Authority, Senior Parkway Revenue | ||||||||
| (Garden State Parkway) (Insured; FGIC) | 5.00 | 1/1/10 | 1,110,000 | 1,154,877 | ||||
| New Jersey Transit Corporation, COP (Federal | ||||||||
| Transit Administration Grants) (Insured; AMBAC) | 6.00 | 9/15/10 | 2,000,000 a | 2,152,220 | ||||
| Tobacco Settlement Financing Corporation of | ||||||||
| New Jersey, Tobacco Settlement Asset-Backed Bonds | 4.50 | 6/1/23 | 4,620,000 | 4,198,240 | ||||
| New Mexico—.3% | ||||||||
| New Mexico Finance Authority, Revenue | ||||||||
| (Public Project Revolving Fund) (Insured; AMBAC) | 5.25 | 6/1/17 | 1,000,000 | 1,079,850 | ||||
| New Mexico Highway Commission, Tax Revenue | 6.00 | 6/15/10 | 2,000,000 a | 2,136,800 | ||||
| New York—9.4% | ||||||||
| Greece Central School District, GO (Insured; FGIC) | 6.00 | 6/15/10 | 225,000 | 240,721 | ||||
| Greece Central School District, GO (Insured; FGIC) | 6.00 | 6/15/11 | 950,000 | 1,046,254 | ||||
| Greece Central School District, GO (Insured; FGIC) | 6.00 | 6/15/12 | 950,000 | 1,071,448 | ||||
| Greece Central School District, GO (Insured; FGIC) | 6.00 | 6/15/13 | 950,000 | 1,091,436 | ||||
| Greece Central School District, GO (Insured; FGIC) | 6.00 | 6/15/14 | 950,000 | 1,103,187 | ||||
| Greece Central School District, GO (Insured; FGIC) | 6.00 | 6/15/15 | 950,000 | 1,116,174 | ||||
| Long Island Power Authority, Electric System | ||||||||
| General Revenue (Insured; FGIC) | 5.25 | 12/1/20 | 10,000,000 | 10,455,100 | ||||
| Long Island Power Authority, Electric System | ||||||||
| General Revenue (Insured; FGIC) | 5.00 | 12/1/23 | 7,500,000 | 7,852,725 | ||||
| Metropolitan Transportation Authority, | ||||||||
| Commuter Facilities Revenue | 5.50 | 7/1/11 | 1,000,000 | 1,012,690 | ||||
24
| BNY Mellon National Intermediate Municipal Bond Fund (continued) | ||||||||
| Long-Term Municipal | Coupon | Maturity | Principal | |||||
| Investments (continued) | Rate (%) | Date | Amount ($) | Value ($) | ||||
| New York (continued) | ||||||||
| Metropolitan Transportation Authority, | ||||||||
| State Service Contract Revenue | 5.50 | 7/1/16 | 5,000,000 | 5,629,050 | ||||
| Metropolitan Transportation Authority, | ||||||||
| State Service Contract Revenue | 5.75 | 1/1/18 | 1,500,000 | 1,729,335 | ||||
| New York City, GO | 5.75 | 8/1/10 | 820,000 a | 885,059 | ||||
| New York City, GO | 5.75 | 8/1/13 | 830,000 | 884,971 | ||||
| New York City, GO | 5.13 | 12/1/22 | 6,000,000 | 6,294,780 | ||||
| New York City, GO (Insured; XLCA) | 5.50 | 8/1/10 | 2,000,000 | 2,119,820 | ||||
| New York City Transitional Finance Authority, | ||||||||
| Future Tax Secured Revenue | 6.13 | 5/15/10 | 2,000,000 a | 2,158,280 | ||||
| New York City Transitional Finance Authority, | ||||||||
| Future Tax Secured Revenue | 6.13 | 5/15/10 | 175,000 a | 188,879 | ||||
| New York City Transitional Finance Authority, | ||||||||
| Future Tax Secured Revenue | 5.50/14.00 | 11/1/26 | 3,000,000 d | 3,222,480 | ||||
| New York City Trust for Cultural Resources, | ||||||||
| Revenue (The Museum of Modern Art) | 5.00 | 4/1/31 | 1,000,000 | 1,023,030 | ||||
| New York State Dormitory Authority, Revenue | ||||||||
| (Consolidated City University System) (Insured; FSA) | 5.75 | 7/1/18 | 200,000 | 227,650 | ||||
| New York State Power Authority, General Purpose Revenue | 7.00 | 1/1/10 | 350,000 a | 372,537 | ||||
| New York State Thruway Authority, Highway | ||||||||
| and Bridge Trust Fund Bonds (Insured; FSA) | 6.00 | 4/1/10 | 1,000,000 a | 1,072,490 | ||||
| New York State Thruway Authority, Second | ||||||||
| General Highway and Bridge Trust Fund Bonds | 5.00 | 4/1/15 | 5,000,000 | 5,511,950 | ||||
| New York State Thruway Authority, Second | ||||||||
| General Highway and Bridge Trust Fund Bonds | 5.00 | 4/1/16 | 5,000,000 | 5,529,250 | ||||
| New York State Thruway Authority, Second | ||||||||
| General Highway and Bridge Trust Fund Bonds | 5.00 | 4/1/21 | 5,000,000 | 5,318,100 | ||||
| New York State Thruway Authority, Second | ||||||||
| General Highway and Bridge Trust Fund Bonds | 5.00 | 4/1/24 | 10,000,000 | 10,498,600 | ||||
| New York State Thruway Authority, State | ||||||||
| Personal Income Tax Revenue (Transportation) | 5.25 | 3/15/19 | 10,000,000 e | 11,157,900 | ||||
| New York State Urban Development Corporation, | ||||||||
| Correctional and Youth Facilities Service Contract Revenue | 5.00 | 1/1/11 | 5,000,000 | 5,235,000 | ||||
| Tobacco Settlement Financing Corporation of New York, Asset- | ||||||||
| Backed Revenue Bonds (State Contingency Contract Secured) | 5.50 | 6/1/19 | 5,000,000 | 5,303,750 | ||||
| Tobacco Settlement Financing Corporation of | ||||||||
| New York, Asset-Backed Revenue Bonds (State | ||||||||
| Contingency Contract Secured) (Insured; MBIA, Inc.) | 5.50 | 6/1/18 | 2,000,000 | 2,099,960 | ||||
| North Carolina—2.1% | ||||||||
| Charlotte, GO | 5.00 | 4/1/13 | 1,000,000 | 1,097,490 | ||||
| Concord, COP (Insured; MBIA, Inc.) | 5.50 | 6/1/11 | 1,000,000 | 1,072,180 | ||||
| Durham County, GO | 5.50 | 4/1/10 | 1,000,000 | 1,055,740 | ||||
| Guilford County, Public Improvement | 5.10 | 10/1/10 | 1,500,000 a | 1,619,700 | ||||
The Funds 25
STATEMENT OF INVESTMENTS (continued)
| BNY Mellon National Intermediate Municipal Bond Fund (continued) | ||||||||
| Long-Term Municipal | Coupon | Maturity | Principal | |||||
| Investments (continued) | Rate (%) | Date | Amount ($) | Value ($) | ||||
| North Carolina (continued) | ||||||||
| North Carolina Eastern Municipal Power | ||||||||
| Agency, Power System Revenue | 5.38 | 1/1/16 | 1,500,000 | 1,554,105 | ||||
| North Carolina Eastern Municipal Power | ||||||||
| Agency, Power System Revenue | 5.25 | 1/1/20 | 5,000,000 | 5,092,000 | ||||
| North Carolina Eastern Municipal Power | ||||||||
| Agency, Power System Revenue | 5.00 | 1/1/24 | 2,500,000 | 2,434,550 | ||||
| North Carolina Eastern Municipal Power | ||||||||
| Agency, Power System Revenue (Insured; FGIC) | 6.00 | 1/1/25 | 4,075,000 | 4,379,280 | ||||
| Raleigh Durham Airport Authority, Revenue (Insured; FGIC) | 5.25 | 11/1/13 | 2,465,000 | 2,591,824 | ||||
| Wake County Industrial Facilities and Pollution Control Financing | ||||||||
| Authority, PCR (Carolina Power and Light Company Project) | 5.38 | 2/1/17 | 1,000,000 | 1,034,090 | ||||
| Ohio—2.4% | ||||||||
| Akron, Sanitary Sewer System Special Revenue (Insured; AMBAC) | 6.00 | 12/1/14 | 500,000 | 527,375 | ||||
| American Municipal Power—Ohio, Inc., Electricity | ||||||||
| Purpose Revenue (Prepayment Issue) | 5.00 | 2/1/10 | 5,000,000 | 5,065,550 | ||||
| Buckeye Tobacco Settlement Financing Authority, | ||||||||
| Tobacco Settlement Asset-Backed Bonds | 5.13 | 6/1/24 | 11,655,000 | 10,679,477 | ||||
| Cuyahoga County, Revenue (Cleveland Clinic Health System) | 6.00 | 1/1/15 | 2,265,000 | 2,455,101 | ||||
| Cuyahoga County, Revenue (Cleveland Clinic Health System) | 6.00 | 1/1/17 | 3,900,000 | 4,334,928 | ||||
| Ohio, GO Infrastructure Improvements | 5.63 | 2/1/09 | 1,000,000 | 1,016,980 | ||||
| Ohio Housing Finance Agency, MFHR (Uptown Towers | ||||||||
| Apartments Project) (Collateralized; GNMA) | 4.75 | 10/20/15 | 1,000,000 | 1,003,070 | ||||
| Toledo-Lucas County Port Authority, Port | ||||||||
| Facilities Revenue (Cargill Inc. Project) | 4.50 | 12/1/15 | 900,000 | 934,542 | ||||
| Oklahoma—.0% | ||||||||
| Oklahoma Housing Finance Agency, SFMR (Collateralized; FNMA) | 6.80 | 9/1/16 | 15,000 | 15,512 | ||||
| Oregon—.5% | ||||||||
| Eagle Point School District Number 9, GO | 5.63 | 6/15/11 | 1,500,000 a | 1,632,735 | ||||
| Jackson County School District Number 6, GO | ||||||||
| (Central Point) (Insured; FGIC) | 5.75 | 6/15/10 | 2,265,000 a | 2,410,005 | ||||
| Portland, Convention Center Urban Renewal | ||||||||
| and Redevelopment Bonds (Insured; AMBAC) | 5.75 | 6/15/18 | 1,150,000 | 1,193,666 | ||||
| Pennsylvania—.6% | ||||||||
| Allegheny County Hospital Development Authority, | ||||||||
| Revenue (University of Pittsburgh Medical Center) | 5.25 | 6/15/15 | 1,620,000 | 1,727,827 | ||||
| Philadelphia School District, GO (Insured; AMBAC) | 5.00 | 4/1/17 | 2,165,000 | 2,299,295 | ||||
| Swarthmore Borough Authority, Revenue (Swarthmore College) | 5.00 | 9/15/11 | 1,000,000 | 1,071,990 | ||||
| Swarthmore Borough Authority, Revenue (Swarthmore College) | 5.00 | 9/15/12 | 1,400,000 | 1,521,506 | ||||
| Rhode Island—.1% | ||||||||
| Rhode Island Health and Educational Building | ||||||||
| Corporation, Higher Educational Facility Revenue | ||||||||
| (Providence College Issue) (Insured; XLCA) | 4.50 | 11/1/17 | 795,000 | 800,350 | ||||
26
| BNY Mellon National Intermediate Municipal Bond Fund (continued) | ||||||||
| Long-Term Municipal | Coupon | Maturity | Principal | |||||
| Investments (continued) | Rate (%) | Date | Amount ($) | Value ($) | ||||
| Rhode Island (continued) | ||||||||
| Rhode Island Health and Educational Building | ||||||||
| Corporation, Higher Educational Facility Revenue | ||||||||
| (Providence College Issue) (Insured; XLCA) | 5.00 | 11/1/22 | 250,000 | 250,095 | ||||
| South Carolina—3.0% | ||||||||
| Greenville County School District, Installment Purchase | ||||||||
| Revenue (Building Equity Sooner for Tomorrow) | 5.25 | 12/1/10 | 10,000,000 | 10,606,500 | ||||
| Greenville County School District, Installment Purchase | ||||||||
| Revenue (Building Equity Sooner for Tomorrow) | 5.25 | 12/1/11 | 5,650,000 | 6,063,015 | ||||
| Greenville County School District, Installment Purchase | ||||||||
| Revenue (Building Equity Sooner for Tomorrow) | 5.88 | 12/1/12 | 3,000,000 a | 3,402,330 | ||||
| Greenville County School District, Installment Purchase | ||||||||
| Revenue (Building Equity Sooner for Tomorrow) | 5.50 | 12/1/18 | 3,000,000 | 3,346,440 | ||||
| Greenville County School District, Installment Purchase | ||||||||
| Revenue (Building Equity Sooner for Tomorrow) | 5.00 | 12/1/24 | 1,000,000 | 1,015,150 | ||||
| Horry County School District, GO (Insured; | ||||||||
| South Carolina State Department of Education) | 5.38 | 3/1/17 | 5,030,000 | 5,409,061 | ||||
| Newberry Investing in Children’s Education, | ||||||||
| Installment Purchase Revenue (School District | ||||||||
| of Newberry County, South Carolina Project) | 5.25 | 12/1/20 | 1,000,000 | 988,360 | ||||
| South Carolina Jobs and Economic Development | ||||||||
| Authority, Hospital Facilities Revenue | ||||||||
| (Georgetown Memorial Hospital) (Insured; Radian) | 5.25 | 2/1/21 | 1,250,000 | 1,205,738 | ||||
| Tennessee—1.1% | ||||||||
| Shelby County Health Educational and Housing Facility | ||||||||
| Board, Revenue (Methodist Healthcare) (Insured; FSA) | 5.25 | 9/1/23 | 11,205,000 | 11,664,293 | ||||
| Texas—4.6% | ||||||||
| Cities of Dallas and Fort Worth, Dallas/Fort Worth | ||||||||
| International Airport, Joint Revenue Bonds (Insured; XLCA) | 5.00 | 11/1/14 | 5,000,000 | 5,005,400 | ||||
| Cities of Dallas and Fort Worth, Dallas/Fort Worth International | ||||||||
| Airport, Joint Revenue Improvement Bonds (Insured; FGIC) | 5.50 | 11/1/31 | 1,000,000 | 953,370 | ||||
| Cypress-Fairbanks Independent School District, Unlimited Tax | ||||||||
| Schoolhouse Bonds (Permanent School Fund Guarantee Program) | 5.25 | 2/15/14 | 10,000,000 a | 11,132,400 | ||||
| Houston, Combined Utility System First | ||||||||
| Lien Revenue (Insured; AMBAC) | 5.00 | 5/15/11 | 10,000,000 | 10,474,800 | ||||
| Lower Colorado River Authority, Transmission Contract Revenue | ||||||||
| (LCRA Transmission Services Corporation Project) (Insured; FGIC) | 5.00 | 5/15/20 | 2,500,000 | 2,536,175 | ||||
| Lower Colorado River Authority, Transmission Contract Revenue | ||||||||
| (LCRA Transmission Services Corporation Project) (Insured; FGIC) | 5.00 | 5/15/21 | 2,500,000 | 2,531,075 | ||||
| San Antonio, General Improvement Bonds | 5.90 | 2/1/10 | 500,000 a | 527,300 | ||||
| Tarrant County, Limited Tax Bonds | 5.00 | 7/15/27 | 1,220,000 | 1,260,565 | ||||
| Texas Municipal Power Agency, Revenue (Insured; FGIC) | 4.40 | 9/1/11 | 2,750,000 | 2,753,548 | ||||
| Texas Water Development Board, State Revolving | ||||||||
| Fund Subordinate Lien Revenue | 5.00 | 7/15/24 | 11,500,000 | 11,993,465 | ||||
The Funds 27
STATEMENT OF INVESTMENTS (continued)
| BNY Mellon National Intermediate Municipal Bond Fund (continued) | ||||||||
| Long-Term Municipal | Coupon | Maturity | Principal | |||||
| Investments (continued) | Rate (%) | Date | Amount ($) | Value ($) | ||||
| Utah—.1% | ||||||||
| Intermountain Power Agency, Power Supply | ||||||||
| Revenue (Insured; FSA) | 6.25 | 7/1/09 | 750,000 | 778,087 | ||||
| Vermont—.5% | ||||||||
| Burlington, Electric Revenue (Insured; MBIA, Inc.) | 6.25 | 7/1/11 | 2,000,000 | 2,167,060 | ||||
| Burlington, Electric Revenue (Insured; MBIA, Inc.) | 6.25 | 7/1/12 | 2,500,000 | 2,762,325 | ||||
| Virginia—.7% | ||||||||
| Chesterfield County Industrial Development Authority, | ||||||||
| PCR (Virginia Electric and Power Company Project) | 5.88 | 6/1/17 | 3,000,000 | 3,161,340 | ||||
| Louisa Industrial Development Authority, | ||||||||
| PCR (Virginia Electric and Power Company Project) | 5.25 | 12/1/08 | 3,000,000 | 3,018,030 | ||||
| Newport News Industrial Development Authority, IDR | ||||||||
| (Virginia Advanced Shipbuilding and Carrier Integration Center) | 5.50 | 9/1/10 | 1,000,000 | 1,062,150 | ||||
| Washington—2.3% | ||||||||
| Port of Longview Industrial Development Corporation, | ||||||||
| SWDR (Weyerhaeuser Company Project) | 6.88 | 10/1/08 | 2,500,000 | 2,506,350 | ||||
| Seattle, Municipal Light and Power Revenue | 5.50 | 12/1/10 | 1,000,000 | 1,067,760 | ||||
| Washington, GO (Various Purpose) | 5.00 | 7/1/23 | 19,550,000 | 20,502,476 | ||||
| West Virginia—.4% | ||||||||
| Monongalia County Building Commission, HR | ||||||||
| (Monongalia General Hospital) | 5.25 | 7/1/20 | 4,055,000 | 4,044,092 | ||||
| Wisconsin—1.3% | ||||||||
| Kenosha, Waterworks Revenue (Insured; FGIC) | 5.00 | 12/1/08 | 750,000 a | 771,345 | ||||
| Wisconsin, Transportation Revenue (Insured; FGIC) | 5.00 | 7/1/18 | 11,825,000 | 12,620,586 | ||||
| U.S. Related—4.5% | ||||||||
| Puerto Rico Commonwealth, Public Improvement GO | 5.00 | 7/1/12 | 2,000,000 | 2,023,180 | ||||
| Puerto Rico Commonwealth, Public | ||||||||
| Improvement GO (Insured; MBIA, Inc.) | 6.25 | 7/1/11 | 950,000 | 1,019,455 | ||||
| Puerto Rico Commonwealth, Public | ||||||||
| Improvement GO (Insured; MBIA, Inc.) | 6.25 | 7/1/13 | 1,380,000 | 1,514,329 | ||||
| Puerto Rico Commonwealth, Public | ||||||||
| Improvement GO (Insured; MBIA, Inc.) | 5.50 | 7/1/20 | 5,500,000 | 5,705,700 | ||||
| Puerto Rico Commonwealth, Public | ||||||||
| Improvement GO (Insured; MBIA, Inc.) | 5.50 | 7/1/20 | 5,000,000 | 5,187,000 | ||||
| Puerto Rico Electric Power Authority, | ||||||||
| Power Revenue (Insured; MBIA, Inc.) | 5.25 | 7/1/15 | 2,000,000 | 2,115,060 | ||||
| Puerto Rico Electric Power Authority, | ||||||||
| Power Revenue (Insured; MBIA, Inc.) | 5.00 | 7/1/17 | 3,940,000 | 4,100,043 | ||||
| Puerto Rico Government Development Bank, Senior Notes | 5.00 | 12/1/12 | 10,000,000 | 10,344,400 | ||||
| Puerto Rico Government Development Bank, Senior Notes | 5.00 | 12/1/13 | 4,000,000 | 4,130,000 | ||||
| Puerto Rico Highways and Transportation Authority, | ||||||||
| Highway Revenue (Insured; MBIA, Inc.) | 6.25 | 7/1/09 | 85,000 | 88,209 | ||||
| Puerto Rico Highways and Transportation Authority, | ||||||||
| Highway Revenue (Insured; MBIA, Inc.) | 6.25 | 7/1/09 | 65,000 | 66,951 | ||||
28
| BNY Mellon National Intermediate Municipal Bond Fund (continued) | ||||||||
| Long-Term Municipal | Coupon | Maturity | Principal | |||||
| Investments (continued) | Rate (%) | Date | Amount ($) | Value ($) | ||||
| U.S. Related (continued) | ||||||||
| Puerto Rico Highways and Transportation Authority, | ||||||||
| Transportation Revenue (Insured; MBIA, Inc.) | 5.88 | 7/1/10 | 1,405,000 a | 1,516,979 | ||||
| Puerto Rico Highways and Transportation Authority, | ||||||||
| Transportation Revenue (Insured; MBIA, Inc.) | 5.88 | 7/1/10 | 2,595,000 a | 2,789,080 | ||||
| Puerto Rico Public Buildings Authority, Government Facility Revenue | 5.50 | 7/1/14 | 1,000,000 | 1,053,670 | ||||
| Puerto Rico Public Buildings Authority, Government Facility Revenue | 5.50 | 7/1/15 | 995,000 | 1,046,372 | ||||
| Puerto Rico Public Buildings Authority, Government Facility Revenue | 5.50 | 7/1/15 | 5,000 | 5,699 | ||||
| Puerto Rico Public Buildings Authority, Government Facility Revenue | 5.50 | 7/1/16 | 5,000 | 5,737 | ||||
| Puerto Rico Public Buildings Authority, Government Facility Revenue | 5.50 | 7/1/16 | 1,995,000 | 2,095,847 | ||||
| Puerto Rico Public Buildings Authority, Government Facility Revenue | 5.75 | 7/1/17 | 1,940,000 | 2,064,878 | ||||
| Puerto Rico Public Buildings Authority, Government Facility Revenue | 5.75 | 7/1/17 | 5,000 | 5,814 | ||||
| Puerto Rico Public Buildings Authority, | ||||||||
| Government Facility Revenue (Insured; AMBAC) | 6.25 | 7/1/10 | 750,000 | 787,080 | ||||
| Total Long-Term Municipal Investments | ||||||||
| (cost $976,997,197) | 988,103,548 | |||||||
| Short-Term Municipal Investments—7.6% | ||||||||
| Alaska—.1% | ||||||||
| Valdez, Marine Terminal Revenue, Refunding (BP Pipelines Inc. Project) | 2.60 | 9/1/08 | 1,400,000 f | 1,400,000 | ||||
| Colorado—.1% | ||||||||
| Colorado Educational and Cultural Facilities Authority, Revenue | ||||||||
| (National Jewish Federation Bond Program) (LOC; Bank of America) | 2.35 | 9/1/08 | 450,000 f | 450,000 | ||||
| Colorado Educational and Cultural Facilities Authority, Revenue | ||||||||
| (National Jewish Federation Bond Program) (LOC; Bank of America) | 2.35 | 9/1/08 | 100,000 f | 100,000 | ||||
| Georgia—.1% | ||||||||
| Clayton County Housing Authority, MFHR, Refunding | ||||||||
| (Huntington Woods Apartments Project) (Insured; | ||||||||
| FSA and Liquidity Facility; Societe Generale) | 2.25 | 9/7/08 | 875,000 f | 875,000 | ||||
| Gainesville and Hall County Development Authority, | ||||||||
| Senior Living Facility Revenue (Lanier Village | ||||||||
| Estates, Inc. Project) (LOC; Allied Irish Banks) | 2.80 | 9/1/08 | 100,000 f | 100,000 | ||||
| Illinois—2.6% | ||||||||
| Chicago Board of Education, Unlimited Tax GO (Dedicated Revenues) | ||||||||
| (Insured; Assured Guaranty and Liquidity Facility; DEPFA Bank PLC) | 2.55 | 9/1/08 | 25,000,000 f | 25,000,000 | ||||
| Illinois Finance Authority, Revenue (Resurrection | ||||||||
| Health Care) (LOC; JPMorgan Chase Bank) | 2.65 | 9/1/08 | 3,800,000 f | 3,800,000 | ||||
| Massachusetts—.9% | ||||||||
| Massachusetts, Consolidated Loan (LOC; Bank of America) | 2.55 | 9/1/08 | 1,300,000 f | 1,300,000 | ||||
| Massachusetts Health and Educational Facilities Authority, | ||||||||
| Revenue (Northeastern University Issue) (Insured; MBIA, Inc.) | 3.06 | 10/5/08 | 6,000,000 f,g | 6,000,000 | ||||
| Massachusetts Health and Educational Facilities Authority, | ||||||||
| Revenue (Northeastern University Issue) (Insured; MBIA, Inc.) | 3.24 | 10/5/08 | 2,000,000 f,g | 2,000,000 | ||||
The Funds 29
STATEMENT OF INVESTMENTS (continued)
| BNY Mellon National Intermediate Municipal Bond Fund (continued) | ||||||||
| Short-Term Municipal | Coupon | Maturity | Principal | |||||
| Investments (continued) | Rate (%) | Date | Amount ($) | Value ($) | ||||
| Montana—.1% | ||||||||
| Forsyth, PCR, Refunding (PacifiCorp Project) | ||||||||
| (LOC; Rabobank Nederland) | 2.55 | 9/1/08 | 1,000,000 f | 1,000,000 | ||||
| North Carolina—1.1% | ||||||||
| New Hanover County, HR (New Hanover Regional | ||||||||
| Medical Center Project) (Insured; FSA) | 3.00 | 9/7/08 | 11,775,000 f | 11,775,000 | ||||
| Pennsylvania—.7% | ||||||||
| Berks County Municipal Authority, HR (The Reading Hospital | ||||||||
| and Medical Center Project) (Insured; AMBAC) | 2.83 | 10/5/08 | 4,985,000 f | 4,985,000 | ||||
| Delaware County Authority, Revenue (White Horse | ||||||||
| Village Project) (LOC; Citizens Bank of Pennsylvania) | 2.45 | 9/1/08 | 1,600,000 f | 1,600,000 | ||||
| Schuylkill County Industrial Development Authority, RRR, Refunding | ||||||||
| (Northeastern Power Company Project) (LOC; Dexia Credit Locale) | 2.52 | 9/1/08 | 615,000 f | 615,000 | ||||
| Texas—1.5% | ||||||||
| Harris County Health Facilities Development Corporation, HR | ||||||||
| (Memorial Hermann Healthcare System) (Insured; MBIA, Inc.) | 3.50 | 10/5/08 | 15,500,000 f | 15,500,000 | ||||
| Wyoming—.4% | ||||||||
| Sweetwater County, PCR, Refunding (Pacificorp | ||||||||
| Projects) (LOC; Barclays Bank PLC) | 2.55 | 9/1/08 | 4,800,000 f | 4,800,000 | ||||
| Total Short-Term Municipal Investments | ||||||||
| (cost $81,297,624) | 81,300,000 | |||||||
| Total Investments (cost $1,058,294,821) | 100.2% | 1,069,403,548 | ||||||
| Liabilities, Less Cash and Receivables | (.2%) | (2,538,864) | ||||||
| Net Assets | 100.0% | 1,066,864,684 | ||||||
| a These securities are prerefunded; the date shown represents the prerefunded date. Bonds which are prerefunded are collateralized by U.S. Government securities which are held in |
| escrow and are used to pay principal and interest on the municipal issue and to retire the bonds in full at the earliest refunding date. |
| b Zero coupon until a specified date at which time the stated coupon rate becomes effective until maturity. |
| c Variable rate security—interest rate subject to periodic change. |
| d Subject to interest rate change on November 1, 2011. |
| e Purchased on a delayed delivery basis. |
| f Variable rate demand note—rate shown is the interest rate in effect at August 31, 2008. Maturity date represents the next demand date or the ultimate maturity date if earlier. |
| g Securities restricted as to public resale. Investment in restricted securities with aggregated market value assets of $8,000,000 representing .7% of net assets (see below). |
| Acquisition | Purchase | Net | ||||||
| Date | Price ($)† | Assets (%) | Valuation ($)†† | |||||
| Massachusetts Health and Educational Facilities Authority | ||||||||
| (Northeastern University) | 1/15/08 | 100.00 | .2 | 100.00 | ||||
| Massachusetts Health and Educational Facilities Authority | ||||||||
| (Northeastern University) | 12/17/07 | 100.00 | .5 | 100.00 |
| † Average cost per unit. |
| †† The valuation of these securities has been determined in good faith under the direction of the Board of Trustees. |
30
| Summary of Abbreviations | ||||||
| ABAG | Association of Bay Area Governments | ACA | American Capital Access | |||
| AGC | ACE Guaranty Corporation | AGIC | Asset Guaranty Insurance Company | |||
| AMBAC | American Municipal Bond Assurance Corporation | ARRN | Adjustable Rate Receipt Notes | |||
| BAN | Bond Anticipation Notes | BIGI | Bond Investors Guaranty Insurance | |||
| BPA | Bond Purchase Agreement | CGIC | Capital Guaranty Insurance Company | |||
| CIC | Continental Insurance Company | CIFG | CDC Ixis Financial Guaranty | |||
| CMAC | Capital Market Assurance Corporation | COP | Certificate of Participation | |||
| CP | Commercial Paper | EDR | Economic Development Revenue | |||
| EIR | Environmental Improvement Revenue | FGIC | Financial Guaranty Insurance Company | |||
| FHA | Federal Housing Administration | FHLB | Federal Home Loan Bank | |||
| FHLMC | Federal Home Loan Mortgage Corporation | FNMA | Federal National Mortgage Association | |||
| FSA | Financial Security Assurance | GAN | Grant Anticipation Notes | |||
| GIC | Guaranteed Investment Contract | GNMA | Government National Mortgage Association | |||
| GO | General Obligation | HR | Hospital Revenue | |||
| IDB | Industrial Development Board | IDC | Industrial Development Corporation | |||
| IDR | Industrial Development Revenue | LOC | Letter of Credit | |||
| LOR | Limited Obligation Revenue | LR | Lease Revenue | |||
| MFHR | Multi-Family Housing Revenue | MFMR | Multi-Family Mortgage Revenue | |||
| PCR | Pollution Control Revenue | PILOT | Payment in Lieu of Taxes | |||
| RAC | Revenue Anticipation Certificates | RAN | Revenue Anticipation Notes | |||
| RAW | Revenue Anticipation Warrants | RRR | Resources Recovery Revenue | |||
| SAAN | State Aid Anticipation Notes | SBPA | Standby Bond Purchase Agreement | |||
| SFHR | Single Family Housing Revenue | SFMR | Single Family Mortgage Revenue | |||
| SONYMA | State of New York Mortgage Agency | SWDR | Solid Waste Disposal Revenue | |||
| TAN | Tax Anticipation Notes | TAW | Tax Anticipation Warrants | |||
| TRAN | Tax and Revenue Anticipation Notes | XLCA | XL Capital Assurance | |||
| Summary of Combined Ratings (Unaudited) | ||||||||||
| Fitch | or | Moody’s | or | Standard & Poor’s | Value (%)††† | |||||
| AAA | Aaa | AAA | 47.4 | |||||||
| AA | Aa | AA | 30.0 | |||||||
| A | A | A | 5.4 | |||||||
| BBB | Baa | BBB | 13.4 | |||||||
| F1 | MIG1/P1 | SP1/A1 | 3.8 | |||||||
| 100.0 | ||||||||||
| ††† Based on total investments. |
| See notes to financial statements. |
The Funds 31
| STATEMENT OF FINANCIAL FUTURES |
| August 31, 2008 |
| Market Value | Unrealized | |||||||
| BNY Mellon National | Covered by | Appreciation | ||||||
| Intermediate Municipal Bond Fund | Contracts | Contracts ($) | Expiration | at 8/31/2008 ($) | ||||
| Financial Futures Short | ||||||||
| U.S. Treasury 20 Year Bond | 263 | (30,853,188) | December 2008 | 156,156 |
See notes to financial statements.
32
| STATEMENT OF INVESTMENTS |
| August 31, 2008 |
| BNY Mellon National Short-Term Municipal Bond Fund | ||||||||
| Long-Term Municipal | Coupon | Maturity | Principal | |||||
| Investments—88.5% | Rate (%) | Date | Amount ($) | Value ($) | ||||
| Alabama—2.2% | ||||||||
| Alabama Public School and College Authority, | ||||||||
| Capital Improvement Bonds | 5.63 | 7/1/13 | 1,000,000 | 1,043,610 | ||||
| Jefferson County, Sewer Revenue Warrants (Insured; FSA) | 5.25 | 2/1/13 | 3,000,000 | 2,704,950 | ||||
| Arizona—3.2% | ||||||||
| Chandler Industrial Development Authority, | ||||||||
| IDR (Intel Corporation Project) | 4.38 | 12/1/10 | 5,200,000 | 5,404,360 | ||||
| California—7.0% | ||||||||
| California Department of Water Resources, Power Supply Revenue | 5.50 | 5/1/11 | 2,000,000 | 2,158,780 | ||||
| California Infrastructure and Economic Development | ||||||||
| Bank, Revenue (The J. Paul Getty Trust) | 3.90 | 12/1/11 | 2,000,000 | 2,076,340 | ||||
| California Statewide Communities Development | ||||||||
| Authority, MFHR (Clara Park Cypress Sunrise | ||||||||
| Wysong Plaza Apartments) (Collateralized; GNMA) | 4.55 | 1/20/16 | 1,335,000 | 1,367,534 | ||||
| Del Mar Race Track Authority, Revenue | 5.00 | 8/15/09 | 1,080,000 | 1,093,738 | ||||
| Golden State Tobacco Securitization Corporation, | ||||||||
| Tobacco Settlement Asset-Backed Bonds | 5.00 | 6/1/11 | 1,005,000 | 1,022,748 | ||||
| Sacramento County Sanitation Districts | ||||||||
| Financing Authority, Revenue (Sacramento | ||||||||
| Regional County Sanitation District) (Insured; AMBAC) | 5.00 | 12/1/14 | 1,000,000 a | 1,118,820 | ||||
| San Bernardino County Housing Authority, MFHR (Equity | ||||||||
| Residential/Redlands Lawn and Tennis Apartments) | 5.20 | 6/15/09 | 3,000,000 | 3,033,210 | ||||
| Colorado—1.6% | ||||||||
| Black Hawk, Device Tax Revenue | 5.00 | 12/1/11 | 600,000 | 613,416 | ||||
| Colorado Health Facilities Authority, Health Facilities Revenue | ||||||||
| (The Evangelical Lutheran Good Samaritan Society Project) | 3.75 | 6/1/09 | 1,000,000 | 1,006,670 | ||||
| Colorado Health Facilities Authority, Health Facilities Revenue | ||||||||
| (The Evangelical Lutheran Good Samaritan Society Project) | 5.00 | 6/1/10 | 1,000,000 | 1,027,220 | ||||
| Connecticut—1.8% | ||||||||
| Connecticut Development Authority, PCR | ||||||||
| (Connecticut Light and Power Company Project) | 5.85 | 9/1/28 | 3,000,000 | 3,000,900 | ||||
| Florida—12.8% | ||||||||
| Florida Department of Environmental Protection, | ||||||||
| Florida Forever Revenue (Insured; FGIC) | 5.25 | 7/1/16 | 3,250,000 | 3,484,455 | ||||
| Florida Department of Environmental Protection, | ||||||||
| Preservation 2000 Revenue (Insured; FSA) | 5.25 | 7/1/13 | 5,000,000 | 5,061,600 | ||||
| Florida Hurricane Catastrophe Fund Finance Corporation, Revenue | 5.00 | 7/1/10 | 3,000,000 | 3,106,500 | ||||
| Florida Rural Utility Financing Commission, | ||||||||
| Revenue Notes (Public Projects Construction) | 4.00 | 2/1/11 | 1,250,000 | 1,254,863 | ||||
| Florida State Board of Education, Public | ||||||||
| Education Capital Outlay Bonds (Insured; FGIC) | 5.25 | 6/1/13 | 3,000,000 | 3,289,980 | ||||
| Highlands County Health Facilities Authority, HR | ||||||||
| (Adventist Health System/Sunbelt Obligated Group) | 5.00 | 11/15/08 | 500,000 | 502,315 | ||||
| Miami-Dade County Health Facilities Authority, HR | ||||||||
| (Miami Children’s Hospital Project) (Insured; AMBAC) | 5.50 | 8/15/11 | 2,450,000 | 2,665,453 | ||||
The Funds 33
STATEMENT OF INVESTMENTS (continued)
| BNY Mellon National Short-Term Municipal Bond Fund (continued) | ||||||||
| Long-Term Municipal | Coupon | Maturity | Principal | |||||
| Investments (continued) | Rate (%) | Date | Amount ($) | Value ($) | ||||
| Florida (continued) | ||||||||
| Palm Beach County School Board, COP (Master | ||||||||
| Lease Purchase Agreement) (Insured; FGIC) | 5.00 | 8/1/11 | 2,200,000 | 2,298,076 | ||||
| Idaho—1.5% | ||||||||
| University of Idaho Regents, General Revenue (Insured; FSA) | 4.38 | 4/1/11 | 2,500,000 | 2,603,025 | ||||
| Illinois—8.0% | ||||||||
| Chicago, Senior Lien Water Revenue (Insured; AMBAC) | 5.50 | 11/1/11 | 1,750,000 a | 1,914,185 | ||||
| Chicago, Senior Lien Water Revenue (Insured; AMBAC) | 5.50 | 11/1/11 | 1,000,000 a | 1,093,820 | ||||
| Illinois, GO (Illinois Fund for Infrastructure, | ||||||||
| Roads, Schools and Transit) (Insured; FGIC) | 6.00 | 1/1/17 | 5,575,000 | 5,810,599 | ||||
| Illinois, Sales Tax Revenue (Illinois Fund | ||||||||
| for Infrastructure, Roads, Schools and Transit) | 5.50 | 6/15/13 | 1,100,000 | 1,181,455 | ||||
| Illinois Educational Facilities Authority, Revenue (University of Chicago) | 4.05 | 7/1/09 | 1,000,000 | 1,018,170 | ||||
| Metropolitan Pier and Exposition Authority, | ||||||||
| Dedicated State Tax Revenue (Insured; AMBAC) | 5.38 | 6/1/14 | 2,500,000 | 2,518,075 | ||||
| Indiana—2.1% | ||||||||
| Indiana Health and Educational Facility Financing Authority, | ||||||||
| HR (Clarian Health Obligated Group) | 5.00 | 2/15/11 | 1,000,000 | 1,036,740 | ||||
| Indiana Health Facility Financing Authority, | ||||||||
| HR (The Methodist Hospitals, Inc.) | 5.25 | 9/15/09 | 2,415,000 | 2,447,313 | ||||
| Iowa—.6% | ||||||||
| Coralville, Annual Appropriation GO Urban | ||||||||
| Renewal Bond Anticipation Project Notes | 4.25 | 6/1/09 | 1,085,000 | 1,089,839 | ||||
| Kansas—.8% | ||||||||
| The Unified Government of Wyandotte County/Kansas | ||||||||
| City, Tax Exempt Sales Tax Special Obligation Revenue | ||||||||
| (Redevelopment Project Area B) (LOC; Citibank NA) | 3.75 | 12/1/12 | 1,360,000 | 1,359,946 | ||||
| Kentucky—2.5% | ||||||||
| Kentucky Economic Development Finance Authority, | ||||||||
| Health System Revenue (Norton Healthcare, Inc.) | 6.25 | 10/1/10 | 335,000 a | 365,204 | ||||
| Kentucky Economic Development Finance Authority, | ||||||||
| Health System Revenue (Norton Healthcare, Inc.) | 6.25 | 10/1/12 | 665,000 | 699,427 | ||||
| Kentucky Property and Buildings Commission, | ||||||||
| Revenue (Project Number 69) (Insured; FSA) | 5.25 | 8/1/14 | 1,450,000 | 1,536,130 | ||||
| Kentucky Property and Buildings Commission, | ||||||||
| Revenue (Project Number 72) (Insured; MBIA, Inc.) | 5.38 | 10/1/11 | 1,550,000 a | 1,687,190 | ||||
| Louisiana—1.1% | ||||||||
| Louisiana Public Facilities Authority, Revenue | ||||||||
| (Department of Public Safety Project) (Insured; FSA) | 5.00 | 8/1/10 | 1,765,000 | 1,857,151 | ||||
| Maryland—.6% | ||||||||
| Maryland Health and Higher Educational Facilities Authority, | ||||||||
| Revenue (The Johns Hopkins Health System Obligated Group Issue) | 5.00 | 11/15/11 | 1,000,000 | 1,045,300 | ||||
34
| BNY Mellon National Short-Term Municipal Bond Fund (continued) | ||||||||
| Long-Term Municipal | Coupon | Maturity | Principal | |||||
| Investments (continued) | Rate (%) | Date | Amount ($) | Value ($) | ||||
| Massachusetts—2.1% | ||||||||
| Massachusetts, Federal Highway, GAN (Insured; FSA) | 5.75 | 6/15/12 | 2,000,000 | 2,134,520 | ||||
| Massachusetts Health and Educational Facilities Authority, | ||||||||
| Revenue (Milford Regional Medical Center Issue) | 5.00 | 7/15/09 | 340,000 | 343,998 | ||||
| Massachusetts Health and Educational Facilities Authority, | ||||||||
| Revenue (Milford Regional Medical Center Issue) | 5.00 | 7/15/10 | 200,000 | 204,696 | ||||
| Massachusetts Housing Finance Agency, Housing Revenue | 4.20 | 12/1/10 | 775,000 | 797,777 | ||||
| Mississippi—1.2% | ||||||||
| Mississippi Business Finance Corporation, | ||||||||
| SWDR (Waste Management, Inc. Project) | 4.40 | 3/1/11 | 1,000,000 | 991,240 | ||||
| Mississippi Hospital Equipment and Facilities Authority, | ||||||||
| Hospital Refunding and Improvement Revenue | ||||||||
| (South Central Regional Medical Center) | 5.00 | 12/1/09 | 1,085,000 | 1,105,344 | ||||
| Missouri—1.2% | ||||||||
| Bi-State Development Agency of the Missouri-Illinois Metropolitan | ||||||||
| District, Subordinate Mass Transit Sales Tax Appropriation | ||||||||
| Revenue (Metrolink Cross County Extension Project) | 3.95 | 10/1/09 | 1,000,000 | 1,009,920 | ||||
| Blue Springs Neighborhood Improvement District, Limited GO | ||||||||
| Temporary Notes (South Area Sewer Improvement Project) | 4.13 | 3/1/09 | 1,000,000 | 1,001,670 | ||||
| Montana—2.7% | ||||||||
| Montana Board of Regents of Higher Education, University of | ||||||||
| Montana Facilities Improvement Revenue (Insured; MBIA, Inc.) | 5.75 | 5/15/10 | 350,000 a | 378,262 | ||||
| Montana Board of Regents of Higher Education, University of | ||||||||
| Montana Facilities Improvement Revenue (Insured; MBIA, Inc.) | 5.75 | 5/15/24 | 3,900,000 | 4,101,045 | ||||
| Nevada—1.8% | ||||||||
| Clark County, PCR (Southern California Edison Company) | 3.25 | 3/2/09 | 2,000,000 | 1,999,280 | ||||
| Truckee Meadows Water Authority, Water Revenue (Insured; FSA) | 5.50 | 7/1/15 | 1,000,000 | 1,074,140 | ||||
| New Hampshire—1.5% | ||||||||
| New Hampshire Health and Education Facilities Authority, Revenue | ||||||||
| (Center for Life Management Issue) (LOC; Ocean National Bank) | 4.05 | 7/1/11 | 2,505,000 | 2,547,936 | ||||
| New Jersey—.3% | ||||||||
| New Jersey Economic Development Authority, | ||||||||
| Cigarette Tax Revenue | 5.63 | 6/15/17 | 110,000 | 108,678 | ||||
| University of Medicine and Dentistry of | ||||||||
| New Jersey, COP (Insured; MBIA, Inc.) | 6.75 | 12/1/09 | 465,000 | 471,719 | ||||
| New York—3.4% | ||||||||
| Buffalo and Fort Erie Public Bridge Authority, Toll Bridge | ||||||||
| System Revenue (Liquidity Facility; Bank of Nova Scotia) | 4.00 | 7/1/10 | 1,000,000 | 1,023,960 | ||||
| New York City Transitional Finance Authority, | ||||||||
| Future Tax Secured Revenue | 5.50/14.00 | 11/1/26 | 1,500,000 b | 1,611,240 | ||||
| Troy Industrial Development Authority, Civic Facility | ||||||||
| Revenue (Rensselaer Polytechnic Institute Project) | 5.00 | 9/1/10 | 3,000,000 | 3,071,280 | ||||
The Funds 35
STATEMENT OF INVESTMENTS (continued)
| BNY Mellon National Short-Term Municipal Bond Fund (continued) | ||||||||
| Long-Term Municipal | Coupon | Maturity | Principal | |||||
| Investments (continued) | Rate (%) | Date | Amount ($) | Value ($) | ||||
| North Carolina—1.3% | ||||||||
| North Carolina Eastern Municipal Power Agency, Power System | ||||||||
| Revenue (Insured; Assured Guaranty) | 5.00 | 1/1/13 | 2,000,000 | 2,148,880 | ||||
| Ohio—4.7% | ||||||||
| American Municipal Power—Ohio, Inc., Electricity | ||||||||
| Purpose Revenue (Prepayment Issue) | 5.00 | 2/1/11 | 3,000,000 | 3,043,590 | ||||
| Buckeye Tobacco Settlement Financing Authority, | ||||||||
| Tobacco Settlement Asset-Backed Bonds | 5.13 | 6/1/24 | 2,430,000 | 2,226,609 | ||||
| Lorain County, Hospital Facilities Improvement | ||||||||
| Revenue (Catholic Healthcare Partners) | 5.63 | 10/1/12 | 2,500,000 | 2,662,625 | ||||
| Pennsylvania—1.0% | ||||||||
| Lehigh County Industrial Development Authority, PCR | ||||||||
| (PPL Electric Utilities Corporation Project) (Insured; AMBAC) | 3.13 | 11/1/08 | 1,250,000 | 1,251,675 | ||||
| Sayre Health Care Facilities Authority, | ||||||||
| Revenue (Guthrie Health Issue) | 5.50 | 12/1/09 | 400,000 | 411,976 | ||||
| Tennessee—3.3% | ||||||||
| Tennessee Energy Acquisition Corporation, Gas Project Revenue | 5.00 | 9/1/09 | 2,500,000 | 2,527,500 | ||||
| The Health, Educational and Housing Facility Board of | ||||||||
| Shelby County, Revenue (Baptist Memorial Health Care) | 5.00 | 10/1/08 | 3,000,000 | 3,000,150 | ||||
| Texas—4.1% | ||||||||
| Austin, Hotel Occupancy Tax Revenue (Convention | ||||||||
| Center/Waller Creek Venue Project) (Insured; AMBAC) | 5.25 | 11/15/19 | 3,000,000 | 3,081,180 | ||||
| Harris County Cultural Education Facilities Finance | ||||||||
| Corporation, Revenue (The Methodist Hospital System) | 5.25 | 12/1/12 | 1,000,000 | 1,061,060 | ||||
| Montgomery County, Unlimited Tax Adjustable | ||||||||
| Rate Road Bonds (Insured; FSA) | 5.00 | 9/1/10 | 1,050,000 | 1,103,728 | ||||
| Port Arthur Independent School District, Unlimited | ||||||||
| Tax School Building Bonds (Insured; AMBAC) | 5.25 | 2/15/18 | 1,000,000 | 1,010,780 | ||||
| Texas Municipal Gas Acquisition and Supply | ||||||||
| Corporation I, Gas Supply Revenue | 5.00 | 12/15/13 | 720,000 | 699,581 | ||||
| Virginia—7.4% | ||||||||
| Louisa Industrial Development Authority, PCR | ||||||||
| (Virginia Electric and Power Company) | 5.25 | 12/1/08 | 2,000,000 | 2,012,020 | ||||
| Peninsula Ports Authority, Coal Terminal Revenue | ||||||||
| (Dominion Terminal Associates Project—DETC Issue) | 3.30 | 10/1/08 | 1,400,000 | 1,401,246 | ||||
| Rappahannock Regional Jail Authority, Regional Jail Facility GAN | 4.25 | 12/1/09 | 3,000,000 | 3,017,190 | ||||
| Riverside Regional Jail Authority, Jail Facility Senior RAN | 4.25 | 7/1/10 | 3,000,000 | 3,051,900 | ||||
| Western Virginia Regional Jail Authority, Regional Jail Facility RAN | 4.13 | 12/1/09 | 3,000,000 | 3,013,140 | ||||
| Washington—.9% | ||||||||
| Port of Longview Industrial Development Corporation, | ||||||||
| SWDR (Weyerhaeuser Company Project) | 6.88 | 10/1/08 | 1,500,000 | 1,503,810 | ||||
36
| BNY Mellon National Short-Term Municipal Bond Fund (continued) | ||||||||
| Long-Term Municipal | Coupon | Maturity | Principal | |||||
| Investments (continued) | Rate (%) | Date | Amount ($) | Value ($) | ||||
| U.S. Related—5.8% | ||||||||
| Puerto Rico Highways and Transportation Authority, | ||||||||
| Highway Revenue (Insured; MBIA, Inc.) | 6.00 | 7/1/11 | 2,000,000 | 2,118,560 | ||||
| Puerto Rico Highways and Transportation | ||||||||
| Authority, Transportation Revenue | 5.25 | 7/1/12 | 1,000,000 a | 1,083,050 | ||||
| Puerto Rico Infrastructure Financing Authority, | ||||||||
| Special Tax Revenue | 4.50 | 7/1/10 | 4,105,000 | 4,193,586 | ||||
| University of Puerto Rico, University System Revenue | 5.00 | 6/1/13 | 2,315,000 | 2,389,311 | ||||
| Total Long-Term Municipal Investments | ||||||||
| (cost $148,642,777) | 149,588,959 | |||||||
| Short-Term Municipal Investments—10.6% | ||||||||
| Arizona—.7% | ||||||||
| Yuma Industrial Development Authority, HR | ||||||||
| (Yuma Regional Medical Center) (Insured; FSA) | 3.75 | 9/28/08 | 1,100,000 c | 1,100,000 | ||||
| California—.9% | ||||||||
| Los Angeles Department of Water and Power, | ||||||||
| Power System Revenue (Insured; XCLA) | 4.00 | 9/7/08 | 1,500,000 c | 1,500,000 | ||||
| Colorado—1.5% | ||||||||
| Colorado Educational and Cultural Facilities | ||||||||
| Authority, Revenue (National Jewish Federation | ||||||||
| Bond Program) (LOC; Bank of America) | 2.35 | 9/1/08 | 1,100,000 c | 1,100,000 | ||||
| Colorado Educational and Cultural Facilities | ||||||||
| Authority, Revenue (National Jewish Federation | ||||||||
| Bond Program) (LOC; U.S. Bank NA) | 2.35 | 9/1/08 | 1,400,000 c | 1,400,000 | ||||
| Illinois—.3% | ||||||||
| Romeoville, Revenue (Lewis University) | ||||||||
| (LOC; JPMorgan Chase Bank) | 2.35 | 9/1/08 | 500,000 c | 500,000 | ||||
| Kentucky—.0% | ||||||||
| Shelby County, Lease Program Revenue (Kentucky Association | ||||||||
| of Counties Leasing Trust) (LOC; U.S. Bank NA) | 2.30 | 9/1/08 | 5,000 c | 5,000 | ||||
| Massachusetts—3.5% | ||||||||
| Chelsea, LR (Massachusetts Information Technolgy | ||||||||
| Center Project) (Insured; FSA) | 3.24 | 10/5/08 | 4,750,000 c,d | 4,750,000 | ||||
| Massachusetts Consolidated Loan (LOC; Bank of America) | 2.55 | 9/1/08 | 100,000 c | 100,000 | ||||
| Massachusetts Health and Educational Facilities Authority, | ||||||||
| Revenue (Capital Asset Program Issue) (LOC; Bank of America) | 2.40 | 9/1/08 | 800,000 c | 800,000 | ||||
| Massachusetts Water Resources Authority, | ||||||||
| Multi-Modal Subordinated General Revenue, | ||||||||
| Refunding (LOC; Landesbank Baden-Wurttemberg) | 2.60 | 9/1/08 | 300,000 c | 300,000 | ||||
The Funds 37
STATEMENT OF INVESTMENTS (continued)
| BNY Mellon National Short-Term Municipal Bond Fund (continued) | ||||||||
| Short-Term Municipal | Coupon | Maturity | Principal | |||||
| Investments (continued) | Rate (%) | Date | Amount ($) | Value ($) | ||||
| New Mexico—.2% | ||||||||
| Farmington, PCR, Refunding (Arizona Public Service | ||||||||
| Company Four Corners Project) (LOC; Barclays Bank PLC) | 2.60 | 9/1/08 | 400,000 c | 400,000 | ||||
| New York—.2% | ||||||||
| New York City Industrial Development Agency, Civic Facility | ||||||||
| Revenue (CASA Project) (LOC; JPMorgan Chase Bank) | 1.75 | 9/7/08 | 400,000 c | 400,000 | ||||
| Pennsylvania—2.6% | ||||||||
| Delaware County Authority, Revenue (White Horse | ||||||||
| Village Project) (LOC; Citizens Bank of Pennsylvania) | 2.45 | 9/1/08 | 3,400,000 c | 3,400,000 | ||||
| Philadelphia Authority for Industrial Development, | ||||||||
| Revenue (Special People In Northeast, Inc. Project) | ||||||||
| (LOC; Citizens Bank of Pennsylvania) | 1.90 | 9/7/08 | 1,020,000 c | 1,020,000 | ||||
| Vermont—.2% | ||||||||
| Vermont Educational and Health Buildings Financing Agency, HR | ||||||||
| (Mount Ascutney Hospital Project) (LOC; TD Banknorth NA) | 2.50 | 9/1/08 | 155,000 c | 155,000 | ||||
| Vermont Educational and Health Buildings Financing | ||||||||
| Agency, HR (Rutland Regional Medical Center Project) | ||||||||
| (Insured; Radian Group and Liquidity Facility; TD Banknorth NA) | 2.50 | 9/1/08 | 100,000 c | 100,000 | ||||
| Washington—.4% | ||||||||
| Washington Housing Finance Commission, Nonprofit | ||||||||
| Housing Revenue (Rockwood Retirement | ||||||||
| Communities Program) (LOC; Wells Fargo Bank) | 2.41 | 9/1/08 | 600,000 c | 600,000 | ||||
| Wyoming—.1% | ||||||||
| Sweetwater County, PCR, Refunding | ||||||||
| (Pacificorp Projects) (LOC; Barclays Bank PLC) | 2.55 | 9/1/08 | 200,000 c | 200,000 | ||||
| Total Short-Term Municipal Investments | ||||||||
| (cost $17,830,000) | 17,830,000 | |||||||
| Total Investments (cost $166,472,777) | 99.1% | 167,418,959 | ||||||
| Cash and Receivables (Net) | .9% | 1,486,502 | ||||||
| Net Assets | 100.0% | 168,905,461 | ||||||
| a These securities are prerefunded; the date shown represents the prerefunded date. Bonds which are prerefunded are collateralized by U.S. Government securities which are held in |
| escrow and are used to pay principal and interest on the municipal issue and to retire the bonds in full at the earliest refunding date. |
| b Subject to interest rate change on November 1, 2011. |
| c Variable rate demand note—rate shown is the interest rate in effect at August 31, 2008. Maturity date represents the next demand date or the ultimate maturity date if earlier. |
| d Security restricted as to public resale. Investment in restricted securities with aggregated market value assets of $4,750,000 representing 2.8% of net assets (see below). |
| Acquisition | Purchase | Net | ||||||
| Date | Price ($)† | Assets (%) | Valuation ($)†† | |||||
| Chelsea, LR (Massachusetts Information | ||||||||
| Technology Center Project) | 1/10/08 | 100.00 | 2.8 | 100.00 |
| † | Average cost per unit. | |
| †† | The valuation of this security has been determined in good faith under the direction of the Board of Trustees. |
38
| Summary of Abbreviations | ||||||
| ABAG | Association of Bay Area Governments | ACA | American Capital Access | |||
| AGC | ACE Guaranty Corporation | AGIC | Asset Guaranty Insurance Company | |||
| AMBAC | American Municipal Bond Assurance Corporation | ARRN | Adjustable Rate Receipt Notes | |||
| BAN | Bond Anticipation Notes | BIGI | Bond Investors Guaranty Insurance | |||
| BPA | Bond Purchase Agreement | CGIC | Capital Guaranty Insurance Company | |||
| CIC | Continental Insurance Company | CIFG | CDC Ixis Financial Guaranty | |||
| CMAC | Capital Market Assurance Corporation | COP | Certificate of Participation | |||
| CP | Commercial Paper | EDR | Economic Development Revenue | |||
| EIR | Environmental Improvement Revenue | FGIC | Financial Guaranty Insurance Company | |||
| FHA | Federal Housing Administration | FHLB | Federal Home Loan Bank | |||
| FHLMC | Federal Home Loan Mortgage Corporation | FNMA | Federal National Mortgage Association | |||
| FSA | Financial Security Assurance | GAN | Grant Anticipation Notes | |||
| GIC | Guaranteed Investment Contract | GNMA | Government National Mortgage Association | |||
| GO | General Obligation | HR | Hospital Revenue | |||
| IDB | Industrial Development Board | IDC | Industrial Development Corporation | |||
| IDR | Industrial Development Revenue | LOC | Letter of Credit | |||
| LOR | Limited Obligation Revenue | LR | Lease Revenue | |||
| MFHR | Multi-Family Housing Revenue | MFMR | Multi-Family Mortgage Revenue | |||
| PCR | Pollution Control Revenue | PILOT | Payment in Lieu of Taxes | |||
| RAC | Revenue Anticipation Certificates | RAN | Revenue Anticipation Notes | |||
| RAW | Revenue Anticipation Warrants | RRR | Resources Recovery Revenue | |||
| SAAN | State Aid Anticipation Notes | SBPA | Standby Bond Purchase Agreement | |||
| SFHR | Single Family Housing Revenue | SFMR | Single Family Mortgage Revenue | |||
| SONYMA | State of New York Mortgage Agency | SWDR | Solid Waste Disposal Revenue | |||
| TAN | Tax Anticipation Notes | TAW | Tax Anticipation Warrants | |||
| TRAN | Tax and Revenue Anticipation Notes | XLCA | XL Capital Assurance | |||
| Summary of Combined Ratings (Unaudited) | ||||||||||
| Fitch | or | Moody’s | or | Standard & Poor’s | Value (%)††† | |||||
| AAA | Aaa | AAA | 42.4 | |||||||
| AA | Aa | AA | 19.7 | |||||||
| A | A | A | 10.2 | |||||||
| BBB | Baa | BBB | 17.2 | |||||||
| F1 | MIG1/P1 | SP1/A1 | 10.1 | |||||||
| Not Ratede | Not Ratede | Not Ratede | .4 | |||||||
| 100.0 | ||||||||||
| ††† Based on total investments. | ||
| e | Securities which, while not rated by Fitch, Moody’s and Standard & Poor’s, have been determined by the Manager to be of comparable quality to those rated securities in which the | |
| fund may invest. | ||
| See notes to financial statements. | ||
The Funds 39
| STATEMENT OF INVESTMENTS |
| August 31, 2008 |
| BNY Mellon Pennsylvania Intermediate Municipal Bond Fund | ||||||||
| Long-Term Municipal | Coupon | Maturity | Principal | |||||
| Investments—99.8% | Rate (%) | Date | Amount ($) | Value ($) | ||||
| Alabama—.9% | ||||||||
| Jefferson County, Limited Obligation School Warrants | 5.25 | 1/1/15 | 2,500,000 | 2,205,275 | ||||
| Jefferson County, Limited Obligation School Warrants | 5.50 | 1/1/21 | 3,500,000 | 3,162,215 | ||||
| Arizona—.2% | ||||||||
| University Medical Center Corporation, HR | 5.25 | 7/1/15 | 1,160,000 | 1,189,197 | ||||
| California—5.1% | ||||||||
| Agua Caliente Band, Cahuilla Indians Revenue | 6.00 | 7/1/18 | 1,500,000 | 1,514,565 | ||||
| Alameda Corridor Transportation Authority, | ||||||||
| Revenue (Insured; AMBAC) | 0/5.25 | 10/1/21 | 2,000,000 a | 1,707,480 | ||||
| California, GO | 5.25 | 11/1/17 | 2,500,000 | 2,655,600 | ||||
| California, GO | 5.50 | 6/1/20 | 110,000 | 114,750 | ||||
| California, GO | 5.50 | 11/1/33 | 6,300,000 | 6,427,134 | ||||
| California County Tobacco Securitization Agency, | ||||||||
| Tobacco Settlement Asset-Backed Bonds | ||||||||
| (Los Angeles County Securitization Corporation) | 0/5.25 | 6/1/21 | 1,250,000 a | 955,475 | ||||
| Foothill/Eastern Transportation Corridor Agency, | ||||||||
| Toll Road Revenue | 5.75 | 1/15/40 | 2,000,000 | 1,944,680 | ||||
| Foothill/Eastern Transportation Corridor Agency, | ||||||||
| Toll Road Revenue (Insured; MBIA, Inc.) | 0/5.88 | 1/15/27 | 6,000,000 a | 6,064,260 | ||||
| Foothill/Eastern Transportation Corridor Agency, | ||||||||
| Toll Road Revenue (Insured; MBIA, Inc.) | 0/5.88 | 1/15/29 | 2,000,000 a | 2,010,800 | ||||
| Golden State Tobacco Securitization Corporation, Enhanced | ||||||||
| Tobacco Settlement Asset-Backed Bonds (Insured; AMBAC) | 5.00 | 6/1/21 | 1,910,000 | 1,897,413 | ||||
| Golden State Tobacco Securitization Corporation, | ||||||||
| Tobacco Settlement Asset-Backed Bonds | 4.50 | 6/1/27 | 4,205,000 | 3,770,077 | ||||
| Colorado—.9% | ||||||||
| Northwest Parkway Public Highway Authority, | ||||||||
| Revenue (Insured; AMBAC) | 0/5.70 | 6/15/16 | 5,000,000 a,b | 4,919,850 | ||||
| Florida—.7% | ||||||||
| Miami-Dade County, Subordinate Special Obligation | 0/5.00 | 10/1/35 | 1,500,000 a | 1,345,695 | ||||
| Seminole Tribe, Special Obligation Revenue | 5.50 | 10/1/24 | 3,000,000 | 2,824,290 | ||||
| Georgia—.5% | ||||||||
| Burke County Development Authority, PCR (Oglethorpe | ||||||||
| Power Corporation, Vogtle Project) (Insured; MBIA, Inc.) | 4.75 | 4/1/11 | 2,500,000 | 2,571,950 | ||||
| Massachusetts—.1% | ||||||||
| Massachusetts Housing Finance Agency, Housing Revenue | 5.13 | 12/1/34 | 350,000 | 308,812 | ||||
| Michigan—1.2% | ||||||||
| Detroit City School District, School Buildings and | ||||||||
| Site Improvement Bonds (Insured; FGIC) | 5.25 | 5/1/17 | 2,000,000 | 2,187,240 | ||||
| Michigan Tobacco Settlement Finance Authority, | ||||||||
| Tobacco Settlement Asset-Backed Bonds | 5.13 | 6/1/22 | 5,225,000 | 4,832,707 | ||||
40
| BNY Mellon Pennsylvania Intermediate Municipal Bond Fund (continued) | ||||||||
| Long-Term Municipal | Coupon | Maturity | Principal | |||||
| Investments (continued) | Rate (%) | Date | Amount ($) | Value ($) | ||||
| Missouri—.1% | ||||||||
| Missouri Housing Development Commission, | ||||||||
| SFMR (Homeownership Loan Program) | ||||||||
| (Collateralized: FNMA and GNMA) | 6.40 | 9/1/29 | 385,000 | 395,922 | ||||
| New Hampshire—.2% | ||||||||
| New Hampshire Business Finance Authority, | ||||||||
| PCR (Central Maine Power Company) | 5.38 | 5/1/14 | 1,015,000 | 1,052,271 | ||||
| New Jersey—1.7% | ||||||||
| Garden State Preservation Trust, Open Space and | ||||||||
| Farmland Preservation Revenue (Insured; FSA) | 5.80 | 11/1/21 | 2,000,000 | 2,258,040 | ||||
| Garden State Preservation Trust, Open Space and | ||||||||
| Farmland Preservation Revenue (Insured; FSA) | 5.80 | 11/1/23 | 2,000,000 | 2,233,640 | ||||
| New Jersey Economic Development Authority, Cigarette Tax Revenue | 5.75 | 6/15/29 | 4,000,000 | 3,808,760 | ||||
| Tobacco Settlement Financing Corporation of New Jersey, | ||||||||
| Tobacco Settlement Asset-Backed Bonds | 4.50 | 6/1/23 | 1,715,000 | 1,558,438 | ||||
| New York—.4% | ||||||||
| Long Island Power Authority, Electric System | ||||||||
| General Revenue (Insured; FGIC) | 5.25 | 12/1/20 | 2,000,000 | 2,091,020 | ||||
| North Carolina—.5% | ||||||||
| North Carolina Eastern Municipal Power | ||||||||
| Agency, Power System Revenue | 5.30 | 1/1/15 | 1,500,000 | 1,556,310 | ||||
| North Carolina Eastern Municipal Power | ||||||||
| Agency, Power System Revenue | 5.13 | 1/1/23 | 1,500,000 | 1,488,615 | ||||
| Ohio—2.1% | ||||||||
| Buckeye Tobacco Settlement Financing Authority, | ||||||||
| Tobacco Settlement Asset-Backed Bonds | 5.75 | 6/1/34 | 7,500,000 | 6,244,275 | ||||
| Cuyahoga County, Revenue (Cleveland Clinic Health System) | 6.00 | 1/1/16 | 5,000,000 | 5,557,600 | ||||
| Pennsylvania—70.1% | ||||||||
| Allegheny County Hospital Development Authority, | ||||||||
| Revenue (University of Pittsburgh Medical Center) | 5.00 | 6/15/14 | 5,000,000 | 5,286,250 | ||||
| Allegheny County Port Authority, Special | ||||||||
| Transportation Revenue (Insured; FGIC) | 5.38 | 3/1/11 | 2,500,000 | 2,641,725 | ||||
| Allegheny County Port Authority, Special | ||||||||
| Transportation Revenue (Insured; FGIC) | 5.50 | 3/1/14 | 2,500,000 | 2,659,600 | ||||
| Allegheny County Port Authority, Special | ||||||||
| Transportation Revenue (Insured; FGIC) | 5.50 | 3/1/16 | 1,360,000 | 1,446,822 | ||||
| Allegheny County Sanitary Authority, | ||||||||
| Sewer Revenue (Insured; MBIA, Inc.) | 5.00 | 12/1/18 | 2,560,000 | 2,737,997 | ||||
| Allegheny County Sanitary Authority, | ||||||||
| Sewer Revenue (Insured; MBIA, Inc.) | 5.00 | 12/1/22 | 6,860,000 | 7,147,434 | ||||
| Allentown School District, GO | 5.00 | 2/15/22 | 5,875,000 c | 6,021,816 | ||||
The Funds 41
STATEMENT OF INVESTMENTS (continued)
| BNY Mellon Pennsylvania Intermediate Municipal Bond Fund (continued) | ||||||||
| Long-Term Municipal | Coupon | Maturity | Principal | |||||
| Investments (continued) | Rate (%) | Date | Amount ($) | Value ($) | ||||
| Pennsylvania (continued) | ||||||||
| Beaver County Industrial Development Authority, PCR | ||||||||
| (Duquesne Light Company Project) (Insured; AMBAC) | 4.50 | 11/1/29 | 6,500,000 | 6,045,910 | ||||
| Blair County, GO (Insured; AMBAC) | 5.38 | 8/1/15 | 1,880,000 | 2,079,769 | ||||
| Blair County, GO (Insured; AMBAC) | 5.38 | 8/1/16 | 1,980,000 | 2,195,127 | ||||
| Central Bucks School District, GO | 5.00 | 5/15/23 | 5,000,000 | 5,287,350 | ||||
| Central Dauphin School District, GO (Insured; MBIA, Inc.) | 6.75 | 2/1/16 | 5,000,000 b | 6,100,000 | ||||
| Central Dauphin School District, GO (Insured; MBIA, Inc.) | 7.00 | 2/1/16 | 1,630,000 b | 2,013,946 | ||||
| Central Dauphin School District, GO (Insured; MBIA, Inc.) | 7.50 | 2/1/16 | 3,100,000 b | 3,926,522 | ||||
| Central York School District, GO (Insured; FGIC) | 5.00 | 6/1/12 | 2,305,000 | 2,463,930 | ||||
| Central York School District, GO (Insured; FGIC) | 5.50 | 6/1/12 | 80,000 b | 88,262 | ||||
| Central York School District, GO (Insured; FGIC) | 5.50 | 6/1/14 | 920,000 | 992,073 | ||||
| Chester County, GO | 5.00 | 8/15/18 | 4,545,000 | 4,858,560 | ||||
| Chichester School District, GO (Insured; FSA) | 5.25 | 3/15/24 | 1,355,000 | 1,430,907 | ||||
| Coatesville Area School District, GO (Insured; FSA) | 5.25 | 8/15/14 | 1,485,000 b | 1,663,111 | ||||
| Coatesville Area School District, GO (Insured; FSA) | 5.25 | 8/15/14 | 6,515,000 b | 7,296,409 | ||||
| Delaware County Authority, College Revenue (Haverford College) | 5.88 | 11/15/21 | 1,500,000 | 1,594,260 | ||||
| Delaware County Authority, College Revenue (Haverford College) | 5.75 | 11/15/25 | 3,000,000 | 3,163,110 | ||||
| Delaware County Authority, University Revenue | ||||||||
| (Villanova University) (Insured; AMBAC) | 5.00 | 8/1/20 | 2,095,000 | 2,179,806 | ||||
| Delaware County Regional Water Quality Control | ||||||||
| Authority, Sewer Revenue (Insured; FGIC) | 4.75 | 5/1/10 | 1,945,000 | 2,003,933 | ||||
| Delaware River Joint Toll Bridge Commission, | ||||||||
| Bridge Revenue (Insured; MBIA, Inc.) | 5.25 | 7/1/17 | 1,485,000 | 1,609,161 | ||||
| East Stroudsburg Area School District, GO (Insured; FSA) | 7.50 | 9/1/16 | 2,500,000 b | 3,207,250 | ||||
| Easton Area School District, GO (Insured; FSA) | 7.50 | 4/1/18 | 1,000,000 | 1,245,110 | ||||
| Easton Area School District, GO (Insured; FSA) | 7.50 | 4/1/21 | 3,000,000 | 3,665,430 | ||||
| Easton Area School District, GO (Insured; FSA) | 7.50 | 4/1/22 | 3,000,000 | 3,654,930 | ||||
| Erie County, GO (Insured; FGIC) | 5.50 | 9/1/22 | 1,640,000 | 1,798,276 | ||||
| Fleetwood Area School District, GO (Insured; FGIC) | 5.00 | 4/1/11 | 1,500,000 | 1,591,470 | ||||
| Kennett Consolidated School District, GO (Insured; FGIC) | 5.50 | 2/15/12 | 1,310,000 b | 1,431,319 | ||||
| Lancaster County Solid Waste Management Authority, | ||||||||
| Resource Recovery System Revenue (Insured; AMBAC) | 5.25 | 12/15/09 | 4,230,000 | 4,339,599 | ||||
| Lancaster County Solid Waste Management Authority, | ||||||||
| Resource Recovery System Revenue (Insured; AMBAC) | 5.25 | 12/15/10 | 2,000,000 | 2,077,800 | ||||
| Lancaster County Vocational Technical School | ||||||||
| Authority, LR (Insured; FGIC) | 5.25 | 2/15/10 | 1,500,000 | 1,558,140 | ||||
| Lancaster Higher Education Authority, College | ||||||||
| Revenue (Franklin and Marshall College Project) | 5.25 | 4/15/16 | 1,815,000 | 1,928,256 | ||||
| Lancaster Parking Authority, Guaranteed | ||||||||
| Parking Revenue (Insured; AMBAC) | 5.00 | 12/1/32 | 2,300,000 | 2,299,816 | ||||
42
| BNY Mellon Pennsylvania Intermediate Municipal Bond Fund (continued) | ||||||||
| Long-Term Municipal | Coupon | Maturity | Principal | |||||
| Investments (continued) | Rate (%) | Date | Amount ($) | Value ($) | ||||
| Pennsylvania (continued) | ||||||||
| Lancaster Parking Authority, Guaranteed | ||||||||
| Parking Revenue (Insured; AMBAC) | 5.00 | 12/1/35 | 1,500,000 | 1,484,460 | ||||
| Lehigh County General Purpose Authority, | ||||||||
| Revenue (Good Shepherd Group) | 5.25 | 11/1/14 | 3,255,000 | 3,427,189 | ||||
| Lehigh County Industrial Development Authority, PCR | ||||||||
| (People Electric Utilities Corporation Project) (Insured; FGIC) | 4.75 | 2/15/27 | 2,000,000 | 1,921,500 | ||||
| Lower Merion School District, GO | 5.00 | 9/1/22 | 2,980,000 | 3,177,932 | ||||
| Lower Merion School District, GO | 5.00 | 5/15/29 | 11,975,000 | 12,225,876 | ||||
| Montgomery County, GO | 5.00 | 9/15/10 | 1,165,000 | 1,233,362 | ||||
| Montgomery County, GO | 5.00 | 9/15/11 | 2,155,000 | 2,316,560 | ||||
| Muhlenberg School District, GO (Insured; FGIC) | 5.38 | 4/1/15 | 1,000,000 | 1,068,960 | ||||
| Neshaminy School District, GO (Insured; AMBAC) | 5.00 | 5/1/18 | 2,000,000 | 2,151,420 | ||||
| Neshaminy School District, GO (Insured; AMBAC) | 5.00 | 5/1/24 | 1,500,000 | 1,553,040 | ||||
| Northwestern Lehigh School District, GO (Insured; FSA) | 5.00 | 3/15/10 | 1,245,000 | 1,300,876 | ||||
| Owen J. Roberts School District, GO (Insured; FSA) | 5.50 | 8/15/12 | 1,440,000 b | 1,595,232 | ||||
| Parkland School District, GO (Insured; FGIC) | 5.25 | 9/1/11 | 2,220,000 | 2,373,757 | ||||
| Parkland School District, GO (Insured; FGIC) | 5.38 | 9/1/14 | 3,110,000 | 3,429,210 | ||||
| Parkland School District, GO (Insured; FGIC) | 5.38 | 9/1/16 | 1,490,000 | 1,652,842 | ||||
| Pennsylvania, GO | 5.25 | 2/1/11 | 7,850,000 | 8,388,981 | ||||
| Pennsylvania Economic Development Financing | ||||||||
| Authority, SWDR (Waste Management Inc. Project) | 4.70 | 11/1/14 | 5,000,000 | 4,630,650 | ||||
| Pennsylvania Higher Educational Facilities Authority, | ||||||||
| College Revenue (Lafayette College Project) | 6.00 | 5/1/30 | 5,000,000 | 5,205,150 | ||||
| Pennsylvania Higher Educational Facilities Authority, | ||||||||
| Health Services Revenue (Allegheny Delaware Valley | ||||||||
| Obligated Group Project) (Insured; MBIA, Inc.) | 5.60 | 11/15/10 | 2,000,000 | 2,008,220 | ||||
| Pennsylvania Higher Educational Facilities Authority, | ||||||||
| Revenue (Bryn Mawr College) (Insured; AMBAC) | 5.25 | 12/1/12 | 3,000,000 | 3,287,880 | ||||
| Pennsylvania Higher Educational Facilities Authority, | ||||||||
| Revenue (Drexel University) (Insured; MBIA, Inc.) | 5.30 | 5/1/10 | 3,035,000 | 3,072,391 | ||||
| Pennsylvania Higher Educational Facilities | ||||||||
| Authority, Revenue (La Salle University) | 5.50 | 5/1/34 | 2,250,000 | 2,166,052 | ||||
| Pennsylvania Higher Educational Facilities Authority, Revenue | ||||||||
| (State System of Higher Education) (Insured; AMBAC) | 5.00 | 6/15/10 | 2,785,000 | 2,915,811 | ||||
| Pennsylvania Higher Educational Facilities Authority, Revenue | ||||||||
| (State System of Higher Education) (Insured; AMBAC) | 5.75 | 6/15/10 | 3,045,000 | 3,227,365 | ||||
| Pennsylvania Higher Educational Facilities Authority, Revenue | ||||||||
| (State System of Higher Education) (Insured; AMBAC) | 5.00 | 6/15/11 | 2,935,000 | 3,116,559 | ||||
| Pennsylvania Higher Educational Facilities Authority, Revenue | ||||||||
| (Temple University) (Insured; MBIA, Inc.) | 5.25 | 4/1/14 | 960,000 | 971,587 | ||||
The Funds 43
STATEMENT OF INVESTMENTS (continued)
| BNY Mellon Pennsylvania Intermediate Municipal Bond Fund (continued) | ||||||||
| Long-Term Municipal | Coupon | Maturity | Principal | |||||
| Investments (continued) | Rate (%) | Date | Amount ($) | Value ($) | ||||
| Pennsylvania (continued) | ||||||||
| Pennsylvania Higher Educational Facilities Authority, Revenue | ||||||||
| (Thomas Jefferson University) (Insured; AMBAC) | 5.25 | 9/1/17 | 1,700,000 | 1,867,059 | ||||
| Pennsylvania Higher Educational Facilities Authority, Revenue | ||||||||
| (Thomas Jefferson University) (Insured; AMBAC) | 5.25 | 9/1/18 | 1,485,000 | 1,624,902 | ||||
| Pennsylvania Higher Educational Facilities Authority, Revenue | ||||||||
| (University of Scranton) (Insured; AMBAC) | 5.75 | 5/1/11 | 1,690,000 b | 1,839,987 | ||||
| Pennsylvania Higher Educational Facilities Authority, | ||||||||
| Revenue (UPMC Health System) | 5.00 | 1/15/10 | 1,630,000 | 1,680,269 | ||||
| Pennsylvania Higher Educational Facilities Authority, | ||||||||
| Revenue (UPMC Health System) | 5.13 | 1/15/11 | 1,550,000 | 1,619,114 | ||||
| Pennsylvania Higher Educational Facilities Authority, | ||||||||
| Revenue (UPMC Health System) | 6.00 | 1/15/22 | 2,500,000 | 2,649,575 | ||||
| Pennsylvania Higher Educational Facilities Authority, | ||||||||
| Revenue (UPMC Health System) (Insured; FSA) | 5.25 | 8/1/12 | 3,000,000 | 3,098,400 | ||||
| Pennsylvania Housing Finance Agency, SFMR | 5.35 | 10/1/09 | 1,165,000 | 1,179,656 | ||||
| Pennsylvania Housing Finance Agency, SFMR | 5.45 | 10/1/10 | 3,025,000 | 3,058,063 | ||||
| Pennsylvania Housing Finance Agency, SFMR | 5.50 | 10/1/11 | 1,325,000 | 1,337,217 | ||||
| Pennsylvania Housing Finance Agency, SFMR | 5.55 | 10/1/12 | 325,000 | 328,344 | ||||
| Pennsylvania Industrial Development Authority, | ||||||||
| EDR (Insured; AMBAC) | 5.50 | 7/1/12 | 5,335,000 | 5,781,753 | ||||
| Pennsylvania Turnpike Commission, Oil Franchise | ||||||||
| Tax Subordinated Revenue (Insured; MBIA, Inc.) | 5.25 | 12/1/13 | 2,500,000 b | 2,785,400 | ||||
| Pennsylvania Turnpike Commission, Registration | ||||||||
| Fee Revenue (Insured; FSA) | 5.25 | 7/15/24 | 5,000,000 | 5,469,650 | ||||
| Pennsylvania Turnpike Commission, Registration | ||||||||
| Fee Revenue (Insured; FSA) | 5.25 | 7/15/25 | 5,000,000 | 5,464,700 | ||||
| Pennsylvania Turnpike Commission, Turnpike Revenue | 5.50 | 6/1/15 | 1,500,000 | 1,619,595 | ||||
| Pennsylvania Turnpike Commission, Turnpike | ||||||||
| Revenue (Insured; AMBAC) | 5.00 | 12/1/23 | 3,700,000 | 3,790,502 | ||||
| Pennsylvania Turnpike Commission, Turnpike | ||||||||
| Revenue (Insured; AMBAC) | 5.00 | 12/1/29 | 5,000,000 | 5,037,000 | ||||
| Pennsylvania Turnpike Commission, Turnpike Revenue (Insured; FGIC) | 5.00 | 6/1/11 | 3,000,000 | 3,172,920 | ||||
| Pennsylvania Turnpike Commission, Turnpike Revenue (Insured; FGIC) | 5.50 | 12/1/11 | 2,510,000 | 2,708,792 | ||||
| Pennsylvania Turnpike Commission, Turnpike Revenue (Insured; FGIC) | 5.50 | 12/1/12 | 2,000,000 | 2,184,220 | ||||
| Pennsylvania Turnpike Commission, Turnpike Subordinate Revenue | 5.00 | 6/1/26 | 5,000,000 | 5,011,100 | ||||
| Perkiomen Valley School District, GO (Insured; FSA) | 5.25 | 3/1/11 | 690,000 b | 739,908 | ||||
| Perkiomen Valley School District, GO (Insured; FSA) | 5.25 | 3/1/11 | 720,000 b | 772,078 | ||||
| Perkiomen Valley School District, GO (Insured; FSA) | 5.25 | 3/1/13 | 540,000 | 569,867 | ||||
| Perkiomen Valley School District, GO (Insured; FSA) | 5.25 | 3/1/14 | 570,000 | 601,527 | ||||
| Philadelphia, GO (Insured; FSA) | 5.25 | 8/1/17 | 12,500,000 | 13,610,500 | ||||
| Philadelphia, Water and Wastewater Revenue (Insured; AMBAC) | 5.63 | 6/15/09 | 5,000,000 | 5,152,150 | ||||
| Philadelphia, Water and Wastewater Revenue (Insured; AMBAC) | 5.25 | 12/15/12 | 10,000,000 | 10,764,800 | ||||
| Philadelphia, Water and Wastewater Revenue (Insured; FSA) | 5.25 | 7/1/18 | 5,000,000 | 5,424,950 | ||||
44
| BNY Mellon Pennsylvania Intermediate Municipal Bond Fund (continued) | ||||||||
| Long-Term Municipal | Coupon | Maturity | Principal | |||||
| Investments (continued) | Rate (%) | Date | Amount ($) | Value ($) | ||||
| Pennsylvania (continued) | ||||||||
| Philadelphia, Water and Wastewater Revenue (Insured; FSA) | 5.00 | 7/1/23 | 1,690,000 | 1,752,260 | ||||
| Philadelphia Authority for Industrial Development, Industrial and | ||||||||
| Commercial Revenue (Girard Estates Facilities Leasing Project) | 5.00 | 5/15/19 | 2,400,000 | 2,404,752 | ||||
| Philadelphia Authority for Industrial Development, Revenue | ||||||||
| (Cultural and Commercial Corridors Program) (Insured; FGIC) | 5.00 | 12/1/20 | 3,380,000 | 3,401,091 | ||||
| Philadelphia Authority for Industrial Development, Revenue | ||||||||
| (Cultural and Commercial Corridors Program) (Insured; FGIC) | 5.00 | 12/1/22 | 3,150,000 | 3,121,272 | ||||
| Philadelphia Parking Authority, Airport Parking | ||||||||
| Revenue (Insured; AMBAC) | 5.75 | 9/1/09 | 2,255,000 | 2,271,191 | ||||
| Philadelphia School District, GO (Insured; AMBAC) | 5.00 | 4/1/17 | 5,000,000 | 5,310,150 | ||||
| Philadelphia School District, GO (Insured; FSA) | 5.75 | 2/1/11 | 4,000,000 | 4,318,240 | ||||
| Philadelphia School District, GO (Insured; FSA) | 5.75 | 2/1/11 | 3,000,000 b | 3,246,420 | ||||
| Philadelphia School District, GO (Insured; FSA) | 5.50 | 2/1/12 | 1,310,000 b | 1,435,629 | ||||
| Philadelphia School District, GO (Insured; FSA) | 5.50 | 2/1/12 | 1,770,000 b | 1,939,743 | ||||
| Pittsburgh School District, GO (Insured; FSA) | 5.50 | 9/1/16 | 4,000,000 | 4,547,160 | ||||
| Pittsburgh School District, GO (Insured; FSA) | 5.50 | 9/1/18 | 1,000,000 | 1,137,720 | ||||
| Pocono Mountain School District, GO (Insured; FSA) | 5.00 | 9/1/22 | 5,270,000 | 5,545,832 | ||||
| Saint Mary Hospital Authority, Health System | ||||||||
| Revenue (Catholic Health East Issue) | 5.00 | 11/15/21 | 1,000,000 | 985,670 | ||||
| Scranton-Lackawanna Health and Welfare Authority, Revenue | ||||||||
| (Community Medical Center Project) (Insured; MBIA, Inc.) | 5.50 | 7/1/10 | 3,035,000 | 3,072,634 | ||||
| Scranton-Lackawanna Health and Welfare Authority, Revenue | ||||||||
| (Community Medical Center Project) (Insured; MBIA, Inc.) | 5.50 | 7/1/11 | 3,195,000 | 3,234,267 | ||||
| State Public School Building Authority, School LR | ||||||||
| (Richland School District Project) (Insured; FGIC) | 5.00 | 11/15/14 | 1,265,000 b | 1,403,176 | ||||
| State Public School Building Authority, School LR | ||||||||
| (The School District of Philadelphia Project) (Insured; FSA) | 5.00 | 6/1/13 | 5,000,000 b | 5,452,650 | ||||
| State Public School Building Authority, School Revenue | ||||||||
| (Tuscarora School District Project) (Insured; FSA) | 5.25 | 4/1/13 | 195,000 b | 215,479 | ||||
| State Public School Building Authority, School Revenue | ||||||||
| (Tuscarora School District Project) (Insured; FSA) | 5.25 | 4/1/17 | 840,000 | 908,754 | ||||
| Susquehanna Area Regional Airport Authority, | ||||||||
| Airport System Revenue | 5.38 | 1/1/18 | 6,000,000 | 5,508,360 | ||||
| Susquehanna Area Regional Airport Authority, | ||||||||
| Airport System Revenue (Insured; AMBAC) | 5.50 | 1/1/20 | 4,370,000 | 4,389,709 | ||||
| Susquehanna Area Regional Airport Authority, | ||||||||
| Airport System Revenue (Insured; AMBAC) | 5.00 | 1/1/33 | 2,290,000 | 2,036,154 | ||||
| Swarthmore Borough Authority, College Revenue | 5.50 | 9/15/11 | 17,500,000 | 19,073,600 | ||||
| Swarthmore Borough Authority, College Revenue | 5.25 | 9/15/17 | 1,000,000 | 1,080,530 | ||||
| Twin Valley School District, GO (Insured; FSA) | 5.25 | 10/1/15 | 1,000,000 b | 1,129,410 | ||||
| University Area Joint Authority, Sewer Revenue (Insured; MBIA, Inc.) | 5.00 | 11/1/11 | 1,430,000 | 1,514,542 | ||||
| Upper Darby School District, GO (Insured; FGIC) | 5.00 | 5/1/18 | 2,870,000 | 3,055,488 | ||||
| Upper Merion Area School District, GO (Insured; MBIA, Inc.) | 5.00 | 2/15/19 | 1,165,000 | 1,226,547 | ||||
The Funds 45
STATEMENT OF INVESTMENTS (continued)
| BNY Mellon Pennsylvania Intermediate Municipal Bond Fund (continued) | ||||||||
| Long-Term Municipal | Coupon | Maturity | Principal | |||||
| Investments (continued) | Rate (%) | Date | Amount ($) | Value ($) | ||||
| Pennsylvania (continued) | ||||||||
| Warwick School District, GO (Insured; FGIC) | 5.25 | 2/15/11 | 1,000,000 | 1,071,300 | ||||
| Wilson Area School District, GO (Insured; FGIC) | 5.00 | 2/15/11 | 1,910,000 | 2,010,638 | ||||
| Wilson School District, GO (Insured; FSA) | 5.38 | 5/15/12 | 1,785,000 b | 1,959,751 | ||||
| Wilson School District, GO (Insured; FSA) | 5.38 | 5/15/12 | 1,500,000 b | 1,646,850 | ||||
| York County, GO (Insured; AMBAC) | 5.00 | 6/1/17 | 1,100,000 | 1,174,283 | ||||
| York County Solid Waste and Refuse Authority, | ||||||||
| Solid Waste System Revenue (Insured; FGIC) | 5.50 | 12/1/14 | 1,000,000 | 1,109,420 | ||||
| South Carolina—.4% | ||||||||
| Greenville County School District, Installment Purchase | ||||||||
| Revenue (Building Equity Sooner for Tomorrow) | 5.50 | 12/1/18 | 2,000,000 | 2,230,960 | ||||
| Texas—.3% | ||||||||
| Cities of Dallas and Fort Worth, Dallas/Fort Worth International | ||||||||
| Airport, Joint Revenue Improvement Bonds (Insured; FGIC) | 5.50 | 11/1/31 | 2,000,000 | 1,906,740 | ||||
| Virginia—1.2% | ||||||||
| Industrial Development Authority of the County of | ||||||||
| Charles City, Solid Waste Disposal Facility | ||||||||
| Revenue (USA Waste of Virginia, Inc. Project) | 4.88 | 2/1/09 | 6,600,000 | 6,604,158 | ||||
| U.S. Related—13.2% | ||||||||
| Puerto Rico Commonwealth, Public Improvement GO | 5.25 | 7/1/23 | 4,090,000 | 4,089,714 | ||||
| Puerto Rico Commonwealth, Public Improvement GO (Insured; FGIC) | 5.50 | 7/1/18 | 9,545,000 | 9,907,901 | ||||
| Puerto Rico Commonwealth, Public | ||||||||
| Improvement GO (Insured; MBIA, Inc.) | 5.50 | 7/1/14 | 7,500,000 | 7,902,525 | ||||
| Puerto Rico Commonwealth, Public | ||||||||
| Improvement GO (Insured; MBIA, Inc.) | 5.50 | 7/1/20 | 4,000,000 | 4,149,600 | ||||
| Puerto Rico Electric Power Authority, | ||||||||
| Power Revenue (Insured; FSA) | 5.25 | 7/1/10 | 5,000,000 b | 5,342,400 | ||||
| Puerto Rico Electric Power Authority, | ||||||||
| Power Revenue (Insured; MBIA, Inc.) | 5.25 | 7/1/14 | 7,875,000 | 8,317,575 | ||||
| Puerto Rico Electric Power Authority, | ||||||||
| Power Revenue (Insured; MBIA, Inc.) | 5.50 | 7/1/17 | 6,000,000 | 6,394,920 | ||||
| Puerto Rico Electric Power Authority, | ||||||||
| Power Revenue (Insured; MBIA, Inc.) | 5.50 | 7/1/19 | 2,290,000 | 2,423,095 | ||||
| Puerto Rico Government Development Bank, Senior Notes | 5.00 | 12/1/12 | 3,000,000 | 3,103,320 | ||||
| Puerto Rico Government Development Bank, Senior Notes | 5.00 | 12/1/13 | 3,000,000 | 3,097,500 | ||||
| Puerto Rico Highways and Transportation Authority, | ||||||||
| Highway Revenue (Insured; FSA) | 5.50 | 7/1/13 | 1,500,000 | 1,613,580 | ||||
| Puerto Rico Highways and Transportation Authority, | ||||||||
| Highway Revenue (Insured; MBIA, Inc.) | 5.50 | 7/1/13 | 4,000,000 | 4,285,160 | ||||
46
| BNY Mellon Pennsylvania Intermediate Municipal Bond Fund (continued) | ||||||||
| Long-Term Municipal | Coupon | Maturity | Principal | |||||
| Investments (continued) | Rate (%) | Date | Amount ($) | Value ($) | ||||
| U.S. Related (continued) | ||||||||
| Puerto Rico Highways and Transportation | ||||||||
| Authority, Transportation Revenue | 5.25 | 7/1/10 | 4,000,000 | 4,139,400 | ||||
| Puerto Rico Infrastructure Financing Authority, Special Tax Revenue | 5.00 | 7/1/21 | 5,000,000 | 4,932,150 | ||||
| Puerto Rico Municipal Finance Agency (Insured; FSA) | 5.50 | 8/1/09 | 5,000,000 | 5,139,500 | ||||
| Total Long-Term Municipal Investments | ||||||||
| (cost $559,567,171) | 566,703,272 | |||||||
| Short-Term Municipal Investments—.2% | ||||||||
| Illinois—.0% | ||||||||
| Illinois Finance Authority, Revenue (Resurrection | ||||||||
| Health Care) (LOC; JPMorgan Chase Bank) | 2.65 | 9/1/08 | 5,000 d | 5,000 | ||||
| Pennsylvania—.2% | ||||||||
| Delaware County Authority, Revenue (White Horse | ||||||||
| Village Project) (LOC; Citizens Bank of Pennsylvania) | 2.45 | 9/1/08 | 700,000 d | 700,000 | ||||
| Delaware County Authority, Revenue (White Horse | ||||||||
| Village Project) (LOC; Citizens Bank of Pennsylvania) | 2.45 | 9/1/08 | 500,000 d | 500,000 | ||||
| Washington—.0% | ||||||||
| Washington Housing Finance Commission, Nonprofit | ||||||||
| Revenue (Pioneer Human Services Projects) (LOC; U.S. Bank NA) | 2.41 | 9/1/08 | 100,000 d | 100,000 | ||||
| Total Short-Term Municipal Investments | ||||||||
| (cost $1,305,000) | 1,305,000 | |||||||
| Total Investments (cost $560,872,171) | 100.0% | 568,008,272 | ||||||
| Cash and Receivables (Net) | .0% | 200,483 | ||||||
| Net Assets | 100.0% | 568,208,755 | ||||||
| a Zero coupon until a specified date at which time the stated coupon rate becomes effective until maturity. |
| b These securities are prerefunded; the date shown represents the prerefunded date. Bonds which are prerefunded are collateralized by U.S. Government securities which are held in |
| escrow and are used to pay principal and interest on the municipal issue and to retire the bonds in full at the earliest refunding date. |
| c Purchased on a delayed delivery basis. |
| d Variable rate demand note—rate shown is the interest rate in effect at August 31, 2008. Maturity date represents the next demand date or the ultimate maturity date if earlier. |
The Funds 47
STATEMENT OF INVESTMENTS (continued)
| Summary of Abbreviations | ||||||
| ABAG | Association of Bay Area Governments | ACA | American Capital Access | |||
| AGC | ACE Guaranty Corporation | AGIC | Asset Guaranty Insurance Company | |||
| AMBAC | American Municipal Bond Assurance Corporation | ARRN | Adjustable Rate Receipt Notes | |||
| BAN | Bond Anticipation Notes | BIGI | Bond Investors Guaranty Insurance | |||
| BPA | Bond Purchase Agreement | CGIC | Capital Guaranty Insurance Company | |||
| CIC | Continental Insurance Company | CIFG | CDC Ixis Financial Guaranty | |||
| CMAC | Capital Market Assurance Corporation | COP | Certificate of Participation | |||
| CP | Commercial Paper | EDR | Economic Development Revenue | |||
| EIR | Environmental Improvement Revenue | FGIC | Financial Guaranty Insurance Company | |||
| FHA | Federal Housing Administration | FHLB | Federal Home Loan Bank | |||
| FHLMC | Federal Home Loan Mortgage Corporation | FNMA | Federal National Mortgage Association | |||
| FSA | Financial Security Assurance | GAN | Grant Anticipation Notes | |||
| GIC | Guaranteed Investment Contract | GNMA | Government National Mortgage Association | |||
| GO | General Obligation | HR | Hospital Revenue | |||
| IDB | Industrial Development Board | IDC | Industrial Development Corporation | |||
| IDR | Industrial Development Revenue | LOC | Letter of Credit | |||
| LOR | Limited Obligation Revenue | LR | Lease Revenue | |||
| MFHR | Multi-Family Housing Revenue | MFMR | Multi-Family Mortgage Revenue | |||
| PCR | Pollution Control Revenue | PILOT | Payment in Lieu of Taxes | |||
| RAC | Revenue Anticipation Certificates | RAN | Revenue Anticipation Notes | |||
| RAW | Revenue Anticipation Warrants | RRR | Resources Recovery Revenue | |||
| SAAN | State Aid Anticipation Notes | SBPA | Standby Bond Purchase Agreement | |||
| SFHR | Single Family Housing Revenue | SFMR | Single Family Mortgage Revenue | |||
| SONYMA | State of New York Mortgage Agency | SWDR | Solid Waste Disposal Revenue | |||
| TAN | Tax Anticipation Notes | TAW | Tax Anticipation Warrants | |||
| TRAN | Tax and Revenue Anticipation Notes | XLCA | XL Capital Assurance | |||
| Summary of Combined Ratings (Unaudited) | ||||||||||
| Fitch | or | Moody’s | or | Standard & Poor’s | Value (%)† | |||||
| AAA | Aaa | AAA | 56.0 | |||||||
| AA | Aa | AA | 21.1 | |||||||
| A | A | A | 8.9 | |||||||
| BBB | Baa | BBB | 13.8 | |||||||
| F1 | MIG1/P1 | SP1/A1 | .2 | |||||||
| 100.0 | ||||||||||
| † Based on total investments. |
| See notes to financial statements. |
48
| STATEMENT OF FINANCIAL FUTURES |
| August 31, 2008 |
| Market Value | Unrealized | |||||||
| BNY Mellon Pennsylvania | Covered by | Appreciation | ||||||
| Intermediate Municipal Bond Fund | Contracts | Contracts ($) | Expiration | at 8/31/2008 ($) | ||||
| Financial Futures Short | ||||||||
| U.S. Treasury 20 Year Bond | 143 | (16,775,688) | December 2008 | 84,907 |
| See notes to financial statements. |
The Funds 49
| STATEMENT OF INVESTMENTS |
| August 31, 2008 |
| BNY Mellon Massachusetts Intermediate Municipal Bond Fund | ||||||||
| Long-Term Municipal | Coupon | Maturity | Principal | |||||
| Investments—96.7% | Rate (%) | Date | Amount ($) | Value ($) | ||||
| Massachusetts—87.1% | ||||||||
| Ashland, GO (Insured; AMBAC) | 5.25 | 5/15/21 | 1,305,000 | 1,398,673 | ||||
| Auburn, GO (Insured; AMBAC) | 5.13 | 6/1/20 | 1,225,000 | 1,288,969 | ||||
| Bellingham, GO (Insured; AMBAC) | 5.38 | 3/1/14 | 1,685,000 | 1,799,748 | ||||
| Boston, GO | 5.75 | 2/1/10 | 2,000,000 | 2,107,960 | ||||
| Boston, GO | 5.00 | 3/1/20 | 2,500,000 | 2,697,450 | ||||
| Boston, GO | 5.00 | 3/1/21 | 3,605,000 | 3,860,054 | ||||
| Boston Economic Development and Industrial | ||||||||
| Corporation, Public Parking Facility Bonds | 4.50 | 6/1/10 | 3,000,000 | 3,112,140 | ||||
| Boston Water and Sewer Commission, Revenue | 9.25 | 1/1/11 | 100,000 | 112,176 | ||||
| Boston Water and Sewer Commission, Revenue | 5.00 | 11/1/19 | 2,170,000 | 2,300,677 | ||||
| Boston Water and Sewer Commission, Revenue | 5.00 | 11/1/23 | 3,920,000 | 4,097,419 | ||||
| Brockton, GO (Municipal Purpose Loan) (Insured; AMBAC) | 5.00 | 6/1/19 | 1,430,000 | 1,507,778 | ||||
| Burlington, GO | 5.25 | 2/1/12 | 200,000 | 217,756 | ||||
| Burlington, GO | 5.25 | 2/1/13 | 250,000 | 275,972 | ||||
| Cambridge, GO (Municipal Purpose Loan) | 5.00 | 12/15/11 | 510,000 | 550,851 | ||||
| Cohasset, GO | 5.00 | 6/15/22 | 895,000 | 930,728 | ||||
| Cohasset, GO | 5.00 | 6/15/23 | 895,000 | 933,771 | ||||
| Everett, GO (Insured; FGIC) | 5.38 | 12/15/17 | 1,250,000 | 1,362,800 | ||||
| Haverhill, GO (State Qualified Municipal | ||||||||
| Purpose Loan) (Insured; FGIC) | 5.00 | 6/1/16 | 1,580,000 | 1,756,107 | ||||
| Haverhill, GO (State Qualified Municipal | ||||||||
| Purpose Loan) (Insured; FGIC) | 5.00 | 6/1/18 | 505,000 | 549,556 | ||||
| Hingham, GO (Municipal Purpose Loan) | 5.38 | 4/1/17 | 1,645,000 | 1,778,689 | ||||
| Holden, GO (Municipal Purpose Loan) (Insured; FGIC) | 6.00 | 3/1/10 | 1,000,000 a | 1,069,760 | ||||
| Hopedale, GO (Insured; AMBAC) | 5.00 | 11/15/19 | 650,000 | 690,541 | ||||
| Ipswich, GO (Insured; FGIC) | 5.00 | 11/15/14 | 500,000 | 552,620 | ||||
| Lynnfield, GO (Municipal Purpose Loan) | 5.00 | 7/1/20 | 505,000 | 529,563 | ||||
| Lynnfield, GO (Municipal Purpose Loan) | 5.00 | 7/1/21 | 525,000 | 545,554 | ||||
| Lynnfield, GO (Municipal Purpose Loan) | 5.00�� | 7/1/22 | 585,000 | 608,423 | ||||
| Lynnfield, GO (Municipal Purpose Loan) | 5.00 | 7/1/23 | 585,000 | 609,903 | ||||
| Malden, GO (Insured; FGIC) | 5.00 | 8/1/18 | 2,260,000 | 2,401,815 | ||||
| Mansfield, GO (Insured; AMBAC) | 5.00 | 8/15/17 | 1,395,000 | 1,500,588 | ||||
| Marblehead, GO | 5.00 | 8/15/18 | 1,340,000 | 1,426,872 | ||||
| Marblehead, GO | 5.00 | 8/15/22 | 1,750,000 | 1,820,595 | ||||
| Mashpee, GO (Insured; FGIC) | 5.63 | 11/15/10 | 500,000 a | 542,255 | ||||
| Massachusetts, Consolidated Loan | 5.75 | 6/1/10 | 5,000,000 a | 5,291,850 | ||||
| Massachusetts, Consolidated Loan | 5.25 | 11/1/12 | 2,000,000 a | 2,177,700 | ||||
| Massachusetts, Consolidated Loan | 5.25 | 10/1/13 | 2,600,000 a | 2,849,028 | ||||
| Massachusetts, Consolidated Loan | 5.25 | 10/1/13 | 2,500,000 a | 2,739,450 | ||||
| Massachusetts, Consolidated Loan | 5.00 | 3/1/15 | 1,500,000 a | 1,662,270 | ||||
| Massachusetts, Consolidated Loan | 5.00 | 3/1/15 | 1,800,000 a | 1,994,724 | ||||
50
| BNY Mellon Massachusetts Intermediate Municipal Bond Fund (continued) | ||||||||
| Long-Term Municipal | Coupon | Maturity | Principal | |||||
| Investments (continued) | Rate (%) | Date | Amount ($) | Value ($) | ||||
| Massachusetts (continued) | ||||||||
| Massachusetts, Consolidated Loan | 5.00 | 8/1/16 | 1,000,000 a | 1,113,070 | ||||
| Massachusetts, Consolidated Loan | 5.50 | 11/1/16 | 1,000,000 | 1,147,380 | ||||
| Massachusetts, Consolidated Loan | 5.00 | 9/1/18 | 5,000,000 | 5,397,900 | ||||
| Massachusetts, Consolidated Loan (Insured; FGIC) | 5.50 | 11/1/13 | 2,500,000 | 2,798,025 | ||||
| Massachusetts, Consolidated Loan (Insured; FGIC) | 5.50 | 8/1/18 | 1,035,000 | 1,178,637 | ||||
| Massachusetts, Consolidated Loan (Insured; FSA) | 5.25 | 1/1/13 | 5,000,000 a | 5,434,150 | ||||
| Massachusetts, Consolidated Loan (Insured; FSA) | 5.25 | 8/1/22 | 5,825,000 | 6,298,514 | ||||
| Massachusetts, Consolidated Loan (Insured; MBIA, Inc.) | 5.50 | 1/1/12 | 1,500,000 | 1,635,690 | ||||
| Massachusetts, Consolidated Loan (Insured; MBIA, Inc.) | 5.00 | 8/1/12 | 420,000 a | 451,773 | ||||
| Massachusetts, Consolidated Loan (Insured; MBIA, Inc.) | 5.00 | 8/1/12 | 1,580,000 a | 1,699,527 | ||||
| Massachusetts, Consolidated Loan (Insured; MBIA, Inc.) | 5.50 | 11/1/12 | 3,000,000 | 3,320,850 | ||||
| Massachusetts, Federal Highway, GAN | 5.50 | 6/15/14 | 4,335,000 | 4,424,604 | ||||
| Massachusetts, Federal Highway, GAN (Insured; FSA) | 5.75 | 6/15/12 | 2,500,000 | 2,668,150 | ||||
| Massachusetts, Federal Highway, GAN (Insured; FSA) | 5.13 | 12/15/12 | 1,500,000 | 1,525,920 | ||||
| Massachusetts, Federal Highway, GAN (Insured; MBIA, Inc.) | 5.13 | 6/15/15 | 500,000 | 509,790 | ||||
| Massachusetts, GO (Insured; AMBAC) | 5.50 | 10/1/18 | 5,225,000 | 5,980,849 | ||||
| Massachusetts, GO (Insured; FSA) | 5.25 | 9/1/22 | 2,275,000 | 2,531,097 | ||||
| Massachusetts, GO (Insured; XLCA) | 7.95 | 12/1/12 | 2,470,000 b | 2,506,877 | ||||
| Massachusetts, Special Obligation | ||||||||
| Dedicated Tax Revenue (Insured; FGIC) | 5.25 | 1/1/14 | 2,500,000 a | 2,745,075 | ||||
| Massachusetts, Special Obligation | ||||||||
| Dedicated Tax Revenue (Insured; FGIC) | 6.51 | 1/1/16 | 3,540,000 b | 3,531,893 | ||||
| Massachusetts, Special Obligation Revenue | 5.38 | 6/1/11 | 6,350,000 | 6,844,538 | ||||
| Massachusetts, Special Obligation Revenue | 5.50 | 6/1/13 | 1,000,000 | 1,117,410 | ||||
| Massachusetts, Special Obligation | ||||||||
| Revenue (Insured; FGIC) | 5.38 | 6/1/12 | 5,000,000 a | 5,445,450 | ||||
| Massachusetts Bay Transportation Authority, Assessment Revenue | 5.75 | 7/1/10 | 2,835,000 a | 3,024,605 | ||||
| Massachusetts Bay Transportation Authority, Assessment Revenue | 5.75 | 7/1/11 | 165,000 | 174,727 | ||||
| Massachusetts Bay Transportation Authority, Assessment Revenue | 5.25 | 7/1/14 | 1,045,000 a | 1,169,742 | ||||
| Massachusetts Bay Transportation Authority, Assessment Revenue | 5.25 | 7/1/14 | 1,000,000 a | 1,119,370 | ||||
| Massachusetts Bay Transportation Authority, Assessment Revenue | 5.00 | 7/1/15 | 5,000,000 a | 5,569,800 | ||||
| Massachusetts Bay Transportation Authority, | ||||||||
| General Transportation System (Insured; FGIC) | 5.25 | 3/1/15 | 1,000,000 | 1,111,290 | ||||
| Massachusetts Bay Transportation Authority, | ||||||||
| Senior Sales Tax Revenue | 5.00 | 7/1/15 | 3,500,000 | 3,888,605 | ||||
| Massachusetts Bay Transportation Authority, | ||||||||
| Senior Sales Tax Revenue | 5.50 | 7/1/16 | 2,500,000 | 2,869,600 | ||||
| Massachusetts Bay Transportation Authority, | ||||||||
| Senior Sales Tax Revenue | 5.25 | 7/1/21 | 2,000,000 | 2,225,580 | ||||
| Massachusetts Bay Transportation Authority, | ||||||||
| Senior Sales Tax Revenue | 5.25 | 7/1/22 | 2,430,000 | 2,706,413 | ||||
The Funds 51
STATEMENT OF INVESTMENTS (continued)
| BNY Mellon Massachusetts Intermediate Municipal Bond Fund (continued) | ||||||||
| Long-Term Municipal | Coupon | Maturity | Principal | |||||
| Investments (continued) | Rate (%) | Date | Amount ($) | Value ($) | ||||
| Massachusetts (continued) | ||||||||
| Massachusetts Development Finance Agency, | ||||||||
| Education Revenue (Belmont Hill School Issue) | 5.00 | 9/1/11 | 500,000 a | 535,285 | ||||
| Massachusetts Development Finance Agency, | ||||||||
| Education Revenue (Dexter School Project) | 5.00 | 5/1/23 | 1,400,000 | 1,435,560 | ||||
| Massachusetts Development Finance Agency, | ||||||||
| Education Revenue (Dexter School Project) | 5.00 | 5/1/24 | 1,465,000 | 1,498,006 | ||||
| Massachusetts Development Finance Agency, | ||||||||
| Higher Education Revenue (Emerson College Issue) | 5.00 | 1/1/16 | 1,000,000 | 1,045,520 | ||||
| Massachusetts Development Finance Agency, | ||||||||
| Higher Education Revenue (Emerson College Issue) | 5.00 | 1/1/22 | 2,000,000 | 2,016,140 | ||||
| Massachusetts Development Finance Agency, | ||||||||
| Higher Education Revenue (Smith College Issue) | 5.75 | 7/1/10 | 1,000,000 a | 1,076,510 | ||||
| Massachusetts Development Finance Agency, | ||||||||
| Revenue (Belmont Hill School Issue) | 4.50 | 9/1/36 | 1,380,000 | 1,232,368 | ||||
| Massachusetts Development Finance Agency, | ||||||||
| Revenue (Boston College Issue) | 5.00 | 7/1/20 | 1,000,000 | 1,056,620 | ||||
| Massachusetts Development Finance Agency, | ||||||||
| Revenue (College of the Holy Cross Issue) | 5.00 | 9/1/19 | 1,000,000 | 1,087,810 | ||||
| Massachusetts Development Finance Agency, | ||||||||
| Revenue (College of the Holy Cross Issue) | 5.00 | 9/1/21 | 1,800,000 | 1,918,620 | ||||
| Massachusetts Development Finance Agency, | ||||||||
| Revenue (Combined Jewish Philanthropies | ||||||||
| of Greater Boston, Inc. Project) | 5.25 | 2/1/22 | 1,000,000 | 1,054,880 | ||||
| Massachusetts Development Finance Agency, | ||||||||
| Revenue (Curry College Issue) (Insured; ACA) | 4.75 | 3/1/20 | 530,000 | 495,153 | ||||
| Massachusetts Development Finance Agency, | ||||||||
| Revenue (Curry College Issue) (Insured; ACA) | 5.25 | 3/1/26 | 1,000,000 | 950,560 | ||||
| Massachusetts Development Finance Agency, | ||||||||
| Revenue (Curry College Issue) (Insured; ACA) | 5.00 | 3/1/36 | 1,000,000 | 880,730 | ||||
| Massachusetts Development Finance Agency, | ||||||||
| Revenue (Massachusetts College of Pharmacy | ||||||||
| and Allied Health Sciences Issue) | 6.30 | 1/1/10 | 350,000 | 373,786 | ||||
| Massachusetts Development Finance Agency, | ||||||||
| Revenue (Massachusetts College of Pharmacy | ||||||||
| and Allied Health Sciences Issue) | 6.40 | 1/1/10 | 370,000 a | 395,634 | ||||
| Massachusetts Development Finance Agency, | ||||||||
| Revenue (Massachusetts College of Pharmacy | ||||||||
| and Allied Health Sciences Issue) | 6.50 | 1/1/10 | 395,000 a | 422,883 | ||||
| Massachusetts Development Finance Agency, | ||||||||
| Revenue (Massachusetts College of Pharmacy | ||||||||
| and Allied Health Sciences Issue) | 6.38 | 7/1/13 | 1,000,000 a | 1,168,190 | ||||
| Massachusetts Development Finance Agency, | ||||||||
| Revenue (Massachusetts College of Pharmacy | ||||||||
| and Allied Health Sciences Issue) | ||||||||
| (Insured; Assured Guaranty) | 5.00 | 7/1/24 | 2,750,000 | 2,812,123 | ||||
52
| BNY Mellon Massachusetts Intermediate Municipal Bond Fund (continued) | ||||||||
| Long-Term Municipal | Coupon | Maturity | Principal | |||||
| Investments (continued) | Rate (%) | Date | Amount ($) | Value ($) | ||||
| Massachusetts (continued) | ||||||||
| Massachusetts Development Finance Agency, Revenue | ||||||||
| (Massachusetts College of Pharmacy and Allied | ||||||||
| Health Sciences Issue) (Insured; Assured Guaranty) | 5.00 | 7/1/27 | 1,000,000 | 1,013,810 | ||||
| Massachusetts Development Finance Agency, | ||||||||
| Revenue (Milton Academy Issue) | 5.00 | 9/1/19 | 1,000,000 | 1,073,740 | ||||
| Massachusetts Development Finance Agency, | ||||||||
| Revenue (Suffolk University Issue) | 5.85 | 7/1/09 | 1,000,000 a | 1,043,780 | ||||
| Massachusetts Development Finance Agency, | ||||||||
| Revenue (The Park School Issue) | 4.50 | 9/1/31 | 1,000,000 | 918,520 | ||||
| Massachusetts Development Finance Agency, | ||||||||
| RRR (Waste Management, Inc. Project) | 6.90 | 12/1/09 | 1,000,000 | 1,028,080 | ||||
| Massachusetts Development Finance Agency, | ||||||||
| SWDR (Waste Management, Inc. Project) | 5.45 | 6/1/14 | 1,000,000 | 960,550 | ||||
| Massachusetts Educational Financing Authority, | ||||||||
| Education Loan Revenue (Insured; AMBAC) | 4.70 | 1/1/10 | 715,000 | 726,662 | ||||
| Massachusetts Educational Financing Authority, | ||||||||
| Education Loan Revenue (Insured; AMBAC) | 6.20 | 7/1/13 | 40,000 | 40,166 | ||||
| Massachusetts Health and Educational Facilities | ||||||||
| Authority, Revenue (Berklee College of Music Issue) | 5.00 | 10/1/22 | 1,080,000 | 1,111,752 | ||||
| Massachusetts Health and Educational Facilities | ||||||||
| Authority, Revenue (Berklee College of Music Issue) | 5.00 | 10/1/37 | 3,250,000 | 3,191,175 | ||||
| Massachusetts Health and Educational Facilities | ||||||||
| Authority, Revenue (Boston College Issue) | 5.13 | 6/1/37 | 2,000,000 | 2,015,360 | ||||
| Massachusetts Health and Educational Facilities | ||||||||
| Authority, Revenue (CareGroup Issue) (Insured; MBIA, Inc.) | 5.25 | 7/1/20 | 1,000,000 | 1,051,310 | ||||
| Massachusetts Health and Educational Facilities | ||||||||
| Authority, Revenue (CareGroup Issue) (Insured; MBIA, Inc.) | 5.25 | 7/1/23 | 1,000,000 | 1,030,940 | ||||
| Massachusetts Health and Educational Facilities | ||||||||
| Authority, Revenue (Dana-Farber Cancer Institute Issue) | 5.25 | 12/1/22 | 2,750,000 | 2,894,650 | ||||
| Massachusetts Health and Educational Facilities | ||||||||
| Authority, Revenue (Dana-Farber Cancer Institute Issue) | 5.25 | 12/1/27 | 2,000,000 | 2,068,800 | ||||
| Massachusetts Health and Educational Facilities | ||||||||
| Authority, Revenue (Dana-Farber Cancer Institute Issue) | 5.00 | 12/1/37 | 2,500,000 | 2,454,550 | ||||
| Massachusetts Health and Educational Facilities | ||||||||
| Authority, Revenue (Dartmouth-Hitchcock | ||||||||
| Obligated Group Issue) (Insured; FSA) | 5.13 | 8/1/22 | 2,000,000 | 2,065,540 | ||||
| Massachusetts Health and Educational Facilities | ||||||||
| Authority, Revenue (Harvard University Issue) | 5.00 | 7/15/36 | 1,000,000 | 1,020,940 | ||||
| Massachusetts Health and Educational Facilities | ||||||||
| Authority, Revenue (Jordan Hospital Issue) | 5.00 | 10/1/10 | 500,000 | 502,090 | ||||
| Massachusetts Health and Educational Facilities Authority, | ||||||||
| Revenue (Massachusetts Institute of Technology Issue) | 5.00 | 7/1/23 | 5,335,000 | 5,870,794 | ||||
| Massachusetts Health and Educational Facilities Authority, | ||||||||
| Revenue (Massachusetts Institute of Technology Issue) | 5.00 | 7/1/38 | 2,000,000 | 2,050,140 | ||||
The Funds 53
STATEMENT OF INVESTMENTS (continued)
| BNY Mellon Massachusetts Intermediate Municipal Bond Fund (continued) | ||||||||
| Long-Term Municipal | Coupon | Maturity | Principal | |||||
| Investments (continued) | Rate (%) | Date | Amount ($) | Value ($) | ||||
| Massachusetts (continued) | ||||||||
| Massachusetts Health and Educational Facilities Authority, | ||||||||
| Revenue (Milford Regional Medical Center Issue) | 5.00 | 7/15/11 | 500,000 | 511,910 | ||||
| Massachusetts Health and Educational Facilities Authority, | ||||||||
| Revenue (Milford Regional Medical Center Issue) | 5.00 | 7/15/22 | 500,000 | 461,520 | ||||
| Massachusetts Health and Educational Facilities Authority, | ||||||||
| Revenue (Northeastern University Issue) (Insured; MBIA, Inc.) | 5.50 | 10/1/09 | 420,000 | 433,742 | ||||
| Massachusetts Health and Educational Facilities Authority, | ||||||||
| Revenue (Partners HealthCare System Issue) | 5.25 | 7/1/13 | 1,595,000 | 1,631,956 | ||||
| Massachusetts Health and Educational Facilities Authority, | ||||||||
| Revenue (Partners HealthCare System Issue) | 5.00 | 7/1/16 | 1,045,000 | 1,087,239 | ||||
| Massachusetts Health and Educational Facilities Authority, | ||||||||
| Revenue (Partners HealthCare System Issue) | 5.00 | 7/1/18 | 1,500,000 | 1,595,730 | ||||
| Massachusetts Health and Educational Facilities Authority, | ||||||||
| Revenue (Partners HealthCare System Issue) | 5.13 | 7/1/19 | 1,000,000 | 1,010,840 | ||||
| Massachusetts Health and Educational Facilities Authority, | ||||||||
| Revenue (Partners HealthCare System Issue) | 5.00 | 7/1/21 | 1,235,000 | 1,278,633 | ||||
| Massachusetts Health and Educational Facilities Authority, | ||||||||
| Revenue (Partners HealthCare System Issue) | 5.75 | 7/1/21 | 2,325,000 | 2,440,948 | ||||
| Massachusetts Health and Educational Facilities Authority, | ||||||||
| Revenue (Partners HealthCare System Issue) | 5.00 | 7/1/22 | 250,000 | 257,180 | ||||
| Massachusetts Health and Educational Facilities Authority, | ||||||||
| Revenue (Tufts University Issue) | 5.50 | 8/15/14 | 1,000,000 | 1,132,780 | ||||
| Massachusetts Health and Educational Facilities Authority, | ||||||||
| Revenue (Tufts University Issue) | 5.50 | 2/15/36 | 1,000,000 | 1,015,350 | ||||
| Massachusetts Health and Educational Facilities Authority, | ||||||||
| Revenue (UMass Memorial Issue) | 5.25 | 7/1/25 | 2,000,000 | 1,899,080 | ||||
| Massachusetts Health and Educational Facilities Authority, | ||||||||
| Revenue (UMass Memorial Issue) | 5.00 | 7/1/33 | 1,000,000 | 874,550 | ||||
| Massachusetts Health and Educational Facilities Authority, | ||||||||
| Revenue (Wellesley College Issue) | 5.00 | 7/1/24 | 1,000,000 | 1,037,350 | ||||
| Massachusetts Health and Educational Facilities Authority, | ||||||||
| Revenue (Winchester Hospital Issue) | 6.75 | 7/1/10 | 1,540,000 a | 1,664,032 | ||||
| Massachusetts Housing Finance Agency, Housing Revenue | 4.20 | 12/1/10 | 1,495,000 | 1,538,938 | ||||
| Massachusetts Housing Finance Agency, Housing Revenue | 5.00 | 12/1/26 | 1,165,000 | 1,080,596 | ||||
| Massachusetts Housing Finance Agency, Housing Revenue | 5.13 | 12/1/34 | 200,000 | 176,464 | ||||
| Massachusetts Industrial Finance Agency, Education Revenue | ||||||||
| (Saint John’s High School of Worcester County, Inc. Issue) | 5.70 | 6/1/18 | 1,700,000 | 1,719,601 | ||||
| Massachusetts Industrial Finance Agency, Education | ||||||||
| Revenue (The Tabor Academy Issue) | 5.40 | 12/1/08 | 775,000 a | 797,901 | ||||
| Massachusetts Industrial Finance Agency, Education | ||||||||
| Revenue (The Tabor Academy Issue) | 5.40 | 12/1/08 | 785,000 a | 808,197 | ||||
| Massachusetts Industrial Finance Agency, | ||||||||
| Revenue (Concord Academy Issue) | 5.45 | 9/1/17 | 500,000 | 505,680 | ||||
| Massachusetts Industrial Finance Agency, | ||||||||
| Revenue (Concord Academy Issue) | 5.50 | 9/1/27 | 1,250,000 | 1,252,050 | ||||
54
| BNY Mellon Massachusetts Intermediate Municipal Bond Fund (continued) | ||||||||
| Long-Term Municipal | Coupon | Maturity | Principal | |||||
| Investments (continued) | Rate (%) | Date | Amount ($) | Value ($) | ||||
| Massachusetts (continued) | ||||||||
| Massachusetts Industrial Finance Agency, Revenue | ||||||||
| (Tufts University Issue) (Insured; MBIA, Inc.) | 5.50 | 2/15/11 | 500,000 | 536,635 | ||||
| Massachusetts Industrial Finance Agency, Revenue | ||||||||
| (Wentworth Institute of Technology Inc. Issue) | 5.55 | 10/1/08 | 500,000 a | 511,745 | ||||
| Massachusetts Municipal Wholesale Electric | ||||||||
| Company, Power Supply Project Revenue | ||||||||
| (Nuclear Project Number 4 Issue) (Insured; MBIA, Inc.) | 5.25 | 7/1/12 | 2,000,000 | 2,157,660 | ||||
| Massachusetts Municipal Wholesale Electric Company, | ||||||||
| Power Supply Project Revenue (Nuclear Project | ||||||||
| Number 4 Issue) (Insured; MBIA, Inc.) | 5.25 | 7/1/14 | 5,000,000 | 5,345,550 | ||||
| Massachusetts Municipal Wholesale Electric Company, | ||||||||
| Power Supply Project Revenue (Nuclear Project | ||||||||
| Number 5 Issue) (Insured; MBIA, Inc.) | 5.00 | 7/1/11 | 120,000 | 127,256 | ||||
| Massachusetts Municipal Wholesale Electric Company, Power Supply | ||||||||
| Project Revenue (Project Number 6 Issue) (Insured; MBIA, Inc.) | 5.00 | 7/1/10 | 1,635,000 | 1,699,599 | ||||
| Massachusetts Port Authority, Revenue | 6.00 | 1/1/10 | 2,500,000 a | 2,655,200 | ||||
| Massachusetts Port Authority, Revenue | 5.75 | 7/1/11 | 3,500,000 | 3,799,705 | ||||
| Massachusetts Port Authority, Revenue (Insured; FSA) | 5.50 | 7/1/14 | 1,265,000 | 1,308,326 | ||||
| Massachusetts Port Authority, Revenue (Insured; MBIA, Inc.) | 5.00 | 7/1/09 | 1,830,000 | 1,879,739 | ||||
| Massachusetts School Building Authority, | ||||||||
| Dedicated Sales Tax Revenue (Insured; AMBAC) | 5.00 | 8/15/16 | 2,720,000 | 3,015,256 | ||||
| Massachusetts School Building Authority, | ||||||||
| Dedicated Sales Tax Revenue (Insured; AMBAC) | 5.00 | 8/15/20 | 4,000,000 | 4,284,360 | ||||
| Massachusetts School Building Authority, | ||||||||
| Dedicated Sales Tax Revenue (Insured; AMBAC) | 5.00 | 8/15/22 | 3,500,000 | 3,696,525 | ||||
| Massachusetts School Building Authority, | ||||||||
| Dedicated Sales Tax Revenue (Insured; FSA) | 5.00 | 8/15/15 | 1,900,000 | 2,105,637 | ||||
| Massachusetts School Building Authority, | ||||||||
| Dedicated Sales Tax Revenue (Insured; FSA) | 5.00 | 8/15/18 | 5,000,000 | 5,378,450 | ||||
| Massachusetts School Building Authority, | ||||||||
| Dedicated Sales Tax Revenue (Insured; FSA) | 5.00 | 8/15/21 | 2,000,000 | 2,125,320 | ||||
| Massachusetts Turnpike Authority, Turnpike | ||||||||
| Revenue (Insured; MBIA, Inc.) | 5.00 | 1/1/20 | 5,000,000 | 5,454,350 | ||||
| Massachusetts Water Pollution Abatement Trust (Pool Program) | 5.50 | 8/1/11 | 4,000,000 | 4,341,480 | ||||
| Massachusetts Water Pollution Abatement Trust (Pool Program) | 5.00 | 8/1/21 | 2,625,000 | 2,806,860 | ||||
| Massachusetts Water Pollution Abatement | ||||||||
| Trust (Pooled Loan Program) | 5.25 | 8/1/11 | 335,000 a | 358,959 | ||||
| Massachusetts Water Pollution Abatement | ||||||||
| Trust (Pooled Loan Program) | 5.00 | 8/1/12 | 3,910,000 a | 4,205,792 | ||||
| Massachusetts Water Pollution Abatement | ||||||||
| Trust (Pooled Loan Program) | 5.63 | 8/1/13 | 25,000 | 26,734 | ||||
| Massachusetts Water Pollution Abatement | ||||||||
| Trust (Pooled Loan Program) | 5.25 | 2/1/14 | 1,105,000 | 1,182,129 | ||||
| Massachusetts Water Pollution Abatement | ||||||||
| Trust (Pooled Loan Program) | 5.25 | 8/1/14 | 1,330,000 a | 1,490,318 | ||||
The Funds 55
| STATEMENT OF INVESTMENTS (continued) |
| BNY Mellon Massachusetts Intermediate Municipal Bond Fund (continued) | ||||||||
| Long-Term Municipal | Coupon | Maturity | Principal | |||||
| Investments (continued) | Rate (%) | Date | Amount ($) | Value ($) | ||||
| Massachusetts (continued) | ||||||||
| Massachusetts Water Pollution Abatement | ||||||||
| Trust (Pooled Loan Program) | 5.50 | 8/1/14 | 30,000 | 31,215 | ||||
| Massachusetts Water Pollution Abatement | ||||||||
| Trust (Pooled Loan Program) | 5.25 | 8/1/17 | 170,000 | 187,840 | ||||
| Massachusetts Water Pollution Abatement | ||||||||
| Trust (Pooled Loan Program) | 5.00 | 8/1/18 | 75,000 | 80,366 | ||||
| Massachusetts Water Pollution Abatement | ||||||||
| Trust (Pooled Loan Program) | 5.00 | 8/1/32 | 2,000,000 | 2,016,920 | ||||
| Massachusetts Water Pollution Abatement Trust, Water | ||||||||
| Pollution Abatement Revenue (New Bedford Loan Program) | 5.25 | 2/1/12 | 500,000 | 543,415 | ||||
| Massachusetts Water Pollution Abatement Trust, | ||||||||
| Water Pollution Abatement Revenue | ||||||||
| (South Essex Sewer District Loan Program) | 6.38 | 2/1/15 | 195,000 | 195,702 | ||||
| Massachusetts Water Resources Authority, | ||||||||
| General Revenue (Insured; FSA) | 5.50 | 8/1/11 | 100,000 | 108,331 | ||||
| Massachusetts Water Resources Authority, | ||||||||
| General Revenue (Insured; FSA) | 5.25 | 8/1/18 | 500,000 | 563,550 | ||||
| Massachusetts Water Resources Authority, | ||||||||
| General Revenue (Insured; MBIA, Inc.) | 6.00 | 8/1/14 | 1,000,000 | 1,154,310 | ||||
| Massachusetts Water Resources Authority, | ||||||||
| General Revenue (Insured; MBIA, Inc.) | 5.25 | 8/1/19 | 1,500,000 | 1,642,200 | ||||
| Massachusetts Water Resources Authority, | ||||||||
| General Revenue (Insured; MBIA, Inc.) | 5.25 | 8/1/21 | 1,000,000 | 1,074,650 | ||||
| Massachusetts Water Resources Authority, | ||||||||
| General Revenue (Insured; MBIA, Inc.) | 5.25 | 8/1/24 | 2,500,000 | 2,649,650 | ||||
| Massachusetts Water Resources Authority, | ||||||||
| Subordinated General Revenue (Insured; MBIA, Inc.) | 5.50 | 8/1/11 | 1,000,000 | 1,088,200 | ||||
| Middleborough, GO (Insured; MBIA, Inc.) | 5.00 | 12/15/16 | 1,000,000 | 1,117,270 | ||||
| Middleborough, GO (Insured; MBIA, Inc.) | 5.00 | 12/15/18 | 1,275,000 | 1,393,537 | ||||
| Milton School, GO | 5.00 | 3/1/23 | 500,000 | 521,120 | ||||
| Milton School, GO | 5.00 | 3/1/24 | 500,000 | 519,390 | ||||
| Milton School, GO | 5.00 | 3/1/25 | 500,000 | 517,955 | ||||
| Northampton, GO (Insured; MBIA, Inc.) | 5.13 | 10/15/16 | 1,985,000 | 2,196,363 | ||||
| Northbridge, GO (Insured; AMBAC) | 5.25 | 2/15/17 | 1,000,000 | 1,076,120 | ||||
| Pembroke, GO (Insured; MBIA, Inc.) | 4.50 | 8/1/13 | 695,000 | 747,903 | ||||
| Pembroke, GO (Insured; MBIA, Inc.) | 5.00 | 8/1/20 | 960,000 | 1,028,640 | ||||
| Pittsfield, GO (Insured; MBIA, Inc.) | 5.00 | 4/15/12 | 1,000,000 | 1,068,120 | ||||
| Pittsfield, GO (Insured; MBIA, Inc.) | 5.50 | 4/15/14 | 500,000 | 544,880 | ||||
| Randolph, GO (Insured; AMBAC) | 5.00 | 9/1/17 | 1,045,000 | 1,122,664 | ||||
| Randolph, GO (Insured; AMBAC) | 5.00 | 9/1/24 | 490,000 | 501,329 | ||||
| Sandwich, GO (Insured; MBIA, Inc.) | 5.75 | 8/15/10 | 1,050,000 a | 1,134,084 | ||||
| Springfield, GO (Municipal Purpose Loan) (Insured; FGIC) | 5.50 | 8/1/11 | 1,500,000 a | 1,631,625 | ||||
| Springfield Water and Sewer Commission, | ||||||||
| General Revenue (Insured; AMBAC) | 5.00 | 7/15/22 | 1,175,000 | 1,209,616 | ||||
56
| BNY Mellon Massachusetts Intermediate Municipal Bond Fund (continued) | ||||||||
| Long-Term Municipal | Coupon | Maturity | Principal | |||||
| Investments (continued) | Rate (%) | Date | Amount ($) | Value ($) | ||||
| Massachusetts (continued) | ||||||||
| Springfield Water and Sewer Commission, | ||||||||
| General Revenue (Insured; AMBAC) | 5.00 | 7/15/23 | 1,235,000 | 1,266,455 | ||||
| University of Massachusetts Building Authority, | ||||||||
| Project Revenue (Insured; AMBAC) | 5.50 | 11/1/10 | 1,000,000 a | 1,070,780 | ||||
| Westfield, GO (Insured; FGIC) | 6.50 | 5/1/10 | 735,000 a | 796,402 | ||||
| Worcester, GO (Insured; FGIC) | 5.63 | 8/15/10 | 1,000,000 a | 1,077,690 | ||||
| Worcester, GO (Insured; FGIC) | 5.00 | 4/1/18 | 625,000 | 661,981 | ||||
| Worcester, GO (Insured; MBIA, Inc.) | 5.25 | 8/15/16 | 1,000,000 | 1,088,750 | ||||
| Worcester, GO (Insured; MBIA, Inc.) | 5.25 | 8/15/17 | 1,000,000 | 1,086,850 | ||||
| Worcester, GO (Municipal Purpose Loan) (Insured; MBIA, Inc.) | 6.25 | 7/1/10 | 755,000 | 807,110 | ||||
| U.S. Related—9.6% | ||||||||
| Guam Economic Development Authority, | ||||||||
| Tobacco Settlement Asset-Backed Bonds | 5.15 | 5/15/11 | 250,000 | 267,838 | ||||
| Guam Economic Development Authority, | ||||||||
| Tobacco Settlement Asset-Backed Bonds | 5.20 | 5/15/12 | 300,000 | 326,415 | ||||
| Guam Economic Development Authority, | ||||||||
| Tobacco Settlement Asset-Backed Bonds | 5.20 | 5/15/13 | 1,175,000 | 1,292,124 | ||||
| Puerto Rico Commonwealth, Public Improvement GO | 5.00 | 7/1/14 | 2,500,000 | 2,570,525 | ||||
| Puerto Rico Commonwealth, Public Improvement GO | 5.25 | 7/1/22 | 1,500,000 | 1,501,800 | ||||
| Puerto Rico Commonwealth, Public | ||||||||
| Improvement GO (Insured; FSA) | 5.50 | 7/1/15 | 1,350,000 | 1,482,746 | ||||
| Puerto Rico Commonwealth, Public | ||||||||
| Improvement GO (Insured; MBIA, Inc.) | 6.25 | 7/1/11 | 1,050,000 | 1,126,766 | ||||
| Puerto Rico Commonwealth, Public | ||||||||
| Improvement GO (Insured; MBIA, Inc.) | 5.50 | 7/1/14 | 500,000 | 526,835 | ||||
| Puerto Rico Commonwealth, Public | ||||||||
| Improvement GO (Insured; MBIA, Inc.) | 5.50 | 7/1/15 | 1,135,000 | 1,193,600 | ||||
| Puerto Rico Electric Power Authority, | ||||||||
| Power Revenue (Insured; MBIA, Inc.) | 5.00 | 7/1/17 | 1,000,000 | 1,040,620 | ||||
| Puerto Rico Government Development Bank, Senior Notes | 5.00 | 12/1/12 | 3,205,000 | 3,315,380 | ||||
| Puerto Rico Government Development Bank, Senior Notes | 5.00 | 12/1/13 | 3,000,000 | 3,097,500 | ||||
| Puerto Rico Government Development Bank, Senior Notes | 5.25 | 1/1/15 | 2,000,000 | 2,045,260 | ||||
| Puerto Rico Highways and Transportation | ||||||||
| Authority, Highway Revenue | 5.00 | 7/1/16 | 1,000,000 | 1,038,010 | ||||
| Puerto Rico Highways and Transportation | ||||||||
| Authority, Highway Revenue (Insured; FGIC) | 5.50 | 7/1/16 | 3,265,000 | 3,421,328 | ||||
| Puerto Rico Highways and Transportation | ||||||||
| Authority, Highway Revenue (Insured; MBIA, Inc.) | 6.25 | 7/1/09 | 540,000 | 560,385 | ||||
| Puerto Rico Highways and Transportation Authority, | ||||||||
| Highway Revenue (Insured; MBIA, Inc.) | 6.25 | 7/1/09 | 460,000 | 473,809 | ||||
| Puerto Rico Highways and Transportation Authority, | ||||||||
| Highway Revenue (Insured; MBIA, Inc.) | 6.00 | 7/1/11 | 4,000,000 | 4,237,120 | ||||
| Puerto Rico Highways and Transportation Authority, | ||||||||
| Transportation Revenue (Insured; FGIC) | 5.25 | 7/1/15 | 1,905,000 | 1,961,388 | ||||
The Funds 57
STATEMENT OF INVESTMENTS (continued)
| BNY Mellon Massachusetts Intermediate Municipal Bond Fund (continued) | ||||||||
| Long-Term Municipal | Coupon | Maturity | Principal | |||||
| Investments (continued) | Rate (%) | Date | Amount ($) | Value ($) | ||||
| U.S. Related (continued) | ||||||||
| Puerto Rico Highways and Transportation Authority, | ||||||||
| Transportation Revenue (Insured; FGIC) | 5.25 | 7/1/16 | 1,550,000 | 1,605,397 | ||||
| Puerto Rico Highways and Transportation Authority, | ||||||||
| Transportation Revenue (Insured; FGIC) | 5.25 | 7/1/18 | 1,300,000 | 1,314,001 | ||||
| Puerto Rico Infrastructure Financing Authority, Special Tax Revenue | 5.00 | 7/1/20 | 2,260,000 | 2,235,004 | ||||
| Total Long-Term Municipal Investments | ||||||||
| (cost $363,586,965) | 370,272,099 | |||||||
| Short-Term Municipal Investments—2.4% | ||||||||
| Massachusetts; | ||||||||
| Chelsea, LR (Massachusetts Information | ||||||||
| Technolgy Center Project) (Insured; FSA) | 3.24 | 10/5/08 | 4,750,000 c,d | 4,750,000 | ||||
| Massachusetts, Consolidated Loan | ||||||||
| (Liquidity Facility; Dexia Credit Locale) | 2.55 | 9/1/08 | 100,000 c | 100,000 | ||||
| Massachusetts, Consolidated Loan (LOC; Bank of America) | 2.55 | 9/1/08 | 300,000 c | 300,000 | ||||
| Massachusetts Development Finance Agency, | ||||||||
| Revenue (Boston University Issue) (LOC; Bank of America) | 2.55 | 9/1/08 | 100,000 c | 100,000 | ||||
| Massachusetts Health and Educational Facilities Authority, | ||||||||
| Revenue (Capital Asset Program Issue) (LOC; Bank of America) | 2.40 | 9/1/08 | 1,200,000 c | 1,200,000 | ||||
| Massachusetts Health and Educational Facilities | ||||||||
| Authority, Revenue (Museum of Fine Arts Issue) | ||||||||
| (Liquidity Facility; Bank of America) | 2.40 | 9/1/08 | 200,000 c | 200,000 | ||||
| Massachusetts Water Resources Authority, | ||||||||
| Multi-Modal Subordinated General Revenue, | ||||||||
| Refunding (LOC; Landesbank Baden-Wurttemberg) | 2.60 | 9/1/08 | 1,485,000 c | 1,485,000 | ||||
| Massachusetts Water Resources Authority, | ||||||||
| Multi-Modal Subordinated General Revenue, | ||||||||
| Refunding (LOC; Landesbank Hessen-Thuringen Girozentrale) | 2.55 | 9/1/08 | 875,000 c | 875,000 | ||||
| Total Short-Term Municipal Investments | ||||||||
| (cost $9,010,000) | 9,010,000 | |||||||
| Total Investments (cost $372,596,965) | 99.1% | 379,282,099 | ||||||
| Cash and Receivables (Net) | .9% | 3,424,497 | ||||||
| Net Assets | 100.0% | 382,706,596 | ||||||
| a These securities are prerefunded; the date shown represents the prerefunded date. Bonds which are prerefunded are collateralized by U.S. Government securities which are held in |
| escrow and are used to pay principal and interest on the municipal issue and to retire the bonds in full at the earliest refunding date. |
| b Variable rate security—interest rate subject to periodic change. |
| c Variable rate demand note—rate shown is the interest rate in effect at August 31, 2008. Maturity date represents the next demand date or the ultimate maturity date if earlier. |
| d Security restricted as to public resale. Investment in restricted securities with aggregated market value assets of $4,750,000 representing 1.2% of net assets (see below). |
| Acquisition | Purchase | Net | ||||||
| Date | Price ($)† | Assets (%) | Valuation ($)†† | |||||
| Chelsea, LR (Massachusetts Information | ||||||||
| Technology Center Project) | 1/10/08-2/1/08 | 100.00 | 1.2 | 100.00 |
| † | Average cost per unit. | |
| †† | The valuation of these securities has been determined in good faith under the direction of the Board of Trustees. |
58
| Summary of Abbreviations | ||||||
| ABAG | Association of Bay Area Governments | ACA | American Capital Access | |||
| AGC | ACE Guaranty Corporation | AGIC | Asset Guaranty Insurance Company | |||
| AMBAC | American Municipal Bond Assurance Corporation | ARRN | Adjustable Rate Receipt Notes | |||
| BAN | Bond Anticipation Notes | BIGI | Bond Investors Guaranty Insurance | |||
| BPA | Bond Purchase Agreement | CGIC | Capital Guaranty Insurance Company | |||
| CIC | Continental Insurance Company | CIFG | CDC Ixis Financial Guaranty | |||
| CMAC | Capital Market Assurance Corporation | COP | Certificate of Participation | |||
| CP | Commercial Paper | EDR | Economic Development Revenue | |||
| EIR | Environmental Improvement Revenue | FGIC | Financial Guaranty Insurance Company | |||
| FHA | Federal Housing Administration | FHLB | Federal Home Loan Bank | |||
| FHLMC | Federal Home Loan Mortgage Corporation | FNMA | Federal National Mortgage Association | |||
| FSA | Financial Security Assurance | GAN | Grant Anticipation Notes | |||
| GIC | Guaranteed Investment Contract | GNMA | Government National Mortgage Association | |||
| GO | General Obligation | HR | Hospital Revenue | |||
| IDB | Industrial Development Board | IDC | Industrial Development Corporation | |||
| IDR | Industrial Development Revenue | LOC | Letter of Credit | |||
| LOR | Limited Obligation Revenue | LR | Lease Revenue | |||
| MFHR | Multi-Family Housing Revenue | MFMR | Multi-Family Mortgage Revenue | |||
| PCR | Pollution Control Revenue | PILOT | Payment in Lieu of Taxes | |||
| RAC | Revenue Anticipation Certificates | RAN | Revenue Anticipation Notes | |||
| RAW | Revenue Anticipation Warrants | RRR | Resources Recovery Revenue | |||
| SAAN | State Aid Anticipation Notes | SBPA | Standby Bond Purchase Agreement | |||
| SFHR | Single Family Housing Revenue | SFMR | Single Family Mortgage Revenue | |||
| SONYMA | State of New York Mortgage Agency | SWDR | Solid Waste Disposal Revenue | |||
| TAN | Tax Anticipation Notes | TAW | Tax Anticipation Warrants | |||
| TRAN | Tax and Revenue Anticipation Notes | XLCA | XL Capital Assurance | |||
| Summary of Combined Ratings (Unaudited) | ||||||||||
| Fitch | or | Moody’s | or | Standard & Poor’s | Value (%)††† | |||||
| AAA | Aaa | AAA | 53.3 | |||||||
| AA | Aa | AA | 27.7 | |||||||
| A | A | A | 9.2 | |||||||
| BBB | Baa | BBB | 8.6 | |||||||
| BB | Ba | BB | .1 | |||||||
| F1 | MIG1/P1 | SP1/A1 | 1.1 | |||||||
| 100.0 | ||||||||||
| ††† Based on total investments. |
| See notes to financial statements. |
The Funds 59
| STATEMENT OF FINANCIAL FUTURES |
| August 31, 2008 |
| Market Value | Unrealized | |||||||
| BNY Mellon Massachusetts | Covered by | Appreciation | ||||||
| Intermediate Municipal Bond Fund | Contracts | Contracts ($) | Expiration | at 8/31/2008 ($) | ||||
| Financial Futures Short | ||||||||
| U.S. Treasury 20 Year Bond | 94 | (11,027,375) | December 2008 | 55,812 |
See notes to financial statements.
60
| STATEMENTS OF ASSETS AND LIABILITIES |
| August 31, 2008 |
| BNY Mellon | BNY Mellon | BNY Mellon | BNY Mellon | |||||
| National | National | Pennsylvania | Massachusetts | |||||
| Intermediate | Short-Term | Intermediate | Intermediate | |||||
| Municipal Bond Fund | Municipal Bond Fund | Municipal Bond Fund | Municipal Bond Fund | |||||
| Assets ($): | ||||||||
| Investments in securities— | ||||||||
| See Statement of Investments† | 1,069,403,548 | 167,418,959 | 568,008,272 | 379,282,099 | ||||
| Cash on Initial Margin—Note 5 | 420,800 | — | 228,800 | 150,400 | ||||
| Interest receivable | 11,414,655 | 1,879,421 | 6,887,258 | 3,999,971 | ||||
| Receivable for investment securites sold | 4,198,678 | 122,600 | 1,184,385 | — | ||||
| Receivable for futures variation margin—Note 5 | 154,909 | — | 84,229 | 55,367 | ||||
| Receivable for shares of Beneficial Interest subscribed | 822,046 | — | 126,700 | — | ||||
| Prepaid expenses and other receivables | 26,671 | 16,513 | 19,496 | 22,595 | ||||
| 1,086,441,307 | 169,437,493 | 576,539,140 | 383,510,432 | |||||
| Liabilities ($): | ||||||||
| Due to The Dreyfus Corporation and affiliates—Note 4(c) | 344,254 | 56,561 | 258,433 | 126,201 | ||||
| Due to Administrator—Note 4(a) | 115,868 | 18,225 | 62,477 | 41,522 | ||||
| Cash overdraft due to Custodian | 2,479,246 | 266,866 | 1,676,779 | 208,150 | ||||
| Payable for investment securities purchased | 15,168,760 | — | 6,007,775 | — | ||||
| Payable for shares of Beneficial Interest redeemed | 1,403,805 | 160,483 | 282,611 | 380,556 | ||||
| Accrued expenses and other liabilities | 64,690 | 29,897 | 42,310 | 47,407 | ||||
| 19,576,623 | 532,032 | 8,330,385 | 803,836 | |||||
| Net Assets ($) | 1,066,864,684 | 168,905,461 | 568,208,755 | 382,706,596 | ||||
| Composition of Net Assets ($): | ||||||||
| Paid—in capital | 1,054,348,530 | 168,969,849 | 559,972,894 | 376,508,713 | ||||
| Accumulated undistributed investment income—net | 227,830 | 29,473 | 121,264 | 77,271 | ||||
| Accumulated net realized gain (loss) on investments | 1,023,441 | (1,040,043) | 893,590 | (620,334) | ||||
| Accumulated net unrealized appreciation (depreciation) | ||||||||
| on investments (including $156,156, $84,907 and | ||||||||
| $55,812 net unrealized appreciation on financial | ||||||||
| futures for BNY Mellon National Intermediate Municipal | ||||||||
| Bond Fund, BNY Mellon Pennsylvania Intermediate | ||||||||
| Municipal Bond Fund and BNY Mellon Massachussetts | ||||||||
| Intermediate Municipal Bond Fund, respectively) | 11,264,883 | 946,182 | 7,221,007 | 6,740,946 | ||||
| Net Assets ($) | 1,066,864,684 | 168,905,461 | 568,208,755 | 382,706,596 | ||||
| Net Asset Value Per Share | ||||||||
| Class M Shares | ||||||||
| Net Assets ($) | 1,045,019,486 | 168,243,141 | 566,767,024 | 374,115,189 | ||||
| Shares Outstanding | 81,366,565 | 13,254,919 | 45,886,355 | 29,756,948 | ||||
| Net Asset Value Per Share ($) | 12.84 | 12.69 | 12.35 | 12.57 | ||||
| Investor Shares | ||||||||
| Net Assets ($) | 21,668,473 | 662,320 | 1,441,731 | 8,573,645 | ||||
| Shares Outstanding | 1,689,057 | 52,239 | 116,883 | 682,036 | ||||
| Net Asset Value Per Share ($) | 12.83 | 12.68 | 12.33 | 12.57 | ||||
| Dreyfus Premier Shares | ||||||||
| Net Assets ($) | 176,725 | — | — | 17,762 | ||||
| Shares Outstanding | 13,768 | — | — | 1,410 | ||||
| Net Asset Value Per Share ($) | 12.84 | — | — | 12.60 | ||||
| † Investments at cost ($) | 1,058,294,821 | 166,472,777 | 560,872,171 | 372,596,965 |
See notes to financial statements.
The Funds 61
| STATEMENT OF OPERATIONS |
| Year Ended August 31, 2008 |
| BNY Mellon | BNY Mellon | BNY Mellon | BNY Mellon | |||||
| National | National | Pennsylvania | Massachusetts | |||||
| Intermediate | Short-Term | Intermediate | Intermediate | |||||
| Municipal Bond Fund | Municipal Bond Fund | Municipal Bond Fund | Municipal Bond Fund | |||||
| Investment Income ($): | ||||||||
| Interest Income | 46,418,348 | 6,079,971 | 27,194,757 | 15,773,789 | ||||
| Expenses: | ||||||||
| Investment advisory fee—Note 4(a) | 3,594,243 | 563,818 | 3,001,076 | 1,303,554 | ||||
| Administration fee—Note 4(a) | 1,309,213 | 205,380 | 765,122 | 474,817 | ||||
| Custodian fees—Note 4(c) | 79,923 | 12,937 | 47,702 | 29,388 | ||||
| Shareholder servicing costs—Note 4(c) | 64,721 | 1,546 | 4,237 | 24,853 | ||||
| Registration fees | 40,541 | 24,840 | 25,459 | 36,874 | ||||
| Trustees’ fees and expenses—Note 4(d) | 37,955 | 6,507 | 22,099 | 14,216 | ||||
| Auditing fees | 28,787 | 26,406 | 18,783 | 30,809 | ||||
| Prospectus and shareholders’ reports | 17,868 | 4,313 | 4,746 | 6,884 | ||||
| Legal fees | 9,682 | 3,546 | 1,970 | 6,434 | ||||
| Distribution fees—Note 4(b) | 1,106 | — | — | 87 | ||||
| Miscellaneous | 81,584 | 28,298 | 56,756 | 57,129 | ||||
| Total Expenses | 5,265,623 | 877,591 | 3,947,950 | 1,985,045 | ||||
| Less—reduction in investment advisory fee | ||||||||
| due to undertaking—Note 4(a) | — | — | — | (8,306) | ||||
| Less—reduction in fees due to | ||||||||
| earnings credits—Note 2(b) | (6,352) | (370) | (2,872) | (2,736) | ||||
| Net Expenses | 5,259,271 | 877,221 | 3,945,078 | 1,974,003 | ||||
| Investment Income—Net | 41,159,077 | 5,202,750 | 23,249,679 | 13,799,786 | ||||
| Realized and Unrealized Gain (Loss) | ||||||||
| on Investments—Note 5 ($): | ||||||||
| Net realized gain (loss) on investments | 2,930,272 | 13,630 | 1,763,501 | 483,472 | ||||
| Net realized gain (loss) on financial futures | (783,649) | — | (581,765) | (322,390) | ||||
| Net Realized Gain (Loss) | 2,146,623 | 13,630 | 1,181,736 | 161,082 | ||||
| Net unrealized appreciation (depreciation) on | ||||||||
| investments (including $156,156, $84,907 and | ||||||||
| $55,812 appreciation on financial futures for | ||||||||
| BNY Mellon National Intermediate Municipal Bond Fund, | ||||||||
| BNY Mellon Pennsylvania Intermediate Municipal Bond | ||||||||
| Fund and BNY Mellon Massachussetts Intermediate | ||||||||
| Municipal Bond Fund , respectively) | (792,889) | 1,246,315 | (3,662,156) | 4,235,734 | ||||
| Net Realized and Unrealized | ||||||||
| Gain (Loss) on Investments | 1,353,734 | 1,259,945 | (2,480,420) | 4,396,816 | ||||
| Net Increase in Net Assets | ||||||||
| Resulting from Operations | 42,512,811 | 6,462,695 | 20,769,259 | 18,196,602 | ||||
See notes to financial statements.
62
STATEMENT OF CHANGES IN NET ASSETS
| BNY Mellon National Intermediate | BNY Mellon National Short-Term | |||||||
| Municipal Bond Fund | Municipal Bond Fund | |||||||
| Year Ended August 31, | Year Ended August 31, | |||||||
| 2008 | 2007 | 2008 | 2007 | |||||
| Operations ($): | ||||||||
| Investment income—net | 41,159,077 | 35,012,568 | 5,202,750 | 4,738,360 | ||||
| Net realized gain (loss) on investments | 2,146,623 | (1,505,123) | 13,630 | (167,807) | ||||
| Net unrealized appreciation (depreciation) on investments | (792,889) | (13,239,501) | 1,246,315 | 179,724 | ||||
| Net Increase (Decrease) in Net Assets | ||||||||
| Resulting from Operations | 42,512,811 | 20,267,944 | 6,462,695 | 4,750,277 | ||||
| Dividends to Shareholders from ($): | ||||||||
| Investment income—net: | ||||||||
| Class M Shares | (39,936,768) | (34,000,332) | (5,156,310) | (4,720,147) | ||||
| Investor Shares | (863,354) | (896,185) | (16,967) | (11,132) | ||||
| Dreyfus Premier Shares | (7,165) | (36,057) | — | — | ||||
| Net realized gain on investments: | ||||||||
| Class M Shares | — | — | — | (33,181) | ||||
| Investor Shares | — | — | — | (80) | ||||
| Dreyfus Premier Shares | — | — | — | — | ||||
| Total Dividends | (40,807,287) | (34,932,574) | (5,173,277) | (4,764,540) | ||||
| Beneficial Interest Transactions ($): | ||||||||
| Net proceeds from shares sold: | ||||||||
| Class M Shares | 254,992,966 | 273,486,950 | 75,743,234 | 41,447,785 | ||||
| Investor Shares | 4,509,467 | 4,696,649 | 1,034,575 | 870,799 | ||||
| Dreyfus Premier Shares | 393 | 10 | — | — | ||||
| Dividends reinvested: | ||||||||
| Class M Shares | 5,465,854 | 4,139,829 | 850,655 | 495,028 | ||||
| Investor Shares | 639,203 | 633,977 | 13,672 | 9,505 | ||||
| Dreyfus Premier Shares | 1,716 | 19,116 | — | — | ||||
| Cost of shares redeemed: | ||||||||
| Class M Shares | (161,964,429) | (126,058,742) | (55,029,033) | (57,084,093) | ||||
| Investor Shares | (8,829,522) | (6,786,661) | (1,026,906) | (522,240) | ||||
| Dreyfus Premier Shares | (154,357) | (2,160,797) | — | — | ||||
| Increase (Decrease) in Net Assets from | ||||||||
| Beneficial Interest Transactions | 94,661,291 | 147,970,331 | 21,586,197 | (14,783,216) | ||||
| Total Increase (Decrease) in Net Assets | 96,366,815 | 133,305,701 | 22,875,615 | (14,797,479) | ||||
| Net Assets ($): | ||||||||
| Beginning of Period | 970,497,869 | 837,192,168 | 146,029,846 | 160,827,325 | ||||
| End of Period | 1,066,864,684 | 970,497,869 | 168,905,461 | 146,029,846 | ||||
| Undistributed Investment Income—net | 227,830 | — | 29,473 | — | ||||
The Funds 63
STATEMENT OF CHANGES IN NET ASSETS (continued)
| BNY Mellon National Intermediate | BNY Mellon National Short-Term | |||||||
| Municipal Bond Fund | Municipal Bond Fund | |||||||
| Year Ended August 31, | Year Ended August 31, | |||||||
| 2008 | 2007 | 2008 | 2007 | |||||
| Capital Share Transactions: | ||||||||
| Class M Shares | ||||||||
| Shares sold | 19,756,849 | 21,096,258 | 5,979,916 | 3,291,249 | ||||
| Shares issued for dividends reinvested | 424,803 | 319,364 | 67,119 | 39,309 | ||||
| Shares redeemed | (12,554,905) | (9,731,631) | (4,337,585) | (4,533,591) | ||||
| Net Increase (Decrease) in Shares Outstanding | 7,626,747 | 11,683,991 | 1,709,450 | (1,203,033) | ||||
| Investor Sharesa | ||||||||
| Shares sold | 349,407 | 364,741 | 81,777 | 69,222 | ||||
| Shares issued for dividends reinvested | 49,712 | 48,914 | 1,080 | 755 | ||||
| Shares redeemed | (683,793) | (523,350) | (81,095) | (41,489) | ||||
| Net Increase (Decrease) in Shares Outstanding | (284,674) | (109,695) | 1,762 | 28,488 | ||||
| Dreyfus Premier Sharesa | ||||||||
| Shares sold | 31 | 1 | — | — | ||||
| Shares issued for dividends reinvested | 133 | 1,468 | — | — | ||||
| Shares redeemed | (11,899) | (166,217) | — | — | ||||
| Net Increase (Decrease) in Shares Outstanding | (11,735) | (164,748) | — | — | ||||
| a During the period ended August 31, 2008, 8,430 Dreyfus Premier shares of BNY Mellon National Intermediate Municipal Bond Fund representing $109,477 were |
| automatically converted to 8,430 Investor shares and during the year ended August 31, 2007 110,837 Dreyfus Premier shares of BNY Mellon National Intermediate Municipal |
| Bond Fund representing $1,442,058 were automatically converted to 110,895 Investor shares. |
| See notes to financial statements. |
64
| BNY Mellon Pennsylvania Intermediate Municipal Bond Fund | ||||
| Year Ended August 31, | ||||
| 2008 | 2007 | |||
| Operations ($): | ||||
| Investment income—net | 23,249,679 | 23,950,605 | ||
| Net realized gain (loss) on investments | 1,181,736 | 8,560 | ||
| Net unrealized appreciation (depreciation) on investments | (3,662,156) | (10,129,094) | ||
| Net Increase (Decrease) in Net Assets Resulting from Operations | 20,769,259 | 13,830,071 | ||
| Dividends to Shareholders from ($): | ||||
| Investment income—net: | ||||
| Class M Shares | (23,028,450) | (23,807,347) | ||
| Investor Shares | (54,887) | (107,626) | ||
| Net realized gain on investments: | ||||
| Class M Shares | (1,001,485) | (1,342,041) | ||
| Investor Shares | (2,591) | (10,403) | ||
| Total Dividends | (24,087,413) | (25,267,417) | ||
| Beneficial Interest Transactions ($): | ||||
| Net proceeds from shares sold: | ||||
| Class M Shares | 52,631,152 | 74,399,765 | ||
| Investor Shares | 1,175,559 | 4,155,623 | ||
| Dividends reinvested: | ||||
| Class M Shares | 1,342,499 | 1,424,071 | ||
| Investor Shares | 44,492 | 59,929 | ||
| Cost of shares redeemed: | ||||
| Class M Shares | (94,511,512) | (100,411,233) | ||
| Investor Shares | (1,067,910) | (6,473,353) | ||
| Increase (Decrease) in Net Assets from | ||||
| Beneficial Interest Transactions | (40,385,720) | (26,845,198) | ||
| Total Increase (Decrease) in Net Assets | (43,703,874) | (38,282,544) | ||
| Net Assets ($): | ||||
| Beginning of Period | 611,912,629 | 650,195,173 | ||
| End of Period | 568,208,755 | 611,912,629 | ||
| Undistributed Investment Income—net | 121,264 | — | ||
| Capital Share Transactions (shares): | ||||
| Class M Shares | ||||
| Shares sold | 4,220,140 | 5,925,170 | ||
| Shares issued for dividends reinvested | 107,668 | 112,629 | ||
| Shares redeemed | (7,581,449) | (7,973,075) | ||
| Net Increase (Decrease) in Shares Outstanding | (3,253,641) | (1,935,276) | ||
| Investor Shares | ||||
| Shares sold | 94,451 | 328,071 | ||
| Shares issued for dividends reinvested | 3,582 | 4,755 | ||
| Shares redeemed | (85,499) | (511,838) | ||
| Net Increase (Decrease) in Shares Outstanding | 12,534 | (179,012) | ||
See notes to financial statements.
The Funds 65
STATEMENT OF CHANGES IN NET ASSETS (continued)
| BNY Mellon Massachusetts Intermediate Municipal Bond Fund | ||||
| Year Ended August 31, | ||||
| 2008 | 2007 | |||
| Operations ($): | ||||
| Investment income—net | 13,799,786 | 12,342,093 | ||
| Net realized gain (loss) on investments | 161,082 | (914,678) | ||
| Net unrealized appreciation (depreciation) on investments | 4,235,734 | (3,725,019) | ||
| Net Increase (Decrease) in Net Assets Resulting from Operations | 18,196,602 | 7,702,396 | ||
| Dividends to Shareholders from ($): | ||||
| Investment income—net: | ||||
| Class M Shares | (13,409,833) | (12,004,690) | ||
| Investor Shares | (310,487) | (333,605) | ||
| Dreyfus Premier Shares | (517) | (2,219) | ||
| Net realized gain on investments: | ||||
| Class M Shares | — | — | ||
| Investor Shares | — | — | ||
| Dreyfus Premier Shares | — | — | ||
| Total Dividends | (13,720,837) | (12,340,514) | ||
| Beneficial Interest Transactions ($): | ||||
| Net proceeds from shares sold: | ||||
| Class M Shares | 93,834,677 | 102,031,565 | ||
| Investor Shares | 1,241,266 | 164,103 | ||
| Dreyfus Premier Shares | — | — | ||
| Dividends reinvested: | ||||
| Class M Shares | 3,053,932 | 2,591,243 | ||
| Investor Shares | 164,179 | 174,802 | ||
| Dreyfus Premier Shares | 517 | 1,830 | ||
| Cost of shares redeemed: | ||||
| Class M Shares | (69,729,479) | (56,791,685) | ||
| Investor Shares | (1,958,561) | (1,042,303) | ||
| Dreyfus Premier Shares | — | (149,632) | ||
| Increase (Decrease) in Net Assets from | ||||
| Beneficial Interest Transactions | 26,606,531 | 46,979,923 | ||
| Total Increase (Decrease) in Net Assets | 31,082,296 | 42,341,805 | ||
| Net Assets ($): | ||||
| Beginning of Period | 351,624,300 | 309,282,495 | ||
| End of Period | 382,706,596 | 351,624,300 | ||
| Undistributed Investment Income—net | 77,271 | — | ||
66
| BNY Mellon Massachusetts Intermediate Municipal Bond Fund | ||||
| Year Ended August 31, | ||||
| 2008 | 2007 | |||
| Capital Share Transactions: | ||||
| Class M Shares | ||||
| Shares sold | 7,460,532 | 8,130,189 | ||
| Shares issued for dividends reinvested | 243,390 | 206,519 | ||
| Shares redeemed | (5,536,521) | (4,526,581) | ||
| Net Increase (Decrease) in Shares Outstanding | 2,167,401 | 3,810,127 | ||
| Investor Sharesa | ||||
| Shares sold | 98,103 | 13,027 | ||
| Shares issued for dividends reinvested | 13,088 | 13,920 | ||
| Shares redeemed | (155,964) | (83,241) | ||
| Net Increase (Decrease) in Shares Outstanding | (44,773) | (56,294) | ||
| Dreyfus Premier Sharesa | ||||
| Shares sold | — | — | ||
| Shares issued for dividends reinvested | 42 | 145 | ||
| Shares redeemed | — | (11,860) | ||
| Net Increase (Decrease) in Shares Outstanding | 42 | (11,715) | ||
| a During the period ended August 31, 2007, 9,671 Dreyfus Premier shares of BNY Mellon Massachusetts Intermediate Municipal Bond Fund representing $122,161 were |
| automatically converted to 9,692 Investor shares. |
| See notes to financial statements. |
The Funds 67
FINANCIAL HIGHLIGHTS
The following tables describe the performance for each share class of each BNY Mellon municipal bond fund for the fiscal periods indicated. All information (except portfolio turnover rate) reflects financial results for a single fund share. Total return shows how much your investment in each fund would have increased (or decreased) during the period, assuming you had reinvested all dividends and distributions.These figures have been derived from each fund’s financial statements.
| Class M Shares | ||||||||||
| Year Ended August 31, | ||||||||||
| BNY Mellon National Intermediate Municipal Bond Fund | 2008 | 2007 | 2006 | 2005 | 2004 | |||||
| Per Share Data ($): | ||||||||||
| Net asset value, beginning of period | 12.81 | 13.01 | 13.25 | 13.34 | 13.09 | |||||
| Investment Operations: | ||||||||||
| Investment income—neta | .52 | .50 | .50 | .50 | .51 | |||||
| Net realized and unrealized | ||||||||||
| gain (loss) on investments | .02 | (.20) | (.16) | (.03) | .29 | |||||
| Total from Investment Operations | .54 | .30 | .34 | .47 | .80 | |||||
| Distributions: | ||||||||||
| Dividends from investment income—net | (.51) | (.50) | (.50) | (.50) | (.51) | |||||
| Dividends from net realized gain on investments | — | — | (.08) | (.06) | (.04) | |||||
| Total Distributions | (.51) | (.50) | (.58) | (.56) | (.55) | |||||
| Net asset value, end of period | 12.84 | 12.81 | 13.01 | 13.25 | 13.34 | |||||
| Total Return (%) | 4.32 | 2.36 | 2.64 | 3.62 | 6.22 | |||||
| Ratios/Supplemental Data (%): | ||||||||||
| Ratio of total expenses to average net assets | .51 | .51 | .51 | .52 | .52 | |||||
| Ratio of net expenses to average net assets | .51b | .51b | .51b | .52 | .52b | |||||
| Ratio of net investment income | ||||||||||
| to average net assets | 4.01 | 3.90 | 3.87 | 3.80 | 3.84 | |||||
| Portfolio Turnover Rate | 49.50 | 27.18 | 28.19 | 42.72 | 53.26 | |||||
| Net Assets, end of period ($ x 1,000) | 1,045,019 | 944,909 | 807,634 | 732,711 | 646,793 | |||||
| a | Based on average shares outstanding at each month end. | |
| b | Expense waivers and/or reimbursements amounted to less than .01%. | |
| See notes to financial statements. | ||
68
| Investor Shares | ||||||||||
| Year Ended August 31, | ||||||||||
| BNY Mellon National Intermediate Municipal Bond Fund | 2008 | 2007 | 2006 | 2005 | 2004 | |||||
| Per Share Data ($): | ||||||||||
| Net asset value, beginning of period | 12.80 | 13.00 | 13.23 | 13.33 | 13.08 | |||||
| Investment Operations: | ||||||||||
| Investment income—neta | .48 | .47 | .47 | .47 | .48 | |||||
| Net realized and unrealized | ||||||||||
| gain (loss) on investments | .03 | (.20) | (.15) | (.04) | .29 | |||||
| Total from Investment Operations | .51 | .27 | .32 | .43 | .77 | |||||
| Distributions: | ||||||||||
| Dividends from investment income—net | (.48) | (.47) | (.47) | (.47) | (.48) | |||||
| Dividends from net realized gain on investments | — | — | (.08) | (.06) | (.04) | |||||
| Total Distributions | (.48) | (.47) | (.55) | (.53) | (.52) | |||||
| Net asset value, end of period | 12.83 | 12.80 | 13.00 | 13.23 | 13.33 | |||||
| Total Return (%) | 4.06 | 2.11 | 2.47 | 3.28 | 6.04 | |||||
| Ratios/Supplemental Data (%): | ||||||||||
| Ratio of total expenses to average net assets | .76 | .76 | .76 | .77 | .77 | |||||
| Ratio of net expenses to average net assets | .76b | .76b | .76b | .77 | .77b | |||||
| Ratio of net investment income | ||||||||||
| to average net assets | 3.77 | 3.65 | 3.62 | 3.56 | 3.60 | |||||
| Portfolio Turnover Rate | 49.50 | 27.18 | 28.19 | 42.72 | 53.26 | |||||
| Net Assets, end of period ($ x 1,000) | 21,668 | 25,262 | 27,084 | 27,409 | 30,164 | |||||
| a | Based on average shares outstanding at each month end. | |
| b | Expense waivers and/or reimbursements amounted to less than .01%. | |
| See notes to financial statements. | ||
The Funds 69
FINANCIAL HIGHLIGHTS (continued)
| Dreyfus Premier Shares | ||||||||||
| Year Ended August 31, | ||||||||||
| BNY Mellon National Intermediate Municipal Bond Fund | 2008 | 2007 | 2006 | 2005 | 2004 | |||||
| Per Share Data ($): | ||||||||||
| Net asset value, beginning of period | 12.81 | 13.00 | 13.24 | 13.33 | 13.08 | |||||
| Investment Operations: | ||||||||||
| Investment income—neta | .41 | .39 | .40 | .40 | .41 | |||||
| Net realized and unrealized | ||||||||||
| gain (loss) on investments | .04 | (.17) | (.16) | (.03) | .29 | |||||
| Total from Investment Operations | .45 | .22 | .24 | .37 | .70 | |||||
| Distributions: | ||||||||||
| Dividends from investment income—net | (.42) | (.41) | (.40) | (.40) | (.41) | |||||
| Dividends from net realized gain on investments | — | — | (.08) | (.06) | (.04) | |||||
| Total Distributions | (.42) | (.41) | (.48) | (.46) | (.45) | |||||
| Net asset value, end of period | 12.84 | 12.81 | 13.00 | 13.24 | 13.33 | |||||
| Total Return (%) | 3.46 | 1.68 | 1.88 | 2.85 | 5.43 | |||||
| Ratios/Supplemental Data (%): | ||||||||||
| Ratio of total expenses to average net assets | 1.26 | 1.26 | 1.26 | 1.27 | 1.27 | |||||
| Ratio of net expenses to average net assets | 1.26b | 1.26b | 1.26b | 1.27 | 1.27b | |||||
| Ratio of net investment income | ||||||||||
| to average net assets | 3.27 | 3.13 | 3.12 | 3.06 | 3.09 | |||||
| Portfolio Turnover Rate | 49.50 | 27.18 | 28.19 | 42.72 | 53.26 | |||||
| Net Assets, end of period ($ x 1,000) | 177 | 327 | 2,474 | 4,656 | 5,945 |
| a | Based on average shares outstanding at each month end. | |
| b | Expense waivers and/or reimbursements amounted to less than .01%. | |
| See notes to financial statements. | ||
70
| Class M Shares | ||||||||||
| Year Ended August 31, | ||||||||||
| BNY Mellon National Short-Term Municipal Bond Fund | 2008 | 2007 | 2006 | 2005 | 2004 | |||||
| Per Share Data ($): | ||||||||||
| Net asset value, beginning of period | 12.59 | 12.59 | 12.63 | 12.81 | 12.86 | |||||
| Investment Operations: | ||||||||||
| Investment income—neta | .41 | .40 | .33 | .29 | .29 | |||||
| Net realized and unrealized | ||||||||||
| gain (loss) on investments | .10 | — | (.04) | (.18) | (.05) | |||||
| Total from Investment Operations | .51 | .40 | .29 | .11 | .24 | |||||
| Distributions: | ||||||||||
| Dividends from investment income—net | (.41) | (.40) | (.33) | (.29) | (.29) | |||||
| Net asset value, end of period | 12.69 | 12.59 | 12.59 | 12.63 | 12.81 | |||||
| Total Return (%) | 4.09 | 3.21 | 2.36 | .91 | 2.00 | |||||
| Ratios/Supplemental Data (%): | ||||||||||
| Ratio of total expenses to average net assets | .54 | .55 | .53 | .54 | .53 | |||||
| Ratio of net expenses to average net assets | .54b | .54 | .53b | .53 | .53 | |||||
| Ratio of net investment income | ||||||||||
| to average net assets | 3.23 | 3.14 | 2.65 | 2.31 | 2.28 | |||||
| Portfolio Turnover Rate | 22.93 | 33.74 | 49.94 | 40.92 | 28.12 | |||||
| Net Assets, end of period ($ x 1,000) | 168,243 | 145,395 | 160,551 | 207,063 | 221,600 | |||||
| a | Based on average shares outstanding at each month end. | |
| b | Expense waivers and/or reimbursements amounted to less than .01%. | |
| See notes to financial statements. | ||
The Funds 71
FINANCIAL HIGHLIGHTS (continued)
| Investor Shares | ||||||||||
| Year Ended August 31, | ||||||||||
| BNY Mellon National Short-Term Municipal Bond Fund | 2008 | 2007 | 2006 | 2005 | 2004 | |||||
| Per Share Data ($): | ||||||||||
| Net asset value, beginning of period | 12.58 | 12.58 | 12.62 | 12.79 | 12.84 | |||||
| Investment Operations: | ||||||||||
| Investment income—neta | .38 | .37 | .31 | .27 | .29 | |||||
| Net realized and unrealized | ||||||||||
| gain (loss) on investments | .10 | (.01) | (.05) | (.18) | (.07) | |||||
| Total from Investment Operations | .48 | .36 | .26 | .09 | .22 | |||||
| Distributions: | ||||||||||
| Dividends from investment income—net | (.38) | (.36) | (.30) | (.26) | (.27) | |||||
| Net asset value, end of period | 12.68 | 12.58 | 12.58 | 12.62 | 12.79 | |||||
| Total Return (%) | 3.83 | 2.95 | 2.10 | .73 | 1.72 | |||||
| Ratios/Supplemental Data (%): | ||||||||||
| Ratio of total expenses to average net assets | .80 | .80 | .79 | .79 | .79 | |||||
| Ratio of net expenses to average net assets | .80b | .80b | .79b | .78 | .79 | |||||
| Ratio of net investment income | ||||||||||
| to average net assets | 2.99 | 2.94 | 2.47 | 2.06 | 2.08 | |||||
| Portfolio Turnover Rate | 22.93 | 33.74 | 49.94 | 40.92 | 28.12 | |||||
| Net Assets, end of period ($ x 1,000) | 662 | 635 | 277 | 150 | 94 |
| a | Based on average shares outstanding at each month end. | |
| b | Expense waivers and/or reimbursements amounted to less than .01%. | |
| See notes to financial statements. | ||
72
| Class M Shares | ||||||||||
| Year Ended August 31, | ||||||||||
| BNY Mellon Pennsylvania Intermediate Municipal Bond Fund | 2008 | 2007 | 2006 | 2005 | 2004 | |||||
| Per Share Data ($): | ||||||||||
| Net asset value, beginning of period | 12.43 | 12.66 | 12.92 | 13.13 | 12.95 | |||||
| Investment Operations: | ||||||||||
| Investment income—neta | .48 | .48 | .48 | .49 | .50 | |||||
| Net realized and unrealized | ||||||||||
| gain (loss) on investments | (.06) | (.20) | (.18) | (.13) | .21 | |||||
| Total from Investment Operations | .42 | .28 | .30 | .36 | .71 | |||||
| Distributions: | ||||||||||
| Dividends from investment income—net | (.48) | (.48) | (.48) | (.49) | (.50) | |||||
| Dividends from net realized gain on investments | (.02) | (.03) | (.08) | (.08) | (.03) | |||||
| Total Distributions | (.50) | (.51) | (.56) | (.57) | (.53) | |||||
| Net asset value, end of period | 12.35 | 12.43 | 12.66 | 12.92 | 13.13 | |||||
| Total Return (%) | 3.43 | 2.23 | 2.41 | 2.84 | 5.60 | |||||
| Ratios/Supplemental Data (%): | ||||||||||
| Ratio of total expenses to average net assets | .66 | .66 | .66 | .66 | .66 | |||||
| Ratio of net expenses to average net assets | .66b | .66b | .66b | .66 | .66 | |||||
| Ratio of net investment income | ||||||||||
| to average net assets | 3.87 | 3.83 | 3.81 | 3.78 | 3.82 | |||||
| Portfolio Turnover Rate | 10.14 | 20.18 | 13.80 | 23.88 | 18.87 | |||||
| Net Assets, end of period ($ x 1,000) | 566,767 | 610,618 | 646,610 | 656,901 | 681,295 | |||||
| a | Based on average shares outstanding at each month end. | |
| b | Expense waivers and/or reimbursements amounted to less than .01%. | |
| See notes to financial statements. | ||
The Funds 73
FINANCIAL HIGHLIGHTS (continued)
| Investor Shares | ||||||||||
| Year Ended August 31, | ||||||||||
| BNY Mellon Pennsylvania Intermediate Municipal Bond Fund | 2008 | 2007 | 2006 | 2005 | 2004 | |||||
| Per Share Data ($): | ||||||||||
| Net asset value, beginning of period | 12.41 | 12.65 | 12.91 | 13.13 | 12.95 | |||||
| Investment Operations: | ||||||||||
| Investment income—neta | .46 | .45 | .46 | .45 | .47 | |||||
| Net realized and unrealized | ||||||||||
| gain (loss) on investments | (.07) | (.21) | (.19) | (.13) | .21 | |||||
| Total from Investment Operations | .39 | .24 | .27 | .32 | .68 | |||||
| Distributions: | ||||||||||
| Dividends from investment income—net | (.45) | (.45) | (.45) | (.46) | (.47) | |||||
| Dividends from net realized gain on investments | (.02) | (.03) | (.08) | (.08) | (.03) | |||||
| Total Distributions | (.47) | (.48) | (.53) | (.54) | (.50) | |||||
| Net asset value, end of period | 12.33 | 12.41 | 12.65 | 12.91 | 13.13 | |||||
| Total Return (%) | 3.17 | 1.89 | 2.15 | 2.50 | 5.41 | |||||
| Ratios/Supplemental Data (%): | ||||||||||
| Ratio of total expenses to average net assets | .91 | .91 | .91 | .91 | .92 | |||||
| Ratio of net expenses to average net assets | .91b | .91b | .91b | .91 | .92 | |||||
| Ratio of net investment income | ||||||||||
| to average net assets | 3.63 | 3.59 | 3.57 | 3.50 | 3.56 | |||||
| Portfolio Turnover Rate | 10.14 | 20.18 | 13.80 | 23.88 | 18.87 | |||||
| Net Assets, end of period ($ x 1,000) | 1,442 | 1,295 | 3,586 | 4,561 | 2,741 |
| a | Based on average shares outstanding at each month end. | |
| b | Expense waivers and/or reimbursements amounted to less than .01%. | |
| See notes to financial statements. | ||
74
| Class M Shares | ||||||||||
| Year Ended August 31, | ||||||||||
| BNY Mellon Massachusetts Intermediate Municipal Bond Fund | 2008 | 2007 | 2006 | 2005 | 2004 | |||||
| Per Share Data ($): | ||||||||||
| Net asset value, beginning of period | 12.42 | 12.58 | 12.75 | 12.81 | 12.59 | |||||
| Investment Operations: | ||||||||||
| Investment income—neta | .47 | .47 | .47 | .47 | .48 | |||||
| Net realized and unrealized | ||||||||||
| gain (loss) on investments | .14 | (.16) | (.14) | (.06) | .22 | |||||
| Total from Investment Operations | .61 | .31 | .33 | .41 | .70 | |||||
| Distributions: | ||||||||||
| Dividends from investment income—net | (.46) | (.47) | (.47) | (.47) | (.48) | |||||
| Dividends from net realized gain on investments | — | — | (.03) | — | — | |||||
| Total Distributions | (.46) | (.47) | (.50) | (.47) | (.48) | |||||
| Net asset value, end of period | 12.57 | 12.42 | 12.58 | 12.75 | 12.81 | |||||
| Total Return (%) | 5.02 | 2.47 | 2.65 | 3.25 | 5.72 | |||||
| Ratios/Supplemental Data (%): | ||||||||||
| Ratio of total expenses to average net assets | .52 | .53 | .54 | .54 | .55 | |||||
| Ratio of net expenses to average net assets | .52b | .50 | .50 | .50 | .50 | |||||
| Ratio of net investment income | ||||||||||
| to average net assets | 3.71 | 3.72 | 3.73 | 3.67 | 3.74 | |||||
| Portfolio Turnover Rate | 8.75 | 18.85 | 20.57 | 32.16 | 27.26 | |||||
| Net Assets, end of period ($ x 1,000) | 374,115 | 342,583 | 299,263 | 228,239 | 197,140 | |||||
The Funds 75
| a | Based on average shares outstanding at each month end. | |
| b | Expense waivers and/or reimbursements amounted to less than .01%. | |
| See notes to financial statements. | ||
FINANCIAL HIGHLIGHTS (continued)
| Investor Shares | ||||||||||
| Year Ended August 31, | ||||||||||
| BNY Mellon Massachusetts Intermediate Municipal Bond Fund | 2008 | 2007 | 2006 | 2005 | 2004 | |||||
| Per Share Data ($): | ||||||||||
| Net asset value, beginning of period | 12.42 | 12.58 | 12.75 | 12.80 | 12.59 | |||||
| Investment Operations: | ||||||||||
| Investment income—neta | .44 | .44 | .44 | .44 | .45 | |||||
| Net realized and unrealized | ||||||||||
| gain (loss) on investments | .14 | (.16) | (.14) | (.05) | .21 | |||||
| Total from Investment Operations | .58 | .28 | .30 | .39 | .66 | |||||
| Distributions: | ||||||||||
| Dividends from investment income—net | (.43) | (.44) | (.44) | (.44) | (.45) | |||||
| Dividends from net realized gain on investments | — | — | (.03) | — | — | |||||
| Total Distributions | (.43) | (.44) | (.47) | (.44) | (.45) | |||||
| Net asset value, end of period | 12.57 | 12.42 | 12.58 | 12.75 | 12.80 | |||||
| Total Return (%) | 4.76 | 2.21 | 2.40 | 3.07 | 5.38 | |||||
| Ratios/Supplemental Data (%): | ||||||||||
| Ratio of total expenses to average net assets | .77 | .78 | .79 | .79 | .80 | |||||
| Ratio of net expenses to average net assets | .77b | .75 | .75 | .75 | .75 | |||||
| Ratio of net investment income | ||||||||||
| to average net assets | 3.47 | 3.48 | 3.49 | 3.43 | 3.50 | |||||
| Portfolio Turnover Rate | 8.75 | 18.85 | 20.57 | 32.16 | 27.26 | |||||
| Net Assets, end of period ($ x 1,000) | 8,574 | 9,024 | 9,854 | 10,371 | 11,698 | |||||
| a | Based on average shares outstanding at each month end. | |
| b | Expense waivers and/or reimbursements amounted to less than .01%. | |
| See notes to financial statements. | ||
76
| Dreyfus Premier Shares | ||||||||||
| Year Ended August 31, | ||||||||||
| BNY Mellon Massachusetts Intermediate Municipal Bond Fund | 2008 | 2007 | 2006 | 2005 | 2004 | |||||
| Per Share Data ($): | ||||||||||
| Net asset value, beginning of period | 12.45 | 12.61 | 12.78 | 12.83 | 12.61 | |||||
| Investment Operations: | ||||||||||
| Investment income—neta | .38 | .35 | .37 | .38 | .38 | |||||
| Net realized and unrealized | ||||||||||
| gain (loss) on investments | .14 | (.14) | (.14) | (.05) | .22 | |||||
| Total from Investment Operations | .52 | .21 | .23 | .33 | .60 | |||||
| Distributions: | ||||||||||
| Dividends from investment income—net | (.37) | (.37) | (.37) | (.38) | (.38) | |||||
| Dividends from net realized gain on investments | — | — | (.03) | — | — | |||||
| Total Distributions | (.37) | (.37) | (.40) | (.38) | (.38) | |||||
| Net asset value, end of period | 12.60 | 12.45 | 12.61 | 12.78 | 12.83 | |||||
| Total Return (%) | 4.25 | 1.71 | 1.89 | 2.59 | 4.85 | |||||
| Ratios/Supplemental Data (%): | ||||||||||
| Ratio of total expenses to average net assets | 1.27 | 1.28 | 1.29 | 1.29 | 1.30 | |||||
| Ratio of net expenses to average net assets | 1.27b | 1.25 | 1.25 | 1.25 | 1.25 | |||||
| Ratio of net investment income | ||||||||||
| to average net assets | 2.97 | 2.96 | 2.99 | 2.98 | 3.01 | |||||
| Portfolio Turnover Rate | 8.75 | 18.85 | 20.57 | 32.16 | 27.26 | |||||
| Net Assets, end of period ($ x 1,000) | 18 | 17 | 165 | 202 | 655 |
| a | Based on average shares outstanding at each month end. | |
| b | Expense waivers and/or reimbursements amounted to less than .01%. | |
| See notes to financial statements. | ||
The Funds 77
NOTES TO FINANCIAL STATEMENTS
NOTE 1—General:
BNY Mellon Funds Trust (the “Trust”) was organized as a Massachusetts business trust which is registered under the Investment Company Act of 1940, as amended (the “Act”), as an open-end management investment company and operates as a series company currently comprised of twenty series, effective as of the close of business on September 12, 2008, including the following non-diversified municipal bond funds: BNY Mellon National Intermediate Municipal Bond Fund, BNY Mellon National Short-Term Municipal Bond Fund, BNY Mellon Pennsylvania Intermediate Municipal Bond Fund and BNY Mellon Massachusetts Intermediate Municipal Bond Fund (each, a “fund” and collectively, the “funds”). Effective March 31,2008,theTrust changed its name from “Mellon Funds Trust” to “BNY Mellon Funds Trust” and each fund added “BNY” to the beginning of its name. BNY Mellon National Intermediate Municipal Bond Fund and BNY Mellon National Short-Term Municipal Bond Fund seek to maximize current income exempt from federal income tax to the extent consistent with the preservation of capital. BNY Mellon Pennsylvania Intermediate Municipal Bond Fund seeks as high a level of income exempt from federal and Pennsylvania state income taxes as is consistent with the preservation of capital. BNY Mellon Massachusetts Intermediate Municipal Bond Fund seeks as high a level of income exempt from federal and Massachusetts state income taxes as is consistent with the preservation of capital.
BNY Mellon Fund Advisers, a division of The Dreyfus Corporation (the “Manager” or “Dreyfus”), a wholly-owned subsidiary of The Bank of New York Mellon Corporation (“BNY Mellon”), serves as each fund’s investment adviser (“Investment Adviser”). The Bank of New York Mellon, a subsidiary of BNY Mellon and an affiliate of Dreyfus, serves as administrator for the funds pursuant to an Administration Agreement with the Trust (the “Administration Agreement”). The Bank of New York Mellon has entered into a Sub-Administration Agreement with Dreyfus pursuant to which The Bank of New York Mellon pays Dreyfus for performing certain
administrative services. MBSC Securities Corporation (the “Distributor”), a wholly-owned subsidiary of Dreyfus, is the distributor of each fund’s shares, which are sold without a sales charge.
Effective July 1, 2008, BNY Mellon has reorganized and consolidated a number of its banking and trust company subsidiaries.As a result of the reorganization, any services previously provided to the portfolio by Mellon Bank, N.A. or Mellon Trust of New England, N.A. are now provided by The Bank of NewYork, which has changed its name to The Bank of New York Mellon.
The Trust is authorized to issue an unlimited number of shares of beneficial interest, par value $.001 per share, in each of the Class M and Investor class shares of each fund and in the Dreyfus Premier class shares of BNY Mellon National Intermediate Municipal Bond Fund and BNY Mellon Massachusetts Intermediate Municipal Bond Fund. Dreyfus Premier shares of BNY Mellon National Intermediate Municipal Bond Fund and BNY Mellon Massachusetts Intermediate Municipal Bond Fund are subject to a contingent deferred sales charge (“CDSC”) imposed on redemptions of Dreyfus Premier shares made within six years of purchase and automatically convert to Investor class shares after six years. Each class of shares has similar rights and privileges, except with respect to the expenses borne by and the shareholder services offered to each class, the shareholder services plan applicable to the Investor shares and Dreyfus Premier shares and the Rule 12b-1 plan applicable to the Dreyfus Premier shares and certain voting rights. Income, expenses (other than expenses attributable to a specific class), and realized and unrealized gains or losses on investments are allocated to each class of shares based on its relative net assets.
TheTrust accounts separately for the assets, liabilities and operations of each series. Expenses directly attributable to each series are charged to that series’ operations; expenses that are applicable to all series are allocated among them on a pro rata basis.
BNY Mellon National Intermediate Municipal Bond Fund and BNY Mellon Massachusetts Intermediate
78
Municipal Bond Fund no longer offer Dreyfus Premier shares, except in connection with dividend reinvestment and permitted exchanges of Dreyfus Premier shares.
The funds’ financial statements are prepared in accordance with U.S. generally accepted accounting principles, which may require the use of management estimates and assump-tions.Actual results could differ from those estimates.
NOTE 2—Significant Accounting Policies:
(a) Portfolio valuation: Investments in municipal securities (excluding options and financial futures on municipal, U.S.Treasury securities and swaps) are valued each business day by an independent pricing service (the“Service”) approved by the Board of Trustees. Investments for which quoted bid prices are readily available and are representative of the bid side of the market in the judgment of the Service are valued at the mean between the quoted bid prices (as obtained by the Service from dealers in such securities) and asked prices (as calculated by the Service based upon its evaluation of the market for such securities). Other investments are valued by the Service, based on methods which include consideration of: yields or prices of municipal securities of comparable quality, coupon, maturity and type; indications as to values from dealers; and general market conditions. Options and financial futures on municipal and U.S.Treasury securities are valued at the last sales price on the securities exchange on which such securities are primarily traded or at the last sales price on the national securities market on each business day. Swap transactions are valued based on future cash flows and other factors, such as interest rates and underlying securities.
Financial Accounting Standards Board (“FASB”) released Statement of Financial Accounting Standards No. 157 “FairValue Measurements” (“FAS 157”). FAS 157 establishes an authoritative definition of fair value, sets out a framework for measuring fair value, and requires additional disclosures about fair-value measurements. The application of FAS 157 is required for fiscal years beginning after November 15, 2007 and interim periods within those fiscal years. Management does not believe
that the application of this standard will have a material impact on the financial statements of the fund.
(b) Securities transactions and investment income:
Securities transactions are recorded on a trade date basis. Realized gain and loss from securities transactions are recorded on the identified cost basis. Interest income, adjusted for accretion of discount and amortization of premium on investments, is earned from settlement date and recognized on the accrual basis. Securities purchased or sold on a when-issued or delayed-delivery basis may be settled a month or more after the trade date.
The funds have arrangements with the custodian and cash management banks whereby the funds may receive earnings credits when positive cash balances are maintained, which are used to offset custody and cash management fees. For financial reporting purposes, the funds include net earnings credits as expense offsets in the Statement of Operations.
(c) Concentration of risk: BNY Mellon Pennsylvania Intermediate Municipal Bond Fund and BNY Mellon Massachusetts Intermediate Municipal Bond Fund follow an investment policy of investing primarily in municipal obligations of one state. Economic changes affecting the state and certain of its public bodies and municipalities may affect the ability of issuers within the state to pay interest on, or repay principal of, municipal obligations held by the fund.
(d) Dividends to shareholders: The funds declare dividends daily from investment income-net; such dividends are paid monthly. With respect to each series, dividends from net realized capital gain, if any, are normally declared and paid annually, but the funds may make distributions on a more frequent basis to comply with the distribution requirements of the Internal Revenue Code of 1986, as amended (the “Code”). To the extent that net realized capital gain can be offset by capital loss carryovers of that fund, it is the policy of the fund not to distribute such gain. Income and capital gain distributions are determined in accordance with income tax regulations, which may differ from U.S. generally accepted accounting principles.
The Funds 79
NOTES TO FINANCIAL STATEMENTS (continued)
(e) Federal income taxes: It is the policy of each fund to continue to qualify as a regulated investment company, which can distribute tax exempt dividends, by complying with the applicable provisions of the Code, and to make distributions of income and net realized capital gain sufficient to relieve it from substantially all federal income and excise taxes. For federal income tax purposes, each series is treated as a single entity for the purpose of determining such qualification.
During the current year, the fund adopted FASB Interpretation No. 48 “Accounting for Uncertainty in IncomeTaxes” (“FIN 48”). FIN 48 provides guidance for how uncertain tax positions should be recognized, measured, presented and disclosed in the financial statements. FIN 48 requires the evaluation of tax positions taken or expected to be taken in the course of preparing the fund’s tax returns to determine whether the tax positions are “more-likely-than-not” of being sustained by the applicable tax authority. Tax positions not deemed to meet the more likely-than-not threshold would be recorded as a tax expense in the current year.The adoption of FIN 48 had no impact on the operations of the fund for the period ended August 31, 2008.
As of and during the period ended August 31, 2008, the fund did not have any liabilities for any unrecognized tax benefits. The fund recognizes interest and penalties, if
any, related to unrecognized tax benefits as income tax expense in the Statement of Operations. During the period, the fund did not incur any interest or penalties.
Each of the tax years in the four-year period ended August 31, 2008, remains subject to examination by the Internal Revenue Service and state taxing authorities.
Table 1 summarizes each fund’s components of accumulated earnings on a tax basis at August 31, 2008.
Table 2 summarizes BNY Mellon National Short-Term Municipal Bond Fund and BNY Mellon Massachusetts Intermediate Municipal Bond Fund’s unused capital loss carryover available to be applied against future net securities profits, if any, realized subsequent to August 31, 2008.
Table 3 summarizes each relevant fund’s tax character of distributions paid to shareholders during the fiscal periods ended August 31, 2008 and August 31, 2007, respectively.
During the period ended August 31, 2008, as a result of permanent book to tax differences, primarily due to the tax treatment for amortization of premiums/discounts, the funds increased (decreased) accumulated undistributed investment income-net, increased (decreased) accumulated net realized gain (loss) on investments and increased (decreased) paid-in capital as summarized in Table 4. Net assets and net asset value per share were not affected by this reclassification.
| Table 1. | ||||||||
| Undistributed | Undistributed | Undistributed | Unrealized | |||||
| Tax Exempt | Ordinary | Capital Gains | Appreciation | |||||
| Income ($) | Income ($) | (Losses) ($) | (Depreciation) ($) | |||||
| BNY Mellon National Intermediate Municipal Bond Fund | 388,050 | 1,328 | 719,767 | 11,567,229 | ||||
| BNY Mellon National Short-Term Municipal Bond Fund | 62,095 | — | (1,040,043) | 946,182 | ||||
| BNY Mellon Pennsylvania Intermediate Municipal Bond Fund | 177,815 | — | 742,338 | 7,372,259 | ||||
| BNY Mellon Massachusetts Intermediate Municipal Bond Fund | 80,036 | — | (576,569) | 6,697,181 | ||||
| Table 2. | ||||||||
| Expiring in fiscal† | 2014 ($)† | 2015 ($)† | 2016 ($)† | Total ($) | ||||
| BNY Mellon National Short-Term Municipal Bond Fund | 439,406 | 501,053 | 99,584 | 1,040,043 | ||||
| BNY Mellon Massachusetts Intermediate Municipal Bond Fund | — | 67,779 | 508,790 | 576,569 | ||||
† If not applied, the carryovers expire in the above years.
80
NOTE 3—Bank Lines of Credit:
Effective May 1, 2008, the funds participate with other Dreyfus-managed funds in a $300 million unsecured line of credit primarily to be utilized for temporary or emergency purposes, including the financing of redemptions. The terms of the line of credit agreement limit the amount of individual fund borrowings. Interest is charged to the fund based on prevailing market rates in effect at the time of borrowing. Prior to May 1, 2008, the funds participated with other Dreyfus-managed funds in a $100 million unsecured line of credit. During the period ended August 31, 2008, the funds did not borrow under the lines of credit.
NOTE 4—Investment Advisory Fee, Administration Fee and Other Transactions With Affiliates:
(a) Fees payable by the funds pursuant to the provisions of an Investment Advisory Agreement with the Investment Adviser are payable monthly, computed on the average daily value of each fund’s net assets at the following annual rates: .35% of the BNY Mellon National Intermediate Municipal Bond Fund,.35% of the BNY Mellon National
Short-Term Municipal Bond Fund, .50% of the BNY Mellon Pennsylvania Intermediate Municipal Bond Fund and .35% of the BNY Mellon Massachusetts Intermediate Municipal Bond Fund.
Pursuant to the Administration Agreement,The Bank of New York Mellon provides or arranges for fund accounting, transfer agency and other fund administration services and receives a fee based on the total net assets of the Trust based on the following rates:
| 0 up to $6 billion | .15% | |
| $6 billion up to $12 billion | .12% | |
| In excess of $12 billion | .10% |
The Bank of New York Mellon has entered into a Sub-Administration Agreement with Dreyfus pursuant to which Mellon pays Dreyfus for performing certain administrative services.
The Bank of NewYork Mellon agreed, until September 30, 2007, with respect to BNY Mellon Massachusetts Intermediate Municipal Bond Fund, to waive receipt of its fees and/or reimburse a portion of the fund’s
| Table 3. | ||||||||||||
| Ordinary | Long-Term | |||||||||||
| Tax-Exempt Income ($) | Income ($) | Capital Gains ($) | ||||||||||
| 2008 | 2007 | 2008 | 2007 | 2008 | 2007 | |||||||
| BNY Mellon National Intermediate | ||||||||||||
| Municipal Bond Fund | 40,807,287 | 34,847,113 | — | 85,461 | — | — | ||||||
| BNY Mellon National Short-Term | ||||||||||||
| Municipal Bond Fund | 5,173,277 | 4,730,899 | — | 33,641 | — | — | ||||||
| BNY Mellon Pennsylvania Intermediate | ||||||||||||
| Municipal Bond Fund | 23,083,337 | 23,914,973 | 212,223 | 191,052 | 791,853 | 1,161,392 | ||||||
| BNY Mellon Massachusetts Intermediate | ||||||||||||
| Municipal Bond Fund | 13,720,837 | 12,340,514 | — | — | — | — | ||||||
| Table 4. | ||||||
| Accumulatead | Accumulatead | |||||
| Undistributed | Net Realized | Paid-in | ||||
| Investment Income—Net ($) | Gain (Loss) ($) | Capital ($) | ||||
| BNY Mellon National Intermediate Municipal Bond Fund | (123,960) | 123,806 | 154 | |||
| BNY Mellon Pennsylvania Intermediate Municipal Bond Fund | (45,078) | 45,078 | — | |||
| BNY Mellon Massachusetts Intermediate Municipal Bond Fund | (1,678) | 1,678 | — | |||
The Funds 81
NOTES TO FINANCIAL STATEMENTS (continued)
expenses, exclusive of taxes, interest, brokerage commissions, Rule 12b-1 fees, Shareholder Services Plan fees and extraordinary expenses, so that the fund’s expenses, in the aggregate, did not exceed an annual rate of .50% of the value of the fund’s average daily net assets. The expense reimbursement, pursuant to the undertaking, for BNY Mellon Massachusetts Intermediate Bond Fund, amounted to $8,306 during the period ended August 31, 2008.
During the period ended August 31, 2008, the Distributor retained $711 from contingent deferred sales charges on redemptions of the BNY Mellon National Intermediate Municipal Bond Fund’s Dreyfus Premier shares.
(b) BNY Mellon National Intermediate Municipal Bond Fund and BNY Mellon Massachusetts Intermediate Municipal Bond Fund have adopted a Distribution Plan (the “Plan”) pursuant to Rule 12b-1 under the Act for distributing its Dreyfus Premier shares.The funds each pay the Distributor a fee at an annual rate of .50% of the value of the fund’s average daily net assets attributable to its Dreyfus Premier shares. During the period ended August 31, 2008, BNY Mellon National Intermediate Municipal Bond Fund and BNY Mellon Massachusetts Intermediate Municipal Bond Fund’s Dreyfus Premier shares were charged $1,106 and $87, respectively, pursuant to the Plan.
(c) The funds have adopted a Shareholder Services Plan with respect to its Investor shares, and BNY Mellon National Intermediate Municipal Bond Fund and BNY Mellon Massachusetts Intermediate Municipal Bond Fund have adopted a Shareholder Services Plan with respect to its Dreyfus Premier shares, pursuant to which each fund pays the Distributor for the provision of certain services to holders of Investor shares and Dreyfus Premier shares a fee at an annual rate of .25% of the value of the average daily net assets attributable to Investor shares and Dreyfus Premier shares, respectively.The services provided may include personal services relating to shareholder accounts, such as answering shareholder inquiries regarding a fund, and providing reports and other information, and services related
to the maintenance of such shareholder accounts. The Shareholder Services Plan allows the Distributor to make payments from the shareholder services fees it collects from each fund to compensate service agents (certain banks, securities brokers or dealers and other financial institutions) in respect of these services. Table 5 summarizes the amounts Investor shares and Dreyfus Premier shares were charged during the period endedAugust 31,2008,pursuant to the Shareholder Services Plan. Additional fees included in shareholder servicing costs in the Statement of Operations include fees paid to the transfer agent.
| Table 5. | ||
| BNY Mellon National Intermediate | ||
| Municipal Bond Fund (Investor Shares) | $57,739 | |
| BNY Mellon National Intermediate Municipal | ||
| Bond Fund (Dreyfus Premier Shares) | 553 | |
| BNY Mellon National Short-Term | ||
| Municipal Bond Fund (Investor Shares) | 1,428 | |
| BNY Mellon Pennsylvania Intermediate | ||
| Municipal Bond Fund (Investor Shares) | 3,809 | |
| BNY Mellon Massachusetts Intermediate | ||
| Municipal Bond Fund (Investor Shares) | 22,512 | |
| BNY Mellon Massachusetts Intermediate | ||
| Municipal Bond Fund | ||
| (Dreyfus Premier Shares) | 44 |
The funds compensate The Bank of New York Mellon under a cash management agreement for performing cash management services related to fund subscriptions and redemptions. Table 6 summarizes the amounts the funds were charged during the period ended August 31, 2008 pursuant to the cash management agreement.
| Table 6. | ||
| BNY Mellon National Intermediate | ||
| Municipal Bond Fund | $3,646 | |
| BNY Mellon National Short-Term | ||
| Municipal Bond Fund | 94 | |
| BNY Mellon Pennsylvania Intermediate | ||
| Municipal Bond Fund | 232 | |
| BNY Mellon Massachusetts Intermediate | ||
| Municipal Bond Fund | 1,300 |
The funds compensate The Bank of New York Mellon under a custody agreement for providing custodial services
82
for the relevant funds. Table 7 summarizes the amounts each funds were charged during the period ended August 31, 2008, pursuant to the custody agreement.
| Table 7. | ||
| BNY Mellon National Intermediate | ||
| Municipal Bond Fund | $79,923 | |
| BNY Mellon National Short-Term | ||
| Municipal Bond Fund | 12,937 | |
| BNY Mellon Pennsylvania Intermediate | ||
| Municipal Bond Fund | 47,702 | |
| BNY Mellon Massachusetts Intermediate | ||
| Municipal Bond Fund | 29,388 |
During the period ended August 31, 2008, each of the funds was charged $5,622 for services performed by the Chief Compliance Officer. Table 8 summarizes the components of Due to the Dreyfus Corporation and affiliates in the Statements of Assets and Liabilities for each fund.
(d) Effective June 1, 2008, each trustee who is not an “affiliated person” as defined in the Act receives from the Trust an annual fee of $68,000 and an attendance fee of $7,500 for each in-person meeting attended and $500 for telephone meetings and is reimbursed for travel and out-of-pocket expenses. The Chairman of the Trust’s Board receives an additional annual fee of $15,000 and the Chairman of the Trust’s Audit Committee receives an additional fee of $10,000. Prior to June 1, 2008, the Trust paid its Board members an annual fee of $48,000 and an attendance fee of $5,000 for each in-person
meeting attended and $500 for telephone meetings and reimbursed them for travel and out-of-pocket expenses, and the Chairmen of the Trust’s Board and Audit Committee received additional annual fees of $10,000 and $8,000, respectively.
NOTE 5—Securities Transactions:
Table 9 summarizes each fund’s aggregate amount of purchases and sales of investment securities, excluding short-term securities and financial futures, during the period ended August 31, 2008.
The funds may invest in financial futures contracts in order to gain exposure to or protect against changes in the market. The funds are exposed to market risk as a result of changes in the value of the underlying financial instruments. Investments in financial futures require the funds to “mark to market” on a daily basis, which reflects the change in the market value of the contracts at the close of each day’s trading. Typically, variation margin payments are received or made to reflect daily unrealized gains or losses.When the contracts are closed, the funds recognize a realized gain or loss. These investments require initial margin deposits with a broker, which consist of cash or cash equivalents. The amount of these deposits is determined by the exchange or Board of Trade on which the contract is traded and is subject to change. Contracts open at August 31, 2008 are set forth in the Statement of Financial Futures.
| Table 8. | ||||||||||
| Investment | Rule 12b-1 | Shareholder | Chief | |||||||
| Advisory | Distribution | Services | Custodian | Compliance | ||||||
| Fees ($) | Plan Fees ($) | Plan Fees ($) | Fees ($) | Officer Fees ($) | ||||||
| BNY Mellon National Intermediate | ||||||||||
| Municipal Bond Fund | 315,871 | 75 | 4,637 | 19,911 | 3,760 | |||||
| BNY Mellon National Short-Term | ||||||||||
| Municipal Bond Fund | 49,636 | — | 132 | 3,033 | 3,760 | |||||
| BNY Mellon Pennsylvania Intermediate | ||||||||||
| Municipal Bond Fund | 243,412 | — | 314 | 10,947 | 3,760 | |||||
| BNY Mellon Massachusetts Intermediate | ||||||||||
| Municipal Bond Fund | 113,196 | 8 | 1,830 | 7,407 | 3,760 | |||||
The Funds 83
NOTES TO FINANCIAL STATEMENTS (continued)
Table 10 summarizes accumulated net unrealized appreciation on investments for each fund at August 31, 2008.
In March 2008, the FASB released Statement of Financial Accounting Standards No. 161 “Disclosures about Derivative Instruments and Hedging Activities” (“FAS 161”). FAS 161 requires qualitative disclosures about objectives and strategies for using derivatives, quantitative disclosures about fair value amounts of gains and losses on derivative instruments and disclosures about credit-risk-related contingent features in derivative agreements. The application of FAS 161 is required for fiscal years and interim periods beginning after November 15, 2008. At this time, management is evaluating the implications of FAS 161 and its impact on the financial statements and the accompanying notes has not yet been determined.
NOTE 6—Plan of Reorganization:
On March 11, 2008, the Board of Trustees approved an Agreement and Plan of Reorganization between BNY
Mellon National Intermediate Municipal Bond Fund (the “Acquiring Fund”) and BNY Hamilton Intermediate Tax-Exempt Fund (the “Acquired Fund”) providing for the Acquired Fund to merge into the Acquiring Fund as part of a tax-free reorganization.The merger, which was approved by the Acquired Fund’s shareholders, on July 16, 2008, occurred as of the close of business on September 12, 2008. On that date, shareholders of the Acquired Fund’s Institutional shares received Class M shares of the Acquiring Fund and shareholders of the Acquired Fund’s Class A shares received Investor shares of the Acquiring Fund. The Acquired Fund exchanged all of its assets at net asset value, subject to liabilities, for the equivalent value of shares of the Acquiring Fund. Such shares have been distributed pro rata to shareholders of the Acquired Fund so that each shareholder received a number of shares of the Acquired Fund equal to the aggregate net asset value of the shareholders Acquired Fund’s shares.
| Table 9. | ||||
| Purchases ($) | Sales ($) | |||
| BNY Mellon National Intermediate Municipal Bond Fund | 489,764,408 | 475,502,097 | ||
| BNY Mellon National Short-Term Municipal Bond Fund | 47,670,449 | 33,279,112 | ||
| BNY Mellon Pennsylvania Intermediate Municipal Bond Fund | 59,616,148 | 94,777,695 | ||
| BNY Mellon Massachusetts Intermediate Municipal Bond Fund | 53,776,521 | 31,265,641 | ||
| Table 10. | ||||||||
| Cost of | Gross | Gross | ||||||
| Investments ($) | Appreciation ($) | (Depreciation) ($) | Net ($) | |||||
| BNY Mellon National Intermediate Municipal Bond Fund | 1,057,836,319 | 24,122,377 | 12,555,148 | 11,567,229 | ||||
| BNY Mellon National Short-Term Municipal Bond Fund | 166,472,777 | 1,624,222 | 678,040 | 946,182 | ||||
| BNY Mellon Pennsylvania Intermediate Municipal Bond Fund | 560,636,013 | 14,978,112 | 7,605,853 | 7,372,259 | ||||
| BNY Mellon Massachusetts Intermediate Municipal Bond Fund | 372,584,918 | 8,893,428 | 2,196,247 | 6,697,181 | ||||
84
REPORT OF INDEPENDENT REGISTERED PUBLIC ACCOUNTING FIRM
The Board of Trustees and Shareholders of BNY Mellon Funds Trust
We have audited the accompanying statements of assets and liabilities of BNY Mellon National Intermediate Municipal Bond Fund, BNY Mellon National Short-Term Municipal Bond Fund, BNY Mellon Pennsylvania Intermediate Municipal Bond Fund and BNY Mellon Massachusetts Intermediate Municipal Bond Fund, each a series of BNY Mellon Funds Trust, (collectively “the Funds”), including the statements of investments as of August 31, 2008, and the related statements of operations for the year then ended, the statements of changes in net assets for each of the years in the two-year period then ended, and the financial highlights for each of the years in the five-year period then ended.These financial statements and financial highlights are the responsibility of the Funds’ management. Our responsibility is to express an opinion on these financial statements and financial highlights based on our audits.
We conducted our audits in accordance with the standards of the Public Company Accounting Oversight Board (United States). Those standards require that we plan and perform the audit to obtain reasonable assurance about whether the financial statements and financial highlights are free of material misstatement.An audit includes examining, on a test basis, evidence supporting the amounts and disclosures in the financial statements
and financial highlights. Our procedures included confirmation of securities owned as of August 31, 2008, by correspondence with the custodian and brokers or by other appropriate audit procedures where replies from brokers were not received. An audit also includes assessing the accounting principles used and significant estimates made by management, as well as evaluating the overall financial statement presentation. We believe that our audits provide a reasonable basis for our opinion.
In our opinion, the financial statements and financial highlights referred to above present fairly, in all material respects, the financial position of BNY Mellon National Intermediate Municipal Bond Fund, BNY Mellon National Short-Term Municipal Bond Fund, BNY Mellon Pennsylvania Intermediate Municipal Bond Fund and BNY Mellon Massachusetts Intermediate Municipal Bond Fund as of August 31, 2008, and the results of their operations for the year then ended, the changes in their net assets for each of the years in the two-year period then ended and the financial highlights for each of the years in the five-year period then ended, in conformity with U.S. generally accepted accounting principles.

| New York, New York |
| October 27, 2008 |
The Funds 85
IMPORTANT TAX INFORMATION (Unaudited)
BNY Mellon National Intermediate Municipal Bond Fund
In accordance with federal tax law, the fund hereby designates all the dividends paid from investment income-net during its fiscal year ended August 31, 2008 as “exempt-interest dividends” (not generally subject to regular federal income tax).
As required by federal tax law rules, shareholders will receive notification of their portion of the fund’s taxable ordinary dividends (if any) and capital gains distributions (if any) paid for the 2008 calendar year on Form 1099-DIV and their portion of the fund’s tax-exempt dividends paid for the 2008 calendar year on Form 1099-INT, both which will be mailed by January 31, 2009.
BNY Mellon National Short-Term Municipal Bond Fund
In accordance with federal tax law, the fund hereby designates all the dividends paid from investment income-net during its fiscal year ended August 31, 2008 as “exempt-interest dividends” (not generally subject to regular federal income tax).
As required by federal tax law rules, shareholders will receive notification of their portion of the fund’s taxable ordinary dividends (if any) and capital gains distributions (if any) paid for the 2008 calendar year on Form 1099-DIV and their portion of the fund’s tax-exempt dividends paid for the 2008 calendar year on Form 1099-INT, both which will be mailed by January 31, 2009.
BNY Mellon Pennsylvania Intermediate Municipal Bond Fund
In accordance with federal tax law, the fund hereby makes the following designations regarding its fiscal year ended August 31, 2008:
- all the dividends paid from investment income- net are “exempt-interest dividends” (not gener- ally subject to regular Federal income tax).
- the fund hereby designates $.0162 per share as a long-term capital gain distribution and $.0044 per share as a short-term capital gain distribution paid on December 13, 2007.
As required by federal tax law rules, shareholders will receive notification of their portion of the fund’s taxable ordinary dividends (if any) and capital gains distributions (if any) paid for the 2008 calendar year on Form 1099-DIV and their portion of the fund’s exempt-interest dividends paid for the 2008 calendar year on Form 1099-INT, both which will be mailed by January 31, 2009.
BNY Mellon Massachusetts Intermediate Municipal Bond Fund
In accordance with federal tax law, the fund hereby designates all the dividends paid from investment income-net during its fiscal year ended August 31, 2008 as “exempt-interest dividends” (not generally subject to regular federal income tax).
As required by federal tax law rules, shareholders will receive notification of their portion of the fund’s taxable ordinary dividends (if any) and capital gains distributions (if any) paid for the 2008 calendar year on Form 1099-DIV and their portion of the fund’s tax-exempt dividends paid for the 2008 calendar year on Form 1099-INT, both which will be mailed by January 31, 2009.
86
| INFORMATION ABOUT THE REVIEW AND APPROVAL |
| OF EACH FUND’S INVESTMENT ADVISORY AGREEMENT (Unaudited) |
At a meeting of the Board of Trustees held on March 10-11, 2008, the Board considered the re-approval of the Trust’s Investment Advisory Agreement for another one year term, pursuant to which BNY Mellon Fund Advisers, a division of Dreyfus, provides the funds with investment advisory services. The Board members also considered the re-approval of the Trust’s Administration Agreement with Mellon Bank for another one year term, pursuant to which Mellon Bank provides the funds with administrative services. Mellon Bank has entered into a Sub-Administration Agreement with Dreyfus pursuant to which Mellon Bank pays Dreyfus for performing certain of these administrative services.The Board members who are not “interested persons” (as defined in the Act) of the Trust were assisted in their review by independent legal counsel and met with counsel in executive session separate from representatives of Dreyfus.
Analysis of Nature, Extent and Quality of Services Provided to the Funds. The Board members received a presentation from representatives of Dreyfus regarding services provided to the funds, and discussed the nature, extent and quality of the services provided to the funds pursuant to the Investment Advisory Agreement. Dreyfus’ representatives reviewed the funds’ distribution of accounts, and noted the diversity of distribution of the funds and Dreyfus’ corresponding need for broad, deep and diverse resources to be able to provide ongoing shareholder services to each of the funds’ distribution channels. Dreyfus also provided the number of shareholder accounts in each fund, as well as each fund’s asset size.
The Board members also considered Dreyfus’ research and portfolio management capabilities and that Dreyfus also provides oversight of day-to-day fund operations, including fund accounting and administration and assistance in meeting legal and regulatory requirements, and Dreyfus’ extensive administrative, accounting and compliance infrastructure.
Comparative Analysis of the Funds’ Advisory Fees, Expense Ratios and Performance
The Board members reviewed reports prepared by Lipper, Inc., an independent provider of investment company data, which included information comparing each fund’s advisory fee and expense ratio with a group of comparable funds (the “Expense Group”) and with a broader group of funds (the “Expense Universe”), in each case in the same category applicable to the fund, that were selected by Lipper. The Board members also reviewed reports prepared by Lipper which included information comparing each fund’s performance with that of a group of comparable funds (the “Performance Group”) composed of the same funds included in the Expense Group and with that of a broader group of funds (the “Performance Universe”), in each case in the same category applicable to the fund, that were selected by Lipper. Included in these reports were comparisons of contractual and actual advisory fee rates, total operating expenses, total return performance and yield. Dreyfus also provided a comparison of each fund’s calendar year total returns to the performance of the fund’s benchmark. Representatives of Dreyfus furnished these reports to the Board along with a description of the methodology Lipper used to select each Expense Group and Expense Universe and each Performance Group and Performance Universe.
BNY Mellon National Intermediate Municipal Bond Fund
The Board reviewed the results of the Expense Group and Expense Universe comparisons. The Board reviewed the range of advisory fees and expense ratios of the funds in the Expense Group and Expense Universe, and noted that the fund’s expense ratio ranked in the second quartile of the Expense Group and Expense Universe (below the respective Expense Group and Expense Universe medians).
The Funds 87
| INFORMATION ABOUT THE REVIEW AND APPROVAL OF EACH FUND’S |
| INVESTMENT ADVISORY AGREEMENT (Unaudited) (continued) |
The Board also reviewed the results of the Performance Group and Performance Universe comparisons.The Board noted that for periods ended January 31, 2008, the fund’s total return performance was below the medians of the Performance Group for the 1-, 2- and 3-year periods, and was above the medians for the 4- and 5-year periods, and was below the median of the Performance Universe for the 1-year period, and was above the medians for the 2-, 3-, 4- and 5-year periods.The Board also noted that the fund’s yield was above the medians of the Performance Group for each of the 1-year periods ended January 31st for each of the reported periods, except 2004, when it was equal to the median, and was above the medians of the Performance Universe for each of the 1-year periods ended January 31st for each of the reported periods.
Representatives of Dreyfus reviewed with the Board members the fees paid to Dreyfus or its affiliates by mutual funds managed by Dreyfus or its affiliates with similar investment objectives, policies and strategies, and included within the same Lipper category, as the fund. The Board considered BNY Mellon Wealth Management’s general advisory fee schedule for accounts with similar investment objectives, policies and strategies as the fund.The Board analyzed the differences in fees paid to Dreyfus and discussed the relationship of the advisory fees paid in light of the services provided. The Board members considered the relevance of the fee information provided to evaluate the appropriateness and reasonableness of the fund’s advisory fees.
BNY Mellon National Short-Term Municipal Bond Fund
The Board reviewed the results of the Expense Group and Expense Universe comparisons.The Board reviewed the range of advisory fees and expense ratios of the funds in
the Expense Group and Expense Universe, and noted that the fund’s expense ratio ranked in the third quartile of the Expense Group and Expense Universe (above the respective Expense Group and Expense Universe medians).
The Board also reviewed the results of the Performance Group and Performance Universe comparisons. The Board noted that the fund’s total return performance was below the medians of the Performance Group, and was above the medians of the Performance Universe, for the reported periods ended January 31, 2008.The Board also noted that the fund’s yield was below the medians of the Performance Group for each of the 1-year periods ended January 31st for 2002 and for 2005 through 2008, was above the medians for each of the 1-year periods ended January 31st for 2003 and 2004, and was above the medians of the Performance Universe for each of the 1-year periods ended January 31st for 2002 through 2005, was below the medians for the 1-year periods ended January 31st for 2006 and 2007 and was equal to the median for the 1-year period ended January 31, 2008.
Representatives of Dreyfus reviewed with the Board members the fees paid to Dreyfus or its affiliates by a mutual fund managed by Dreyfus or its affiliates with a similar investment objective and similar policies and strategies, and included within the same Lipper category, as the fund.The Board considered BNY Mellon Wealth Management’s general advisory fee schedule for accounts with similar investment objectives, policies and strategies as the fund.The Board analyzed the differences in fees paid to Dreyfus and discussed the relationship of the advisory fees paid in light of the services provided. The Board members considered the relevance of the fee information provided to evaluate the appropriateness and reasonableness of the fund’s advisory fees.
88
BNY Mellon Pennsylvania Intermediate Municipal Bond Fund
The Board reviewed the results of the Expense Group and Expense Universe comparisons. The Board reviewed the range of advisory fees and expense ratio of the funds in the Expense Group and in the Expense Universe, and noted that the fund’s expense ratio ranked 3 of 4 (among the highest expense ratios) in the Expense Group and 4 of 5 (among the highest expense ratios) in the Expense Universe.
The Board also reviewed the results of the Performance Group and Performance Universe comparisons. The Board noted that for periods ended January 31, 2008, the fund’s total return performance was below the medians of the Performance Group for the 1-, 2-, 3- and 4-year periods, and was above the median for the 5-year period, and was below the median of the Performance Universe for the 1-year period, and was above the medians for the 2-, 3-, 4- and 5-year periods.The Board also noted that the fund’s yield was below the medians of the Performance Group for each of the 1-year periods ended January 31st for 2002 and 2003, and was above the medians for each of the 1-year periods ended January 31st for 2004 through 2008, and was above the medians of the Performance Universe for each of the 1-year periods ended January 31st for 2003 through 2008 and was below the median for the 1-year period ended January 31, 2002.
The Board considered BNY Mellon Wealth Management’s general advisory fee schedule for accounts with similar investment objectives, policies and strategies as the fund.The Board analyzed the differences in fees paid to Dreyfus and discussed the relationship of the advisory fees paid in light of the services provided. The Board
members considered the relevance of the fee information provided to evaluate the appropriateness and reasonableness of the fund’s advisory fees.
BNY Mellon Massachusetts Intermediate Municipal Bond Fund
The Board reviewed the results of the Expense Group and Expense Universe comparisons.The Board reviewed the range of advisory fees and expense ratios of the funds in the Expense Group and Expense Universe, and noted that the fund had the lowest expense ratios in the Expense Group and the Expense Universe. The Board also considered that Mellon Bank waived fees and/or reimbursed fund expenses through September 30, 2007, so that the total annual operating expenses of Class M shares, Investor shares and Dreyfus Premier shares of the fund (excluding interest, taxes, brokerage commissions, extraordinary expenses, Rule 12b-1 fees and shareholder services fees) were limited to 0.50% and that the undertaking is no longer in effect pursuant to its terms.
The Board also reviewed, and placed significant emphasis on, the results of the Performance Group and Performance Universe comparisons. The Board noted that the fund’s total return performance was above the medians of the Performance Group and Performance Universe for the reported periods ended January 31, 2008.The Board also noted that the fund’s yield was above the medians of the Performance Group and the Performance Universe for each of the 1-year periods ended January 31st for each of the reported periods, except for the 1-year period ended January 31, 2000, when it was below the median of the Performance Group.
The Board considered BNY Mellon Wealth Management’s general advisory fee schedule for accounts with
The Funds 89
| INFORMATION ABOUT THE REVIEW AND APPROVAL OF EACH FUND’S |
| INVESTMENT ADVISORY AGREEMENT (Unaudited) (continued) |
similar investment objectives, policies and strategies as the fund.The Board analyzed the differences in fees paid to Dreyfus and discussed the relationship of the advisory fees paid in light of the services provided. The Board members considered the relevance of the fee information provided to evaluate the appropriateness and reasonableness of the fund’s advisory fees.
Analysis of Profitability and Economies of Scale. Dreyfus’ representatives reviewed the dollar amount of expenses allocated and profit received by Dreyfus and its affiliates with respect to each fund and the method used to determine such expenses and profit.The Board previously had been provided with information prepared by an independent consulting firm regarding Dreyfus’ approach to allocating costs to, and determining the profitability of, individual funds and the entire Dreyfus mutual fund complex. The Board members also had been informed that the methodology had been reviewed by an independent registered public accounting firm which, like the consultant, found the methodology to be reasonable.The consulting firm also analyzed where any economies of scale might emerge in connection with the management of the funds. The Board members evaluated the profitability analysis in light of the relevant circumstances for each fund, including any decline in assets, and the extent to which economies of scale would be realized if a fund grows and whether fee levels reflect these economies of scale for the benefit of fund shareholders. The Board members also considered potential benefits to Dreyfus and its affiliates, including BNY Mellon Fund Advisers, from acting as investment adviser to the funds and noted that there were no soft dollar arrangements with respect to trading the funds’ portfolios.
It was noted that the Board members should consider Dreyfus’ profitability with respect to each fund as part of
their evaluation of whether the fees under the Investment Advisory Agreement bear a reasonable relationship to the mix of services provided by Dreyfus, including the nature, extent and quality of such services. It was noted that the profitability percentage for managing each fund was within ranges determined by appropriate court cases to be reasonable given the services rendered and that the profitability percentage for managing each fund was not unreasonable given the services provided.The Board also noted the current fee waiver and expense reimbursement arrangement pertaining to BNY Mellon Massachusetts Intermediate Municipal Bond Fund and its effect on the profitability of Dreyfus.
At the conclusion of these discussions, the Board agreed that it had been furnished with sufficient information to make an informed business decision with respect to the continuation of the Trust’s Investment Advisory Agreement with respect to the funds. Based on the discussions and considerations as described above, the Board made the following conclusions and determinations with respect to the funds:
- The Board concluded that the nature, extent and qual- ity of the services provided by Dreyfus to each fund are adequate and appropriate.
- With respect to BNY Mellon National Intermediate Municipal Bond Fund and BNY Mellon National Short-Term Municipal Bond Fund, the Board was gen- erally satisfied with each fund’s overall performance.
- With respect to BNY Mellon Pennsylvania Intermediate Municipal Bond Fund, the Board was satisfied with the fund’s overall performance
- With respect to BNY Mellon Massachusetts Intermediate Municipal Bond Fund, the Board was satisfied with the fund’s performance.
90
- The Board concluded that the fee paid to Dreyfus by each fund was reasonable in light of the services pro- vided, comparative performance and expense and advisory fee information, costs of the services pro- vided and profits to be realized and benefits derived or to be derived by Dreyfus and its affiliates from its rela- tionship with the fund.
- The Board determined that the economies of scale which may accrue to Dreyfus and its affiliates in con- nection with the management of the funds had been adequately considered by Dreyfus in connection with the advisory fee rate charged to each fund, and that,
to the extent in the future it were to be determined that material economies of scale had not been shared with a fund, the Board would seek to have those economies of scale shared with the fund.
The Board members considered these conclusions and determinations, along with the information received on a routine and regular basis throughout the year, and, without any one factor being dispositive, the Board determined that re-approval of the Trust’s Investment Advisory Agreement and Administration Agreement with respect to the funds was in the best interests of each fund and its respective shareholders.
The Funds 91
BOARD MEMBERS INFORMATION (Unaudited)
| Patrick J. O’Connor (65) |
| Chairman of the Board (2000) |
Principal Occupation During Past 5Years:
- Attorney, Cozen and O’Connor, P.C. since 1973, including Vice Chairman since 1980 and Chief Executive Officer and President from 2002 to 2007
Other Board Memberships and Affiliations:
- Board of Consultors of Villanova University School of Law, Board Member
- Temple University,Trustee
- Philadelphia Police Foundation, Board Member
- Philadelphia Children’s First Fund, Board Member
- American College of Trial Lawyers, Fellow
- Historical Society of the United States District Court for the Eastern District of Pennsylvania, Director
- St. Jude’s Children Research Hospital Professional Advisory Board, Director
- Crowley Chemical, Director
- Franklin Security Bank,Vice Chairman
- International Academy of Trial Lawyers, Fellow
No. of Portfolios for which Board Member Serves: 20
| ——————— |
| Ronald R. Davenport (72) |
| Board Member (2000) |
Principal Occupation During Past 5Years:
Chairman of Sheridan Broadcasting Corporation since July 1972
Other Board Memberships and Affiliations:
American Urban Radio Networks, Co-Chairman
No. of Portfolios for which Board Member Serves: 20
| ——————— |
| John L. Diederich (71) |
| Board Member (2000) |
Principal Occupation During Past 5Years:
- Chairman of Digital Site Systems, Inc., a privately held soft- ware company providing internet service to the construction materials industry, since July 1998
Other Board Memberships and Affiliations:
- Continental Mills, a dry baking products company, Board Member
- Pittsburgh Parks Conservancy, Board Member
No. of Portfolios for which Board Member Serves: 20
| Maureen M.Young (63) |
| Board Member (2000) |
Principal Occupation During Past 5Years:
- Director of the Office of Government Relations at Carnegie Mellon University from January 2000 to December 2007
Other Board Memberships and Affiliations:
Oakland Planning and Development Corp., Board Member
No. of Portfolios for which Board Member Serves: 20
| ——————— |
| Kevin C. Phelan (64) |
| Board Member (2000) |
Principal Occupation During Past 5Years:
- Mortgage Banker, Meredith & Grew, Inc. since March 1978, including President since September 2007 and Executive Vice President and Director from March 1998 to September 2007
Other Board Memberships and Affiliations:
- Greater Boston Chamber of Commerce, Director
- Fiduciary Trust of Boston, Director
- Caritas Medical Center,Vice Chairman
- St. Elizabeth’s Medical Center of Boston, Board Member
- Providence College,Trustee
- Simmons College,Trustee
- Newton Country Day School, Chairman of the Board
- Babson College, Board of Visitors
- Boston University School of Public Health, Board of Visitors
- Boston Public Library Foundation, Director
- Boston Foundation, Director
- Boston Municipal Research Bureau, Board Member
- Boys and Girls Club of Boston, Board Member
- Boston Capital Real Estate Investment Trust, Director
No. of Portfolios for which Board Member Serves: 20
| ——————— |
| Patrick J. Purcell (60) |
| Board Member (2000) |
Principal Occupation During Past 5Years:
- Owner, President and Publisher of The Boston Herald since February 1994
- President and Founder, jobfind.com, an employment search site on the world wide web, since July 1996
- President and CEO, Herald Media since 2001
Other Board Memberships and Affiliations:
- The American Ireland Fund, an organization that raises funds for philanthropic projects in Ireland, Board Member
- The Genesis Fund, an organization that raises funds for the specialized care and treatment of New England area children born with birth defects, mental retardation and genetic dis- eases, Board Member
- United Way of Massachusetts Bay, Board Member
- Greater Boston Chamber of Commerce, Board Member
No. of Portfolios for which Board Member Serves: 20
92
| John R. Alchin (60) |
| Board Member (2008) |
Principal Occupation During Past 5Years:
- Retired since 2007
- Executive of Comcast Corporation, a cable services provider, from 1990 to 2007, including Executive Vice-President, Co-Chief Financial Officer and Treasurer from 2002 to 2007
Other Board Memberships and Affiliations
- Big Brothers/Big Sisters of Southeastern Pennsylvania, Director
- Polo Ralph Lauren Corporation, a retail clothing and home furnishings company, Director
- Philadelphia Museum of Art, Board Member
- Metropolitan AIDS Neighborhood Nutrition Alliance, Board Member
No. of Portfolios for which Board Member Serves: 20
| ——————— |
| Kim D. Kelly (52) |
| Board Member (2008) |
- Consultant since 2005
- President, Chief Executive Officer and a Director of Arroyo Video Solutions, Inc., a video-on-demand technology company, from 2004 to 2005
- Executive of Insight Communications Company, Inc., a cable services provider, from 1990 to 2003, including President from 2002 to 2003 and Chief Operating Officer from 1998 to 2003
Other Board Memberships and Affiliations:
- Saint David’s School,Trustee
- MCG Capital Corp., Director
No. of Portfolios for which Board Member Serves: 20
| Thomas F. Ryan, Jr. (67) |
| Board Member (2000) |
Principal Occupation During Past 5Years:
- Retired since April 1999
- President and Chief Operating Officer of the American Stock Exchange from October 1995 to April 1999
Other Board Memberships and Affiliations:
- Boston College,Trustee
- Brigham & Women’s Hospital,Trustee
- New York State Independent System Operator, a non-profit organization which administers a competitive wholesale mar- ket for electricity in New York State, Director
- RepliGen Corporation, a biopharmaceutical company, Director
No. of Portfolios for which Board Member Serves: 20
Once elected all Board Members serve for an indefinite term.The address of the Board Members and Officers is in c/o The Dreyfus Corporation, 200 Park Avenue, NewYork, NewYork 10166.Additional information about the Board Members is available in the fund’s Statement of Additional Information which can be obtained from Dreyfus free of charge by calling this toll free number: 1-800-645-6561. For Wealth Management clients, please contact your account officer or call 1-888-281-7350.
The Funds 93
OFFICERS OF THE TRUST (Unaudited)
| CHRISTOPHER SHELDON, President since September 2006. |
As director of Investment Strategy for Mellon’s Private Wealth Management group since April 2003, Mr. Sheldon manages the analysis and development of investment and asset allocation strategies and oversees investment product research and, since June 2006, also oversees the alternative investment groups. Prior to assuming his current position, Mr. Sheldon was West Coast managing director of Mellon’s Private Wealth Management group from 2001-2003 and its regional manager from 1998-2001. He was previously a Vice President of the Trust. He is 43 years old has been employed by Mellon Bank since January 1995.
| MICHAEL A. ROSENBERG, Vice President and Secretary since |
| August 2005. |
Assistant General Counsel of BNY Mellon, and an officer of 77 investment companies (comprised of 174 portfolios) managed by the Manager. He is 48 years old and has been an employee of the Manager since October 1991.
| JAMES BITETTO, Vice President and Assistant Secretary |
| since August 2005. |
Senior Counsel of BNY Mellon and Secretary of the Manager, and an officer of 77 investment companies (comprised of 174 portfolios) managed by the Manager. He is 42 years old and has been an employee of the Manager since December 1996.
| JONI LACKS CHARATAN, Vice President and Assistant |
| Secretary since August 2005. |
Senior Counsel of BNY Mellon, and an officer of 77 investment companies (comprised of 174 portfolios) managed by the Manager. She is 52 years old and has been an employee of the Manager since October 1988.
| JOSEPH M. CHIOFFI, Vice President and Assistant Secretary |
| since August 2005. |
Senior Counsel of BNY Mellon, and an officer of 77 investment companies (comprised of 174 portfolios) managed by the Manager. He is 46 years old and has been an employee of the Manager since June 2000.
| JANETTE E. FARRAGHER, Vice President and Assistant |
| Secretary since August 2005. |
Assistant General Counsel of BNY Mellon, and an officer of 77 investment companies (comprised of 174 portfolios) managed by the Manager. She is 45 years old and has been an employee of the Manager since February 1984.
| JOHN B. HAMMALIAN, Vice President and Assistant |
| Secretary since August 2005. |
Managing Counsel of BNY Mellon, and an officer of 77 investment companies (comprised of 174 portfolios) managed by the Manager. He is 45 years old and has been an employee of the Manager since February 1991.
| ROBERT R. MULLERY, Vice President and Assistant Secretary |
| since August 2005. |
Managing Counsel of BNY Mellon, and an officer of 77 investment companies (comprised of 174 portfolios) managed by the Manager. He is 56 years old and has been an employee of the Manager since May 1986.
| JEFF PRUSNOFSKY, Vice President and Assistant Secretary |
| since August 2005. |
Managing Counsel of BNY Mellon, and an officer of 77 investment companies (comprised of 174 portfolios) managed by the Manager. He is 43 years old and has been an employee of the Manager since October 1990.
| JAMES WINDELS, Treasurer since November 2001. |
Director – Mutual Fund Accounting of the Manager, and an officer of 77 investment companies (comprised of 174 portfolios) managed by the Manager. He is 49 years old and has been an employee of the Manager since April 1985.
| RICHARD CASSARO, Assistant Treasurer since |
| September 2007. |
Senior Accounting Manager – Money Market and Municipal Bond Funds of the Manager, and an officer of 77 investment companies (comprised of 174 portfolios) managed by the Manager. He is 49 years old and has been an employee of the Manager since September 1982.
| GAVIN C. REILLY, Assistant Treasurer since December 2005. |
Tax Manager of the Investment Accounting and Support Department of the Manager, and an officer of 77 investment companies (comprised of 174 portfolios) managed by the Manager. He is 40 years old and has been an employee of the Manager since April 1991.
| ROBERT ROBOL, Assistant Treasurer since December 2002. |
Senior Accounting Manager – Fixed Income Funds of the Manager, and an officer of 77 investment companies (comprised of 174 portfolios) managed by the Manager. He is 44 years old and has been an employee of the Manager since October 1988.
| ROBERT SALVIOLO, Assistant Treasurer since May 2007. |
Senior Accounting Manager – Equity Funds of the Manager, and an officer of 77 investment companies (comprised of 174 portfolios) managed by the Manager. He is 41 years old and has been an employee of the Manager since June 1989.
| ROBERT SVAGNA, Assistant Treasurer since December 2002. |
Senior Accounting Manager – Equity Funds of the Manager, and an officer of 77 investment companies (comprised of 174 portfolios) managed by the Manager. He is 41 years old and has been an employee of the Manager since November 1990.
94
| JOSEPH W. CONNOLLY, Chief Compliance Officer since |
| October 2004. |
Chief Compliance Officer of the Manager and The Dreyfus Family of Funds (77 investment companies, comprised of 174 portfolios). From November 2001 through March 2004, Mr. Connolly was first Vice-President, Mutual Fund Servicing for Mellon Global Securities Services. In that capacity, Mr. Connolly was responsible for managing Mellon’s Custody, Fund Accounting and Fund Administration services to third-party mutual fund clients. He is 51 years old and has served in various capacities with the Manager since 1980, including manager of the firm’s Fund Accounting Department from 1997 through October 2001.
| WILLIAM GERMENIS, Anti-Money Laundering Compliance |
| Officer since September 2002. |
Vice President and Anti-Money Laundering Compliance Officer of the Distributor, and the Anti-Money Laundering Compliance Officer of 73 investment companies (comprised of 170 portfolios) managed by the Manager. He is 37 years old and has been an employee of the Distributor since October 1998.
The Funds 95
For More Information

| Ticker Symbols: | ||||||
| BNY Mellon National Intermediate Municipal Bond Fund | Class M: MPNIX | Investor: MINMX | Dreyfus Premier: MNMBX | |||
| BNY Mellon National Short-Term Municipal Bond Fund | Class M: MPSTX | Investor: MINSX | ||||
| BNY Mellon Pennsylvania Intermediate Municipal Bond Fund | Class M: MPPIX | Investor: MIPAX | ||||
| BNY Mellon Massachusetts Intermediate Municipal Bond Fund | Class M: MMBMX | Investor: MMBIX | Dreyfus Premier: MMBPX |
Telephone Wealth Management (WM) Clients, please contact your Account Officer or call 1-888-281-7350. Brokerage Clients of BNY Mellon Wealth Advisors (BNYMWA), please contact your financial representative or call 1-800-830-0549, Option 2. Individual Account holders, please call Dreyfus at 1-800-645-6561.
Mail WM Clients, write to your Account Officer, c/o The Bank of New York Mellon, One Mellon Bank Center, Pittsburgh, PA 15258
BNYMWA Brokerage Clients, write to your financial representative, P.O. Box 9012, Hicksville, NY 11802–9012
Individual Account Holders, write to: BNY Mellon Funds, P.O. Box 55268, Boston, MA 02205–8502
The fund files its complete schedule of portfolio holdings with the Securities and Exchange Commission (“SEC”) for the first and third quarters of each fiscal year on Form N-Q. The funds’ Forms N-Q are available on the SEC’s website at http://www.sec.gov and may be reviewed and copied at the SEC’s Public Reference Room in Washington, DC. Information on the operation of the Public Reference Room may be obtained by calling 1-800-SEC-0330.
Information regarding how the fund voted proxies relating to portfolio securities for the 12-month period ended June 30, 2008, is available on the SEC’s website at http://www.sec.gov and without charge, upon request, by calling 1-800-645-6561.
MFTAR0808-MB
©2008 MBSC Securities Corporation

DISCUSSION OF
FUND PERFORMANCE
For the period of September 1, 2007, through August 31, 2008, as provided by Sean P. Fitzgibbon, Portfolio Manager
Fund and Market Performance Overview
For the 12-month period ended August 31, 2008, BNY Mellon Large Cap Stock Fund’s Class M shares produced a total return of –9.95%, and Investor shares produced a total return of –10.26% .1 In comparison, the total return of the Standard & Poor’s 500 Composite Stock Price Index (“S&P 500 Index”), the fund’s benchmark, was –11.13% for the same period.2
Large cap stocks retreated over the reporting period when soaring energy prices,an economic downturn and a global credit crisis dampened investor sentiment.The fund produced slightly higher returns than its benchmark, primarily due to strong stock selections in the financials, information technology and energy sectors.
The Fund’s Investment Approach
The fund seeks capital appreciation.To pursue its goal, the fund normally invests at least 80% of its assets in stocks of large-cap companies. We choose stocks through a disciplined investment process that uses computer modeling techniques to identify and rank companies based on value, growth and other financial characteristics. Next, we use fundamental analysis to select the most attractive of the higher ranked securities, drawing on a variety of internal andWall Street research sources. We also attempt to manage risks by diversifying the fund’s investments across companies and industries, maintaining weightings and risk characteristics that generally are similar to those of the S&P 500 Index.
Security Selection Strategy Drove Fund Performance
Large-cap U.S. stocks generally produced disappointing results over the reporting period amid an onslaught of negative economic news.As housing values plummeted and unemployment rates climbed, mortgage delinquencies and foreclosures rose sharply, fueling ongoing turmoil in the mortgage market. Meanwhile, escalating commodity prices over much of the reporting period burdened consumers with soaring oil, gas and home heating expenditures and rising food costs. These factors caused consumers to cut back on spending in other, more discretionary areas. In addition, with banks increasingly reluctant to lend, many businesses reduced capital spending in anticipation of a more difficult business environment.
At the same time, a credit crisis that began in the sub-prime mortgage market continued to batter commercial banks, investment banks, insurers and mortgage agencies. A number of the world’s major financial institutions announced additional write-downs and write-offs over the reporting period, sparking steep declines in their stock prices. Most other market sectors also posted losses in this challenging environment.
The fund received strong contributions to relative performance from our stock selection strategy in the hard-hit financials sector. In the mortgage finance industry, the fund did not hold government-sponsored enterprise Freddie Mac, and we eliminated Fannie Mae from the portfolio before both companies encountered capital shortages that resulted in their takeover by the
The Funds 3
DISCUSSION OF FUND PERFORMANCE (continued)
federal government soon after the reporting period’s end. The fund also avoided declines in banking giant Washington Mutual, which was forced to raise dilutive capital as a result of their leverage to the troubled mortgage market.Among commercial banks, an overweighted position in PNC Financial Services Group fared well due to its strong capital position and relative lack of exposure to the asset write-downs that affected other large regional banks. The fund also avoided harder-hit members of the capital markets industry, including Merrill Lynch, Lehman Brothers and Bear Stearns.
The fund’s investments in the information technology sector bolstered the fund’s results. BlackBerry maker Research In Motion benefited from the proliferation and popularity of its products, including increased adoption of smartphones by retail customers. In the energy sector, which represented the S&P 500 Index’s top performing sector during the reporting period, fund holdings Chesapeake Energy and Hess Corporation were bolstered by surging oil and natural gas prices.
On the other hand, the health care sector detracted from the fund’s relative performance, due mainly to overweighted positions in pharmaceutical developers Merck
& Co. and Schering-Plough, which fared relatively poorly. In the industrials sector, the fund held no exposure to the road-and-rail industry, which benefited as shippers sought lower-cost transportation alternatives. Conversely, the fund held a small position in U.S.Airways
Group, which, despite higher-than-forecast revenues, fell sharply due to significant increases in the price of fuel.
Finding Opportunities in a Challenging Market
As of the reporting period’s end, the economic downturn has persisted and the credit crisis has intensified.Therefore, we have maintained the fund’s disciplined security selection strategy, which we believe is critical to weathering market downturns.We have found a number of what we believe are attractive opportunities in the information technology sector, where certain companies appear poised to maintain their earnings despite the slower business climate. On the other hand, we recently have found relatively few stocks meeting our criteria in the energy sector, primarily due to the expected effects of the recent pull-back in commodity prices. Although we have maintained a market-neutral allocation to the health care sector overall, we have focused primarily on innovative companies in the pharmaceutical and biotechnology industries that have gained market share and sell distinctive products.
September 15, 2008
| 1 | Total return includes reinvestment of dividends and any capital gains paid. Past performance is no guarantee of future results. Share price and investment return fluctuate such that upon redemption, fund shares may be worth more or less than their original cost. |
| 2 | SOURCE: LIPPER INC. — Reflects the monthly reinvestment of dividends and, where applicable, capital gain distributions.The Standard & Poor’s 500 Composite Stock Price Index is a widely accepted, unmanaged index of U.S. stock market performance. Index return does not reflect fees and expenses associated with operating a mutual fund. |
4
FUND PERFORMANCE
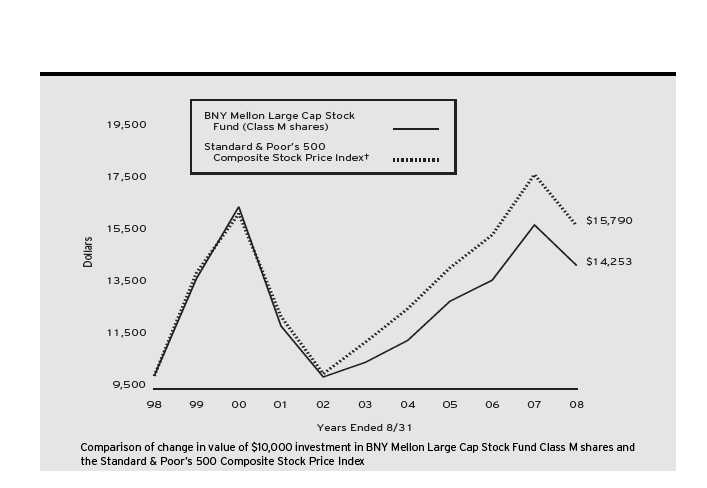
| Average Annual Total Returns as of 8/31/08 | ||||||||||
| Inception | From | |||||||||
| Date | 1 Year | 5 Years | 10 Years | Inception | ||||||
| Class M shares | (9.95)% | 6.24% | 3.61% | |||||||
| Investor shares | 7/11/01 | (10.26)% | 5.98% | — | 1.61% | |||||
† Source: Lipper Inc.
Past performance is not predictive of future performance.The fund’s performance shown in the graph and table does not reflect the deduction of taxes that a shareholder would pay on fund distributions or the redemption of fund shares.
The above graph compares a $10,000 investment made in Class M shares of BNY Mellon Large Cap Stock Fund on 8/31/98 to a $10,000 investment made in the Standard & Poor’s 500 Composite Stock Price Index (the “Index”) on that date.All dividends and capital gain distributions are reinvested.
Effective March 31, 2008, Mellon Funds Trust changed its name to BNY Mellon Funds Trust.
Before the fund commenced operations, substantially all of the assets of a predecessor common trust fund (CTF) that, in all material respects, had the same investment objective, policies, guidelines and restrictions as the fund (and those of another CTF) were transferred to the fund. Please note that the performance of the fund’s Class M shares represents the performance of the predecessor CTF through October 1, 2000, adjusted to reflect the fund’s fees and expenses, by subtracting from the actual performance of the CTF the expenses of the fund’s Class M shares as they were estimated prior to the conversion of the CTF into the fund, and the performance of the fund’s Class M shares thereafter.The predecessor CTF was not registered under the Investment Company Act of 1940, as amended, and therefore was not subject to certain investment restrictions that might have adversely affected performance. In addition, the expenses of the fund’s Class M shares may be higher than those estimated prior to the conversion of the CTF into the fund, which would lower the performance shown in the above line graph.
Effective July 11, 2001, existing fund shares were designated as Class M shares and the fund began offering a second class of shares designated as Investor shares, which are subject to a Shareholder Services Plan. Performance for Investor shares will vary from the performance of Class M shares shown above because of the differences in charges and expenses.
The fund’s performance shown in the line graph takes into account all applicable fees and expenses for Class M shares only.The Index is a widely accepted, unmanaged index of U.S. stock market performance. Unlike a mutual fund, the Index is not subject to charges, fees and other expenses. Investors cannot invest directly in any index. Further information relating to fund performance, including expense reimbursements, if applicable, is contained in the Financial Highlights section of the prospectus and elsewhere in this report.
The Funds 5
DISCUSSION OF FUND PERFORMANCE (continued)

DISCUSSION OF
FUND PERFORMANCE
For the period of September 1, 2007, through August 31, 2008, as provided by Brian C. Ferguson, Portfolio Manager
Fund and Market Performance Overview
For the 12-month period ended August 31, 2008, BNY Mellon Income Stock Fund’s Class M shares produced a total return of –13.79%, and Investor shares produced a total return of –14.03% .1 In comparison, the Russell 1000 Value Index (the “Index”), the fund’s benchmark, provided a total return of –14.66% .2
Equity markets declined during the reporting period as an economic slowdown and credit crisis depressed investor sentiment. In this challenging environment, the fund outperformed its benchmark, primarily due to the success of our “bottom-up” stock selection strategy in the consumer staples, information technology and telecommunications services sectors.
The Fund’s Investment Approach
The fund seeks total return consisting of capital appreciation and income.To pursue its goal, the fund normally invests at least 80% of its assets in stocks.The fund seeks to focus on dividend-paying stocks and other investment techniques that produce income. We choose stocks through a disciplined investment process that combines quantitative modeling techniques, fundamental analysis and risk management.While we attempt to manage risks by diversifying broadly across companies and industries, the fund may at times overweight certain sectors in an attempt to earn higher yields. The fund may also use derivatives as a substitute for taking a position in an underlying asset, to increase returns or income, or as part of a hedging strategy.
Economic Slump Weighed on Investor Sentiment
A deteriorating economy and an intensifying credit crunch fueled a precipitous drop in U.S. stock prices during the reporting period. Declining housing values, soaring energy and food costs, rising unemployment and stifled consumer spending weighed heavily on investor sentiment.Although
government efforts to stimulate the economy provided modest relief during the reporting period, uncertainty regarding the domestic economic outlook, paired with a slowdown in developed international economies, contributed to ongoing risk aversion among investors.
Strong Stock Selections Aided Relative Results
The fund’s absolute performance suffered along with the overall market; however, our bottom-up approach led to favorable returns from the purchases and sales of individual stocks, enabling the fund to produce higher relative returns than its benchmark. Overweighted exposure and solid stock selections in the consumer staples sector provided the reporting period’s greatest positive contribution to fund performance.Tobacco giant Altria Group’s spin-off of its international arm, Philip Morris International, produced a tighter focus on the company’s operations and cost containment, boosting the value of both firms. Information technology company Qualcomm also fared well when the wireless data supplier entered into an advantageous partnership with handset maker Nokia. Qualcomm was sold during the reporting period as it reached its target price. In addition, despite lagging performance by AT&T, the fund’s telecommunication services sector was bolstered by its lack of exposure to benchmark components Qwest Communications International and Sprint Nextel, both of which suffered from shrinking subscriber volumes. Consumer discretionary leader Wal-Mart Stores,which benefited from improved sales trends as cash-strapped consumers flocked to cheaper goods, also helped support the fund’s relative performance.
Other notable winners during the reporting period included Devon Energy and EOG Resources, which capitalized on strong supply-and-demand dynamics in the natural gas market. EOG was sold during the reporting period. Occidental Petroleum gained value amid rising demand and climbing commodity prices, while drug developer Abbott Laboratories benefited from a larger share of the coronary stent market.
6
On the other hand, modestly overweighted exposure and weak selections of health care stocks represented the greatest detractor from the fund’s performance. Merck & Co. suffered a drop in its share price when safety concerns arose regarding a cholesterol-lowering drug. Lack of exposure to stronger-performing pharmaceutical company Johnson & Johnson also hampered the fund’s results. Similarly, lack of exposure to railroad companies impeded the fund’s advance in the industrials sector, where strong supply-and-demand dynamics and positive pricing power drove rail stocks higher. Underweighted exposure to the materials sector also undermined the fund’s relative performance. Finally, the fund suffered disappointments among hard-hit financial institutions Wachovia, Bank of America and American International Group.
Reducing the Fund’s Multinational Exposure
In our estimation, government stimulus packages have helped improve market liquidity, and signs of economic stabilization have been reported. However, while the U.S. economy has shown small steps toward improvement, international economies have begun to slow. Therefore, we have reduced the fund’s exposure to multinational corporations, instead focusing more
intently on companies that earn most of their revenues domestically. We also have selectively established new positions in the financials, consumer discretionary and consumer staples sectors based on what we believe are favorable valuations and evidence of future business momentum. Conversely, we have begun to favor integrated oil companies, and we trimmed the fund’s exposure to natural gas exploration and production suppliers due to lower commodity prices and supply concerns.We also have reduced the fund’s information technology weighting, as many firms in this sector have substantial overseas revenue streams. We have continued to monitor companies in other industry groups, and we may adjust our strategies should we detect evidence of fundamental change.
September 15, 2008
| 1 | Total return includes reinvestment of dividends and any capital gains paid. Past performance is no guarantee of future results. Share price and investment return fluctuate such that upon redemption, fund shares may be worth more or less than their original cost. |
| 2 | SOURCE: LIPPER INC. — Reflects the reinvestment of net dividends and, where applicable, capital gain distributions.The Russell 1000 Value Index is an unmanaged index which measures the performance of those Russell 1000 companies with lower price-to-book ratios and lower forecasted growth values. Index return does not reflect fees and expenses associated with operating a mutual fund. |
| The Funds |
| 7 |
FUND PERFORMANCE

| Average Annual Total Returns as of 8/31/08 | ||||||||||
| Inception | From | |||||||||
| Date | 1 Year | 5 Years | 10 Years | Inception | ||||||
| Class M shares | (13.79)% | 7.22% | 3.79% | |||||||
| Investor shares | 7/11/01 | (14.03)% | 6.92% | — | 2.92% | |||||
† Source: Lipper Inc.
Past performance is not predictive of future performance.The fund’s performance shown in the graph and table does not reflect the deduction of taxes that a shareholder would pay on fund distributions or the redemption of fund shares.
The above graph compares a $10,000 investment made in Class M shares of BNY Mellon Income Stock Fund on 8/31/98 to a $10,000 investment made in the Russell 1000 Value Index (the “Index”) on that date.All dividends and capital gain distributions are reinvested.
Effective March 31, 2008, Mellon Funds Trust changed its name to BNY Mellon Funds Trust.
Before the fund commenced operations, substantially all of the assets of a predecessor common trust fund (CTF) that, in all material respects, had the same investment objective, policies, guidelines and restrictions as the fund (and those of another CTF) were transferred to the fund. Please note that the performance of the fund’s Class M shares represents the performance of the predecessor CTF through October 1, 2000, adjusted to reflect the fund’s fees and expenses, by subtracting from the actual performance of the CTF the expenses of the fund’s Class M shares as they were estimated prior to the conversion of the CTF into the fund, and the performance of the fund’s Class M shares thereafter.The predecessor CTF was not registered under the Investment Company Act of 1940, as amended, and therefore was not subject to certain investment restrictions that might have adversely affected performance. In addition, the expenses of the fund’s Class M shares may be higher than those estimated prior to the conversion of the CTF into the fund, which would lower the performance shown in the above line graph.
Effective July 11, 2001, existing fund shares were designated as Class M shares and the fund began offering a second class of shares designated as Investor shares, which are subject to a Shareholder Services Plan. Performance for Investor shares will vary from the performance of Class M shares shown above because of the differences in charges and expenses.
The fund’s performance shown in the line graph takes into account all applicable fees and expenses for Class M shares only.The Index uses company price-to-book ratios and long-term growth rates to calculate a composite ranking, which is used to determine if a stock is “growth” or “value.” Unlike a mutual fund, the Index is not subject to charges, fees and other expenses. Investors cannot invest directly in any index. Further information relating to fund performance, including expense reimbursements, if applicable, is contained in the Financial Highlights section of the prospectus and elsewhere in this report.
8

DISCUSSION OF
FUND PERFORMANCE
For the period of September 1, 2007, through August 31, 2008, as provided by James C.Wadsworth, Portfolio Manager
Fund and Market Performance Overview
For the 12-month period ended August 31, 2008, BNY Mellon Mid Cap Stock Fund’s Class M shares produced a total return of –5.67%, Investor shares returned –5.94% and Dreyfus Premier shares returned –6.63% .1 In comparison, the Standard & Poor’s MidCap 400 Index (“S&P 400 Index”), the fund’s benchmark, produced a total return of – 4.22%, and the average return of all funds in the Lipper Midcap Core category was –7.93% for the same period.2
Although midcap stocks declined during the reporting period due to a prolonged economic slump and the persistent credit crisis, they generally fell less severely than their small cap and large cap counterparts. The fund produced lower returns than its benchmark but higher returns than its Lipper category average, as favorable results in the health care, energy, materials, consumer discretionary and technology sectors were balanced by weaker returns in financials, consumer staples and industrials.
The Fund’s Investment Approach
The fund seeks capital appreciation by normally investing at least 80% of its assets in stocks of domestic companies with market capitalizations generally in the range of companies included in the S&P 400 Index at the time of purchase. The fund invests in growth and value stocks, which are chosen through a disciplined investment process that combines computer modeling techniques, fundamental analysis and risk management. Based on fundamental analysis, the investment adviser generally selects the most attractive securities, drawing on a variety of sources, including internal as well as Wall Street research, and company management. Finally, we use portfolio construction techniques to manage sector and industry risks. Our goal is to keep those risks at levels that are similar to those of the S&P 400 Index.
Stocks Struggled in a Weaker Economy
U.S. stocks generally produced disappointing results over the reporting period amid an onslaught of negative economic news.As housing values plummeted and unemployment rates climbed, mortgage delinquencies and foreclosures rose sharply, fueling ongoing turmoil in the mortgage market. Meanwhile, escalating commodity prices over much of the reporting period burdened consumers with soaring oil, gas and home heating expenditures and rising food costs. These factors caused consumers to cut back on spending in other, more discretionary areas. In addition, with banks increasingly reluctant to lend, many businesses reduced capital spending in anticipation of a more difficult business environment.
At the same time, a credit crisis that began in the sub-prime mortgage market continued to batter commercial banks, investment banks, bond insurers and mortgage agencies. A number of the world’s major financial institutions announced massive write-downs and write-offs over the reporting period, sparking steep declines in their stock prices. Most other midcap market sectors also posted losses in this challenging economic environment.
Stock Selection Strategies Produced Mixed Results
The fund received substantially positive contributions to performance from its holdings in the energy sector, which also was one of the stronger sectors of the benchmark over the reporting period. We focused primarily on energy companies with growing production, including Consol Energy and Southwestern Energy, both which were sold during the reporting period, and PetroHawk Energy. In the health care sector, biotechnology developer MGI Pharma, which was sold during the reporting period, was acquired by another company at a premium to its stock price. In the materials sector, iron ore producer Cleveland-Cliffs benefited from robust global demand for steel.
The Funds 9
DISCUSSION OF FUND PERFORMANCE (continued)
In the consumer discretionary sector, apparel retailer Urban Outfitters, which was also sold during the reporting period, reported impressive same-store sales trends in a challenging business environment.Among information technology companies, Alliance Data Systems gained value due to record credit card processing transactions.
However, disappointments in other sectors offset these positive contributions to the fund’s performance. In the financials sector, our efforts to own stocks that were expected to have less exposure to the credit crisis were unsuccessful. Assured Guaranty initially avoided ratings downgrades, but its stock was hit hard when a major rating agency indicated that the company was under review for a possible downgrade. Real estate investment trust Felcor Lodging Trust declined despite upgrades to many of its properties. Assured Guaranty and Felcor Lodging Trust were sold during the reporting period. IntercontinentalExchange, an energy and commodities trading firm, was hurt by uncertainty related to a Congressional investigation into oil futures speculation. Regional bank Zions Bancorporation fell along with other banking stocks despite sound business fundamentals.
Although consumer staples stocks historically have tended to hold up well during economic downturns, pork processor Smithfield Foods, which was sold during the reporting period, was hurt by rising feed costs, and Energizer Holdings, which was also sold, declined due to stiff competition in its battery business.The fund did not own household products provider Church & Dwight, which fared well for the benchmark. In the aerospace and defense industry within the industrials sector, positions in Textron and BE Aerospace declined due to concerns
regarding the sustainability of their orders. BE Aerospace was sold during the reporting period.
Maintaining a Cautious Investment Posture
As of the reporting period’s end, the U.S. economy has remained weak and the credit crisis has not abated. We continue to focus on executing our disciplined investment process which is designed to identify what we believe are attractive stocks and to create a portfolio that seeks risk exposures similar to those of the midcap S&P 400 benchmark. Stock market volatility is expected to continue. In keeping with our sector neutral philosophy and considering the global economic slowdown, the fund’s modest overweight in energy has been reduced. In the financial sector, turmoil has led to the demise of large cap insurance and banking institutions.This situation should provide increased business for other insurance companies and for companies that specialize in providing advice and fairness opinions for mergers and acquisitions.
September 15, 2008
| 1 | Total return includes reinvestment of dividends and any capital gains paid. Past performance is no guarantee of future results. Share price and investment return fluctuate such that upon redemption, fund shares may be worth more or less than their original cost. |
| Part of the fund’s recent performance is attributable to positive returns from its initial public offering (IPO) investments. There can be no guarantee that IPOs will have or continue to have a positive effect on fund performance. | |
| 2 | SOURCE: LIPPER INC. — Reflects reinvestment of dividends and, where applicable, capital gain distributions.The Standard & Poor’s MidCap 400 Index is a widely accepted, unmanaged total return index measuring the performance of the midsize company segment of the U.S. stock market. Index return does not reflect the fees and expenses associated with operating a mutual fund. |
10
| FUND PERFORMANCE |
| Average Annual Total Returns as of 8/31/08 | ||||||||||
| Inception | From | |||||||||
| Date | 1 Year | 5 Years | 10 Years | Inception | ||||||
| Class M shares | (5.67)% | 11.44% | 9.13% | |||||||
| Investor shares | 7/11/01 | (5.94)% | 11.15% | — | 7.34% | |||||
| Dreyfus Premier shares | ||||||||||
| with applicable redemption †† | 9/6/02 | (9.71)% | 10.09% | — | 10.49% | |||||
| without redemption | 9/6/02 | (6.63)% | 10.35% | — | 10.59% | |||||
† Source: Lipper Inc.
Past performance is not predictive of future performance.The fund’s performance shown in the graph and table does not reflect the deduction of taxes that a shareholder would pay on fund distributions or the redemption of fund shares.
Part of the fund’s recent performance is attributable to positive returns from its initial public offering (IPO) investments.There can be no guarantee that IPOs will have or continue to have a positive effect on fund performance.
The above graph compares a $10,000 investment made in Class M shares of BNY Mellon Mid Cap Stock Fund on 8/31/98 to a $10,000 investment made in the Standard & Poor’s MidCap 400 Index (the “Index”) on that date.All dividends and capital gain distributions are reinvested.
Effective March 31, 2008, Mellon Funds Trust changed its name to BNY Mellon Funds Trust.
Before the fund commenced operations, substantially all of the assets of a predecessor common trust fund (CTF) that, in all material respects, had the same investment objective, policies, guidelines and restrictions as the fund were transferred to the fund. Please note that the performance of the fund’s Class M shares represents the performance of the predecessor CTF through October 1, 2000, adjusted to reflect the fund’s fees and expenses, by subtracting from the actual performance of the CTF the expenses of the fund’s Class M shares as they were estimated prior to the conversion of the CTF into the fund, and the performance of the fund’s Class M shares thereafter.The predecessor CTF was not registered under the Investment Company Act of 1940, as amended, and therefore was not subject to certain investment restrictions that might have adversely affected performance. In addition, the expenses of the fund’s Class M shares may be higher than those estimated prior to the conversion of the CTF into the fund, which would lower the performance shown in the above line graph.
Effective July 11, 2001, existing fund shares were designated as Class M shares and the fund began offering a second class of shares designated as Investor shares, which are subject to a Shareholder Services Plan. Performance for Investor shares will vary from the performance of Class M shares shown above because of the differences in charges and expenses.
The fund’s performance shown in the line graph takes into account all applicable fees and expenses for Class M shares only.The Index is a widely accepted, unmanaged total return index measuring the performance of the midsize company segment of the U.S. stock market. Unlike a mutual fund, the Index is not subject to charges, fees and other expenses. Investors cannot invest directly in any index. Further information relating to fund performance, including expense reimbursements, if applicable, is contained in the Financial Highlights section of the prospectus and elsewhere in this report.
The maximum contingent deferred sales charge for Dreyfus Premier shares is 4%.After six years Dreyfus Premier shares convert to Investor shares.
The Funds 11
DISCUSSION OF FUND PERFORMANCE (continued)

DISCUSSION OF
FUND PERFORMANCE
For the period of September 1, 2007, through August 31, 2008, as provided by Dwight E. Cowden, Portfolio Manager
Fund and Market Performance Overview
For the 12-month period ended August 31, 2008, BNY Mellon Small Cap Stock Fund’s Class M shares produced a total return of –9.07%, and Investor shares produced a total return of –9.36% .1 In comparison, the fund’s benchmark, the Standard & Poor’s SmallCap 600 Index (the “Index”), produced a total return of –6.20% for the same period.2
Small cap stocks retreated over the reporting period as rising energy prices, an economic downturn and a global credit crisis dampened investor sentiment. The fund produced lower returns than its benchmark, primarily due to weak stock selections in the health care and financials sectors.
The Fund’s Investment Approach
The fund seeks capital appreciation. To pursue its goal, the fund normally invests at least 80% of its assets in stocks of small capitalization companies whose market capitalizations generally are in the range of companies included in the Index at the time of purchase.We choose growth and value stocks using a disciplined process that combines computer modeling, fundamental analysis and risk management. We use a computer model to rank stocks within an industry or sector based on valuation, earnings growth and the company’s financial profile.We examine the fundamentals of the higher-ranked securities, and we select those we believe to be the most attractive. We use portfolio construction techniques to manage sector and industry risks, and we attempt to keep those risks at levels that are similar to those of the Index.
Security Selection Strategy Produced Mixed Results
U.S. small-cap stocks produced disappointing results during the reporting period due to an onslaught of negative economic news. Housing values fell sharply while mortgage defaults, delinquencies and foreclosures intensified,
and soaring food and fuel prices put pressure on cash-strapped consumers. Meanwhile, a credit crisis sent ripples throughout the U.S. and global financial markets, producing massive losses among major financial institutions.
Investors initially responded to these developments by shifting away from small-cap stocks toward those of larger companies. However, by the end of the reporting period, small-cap stocks generally had produced better results than their large-cap counterparts, as many of the harder-hit financial institutions were large-cap companies. Nonetheless, smaller consumer-related companies declined sharply as demand waned, while smaller financial stocks also suffered in the credit crisis. Conversely, the small-cap market generally achieved strong absolute returns in the energy and utilities sectors as oil and natural gas prices moved higher.
The fund received strong contributions to relative performance from our stock selection strategy in the consumer staples sector, where Chiquita Brands International benefited from strong pricing for bananas. Darling International enjoyed strong demand for their meat-rendered products, and Boston Beer saw improved sales volumes.The fund’s relative returns in the materials sector benefited from an overweighted position early in the reporting period and reduced exposure in the second half as global growth worries began to rise. Strong stock selection in the metals industry included Steel Dynamics and Cleveland Cliffs, which were aided by robust overseas growth. In addition, the fund successfully avoided the full brunt of declines in industries with higher energy-related input costs, including chemicals and packaging companies.
Some of the fund’s greater disappointments during the reporting period stemmed from adverse stock selections in the health care sector. Inventiv Health declined due to slower demand for their pharmaceutical sales and marketing services. Disease management company Healthways encountered difficulties with contract negotiations as customers grew more price sensitive. Contract research organization Pharma Net Development struggled when costs and contract cancellations dampened financial results.
12
Although the fund generally benefited from underweighted exposure to the financials sector and a lack of holdings in sub-prime related companies, these favorable factors were more than offset by weak stock selections, particularly in the real estate investment trust (REIT) and insurance industries. Hotel REIT Felcor Lodging Trust declined amid slower consumer spending despite valuation and yield support. Insurance broker National Financial Partners lost value when investors became concerned that its acquisition-oriented business model may be broken.
Maintaining Caution, but Open to New Opportunities
We expect market volatility to persist over the near term in the weak U.S. and global economies. Accordingly, we have maintained a generally neutral sector allocation strategy, with modestly underweighted exposure to the energy and materials sectors, where commodity prices have moderated as the global economy has slowed. We have increased the fund’s holdings of financials stocks to a market-neutral weighting, with an emphasis on higher-quality com-
panies that appear poised to benefit in the early stages of the economic cycle.We also have found opportunities among consumer-oriented companies that appear to be oversold and could be the next bull market leaders. In addition, we have maintained an emphasis on growth companies at the higher end of the small-cap spectrum, as valuations have declined to what we believe are more attractive levels and consistent earnings growth is harder to find in a sluggish economy. Finally, we have continued to focus on several long-term, secular investment themes, including healthy living, consolidating industries and Internet growth beneficiaries.
September 15, 2008
| 1 | Total return includes reinvestment of dividends and any capital gains paid. Past performance is no guarantee of future results. Share price and investment return fluctuate such that upon redemption, fund shares may be worth more or less than their original cost. |
| 2 | SOURCE: LIPPER INC. — Reflects the reinvestment of dividends and, where applicable, capital gain distributions.The Standard & Poor’s SmallCap 600 Index is a broad-based index and a widely accepted, unmanaged index of overall small-cap stock market performance.The index does not take into account fees and expenses to which the fund is subject. |
The Funds 13
FUND PERFORMANCE

| Average Annual Total Returns as of 8/31/08 | ||||||||||
| Inception | From | |||||||||
| Date | 1 Year | 5 Years | 10 Years | Inception | ||||||
| Class M shares | (9.07)% | 7.49% | 9.22% | |||||||
| Investor shares | 7/11/01 | (9.36)% | 7.22% | — | 6.34% | |||||
† Source: Lipper Inc.
Past performance is not predictive of future performance.The fund’s performance shown in the graph and table does not reflect the deduction of taxes that a shareholder would pay on fund distributions or the redemption of fund shares.
The above graph compares a $10,000 investment made in Class M shares of BNY Mellon Small Cap Stock Fund on 8/31/98 to a $10,000 investment made in the Standard & Poor’s SmallCap 600 Index (the “Index”) on that date.All dividends and capital gain distributions are reinvested.
Effective March 31, 2008, Mellon Funds Trust changed its name to BNY Mellon Funds Trust.
Before the fund commenced operations, substantially all of the assets of a predecessor common trust fund (CTF) that, in all material respects, had the same investment objective, policies, guidelines and restrictions as the fund were transferred to the fund. Please note that the performance of the fund’s Class M shares represents the performance of the predecessor CTF through October 1, 2000, adjusted to reflect the fund’s fees and expenses, by subtracting from the actual performance of the CTF the expenses of the fund’s Class M shares as they were estimated prior to the conversion of the CTF into the fund, and the performance of the fund’s Class M shares thereafter.The predecessor CTF was not registered under the Investment Company Act of 1940, as amended, and therefore was not subject to certain investment restrictions that might have adversely affected performance. In addition, the expenses of the fund’s Class M shares may be higher than those estimated prior to the conversion of the CTF into the fund, which would lower the performance shown in the above line graph.
Effective July 11, 2001, existing fund shares were designated as Class M shares and the fund began offering a second class of shares designated as Investor shares, which are subject to a Shareholder Services Plan. Performance for Investor shares will vary from the performance of Class M shares shown above because of the differences in charges and expenses.
The fund’s performance shown in the line graph takes into account all applicable fees and expenses for Class M shares only.The Index is a widely accepted, unmanaged index of overall small-cap stock market performance. Unlike a mutual fund, the Index is not subject to charges, fees and other expenses. Investors cannot invest directly in any index. Further information relating to fund performance, including expense reimbursements, if applicable, is contained in the Financial Highlights section of the prospectus and elsewhere in this report.
14

DISCUSSION OF
FUND PERFORMANCE
For the period of September 1, 2007, through August 31, 2008, as provided by Sean P. Fitzgibbon and Jeffrey D. McGrew, Portfolio Managers
Fund and Market Performance Overview
For the 12-month period ended August 31, 2008, BNY Mellon U.S. Core Equity 130/30 Fund’s Class M shares produced a total return of –9.89%, and Investor shares produced a total return of –10.06% .1 In comparison, the total return of the Standard & Poor’s 500 Composite Stock Price Index (“S&P 500 Index”), the fund’s benchmark, was –11.13% for the same period.2
Large-cap stocks retreated over the reporting period when soaring energy prices,an economic downturn and a global credit crisis dampened investor sentiment.The fund produced slightly higher returns than its benchmark, primarily due to strong stock selections in the financials, information technology and energy sectors.
The Fund’s Investment Approach
The fund seeks capital appreciation, normally investing at least 80% of its assets in stocks of large-cap compa-nies.We choose stocks through a disciplined investment process that uses computer modeling techniques to identify and rank companies based on value, growth and other financial characteristics. Next, based on fundamental analysis, the portfolio managers generally buy “long” the most attractive of the higher ranked securities and sell “short” those stocks identified by the computer model and fundamental analysis as being likely to underperform. Normally, up to 130% of the fund’s assets will be in long positions, and approximately 30% of the fund’s assets will be in short positions. However, the fund’s short positions may range in value from approximately 25% to 35% of the fund’s assets.
Stocks Declined Amid Heightened Volatility
Stocks generally produced disappointing results over the reporting period amid an onslaught of negative economic news. As housing values plummeted and unemployment rates climbed, mortgage foreclosures rose sharply. Meanwhile, escalating commodity prices over much of the reporting period burdened consumers with soaring food and energy costs. In addition, businesses reduced capital spending in anticipation of a more difficult business environment.
Meanwhile, a credit crisis continued to batter many financial institutions, sparking steep declines in their stock prices. Most other market sectors also posted losses in this challenging environment.
Security Selection Strategy Drove Fund Performance
The fund received strong contributions to relative performance from the information technology sector. Successful long positions included Amphenol, a producer of electrical and fiber optic connectors and cable. BlackBerry maker Research In Motion benefited from increased adoption of smartphones by retail customers. On the short side, opportunistic positions in a handful of struggling communications equipment makers benefited the fund’s performance.
In the consumer discretionary sector, overweighted long positions in retailers Ross Stores and TJX prospered as budget-conscious consumers increasingly turned to off-price stores, which received an ample supply of excess inventory from higher-end retailers. In the telecommunications services sector, the fund began the reporting period with a short position in wireless operator Sprint/Nextel, which dropped sharply. We subsequently covered the short position and established
The Funds 15
DISCUSSION OF FUND PERFORMANCE (continued)
a long position in the stock, which gained value as a new management team appeared poised to stabilize the company’s operations. In the energy sector, long holdings Chesapeake Energy and Hess Corporation were bolstered by surging oil and natural gas prices.
As for the hard-hit financials sector, the fund successfully avoided Freddie Mac, and we eliminated Fannie Mae before both companies suffered capital shortages that resulted in their takeover by the federal government soon after the reporting period’s end.The fund also held no shares of Washington Mutual, which was overlever-aged to the mortgage market.Although the fund held no exposure early in the reporting period to Fifth Third Bancorp due to its need for capital, we later established a long position in the security, which fared well after a capital infusion and a more realistic credit outlook drove its stock price higher. An underweighted position in Citigroup and overweighted exposure to JPMorgan Chase also supported the fund’s returns. Finally, the fund avoided harder-hit capital markets firms, including Lehman Brothers and Bear Stearns.
On the other hand, the materials sector detracted from the fund’s relative performance, due mainly to a lack of long exposure to Monsanto and weakness in copper mining company Freeport McMoRan as copper prices retreated from their highs. In addition, Allegheny Technologies struggled due to lower prices for finished steel products.Among consumer staples stocks, detractors included an underweighted, long position in Procter &
Gamble. The fund failed to hold brewery Anheuser-Busch, which was the subject of a take-over offer.
Finding Opportunities in a Challenging Market
As of the reporting period’s end, the economic downturn has persisted and the credit crisis has intensified. Therefore, we have maintained the fund’s disciplined security selection strategy on the long side, which we believe is critical to weathering market downturns. We have found what we believe are a number of attractive opportunities in the health care and consumer discretionary sectors, but fewer in the energy, materials and financials sectors.Among short positions, the fund ended the reporting period with overweighted exposure to the consumer discretionary, health care and consumer staples sectors, but an underweighted position in financials stocks, which have proven expensive to short amid heightened selling pressure.
September 15, 2008
| 1 | Total return includes reinvestment of dividends and any capital gains paid. Past performance is no guarantee of future results. Share price and investment return fluctuate such that upon redemption, fund shares may be worth more or less than their original cost. Return figures provided reflect the absorption of certain fund expenses by BNY Mellon Fund Advisers pursuant to an agreement in effect through August 31, 2008, at which time it was terminated. Had these expenses not been absorbed, the fund’s returns would have been lower. |
| 2 | SOURCE: LIPPER INC. — Reflects the monthly reinvestment of dividends and, where applicable, capital gain distributions.The Standard & Poor’s 500 Composite Stock Price Index is a widely accepted, unmanaged index of U.S. stock market performance. Index return does not reflect fees and expenses associated with operating a mutual fund. |
16
FUND PERFORMANCE
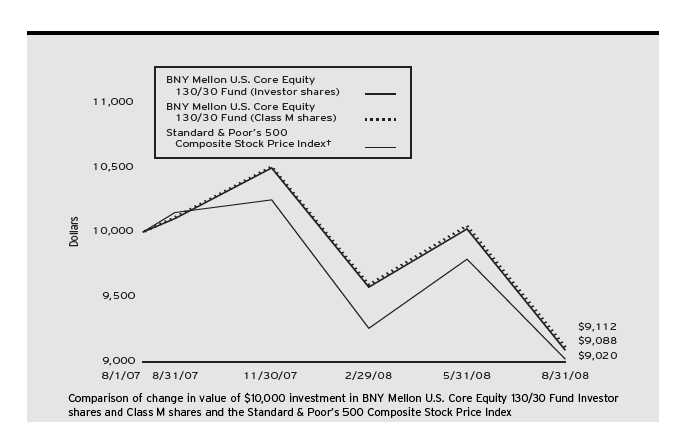
| Average Annual Total Returns as of 8/31/08 | ||||||
| Inception | From | |||||
| Date | 1 Year | Inception | ||||
| Investor shares | 8/1/07 | (10.06)% | (8.47)% | |||
| Class M shares | 8/1/07 | (9.89)% | (8.25)% |
† Source: Lipper Inc.
Past performance is not predictive of future performance.The fund’s performance shown in the graph and table does not reflect the deduction of taxes that a shareholder would pay on fund distributions or the redemption of fund shares.
The above graph compares a $10,000 investment made in Class M shares and Investor shares of BNY Mellon U.S. Core Equity 130/30 Fund on 8/01/07 (inception date) to a $10,000 investment made in the Standard & Poor’s 500 Composite Stock Price Index (the “Index”) on that date.All dividends and capital gain distributions are reinvested.
Effective March 31, 2008, Mellon Funds Trust changed its name to BNY Mellon Funds Trust.
The fund’s performance shown in the line graph takes into account all applicable fees and expenses for all share classes.The Index is a widely accepted, unmanaged index of U.S. stock market performance. Unlike a mutual fund, the Index is not subject to charges, fees and other expenses. Investors cannot invest directly in any index. Further information relating to fund performance, including expense reimbursements, if applicable, is contained in the Financial Highlights section of the prospectus and elsewhere in this report.
The Funds 17
DISCUSSION OF FUND PERFORMANCE (continued)

DISCUSSION OF
FUND PERFORMANCE
For the period of September 1, 2007, through August 31, 2008, as provided by D. Kirk Henry and William S. Patzer, Portfolio Managers
Fund and Market Performance Overview
For the 12-month period ended August 31, 2008, BNY Mellon International Fund’s Class M shares produced a total return of –18.61%, and Investor shares produced a total return of –18.87% .1 In comparison, the fund’s benchmark, the Morgan Stanley Capital International Europe,Australasia, Far East Index (“MSCI EAFE Index” or the “Index”), produced a total return of –14.41% for the same period.2
International equities produced disappointing results in a volatile market environment during the reporting period.The fund’s returns lagged its benchmark, largely due to an underweighted position in materials stocks and disappointing stock selections within the consumer discretionary sector.
The Fund’s Investment Approach
The fund seeks long-term capital growth.To pursue this goal, the fund normally invests at least 65% of its total assets in equity securities of foreign issuers.
Since June 30, 2005, the fund generally invests most of its cash inflows (purchases of fund shares and reinvested distributions) in accordance with a core investment style. The fund’s portfolio as of June 30, 2005, will continue to be managed in accordance with the value-oriented investment style. Pursuant to the core investment style, under normal circumstances, at least 80% of the fund’s cash inflows allocated to this style are invested in equity securities of companies located in the foreign countries represented in the MSCI EAFE Index and Canada.
The allocation of cash inflows and outflows will be at the discretion of the investment adviser depending on the circumstances; however, under normal circumstances, generally between 90% and 100% of cash inflows will be allocated to the core investment style.We believe that by implementing a core investment style with respect to such assets, the fund may take advantage of investment opportunities in international markets that may not fall within the value-oriented investment style previously employed for the fund’s entire portfolio.
The fund will continue to invest in stocks that appear to be undervalued (as measured by their price/earnings ratios), but stocks purchased pursuant to the core investment style may have value and/or growth characteristics. The core investment style portfolio manager employs a “bottom-up” investment approach, which emphasizes individual stock selection.The core investment style stock selection process is designed to produce a diversified portfolio that,relative to the MSCI EAFE Index, has a below-average price/earnings ratio and an above-average earnings growth trend.
The fund’s investment approach for the portion of the fund using the value-oriented investment style is research-driven and risk-averse. When selecting stocks, we identify potential investments through extensive quantitative and fundamental research. Emphasizing individual stock selection over economic or industry trends, the fund focuses on three key factors: value, business health and business momentum.
International Stocks Hurt by Slowing Global Economy
International equities posted negative returns over much of the reporting period, succumbing to an onslaught of negative economic news, including a global credit crisis
18
and the slowdown in the U.S. economy. In this uncertain environment, commodities stocks offered some of the market’s only consistently positive returns. However, toward the end of the reporting period, as growth in China and India began to waver, global industrial production slowed and the U.S. dollar rebounded from previous lows, investors began to look toward more traditionally defensive stocks in other areas.
Materials and Consumer Stocks Weighed on Performance
We attribute much of the fund’s underperformance to an underweighted position in materials stocks, most notably metals-and-mining giants Rio Tinto and BHP Billiton and steelmaker ArcelorMittal. Consumer discretionary stocks also disappointed,as two German auto manufacturers, Daimler and BMW, encountered weak sales in Europe. In addition, two U.K. media holdings—Trinity Mirror, a newspaper publisher, andWPP Group, a media and communications services conglomerate—lost value along with much of the rest of the industry group. Midsize U.K. retailer Debenhams suffered due to increased competition from discount retailers. Other laggards included Japanese homebuilder Sekisui House, which disappointed due to regulatory changes that delayed construction projects.
The fund achieved better relative performance in Japan, a market we have favored for some time. Winners included Kubota Corp, the country’s top maker of tractors and other farm equipment, which
posted strong gains due to rising agricultural demand, Central Japan Railway Company and Tokyo Gas Co. The fund’s performance also benefited from its French holdings, including integrated oil company Total, pharmaceuticals giant Sanofi-Aventis, and telecommunications firm France Telecom.
Late-Term Rebound Creates New Investment Opportunities
Despite a rebound in international equity markets late in the reporting period, we remain cautious with regard to the outlook for the foreseeable future. We recently have increased the fund’s exposure to some high-quality consumer discretionary names in Japan, including an electronics firm and an express delivery company.We also have added selectively to the fund’s holdings of metals stocks, focusing on companies we believe have the ability to improve margins even if commodity prices continue to fall over the near term.
September 15, 2008
| 1 | Total return includes reinvestment of dividends and any capital gains paid. Past performance is no guarantee of future results. Share price and investment return fluctuate such that upon redemption, fund shares may be worth more or less than their original cost. Return figures provided reflect the absorption of certain fund expenses by The Dreyfus Corporation, pursuant to an undertaking which is voluntary, not contractual, and may be terminated at any time. |
| 2 | SOURCE: LIPPER INC.— Reflects reinvestment of net dividends and, where applicable, capital gain distributions.The Morgan Stanley Capital International Europe,Australasia, Far East (MSCI EAFE) Index is an unmanaged index composed of a sample of companies representative of the market structure of European and Pacific Basin countries. Index return does not reflect fees and expenses associated with operating a mutual fund. |
The Funds 19
| FUND PERFORMANCE |

| Average Annual Total Returns as of 8/31/08 | ||||||||||
| Inception | From | |||||||||
| Date | 1 Year | 5 Years | 10 Years | Inception | ||||||
| Class M shares | (18.61)% | 10.51% | 6.65% | |||||||
| Investor shares | 7/11/01 | (18.87)% | 10.13% | — | 7.37% | |||||
† Source: Lipper Inc.
Past performance is not predictive of future performance.The fund’s performance shown in the graph and table does not reflect the deduction of taxes that a shareholder would pay on fund distributions or the redemption of fund shares.
The above graph compares a $10,000 investment made in Class M shares of BNY Mellon International Fund on 8/31/98 to a $10,000 investment made in the Morgan Stanley Capital International Europe,Australasia, Far East Index (the “Index”) on that date.All dividends and capital gain distributions are reinvested.
Effective March 31, 2008, Mellon Funds Trust changed its name to BNY Mellon Funds Trust.
Before the fund commenced operations, substantially all of the assets of a predecessor common trust fund (CTF) that, in all material respects, had the same investment objective, policies, guidelines and restrictions as the fund (and those of another CTF) were transferred to the fund. Please note that the performance of the fund’s Class M shares represents the performance of the predecessor CTF through October 1, 2000, adjusted to reflect the fund’s fees and expenses, by subtracting from the actual performance of the CTF the expenses of the fund’s Class M shares as they were estimated prior to the conversion of the CTF into the fund, and the performance of the fund’s Class M shares thereafter.The predecessor CTF was not registered under the Investment Company Act of 1940, as amended, and therefore was not subject to certain investment restrictions that might have adversely affected performance. In addition, the expenses of the fund’s Class M shares may be higher than those estimated prior to the conversion of the CTF into the fund, which would lower the performance shown in the above line graph.
Effective July 11, 2001, existing fund shares were designated as Class M shares and the fund began offering a second class of shares designated as Investor shares, which are subject to a Shareholder Services Plan. Performance for Investor shares will vary from the performance of Class M shares shown above because of the differences in charges and expenses.
The fund’s performance shown in the line graph takes into account all applicable fees and expenses for Class M shares only.The Index is an unmanaged index composed of a sample of companies representative of the market structure of European and Pacific Basin countries. Unlike a mutual fund, the Index is not subject to charges, fees and other expenses. Investors cannot invest directly in any index. Further information relating to fund performance, including expense reimbursements, if applicable, is contained in the Financial Highlights section of the prospectus and elsewhere in this report.
20
DISCUSSION OF
FUND PERFORMANCE
For the period of September 1, 2007, through August 31, 2008, as provided by D. Kirk Henry andWilliam S. Patzer, Portfolio Managers
Fund and Market Performance Overview
For the 12-month period ended August 31, 2008, BNY Mellon Emerging Markets Fund’s Class M shares produced a total return of –9.11%, and the fund’s Investor shares produced a total return of –9.29% .1 In comparison, the Morgan Stanley Capital International Emerging Markets Index (the “Index”), the fund’s benchmark, provided a total return of –9.83% for the same period.2
The emerging markets generally declined during the reporting period, unable to avoid the economic woes of the developed world. However, the fund produced higher returns than its benchmark, due primarily to strong stock selections in Korea and Taiwan as well as limited exposure to slumping markets in China and India.
The Fund’s Investment Approach
The fund seeks long-term capital growth.To pursue its goal, the fund invests at least 80% of its assets in equity securities of companies organized, or with a majority of assets or operations, in countries considered to be emerging markets.
Since June 30, 2005, the fund generally invests most of its cash inflows (purchases of fund shares and reinvested distributions) in accordance with a core investment style. The fund’s portfolio as of June 30, 2005, was invested in companies the investment adviser considered to be “value” companies. Pursuant to the core investment style, under normal circumstances, at least 80% of the fund’s cash inflows allocated to this style are invested in equity securities of companies located in the foreign countries represented in the Index.
The allocation of cash inflows and outflows will be at the discretion of the investment adviser depending on
the circumstances; however, under normal circumstances, generally between 90% and 100% of cash inflows will be allocated to the core investment style.We believe that by implementing a core investment style with respect to such assets, the fund may take advantage of investment opportunities in emerging markets that may not fall within the value-oriented investment style previously employed for the fund’s entire portfolio.
The fund will continue to invest in stocks that appear to be undervalued (as measured by their price/earnings ratios), but stocks purchased pursuant to the core investment style may have value and/or growth characteristics. The core investment style portfolio manager employs a “bottom-up” investment approach, which emphasizes individual stock selection.The core investment style stock selection process is designed to produce a diversified portfolio that, relative to the Index, has a below-average price/earnings ratio and an above-average earnings growth trend.
When choosing stocks for the portion of the fund using the value-oriented investment style, we use a research-driven and risk-averse approach.We identify potential investments through extensive quantitative and fundamental research. Emphasizing individual stock selection rather than economic and industry trends, we focus on three key factors: value, business health and business momentum.
Emerging Markets Retreated in a Slowing Global Economy
The emerging equity markets retrenched during the reporting period as an economic slowdown and credit crisis spread from the United States to other developed economies.This development led some investors to question the likelihood of “decoupling,” the theory that emerging markets can grow robustly despite less favorable conditions in developed markets.
We attribute the bulk of the fund’s relatively strong performance to its stock selections in Korea and
The Funds 21
DISCUSSION OF FUND PERFORMANCE (continued)
Taiwan. We maintained limited exposure to Korean industrial companies due to their exposure to Chinese infrastructure development.This stance proved beneficial when China’s government took steps to cool off its economy, and a sell-off in related industrial stocks ensued. Nonetheless, the fund received relatively strong returns from SK Telecom and steel company POSCO.
In Taiwan, equities were buoyed by a new government that favors better relations with Mainland China. Contract manufacturers also fared well, including Quanta Computer.Taiwanese financial services firms rebounded from their lows and benefited from lack of exposure to the troubled U.S. sub-prime mortgage market. In addition, Chungwa Telecom delivered strong earnings.
Other significant gains came from India, where Oil and Natural Gas Corporation Ltd. benefited from an offshore gas discovery. Most Indian banks performed well, while Satyam Computer Services Limited delivered good earnings. In China, the fund benefited from gains achieved by oil and gas firm PetroChina as well as a limited exposure to banks and insurance companies that faltered when the economy slowed.
On the other hand, the fund received disappointing results from South African banks that were hurt by rising inflation and interest rates.An underweighted position in
Brazilian metals and steel stocks also detracted from the fund’s relative performance, as did a handful of consumer discretionary stocks, each for company-specific reasons.
Favorable Long-Term Outlook
Although consumption is rising, exports remain an important factor in emerging market development. Therefore, in the near term, we expect to see slightly slower growth in developing economies, which we believe makes a disciplined security selection strategy more important than ever. Still, we remain optimistic regarding the emerging markets over the long term, largely due to strong corporate profits and low debt levels, supportive demographic trends, favorable fiscal backdrops, and encouraging signs of industry reform in several countries.
September 15, 2008
| 1 | Total return includes reinvestment of dividends and any capital gains paid. Past performance is no guarantee of future results. Share price and investment return fluctuate such that upon redemption, fund shares may be worth more or less than their original cost. |
| 2 | SOURCE: LIPPER INC. — Reflects reinvestment of gross dividends and, where applicable, capital gain distributions.The Morgan Stanley Capital International Emerging Markets Index is a market capitalization-weighted index composed of companies representative of the market structure of 26 emerging market countries in Europe, Latin America and the Pacific Basin. Index return does not reflect fees and expenses associated with operating a mutual fund. |
22
| FUND PERFORMANCE |

| Average Annual Total Returns as of 8/31/08 | ||||||||
| Inception | From | |||||||
| Date | 1 Year | 5 Years | Inception | |||||
| Class M shares | 10/2/00 | (9.11)% | 20.90% | 16.46% | ||||
| Investor shares | 7/11/01 | (9.29)% | 20.63% | 18.62% | ||||
† Source: Lipper Inc.
Past performance is not predictive of future performance.The fund’s performance shown in the graph and table does not reflect the deduction of taxes that a shareholder would pay on fund distributions or the redemption of fund shares.
The above graph compares a $10,000 investment made in Class M shares of BNY Mellon Emerging Markets Fund on 10/2/00 (inception date) to a $10,000 investment made in the Morgan Stanley Capital International Emerging Markets Index (the “Index”) on that date. For comparative purposes, the value of the Index on 9/30/00 is used as the beginning value on 10/2/00.All dividends and capital gain distributions are reinvested.
Effective March 31, 2008, Mellon Funds Trust changed its name to BNY Mellon Funds Trust.
Effective July 11, 2001, existing fund shares were designated as Class M shares and the fund began offering a second class of shares designated as Investor shares, which are subject to a Shareholder Services Plan. Performance for Investor shares will vary from the performance of Class M shares shown above because of the differences in charges and expenses.
The fund’s performance shown in the line graph takes into account all applicable fees and expenses for Class M shares only.The Index is a market capitalization-weighted index composed of companies representative of the market structure of 26 emerging market countries in Europe, Latin America and the Pacific Basin.The Index excludes closed markets and those shares in otherwise free markets, which are not purchasable by foreigners.The Index includes gross dividends reinvested and does not take into account charges, fees and other expenses.These factors can contribute to the Index potentially outperforming the fund. Unlike a mutual fund, the Index is not subject to charges, fees and other expenses. Investors cannot invest directly in any index. Further information relating to fund performance, including expense reimbursements, if applicable, is contained in the Financial Highlights section of the prospectus and elsewhere in this report.
The Funds 23
DISCUSSION OF FUND PERFORMANCE (continued)

DISCUSSION OF
FUND PERFORMANCE
For the period of September 1, 2007, through August 31, 2008, as provided by Sean P. Fitzgibbon and John F. Flahive, Portfolio Managers
Fund and Market Performance Overview
For the 12-month period ended August 31, 2008, BNY Mellon Balanced Fund’s Class M shares produced a total return of –3.99%, and Investor shares produced –4.29% .1 In comparison, the fund’s benchmark, a blended index composed of 60% Standard & Poor’s 500 Composite Stock Price Index (“S&P 500 Index”) and 40% Lehman Brothers U.S.Aggregate Index, produced a –4.34% total return for the same period.2 Separately, the S&P 500 Index and the Lehman Brothers U.S. Aggregate Index produced total returns of –11.13% and 5.86%, respectively, for the same period.
Stocks and higher yielding sectors of the bond market retreated over the reporting period when an economic downturn and a global credit crisis dampened investor sentiment, while U.S. Treasury securities rallied amid a “flight to quality.”The fund produced higher returns than its benchmark, primarily due to a defensive posture in the fund’s bond portfolio and strong stock selections in the financials, information technology and energy sectors.
The Fund’s Investment Approach
The fund seeks long-term growth of principal in conjunction with current income. To pursue its goal, the fund may invest in equity securities, income producing bonds, BNY Mellon Small Cap Stock Fund, BNY Mellon Mid Cap Stock Fund, BNY Mellon International Fund and BNY Mellon Emerging Markets Fund (collectively, the “BNY Mellon Funds”).The fund has established target allocations of 60% to equity securities and 40% to bonds and money market instruments. The fund may deviate from these targets within ranges of 15% above or below the target amount. The fund’s investments in each of the BNY Mellon Funds are subject to a separate limit of 20% of the fund’s total assets, as is the fund’s investment in money market instruments.
In the fund’s equity portfolio, individual stocks are chosen using a computer model, fundamental analysis and risk management techniques. Our computer model identifies and ranks stocks within each industry or sector based on value, earnings growth and the financial health of the company.
In the fund’s fixed-income portfolio, investments in debt securities must be of investment-grade quality at the time of purchase3 or, if unrated, deemed of comparable quality by the investment adviser. Generally, the fund’s average effective portfolio duration of bonds will not exceed eight years. We choose debt securities based on their yields, credit quality, the level of interest rates and inflation, general economic and financial trends and our outlook for the securities markets.
Economic and Credit Woes Weighed on Stocks and Bonds
U.S. stocks and riskier bonds produced disappointing results over the reporting period amid an onslaught of negative economic news. As housing values plummeted and job losses mounted, mortgage foreclosures rose sharply. Meanwhile, soaring energy and food prices caused consumers to cut back on discretionary spending. Many businesses also reduced spending in anticipation of a more difficult business environment.At the same time, a credit crisis that began in the sub-prime mortgage market continued to batter the world’s major financial institutions, many of which announced additional write-downs.
Defensive Strategies Bolstered Fund Performance
The fund’s stock portfolio received strong contributions to relative performance from our stock selection strategy in the hard-hit financials sector. The fund did not hold mortgage agency Freddie Mac, and we sold Fannie Mae before both companies encountered capital shortages that resulted in a government takeover soon after the reporting period’s end. The fund also avoided declines in banking giant Washington Mutual and hard-hit investment banks Merrill Lynch, Lehman Brothers and Bear Stearns. An
24
overweighted position in PNC Financial Services fared well due to its strong capital position and relative lack of exposure to asset write-downs.
Winners in the information technology sector included BlackBerry maker Research In Motion, which benefited from increased adoption of smart-phones by retail customers. In the energy sector, Chesapeake Energy and Hess Corporation advanced amid surging commodity prices.
The health care sector detracted from the fund’s relative performance, due mainly to overweighted positions in Merck & Co. and Schering-Plough, which fared relatively poorly. In the industrials area, lack of exposure to the road-and-rail industry and a small position in U.S. Airways Group constrained returns.
Among bonds, an overweighted position in U.S. Treasury securities and an emphasis on short-duration, high-quality corporate- and mortgage-backed securities supported the fund’s performance.We increased the fund’s holdings of bonds we deemed to be relatively insensitive to the economic downturn and trimmed holdings of riskier corporate, asset-backed and commercial mortgage-backed securities. Conversely, we
increased the fund’s exposure to longer-duration U.S. Treasury securities. As a result, the fund held none of the securities that were hit hardest by the credit crisis.
Finding Opportunities in a Challenging Market
As of the reporting period’s end, the economic downturn has persisted and the credit crisis has intensified. Therefore, we have maintained generally defensive postures in the fund’s stock and bond portfolios. In our judgment, these are prudent strategies until we see evidence of an economic rebound and better conditions in credit markets.
September 15, 2008
| 1 | Total return includes reinvestment of dividends and any capital gains paid. Past performance is no guarantee of future results. Share price and investment return fluctuate such that upon redemption, fund shares may be worth more or less than their original cost. |
| 2 | SOURCE: LIPPER INC. — Reflects reinvestment of dividends and, where applicable, capital gain distributions.The Standard & Poor’s 500 Composite Stock Price Index is a widely accepted, unmanaged index of U.S. stock market performance.The Lehman Brothers U.S.Aggregate Index is a widely accepted, unmanaged total return index of corporate, U.S. government and U.S. government agency debt instruments, mortgage-backed securities and asset-backed securities with an average maturity of 1-10 years.The indices’ returns do not reflect the fees and expenses associated with operating a mutual fund. |
| 3 | The fund may continue to own investment-grade bonds (at the time of purchase), which are subsequently downgraded to below investment grade. |
The Funds 25
| FUND PERFORMANCE |

| Average Annual Total Returns as of 8/31/08 | ||||||||
| Inception | From | |||||||
| Date | 1 Year | 5 Years | Inception | |||||
| Class M shares | 10/2/00 | (3.99)% | 7.27% | 3.86% | ||||
| Investor shares | 7/11/01 | (4.29)% | 6.96% | 4.86% | ||||
† Source: Lipper Inc.
Past performance is not predictive of future performance.The fund’s performance shown in the graph and table does not reflect the deduction of taxes that a shareholder would pay on fund distributions or the redemption of fund shares.
The above graph compares a $10,000 investment made in Class M shares of BNY Mellon Balanced Fund on 10/2/00 (inception date) to a $10,000 investment made in three different indices: (1) the Standard & Poor’s 500 Composite Stock Price Index (the “S&P 500 Index”), (2) the Lehman Brothers U.S.Aggregate Index (the “Lehman Index”) and (3) the Customized Blended Index on that date.The Customized Blended Index is calculated on a year-to-year basis. For comparative purposes, the value of each index on 9/30/00 is used as the beginning value on 10/2/00.All dividends and capital gain distributions are reinvested.
Effective March 31, 2008, Mellon Funds Trust changed its name to BNY Mellon Funds Trust.
Effective July 11, 2001, existing fund shares were designated as Class M shares and the fund began offering a second class of shares designated as Investor shares, which are subject to a Shareholder Services Plan. Performance for Investor shares will vary from the performance of Class M shares shown above because of the differences in charges and expenses.
The fund’s performance shown in the line graph takes into account all applicable fees and expenses for Class M shares only.The S&P 500 Index is a widely accepted, unmanaged index of U.S. stock market performance.The Lehman Index is a widely accepted, unmanaged index of corporate, government and government agency debt instruments, mortgage-backed securities and asset-backed securities with an average maturity of 1-10 years. Unlike a mutual fund, the indices are not subject to charges, fees and other expenses. Investors cannot invest directly in any index.The Customized Blended Index is composed of the S&P 500 Index, 60%, and the Lehman Index, 40%. Further information relating to fund performance, including expense reimbursements, if applicable, is contained in the Financial Highlights section of the prospectus and elsewhere in this report.
26
UNDERSTANDING YOUR FUND’S EXPENSES (Unaudited)
As a mutual fund investor, you pay ongoing expenses, such as management fees and other expenses. Using the information below, you can estimate how these expenses affect your investment and compare them with the expenses of other funds.You also may pay one-time transaction expenses, including sales charges (loads) and redemptions fees, which are not shown in this section and would have resulted in higher total expenses. For more information, see your fund’s prospectus or talk to your financial adviser.
Review your fund’s expenses
The table below shows the expenses you would have paid on a $1,000 investment in each class of each BNY Mellon equity fund from March 1, 2008 to August 31, 2008. It also shows how much a $1,000 investment would be worth at the close of the period, assuming actual returns and expenses.
| Expenses and Value of a $1,000 Investment | ||||||
| assuming actual returns for the six months ended August 31, 2008 | ||||||
| Dreyfus | ||||||
| Class M Shares | Investor Shares | Premier Shares | ||||
| BNY Mellon Large Cap Stock Fund | ||||||
| Expenses paid per $1,000† | $ 3.96 | $ 5.19 | — | |||
| Ending value (after expenses) | $ 969.30 | $ 967.00 | — | |||
| BNY Mellon Income Stock Fund | ||||||
| Expenses paid per $1,000† | $ 4.05 | $ 5.26 | — | |||
| Ending value (after expenses) | $ 939.50 | $ 937.50 | — | |||
| BNY Mellon Mid Cap Stock Fund | ||||||
| Expenses paid per $1,000† | $ 4.51 | $ 5.71 | $ 9.45 | |||
| Ending value (after expenses) | $ 994.70 | $ 992.80 | $ 989.50 | |||
| BNY Mellon Small Cap Stock Fund | ||||||
| Expenses paid per $1,000† | $ 5.11 | $ 6.27 | — | |||
| Ending value (after expenses) | $1,011.50 | $1,010.00 | — | |||
| BNY Mellon U.S. Core Equity 130/30 Fund | ||||||
| Expenses paid per $1,000† | $ 8.43 | $ 9.70 | — | |||
| Ending value (after expenses) | $ 950.00 | $ 949.00 | — | |||
| BNY Mellon International Fund | ||||||
| Expenses paid per $1,000† | $ 4.85 | $ 6.09 | — | |||
| Ending value (after expenses) | $ 893.10 | $ 892.50 | — | |||
| BNY Mellon Emerging Markets Fund | ||||||
| Expenses paid per $1,000† | $ 7.28 | $ 8.45 | — | |||
| Ending value (after expenses) | $ 879.70 | $ 878.90 | — | |||
| BNY Mellon Balanced Fund | ||||||
| Expenses paid per $1,000† | $ 2.93 | $ 3.62 | — | |||
| Ending value (after expenses) | $ 975.40 | $ 973.90 | — |
† Expenses are equal to the BNY Mellon Large Cap Stock Fund’s annualized expense ratio of ..80% for Class M and 1.05% for Investor Shares, BNY Mellon Income Stock Fund .83% for Class M and 1.08% for Investor Shares, BNY Mellon Mid Cap Stock Fund .90% for Class M, 1.14% for Investor Shares and 1.89% for Dreyfus Premier Shares, BNY Mellon Small Cap Stock Fund 1.01% for Class M and 1.24% for Investor Shares, BNY Mellon U.S. Core Equity 130/30 Fund 1.72% for Class M and 1.98% for Investor Shares, BNY Mellon International Fund 1.02% for Class M and 1.28% for Investor Shares, BNY Mellon Emerging Markets Fund 1.54% for Class M and 1.79% for Investor Shares and BNY Mellon Balanced Fund .59% for Class M and .73% for Investor Shares, multiplied by the respective fund's average account value over the period, multiplied by 184/366 (to reflect the one-half year period).
The Funds 27
COMPARING YOUR FUND’S EXPENSES WITH THOSE OF OTHER FUNDS (Unaudited)
Using the SEC’s method to compare expenses
The Securities and Exchange Commission (SEC) has established guidelines to help investors assess fund expenses. Per these guidelines, the table below shows your fund’s expenses based on a $1,000 investment, assuming a hypothetical 5% annualized return.You can use this information to compare the ongoing expenses (but not transaction expenses or total cost) of investing in the fund with those of other funds.All mutual fund shareholder reports will provide this information to help you make this comparison. Please note that you cannot use this information to estimate your actual ending account balance and expenses paid during the period.
| Expenses and Value of a $1,000 Investment | ||||||
| assuming a hypothetical 5% annualized return for the six months ended August 31, 2008 | ||||||
| Dreyfus | ||||||
| Class M Shares | Investor Shares | Premier Shares | ||||
| BNY Mellon Large Cap Stock Fund | ||||||
| Expenses paid per $1,000† | $ 4.06 | $ 5.33 | — | |||
| Ending value (after expenses) | $1,021.11 | $1,019.86 | — | |||
| BNY Mellon Income Stock Fund | ||||||
| Expenses paid per $1,000† | $ 4.22 | $ 5.48 | — | |||
| Ending value (after expenses) | $1,020.96 | $1,019.71 | — | |||
| BNY Mellon Mid Cap Stock Fund | ||||||
| Expenses paid per $1,000† | $ 4.57 | $ 5.79 | $ 9.58 | |||
| Ending value (after expenses) | $1,020.61 | $1,019.41 | $1,015.63 | |||
| BNY Mellon Small Cap Stock Fund | ||||||
| Expenses paid per $1,000† | $ 5.13 | $ 6.29 | — | |||
| Ending value (after expenses) | $1,020.06 | $1,018.90 | — | |||
| BNY Mellon U.S. Core Equity 130/30 Fund | ||||||
| Expenses paid per $1,000† | $ 8.72 | $ 10.03 | — | |||
| Ending value (after expenses) | $1,016.49 | $1,015.18 | — | |||
| BNY Mellon International Fund | ||||||
| Expenses paid per $1,000† | $ 5.18 | $ 6.50 | — | |||
| Ending value (after expenses) | $1,020.01 | $1,018.70 | — | |||
| BNY Mellon Emerging Markets Fund | ||||||
| Expenses paid per $1,000† | $ 7.81 | $ 9.07 | — | |||
| Ending value (after expenses) | $1,017.39 | $1,016.14 | — | |||
| BNY Mellon Balanced Fund | ||||||
| Expenses paid per $1,000† | $ 3.00 | $ 3.71 | — | |||
| Ending value (after expenses) | $1,022.17 | $1,021.47 | — | |||
† Expenses are equal to the BNY Mellon Large Cap Stock Fund's annualized expense ratio of .80% for Class M and 1.05% for Investor Shares, BNY Mellon Income Stock Fund .83% for Class M and 1.08% for Investor Shares, BNY Mellon Mid Cap Stock Fund .90% for Class M, 1.14% for Investor Shares and 1.89% for Dreyfus Premier Shares, BNY Mellon Small Cap Stock Fund 1.01% for Class M and 1.24% for Investor Shares, BNY Mellon U.S. Core Equity 130/30 Fund 1.72% for Class M and 1.98% for Investor Shares, BNY Mellon International Fund 1.02% for Class M and 1.28% for Investor Shares, BNY Mellon Emerging Markets Fund 1.54% for Class M and 1.79% for Investor Shares and BNY Mellon Balanced Fund .59% for Class M and .73% for Investor Shares, multiplied by the respective fund's average account value over the period, multiplied by 184/366 (to reflect the one-half year period).
28
STATEMENT OF INVESTMENTS
August 31, 2008
| BNY Mellon Large Cap Stock Fund | ||||||||||
| Common Stocks—97.4% | Shares | Value ($) | Shares | Value ($) | ||||||
| Consumer Discretionary—10.0% | Financial (continued) | |||||||||
| Colgate-Palmolive | 346,070 | 26,311,702 | Morgan Stanley | 303,430 | 12,389,047 | |||||
| Darden Restaurants | 318,166 a | 9,319,082 | PNC Financial Services Group | 235,160 a | 16,919,762 | |||||
| Family Dollar Stores | 804,740 | 20,054,121 | U.S. Bancorp | 558,400 a | 17,790,624 | |||||
| Gap | 838,040 a | 16,299,878 | Wachovia | 323,320 a | 5,137,555 | |||||
| McDonald’s | 382,990 | 23,764,530 | Wells Fargo & Co. | 825,240 a | 24,980,015 | |||||
| Newell Rubbermaid | 506,710 | 9,171,451 | 251,014,474 | |||||||
| News, Cl. B | 1,220,960 | 17,532,986 | Health Care—12.4% | |||||||
| Omnicom Group | 394,390 a | 16,718,192 | Aetna | 233,490 | 10,072,759 | |||||
| Ross Stores | 464,230 a | 18,666,688 | Baxter International | 385,490 | 26,120,802 | |||||
| TJX Cos. | 504,080 a | 18,267,859 | Becton, Dickinson & Co. | 131,080 | 11,453,770 | |||||
| 176,106,489 | Covidien | 212,490 | 11,489,334 | |||||||
| Consumer Staples—8.5% | Hospira | 382,500 a,b | 15,437,700 | |||||||
| Coca-Cola Enterprises | 659,830 | 11,263,298 | Johnson & Johnson | 468,000 | 32,961,240 | |||||
| CVS Caremark | 743,200 | 27,201,120 | Laboratory Corp. | |||||||
| Estee Lauder, Cl. A | 390,040 | 19,412,291 | of America Holdings | 151,050 a,b | 11,049,308 | |||||
| Kroger | 538,950 | 14,885,799 | Medtronic | 315,840 | 17,244,864 | |||||
| Molson Coors Brewing, Cl. B | 200,280 a | 9,543,342 | Pfizer | 1,129,670 | 21,587,994 | |||||
| PepsiCo | 191,847 | 13,137,683 | Schering-Plough | 689,190 | 13,370,286 | |||||
| Philip Morris International | 544,760 | 29,253,612 | St. Jude Medical | 259,260 b | 11,881,886 | |||||
| Procter & Gamble | 1 | 70 | Thermo Fisher Scientific | 395,790 b | 23,969,042 | |||||
| Wal-Mart Stores | 433,564 | 25,610,625 | Wyeth | 276,540 | 11,968,651 | |||||
| 150,307,840 | 218,607,636 | |||||||||
| Energy—12.3% | Industrial—11.0% | |||||||||
| Anadarko Petroleum | 179,560 | 11,084,239 | Cooper Industries, Cl. A | 195,740 | 9,325,054 | |||||
| Chevron | 411,480 | 35,518,954 | Eaton | 179,220 | 13,115,320 | |||||
| ConocoPhillips | 601,440 | 49,624,814 | Emerson Electric | 403,220 | 18,870,696 | |||||
| ENSCO International | 283,230 a | 19,197,329 | General Electric | 1,027,976 | 28,886,126 | |||||
| Hess | 262,700 | 27,507,317 | Goodrich | 250,490 | 12,837,613 | |||||
| Marathon Oil | 368,180 | 16,593,873 | L-3 Communications Holdings | 248,390 | 25,817,657 | |||||
| National Oilwell Varco | 202,670 b | 14,942,859 | Lockheed Martin | 174,900 | 20,365,356 | |||||
| Valero Energy | 145,470 | 5,056,537 | Terex | 312,860 b | 15,733,729 | |||||
| Williams | 405,050 | 12,511,995 | Textron | 396,520 | 16,296,972 | |||||
| XTO Energy | 481,075 | 24,250,991 | Tyco International | 544,370 | 23,342,586 | |||||
| 216,288,908 | United Technologies | 149,670 | 9,816,855 | |||||||
| Financial—14.3% | 194,407,964 | |||||||||
| Bank of America | 920,155 | 28,653,627 | Information Technology—19.7% | |||||||
| Chubb | 479,160 | 23,004,471 | Accenture, Cl. A | 266,530 | 11,023,681 | |||||
| Citigroup | 873,859 | 16,594,582 | Adobe Systems | 382,580 b | 16,385,901 | |||||
| Discover Financial Services | 543,110 | 8,934,160 | Akamai Technologies | 507,830 a,b | 11,629,307 | |||||
| Goldman Sachs Group | 177,430 | 29,093,197 | Alliance Data Systems | 287,070 a,b | 18,441,377 | |||||
| JPMorgan Chase & Co. | 1,057,286 | 40,694,938 | Amphenol, Cl. A | 231,310 | 10,991,851 | |||||
| MetLife | 494,880 | 26,822,496 | Apple | 224,880 b | 38,123,906 | |||||
The Funds 29
| STATEMENT OF INVESTMENTS (continued) |
| BNY Mellon Large Cap Stock Fund (continued) | ||||||||||
| Common Stocks (continued) | Shares | Value ($) | Shares | Value ($) | ||||||
| Information Technology (continued) | Utilities—3.5% | |||||||||
| Cisco Systems | 1,716,604 b | 41,284,326 | Exelon | 309,190 | 23,486,072 | |||||
| Dell | 764,650 a,b | 16,615,845 | Sempra Energy | 666,970 | 38,630,902 | |||||
| Global Payments | 217,540 | 10,487,603 | 62,116,974 | |||||||
| Intel | 1,534,440 | 35,092,643 | Total Common Stocks | |||||||
| McAfee | 257,300 a,b | 10,178,788 | (cost $1,515,071,133) | 1,714,758,219 | ||||||
| Microsoft | 1,522,086 | 41,537,727 | ||||||||
| Nokia, ADR | 501,630 | 12,626,027 | Other Investment—2.5% | |||||||
| Nortel Networks | 50,142 b | 302,356 | ||||||||
| Registered Investment Company; | ||||||||||
| Oracle | 950,820 b | 20,851,483 | ||||||||
| Dreyfus Institutional Preferred | ||||||||||
| QUALCOMM | 218,850 | 11,522,452 | Plus Money Market Fund | |||||||
| Research In Motion | 135,480 b | 16,474,368 | (cost $44,490,000) | 44,490,000 c 44,490,000 | ||||||
| Visa, Cl. A | 188,340 | 14,295,006 | ||||||||
| Yahoo! | 365,540 b | 7,084,165 | Investment of Cash Collateral | |||||||
| 344,948,812 | for Securities Loaned—4.2% | |||||||||
| Materials—3.1% | Registered Investment Company; | |||||||||
| Air Products & Chemicals | 192,629 | 17,692,974 | Dreyfus Institutional Cash | |||||||
| Cia Vale do Rio Doce, ADR | 692,300 | 18,380,565 | Advantage Plus Fund | |||||||
| Freeport-McMoRan Copper & Gold | 102,970 a | 9,197,280 | (cost $72,855,866) | 72,855,866 c 72,855,866 | ||||||
| Mosaic | 92,430 | 9,865,978 | ||||||||
| Total Investments | ||||||||||
| 55,136,797 | (cost $1,632,416,999) | 104.1% | 1,832,104,085 | |||||||
| Telecommunication Services—2.6% | ||||||||||
| Liabilities, Less Cash | ||||||||||
| AT & T | 1,092,879 | 34,961,199 | ||||||||
| and Receivables | (4.1%) | (71,587,381) | ||||||||
| Sprint Nextel | 1,245,542 | 10,861,126 | ||||||||
| 45,822,325 | Net Assets | 100.0% | 1,760,516,704 | |||||||
ADR—American Depository Receipts a All or a portion of these securities are on loan.At August 31, 2008, the total market value of the fund’s securities on loan is $92,203,044 and the total market value of the collateral held by the fund is $97,290,687, consisting of cash collateral of $72,855,866 and U.S. Government and Agency securities valued at $24,434,821.
| b | Non-income producing security. |
| c | Investment in affiliated money market mutual fund. |
| Portfolio Summary (Unaudited) † | ||||||
| Value (%) | Value (%) | |||||
| Information Technology | 19.7 | Consumer Staples | 8.5 | |||
| Financial | 14.3 | Money Market Investments | 6.7 | |||
| Health Care | 12.4 | Utilities | 3.5 | |||
| Energy | 12.3 | Materials | 3.1 | |||
| Industrial | 11.0 | Telecommunication Services | 2.6 | |||
| Consumer Discretionary | 10.0 | 104.1 | ||||
| † Based on net assets. | ||||||
| See notes to financial statements. | ||||||
30
STATEMENT OF INVESTMENTS
August 31, 2008
| BNY Mellon Income Stock Fund | ||||||||||
| Common Stocks—99.6 | Shares | Value ($) | Shares | Value ($) | ||||||
| Consumer Discretionary—8.4% | Financial (continued) | |||||||||
| Home Depot | 128,730 | 3,491,158 | JPMorgan Chase & Co. | 176,329 | 6,786,903 | |||||
| Johnson Controls | 36,510 | 1,128,889 | Lincoln National | 75,070 | 3,810,553 | |||||
| McDonald’s | 17,400 | 1,079,670 | MetLife | 39,760 | 2,154,992 | |||||
| News, Cl. A | 385,660 | 5,460,946 | Morgan Stanley | 25,440 | 1,038,715 | |||||
| Omnicom Group | 58,520 | 2,480,663 | PNC Financial Services Group | 41,960 | 3,019,022 | |||||
| Time Warner | 199,750 | 3,269,908 | Principal Financial Group | 32,260 a | 1,477,185 | |||||
| 16,911,234 | Prudential Financial | 12,800 a | 943,488 | |||||||
| Consumer Staples—10.9% | Travelers Cos. | 24,581 | 1,085,497 | |||||||
| Cadbury, ADR | 48,460 | 2,234,975 | U.S. Bancorp | 35,706 | 1,137,593 | |||||
| CVS Caremark | 74,880 | 2,740,608 | Wachovia | 99,090 a | 1,574,540 | |||||
| Kellogg | 27,660 | 1,505,810 | Wells Fargo & Co. | 110,770 | 3,353,008 | |||||
| Kraft Foods, Cl. A | 132,050 | 4,160,896 | 49,590,693 | |||||||
| PepsiCo | 36,080 | 2,470,758 | Health Care—8.5% | |||||||
| Philip Morris International | 120,940 | 6,494,478 | Abbott Laboratories | 123,740 | 7,106,388 | |||||
| Wal-Mart Stores | 39,780 | 2,349,805 | Baxter International | 15,020 | 1,017,755 | |||||
| 21,957,330 | Merck & Co. | 88,060 | 3,141,100 | |||||||
| Energy—14.2% | Pfizer | 95,778 | 1,830,318 | |||||||
| Chevron | 106,916 | 9,228,989 | Wyeth | 93,899 | 4,063,949 | |||||
| Devon Energy | 33,030 | 3,370,712 | 17,159,510 | |||||||
| Exxon Mobil | 78,886 | 6,311,669 | Industrial—9.4% | |||||||
| Marathon Oil | 34,670 | 1,562,577 | Eaton | 36,760 | 2,690,097 | |||||
| Occidental Petroleum | 25,640 | 2,034,790 | Emerson Electric | 21,310 | 997,308 | |||||
| Schlumberger | 41,440 | 3,904,477 | General Electric | 204,942 | 5,758,870 | |||||
| XTO Energy | 38,527 | 1,942,146 | Honeywell International | 59,310 | 2,975,583 | |||||
| 28,355,360 | Lockheed Martin | 12,410 | 1,445,020 | |||||||
| Financial—24.8% | ||||||||||
| United Technologies | 18,116 | 1,188,228 | ||||||||
| Aflac | 18,400 | 1,043,280 | ||||||||
| Waste Management | 110,750 | 3,896,185 | ||||||||
| American International Group | 40,510 | 870,560 | ||||||||
| 18,951,291 | ||||||||||
| Ameriprise Financial | 26,340 | 1,183,983 | ||||||||
| Information Technology—5.8% | ||||||||||
| Bank of America | 199,088 | 6,199,600 | ||||||||
| Accenture, Cl. A | 55,300 | 2,287,208 | ||||||||
| Chubb | 33,070 | 1,587,691 | ||||||||
| Automatic Data Processing | 46,280 | 2,053,906 | ||||||||
| Citigroup | 196,645 | 3,734,288 | ||||||||
| Cisco Systems | 105,060 b | 2,526,693 | ||||||||
| Federal National | ||||||||||
| Mortgage Association | 39,310 a | 268,880 | Intel | 84,220 | 1,926,111 | |||||
| Fidelity National Financial, Cl. A | 91,640 | 1,285,709 | Microsoft | 47,550 | 1,297,640 | |||||
| Franklin Resources | 44,100 | 4,608,450 | Nokia, ADR | 64,670 | 1,627,744 | |||||
| Goldman Sachs Group | 14,800 | 2,426,756 | 11,719,302 | |||||||
The Funds 31
| STATEMENT OF INVESTMENTS (continued) | ||||||||||
| BNY Mellon Income Stock Fund (continued) | ||||||||||
| Common Stocks (continued) | Shares | Value ($) | Shares | Value ($) | ||||||
| Materials—4.0% | Utilities (continued) | |||||||||
| Air Products & Chemicals | 12,880 | 1,183,028 | Questar | 15,340 | 795,993 | |||||
| Dow Chemical | 42,920 | 1,464,860 | Southern | 102,290 | 3,836,898 | |||||
| Freeport-McMoRan Copper & Gold | 22,260 a | 1,988,263 | 18,682,918 | |||||||
| Monsanto | 6,750 | 771,188 | Total Common Stocks | |||||||
| Packaging Corp. of America | 99,210 | 2,554,658 | (cost $187,370,876) | 199,965,358 | ||||||
| 7,961,997 | ||||||||||
| Investment of Cash Collateral | ||||||||||
| Telecommunication Services—4.3% | for Securities Loaned—1.8% | |||||||||
| AT & T | 195,255 | 6,246,207 | ||||||||
| Registered Investment Company; | ||||||||||
| Verizon Communications | 41,391 | 1,453,652 | ||||||||
| Dreyfus Institutional Cash | ||||||||||
| Windstream | 78,572 | 975,864 | Advantage Plus Fund | |||||||
| 8,675,723 | (cost $3,634,033) | 3,634,033 c | 3,634,033 | |||||||
| Utilities—9.3% | ||||||||||
| Total Investments | ||||||||||
| Entergy | 39,470 | 4,080,803 | ||||||||
| (cost $191,004,909) | 101.4% | 203,599,391 | ||||||||
| Exelon | 60,170 | 4,570,513 | ||||||||
| FPL Group | 55,050 | 3,306,303 | Liabilities, Less Cash and Receivables | (1.4%) | (2,825,468) | |||||
| NRG Energy | 55,590 b | 2,092,408 | Net Assets | 100.0% | 200,773,923 | |||||
| ADR—American Depository Receipts |
| a | All or a portion of these securities are on loan.At August 31, 2008, the total market value of the fund’s securities on loan is $4,963,993 and the total market value of the collateral held by the fund is $5,265,346, consisting of cash collateral of $3,634,033 and U.S. Government and Agency securities valued at $1,631,313. |
| b | Non-income producing security. |
| c | Investment in affiliated money market mutual fund. |
| Portfolio Summary (Unaudited) † | ||||||
| Value (%) | Value (%) | |||||
| Financial | 24.8 | Consumer Discretionary | 8.4 | |||
| Energy | 14.2 | Information Technology | 5.8 | |||
| Consumer Staples | 10.9 | Telecommunication Services | 4.3 | |||
| Industrial | 9.4 | Materials | 4.0 | |||
| Utilities | 9.3 | Money Market Investment | 1.8 | |||
| Health Care | 8.5 | 101.4 | ||||
| † Based on net assets. | ||||||
| See notes to financial statements. | ||||||
32
| STATEMENT OF OPTIONS WRITTEN August 31, 2008 |
| Face Amount | |||||
| Covered by | |||||
| BNY Mellon Income Stock Fund | Contracts (S) | Value ($) | |||
| Call Options: | |||||
| Baxter International, | |||||
| September 2008 @ 75 | 15,000 | a | (600) | ||
| Johnson Controls, | |||||
| October 2008 @ 35 | 36,500 | a | (20,075) | ||
| McDonald’s, | |||||
| September 2008 @ 62.50 | 17,400 | a | (20,880) | ||
| Monsanto, | |||||
| September 2008 @ 130 | 6,700 | a | (2,345) | ||
| (Premiums received $74,187) | (43,900) | ||||
| a Non-income producing security. | |||||
| See notes to financial statements. | |||||
The Funds 33
| STATEMENT OF INVESTMENTS | ||||||||||
| August 31, 2008 | ||||||||||
| BNY Mellon Mid Cap Stock Fund | ||||||||||
| Common Stocks—97.9% | Shares | Value ($) | Shares | Value ($) | ||||||
| Consumer Discretionary—11.5% | Energy (continued) | |||||||||
| Brinker International | 412,300 | 7,800,716 | Plains Exploration & Production | 243,300 a,b | 13,113,870 | |||||
| Burger King Holdings | 288,900 | 7,170,498 | Pride International | 405,000 a | 15,556,050 | |||||
| Darden Restaurants | 410,200 | 12,014,758 | Range Resources | 156,300 b | 7,255,446 | |||||
| Deckers Outdoor | 64,100 a | 7,287,529 | Superior Energy Services | 267,600 a,b | 12,587,904 | |||||
| Dollar Tree | 435,600 a,b | 16,709,616 | 149,316,920 | |||||||
| Focus Media Holding, ADR | 294,900 a | 9,649,128 | Financial—15.6% | |||||||
| Gentex | 693,010 b | 11,039,649 | AllianceBernstein Holding | 104,400 b | 5,661,612 | |||||
| Gildan Activewear | 274,310 a,b | 6,410,625 | Aspen Insurance Holdings | 297,300 | 8,056,830 | |||||
| Guess? | 289,200 | 10,778,484 | Bank of Hawaii | 235,300 b | 12,442,664 | |||||
| LKQ | 397,700 a | 7,448,921 | Cullen/Frost Bankers | 182,000 | 10,133,760 | |||||
| Macy’s | 397,600 | 8,278,032 | Digital Realty Trust | 305,300 b | 14,004,111 | |||||
| MDC Holdings | 154,300 | 6,395,735 | Dun & Bradstreet | 125,900 b | 11,579,023 | |||||
| O’Reilly Automotive | 287,800 a,b | 8,380,736 | Equifax | 191,100 | 6,751,563 | |||||
| Phillips-Van Heusen | 253,500 | 9,648,210 | Fidelity National Financial, Cl. A | 941,800 | 13,213,454 | |||||
| Priceline.com | 138,700 a,b | 12,896,326 | First Industrial Realty Trust | 240,100 b | 5,663,959 | |||||
| Regal Entertainment | Hudson City Bancorp | 489,600 b | 9,028,224 | |||||||
| Group, Cl. A | 697,600 b | 11,691,776 | IntercontinentalExchange | 108,600 a | 9,560,058 | |||||
| Ross Stores | 197,100 | 7,925,391 | Lazard, Cl. A | 291,300 | 12,348,207 | |||||
| Ryland Group | 192,310 b | 4,457,746 | Liberty Property Trust | 311,300 b | 11,754,688 | |||||
| Tupperware Brands | 294,000 b | 10,501,680 | Nationwide Health Properties | 377,400 b | 12,990,108 | |||||
| Warnaco Group | 90,000 a | 4,641,300 | New York Community Bancorp | 698,300 | 11,514,967 | |||||
| 181,126,856 | Old Republic International | 1,040,760 b | 11,375,507 | |||||||
| Consumer Staples—2.4% | Rayonier | 326,186 b | 14,675,108 | |||||||
| Clorox | 118,400 | 6,997,440 | Reinsurance Group of America | 156,500 b | 7,537,040 | |||||
| Dr. Pepper Snapple Group | 357,300 a | 8,828,883 | RenaissanceRe Holdings | 152,700 | 7,743,417 | |||||
| Herbalife | 206,800 | 9,740,280 | Taubman Centers | 189,300 b | 9,188,622 | |||||
| Ralcorp Holdings | 209,200 a,b | 12,844,880 | TCF Financial | 692,800 b | 10,911,600 | |||||
| 38,411,483 | Validus Holdings | 414,100 b | 9,880,426 | |||||||
| Energy—9.5% | Waddell & Reed Financial, Cl. A | 341,100 | 10,983,420 | |||||||
| Arch Coal | 224,800 b | 12,193,152 | Zions Bancorporation | 274,400 b | 7,364,896 | |||||
| Denbury Resources | 363,700 a | 9,052,493 | 244,363,264 | |||||||
| FMC Technologies | 191,400 a,b | 10,251,384 | Health Care—11.2% | |||||||
| Forest Oil | 242,300 a | 13,791,716 | AMERIGROUP | 352,600 a | 9,125,288 | |||||
| Helmerich & Payne | 273,100 b | 15,599,472 | Beckman Coulter | 196,900 b | 14,535,158 | |||||
| Massey Energy | 101,600 | 6,701,536 | Cephalon | 276,400 a,b | 21,177,768 | |||||
| Newfield Exploration | 200,500 a | 9,066,610 | Community Health Systems | 374,900 a | 12,937,799 | |||||
| PetroHawk Energy | 353,100 a | 12,220,791 | Covance | 178,340 a,b | 16,824,596 | |||||
| Pioneer Natural Resources | 188,800 | 11,926,496 | Dentsply International | 393,630 | 15,426,360 | |||||
34
| BNY Mellon Mid Cap Stock Fund (continued) | ||||||||||
| Common Stocks (continued) | Shares | Value ($) | Shares | Value ($) | ||||||
| Health Care (continued) | Information Technology—14.4% | |||||||||
| Endo Pharmaceuticals Holdings | 632,800 a,b | 14,377,216 | Alliance Data Systems | 293,300 a,b | 18,841,592 | |||||
| Hologic | 1,148,208 a,b | 24,364,974 | Amphenol, Cl. A | 494,920 b | 23,518,598 | |||||
| Laboratory Corp. | Arrow Electronics | 410,300 a | 13,617,857 | |||||||
| of America Holdings | 115,400 a,b | 8,441,510 | Atheros Communications | 283,900 a,b | 9,257,979 | |||||
| Lincare Holdings | 132,549 a | 4,374,117 | Broadridge | |||||||
| Perrigo | 399,450 b | 13,976,755 | Financial Solutions | 565,400 | 11,291,038 | |||||
| Pharmaceutical Product | CommScope | 294,400 a,b | 14,416,768 | |||||||
| Development | 272,395 | 11,113,716 | Cypress Semiconductor | 225,700 a,b | 7,317,194 | |||||
| Vertex Pharmaceuticals | 362,300 a | 9,731,378 | Equinix | 60,100 a,b | 4,838,050 | |||||
| 176,406,635 | FactSet Research Systems | 65,620 b | 4,115,030 | |||||||
| Industrial—17.4% | FLIR Systems | 419,800 a,b | 14,986,860 | |||||||
| AGCO | 292,160 a,b | 18,005,821 | Global Payments | 300,500 | 14,487,105 | |||||
| Alliant Techsystems | 112,700 a,b | 11,859,421 | Harris | 353,400 | 18,504,024 | |||||
| AMETEK | 245,250 | 11,904,435 | Intersil, Cl. A | 526,100 | 12,326,523 | |||||
| Brink’s | 161,800 | 11,290,404 | Lam Research | 168,300 a | 6,186,708 | |||||
| Chicago Bridge | McAfee | 471,600 a,b | 18,656,496 | |||||||
| & Iron (NY Shares) | 305,060 | 9,768,021 | NCR | 283,800 a | 7,509,348 | |||||
| Con-way | 212,700 b | 10,443,570 | Synopsys | 486,300 a | 10,470,039 | |||||
| Cooper Industries, Cl. A | 200,000 | 9,528,000 | Trimble Navigation | 186,600 a,b | 6,316,410 | |||||
| Corrections Corp. | Western Digital | 332,900 a,b | 9,074,854 | |||||||
| of America | 454,700 a | 12,095,020 | ||||||||
| 225,732,473 | ||||||||||
| DeVry | 250,200 | 12,905,316 | ||||||||
| Materials—7.5% | ||||||||||
| Flowserve | 112,700 | 14,889,924 | ||||||||
| Airgas | 291,900 | 17,292,156 | ||||||||
| Goodrich | 148,500 b | 7,610,625 | ||||||||
| Albemarle | 113,200 | 4,498,568 | ||||||||
| Harsco | 135,900 | 7,153,776 | ||||||||
| Celanese, Ser. A | 260,100 b | 10,029,456 | ||||||||
| Joy Global | 169,600 | 12,048,384 | ||||||||
| CF Industries Holdings | 129,800 | 19,781,520 | ||||||||
| Kansas City Southern | 148,100 a,b | 7,616,783 | ||||||||
| Cleveland-Cliffs | 267,500 b | 27,076,350 | ||||||||
| KBR | 488,400 | 11,990,220 | ||||||||
| Crown Holdings | 313,100 a | 8,685,394 | ||||||||
| Lincoln Electric Holdings | 63,160 | 5,101,433 | ||||||||
| FMC | 221,200 | 16,267,048 | ||||||||
| Quanta Services | 516,700 a | 16,503,398 | ||||||||
| Olin | 206,100 b | 5,546,151 | ||||||||
| Republic Services | 404,780 | 13,305,119 | ||||||||
| Steel Dynamics | 322,160 | 7,999,233 | ||||||||
| Rockwell Collins | 132,700 | 6,978,693 | ||||||||
| 117,175,876 | ||||||||||
| Roper Industries | 250,900 b | 14,823,172 | ||||||||
| Telecommunication | ||||||||||
| SPX | 145,200 | 17,315,100 | Services—1.6% | |||||||
| Stericycle | 278,600 a,b | 16,520,980 | NII Holdings | 204,200 a,b | 10,724,584 | |||||
| Terex | 142,100 a | 7,146,209 | SBA Communications, Cl. A | 243,000 a,b | 8,487,990 | |||||
| Textron | 173,400 | 7,126,740 | Telephone & Data Systems | 141,900 | 5,448,960 | |||||
| 273,930,564 | ||||||||||
| 24,661,534 |
The Funds 35
| STATEMENT OF INVESTMENTS (continued) | ||||||||||
| BNY Mellon Mid Cap Stock Fund (continued) | ||||||||||
| Common Stocks (continued) | Shares | Value ($) | Other Investment—2.5% | Shares | Value ($) | |||||
| Utilities—6.8% | Registered Investment Company; | |||||||||
| Allegheny Energy | 159,500 | 7,230,135 | Dreyfus Institutional Preferred | |||||||
| Alliant Energy | 294,800 | 10,303,260 | Plus Money Market Fund | |||||||
| (cost $38,975,000) | 38,975,000 c 38,975,000 | |||||||||
| DPL | 368,300 b | 9,141,206 | ||||||||
| Energen | 196,530 | 10,974,235 | Investment of Cash Collateral | |||||||
| Equitable Resources | 302,800 | 15,112,748 | for Securities Loaned—19.2% | |||||||
| ITC Holdings | 152,800 b | 8,558,328 | Registered Investment Company; | |||||||
| MDU Resources Group | 472,360 | 15,606,774 | Dreyfus Institutional Cash | |||||||
| Pepco Holdings | 153,900 | 3,901,365 | Advantage Plus Fund | |||||||
| (cost $301,987,409) | 301,987,409 c 301,987,409 | |||||||||
| Questar | 169,900 | 8,816,111 | ||||||||
| Wisconsin Energy | 355,100 | 16,608,027 | Total Investments | |||||||
| 106,252,189 | (cost $1,785,436,856) | 119.6% | 1,878,340,203 | |||||||
| Total Common Stocks | Liabilities, Less Cash and Receivables (19.6%) | (307,330,402) | ||||||||
| (cost $1,444,474,447) | 1,537,377,794 | Net Assets | 100.0% | 1,571,009,801 | ||||||
| ADR—American Depository Receipts |
| a | Non-income producing security. |
| b | All or a portion of these securities are on loan.At August 31, 2008, the total market value of the fund’s securities on loan is $291,681,273 and the total market value of the collateral held by the fund is $303,000,726, consisting of cash collateral of $301,987,409 and U.S. Government and Agency securities valued at $1,013,317. |
| c | Investment in affiliated money market mutual fund. |
| Portfolio Summary (Unaudited) † | ||||||
| Value (%) | Value (%) | |||||
| Money Market Investments | 21.7 | Energy | 9.5 | |||
| Industrial | 17.4 | Materials | 7.5 | |||
| Financial | 15.6 | Utilities | 6.8 | |||
| Information Technology | 14.4 | Consumer Staples | 2.4 | |||
| Consumer Discretionary | 11.5 | Telecommunication Services | 1.6 | |||
| Health Care | 11.2 | 119.6 | ||||
| † Based on net assets. | ||||||
| See notes to financial statements. | ||||||
36
| STATEMENT OF INVESTMENTS | ||||||||||
| August 31, 2008 | ||||||||||
| BNY Mellon Small Cap Stock Fund | ||||||||||
| Common Stocks—98.8% | Shares | Value ($) | Shares | Value ($) | ||||||
| Consumer Discretionary—13.3% | Energy (continued) | |||||||||
| Brinker International | 166,300 | 3,146,396 | Petroleum Development | 25,900 b | 1,574,461 | |||||
| Buckle | 73,800 a | 3,832,434 | St. Mary Land & Exploration | 90,290 a | 3,812,044 | |||||
| Carter’s | 170,400 a,b | 3,137,064 | Stone Energy | 56,300 b | 2,683,821 | |||||
| CEC Entertainment | 34,300 a,b | 1,175,118 | Tetra Technologies | 99,700 a,b | 2,207,358 | |||||
| Citi Trends | 161,600 a,b | 3,332,192 | Unit | 70,430 b | 4,770,224 | |||||
| Coinstar | 94,700 a,b | 3,117,524 | 42,536,675 | |||||||
| Deckers Outdoor | 36,400 a,b | 4,138,316 | Financial—16.4% | |||||||
| Dollar Tree | 112,700 b | 4,323,172 | AmTrust Financial Services | 218,900 a | 3,077,734 | |||||
| Family Dollar Stores | 133,200 | 3,319,344 | Aspen Insurance Holdings | 244,400 | 6,623,240 | |||||
| Fossil | 67,300 a,b | 2,013,616 | Bank of Hawaii | 78,200 | 4,135,216 | |||||
| Gildan Activewear | 120,900 b | 2,825,433 | BioMed Realty Trust | 220,500 a | 5,904,990 | |||||
| Gymboree | 42,500 b | 1,668,125 | Community Bank System | 84,700 a | 1,914,220 | |||||
| Iconix Brand Group | 281,100 a,b | 3,634,623 | Digital Realty Trust | 94,300 a | 4,325,541 | |||||
| JAKKS Pacific | 131,500 a,b | 3,280,925 | Endurance Specialty Holdings | 95,200 | 3,105,424 | |||||
| JoS. A. Bank Clothiers | 155,700 a,b | 4,046,643 | Entertainment Properties Trust | 38,500 a | 2,089,395 | |||||
| LKQ | 359,500 a,b | 6,733,435 | Essex Property Trust | 33,100 a | 3,884,285 | |||||
| MDC Holdings | 74,100 | 3,071,445 | Extra Space Storage | 370,900 a | 5,841,675 | |||||
| Meritage Homes | 179,800 a,b | 4,210,916 | First BanCorp/Puerto Rico | 250,800 | 2,370,060 | |||||
| Panera Bread, Cl. A | 42,100 a,b | 2,262,454 | First Midwest Bancorp | 98,640 a | 2,207,563 | |||||
| Phillips-Van Heusen | 75,500 a | 2,873,530 | First Niagara Financial Group | 265,300 a | 3,968,888 | |||||
| Pool | 178,600 a | 4,332,836 | Greenhill & Co. | 57,500 a | 3,800,750 | |||||
| Rent-A-Center | 90,900 a,b | 2,059,794 | Kilroy Realty | 46,700 a | 2,337,335 | |||||
| Tractor Supply | 47,100 b | 2,007,402 | Lexington Realty Trust | 88,900 a | 1,325,499 | |||||
| Tupperware Brands | 80,700 a | 2,882,604 | Mid-America Apartment Communities | 65,300 a | 3,275,448 | |||||
| Under Armour, Cl. A | 46,300 b | 1,560,773 | National Penn Bancshares | 114,500 a | 1,635,060 | |||||
| WMS Industries | 176,100 a,b | 5,916,960 | National Retail Properties | 293,500 a | 6,659,515 | |||||
| 84,903,074 | Old National Bancorp | 153,200 a | 2,670,276 | |||||||
| Consumer Staples—3.1% | PrivateBancorp | 115,100 a | 3,526,664 | |||||||
| Flowers Foods | 105,000 a | 2,776,200 | Prosperity Bancshares | 87,500 | 2,797,375 | |||||
| NBTY | 88,300 b | 2,935,092 | Senior Housing Properties Trust | 100,300 a | 2,174,504 | |||||
| Ralcorp Holdings | 100,100 a,b | 6,146,140 | Signature Bank | 120,840 a,b | 3,573,239 | |||||
| TreeHouse Foods | 280,400 a,b | 7,783,904 | StanCorp Financial Group | 82,850 a | 4,060,478 | |||||
| 19,641,336 | Susquehanna Bancshares | 204,500 a | 3,267,910 | |||||||
| Energy—6.7% | Texas Capital Bancshares | 267,800 a,b | 4,180,358 | |||||||
| Atwood Oceanics | 124,600 b | 5,066,236 | Trustco Bank | 381,900 a | 3,734,982 | |||||
| CARBO Ceramics | 27,000 | 1,622,700 | UMB Financial | 51,200 a | 2,663,936 | |||||
| ION Geophysical | 143,100 a,b | 2,306,772 | Validus Holdings | 145,400 | 3,469,244 | |||||
| Nordic American Tanker Shipping | 79,500 a | 2,796,810 | 104,600,804 | |||||||
| Oceaneering International | 79,300 a,b | 4,949,113 | Health Care—12.5% | |||||||
| Overseas Shipholding Group | 38,000 a | 2,726,120 | Allscripts Healthcare Solutions | 215,400 b | 3,088,836 | |||||
| Penn Virginia | 121,200 a | 8,021,016 | Alpharma, Cl. A | 69,100 a,b | 2,466,870 | |||||
The Funds 37
| STATEMENT OF INVESTMENTS (continued) |
| BNY Mellon Small Cap Stock Fund (continued) | ||||||||||
| Common Stocks (continued) | Shares | Value ($) | Shares | Value ($) | ||||||
| Health Care (continued) | Industrial (continued) | |||||||||
| Amedisys | 33,700 a,b | 1,793,514 | Kaydon | 118,200 a | 6,587,286 | |||||
| American Medical Systems Holdings | 94,800 a,b | 1,687,440 | Kirby | 159,900 b | 7,321,821 | |||||
| AMERIGROUP | 304,700 b | 7,885,636 | Landstar System | 79,520 | 3,898,070 | |||||
| AmSurg | 210,800 a,b | 5,714,788 | Lennox International | 87,800 | 3,248,600 | |||||
| ArthroCare | 40,600 a,b | 1,040,984 | Lindsay | 37,300 a | 3,055,243 | |||||
| Beckman Coulter | 44,100 | 3,255,462 | Moog, Cl. A | 110,800 a,b | 5,251,920 | |||||
| Cubist Pharmaceuticals | 86,600 a,b | 1,907,798 | Orbital Sciences | 84,800 b | 2,242,112 | |||||
| Dionex | 23,000 a,b | 1,499,370 | Robbins & Myers | 100,500 a | 4,507,425 | |||||
| Endo Pharmaceuticals Holdings | 210,900 b | 4,791,648 | Teledyne Technologies | 44,630 a,b | 2,781,788 | |||||
| Haemonetics | 32,700 b | 2,050,944 | Toro | 64,600 a | 2,640,202 | |||||
| Health Management | Wabtec | 85,200 a | 5,032,764 | |||||||
| Associates, Cl. A | 514,200 a,b | 2,987,502 | Waste Connections | 217,700 a,b | 7,904,687 | |||||
| Healthways | 48,200 a,b | 918,210 | Watson Wyatt Worldwide, Cl. A | 125,600 a | 7,358,904 | |||||
| Immucor | 91,600 a,b | 2,950,436 | Woodward Governor | 84,900 | 3,933,417 | |||||
| Inventiv Health | 167,400 a,b | 3,694,518 | YRC Worldwide | 163,600 b | 2,961,160 | |||||
| iShares Nasdaq | 121,427,920 | |||||||||
| Biotechnology Index Fund | 73,600 a | 6,322,240 | Information Technology—17.0% | |||||||
| K-V Pharmaceutical, Cl. A | 146,100 a,b | 3,294,555 | Advanced Energy Industries | 227,000 a,b | 3,661,510 | |||||
| King Pharmaceuticals | 299,400 b | 3,425,136 | Anixter International | 44,960 a,b | 3,318,498 | |||||
| Lincare Holdings | 94,700 b | 3,125,100 | ANSYS | 113,960 a,b | 5,054,126 | |||||
| Martek Biosciences | 49,200 a,b | 1,643,772 | Atheros Communications | 95,940 a,b | 3,128,603 | |||||
| Meridian Bioscience | 66,000 a | 1,875,720 | Comtech Telecommunications | 113,800 a,b | 5,202,936 | |||||
| Pediatrix Medical Group | 58,900 b | 3,354,355 | Concur Technologies | 65,700 a,b | 2,887,515 | |||||
| Regeneron Pharmaceuticals | 81,700 a,b | 1,774,524 | DST Systems | 49,400 a,b | 3,050,450 | |||||
| Savient Pharmaceuticals | 75,300 a,b | 1,711,569 | Equinix | 45,500 a,b | 3,662,750 | |||||
| Sunrise Senior Living | 61,900 a,b | 1,258,427 | FactSet Research Systems | 49,450 a | 3,101,009 | |||||
| West Pharmaceutical Services | 87,700 a | 4,280,637 | FARO Technologies | 128,900 b | 3,044,618 | |||||
| 79,799,991 | FLIR Systems | 87,000 a,b | 3,105,900 | |||||||
| Industrial—19.1% | Harmonic | 526,400 a,b | 4,632,320 | |||||||
| Acuity Brands | 53,900 a | 2,345,189 | Informatica | 431,100 a,b | 7,272,657 | |||||
| American Superconductor | 67,700 a,b | 1,663,389 | Itron | 106,000 a,b | 10,979,480 | |||||
| Applied Industrial Technologies | 125,800 | 3,662,038 | ManTech International, Cl. A | 54,200 a,b | 3,191,838 | |||||
| Brady, Cl. A | 80,300 a | 2,947,813 | Micros Systems | 110,200 a,b | 3,396,364 | |||||
| Con-way | 66,400 a | 3,260,240 | Microsemi | 263,500 a,b | 7,246,250 | |||||
| Corrections Corp. of America | 148,900 b | 3,960,740 | MKS Instruments | 241,700 a,b | 5,447,918 | |||||
| Curtiss-Wright | 164,500 a | 8,861,615 | Nuance Communications | 199,200 a,b | 3,147,360 | |||||
| DeVry | 71,700 | 3,698,286 | Plexus | 140,000 a,b | 3,924,200 | |||||
| EMCOR Group | 203,700 b | 6,940,059 | Skyworks Solutions | 212,500 b | 2,061,250 | |||||
| EnerSys | 101,200 b | 2,845,744 | Synaptics | 87,800 a,b | 4,595,452 | |||||
| EnPro Industries | 130,000 a,b | 5,479,500 | THQ | 226,700 a,b | 3,473,044 | |||||
| Gardner Denver | 74,800 b | 3,376,472 | Trimble Navigation | 111,700 a,b | 3,781,045 | |||||
| Hexcel | 176,200 b | 3,661,436 | ||||||||
38
| BNY Mellon Small Cap Stock Fund (continued) | ||||||||||
| Common Stocks (continued) | Shares | Value ($) | Shares | Value ($) | ||||||
| Information Technology (continued) | Utilities (continued) | |||||||||
| Varian Semiconductor | Otter Tail | 93,700 a | 3,720,827 | |||||||
| Equipment Associates | 107,605 a,b | 3,475,642 | Southern Union | 164,800 | 4,294,688 | |||||
| Verigy | 145,400 b | 2,685,538 | UGI | 292,300 | 8,038,250 | |||||
| 108,528,273 | 36,781,645 | |||||||||
| Materials—2.9% | Total Common Stocks | |||||||||
| Century Aluminum | 38,500 a,b | 1,877,260 | (cost $609,892,315) | 629,465,942 | ||||||
| H.B. Fuller | 80,300 a | 2,093,421 | ||||||||
| OM Group | 48,200 a,b | 1,788,220 | Other Investment—1.2% | |||||||
| PolyOne | 494,600 b | 4,060,666 | Registered Investment Company; | |||||||
| Rock-Tenn, Cl. A | 158,500 a | 5,813,780 | Dreyfus Institutional Preferred | |||||||
| Texas Industries | 50,400 a | 2,654,568 | Plus Money Market Fund | |||||||
| 18,287,915 | (cost $7,432,000) | 7,432,000 c | 7,432,000 | |||||||
| Telecommunication Services—2.0% | Investment of Cash Collateral | |||||||||
| Alaska Communications | for Securities Loaned—35.3% | |||||||||
| Systems Group | 548,120 a | 5,766,222 | ||||||||
| Registered Investment Company; | ||||||||||
| SBA Communications, Cl. A | 205,900 a,b | 7,192,087 | ||||||||
| Dreyfus Institutional Cash | ||||||||||
| 12,958,309 | Advantage Plus Fund | |||||||||
| Utilities—5.8% | (cost $224,626,982) | 224,626,982 c | 224,626,982 | |||||||
| Atmos Energy | 123,000 | 3,387,420 | ||||||||
| Cleco | 120,500 a | 3,037,805 | Total Investments | |||||||
| (cost $841,951,297) | 135.3% | 861,524,924 | ||||||||
| El Paso Electric | 236,600 b | 5,037,214 | ||||||||
| ITC Holdings | 60,360 a | 3,380,764 | Liabilities, Less Cash and Receivables (35.3%) | (224,610,964) | ||||||
| New Jersey Resources | 162,650 a | 5,884,677 | Net Assets | 100.0% | 636,913,960 | |||||
a All or a portion of these securities are on loan.At August 31, 2008, the total market value of the fund’s securities on loan is $217,646,055 and the total market value of the collateral held by the fund is $227,767,876, consisting of cash collateral of $224,626,982 and U.S. Government and Agency securities valued at $3,140,894. b Non-income producing security. c Investment in affiliated money market mutual fund.
| Portfolio Summary (Unaudited) † | ||||||
| Value (%) | Value (%) | |||||
| Money Market Investments | 36.5 | Energy | 6.7 | |||
| Industrial | 19.1 | Utilities | 5.8 | |||
| Information Technology | 17.0 | Consumer Staples | 3.1 | |||
| Financial | 16.4 | Materials | 2.9 | |||
| Consumer Discretionary | 13.3 | Telecommunication Services | 2.0 | |||
| Health Care | 12.5 | 135.3 | ||||
| † Based on net assets. | ||||||
| See notes to financial statements. | ||||||
The Funds 39
STATEMENT OF INVESTMENTS
August 31, 2008
| BNY Mellon U.S. Core Equity 130/30 Fund | ||||||||||
| Common Stocks—127.7% | Shares | Value ($) | Shares | Value ($) | ||||||
| Consumer Discretionary—13.9% | Financial—16.7% | |||||||||
| Central European | Bank of America | 98,540 b | 3,068,536 | |||||||
| Media Enterprises, Cl. A | 12,080 a,b | 941,153 | Chubb | 53,860 b | 2,585,819 | |||||
| Darden Restaurants | 60,835 b | 1,781,857 | Citigroup | 94,470 b | 1,793,985 | |||||
| Family Dollar Stores | 135,090 b | 3,366,443 | Discover Financial Services | 118,750 b | 1,953,437 | |||||
| Gap | 101,870 b | 1,981,371 | Fifth Third Bancorp | 59,190 b | 934,018 | |||||
| Home Depot | 36,710 b | 995,575 | Goldman Sachs Group | 19,770 b | 3,241,687 | |||||
| McDonald’s | 40,080 b | 2,486,964 | JPMorgan Chase & Co. | 105,600 b | 4,064,544 | |||||
| Newell Rubbermaid | 96,310 b | 1,743,211 | MetLife | 55,620 b | 3,014,604 | |||||
| News, Cl. A | 50,650 b | 717,204 | Morgan Stanley | 32,790 | 1,338,816 | |||||
| News, Cl. B | 44,630 b | 640,887 | National City | 147,900 | 745,416 | |||||
| Omnicom Group | 79,820 b | 3,383,570 | PNC Financial Services Group | 22,580 b | 1,624,631 | |||||
| Phillips-Van Heusen | 20,480 b | 779,469 | T. Rowe Price Group | 12,050 | 715,288 | |||||
| Ross Stores | 80,480 b | 3,236,101 | U.S. Bancorp | 59,520 | 1,896,307 | |||||
| TJX Cos. | 70,210 b | 2,544,410 | Wachovia | 33,500 | 532,315 | |||||
| WMS Industries | 16,880 a | 567,168 | Wells Fargo & Co. | 90,450 b | 2,737,921 | |||||
| 25,165,383 | 30,247,324 | |||||||||
| Consumer Staples—12.9% | Health Care—18.1% | |||||||||
| Cadbury, ADR | 18,258 b | 842,059 | Aetna | 68,790 | 2,967,601 | |||||
| Coca-Cola Enterprises | 63,080 b | 1,076,776 | Baxter International | 61,590 b | 4,173,338 | |||||
| Colgate-Palmolive | 47,020 | 3,574,931 | Becton, Dickinson & Co. | 20,180 | 1,763,328 | |||||
| CVS Caremark | 108,440 b | 3,968,904 | Covidien | 49,590 b | 2,681,331 | |||||
| Dr. Pepper Snapple Group | 54,438 a,b | 1,345,163 | Gilead Sciences | 38,110 a,b | 2,007,635 | |||||
| Estee Lauder, Cl. A | 60,350 b | 3,003,619 | Hospira | 81,430 a,b | 3,286,515 | |||||
| Kroger | 49,930 b | 1,379,067 | Invitrogen | 10,180 a | 432,243 | |||||
| Molson Coors Brewing, Cl. B | 41,270 b | 1,966,515 | Johnson & Johnson | 31,530 b | 2,220,658 | |||||
| Philip Morris International | 66,970 b | 3,596,289 | Laboratory Corp. | |||||||
| Wal-Mart Stores | 43,880 b | 2,591,992 | of America Holdings | 21,540 a,b | 1,575,651 | |||||
| 23,345,315 | Pfizer | 105,890 b | 2,023,558 | |||||||
| Energy—14.3% | Psychiatric Solutions | 16,080 a,b | 607,020 | |||||||
| Anadarko Petroleum | 21,450 b | 1,324,108 | Schering-Plough | 68,680 b | 1,332,392 | |||||
| Chesapeake Energy | 13,158 | 636,847 | St. Jude Medical | 27,580 a | 1,263,991 | |||||
| Chevron | 64,670 b | 5,582,314 | Thermo Fisher Scientific | 69,860 a,b | 4,230,722 | |||||
| ConocoPhillips | 71,030 b | 5,860,685 | Vertex Pharmaceuticals | 20,070 a | 539,080 | |||||
| ENSCO International | 10,960 | 742,869 | Wyeth | 38,450 | 1,664,116 | |||||
| Marathon Oil | 37,480 b | 1,689,224 | 32,769,179 | |||||||
| Nabors Industries | 39,920 a,b | 1,421,152 | Industrials—14.6% | |||||||
| National Oilwell Varco | 15,190 a | 1,119,959 | Allied Waste Industries | 92,280 a,b | 1,240,243 | |||||
| Unit | 11,020 a | 746,385 | Delta Air Lines | 49,650 a,b | 403,654 | |||||
| Valero Energy | 23,460 b | 815,470 | Dover | 29,990 b | 1,480,906 | |||||
| Williams | 67,280 | 2,078,279 | Eaton | 28,750 b | 2,103,925 | |||||
| XTO Energy | 75,547 b | 3,808,324 | Emerson Electric | 41,450 b | 1,939,860 | |||||
| 25,825,616 | General Electric | 118,880 b | 3,340,528 | |||||||
| Exchange Traded Funds—5.0% | Goodrich | 42,240 b | 2,164,800 | |||||||
| Standard & Poor’s Depository | L-3 Communications Holdings | 14,360 b | 1,492,578 | |||||||
| Receipts (Tr. Ser. 1) | 69,840 | 8,994,694 | Lockheed Martin | 29,400 b | 3,423,336 | |||||
40
| BNY Mellon U.S. Core Equity 130/30 Fund (continued) | ||||||||||
| Common Stocks (continued) | Shares | Value ($) | Shares | Value ($) | ||||||
| Industrials (continued) | Materials—2.9% | |||||||||
| Raytheon | 33,750 b | 2,024,662 | Air Products & Chemicals | 19,255 b | 1,768,572 | |||||
| Terex | 57,910 a,b | 2,912,294 | Celanese, Ser. A | 11,540 | 444,982 | |||||
| Textron | 27,470 b | 1,129,017 | Freeport-McMoRan Copper & Gold | 22,600 b | 2,018,632 | |||||
| Tyco International | 63,850 b | 2,737,888 | Mosaic | 9,230 b | 985,210 | |||||
| 26,393,691 | 5,217,396 | |||||||||
| Information Technology—22.2% | Telecommunication Services—3.6% | |||||||||
| Accenture, Cl. A | 27,080 b | 1,120,029 | AT & T | 117,800 b | 3,768,422 | |||||
| Adobe Systems | 35,140 a,b | 1,505,046 | Metropcs Communications | 36,740 a,b | 619,804 | |||||
| Akamai Technologies | 71,770 a,b | 1,643,533 | Sprint Nextel | 247,120 | 2,154,886 | |||||
| Alliance Data Systems | 53,780 a,b | 3,454,827 | 6,543,112 | |||||||
| Amphenol, Cl. A | 38,650 | 1,836,648 | Utilities—3.5% | |||||||
| Apple | 32,270 a,b | 5,470,733 | PG & E | 51,940 b | 2,146,680 | |||||
| BMC Software | 18,260 a | 594,546 | Sempra Energy | 71,230 b | 4,125,642 | |||||
| Cisco Systems | 169,250 a,b | 4,070,463 | 6,272,322 | |||||||
| Concur Technologies | 14,920 a | 655,734 | Total Common Stocks | |||||||
| Dell | 77,650 a,b | 1,687,335 | (cost $237,201,637) | 230,819,026 | ||||||
| Global Payments | 23,080 | 1,112,687 | ||||||||
| Intel | 150,370 b | 3,438,962 | Other Investmant—5.9% | |||||||
| Juniper Networks | 30,490 a | 783,593 | Registered Investment Company; | |||||||
| McAfee | 25,780 a | 1,019,857 | Dreyfus Institutional Preferred | |||||||
| Microsoft | 156,570 b | 4,272,795 | Plus Money Market Fund | |||||||
| Nokia, ADR | 49,750 | 1,252,208 | (cost $10,723,000) | 10,723,000 c | 10,723,000 | |||||
| Oracle | 99,790 a,b | 2,188,395 | ||||||||
| Total Investments | ||||||||||
| QUALCOMM | 21,560 b | 1,135,134 | (cost $247,924,637) | 133.6% | 241,542,026 | |||||
| Research In Motion | 8,780 a,b | 1,067,648 | ||||||||
| Liabilities, Less Cash | ||||||||||
| Sybase | 29,600 a | 1,018,536 | ||||||||
| and Receivables | (33.6%) | (60,725,379) | ||||||||
| Yahoo! | 36,960 a | 716,285 | ||||||||
| 40,044,994 | Net Assets | 100.0% | 180,816,647 | |||||||
| ADR—American Depository Receipts |
a Non-income producing security. b Partially held by a broker as collateral for open short positions. c Investment in affiliated money market mutual fund.
| Portfolio Summary (Unaudited) † | ||||||||
| Value (%) | Value (%) | |||||||
| Information Technology | 22.2 | Money Market Investment | 5.9 | |||||
| Health Care | 18.1 | Exchange Traded Funds | 5.0 | |||||
| Financial | 16.7 | Telecommunication Services | 3.6 | |||||
| Industrials | 14.6 | Utilities | 3.5 | |||||
| Energy | 14.3 | Materials | 2.9 | |||||
| Consumer Discretionary | 13.9 | |||||||
| Consumer Staples | 12.9 | 133.6 | ||||||
| † Based on net assets. | ||||||||
| See notes to financial statements. | ||||||||
| The Funds | 41 | |||||||
| STATEMENT OF SECURITIES SOLD SHORT | ||||||||||
| August 31, 2008 | ||||||||||
| BNY Mellon U.S. Core Equity 130/30 Fund | ||||||||||
| Common Stocks—29.7% | Shares | Value ($) | Shares | Value ($) | ||||||
| Consumer Discretionary— 6.2% | Exchange Traded Funds—.5% | |||||||||
| CBS, Cl. B | 32,930 | 532,807 | Technology Select Sector SPDR Fund | 38,680 | 879,970 | |||||
| Gentex | 56,070 | 893,195 | Financials—1.8% | |||||||
| Harley-Davidson | 38,590 | 1,535,110 | American International Group | 27,420 | 589,256 | |||||
| Lamar Advertising, Cl. A | 26,620 | 988,933 | Keycorp | 52,100 | 625,721 | |||||
| Liberty Media-Interactive, Cl. A | 57,490 a | 781,289 | Lehman Brothers Holdings | 38,770 | 623,809 | |||||
| Mohawk Industries | 26,770 a | 1,848,469 | Regions Financial | 77,070 | 714,439 | |||||
| Nordstrom | 41,150 | 1,279,765 | TFC Financial | 48,990 | 771,593 | |||||
| Sally Beauty Holdings | 115,600 a | 987,224 | 3,324,818 | |||||||
| Tim Hortons | 75,140 | 2,363,904 | Health Care—5.1% | |||||||
| 11,210,696 | C.R. Bard | 16,930 | 1,582,109 | |||||||
| Consumer Staples—5.0% | Edwards Lifesciences | 10,480 a | 620,521 | |||||||
| Brown-Forman, Cl. B | 27,690 | 1,993,957 | IDEXX Laboratories | 31,280 a | 1,761,064 | |||||
| Bunge | 8,400 | 750,624 | Intuitive Surgical | 5,220 a | 1,541,310 | |||||
| Constellation Brands, Cl. A | 47,950 a | 1,012,225 | Lifepoint Hospitals | 17,250 a | 582,015 | |||||
| Hain Celestial Group | 54,600 a | 1,419,054 | Medicis Pharmaceutical, Cl. A | 44,820 | 928,222 | |||||
| Hershey | 25,370 | 915,603 | Mentor | 35,450 | 874,906 | |||||
| Hormel Foods | 42,990 | 1,533,024 | Millipore | 8,250 a | 618,833 | |||||
| Tootsie Roll Industries | 46,800 | 1,332,864 | Patterson | 21,550 a | 701,237 | |||||
| 8,957,351 | 9,210,217 | |||||||||
| Energy—2.9% | Industrials-3.8% | |||||||||
| Dril-Quip | 16,570 a | 911,516 | Alaska Air Group | 24,740 a | 519,787 | |||||
| EOG Resources | 7,870 | 821,785 | Caterpillar | 15,500 | 1,096,315 | |||||
| Noble Energy | 8,670 | 621,899 | Deere & Co. | 30,970 | 2,185,553 | |||||
| Quicksilver Resources | 32,890 a | 795,609 | Rockwell Automation | 20,720 | 978,191 | |||||
| Range Resources | 16,020 | 743,648 | Trinity Industries | 25,450 | 915,691 | |||||
| Southwestern Energy | 35,820 a | 1,374,413 | United Parcel Service, Cl. B | 18,220 | 1,168,266 | |||||
| 5,268,870 | 6,863,803 | |||||||||
42
| BNY Mellon U.S. Core Equity 130/30 Fund | ||||||||||
| Common Stocks (continued) | Shares | Value ($) | Shares | Value ($) | ||||||
| Information Technology—3.9% | Information Technology (continued) | |||||||||
| Automatic Data Processing | 22,190 | 984,792 | SAP, ADR | 9,380 | 526,030 | |||||
| Commscope | 17,000 a | 832,490 | 7,047,800 | |||||||
| Factset Research Systems | 10,610 | 665,353 | Materials—.5% | |||||||
| Hewlett-Packard | 17,880 | 1,405,254 | Alcoa | 15,150 | 486,770 | |||||
| JDS Uniphase | 68,370 a | 694,639 | Weyerhaeuser | 6,330 | 398,418 | |||||
| Molex | 17,690 | 426,683 | 885,188 | |||||||
| Nuance Communications | 27,550 a | 435,290 | Total Securities Sold Short | |||||||
| Paychex | 31,610 | 1,077,269 | (cost $55,451,421) | 29.7% | 53,648,713 | |||||
| ADR-American Depository Receipts | ||||||||||
| a Non-income producing security. | ||||||||||
| See notes to financial statements. | ||||||||||
| Portfolio Summary (Unaudited) † | ||||||
| Value (%) | Value (%) | |||||
| Information Technology | 3.9 | Consumer Discretionary | 6.2 | |||
| Health Care | 5.1 | Consumer Staples | 5.0 | |||
| Financial | 1.8 | Exchange Traded Funds | .5 | |||
| Industrials | 3.8 | Materials | .5 | |||
| Energy | 2.9 | 29.7 | ||||
| † Based on net assets. | ||||||
| See notes to financial statements. | ||||||
The Funds 43
| STATEMENT OF INVESTMENTS | ||||||||||
| August 31, 2008 | ||||||||||
| BNY Mellon International Fund | ||||||||||
| Common Stocks—96.3% | Shares | Value ($) | Shares | Value ($) | ||||||
| Australia—4.3% | France (continued) | |||||||||
| Amcor | 2,811,177 | 13,168,467 | PPR | 53,740 | 6,285,067 | |||||
| Bendigo and Adelaide Bank | 404,830 | 3,980,422 | Sanofi-Aventis | 663,015 | 47,281,790 | |||||
| BHP Billiton | 434,170 | 15,301,185 | Scor | 136,455 | 3,156,938 | |||||
| Computershare | 315,799 | 2,436,103 | Total | 640,012 | 46,049,804 | |||||
| Dexus Property Group | 1,745,846 | 2,188,179 | Total, ADR | 12,872 | 925,239 | |||||
| Goodman Fielder | 6,342,872 | 7,983,343 | Unibail-Rodamco | 17,546 | 3,658,034 | |||||
| Incitec Pivot | 14,120 | 1,913,809 | 189,373,718 | |||||||
| Insurance Australia Group | 3,290,559 | 11,172,335 | Germany—9.1% | |||||||
| National Australia Bank | 468,999 | 9,728,892 | Adidas | 39,960 | 2,347,864 | |||||
| OZ Minerals | 3,245,097 | 4,829,293 | Allianz | 75,811 | 12,690,034 | |||||
| Sonic Healthcare | 153,560 | 1,898,692 | BASF | 99,086 | 5,724,439 | |||||
| Suncorp-Metway | 377,998 | 3,663,257 | Bayer | 79,260 | 6,280,196 | |||||
| Telstra | 906,700 | 3,371,843 | Bayerische Motoren Werke | 324,590 | 13,333,314 | |||||
| Westpac Banking | 247,861 | 4,949,866 | Daimler | 148,630 | 8,700,101 | |||||
| 86,585,686 | Deutsche Bank | 39,990 | 3,414,439 | |||||||
| Austria—.6% | Deutsche Post | 741,088 | 17,395,411 | |||||||
| Erste Group Bank | 89,610 | 5,387,327 | Deutsche Telekom | 1,102,121 | 18,286,762 | |||||
| Raiffeisen International Bank Holding | 31,830 | 3,501,748 | E.ON | 234,830 | 13,728,618 | |||||
| Voestalpine | 48,521 | 2,638,032 | Heidelberger Druckmaschinen | 216,612 | 4,448,929 | |||||
| 11,527,107 | Linde | 31,898 | 4,024,921 | |||||||
| Belgium—2.0% | MAN | 26,710 | 2,619,511 | |||||||
| Colruyt | 20,560 | 5,615,663 | MTU Aero Engines Holding | 396,436 | 13,841,877 | |||||
| Delhaize Group | 319,050 | 20,580,700 | Muenchener Rueckversicherungs | 110,150 | 17,158,217 | |||||
| Fortis Group | 768,176 a | 10,660,972 | RWE | 220,349 | 23,801,856 | |||||
| Groupe Bruxelles Lambert | 29,440 | 3,070,806 | Salzgitter | 14,404 | 2,220,909 | |||||
| 39,928,141 | Siemens | 87,955 | 9,582,094 | |||||||
| Finland—2.1% | ThyssenKrupp | 53,800 | 2,700,103 | |||||||
| Nokia | 1,017,374 | 25,492,559 | 182,299,595 | |||||||
| UPM-Kymmene | 921,451 | 15,816,232 | Greece—1.1% | |||||||
| 41,308,791 | Alpha Bank | 183,120 | 4,695,936 | |||||||
| France—9.4% | Public Power | 662,746 | 16,762,134 | |||||||
| AXA | 83,510 | 2,678,142 | 21,458,070 | |||||||
| BNP Paribas | 177,869 | 16,042,759 | Hong Kong—2.9% | |||||||
| Cap Gemini | 72,285 | 4,289,549 | BOC Hong Kong Holdings | 7,694,600 | 17,153,281 | |||||
| Casino Guichard Perrachon | 65,223 | 6,409,008 | CITIC International | |||||||
| CNP Assurances | 18,130 | 2,180,739 | Financial Holdings | 2,949,000 a | 2,370,030 | |||||
| Credit Agricole | 903,144 | 19,238,382 | Esprit Holdings | 693,200 | 5,733,946 | |||||
| France Telecom | 579,489 | 17,117,556 | Hang Seng Bank | 202,000 | 3,993,230 | |||||
| GDF SUEZ | 124,278 | 7,183,489 | Hutchison Whampoa | 1,209,700 | 11,240,236 | |||||
| Lagardere | 122,717 | 6,877,222 | Hysan Development | 1,093,000 | 2,995,637 | |||||
44
| BNY Mellon International Fund (continued) | ||||||||||
| Common Stocks (continued) | Shares | Value ($) | Shares | Value ($) | ||||||
| Hong Kong (continued) | Japan (continued) | |||||||||
| Johnson Electric Holdings | 10,799,500 | 4,385,167 | Matsushita Electric Industrial | 179,000 | 3,681,640 | |||||
| Wharf Holdings | 850,500 | 3,082,226 | Mitsubishi Chemical Holdings | 1,245,000 | 7,006,239 | |||||
| Yue Yuen Industrial Holdings | 2,463,500 | 6,836,204 | Mitsubishi Rayon | 3,349,000 | 9,051,091 | |||||
| 57,789,957 | Mitsubishi Tanabe Pharma | 171,000 | 2,402,999 | |||||||
| Ireland—.2% | Mitsubishi UFJ Financial Group | 1,152,000 | 8,772,753 | |||||||
| Bank of Ireland | 240,354 | 1,929,242 | Mitsubishi UFJ Lease & Finance | 66,270 | 2,326,185 | |||||
| Kerry Group, Cl. A | 105,930 | 2,867,215 | Mitsui & Co. | 184,000 | 3,158,996 | |||||
| 4,796,457 | Mitsui OSK Lines | 398,000 | 4,735,657 | |||||||
| Italy—4.7% | Murata Manufacturing | 93,600 | 4,108,350 | |||||||
| Banco Popolare | 625,030 | 11,975,371 | NGK Spark Plug | 948,100 | 10,449,217 | |||||
| Buzzi Unicem | 83,168 | 1,650,329 | Nikon | 113,000 | 3,671,055 | |||||
| Enel | 724,180 | 6,666,612 | Nintendo | 15,700 | 7,420,511 | |||||
| ENI | 589,254 | 19,182,481 | Nippon Telegraph & Telephone | 631 | 3,097,930 | |||||
| Mediaset | 1,828,588 | 13,238,780 | Nippon Yusen | 290,800 | 2,328,226 | |||||
| Prysmian | 209,811 | 5,155,704 | Nissan Motor | 1,048,900 | 8,002,269 | |||||
| Telecom Italia | 9,243,189 | 14,984,044 | Nomura Holdings | 1,228,900 | 16,360,011 | |||||
| UniCredit | 2,318,120 | 12,506,435 | Nomura Real Estate Holdings | 111,300 | 2,289,039 | |||||
| Unipol Gruppo Finanziario | 3,412,261 | 8,460,068 | Ricoh | 316,800 | 5,213,217 | |||||
| 93,819,824 | Rohm | 154,800 | 8,873,995 | |||||||
| Japan—21.1% | Seiko Epson | 111,400 | 3,208,291 | |||||||
| Aeon | 1,270,600 | 14,575,123 | Sekisui Chemical | 808,700 | 5,019,274 | |||||
| Bank of Yokohama | 523,000 | 2,795,830 | Sekisui House | 220,800 | 2,098,903 | |||||
| Canon | 313,951 | 14,048,122 | Sharp | 574,000 | 7,302,278 | |||||
| Central Japan Railway | 1,131 | 11,790,477 | Shimamura | 216,800 | 12,086,041 | |||||
| Chiba Bank | 978,000 | 5,349,758 | Shionogi & Co. | 115,000 | 2,596,847 | |||||
| Chiyoda | 931,500 | 7,745,549 | Sony | 130,900 | 5,012,214 | |||||
| Chuo Mitsui Trust Holdings | 1,855,700 | 10,167,841 | Sumitomo | 808,200 | 10,085,923 | |||||
| Daihatsu Motor | 709,000 | 8,749,173 | Sumitomo Electric Industries | 284,900 | 3,264,268 | |||||
| Daiwa House Industry | 1,030,000 | 10,114,637 | Sumitomo Mitsui | |||||||
| Dentsu | 1,678 | 3,375,747 | Financial Group | 4,446 | 27,050,669 | |||||
| Hitachi Chemical | 121,000 | 2,196,359 | Taiheiyo Cement | 3,044,000 | 5,002,500 | |||||
| Hosiden | 131,900 | 2,198,334 | Takata | 416,900 | 7,149,764 | |||||
| INPEX Holdings | 182 | 1,968,939 | Takeda Pharmaceutical | 200,900 | 10,476,063 | |||||
| Isuzu Motors | 1,962,000 | 7,372,523 | Teijin | 876,800 | 2,817,033 | |||||
| JFE Holdings | 55,500 | 2,334,194 | THK | 388,600 | 6,355,056 | |||||
| JS Group | 670,100 | 9,097,175 | Tokio Marine Holdings | 139,000 | 4,721,200 | |||||
| KDDI | 2,309 | 13,437,805 | Tokyo Electron | 141,900 | 8,054,668 | |||||
| Konica Minolta Holdings | 202,000 | 2,778,084 | Tokyo Gas | 3,192,400 | 13,317,692 | |||||
| Kubota | 1,381,500 | 9,628,997 | Toppan Printing | 489,000 | 4,408,335 | |||||
| Marubeni | 766,000 | 4,759,855 | Tosoh | 496,000 | 1,798,520 | |||||
| The Funds |
| 45 |
| STATEMENT OF INVESTMENTS (continued) |
| BNY Mellon International Fund (continued) | ||||||||||
| Common Stocks (continued) | Shares | Value ($) | Shares | Value ($) | ||||||
| Japan (continued) | Sweden (continued) | |||||||||
| Toyo Engineering | 636,000 | 3,320,193 | Telefonaktiebolaget | |||||||
| Toyota Motor | 347,300 | 15,567,303 | LM Ericsson, Cl. B | 1,121,980 | 12,697,000 | |||||
| Yamada Denki | 55,470 | 4,000,606 | 41,956,838 | |||||||
| Switzerland—8.5% | ||||||||||
| Yamaguchi Financial Group | 398,000 | 4,572,112 | ||||||||
| Adecco | 39,320 | 1,853,252 | ||||||||
| 426,719,655 | ||||||||||
| Baloise Holding | 34,839 | 2,989,861 | ||||||||
| Luxembourg—.1% | ||||||||||
| Ciba Holding | 642,835 | 15,890,631 | ||||||||
| ArcelorMittal | 23,230 | 1,832,118 | ||||||||
| Clariant | 719,564 a | 6,488,917 | ||||||||
| Netherlands—3.1% | Compagnie Financiere | |||||||||
| Aalberts Industries | 114,710 | 1,772,044 | Richemont, Cl. A | 62,370 | 3,644,834 | |||||
| Aegon | 903,367 | 10,661,915 | Credit Suisse Group | 121,810 | 5,658,250 | |||||
| European Aeronautic | Logitech International | 87,450 a | 2,342,801 | |||||||
| Defence and Space | 183,387 | 4,124,351 | Lonza Group | 21,119 | 2,988,094 | |||||
| ING Groep | 206,674 | 6,470,312 | Nestle | 907,610 | 40,057,981 | |||||
| Koninklijke BAM Groep | 182,825 | 3,242,700 | Novartis | 951,752 | 53,199,233 | |||||
| Koninklijke DSM | 47,830 | 2,759,747 | Roche Holding | 45,675 | 7,715,161 | |||||
| Koninklijke Philips | Swiss Reinsurance | 160,881 | 9,927,679 | |||||||
| Electronics | 206,770 | 6,746,325 | UBS | 640,844 a | 14,048,925 | |||||
| Koninklijke Philips | Zurich Financial Services | 14,930 | 3,911,642 | |||||||
| Electronics (NY Shares) | 4,620 | 149,734 | ||||||||
| 170,717,261 | ||||||||||
| Royal Dutch Shell, Cl. A | 710,910 | 24,848,059 | United Kingdom—20.8% | |||||||
| Wolters Kluwer | 100,483 | 2,454,436 | Anglo American | 300,951 | 16,084,659 | |||||
| 63,229,623 | AstraZeneca | 137,960 | 6,772,385 | |||||||
| Norway—.2% | BP | 5,243,277 | 50,536,516 | |||||||
| StatoilHydro | 134,700 | 4,160,666 | British American Tobacco | 266,386 | 9,036,700 | |||||
| Singapore—1.3% | Centrica | 2,694,590 | 16,074,018 | |||||||
| DBS Group Holdings | 1,782,844 | 22,565,198 | Charter | 177,450 | 3,079,393 | |||||
| Oversea-Chinese Banking | 451,700 | 2,564,847 | Cookson Group | 475,197 | 5,626,068 | |||||
| 25,130,045 | Dana Petroleum | 62,049 a | 1,703,381 | |||||||
| Spain—2.2% | Debenhams | 3,697,854 | 3,353,474 | |||||||
| Banco Santander | 738,272 | 12,607,074 | Friends Provident | 2,771,497 | 5,001,517 | |||||
| Corporacion Financiera Alba | 55,671 | 2,938,564 | GlaxoSmithKline | 1,474,439 | 34,845,881 | |||||
| Mapfre | 568,360 | 2,726,567 | Greene King | 296,100 | 2,893,046 | |||||
| Repsol | 510,200 | 15,867,965 | HBOS | 808,452 | 4,653,178 | |||||
| Telefonica | 303,350 | 7,525,451 | HSBC Holdings | 2,900,492 | 45,760,510 | |||||
| Union Fenosa | 103,020 | 2,622,201 | Imperial Tobacco Group | 230,080 | 7,599,573 | |||||
| 44,287,822 | Kingfisher | 4,300,316 | 10,464,868 | |||||||
| Sweden—2.1% | Land Securities Group | 116,450 | 2,886,892 | |||||||
| Alfa Laval | 379,975 | 5,213,045 | National Grid | 343,990 | 4,480,228 | |||||
| Nordea Bank | 416,800 | 5,550,269 | Old Mutual | 6,113,902 | 10,877,282 | |||||
| Sandvik | 726,500 | 9,066,187 | Pearson | 174,220 | 2,156,353 | |||||
| Svenska Cellulosa, Cl. B | 827,650 | 9,430,337 | Punch Taverns | 888,727 | 4,718,309 | |||||
46
| BNY Mellon International Fund (continued) | ||||||||||
| Common Stocks (continued) | Shares | Value ($) | Shares | Value ($) | ||||||
| United Kingdom (continued) | United States—.5% | |||||||||
| Rexam | 325,490 | 2,408,883 | iShares MSCI EAFE Index Fund | 147,930 | 9,403,910 | |||||
| Royal Bank of Scotland Group | 1,902,586 | 8,141,455 | Total Common Stocks | |||||||
| Royal Dutch Shell, Cl. A | 45,266 | 1,585,082 | (cost $2,296,929,649) | 1,935,087,327 | ||||||
| Royal Dutch Shell, Cl. B | 378,770 | 13,063,177 | ||||||||
| RSA Insurance Group | 1,646,197 | 4,525,174 | Preferred Stocks—1.4% | |||||||
| Sage Group | 562,800 | 2,154,396 | Germany | |||||||
| Scottish & Southern Energy | 130,700 | 3,447,436 | Fresenius | 59,840 | 4,888,051 | |||||
| Stagecoach Group | 726,950 | 4,237,085 | Henkel & Co. | 578,040 | 22,692,844 | |||||
| Standard Chartered | 195,540 | 5,314,536 | Total Preferred Stocks | |||||||
| Standard Life | 835,470 | 3,822,581 | (cost $32,026,613) | 27,580,895 | ||||||
| Tesco | 1,708,677 | 11,882,467 | ||||||||
| Thomas Cook Group | 1,320,020 | 5,510,209 | Other Investment—.7% | |||||||
| Trinity Mirror | 998,420 | 1,956,473 | Registered Investment Company; | |||||||
| Tullet Prebon | 233,280 | 1,877,415 | Dreyfus Institutional Preferred | |||||||
| Unilever | 1,142,211 | 30,752,395 | Plus Money Market Fund | |||||||
| Vedanta Resources | 62,395 | 2,071,151 | (cost $13,500,000) | 13,500,000 b 13,500,000 | ||||||
| Vodafone Group | 15,812,172 | 40,655,259 | Total Investments | |||||||
| WM Morrison Supermarkets | 590,894 | 3,042,847 | (cost $2,342,456,262) | 98.4% | 1,976,168,222 | |||||
| WPP Group | 1,902,700 | 18,642,360 | Cash and Receivables (Net) | 1.6% | 32,765,192 | |||||
| Xstrata | 90,670 | 5,067,431 | ||||||||
| Net Assets | 100.0% | 2,008,933,414 | ||||||||
| 418,762,043 | ||||||||||
| ADR—American Depository Receipts |
a Non-income producing security. b Investment in affiliated money market mutual fund.
| Portfolio Summary (Unaudited) † | ||||||
| Value (%) | Value (%) | |||||
| Financial | 20.6 | Telecommunication Services | 5.9 | |||
| Consumer Discretionary | 11.5 | Utilities | 5.4 | |||
| Industrial | 9.8 | Information Technology | 5.1 | |||
| Consumer Staples | 9.1 | Insurance | 4.4 | |||
| Energy | 9.1 | Money Market Investment | .7 | |||
| Health Care | 8.6 | Index | .5 | |||
| Materials | 7.7 | 98.4 | ||||
| † Based on net assets. | ||||||
| See notes to financial statements. | ||||||
The Funds 47
| STATEMENT OF INVESTMENTS | ||||||||||
| August 31, 2008 | ||||||||||
| BNY Mellon Emerging Markets Fund | ||||||||||
| Common Stocks—93.2% | Shares | Value ($) | Shares | Value ($) | ||||||
| Brazil—10.3% | China (continued) | |||||||||
| Banco Itau Holding Financeira, ADR | 265,837 | 5,050,903 | Dongfeng Motor Group, Cl. H | 2,106,000 | 889,530 | |||||
| Braskem, ADR | 40,000 | 584,400 | Harbin Power Equipment, Cl. H | 746,000 | 922,677 | |||||
| Centrais Eletricas Brasileiras | 387,203 | 7,007,662 | Huaneng Power International, ADR | 36,621 | 1,098,630 | |||||
| Cia de Saneamento Basico | Huaneng Power International, Cl. H | 10,224,200 | 7,666,820 | |||||||
| do Estado de Sao Paulo | 127,508 | 2,885,749 | Industrial & Commercial | |||||||
| Cia de Saneamento Basico | Bank of China, Cl. H | 5,048,000 | 3,467,191 | |||||||
| do Estado de Sao Paulo, ADR | 12,400 | 555,520 | PetroChina, ADR | 41,940 | 5,418,648 | |||||
| Cia de Saneamento de Minas Gerais | 248,100 | 3,751,942 | PetroChina, Cl. H | 13,650,000 | 17,620,734 | |||||
| Cia Energetica de Minas Gerais, ADR | 173,163 | 3,736,858 | Shanda Interactive | |||||||
| Cia Vale do Rio Doce, ADR | 104,020 | 2,761,731 | Entertainment, ADR | 35,110 a | 930,064 | |||||
| Empresa Brasileira | Sinopec Shanghai | |||||||||
| de Aeronautica, ADR | 105,130 | 3,569,164 | Petrochemical, Cl. H | 11,220,000 | 3,531,255 | |||||
| Grendene | 679,200 | 6,375,313 | Sinotrans, Cl. H | 16,266,600 | 3,681,657 | |||||
| Medial Saude | 173,300 | 1,302,408 | TPV Technology | 12,112,000 | 5,929,867 | |||||
| Petroleo Brasileiro (Preferred), ADR | 1,023,730 | 43,989,678 | Weichai Power, Cl. H | 235,000 | 1,084,953 | |||||
| Petroleo Brasileiro, ADR | 43,520 | 2,295,245 | Weiqiao Textile, Cl. H | 10,741,400 | 8,526,793 | |||||
| Redecard | 57,300 | 1,020,502 | Yanzhou Coal Mining, Cl. H | 488,000 | 846,417 | |||||
| Tam, ADR | 297,065 | 5,780,885 | 90,284,086 | |||||||
| Tele Norte Leste Participacoes, ADR | 530,398 | 12,315,842 | Czech Republic—.4% | |||||||
| Unibanco—Uniao de | CEZ | 10,110 | 762,757 | |||||||
| Bancos Brasileiros (Units) | 88,800 | 1,051,980 | Komercni Banka | 18,580 | 4,107,499 | |||||
| Unibanco—Uniao de | 4,870,256 | |||||||||
| Bancos Brasileiros, GDR | 76,670 | 9,166,665 | Egypt—.1% | |||||||
| Votorantim Celulose e Papel, ADR | 278,010 | 5,871,571 | Telecom Egypt | 388,934 | 1,186,701 | |||||
| 119,074,018 | Hong Kong—6.3% | |||||||||
| Chile—.2% | Brilliance China | |||||||||
| Banco Santander Chile, ADR | 28,100 | 1,236,681 | Automotive Holdings | 27,353,000 a | 2,822,512 | |||||
| Cia Cervecerias Unidas | 160,330 | 1,125,671 | Chaoda Modern Agriculture | 946,000 | 1,004,069 | |||||
| CorpBanca | 52,611,942 | 287,301 | China Agri-Industries Holdings | 1,587,519 a | 1,072,530 | |||||
| 2,649,653 | China Mobile | 938,400 | 10,668,780 | |||||||
| China—7.9% | China Mobile, ADR | 53,680 | 3,044,730 | |||||||
| Aluminum Corp. of China, Cl. H | 730,500 | 647,365 | China Netcom Group | 3,220,500 | 7,671,646 | |||||
| Anhui Expressway, Cl. H | 4,146,000 | 2,595,772 | China Power International | |||||||
| Bank of China, Cl. H | 23,400,000 | 10,089,321 | Development | 27,861,400 | 8,557,511 | |||||
| Bosideng International Holdings | 23,064,000 | 3,665,581 | CNOOC | 3,661,000 | 5,700,240 | |||||
| China Construction Bank, Cl. H | 1,724,000 | 1,400,358 | CNOOC, ADR | 5,840 | 909,639 | |||||
| China COSCO Holdings, Cl. H | 377,500 | 720,325 | Cosco Pacific | 6,394,000 | 9,758,044 | |||||
| China Molybdenum, Cl. H | 1,078,000 | 703,852 | Denway Motors | 10,360,700 | 3,694,661 | |||||
| China Telecom, Cl. H | 7,605,000 | 3,885,029 | Global Bio-Chem | |||||||
| Dongfang Electric Machinery, Cl. H | 1,603,000 | 4,961,247 | Technology Group | 15,802,800 | 5,986,654 | |||||
48
| BNY Mellon Emerging Markets Fund (continued) | ||||||||||
| Common Stocks (continued) | Shares | Value ($) | Shares | Value ($) | ||||||
| Hong Kong (continued) | Indonesia (continued) | |||||||||
| Hopson Development Holdings | 2,354,000 | 2,340,525 | Telekomunikasi Indonesia | 11,845,900 | 10,329,221 | |||||
| NWS Holdings | 1,033,544 | 2,286,042 | 19,199,768 | |||||||
| Shanghai Industrial Holdings | 1,060,000 | 2,859,662 | Israel—1.3% | |||||||
| Texwinca Holdings | 4,973,600 | 4,271,090 | Bank Hapoalim | 698,290 | 2,738,010 | |||||
| 72,648,335 | Check Point Software Technologies | 52,970 a | 1,297,235 | |||||||
| Hungary—1.1% | Israel Chemicals | 60,000 | 1,004,675 | |||||||
| Magyar Telekom | Israel Discount Bank, Cl. A | 3,386,976 a | 5,588,168 | |||||||
| Telecommunications | 1,367,200 | 7,027,325 | Teva Pharmaceutical Industries, ADR | 85,640 | 4,054,198 | |||||
| Richter Gedeon | 28,140 | 5,576,401 | 14,682,286 | |||||||
| 12,603,726 | Malaysia—4.5% | |||||||||
| India—7.5% | AMMB Holdings | 2,398,362 | 2,152,130 | |||||||
| Andhra Bank | 1,512,250 | 1,914,149 | Gamuda | 8,586,800 | 6,510,211 | |||||
| Bank of India | 244,650 | 1,469,176 | Genting | 1,537,800 | 2,637,866 | |||||
| Bharat Petroleum | 1,378,317 | 9,379,805 | Hong Leong Bank | 1,144,700 | 1,931,742 | |||||
| Hindalco Industries | 513,030 | 1,421,389 | KLCC Property Holdings | 861,300 | 687,304 | |||||
| Hindalco Industries (Rights) | 219,870 a | 111,625 | Malayan Banking | 7,293,550 | 16,812,133 | |||||
| Hindalco Industries, GDR | 1,524,430 b | 4,386,700 | Resorts World | 6,129,300 | 4,877,981 | |||||
| Hindustan Petroleum | 1,638,423 | 7,409,525 | RHB Capital | 744,700 | 914,244 | |||||
| ICICI Bank, ADR | 144,360 | 4,478,047 | Sime Darby | 3,219,000 | 6,436,708 | |||||
| India Cements | 1,626,054 | 5,064,901 | Tenaga Nasional | 3,710,700 | 8,597,221 | |||||
| Jet Airways India | 243,895 | 2,594,619 | 51,557,540 | |||||||
| Mahanagar Telephone Nigam | 1,610,538 | 3,604,772 | Mexico—4.5% | |||||||
| Mahanagar Telephone Nigam, ADR | 262,740 | 1,224,368 | Alfa, Cl. A | 391,600 | 2,041,259 | |||||
| Mahindra & Mahindra | 503,727 | 6,554,424 | Cemex (Units) | 2,233,908 a | 4,477,484 | |||||
| Oil & Natural Gas | 338,093 | 7,695,311 | Cemex, ADR | 112,091 a | 2,247,425 | |||||
| Rolta India | 136,720 | 1,004,772 | Consorcio ARA | 4,389,500 | 3,457,728 | |||||
| Satyam Computer Services | 352,230 | 3,311,964 | Controladora Comercial | |||||||
| Sesa Goa | 80,137 | 286,320 | Mexicana (Units) | 1,629,700 | 4,068,406 | |||||
| State Bank of India, GDR | 151,490 b | 9,619,615 | Embotelladoras Arca | 1,509,000 | 5,194,972 | |||||
| Steel Authority of India | 1,132,302 | 3,926,292 | Fomento Economico Mexicano, ADR | 34,820 | 1,546,705 | |||||
| Sterlite Industries (India) | 143,460 | 2,030,958 | Gruma, Cl. B | 1,933,966 a | 5,463,686 | |||||
| Sterlite Industries (India), ADR | 237,350 | 3,375,117 | Grupo Aeroportuario del Sureste, Cl. B | 167,800 | 799,448 | |||||
| Tata Consultancy Services | 200,300 | 3,669,478 | Grupo Continental | 3,804,840 | 9,250,541 | |||||
| Tata Motors | 71,890 | 716,019 | Grupo Financiero Banorte, Cl. O | 184,800 | 740,440 | |||||
| Tata Steel | 56,431 | 765,750 | Grupo Modelo, Ser. C | 853,100 | 4,087,646 | |||||
| 86,015,096 | Kimberly-Clark de Mexico, Cl. A | 790,500 | 3,455,591 | |||||||
| Indonesia—1.7% | Telefonos de Mexico, ADR, Ser. L | 106,620 | 2,619,653 | |||||||
| Gudang Garam | 7,156,200 | 5,027,454 | Telmex Internacional, ADR | 158,990 | 2,243,349 | |||||
| Kalbe Farma | 47,028,000 | 3,843,093 | 51,694,333 | |||||||
| The Funds |
| 49 |
| STATEMENT OF INVESTMENTS (continued) | ||||||||||
| BNY Mellon Emerging Markets Fund (continued) | ||||||||||
| Common Stocks (continued) | Shares | Value ($) | Shares | Value ($) | ||||||
| Philippines—.9% | South Africa (continued) | |||||||||
| ABS-CBN Holdings | 1,568,300 | 602,917 | MTN Group | 117,269 | 1,807,443 | |||||
| Bank of the Philippine Islands | 5,281,261 | 5,319,132 | Nampak | 3,924,305 | 7,494,288 | |||||
| Manila Electric | 1,112,210 | 1,344,304 | Nedbank Group | 840,560 | 11,378,545 | |||||
| Metropolitan Bank & Trust | 2,070,900 | 1,698,132 | Remgro | 50,100 | 1,216,784 | |||||
| Union Bank of the Philippines | 1,880,400 | 1,289,352 | Sanlam | 1,806,501 | 4,168,036 | |||||
| 10,253,837 | Sappi | 725,047 | 7,606,047 | |||||||
| Poland—1.6% | Sappi, ADR | 100 | 1,060 | |||||||
| Bank Pekao | 49,820 | 3,976,914 | Sasol | 157,593 | 8,700,116 | |||||
| BRE Bank | 10,530 a | 1,645,892 | Standard Bank Group | 254,607 | 2,976,893 | |||||
| KGHM Polska Miedz | 26,730 | 910,341 | Steinhoff International Holdings | 2,028,346 | 4,861,706 | |||||
| Polski Koncern Naftowy Orlen | 408,820 | 5,950,858 | Telkom | 268,710 | 4,866,627 | |||||
| Telekomunikacja Polska | 528,137 | 5,315,785 | 95,375,756 | |||||||
| 17,799,790 | South Korea—14.7% | |||||||||
| Russia—6.8% | CJ Home Shopping | 14,370 | 875,526 | |||||||
| Cherepovets MK Severstal, GDR | 28,350 b | 477,698 | Daehan Steel | 13,140 | 793,312 | |||||
| Gazprom, ADR | 1,038,630 | 40,506,570 | Dongbu Insurance | 23,430 | 656,466 | |||||
| LUKOIL, ADR | 342,350 | 25,436,605 | Hana Financial Group | 146,475 | 5,160,988 | |||||
| MMC Norilsk Nickel, ADR | 286,800 | 5,666,136 | Hanwha Chemical | 456,313 | 4,297,476 | |||||
| Mobile Telesystems, ADR | 16,780 | 1,141,040 | Honam Petrochemical | 13,378 | 792,638 | |||||
| Surgutneftegaz, ADR | 236,900 | 1,705,680 | Hyundai Department Store | 9,560 | 780,119 | |||||
| VTB Bank, GDR | 496,600 b | 2,775,994 | Hyundai Marine | |||||||
| 77,709,723 | & Fire Insurance | 51,290 | 847,511 | |||||||
| South Africa—8.3% | Hyundai Mobis | 78,792 | 6,544,638 | |||||||
| ABSA Group | 46,000 | 650,723 | Hyundai Motor | 117,779 | 7,682,423 | |||||
| AngloGold Ashanti, ADR | 478,818 | 12,889,781 | Kookmin Bank | 357,299 | 19,602,372 | |||||
| ArcelorMittal South Africa | 61,587 | 1,456,166 | Korea Electric Power | 392,425 | 11,868,688 | |||||
| Aspen Pharmacare Holdings | 83,765 a | 508,738 | KT | 40,250 | 1,647,942 | |||||
| Aveng | 194,201 | 1,670,166 | KT & G | 9,553 | 803,016 | |||||
| Bidvest Group | 346,892 | 5,137,472 | KT, ADR | 442,840 | 9,016,222 | |||||
| FirstRand | 4,456,100 | 9,505,575 | Kumho Tire | 708,580 | 5,333,417 | |||||
| Gold Fields, ADR | 494,970 | 4,504,227 | LG | 35,683 | 2,037,091 | |||||
| JD Group | 837,168 | 3,273,629 | LG Chem | 8,525 | 737,445 | |||||
| Metropolitan Holdings | 422,000 | 701,734 | LG Fashion | 35,270 | 923,947 | |||||
50
| BNY Mellon Emerging Markets Fund (continued) | ||||||||||
| Common Stocks (continued) | Shares | Value ($) | Shares | Value ($) | ||||||
| South Korea (continued) | Taiwan (continued) | |||||||||
| LG Telecom | 71,720 | 626,022 | Yageo | 18,818,960 | 5,573,853 | |||||
| Lotte Shopping | 31,793 | 8,637,339 | 106,946,813 | |||||||
| Nong Shim | 10,184 | 2,047,381 | Thailand—3.4% | |||||||
| POSCO | 31,184 | 13,398,637 | Bangkok Bank | 733,600 | 2,493,227 | |||||
| POSCO, ADR | 22,950 | 2,457,945 | Charoen Pokphand Foods | 52,068,200 | 5,885,165 | |||||
| S-Oil | 69,657 | 4,129,433 | Electricity Generating | 319,900 | 690,414 | |||||
| Samsung Electronics | 62,017 | 29,126,404 | Kasikornbank | 3,779,900 | 7,740,014 | |||||
| Shinhan Financial Group | 213,262 | 9,759,328 | Krung Thai Bank | 37,705,900 | 8,324,691 | |||||
| SK Telecom, ADR | 906,870 | 18,500,148 | PTT | 146,000 | 1,127,618 | |||||
| Woori Finance Holdings | 64,860 | 852,035 | Siam Cement | 1,384,700 | 6,795,026 | |||||
| 169,935,909 | Thai Airways International | 5,658,700 | 2,389,970 | |||||||
| Taiwan—9.3% | Thai Union Frozen Products | 5,910,100 | 3,195,937 | |||||||
| Acer | 470,000 | 937,298 | Total Access Communications | 468,700 | 561,711 | |||||
| China Motor | 4,611,413 | 2,701,824 | 39,203,773 | |||||||
| Chinatrust Financial Holding | 10,814,458 | 6,947,575 | Turkey—2.1% | |||||||
| Compal Electronics | 14,387,011 | 12,860,073 | Haci Omer Sabanci Holding | 275,897 | 1,164,515 | |||||
| First Financial Holding | 5,102,622 | 3,842,695 | Selcuk Ecza Deposu | |||||||
| Gigabyte Technology | 1,196,000 | 827,120 | Ticaret ve Sanayi | 814,594 | 1,134,628 | |||||
| Mega Financial Holding | 10,479,000 | 6,578,332 | Trakya Cam Sanayii | 230,118 a | 314,698 | |||||
| Nan Ya Printed Circuit Board | 1,029,971 | 4,803,832 | Tupras Turkiye Petrol Rafine | 52,700 | 1,245,653 | |||||
| Nien Hsing Textile | 1,846,000 | 707,493 | Turk Sise ve Cam Fabrikalari | 3,938,103 a | 5,352,310 | |||||
| Polaris Securities | 1,395,080 | 644,923 | Turkcell Iletisim Hizmet | 496,350 | 3,331,067 | |||||
| Powerchip Semiconductor | 14,188,393 a | 2,492,468 | Turkcell Iletisim Hizmet, ADR | 63,460 | 1,050,263 | |||||
| Powertech Technology | 481,700 | 1,489,791 | Turkiye Garanti Bankasi | 1,170,770 a | 3,518,438 | |||||
| Quanta Computer | 11,393,902 | 17,092,232 | Turkiye Is Bankasi, Cl. C | 1,392,879 | 6,702,187 | |||||
| SinoPac Financial Holdings | 31,900,225 | 11,086,794 | 23,813,759 | |||||||
| Taiwan Mobile | 504,999 | 906,263 | United Kingdom—.1% | |||||||
| Taiwan Semiconductor | JKX Oil & Gas | 141,030 | 1,115,715 | |||||||
| Manufacturing | 5,104,615 | 9,444,507 | United States—.2% | |||||||
| Taiwan Semiconductor | iShares MSCI Emerging | |||||||||
| Manufacturing, ADR | 430,756 | 4,182,641 | Markets Index Fund | 51,000 c | 2,045,100 | |||||
| Tong Yang Industry | 912,649 | 643,830 | Total Common Stocks | |||||||
| United Microelectronics | 31,497,397 | 13,183,269 | (cost $1,147,858,242) | 1,070,665,973 | ||||||
The Funds 51
| STATEMENT OF INVESTMENTS (continued) | ||||||||||||
| BNY Mellon Emerging Markets Fund (continued) | ||||||||||||
| Preferred Stocks—3.0% | Shares | Value ($) | Other Investment—.9% | Shares | Value ($) | |||||||
| Brazil | Registered Investment Company; | |||||||||||
| Banco Bradesco | 45,500 | 836,028 | Dreyfus Institutional Preferred | |||||||||
| Braskem, Cl. A | 902,700 | 6,468,427 | Plus Money Market Fund | |||||||||
| Centrais Eletricas Brasileiras, Cl. B | 162,409 | 2,494,921 | (cost $10,100,000) | 10,100,000 d | 10,100,000 | |||||||
| Cia de Tecidos do Norte | Investment of Cash Collateral | |||||||||||
| de Minas—Coteminas | 1,204,160 a | 4,691,053 | for Securities Loaned—.1% | |||||||||
| Cia Energetica de Minas Gerais | 247,994 | 5,353,932 | ||||||||||
| Registered Investment Company; | ||||||||||||
| Cia Paranaense de Energia, Cl. B | 92,100 | 1,582,086 | ||||||||||
| Dreyfus Institutional Cash | ||||||||||||
| Cia Vale do Rio Doce, Cl. A | 159,900 | 3,727,730 | ||||||||||
| Advantage Plus Fund | ||||||||||||
| Petroleo Brasileiro | 236,800 | 5,070,135 | (cost $731,808) | 731,808 d | 731,808 | |||||||
| Tele Norte Leste Participacoes | 48,900 | 1,138,500 | ||||||||||
| Telemig Celular Participacoes | 76,851 | 1,961,351 | Total Investments | |||||||||
| Usinas Siderurgicas | (cost $1,187,365,382) | 97.2% | 1,116,030,864 | |||||||||
| de Minas Gerais, Cl. A | 34,450 | 1,208,920 | Cash and Receivables (Net) | 2.8% | 32,302,092 | |||||||
| Total Preferred Stocks | ||||||||||||
| (cost $28,675,332) | 34,533,083 | Net Assets | 100.0% | 1,148,332,956 | ||||||||
| ADR—American Depository Receipts GDR—Global Depository Receipts |
a Non-income producing security. b Securities exempt from registration under Rule 144A of the Securities Act of 1933.These securities may be resold in transactions exempt from registration, normally to qualified institutional buyers.At August 31, 2008, these securities amounted to $17,260,007 or 1.5% of net assets. c All or a portion of this security is on loan.At August 31, 2008, the total market value of the fund’s securities on loan is $698,702 and the total market value of the collateral held by the fund is $731,808. d Investment in affiliated money market mutual fund.
| Portfolio Summary (Unaudited) † | ||||||
| Value (%) | Value (%) | |||||
| Financial | 20.2 | Utilities | 6.0 | |||
| Energy | 17.0 | Consumer Staples | 5.2 | |||
| Materials | 10.9 | Health Care | 1.4 | |||
| Information Technology | 10.4 | Money Market Investments | .9 | |||
| Telecommunication Services | 10.2 | Exchange Traded Funds | .2 | |||
| Consumer Discretionary | 8.8 | |||||
| Industrial | 6.0 | 97.2 | ||||
| † Based on net assets. | ||||||
| See notes to financial statements. | ||||||
52
| STATEMENT OF INVESTMENTS | ||||||||||
| August 31, 2008 | ||||||||||
| BNY Mellon Balanced Fund | ||||||||||
| Common Stocks—38.0% | Shares | Value ($) | Shares | Value ($) | ||||||
| Consumer Discretionary—3.3% | Energy (continued) | |||||||||
| Darden Restaurants | 23,225 | 680,260 | Valero Energy | 10,820 | 376,103 | |||||
| Family Dollar Stores | 58,550 a | 1,459,066 | Williams | 29,370 | 907,239 | |||||
| Gap | 56,980 | 1,108,261 | XTO Energy | 31,620 | 1,593,964 | |||||
| McDonald’s | 27,890 | 1,730,575 | 15,004,017 | |||||||
| Newell Rubbermaid | 36,880 | 667,528 | Financial—5.6% | |||||||
| News, Cl. B | 80,160 | 1,151,098 | Bank of America | 62,421 | 1,943,790 | |||||
| Omnicom Group | 29,020 | 1,230,158 | Chubb | 35,530 | 1,705,795 | |||||
| Ross Stores | 33,990 | 1,366,738 | Citigroup | 64,266 | 1,220,411 | |||||
| TJX Cos. | 34,860 | 1,263,326 | Discover Financial Services | 39,600 | 651,420 | |||||
| 10,657,010 | Goldman Sachs Group | 13,130 | 2,152,926 | |||||||
| Consumer Staples—4.0% | JPMorgan Chase & Co. | 78,412 | 3,018,078 | |||||||
| Coca-Cola Enterprises | 47,920 | 817,994 | MetLife | 36,700 | 1,989,140 | |||||
| Colgate-Palmolive | 25,470 | 1,936,484 | Morgan Stanley | 19,990 | 816,192 | |||||
| CVS Caremark | 55,600 | 2,034,960 | PNC Financial Services Group | 17,170 | 1,235,382 | |||||
| Estee Lauder, Cl. A | 28,630 | 1,424,915 | U.S. Bancorp | 40,780 | 1,299,251 | |||||
| Kroger | 39,350 | 1,086,847 | Wachovia | 23,560 a | 374,368 | |||||
| Molson Coors Brewing, Cl. B | 14,600 | 695,690 | Wells Fargo & Co. | 54,940 | 1,663,034 | |||||
| PepsiCo | 14,430 | 988,166 | 18,069,787 | |||||||
| Philip Morris International | 40,200 | 2,158,740 | Health Care—4.9% | |||||||
| Procter & Gamble | 1 | 70 | Aetna | 17,120 | 738,557 | |||||
| Wal-Mart Stores | 31,900 | 1,884,333 | Baxter International | 26,670 | 1,807,159 | |||||
| 13,028,199 | Becton, Dickinson & Co. | 9,470 | 827,489 | |||||||
| Energy—4.7% | Covidien | 15,652 | 846,303 | |||||||
| Anadarko Petroleum | 13,350 | 824,096 | Hospira | 27,630 b | 1,115,147 | |||||
| Chevron | 29,950 | 2,585,284 | Johnson & Johnson | 34,460 | 2,427,018 | |||||
| ConocoPhillips | 38,610 | 3,185,711 | Laboratory Corp. | |||||||
| ENSCO International | 20,620 a | 1,397,624 | of America Holdings | 11,000 a,b | 804,650 | |||||
| Hess | 17,390 | 1,820,907 | Medtronic | 20,930 | 1,142,778 | |||||
| Marathon Oil | 26,800 | 1,207,876 | Pfizer | 94,490 | 1,805,704 | |||||
| National Oilwell Varco | 14,990 b | 1,105,213 | Schering-Plough | 47,050 | 912,770 | |||||
The Funds 53
| STATEMENT OF INVESTMENTS (continued) | ||||||||||
| BNY Mellon Balanced Fund (continued) | ||||||||||
| Common Stocks (continued) | Shares | Value ($) | Shares | Value ($) | ||||||
| Health Care (continued) | Information Technology (continued) | |||||||||
| St. Jude Medical | 17,680 b | 810,274 | Intel | 111,860 | 2,558,238 | |||||
| Thermo Fisher Scientific | 27,990 b | 1,695,074 | McAfee | 18,880 b | 746,893 | |||||
| Wyeth | 20,130 | 871,226 | Microsoft | 103,600 | 2,827,244 | |||||
| 15,804,149 | Nokia, ADR | 36,800 | 926,256 | |||||||
| Industrial—4.2% | Nortel Networks | 4,808 b | 28,992 | |||||||
| Cooper Industries, Cl. A | 13,030 | 620,749 | Oracle | 64,710 b | 1,419,090 | |||||
| Eaton | 13,170 | 963,781 | QUALCOMM | 16,060 | 845,559 | |||||
| Emerson Electric | 27,450 | 1,284,660 | Research In Motion | 9,870 b | 1,200,192 | |||||
| General Electric | 66,320 | 1,863,592 | Visa, Cl. A | 13,750 | 1,043,625 | |||||
| Goodrich | 16,060 | 823,075 | Yahoo! | 26,860 b | 520,547 | |||||
| L-3 Communications Holdings | 17,170 | 1,784,650 | 24,849,995 | |||||||
| Lockheed Martin | 12,900 | 1,502,076 | Materials—1.3% | |||||||
| Terex | 22,990 b | 1,156,167 | Air Products & Chemicals | 14,230 | 1,307,026 | |||||
| Textron | 25,260 | 1,038,186 | Cia Vale do Rio Doce, ADR | 50,360 | 1,337,058 | |||||
| Tyco International | 40,122 | 1,720,431 | Freeport-McMoRan Copper & Gold | 7,650 | 683,298 | |||||
| United Technologies | 9,810 | 643,438 | Mosaic | 6,730 | 718,360 | |||||
| 13,400,805 | 4,045,742 | |||||||||
| Information Technology—7.7% | Telecommunication | |||||||||
| Services—1.0% | ||||||||||
| Accenture, Cl. A | 19,480 | 805,693 | ||||||||
| AT & T | 79,437 | 2,541,189 | ||||||||
| Adobe Systems | 27,910 b | 1,195,385 | ||||||||
| Sprint Nextel | 91,652 | 799,205 | ||||||||
| Akamai Technologies | 37,240 a,b | 852,796 | ||||||||
| 3,340,394 | ||||||||||
| Alliance Data Systems | 21,050 a,b | 1,352,252 | Utilities—1.3% | |||||||
| Amphenol, Cl. A | 15,740 | 747,965 | Exelon | 20,510 | 1,557,940 | |||||
| Apple | 16,390 b | 2,778,597 | Sempra Energy | 47,120 | 2,729,190 | |||||
| Cisco Systems | 125,890 b | 3,027,655 | 4,287,130 | |||||||
| Dell | 55,610 b | 1,208,405 | Total Common Stocks | |||||||
| Global Payments | 15,860 | 764,611 | (cost $108,533,449) | 122,487,228 | ||||||
54
| BNY Mellon Balanced Fund (continued) | ||||||||
| Coupon | Maturity | Principal | ||||||
| Bonds and Notes—41.4% | Rate (%) | Date | Amount ($) | Value ($) | ||||
| Asset—Backed Ctfs.—.3% | ||||||||
| CIT Equipment Collateral, Ser. 2006-VT2, Cl. A4 | 5.05 | 4/20/14 | 685,000 | 686,507 | ||||
| CNH Equipment Trust, Ser. 2005-A, Cl. A4B | 4.29 | 6/15/12 | 218,109 | 218,653 | ||||
| 905,160 | ||||||||
| Asset-Backed Ctfs./Auto Receivables—1.4% | ||||||||
| Franklin Auto Trust, Ser. 2007-1, Cl. A4 | 5.03 | 2/16/15 | 860,000 | 833,101 | ||||
| Harley-Davidson Motorcycle Trust, Ser. 2005-3, Cl. A2 | 4.41 | 6/15/12 | 207,006 | 207,798 | ||||
| Harley-Davidson Motorcycle Trust, Ser. 2007-1, Cl. A4 | 5.21 | 6/17/13 | 440,000 | 443,821 | ||||
| Honda Auto Receivables Owner Trust, Ser. 2006-3, Cl. A4 | 5.11 | 4/15/12 | 955,000 | 960,995 | ||||
| Household Automotive Trust, Ser. 2007-1, Cl. A4 | 5.33 | 11/17/13 | 495,000 | 480,210 | ||||
| Hyundai Auto Receivables Trust, Ser. 2006-B, Cl. A4 | 5.15 | 5/15/13 | 550,000 | 551,969 | ||||
| Nissan Auto Lease Trust, Ser. 2006-A, Cl. A4 | 5.10 | 7/16/12 | 1,145,000 | 1,137,334 | ||||
| 4,615,228 | ||||||||
| Commercial Mortgage Pass-Through Ctfs.—.7% | ||||||||
| Citigroup/Deutsche Bank Commercial | ||||||||
| Mortgage Trust, Ser. 2007-CD4, Cl. A2B | 5.21 | 12/11/49 | 455,000 | 436,949 | ||||
| Credit Suisse Mortgage Capital Certificates, Ser. 2007-C2, Cl. A2 | 5.45 | 1/15/49 | 660,000 c | 638,458 | ||||
| CWCapital Cobalt, Ser. 2007-C2, Cl. A2 | 5.33 | 4/15/47 | 705,000 | 678,845 | ||||
| LB-UBS Commercial Mortgage Trust, Ser. 2007-C2, Cl. A2 | 5.30 | 2/15/40 | 395,000 | 380,123 | ||||
| 2,134,375 | ||||||||
| Diversified Financial Services—3.6% | ||||||||
| AEP Texas Central Transition Funding, Sr. Scd. Bonds, Ser. A-4 | 5.17 | 1/1/18 | 1,075,000 | 1,031,744 | ||||
| Agua Caliente Band of Cahuilla Indians, Sr. Scd. Notes | 6.08 | 10/1/16 | 400,000 d | 395,840 | ||||
| Agua Caliente Band of Cahuilla Indians, Sr. Scd. Notes | 6.44 | 10/1/16 | 455,000 d | 450,268 | ||||
| AXA Financial, Unscd. Notes | 7.75 | 8/1/10 | 840,000 | 879,510 | ||||
| Bank of America, Sub. Notes | 5.49 | 3/15/19 | 1,000,000 | 893,707 | ||||
| Blackrock, Sr. Unsub. Notes | 6.25 | 9/15/17 | 710,000 | 698,535 | ||||
| CIT Group, Sr. Unscd. Notes | 5.40 | 3/7/13 | 600,000 | 454,552 | ||||
| Citigroup, Sr. Unscd. Notes | 6.13 | 11/21/17 | 470,000 | 442,723 | ||||
| Countrywide Home Loan, Gtd. Notes, Ser. K | 5.63 | 7/15/09 | 430,000 | 420,479 | ||||
| Countrywide Home Loan, Gtd. Notes, Ser. H | 6.25 | 4/15/09 | 220,000 | 217,835 | ||||
| Goldman Sachs Group, Sub. Notes | 6.75 | 10/1/37 | 600,000 | 529,461 | ||||
| HSBC Finance, Sr. Unscd. Notes | 5.00 | 6/30/15 | 420,000 | 400,950 | ||||
| HSBC Holdings, Sub. Notes | 6.50 | 9/15/37 | 500,000 | 457,327 | ||||
| International Lease Finance, Sr. Unscd. Notes | 5.75 | 6/15/11 | 855,000 | 782,124 | ||||
| John Deere Capital, Sr. Unscd. Notes | 7.00 | 3/15/12 | 680,000 | 734,284 |
The Funds 55
| STATEMENT OF INVESTMENTS (continued) |
| BNY Mellon Balanced Fund (continued) | ||||||||
| Coupon | Maturity | Principal | ||||||
| Bonds and Notes (continued) | Rate (%) | Date | Amount ($) | Value ($) | ||||
| Diversified Financial Services (continued) | ||||||||
| JPMorgan Chase & Co., Sr. Unscd. Notes | 5.38 | 10/1/12 | 750,000 | 744,808 | ||||
| Morgan Stanley, Sub. Notes | 4.75 | 4/1/14 | 1,185,000 | 1,041,691 | ||||
| PNC Funding, Bank Gtd. Notes | 4.50 | 3/10/10 | 900,000 | 900,632 | ||||
| 11,476,470 | ||||||||
| Food & Beverages—.4% | ||||||||
| Diageo Finance, Gtd. Notes | 5.50 | 4/1/13 | 590,000 | 604,705 | ||||
| Pepsico, Unscd. Notes | 5.00 | 6/1/18 | 730,000 | 724,936 | ||||
| 1,329,641 | ||||||||
| Foreign/Governmental—.5% | ||||||||
| Hydro-Quebec, Gov’t. Gtd. Bonds, Ser. IF | 8.00 | 2/1/13 | 580,000 | 672,959 | ||||
| United Mexican States, Sr. Unscd. Notes | 5.63 | 1/15/17 | 825,000 a | 834,900 | ||||
| United Mexican States, Sr. Unscd. Notes | 6.63 | 3/3/15 | 185,000 | 198,875 | ||||
| 1,706,734 | ||||||||
| Health Care—.2% | ||||||||
| Aetna, Sr. Unscd. Notes | 5.75 | 6/15/11 | 545,000 | 553,087�� | ||||
| Industrials—1.1% | ||||||||
| CRH America, Gtd. Notes | 5.30 | 10/15/13 | 615,000 | 569,612 | ||||
| Devon Financing, Gtd. Notes | 6.88 | 9/30/11 | 600,000 | 637,852 | ||||
| Emerson Electric, Sr. Unscd. Notes | 4.75 | 10/15/15 | 670,000 | 665,002 | ||||
| Johnson Controls, Sr. Unscd. Notes | 5.50 | 1/15/16 | 1,080,000 | 1,051,719 | ||||
| United Technologies, Notes | 6.13 | 7/15/38 | 720,000 | 725,830 | ||||
| 3,650,015 | ||||||||
| Lodging & Entertainment—.5% | ||||||||
| Seminole Tribe of Florida, Notes | 5.80 | 10/1/13 | 1,460,000 d | 1,470,811 | ||||
| Media & Telecommunications—1.8% | ||||||||
| AT&T, Sr. Unscd. Notes | 6.50 | 9/1/37 | 420,000 | 405,521 | ||||
| British Sky Broadcasting, Gtd. Notes | 6.88 | 2/23/09 | 600,000 | 607,121 | ||||
| Cisco Systems, Sr. Unscd. Notes | 5.50 | 2/22/16 | 800,000 | 814,094 | ||||
| Comcast, Gtd. Notes | 5.90 | 3/15/16 | 1,045,000 | 1,022,717 | ||||
| News America Holdings, Gtd. Debs. | 7.60 | 10/11/15 | 665,000 | 739,550 | ||||
| News America, Gtd. Notes | 6.15 | 3/1/37 | 350,000 | 317,661 | ||||
| SBC Communications, Sr. Unscd. Notes | 5.88 | 8/15/12 | 695,000 | 719,106 | ||||
| Time Warner Cable, Gtd. Debs | 7.30 | 7/1/38 | 385,000 | 388,034 | ||||
| Time Warner, Gtd. Debs | 6.50 | 11/15/36 | 315,000 | 279,123 | ||||
| Verizon Communications, Sr. Unscd. Notes | 5.50 | 2/15/18 | 615,000 | 589,242 | ||||
| 5,882,169 | ||||||||
| Real Estate—.5% | ||||||||
| ERP Operating, Sr. Unscd. Notes | 6.95 | 3/2/11 | 750,000 | 767,566 | ||||
| Simon Property Group, Sr. Unscd. Notes | 5.75 | 5/1/12 | 750,000 | 742,448 | ||||
| 1,510,014 |
56
| BNY Mellon Balanced Fund (continued) | ||||||||
| Coupon | Maturity | Principal | ||||||
| Bonds and Notes (continued) | Rate (%) | Date | Amount ($) | Value ($) | ||||
| Residential Mortgage Pass-Through Ctfs.—.3% | ||||||||
| WaMu Mortgage Pass Through | ||||||||
| Certificates, Ser. 2003-S4, Cl. 4A1 | 4.00 | 2/25/32 | 128,197 | 119,386 | ||||
| WaMu Mortgage Pass Through | ||||||||
| Certificates, Ser. 2004-AR9, Cl. A6 | 4.13 | 8/25/34 | 845,000 c | 826,743 | ||||
| 946,129 | ||||||||
| Retail—.4% | ||||||||
| Wal-Mart Stores, Sr. Unscd. Notes | 6.50 | 8/15/37 | 1,105,000 | 1,134,949 | ||||
| Technology—.8% | ||||||||
| International Business Machines, Sr. Unscd. Debs. | 7.00 | 10/30/25 | 650,000 a | 717,860 | ||||
| Intuit, Sr. Unscd. Notes | 5.40 | 3/15/12 | 710,000 | 707,886 | ||||
| Oracle, Sr. Unscd. Notes | 5.75 | 4/15/18 | 1,065,000 | 1,069,991 | ||||
| 2,495,737 | ||||||||
| U.S. Government Agencies—3.0% | ||||||||
| Federal Farm Credit Banks, Bonds | 3.88 | 8/25/11 | 430,000 | 434,268 | ||||
| Federal Farm Credit Banks, Bonds | 5.25 | 9/13/10 | 635,000 | 660,063 | ||||
| Federal Home Loan Banks, Bonds | 5.33 | 3/6/12 | 355,000 | 358,725 | ||||
| Federal Home Loan Banks, Bonds | 5.65 | 4/20/22 | 1,175,000 | 1,192,538 | ||||
| Federal Home Loan Mortgage Corp., Notes | 5.38 | 1/9/14 | 440,000 i | 442,573 | ||||
| Federal Home Loan Mortgage Corp., Notes | 5.40 | 2/2/12 | 700,000 i | 705,931 | ||||
| Federal Home Loan Mortgage Corp., Notes | 5.40 | 3/2/12 | 850,000 i | 850,000 | ||||
| Federal Home Loan Mortgage Corp., Notes | 5.50 | 3/22/22 | 660,000 i | 661,368 | ||||
| Federal Home Loan Mortgage Corp., Notes | 5.90 | 6/15/22 | 1,175,000 i | 1,194,230 | ||||
| Federal National Mortgage Association, Notes | 5.25 | 3/5/14 | 2,030,000 i | 2,068,320 | ||||
| Federal National Mortgage Association, Notes | 5.38 | 4/11/22 | 1,010,000 i | 1,008,197 | ||||
| 9,576,213 | ||||||||
| U.S. Government Agencies/Mortgage-Backed—15.8% | ||||||||
| Federal Home Loan Mortgage Corp.: | ||||||||
| 4.50%, 3/1/21 | 553,546 i | 542,063 | ||||||
| 5.00%, 10/1/18 | 777,007 i | 778,979 | ||||||
| 5.00%, 6/1/28—7/1/28 | 1,389,130 e,i | 1,353,429 | ||||||
| 5.07%, 10/1/35 | 855,606 c,i | 857,598 | ||||||
| 5.50%, 3/1/35—12/1/37 | 3,623,846 i | 3,580,557 | ||||||
| 5.77%, 4/1/37 | 1,182,869 c,i | 1,205,974 | ||||||
| 6.00%, 5/1/37—12/1/37 | 3,437,668 i | 3,469,471 | ||||||
| 7.00%, 8/1/29—8/1/36 | 347,733 i | 364,476 | ||||||
| Federal National Mortgage Association: | ||||||||
| 4.50%, 1/1/36 | 1,142,787 i | 1,067,102 | ||||||
| 4.58%, 3/1/35 | 282,340 c,i | 280,443 | ||||||
| 4.92%, 9/1/35 | 932,188 c,i | 931,669 | ||||||
| 4.99%, 10/1/35 | 751,719 c,i | 752,508 | ||||||
| 5.50%, 7/1/35—3/1/38 | 10,338,716 i | 10,239,244 | ||||||
| 5.71%, 4/1/37 | 1,095,793 c,i | 1,114,481 | ||||||
| 5.97%, 5/1/37 | 1,176,899 c,i | 1,191,237 | ||||||
The Funds 57
| STATEMENT OF INVESTMENTS (continued) |
| BNY Mellon Balanced Fund (continued) | ||||||||
| Coupon | Maturity | Principal | ||||||
| Bonds and Notes (continued) | Rate (%) | Date | Amount ($) | Value ($) | ||||
| U.S. Government Agencies/Mortgage-Backed (continued) | ||||||||
| Federal National Mortgage Association (continued): | ||||||||
| 6.00%, 4/1/33—6/1/38 | 6,141,061 i | 6,217,279 | ||||||
| 6.01%, 8/1/37 | 1,868,710 c,i | 1,887,356 | ||||||
| 6.50%, 10/1/36—4/1/38 | 4,575,901 i | 4,711,965 | ||||||
| 7.00%, 6/1/32 | 114,966 i | 121,192 | ||||||
| 7.50%, 7/1/32 | 100,852 i | 108,283 | ||||||
| Government National Mortgage Association I: | ||||||||
| 5.00%, 11/15/34—4/15/38 | 5,851,768 | 5,724,538 | ||||||
| 5.50%, 2/15/36 | 815,274 | 815,842 | ||||||
| 6.00%, 10/15/08—7/15/34 | 1,498,362 | 1,525,661 | ||||||
| 6.50%, 4/15/38 | 888,667 | 917,233 | ||||||
| 6.50%, 8/15/38 | 1,295,000 e | 1,336,628 | ||||||
| 7.00%, 5/15/23—11/15/23 | 232,353 | 247,891 | ||||||
| 9.00%, 12/15/09 | 16,943 | 17,036 | ||||||
| 51,360,135 | ||||||||
| U.S. Government Securities—10.1% | ||||||||
| U.S. Treasury Bonds | 4.50 | 2/15/36 | 2,600,000 a | 2,626,814 | ||||
| U.S. Treasury Inflation Protected Securities: | ||||||||
| Bonds | 2.38 | 1/15/27 | 1,404,233 a,f | 1,453,383 | ||||
| Notes | 1.38 | 7/15/18 | 1,110,407 f | 1,082,648 | ||||
| Notes | 2.38 | 1/15/17 | 1,404,233 a,f | 1,490,682 | ||||
| U.S. Treasury Notes | 3.88 | 5/15/18 | 260,000 a | 261,605 | ||||
| U.S. Treasury Notes | 4.00 | 11/15/12 | 4,550,000 a | 4,755,464 | ||||
| U.S. Treasury Notes | 4.25 | 8/15/13 | 2,550,000 a | 2,687,861 | ||||
| U.S. Treasury Notes | 4.25 | 11/15/13 | 1,440,000 | 1,519,875 | ||||
| U.S. Treasury Notes | 4.50 | 5/15/17 | 2,790,000 a | 2,955,221 | ||||
| U.S. Treasury Notes | 4.63 | 8/31/11 | 5,875,000 a | 6,215,568 | ||||
| U.S. Treasury Notes | 4.63 | 2/29/12 | 4,375,000 a | 4,645,708 | ||||
| U.S. Treasury Notes | 5.13 | 5/15/16 | 2,530,000 a | 2,801,383 | ||||
| 32,496,212 | ||||||||
| Total Bonds and Notes | ||||||||
| (cost $132,559,706) | 133,243,079 | |||||||
58
| BNY Mellon Balanced Fund (continued) | ||||||||||
| Investment of Cash Collateral | ||||||||||
| Other Investments—20.9% | Shares | Value ($) | for Securities Loaned—8.0% | Shares | Value ($) | |||||
| Registered Investment Company: | Registered Investment Company; | |||||||||
| BNY Mellon Emerging Markets Fund | 631,848 g | 10,671,915 | Dreyfus Institutional Cash | |||||||
| BNY Mellon International Fund | 2,145,525 g | 26,003,762 | Advantage Plus Fund | |||||||
| BNY Mellon Mid Cap Stock Fund | 1,778,219 g | 19,756,015 | (cost $25,947,684) | 25,947,684 h | 25,947,684 | |||||
| BNY Mellon Small Cap Stock Fund | 851,760 g | 9,744,139 | Total Investments | |||||||
| Dreyfus Institutional Preferred | (cost $342,767,757) | 108.3% | 349,173,822 | |||||||
| Plus Money Market Fund | 1,320,000 h | 1,320,000 | ||||||||
| Liabilities, Less Cash and Receivables | (8.3%) | (26,816,789) | ||||||||
| Total Other Investment | ||||||||||
| (cost $75,726,918) | 67,495,831 | Net Assets | 100.0% | 322,357,033 | ||||||
| ADR—American Depository Receipts |
a All or a portion of these securities are on loan.At August 31, 2008, the total market value of the fund’s securities on loan is $31,866,391 and the total market value of the collateral held by the fund is $32,987,772, consisting of cash collateral of $25,947,684, U.S. Government and Agency securities valued at $5,881,882, and Letters of Credit valued at $1,158,206. b Non-income producing security. c Variable rate security—interest rate subject to periodic change. d Securities exempt from registration under Rule 144A of the Securities Act of 1933.These securities may be resold in transactions exempt from registration, normally to qualified institutional buyers.At August 31, 2008, these securities amounted to $2,316,919 or 0.7% of net assets. e Purchased on a delayed delivery basis. f Principal amount for accrual purposes is periodically adjusted based on changes in the Consumer Price Index. g Investment in affiliated mutual fund. h Investment in affiliated money market mutual fund. i On September 7, 2008, the Federal Housing Finance Agency (FHFA) placed Federal National Mortgage Association and Federal Home Loan Mortgage Corporation into conservatorship with FHFA as the conservator.
| Portfolio Summary (Unaudited) † | ||||||
| Value (%) | Value (%) | |||||
| U.S. Government & Agencies | 28.9 | Consumer Staples | 4.0 | |||
| Affiliated Mutual Funds | 20.5 | Consumer Discretionary | 3.3 | |||
| Corporate Bonds | 9.3 | Asset/Mortgage-Backed | 2.7 | |||
| Money Market Investment | 8.4 | Materials | 1.3 | |||
| Information Technology | 7.7 | Utilities | 1.3 | |||
| Financial | 5.6 | Telecommunication Services | 1.0 | |||
| Health Care | 4.9 | Foreign/Governmental | .5 | |||
| Energy | 4.7 | |||||
| Industrial | 4.2 | 108.3 | ||||
| † Based on net assets. | ||||||
| See notes to financial statements. | ||||||
The Funds 59
| STATEMENTS OF ASSETS AND LIABILITIES August 31, 2008 |
| BNY Mellon | BNY Mellon | BNY Mellon | BNY Mellon | |||||
| Large Cap | Income | Mid Cap | Small Cap | |||||
| Stock Fund | Stock Fund | Stock Fund | Stock Fund | |||||
| Assets ($): | ||||||||
| Investments in securities—See Statement of Investments† | ||||||||
| (including securities on loan)††—Note 2(b): | ||||||||
| Unaffiliated issuers | 1,714,758,219 | 199,965,358 | 1,537,377,794 | 629,465,942 | ||||
| Affiliated issuers | 117,345,866 | 3,634,033 | 340,962,409 | 232,058,982 | ||||
| Cash | — | — | 660,714 | 195,912 | ||||
| Receivable for investment securities sold | — | 5,129,832 | 14,139,883 | — | ||||
| Dividends and interest receivable | 3,328,444 | 480,120 | 1,414,627 | 701,647 | ||||
| Receivable for shares of Beneficial Interest subscribed | 825,503 | 140,512 | 359,532 | 181,759 | ||||
| Prepaid expenses | 21,446 | 17,062 | 42,164 | 19,198 | ||||
| 1,836,279,478 | 209,366,917 | 1,894,957,123 | 862,623,440 | |||||
| Liabilities ($): | ||||||||
| Due to The Dreyfus Corporation and affiliates—Note 4(c) | 1,002,759 | 121,895 | 1,044,493 | 475,091 | ||||
| Due to Administrator—Note 4(a) | 191,030 | 22,067 | 170,450 | 69,211 | ||||
| Cash overdraft due to Custodian | 978,546 | 642,740 | — | — | ||||
| Liability for securities on loan—Note 2(b) | 72,855,866 | 3,634,033 | 301,987,409 | 224,626,982 | ||||
| Payable for investment securities purchased | — | 3,883,682 | 19,389,103 | — | ||||
| Outstanding options written, at value (premiums received | ||||||||
| $74,187)—See Statement of Options Written—Note 5 | — | 43,900 | — | — | ||||
| Payable for shares of Beneficial Interest redeemed | 676,949 | 210,238 | 1,288,462 | 495,307 | ||||
| Interest payable—Note 3 | — | 198 | — | — | ||||
| Accrued expenses | 57,624 | 34,241 | 67,405 | 42,889 | ||||
| 75,762,774 | 8,592,994 | 323,947,322 | 225,709,480 | |||||
| Net Assets ($) | 1,760,516,704 | 200,773,923 | 1,571,009,801 | 636,913,960 | ||||
| Composition of Net Assets ($): | ||||||||
| Paid-in capital | 1,543,725,101 | 172,276,295 | 1,475,848,059 | 637,100,914 | ||||
| Accumulated undistributed investment income—net | 415,237 | 226,968 | 2,869,184 | 1,563,336 | ||||
| Accumulated net realized gain (loss) on investments | 16,689,280 | 15,645,891 | (610,789) | (21,323,917) | ||||
| Accumulated net unrealized appreciation | ||||||||
| (depreciation) on investments | 199,687,086 | — | 92,903,347 | 19,573,627 | ||||
| Accumulated net unrealized appreciation (depreciation) | ||||||||
| on investments and options transactions | — | 12,624,769 | — | — | ||||
| Net Assets ($) | 1,760,516,704 | 200,773,923 | 1,571,009,801 | 636,913,960 | ||||
| Net Asset Value Per Share | ||||||||
| Class M Shares | ||||||||
| Net Assets ($) | 1,750,687,774 | 199,367,326 | 1,540,820,630 | 633,118,472 | ||||
| Shares Outstanding | 199,623,872 | 27,617,605 | 138,700,503 | 55,361,696 | ||||
| Net Asset Value Per Share ($) | 8.77 | 7.22 | 11.11 | 11.44 | ||||
| Investor Shares | ||||||||
| Net Assets ($) | 9,828,930 | 1,406,597 | 28,520,063 | 3,795,488 | ||||
| Shares Outstanding | 1,118,993 | 193,398 | 2,592,567 | 341,512 | ||||
| Net Asset Value Per Share ($) | 8.78 | 7.27 | 11.00 | 11.11 | ||||
| Dreyfus Premier Shares | ||||||||
| Net Assets ($) | — | — | 1,669,108 | — | ||||
| Shares Outstanding | — | — | 160,460 | — | ||||
| Net Asset Value Per Share ($) | — | — | 10.40 | — | ||||
| † Investments at cost ($): | ||||||||
| Unaffiliated issuers | 1,515,071,133 | 187,370,876 | 1,444,474,447 | 609,892,315 | ||||
| Affiliated issuers | 117,345,866 | 3,634,033 | 340,962,409 | 232,058,982 | ||||
| ††Value of securities on loan ($) | 92,203,044 | 4,963,993 | 291,681,273 | 217,646,055 | ||||
| See notes to financial statements. | ||||||||
60
| BNY Mellon | BNY Mellon | BNY Mellon | BNY Mellon | |||||
| U.S. Core Equity | International | Emerging | Balanced | |||||
| 130/30 Fund | Fund | Markets Fund | Fund | |||||
| Assets ($): | ||||||||
| Investments in securities— | ||||||||
| See Statement of Investments† | ||||||||
| (including securities on loan)††—Note 2(b): | ||||||||
| Unaffiliated issuers | 230,819,026 | 1,962,668,222 | 1,105,199,056 | 255,730,307 | ||||
| Affiliated issuers | 10,723,000 | 13,500,000 | 10,831,808 | 93,443,515 | ||||
| Cash | — | 4,960,216 | 7,827,757 | — | ||||
| Cash denominated in foreign currencies††† | — | 17,502,935 | 24,248,933 | — | ||||
| Receivable for investment securities sold | — | 6,861,696 | 6,413,523 | 2,499,264 | ||||
| Receivable for shares of Beneficial Interest subscribed | 60,900 | 654,025 | 264,350 | 15,000 | ||||
| Paydowns receivable | — | — | — | 20,579 | ||||
| Unrealized appreciation on foreign currency | ||||||||
| exchange contracts—Note 2(e) | — | 8,099 | 22,216 | — | ||||
| Dividends and interest receivable | 418,759 | 7,284,790 | 4,731,622 | 1,696,869 | ||||
| Prepaid expenses | 31,850 | 14,821 | 21,183 | 13,333 | ||||
| 242,053,535 | 2,013,454,804 | 1,159,560,448 | 353,418,867 | |||||
| Liabilities ($): | ||||||||
| Due to The Dreyfus Corporation and affiliates—Note 4(c) | 126,783 | 1,268,215 | 2,165,137 | 134,980 | ||||
| Due to Administrator—Note 4(a) | 19,405 | 221,452 | 128,163 | 27,684 | ||||
| Due to Broker | 104,900 | — | — | — | ||||
| Cash overdraft due to Custodian | 4,291,050 | — | — | 640,467 | ||||
| Securities sold short, at value (proceeds $55,451,421) | ||||||||
| —See Statement of Securities Sold Short | 53,648,713 | — | — | — | ||||
| Payable to brokers for proceeds | ||||||||
| on securities sold short | 1,677,306 | — | — | — | ||||
| Payable for investment securities purchased | 1,132,619 | 1,258,964 | 7,235,973 | 4,213,645 | ||||
| Payable for shares of Beneficial Interest redeemed | 91,120 | 1,680,858 | 904,130 | 36,949 | ||||
| Liability for securities on loan—Note 2(b) | — | — | 731,808 | 25,947,684 | ||||
| Dividends payable on securities sold short | 82,830 | — | — | — | ||||
| Unrealized depreciation on foreign currency | ||||||||
| exchange contracts—Note 2(e) | — | 2,936 | 11,698 | — | ||||
| Accrued expenses | 62,162 | 88,965 | 50,583 | 60,425 | ||||
| 61,236,888 | 4,521,390 | 11,227,492 | 31,061,834 | |||||
| Net Assets ($) | 180,816,647 | 2,008,933,414 | 1,148,332,956 | 322,357,033 |
The Funds 61
| STATEMENTS OF ASSETS AND LIABILITIES (continued) |
| BNY Mellon | BNY Mellon | BNY Mellon | BNY Mellon | |||||||
| U.S. Core Equity | International | Emerging | Balanced | |||||||
| 130/30 Fund | Fund | Markets Fund | Fund | |||||||
| Composition of Net Assets ($): | ||||||||||
| Paid-in capital | 197,035,332 | 2,280,552,405 | 963,319,026 | 298,768,721 | ||||||
| Accumulated undistributed | ||||||||||
| investment income—net | 657,459 | 50,952,391 | 19,948,412 | 3,772,082 | ||||||
| Accumulated net realized gain (loss) on investments | (12,296,241) | 43,886,616 | 236,828,087 | 13,410,165 | ||||||
| Accumulated net unrealized appreciation | ||||||||||
| (depreciation) on investments | — | — | — | 6,406,065 | ||||||
| Accumulated net unrealized appreciation (depreciation) | ||||||||||
| on investments and foreign currency transactions | — | (366,457,998) | (71,762,569) | — | ||||||
| Accumulated net unrealized appreciation (depreciation) | ||||||||||
| on investments and securities sold short | (4,579,903) | — | — | — | ||||||
| Net Assets ($) | 180,816,647 | 2,008,933,414 | 1,148,332,956 | 322,357,033 | ||||||
| Net Asset Value Per Share | ||||||||||
| Class M Shares | ||||||||||
| Net Assets ($) | 180,803,287 | 2,002,306,712 | 1,141,145,586 | 317,545,048 | ||||||
| Shares Outstanding | 15,867,401 | 165,280,202 | 67,557,358 | 29,060,305 | ||||||
| Net Asset Value Per Share ($) | 11.39 | 12.11 | 16.89 | 10.93 | ||||||
| Investor Shares | ||||||||||
| Net Assets ($) | 13,360 | 6,626,702 | 7,187,370 | 4,811,985 | ||||||
| Shares Outstanding | 1,176 | 521,896 | 421,450 | 438,169 | ||||||
| Net Asset Value Per Share ($) | 11.36 | 12.70 | 17.05 | 10.98 | ||||||
| † | Investments at cost ($): | |||||||||
| Unaffiliated issuers | 237,201,637 | 2,328,956,262 | 1,176,533,574 | 241,093,155 | ||||||
| Affiliated issuers | 10,723,000 | 13,500,000 | 10,831,808 | 101,674,602 | ||||||
| †† | Value of securities on loan ($) | — | — | 698,702 | 31,866,391 | |||||
| ††† Cash denominated in foreign currencies (cost) ($) | — | 17,596,091 | 24,678,925 | — | ||||||
| See notes to financial statements. | ||||||||||
62
| STATEMENTS OF OPERATIONS Year Ended August 31, 2008 |
| BNY Mellon | BNY Mellon | BNY Mellon | BNY Mellon | |||||
| Large Cap | Income | Mid Cap | Small Cap | |||||
| Stock Fund | Stock Fund | Stock Fund | Stock Fund | |||||
| Investment Income ($): | ||||||||
| Income: | ||||||||
| Cash dividends (net of $75,778, $6,274 and $2,112 | ||||||||
| foreign taxes withheld at source for BNY Mellon Large | ||||||||
| Cap Stock Fund, BNY Mellon Mid Cap Stock Fund and | ||||||||
| BNY Mellon Small Cap Stock Fund, respectively): | ||||||||
| Unaffiliated issuers | 35,626,608 | 7,936,040 | 16,924,342 | 6,111,176 | ||||
| Affiliated issuers | 950,512 | 7,707 | 890,119 | 912,535 | ||||
| Income from securities lending | 312,120 | 26,701 | 1,875,675 | 1,183,322 | ||||
| Total Income | 36,889,240 | 7,970,448 | 19,690,136 | 8,207,033 | ||||
| Expenses: | ||||||||
| Investment advisory fees—Note 4(a) | 12,305,522 | 1,916,329 | 12,489,757 | 5,442,837 | ||||
| Administration fees—Note 4(a) | 2,412,711 | 375,506 | 2,122,210 | 816,080 | ||||
| Custodian fees—Note 4(c) | 149,583 | 33,316 | 123,309 | 64,242 | ||||
| Trustees’ fees and expenses—Note 4(d) | 64,693 | 11,343 | 62,437 | 24,532 | ||||
| Auditing fees | 30,947 | 17,025 | 32,065 | 30,437 | ||||
| Shareholder servicing costs—Note 4(c) | 30,209 | 4,244 | 136,360 | 15,178 | ||||
| Registration fees | 27,321 | 25,699 | 44,791 | 27,298 | ||||
| Legal fees | 21,406 | 5,333 | 23,107 | 7,969 | ||||
| Prospectus and shareholders’ reports | 8,310 | 4,661 | 42,624 | 15,245 | ||||
| Interest expense—Note 3 | 7,421 | 63,294 | — | — | ||||
| Distribution fees—Note 4(b) | — | — | 19,379 | — | ||||
| Miscellaneous | 38,330 | 16,479 | 37,315 | 24,668 | ||||
| Total Expenses | 15,096,453 | 2,473,229 | 15,133,354 | 6,468,486 | ||||
| Less—reduction in fees due to | ||||||||
| earnings credits—Note 2(b) | (1,211) | (250) | (26,920) | (11,406) | ||||
| Net Expenses | 15,095,242 | 2,472,979 | 15,106,434 | 6,457,080 | ||||
| Investment Income—Net | 21,793,998 | 5,497,469 | 4,583,702 | 1,749,953 | ||||
| Realized and Unrealized Gain (Loss) | ||||||||
| on Investments—Note 5 ($): | ||||||||
| Net realized gain (loss) on investments | 42,707,422 | 23,402,453 | 49,153,737 | (10,963,249) | ||||
| Net realized gain (loss) on options transactions | — | 250,560 | — | — | ||||
| Net Realized Gain (Loss) | 42,707,422 | 23,653,013 | 49,153,737 | (10,963,249) | ||||
| Net unrealized appreciation | ||||||||
| (depreciation) on investments | (255,434,623) | — | (138,222,392) | (48,570,551) | ||||
| Net unrealized appreciation (depreciation) | ||||||||
| on investments and options transactions | — | (66,771,228) | — | — | ||||
| Net Realized and Unrealized | ||||||||
| Gain (Loss) on Investments | (212,727,201) | (43,118,215) | (89,068,655) | (59,533,800) | ||||
| Net (Decrease) in Net Assets | ||||||||
| Resulting from Operations | (190,933,203) | (37,620,746) | (84,484,953) | (57,783,847) | ||||
| See notes to financial statements. |
The Funds 63
| STATEMENTS OF OPERATIONS (continued) |
| BNY Mellon | BNY Mellon | BNY Mellon | BNY Mellon | |||||
| U.S. Core Equity | International | Emerging | Balanced | |||||
| 130/30 Fund | Fund | Markets Fund | Fund | |||||
| Investment Income ($): | ||||||||
| Income: | ||||||||
| Cash dividends (net of $7,319,295, $4,567,521 and | ||||||||
| $5,635 foreign taxes withheld at source for BNY Mellon | ||||||||
| International Fund, BNY Mellon Emerging Markets Fund | ||||||||
| and BNY Mellon Balanced Fund, respectively): | ||||||||
| Unaffiliated issuers | 3,147,495 | 78,696,072 | 36,304,382 | 3,239,865 | ||||
| Affiliated issuers | 23,726 | 1,162,955 | 418,080 | 68,926 | ||||
| Interest | — | 327,138 | 111,361 | 7,305,474 | ||||
| Income from securities lending | — | — | 19,920 | 160,109 | ||||
| Total Income | 3,171,221 | 80,186,165 | 36,853,743 | 10,774,374 | ||||
| Expenses: | ||||||||
| Investment advisory fees—Note 4(a) | 885,522 | 20,746,942 | 16,102,369 | 1,529,969 | ||||
| Interest expense—Note 3 | 1,008,611 | 48,509 | 20,042 | 376 | ||||
| Dividends on securities sold short | 389,818 | — | — | — | ||||
| Administration fees—Note 4(a) | 141,232 | 3,109,931 | 1,784,118 | 345,402 | ||||
| Custodian fees—Note 4(c) | 70,966 | 2,566,485 | 3,279,344 | 39,353 | ||||
| Legal fees | 57,287 | 42,045 | 20,797 | 2,058 | ||||
| Registration fees | 47,257 | 27,723 | 29,052 | 27,777 | ||||
| Auditing fees | 21,147 | 33,086 | 39,355 | 31,510 | ||||
| Prospectus and shareholders’ reports | 16,031 | 10,051 | 10,543 | 11,005 | ||||
| Trustees’ fees and expenses—Note 4(d) | 2,552 | 101,331 | 56,703 | 13,329 | ||||
| Shareholder servicing costs—Note 4(c) | 185 | 29,914 | 28,965 | 11,596 | ||||
| Miscellaneous | 6,920 | 90,966 | 49,295 | 26,318 | ||||
| Total Expenses | 2,647,528 | 26,806,983 | 21,420,583 | 2,038,693 | ||||
| Less—reduction in investment advisory fee | ||||||||
| due to undertaking—Note 4(a) | (64,823) | (814,495) | — | — | ||||
| Less—reduction in fees due to earnings credits—Note 2(b) | (57,258) | (45,009) | (55,237) | (239) | ||||
| Net Expenses | 2,525,447 | 25,947,479 | 21,365,346 | 2,038,454 | ||||
| Investment Income—Net | 645,774 | 54,238,686 | 15,488,397 | 8,735,920 |
64
| BNY Mellon | BNY Mellon | BNY Mellon | BNY Mellon | |||||
| U.S. Core Equity | International | Emerging | Balanced | |||||
| 130/30 Fund | Fund | Markets Fund | Fund | |||||
| Realized and Unrealized Gain (Loss) | ||||||||
| on Investments—Note 5 ($): | ||||||||
| Net realized gain (loss) on investments | — | — | — | 5,311,598 | ||||
| Net realized gain distributions from affiliated issuers | — | — | — | 13,125,231 | ||||
| Net realized gain (loss) on investments | ||||||||
| and foreign currency transactions | — | 94,198,906 | 332,258,470 | — | ||||
| Net realized gain (loss) on foreign | ||||||||
| currency exchange contracts | — | 1,179,310 | (1,158,872) | — | ||||
| Net realized gain (loss) on investments: | ||||||||
| Long transactions | (12,390,332) | — | — | — | ||||
| Short sale transactions | 158,733 | — | — | — | ||||
| Net Realized Gain (Loss) | (12,231,599) | 95,378,216 | 331,099,598 | 18,436,829 | ||||
| Net unrealized appreciation | ||||||||
| (depreciation) on investments | — | — | — | (40,618,563) | ||||
| Net unrealized appreciation (depreciation) | ||||||||
| on investments and foreign currency transactions | — | (603,850,995) | (442,376,656) | — | ||||
| Net unrealized appreciation (depreciation) | ||||||||
| on investments and securities sold short | (5,136,786) | — | — | — | ||||
| Net Realized and Unrealized | ||||||||
| Gain (Loss) on Investments | (17,368,385) | (508,472,779) | (111,277,058) | (22,181,734) | ||||
| Net (Decrease) in Net Assets | ||||||||
| Resulting from Operations | (16,722,611) | (454,234,093) | (95,788,661) | (13,445,814) | ||||
| See notes to financial statements. | ||||||||
The Funds 65
STATEMENT OF CASH FLOWS
Year Ended August 31, 2008
| BNY Mellon U.S. Core Equity 130/30 Fund | ||||
| Cash Flows from Operating Activities ($): | ||||
| Purchases of portfolio securities | (450,777,698) | |||
| Proceed from sales of portfolio securities | 221,631,171 | |||
| Proceeds from securities sold short | 51,194,981 | |||
| Dividends received | 2,791,417 | |||
| Interest paid | (1,328,373) | |||
| Operating expenses paid | (254,464) | |||
| Paid from The Dreyfus Corporation | (676,415) | (177,419,381) | ||
| Cash Flows from Financing Activities ($): | ||||
| Net beneficial interest transactions | 171,655,691 | |||
| Cash at beginning of period | 1,472,640 | |||
| Cash at end of period | (4,291,050) | |||
| Reconciliation of Net Increase in Net Assets Resulting from | ||||
| Operations to Net Cash Used by Operating Activities ($): | ||||
| Net Decrease in Net Assets Resulting From Operations | (16,722,611) | |||
| Adjustments to reconcile net increase in net assets resulting | ||||
| from operations to net cash used by operating activities ($): | ||||
| Purchases of portfolio securities | (450,777,698) | |||
| Proceeds from sales of portfolio securities | 221,631,171 | |||
| Proceeds from securities sold short | 51,194,981 | |||
| Increase in dividends payable on securities | ||||
| sold short and loan commitment fees | 70,056 | |||
| Increase in accrued operating expenses | 52,132 | |||
| Decrease in prepaid expenses | (277) | |||
| Increase in Due to The Dreyfus Corporation | 144,284 | |||
| Net realized gains on investments | 12,231,599 | |||
| Net unrealized depreciation on investments | 5,136,786 | |||
| Decrease in dividends and income receivable | (379,804) | |||
| Net Cash Used by Operating Activities | (177,419,381) | |||
| See notes to financial statements. | ||||
66
| STATEMENTS OF CHANGES IN NET ASSETS |
| BNY Mellon Large Cap Stock Fund | BNY Mellon Income Stock Fund | |||||||
| Year Ended August 31, | Year Ended August 31, | |||||||
| 2008 | 2007 | 2008 | 2007 | |||||
| Operations ($): | ||||||||
| Investment income—net | 21,793,998 | 14,690,077 | 5,497,469 | 7,960,738 | ||||
| Net realized gain (loss) on investments | 42,707,422 | 289,295,291 | 23,653,013 | 64,683,917 | ||||
| Net unrealized appreciation (depreciation) on investments | (255,434,623) | (28,034,523) | (66,771,228) | (21,599,065) | ||||
| Net Increase (Decrease) in Net Assets | ||||||||
| Resulting from Operations | (190,933,203) | 275,950,845 | (37,620,746) | 51,045,590 | ||||
| Dividends to Shareholders from ($): | ||||||||
| Investment income—net: | ||||||||
| Class M Shares | (21,697,143) | (14,513,891) | (5,380,112) | (7,708,280) | ||||
| Investor Shares | (102,171) | (52,457) | (24,312) | (25,719) | ||||
| Net realized gain on investments: | ||||||||
| Class M Shares | (292,549,129) | (42,915,907) | (68,094,883) | (35,419,719) | ||||
| Investor Shares | (1,786,575) | (216,079) | (355,903) | (127,542) | ||||
| Total Dividends | (316,135,018) | (57,698,334) | (73,855,210) | (43,281,260) | ||||
| Beneficial Interest Transactions ($): | ||||||||
| Net proceeds from shares sold: | ||||||||
| Class M Shares | 348,280,071 | 226,642,767 | 14,558,053 | 76,012,981 | ||||
| Investor Shares | 6,025,431 | 6,833,158 | 959,671 | 410,294 | ||||
| Dividends reinvested: | ||||||||
| Class M Shares | 219,092,628 | 33,600,082 | 45,986,015 | 24,078,831 | ||||
| Investor Shares | 1,629,824 | 240,358 | 343,443 | 135,866 | ||||
| Cost of shares redeemed: | ||||||||
| Class M Shares | (283,003,054) | (273,005,675) | (165,171,342) | (114,219,942) | ||||
| Investor Shares | (6,626,069) | (4,111,344) | (1,011,025) | (331,362) | ||||
| Increase (Decrease) in Net Assets from | ||||||||
| Beneficial Interest Transactions | 285,398,831 | (9,800,654) | (104,335,185) | (13,913,332) | ||||
| Total Increase (Decrease) in Net Assets | (221,669,390) | 208,451,857 | (215,811,141) | (6,149,002) | ||||
| Net Assets ($): | ||||||||
| Beginning of Period | 1,982,186,094 | 1,773,734,237 | 416,585,064 | 422,734,066 | ||||
| End of Period | 1,760,516,704 | 1,982,186,094 | 200,773,923 | 416,585,064 | ||||
| Undistributed investment income—net | 415,237 | 440,468 | 226,968 | 146,199 | ||||
| Capital Share Transactions (Shares): | ||||||||
| Class M Shares | ||||||||
| Shares sold | 35,913,810 | 20,318,937 | 1,733,256 | 7,139,757 | ||||
| Shares issued for dividends reinvested | 21,978,940 | 3,073,298 | 5,484,101 | 2,326,716 | ||||
| Shares redeemed | (28,751,330) | (24,279,996) | (18,698,275) | (10,762,331) | ||||
| Net Increase (Decrease) in Shares Outstanding | 29,141,420 | (887,761) | (11,480,918) | (1,295,858) | ||||
| Investor Shares | ||||||||
| Shares sold | 579,957 | 611,162 | 104,995 | 38,623 | ||||
| Shares issued for dividends reinvested | 164,416 | 21,855 | 40,671 | 12,989 | ||||
| Shares redeemed | (635,660) | (361,527) | (113,307) | (30,537) | ||||
| Net Increase (Decrease) in Shares Outstanding | 108,713 | 271,490 | 32,359 | 21,075 | ||||
| See notes to financial statements. | ||||||||
The Funds 67
| STATEMENTS OF CHANGES IN NET ASSETS (continued) |
| BNY Mellon Mid Cap Stock Fund | BNY Mellon Small Cap Stock Fund | |||||||
| Year Ended August 31, | Year Ended August 31, | |||||||
| 2008 | 2007 | 2008 | 2007 | |||||
| Operations ($): | ||||||||
| Investment income—net | 4,583,702 | 6,990,751 | 1,749,953 | 108,639 | ||||
| Net realized gain (loss) on investments | 49,153,737 | 267,156,006 | (10,963,249) | 111,126,355 | ||||
| Net unrealized appreciation (depreciation) on investments | (138,222,392) | (13,565,718) | (48,570,551) | (31,334,249) | ||||
| Net Increase (Decrease) in Net Assets | ||||||||
| Resulting from Operations | (84,484,953) | 260,581,039 | (57,783,847) | 79,900,745 | ||||
| Dividends to Shareholders from ($): | ||||||||
| Investment income—net: | ||||||||
| Class M Shares | (4,706,351) | (7,932,371) | — | — | ||||
| Investor Shares | — | (86,011) | — | — | ||||
| Net realized gain on investments: | ||||||||
| Class M Shares | (290,742,198) | (234,597,218) | (93,553,168) | (95,370,568) | ||||
| Investor Shares | (6,187,293) | (4,769,554) | (779,053) | (978,502) | ||||
| Dreyfus Premier Shares | (585,373) | (828,723) | — | — | ||||
| Total Dividends | (302,221,215) | (248,213,877) | (94,332,221) | (96,349,070) | ||||
| Beneficial Interest Transactions ($): | ||||||||
| Net proceeds from shares sold: | ||||||||
| Class M Shares | 358,126,989 | 281,940,037 | 215,247,987 | 139,163,228 | ||||
| Investor Shares | 6,563,714 | 12,902,810 | 2,534,593 | 3,514,777 | ||||
| Dreyfus Premier Shares | 21,513 | 25,446 | — | — | ||||
| Dividends reinvested: | ||||||||
| Class M Shares | 194,264,082 | 150,145,577 | 64,066,796 | 61,106,520 | ||||
| Investor Shares | 5,593,861 | 4,570,406 | 715,704 | 810,943 | ||||
| Dreyfus Premier Shares | 484,613 | 715,679 | — | — | ||||
| Cost of shares redeemed: | ||||||||
| Class M Shares | (342,230,172) | (296,418,896) | (165,452,779) | (181,135,260) | ||||
| Investor Shares | (10,854,203) | (12,668,316) | (3,661,275) | (5,292,529) | ||||
| Dreyfus Premier Shares | (1,774,328) | (3,237,779) | — | — | ||||
| Increase (Decrease) in Net Assets from | ||||||||
| Beneficial Interest Transactions | 210,196,069 | 137,974,964 | 113,451,026 | 18,167,679 | ||||
| Total Increase (Decrease) in Net Assets | (176,510,099) | 150,342,126 | (38,665,042) | 1,719,354 | ||||
| Net Assets ($): | ||||||||
| Beginning of Period | 1,747,519,900 | 1,597,177,774 | 675,579,002 | 673,859,648 | ||||
| End of Period | 1,571,009,801 | 1,747,519,900 | 636,913,960 | 675,579,002 | ||||
| Undistributed investment income—net | 2,869,184 | 5,455,543 | 1,563,336 | 258,045 | ||||
68
| BNY Mellon Mid Cap Stock Fund | BNY Mellon Small Cap Stock Fund | |||||||
| Year Ended August 31, | Year Ended August 31, | |||||||
| 2008 | 2007 | 2008 | 2007 | |||||
| Capital Share Transactions: | ||||||||
| Class M Shares | ||||||||
| Shares sold | 29,990,811 | 20,373,901 | 17,812,671 | 9,447,857 | ||||
| Shares issued for dividends reinvested | 15,433,934 | 11,348,872 | 5,048,605 | 4,297,223 | ||||
| Shares redeemed | (27,138,793) | (20,747,563) | (12,720,300) | (11,874,638) | ||||
| Net Increase (Decrease) in Shares Outstanding | 18,285,952 | 10,975,210 | 10,140,976 | 1,870,442 | ||||
| Investor Sharesa | ||||||||
| Shares sold | 527,609 | 905,663 | 218,973 | 236,350 | ||||
| Shares issued for dividends reinvested | 448,282 | 347,893 | 57,952 | 57,630 | ||||
| Shares redeemed | (880,979) | (905,828) | (303,798) | (362,914) | ||||
| Net Increase (Decrease) in Shares Outstanding | 94,912 | 347,728 | (26,873) | (68,934) | ||||
| Dreyfus Premier Sharesa | ||||||||
| Shares sold | 1,728 | 1,928 | — | — | ||||
| Shares issued for dividends reinvested | 40,861 | 56,351 | — | — | ||||
| Shares redeemed | (150,984) | (238,498) | — | — | ||||
| Net Increase (Decrease) in Shares Outstanding | (108,395) | (180,219) | — | — | ||||
a During the period ended August 31, 2008, 100,441 Dreyfus Premier shares of BNY Mellon Mid Cap Stock Fund representing $1,191,638 were automatically converted to 95,597 Investor shares and during the period ended August 31, 2007, 148,230 Dreyfus Premier shares of BNY Mellon Mid Cap Stock Fund representing $2,024,244 were automatically converted to 143,127 Investor shares.
| See notes to financial statements. |
The Funds 69
| STATEMENTS OF CHANGES IN NET ASSETS (continued) |
| BNY Mellon U.S. Core Equity 130/30 Fund | BNY Mellon International Fund | |||||||
| Year Ended August 31, | Year Ended August 31, | |||||||
| 2008 | 2007a | 2008 | 2007 | |||||
| Operations ($): | ||||||||
| Investment income (loss)—net | 645,774 | (4,626) | 54,238,686 | 43,954,152 | ||||
| Net realized gain (loss) on investments | (12,231,599) | (58,612) | 95,378,216 | 361,316,981 | ||||
| Net unrealized appreciation (depreciation) on investments | (5,136,786) | 556,883 | (603,850,995) | (79,730,236) | ||||
| Net Increase (Decrease) in Net Assets | ||||||||
| Resulting from Operations | (16,722,611) | 493,645 | (454,234,093) | 325,540,897 | ||||
| Dividends to Shareholders from ($): | ||||||||
| Investment income—net: | ||||||||
| Class M Shares | — | — | (42,716,813) | (42,865,752) | ||||
| Investor Shares | — | — | (205,294) | (135,397) | ||||
| Net realized gain on investments: | ||||||||
| Class M Shares | — | — | (345,711,591) | (297,965,799) | ||||
| Investor Shares | — | — | (1,860,329) | (1,072,533) | ||||
| Total Dividends | — | — | (390,494,027) | (342,039,481) | ||||
| Beneficial Interest Transactions ($): | ||||||||
| Net proceeds from shares sold: | ||||||||
| Class M Shares | 186,351,055 | 25,975,600 | 556,922,492 | 499,791,572 | ||||
| Investor Shares | 4,745 | 10,000 | 13,032,304 | 13,554,606 | ||||
| Dividends reinvested: | ||||||||
| Class M Shares | — | — | 230,869,383 | 194,224,145 | ||||
| Investor Shares | — | — | 1,480,972 | 915,648 | ||||
| Cost of shares redeemed: | ||||||||
| Class M Shares | (14,890,330) | (405,457) | (781,527,245) | (375,343,055) | ||||
| Investor Shares | — | — | (17,717,637) | (10,052,185) | ||||
| Increase (Decrease) in Net Assets from | ||||||||
| Beneficial Interest Transactions | 171,465,470 | 25,580,143 | 3,060,269 | 323,090,731 | ||||
| Total Increase (Decrease) in Net Assets | 154,742,859 | 26,073,788 | (841,667,851) | 306,592,147 | ||||
| Net Assets ($): | ||||||||
| Beginning of Period | 26,073,788 | — | 2,850,601,265 | 2,544,009,118 | ||||
| End of Period | 180,816,647 | 26,073,788 | 2,008,933,414 | 2,850,601,265 | ||||
| Undistributed investment income—net | 657,459 | — | 50,952,391 | 42,795,763 | ||||
| Capital Share Transactions (Shares): | ||||||||
| Class M Shares | ||||||||
| Shares sold | 15,033,402 | 2,094,556 | 39,270,402 | 28,452,070 | ||||
| Shares issued for dividends reinvested | — | — | 15,684,061 | 11,512,990 | ||||
| Shares redeemed | (1,228,454) | (32,103) | (51,208,464) | (21,099,016) | ||||
| Net Increase (Decrease) in Shares Outstanding | 13,804,948 | 2,062,453 | 3,745,999 | 18,866,044 | ||||
| Investor Shares | ||||||||
| Shares sold | 376 | 800 | 829,908 | 731,940 | ||||
| Shares issued for dividends reinvested | — | — | 95,731 | 52,026 | ||||
| Shares redeemed | — | — | (1,149,216) | (541,199) | ||||
| Net Increase (Decrease) in Shares Outstanding | 376 | 800 | (223,577) | 242,767 | ||||
| a From August 1, 2007 (commencement of operations) to August 31, 2007. | ||||||||
| See notes to financial statements. | ||||||||
70
| BNY Mellon Emerging Markets Fund | BNY Mellon Balanced Fund | |||||||
| Year Ended August 31, | Year Ended August 31, | |||||||
| 2008 | 2007 | 2008 | 2007 | |||||
| Operations ($): | ||||||||
| Investment income—net | 15,488,397 | 14,989,685 | 8,735,920 | 8,161,745 | ||||
| Net realized gain (loss) on investments | 331,099,598 | 298,691,541 | 18,436,829 | 34,944,176 | ||||
| Net unrealized appreciation (depreciation) on investments | (442,376,656) | 125,896,899 | (40,618,563) | (2,011,921) | ||||
| Net Increase (Decrease) in Net Assets | ||||||||
| Resulting from Operations | (95,788,661) | 439,578,125 | (13,445,814) | 41,094,000 | ||||
| Dividends to Shareholders from ($): | ||||||||
| Investment income—net: | ||||||||
| Class M Shares | (12,065,738) | (11,143,002) | (10,238,937) | (8,588,393) | ||||
| Investor Shares | (65,696) | (55,920) | (116,860) | (87,689) | ||||
| Net realized gain on investments: | ||||||||
| Class M Shares | (353,792,959) | (373,891,351) | (32,629,458) | (37,309,689) | ||||
| Investor Shares | (2,618,833) | (2,695,847) | (387,034) | (410,941) | ||||
| Total Dividends | (368,543,226) | (387,786,120) | (43,372,289) | (46,396,712) | ||||
| Beneficial Interest Transactions ($): | ||||||||
| Net proceeds from shares sold: | ||||||||
| Class M Shares | 205,477,859 | 229,712,148 | 17,823,560 | 18,552,789 | ||||
| Investor Shares | 8,072,091 | 8,957,255 | 1,685,536 | 2,627,739 | ||||
| Dividends reinvested: | ||||||||
| Class M Shares | 243,684,211 | 241,635,492 | 28,856,395 | 32,351,111 | ||||
| Investor Shares | 2,132,234 | 2,299,129 | 497,307 | 450,228 | ||||
| Cost of shares redeemed: | ||||||||
| Class M Shares | (367,680,477) | (314,129,360) | (31,106,354) | (29,698,540) | ||||
| Investor Shares | (10,890,865) | (12,212,487) | (922,749) | (2,475,801) | ||||
| Increase (Decrease) in Net Assets from | ||||||||
| Beneficial Interest Transactions | 80,795,053 | 156,262,177 | 16,833,695 | 21,807,526 | ||||
| Total Increase (Decrease) in Net Assets | (383,536,834) | 208,054,182 | (39,984,408) | 16,504,814 | ||||
| Net Assets ($): | ||||||||
| Beginning of Period | 1,531,869,790 | 1,323,815,608 | 362,341,441 | 345,836,627 | ||||
| End of Period | 1,148,332,956 | 1,531,869,790 | 322,357,033 | 362,341,441 | ||||
| Undistributed investment income—net | 19,948,412 | 12,083,750 | 3,772,082 | 2,211,763 | ||||
| Capital Share Transactions (Shares): | ||||||||
| Class M Shares | ||||||||
| Shares sold | 10,294,485 | 10,259,259 | 1,523,216 | 1,442,105 | ||||
| Shares issued for dividends reinvested | 12,117,564 | 11,695,813 | 2,443,405 | 2,608,038 | ||||
| Shares redeemed | (17,134,264) | (13,164,193) | (2,647,673) | (2,286,103) | ||||
| Net Increase (Decrease) in Shares Outstanding | 5,277,785 | 8,790,879 | 1,318,948 | 1,764,040 | ||||
| Investor Shares | ||||||||
| Shares sold | 393,724 | 378,468 | 140,512 | 201,131 | ||||
| Shares issued for dividends reinvested | 104,881 | 110,323 | 42,003 | 35,958 | ||||
| Shares redeemed | (518,065) | (525,054) | (74,207) | (189,290) | ||||
| Net Increase (Decrease) in Shares Outstanding | (19,460) | (36,263) | 108,308 | 47,799 | ||||
| See notes to financial statements. | ||||||||
The Funds 71
FINANCIAL HIGHLIGHTS
The following tables describe the performance for each share class of each BNY Mellon equity fund for the fiscal periods indicated. All information (except portfolio turnover rate) reflects financial results for a single fund share.Total return shows how much your investment in each fund would have increased (or decreased) during the period, assuming you had reinvested all dividends and distributions.These figures have been derived from each fund’s financial statements.
| Class M Shares | ||||||||||
| Year Ended August 31, | ||||||||||
| BNY Mellon Large Cap Stock Fund | 2008 | 2007 | 2006 | 2005 | 2004 | |||||
| Per Share Data ($): | ||||||||||
| Net asset value, beginning of period | 11.56 | 10.31 | 9.79 | 8.74 | 8.16 | |||||
| Investment Operations: | ||||||||||
| Investment income—neta | .11 | .09 | .10 | .11 | .07 | |||||
| Net realized and unrealized gain (loss) on investments | (1.05) | 1.49 | .52 | 1.05 | .58 | |||||
| Total from Investment Operations | (.94) | 1.58 | .62 | 1.16 | .65 | |||||
| Distributions: | ||||||||||
| Dividends from investment income—net | (.12) | (.08) | (.10) | (.11) | (.07) | |||||
| Dividends from net realized gain on investments | (1.73) | (.25) | — | — | — | |||||
| Total Distributions | (1.85) | (.33) | (.10) | (.11) | (.07) | |||||
| Net asset value, end of period | 8.77 | 11.56 | 10.31 | 9.79 | 8.74 | |||||
| Total Return (%) | (9.95) | 15.60 | 6.32 | 13.27 | 7.95 | |||||
| Ratios/Supplemental Data (%): | ||||||||||
| Ratio of total expenses to average net assets | .80 | .80 | .80 | .80 | .81 | |||||
| Ratio of net expenses to average net assets | .80b | .79 | .80b | .80b | .81 | |||||
| Ratio of net investment income to average net assets | 1.15 | .76 | .96 | 1.13 | .77 | |||||
| Portfolio Turnover Rate | 56.13 | 77.46 | 19.08 | 23.49 | 43.52 | |||||
| Net Assets, end of period ($ x 1,000) | 1,750,688 | 1,970,482 | 1,766,105 | 1,733,531 | 1,545,002 | |||||
a Based on average shares outstanding at each month end. b Expense waivers and/or reimbursements amounted to less than .01%.
| See notes to financial statements. |
72
| Investor Shares | ||||||||||
| Year Ended August 31, | ||||||||||
| BNY Mellon Large Cap Stock Fund | 2008 | 2007 | 2006 | 2005 | 2004 | |||||
| Per Share Data ($): | ||||||||||
| Net asset value, beginning of period | 11.58 | 10.33 | 9.82 | 8.76 | 8.16 | |||||
| Investment Operations: | ||||||||||
| Investment income—neta | .09 | .06 | .07 | .08 | .06 | |||||
| Net realized and unrealized gain (loss) on investments | (1.07) | 1.50 | .51 | 1.06 | .58 | |||||
| Total from Investment Operations | (.98) | 1.56 | .58 | 1.14 | .64 | |||||
| Distributions: | ||||||||||
| Dividends from investment income—net | (.09) | (.06) | (.07) | (.08) | (.04) | |||||
| Dividends from net realized gain on investments | (1.73) | (.25) | — | — | — | |||||
| Total Distributions | (1.82) | (.31) | (.07) | (.08) | (.04) | |||||
| Net asset value, end of period | 8.78 | 11.58 | 10.33 | 9.82 | 8.76 | |||||
| Total Return (%) | (10.26) | 15.29 | 5.95 | 13.08 | 7.88 | |||||
| Ratios/Supplemental Data (%): | ||||||||||
| Ratio of total expenses to average net assets | 1.05 | 1.05 | 1.06 | 1.05 | 1.06 | |||||
| Ratio of net expenses to average net assets | 1.05b | 1.04 | 1.06b | 1.05b | 1.06 | |||||
| Ratio of net investment income to average net assets | .89 | .51 | .72 | .87 | .59 | |||||
| Portfolio Turnover Rate | 56.13 | 77.46 | 19.08 | 23.49 | 43.52 | |||||
| Net Assets, end of period ($ x 1,000) | 9,829 | 11,704 | 7,629 | 3,985 | 3,356 |
a Based on average shares outstanding at each month end. b Expense waivers and/or reimbursements amounted to less than .01%.
| See notes to financial statements. |
The Funds 73
| FINANCIAL HIGHLIGHTS (continued) |
| Class M Shares | ||||||||||
| Year Ended August 31, | ||||||||||
| BNY Mellon Income Stock Fund | 2008 | 2007 | 2006 | 2005 | 2004 | |||||
| Per Share Data ($): | ||||||||||
| Net asset value, beginning of period | 10.61 | 10.43 | 9.92 | 9.50 | 8.56 | |||||
| Investment Operations: | ||||||||||
| Investment income—neta | .16 | .19 | .22 | .21 | .16 | |||||
| Net realized and unrealized gain (loss) on investments | (1.35) | 1.04 | .75 | 1.27 | 1.09 | |||||
| Total from Investment Operations | (1.19) | 1.23 | .97 | 1.48 | 1.25 | |||||
| Distributions: | ||||||||||
| Dividends from investment income—net | (.16) | (.19) | (.22) | (.20) | (.17) | |||||
| Dividends from net realized gain on investments | (2.04) | (.86) | (.24) | (.86) | (.14) | |||||
| Total Distributions | (2.20) | (1.05) | (.46) | (1.06) | (.31) | |||||
| Net asset value, end of period | 7.22 | 10.61 | 10.43 | 9.92 | 9.50 | |||||
| Total Return (%) | (13.79) | 12.11 | 10.00 | 16.23 | 14.68 | |||||
| Ratios/Supplemental Data (%): | ||||||||||
| Ratio of total expenses to average net assets | .84 | .81 | .81 | .82 | .83 | |||||
| Ratio of net expenses to average net assets | .84b | .81 | .81b | .82b | .83 | |||||
| Ratio of net investment income to average net assets | 1.87 | 1.81 | 2.14 | 2.12 | 1.75 | |||||
| Portfolio Turnover Rate | 33.02 | 62.06 | 40.75 | 34.61 | 52.47 | |||||
| Net Assets, end of period ($ x 1,000) | 199,367 | 414,866 | 421,266 | 394,977 | 274,881 | |||||
a Based on average shares outstanding at each month end. b Expense waivers and/or reimbursements amounted to less than .01%.
| See notes to financial statements. |
74
| Investor Shares | ||||||||||
| Year Ended August 31, | ||||||||||
| BNY Mellon Income Stock Fund | 2008 | 2007 | 2006 | 2005 | 2004 | |||||
| Per Share Data ($): | ||||||||||
| Net asset value, beginning of period | 10.67 | 10.49 | 9.98 | 9.53 | 8.58 | |||||
| Investment Operations: | ||||||||||
| Investment income—neta | .14 | .17 | .19 | .18 | .14 | |||||
| Net realized and unrealized gain (loss) on investments | (1.36) | 1.04 | .75 | 1.29 | 1.08 | |||||
| Total from Investment Operations | (1.22) | 1.21 | .94 | 1.47 | 1.22 | |||||
| Distributions: | ||||||||||
| Dividends from investment income—net | (.14) | (.17) | (.19) | (.16) | (.13) | |||||
| Dividends from net realized gain on investments | (2.04) | (.86) | (.24) | (.86) | (.14) | |||||
| Total Distributions | (2.18) | (1.03) | (.43) | (1.02) | (.27) | |||||
| Net asset value, end of period | 7.27 | 10.67 | 10.49 | 9.98 | 9.53 | |||||
| Total Return (%) | (14.03) | 11.78 | 9.68 | 16.00 | 14.26 | |||||
| Ratios/Supplemental Data (%): | ||||||||||
| Ratio of total expenses to average net assets | 1.09 | 1.06 | 1.06 | 1.07 | 1.08 | |||||
| Ratio of net expenses to average net assets | 1.09b | 1.06 | 1.06b | 1.07b | 1.08 | |||||
| Ratio of net investment income to average net assets | 1.62 | 1.55 | 1.92 | 1.88 | 1.49 | |||||
| Portfolio Turnover Rate | 33.02 | 62.06 | 40.75 | 34.61 | 52.47 | |||||
| Net Assets, end of period ($ x 1,000) | 1,407 | 1,719 | 1,468 | 1,092 | 756 |
a Based on average shares outstanding at each month end. b Expense waivers and/or reimbursements amounted to less than .01%.
| See notes to financial statements. |
The Funds 75
| FINANCIAL HIGHLIGHTS (continued) |
| Class M Shares | ||||||||||
| Year Ended August 31, | ||||||||||
| BNY Mellon Mid Cap Fund | 2008 | 2007 | 2006 | 2005 | 2004 | |||||
| Per Share Data ($): | ||||||||||
| Net asset value, beginning of period | 14.19 | 14.26 | 14.80 | 12.29 | 11.07 | |||||
| Investment Operations: | ||||||||||
| Investment income—neta | .03 | .06 | .08 | .04 | .04 | |||||
| Net realized and unrealized gain (loss) on investments | (.53) | 2.17 | 1.21 | 3.33 | 1.21 | |||||
| Total from Investment Operations | (.50) | 2.23 | 1.29 | 3.37 | 1.25 | |||||
| Distributions: | ||||||||||
| Dividends from investment income—net | (.04) | (.08) | (.01) | (.04) | (.03) | |||||
| Dividends from net realized gain on investments | (2.54) | (2.22) | (1.82) | (.82) | — | |||||
| Total Distributions | (2.58) | (2.30) | (1.83) | (.86) | (.03) | |||||
| Net asset value, end of period | 11.11 | 14.19 | 14.26 | 14.80 | 12.29 | |||||
| Total Return (%) | (5.67) | 16.76 | 9.14 | 28.41 | 11.33 | |||||
| Ratios/Supplemental Data (%): | ||||||||||
| Ratio of total expenses to average net assets | .90 | .90 | .91 | .91 | .91 | |||||
| Ratio of net expenses to average net assets | .90b | .90b | .91b | .91 | .91 | |||||
| Ratio of net investment income to average net assets | .28 | .42 | .51 | .26 | .34 | |||||
| Portfolio Turnover Rate | 121.12 | 112.31 | 93.33 | 83.57 | 69.03 | |||||
| Net Assets, end of period ($ x 1,000) | 1,540,821 | 1,708,747 | 1,560,575 | 1,458,952 | 1,159,657 | |||||
| a Based on average shares outstanding at each month end. | ||||||||||
| b Expense waivers and/or reimbursements amounted to less than .01%. | ||||||||||
| See notes to financial statements. | ||||||||||
76
| Investor Shares | ||||||||||
| Year Ended August 31, | ||||||||||
| BNY Mellon Mid Cap Fund | 2008 | 2007 | 2006 | 2005 | 2004 | |||||
| Per Share Data ($): | ||||||||||
| Net asset value, beginning of period | 14.07 | 14.16 | 14.73 | 12.24 | 11.03 | |||||
| Investment Operations: | ||||||||||
| Investment income—neta | .00b | .02 | .04 | .00b | .01 | |||||
| Net realized and unrealized gain (loss) on investments | (.53) | 2.15 | 1.21 | 3.32 | 1.21 | |||||
| Total from Investment Operations | (.53) | 2.17 | 1.25 | 3.32 | 1.22 | |||||
| Distributions: | ||||||||||
| Dividends from investment income—net | — | (.04) | — | (.01) | (.01) | |||||
| Dividends from net realized gain on investments | (2.54) | (2.22) | (1.82) | (.82) | — | |||||
| Total Distributions | (2.54) | (2.26) | (1.82) | (.83) | (.01) | |||||
| Net asset value, end of period | 11.00 | 14.07 | 14.16 | 14.73 | 12.24 | |||||
| Total Return (%) | (5.94) | 16.44 | 8.93 | 28.05 | 11.02 | |||||
| Ratios/Supplemental Data (%): | ||||||||||
| Ratio of total expenses to average net assets | 1.15 | 1.15 | 1.15 | 1.15 | 1.16 | |||||
| Ratio of net expenses to average net assets | 1.15c | 1.15c | 1.15c | 1.15 | 1.16 | |||||
| Ratio of net investment income to average net assets | .03 | .16 | .26 | .02 | .10 | |||||
| Portfolio Turnover Rate | 121.12 | 112.31 | 93.33 | 83.57 | 69.03 | |||||
| Net Assets, end of period ($ x 1,000) | 28,520 | 35,139 | 30,433 | 26,445 | 21,810 | |||||
a Based on average shares outstanding at each month end. b Amount represents less than $.01 per share. c Expense waivers and/or reimbursements amounted to less than .01%.
| See notes to financial statements. |
The Funds 77
| FINANCIAL HIGHLIGHTS (continued) |
| Dreyfus Premier Shares | ||||||||||
| Year Ended August 31, | ||||||||||
| BNY Mellon Mid Cap Fund | 2008 | 2007 | 2006 | 2005 | 2004 | |||||
| Per Share Data ($): | ||||||||||
| Net asset value, beginning of period | 13.52 | 13.74 | 14.44 | 12.09 | 10.96 | |||||
| Investment Operations: | ||||||||||
| Investment (loss)—neta | (.09) | (.07) | (.07) | (.09) | (.08) | |||||
| Net realized and unrealized gain (loss) on investments | (.49) | 2.07 | 1.19 | 3.26 | 1.21 | |||||
| Total from Investment Operations | (.58) | 2.00 | 1.12 | 3.17 | 1.13 | |||||
| Distributions: | ||||||||||
| Dividends from net realized gain on investments | (2.54) | (2.22) | (1.82) | (.82) | — | |||||
| Net asset value, end of period | 10.40 | 13.52 | 13.74 | 14.44 | 12.09 | |||||
| Total Return (%) | (6.63) | 15.58 | 8.13 | 27.11 | 10.31 | |||||
| Ratios/Supplemental Data (%): | ||||||||||
| Ratio of total expenses to average net assets | 1.90 | 1.90 | 1.90 | 1.88 | 1.91 | |||||
| Ratio of net expenses to average net assets | 1.90b | 1.90b | 1.90b | 1.88 | 1.91 | |||||
| Ratio of net investment (loss) to average net assets | (.73) | (.53) | (.48) | (.71) | (.65) | |||||
| Portfolio Turnover Rate | 121.12 | 112.31 | 93.33 | 83.57 | 69.03 | |||||
| Net Assets, end of period ($ x 1,000) | 1,669 | 3,635 | 6,170 | 8,113 | 9,682 |
a Based on average shares outstanding at each month end. b Expense waivers and/or reimbursements amounted to less than .01%.
| See notes to financial statements. |
78
| Class M Shares | ||||||||||
| Year Ended August 31, | ||||||||||
| BNY Mellon Small Cap Stock Fund | 2008 | 2007 | 2006 | 2005 | 2004 | |||||
| Per Share Data ($): | ||||||||||
| Net asset value, beginning of period | 14.82 | 15.39 | 17.18 | 14.92 | 13.17 | |||||
| Investment Operations: | ||||||||||
| Investment income (loss)—neta | .03 | .00b | (.01) | (.01) | (.02) | |||||
| Net realized and unrealized gain (loss) on investments | (1.15) | 1.83 | .80 | 2.66 | 1.77 | |||||
| Total from Investment Operations | (1.12) | 1.83 | .79 | 2.65 | 1.75 | |||||
| Distributions: | ||||||||||
| Dividends from net realized gain on investments | (2.26) | (2.40) | (2.58) | (.39) | — | |||||
| Net asset value, end of period | 11.44 | 14.82 | 15.39 | 17.18 | 14.92 | |||||
| Total Return (%) | (9.07) | 12.53 | 5.04 | 17.86 | 13.29 | |||||
| Ratios/Supplemental Data (%): | ||||||||||
| Ratio of total expenses to average net assets | 1.01 | 1.01 | 1.01 | 1.01 | 1.02 | |||||
| Ratio of net expenses to average net assets | 1.01c | 1.00 | 1.01c | 1.01c | 1.02c | |||||
| Ratio of net investment income (loss) to average net assets | .28 | .02 | (.08) | (.07) | (.11) | |||||
| Portfolio Turnover Rate | 132.19 | 167.04 | 108.79 | 148.54 | 91.71 | |||||
| Net Assets, end of period ($ x 1,000) | 633,118 | 670,238 | 667,241 | 797,808 | 747,637 | |||||
| a | Based on average shares outstanding at each month end. |
| b | Amount represents less than $.01 per share. |
| c | Expense waivers and/or reimbursements amounted to less than .01%. |
| See notes to financial statements. |
The Funds 79
| FINANCIAL HIGHLIGHTS (continued) |
| Investor Shares | ||||||||||
| Year Ended August 31, | ||||||||||
| BNY Mellon Small Cap Stock Fund | 2008 | 2007 | 2006 | 2005 | 2004 | |||||
| Per Share Data ($): | ||||||||||
| Net asset value, beginning of period | 14.50 | 15.13 | 16.97 | 14.78 | 13.08 | |||||
| Investment Operations: | ||||||||||
| Investment income (loss)—neta | .00b | (.03) | (.05) | (.05) | (.05) | |||||
| Net realized and unrealized gain (loss) on investments | (1.13) | 1.80 | .79 | 2.63 | 1.75 | |||||
| Total from Investment Operations | (1.13) | 1.77 | .74 | 2.58 | 1.70 | |||||
| Distributions: | ||||||||||
| Dividends from net realized gain on investments | (2.26) | (2.40) | (2.58) | (.39) | — | |||||
| Net asset value, end of period | 11.11 | 14.50 | 15.13 | 16.97 | 14.78 | |||||
| Total Return (%) | (9.36) | 12.33 | 4.78 | 17.55 | 13.00 | |||||
| Ratios/Supplemental Data (%): | ||||||||||
| Ratio of total expenses to average net assets | 1.26 | 1.26 | 1.26 | 1.26 | 1.26 | |||||
| Ratio of net expenses to average net assets | 1.26c | 1.25 | 1.26c | 1.26c | 1.26c | |||||
| Ratio of net investment income (loss) to average net assets | .02 | (.23) | (.35) | (.33) | (.35) | |||||
| Portfolio Turnover Rate | 132.19 | 167.04 | 108.79 | 148.54 | 91.71 | |||||
| Net Assets, end of period ($ x 1,000) | 3,795 | 5,341 | 6,618 | 4,692 | 3,310 | |||||
a Based on average shares outstanding at each month end. b Amount represents less than $.01 per share. c Expense waivers and/or reimbursements amounted to less than .01%.
| See notes to financial statements. |
80
| Class M Shares | ||||
| Year Ended August 31, | ||||
| BNY Mellon U.S. Core Equity 130/30 Fund | 2008 | 2007a | ||
| Per Share Data ($): | ||||
| Net asset value, beginning of period | 12.64 | 12.50 | ||
| Investment Operations: | ||||
| Investment income (loss)—netb | .07 | (.00)c | ||
| Net realized and unrealized gain (loss) on investments | (1.32) | .14 | ||
| Total from Investment Operations | (1.25) | .14 | ||
| Net asset value, end of period | 11.39 | 12.64 | ||
| Total Return (%) | (9.89) | 1.12d | ||
| Ratios/Supplemental Data (%): | ||||
| Ratio of total expenses to average net assets | 2.39e | .50d | ||
| Ratio of net expenses to average net assets | 2.28e | .28d | ||
| Ratio of net investment income (loss) to average net assets | .58 | (.03)d | ||
| Portfolio Turnover Rate | 163.66 | 11.94d | ||
| Net Assets, end of period ($ x 1,000) | 180,803 | 26,064 | ||
a From August 1, 2007 (commencement of operations) to August 31, 2007. b Based on average shares outstanding at each month end. c Amount represents less than $.01 per share. d Not annualized. e Higher costs are due to borrowing costs associated with the 130/30 fund structure.
| See notes to financial statements. |
The Funds 81
| FINANCIAL HIGHLIGHTS (continued) |
| Investor Shares | ||||
| Year Ended August 31, | ||||
| BNY Mellon U.S. Core Equity 130/30 Fund | 2008 | 2007a | ||
| Per Share Data ($): | ||||
| Net asset value, beginning of period | 12.63 | 12.50 | ||
| Investment Operations: | ||||
| Investment income (loss)—netb | .02 | (.00)c | ||
| Net realized and unrealized gain (loss) on investments | (1.29) | .13 | ||
| Total from Investment Operations | (1.27) | .13 | ||
| Net asset value, end of period | 11.36 | 12.63 | ||
| Total Return (%) | (10.06) | 1.04d | ||
| Ratios/Supplemental Data (%): | ||||
| Ratio of total expenses to average net assets | 2.81e | .50d | ||
| Ratio of net expenses to average net assets | 2.71e | .28d | ||
| Ratio of net investment income (loss) to average net assets | .16 | (.03)d | ||
| Portfolio Turnover Rate | 163.66 | 11.94d | ||
| Net Assets, end of period ($ x 1,000) | 13 | 10 | ||
a From August 1, 2007 (commencement of operations) to August 31, 2007. b Based on average shares outstanding at each month end. c Amount represents less than $.01 per share. d Not annualized. e Higher costs are due to borrowing costs associated with the 130/30 fund structure.
| See notes to financial statements. |
82
| Class M Shares | ||||||||||
| Year Ended August 31, | ||||||||||
| BNY Mellon International Fund | 2008 | 2007 | 2006 | 2005 | 2004 | |||||
| Per Share Data ($): | ||||||||||
| Net asset value, beginning of period | 17.56 | 17.77 | 16.20 | 14.29 | 11.77 | |||||
| Investment Operations: | ||||||||||
| Investment income—neta | .33 | .28 | .28 | .22 | .20 | |||||
| Net realized and unrealized gain (loss) on investments | (3.14) | 1.92 | 3.02 | 2.52 | 2.51 | |||||
| Total from Investment Operations | (2.81) | 2.20 | 3.30 | 2.74 | 2.71 | |||||
| Distributions: | ||||||||||
| Dividends from investment income—net | (.29) | (.30) | (.23) | (.20) | (.19) | |||||
| Dividends from net realized gain on investments | (2.35) | (2.11) | (1.50) | (.63) | — | |||||
| Total Distributions | (2.64) | (2.41) | (1.73) | (.83) | (.19) | |||||
| Net asset value, end of period | 12.11 | 17.56 | 17.77 | 16.20 | 14.29 | |||||
| Total Return (%) | (18.61) | 12.93 | 21.86 | 19.51 | 23.15 | |||||
| Ratios/Supplemental Data (%): | ||||||||||
| Ratio of total expenses to average net assets | 1.10 | 1.08 | 1.10 | 1.09 | 1.11 | |||||
| Ratio of net expenses to average net assets | 1.06 | 1.08b | 1.10b | 1.09 | 1.10 | |||||
| Ratio of net investment income to average net assets | 2.22 | 1.59 | 1.68 | 1.40 | 1.46 | |||||
| Portfolio Turnover Rate | 78.35 | 72.83 | 70.02 | 44.92 | 45.60 | |||||
| Net Assets, end of period ($ x 1,000) | 2,002,307 | 2,836,968 | 2,534,753 | 1,857,398 | 1,265,004 | |||||
a Based on average shares outstanding at each month end. b Expense waivers and/or reimbursements amounted to less than .01%.
| See notes to financial statements. |
The Funds 83
| FINANCIAL HIGHLIGHTS (continued) |
| Investor Shares | ||||||||||
| Year Ended August 31, | ||||||||||
| BNY Mellon International Fund | 2008 | 2007 | 2006 | 2005 | 2004 | |||||
| Per Share Data ($): | ||||||||||
| Net asset value, beginning of period | 18.29 | 18.41 | 16.74 | 14.74 | 12.13 | |||||
| Investment Operations: | ||||||||||
| Investment income—neta | .28 | .23 | .26 | .24 | .49 | |||||
| Net realized and unrealized gain (loss) on investments | (3.26) | 2.03 | 3.11 | 2.55 | 2.20 | |||||
| Total from Investment Operations | (2.98) | 2.26 | 3.37 | 2.79 | 2.69 | |||||
| Distributions: | ||||||||||
| Dividends from investment income—net | (.26) | (.27) | (.20) | (.16) | (.08) | |||||
| Dividends from net realized gain on investments | (2.35) | (2.11) | (1.50) | (.63) | — | |||||
| Total Distributions | (2.61) | (2.38) | (1.70) | (.79) | (.08) | |||||
| Net asset value, end of period | 12.70 | 18.29 | 18.41 | 16.74 | 14.74 | |||||
| Total Return (%) | (18.87) | 12.73 | 21.49 | 19.24 | 22.28 | |||||
| Ratios/Supplemental Data (%): | ||||||||||
| Ratio of total expenses to average net assets | 1.35 | 1.33 | 1.36 | 1.34 | 1.35 | |||||
| Ratio of net expenses to average net assets | 1.32 | 1.32 | 1.36b | 1.34 | 1.35b | |||||
| Ratio of net investment income to average net assets | 1.82 | 1.26 | 1.50 | 1.50 | 2.63 | |||||
| Portfolio Turnover Rate | 78.35 | 72.83 | 70.02 | 44.92 | 45.60 | |||||
| Net Assets, end of period ($ x 1,000) | 6,627 | 13,634 | 9,256 | 3,466 | 900 |
a Based on average shares outstanding at each month end. b Expense waivers and/or reimbursements amounted to less than .01%.
| See notes to financial statements. |
84
| Class M Shares | ||||||||||
| Year Ended August 31, | ||||||||||
| BNY Mellon Emerging Markets Fund | 2008 | 2007 | 2006 | 2005 | 2004 | |||||
| Per Share Data ($): | ||||||||||
| Net asset value, beginning of period | 24.42 | 24.53 | 22.69 | 17.98 | 14.92 | |||||
| Investment Operations: | ||||||||||
| Investment income—neta | .23 | .25 | .29 | .32 | .25 | |||||
| Net realized and unrealized gain (loss) on investments | (1.45) | 7.18 | 4.96 | 6.09 | 3.16 | |||||
| Total from Investment Operations | (1.22) | 7.43 | 5.25 | 6.41 | 3.41 | |||||
| Distributions: | ||||||||||
| Dividends from investment income—net | (.21) | (.22) | (.44) | (.12) | (.12) | |||||
| Dividends from net realized gain on investments | (6.10) | (7.32) | (2.97) | (1.58) | (.23) | |||||
| Total Distributions | (6.31) | (7.54) | (3.41) | (1.70) | (.35) | |||||
| Net asset value, end of period | 16.89 | 24.42 | 24.53 | 22.69 | 17.98 | |||||
| Total Return (%) | (9.11) | 35.81 | 24.59 | 36.62 | 22.93 | |||||
| Ratios/Supplemental Data (%): | ||||||||||
| Ratio of total expenses to average net assets | 1.53 | 1.50 | 1.52 | 1.51 | 1.51 | |||||
| Ratio of net expenses to average net assets | 1.52 | 1.50b | 1.52 | 1.51b | 1.50 | |||||
| Ratio of net investment income to average net assets | 1.11 | 1.05 | 1.18 | 1.52 | 1.39 | |||||
| Portfolio Turnover Rate | 63.60 | 60.72 | 49.06 | 42.97 | 46.36 | |||||
| Net Assets, end of period ($ x 1,000) | 1,141,146 | 1,521,024 | 1,312,055 | 1,337,801 | 1,001,344 | |||||
a Based on average shares outstanding at each month end. b Expense waivers and/or reimbursements amounted to less than .01%.
| See notes to financial statements. |
The Funds 85
| FINANCIAL HIGHLIGHTS (continued) |
| Investor Shares | ||||||||||
| Year Ended August 31, | ||||||||||
| BNY Mellon Emerging Markets Fund | 2008 | 2007 | 2006 | 2005 | 2004 | |||||
| Per Share Data ($): | ||||||||||
| Net asset value, beginning of period | 24.60 | 24.65 | 22.79 | 18.08 | 15.00 | |||||
| Investment Operations: | ||||||||||
| Investment income—neta | .20 | .15 | .26 | .30 | .17 | |||||
| Net realized and unrealized gain (loss) on investments | (1.50) | 7.27 | 4.96 | 6.09 | 3.22 | |||||
| Total from Investment Operations | (1.30) | 7.42 | 5.22 | 6.39 | 3.39 | |||||
| Distributions: | ||||||||||
| Dividends from investment income—net | (.15) | (.15) | (.39) | (.10) | (.08) | |||||
| Dividends from net realized gain on investments | (6.10) | (7.32) | (2.97) | (1.58) | (.23) | |||||
| Total Distributions | (6.25) | (7.47) | (3.36) | (1.68) | (.31) | |||||
| Net asset value, end of period | 17.05 | 24.60 | 24.65 | 22.79 | 18.08 | |||||
| Total Return (%) | (9.29) | 35.52 | 24.29 | 36.26 | 22.68 | |||||
| Ratios/Supplemental Data (%): | ||||||||||
| Ratio of total expenses to average net assets | 1.78 | 1.75 | 1.78 | 1.72 | 1.84 | |||||
| Ratio of net expenses to average net assets | 1.78b | 1.74 | 1.78 | 1.72b | 1.83 | |||||
| Ratio of net investment income to average net assets | .96 | .65 | 1.07 | 1.48 | 1.14 | |||||
| Portfolio Turnover Rate | 63.60 | 60.72 | 49.06 | 42.97 | 46.36 | |||||
| Net Assets, end of period ($ x 1,000) | 7,187 | 10,846 | 11,761 | 4,557 | 3,424 |
a Based on average shares outstanding at each month end. b Expense waivers and/or reimbursements amounted to less than .01%.
| See notes to financial statements. |
86
| Class M Shares | ||||||||||
| Year Ended August 31, | ||||||||||
| BNY Mellon Balanced Fund | 2008 | 2007 | 2006 | 2005 | 2004 | |||||
| Per Share Data ($): | ||||||||||
| Net asset value, beginning of period | 12.91 | 13.17 | 12.79 | 11.56 | 10.79 | |||||
| Investment Operations: | ||||||||||
| Investment income—neta | .30 | .29 | .27 | .22 | .20 | |||||
| Net realized and unrealized gain (loss) on investments | (.73) | 1.21 | .64 | 1.25 | .78 | |||||
| Total from Investment Operations | (.43) | 1.50 | .91 | 1.47 | .98 | |||||
| Distributions: | ||||||||||
| Dividends from investment income—net | (.36) | (.32) | (.30) | (.24) | (.21) | |||||
| Dividends from net realized gain on investments | (1.19) | (1.44) | (.23) | — | — | |||||
| Total Distributions | (1.55) | (1.76) | (.53) | (.24) | (.21) | |||||
| Net asset value, end of period | 10.93 | 12.91 | 13.17 | 12.79 | 11.56 | |||||
| Total Return (%) | (3.99) | 12.09 | 7.22 | 12.78 | 9.13 | |||||
| Ratios/Supplemental Data (%): | ||||||||||
| Ratio of total expenses to average net assets | .58 | .58 | .60 | .58 | .59 | |||||
| Ratio of net expenses to average net assets | .58b | .58b | .60 | .58 | .59b | |||||
| Ratio of net investment income to average net assets | 2.51 | 2.26 | 2.10 | 1.81 | 1.77 | |||||
| Portfolio Turnover Ratec | 51.92 | 89.78 | 64.43 | 62.64 | 61.77 | |||||
| Net Assets, end of period ($ x 1,000) | 317,545 | 358,068 | 342,110 | 351,525 | 342,326 | |||||
a Based on average shares outstanding at each month end. b Expense waivers and/or reimbursements amounted to less than .01%. c The portfolio turnover rates excluding mortgage dollar roll transactions for the periods ended August 31, 2008,August 31, 2007,August 31, 2006,August 31, 2005 and August 31, 2004 were 51.44%, 75.75%, 61.53%, 45.79% and 55.45%, respectively.
| See notes to financial statements. |
The Funds 87
| FINANCIAL HIGHLIGHTS (continued) |
| Investor Shares | ||||||||||
| Year Ended August 31, | ||||||||||
| BNY Mellon Balanced Fund | 2008 | 2007 | 2006 | 2005 | 2004 | |||||
| Per Share Data ($): | ||||||||||
| Net asset value, beginning of period | 12.96 | 13.21 | 12.83 | 11.57 | 10.79 | |||||
| Investment Operations: | ||||||||||
| Investment income—neta | .27 | .26 | .24 | .18 | .17 | |||||
| Net realized and unrealized gain (loss) on investments | (.74) | 1.21 | .63 | 1.26 | .77 | |||||
| Total from Investment Operations | (.47) | 1.47 | .87 | 1.44 | .94 | |||||
| Distributions: | ||||||||||
| Dividends from investment income—net | (.32) | (.28) | (.26) | (.18) | (.16) | |||||
| Dividends from net realized gain on investments | (1.19) | (1.44) | (.23) | — | — | |||||
| Total Distributions | (1.51) | (1.72) | (.49) | (.18) | (.16) | |||||
| Net asset value, end of period | 10.98 | 12.96 | 13.21 | 12.83 | 11.57 | |||||
| Total Return (%) | (4.29) | 11.73 | 6.93 | 12.55 | 8.76 | |||||
| Ratios/Supplemental Data (%): | ||||||||||
| Ratio of total expenses to average net assets | .81 | .86 | .85 | .85 | .85 | |||||
| Ratio of net expenses to average net assets | .81b | .86b | .85 | .85 | .85b | |||||
| Ratio of net investment income to average net assets | 2.28 | 1.98 | 1.86 | 1.45 | 1.45 | |||||
| Portfolio Turnover Ratec | 51.92 | 89.78 | 64.43 | 62.64 | 61.77 | |||||
| Net Assets, end of period ($ x 1,000) | 4,812 | 4,274 | 3,727 | 1,848 | 665 |
a Based on average shares outstanding at each month end. b Expense waivers and/or reimbursements amounted to less than .01%. e The portfolio turnover rates excluding mortgage dollar roll transactions for the periods ended August 31, 2008,August 31, 2007,August 31, 2006,August 31, 2005 and August 31, 2004 were 51.44%, 75.75%, 61.53%, 45.79% and 55.45%, respectively.
| See notes to financial statements. |
88
NOTES TO FINANCIAL STATEMENTS
NOTE 1—General:
BNY Mellon Funds Trust (the “Trust”) was organized as a Massachusetts business trust which is registered under the Investment Company Act of 1940, as amended (the “Act”), as an open-end management investment company and operates as a series company currently comprised of twenty series, effective as of the close of business on September 12, 2008, including the following diversified equity funds and balanced fund: BNY Mellon Large Cap Stock Fund, BNY Mellon Income Stock Fund, BNY Mellon Mid Cap Stock Fund, BNY Mellon Small Cap Stock Fund, BNY Mellon U.S. Core Equity 130/30 Fund, BNY Mellon International Fund, BNY Mellon Emerging Markets Fund and BNY Mellon Balanced Fund (each, a “fund” and collectively, the “funds”). Effective March 31, 2008, the Trust changed its name from “Mellon Funds Trust” to its current name and each fund added “BNY” to the beginning of its name. BNY Mellon Large Cap Stock Fund, BNY Mellon Mid Cap Stock Fund, BNY Mellon Small Cap Stock Fund and BNY Mellon U.S. Core Equity 130/30 Fund seek capital appreciation and BNY Mellon Income Stock Fund seeks total return (consisting of capital appreciation and income). BNY Mellon International Fund and BNY Mellon Emerging Markets Fund seek long-term capital growth. BNY Mellon Balanced Fund seeks long-term growth of principal in conjunction with current income.
BNY Mellon Fund Advisers, a division of The Dreyfus Corporation (the “Manager” or “Dreyfus”), a wholly-owned subsidiary of The Bank of New York Mellon Corporation (“BNY Mellon”), serves as each fund’s investment adviser (“Investment Adviser”). The Bank of New York Mellon, a subsidiary of BNY Mellon and an affiliate of Dreyfus, serves as administrator for the funds pursuant to an Administration Agreement with the Trust (the “Administration Agreement”). The Bank of New York Mellon has entered into a Sub-Administration Agreement with Dreyfus pursuant to which The Bank of New York Mellon pays Dreyfus for performing certain
administrative services. MBSC Securities Corporation (the “Distributor”), a wholly-owned subsidiary of Dreyfus, is the distributor of each fund’s shares, which are sold without a sales charge.
Effective July 1, 2008, BNY Mellon has reorganized and consolidated a number of its banking and trust company subsidiaries.As a result of the reorganization, any services previously provided to the funds by Mellon Bank, N.A. or Mellon Trust of New England, N.A. are now provided by The Bank of New York, which has changed its name to The Bank of New York Mellon.
The Trust is authorized to issue an unlimited number of shares of beneficial interest, par value $.001 per share, in each of the Class M and Investor class shares of each fund and in the Dreyfus Premier class shares of BNY Mellon Mid Cap Stock Fund. Dreyfus Premier shares of BNY Mellon Mid Cap Stock Fund are subject to a contingent deferred sales charge (“CDSC”) imposed on redemptions of Dreyfus Premier shares made within six years of purchase and automatically convert to Investor class shares after six years. BNY Mellon Mid Cap Stock Fund does not offer Dreyfus Premier shares, except in connection with dividend reinvestment and permitted exchanges of Dreyfus Premier shares. Each class of shares has similar rights and privileges, except with respect to the expenses borne by and the shareholder services offered to each class, the shareholder services plan applicable to the Investor shares and Dreyfus Premier shares and the Rule 12b-1 plan applicable to the Dreyfus Premier shares, the allocation of certain transfer agency costs and certain voting rights. Income, expenses (other than expenses attributable to a specific class), and realized and unrealized gains or losses on investments are allocated to each class of shares based on its relative net assets.
As of August 31, 2008, MBC Investments Corp., an indirect subsidiary of BNY Mellon, held 800 Investor shares of BNY Mellon U.S. Core Equity 130/30 Fund.
TheTrust accounts separately for the assets, liabilities and operations of each series. Expenses directly attributable
The Funds 89
NOTES TO FINANCIAL STATEMENTS (continued)
to each series are charged to that series’ operations; expenses that are applicable to all series are allocated among them on a pro rata basis.
The funds’ financial statements are prepared in accordance with U.S. generally accepted accounting principles, which may require the use of management estimates and assump-tions.Actual results could differ from those estimates.
NOTE 2—Significant Accounting Policies:
(a) Portfolio valuation: Investments in equity securities are valued at the last sales price on the securities exchange or national securities market on which such securities are primarily traded. Securities listed on the National Market System for which market quotations are available are valued at the official closing price or, if there is no official closing price that day, at the last sales price. Securities not listed on an exchange or the national securities market, or securities for which there were no transactions, are valued at the average of the most recent bid and asked prices, except for open short positions, where the asked price is used for valuation purposes. Bid price is used when no asked price is available. Registered investment companies that are not traded on an exchange are valued at their net asset value. When market quotations or official closing prices are not readily available, or are determined not to reflect accurately fair value, such as when the value of the security has been significantly affected by events after the close of the exchange or market on which the security is principally traded (for example, a foreign exchange or market), but before the funds calculate their net asset values, the funds may value these investments at fair value as determined in accordance with the procedures approved by the Trust’s Board. Fair valuing of securities may be determined with the assistance of a pricing service using calculations based on indices of domestic securities and other appropriate indicators, such as prices of relevant ADRs and futures contracts. For other securities that are fair valued by theTrust’s Board,certain factors may be considered such as: fundamental analytical data, the nature and duration of restrictions on disposition, an evaluation of the forces that influence the market in which securities are
purchased and sold and public trading in similar securities of the issuer or comparable issuers. Financial futures and options,which are traded on an exchange,are valued at the last sales price on the securities exchange on which such securities are primarily traded or at the last sales price on the national securities market on each business day. Options traded over-the-counter are priced at the mean between the bid and asked price.Investments denominated in foreign currencies are translated to U.S. dollars at the prevailing rates of exchange. Forward currency exchange contracts are valued at the forward rate.
BNY Mellon Balanced Fund
Most debt securities are valued each business day by an independent pricing service (the “Service”) approved by the Trust’s Board. Securities listed on the National Market System for which market quotations are available are valued at the official closing price or, if there is no official closing price that day, at the last sales price. Debt securities for which quoted bid prices are readily available and are representative of the bid side of the market in the judgment of the Service are valued at the mean between the quoted bid prices (as obtained by the Service from dealers in such securities) and asked prices (as calculated by the Service based upon its evaluation of the market for such securities). Other debt securities (which constitute a majority of the portfolio securities) are valued as determined by the Service, based on methods which include consideration of: yields or prices of securities of comparable quality, coupon, maturity and type; indications as to values from dealers; and general market conditions. Restricted securities, as well as securities or other assets for which recent market quotations are not readily available, that are not valued by a pricing service approved by the Trust’s Board, or are determined by the fund not to reflect accurately fair value, are valued at fair value as determined in good faith under the direction of the Trust’s Board.The factors that may be considered when fair valuing a security include fundamental analytical data, the nature and duration of restrictions on disposition, an evaluation of the forces that influence the market in which the securities are purchased and
90
sold and public trading in similar securities of the issuer or comparable issuers.
The Financial Accounting Standards Board (“FASB”) released Statement of Financial Accounting Standards No. 157 “Fair Value Measurements” (“FAS 157”). FAS 157 establishes an authoritative definition of fair value, sets out a framework for measuring fair value, and requires additional disclosures about fair-value measure-ments.The application of FAS 157 is required for fiscal years beginning after November 15, 2007 and interim periods within those fiscal years. Management does not believe that the application of this standard will have a material impact on the financial statements of the funds.
(b) Securities transactions and investment income:
Securities transactions are recorded on a trade date basis. Realized gains and losses from securities transactions are recorded on the identified cost basis. Dividend income is recorded on the ex-dividend date and interest income, including accretion of discount and amortization of premium on investments, is recognized on the accrual basis.
The funds have arrangements with the custodian and cash management banks whereby the funds may receive earnings credits when positive cash balances are maintained, which are used to offset custody and cash management fees. For financial reporting purposes, the funds include net earnings credits as an expense offset in the Statement of Operations.
BNY Mellon International Fund and BNY Mellon Emerging Markets Fund
Investing in foreign markets may involve special risks and considerations not typically associated with investing in the U.S. These risks include revaluation of currencies, high rates of inflation, repatriation restrictions on income and capital, and adverse political and economic developments. Moreover, securities issued in these markets may be less liquid, subject to government ownership controls, delayed settlements, and their prices may be more volatile than those of comparable securities in the U.S.
Pursuant to a securities lending agreement withThe Bank of NewYork Mellon, the funds may lend securities to certain qualified institutions. It is the funds’ policy that, at origination, all loans are secured by collateral of at least 102% of the value of U.S. securities loaned and 105% of the value of foreign securities loaned. Collateral equivalent to at least 100% of the market value of securities on loan is maintained at all times. Collateral is either in the form of cash, which can be invested in certain money market mutual funds managed by Dreyfus, U.S. Government and Agency securities or letters of credit. The funds are entitled to receive all income on securities loaned, in addition to income earned as a result of the lending transaction.Although each security loaned is fully collateralized, the funds bear the risk of delay in recovery of, or loss of rights in, the securities loaned should a borrower fail to return the securities in a timely manner. Table 1 summarizes the amount The Bank of New York Mellon earned from each relevant fund from lending portfolio securities, pursuant to the securities lending agreement during the period ended August 31, 2008.
| Table 1. | ||
| BNY Mellon Large Cap Stock Fund | $133,766 | |
| BNY Mellon Income Stock Fund | 11,443 | |
| BNY Mellon Mid Cap Stock Fund | 625,225 | |
| BNY Mellon Small Cap Stock Fund | 394,441 | |
| BNY Mellon Emerging Markets Fund | 10,726 | |
| BNY Mellon Balanced Fund | 68,618 |
(c) Affiliated issuers: Investments in other investment companies advised by Dreyfus are defined as “affiliated” in the Act.
(d) Foreign currency transactions: BNY Mellon Emerging Markets Fund and BNY Mellon International Fund do not isolate that portion of the results of operations resulting from changes in foreign exchange rates on investments from the fluctuations arising from changes in the market prices of securities held. Such fluctuations are included with the net realized and unrealized gains or losses from investments.
The Funds 91
NOTES TO FINANCIAL STATEMENTS (continued)
Net realized foreign exchange gains or losses arise from sales and maturities of short-term securities, sales of foreign currencies, currency gains or losses realized on securities transactions and the difference between the amounts of dividends, interest, and foreign withholding taxes recorded on the fund’s books and the U.S. dollar equivalent of the amounts actually received or paid. Net unrealized foreign exchange gains and losses arise from changes in the value of assets and liabilities other than investments in securities, resulting from changes in exchange rates. Such gains and losses are included with net realized and unrealized gain or loss on investments.
(e) Foreign currency exchange contracts: Certain funds may enter into forward currency exchange contracts to hedge their exposure to changes in foreign currency exchange rates on their foreign portfolio holdings and to settle foreign currency transactions. When executing forward currency exchange contracts, a fund is obligated to buy or sell a foreign currency at a specified rate on a certain date in the future.With respect to sales of forward currency exchange contracts, a fund would incur a loss if the value of the contract increases between the date the forward contract is opened and the date the forward contract is closed.The fund realizes a gain if the value of the contract decreases between those dates.With respect to purchases of forward currency exchange contracts, a fund would incur a loss if the value of the contract decreases between the date the forward contract is opened and the date the forward contract is closed.A fund realizes a gain if the value of the contract increases between those dates. The fund is also exposed to credit risk associated with counterparty nonperformance on these forward currency exchange contracts, which is typically limited to the unrealized gain on each open contract. As of August 31, 2008, there were no open forward currency exchange contracts. Funds may also enter into foreign exchange contracts at the prevailing spot rate in order to facilitate the settlement of purchases and sales of foreign securities. Table 2 summarizes open foreign exchange contracts for BNY Mellon International Fund and BNY Mellon Emerging Markets Fund at August 31, 2008.
(f) Concentration of risk: BNY Mellon U. S. Core Equity 130/30 Fund enters into short sales. Short sales involve selling a security the fund does not own in anticipation that the security’s price will decline. Short sales may involve substantial risk and “leverage.”The fund may be required to buy the security sold short at a time when the security has appreciated in value, thus resulting in a loss to the fund. Short positions in stocks involve more risk than long positions in stocks. In theory, stocks sold short have unlimited risk. BNY Mellon Balanced Fund invests in debt securities. Failure of an issuer of the debt securities to make timely interest or principal payments, or a decline or the perception of a decline in the credit quality of a debt security, can cause the debt security’s price to fall, potentially lowering the fund’s share price. In addition, the value of debt securities may decline due to general market conditions that are not specifically related to a particular company, such as real or perceived adverse economic conditions, changes in outlook for corporate earnings, changes in interest or currency rates or adverse investor sentiment. They may also decline because of factors that affect a particular industry.
(g) Dividends to shareholders: Dividends payable to shareholders are recorded by the funds on the ex-dividend date. BNY Mellon Large Cap Stock Fund, BNY Mellon Income Stock Fund and BNY Mellon Balanced Fund declare and pay dividends from investment income-net monthly. BNY Mellon Mid Cap Stock Fund, BNY Mellon Small Cap Stock Fund, BNY Mellon U.S. Core Equity Fund 130/30 Fund, BNY Mellon International Fund and BNY Mellon Emerging Markets Fund declare and pay dividends from investment income-net annually. With respect to each series, dividends from net realized capital gains, if any, are normally declared and paid annually, but the funds may make distributions on a more frequent basis to comply with the distribution requirements of the Internal Revenue Code of 1986, as amended (the “Code”). To the extent that net realized capital gains can be offset by capital loss carryovers of that fund, it is the policy of the fund not to distribute such gains. Income and capital
92
gain distributions are determined in accordance with income tax regulations, which may differ from U.S. generally accepted accounting principles.
(h) Federal income taxes: It is the policy of each fund to continue to qualify as a regulated investment company, if such qualification is in the best interests of its shareholders, by complying with the applicable provisions of the Code, and to make distributions of taxable income sufficient to relieve it from substantially all federal income and excise taxes. For federal income tax purposes, each series is treated as a single entity for the purpose of determining such qualification.
The funds adopted FASB Interpretation No. 48 “Accounting for Uncertainty in Income Taxes” (“FIN 48”). FIN 48 provides guidance for how uncertain tax positions should be recognized, measured, presented and disclosed in the financial statements. FIN 48 requires the evaluation of tax positions taken or expected to be taken in the course of preparing the fund’s tax returns to determine whether the tax positions are “more-likely-than-not” of being sustained by the applicable tax authority.Tax positions not deemed to meet the more-likely-than-not threshold would be recorded as a tax expense in the current year.The adoption of FIN 48 had
| Table 2. | ||||||||
| BNY Mellon International Fund | ||||||||
| Foreign | Unrealized | |||||||
| Currency | Appreciation | |||||||
| Foreign Currency Exchange Contracts | Amount | Cost ($) | Value ($) | (Depreciation) ($) | ||||
| Purchases; | ||||||||
| Euro, expiring 9/2/2008 | 223,021 | 328,844 | 327,183 | (1,661) | ||||
| Sales: | Proceeds ($) | |||||||
| Japanese Yen, expiring 9/2/2008 | 91,783,316 | 844,917 | 843,403 | 1,514 | ||||
| Japanese Yen, expiring 9/2/2008 | 59,331,504 | 543,926 | 545,201 | (1,275) | ||||
| Swiss Franc, expiring 9/2/2008 | 1,709,776 | 1,559,304 | 1,552,719 | 6,585 | ||||
| Total | 5,163 | |||||||
| BNY Mellon Emerging Markets Fund | ||||||||
| Foreign | Unrealized | |||||||
| Currency | Appreciation | |||||||
| Foreign Currency Exchange Contracts | Amount | Cost ($) | Value ($) | (Depreciation) ($) | ||||
| Purchases: | ||||||||
| Brazilian Lira, expiring 9/2/2008 | 1,411,835 | 854,104 | 864,963 | 10,859 | ||||
| Brazilian Lira, expiring 9/3/2008 | 623,002 | 375,756 | 381,683 | 5,927 | ||||
| Hungarian Forint, expiring 9/2/2008 | 13,894,254 | 86,563 | 86,043 | (520) | ||||
| Malaysian Ringgit, expiring 9/2/2008 | 827,253 | 242,028 | 244,207 | 2,179 | ||||
| South Korean Won, expiring 9/2/2008 | 420,010,408 | 384,554 | 385,719 | 1,165 | ||||
| Sales: | Proceeds ($) | |||||||
| Chilean Peso, expiring 9/2/2008 | 138,677,907 | 267,747 | 268,470 | (723) | ||||
| Indian Rupee, expiring 9/2/2008 | 33,234,505 | 749,705 | 759,039 | (9,334) | ||||
| Mexican Peso, expiring 9/2/2008 | 1,823,201 | 177,757 | 177,307 | 450 | ||||
| South African Rand, expiring 9/2/2008 | 409,540 | 53,266 | 53,204 | 62 | ||||
| South Korean Won, expiring 9/2/2008 | 541,353,593 | 496,035 | 497,156 | (1,121) | ||||
| Thai Bhat, expiring 9/2/2008 | 25,864,792 | 756,971 | 755,397 | 1,574 | ||||
| Total | 10,518 | |||||||
The Funds 93
| NOTES TO FINANCIAL STATEMENTS (continued) |
no impact on the operations of the funds for the period ending August 31, 2008.
As of and during the period ended August 31, 2008, the funds did not have any liabilities for any unrecognized tax benefits. The funds recognize interest and penalties, if any, related to unrecognized tax benefits as income tax expense in the Statement of Operations. During the period, the funds did not incur any interest or penalties.
Each of the tax years in the four-year period ended August 31, 2008, remains subject to examination by the Internal Revenue Service and state taxing authorities.
Table 3 summarizes each fund’s components of accumulated earnings on a tax basis at August 31, 2008.
Table 4 summarizes each relevant fund’s tax character of distributions paid to shareholders during the fiscal periods ended August 31, 2008 and August 31, 2007, respectively.
During the period ended August 31, 2008, as a result of permanent book to tax differences, the funds increased (decreased) accumulated undistributed investment income-net, increased (decreased) accumulated net realized gain (loss) on investments and increased (decreased) paid-in capital as summarized in Table 5.These permanent book to tax differences are primarily due to the tax treatment for real estate investment trusts for BNY Mellon Large Cap Stock Fund, BNY Mellon Income Stock Fund, BNY Mellon Mid Cap Stock Fund and BNY Mellon Small Cap Stock Fund, nondeductible expenses for BNY Mellon
| Table 3. | ||||||||
| Undistributed | Undistributed | Unrealized | Capital (Losses) | |||||
| Ordinary | Capital Gains | Appreciation | Realized After | |||||
| Income ($) | (Losses) ($) | (Depreciation) ($) | October 31, 2007 ($ | |||||
| BNY Mellon Large Cap Stock Fund | 415,237 | 17,133,675 | 199,242,691 | — | ||||
| BNY Mellon Income Stock Fund | 226,968 | 16,165,769 | 12,104,891 | — | ||||
| BNY Mellon Mid Cap Stock Fund | 2,573,168 | 1,776,804 | 90,811,770 | — | ||||
| BNY Mellon Small Cap Stock Fund | 1,853,155 | 560,981 | 16,624,055 | 19,225,145 | ||||
| BNY Mellon U.S. Core Equity 130/30 Fund | 657,459 | (114,430)†† | (8,516,477) | 8,245,237 | ||||
| BNY Mellon International Fund | 50,952,391 | 61,213,723 | (383,785,105) | — | ||||
| BNY Mellon Emerging Markets Fund | 67,451,930 | 194,433,904 | (76,871,904) | — | ||||
| BNY Mellon Balanced Fund | 3,772,082 | 14,006,195 | 5,810,035 | — | ||||
| † These losses were deferred for tax purposes to the first day of the following year. | ||||||||
| †† If not applied the carryover expires in fiscal 2016. | ||||||||
| Table 4. | ||||||||
| Long-Term | ||||||||
| Ordinary Income ($) | Capital Gains ($) | |||||||
| 2008 | 2007 | 2008 | 2007 | |||||
| BNY Mellon Large Cap Stock Fund | 37,171,503 | 14,566,348 | 278,963,515 | 43,131,986 | ||||
| BNY Mellon Income Stock Fund | 9,525,578 | 7,733,999 | 64,329,632 | 35,547,261 | ||||
| BNY Mellon Mid Cap Stock Fund | 33,891,042 | 44,446,751 | 268,330,173 | 203,767,126 | ||||
| BNY Mellon Small Cap Stock Fund | 33,001,662 | 4,019,569 | 61,330,559 | 92,329,501 | ||||
| BNY Mellon International Fund | 140,810,918 | 105,535,739 | 249,683,109 | 236,503,742 | ||||
| BNY Mellon Emerging Markets Fund | 97,625,851 | 73,233,513 | 270,917,375 | 314,552,607 | ||||
| BNY Mellon Balanced Fund | 12,186,661 | 9,747,839 | 31,185,628 | 36,648,873 | ||||
94
U.S. Core Equity 130/30 Fund, foreign exchange gains and losses, and passive foreign investment companies for BNY Mellon International Fund, foreign exchange gains and losses, passive foreign investment companies and India and Thailand capital gains taxes for BNY Mellon Emerging Markets Fund and amortization adjustments, treasury inflation protected securities and real estate investment trusts for BNY Mellon Balanced Fund. Net assets and net asset value per share were not affected by this reclassification.
NOTE 3—Bank Line of Credit:
Effective May 1, 2008, the funds participate with other Dreyfus-managed funds in a $300 million unsecured line of credit primarily to be utilized for temporary or emergency purposes, including the financing of redemptions. The terms of the line of credit agreement limit the amount of individual fund borrowings. Interest is charged to the fund based on prevailing market rates in effect at the time of borrowing. Prior to May 1, 2008, the funds participated with other Dreyfus-managed funds in a $100 million unsecured line of credit. During the period ended August 31, 2008, BNY Mellon Mid Cap Stock Fund and BNY Mellon Small Cap Stock did not borrow under the line of credit.
The average daily amount of borrowings outstanding under the line of credit during the period ended
August 31, 2008 for BNY Mellon Large Cap Stock Fund was approximately $162,300, with a related weighted average annualized interest rate of 4.58% .
The average daily amount of borrowings outstanding under the line of credit during the period ended August 31, 2008 for BNY Mellon Income Stock Fund was approximately $1,340,200, with a related weighted average annualized interest rate of 4.72% .
Prime broker fees charged on BNY Mellon U.S. Core Equity 130/30 Fund are included in interest expense.
The average daily amount of borrowings outstanding under the line of credit during the period ended August 31, 2008 for BNY Mellon International Fund was approximately $1,032,800, with a related weighted average annualized interest rate of 4.75% .
The average daily amount of borrowings outstanding under the line of credit during the period ended August 31, 2008 for BNY Mellon Emerging Markets Fund was approximately $452,200, with a related weighted average annualized interest rate of 4.72% .
The average daily amount of borrowings outstanding under the line of credit during the period ended August 31, 2008 for BNY Mellon Balanced Fund was approximately $10,200, with a related weighted average annualized interest rate of 3.69% .
| Table 5. | ||||||
| Accumulatead | Accumulatead | |||||
| Undistributed | Net Realized | Paid-in | ||||
| Investment Income—Net ($) | Gain (Loss) ($) | Capital ($) | ||||
| BNY Mellon Large Cap Stock Fund | (19,915) | 19,915 | — | |||
| BNY Mellon Income Stock Fund | (12,276) | 12,276 | — | |||
| BNY Mellon Mid Cap Stock Fund | (2,463,710) | 1,871,816 | 591,894 | |||
| BNY Mellon Small Cap Stock Fund | (444,662) | 444,852 | (190) | |||
| BNY Mellon U.S. Core Equity 130/30 Fund | 11,685 | (6,030) | (5,655) | |||
| BNY Mellon International Fund | (3,159,951) | 3,159,951 | — | |||
| BNY Mellon Emerging Markets Fund | 4,507,699 | (4,507,699) | — | |||
| BNY Mellon Balanced Fund | 3,180,196 | (3,120,341) | (59,855) | |||
The Funds 95
NOTES TO FINANCIAL STATEMENTS (continued)
NOTE 4—Investment Advisory Fee, Administration Fee and Other Transactions With Affiliates:
(a) Fees payable by the funds pursuant to the provisions of an Investment Advisory Agreement with the Investment Adviser are payable monthly, computed on the average daily value of each fund’s net assets at the following annual rates: .65% of BNY Mellon Large Cap Stock Fund, .65% of BNY Mellon Income Stock Fund, .75% of BNY Mellon Mid Cap Stock Fund, .85% of BNY Mellon Small Cap Stock Fund, .80% of BNY Mellon U.S. Core Equity 130/30 Fund, .85% of BNY Mellon International Fund, 1.15% of BNY Mellon Emerging Markets Fund and .65% (equity investments), .40% (debt securities) and .15% (money market investments and other underlying BNY Mellon funds) of BNY Mellon Balanced Fund.
For BNY Mellon U.S. Core Equity 130/30 Fund, the Investment Adviser contractually agreed through August 31, 2008, to waive receipt of its fees and/or assume the expenses of the fund so that the direct expenses of neither class, exclusive of taxes, brokerage commissions, interest on borrowings, shareholder services fees, prime broker fees, substitute dividend expenses on securities sold short and extraordinary expenses, exceed an annual rate of 1.05% of the value of the average daily net assets of the respective class. The reduction in investment advisory fee, pursuant to the undertaking, amounted to $64,823 during the period ended August 31, 2008.
For BNY Mellon International Fund, the Investment Advisor has agreed beginning June 1, 2008, to waive receipt of .15% of the fund’s investment advisory fee.This waiver is voluntary, not contractual, and may be terminated at any time.The reduction in investment advisory fee, pursuant to the undertaking, amounted to $814,495, during the period ended August 31, 2008.
Pursuant to the Administration Agreement,The Bank of New York Mellon provides or arranges for fund accounting, transfer agency and other fund administra-
tion services and receives a fee based on the total net assets of the Trust based on the following rates:
| 0 up to $6 billion | .15% | |
| $6 billion up to $12 billion | .12% | |
| In excess of $12 billion | .10% |
No administration fee is applied to assets held by BNY Mellon Balanced Fund, which are invested in cash or money market instruments or shares of certain other series of the Trust.
The Bank of New York Mellon has entered into a Sub-Administration Agreement with Dreyfus pursuant to which The Bank of New York Mellon pays Dreyfus for performing certain administrative services.
During the period ended August 31,2008,the Distributor retained $2,223 from CDSCs on redemptions of BNY Mellon Mid Cap Stock Fund’s Dreyfus Premier shares.
(b) BNY Mellon Mid Cap Stock Fund has adopted a Distribution Plan (the “Plan”) pursuant to Rule 12b-1 under the Act for distributing its Dreyfus Premier shares. BNY Mellon Mid Cap Stock Fund pays the Distributor a fee at an annual rate of .75% of the value of the fund’s average daily net assets attributable to its Dreyfus Premier shares. During the period ended August 31, 2008, BNY Mellon Mid Cap Stock Fund’s Dreyfus Premier shares were charged $19,379 pursuant to the Plan.
(c) The funds have adopted a Shareholder Services Plan with respect to their Investor shares and BNY Mellon Mid Cap Stock Fund has adopted a Shareholder Services Plan with respect to its Dreyfus Premier shares. Each fund pays the Distributor for the provision of certain services to holders of Investor shares and Dreyfus Premier shares a fee at an annual rate of ..25% of the value of the average daily net assets attributable to Investor shares and Dreyfus Premier shares, respectively. The services provided may include personal services relating to shareholder accounts, such as answering shareholder inquiries regarding a fund and providing reports and other information and services related to the maintenance of such shareholder accounts.
96
The Shareholder Services Plan allows the Distributor to make payments from the shareholder services fees it collects from each fund to compensate service agents (certain banks, securities brokers or dealers and other financial institutions) in respect of these services. Table 6 summarizes the amounts Investor shares and Dreyfus Premier shares were charged during the period ended August 31, 2008, pursuant to the Shareholder Services Plan. Additional fees included in shareholder servicing costs in the Statements of Operations include fees paid to the transfer agent.
| Table 6. | ||
| BNY Mellon Large Cap Stock Fund | $28,219 | |
| BNY Mellon Income Stock Fund | 3,785 | |
| BNY Mellon Mid Cap Stock Fund, | ||
| Investor shares | 80,801 | |
| BNY Mellon Mid Cap Stock Fund, | ||
| Dreyfus Premier shares | 6,460 | |
| BNY Mellon Small Cap Stock Fund | 11,392 | |
| BNY Mellon U.S. Core Equity 130/30 Fund | 28 | |
| BNY Mellon International Fund | 26,451 | |
| BNY Mellon Emerging Markets Fund | 25,024 | |
| BNY Mellon Balanced Fund | 11,141 |
The funds compensate The Bank of New York Mellon under a cash management agreement for performing cash management services related to fund subscriptions and redemptions. Table 7 summarizes the amount each fund was charged during the period ended August 31, 2008, pursuant to the cash management agreement.
| Table 7. | ||
| BNY Mellon Large Cap Stock Fund | $1,211 | |
| BNY Mellon Income Stock Fund | 250 | |
| BNY Mellon Mid Cap Stock Fund | 26,920 | |
| BNY Mellon Small Cap Stock Fund | 2,066 | |
| BNY Mellon U.S. Core Equity 130/30 Fund | 88 | |
| BNY Mellon International Fund | 1,859 | |
| BNY Mellon Emerging Markets Fund | 2,036 | |
| BNY Mellon Balanced Fund | 239 |
The funds compensate The Bank of New York Mellon under a custody agreement for providing custodial services for the funds. Table 8 summarizes the amount each funds were charged during the period ended August 31, 2008, pursuant to the custody agreement.
| Table 8. | ||
| BNY Mellon Large Cap Stock Fund | $149,583 | |
| BNY Mellon Income Stock Fund | 33,316 | |
| BNY Mellon Mid Cap Stock Fund | 123,309 | |
| BNY Mellon Small Cap Stock Fund | 64,242 | |
| BNY Mellon U.S. Core Equity 130/30 Fund | 70,966 | |
| BNY Mellon International Fund | 2,566,485 | |
| BNY Mellon Emerging Markets Fund | 3,279,344 | |
| BNY Mellon Balanced Fund | 39,353 |
During the period ended August 31, 2008, each fund was charged $5,622 for services performed by the Chief Compliance Officer.
Table 9 summarizes the components of “Due to the Dreyfus Corporation and affiliates” in the Statements of Assets and Liabilities for each fund.
| Table 9. | ||||||||||||
| Less | ||||||||||||
| Investment | Rule 12b-1 | Shareholder | Chief | Expense | ||||||||
| Advisory | Distribution | Services | Custodian | Compliance | Reimbursement | |||||||
| Fees ($) | Plan Fees ($) | Plan Fees ($) | Fees ($) | Officer Fees ($) | Fees ($) | |||||||
| BNY Mellon Large Cap Stock Fund | 967,145 | — | 2,015 | 29,839 | 3,760 | — | ||||||
| BNY Mellon Income Stock Fund | 111,719 | — | 283 | 6,133 | 3,760 | — | ||||||
| BNY Mellon Mid Cap Stock Fund | 995,713 | 1,061 | 6,333 | 37,626 | 3,760 | — | ||||||
| BNY Mellon Small Cap Stock Fund | 458,219 | — | 776 | 12,336 | 3,760 | — | ||||||
| BNY Mellon U.S. Core Equity 130/30 Fund | 120,917 | — | 3 | 14,642 | 3,760 | 12,539 | ||||||
| BNY Mellon International Fund | 1,466,141 | — | 1,365 | 611,444 | 3,760 | 814,495 | ||||||
| BNY Mellon Emerging Markets Fund | 1,147,991 | — | 1,534 | 1,011,852 | 3,760 | — | ||||||
| BNY Mellon Balanced Fund | 121,142 | — | 1,023 | 9,055 | 3,760 | — | ||||||
The Funds 97
NOTES TO FINANCIAL STATEMENTS (continued)
(d) Effective June 1, 2008, each trustee who is not an “affiliated person” as defined in the Act receives from the Trust an annual fee of $68,000 and an attendance fee of $7,500 for each in-person meeting attended and $500 for telephone meetings and is reimbursed for travel and out-of-pocket expenses. The Chairman of the Trust’s Board receives an additional annual fee of $15,000 and the Chairman of the Trust’s Audit Committee receives an additional annual fee of $10,000. Prior to June 1, 2008, the Trust paid its Board members an annual fee of $48,000 and an attendance fee of $5,000 for each in-person meeting attended and $500 for telephone meetings and reimbursed them for travel and out-of-pocket expenses, and the Chairmen of the Trust’s Board and Audit Committee received additional annual fees of $10,000 and $8,000, respectively.
NOTE 5—Securities Transactions:
Table 10 summarizes each fund’s aggregate amount of purchases and sales (including paydowns) of investment securities and securities sold short, excluding short-term securities, options transactions and foreign currency exchange contracts, during the period ended August 31, 2008, of which $1,693,087 in purchases and $1,686,743 in sales were from mortgage dollar roll transactions in BNY Mellon Balanced Fund.
A mortgage dollar roll transaction involves a sale by the fund of mortgage related securities that it holds with an
agreement by the fund to repurchase similar securities at an agreed upon price and date.The securities purchased will bear the same interest rate as those sold, but generally will be collateralized by pools of mortgages with different prepayment histories than those securities sold.
BNY Mellon U.S. Core Equity 130/30 Fund is engaged in short selling which obligates the fund to replace the security borrowed by purchasing the security at current market value.The fund would incur a loss if the price of the security increases between the date of the short sale and the date on which the fund replaces the borrowed security.The fund would realize a gain if the price of the security declines between those dates. Until the fund replaces the borrowed security, the fund will maintain daily a segregated account with a broker or custodian, of permissible liquid assets sufficient to cover its short position. Securities sold short at August 31, 2008, and their related market values and proceeds are set forth in the Statement of Securities Sold Short for BNY Mellon U.S. Core Equity 130/30 Fund.
BNY Mellon Income Stock Fund may purchase and write (sell) put and call options in order to gain exposure to or to protect against changes in the market.
As a writer of call options, the fund receives a premium at the outset and then bears the market risk of unfavorable changes in the price of the financial instrument underlying the option. Generally, the fund would incur
| Table 10. | ||||
| Purchases ($) | Sales ($) | |||
| BNY Mellon Large Cap Stock Fund | 1,052,922,397 | 1,079,495,616 | ||
| BNY Mellon Income Stock Fund | 98,106,189 | 269,171,927 | ||
| BNY Mellon Mid Cap Stock Fund | 2,001,261,546 | 2,101,358,549 | ||
| BNY Mellon Small Cap Stock Fund | 841,275,984 | 817,690,153 | ||
| BNY Mellon International Fund | 1,883,608,237 | 2,181,139,322 | ||
| BNY Mellon Emerging Markets Fund | 868,318,154 | 1,124,291,539 | ||
| BNY Mellon Balanced Fund | 180,210,448 | 183,220,666 | ||
| BNY Mellon U.S. Core Equity 130/30 Fund | ||||
| Long transactions | 447,804,037 | 231,450,981 | ||
| Short sale transactions | 84,323,996 | 132,825,279 | ||
| Total | 532,128,033 | 364,276,260 | ||
98
a gain, to the extent of the premium, if the price of the underlying financial instrument decreases between the date the option is written and the date on which the option is terminated. Generally, the fund would realize a loss, if the price of the financial instrument increases between those dates.
As a writer of put options, the fund receives a premium at the outset and then bears the market risk of unfavorable changes in the price of the financial instrument underlying the option. Generally, the fund would incur a gain, to the extent of the premium, if the price of the underlying financial instrument increases between the date the option is written and the date on which the option is terminated. Generally, the fund would realize a loss, if the price of the financial instrument decreases between those dates.
Table 11 summarizes BNY Mellon Income Stock Fund’s call/put options written for the period ended August 31, 2008.
Table 12 summarizes the cost of investments for federal income tax purposes and accumulated net unrealized appreciation (depreciation) on investments for each fund at August 31, 2008.
In March 2008, the FASB released Statement of Financial Accounting Standards No. 161 “Disclosures about Derivative Instruments and Hedging Activities” (“FAS 161”). FAS 161 requires qualitative disclosures about objectives and strategies for using derivatives, quantitative disclosures about fair value amounts of gains and losses on derivative instruments and disclosures about credit-risk-related contingent features in deriva-
| Table 11. | ||||||||||
| Face Amount | Options Terminated | |||||||||
| Covered by | Premiums | Net Realized | ||||||||
| Contract ($) | Received ($) | Cost ($) | Gain ($) | |||||||
| Contracts outstanding | ||||||||||
| August 31, 2007 | — | — | ||||||||
| Contracts written | 404,300 | 515,179 | ||||||||
| Contracts terminated: | ||||||||||
| Closed | 176,500 | 297,903 | 190,433 | 107,470 | ||||||
| Expired | 152,200 | 143,089 | — | 143,090 | ||||||
| Total contracts terminated | 328,700 | 440,992 | 190,433 | 250,560 | ||||||
| Contracts outstanding | ||||||||||
| August 31, 2008 | 75,600 | 74,187 | ||||||||
| Table 12. | ||||||||||
| Cost of | Gross | Gross | ||||||||
| Investments ($) | Appreciation ($) | (Depreciation) ($) | Net ($) | |||||||
| BNY Mellon Large Cap Stock Fund | 1,632,861,394 | 303,031,273 | 103,788,582 | 199,242,691 | ||||||
| BNY Mellon Income Stock Fund | 191,524,787 | 29,053,168 | 16,978,564 | 12,074,604 | ||||||
| BNY Mellon Mid Cap Stock Fund | 1,787,528,433 | 173,292,946 | 82,481,176 | 90,811,770 | ||||||
| BNY Mellon Small Cap Stock Fund | 844,900,869 | 55,727,802 | 39,103,747 | 16,624,055 | ||||||
| BNY Mellon U.S. Core Equity 130/30 Fund | 251,861,211 | 10,004,554 | 20,323,739 | (10,319,185) | ||||||
| BNY Mellon International Fund | 2,359,783,369 | 33,428,392 | 417,043,539 (383,615,147) | |||||||
| BNY Mellon Emerging Markets Fund | 1,192,474,717 | 109,463,600 | 185,907,453 | (76,443,853) | ||||||
| BNY Mellon Balanced Fund | 343,363,787 | 22,899,134 | 17,089,099 | 5,810,035 | ||||||
The Funds 99
NOTES TO FINANCIAL STATEMENTS (continued)
tive agreements.The application of FAS 161 is required for fiscal years and interim periods beginning after November 15, 2008. At this time, management is evaluating the implications of FAS 161 and its impact on the financial statements and the accompanying notes has not yet been determined.
NOTE 6—Plan of Reorganization:
On March 11, 2008, the Board of Trustees’ approved an Agreement and Plan of Reorganization between BNY Mellon Small Cap Stock Fund (the “Acquiring Fund”) and BNY Hamilton Small Cap Growth Fund (the “Acquired Fund”), providing for the Acquired Fund to merge into the Acquiring Fund as part of a tax-free reorganization. The merger, which was approved by the Acquired Fund’s shareholders, on July 16, 2008, occurred as of the close of business on September 12, 2008. On that date, shareholders of the Acquired Fund’s Institutional shares received Class M shares of the Acquiring Fund and shareholders of the Acquired Fund’s Class A shares received Investor shares of the Acquiring Fund. The Acquired Fund exchanged all of its assets at net asset value, subject to liabilities, for an equivalent value of shares of the Acquiring Fund. Such shares have been distributed pro rata to shareholders of the Acquired Fund so that each
shareholder received a number of shares of the Acquiring Fund equal to the aggregate net asset value of the shareholder’s Acquired Fund’s shares.
On March 11, 2008, the Board of Trustees’ approved an Agreement and Plan of Reorganization between BNY Mellon Small Cap Stock Fund (the “Acquiring Fund”) and BNY Hamilton Small Cap Core Equity Fund (the “Acquired Fund”), providing for the Acquired Fund to merge into the Acquiring Fund as part of a tax-free reorganization. The merger, which was approved by shareholders of the Acquired Fund’s shareholders, on July 16, 2008, occurred as of the close of business on September 12, 2008. On that date, shareholders of the Acquired Fund’s Institutional shares received Class M shares of the Acquiring Fund and the Acquired Fund’s Class A shares received Investor shares of the fund.The Acquired Fund exchanged all of its assets at net asset value, subject to liabilities, for an equivalent value of shares of the Acquiring Fund. Such shares have been distributed pro rata to shareholders of the Acquired Fund so that each shareholder received a number of shares of the Acquiring Fund equal to the aggregate net asset value of the shareholder’s Acquired Fund’s shares.
100
REPORT OF INDEPENDENT REGISTERED PUBLIC ACCOUNTING FIRM
The Board of Trustees and Shareholders of BNY Mellon Funds Trust:
We have audited the accompanying statements of assets and liabilities of BNY Mellon Large Cap Stock Fund, BNY Mellon Income Stock Fund, BNY Mellon Mid Cap Stock Fund, BNY Mellon Small Cap Stock Fund, BNY Mellon U.S. Core Equity 130/30 Fund, BNY Mellon International Fund, BNY Mellon Emerging Markets Fund and BNY Mellon Balanced Fund, each a series of BNY Mellon Funds Trust (formerly Mellon Funds Trust) (collectively “the Funds”), including the statements of investments and statement of securities sold short, as of August 31, 2008, and the related statements of operations for the year then ended, the statements of changes in net assets for each of the years or period then ended, the statement of cash flows for the year then ended with respect to the BNY Mellon U.S. Core Equity 130/30 Fund, and the financial highlights for each of the years or periods in the five year period then ended.These financial statements and financial highligh ts are the responsibility of the Funds’ management. Our responsibility is to express an opinion on these financial statements and financial highlights based on our audits.
We conducted our audits in accordance with the standards of the Public Company Accounting Oversight Board (United States). Those standards require that we plan and perform the audit to obtain reasonable assurance about whether the financial statements and financial highlights are free of material misstatement.An audit also includes examining, on a test basis, evidence supporting
the amounts and disclosures in the financial statements and financial highlights, assessing the accounting principles used and significant estimates made by management, and evaluating the overall financial statement presentation. Our procedures included confirmation of securities held as of August 31, 2008 by correspondence with the custodian and brokers or by other appropriate auditing procedures where replies from brokers were not received.We believe that our audits provide a reasonable basis for our opinion.
In our opinion, the financial statements and financial highlights referred to above present fairly, in all material respects, the financial position of BNY Mellon Large Cap Stock Fund, BNY Mellon Income Stock Fund, BNY Mellon Mid Cap Stock Fund, BNY Mellon Small Cap Stock Fund, BNY Mellon U.S. Core Equity 130/30 Fund, BNY Mellon International Fund, BNY Mellon Emerging Markets Fund and BNY Mellon Balanced Fund as of August 31, 2008, and the results of their operations for the year then ended, the changes in their net assets for each of the years or period in the two year period then ended, the results of the BNY Mellon U.S. Core Equity 130/30 Fund’s cash flows for the year then ended, and the financial highlights for each of the years or periods in the five year period then ended, in conformity with U.S. generally accepted accounting principles.
![]()
| New York, New York October 29, 2008 |
The Funds 101
IMPORTANT TAX INFORMATION (Unaudited)
BNY Mellon Large Cap Stock Fund
For federal tax purposes, the fund hereby designates $1.6387 per share as a long-term capital gain distribution and $.0903 per share as a short-term capital gain distribution paid on December 19, 2007. Also the fund hereby designates 96.43% of the ordinary dividends paid during the fiscal year ended August 31, 2008 as qualifying for the corporate dividends received deduction.Also certain dividends paid by the fund may be subject to a maximum tax rate of 15%, as provided for by the Jobs and Growth Tax Relief Reconciliation Act of 2003. Of the distributions paid during the fiscal year, $34,950,114 represents the maximum amount that may be considered qualified dividend income. Shareholders will receive notification in January 2009 of the percentage applicable to the preparation of their 2008 income tax returns.
BNY Mellon Income Stock Fund
For federal tax purposes, the fund hereby designates $1.9153 per share as a long-term capital gain distribution and $.1227 per share as a short-term capital gain distribution paid on December 19, 2007. Also the fund hereby designates 100% of the ordinary dividends paid during the fiscal year ended August 31, 2008 as qualifying for the corporate dividends received deduction.Also certain dividends paid by the fund may be subject to a maximum tax rate of 15%, as provided for by the Jobs and Growth Tax Relief Reconciliation Act of 2003. Of the distributions paid during the fiscal year, $7,911,432 represents the maximum amount that may be considered qualified dividend income. Shareholders will receive notification in January 2009 of the percentage applicable to the preparation of their 2008 income tax returns.
BNY Mellon Mid Cap Stock Fund
For federal tax purposes, the fund hereby designates $2.2866 per share as a long-term capital gain distribution and $.2487 per share as a short-term capital gain distribution paid on December 6, 2007. Also the fund hereby designates 81.05% of the ordinary dividends paid during
the fiscal year ended August 31, 2008 as qualifying for the corporate dividends received deduction.Also certain dividends paid by the fund may be subject to a maximum tax rate of 15%, as provided for by the Jobs and Growth Tax Relief Reconciliation Act of 2003. Of the distributions paid during the fiscal year, $9,237,096 represents the maximum amount that may be considered qualified dividend income. Shareholders will receive notification in January 2009 of the percentage applicable to the preparation of their 2008 income tax returns.
BNY Mellon Small Cap Stock Fund
For federal tax purposes, the fund hereby designates $1.4687 per share as a long-term capital gain distribution and $.7903 per share as a short-term capital gain distribution of the $2.2590 per share paid on December 5, 2007. Also the fund hereby designates 21.31% of the ordinary dividends paid during the fiscal year ended August 31, 2008 as qualifying for the corporate dividends received deduction. Also certain dividends paid by the fund may be subject to a maximum tax rate of 15%, as provided for by the Jobs and Growth Tax Relief Reconciliation Act of 2003. Of the distributions paid during the fiscal year, $2,885,121 represents the maximum amount that may be considered qualified dividend income. Shareholders will receive notification in January 2009 of the percentage applicable to the preparation of their 2008 income tax returns.
BNY Mellon International Fund
In accordance with federal tax law, the fund elects to provide each shareholder with their portion of the fund’s foreign taxes paid and the income sourced from foreign countries. Accordingly, the Fund hereby makes the following designations regarding its fiscal year ended August 31, 2008:
— the total amount of taxes paid to foreign countries was $7,089,991
— the total amount of income sourced from foreign countries was $61,916,259.
102
As required by federal tax law rules, shareholders will receive notification of their proportionate share of foreign taxes paid and foreign sourced income for the 2008 calendar year with Form 1099-DIV which will be mailed by January 31, 2009.Also certain dividends paid by the Fund may be subject to a maximum tax rate of 15%, as provided for by the Jobs and GrowthTax Relief Reconciliation Act of 2003. Of the distributions paid during the fiscal year, $11,003,519 represents the maximum amount that may be considered qualified dividend income. Also, the fund designates $1.6860 per share as a long-term capital gain distribution and $.6610 per share as a short-term capital gain distribution paid on December 18, 2007.
BNY Mellon Emerging Markets Fund
In accordance with federal tax law, the fund elects to provide each shareholder with their portion of the fund’s foreign taxes paid and the income sourced from foreign countries. Accordingly, the fund hereby makes the following designations regarding its fiscal year ended August 31, 2008:
— the total amount of taxes paid to foreign countries was $5,988,371
— the total amount of income sourced from foreign countries was $33,018,260.
As required by federal tax law rules, shareholders will receive notification of their proportionate share of foreign taxes paid and foreign sourced income for the 2008
calendar year with Form 1099-DIV which will be mailed by January 31, 2009. Also certain dividends paid by the fund may be subject to a maximum tax rate of 15%, as provided for by the Jobs and Growth Tax Relief Reconciliation Act of 2003. Of the distributions paid during the fiscal year, $14,564,142 represents the maximum amount that may be considered qualified dividend income. Also, the fund designates $4.6360 per share as a long-term capital gain distribution and $1.4630 per share as a short-term capital gain distribution paid on December 21, 2007.
BNY Mellon Balanced Fund
For federal tax purposes, the fund hereby designates $1.1259 per share as a long-term capital gain distribution and $.0661 per share as a short-term capital gain distribution paid on December 19, 2007. Also the fund hereby designates 25.24% of the ordinary dividends paid during the fiscal year ended August 31, 2008 as qualifying for the corporate dividends received deduction.Also certain dividends paid by the fund may be subject to a maximum tax rate of 15%, as provided for by the Jobs and Growth Tax Relief Reconciliation Act of 2003. Of the distributions paid during the fiscal year, $3,165,765 represents the maximum amount that may be considered qualified dividend income. Shareholders will receive notification in January 2009 of the percentage applicable to the preparation of their 2008 income tax returns.
The Funds 103
INFORMATION ABOUT THE REVIEW AND APPROVAL
OF EACH FUND’S INVESTMENT ADVISORY AGREEMENT (Unaudited)
At a meeting of the Board of Trustees held on March 10-11, 2008, the Board considered the re-approval of the Trust’s Investment Advisory Agreement for another one year term, pursuant to which BNY Mellon Fund Advisers, a division of Dreyfus, provides the funds with investment advisory services. The Board members also considered the re-approval of the Trust’s Administration Agreement with Mellon Bank for another one year term, pursuant to which Mellon Bank provides the funds with administrative services. Mellon Bank has entered into a Sub-Administration Agreement with Dreyfus pursuant to which Mellon Bank pays Dreyfus for performing certain of these administrative services.The Board members who are not “interested persons” (as defined in the Act) of the Trust were assisted in their review by independent legal counsel and met with counsel in executive session separate from representatives of Dreyfus.
Analysis of Nature, Extent and Quality of Services Provided to the Funds. The Board members received a presentation from representatives of Dreyfus regarding services provided to the funds, and discussed the nature, extent and quality of the services provided to the funds pursuant to the Investment Advisory Agreement. Dreyfus’ representatives reviewed the funds’ distribution of accounts, and noted the diversity of distribution of the funds and Dreyfus’ corresponding need for broad, deep and diverse resources to be able to provide ongoing shareholder services to each of the funds’ distribution channels. Dreyfus also provided the number of shareholder accounts in each fund, as well as each fund’s asset size.
The Board members also considered Dreyfus’ research and portfolio management capabilities and that Dreyfus also provides oversight of day-to-day fund operations, including fund accounting and administration and assistance in meeting legal and regulatory requirements, and Dreyfus’ extensive administrative, accounting and compliance infrastructure.
Comparative Analysis of the Funds’ Advisory Fees, Expense Ratios and Performance
The Board members reviewed reports prepared by Lipper, Inc., an independent provider of investment company data, which included information comparing each fund’s advisory fee and expense ratio with a group of comparable funds (the “Expense Group”) and with a broader group of funds (the “Expense Universe”), in each case in the same category applicable to the fund, that were selected by Lipper. The Board members also reviewed reports prepared by Lipper which included information comparing each fund’s performance with that of a group of comparable funds (the “Performance Group”) composed of the same funds included in the Expense Group and with that of a broader group of funds (the “Performance Universe”), in each case in the same category applicable to the fund, that were selected by Lipper. Included in these reports were comparisons of contractual and actual advisory fee rates, total operating expenses and performance. Dreyfus also provided a comparison of each fund’s calendar year total returns to the performance of the fund’s benchmark. Representatives of Dreyfus furnished these reports to the Board along with a description of the methodology Lipper used to select each Expense Group and Expense Universe and each Performance Group and Performance Universe.
BNY Mellon Large Cap Stock Fund
The Board reviewed the results of the Expense Group and Expense Universe comparisons.The Board reviewed the range of advisory fees and expense ratios of the funds in the Expense Group and Expense Universe, and noted that the fund’s expense ratio ranked in the fourth quartile (above the median) of the Expense Group and in the second quartile (below the median) of the Expense Universe.
The Board also reviewed the results of the Performance Group and Performance Universe comparisons. The
104
Board noted that the fund’s performance for periods ended January 31, 2008 was above the medians of the Performance Group for the 1- and 2-year periods, and was below the medians for the 3-, 4- and 5-year periods, and was above the medians of the Performance Universe for the 1-, 2-, 3- and 4-year periods, and was below the median for the 5-year period. The Board considered management’s efforts to improve the fund’s performance by appointing a new primary portfolio manager of the fund, effective February 15, 2007.
Representatives of Dreyfus reviewed with the Board members the fees paid to Dreyfus or its affiliates by mutual funds managed by Dreyfus or its affiliates with similar investment objectives, policies and strategies, and included within the same Lipper category, as the fund (the “Similar Funds”), and by other accounts managed or sub-advised by Dreyfus or its affiliates with similar investment objectives, policies and strategies as the fund (the “Similar Accounts”). Dreyfus’ representatives explained the nature of the Similar Accounts and the differences, from Dreyfus’ perspective, in management of the Similar Accounts as compared to managing and providing services to the fund. Dreyfus’ representatives also reviewed the costs associated with distribution through intermediaries. The Board analyzed the differences in fees paid to Dreyfus and discussed the relationship of the advisory fees paid in light of the services provided.The Board members considered the relevance of the fee information provided for the Similar Funds and Similar Accounts to evaluate the appropriateness and reasonableness of the fund’s advisory fees.
BNY Mellon Income Stock Fund
The Board reviewed the results of the Expense Group and Expense Universe comparisons. The Board reviewed the range of advisory fees and expense ratios of the funds in the Expense Group and Expense Universe, and noted that the fund’s expense ratio ranked in the second quartile of the
Expense Group and Expense Universe (below the respective Expense Group and Expense Universe medians).
The Board also reviewed the results of the Performance Group and Performance Universe comparisons. The Board noted that the fund’s performance was below the medians of the Performance Group for the reported periods ended January 31, 2008, and was below the medians of the Performance Universe for the 1-, 2-, 3-and 5-year periods, and was above the median for the 4-year period.The Board considered management’s efforts to improve the fund’s performance by appointing a new primary portfolio manager of the fund, effective February 15, 2007.
Representatives of Dreyfus reviewed with the Board members the fees paid to Dreyfus or its affiliates by a mutual fund managed by Dreyfus or its affiliates with a similar investment objective and similar policies and strategies, and included within the same Lipper category, as the fund (the “Similar Fund”). Representatives of Dreyfus also noted that there were no other accounts managed or sub-advised by Dreyfus or its affiliates with similar investment objectives, policies and strategies as the fund.The Board analyzed the differences in fees paid to Dreyfus and discussed the relationship of the advisory fees paid in light of the services provided. The Board members considered the relevance of the fee information provided for the Similar Fund to evaluate the appropriateness and reasonableness of the fund’s advisory fees.
BNY Mellon Mid Cap Stock Fund
The Board reviewed the results of the Expense Group and Expense Universe comparisons.The Board reviewed the range of advisory fees and expense ratios of the funds in the Expense Group and Expense Universe, and noted that the fund’s expense ratio ranked in the third quartile (above the median) of the Expense Group and in the second quartile (below the median) of the Expense Universe.
The Funds 105
INFORMATION ABOUT THE REVIEW AND APPROVAL OF EACH FUND’S INVESTMENT ADVISORY AGREEMENT (Unaudited) (continued)
The Board also reviewed, and placed significant emphasis on, the results of the Performance Group and Performance Universe comparisons. The Board noted that the fund’s performance for periods ended January 31, 2008 was equal to the median of the Performance Group for the 1-year period, was below the median for the 2-year period and was above the medians for the 3-, 4- and 5-year periods, and was above the medians of the Performance Universe for the reported periods.
Representatives of Dreyfus reviewed with the Board members the fees paid to Dreyfus or its affiliates by mutual funds managed by Dreyfus or its affiliates with a similar investment objective and similar policies and strategies, and included within the same Lipper category, as the fund (the “Similar Funds”). Representatives of Dreyfus also noted that there were no other accounts managed or sub-advised by Dreyfus or its affiliates with similar investment objectives, policies and strategies as the fund.The Board analyzed the differences in fees paid to Dreyfus and discussed the relationship of the advisory fees paid in light of the services provided. The Board members considered the relevance of the fee information provided for the Similar Funds to evaluate the appropriateness and reasonableness of the fund’s advisory fees.
BNY Mellon Small Cap Stock Fund
The Board reviewed the results of the Expense Group and Expense Universe comparisons.The Board reviewed the range of advisory fees and expense ratios of the funds in the Expense Group and Expense Universe, and noted that the fund’s expense ratio ranked in the third quartile (above the median) of the Expense Group and in the second quartile (below the median) of the Expense Universe.
The Board also reviewed the results of the Performance Group and Performance Universe comparisons. The Board noted that for periods ended January 31, 2008, the fund’s performance was above the medians for the 1- and 2-year periods, and was below the medians for the 3-, 4-and 5-year periods, of the Performance Group and the Performance Universe. The Board considered manage-
ment’s efforts in the past two years to improve the fund’s performance by increasing the number of research analysts assigned to cover small-cap stocks.
Representatives of Dreyfus reviewed with the Board members the fees paid to Dreyfus or its affiliates by mutual funds managed by Dreyfus or its affiliates with a similar investment objective and similar policies and strategies, and included within the same Lipper category, as the fund (the “Similar Funds”). Representatives of Dreyfus also noted that there were no other accounts managed or sub-advised by Dreyfus or its affiliates with similar investment objectives, policies and strategies as the fund.The Board analyzed the differences in fees paid to Dreyfus and discussed the relationship of the advisory fees paid in light of the services provided. The Board members considered the relevance of the fee information provided for the Similar Funds to evaluate the appropriateness and reasonableness of the fund’s advisory fees.
BNY Mellon International Fund
The Board reviewed the results of the Expense Group and Expense Universe comparisons.The Board reviewed the range of advisory fees and expense ratios of the funds in the Expense Group and Expense Universe, and noted that the fund’s expense ratio ranked in the fourth quartile (above the median) of the Expense Group and in the third quartile (equal to the median) of the Expense Universe.
The Board also reviewed the results of the Performance Group and Performance Universe comparisons. The Board noted that the fund’s performance was below the medians of the Performance Group and Performance Universe for the reported periods ended January 31, 2008, but, except for the one-year performance, was favorable on an absolute basis.The Board considered the voluntary 15 basis point combined fee waiver and expense reimbursement arrangement undertaken by Mellon Bank for an indefinite period, effective June 1, 2008.
Representatives of Dreyfus reviewed with the Board members the fees paid to Dreyfus or its affiliates by
106
mutual funds managed by Dreyfus or its affiliates with similar investment objectives, policies and strategies, and included within the same Lipper category, as the fund (the “Similar Funds”), and by other accounts managed or sub-advised by Dreyfus or its affiliates with similar investment objectives, policies and strategies as the fund (the “Similar Accounts”). Dreyfus’ representatives explained the nature of the Similar Accounts and the differences, from Dreyfus’ perspective, in management of the Similar Accounts as compared to managing and providing services to the fund. Dreyfus’ representatives also reviewed the costs associated with distribution through intermedi-aries.The Board analyzed the differences in fees paid to Dreyfus and discussed the relationship of the advisory fees paid in light of the services provided. The Board members considered the relevance of the fee information provided for the Similar Funds and Similar Accounts to evaluate the appropriateness and reasonableness of the fund’s advisory fees.
BNY Mellon Emerging Markets Fund
The Board reviewed the results of the Expense Group and Expense Universe comparisons.The Board reviewed the range of advisory fees and expense ratios of the funds in the Expense Group and Expense Universe, and noted that the fund’s expense ratio ranked in the third quartile of the Expense Group and Expense Universe (above the respective Expense Group and Expense Universe medians).
The Board also reviewed the results of the Performance Group and Performance Universe comparisons. The Board noted that the fund’s performance was below the medians of the Performance Group and Performance Universe for the reported periods ended January 31, 2008, but was favorable on an absolute basis.
Representatives of Dreyfus reviewed with the Board members the fees paid to Dreyfus or its affiliates by mutual funds managed by Dreyfus or its affiliates with a similar investment objectives, policies and strategies, and included within the same Lipper category, as the fund
(the “Similar Funds”), and by other accounts managed or sub-advised by Dreyfus or its affiliates with similar investment objectives, policies and strategies as the fund (the “Similar Accounts”). Dreyfus’ representatives explained the nature of the Similar Accounts and the differences, from Dreyfus’ perspective, in management of the Similar Accounts as compared to managing and providing services to the fund. Dreyfus’ representatives also reviewed the costs associated with distribution through intermedi-aries.The Board analyzed the differences in fees paid to Dreyfus and discussed the relationship of the advisory fees paid in light of the services provided. The Board members considered the relevance of the fee information provided for the Similar Funds and Similar Accounts to evaluate the appropriateness and reasonableness of the fund’s advisory fees.
BNY Mellon Balanced Fund
The Board reviewed the results of the Expense Group and Expense Universe comparisons.The Board reviewed the range of advisory fees and expense ratios of the funds in the Expense Group and Expense Universe, and noted that the fund’s expense ratio ranked in the first quartile of the Expense Group and Expense Universe (below the respective medians of the Expense Group and Expense Universe).
The Board also reviewed, and placed significant emphasis on, the results of the Performance Group and Performance Universe comparisons. The Board noted that for periods ended January 31, 2008, the fund’s performance was above the medians of the Performance Group for the 1-, 2-, 3- and 4-year periods, and was below the median for the 5-year period, and was above the medians of the Performance Universe for the reported periods. The Board also noted management’s efforts to improve the fund’s performance by appointing a new primary portfolio manager of the equity portion of the fund, effective February 15, 2007.
The Funds 107
INFORMATION ABOUT THE REVIEW AND APPROVAL OF EACH FUND’S INVESTMENT ADVISORY AGREEMENT (Unaudited) (continued)
Representatives of Dreyfus reviewed with the Board members the fees paid to Dreyfus or its affiliates by mutual funds managed by Dreyfus or its affiliates with a similar investment objective and similar policies and strategies, and included within the same Lipper category, as the fund (the “Similar Funds”). Representatives of Dreyfus also noted that there were no other accounts managed or sub-advised by Dreyfus or its affiliates with similar investment objectives, policies and strategies as the fund.The Board analyzed the differences in fees paid to Dreyfus and discussed the relationship of the advisory fees paid in light of the services provided. The Board members considered the relevance of the fee information provided for the Similar Funds to evaluate the appropriateness and reasonableness of the fund’s advisory fees.
Analysis of Profitability and Economies of Scale. Dreyfus’ representatives reviewed the dollar amount of expenses allocated and profit received by Dreyfus and its affiliates with respect to each fund and the method used to determine such expenses and profit.The Board previously had been provided with information prepared by an independent consulting firm regarding Dreyfus’ approach to allocating costs to, and determining the profitability of, individual funds and the entire Dreyfus mutual fund complex. The Board members also had been informed that the methodology had been reviewed by an independent registered public accounting firm which, like the consultant, found the methodology to be reasonable.The consulting firm also analyzed where any economies of scale might emerge in connection with the management of the funds. The Board members evaluated the profitability analysis in light of the relevant circumstances for each fund, including any decline in assets, and the extent to which economies of scale would be realized if a fund grows and whether fee levels reflect these economies of scale for the benefit of fund shareholders. The Board members also considered potential benefits to Dreyfus and its affiliates,
including BNY Mellon Fund Advisers, from acting as investment adviser to the funds, including soft dollar arrangements with respect to trading the funds’ portfolios.
It was noted that the Board members should consider Dreyfus’ profitability with respect to each fund as part of their evaluation of whether the fees under the Investment Advisory Agreement bear a reasonable relationship to the mix of services provided by Dreyfus, including the nature, extent and quality of such services. It was noted that the profitability percentage for managing each fund was within ranges determined by appropriate court cases to be reasonable given the services rendered and that the profitability percentage for managing each fund was not unreasonable given the services provided.
At the conclusion of these discussions, the Board agreed that it had been furnished with sufficient information to make an informed business decision with respect to the continuation of the Trust’s Investment Advisory Agreement with respect to the funds. Based on the discussions and considerations as described above, the Board made the following conclusions and determinations with respect to the funds:
- The Board concluded that the nature, extent and qual- ity of the services provided by Dreyfus to each fund are adequate and appropriate.
- With respect to BNY Mellon Large Cap Stock Fund and BNY Mellon Small Cap Fund, while the Board was concerned with each fund’s longer term perfor- mance, the Board was generally satisfied each fund’s performance in the short term and with management’s efforts to improve performance by appointing a new primary portfolio manager for BNY Mellon Large Cap Stock Fund, effective February 15, 2007, and by increasing the number of research analysts in 2007 assigned to cover small-cap stocks for BNY Mellon Small Cap Stock Fund.
108
- With respect to BNY Mellon Income Stock Fund, the Board was concerned with the fund’s relative underper- formance for the reported periods, but noted manage- ment’s efforts to improve the fund’s performance by appointing a new primary portfolio manager of the fund, effective February 15, 2007.
- With respect to BNY Mellon International Fund and BNY Mellon Emerging Markets Fund, while the Board was concerned with each fund’s performance versus its respective Performance Group, the Board noted the funds’ favorable performance on an absolute basis and, with respect to Mellon International Fund, considered the voluntary 15 basis point combined fee waiver and expense reimbursement arrangement undertaken by Mellon Bank for an indefinite period, effective June 1, 2008.
- With respect to BNY Mellon Mid Cap Stock Fund and Mellon Balanced Fund, the Board was satisfied with each fund’s performance.
- The Board concluded that the fee paid to Dreyfus by each fund was reasonable in light of the considerations described above.
- The Board determined that the economies of scale which may accrue to Dreyfus and its affiliates in con- nection with the management of the funds had been adequately considered by Dreyfus in connection with the advisory fee rate charged to each fund, and that, to the extent in the future it were to be determined that material economies of scale had not been shared with a fund, the Board would seek to have those economies of scale shared with the fund.
The Board members considered these conclusions and determinations, along with the information received on a routine and regular basis throughout the year, and, without any one factor being dispositive, the Board determined that re-approval of the Trust’s Investment Advisory Agreement and Administration Agreement with respect to the funds was in the best interests of each fund and its respective shareholders.
The re-approval date of the Investment Advisory Agreement for BNY Mellon U.S. Core Equity 130/30 Fund is May 31, 2009 and, therefore, the Board was not required to consider the re-approval of the Agreement at its meeting held on March 10-11, 2008.
The Funds 109
BOARD MEMBERS INFORMATION (Unaudited)
Patrick J. O’Connor (65) Chairman of the Board (2000)
Principal Occupation During Past 5Years:
- Attorney, Cozen and O’Connor, P.C. since 1973, including Vice Chairman since 1980 and Chief Executive Officer and President from 2002 to 2007
Other Board Memberships and Affiliations:
- Board of Consultors of Villanova University School of Law, Board Member
- Temple University,Trustee
- Philadelphia Police Foundation, Board Member
- Philadelphia Children’s First Fund, Board Member
- American College of Trial Lawyers, Fellow
- Historical Society of the United States District Court for the Eastern District of Pennsylvania, Director
- St. Jude's Children Research Hospital Professional Advisory Board, Director
- Crowley Chemical, Director
- Franklin Security Bank,Vice Chairman
- International Academy of Trial Lawyers, Fellow
No. of Portfolios for which Board Member Serves: 20
| ——————— |
| Ronald R. Davenport (72) Board Member (2000) |
Principal Occupation During Past 5Years:
Chairman of Sheridan Broadcasting Corporation since July 1972
Other Board Memberships and Affiliations:
American Urban Radio Networks, Co-Chairman
No. of Portfolios for which Board Member Serves: 20
| ——————— |
John L. Diederich (71) Board Member (2000)
Principal Occupation During Past 5Years:
- Chairman of Digital Site Systems, Inc., a privately held software company providing internet service to the construction materials industry, since July 1998
Other Board Memberships and Affiliations:
- Continental Mills, a dry baking products company, Board Member
- Pittsburgh Parks Conservancy, Board Member
No. of Portfolios for which Board Member Serves: 20
Maureen M.Young (63) Board Member (2000)
Principal Occupation During Past 5Years:
- Director of the Office of Government Relations at Carnegie Mellon University from January 2000 to December 2007
Other Board Memberships and Affiliations:
Oakland Planning and Development Corp., Board Member
No. of Portfolios for which Board Member Serves: 20
| ——————— |
Kevin C. Phelan (64) Board Member (2000)
Principal Occupation During Past 5Years:
- Mortgage Banker, Meredith & Grew, Inc. since March 1978, including President since September 2007 and Executive Vice President and Director from March 1998 to September 2007
Other Board Memberships and Affiliations:
- Greater Boston Chamber of Commerce, Director
- Fiduciary Trust of Boston, Director
- Caritas Medical Center,Vice Chairman
- St. Elizabeth’s Medical Center of Boston, Board Member
- Providence College,Trustee
- Simmons College,Trustee
- Newton Country Day School, Chairman of the Board
- Babson College, Board of Visitors
- Boston University School of Public Health, Board of Visitors
- Boston Public Library Foundation, Director
- Boston Foundation, Director
- Boston Municipal Research Bureau, Board Member
- Boys and Girls Club of Boston, Board Member
- Boston Capital Real Estate Investment Trust, Director
No. of Portfolios for which Board Member Serves: 20
| ——————— |
Patrick J. Purcell (60) Board Member (2000)
Principal Occupation During Past 5Years:
- Owner, President and Publisher of The Boston Herald since February 1994
- President and Founder, jobfind.com, an employment search site on the world wide web, since July 1996
- President and CEO, Herald Media since 2001
Other Board Memberships and Affiliations:
- The American Ireland Fund, an organization that raises funds for philanthropic projects in Ireland, Board Member
- The Genesis Fund, an organization that raises funds for the specialized care and treatment of New England area children born with birth defects, mental retardation and genetic diseases, Board Member
- United Way of Massachusetts Bay, Board Member
- Greater Boston Chamber of Commerce, Board Member
No. of Portfolios for which Board Member Serves: 20
110
John R. Alchin (60) Board Member (2008)
Principal Occupation During Past 5Years:
- Retired since 2007
- Executive of Comcast Corporation, a cable services provider, from 1990 to 2007, including Executive Vice-President, Co-Chief Financial Officer and Treasurer from 2002 to 2007
Other Board Memberships and Affiliations
- Big Brothers/Big Sisters of Southeastern Pennsylvania, Director
- Polo Ralph Lauren Corporation, a retail clothing and home furnishings company, Director
- Philadelphia Museum of Art, Board Member
- Metropolitan AIDS Neighborhood Nutrition Alliance, Board Member
No. of Portfolios for which Board Member Serves: 20
Thomas F. Ryan, Jr. (67) Board Member (2000)
Principal Occupation During Past 5Years:
- Retired since April 1999
- President and Chief Operating Officer of the American Stock Exchange from October 1995 to April 1999
Other Board Memberships and Affiliations:
- Boston College,Trustee
- Brigham & Women’s Hospital,Trustee
- New York State Independent System Operator, a non-profit organization which administers a competitive wholesale market for electricity in New York State, Director
- RepliGen Corporation, a biopharmaceutical company, Director
No. of Portfolios for which Board Member Serves: 20
| ——————— |
| Kim D. Kelly (52) Board Member (2008) |
- Consultant since 2005
- President, Chief Executive Officer and a Director of Arroyo Video Solutions, Inc., a video-on-demand technology company, from 2004 to 2005
- Executive of Insight Communications Company, Inc., a cable services provider, from 1990 to 2003, including President from 2002 to 2003 and Chief Operating Officer from 1998 to 2003
| Other Board Memberships and Affiliations: |
- Saint David’s School,Trustee
- MCG Capital Corp., Director
No. of Portfolios for which Board Member Serves: 20
Once elected all Board Members serve for an indefinite term.The address of the Board Members and Officers is in c/o The Dreyfus Corporation, 200 Park Avenue, New York, NewYork 10166.Additional information about the Board Members is available in the fund’s Statement of Additional Information which can be obtained from Dreyfus free of charge by calling this toll free number: 1-800-645-6561. For Wealth Management clients, please contact your account officer or call 1-888-281-7350.
The Funds 111
OFFICERS OF THE TRUST (Unaudited)
CHRISTOPHER SHELDON, President since September 2006.
As director of Investment Strategy for Mellon’s Private Wealth Management group since April 2003, Mr. Sheldon manages the analysis and development of investment and asset allocation strategies and oversees investment product research and, since June 2006, also oversees the alternative investment groups. Prior to assuming his current position, Mr. Sheldon was West Coast managing director of Mellon’s Private Wealth Management group from 2001-2003 and its regional manager from 1998-2001. He was previously a Vice President of the Trust. He is 43 years old has been employed by Mellon Bank since January 1995.
MICHAEL A. ROSENBERG, Vice President and Secretary since August 2005.
Assistant General Counsel of BNY Mellon, and an officer of 77 investment companies (comprised of 174 portfolios) managed by the Manager. He is 48 years old and has been an employee of the Manager since October 1991.
JAMES BITETTO, Vice President and Assistant Secretary since August 2005.
Senior Counsel of BNY Mellon and Secretary of the Manager, and an officer of 77 investment companies (comprised of 174 portfolios) managed by the Manager. He is 42 years old and has been an employee of the Manager since December 1996.
JONI LACKS CHARATAN, Vice President and Assistant Secretary since August 2005.
Senior Counsel of BNY Mellon, and an officer of 77 investment companies (comprised of 174 portfolios) managed by the Manager. She is 52 years old and has been an employee of the Manager since October 1988.
JOSEPH M. CHIOFFI, Vice President and Assistant Secretary since August 2005.
Senior Counsel of BNY Mellon, and an officer of 77 investment companies (comprised of 174 portfolios) managed by the Manager. He is 46 years old and has been an employee of the Manager since June 2000.
JANETTE E. FARRAGHER, Vice President and Assistant Secretary since August 2005.
Assistant General Counsel of BNY Mellon, and an officer of 77 investment companies (comprised of 174 portfolios) managed by the Manager. She is 45 years old and has been an employee of the Manager since February 1984.
JOHN B. HAMMALIAN, Vice President and Assistant Secretary since August 2005.
Managing Counsel of BNY Mellon, and an officer of 77 investment companies (comprised of 174 portfolios) managed by the Manager. He is 45 years old and has been an employee of the Manager since February 1991.
ROBERT R. MULLERY, Vice President and Assistant Secretary since August 2005.
Managing Counsel of BNY Mellon, and an officer of 77 investment companies (comprised of 174 portfolios) managed by the Manager. He is 56 years old and has been an employee of the Manager since May 1986.
JEFF PRUSNOFSKY, Vice President and Assistant Secretary since August 2005.
Managing Counsel of BNY Mellon, and an officer of 77 investment companies (comprised of 174 portfolios) managed by the Manager. He is 43 years old and has been an employee of the Manager since October 1990.
JAMES WINDELS, Treasurer since November 2001.
Director – Mutual Fund Accounting of the Manager, and an officer of 77 investment companies (comprised of 174 portfolios) managed by the Manager. He is 49 years old and has been an employee of the Manager since April 1985.
RICHARD CASSARO, Assistant Treasurer since September 2007.
Senior Accounting Manager – Money Market and Municipal Bond Funds of the Manager, and an officer of 77 investment companies (comprised of 174 portfolios) managed by the Manager. He is 49 years old and has been an employee of the Manager since September 1982.
GAVIN C. REILLY, Assistant Treasurer since December 2005.
Tax Manager of the Investment Accounting and Support Department of the Manager, and an officer of 77 investment companies (comprised of 174 portfolios) managed by the Manager. He is 40 years old and has been an employee of the Manager since April 1991.
112
ROBERT ROBOL, Assistant Treasurer since December 2002.
Senior Accounting Manager – Fixed Income Funds of the Manager, and an officer of 77 investment companies (comprised of 174 portfolios) managed by the Manager. He is 44 years old and has been an employee of the Manager since October 1988.
ROBERT SALVIOLO, Assistant Treasurer since May 2007.
Senior Accounting Manager – Equity Funds of the Manager, and an officer of 77 investment companies (comprised of 174 portfolios) managed by the Manager. He is 41 years old and has been an employee of the Manager since June 1989.
ROBERT SVAGNA, Assistant Treasurer since December 2002.
Senior Accounting Manager – Equity Funds of the Manager, and an officer of 77 investment companies (comprised of 174 portfolios) managed by the Manager. He is 41 years old and has been an employee of the Manager since November 1990.
JOSEPH W. CONNOLLY, Chief Compliance Officer since October 2004.
Chief Compliance Officer of the Manager and The Dreyfus Family of Funds (77 investment companies, comprised of 174 portfolios). From November 2001 through March 2004, Mr. Connolly was first Vice-President, Mutual Fund Servicing for Mellon Global Securities Services. In that capacity, Mr. Connolly was responsible for managing Mellon’s Custody, Fund Accounting and Fund Administration services to third-party mutual fund clients. He is 51 years old and has served in various capacities with the Manager since 1980, including manager of the firm’s Fund Accounting Department from 1997 through October 2001.
WILLIAM GERMENIS, Anti-Money Laundering Compliance Officer since September 2002.
Vice President and Anti-Money Laundering Compliance Officer of the Distributor, and the Anti-Money Laundering Compliance Officer of 73 investment companies (comprised of 170 portfolios) managed by the Manager. He is 37 years old and has been an employee of the Distributor since October 1998.
The Funds 113
NOTES

S.
-
to .
. to
-
.

| DISCUSSION OF FUND PERFORMANCE |
For the period of September 1, 2007, through August 31, 2008, as provided by J. Christopher Nicholl and John F. Flahive, Portfolio Managers
Fund and Market Performance Overview
For the 12-month period ended August 31, 2008, BNY Mellon Money Market Fund’s Class M shares produced a yield of 3.65%, and its Investor shares produced a yield of 3.40% .Taking into account the effects of compounding, the fund’s Class M and Investor shares also produced effective yields of 3.71% and 3.46%, respectively.1
Yields of money market instruments generally declined over much of the reporting period as the Federal Reserve Board (the “Fed”) reduced short-term interest rates to stimulate a struggling U.S. economy and address a global credit crisis that originated in the U.S. sub-prime mortgage market.
The Fund’s Investment Approach
The fund seeks as high a level of current income as is consistent with the preservation of capital and the maintenance of liquidity.To pursue its goal, the fund invests in a diversified portfolio of high-quality, short-term debt securities, including U.S. government securities; certificates of deposit, time deposits, bankers’ acceptances and other short-term domestic or foreign bank obligations; repurchase agreements; high-grade commercial paper and other short-term corporate obligations; and taxable municipal obligations. Normally, the fund invests at least 25% of its net assets in bank obligations.
Interest Rates Fell due to Credit and Economic Woes
By the start of the reporting period, economic conditions in the United States had begun to deteriorate as a result of slumping housing markets when a larger-than-expected number of homeowners defaulted
or fell behind on their mortgages.At the same time,soar-ing food and energy costs put pressure on cash-strapped consumers,who reduced their spending on discretionary items. Businesses also cut back on expenditures as they anticipated potentially weaker business conditions.
Meanwhile, a credit crisis that had originated in the sub-prime mortgage market caused investors to reassess their attitudes toward risk and flock to the relative safety of U.S. Treasury securities and money market funds.The Fed began to address the flagging economy and intensifying credit crunch by injecting liquidity into the banking system and reducing the federal funds rate from 5.25% to 4.75% in September 2007, the first reduction of short-term interest rates in more than four years. However, news of further deterioration in housing prices and massive sub-prime related losses among major financial institutions led to renewed market turbulence, and the Fed responded with additional rate cuts in October and December. As a result, the federal funds rate ended 2007 at 4.25% .
Signs of economic weakness continued to accumulate in early 2008, including the first monthly job losses in more than four years. The Fed took particularly aggressive action in late January, easing the federal funds rate by another 125 basis points in two moves. Despite these actions and a stimulus package passed by Congress, the economy continued to deteriorate amid steady job losses, accelerating inflation and intensifying deleveraging pressures on financial institutions. Additional rate cuts by the Fed followed in March and April, driving the federal funds rate to 2.00% .The Fed left interest rates unchanged at its meetings in June and August despite additional job losses and continued price erosion in housing markets, due mainly to concerns that further easing might amplify inflationary pressures stemming from higher commodity prices.
The Funds 3
DISCUSSION OF FUND PERFORMANCE (continued)
Although yields of money market instruments declined along with short-term interest rates, instruments at the short end of the maturity spectrum provided higher yields than their longer-term counterparts over the first half of the reporting period due to supply-and-demand influences as record amounts of cash flowed into money market funds from newly risk-averse investors. Over the reporting period’s second half, when it became apparent that the bulk of Fed easing was complete, the money market yield curve returned to a positive slope.
Maintaining a Conservative Investment Posture
In this environment, we maintained the fund’s weighted average maturity in a range we considered longer than industry averages, which enabled the fund to maintain higher yields for a longer time while interest rates declined.While we invested the bulk of the fund’s asset in corporate-backed commercial paper, we gradually reduced that allocation over the course of the reporting period in favor of certificates of deposit and corporate-backed floating-rate notes.
As of the reporting period’s end, the U.S. economic slump has persisted and the global credit crisis has not abated. However, inflationary pressures appear to be receding as prices of crude oil and other commodities have retreated from their peaks due to slackening demand in a slowing global economy. Therefore, we believe that the Fed is unlikely to raise short-term interest rates anytime soon, and we have maintained a relatively long weighted average maturity, which we believe should enable the fund to capture incrementally higher yields from those maturities. Of course, we are prepared to adjust our strategies as economic and market conditions develop.
September 15, 2008
An investment in the fund is not insured or guaranteed by the FDIC or any other government agency. Although the fund seeks to preserve the value of your investment at $1.00 per share, it is possible to lose money by investing in the fund.
1 Effective yield is based upon dividends declared daily and reinvested monthly. Past performance is no guarantee of future results.Yields fluctuate.
4

| DISCUSSION OF FUND PERFORMANCE |
For the period of September 1, 2007, through August 31, 2008, as provided by J. Christopher Nicholl and John F. Flahive, Portfolio Managers
Fund and Market Performance Overview
For the 12-month period ended August 31, 2008, BNY Mellon National Municipal Money Market Fund’s Class M shares produced a yield of 2.36%, and its Investor shares produced a yield of 2.11% . Taking into account the effects of compounding, the fund’s Class M and Investor shares also produced effective yields of 2.38% and 2.13%, respectively.1
Yields of tax-exempt money market instruments declined along with short-term interest rates over much of the reporting period, as the Federal Reserve Board (the “Fed”) sought to stimulate economic growth and address a credit crisis in global fixed-income markets.
The Fund’s Investment Approach
The fund seeks as high a level of current income exempt from federal income tax as is consistent with the preservation of capital and maintenance of liquid-ity.To pursue its goal, the fund invests at least 80% of its assets in short-term municipal obligations that provide income exempt from federal income tax.Among these are municipal notes, short-term municipal bonds, tax-exempt commercial paper and municipal leases.The fund may invest up to 20% of its total assets in taxable money market securities, such as U.S. government obligations, bank and corporate obligations and commercial paper. The fund also may invest in custodial receipts.
Interest Rates Fell due to Credit and Economic Woes
By the start of the reporting period, U.S. economic conditions had begun to deteriorate as a result of slumping housing markets when a larger-than-expected number of homeowners defaulted on their mortgages. At the same time, soaring food and energy costs put pressure on cash-strapped consumers, who reduced spending on discretionary items. Businesses also cut
back on expenditures as they anticipated potentially weaker business conditions.
Meanwhile, a credit crisis that had originated in the sub-prime mortgage market caused investors to reassess their attitudes toward risk and flock to the relative safety of U.S. Treasury securities and money market funds.The Fed began to address these issues by injecting liquidity into the banking system and reducing the federal funds rate from 5.25% to 4.75% in September 2007, the first reduction in more than four years. However, news of further deterioration in housing prices and massive sub-prime related losses among major financial institutions led to renewed market turbulence, and the Fed responded with additional rate cuts in October and December. As a result, the federal funds rate ended 2007 at 4.25% .
Signs of economic weakness continued to accumulate in early 2008,including the first monthly job losses in more than four years. The Fed took particularly aggressive action in late January, easing the federal funds rate by another 125 basis points in two moves. Despite these actions and a stimulus package passed by Congress, the economy continued to deteriorate amid steady job losses, accelerating inflation and intensifying deleverag-ing pressures on financial institutions. Additional rate cuts by the Fed followed in March and April, driving the federal funds rate to 2.00% . The Fed left interest rates unchanged at its meetings in June and August despite additional job losses and continued price erosion in housing markets, due mainly to concerns that further easing might amplify inflationary pressures.
Assets Flowed into Tax-Exempt Money Market Funds
Although tax-exempt money market yields declined along with interest rates, a record level of assets flowed into municipal money market funds from risk-averse investors. However, robust demand was met with an ample supply of short-term tax-exempt instruments as municipalities began to see lower revenues in the slower economy. In addition, turmoil in some seg-
The Funds 5
DISCUSSION OF FUND PERFORMANCE (continued)
ments of the longer-term municipal bond market resulted in greater issuance of short-term tax-exempt securities.As a result, yields of tax-exempt money market instruments at the short end of the maturity spectrum provided higher yields than their longer-term counterparts over most of the reporting period.
Maintaining a Conservative Investment Posture
Early in the reporting period, we maintained the fund’s weighted average maturity in a range we considered shorter than industry averages to take advantage of higher yields on short-term instruments.However,by the reporting period’s end, we had increased the fund’s weighted average maturity to a point that was longer than average, as variable-rate demand notes (“VRDNs”) grew more expensive.As we reduced the fund’s allocation toVRDNs, we generally increased its holdings of municipal notes, tax-exempt commercial paper and seasoned municipal bonds.We maintained a focus on credit quality, generally avoiding instruments that may be affected by concerns surrounding certain insurers, banks and broker-dealers.
As of the reporting period’s end, the U.S. economic slump has persisted and the global credit crisis has not abated. However, inflationary pressures appear to be receding as commodity prices have retreated from their peaks.Therefore, we believe that the Fed is unlikely to raise short-term interest rates anytime soon, and we have maintained a relatively long weighted average maturity, which we believe should enable the fund to capture incrementally higher yields from those maturities. Of course, we are prepared to adjust our strategies as economic and market conditions develop.
September 15, 2008
An investment in the fund is not insured or guaranteed by the FDIC or any other government agency. Although the fund seeks to preserve the value of your investment at $1.00 per share, it is possible to lose money by investing in the fund.
1 Effective yield is based upon dividends declared daily and reinvested monthly. Past performance is no guarantee of future results.Yields fluctuate. Income may be subject to state and local taxes, and some income may be subject to the federal alternative minimum tax (AMT) for certain investors.
6
UNDERSTANDING YOUR FUND’S EXPENSES (Unaudited)
As a mutual fund investor, you pay ongoing expenses, such as management fees and other expenses. Using the information below, you can estimate how these expenses affect your investment and compare them with the expenses of the funds.You also may pay one-time transaction expenses, including sales charges (loads) and redemption fees, which are not shown in this section and would have resulted in higher total expenses. For more information, see your fund’s prospectus or talk to your financial advisor.
Review your fund’s expenses
The table below shows the expenses you would have paid on a $1,000 investment in each class of each fund from March 1, 2008 to August 31, 2008. It also shows how much a $1,000 investment would be worth at the close of the period, assuming actual returns and expenses.
| Expenses and Value of a $1,000 Investment | ||||||
| assuming actual returns for the six months ended August 31, 2008 | ||||||
| Class M Shares | Investor Shares | |||||
| BNY Mellon Money Market Fund | ||||||
| Expenses paid per $1,000† | $ 1.52 | $ 2.78 | ||||
| Ending value (after expenses) | $1,013.60 | $1,012.40 | ||||
| BNY Mellon National Municipal Money Market Fund | ||||||
| Expenses paid per $1,000† | $ 1.46 | $ 2.72 | ||||
| Ending value (after expenses) | $1,008.70 | $1,007.40 | ||||
| C O M PA R I N G YO U R F U N D ’ S E X P E N S E S | W I T H | T H O S E O F O T H E R | F U N D S ( U n a u d i t e d ) | |||
Using the SEC’s method to compare expenses
The Securities and Exchange Commission (SEC) has established guidelines to help investors assess fund expenses. Per these guidelines, the table below shows your fund’s expenses based on a $1,000 investment, assuming a hypothetical 5% annualized return.You can use this information to compare the ongoing expenses (but not transaction expenses or total costs) of investing in the fund with those of other funds. All mutual fund shareholder reports will provide this information to help you make this comparison. Please note that you cannot use this information to estimate your actual ending account balance and expenses paid during the period.
| Expenses and Value of a $1,000 Investment | ||||
| assuming a hypothetical 5% annualized return for the six months ended August 31, 2008 | ||||
| Class M Shares | Investor Shares | |||
| BNY Mellon Money Market Fund | ||||
| Expenses paid per $1,000† | $ 1.53 | $ 2.80 | ||
| Ending value (after expenses) | $1,023.63 | $1,022.37 | ||
| BNY Mellon National Municipal Money Market Fund | ||||
| Expenses paid per $1,000† | $ 1.48 | $ 2.75 | ||
| Ending value (after expenses) | $1,023.68 | $1,022.42 |
† Expenses are equal to the BNY Mellon Money Market Fund annualized expense ratio of .30% for Class M and .55% for Investor Class and BNY Mellon National Municipal Money Market Fund, .29% for Class M and .54% for Investor Class, multiplied by the average account value over the period, multiplied by 184/366 (to reflect the one-half year period).
The Funds 7
| STATEMENT OF INVESTMENTS | ||||||||||
| August 31, 2008 | ||||||||||
| BNY Mellon Money Market Fund | ||||||||||
| Negotiable Bank | Principal | Principal | ||||||||
| Certificates of Deposit—28.6% | Amount ($) | Value ($) | Commercial Paper (continued) | Amount ($) | Value ($) | |||||
| ABN AMRO Bank | ABN-AMRO North America | |||||||||
| 3.03%, 10/24/08 | 15,000,000 | 15,000,435 | Finance Inc. | |||||||
| Banco Bilbao Vizcaya | 2.60%, 9/8/08 | 35,000,000 | 34,982,305 | |||||||
| Argenteria Puerto Rico | American Express Company | |||||||||
| 3.08%, 5/26/09 | 20,000,000 | 20,000,725 | 2.42%, 9/17/08 | 31,000,000 | 30,966,658 | |||||
| Banco Santander | ANZ National (International) Ltd. | |||||||||
| Puerto Rico (Yankee) | 2.75%, 9/8/08 | 45,000,000 b | 44,975,937 | |||||||
| 2.56%—2.88%, | Calyon | |||||||||
| 9/4/08—3/11/09 | 30,000,000 | 30,000,147 | 2.65%, 9/3/08 | 30,000,000 | 29,995,592 | |||||
| Bank of America Corp. | DEPFA BANK PLC | |||||||||
| 2.54%, 9/26/08 | 50,000,000 | 50,003,321 | 2.85%, 10/17/08 | 23,000,000 b | 22,916,242 | |||||
| Bank of Nova Scotia | District of Columbia Water | |||||||||
| (Yankee) | and Sewer Authority | |||||||||
| 2.83%, 5/8/09 | 20,000,000 | 20,002,665 | 3.20%, 1/14/09 | 14,200,000 | 14,200,000 | |||||
| Calyon (Yankee) | Fortis Banque | |||||||||
| 3.14%, 2/20/09 | 15,000,000 | 15,001,411 | Luxembourg S.A. | |||||||
| Canadian Imperial | 2.63%, 9/25/08 | 40,000,000 | 39,929,867 | |||||||
| Bank of Commerce | General Electric Capital Corp. | |||||||||
| 4.46%, 11/28/08 | 27,000,000 | 27,000,631 | 2.07%, 9/5/08 | 42,000,000 | 41,990,340 | |||||
| Citibank (South Dakota) | ING (US) Funding LLC | |||||||||
| N.A., Sioux Falls | 2.60%, 9/10/08 | 25,000,000 | 24,983,781 | |||||||
| 2.81%, 9/8/08 | 30,000,000 | 30,000,000 | ING (US) Funding LLC | |||||||
| Credit Suisse Group | 2.58%, 10/17/08 | 30,000,000 | 29,901,100 | |||||||
| 2.96%, 10/15/08 | 45,000,000 a | 45,018,848 | Northern California | |||||||
| Fifth Third Bank | Transmission Agency | |||||||||
| 3.24%, 12/17/08 | 25,000,000 | 25,000,731 | 2.50%—2.90%, | |||||||
| Royal Bank of Canada | 9/3/08—11/6/08 | 38,500,000 | 38,500,000 | |||||||
| 2.93%, 9/19/08 | 25,000,000 a | 25,000,000 | Prudential Funding LLC | |||||||
| Societe Generale | 2.20%, 9/5/08 | 43,000,000 | 42,989,489 | |||||||
| (Yankee) | Salvation Army | |||||||||
| 2.90%, 12/8/08 | 25,000,000 | 24,983,146 | 2.46%, 9/11/08 | 27,150,000 | 27,150,000 | |||||
| Westpac Banking Corp. | Societe Generale N.A. Inc. | |||||||||
| 3.24%, 8/25/09 | 10,000,000 | 10,000,963 | 2.36%, 9/5/08 | 30,000,000 | 29,992,133 | |||||
| Total Negotiable Bank | Wells Fargo & Co. | |||||||||
| Certificates of Deposit | 2.38%, 9/12/08 | 50,000,000 | 49,963,639 | |||||||
| (cost $337,013,023) | 337,013,023 | Westpac Banking Corp. | ||||||||
| 2.93%, 10/3/08 | 40,000,000 | 40,000,000 | ||||||||
| Commercial Paper—51.9% | Yale University | |||||||||
| 2.40%, 9/2/08 | 52,100,000 | 52,096,525 | ||||||||
| Abbey National | ||||||||||
| North America LLC | Total Commercial Paper | |||||||||
| 3.05%, 4/21/09 | 15,000,000 | 14,705,167 | (cost $610,238,775) | 610,238,775 | ||||||
8
| BNY Mellon Money Market Fund (continued) | ||||||||||||
| Principal | Principal | |||||||||||
| Notes—19.3% | Amount ($) | Value ($) | Notes (continued) | Amount ($) | Value ($) | |||||||
| Allied Irish Banks | Indiana Health and | |||||||||||
| 3.21%, 11/5/08 | 30,000,000 a | 30,000,000 | Educational Facility | |||||||||
| Andrew W. Mellon Foundation NY | 2.90%, 9/7/08 | 23,375,000 a | 23,375,000 | |||||||||
| 2.48%, 9/7/08 | 23,050,000 a | 23,050,000 | Mullenix St. Charles Properties LP | |||||||||
| Bank of Scotland PLC | 2.67%, 9/7/08 | 7,000,000 a | 7,000,000 | |||||||||
| 3.01%, 11/6/08 | 40,000,000 a | 39,918,589 | New Jersey Economic | |||||||||
| BBVA U.S. Senior, | Development Authority | |||||||||||
| S.A. Unipersonal | 2.60%, 9/7/08 | 8,075,000 a | 8,075,000 | |||||||||
| 2.86%, 10/17/08 | 24,600,000 a,b | 24,569,002 | New Jersey Economic | |||||||||
| Cleveland Ohio Airport System | Development Authority | |||||||||||
| 2.55%, 9/7/08 | 1,600,000 a | 1,600,000 | 2.44%, 9/12/08 | 2,300,000 a | 2,300,000 | |||||||
| General Secretariat of | New York City NY Transitional | |||||||||||
| American States | Finance Authority | |||||||||||
| 2.55%, 9/7/08 | 4,280,000 a | 4,280,000 | 2.70%, 9/7/08 | 19,300,000 a | 19,300,000 | |||||||
| Goldman Sachs Group Inc. | Total Notes | |||||||||||
| 3.79%, 1/15/09 | 25,700,000 | 25,754,817 | (cost $227,391,225) | 227,391,225 | ||||||||
| Greater Orlando Aviation | Total Investments | |||||||||||
| Authority FL | (cost $1,174,643,023) | 99.8% | 1,174,643,023 | |||||||||
| 2.76%, 10/1/08 | 5,000,000 | 5,000,000 | ||||||||||
| HSBC Finance Corporation | Cash and Receivables (Net) | .2% | 2,810,465 | |||||||||
| 6.29%, 11/17/08 | 13,100,000 | 13,168,817 | Net Assets | 100.0% | 1,177,453,488 | |||||||
a Variable rate security—interest rate subject to periodic change. b Securities exempt from registration under Rule 144A of the Securities Act of 1933.These securities may be resold in transactions exempt from registration, normally to qualified institutional buyers. At August 31, 2008, these securities amounted to $92,461,181 or 7.9% of net assets.
| Portfolio Summary (Unaudited)† | ||||||
| Value (%) | Value (%) | |||||
| Banking | 67.4 | Insurance | 3.7 | |||
| Finance | 7.3 | Other | 11.0 | |||
| Education | 6.4 | |||||
| Utility-Electric Revenue | 4.0 | 99.8 | ||||
| † Based on net assets. | ||||||
| See notes to financial statements. | ||||||
The Funds 9
| STATEMENT OF INVESTMENTS August 31, 2008 |
| BNY Mellon National Municipal Money Market Fund | ||||||||
| Coupon | Maturity | Principal | ||||||
| Short-Term Investments—101.5% | Rate (%) | Date | Amount ($) | Value ($) | ||||
| Alabama—1.8% | ||||||||
| Jefferson County, Sewer Revenue (Capital | ||||||||
| Improvement Warrants) (Insured; FGIC) | 5.00 | 2/1/09 | 3,935,000 a | 4,036,585 | ||||
| Mobile Infirmary Health System Special Care Facilities Financing | ||||||||
| Authority, Revenue (Infirmary Health System, Inc.) | 1.85 | 9/7/08 | 25,000,000 b | 25,000,000 | ||||
| Arizona—1.2% | ||||||||
| McAllister Academic Village LLC, Revenue (Arizona State | ||||||||
| University McAllister Academic Village Project) (Insured; | ||||||||
| AMBAC and Liquidity Facility; State Street Bank and Trust Co.) | 7.00 | 9/7/08 | 12,400,000 b | 12,400,000 | ||||
| Sun Devil Energy Center LLC, Revenue, Refunding (Arizona | ||||||||
| State University Project) (Insured; Assured Guaranty and | ||||||||
| Liquidity Facility; Royal Bank of Canada) | 2.00 | 9/7/08 | 7,000,000 b | 7,000,000 | ||||
| Colorado—4.5% | ||||||||
| Central Platte Valley Metropolitan District, GO | ||||||||
| (Liquidity Facility; BNP Paribas) | 3.50 | 12/1/08 | 9,200,000 | 9,200,000 | ||||
| Central Platte Valley Metropolitan District, GO (LOC; U.S. Bank NA) | 3.50 | 12/1/08 | 1,490,000 | 1,490,000 | ||||
| Commerce City Northern Infrastructure General | ||||||||
| Improvement District, GO, Refunding (LOC; U.S. Bank NA) | 1.84 | 9/7/08 | 9,390,000 b | 9,390,000 | ||||
| Commerce City Northern Infrastructure General | ||||||||
| Improvement District, GO, Refunding (LOC; U.S. Bank NA) | 1.84 | 9/7/08 | 6,150,000 b | 6,150,000 | ||||
| Denver City and County, Excise Tax Revenue (Colorado | ||||||||
| Convention Center Expansion Project) (Insured; | ||||||||
| FSA and Liquidity Facility; Dexia Credit Locale) | 2.25 | 9/7/08 | 25,000,000 b | 25,000,000 | ||||
| Westminster Economic Development Authority, | ||||||||
| Tax Increment Revenue (North Huron Urban | ||||||||
| Renewal Project) (LOC; DEPFA Bank PLC) | 1.85 | 9/7/08 | 22,650,000 b | 22,650,000 | ||||
| Connecticut—3.0% | ||||||||
| Connecticut, GO (Liquidity Facility; Bayerische Landesbank) | 1.70 | 9/7/08 | 19,350,000 b | 19,350,000 | ||||
| Connecticut, Special Tax Obligation, Refunding | ||||||||
| (Transportation Infrastruture Purposes) (Insured; | ||||||||
| AMBAC and Liquidity Facility; Westdeutsche Landesbank) | 9.00 | 9/7/08 | 29,585,000 b | 29,585,000 | ||||
| District of Columbia—1.8% | ||||||||
| District of Columbia, GO (Insured; CIFG and Liquidity Facility; Citibank NA) | 1.87 | 9/7/08 | 10,015,000 b,c | 10,015,000 | ||||
| District of Columbia, Multimodal GO, Refunding (LOC; Allied Irish Banks) | 1.90 | 9/7/08 | 4,285,000 b | 4,285,000 | ||||
| District of Columbia, Multimodal GO, Refunding (LOC; Dexia Credit Locale) | 1.80 | 9/7/08 | 15,000,000 b | 15,000,000 | ||||
| Florida—7.6% | ||||||||
| Eclipse Funding Trust (Golden Knights Corporation Master Lease | ||||||||
| Program) (Insured; MBIA, Inc. and Liquidity Facility; U.S. Bank NA) | 1.87 | 9/7/08 | 24,240,000 b,c | 24,240,000 | ||||
| Florida Keys Aqueduct Authority, Water Revenue | ||||||||
| (Insured; FGIC and Liquidity Facility; Citibank NA) | 1.87 | 9/7/08 | 9,775,000 b,c | 9,775,000 | ||||
| Highlands County Health Facilities Authority, HR (Adventist Health | ||||||||
| System/Sunbelt Obligated Group) (Insured; Berkshire Hathaway | ||||||||
| Assurance Corporation and Liquidity Facility; Citibank NA) | 1.87 | 9/7/08 | 4,660,000 b,c | 4,660,000 | ||||
10
| BNY Mellon National Municipal Money Market Fund (continued) | ||||||||
| Coupon | Maturity | Principal | ||||||
| Short-Term Investments (continued) | Rate (%) | Date | Amount ($) | Value ($) | ||||
| Florida (continued) | ||||||||
| North Broward Hospital District, Revenue, | ||||||||
| Refunding (LOC; TD Banknorth NA) | 1.77 | 9/7/08 | 17,100,000 b | 17,100,000 | ||||
| Orange County Industrial Development Authority, Revenue, | ||||||||
| Refunding (Lake Highland Preparatory School, Inc. | ||||||||
| Project) (LOC; Bank of America) | 1.90 | 9/7/08 | 17,000,000 b | 17,000,000 | ||||
| Palm Beach County, Revenue, Refunding (Saint Andrew’s | ||||||||
| School of Boca Raton, Inc. Project) (LOC; Bank of America) | 1.90 | 9/7/08 | 10,000,000 b | 10,000,000 | ||||
| Polk County School District, Sales Tax Revenue (Insured; FSA) | 4.00 | 10/1/08 | 7,815,000 | 7,819,360 | ||||
| Sarasota County Public Hospital District, HR (Sarasota | ||||||||
| Memorial Hospital Project) (LOC; Fifth Third Bank) | 1.81 | 9/7/08 | 9,800,000 b | 9,800,000 | ||||
| Tohopekaliga Water Authority, Utility System Revenue | ||||||||
| (LOC; Landesbank Hessen-Thuringen Girozentrale) | 1.85 | 9/7/08 | 13,000,000 b | 13,000,000 | ||||
| UCF Health Facilities Corporation, Capital Improvement | ||||||||
| Revenue (UCF Health Sciences Campus | ||||||||
| at Lake Nona Project) (LOC; Fifth Third Bank) | 1.86 | 9/7/08 | 10,000,000 b | 10,000,000 | ||||
| Georgia—7.9% | ||||||||
| Atlanta, Water and Wastewater Revenue (LOC; Wachovia Bank) | 1.82 | 9/7/08 | 15,000,000 b | 15,000,000 | ||||
| Atlanta, Water and Wastewater Revenue, CP (LOC: | ||||||||
| Bank of America, Dexia Credit Locale, | ||||||||
| JPMorgan Chase Bank and Lloyds TSB Bank PLC) | 1.70 | 2/4/09 | 9,111,000 | 9,111,000 | ||||
| Clayton County Housing Authority, MFHR, | ||||||||
| Refunding (Chateau Forest Apartments Project) | ||||||||
| (Insured; FSA and Liquidity Facility; Societe Generale) | 2.25 | 9/7/08 | 6,530,000 b | 6,530,000 | ||||
| De Kalb County Housing Authority, MFHR, Refunding | ||||||||
| (Wood Terrace Apartment Project) (LOC; Wachovia Bank) | 2.07 | 9/7/08 | 15,935,000 b | 15,935,000 | ||||
| Fulton County Development Authority, Revenue | ||||||||
| (Saint George Village Catholic Continuing Care | ||||||||
| Retirement Communities, Inc. Project) (LOC; Bank of America) | 1.90 | 9/7/08 | 12,990,000 b | 12,990,000 | ||||
| Metropolitan Atlanta Rapid Transit Authority, | ||||||||
| Sales Tax Revenue (Second Indenture Series) | ||||||||
| (LOC: Bayerische Landesbank and Westdeutsche Landesbank) | 1.75 | 9/7/08 | 36,200,000 b | 36,200,000 | ||||
| Metropolitan Atlanta Rapid Transit Authority, | ||||||||
| Sales Tax Revenue (Second Indenture Series) | ||||||||
| (LOC: Bayerische Landesbank and Westdeutsche Landesbank) | 1.90 | 9/7/08 | 33,000,000 b | 33,000,000 | ||||
| Hawaii—1.1% | ||||||||
| Honolulu City and County, CP (LOC; Westdeutsche Landesbank) | 1.70 | 9/3/08 | 17,500,000 | 17,500,000 | ||||
| Illinois—10.8% | ||||||||
| Chicago, Second Lien Water Revenue (LOC; JPMorgan Chase Bank) | 1.75 | 9/7/08 | 49,255,000 b | 49,255,000 | ||||
| Chicago Transit Authority, COP (Insured; Berkshire Hathaway | ||||||||
| Assurance Corporation and Liquidity Facility; Citibank NA) | 1.87 | 9/7/08 | 25,365,000 b,c | 25,365,000 | ||||
| Elmhurst, Revenue (Joint Commission on Accreditation | ||||||||
| of Healthcare Organizations) (LOC; JPMorgan Chase Bank) | 1.83 | 9/7/08 | 4,265,000 b | 4,265,000 | ||||
| The Funds 11 |
| STATEMENT OF INVESTMENTS (continued) |
| BNY Mellon National Municipal Money Market Fund (continued) | ||||||||
| Coupon | Maturity | Principal | ||||||
| Short-Term Investments (continued) | Rate (%) | Date | Amount ($) | Value ($) | ||||
| Illinois (continued) | ||||||||
| Illinois Educational Facilities Authority, | ||||||||
| Revenue (The University of Chicago) | 1.95 | 5/5/09 | 18,000,000 | 18,000,000 | ||||
| Illinois Finance Authority, Revenue (Chicago Symphony | ||||||||
| Orchestra) (LOC; Royal Bank of Scotland) | 1.80 | 9/7/08 | 8,000,000 b | 8,000,000 | ||||
| Illinois Finance Authority, Revenue (Resurrection | ||||||||
| Health Care) (LOC; JPMorgan Chase Bank) | 2.65 | 9/1/08 | 19,060,000 b | 19,060,000 | ||||
| Illinois Health Facilities Authority, Revenue (Ingalls | ||||||||
| Memorial Hospital) (LOC; Northern Trust Co.) | 1.88 | 9/7/08 | 13,300,000 b | 13,300,000 | ||||
| Kane County Forest Preserve District, GO | 4.50 | 12/15/08 | 2,490,000 | 2,497,998 | ||||
| Regional Transportation Authority, GO, Refunding | ||||||||
| (Liquidity Facility; DEPFA Bank PLC) | 1.88 | 9/7/08 | 25,870,000 b | 25,870,000 | ||||
| University of Illinois Board of Trustees, Revenue, Refunding (UIC | ||||||||
| South Campus Development Project) (LOC; JPMorgan Chase Bank) | 1.85 | 9/7/08 | 9,500,000 b | 9,500,000 | ||||
| Indiana—.5% | ||||||||
| Lawrenceburg, PCR, Refunding (Indiana Michigan Power | ||||||||
| Company Project) (LOC; Royal Bank of Scotland) | 1.90 | 9/7/08 | 8,600,000 b | 8,600,000 | ||||
| Iowa—1.3% | ||||||||
| Iowa Finance Authority, Private College Revenue, Refunding | ||||||||
| (Drake University Project) (LOC; Wells Fargo Bank) | 2.45 | 9/1/08 | 20,500,000 b | 20,500,000 | ||||
| Kansas—2.5% | ||||||||
| Olathe, GO Temporary Notes | 2.75 | 6/1/09 | 40,000,000 | 40,240,952 | ||||
| Kentucky—3.8% | ||||||||
| Danville, Multi-City LR, CP (LOC; Fifth Third Bank) | 1.70 | 12/1/08 | 51,290,000 | 51,290,000 | ||||
| Warren County, Revenue (WKU Student Life | ||||||||
| Foundation, Inc. Project) (LOC; JPMorgan Chase Bank) | 1.85 | 9/7/08 | 10,000,000 b | 10,000,000 | ||||
| Louisiana—.6% | ||||||||
| Plaquemines Port Harbor and Terminal District, | ||||||||
| Port Facilities Revenue, Refunding (International | ||||||||
| Marine Terminals Project) (LOC; KBC Bank) | 2.20 | 3/15/09 | 10,000,000 | 10,000,000 | ||||
| Maine—.5% | ||||||||
| Cumberland County, GO, TAN | 3.00 | 11/10/08 | 7,500,000 | 7,510,542 | ||||
| Maryland—3.4% | ||||||||
| Maryland Health and Higher Educational Facilities Authority, | ||||||||
| Revenue (The Johns Hopkins University Issue) | 1.65 | 9/7/08 | 14,765,000 b | 14,765,000 | ||||
| Maryland Health and Higher Educational Facilities | ||||||||
| Authority, Revenue (University of Maryland | ||||||||
| Medical System Issue) (LOC; Bank of America) | 1.85 | 9/7/08 | 31,495,000 b | 31,495,000 | ||||
| Montgomery County, GO, Refunding | ||||||||
| (Consolidated Public Improvement) | 2.75 | 1/1/09 | 9,935,000 | 9,959,326 | ||||
| Massachusetts—1.9% | ||||||||
| Massachusetts, CP (LOC; JPMorgan Chase Bank) | 1.62 | 11/3/08 | 22,500,000 | 22,500,000 | ||||
| Massachusetts Development Finance Agency, Revenue | ||||||||
| (Lasell College Issue) (LOC; Citizens Bank of Massachusetts) | 1.84 | 9/7/08 | 1,000,000 b | 1,000,000 | ||||
12
| BNY Mellon National Municipal Money Market Fund (continued) | ||||||||
| Coupon | Maturity | Principal | ||||||
| Short-Term Investments (continued) | Rate (%) | Date | Amount ($) | Value ($) | ||||
| Massachusetts (continued) | ||||||||
| Massachusetts Development Finance Agency, Revenue | ||||||||
| (Worcester Polytechnic Institute) (LOC; TD Banknorth NA) | 1.80 | 9/7/08 | 7,800,000 b | 7,800,000 | ||||
| Michigan—3.8% | ||||||||
| Eastern Michigan University Board of Regents, General Revenue, | ||||||||
| Refunding (LOC; Dexia Credit Locale) | 1.85 | 9/7/08 | 8,000,000 b | 8,000,000 | ||||
| L’anse Creuse Public Schools, School Building | ||||||||
| and Site Bonds (GO-Unlimited Tax) (Insured; | ||||||||
| FSA and Liquidity Facility; JPMorgan Chase Bank) | 2.03 | 9/7/08 | 15,000,000 b | 15,000,000 | ||||
| Michigan Building Authority, Multi-Modal Revenue | ||||||||
| (Facilities Program) (LOC; JPMorgan Chase Bank) | 1.82 | 9/7/08 | 18,500,000 b | 18,500,000 | ||||
| Michigan Hospital Finance Authority, Revenue, Refunding | ||||||||
| (McLaren Health Care) (LOC; JPMorgan Chase Bank) | 1.80 | 9/7/08 | 2,700,000 b | 2,700,000 | ||||
| Michigan Public Educational Facilities Authority, LOR | ||||||||
| (Michigan Technical Academy Project) (LOC; Fifth Third Bank) | 1.86 | 9/7/08 | 3,885,000 b | 3,885,000 | ||||
| Michigan Strategic Fund, LOR, Refunding (The Detroit Edison | ||||||||
| Company Exempt Facilities Project) (LOC; Bank of Nova Scotia) | 1.85 | 9/7/08 | 14,400,000 b | 14,400,000 | ||||
| Minnesota—1.5% | ||||||||
| Rochester, Health Care Facilities Revenue (Mayo Clinic) | 1.68 | 5/7/09 | 8,000,000 | 8,000,000 | ||||
| Rochester, Health Care Facilities Revenue | ||||||||
| (Mayo Clinic) (Liquidity Facility; Wells Fargo Bank) | 1.90 | 9/7/08 | 16,000,000 b | 16,000,000 | ||||
| Mississippi—1.2% | ||||||||
| Mississippi Business Finance Corporation, Health Care Facilities | ||||||||
| Revenue (Rush Medical Foundation Project) (LOC; Regions Bank) | 1.88 | 9/7/08 | 19,400,000 b | 19,400,000 | ||||
| Nevada—.9% | ||||||||
| Clark County, Airport System Subordinate | ||||||||
| Lien Revenue (LOC; Bayerische Landesbank) | 1.80 | 9/7/08 | 8,065,000 b | 8,065,000 | ||||
| Clark County, Airport System Subordinate Lien | ||||||||
| Revenue (LOC; Landesbank Baden-Wurttemberg) | 1.80 | 9/7/08 | 6,500,000 b | 6,500,000 | ||||
| New Hampshire—1.6% | ||||||||
| New Hampshire Health and Educational Facilities Authority, | ||||||||
| Revenue (Saint Anselm College Issue) (LOC; RBS Citizen’s NA) | 2.45 | 9/1/08 | 14,100,000 b | 14,100,000 | ||||
| New Hampshire Housing Finance Authority, MFHR, Refunding | ||||||||
| (EQR-Bond Partnership— Manchester Project) (LOC; FNMA) | 1.95 | 9/7/08 | 12,700,000 b | 12,700,000 | ||||
| New Jersey—1.2% | ||||||||
| New Jersey Health Care Facilities Financing Authority, Revenue | ||||||||
| (Somerset Medical Center Issue) (LOC; TD Banknorth NA) | 1.79 | 9/7/08 | 3,400,000 b | 3,400,000 | ||||
| New Jersey Transportation Trust Fund Authority (Transportation | ||||||||
| System) (Insured; AMBAC and Liquidity Facility; Citibank NA) | 1.85 | 9/7/08 | 15,500,000 b,c | 15,500,000 | ||||
| New York—3.3% | ||||||||
| New York City (LOC; BNP Paribas) | 1.67 | 9/7/08 | 22,000,000 b | 22,000,000 | ||||
| New York City Industrial Devlopment Agency, Civic Facility | ||||||||
| Revenue (New York University Project) (Insured; Berkshire | ||||||||
| Hathaway Assurance Corporation and Liquidity Facility; Citibank NA) | 1.86 | 9/7/08 | 2,600,000 b,c | 2,600,000 | ||||
| The Funds 13 |
| STATEMENT OF INVESTMENTS (Unaudited) (continued) |
| BNY Mellon National Municipal Money Market Fund (continued) | ||||||||
| Coupon | Maturity | Principal | ||||||
| Short-Term Investments (continued) | Rate (%) | Date | Amount ($) | Value ($) | ||||
| New York (continued) | ||||||||
| New York City Municipal Water Finance Authority, Water | ||||||||
| and Sewer Revenue (Insured; Berkshire Hathaway | ||||||||
| Assurance Corporation and Liquidity Facility; Citibank NA) | 1.87 | 9/7/08 | 1,765,000 b,c | 1,765,000 | ||||
| New York City Transitional Finance Authority, Future Tax | ||||||||
| Secured Revenue (Liquidity Facility; Westdeutsche Landesbank) | 1.83 | 9/7/08 | 21,300,000 b | 21,300,000 | ||||
| New York State Dormitory Authority, Revenue | ||||||||
| (Fordham University) (Insured; Berkshire Hathaway | ||||||||
| Assurance Corporation and Liquidity Facility; Citibank NA) | 1.86 | 9/7/08 | 2,900,000 b,c | 2,900,000 | ||||
| New York State Dormitory Authority, Revenue | ||||||||
| (The College of New Rochelle) (LOC; RBS Citizen’s NA) | 1.78 | 9/7/08 | 4,000,000 b | 4,000,000 | ||||
| North Carolina—3.0% | ||||||||
| Charlotte-Mecklenburg Hospital Authority, Health Care | ||||||||
| Revenue (Carolinas HealthCare System) (Insured; FSA) | 2.00 | 9/7/08 | 15,645,000 b | 15,645,000 | ||||
| Charlotte-Mecklenburg Hospital Authority, Health Care | ||||||||
| Revenue (Carolinas HealthCare System) (Insured; FSA) | 2.18 | 9/7/08 | 13,700,000 b | 13,700,000 | ||||
| New Hanover County, HR, Refunding (New Hanover Regional | ||||||||
| Medical Center) (Insured; FSA and Liquidity Facility; Wachovia Bank) | 2.15 | 9/7/08 | 19,100,000 b | 19,100,000 | ||||
| Ohio—5.4% | ||||||||
| Butler County, Healthcare Facilities Improvement Revenue, | ||||||||
| Refunding (Lifesphere Project) (LOC; U.S. Bank NA) | 1.75 | 9/7/08 | 3,500,000 b | 3,500,000 | ||||
| Cleveland-Cuyahoga County Port Authority, Cultural | ||||||||
| Facility Revenue (Cleveland Museum of Art Project) | ||||||||
| (Liquidity Facility; JPMorgan Chase Bank) | 1.87 | 9/7/08 | 20,000,000 b | 20,000,000 | ||||
| Lucas County, HR (ProMedica Healthcare | ||||||||
| Obligated Group) (LOC; UBS AG) | 1.90 | 9/7/08 | 7,800,000 b | 7,800,000 | ||||
| Lucas County, HR (ProMedica Healthcare | ||||||||
| Obligated Group) (LOC; UBS AG) | 1.90 | 9/7/08 | 5,100,000 b | 5,100,000 | ||||
| Ohio, HR (University Hospitals Health System, Inc.) | ||||||||
| (LOC; Royal Bank of Scotland) | 1.77 | 9/7/08 | 5,800,000 b | 5,800,000 | ||||
| Ohio Higher Educational Facility, Revenue, Refunding (Case | ||||||||
| Western Reserve University Project) (LOC; Allied Irish Banks) | 1.75 | 9/7/08 | 6,000,000 b | 6,000,000 | ||||
| University of Akron, General Receipts Bonds, Refunding (Insured; | ||||||||
| Assured Guaranty and Liquidity Facility; Dexia Credit Locale) | 2.25 | 9/7/08 | 25,000,000 b | 25,000,000 | ||||
| University of Cincinnati, General Receipts | ||||||||
| Bonds (LOC; Bayerische Landesbank) | 1.87 | 9/7/08 | 5,000,000 b | 5,000,000 | ||||
| Warren County, Health Care Facilities Improvement | ||||||||
| Revenue (Otterbein Homes Project) (LOC; U.S. Bank NA) | 1.75 | 9/7/08 | 10,000,000 b | 10,000,000 | ||||
| Oklahoma—1.5% | ||||||||
| Oklahoma Development Finance Authority, Revenue, Refunding | ||||||||
| (INTEGRIS Baptist Medical Center, Inc., INTEGRIS South Oklahoma | ||||||||
| City Hospital Corporation and INTEGRIS Rural Health, Inc) | ||||||||
| (Insured; Assured Guaranty and Liquidity Facility; KBC Bank) | 1.90 | 9/7/08 | 24,360,000 b | 24,360,000 | ||||
| Oregon—1.4% | ||||||||
| Yamhill County Hospital Authority, Revenue, Refunding | ||||||||
| (Friendsview Retirement Community—Oregon) (LOC; U.S. Bank NA) | 2.45 | 9/1/08 | 23,620,000 b | 23,620,000 | ||||
14
| BNY Mellon National Municipal Money Market Fund (continued) | ||||||||
| Coupon | Maturity | Principal | ||||||
| Short-Term Investments (continued) | Rate (%) | Date | Amount ($) | Value ($) | ||||
| Pennsylvania—7.4% | ||||||||
| Beaver County Industrial Development Authority, PCR, | ||||||||
| Refunding (FirstEnergy Nuclear Generation | ||||||||
| Corporation Project) (LOC; Bank of Nova Scotia) | 1.75 | 9/7/08 | 30,000,000 b | 30,000,000 | ||||
| Bucks County Industrial Development Authority, Revenue | ||||||||
| (SHV Real Estate Inc.) (LOC; ABN-AMRO) | 1.78 | 9/7/08 | 2,000,000 b | 2,000,000 | ||||
| Butler County General Authority, Revenue, Refunding | ||||||||
| (South Butler County School District, GO Refunding Project) | ||||||||
| (Insured; FSA and Liquidity Facility; Dexia Credit Locale) | 2.08 | 9/7/08 | 13,380,000 b | 13,380,000 | ||||
| Delaware Valley Regional Finance Authority, Local | ||||||||
| Government Revenue (LOC; Bayerische Landesbank) | 1.75 | 9/7/08 | 15,500,000 b | 15,500,000 | ||||
| Lancaster County, GO (Insured; FSA and | ||||||||
| Liquidity Facility; Royal Bank of Canada) | 2.04 | 9/7/08 | 22,000,000 b | 22,000,000 | ||||
| Parkland School District, GO (Insured; FSA | ||||||||
| and Liquidity Facility; Royal Bank of Canada) | 2.04 | 9/7/08 | 9,245,000 b | 9,245,000 | ||||
| Pennsylvania Higher Educational Facilities Authority, Revenue | ||||||||
| (Saint Joseph’s University) (LOC; Royal Bank of Scotland) | 1.90 | 9/7/08 | 11,400,000 b | 11,400,000 | ||||
| Quakertown General Authority, Revenue, Refunding | ||||||||
| (The Trustees of the University of Pennsylvania Project) | 1.65 | 3/5/09 | 17,700,000 | 17,700,000 | ||||
| Rhode Island—1.3% | ||||||||
| Narragansett Bay Commission, Wastewater System | ||||||||
| Revenue, Refunding (LOC; Royal Bank of Scotland) | 1.75 | 9/7/08 | 13,840,000 b | 13,840,000 | ||||
| Rhode Island Economic Development Corporation, Revenue | ||||||||
| (Rhode Island Philharmonic Orchestra Issue) (LOC; Citizens Bank NA) | 1.87 | 9/7/08 | 7,000,000 b | 7,000,000 | ||||
| Tennessee—.4% | ||||||||
| Metropolitan Nashville Airport Authority, Airport | ||||||||
| Improvement Revenue, Refunding (LOC; Societe Generale) | 1.85 | 9/7/08 | 5,900,000 b | 5,900,000 | ||||
| Texas—7.8% | ||||||||
| Austin, Water and Wastewater System Revenue, | ||||||||
| Refunding (LOC; Dexia Credit Locale) | 1.80 | 9/7/08 | 15,500,000 b | 15,500,000 | ||||
| DFA Municipal Trust (North Texas Tollway Authority, | ||||||||
| Dallas North Tollway System, Revenue) (LOC; DEPFA Bank PLC) | 2.14 | 9/7/08 | 15,000,000 b,c | 15,000,000 | ||||
| Harris County Flood Control District, CP (LOC; | ||||||||
| Landesbank Hessen-Thuringen Girozentrale) | 1.65 | 11/3/08 | 1,000,000 | 1,000,000 | ||||
| Harris County Flood Control District, CP (LOC; | ||||||||
| Landesbank Hessen-Thuringen Girozentrale) | 1.60 | 11/13/08 | 2,200,000 | 2,200,000 | ||||
| Harris County Flood Control District, CP (LOC; | ||||||||
| Landesbank Hessen-Thuringen Girozentrale) | 1.85 | 11/13/08 | 18,605,000 | 18,605,000 | ||||
| North Texas Tollway Authority, Revenue (Insured; | ||||||||
| MBIA, Inc. and Liquidity Facility; Citigroup) | 1.87 | 9/7/08 | 9,435,000 b,c | 9,435,000 | ||||
| Richardson Independent School District, Unlimited Tax | ||||||||
| School Building Bonds (Liquidity Facility; DEPFA Bank | ||||||||
| PLC and LOC; Permanent School Fund Guarantee Program) | 2.10 | 9/7/08 | 20,300,000 b | 20,300,000 | ||||
| Texas A&M University, Revenue, CP | 1.68 | 11/3/08 | 11,000,000 | 11,000,000 | ||||
| Travis County Health Facilities Development Corporation, Retirement | ||||||||
| Facilities Revenue (Longhorn Village Project) (LOC; Bank of Scotland) | 1.83 | 9/7/08 | 34,600,000 b | 34,600,000 | ||||
The Funds 15
| STATEMENT OF INVESTMENTS (Unaudited) (continued) |
| BNY Mellon National Municipal Money Market Fund (continued) | ||||||||
| Coupon | Maturity | Principal | ||||||
| Short-Term Investments (continued) | Rate (%) | Date | Amount ($) | Value ($) | ||||
| Vermont—.7% | ||||||||
| Vermont Housing Finance Agency, Student Housing | ||||||||
| Facilities Revenue (West Block University of | ||||||||
| Vermont Apartments Project) (LOC; Bank of Nova Scotia) | 1.85 | 9/7/08 | 12,075,000 b | 12,075,000 | ||||
| Washington—2.8% | ||||||||
| Seattle, Water System Revenue (Insured; Berkshire Hathaway | ||||||||
| Assurance Corporation and Liquidity Facility; Citigroup) | 1.87 | 9/7/08 | 3,900,000 b | 3,900,000 | ||||
| Seattle Housing Authority, Low Income Housing Assistance | ||||||||
| Revenue (Foss Home Project) (LOC; Wells Fargo Bank) | 1.82 | 9/7/08 | 3,805,000 b | 3,805,000 | ||||
| Tulalip Tribes of the Tulalip Reservation, Revenue, | ||||||||
| Refunding (Capital Projects) (LOC; Wells Fargo Bank) | 1.92 | 9/7/08 | 3,800,000 b | 3,800,000 | ||||
| Washington Housing Finance Commission, Nonprofit Revenue | ||||||||
| (Saint Thomas School Project) (LOC; Bank of America) | 1.82 | 9/7/08 | 15,695,000 b | 15,695,000 | ||||
| Washington Public Power Supply System, Electric Revenue, | ||||||||
| Refunding (Project Number 1 and 3) (LOC; Bank of America) | 1.82 | 9/7/08 | 19,105,000 b | 19,105,000 | ||||
| Wisconsin—2.0% | ||||||||
| Milwaukee, School RAN | 3.00 | 9/3/09 | 25,000,000 d | 25,345,000 | ||||
| Wisconsin Health and Educational Facilities Authority, | ||||||||
| Revenue (Gundersen Lutheran) (LOC; Wells Fargo Bank) | 1.79 | 9/7/08 | 6,900,000 b | 6,900,000 | ||||
| Wyoming—.1% | ||||||||
| Sweetwater County, PCR, Refunding | ||||||||
| (Pacificorp Projects) (LOC; Barclays Bank PLC) | 2.55 | 9/1/08 | 2,000,000 b | 2,000,000 | ||||
| Total Investments (cost $1,654,555,763) | 101.5% | 1,654,555,763 | ||||||
| Liabilities, Less Cash and Receivables | (1.5%) | (24,623,298) | ||||||
| Net Assets | 100.0% | 1,629,932,465 | ||||||
| a | This security is prerefunded; the date shown represents the prerefunded date. Bonds which are prerefunded are collateralized by U.S. Government securities which are held in escrow and are used to pay principal and interest on the municipal issue and to retire the bonds in full at the earliest refunding date. |
| b | Variable rate demand note—rate shown is the interest rate in effect at August 31, 2008. Maturity date represents the next demand date or the ultimate maturity date if earlier. |
| c | Securities exempt from registration under Rule 144A of the Securities Act of 1933.These securities may be resold in transactions exempt from registration, normally to qualified institutional buyers. At August 31, 2008, these securities amounted to $121,255,000 or 7.4% of net assets. |
| d | Purchased on a delayed delivery basis. |
16
| Summary of Abbreviations | ||||||||||||
| ABAG | Association of Bay Area Governments | ACA | American Capital Access | |||||||||
| AGC | ACE Guaranty Corporation | AGIC | Asset Guaranty Insurance Company | |||||||||
| AMBAC | American Municipal Bond Assurance Corporation | ARRN | Adjustable Rate Receipt Notes | |||||||||
| BAN | Bond Anticipation Notes | BIGI | Bond Investors Guaranty Insurance | |||||||||
| BPA | Bond Purchase Agreement | CGIC | Capital Guaranty Insurance Company | |||||||||
| CIC | Continental Insurance Company | CIFG | CDC Ixis Financial Guaranty | |||||||||
| CMAC | Capital Market Assurance Corporation | COP | Certificate of Participation | |||||||||
| CP | Commercial Paper | EDR | Economic Development Revenue | |||||||||
| EIR | Environmental Improvement Revenue | FGIC | Financial Guaranty Insurance Company | |||||||||
| FHA | Federal Housing Administration | FHLB | Federal Home Loan Bank | |||||||||
| FHLMC | Federal Home Loan Mortgage Corporation | FNMA | Federal National Mortgage Association | |||||||||
| FSA | Financial Security Assurance | GAN | Grant Anticipation Notes | |||||||||
| GIC | Guaranteed Investment Contract | GNMA | Government National Mortgage Association | |||||||||
| GO | General Obligation | HR | Hospital Revenue | |||||||||
| IDB | Industrial Development Board | IDC | Industrial Development Corporation | |||||||||
| IDR | Industrial Development Revenue | LOC | Letter of Credit | |||||||||
| LOR | Limited Obligation Revenue | LR | Lease Revenue | |||||||||
| MFHR | Multi-Family Housing Revenue | MFMR | Multi-Family Mortgage Revenue | |||||||||
| PCR | Pollution Control Revenue | PILOT | Payment in Lieu of Taxes | |||||||||
| RAC | Revenue Anticipation Certificates | RAN | Revenue Anticipation Notes | |||||||||
| RAW | Revenue Anticipation Warrants | RRR | Resources Recovery Revenue | |||||||||
| SAAN | State Aid Anticipation Notes | SBPA | Standby Bond Purchase Agreement | |||||||||
| SFHR | Single Family Housing Revenue | SFMR | Single Family Mortgage Revenue | |||||||||
| SONYMA | State of New York Mortgage Agency | SWDR | Solid Waste Disposal Revenue | |||||||||
| TAN | Tax Anticipation Notes | TAW | Tax Anticipation Warrants | |||||||||
| TRAN | Tax and Revenue Anticipation Notes | XLCA | XL Capital Assurance | |||||||||
| Summary of Combined Ratings (Unaudited) | ||||||||||||
| Fitch | or | Moody’s | or | Standard & Poor’s | Value (%)† | |||||||
| F1+,F1 | VMIG1,MIG1,P1 | SP1+,SP1,A1+,A1 | 94.2 | |||||||||
| AAA,AA,A e | Aaa,Aa,A e | AAA,AA,A e | 5.3 | |||||||||
| Not Rated f | Not Rated f | Not Rated f | .5 | |||||||||
| 100.0 | ||||||||||||
| † Based on total investments. | ||||||||||||
e Notes which are not F, MIG and SP rated are represented by bond ratings of the issuers. f Securities which, while not rated by Fitch, Moody’s and Standard & Poor’s, have been determined by the Manager to be of comparable quality to those rated securities in which the fund may invest.
See notes to financial statements.
The Funds 17
| STATEMENTS OF ASSETS AND LIABILITIES August 31, 2008 |
| BNY Mellon | BNY Mellon | |||
| Money Market | National Municipal | |||
| Fund | Money Market Fund | |||
| Assets ($): | ||||
| Investments in securities—See Statement of Investments+ | 1,174,643,023 | 1,654,555,763 | ||
| Interest receivable | 4,820,411 | 4,261,121 | ||
| Receivable for investment securities sold | — | 3,710,759 | ||
| Prepaid expenses | 10,818 | 12,118 | ||
| 1,179,474,252 | 1,662,539,761 | |||
| Liabilities ($): | ||||
| Due to The Dreyfus Corporation and affiliates—Note 4(b) | 168,602 | 118,422 | ||
| Due to Administrator—Note 4(a) | 129,386 | 182,135 | ||
| Cash overdraft due to Custodian | 1,663,568 | 6,903,397 | ||
| Payable for investment securities purchased | — | 25,345,000 | ||
| Payable for shares of Beneficial Interest redeemed | 137 | — | ||
| Accrued expenses | 59,071 | 58,342 | ||
| 2,020,764 | 32,607,296 | |||
| Net Assets ($) | 1,177,453,488 | 1,629,932,465 | ||
| Composition of Net Assets ($): | ||||
| Paid-in capital | 1,177,426,539 | 1,630,983,715 | ||
| Accumulated net realized gain (loss) on investments | 26,949 | (1,051,250) | ||
| Net Assets ($) | 1,177,453,488 | 1,629,932,465 | ||
| Net Asset Value Per Share | ||||
| Class M Shares | ||||
| Net Assets ($) | 1,175,865,552 | 1,629,931,364 | ||
| Shares Outstanding | 1,175,838,639 | 1,630,983,527 | ||
| Net Asset Value Per Share ($) | 1.00 | 1.00 | ||
| Investor Shares | ||||
| Net Assets ($) | 1,587,936 | 1,101 | ||
| Shares Outstanding | 1,587,900 | 1,102 | ||
| Net Asset Value Per Share ($) | 1.00 | 1.00 | ||
| † Investments at cost ($) | 1,174,643,023 | 1,654,555,763 | ||
| See notes to financial statements. |
18
| STATEMENTS OF OPERATIONS Year Ended August 31, 2008 |
| BNY Mellon | BNY Mellon | |||
| Money Market | National Municipal | |||
| Fund | Money Market Fund | |||
| Investment Income ($): | ||||
| Interest Income | 42,082,032 | 35,485,911 | ||
| Expenses: | ||||
| Investment advisory fee—Note 4(a) | 1,651,080 | 2,107,923 | ||
| Administration fee—Note 4(a) | 1,404,284 | 1,792,995 | ||
| Custodian fees—Note 4(b) | 78,866 | 214,894 | ||
| Trustees’ fees and expenses—Note 4(c) | 40,993 | 51,148 | ||
| Registration fees | 38,793 | 52,824 | ||
| Professional fees | 38,426 | 37,105 | ||
| Prospectus and shareholders’ reports | 4,024 | 3,249 | ||
| Shareholder servicing costs—Note 4(b) | 3,496 | 63 | ||
| Miscellaneous | 22,174 | 35,395 | ||
| Total Expenses | 3,282,136 | 4,295,596 | ||
| Less—expense reduction in fees | ||||
| due to earnings credits—Note 2(b) | (25,265) | (298,659) | ||
| Net Expenses | 3,256,871 | 3,996,937 | ||
| Investment Income—Net | 38,825,161 | 31,488,974 | ||
| Net Realized Gain (Loss) on Investments—Note 2(b) ($) | 27,996 | (1,051,250) | ||
| Net Increase in Net Assets Resulting from Operations | 38,853,157 | 30,437,724 | ||
| See notes to financial statements. |
The Funds 19
| STATEMENTS OF CHANGES IN NET ASSETS |
| BNY Mellon National Municipal | ||||||||
| BNY Mellon Money Market Fund | Money Market Fund | |||||||
| Year Ended August 31, | Year Ended August 31, | |||||||
| 2008 | 2007 | 2008 | 2007 | |||||
| Operations ($): | ||||||||
| Investment income—net | 38,825,161 | 40,669,866 | 31,488,974 | 31,063,584 | ||||
| Net realized gain (loss) from investments | 27,996 | — | (1,051,250) | 10,881 | ||||
| Net Increase (Decrease) in Net Assets | ||||||||
| Resulting from Operations | 38,853,157 | 40,669,886 | 30,437,724 | 31,074,465 | ||||
| Dividends to Shareholders from ($): | ||||||||
| Investment income—net: | ||||||||
| Class M Shares | (38,779,281) | (40,620,276) | (31,494,944) | (31,060,143) | ||||
| Investor Shares | (45,880) | (49,610) | (23) | (3,441) | ||||
| Total Dividends | (38,825,161) | (40,669,886) | (31,494,967) | (31,063,584) | ||||
| Beneficial Interest Transactions ($1.00 per share): | ||||||||
| Net proceeds from shares sold: | ||||||||
| Class M Shares | 2,209,831,039 | 1,629,857,060 | 3,276,852,332 | 2,013,809,020 | ||||
| Investor Shares | 701,877 | 768,283 | — | 802,269 | ||||
| Dividends reinvested: | ||||||||
| Class M Shares | 343 | 5 | 749 | 3 | ||||
| Investor Shares | 45,876 | 49,602 | 23 | 2,907 | ||||
| Cost of shares redeemed: | ||||||||
| Class M Shares | (1,877,235,783) | (1,541,341,988) | (2,586,121,590) | (1,808,087,468) | ||||
| Investor Shares | (513,869) | (353,581) | — | (805,143) | ||||
| Increase (Decrease) in Net Assets from | ||||||||
| Beneficial Interest Transactions | 332,829,483 | 88,979,381 | 690,731,514 | 205,721,588 | ||||
| Total Increase (Decrease) In Net Assets | 332,857,479 | 88,979,381 | 689,674,271 | 205,732,469 | ||||
| Net Assets ($): | ||||||||
| Beginning of Period | 844,596,009 | 755,616,628 | 940,258,194 | 734,525,725 | ||||
| End of Period | 1,177,453,488 | 844,596,009 | 1,629,932,465 | 940,258,194 | ||||
| See notes to financial statements. | ||||||||
20
FINANCIAL HIGHLIGHTS
The following tables describe the performance for each share class of each BNY Mellon money market fund for the fiscal periods indicated.All information reflects financial results for a single fund share.Total return shows how much your investment in the fund would have increased (or decreased) during each period, assuming you had reinvested all dividends and distributions.These figures have been derived from the fund’s financial statements.
| Class M Shares | ||||||||||
| Year Ended August 31, | ||||||||||
| BNY Mellon Money Market Fund | 2008 | 2007 | 2006 | 2005 | 2004 | |||||
| Per Share Data ($): | ||||||||||
| Net asset value, beginning of period | 1.00 | 1.00 | 1.00 | 1.00 | 1.00 | |||||
| Investment Operations: | ||||||||||
| Investment income—net | .037 | .050 | .043 | .023 | .008 | |||||
| Distributions: | ||||||||||
| Dividends from investment income—net | (.037) | (.050) | (.043) | (.023) | (.008) | |||||
| Net asset value, end of period | 1.00 | 1.00 | 1.00 | 1.00 | 1.00 | |||||
| Total Return (%) | 3.72 | 5.16 | 4.35 | 2.30 | .82 | |||||
| Ratios/Supplemental Data (%): | ||||||||||
| Ratio of total expenses to average net assets | .30 | .30 | .31 | .31 | .33 | |||||
| Ratio of net expenses to average net assets | .30a | .30a | .31 | .31 | .33 | |||||
| Ratio of net investment income | ||||||||||
| to average net assets | 3.53 | 5.04 | 4.29 | 2.36 | .82 | |||||
| Net Assets, end of period ($ x 1,000) | 1,175,866 | 843,242 | 754,727 | 678,569 | 471,723 | |||||
| a Expense waivers and/or reimbursements amounted to less than .01%. | ||||||||||
| See notes to financial statements. | ||||||||||
The Funds 21
| FINANCIAL HIGHLIGHTS (continued) |
| Investor Shares | ||||||||||
| Year Ended August 31, | ||||||||||
| BNY Mellon Money Market Fund | 2008 | 2007 | 2006 | 2005 | 2004 | |||||
| Per Share Data ($): | ||||||||||
| Net asset value, beginning of period | 1.00 | 1.00 | 1.00 | 1.00 | 1.00 | |||||
| Investment Operations: | ||||||||||
| Investment income—net | .034 | .048 | .040 | .020 | .006 | |||||
| Distributions: | ||||||||||
| Dividends from investment income—net | (.034) | (.048) | (.040) | (.020) | (.006) | |||||
| Net asset value, end of period | 1.00 | 1.00 | 1.00 | 1.00 | 1.00 | |||||
| Total Return (%) | 3.47 | 4.89 | 4.09 | 2.05 | .57 | |||||
| Ratios/Supplemental Data (%): | ||||||||||
| Ratio of total expenses to average net assets | .55 | .55 | .56 | .57 | .64 | |||||
| Ratio of net expenses to average net assets | .55a | .55a | .56 | .57 | .64 | |||||
| Ratio of net investment income | ||||||||||
| to average net assets | 3.39 | 4.80 | 4.09 | 2.20 | .79 | |||||
| Net Assets, end of period ($ x 1,000) | 1,588 | 1,354 | 890 | 640 | 213 | |||||
| a Expense waivers and/or reimbursements amounted to less than .01%. | ||||||||||
| See notes to financial statements. | ||||||||||
22
| Class M Shares | ||||||||||
| Year Ended August 31, | ||||||||||
| BNY Mellon National Municipal Money Market Fund | 2008 | 2007 | 2006 | 2005 | 2004 | |||||
| Per Share Data ($): | ||||||||||
| Net asset value, beginning of period | 1.00 | 1.00 | 1.00 | 1.00 | 1.00 | |||||
| Investment Operations: | ||||||||||
| Investment income—net | .024 | .033 | .028 | .017 | .007 | |||||
| Distributions: | ||||||||||
| Dividends from investment income—net | (.024) | (.033) | (.028) | (.017) | (.007) | |||||
| Net asset value, end of period | 1.00 | 1.00 | 1.00 | 1.00 | 1.00 | |||||
| Total Return (%) | 2.39 | 3.40 | 2.88 | 1.68 | .70 | |||||
| Ratios/Supplemental Data (%): | ||||||||||
| Ratio of total expenses to average net assets | .31 | .30 | .32 | .32 | .33 | |||||
| Ratio of net expenses to average net assets | .28 | .30a | .31 | .32a | .33 | |||||
| Ratio of net investment income | ||||||||||
| to average net assets | 2.24 | 3.35 | 2.86 | 1.68 | .71 | |||||
| Net Assets, end of period ($ x 1,000) | 1,629,931 | 940,257 | 734,525 | 613,375 | 488,926 | |||||
| a Expense waivers and/or reimbursements amounted to less than .01%. | ||||||||||
| See notes to financial statements. | ||||||||||
The Funds 23
| FINANCIAL HIGHLIGHTS (continued) |
| Investor Shares | ||||||||||
| Year Ended August 31, | ||||||||||
| BNY Mellon National Municipal Money Market Fund | 2008 | 2007 | 2006 | 2005 | 2004 | |||||
| Per Share Data ($): | ||||||||||
| Net asset value, beginning of period | 1.00 | 1.00 | 1.00 | 1.00 | 1.00 | |||||
| Investment Operations: | ||||||||||
| Investment income—net | .021 | .031 | .026 | .014 | .005 | |||||
| Distributions: | ||||||||||
| Dividends from investment income—net | (.021) | (.031) | (.026) | (.014) | (.005) | |||||
| Net asset value, end of period | 1.00 | 1.00 | 1.00 | 1.00 | 1.00 | |||||
| Total Return (%) | 2.13 | 3.15 | 2.62 | 1.43 | .45 | |||||
| Ratios/Supplemental Data (%): | ||||||||||
| Ratio of total expenses to average net assets | .56 | .56 | .57 | .58 | .60 | |||||
| Ratio of net expenses to average net assets | .53 | .55 | .57 | .57 | .60 | |||||
| Ratio of net investment income | ||||||||||
| to average net assets | 2.05 | 3.16 | 2.60 | 1.38 | .58 | |||||
| Net Assets, end of period ($ x 1,000) | 1 | 1 | 1 | 1 | 1 | |||||
| See notes to financial statements. | ||||||||||
24
NOTES TO FINANCIAL STATEMENTS
NOTE 1—General:
BNY Mellon Funds Trust (the “Trust”) was organized as a Massachusetts business trust which is registered under the Investment Company Act of 1940, as amended (the “Act”), as an open-end management investment company and operates as a series company currently comprised of twenty series, effective as of the close of business on September 12, 2008, including the following diversified money market funds: BNY Mellon Money Market Fund and BNY Mellon National Municipal Money Market Fund (each, a “fund” and collectively, the “funds”). Effective March 31,2008,theTrust changed its name from “Mellon Funds Trust” to “BNY Mellon Funds Trust” and each fund added “BNY” to the beginning of its name. BNY Mellon Money Market Fund’s investment objective is to provide investors with as high a level of current income as is consistent with the preservation of capital and the maintenance of liquidity. BNY Mellon National Municipal Money Market Fund’s investment objective is to provide investors with as high a level of current income exempt from federal income tax as is consistent with the preservation of capital and the maintenance of liquidity.
BNY Mellon Fund Advisers, a division of The Dreyfus Corporation (the“Manager”or“Dreyfus),a wholly-owned subsidiary of The Bank of NewYork Mellon Corporation (“BNY Mellon”), serves as each fund’s investment adviser (“Investment Adviser”).The Bank of New York Mellon, a subsidiary of BNY Mellon and an affiliate of Dreyfus,serves as administrator for the funds pursuant to an Administration Agreement with the Trust (the “Administration Agreement”).The Bank of New York Mellon has entered into a Sub-Administration Agreement with Dreyfus pursuant to which The Bank of New York Mellon pays Dreyfus for performing certain administrative services. MBSC Securities Corporation (the “Distributor”), a wholly-owned subsidiary of Dreyfus, is the distributor of each fund’s shares, which are sold without a sales charge.
Effective July 1, 2008, BNY Mellon has reorganized and consolidated a number of its banking and trust company subsidiaries.As a result of the reorganization, any services previously provided to the funds by Mellon Bank, N.A.
or Mellon Trust of New England, N.A. are now provided by The Bank of New York, which has changed its name to The Bank of New York Mellon.
The Trust is authorized to issue an unlimited number of shares of beneficial interest, par value $.001 per share, in each of the Class M and Investor class shares of each fund. Each class of shares has similar rights and privileges, except with respect to the expenses borne by and the shareholder services offered to each class and the shareholder services plan applicable to the Investor shares, the allocation of certain transfer agency costs, and certain voting rights. Income, expenses (other than expenses attributable to a specific class), and realized gains or losses on investments are allocated to each Class of shares based on its relative net assets.
TheTrust accounts separately for the assets, liabilities and operations of each series. Expenses directly attributable to each series are charged to that series’ operations; expenses that are applicable to all series are allocated among them on a pro rata basis.
The fund’s financial statements are prepared in accordance with U.S. generally accepted accounting principles, which may require the use of management estimates and assump-tions.Actual results could differ from those estimates.
NOTE 2—Significant Accounting Policies:
(a) Portfolio valuation: Investments in securities are valued at amortized cost in accordance with Rule 2a-7 of the Act, which has been determined by the Trust’s Board to represent the fair value of the fund’s investments.
It is the funds’ policy to maintain a continuous net asset value per share of $1.00; the fund has adopted certain investment, portfolio valuation and dividend and distribution policies to enable it to do so. There is no assurance, however, that the fund will be able to maintain a stable net asset value per share of $1.00.
Financial Accounting Standards Board (“FASB”) released Statement of Financial Accounting Standards No. 157 “FairValue Measurements” (“FAS 157”). FAS 157 establishes an authoritative definition of fair value, sets out a
The Funds 25
NOTES TO FINANCIAL STATEMENTS (continued)
framework for measuring fair value, and requires additional disclosures about fair-value measurements. The application of FAS 157 is required for fiscal years beginning after November 15, 2007 and interim periods within those fiscal years. Management does not believe that the application of this standard will have a material impact on the financial statements of the funds.
(b) Securities transactions and investment income:
Securities transactions are recorded on a trade date basis. Interest income, adjusted for accretion of discount and amortization of premium on investments, is earned from settlement date and recognized on the accrual basis. Realized gains and losses from securities transactions are recorded on the identified cost basis. Cost of investments represents amortized cost.
In March 2008, the FASB released Statement of Financial Accounting Standards No. 161 “Disclosures about Derivative Instruments and Hedging Activities” (“FAS 161”). FAS 161 requires qualitative disclosures about objectives and strategies for using derivatives, quantitative disclosures about fair value amounts of gains and losses on derivative instruments and disclosures about credit-risk-related contingent features in derivative agreements. The application of FAS 161 is required for fiscal years and interim periods beginning after November 15, 2008. At this time, management is evaluating the implications of FAS 161 and its impact on the financial statements and the accompanying notes has not yet been determined.
The fund has arrangements with the custodian and cash management banks whereby the fund may receive earnings credits when positive cash balances are maintained, which are used to offset custody and cash management fees. For financial reporting purposes, the fund includes net earnings credits as an expense offset in the Statement of Operations.
(c) Repurchase agreements: The funds may engage in repurchase agreement transactions. Under the terms of a typical repurchase agreement, a fund, through its custodian and sub-custodian, takes possession of an underlying debt obligation subject to an obligation of the seller to repurchase, and the fund to resell, the obligation at an agreed-
upon price and time, thereby determining the yield during the fund’s holding period.This arrangement results in a fixed rate of return that is not subject to market fluctuations during the fund’s holding period. The value of the collateral is at least equal, at all times, to the total amount of the repurchase obligation, including interest. In the event of a counterparty default, the fund has the right to use the collateral to offset losses incurred.There is potential loss to the fund in the event the fund is delayed or prevented from exercising its rights to dispose of the collateral securities, including the risk of a possible decline in the value of the underlying securities during the period while the fund seeks to assert its rights.The Investment Adviser reviews the value of the collateral and the creditworthiness of those banks and dealers with which the fund enters into repurchase agreements to evaluate potential risks.
(d) Dividends to shareholders: Dividends payable to shareholders are recorded by the funds on the ex-dividend date.The funds declare dividends daily from investment income-net; such dividends are paid monthly.With respect to each series, dividends from net realized capital gains, if any, are normally declared and paid annually, but the funds may make distributions on a more frequent basis to comply with the distribution requirements of the Internal Revenue Code of 1986, as amended (the “Code”).To the extent that net realized capital gains can be offset by capital losses carryovers of that fund, if any, it is the policy of the fund not to distribute such gains.
(e) Federal income taxes: It is the policy of the BNY Mellon Money Market Fund to continue to qualify as a regulated investment company, if such qualification is in the best interests of its shareholders, by complying with the applicable provisions of the Code, and to make distributions of taxable income sufficient to relieve it from substantially all federal income and excise taxes. It is the policy of the BNY Mellon National Municipal Money Market Fund to continue to qualify as a regulated investment company, which can distribute tax exempt dividends, by complying with the applicable provisions of the Code, and to make distributions of income and net realized capital gain sufficient to relieve it from substantially all federal income and excise taxes. For federal
26
income tax purposes, each series is treated as a single entity for the purpose of determining such qualification.
During the current year, the fund adopted FASB Interpretation No. 48 “Accounting for Uncertainty in Income Taxes” (“FIN 48”). FIN 48 provides guidance for how uncertain tax positions should be recognized, measured, presented and disclosed in the financial statements. FIN 48 requires the evaluation of tax positions taken or expected to be taken in the course of preparing the fund’s tax returns to determine whether the tax positions are “more-likely-than-not” of being sustained by the applicable tax authority.Tax positions not deemed to meet the more likely-than-not threshold would be recorded as a tax expense in the current year.The adoption of FIN 48 had no impact on the operations of the fund for the period ended August 31, 2008.
As of and during the period ended August 31, 2008, the fund did not have any liabilities for any unrecognized tax benefits. The fund recognizes interest and penalties, if any, related to unrecognized tax benefits as income tax expense in the Statement of Operations. During the period, the fund did not incur any interest or penalties.
Each of the tax years in the four-year period ended August 31, 2008, remains subject to examination by the Internal Revenue Service and state taxing authorities.
At August 31, 2008, the components of accumulated earnings on a tax basis were substantially the same as for financial reporting purposes. In addition, BNY Mellon National Municipal Money Market Fund had $1,051,250 of capital losses realized after October 31, 2007, which were deferred for tax purposes to the first day of the following fiscal year.
The tax characters of distributions paid to shareholders during the fiscal years ended August 31, 2008 and 2007 were all ordinary income for the BNY Mellon Money Market Fund and all tax exempt income for the BNY Mellon National Municipal Money Market Fund.
During the period ended August 31, 2008, as a result of permanent book to tax differences, primarily due to dividend reclassification, BNY Mellon National Municipal Money Market Fund increased accumulated undistributed
investment income-net by $5,993 and decreased accumulated net realized gain (loss) on investments by the same amount. Net assets and net asset value per share were not affected by this reclassification.
At August 31, 2008, the cost of investments for federal income tax purposes was substantially the same as the cost for financial reporting purposes (see the Statement of Investments).
NOTE 3—Bank Lines of Credit
Effective May 1, 2008, the funds participate with other Dreyfus-managed funds in a $300 million unsecured line of credit primarily to be utilized for temporary or emergency purposes, including the financing of redemptions. The terms of the line of credit agreement limit the amount of individual fund borrowings. Interest is charged to the fund based on prevailing market rates in effect at the time of borrowing. Prior to May 1, 2008, the funds participated with other Dreyfus-managed funds in a $100 million unsecured line of credit. During the period ended August 31, 2008, the funds did not borrow under the lines of credit.
NOTE 4—Investment Advisory Fee, Administration Fee and Other Transactions With Affiliates:
(a) Fees payable by the funds pursuant to the provisions of an Investment Advisory Agreement with the Investment Adviser are payable monthly, computed on the average daily value of each fund’s net assets at the following annual rates: .15% of the BNY Mellon Money Market Fund and .15% of the BNY Mellon National Municipal Money Market Fund.
Pursuant to the Administration Agreement, The Bank of NewYork Mellon provides or arranges for fund accounting, transfer agency and other fund administration services and receives a fee based on the total net assets of the Trust based on the following rates:
| 0 up to $6 billion | .15% | |
| In excess of $6 billion up to $12 billion | .12% | |
| In excess of $12 billion | .10% |
The Bank of New York Mellon has entered into a Sub-Administration Agreement with Dreyfus pursuant to
The Funds 27
NOTES TO FINANCIAL STATEMENTS (continued)
which The Bank of New York Mellon pays Dreyfus for performing certain administrative services.
(b) The funds have adopted a Shareholder Services Plan with respect to its Investor shares pursuant to which each fund pays the Distributor for the provision of certain services to holders of Investor shares a fee at an annual rate of .25% of the value of the average daily net assets attributable to Investor shares. The services provided may include personal services relating to shareholder accounts, such as answering shareholder inquiries regarding a fund, and providing reports and other information, and services related to the maintenance of such shareholder accounts. The Shareholder Services Plan allows the Distributor to make payments from the shareholder services fees it collects from each fund to compensate service agents (certain banks, securities brokers or dealers and other financial institutions) in respect of these services. Table 1 summarizes the amounts Investor shares were charged during the period ended August 31, 2008, pursuant to the Shareholder Services Plan.
| Table 1. | ||
| BNY Mellon Money Market Fund | $3,382 | |
| BNY Mellon National Municipal | ||
| Money Market Fund | $ 3 |
The funds compensate The Bank of New York Mellon, under a cash management agreement for performing cash management services related to fund subscriptions and redemptions. Table 2 summarizes the amounts the funds were charged during the period ended August 31, 2008, pursuant to the cash management agreements.
| Table 2. | ||
| BNY Mellon Money Market Fund | $66 | |
| BNY Mellon National Municipal | ||
| Money Market Fund | $35 | |
| Table 4. | ||
During the period ended August 31, 2008 each fund was charged $5,622 for services performed by the Chief Compliance Officer.
The funds compensate The Bank of New York Mellon, under a Custody Agreement for providing custodial services for the funds. Table 3 summarizes the amounts the funds were charged during the period ended August 31, 2008 pursuant to the custody agreement.
| Table 3. | ||
| BNY Mellon Money Market Fund | $ 78,866 | |
| BNY Mellon National Municipal | ||
| Money Market Fund | $214,894 |
Table 4 summarizes the components of “Due to The Dreyfus Corporation and affiliates” in the Statement of Assets and Liabilities for each fund.
(c) Effective June 1, 2008, each trustee who is not an “affiliated person” as defined in the Act receives from the Trust an annual fee of $68,000 and an attendance fee of $7,500 for each in-person meeting attended and $500 for telephone meetings and is reimbursed for travel and out-of-pocket expenses. The Chairman of the Trust’s Board receives an additional annual fee of $15,000 and the Chairman of the Trust’s Audit Committee receives an additional annual fee of $10,000. Prior to June 1, 2008, the Trust paid its Board members an annual fee of $48,000 and an attendance fee of $5,000 for each in-person meeting attended and $500 for telephone meetings and reimbursed them for travel and out-of-pocket expenses, and the Chairmen of the Trust's Board and Audit Committee received additional annual fees of $10,000 and $8,000, respectively.
| Investment | Shareholder | Chief | ||||||
| Advisory | Services | Custody | Compliance | |||||
| Fees ($) | Plan Fees ($) | Fees ($) | Officer Fees ($) | |||||
| BNY Mellon Money Market Fund | 151,167 | 332 | 13,343 | 3,760 | ||||
| BNY Mellon National Municipal Money Market Fund | 114,662 | — | — | 3,760 | ||||
28
NOTE 5—Subsequent Event:
Each fund has filed a Guarantee Agreement with the United States Department of theTreasury (the “Treasury”) to participate in the Treasury’s Temporary Guarantee Program for Money Market Funds (the “Program”).
Under the Program, the Treasury will guarantee the share price of shares of each fund held by shareholders as of September 19, 2008 at $1.00 per share if a fund’s net asset value per share falls below $0.995 (a “Guarantee Event”) and the fund liquidates. Recovery under the Program is subject to certain conditions and limitations.
Fund shares acquired by investors after September 19, 2008 that increase the number of fund shares the investor
held at the close of business on September 19, 2008 are not eligible for protection under the Program. In addition, fund shares acquired by investors who did not hold fund shares at the close of business on September 19, 2008 are not eligible for protection under the Program.
The Program will be in effect for a three month term expiring on December 18, 2008, after which the Secretary of the Treasury will review the need for, and terms of, the Program. Participation in the initial three months of the Program requires a payment to the Treasury in the amount of .01% of each fund’s shares outstanding as of September 19, 2008.This expense will be borne by the funds.
The Funds 29
REPORT OF INDEPENDENT REGISTERED PUBLIC ACCOUNTING FIRM
The Board of Trustees and Shareholders of BNY Mellon Funds Trust
We have audited the accompanying statements of assets and liabilities of BNY Mellon Money Market Fund and BNY Mellon National Municipal Money Market Fund, each a series of BNY Mellon Funds Trust, (collectively “the Funds”), including the statements of investments as of August 31, 2008, and the related statements of operations for the year then ended, the statements of changes in net assets for each of the years in the two-year period then ended, and the financial highlights for each of the years in the five-year period then ended.These financial statements and financial highlights are the responsibility of the Funds’ management. Our responsibility is to express an opinion on these financial statements and financial highlights based on our audits.
We conducted our audits in accordance with the standards of the Public Company Accounting Oversight Board (United States). Those standards require that we plan and perform the audit to obtain reasonable assurance about whether the financial statements and financial highlights are free of material misstatement. An audit includes examining, on a test basis, evidence supporting the amounts and disclosures in the financial statements
and financial highlights. Our procedures included confirmation of securities owned as of August 31, 2008, by correspondence with the custodian and brokers or by other appropriate audit procedures where replies from brokers were not received. An audit also includes assessing the accounting principles used and significant estimates made by management, as well as evaluating the overall financial statement presentation.We believe that our audits provide a reasonable basis for our opinion.
In our opinion, the financial statements and financial highlights referred to above present fairly, in all material respects, the financial position of BNY Mellon Money Market Fund and BNY Mellon National Municipal Money Market Fund as of August 31, 2008, and the results of their operations for the year then ended, the changes in their net assets for each of the years in the two-year period then ended and the financial highlights for each of the years in the five-year period then ended, in conformity with U.S. generally accepted accounting principles.

| New York, New York October 24, 2008 |
30
IMPORTANT TAX INFORMATION (Unaudited)
BNY Mellon Money Market Fund
For federal tax purposes the fund hereby designates 100% of ordinary income dividends paid during the fiscal year ended August 31, 2008 as qualifying “interest related dividends”.
BNY Mellon National Municipal Money Market Fund
In accordance with federal tax law, the fund hereby designates all the dividends paid from investment income-
net during its fiscal year ended August 31, 2008 as “exempt-interest dividends” (not generally subject to regular federal income tax).
As required by federal tax law rules, shareholders will receive notification of their portion of the fund’s tax-exempt dividends paid for 2008 calendar year on Form 1099-INT, which will be mailed by January 31, 2009.
The Funds 31
| INFORMATION ABOUT THE REVIEW AND APPROVAL OF EACH FUND’S INVESTMENT ADVISORY AGREEMENT (Unaudited) |
At a meeting of the Board of Trustees held on March 10-11, 2008, the Board considered the re-approval of the Trust’s Investment Advisory Agreement for another one year term, pursuant to which BNY Mellon Fund Advisers, a division of Dreyfus, provides the funds with investment advisory services. The Board members also considered the re-approval of the Trust’s Administration Agreement with Mellon Bank for another one year term, pursuant to which Mellon Bank provides the funds with administrative services. Mellon Bank has entered into a Sub-Administration Agreement with Dreyfus pursuant to which Mellon Bank pays Dreyfus for performing certain of these administrative services. The Board members who are not “interested persons” (as defined in the Act) of theTrust were assisted in their review by independent legal counsel and met with counsel in executive session separate from representatives of Dreyfus.
Analysis of Nature, Extent and Quality of Services Provided to the Funds. The Board members received a presentation from representatives of Dreyfus regarding services provided to the funds, and discussed the nature, extent and quality of the services provided to the funds pursuant to the Investment Advisory Agreement. Dreyfus’ representatives reviewed the funds’ distribution of accounts, and noted the diversity of distribution of the funds and Dreyfus’ corresponding need for broad, deep and diverse resources to be able to provide ongoing shareholder services to each of the funds’ distribution channels. Dreyfus also provided reviewed the number of shareholder accounts in each fund, as well as each fund’s asset size.
The Board members also considered Dreyfus’ research and portfolio management capabilities and that Dreyfus also provides oversight of day-to-day fund operations, including fund accounting and administration and assistance in meeting legal and regulatory requirements, and Dreyfus’ extensive administrative, accounting and compliance infrastructure.
Comparative Analysis of the Funds’ Advisory Fees, Expense Ratios and Performance
The Board members reviewed reports prepared by Lipper, Inc., an independent provider of investment company data, which included information comparing each fund’s advisory fee and expense ratio with a group of comparable funds (the “Expense Group”) and with a broader group of funds (the “Expense Universe”), in each case in the same category applicable to the fund, that were selected by Lipper. The Board members also reviewed reports prepared by Lipper which included information comparing each fund’s performance with that of a group of comparable funds (the “Performance Group”) composed of the same funds included in the Expense Group and with that of a broader group of funds (the “Performance Universe”), in each case in the same category applicable to the fund, that were selected by Lipper. Included in these reports were comparisons of contractual and actual advisory fee rates, total operating expenses and performance. Representatives of Dreyfus furnished these reports to the Board along with a description of the methodology Lipper used to select each Expense Group and Expense Universe and each Performance Group and Performance Universe.
BNY Mellon Money Market Fund
The Board reviewed the results of the Expense Group and Expense Universe comparisons.The Board reviewed the range of advisory fees and expense ratios of the funds in the Expense Group and Expense Universe, and noted that the fund’s expense ratio ranked in the second quartile of the Expense Group and Expense Universe (below the respective Expense Group and Expense Universe medians).
The Board also reviewed, and placed significant emphasis on, the results of the Performance Group and Performance Universe comparisons. The Board noted that the fund’s
32
total return performance was above the medians of the Performance Group and Performance Universe for the reported periods ended January 31, 2008.
Representatives of Dreyfus reviewed with the Board members the fees paid to Dreyfus or its affiliates by mutual funds managed by Dreyfus or its affiliates with a similar investment objective and similar policies and strategies, and included within the same Lipper category, as the fund. Representatives of Dreyfus also noted that there were no other accounts managed or sub-advised by Dreyfus or its affiliates with similar investment objectives, policies and strategies as the fund.The Board analyzed the differences in fees paid to Dreyfus and discussed the relationship of the advisory fees paid in light of the services provided.The Board members considered the relevance of the fee information provided to evaluate the appropriateness and reasonableness of the fund’s advisory fees.
BNY Mellon National Municipal Money Market Fund
The Board reviewed the results of the Expense Group and Expense Universe comparisons.The Board reviewed the range of advisory fees and expense ratios of the funds in the Expense Group and Expense Universe, and noted that the fund’s expense ratio ranked in the third quartile (above the median) of the Expense Group and in the second quartile (below the median) of the Expense Universe.
The Board also reviewed, and placed significant emphasis on, the results of the Performance Group and Performance Universe comparisons. The Board noted that for periods ended January 31, 2008, the fund’s performance was below the medians of the Performance Group for the 1-, 2- and 4-year periods, and was equal to the median for the 3-year period, and was above the medians of the Performance Universe for the 1- and 3-year periods, and was equal to the medians for the 2- and 4-year periods.
Representatives of Dreyfus reviewed with the Board members the fees paid to Dreyfus or its affiliates by mutual funds managed by Dreyfus or its affiliates with a similar investment objective and similar policies and strategies, and included within the same Lipper category, as the fund. Representatives of Dreyfus also noted that there were no other accounts managed or sub-advised by Dreyfus or its affiliates with similar investment objectives, policies and strategies as the fund.The Board analyzed the differences in fees paid to Dreyfus and discussed the relationship of the advisory fees paid in light of the services provided.The Board members considered the relevance of the fee information provided to evaluate the appropriateness and reasonableness of the fund’s advisory fees.
Analysis of Profitability and Economies of Scale. Dreyfus’ representatives reviewed the dollar amount of expenses allocated and profit received by Dreyfus and its affiliates with respect to each fund and the method used to determine such expenses and profit.The Board previously had been provided with information prepared by an independent consulting firm regarding Dreyfus’ approach to allocating costs to, and determining the profitability of, individual funds and the entire Dreyfus mutual fund complex. The Board members also had been informed that the methodology had been reviewed by an independent registered public accounting firm which, like the consultant, found the methodology to be reasonable.The consulting firm also analyzed where any economies of scale might emerge in connection with the management of the funds.The Board members evaluated the profitability analysis in light of the relevant circumstances for each fund, including any decline in assets, and the extent to which economies of scale would be realized if a fund grows and whether fee levels reflect these economies of scale for the benefit of fund shareholders. The Board
The Funds 33
| INFORMATION ABOUT THE REVIEW AND APPROVAL OF EACH FUND’S INVESTMENT ADVISORY AGREEMENT (Unaudited) (continued) |
members also considered potential benefits to Dreyfus and its affiliates, including BNY Mellon Fund Advisers, from acting as investment adviser to the funds and noted that there were no soft dollar arrangements with respect to trading each fund’s portfolio.
It was noted that the Board members should consider Dreyfus’ profitability with respect to each fund as part of their evaluation of whether the fees under the Investment Advisory Agreement bear a reasonable relationship to the mix of services provided by Dreyfus, including the nature, extent and quality of such services. It was noted that the profitability percentage for managing each fund was within ranges determined by appropriate court cases to be reasonable given the services rendered and that the profitability percentage for managing each fund was not unreasonable given the services provided.
At the conclusion of these discussions, the Board agreed that it had been furnished with sufficient information to make an informed business decision with respect to the continuation of the Trust’s Investment Advisory Agreement with respect to the funds. Based on the discussions and considerations as described above, the Board made the following conclusions and determinations with respect to the funds:
- The Board concluded that the nature, extent and qual- ity of the services provided by Dreyfus to each fund are adequate and appropriate.
- The Board was satisfied with each fund’s performance.
- The Board concluded that the fee paid to Dreyfus by each fund was reasonable in light of the services pro- vided, comparative performance and expense and advisory fee information, costs of the services pro- vided and profits to be realized and benefits derived or to be derived by Dreyfus and its affiliates from its rela- tionship with the fund.
- The Board determined that the economies of scale which may accrue to Dreyfus and its affiliates in con- nection with the management of the funds had been adequately considered by Dreyfus in connection with the advisory fee rate charged to each fund, and that, to the extent in the future it were to be determined that material economies of scale had not been shared with a fund, the Board would seek to have those economies of scale shared with the fund.
The Board members considered these conclusions and determinations, along with the information received on a routine and regular basis throughout the year, and, without any one factor being dispositive, the Board determined that re-approval of the Trust’s Investment Advisory Agreement and Administration Agreement with respect to the funds was in the best interests of each fund and its respective shareholders.
34
BOARD MEMBERS INFORMATION (Unaudited)
Patrick J. O’Connor (65) Chairman of the Board (2000)
Principal Occupation During Past 5Years:
- Attorney, Cozen and O’Connor, P.C. since 1973, including Vice Chairman since 1980 and Chief Executive Officer and President from 2002 to 2007
Other Board Memberships and Affiliations:
- Board of Consultors of Villanova University School of Law, Board Member
- Temple University,Trustee
- Philadelphia Police Foundation, Board Member
- Philadelphia Children’s First Fund, Board Member
- American College of Trial Lawyers, Fellow
- Historical Society of the United States District Court for the Eastern District of Pennsylvania, Director
- St. Jude’s Children Research Hospital Professional Advisory Board, Director
- Crowley Chemical, Director
- Franklin Security Bank,Vice Chairman
- International Academy of Trial Lawyers, Fellow
No. of Portfolios for which Board Member Serves: 20
| ——————— |
| Ronald R. Davenport (72) Board Member (2000) |
Principal Occupation During Past 5Years:
Other Board Memberships and Affiliations:
No. of Portfolios for which Board Member Serves: 20
| ——————— |
Jack L. Diederich (71) Board Member (2000)
Principal Occupation During Past 5Years:
- Chairman of Digital Site Systems, Inc., a privately held software company providing internet service to the construction materials industry, since July 1998
Other Board Memberships and Affiliations:
- Continental Mills, a dry baking products company, Board Member
- Pittsburgh Parks Conservancy, Board Member
No. of Portfolios for which Board Member Serves: 20
Maureen M.Young (63) Board Member (2000)
Principal Occupation During Past 5Years:
- Director of the Office of Government Relations at Carnegie Mellon University from January 2000 to December 2007
Other Board Memberships and Affiliations:
No. of Portfolios for which Board Member Serves: 20
| ——————— |
Kevin C. Phelan (64) Board Member (2000)
Principal Occupation During Past 5Years:
- Mortgage Banker, Meredith & Grew, Inc. since March 1978, including President since September 2007 and Executive Vice President and Director from March 1998 to September 2007
Other Board Memberships and Affiliations:
- Greater Boston Chamber of Commerce, Director
- Fiduciary Trust of Boston, Director
- Caritas Medical Center,Vice Chairman
- St. Elizabeth’s Medical Center of Boston, Board Member
- Providence College,Trustee
- Simmons College,Trustee
- Newton Country Day School, Chairman of the Board
- Babson College, Board of Visitors
- Boston University School of Public Health, Board of Visitors
- Boston Public Library Foundation, Director
- Boston Foundation, Director
- Boston Municipal Research Bureau, Board Member
- Boys and Girls Club of Boston, Board Member
- Boston Capital Real Estate Investment Trust, Director
No. of Portfolios for which Board Member Serves: 20
| ——————— |
Patrick J. Purcell (60) Board Member (2000)
Principal Occupation During Past 5Years:
- Owner, President and Publisher of The Boston Herald since February 1994
- President and Founder, jobfind.com, an employment search site on the world wide web, since July 1996
- President and CEO, Herald Media since 2001
Other Board Memberships and Affiliations:
- The American Ireland Fund, an organization that raises funds for philanthropic projects in Ireland, Board Member
- The Genesis Fund, an organization that raises funds for the specialized care and treatment of New England area children born with birth defects, mental retardation and genetic diseases, Board Member
- United Way of Massachusetts Bay, Board Member
- Greater Boston Chamber of Commerce, Board Member
No. of Portfolios for which Board Member Serves: 20
The Funds 35
BOARD MEMBERS INFORMATION (Unaudited) (continued)
John R. Alchin (60) Board Member (2008)
Principal Occupation During Past 5Years:
- Retired since 2007
- Executive of Comcast Corporation, a cable services provider, from 1990 to 2007, including Executive Vice-President, Co-Chief Financial Officer and Treasurer from 2002 to 2007
Other Board Memberships and Affiliations
- Big Brothers/Big Sisters of Southeastern Pennsylvania, Director
- Polo Ralph Lauren Corporation, a retail clothing and home furnishings company, Director
- Philadelphia Museum of Art, Board Member
- Metropolitan AIDS Neighborhood Nutrition Alliance, Board Member
No. of Portfolios for which Board Member Serves: 20
Thomas F. Ryan, Jr. (67) Board Member (2000)
Principal Occupation During Past 5Years:
- Retired since April 1999
- President and Chief Operating Officer of the American Stock Exchange from October 1995 to April 1999
Other Board Memberships and Affiliations:
- Boston College,Trustee
- Brigham & Women’s Hospital,Trustee
- New York State Independent System Operator, a non-profit organization which administers a competitive wholesale market for electricity in New York State, Director
- RepliGen Corporation, a biopharmaceutical company, Director
No. of Portfolios for which Board Member Serves: 20
| ——————— |
| Kim D. Kelly (52) Board Member (2008) |
- Consultant since 2005
- President, Chief Executive Officer and a Director of Arroyo Video Solutions, Inc., a video-on-demand technology company, from 2004 to 2005
- Executive of Insight Communications Company, Inc., a cable services provider, from 1990 to 2003, including President from 2002 to 2003 and Chief Operating Officer from 1998 to 2003
| Other Board Memberships and Affiliations: |
- Saint David’s School,Trustee
- MCG Capital Corp., Director
| No. of Portfolios for which Board Member Serves: 20 |
Once elected all Board Members serve for an indefinite term.The address of the Board Members and Officers is in c/o The Dreyfus Corporation, 200 Park Avenue, New York, NewYork 10166. Additional information about the Board Members is available in the fund’s Statement of Additional Information which can be obtained from Dreyfus free of charge by calling this toll free number: 1-800-645-6561. For Wealth Management clients, please contact your account officer or call 1-888-281-7350.
36
OFFICERS OF THE FUND (Unaudited)
CHRISTOPHER SHELDON, President since September 2006.
As director of Investment Strategy for Mellon’s Private Wealth Management group since April 2003, Mr. Sheldon manages the analysis and development of investment and asset allocation strategies and oversees investment product research and, since June 2006, also oversees the alternative investment groups. Prior to assuming his current position, Mr. Sheldon was West Coast managing director of Mellon’s Private Wealth Management group from 2001-2003 and its regional manager from 1998-2001. He was previously a Vice President of the Trust. He is 43 years old has been employed by Mellon Bank since January 1995.
MICHAEL A. ROSENBERG, Vice President and Secretary since August 2005.
Assistant General Counsel of BNY Mellon, and an officer of 77 investment companies (comprised of 174 portfolios) managed by the Manager. He is 48 years old and has been an employee of the Manager since October 1991.
JAMES BITETTO, Vice President and Assistant Secretary since August 2005.
Senior Counsel of BNY Mellon and Secretary of the Manager, and an officer of 77 investment companies (comprised of 174 portfolios) managed by the Manager. He is 42 years old and has been an employee of the Manager since December 1996.
JONI LACKS CHARATAN, Vice President and Assistant Secretary since August 2005.
Senior Counsel of BNY Mellon, and an officer of 77 investment companies (comprised of 174 portfolios) managed by the Manager. She is 52 years old and has been an employee of the Manager since October 1988.
JOSEPH M. CHIOFFI, Vice President and Assistant Secretary since August 2005.
Senior Counsel of BNY Mellon, and an officer of 77 investment companies (comprised of 174 portfolios) managed by the Manager. He is 46 years old and has been an employee of the Manager since June 2000.
JANETTE E. FARRAGHER, Vice President and Assistant Secretary since August 2005.
Assistant General Counsel of BNY Mellon, and an officer of 77 investment companies (comprised of 174 portfolios) managed by the Manager. She is 45 years old and has been an employee of the Manager since February 1984.
JOHN B. HAMMALIAN, Vice President and Assistant Secretary since August 2005.
Managing Counsel of BNY Mellon, and an officer of 77 investment companies (comprised of 174 portfolios) managed by the Manager. He is 45 years old and has been an employee of the Manager since February 1991.
ROBERT R. MULLERY, Vice President and Assistant Secretary since August 2005.
Managing Counsel of BNY Mellon, and an officer of 77 investment companies (comprised of 174 portfolios) managed by the Manager. He is 56 years old and has been an employee of the Manager since May 1986.
JEFF PRUSNOFSKY, Vice President and Assistant Secretary since August 2005.
Managing Counsel of BNY Mellon, and an officer of 77 investment companies (comprised of 174 portfolios) managed by the Manager. He is 43 years old and has been an employee of the Manager since October 1990.
JAMES WINDELS, Treasurer since November 2001.
Director-Mutual Fund Accounting of the Manager, and an officer of 77 investment companies (comprised of 174 portfolios) managed by the Manager. He is 49 years old and has been an employee of the Manager since April 1985.
RICHARD CASSARO, Assistant Treasurer since September 2007.
Senior Accounting Manager — Money Market and Municipal Bond Funds of the Manager, and an officer of 77 investment companies (comprised of 174 portfolios) managed by the Manager. He is 49 years old and has been an employee of the Manager since September 1982.
GAVIN C. REILLY, Assistant Treasurer since December 2005.
Tax Manager of the Investment Accounting and Support Department of the Manager, and an officer of 77 investment companies (comprised of 174 portfolios) managed by the Manager. He is 40 years old and has been an employee of the Manager since April 1991.
ROBERT ROBOL, Assistant Treasurer since December 2002.
Senior Accounting Manager - Fixed Income Funds of the Manager, and an officer of 77 investment companies (comprised of 174 portfolios) managed by the Manager. He is 44 years old and has been an employee of the Manager since October 1988.
ROBERT SALVIOLO, Assistant Treasurer since May 2007.
Senior Accounting Manager - Equity Funds of the Manager, and an officer of 77 investment companies (comprised of 174 portfolios) managed by the Manager. He is 41 years old and has been an employee of the Manager since June 1989.
ROBERT SVAGNA, Assistant Treasurer since December 2002.
Senior Accounting Manager - Equity Funds of the Manager, and an officer of 77 investment companies (comprised of 174 portfolios) managed by the Manager. He is 41 years old and has been an employee of the Manager since November 1990.
The Funds 37
OFFICERS OF THE FUND (Unaudited) (continued)
JOSEPH W. CONNOLLY, Chief Compliance Officer since October 2004.
Chief Compliance Officer of the Manager and The Dreyfus Family of Funds (77 investment companies, comprised of 174 portfolios). From November 2001 through March 2004, Mr. Connolly was first Vice-President, Mutual Fund Servicing for Mellon Global Securities Services. In that capacity, Mr. Connolly was responsible for managing Mellon’s Custody, Fund Accounting and Fund Administration services to third-party mutual fund clients. He is 51 years old and has served in various capacities with the Manager since 1980, including manager of the firm’s Fund Accounting Department from 1997 through October 2001.
WILLIAM GERMENIS, Anti-Money Laundering Compliance Officer since September 2002.
Vice President and Anti-Money Laundering Compliance Officer of the Distributor, and the Anti-Money Laundering Compliance Officer of 73 investment companies (comprised of 170 portfolios) managed by the Manager. He is 37 years old and has been an employee of the Distributor since October 1998.
38
Item 2. Code of Ethics.
The Registrant has adopted a code of ethics that applies to the Registrant's principal executive officer, principal financial officer, principal accounting officer or controller, or persons performing similar functions. There have been no amendments to, or waivers in connection with, the Code of Ethics during the period covered by this Report.
Item 3. Audit Committee Financial Expert.
The Registrant's Board has determined that Joseph DiMartino, a member of the Audit Committee of the Board, is an audit committee financial expert as defined by the Securities and Exchange Commission (the "SEC"). Joseph DiMartino is "independent" as defined by the SEC for purposes of audit committee financial expert determinations.
Item 4. Principal Accountant Fees and Services.
(a) Audit Fees. The aggregate fees billed for each of the last two fiscal years (the "Reporting Periods") for professional services rendered by the Registrant's principal accountant (the "Auditor") for the audit of the Registrant's annual financial statements or services that are normally provided by the Auditor in connection with the statutory and regulatory filings or engagements for the Reporting Periods, were $350,265.00 in 2007 and $360,822.00 in 2008.
(b) Audit-Related Fees. The aggregate fees billed in the Reporting Periods for assurance and related services by the Auditor that are reasonably related to the performance of the audit of the Registrant's financial statements and are not reported under paragraph (a) of this Item 4 were $53,380.00 in 2007 and $57,545.00 in 2008. These services consisted of: (i) security counts required by rule 17f-2 under the Investment Company Act of 1940, as amended.
The aggregate fees billed in the Reporting Periods for non-audit assurance and related services by the Auditor to the Registrant's investment adviser (not including any sub-investment adviser whose role is primarily portfolio management and is subcontracted with or overseen by another investment adviser), and any entity controlling, controlled by or under common control with the investment adviser that provides ongoing services to the Registrant ("Service Affiliates"), that were reasonably related to the performance of the annual audit of the Service Affiliate, which required pre-approval by the Audit Committee were $0 in 2007 and $0 in 2008.
Note: For the second paragraph in each of (b) through (d) of this Item 4, certain of such services were not pre-approved prior to May 6, 2003, when such services were required to be pre-approved. On and after May 6, 2003, 100% of all services provided by the Auditor were pre-approved as required. For comparative purposes, the fees shown assume that all such services were pre-approved, including services that were not pre-approved prior to the compliance date of the pre-approval requirement.
(c) Tax Fees. The aggregate fees billed in the Reporting Periods for professional services rendered by the Auditor for tax compliance, tax advice, and tax planning ("Tax Services") were $33,440.00 in 2007 and $37,995.00 in 2008. These services consisted of: (i) review or preparation of U.S. federal, state, local and excise tax returns.
The aggregate fees billed in the Reporting Periods for Tax Services by the Auditor to Service Affiliates, which required pre-approval by the Audit Committee were $0 in 2007 and $0 in 2008.
(d) All Other Fees. The aggregate fees billed in the Reporting Periods for products and services provided by the Auditor, other than the services reported in paragraphs (a) through (c) of this Item, were $0 in 2007 and $0 in 2008.
The aggregate fees billed in the Reporting Periods for Non-Audit Services by the Auditor to Service Affiliates, other than the services reported in paragraphs (b) through (c) of this Item, which required pre-approval by the Audit Committee, were $0 in 2007 and $0 in 2008.
Audit Committee Pre-Approval Policies and Procedures. The Registrant's Audit Committee has established policies and procedures (the "Policy") for pre-approval (within specified fee limits) of the Auditor's engagements for non-audit services to the Registrant and Service Affiliates without specific case-by-case consideration. Pre-approval considerations include whether the proposed services are compatible with maintaining the Auditor's independence. Pre-approvals pursuant to the Policy are considered annually.
Non-Audit Fees. The aggregate non-audit fees billed by the Auditor for services rendered to the Registrant, and rendered to Service Affiliates, for the Reporting Periods were $2,455,000 in 2007 and $2,532,612 in 2008.
Auditor Independence. The Registrant's Audit Committee has considered whether the provision of non-audit services that were rendered to Service Affiliates, which were not pre-approved (not requiring pre-approval), is compatible with maintaining the Auditor's independence.
| Item 5. | Audit Committee of Listed Registrants. | |
| Not applicable. | ||
| Item 6. | Investments. | |
| (a) | Not applicable. | |
| Item 7. | Disclosure of Proxy Voting Policies and Procedures for Closed-End Management | |
| Investment Companies. | ||
| Not applicable. | ||
| Item 8. | Portfolio Managers of Closed-End Management Investment Companies. | |
| Not applicable. | ||
| Item 9. | Purchases of Equity Securities by Closed-End Management Investment Companies and | |
| Affiliated Purchasers. | ||
| Not applicable. | ||
| Item 10. | Submission of Matters to a Vote of Security Holders. |
The Registrant has a Nominating Committee (the "Committee"), which is responsible for selecting and nominating persons for election or appointment by the Registrant's Board as Board members. The Committee has adopted a Nominating Committee Charter (the "Charter"). Pursuant to the Charter, the Committee will consider recommendations for nominees from shareholders submitted to the Secretary of the Registrant, c/o The Dreyfus Corporation Legal Department, 200 Park Avenue, 8th Floor East, New York, New York 10166. A nomination submission must include information regarding the recommended nominee as specified in the Charter. This information includes all information relating to a recommended nominee that is required to be disclosed in solicitations or proxy statements for the election of Board members, as well as information sufficient to evaluate the factors to be considered by the Committee, including character and
integrity, business and professional experience, and whether the person has the ability to apply sound and independent business judgment and would act in the interests of the Registrant and its shareholders. Nomination submissions are required to be accompanied by a written consent of the individual to stand for election if nominated by the Board and to serve if elected by the shareholders, and such additional information must be provided regarding the recommended nominee as reasonably requested by the Committee.
Item 11. Controls and Procedures.
(a) The Registrant's principal executive and principal financial officers have concluded, based on their evaluation of the Registrant's disclosure controls and procedures as of a date within 90 days of the filing date of this report, that the Registrant's disclosure controls and procedures are reasonably designed to ensure that information required to be disclosed by the Registrant on Form N-CSR is recorded, processed, summarized and reported within the required time periods and that information required to be disclosed by the Registrant in the reports that it files or submits on Form N-CSR is accumulated and communicated to the Registrant's management, including its principal executive and principal financial officers, as appropriate to allow timely decisions regarding required disclosure.
(b) There were no changes to the Registrant's internal control over financial reporting that occurred during the second fiscal quarter of the period covered by this report that have materially affected, or are reasonably likely to materially affect, the Registrant's internal control over financial reporting.
| Item 12. | Exhibits. | |||
| (a)(1) | Code of ethics referred to in Item 2. | |||
| (a)(2) | Certifications of principal executive and principal financial officers as required by Rule 30a-2(a) | |||
| under the Investment Company Act of 1940. | ||||
| (a)(3) | Not applicable. | |||
| (b) | Certification of principal executive and principal financial officers as required by Rule 30a-2(b) | |||
| under the Investment Company Act of 1940. | ||||
| SIGNATURES |
Pursuant to the requirements of the Securities Exchange Act of 1934 and the Investment Company Act of 1940, the Registrant has duly caused this Report to be signed on its behalf by the undersigned, thereunto duly authorized.
BNY Mellon Funds Trust
| By: | /s/ Christopher Sheldon | |
| Christopher Sheldon, | ||
| President | ||
| Date: | 10/27/2008 | |
Pursuant to the requirements of the Securities Exchange Act of 1934 and the Investment Company Act of 1940, this Report has been signed below by the following persons on behalf of the Registrant and in the capacities and on the dates indicated.
| By: | /s/ Christopher Sheldon | |
| Christopher Sheldon, | ||
| President | ||
| Date: | 10/27/2008 | |
| By: | /s/ James Windels | |
| James Windels, | ||
| Treasurer | ||
| Date: | 10/27/2008 | |
| EXHIBIT INDEX | ||
| (a)(1) | Code of ethics referred to in Item 2. | |
| (a)(2) | Certifications of principal executive and principal financial officers as required by Rule 30a- | |
| 2(a) under the Investment Company Act of 1940. (EX-99.CERT) | ||
| (b) | Certification of principal executive and principal financial officers as required by Rule 30a- | |
| 2(b) under the Investment Company Act of 1940. (EX-99.906CERT) | ||